UNITED STATES
SECURITIES AND EXCHANGE COMMISSION
WASHINGTON, D.C. 20549
Form 10-K
For the fiscal year ended December 31 , 2023
or
For the Transition period from to .
Commission File Number 001-34820

(Exact name of Registrant as specified in its charter)
| (State or other Jurisdiction of Incorporation or Organization) | (I.R.S. Employer Identification Number) | |||||||
Telephone: (212 ) 750-8300
(Address, zip code, and telephone number, including
area code, of registrant's principal executive office.)
Securities registered pursuant to Section 12(b) of the Act:
| Title of each class | Trading symbol(s) | Name of each exchange on which registered | ||||||
Securities registered pursuant to Section 12(g) of the Act: None
Indicate by check mark if the registrant is a well-known seasoned issuer, as defined in Rule 405 of the Securities Act. Yes ý No o
Indicate by check mark if the registrant is not required to file reports pursuant to Section 13 or Section 15(d) of the Act. Yes o No ý
Indicate by check mark whether the registrant (1) has filed all reports required to be filed by Section 13 and 15(d) of the Securities Exchange Act of 1934 during the preceding 12 months (or for such shorter periods that the registrant was required to file such reports), and (2) has been subject to such filing requirements for the past 90 days. Yes ý No o
Indicate by check mark whether the registrant has submitted electronically every Interactive Data File required to be submitted pursuant to Rule 405 of Regulation S-T during the preceding 12 months (or for such shorter period that the registrant was required to submit such files). Yes ý No o
Indicate by check mark whether the registrant is a large accelerated filer, an accelerated filer, a non-accelerated filer, smaller reporting company, or an emerging growth company. See the definitions of "large accelerated filer," "accelerated filer," "smaller reporting company," and "emerging growth company" in Rule 12b-2 of the Exchange Act.
| ☒ | Accelerated filer | ☐ | ||||||||||||
| Non-accelerated filer | ☐ | Smaller reporting company | ||||||||||||
| Emerging growth company | ||||||||||||||
If an emerging growth company, indicate by check mark if the registrant has elected not to use the extended transition period for complying with any new or revised financial accounting standards provided pursuant to Section 13(a) of the Exchange Act. ☐
Indicate by check mark whether the registrant has filed a report on and attestation to its management’s assessment of the effectiveness of its internal control over financial reporting under Section 404(b) of the Sarbanes-Oxley Act (15 U.S.C. 7262(b)) by the registered public accounting firm that prepared or issued its audit report. ☒
If securities are registered pursuant to Section 12(b) of the Act, indicate by check mark whether the financial statements of the registrant included in the filing reflect the correction of an error to previously issued financial statements. □
Indicate by check mark whether any of those error corrections are restatements that required a recovery analysis of incentive-based compensation received by any of the registrant’s executive officers during the relevant recovery period pursuant to § 240.10D-1(b). □
Indicate by check mark whether the registrant is a shell company (as defined in Rule 12b-2 of the Exchange Act). Yes ☐ No ☒
The aggregate market value of common stock of the registrant held by non-affiliates as of June 30, 2023, was approximately $36.3 billion. As of February 27, 2024, the registrant had 885,005,588 shares of common stock outstanding.
DOCUMENTS INCORPORATED BY REFERENCE
KKR & CO. INC.
FORM 10-K
For the Year Ended December 31, 2023
INDEX
| Page No. | ||||||||
| Item 1. | ||||||||
| Item 1A. | ||||||||
| Item 1B. | ||||||||
| Item 1C. | ||||||||
| Item 2. | ||||||||
| Item 3. | ||||||||
| Item 4. | ||||||||
| Item 5. | ||||||||
| Item 6. | ||||||||
| Item 7. | ||||||||
| Item 7A. | ||||||||
| Item 8. | ||||||||
| Item 9. | ||||||||
| Item 9A. | ||||||||
| Item 9B. | ||||||||
| Item 9C. | ||||||||
| Item 10. | ||||||||
| Item 11. | ||||||||
| Item 12. | ||||||||
| Item 13. | ||||||||
| Item 14. | ||||||||
| Item 15. | ||||||||
| Item 16. | ||||||||
2
CAUTIONARY NOTE REGARDING FORWARD-LOOKING STATEMENTS
This report contains forward-looking statements within the meaning of Section 27A of the Securities Act of 1933, as amended (the "Securities Act"), and Section 21E of the Securities Exchange Act of 1934, as amended (the "Exchange Act"), which reflect our current views with respect to, among other things, our operations and financial performance. You can identify these forward-looking statements by the use of words such as "outlook," "believe," "think," "expect," "potential," "continue," "may," "should," "seek," "approximately," "predict," "intend," "will," "plan," "estimate," "anticipate," the negative version of these words, other comparable words or other statements that do not relate strictly to historical or factual matters. Without limiting the foregoing, statements regarding the declaration and payment of dividends on common or preferred stock of KKR & Co. Inc.; the timing, manner and volume of repurchase of common stock pursuant to its repurchase program; expansion and growth opportunities and other synergies resulting from acquisitions, reorganizations or strategic partnerships; the return of balance sheet capital if a fund has a successful fundraise; investment opportunities offered to individual investors to continue to grow and to represent a larger percentage of our assets under management; the estimate of the amounts expected to be owed under the tax receivable agreement; the ability of core private equity investments to generate earnings that compound over a long period of time; the timing and completion of certain transactions contemplated by the Reorganization Agreement (as defined below); and the implementation, growth and synergies relating to the strategic initiatives previously announced on November 29, 2023 may constitute forward-looking statements. Forward-looking statements are subject to various risks and uncertainties. Accordingly, there are or will be important factors that could cause actual outcomes or results to differ materially from those indicated in these statements or cause the anticipated benefits and synergies from transactions to not be realized. We believe these factors include those described in the section entitled "Risk Factors" in this Annual Report on Form 10-K (our "Annual Report" or "report"). These factors should be read in conjunction with the other cautionary statements that are included in this report and in our other filings with the U.S. Securities and Exchange Commission ("SEC"). We do not undertake any obligation to publicly update or revise any forward-looking statement, whether as a result of new information, future developments or otherwise, except as required by law.
CERTAIN TERMS USED IN THIS REPORT
In this report, references to "KKR," "we," "us" and "our" refer to KKR & Co. Inc. and its subsidiaries, including The Global Atlantic Financial Group LLC ("TGAFG" and, together with its insurance companies and other subsidiaries, "Global Atlantic"), unless the context requires otherwise.
References to the “Series I preferred stockholder” or “KKR Management” are to KKR Management LLP, the holder of the sole outstanding share of our Series I preferred stock. References to our “senior principals” are to our senior employees who hold interests in the Series I preferred stockholder, including Mr. Henry Kravis and Mr. George Roberts (our "Co-Founders"). References to "principals" are to our current and former employees who formerly held interests in KKR Holdings L.P. ("KKR Holdings"), which we acquired on May 31, 2022, pursuant to the Reorganization Agreement, as discussed below. References to “carry pool participants” are to our current and former employees who hold interests in our “carry pool,” which refers to the carried interest generated by KKR’s business that is allocated to KKR Associates Holdings L.P. (“Associates Holdings”), in which carry pool participants are limited partners. Associates Holdings is currently not a subsidiary of KKR & Co. Inc.
KKR Group Partnership L.P. ("KKR Group Partnership") is the intermediate holding company that owns the entirety of KKR’s business. Unless otherwise indicated, references to equity interests in KKR’s business, or to percentage interests in KKR’s business, reflect the aggregate equity interests in KKR Group Partnership, and are net of amounts that have been allocated to carry pool participants and any other holders of minority interests in KKR Group Partnership. References to “KKR Group Partnership” for periods prior to January 1, 2020 refer to KKR Fund Holdings L.P., KKR Management Holdings L.P. and KKR International Holdings L.P., collectively, which were combined on that date to form KKR Group Partnership. References to a “KKR Group Partnership Unit” refer to (i) one Class A partner interest in each of KKR Fund Holdings L.P., KKR Management Holdings L.P. and KKR International Holdings L.P., collectively, for periods prior to prior to January 1, 2020, and (ii) one Class A partner interest in KKR Group Partnership for periods on and after January 1, 2020. “Exchangeable securities” refers to securities that have the right to acquire KKR Group Partnership Units and to exchange them for our shares of common stock. As of the date of this report, our only outstanding exchangeable securities are (i) restricted holdings units issued through KKR Holdings II L.P. ("KKR Holdings II"), which are issued under the Amended and Restated KKR & Co. Inc. 2019 Equity Incentive Plan (the "2019 Equity Incentive Plan"), and (ii) restricted holdings units issued through KKR Holdings III L.P. ("KKR Holdings III"), which are not issued under the 2019 Equity Incentive Plan and are currently held by certain Global Atlantic employees who received 2.6 million units (a majority of which are unvested) in connection with the January 2, 2024 transaction described below. In the future, we may issue securities other than restricted holdings units that may constitute exchangeable securities.
3
On October 8, 2021, KKR entered into a Reorganization Agreement (the "Reorganization Agreement") with KKR Holdings, KKR Management, Associates Holdings, and the other parties thereto. Pursuant to the Reorganization Agreement, the parties agreed to undertake a series of integrated transactions to effect a number of transformative structural and governance changes, including (a) the acquisition by KKR of KKR Holdings and all of the KKR Group Partnership Units held by it (which as noted below was completed), (b) the future elimination of voting control by KKR Management and the Series I preferred stock held by it, (c) the future establishment of voting rights for all common stock on a one vote per share basis, including with respect to the election of directors, and (d) the future control of the carry pool by KKR. On May 31, 2022, KKR completed the acquisition of KKR Holdings and the 258.3 million KKR Group Partnership Units held by it, and in exchange KKR issued and delivered 266.8 million shares of common stock to our principals. On the "Sunset Date" (which will occur no later than December 31, 2026), KKR will cancel the Series I preferred stock, establish voting rights for all common stock on a one vote per share basis, and acquire control of the carry pool. For more information about the Reorganization Agreement, see "Certain Relationships and Related Transactions, and Director Independence—Reorganization Agreement" in this report.
KKR’s asset management business is conducted by Kohlberg Kravis Roberts & Co. L.P. and various other subsidiaries of KKR & Co. Inc. other than Global Atlantic. KKR’s insurance business is operated by Global Atlantic, which KKR acquired a majority controlling interest in on February 1, 2021 ("2021 GA Acquisition"). On January 2, 2024 KKR acquired all the remaining equity interests in Global Atlantic that KKR did not already own. As of January 2, 2024, KKR owns 100.0% of Global Atlantic. KJR Management ("KJRM") is a Japanese real estate asset manager, which KKR acquired on April 28, 2022.
References to our "funds," "vehicles" or "investment vehicles" refer to a wide array of investment funds, vehicles and accounts that are advised, managed or sponsored by one or more subsidiaries of KKR, including collateralized loan obligations ("CLOs") and business development companies (each, a "BDC"), unless the context requires otherwise. These references do not include the investment funds, vehicles or accounts of any hedge fund partnership or any other third-party asset manager with which we have formed a strategic partnership or have acquired a minority ownership interest. Unless the context requires otherwise, references to “fund investors” or "investors in our investment vehicles" refers to the third-party investors in these funds and investment vehicles. References to “strategic investor partnerships” refers to separately managed accounts with certain investors, which typically have investment periods longer than our traditional funds and typically provide for investments across different investment strategies. References to “hedge fund partnerships” refers to strategic partnerships with third-party hedge fund managers in which KKR owns a minority stake.
Unless otherwise indicated, references in this report to our outstanding common stock on a fully exchanged and diluted basis reflect (i) actual shares of common stock outstanding, (ii) shares of common stock into which all outstanding shares of Series C Mandatory Convertible Preferred Stock were convertible (for periods prior to the date of its mandatory redemption, which occurred in September 2023), and (iii) shares of common stock issuable pursuant to equity awards actually granted pursuant to the Amended and Restated KKR & Co. Inc. 2010 Equity Incentive Plan (the "2010 Equity Incentive Plan" and, together with the 2019 Equity Incentive Plan, our "Equity Incentive Plans"). Our outstanding common stock on a fully exchanged and diluted basis does not include shares of common stock available for issuance pursuant to the Equity Incentive Plans for which equity awards have not yet been granted.
In this report, the term "GAAP" refers to accounting principles generally accepted in the United States of America. We disclose certain financial measures in this report that are calculated and presented using methodologies other than in accordance with GAAP, including after-tax distributable earnings, distributable operating earnings, fee related earnings ("FRE"), asset management segment revenues, book value and book value per adjusted share. We believe that providing these performance measures on a supplemental basis to our GAAP results is helpful to stockholders in assessing the overall performance of KKR's businesses. These non-GAAP financial measures should not be considered as a substitute for similar financial measures calculated in accordance with GAAP. We caution readers that these non-GAAP financial measures may differ from the calculations of other investment managers, and as a result, may not be comparable to similar measures presented by other investment managers. Reconciliations of these non-GAAP financial measures to the most directly comparable financial measures calculated and presented in accordance with GAAP, where applicable, are included under "Management's Discussion and Analysis of Financial Condition and Results of Operations—Non-GAAP Balance Sheet Measures—Reconciliations to GAAP Measures." This report also uses the terms assets under management ("AUM"), fee paying assets under management ("FPAUM") and capital invested. You should note that our calculations of these and other operating metrics may differ from the calculations of other investment managers and, as a result, may not be comparable to similar metrics presented by other investment managers. These non-GAAP and operating metrics are defined in the section "Management's Discussion and Analysis of Financial Condition and Results of Operations—Key Segment and Non-GAAP Performance Measures—Other Terms and Capital Metrics."
4
The use of any defined term in this report to mean more than one entity, person, security or other item collectively is solely for convenience of reference and in no way implies that such entities, persons, securities or other items are one indistinguishable group. For example, notwithstanding the use of the defined terms "KKR," "we" and "our" in this report to refer to KKR & Co. Inc. and its subsidiaries, each subsidiary of KKR & Co. Inc. is a standalone legal entity that is separate and distinct from KKR & Co. Inc. and any of its other subsidiaries. Any KKR entity (including any Global Atlantic entity) referenced herein is responsible for its own financial, contractual and legal obligations. Additionally, references to "including" are for the purpose of illustration and shall be read to mean "including without limitation" unless the context explicitly requires otherwise.
5
SUMMARY RISK FACTORS
The following is a summary of the risk factors associated with investing in our securities. You should read this summary together with a more detailed description of these risks in the “Risk Factors” section of this report and in other filings that we make from time to time with the SEC.
We are subject to risks related to our business, including risks involving:
•difficult market and economic conditions;
•geopolitical developments and other local and global events;
•disruptions caused by natural disasters, catastrophes, or potential changes in climate conditions;
•significant liquidity requirements and sources of liquidity;
•assets we refer to as “perpetual capital” being subject to material reduction;
•high variability in earnings and cash flow;
•“clawback” provisions in our governing agreements;
•inability to raise additional or successor funds successfully;
•intense competition in the investment management and insurance industries;
•increasing focus by stakeholders on ESG matters;
•changes in relevant tax laws, regulations and treaties or adverse interpretations by tax authorities;
•recruiting, retaining and motivating our employees and other key personnel;
•our reliance on third-party service providers;
•cybersecurity failures and data security breaches;
•the unpredictable impact of artificial intelligence on competitive, operational, legal and regulatory risks;
•rapidly developing and changing global privacy laws;
•expansion into new investment strategies, geographic markets, businesses and types of investors;
•failure to manage existing commitments;
•extensive regulation of our businesses;
•litigation and negative publicity;
•certain types of investment vehicles with increased risk of litigation and regulatory scrutiny;
•our capital markets activities; and
•ineffective risk management activities.
We are subject to risks related to our investment activities, including risks involving:
•historical returns not being indicative of future results;
•valuation methodologies for establishing the fair value of certain assets can be subjective;
•the impact on valuations by market and economic conditions;
•changes in debt or equity markets;
•dependence on significant leverage in our investments;
•exposures to, and investments in, leveraged companies or companies experiencing financial or business difficulties;
•ranking of our equity and debt investments compared to other’s investments, exposing us to greater risk of loss;
•limitations inherent in the due diligence process;
•complexity of investments, including large-sized investments and non-controlled investments;
•concentration of investments by type of issuer, geographic region, asset types, or otherwise;
•investments in relatively illiquid assets;
•investments in real assets;
•investments in emerging and less established companies;
•investments in companies that are based outside of the United States;
•third-party investors’ contractual obligation to fund capital calls;
•potential conflicts of interest between our business and our clients;
•investors in certain of our investment vehicles are entitled to redeem their investments in these vehicles on a periodic basis, and certain of our investment advisory agreements may be terminated with minimal notice; and
•our stakes in hedge fund partnerships.
We are subject to risks related to our insurance activities, including risks involving:
•possibility of not achieving the intended benefit of the Global Atlantic acquisitions;
6
•interest rate fluctuations, including sustained periods of low or high interest rates;
•acceleration of amortization of deferred revenues and expenses;
•difference between policyholder behavior estimates, reserve assumptions and actual claims experience;
•estimates used in preparation of financial statements and models for insurance products;
•ability to execute Global Atlantic’s growth strategies successfully;
•Global Atlantic’s actual or perceived financial strength and ratings of Global Atlantic and its subsidiaries;
•business Global Atlantic reinsures and business it cedes to reinsurers;
•changes in accounting standards applicable to insurance companies;
•volatility in our insurance business’s net income under GAAP;
•reinsurance assets held in trust, which limit Global Atlantic’s ability to invest those assets;
•triggering a recapture event under reinsurance agreements where Global Atlantic’s clients may recapture some or all of the assumed business;
•determination of the amount of impairments and allowances for credit losses;
•liquidity risks from Global Atlantic’s membership in Federal Home Loan Banks;
•repurchase and reverse repurchase transactions that subject Global Atlantic to liquidity risks;
•changes in relevant tax laws, regulations or treaties;
•regulations, including those related to capital requirements, that apply to Global Atlantic;
•Bermuda insurance subsidiaries possibly being subject to additional licensing requirements; and
not being able to mitigate the reserve strain associated with statutory accounting rules.
We are subject to risks related to our organizational structure, including risks involving:
•significant voting power held by the Series I preferred stockholder, and conflicts of interest among the Series I preferred stockholder and the holders of our common stock;
•As a “controlled company,” we qualify for some exemptions from the corporate governance and other requirements of the NYSE and are not required to comply with certain provisions of U.S. securities laws;
•provisions in our charter limiting the liability of the Series I preferred stockholder;
•exclusive forum provision included in our charter;
•assets and revenues of our investment vehicles not being directly available to us or our common stockholders;
•declining common stock price due to the large number of shares eligible for future sale and issuable as grants or in acquisitions;
•ability to issue preferred stock may cause the price of our common stock to decline;
•our right to repurchase all outstanding shares of common stock under specified circumstances;
•limitations on our ability to pay periodic dividends;
•our obligations to make payments to our principals pursuant to a tax receivable agreement;
•potential application of restrictions under the Investment Company Act of 1940;
•reorganizations undertaken by us; and
•anti-takeover provisions in our organizational documents.
7
PART I
ITEM 1. BUSINESS
Overview
We are a leading global investment firm that offers alternative asset management as well as capital markets and insurance solutions. We aim to generate attractive investment returns by following a patient and disciplined investment approach, employing world-class people, and supporting growth in our portfolio companies and communities. We sponsor investment funds that invest in private equity, credit and real assets and have strategic partners that manage hedge funds. Our insurance subsidiaries offer retirement, life and reinsurance products under the management of Global Atlantic.
Our asset management business offers a broad range of investment management services to fund investors around the world. Throughout our history, we have consistently been a leader in the private equity industry, having completed more than 730 private equity investments in portfolio companies with a total transaction value in excess of $710 billion as of December 31, 2023. Since the inception of our firm in 1976, we have expanded our investment strategies and product offerings from traditional private equity to areas such as leveraged credit, alternative credit, infrastructure, energy, real estate, growth equity, core private equity, and impact investments. We also provide capital markets services for our firm, our portfolio companies and third parties. Our balance sheet provides a significant source of capital in the growth and expansion of our business, and it has allowed us to further align our interests with those of our investment vehicle investors. Building on these efforts and leveraging our industry expertise and intellectual capital have allowed us to capitalize on a broader range of the opportunities we source.
Our insurance business is operated by Global Atlantic, in which we acquired a majority controlling interest on February 1, 2021 and the remaining equity interests in Global Atlantic that KKR did not already own on January 2, 2024. Global Atlantic is a leading retirement and life insurance company that provides a broad suite of protection, legacy and savings products and reinsurance solutions to clients across individual and institutional markets. Global Atlantic primarily offers individuals fixed-rate annuities, fixed-indexed annuities and targeted life products through a network of banks, broker-dealers and independent marketing organizations. Global Atlantic provides its institutional clients customized reinsurance solutions, including block, flow and pension risk transfer reinsurance, as well as funding agreements. Global Atlantic primarily generates income by earning a spread between its investment income and the cost of policyholder benefits. As of December 31, 2023, Global Atlantic served over three million policyholders.
Our Firm
We seek to work proactively and collaboratively across business lines, departments, and geographies, as appropriate, to achieve what we believe are the best investment results for our clients and the firm. Through our offices around the world, we have a pre-eminent global integrated platform for sourcing transactions, raising capital and carrying out capital markets activities. We have multilingual and multicultural investment teams with local market knowledge and significant business, investment and operational experience in the countries in which we invest. We believe that our global capabilities and one-firm philosophy have helped us to raise capital, capture a greater number of investment opportunities, and assist our portfolio companies in their increasing reliance on global markets and sourcing, while enabling us to diversify our operations.
Though our operations span multiple continents and asset classes, our investment professionals are supported by an integrated infrastructure and operate under a common set of principles and business practices that are monitored by a variety of committees. Our investment teams operate with a single culture that rewards investment discipline, creativity, determination and patience and emphasizes the sharing of information, resources, expertise and best practices across offices and asset classes. When appropriate, we staff investment transactions across multiple offices and businesses in order to take advantage of the industry-specific expertise of our investment professionals, and we hold regular meetings in which investment professionals throughout our offices share their knowledge and experiences. We believe that the ability to draw on the local cultural fluency of our investment professionals while maintaining a centralized and integrated global infrastructure distinguishes us from other investment firms and has been a substantial contributing factor to our ability to raise funds, invest internationally and expand our businesses.
8
Our Business
Through December 31, 2023, we operated in two segments: our asset management business and our insurance business.
Asset Management
In our asset management business, we have five business lines: (1) Private Equity, (2) Real Assets, (3) Credit and Liquid Strategies, (4) Capital Markets, and (5) Principal Activities. Information about our business lines below should be read together with “Management’s Discussion and Analysis of Financial Condition and Results of Operations” and our consolidated financial statements included elsewhere in this report.
As an asset management firm, we earn fees, including management fees and incentive fees, and carried interest for providing investment management and other services to our investment vehicles (including our funds), CLOs, managed accounts, portfolio companies and certain operating companies, and we generate transaction fees from capital markets transactions. We earn additional investment income by investing our own capital alongside investors in our investment vehicles and from other assets on our balance sheet. Carried interest we receive from our funds and certain other investment vehicles entitles us to a specified percentage of investment gains that are generated on third-party capital that is invested. Our investment teams have deep industry knowledge and are supported by a substantial and diversified capital base; an integrated global investment platform; the expertise of operating professionals, senior advisors and other advisors; and a worldwide network of business relationships that provide a significant source of investment opportunities, specialized knowledge during due diligence and substantial resources for creating and realizing value for stakeholders. These teams invest capital, a substantial portion of which is of a long duration or not subject to predetermined redemption requirements, which provides us with significant flexibility to grow investments and select exit opportunities. As of December 31, 2023, approximately 92% of our AUM consists of capital that is either not subject to redemption for at least 8 years from inception or what we refer to as perpetual capital. For more information about the limitations of perpetual capital, please see "—Risks Related to Our Business—AUM, referred to as perpetual capital, is subject to material reduction, including through withdrawal, redemption or dividends, and termination" in the "Risk Factors" section of this report. We believe that these aspects of our business help us continue to grow our asset management business and deliver strong investment performance in a variety of economic and financial conditions.
Since our inception, one of our fundamental investment philosophies has been to align the interests of the firm and our employees with the interests of our fund investors, portfolio companies and other stakeholders. We achieve this by putting our own capital behind our ideas. As of December 31, 2023, we and our employees and other personnel have approximately $25.0 billion invested in or committed to our own funds and portfolio companies, including $12.1 billion of capital funded from our balance sheet, $7.7 billion of additional capital committed by our balance sheet to our investment vehicles, $3.6 billion funded from personal investments, and $1.7 billion of additional capital commitments from personal investments.
9
Private Equity
Overview
Through our Private Equity business line, we manage and sponsor a group of private equity funds that invest capital for long-term appreciation, either through controlling ownership of a company or strategic non-controlling minority positions. In addition to our traditional private equity funds that invest in large and mid-sized companies, we sponsor funds that invest in core private equity, growth equity, and impact investments. Our Private Equity business line includes separately managed accounts that invest in multiple strategies, which may include our credit and real assets strategies, as well as our private equity strategies. These funds and accounts are managed by Kohlberg Kravis Roberts & Co. L.P., an SEC-registered investment adviser. As of December 31, 2023, our Private Equity business line had $176.4 billion of AUM, consisting of $123.7 billion in traditional private equity, including $34.9 billion in core private equity and $17.8 billion in growth equity, which includes $4.4 billion of impact investments.
We are a world leader in private equity, having raised over 30 private equity funds (including core private equity, growth equity and impact investments). We invest in industry-leading franchises and attract world-class management teams. Our investment approach leverages our capital base, sourcing advantage, global network and industry knowledge. It also leverages a sizable team of operating professionals, as well as senior advisors and other advisors, many of whom are former chief executive officers and leaders of the business community.
Our Private Equity business line consists of the following strategies:
Traditional Private Equity. Our traditional private equity investment strategy typically seeks to engage in management buyouts, build-ups, or other investments with a view to acquire control or have significant influence. We believe that the combination of our industry knowledge, investment experience and operational expertise provides KKR with the ability to identify and create value in investment opportunities. Through our portfolio company board oversight, we work closely and cooperatively with the management of our portfolio companies, which are assisted by having access to the resources of our global platform.
Core Private Equity. Our core private equity strategy targets investments with a longer holding period and a lower anticipated risk profile than our traditional private equity investments. Our core private equity investments are made in companies that, among other things, we believe are more stable, and typically have lower average leverage over our holding period, than those in our traditional private equity funds.
Growth Equity. Since 2016, we have offered growth equity funds that pursue growth equity investment opportunities in the technology, media and telecommunications (TMT) sector. Through this strategy, we focus on emerging, high-growth companies and invest across a variety of sub-sectors including software, security, semiconductors, consumer electronics, internet of things (IoT), information services, business services, internet, digital media, content and communications. Also since 2016, we have offered growth equity funds to pursue growth equity investment opportunities in the health care sector, primarily in the United States and Europe. Our health care growth strategy targets opportunities across various health care sub-sectors, including biopharmaceuticals, medical devices, diagnostics, life science tools, health care providers, healthcare information technology and other services.
Global Impact. Since 2019, we have offered global impact funds, which are focused on identifying and investing behind opportunities across the Americas, Europe and Asia where financial performance and societal impact are intrinsically aligned. Our global impact funds aim to generate private equity-like risk-adjusted returns by investing in small to medium-sized companies that contribute toward one or more of the United Nations Sustainable Development Goals. From time to time, we refer to our growth equity strategy to include the investments from our impact strategy.
10
Private Equity Assets Under Management and Select Fund Performance Information
The following chart presents the growth in the AUM of our Private Equity business line from December 31, 2019 through December 31, 2023.
Private Equity
Assets Under Management
($ in billions)
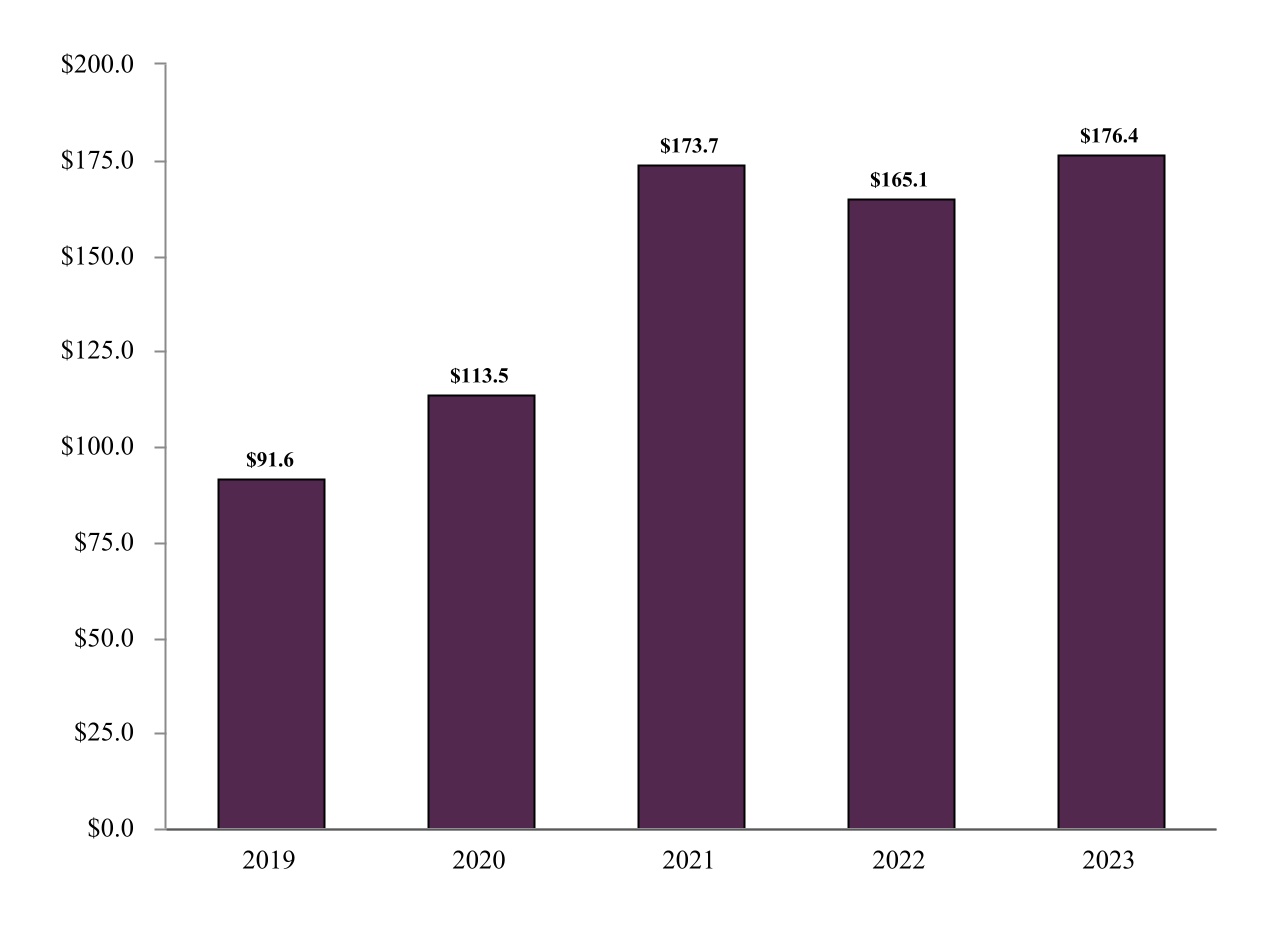
11
The table below presents information as of December 31, 2023, relating to our current private equity and other vehicles reported in our Private Equity business line for which we have the ability to earn carried interest. This data does not reflect acquisitions or disposals of investments, changes in investment values, or distributions occurring after December 31, 2023.
| Investment Period | Amount ($ in millions) | |||||||||||||||||||||||||||||||
Start Date(1) | End Date (2) | Commitment (3) | Uncalled Commitments | Percentage Committed by General Partner | Invested | Realized | Remaining Cost (4) | Remaining Fair Value | Gross Accrued Carried Interest | |||||||||||||||||||||||
| Private Equity Business Line | ||||||||||||||||||||||||||||||||
| North America Fund XIII | 8/2021 | 8/2027 | $ | 18,400 | $ | 10,563 | 1% | $ | 7,837 | $ | — | $ | 7,837 | $ | 8,830 | $ | 5 | |||||||||||||||
| Americas Fund XII | 5/2017 | 5/2021 | 13,500 | 1,665 | 2% | 12,432 | 8,722 | 9,326 | 18,767 | 1,624 | ||||||||||||||||||||||
| North America Fund XI | 11/2012 | 1/2017 | 8,718 | 152 | 3% | 10,044 | 22,833 | 2,759 | 3,269 | 173 | ||||||||||||||||||||||
2006 Fund (5) | 9/2006 | 9/2012 | 17,642 | — | 2% | 17,309 | 37,416 | — | 8 | 1 | ||||||||||||||||||||||
Millennium Fund (5) | 12/2002 | 12/2008 | 6,000 | — | 3% | 6,000 | 14,123 | — | 4 | 1 | ||||||||||||||||||||||
| Ascendant Fund | 6/2022 | 6/2028 | 3,003 | 3,003 | 10% | — | — | — | — | — | ||||||||||||||||||||||
| European Fund VI | 6/2022 | 6/2028 | 7,426 | 5,852 | 2% | 1,574 | — | 1,574 | 1,263 | — | ||||||||||||||||||||||
| European Fund V | 7/2019 | 2/2022 | 6,338 | 738 | 2% | 5,670 | 917 | 5,495 | 6,947 | 327 | ||||||||||||||||||||||
| European Fund IV | 2/2015 | 3/2019 | 3,512 | 22 | 6% | 3,642 | 5,726 | 1,621 | 2,625 | 196 | ||||||||||||||||||||||
European Fund III (5) | 3/2008 | 3/2014 | 5,506 | 146 | 5% | 5,360 | 10,625 | 586 | 39 | (41) | ||||||||||||||||||||||
European Fund II (5) | 11/2005 | 10/2008 | 5,751 | — | 2% | 5,751 | 8,507 | — | 25 | 5 | ||||||||||||||||||||||
| Asian Fund IV | 7/2020 | 7/2026 | 14,735 | 8,529 | 1% | 6,554 | 348 | 6,416 | 8,324 | 268 | ||||||||||||||||||||||
| Asian Fund III | 8/2017 | 7/2020 | 9,000 | 1,329 | 6% | 8,189 | 6,295 | 6,797 | 12,018 | 981 | ||||||||||||||||||||||
| Asian Fund II | 10/2013 | 3/2017 | 5,825 | — | 1% | 7,357 | 6,509 | 2,938 | 2,124 | (346) | ||||||||||||||||||||||
Asian Fund (5) | 7/2007 | 4/2013 | 3,983 | — | 3% | 3,974 | 8,728 | — | — | 21 | ||||||||||||||||||||||
China Growth Fund (5) | 11/2010 | 11/2016 | 1,010 | — | 1% | 1,010 | 1,150 | 181 | 22 | (34) | ||||||||||||||||||||||
| Next Generation Technology Growth Fund III | 11/2022 | 11/2028 | 2,745 | 2,331 | 1% | 414 | — | 414 | 417 | — | ||||||||||||||||||||||
| Next Generation Technology Growth Fund II | 12/2019 | 5/2022 | 2,088 | 154 | 7% | 2,131 | 496 | 1,924 | 2,894 | 193 | ||||||||||||||||||||||
| Next Generation Technology Growth Fund | 3/2016 | 12/2019 | 659 | 5 | 22% | 668 | 1,148 | 276 | 934 | 74 | ||||||||||||||||||||||
| Health Care Strategic Growth Fund II | 5/2021 | 5/2027 | 3,789 | 2,856 | 3% | 933 | — | 933 | 1,045 | — | ||||||||||||||||||||||
| Health Care Strategic Growth Fund | 12/2016 | 4/2021 | 1,331 | 144 | 11% | 1,317 | 283 | 1,128 | 1,863 | 105 | ||||||||||||||||||||||
| Global Impact Fund II | 6/2022 | 6/2028 | 2,704 | 1,889 | 1% | 815 | — | 815 | 753 | — | ||||||||||||||||||||||
| Global Impact Fund | 2/2019 | 3/2022 | 1,242 | 224 | 8% | 1,194 | 471 | 1,018 | 1,562 | 106 | ||||||||||||||||||||||
| Co-Investment Vehicles and Other | Various | Various | 18,340 | 3,219 | Various | 15,680 | 8,980 | 11,151 | 13,863 | 1,328 | ||||||||||||||||||||||
| Core Investment Vehicles | Various | Various | 25,444 | 10,582 | 30% | 15,768 | 2,366 | 14,407 | 24,323 | 119 | ||||||||||||||||||||||
Unallocated Commitments (6) | N/A | N/A | 3,894 | 3,894 | Various | — | — | — | — | — | ||||||||||||||||||||||
| Total Private Equity | $ | 192,585 | $ | 57,297 | $ | 141,623 | $ | 145,643 | $ | 77,596 | $ | 111,919 | $ | 5,106 | ||||||||||||||||||
(1)The start date represents the start of the fund's investment period as defined in the fund's governing documents and may or may not be the same as the date upon which management fees begin to accrue. For further information on management fee calculations, see Note 2 "Summary of Significant Accounting Policies" in our financial statements.
(2)The end date represents the end of the fund's investment period as defined in the fund's governing documents and is generally not the date upon which management fees cease to be paid. For further information on management fee calculations, see Note 2 "Summary of Significant Accounting Policies" in our financial statements.
(3)The commitment represents the aggregate capital commitments to the fund, including capital commitments by third-party fund investors and the general partner. Foreign currency commitments have been converted into U.S. dollars based on the exchange rate that prevailed on December 31, 2023.
(4)The remaining cost represents the initial investment of the general partner and limited partners, reduced for returns of capital.
(5)The "Invested" and "Realized" columns do not include the amounts of any realized investments that restored the unused capital commitments of the fund investors, if any.
(6)"Unallocated Commitments" represent commitments received from our strategic investor partnerships that have yet to be allocated to a particular investment strategy.
Traditional Private Equity Portfolio
As of December 31, 2023, our traditional private equity portfolio consisted of over 130 companies with approximately $285 billion of annual revenues. These companies are headquartered in over 20 countries and operate in approximately 20 general industries, which take advantage of our broad and deep industry and operating expertise. Many of these companies are leading franchises with global operations, strong management teams and attractive growth prospects, which we believe will provide benefits through a broad range of business conditions.
12
Private Equity Investment Process and Fund Characteristics
Investment Approach
Our approach to making private equity investments focuses on achieving multiples of invested capital and attractive risk-adjusted IRRs by selecting high-quality investments that may be made at attractive prices, applying rigorous standards of due diligence when making investment decisions, implementing strategic and operational changes that drive growth and value creation in acquired businesses, carefully monitoring investments, and making informed decisions when developing investment exit strategies.
We believe that we have achieved a leading position in the private equity industry by applying a disciplined investment approach and by building strong partnerships with highly motivated management teams who put their own capital at risk. When making private equity investments, we seek out strong business franchises, attractive growth prospects, leading market positions and the ability to generate attractive returns. In our private equity funds, we do not effect transactions that are "hostile," meaning a target company's board of directors makes an unfavorable recommendation with respect to the transaction or publicly opposes the consummation of the transaction.
Sourcing and Selecting Investments
We have access to significant opportunities for making private equity investments as a result of our sizable capital base, global platform, and relationships with leading executives from major companies, commercial and investment banks, and other investment and advisory institutions. Members of our global network contact us with new investment opportunities, including a substantial number of exclusive investment opportunities and opportunities that are made available to only a limited number of other firms. We also proactively pursue business development strategies that are designed to generate deals internally based on the depth of our industry knowledge and our reputation as a leading financial sponsor.
Due Diligence and the Investment Decision
When an investment team determines that an investment proposal is worth consideration, the proposal is formally presented to the applicable investment committee and the due diligence process commences, if appropriate. The objective of the due diligence process is to identify attractive investment opportunities based on the facts and circumstances surrounding an investment and to prepare a framework that may be used from the date of an acquisition to drive operational improvement and value creation. When conducting due diligence, investment teams evaluate a number of important business, financial, tax, accounting, environmental, social, governance, legal and regulatory issues in order to determine whether an investment is suitable. While the due diligence process differs depending on the type of investment we make, generally, in connection with the private equity due diligence process, investment professionals spend significant amounts of time meeting with a company's management and operating personnel, visiting plants and facilities, and where appropriate, speaking with other stakeholders interested in and impacted by the investment in order to understand the opportunities and risks associated with the proposed investment. Our investment professionals may also use the services of outside accountants, consultants, lawyers, investment banks and industry experts as appropriate to assist them in this process. Investment committees or portfolio managers, as applicable, monitor our due diligence practices and approve an investment before it is made.
Building Successful and Competitive Businesses
Portfolio management committees are responsible for working with our investment professionals from the date on which a private equity investment is made until the time it is exited in order to ensure that strategic and operational objectives are accomplished and that the performance of the investment is closely monitored. When investing in a private equity portfolio company, we partner with management teams to execute on our investment thesis, and we rigorously track performance through regular monitoring of detailed operational and financial metrics as well as appropriate environmental, social and governance issues. We have developed a global network of experienced managers and operating professionals who assist the private equity portfolio companies in making operational improvements and achieving growth. We augment these resources with operational guidance from operating professionals at KKR Capstone, senior advisors, other advisors and investment teams, and with "100-Day Plans" that focus the firm's efforts and drive our strategies. We seek to emphasize efficient capital management, top-line growth, R&D spending, geographical expansion, cost optimization and investment for the long-term.
13
Realizing Investments
We have developed substantial expertise for realizing private equity investments. From our inception through December 31, 2023, the firm has generated approximately $195.9 billion of cash proceeds from the sale of our Private Equity portfolio companies in initial public offerings and secondary offerings, dividends, and sales to strategic and financial buyers. When exiting private equity investments, our objective is to structure the exit in a manner that optimizes returns for fund investors and, in the case of publicly traded companies, minimizes the impact that the exit has on the trading price of the company's securities. We believe that our ability to successfully realize investments is attributable in part to the strength and discipline of our portfolio management committees and capital markets business, as well as the firm's longstanding relationships with corporate buyers and members of the investment banking and investing communities.
Private Equity Fund Structures
The private equity funds that we sponsor and manage typically have finite lives and investment periods. Each fund is typically organized as one or more partnerships, and each partnership is controlled by a general partner. Private equity fund investors are limited partners who agree to contribute a specified amount of capital to the fund from time to time for use in qualifying investments during the investment period, which generally lasts up to six years depending on how quickly capital is deployed. The investment period for certain funds may be terminated upon supermajority vote (based on capital commitment) of the fund's limited partners or by the fund's advisory committee. The term of our private equity funds generally last for 10 to 12 years and may last up to 15 years from the date of the fund's first or last investment, subject to a limited number of extensions with the consent of the limited partners or the applicable advisory committee. Given the length of the investment periods and terms of our private equity funds and the limited conditions under which such periods can be terminated and commitments may be withdrawn, the AUM of our private equity funds provide a long-term stable capital base.
Each private equity fund’s general partner is generally entitled to a carried interest that allocates to it 20% of the net profits realized by the limited partners from the fund’s investments. Our private equity funds since 2012 generally have a performance hurdle which requires that we return 7%, compounded annually, to limited partners in the fund prior to receiving our 20% share of net profits realized by limited partners. Such performance hurdles are subject to a catch-up allocation to the general partner after the hurdle has been reached. Our earlier private equity funds do not include a performance hurdle. The timing of receipt of carried interest in respect of investments of our private equity funds is dictated by the terms of the partnership agreements that govern such funds, and is distributed to the general partner of a private equity fund only after all of the following are met: (i) a realization event has occurred (e.g., sale of a portfolio company, dividend, etc.); (ii) the vehicle has achieved positive overall investment returns since its inception, in excess of performance hurdles where applicable, and is accruing carried interest; and (iii) with respect to investments with a fair value below cost, cost has been returned to fund investors in an amount sufficient to reduce remaining cost to the investments' fair value. For a fund that has a fair value above cost, overall, and is otherwise accruing carried interest, but has one or more investments where fair value is below cost, the shortfall between cost and fair value for such investments is referred to as a "netting hole." See "Management's Discussion and Analysis of Financial Condition and Results of Operations—Liquidity—Sources of Liquidity" for a discussion of netting holes. Net realized profit or loss is not netted between or among funds. In addition, the agreements governing our private equity funds generally include a "clawback" provision that, if triggered, may give rise to a contingent obligation that may require the general partner to return or contribute amounts to the fund for distribution to fund investors at the end of the life of the fund. See "Management's Discussion and Analysis of Financial Condition and Results of Operations—Critical Accounting Policies and Estimates—Critical Accounting Policies and Estimates - Asset Management—Revenues—Capital Allocation-Based Income (Loss)" and "Risk Factors—Risks Related to Our Business—The "clawback" provisions in the agreements governing our carry-paying funds may give rise to a contingent obligation that may require us to return or contribute amounts to our funds and fund investors."
We enter into management agreements with our private equity funds pursuant to which we receive management fees in exchange for providing the funds with management and other services. Gross management fees for our private equity funds generally range from 1% to 2% of committed capital during the fund's investment period and are generally 0.75% to 1.25% of invested capital after the expiration of the fund's investment period with subsequent reductions over time, which causes the fees to be reduced as investments are liquidated. In addition, in connection with the expiration of the investment period, a private equity fund may establish a reserve on its fund investors' capital commitments on which no fee is paid unless such capital is invested. Management fees are paid by private equity fund investors, who generally contribute capital to the fund in order to allow the fund to pay the fees to us. Our private equity funds generally require that the amount of management fees be subtracted from gains allocable to fund investors before a carried interest may be paid.
14
We also enter into monitoring agreements with our portfolio companies pursuant to which we receive periodic monitoring fees in exchange for providing them with management, consulting and other services, and we typically receive transaction fees for providing portfolio companies with financial, advisory and other services in connection with specific transactions. Monitoring agreements may provide for a termination payment following an initial public offering or change of control, if certain criteria are satisfied. In some cases, we may be entitled to other fees that are paid by an investment target upon closing of a transaction or when a potential investment is not consummated. Since 2014, our private equity fund agreements typically require us to share 100% of any monitoring, transaction and other fees that are allocable to a fund (after reduction for expenses incurred allocable to a fund from unconsummated transactions) with fund investors.
In addition, the agreements governing our private equity funds enable investors in those funds to reduce their capital commitments available for further investments, on an investor-by-investor basis, in the event one or more "key persons" (for example, investment professionals who are named as "key executives" for certain geographically or product focused funds) cease to be actively involved in the management of the fund. While these provisions do not allow investors in our funds to withdraw capital that has been invested or cause a fund to terminate, the occurrence of a "key person" event could cause disruption in our business, reduce the amount of capital that we have available for future investments, and make it more challenging to raise additional capital in the future.
Because private equity fund investors typically are unwilling to invest their capital in a fund unless the fund's manager also invests its own capital in the fund's investments, our private equity fund documents generally require the general partners of the funds to make minimum capital commitments to the funds. The amounts of these commitments, which are negotiated by fund investors, generally range from 2% to 8% of a fund's total capital commitments at final closing, but may be greater for certain funds (i) where we are pursuing newer strategies, (ii) where third party investor demand is limited, and (iii) where a larger commitment is consistent with our firm's asset allocation strategy. When investments are made, the general partner contributes capital to the fund based on its fund commitment percentage and acquires a capital interest in the investment that is not subject to a carried interest or management fees.
Real Assets
Overview
Through our Real Assets business line, we manage and sponsor a group of real assets funds and accounts that invest capital in infrastructure, real estate, or energy. These funds and accounts are managed by Kohlberg Kravis Roberts & Co. L.P. or one of its subsidiaries. As of December 31, 2023, our Real Assets business line had $130.9 billion of AUM, consisting of $68.5 billion in real estate (of which $36.3 billion is real estate credit and $32.2 billion is real estate equity), $58.7 billion in infrastructure, and $3.7 billion in energy.
Infrastructure
We established a dedicated infrastructure team and strategy in 2008, focused on global investment opportunities with an emphasis on investments in assets and businesses located in the member countries of the Organisation for Economic Co-operation and Development. In January 2020, we expanded our strategy to include investment opportunities in the Asia-Pacific region. Our infrastructure platform seeks to achieve returns including current income through the acquisition and operational improvement of assets important to the functioning of the economy. We believe that the global infrastructure market provides an opportunity for the firm's private investment, operational improvement capabilities and stakeholder engagement. Through this platform we have made investments in sectors such as power and utilities, midstream, energy and energy transition, transportation, asset leasing, water and wastewater, telecommunications infrastructure, and social infrastructure. In 2020, we established the Diversified Core Infrastructure Fund as our first dedicated open-ended core infrastructure fund. Our diversified core infrastructure strategy seeks core infrastructure and infrastructure-related investment opportunities with a focus on investments with predominantly contracted or regulated cash flows in securities, properties and other assets principally located in North America and Western Europe.
15
Real Estate
Our real estate platform seeks to be a global solutions provider across the capital structure in the real estate industry, focusing on opportunities in the United States, Western Europe and Asia-Pacific, including property-level equity, debt and special situations transactions and businesses with significant real estate holdings that can benefit from KKR’s operational expertise. We seek to partner with real estate owners, lenders, operators, and developers to provide flexible capital to respond to transaction-specific needs, including the purchase or financing of existing assets or companies and the funding of future development or acquisition opportunities.
We have made real estate equity investments in residential and commercial assets. In addition, we have a core plus real estate strategy that seeks to pursue real estate investments through open-ended funds, primarily with the intent of having influence over the real estate assets or companies in which we make investments. Our real estate credit platform provides capital solutions for real estate transactions with a focus on commercial mortgage-backed securities, whole loans and subordinated debt. These real estate credit strategies are deployed in a variety of ways, including through KKR Real Estate Finance Trust Inc. (NYSE: KREF), a publicly listed U.S. real estate investment trust ("KREF"), and our real estate credit funds which focus on commercial real estate lending and the risk retention tranches of commercial mortgage-backed securities ("CMBS"). We also source real estate investments for our Global Atlantic insurance companies and KKR Real Estate Select Trust Inc., a continuously offered, registered closed-end investment company and U.S. real estate investment trust ("KREST"). In addition, in April 2022, we acquired KJRM, one of the largest Japanese real estate asset managers in Japan. KJRM manages diversified real estate assets, including retail, office and mixed used properties through two Tokyo Stock Exchange-listed real estate investment trusts: Japan Metropolitan Fund Investment Corporation and Industrial & Infrastructure Fund Investment Corporation.
Energy
Our primary platform for pursuing upstream oil and natural gas opportunities is through Crescent Energy Company (“Crescent”), a publicly listed energy company (NYSE: CRGY), which we manage. Crescent is a U.S. independent energy company primarily engaged in the acquisition, development and operation of oil and natural gas properties. We also manage investment vehicles that have energy investments in key proven basins across the lower 48 U.S. states, with a focus on operated oil and gas assets and complemented by non‐operated assets, mineral and royalty interests and midstream infrastructure.
16
Real Assets Under Management and Select Fund Performance Information
The following chart presents the growth in the AUM of our Real Assets business line from December 31, 2019 through December 31, 2023.
Real Assets
Assets Under Management (1)
($ in billions)
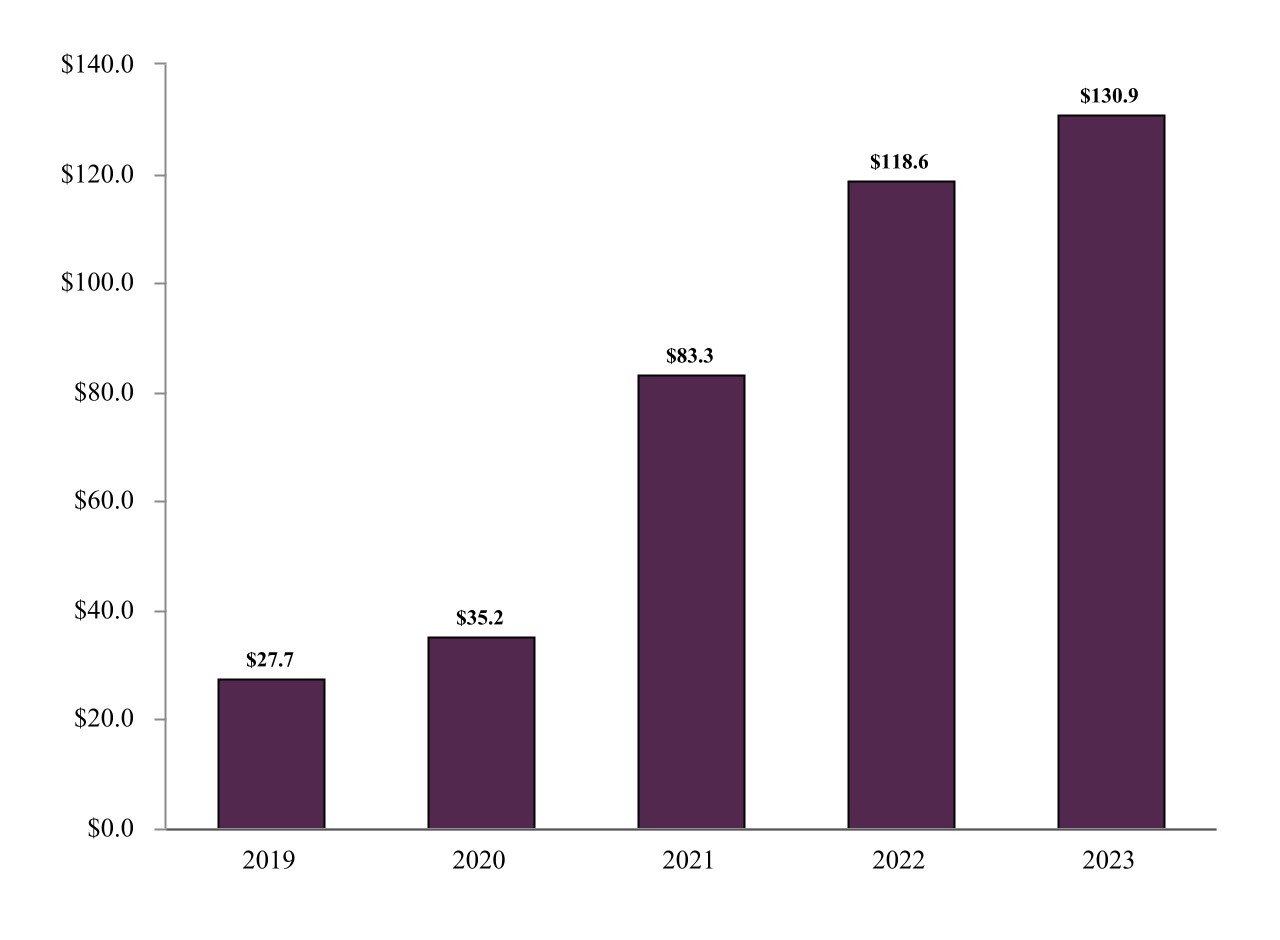
(1)AUM of acquired businesses are included in the years on and after the completion of the respective acquisitions or transactions, as applicable.
17
The table below presents information as of December 31, 2023, relating to our current real asset and other vehicles reported in our Real Assets business line for which we have the ability to earn carried interest. This data does not reflect acquisitions or disposals of investments, changes in investment values, or distributions occurring after December 31, 2023.
| Investment Period | Amount ($ in millions) | |||||||||||||||||||||||||||||||
Start Date (1) | End Date (2) | Commitment (3) | Uncalled Commitments | Percentage Committed by General Partner | Invested | Realized | Remaining Cost (4) | Remaining Fair Value | Gross Accrued Carried Interest | |||||||||||||||||||||||
| Real Assets Business Line | ||||||||||||||||||||||||||||||||
| Energy Income and Growth Fund II | 8/2018 | 8/2022 | $ | 994 | $ | — | 20% | $ | 1,191 | $ | 305 | $ | 954 | $ | 1,503 | $ | 36 | |||||||||||||||
| Energy Income and Growth Fund | 9/2013 | 6/2018 | 1,589 | — | 13% | 1,589 | 1,221 | — | — | — | ||||||||||||||||||||||
Natural Resources Fund (5) | Various | Various | 887 | — | Various | 887 | 168 | — | — | — | ||||||||||||||||||||||
| Global Energy Opportunities | Various | Various | 915 | 62 | Various | 520 | 204 | 297 | 167 | — | ||||||||||||||||||||||
| Global Infrastructure Investors IV | 8/2021 | 8/2027 | 16,589 | 7,244 | —% | 9,672 | 328 | 9,477 | 10,598 | 86 | ||||||||||||||||||||||
| Global Infrastructure Investors III | 7/2018 | 6/2021 | 7,165 | 1,097 | 4% | 6,335 | 1,910 | 5,483 | 7,612 | 436 | ||||||||||||||||||||||
| Global Infrastructure Investors II | 12/2014 | 6/2018 | 3,040 | 130 | 4% | 3,166 | 5,330 | 807 | 1,135 | 34 | ||||||||||||||||||||||
| Global Infrastructure Investors | 9/2010 | 10/2014 | 1,040 | — | 5% | 1,050 | 2,228 | — | — | — | ||||||||||||||||||||||
| Asia Pacific Infrastructure Investors II | 9/2022 | 9/2028 | 6,368 | 6,368 | 5% | — | — | — | — | — | ||||||||||||||||||||||
| Asia Pacific Infrastructure Investors | 1/2020 | 9/2022 | 3,792 | 702 | 7% | 3,375 | 738 | 2,943 | 3,347 | 109 | ||||||||||||||||||||||
| Diversified Core Infrastructure Fund | 12/2020 | (6) | 9,587 | 1,199 | 5% | 8,452 | 508 | 8,452 | 8,916 | — | ||||||||||||||||||||||
| Real Estate Partners Americas III | 1/2021 | 1/2025 | 4,253 | 1,592 | 5% | 2,771 | 228 | 2,611 | 2,584 | — | ||||||||||||||||||||||
| Real Estate Partners Americas II | 5/2017 | 12/2020 | 1,921 | 253 | 8% | 1,951 | 2,688 | 487 | 428 | 13 | ||||||||||||||||||||||
| Real Estate Partners Americas | 5/2013 | 5/2017 | 1,229 | 135 | 16% | 1,024 | 1,416 | 54 | 32 | (3) | ||||||||||||||||||||||
| Real Estate Partners Europe II | 3/2020 | 12/2023 | 2,061 | 610 | 10% | 1,656 | 431 | 1,356 | 1,313 | — | ||||||||||||||||||||||
| Real Estate Partners Europe | 8/2015 | 12/2019 | 707 | 99 | 10% | 687 | 763 | 209 | 208 | (6) | ||||||||||||||||||||||
| Asia Real Estate Partners | 7/2019 | 7/2023 | 1,682 | 452 | 15% | 1,238 | 22 | 1,197 | 1,383 | — | ||||||||||||||||||||||
| Real Estate Credit Opportunity Partners II | 8/2019 | 6/2023 | 950 | — | 5% | 976 | 226 | 976 | 928 | 9 | ||||||||||||||||||||||
| Real Estate Credit Opportunity Partners | 2/2017 | 4/2019 | 1,130 | 122 | 4% | 1,008 | 508 | 1,008 | 991 | 3 | ||||||||||||||||||||||
| Property Partners Americas | 12/2019 | (6) | 2,569 | 46 | 19% | 2,523 | 159 | 2,523 | 2,392 | — | ||||||||||||||||||||||
| Co-Investment Vehicles and Other | Various | Various | 9,293 | 3,903 | Various | 5,429 | 1,582 | 5,017 | 4,923 | 23 | ||||||||||||||||||||||
| Total Real Assets | $ | 77,761 | $ | 24,014 | $ | 55,500 | $ | 20,963 | $ | 43,851 | $ | 48,460 | $ | 740 | ||||||||||||||||||
(1)The start date represents the start of the fund's investment period as defined in the fund's governing documents and may or may not be the same as the date upon which management fees begin to accrue. For further information on management fee calculations, see Note 2 "Summary of Significant Accounting Policies" in our financial statements.
(2)The end date represents the end of the fund's investment period as defined in the fund's governing documents and is generally not the date upon which management fees cease to be paid. For further information on management fee calculations, see Note 2 "Summary of Significant Accounting Policies" in our financial statements.
(3)The commitment represents the aggregate capital commitments to the fund, including capital commitments by third-party fund investors and the general partner. Foreign currency commitments have been converted into U.S. dollars based on the exchange rate that prevailed on December 31, 2023.
(4)The remaining cost represents the initial investment of the general partner and limited partners, reduced for returns of capital.
(5)The "Invested" and "Realized" columns do not include the amounts of any realized investments that restored the unused capital commitments of the fund investors, if any.
(6)Open-ended fund.
18
Real Asset Investment Process and Fund Characteristics
Real Asset Investment Process
Our infrastructure, real estate, and energy vehicles have a similar investment process as that described under "—Private Equity Investment Process and Fund Characteristics." Investment teams for a particular real asset strategy formally present potential investments to the applicable strategy oriented investment committee or the portfolio manager, as applicable, which monitors our due diligence practices and approves an investment before it is made. Our Real Asset strategies also typically have a portfolio management team that works with our investment professionals from the date on which an investment is made until the time it is exited in order to ensure that strategic and operational objectives are accomplished and that the performance of the investment is closely monitored. In addition to leveraging the resources of the firm, our infrastructure, real estate, and energy investment teams typically partner with technical experts and operators to manage our Real Asset investments.
Real Asset Fund Structures
Our traditional infrastructure and real estate funds generally have investment periods of up to 6 years and generally have a fund term of up to 13 years. Management fees for such funds generally range from 0.75% to 1.5% on committed capital, invested capital or net asset value during the investment period and on invested capital or net asset value for investments thereafter, subject to certain adjustments. These funds generally have performance hurdles of 8% to 10% subject to a catch-up allocation to the general partner after the hurdle has been reached. Thereafter, the general partners of such funds generally share in 10% to 20% of net profits realized by limited partners.
Our core real estate and infrastructure funds are open-ended and do not have a fixed termination date. They also do not have a specified termination date for making investments. Management fees for such funds generally range from 0.5% to 1.2% of net asset value, subject to certain adjustments. The general partners of such funds are also entitled to incentive fees ranging generally from 5% to 10% of cash flow or net asset value appreciation, subject to performance hurdles. We also provide investment management services to the publicly available entities in our real assets strategy, including KREF, KREST and Crescent. These services are pursuant to a management agreement with specific KKR subsidiaries, which provide for the payment of management fees, generally ranging from 1.25% to 1.50% of their equity value or similar metric, as well as incentive fees.
Private Equity and Real Asset Historical Performance
We take a long-term approach to Private Equity and Real Assets investing and measure the success of our investments over a period of years rather than months. Given the duration of these investments, the firm focuses on realized multiples of invested capital and internal rates of return ("IRRs") when deploying capital in these transactions. We have approximately doubled the value of capital that has been invested by our Private Equity and Real Assets investment funds, turning $184.3 billion of invested capital into $344.5 billion of value from our inception in 1976 to December 31, 2023.
From our inception in 1976 through December 31, 2023, our Private Equity and Real Assets investment funds with at least 24 months of investment activity generated a cumulative gross IRR of 25.5%, compared to the 11.9% and 9.2% gross IRR achieved by the S&P 500 Index and MSCI World Index, respectively, over the same period, despite the cyclical and sometimes challenging environments in which we have operated. The S&P 500 Index and MSCI World Index are unmanaged indices and their returns assume reinvestment of distributions and do not reflect any fees or expenses. Our past performance, however, may not be representative of performance in any period other than the period discussed above and is not a guarantee of future results. For additional information regarding impact of market conditions on the value and performance of our investments, see our "Risk Factors."
The table below presents information as of December 31, 2023, relating to the historical performance of certain of our Private Equity and Real Assets investment vehicles since inception, which we believe illustrates the benefits of our investment approach. This data does not reflect additional capital raised since December 31, 2023, or acquisitions or disposals of investments, changes in investment values, or distributions occurring after that date. The information presented below is not intended to be representative of any past or future performance for any particular period other than the period presented below. Past performance is no guarantee of future results.
19
| Amount | Fair Value of Investments | ||||||||||||||||||||||||||||||||||
Private Equity and Real Assets Business Lines Investment Funds and Other Vehicles | Commitment (2) | Invested | Realized (4) | Unrealized | Total Value | Gross IRR (5) | Net IRR (5) | Gross Multiple of Invested Capital (5) | |||||||||||||||||||||||||||
| ($ in millions) | |||||||||||||||||||||||||||||||||||
| Total Investments | |||||||||||||||||||||||||||||||||||
Legacy Funds (1) | |||||||||||||||||||||||||||||||||||
| 1976 Fund | $ | 31 | $ | 31 | $ | 537 | $ | — | $ | 537 | 39.5 | % | 35.5 | % | 17.1 | ||||||||||||||||||||
| 1980 Fund | 357 | 357 | 1,828 | — | 1,828 | 29.0 | % | 25.8 | % | 5.1 | |||||||||||||||||||||||||
| 1982 Fund | 328 | 328 | 1,291 | — | 1,291 | 48.1 | % | 39.2 | % | 3.9 | |||||||||||||||||||||||||
| 1984 Fund | 1,000 | 1,000 | 5,964 | — | 5,964 | 34.5 | % | 28.9 | % | 6.0 | |||||||||||||||||||||||||
| 1986 Fund | 672 | 672 | 9,081 | — | 9,081 | 34.4 | % | 28.9 | % | 13.5 | |||||||||||||||||||||||||
| 1987 Fund | 6,130 | 6,130 | 14,949 | — | 14,949 | 12.1 | % | 8.9 | % | 2.4 | |||||||||||||||||||||||||
| 1993 Fund | 1,946 | 1,946 | 4,143 | — | 4,143 | 23.6 | % | 16.8 | % | 2.1 | |||||||||||||||||||||||||
| 1996 Fund | 6,012 | 6,012 | 12,477 | — | 12,477 | 18.0 | % | 13.3 | % | 2.1 | |||||||||||||||||||||||||
| Subtotal - Legacy Funds | 16,475 | 16,475 | 50,269 | — | 50,269 | 26.1 | % | 19.9 | % | 3.1 | |||||||||||||||||||||||||
| Included Funds | |||||||||||||||||||||||||||||||||||
| European Fund (1999) | 3,085 | 3,085 | 8,758 | — | 8,758 | 26.9 | % | 20.2 | % | 2.8 | |||||||||||||||||||||||||
| Millennium Fund (2002) | 6,000 | 6,000 | 14,123 | 4 | 14,127 | 22.0 | % | 16.1 | % | 2.4 | |||||||||||||||||||||||||
| European Fund II (2005) | 5,751 | 5,751 | 8,507 | 25 | 8,532 | 6.1 | % | 4.5 | % | 1.5 | |||||||||||||||||||||||||
| 2006 Fund (2006) | 17,642 | 17,309 | 37,416 | 8 | 37,424 | 11.9 | % | 9.3 | % | 2.2 | |||||||||||||||||||||||||
| Asian Fund (2007) | 3,983 | 3,974 | 8,728 | — | 8,728 | 18.9 | % | 13.6 | % | 2.2 | |||||||||||||||||||||||||
| European Fund III (2008) | 5,506 | 5,360 | 10,625 | 39 | 10,664 | 16.4 | % | 11.2 | % | 2.0 | |||||||||||||||||||||||||
| E2 Investors (Annex Fund) (2009) | 196 | 196 | 200 | — | 200 | 0.6 | % | 0.5 | % | 1.0 | |||||||||||||||||||||||||
| China Growth Fund (2010) | 1,010 | 1,010 | 1,150 | 22 | 1,172 | 3.8 | % | 0.1 | % | 1.2 | |||||||||||||||||||||||||
| Natural Resources Fund (2010) | 887 | 887 | 168 | — | 168 | (24.3) | % | (25.9) | % | 0.2 | |||||||||||||||||||||||||
| Global Infrastructure Investors (2010) | 1,040 | 1,050 | 2,228 | — | 2,228 | 17.6 | % | 15.6 | % | 2.1 | |||||||||||||||||||||||||
| North America Fund XI (2012) | 8,718 | 10,044 | 22,833 | 3,269 | 26,102 | 23.8 | % | 19.2 | % | 2.6 | |||||||||||||||||||||||||
| Asian Fund II (2013) | 5,825 | 7,357 | 6,509 | 2,124 | 8,633 | 4.6 | % | 3.0 | % | 1.2 | |||||||||||||||||||||||||
| Real Estate Partners Americas (2013) | 1,229 | 1,024 | 1,416 | 32 | 1,448 | 15.8 | % | 11.0 | % | 1.4 | |||||||||||||||||||||||||
| Energy Income and Growth Fund (2013) | 1,589 | 1,589 | 1,221 | — | 1,221 | (6.1) | % | (8.8) | % | 0.8 | |||||||||||||||||||||||||
| Global Infrastructure Investors II (2014) | 3,040 | 3,166 | 5,330 | 1,135 | 6,465 | 19.7 | % | 17.0 | % | 2.0 | |||||||||||||||||||||||||
| European Fund IV (2015) | 3,512 | 3,642 | 5,726 | 2,625 | 8,351 | 23.7 | % | 18.4 | % | 2.3 | |||||||||||||||||||||||||
| Real Estate Partners Europe (2015) | 707 | 687 | 763 | 208 | 971 | 12.2 | % | 9.0 | % | 1.4 | |||||||||||||||||||||||||
| Next Generation Technology Growth Fund (2016) | 659 | 668 | 1,148 | 934 | 2,082 | 31.0 | % | 26.4 | % | 3.1 | |||||||||||||||||||||||||
| Health Care Strategic Growth Fund (2016) | 1,331 | 1,317 | 283 | 1,863 | 2,146 | 19.6 | % | 13.2 | % | 1.6 | |||||||||||||||||||||||||
| Americas Fund XII (2017) | 13,500 | 12,432 | 8,722 | 18,767 | 27,489 | 24.9 | % | 20.4 | % | 2.2 | |||||||||||||||||||||||||
| Real Estate Credit Opportunity Partners (2017) | 1,130 | 1,008 | 508 | 991 | 1,499 | 9.0 | % | 7.7 | % | 1.5 | |||||||||||||||||||||||||
| Core Investment Vehicles (2017) | 25,444 | 15,768 | 2,366 | 24,323 | 26,689 | 18.0 | % | 16.9 | % | 1.7 | |||||||||||||||||||||||||
| Asian Fund III (2017) | 9,000 | 8,189 | 6,295 | 12,018 | 18,313 | 29.1 | % | 22.8 | % | 2.2 | |||||||||||||||||||||||||
| Real Estate Partners Americas II (2017) | 1,921 | 1,951 | 2,688 | 428 | 3,116 | 25.6 | % | 21.0 | % | 1.6 | |||||||||||||||||||||||||
| Global Infrastructure Investors III (2018) | 7,165 | 6,335 | 1,910 | 7,612 | 9,522 | 16.0 | % | 12.5 | % | 1.5 | |||||||||||||||||||||||||
| Global Impact Fund (2019) | 1,242 | 1,194 | 471 | 1,562 | 2,033 | 24.9 | % | 18.5 | % | 1.7 | |||||||||||||||||||||||||
| European Fund V (2019) | 6,338 | 5,670 | 917 | 6,947 | 7,864 | 14.1 | % | 10.7 | % | 1.4 | |||||||||||||||||||||||||
| Energy Income and Growth Fund II (2018) | 994 | 1,191 | 305 | 1,503 | 1,808 | 17.1 | % | 15.1 | % | 1.5 | |||||||||||||||||||||||||
| Asia Real Estate Partners (2019) | 1,682 | 1,238 | 22 | 1,383 | 1,405 | 10.3 | % | 4.6 | % | 1.1 | |||||||||||||||||||||||||
| Next Generation Technology Growth Fund II (2019) | 2,088 | 2,131 | 496 | 2,894 | 3,390 | 22.3 | % | 17.4 | % | 1.6 | |||||||||||||||||||||||||
| Real Estate Credit Opportunity Partners II (2019) | 950 | 976 | 226 | 928 | 1,154 | 9.6 | % | 7.4 | % | 1.2 | |||||||||||||||||||||||||
| Asia Pacific Infrastructure Investors (2020) | 3,792 | 3,375 | 738 | 3,347 | 4,085 | 14.4 | % | 9.9 | % | 1.2 | |||||||||||||||||||||||||
| Asian Fund IV (2020) | 14,735 | 6,554 | 348 | 8,324 | 8,672 | 18.5 | % | 11.5 | % | 1.3 | |||||||||||||||||||||||||
| Real Estate Partners Europe II (2020) | 2,061 | 1,656 | 431 | 1,313 | 1,744 | 3.5 | % | 0.2 | % | 1.1 | |||||||||||||||||||||||||
| Real Estate Partners Americas III (2021) | 4,253 | 2,771 | 228 | 2,584 | 2,812 | 0.9 | % | (1.7) | % | 1.0 | |||||||||||||||||||||||||
| Health Care Strategic Growth Fund II (2021) | 3,789 | 933 | — | 1,045 | 1,045 | 14.6 | % | (4.9) | % | 1.1 | |||||||||||||||||||||||||
| North America Fund XIII (2021) | 18,400 | 7,837 | — | 8,830 | 8,830 | 10.7 | % | 6.1 | % | 1.1 | |||||||||||||||||||||||||
Global Infrastructure Investors IV (2021) (3) | 16,589 | 9,672 | 328 | 10,598 | 10,926 | — | — | — | |||||||||||||||||||||||||||
European Fund VI (2022) (3) | 7,426 | 1,574 | — | 1,263 | 1,263 | — | — | — | |||||||||||||||||||||||||||
Global Impact Fund II (2022) (3) | 2,704 | 815 | — | 753 | 753 | — | — | — | |||||||||||||||||||||||||||
Asia Pacific Infrastructure Investors II (2022) (3) | 6,368 | — | — | — | — | — | — | — | |||||||||||||||||||||||||||
Next Generation Technology Growth Fund III (2022) (3) | 2,745 | 414 | — | 417 | 417 | — | — | — | |||||||||||||||||||||||||||
Ascendant Fund (2022) (3) | 3,003 | — | — | — | — | — | — | — | |||||||||||||||||||||||||||
| Subtotal - Included Funds | 229,029 | 167,800 | 164,131 | 130,118 | 294,249 | 16.1 | % | 12.3 | % | 1.8 | |||||||||||||||||||||||||
| All Funds | $ | 245,504 | $ | 184,275 | $ | 214,400 | $ | 130,118 | $ | 344,518 | 25.5 | % | 18.7 | % | 1.9 | ||||||||||||||||||||
(1)These funds were not contributed to KKR as part of the acquisition of the assets and liabilities of KKR & Co. (Guernsey) L.P. (formerly known as KKR Private Equity Investors, L.P.) on October 1, 2009.
(2)Where commitments are not U.S. dollar-denominated, such amounts have been converted into U.S. dollars based on the exchange rate prevailing on December 31, 2023.
(3)The gross IRR, net IRR and gross multiple of invested capital are calculated for our investment funds that made their first investment at least 24 months prior to December 31, 2023. We therefore have not calculated gross IRRs, net IRRs and gross multiples of invested capital with respect to these funds.
20
(4)An investment is considered realized when it has been disposed of or has otherwise generated disposition proceeds or current income that has been distributed by the relevant fund.
(5)IRRs measure the aggregate annual compounded returns generated by a fund's investments over a holding period. Net IRRs are calculated after giving effect to the allocation of realized and unrealized carried interest and the payment of any applicable management fees and organizational expenses. Gross IRRs are calculated before giving effect to the allocation of realized and unrealized carried interest and the payment of any applicable management fees and organizational expenses.
The gross multiples of invested capital measure the aggregate value generated by a fund's investments in absolute terms. Each multiple of invested capital is calculated by adding together the total realized and unrealized values of a fund's investments and dividing by the total amount of capital invested by the fund. Such amounts do not give effect to the allocation of realized and unrealized carried interest or the payment of any applicable management fees or organizational expenses.
KKR's Private Equity and Real Assets funds may utilize third-party financing facilities to provide liquidity to such funds. The above net and gross IRRs are calculated from the time capital contributions are due from fund investors to the time fund investors receive a related distribution from the fund, and the use of such financing facilities generally decreases the amount of time that would otherwise be used to calculate IRRs, which tends to increase IRRs when fair value grows over time and decrease IRRs when fair value decreases over time. KKR's Private Equity and Real Assets funds also generally provide in certain circumstances, which vary depending on the relevant fund documents, for a portion of capital returned to investors to be restored to unused commitments as recycled capital. For KKR's Private Equity and Real Assets funds that have a preferred return, we take into account recycled capital in the calculation of IRRs and multiples of invested capital because the calculation of the preferred return includes the effect of recycled capital. For KKR's Private Equity and Real Assets funds that do not have a preferred return, we do not take recycled capital into account in the calculation of IRRs and multiples of invested capital. The inclusion of recycled capital generally causes invested and realized amounts to be higher and IRRs and multiples of invested capital to be lower than had recycled capital not been included. The inclusion of recycled capital would reduce the composite net IRR of all Included Funds by 0.1% and the composite net IRR of all Legacy Funds by 0.5% and would reduce the composite multiple of invested capital of Included Funds by less than 0.1 and the composite multiple of invested capital of Legacy Funds by 0.4.
For more information, see "Risk Factors—Risks Related to Our Investment Activities—Future results of our investments may be different than, and may not achieve the levels of, any of our historical returns."
Credit and Liquid Strategies
Overview
Through our Credit and Liquid Strategies business line, we report our credit and hedge funds platforms on a combined basis. As of December 31, 2023, our Credit and Liquid Strategies business line had $245.5 billion of AUM, comprised of $123.3 billion of assets managed in our leveraged credit strategies, $86.1 billion of assets managed in our private credit strategy, $9.6 billion of assets managed in our SIG strategy, and $26.5 billion of assets managed through our hedge fund platform. We manage $124.9 billion of credit investments for our Global Atlantic insurance companies. Our BDCs have approximately $15.4 billion in assets under management, which is reflected in the AUM of our private credit strategies above. We report all of the assets under management of our BDCs in our AUM, but we report only a pro rata portion of the assets under management of our hedge fund partnerships based on our percentage ownership in them.
Credit
Our credit platform invests capital in a broad range of corporate debt and collateral-backed investments across asset classes and capital structures. Our credit strategies are primarily managed by KKR Credit Advisors (US) LLC, which is an SEC-registered investment adviser, KKR Credit Advisors (Ireland) Unlimited Company, which is regulated by the Central Bank of Ireland (“CBI”), KKR Credit Advisors (EMEA) LLP, which is regulated by the United Kingdom ("UK") Financial Conduct Authority (the "FCA"), and KKR Credit Advisors (Singapore) Pte. Ltd., which is regulated by the Monetary Authority of Singapore and an SEC-registered investment adviser. We also jointly own with a third party FS/KKR Advisor, LLC, an investment adviser registered with the SEC that provides investment advisory services to certain registered investment companies, including FS KKR Capital Corp. (NYSE: FSK), a publicly listed BDC and KKR FS Income Trust, a privately-offered BDC.
Our hedge funds platform consists of strategic partnerships with third-party hedge fund managers in which KKR owns a minority stake. Our hedge fund partnerships offer a range of alternative investment strategies, including long/short equity, hedge fund-of-funds and energy credit investments.
Our credit business pursues a variety of investment strategies in leveraged credit and alternative credit.
Leveraged Credit. Our leveraged credit strategies seek to primarily invest in leveraged loans (including revolving credit facilities), CLOs, high yield bonds, structured credit, stressed securities and illiquid credits. Within leveraged credit, we manage both single-asset class and multi-asset class pools of capital. Our opportunistic credit strategy seeks to deploy capital across investment themes that seek to take advantage of credit market dislocations, spanning asset types and liquidity profiles. Our multi-asset credit strategy seeks to dynamically allocate across asset types in a broadly diversified strategy. Our revolving credit strategy invests in senior secured revolving credit facilities.
21
Alternative Credit. Our alternative credit strategy consists of our (i) private credit strategies and (ii) investments overseen by our credit platform’s strategic investments group (“SIG”):
•Private Credit. Our private credit strategies focus on privately or directly originated and negotiated transactions. These strategies include direct lending typically in the senior part of a company’s capital structure, junior mezzanine debt, and asset-based finance. Through our direct lending strategy, we seek to make investments in primarily senior debt financings for middle-market companies. Through our junior mezzanine debt strategy, investments typically consist of subordinated debt, which generates a current yield, coupled with marginal equity exposure for additional upside potential. Our asset-based finance strategy focuses on portfolios of financial loans and loans backed by hard assets.
•Strategic Investments Group. This strategy seeks to provide strategic capital solutions to high quality, mid-to-large cap companies and assets. The strategy pursues investments in corporate credit as well as asset or real estate-backed credit, where we believe market volatility or other investment themes have created the opportunity to invest opportunistically across the capital structure and through market cycles to generate outsized returns with downside-protected securities. These investments may include stressed or distressed investments (including post-restructuring equity), control-oriented opportunities, rescue financing (debt or equity investments made to address covenant, maturity or liquidity issues), debtor-in-possession or exit financing and other event-driven investments in debt or equity.
Hedge Fund Platform
Our hedge fund platform consists of strategic partnerships with third-party hedge fund managers in which KKR owns a minority stake. This principally consists of a 39.6% interest in Marshall Wace LLP (together with its affiliates, "Marshall Wace"), a global alternative investment manager specializing in long/short equity products. We also own other interests in third-party hedge fund managers, including a 39.9% interest in PAAMCO Prisma Holdings, LLC ("PAAMCO Prisma"), an investment manager focused on liquid alternative investment solutions, including hedge fund-of-fund portfolios.
22
Credit and Liquid Strategies Assets Under Management and Select Fund Performance Information
The following chart presents the growth in the AUM of our Credit and Liquid Strategies business line from the December 31, 2019 through December 31, 2023.
Credit and Liquid Strategies
Assets Under Management (1)
($ in billions)
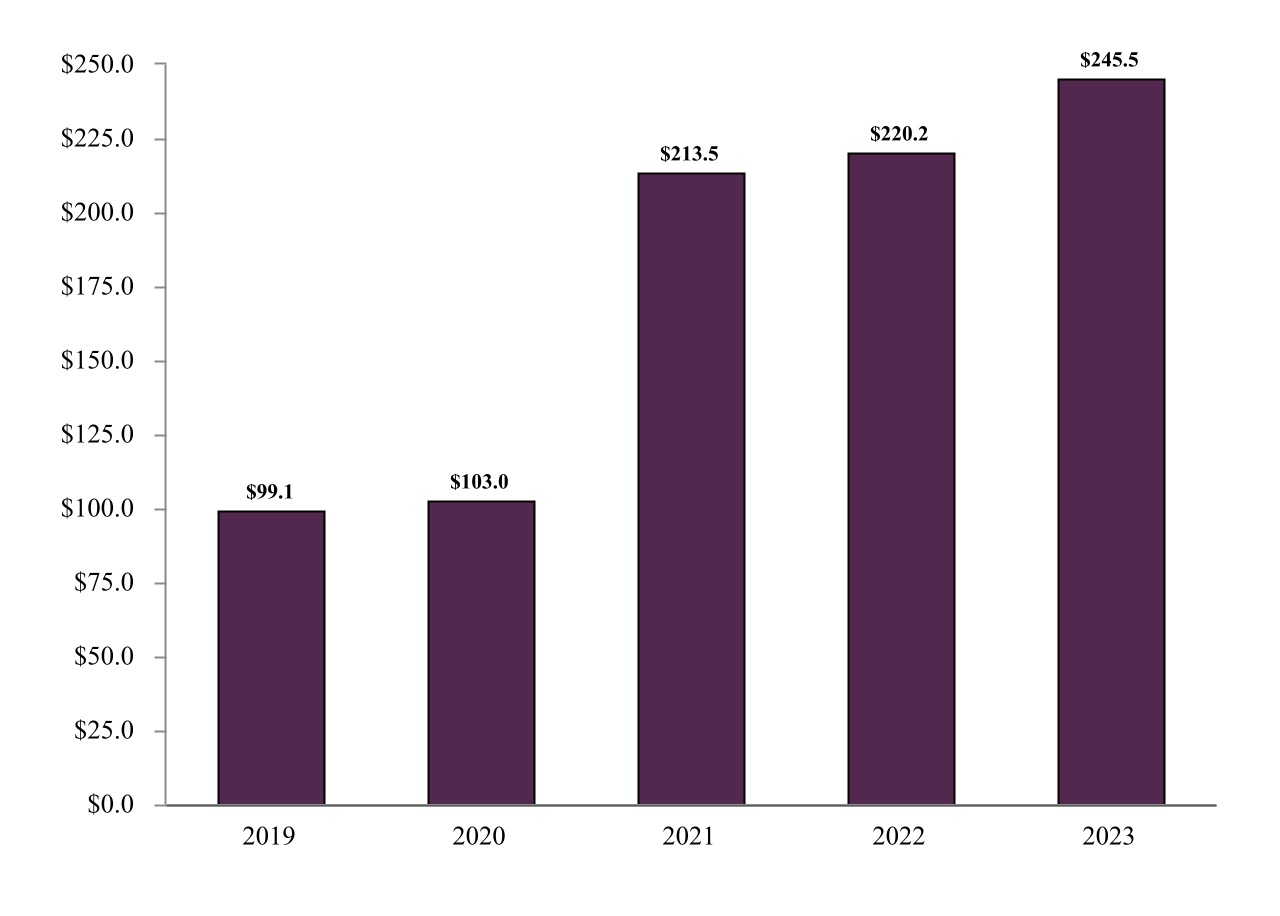
(1)AUM of acquired businesses and pro rata AUM of hedge fund partnerships in which KKR has made an investment are included in the years on and after the completion of the respective acquisitions or transactions, as applicable.
23
The table below presents information as of December 31, 2023, relating to our current credit vehicles reported in our Credit and Liquid Strategies business line for which we have the ability to earn carried interest. This data does not reflect acquisitions or disposals of investments, changes in investment values, or distributions occurring after December 31, 2023.
| Investment Period | Amount ($ in millions) | |||||||||||||||||||||||||||||||
Start Date (1) | End Date (2) | Commitment (3) | Uncalled Commitments | Percentage Committed by General Partner | Invested | Realized | Remaining Cost (4) | Remaining Fair Value | Gross Accrued Carried Interest | |||||||||||||||||||||||
| Credit and Liquid Strategies Business Line | ||||||||||||||||||||||||||||||||
| Opportunities Fund II | 11/2021 | 1/2026 | $ | 2,329 | $ | 1,743 | 7% | $ | 586 | $ | 6 | $ | 586 | $ | 635 | $ | 5 | |||||||||||||||
| Dislocation Opportunities Fund | 8/2019 | 11/2021 | 2,967 | 480 | 14% | 2,488 | 1,141 | 1,766 | 1,888 | 56 | ||||||||||||||||||||||
| Special Situations Fund II | 2/2015 | 3/2019 | 3,525 | 284 | 9% | 3,241 | 2,342 | 1,216 | 1,263 | — | ||||||||||||||||||||||
| Special Situations Fund | 1/2013 | 1/2016 | 2,274 | 1 | 12% | 2,273 | 1,790 | 429 | 348 | — | ||||||||||||||||||||||
| Mezzanine Partners | 7/2010 | 3/2015 | 1,023 | 33 | 4% | 990 | 1,166 | 184 | 152 | (20) | ||||||||||||||||||||||
| Asset-Based Finance Partners | 10/2020 | 7/2025 | 2,059 | 1,017 | 7% | 1,042 | 83 | 1,042 | 1,116 | 22 | ||||||||||||||||||||||
| Private Credit Opportunities Partners II | 12/2015 | 12/2020 | 2,245 | 377 | 2% | 1,868 | 872 | 1,238 | 1,210 | — | ||||||||||||||||||||||
| Lending Partners IV | 3/2022 | 9/2026 | 1,150 | 518 | 5% | 632 | 24 | 633 | 666 | 4 | ||||||||||||||||||||||
| Lending Partners III | 4/2017 | 11/2021 | 1,498 | 540 | 2% | 958 | 766 | 741 | 741 | 41 | ||||||||||||||||||||||
| Lending Partners II | 6/2014 | 6/2017 | 1,336 | 157 | 4% | 1,179 | 1,198 | 151 | 85 | — | ||||||||||||||||||||||
| Lending Partners | 12/2011 | 12/2014 | 460 | 40 | 15% | 420 | 458 | 23 | 11 | — | ||||||||||||||||||||||
| Lending Partners Europe II | 5/2019 | 9/2023 | 837 | 210 | 7% | 627 | 182 | 591 | 623 | 5 | ||||||||||||||||||||||
| Lending Partners Europe | 3/2015 | 3/2019 | 848 | 184 | 5% | 662 | 425 | 247 | 218 | — | ||||||||||||||||||||||
| Asia Credit Opportunities | 1/2021 | 5/2025 | 1,084 | 581 | 9% | 503 | 16 | 503 | 580 | 12 | ||||||||||||||||||||||
| Other Alternative Credit Vehicles | Various | Various | 13,683 | 5,758 | Various | 7,911 | 5,953 | 4,125 | 4,404 | 14 | ||||||||||||||||||||||
| Total Credit and Liquid Strategies | $ | 37,318 | $ | 11,923 | $ | 25,380 | $ | 16,422 | $ | 13,475 | $ | 13,940 | $ | 139 | ||||||||||||||||||
(1)The start date represents the start of the fund's investment period as defined in the fund's governing documents and may or may not be the same as the date upon which management fees begin to accrue. For further information on management fee calculations, see Note 2 "Summary of Significant Accounting Policies" in our financial statements.
(2)The end date represents the end of the fund's investment period as defined in the fund's governing documents and is generally not the date upon which management fees cease to be paid. For further information on management fee calculations, see Note 2 "Summary of Significant Accounting Policies" in our financial statements.
(3)The commitment represents the aggregate capital commitments to the fund, including capital commitments by third-party fund investors and the general partner. Foreign currency commitments have been converted into U.S. dollars based on the foreign exchange rate that prevailed on December 31, 2023.
(4)The remaining cost represents the initial investment of the general partner and limited partners, reduced for returns of capital.
The following table presents information regarding larger leveraged credit strategies managed by KKR from inception to December 31, 2023. The information presented below is not intended to be representative of any past or future performance for any particular period other than the period presented below. Past performance is no guarantee of any future result.
| Leveraged Credit Strategy | Inception Date | Gross Returns | Net Returns | Benchmark (1) | Benchmark Gross Returns | |||||||||||||||||||||||||||
Multi-Asset Credit Composite | Jul 2008 | 6.99 | % | 6.30 | % | 50% S&P/LSTA Loan Index, 50% BoAML HY Master II Index (2) | 5.63% | |||||||||||||||||||||||||
Opportunistic Credit (3) | May 2008 | 10.54 | % | 8.95 | % | 50% S&P/LSTA Loan Index, 50% BoAML HY Master II Index (3) | 5.83% | |||||||||||||||||||||||||
| Bank Loans | Apr 2011 | 5.57 | % | 5.00 | % | S&P/LSTA Loan Index (4) | 4.55% | |||||||||||||||||||||||||
| High-Yield | Apr 2011 | 5.99 | % | 5.41 | % | BoAML HY Master II Index (5) | 5.33% | |||||||||||||||||||||||||
European Leveraged Loans (6) | Sep 2009 | 4.69 | % | 4.17 | % | CS Inst West European Leveraged Loan Index (7) | 3.73% | |||||||||||||||||||||||||
European Credit Opportunities (6) | Sept 2007 | 6.34 | % | 5.18 | % | S&P European Leveraged Loans (All Loans) (8) | 4.23% | |||||||||||||||||||||||||
(1)The benchmarks referred to herein include the S&P/LSTA Leveraged Loan Index (the "S&P/LSTA Loan Index"), S&P/LSTA U.S. B/BB Ratings Loan Index (the "S&P/LSTA BB-B Loan Index"), the Bank of America Merrill Lynch High Yield Master II Index (the "BoAML HY Master II Index"), the BofA Merrill Lynch BB-B US High Yield Index (the "BoAML HY BB-B Constrained"), the Credit Suisse Institutional Western European Leveraged Loan Index (the "CS Inst West European Leveraged Loan Index"), and S&P European Leveraged Loans (All Loans). The S&P/LSTA Loan Index is a daily tradable index for the U.S. loan market that seeks to mirror the market-weighted performance of the largest institutional loans that meet certain criteria. The BoAML HY Master II Index is an index for high-yield corporate bonds. It is designed to measure the broad high-yield market, including lower-rated securities. The CS Inst West European Leveraged Loan Index contains only institutional loan facilities priced above 90, excluding TL and TLa facilities and loans rated CC, C or are in default. The S&P European Leveraged Loan Index reflects the market-weighted performance of institutional leveraged loan portfolios investing in European credits. While the returns of our leveraged credit strategies reflect the reinvestment of income and dividends, none of the indices presented in the chart above reflect such reinvestment, which has the effect of increasing the reported relative performance of these strategies as compared to the indices. Furthermore, these indices are not subject to management fees, incentive allocations, or expenses.
24
(2)Performance is based on a blended composite of Bank Loans, High Yield, and Structured Credit strategy accounts. The benchmark used for purposes of comparison for the Multi-Asset Credit Composite strategy is based on 65% S&P/LSTA Loan Index and 35% BoAML HY Master II Index to May 2022, and 50% S&P/LSTA Loan Index, 50% BoAML HY Master II Index, from June 2022.
(3)The Opportunistic Credit strategy invests in high-yield securities and corporate loans with no preset allocation. The benchmark used for purposes of comparison for the Opportunistic Credit strategy presented herein is based on 50% S&P/LSTA Loan Index and 50% BoAML HY Master II Index. Funds within this strategy may utilize third-party financing facilities to enhance investment returns. In cases where financing facilities are used, the amounts drawn on the facility are deducted from the assets of the fund in the calculation of net asset value, which tends to increase returns when net asset value grows over time and decrease returns when net asset value decreases over time.
(4)Performance is based on a composite of portfolios that primarily invest in leveraged loans. The benchmark used for purposes of comparison for the Bank Loans strategy is based on the S&P/LSTA Loan Index.
(5)Performance is based on a composite of portfolios that primarily invest in high-yield securities. The benchmark used for purposes of comparison for the High Yield strategy is based on the BoAML HY Master II Index.
(6)The returns presented are calculated based on local currency.
(7)Performance is based on a composite of portfolios that primarily invest in higher quality leveraged loans. The benchmark used for purposes of comparison for the European Leveraged Loans strategy is based on the CS Inst West European Leveraged Loan Index.
(8)Performance is based on a composite of portfolios that primarily invest in European institutional leveraged loans. The benchmark used for purposes of comparison for the European Credit Opportunities strategy is based on the S&P European Leveraged Loans (All Loans) Index.
The following table presents information regarding our alternative credit investment funds where investors have capital commitments from inception to December 31, 2023. The information presented below is not intended to be representative of any past or future performance for any particular period other than the period presented below. Past performance is no guarantee of any future result.
| Amount | Fair Value of Investments | |||||||||||||||||||||||||||||||||||||||||||||||||||||||
| Credit and Liquid Strategies Investment Funds | Investment Period Start Date | Commitment | Invested (1) | Realized (1) | Unrealized | Total Value | Gross IRR (2) | Net IRR (2) | Multiple of Invested Capital (3) | |||||||||||||||||||||||||||||||||||||||||||||||
| ($ in Millions) | ||||||||||||||||||||||||||||||||||||||||||||||||||||||||
Opportunities Fund II | Nov 2021 | $ | 2,329 | $ | 586 | $ | 6 | $ | 635 | $ | 641 | 14.4 | % | 9.0 | % | 1.1 | ||||||||||||||||||||||||||||||||||||||||
Dislocation Opportunities Fund | Aug 2019 | 2,967 | 2,488 | 1,141 | 1,888 | 3,029 | 10.7 | % | 8.4 | % | 1.2 | |||||||||||||||||||||||||||||||||||||||||||||
| Special Situations Fund II | Feb 2015 | 3,525 | 3,241 | 2,342 | 1,263 | 3,605 | 2.6 | % | 0.7 | % | 1.1 | |||||||||||||||||||||||||||||||||||||||||||||
| Special Situations Fund | Jan 2013 | 2,274 | 2,273 | 1,790 | 348 | 2,138 | (1.3) | % | (3.0) | % | 0.9 | |||||||||||||||||||||||||||||||||||||||||||||
| Mezzanine Partners | July 2010 | 1,023 | 990 | 1,166 | 152 | 1,318 | 9.1 | % | 5.9 | % | 1.3 | |||||||||||||||||||||||||||||||||||||||||||||
Asset-Based Finance Partners | Oct 2020 | 2,059 | 1,042 | 83 | 1,116 | 1,199 | 14.8 | % | 10.5 | % | 1.2 | |||||||||||||||||||||||||||||||||||||||||||||
| Private Credit Opportunities Partners II | Dec 2015 | 2,245 | 1,868 | 872 | 1,210 | 2,082 | 3.2 | % | 1.5 | % | 1.1 | |||||||||||||||||||||||||||||||||||||||||||||
Lending Partners IV | Mar 2022 | 1,150 | 632 | 24 | 666 | 690 | N/A | N/A | N/A | |||||||||||||||||||||||||||||||||||||||||||||||
| Lending Partners III | Apr 2017 | 1,498 | 958 | 766 | 741 | 1,507 | 15.1 | % | 12.3 | % | 1.6 | |||||||||||||||||||||||||||||||||||||||||||||
| Lending Partners II | Jun 2014 | 1,336 | 1,179 | 1,198 | 85 | 1,283 | 3.0 | % | 1.6 | % | 1.1 | |||||||||||||||||||||||||||||||||||||||||||||
| Lending Partners | Dec 2011 | 460 | 420 | 458 | 11 | 469 | 3.5 | % | 1.8 | % | 1.1 | |||||||||||||||||||||||||||||||||||||||||||||
| Lending Partners Europe II | May 2019 | 837 | 627 | 182 | 623 | 805 | 16.0 | % | 12.3 | % | 1.3 | |||||||||||||||||||||||||||||||||||||||||||||
| Lending Partners Europe | Mar 2015 | 848 | 662 | 425 | 218 | 643 | (0.7) | % | (2.9) | % | 1.0 | |||||||||||||||||||||||||||||||||||||||||||||
Asia Credit Opportunities | Jan 2021 | 1,084 | 503 | 16 | 580 | 596 | 17.7 | % | 12.7 | % | 1.2 | |||||||||||||||||||||||||||||||||||||||||||||
| Other Alternative Credit Vehicles | Various | 13,683 | 7,911 | 5,953 | 4,404 | 10,357 | N/A | N/A | N/A | |||||||||||||||||||||||||||||||||||||||||||||||
| All Funds | $ | 37,318 | $ | 25,380 | $ | 16,422 | $ | 13,940 | $ | 30,362 | ||||||||||||||||||||||||||||||||||||||||||||||
(1)Recycled capital is excluded from the amounts invested and realized.
(2)These credit funds utilize third-party financing facilities to provide liquidity to such funds, and in such event IRRs are calculated from the time capital contributions are due from fund investors to the time fund investors receive a related distribution from the fund. The use of such financing facilities generally decreases the amount of invested capital that would otherwise be used to calculate IRRs, which tends to increase IRRs when fair value grows over time and decrease IRRs when fair value decreases over time. IRRs measure the aggregate annual compounded returns generated by a fund's investments over a holding period and are calculated taking into account recycled capital. Net IRRs presented are calculated after giving effect to the allocation of realized and unrealized carried interest and the payment of any applicable management fees and organizational expenses. Gross IRRs are calculated before giving effect to the allocation of carried interest and the payment of any applicable management fees and organizational expenses.
(3)The multiples of invested capital measure the aggregate value generated by a fund's investments in absolute terms. Each multiple of invested capital is calculated by adding together the total realized and unrealized values of a fund's investments and dividing by the total amount of capital invested by the investors. The use of financing facilities generally decreases the amount of invested capital that would otherwise be used to calculate multiples of invested capital, which tends to increase multiples when fair value grows over time and decrease multiples when fair value decreases over time. Such amounts do not give effect to the allocation of any realized and unrealized returns on a fund's investments to the fund's general partner pursuant to a carried interest or the payment of any applicable management fees and are calculated without taking into account recycled capital.
For additional information regarding impact of market conditions on the value and performance of our investments, see "Risk Factors—Risks Related to Our Business—Difficult market and economic conditions can, and periodically do, materially adversely affect KKR." and "Risk Factors—Risks Related to Our Investment Activities—Future results of our investments may be different than, and may not achieve the levels of, any of our historical returns."
25
The table below presents information as of December 31, 2023, based on the investment funds or other vehicles or accounts offered by our Credit and Liquid Strategies business line. Our funds, vehicles and accounts have been sorted based upon their primary investment strategies. However, the AUM and FPAUM presented for each line in the table includes certain investments from non-primary investment strategies, which are permitted by their investment mandates, for purposes of presenting the fees and other terms for such funds, vehicles and accounts.
| ($ in millions) | AUM | FPAUM | Typical Management Fee Rate | Incentive Fee / Carried Interest | Preferred Return | Duration of Capital | ||||||||||||||||||||||||||||||||
| Leveraged Credit: | ||||||||||||||||||||||||||||||||||||||
Leveraged Credit SMAs/Funds (1) | $ | 96,810 | $ | 94,465 | 0.15% - 1.30% | Various (2) | Various (2) | Subject to redemptions | ||||||||||||||||||||||||||||||
| CLOs | 26,784 | 26,784 | 0.40% - 0.50% | Various (2) | Various (2) | 10-14 Years (3) | ||||||||||||||||||||||||||||||||
| Total Leveraged Credit | 123,594 | 121,249 | ||||||||||||||||||||||||||||||||||||
Alternative Credit: (4) | ||||||||||||||||||||||||||||||||||||||
Private Credit (1) | 72,150 | 60,340 | 0.25% - 1.50% (5) | 10.00 - 20.00% | 5.00 - 8.00% | 8-15 Years (3) | ||||||||||||||||||||||||||||||||
| SIG | 7,807 | 2,899 | 0.50% - 1.75% | 10.00 - 20.00% | 7.00 - 12.00% | 7-15 Years (3) | ||||||||||||||||||||||||||||||||
| Total Alternative Credit | 79,957 | 63,239 | ||||||||||||||||||||||||||||||||||||
Hedge Funds (6) | 26,522 | 26,522 | 0.50% - 2.00% | Various (2) | Various (2) | Subject to redemptions | ||||||||||||||||||||||||||||||||
BDCs (7) | 15,418 | 15,418 | 0.60% - 0.625% | 7.00% - 8.00% | 7.00% | Indefinite | ||||||||||||||||||||||||||||||||
| Total | $ | 245,491 | $ | 226,428 | ||||||||||||||||||||||||||||||||||
(1)Includes credit investments we manage for our Global Atlantic insurance companies. This capital is perpetual in nature, not subject to an incentive fee or carried interest, and does not require a preferred return.
(2)Certain funds and CLOs are subject to a performance fee in which the manager or general partner of the funds share up to 20% of the net profits earned by investors in excess of performance hurdles (generally tied to a benchmark or index) and subject to a provision requiring the funds and vehicles to regain prior losses before any performance fee is earned.
(3)Duration of capital is measured from inception. Inception dates for CLOs were between 2013 and 2023 and for separately managed accounts and funds investing in alternative credit strategies from 2009 through 2023.
(4)Our alternative credit funds generally have investment periods of two to five years and our newer alternative credit funds generally earn management fees on invested capital throughout their lifecycle.
(5)Lower fees on uninvested capital in certain vehicles.
(6)Hedge Funds represent KKR's pro rata portion of AUM and FPAUM of our hedge fund partnerships.
(7)Represents FS KKR Capital Corp. and KKR FS Income Trust. We report all of the assets under management of these BDCs in our AUM and FPAUM.
Credit and Liquid Strategies Investment Process and Fund Characteristics
Investment Approach
Our approach to making credit investments focuses on creating investment portfolios that seek to generate attractive risk-adjusted returns by selecting investments that may be made at attractive prices, subjecting investments to regular monitoring and oversight, and, for more liquid investments, making buy and sell decisions based on relative value parameters. The firm employs both "top-down" and "bottom-up" analyses when making investments. Our top-down analysis involves, as appropriate, a macro analysis of relative asset valuations, long-term industry trends, business cycles, regulatory trends, interest rate expectations, credit fundamentals and technical factors to target specific industry sectors and asset classes in which to invest. From a bottom-up perspective, our investment decision is predicated on an investment thesis that is developed using our proprietary resources and knowledge and due diligence.
Sourcing and Selecting Investments
We source our credit investment opportunities through a variety of channels, including internal deal generation strategies and the firm's global network of contacts at major companies, corporate executives, commercial and investment banks, financial intermediaries, other private equity sponsors and other investment and advisory institutions. We are also provided with opportunities to invest, in certain strategies where appropriate, in the securities of KKR's private equity portfolio companies, though there are limitations across the platform on the availability and maximum size of such KKR-affiliated investments.
26
Due Diligence and the Investment Decision
Once a potential credit investment has been identified, our investment professionals screen the opportunity and make a preliminary determination concerning whether we should proceed with further diligence. When evaluating the suitability of an investment for our credit vehicles, we typically employ a relative value framework and subject the investment to due diligence. This review considers many factors including, as appropriate, expected returns, capital structure, credit ratings, historical and projected financial data, the issuer's competitive position, the quality and track record of the issuer's management team, margin stability, and industry and company trends. Investment professionals use the services of outside advisors and industry experts as appropriate to assist them in the due diligence process and, when relevant and permitted, leverage the knowledge and experience of our Private Equity and Real Assets investment professionals. Strategy-specific investment committees monitor our due diligence practices.
Monitoring Investments
We monitor our portfolios of investments using, as applicable, daily, quarterly and annual analyses. Daily analyses include morning market meetings, industry and company pricing runs, industry and company reports and discussions with the firm's Private Equity, Real Assets and Capital Markets investment professionals on an as-needed basis. Quarterly analyses include the preparation of quarterly operating results, reconciliations of actual results to projections and updates to financial models (baseline and stress cases). Annual analyses involve conducting internal audits, and testing compliance with monitoring and documentation requirements.
Credit Vehicles and Fund Structures
We pursue leveraged credit and alternative credit investments across a range of vehicles, including investment funds and separately managed accounts, for which we receive a fee and in certain cases an incentive fee or carried interest.
We also manage structured credit vehicles in the form of CLOs that hold leveraged loans, high-yield bonds or a combination of both. CLOs are typically structured as special purpose investment vehicles that acquire, monitor and, to varying degrees, manage a pool of credit assets. CLOs generally serve as long-term financing for leveraged credit investments and as a way to reduce refinancing risk, reduce maturity risk and secure a fixed cost of funds over an underlying market interest rate. We typically receive a fee for managing CLOs.
We also serve as the investment adviser to investment companies registered under the U.S. Investment Company Act of 1940 (the "Investment Company Act," and such registered investment companies, "RICs"), including KKR Income Opportunities Fund (NYSE: KIO), KKR Credit Opportunities Portfolio (an interval fund), as well as FS KKR Capital Corp. (NYSE: FSK) and KKR FS Income Trust (a privately offered BDC) through our joint ownership of their investment adviser. We also serve as the investment adviser to other vehicles that are available to public investors, including KKR Credit Income Fund (an Australian listed investment trust; ASX: KKC). The management fees we are paid for managing RICs are generally subject to contractual rights that require their board of directors to provide prior notice in order to terminate our investment management services.
27
Capital Markets
Our Capital Markets business line is comprised of our global capital markets business, which is integrated with KKR’s asset management business lines, and serves our firm, our portfolio companies and third-party customers by developing and implementing both traditional and non-traditional capital solutions for investments or companies seeking financing. These services include arranging debt and equity financing, placing and underwriting securities offerings, and providing other types of capital markets services that result in the firm receiving fees, including underwriting, placement, transaction and syndication fees, commissions, underwriting discounts, interest payments and other compensation, which may be payable in cash or securities, in respect of the activities described above. The third-party customers of our capital markets business include multi-national corporations, public and private companies, financial sponsors, mutual funds, pension funds, sovereign wealth funds, and hedge funds globally. Our capital markets business provides these third-party clients with differentiated access to capital through our distribution platform.
Our capital markets business underwrites credit facilities and arranges loan syndications and participations. When we are sole or lead arrangers of a credit facility, we may advance amounts to the borrower on behalf of other lenders, subject to repayment. When we underwrite an offering of securities on a firm commitment basis, we commit to buy and sell an issue of securities and generate revenue by purchasing the securities at a discount or for a fee. When we act in an agency capacity or best efforts basis, we generate revenue for arranging financing or placing securities with capital markets investors. We may also provide issuers with capital markets advice on capital structuring, access to markets, marketing considerations, securities pricing, and other aspects of capital markets transactions in exchange for a fee. Our capital markets business also provides syndication services in respect of co-investments in transactions participated in by KKR funds or third-party clients, which may entitle the firm to receive syndication fees, management fees and/or a carried interest.
The capital markets business has a global footprint, with local presence and licenses to carry out certain broker-dealer activities in various countries in North America, Europe, Asia-Pacific and the Middle East. Our flagship capital markets subsidiaries include KKR Capital Markets LLC, which is an SEC-registered broker-dealer and a member of the Financial Industry Regulatory Authority ("FINRA"), and KKR Capital Markets Asia Limited, a Hong Kong licensed asset manager and broker dealer licensed by the Securities and Futures Commission in Hong Kong to carry on dealing in securities, advising on securities and asset management regulated activities.
Principal Activities
Through our Principal Activities business line, we manage the firm’s own assets on our firm’s balance sheet and deploy capital to support and grow our Private Equity, Real Assets, and Credit and Liquid Strategies business lines.
Typically, the funds in our Private Equity, Real Assets, and Credit and Liquid Strategies business lines contractually require us, as general partner of the funds, to make sizable capital commitments. We believe making general partner commitments assists us in raising new funds from limited partners by demonstrating our conviction in a given fund’s strategy. Our commitments to fund capital also occurs where we are the holder of the subordinated notes or the equity tranche of investment vehicles that we sponsor, including structured transactions. We also use our balance sheet to bridge investment activity during fundraising, for example by funding investments for new funds and acquiring investments to establish a track record for new investment strategies. We also use our own capital to bridge capital selectively for our funds’ investments or finance strategic transactions, although the financial results of an acquired business may be reported in our other business lines.
Our Principal Activities business line also provides the required capital to fund the various commitments of our Capital Markets business line when underwriting or syndicating securities, or when providing term loan commitments for transactions involving our portfolio companies and for third parties. Our Principal Activities business line also holds assets that are utilized to satisfy regulatory requirements for our Capital Markets business line and risk retention requirements for certain investment vehicles.
We also make opportunistic investments through our Principal Activities business line, which include co-investments alongside our Private Equity, Real Assets and Credit and Liquid Strategies funds, as well as Principal Activities investments that do not involve our Private Equity, Real Assets, or Credit and Liquid Strategies funds.
We endeavor to use our balance sheet strategically and opportunistically to generate an attractive risk-adjusted return on equity in a manner that is consistent with our fiduciary duties, in compliance with applicable laws, and consistent with our one-firm approach.
28
The chart below presents the holdings of our Principal Activities business line by asset class as of December 31, 2023.
Holdings by Asset Class (1)
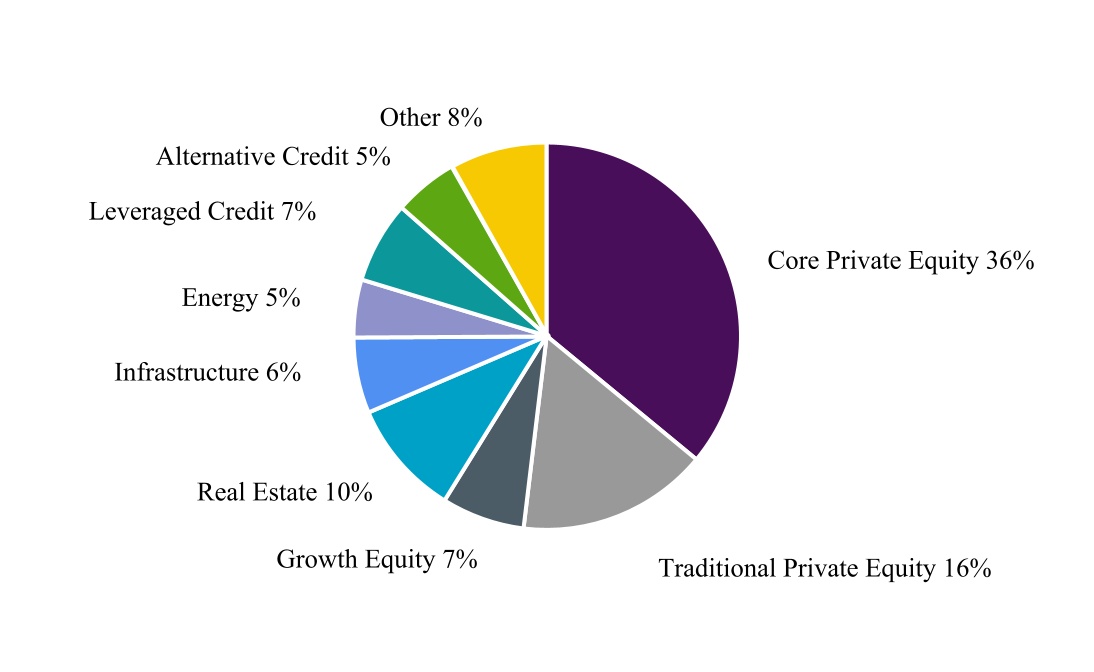
(1)General partner commitments to our funds are included in the various asset classes shown above. Assets and revenues of other asset managers with which KKR has formed strategic partnerships where KKR does not hold more than 50% ownership interest are not included in our Principal Activities business line but are reported in the financial results of our other business lines.
Core Private Equity
A substantial portion of our Principal Activities business line has been dedicated to support our core private equity strategy, where we have committed to fund investors to invest a significant amount of our own capital alongside their core private equity investments. As discussed above, our core private equity strategy targets investments with a longer holding period and a lower anticipated risk profile than our traditional private equity investments. Core private equity consists of investments anticipated to be held for a longer holding period and which possess a lower anticipated risk profile than our traditional private equity investments. Our core private equity investments are made in companies that, among other things, we believe are more stable, and typically with lower leverage over our holding period than those companies in which our traditional private equity investments are made. As of December 31, 2023, core private equity investments accounted for over 30% of the investments on our balance sheet. We believe our core private equity investments should generate earnings that compound over a long period of time. As of December 31, 2023, the fair value of our core private equity investments on the balance sheet was $6.7 billion, resulting in an inception to date gross IRR of 19%. "Investments" as referenced above is a term used solely for purposes of financial presentation of a portion of our balance sheet and includes majority ownership of subsidiaries that operate our asset management, broker-dealer, insurance and other businesses, including the general partner interests of our investment funds, controlling interests in core private equity companies, and the Global Atlantic insurance companies.
As a result of acquiring the remaining minority interests of Global Atlantic that we did not already own on January 2, 2024, beginning with KKR & Co. Inc.’s quarterly report on Form 10-Q for the quarter ending March 31, 2024, we expect to have a third segment named Strategic Holdings, which we expect will initially be comprised of the firm’s participation in our core private equity strategy, and we expect that the periodic financial operating results for these investments will no longer be reported as part of our Principal Activities business line within the asset management segment.
29
Fundraising and Composition of Fund Investors
We have dedicated employees in our KKR Client Services, formerly known as our Client & Partner Group, who are responsible for raising capital for our asset management businesses globally across all products, expanding our investment advisory relationships across asset classes and across types of fund investors, developing products to meet our fund investors’ needs, and servicing existing fund investors and products. We also provide customized solutions for investors seeking diversified portfolios of investment funds and direct co-investments in privately negotiated investments. From time to time, we also provide fundraising services to certain third-party fund managers in our hedge fund partnerships.
As of December 31, 2023, we had over 1,800 investors in privately offered funds across all our strategies. The following charts detail our investor base by type and geography as of December 31, 2023.
Fund Investor Base by Type (1) Fund Investor Base by Geography (1)
(1)Based on the AUM of our Private Equity, Real Assets and Credit and Liquid Strategies. These charts exclude general partner commitments, assets managed through CLOs, and assets managed by other asset managers with which KKR has formed strategic partnerships where KKR does not hold more than a 50% ownership interest. Allocations are assigned to a type or geographic region according to subscriptions received from a limited partner.
We also offer opportunities to invest in various vehicles, which we refer to as the “K-Series,” for individual private wealth investors. These investment opportunities are distributed through third-party managed vehicles sponsored by brokerage firms, banks or third-party feeder providers or to the qualified clients of banks, independent investment advisors and broker-dealers. Unlike our traditional fund structures, these investments do not have fixed termination dates and provide certain limited opportunities for liquidity. We have K-Series vehicles that operate or invest in private equity companies, infrastructure assets, credit investments and real estate. We provide our services pursuant to management agreements with these vehicles, which provide for management and performance fees.
30
Insurance
Our insurance business is operated by Global Atlantic, which KKR acquired a majority controlling interest on February 1, 2021, and which KKR acquired the remaining equity interests in Global Atlantic that KKR did not already own on January 2, 2024. As of December 31, 2023, KKR owned 65.2% of Global Atlantic with the balance of Global Atlantic owned by third-party investors and Global Atlantic employees. Following the Global Atlantic acquisition, Global Atlantic continues to operate as a separate business with its existing brands and management team. Since the first quarter of 2021, we have presented Global Atlantic's financial results as a separate reportable segment.
Global Atlantic is a leading retirement and life insurance company that provides a broad suite of protection, legacy and savings products to customers and reinsurance solutions to clients across individual and institutional markets. Global Atlantic focuses on target markets that it believes support issuing products that have attractive risk and return characteristics. These markets allow Global Atlantic to leverage its strength in distribution and to deploy shareholder capital opportunistically across various market environments.
Global Atlantic offers individual customers fixed-rate annuities, fixed-indexed annuities, and targeted life products primarily through a network of banks, broker-dealers, and insurance agencies. Global Atlantic provides its institutional clients customized reinsurance solutions, including block, flow and pension risk transfer ("PRT") reinsurance, as well as funding agreements. Global Atlantic’s assets generally increase when individual market sales and reinsurance transactions exceed run-off of in-force policies. Global Atlantic primarily generates income by earning a spread on assets under management, as the difference between its net investment income and the cost of policyholder benefits. Global Atlantic also earns fees paid by policyholders on certain types of contracts and fees paid by third-party investors, which are reported in the asset management segment. As of December 31, 2023, Global Atlantic served over three million policyholders.
Global Atlantic operates in the following two complementary markets: individual and institutional.
Individual Markets. Global Atlantic seeks to reach individuals in the United States who are planning for, or are already in, retirement. Global Atlantic’s annuity products are distributed primarily through a network of distribution partners, including over 200 banks and broker-dealers and over 200 independent marketing organizations. Global Atlantic generated $11.4 billion of sales for the year ended December 31, 2023. Global Atlantic's targeted life products are distributed primarily through 20 independent marketing organizations and over 1,300 funeral homes.
•Fixed-Rate and Fixed-Indexed Annuities. With an annuity product, the policyholder provides Global Atlantic cash, referred to as a premium, in exchange for earning interest on a tax deferred basis and the ability based on the contract terms to take lump sum or periodic withdrawals of their account value. Global Atlantic’s annuity products typically also offer a death benefit that guarantees the full account value for the beneficiaries in the event of the death of the policyholder. Fixed-rate annuities offer policyholders tax-deferred savings accumulation and income based on a fixed rate that may be guaranteed for a period of time. Fixed-indexed annuities allow the policyholder to elect strategies where interest is credited based on the performance of a market index. This selection allows the policyholder to participate in the upside performance of the selected index, subject to limits and protection from downside market risks. Global Atlantic primarily generates income from annuity products by earning a spread between net investment income and the cost of providing benefits under the annuity contract.
•Life Products. Global Atlantic’s targeted life products primarily consist of universal life and preneed life insurance. With universal life and preneed products, the policyholder provides Global Atlantic with a premium that funds the policyholder’s account in exchange for earning interest on the account and a death benefit. A universal life insurance account increases with premium payments from the policyholder and interest credited by Global Atlantic, and decreases based on charges, such as fees payable to Global Atlantic. Effective July 1, 2023, Global Atlantic no longer underwrites new indexed universal life products. Indexed universal life policies written prior to this date remain in-force. Indexed universal life policies represented approximately 3% of Global Atlantic’s individual market sales in 2022, on an equivalent basis. With preneed products, the policyholder generally purchases the preneed product along with a contract with a funeral home that guarantees the policyholder a pre-planned funeral, funded by proceeds from the preneed policy.
31
Institutional Markets. Global Atlantic provides its institutional clients customized reinsurance solutions to assist them in meeting their strategic, risk management and capital goals. In general, by reinsuring policies, the institutional client reduces or releases capital that it held for the reinsured business and may use such capital for its other business goals. Our institutional solutions include block, flow, PRT reinsurance, and funding agreements. Global Atlantic’s reinsurance solutions are offered through a client coverage effort focused on domestic and international retirement and life companies. Since Global Atlantic’s founding, it has closed multiple reinsurance transactions, including block, flow and PRT reinsurance, with 29 clients representing a total of $136.2 billion of assets as of December 31, 2023. For the year ended December 31, 2023, Global Atlantic generated $9.8 billion and $1.5 billion of flow and PRT reinsurance production, respectively. To further scale its institutional markets business, Global Atlantic sponsors co-investment vehicles (the "sponsored reinsurance sidecar vehicles") to participate alongside Global Atlantic in certain qualifying reinsurance transactions. Global Atlantic also participates in the funding agreement market, including through membership in Federal Home Loan Banks ("FHLBs") and as a provider of funding agreements in connection with a funding agreement backed notes ("FABN") program established in 2021.
•Block Reinsurance. Block reinsurance is a transaction in which an insurance company divests a block of insurance policies to Global Atlantic in exchange for Global Atlantic’s obligation to pay a specified portion of future insurance claims arising from that block. Global Atlantic operates in the block reinsurance market by offering solutions to its clients across various sizes of transactions and across multiple product types, including both retirement and life products. In block reinsurance transactions, Global Atlantic’s insurance company subsidiaries assume the obligation to pay the policy benefits from the cedant in exchange for a transfer of assets.
•PRT Transactions. PRT is a transaction in which a pension plan sponsor, such as a corporation, transfers the risk associated with the pension plan’s liabilities to an insurance company. Global Atlantic has historically operated in the PRT market through reinsurance relationships with insurance company clients that directly underwrite and assume corporate pension liabilities. Insurance company subsidiaries of Global Atlantic act as the reinsurer in respect of these PRT transactions, and Global Atlantic’s clients are the ceding companies.
•Flow Reinsurance. Flow reinsurance is an agreement in which an insurance company writes new retail policies and shares an economic portion of such newly issued policies with an insurance company subsidiary of Global Atlantic, as its reinsurer, on an ongoing basis. Global Atlantic operates in flow reinsurance by partnering with insurance companies that sell retirement products, such as multi-year guaranteed annuities or single premium immediate annuities. Global Atlantic seeks to ensure that its partnerships generate profitable growth, repricing flow reinsurance products as market conditions evolve.
•Funding Agreements. Funding agreements, including those issued in connection with a FABN program, are a deposit-type contract issued by Global Atlantic’s insurance company subsidiaries. In general, a funding agreement provides its holder with a guaranteed return of principal and periodic interest payments. As of December 31, 2023, Global Atlantic had $4.9 billion of funding agreements outstanding under the FABN program.
32
The following table represents Global Atlantic’s new business volumes by business and product for the years ended December 31, 2023 and December 31, 2022:
| Years Ended December 31, | ||||||||||||||
| 2023 | 2022 | |||||||||||||
| ($ in millions) | ||||||||||||||
| Individual channel: | ||||||||||||||
| Fixed-rate annuities | $ | 7,509 | $ | 5,243 | ||||||||||
| Fixed-indexed annuities | 3,606 | 4,179 | ||||||||||||
| Variable annuities | 23 | 42 | ||||||||||||
Total retirement products(1) | $ | 11,138 | $ | 9,464 | ||||||||||
Life insurance products(2) | $ | 9 | $ | 35 | ||||||||||
| Preneed life | $ | 299 | $ | 277 | ||||||||||
| Institutional channel: | ||||||||||||||
| Block | $ | 10,854 | $ | 5,737 | ||||||||||
| Flow & pension risk transfer | 11,258 | 9,520 | ||||||||||||
Funding agreements(3) | — | 2,000 | ||||||||||||
Total institutional channel(4) | $ | 22,112 | $ | 17,257 | ||||||||||
(1)New business volumes in individual markets are referred to as sales. In Global Atlantic's individual market channel, sales of annuities include all money paid into new and existing contracts. Individual market channel sales of life insurance products are based on commissionable premium and individual market channel sales for preneed life are based on the face amount of insurance. Life insurance product sales do not include the recurring premiums that policyholders may pay over time.
(2)Effective July 1, 2023, Global Atlantic no longer underwrites new indexed universal life products. Indexed universal life policies written prior to this date remain effective.
(3)Funding agreements new business volumes represent funding agreements issued in connection with the FABN program only.
(4)New business volumes from Global Atlantic’s institutional market channel are based on the assets assumed, net of any ceding commission, and is gross of any retrocessions to investment vehicles that participate in qualifying reinsurance transactions sourced by Global Atlantic and to other third party reinsurers.
Global Atlantic seeks to have a diversified set of policy liabilities in order to manage adverse developments across liability types. As of December 31, 2023, 44% of its reserves were in its individual market and 56% were in its institutional market.
33
The table below represents a breakdown of Global Atlantic’s policy liabilities by business and product type as of December 31, 2023, separated by reserves originated through its individual and institutional markets.
Reserves as of December 31, 2023 | |||||||||||||||||||||||||||||||||||
| Individual market | Institutional market(4) | Total | Ceded | Total, net | Percentage of total | ||||||||||||||||||||||||||||||
| ($ in thousands, except percentages, if applicable) | |||||||||||||||||||||||||||||||||||
Fixed-rate annuity(1) | $ | 25,133,802 | $ | 31,780,482 | $ | 56,914,284 | $ | (9,267,828) | $ | 47,646,456 | 34.7 | % | |||||||||||||||||||||||
Fixed-indexed annuity(1) | 24,689,469 | 10,041,153 | 34,730,622 | (3,720,581) | 31,010,041 | 21.2 | % | ||||||||||||||||||||||||||||
Payout annuities(1) | 483,567 | 19,643,365 | 20,126,932 | (10,439,470) | 9,687,462 | 12.3 | % | ||||||||||||||||||||||||||||
| Variable annuity | 2,546,586 | 5,918,581 | 8,465,167 | (2,409,862) | 6,055,305 | 5.2 | % | ||||||||||||||||||||||||||||
Interest sensitive life(1) | 13,680,803 | 18,424,906 | 32,105,709 | (8,750,053) | 23,355,656 | 19.6 | % | ||||||||||||||||||||||||||||
Other life insurance(2) | 3,518,490 | 272,148 | 3,790,638 | (210,202) | 3,580,436 | 2.3 | % | ||||||||||||||||||||||||||||
Funding agreements(3) | 2,055,528 | 4,960,470 | 7,015,998 | — | 7,015,998 | 4.3 | % | ||||||||||||||||||||||||||||
Closed block and other corporate products(4) | — | 1,015,921 | 1,015,921 | (961,747) | 54,174 | 0.4 | % | ||||||||||||||||||||||||||||
| Total reserves | $ | 72,108,245 | $ | 92,057,026 | $ | 164,165,271 | $ | (35,759,743) | $ | 128,405,528 | 100.0 | % | |||||||||||||||||||||||
| Total general account | $ | 69,910,599 | $ | 90,147,672 | $ | 160,058,271 | $ | (35,759,743) | $ | 124,298,528 | 97.5 | % | |||||||||||||||||||||||
| Total separate account | 2,197,646 | 1,909,354 | 4,107,000 | — | 4,107,000 | 2.5 | % | ||||||||||||||||||||||||||||
| Total reserves | $ | 72,108,245 | $ | 92,057,026 | $ | 164,165,271 | $ | (35,759,743) | $ | 128,405,528 | 100.0 | % | |||||||||||||||||||||||
(1)As of December 31, 2023, 78% of the account value in Global Atlantic's general account associated with its fixed-rate and fixed-annuity products, and 39% of account value in its general account associated with universal life products was protected by surrender charges.
(2)"Other life products” includes universal life, term and whole life insurance products.
(3)"Funding agreements” includes funding agreements associated with Federal Home Loan Bank borrowings and under Global Atlantic's funding-agreement backed-notes program.
(4)Institutional market reserves are sourced using customized reinsurance solutions such as block, flow and PRT. As of December 31, 2023, reserves sourced through for block, flow and PRT transactions were $57.7 billion, $20.8 billion, and $5.7 billion, respectively.
Significant Reinsurance Transactions
On May 25, 2023, Global Atlantic signed a transaction agreement committing to reinsure, as of the signing date, $19.2 billion of legacy annuity and life policies (including $5.0 billion of separate account liabilities). The transaction closed on November 16, 2023.
On December 11, 2023, Global Atlantic signed a transaction agreement committing it to reinsure, as of the signing date, $10 billion of life, annuity, and long-term care policies. Global Atlantic is retro-ceding the long-term care insurance risk to a third-party reinsurer. The transaction closed on February 22, 2024.
Underwriting and pricing
Global Atlantic’s underwriting and pricing functions have dedicated teams, who are supported by multiple corporate functions, including actuarial, finance, operations, compliance, investments and risk. These functions have guidelines and procedures designed to assess and quantify the risks of each product type originated through its individual or institutional markets.
Global Atlantic’s proprietary technology platform incorporates analytic models with customized third-party software and database technology, allowing Global Atlantic to dynamically analyze its asset and liability cash flow profile across a range of market and policyholder behavior scenarios. This proprietary platform allows Global Atlantic to integrate investment allocation decisions with product pricing, so that the terms of the liabilities it originates reflect its view of the investment environment. The committees responsible for underwriting and pricing are also aligned with other business functions and include representatives from actuarial, finance, operations, investments, risk and sales.
Global Atlantic also performs suitability reviews for new annuity sales. For sales through banks and broker-dealers, Global Atlantic generally delegates suitability reviews to these distribution partners.
34
When pricing reinsurance transactions in the institutional market, Global Atlantic performs asset and liability modeling of the block of business to be reinsured and typically re-underwrites the liability assumptions on the block using then-current market conditions, actuarial experience provided by the ceding company and its own experience from business Global Atlantic has originated. Reinsured blocks of business are integrated into Global Atlantic’s technology and infrastructure systems and monitored in the same manner used across the broader business, combining input from actuarial, risk, investment management and other functions.
Investment management
Global Atlantic has an excellent track record of generating strong investment results, and since February 2021 KKR has been the investment manager of Global Atlantic’s assets. Global Atlantic believes that KKR's investment expertise, broad range of investment management services and strong origination capabilities are key to maintaining Global Atlantic's successful track record of identifying assets that are well-suited to the stable and long-dated nature of Global Atlantic's insurance liabilities.
Global Atlantic seeks to focus on investments that have the potential to generate stable, predictable, long-dated asset cash flows, are of high credit quality, and that focus on capital protection. These kinds of investments have historically consisted of corporate debt, asset-backed finance, specialty finance, transportation finance, securitizations, private loan facilities, and commercial and residential real estate investment opportunities. However, Global Atlantic’s investments are not limited to solely those asset classes.
Supplementing KKR’s role as an investment advisor, Global Atlantic has retained in-house certain investment origination and allocation functions with expertise in consideration of insurance company asset portfolios. These considerations include asset-liability matching, asset allocation, ongoing portfolio management and new business pricing across both Global Atlantic’s individual and institutional markets. Global Atlantic believes that matching asset and liability cash flows is key to protecting policyholders and achieving its target returns. Global Atlantic’s investment origination and allocation functions are closely integrated with its risk management team, and a group of its risk management professionals is dedicated to supporting investment decision-making. Global Atlantic uses a proprietary risk platform to develop a comprehensive view of the expected cash flow profile of its liabilities and determine the optimal profile of its asset cash flows. Global Atlantic is also capable of developing a bottoms-up view of the cash flows of investments that it considers. These processes help to identify the investments that offer a cash flow profile that is consistent with Global Atlantic’s risk tolerances.
Working within Global Atlantic’s cash flow matching framework as well as its regulatory and rating agency requirements, Global Atlantic has a flexible investment mandate, which allows it to pursue asset classes and investment types that it believes offer the best risk-adjusted returns. Global Atlantic believes that the integration of the analytics around its assets and liabilities and its flexible investment mandate enable Global Atlantic to respond dynamically to market conditions and make investment decisions that maximize risk adjusted returns while still protecting Global Atlantic’s policyholders.
As of December 31, 2023, Global Atlantic’s investment portfolio was comprised of the following:
| December 31, 2023 | ||||||||||||||
| ($ in thousands, except percentages) | Carrying value | Percent of total | ||||||||||||
| Fixed maturity securities, available-for-sale, at fair value | $ | 69,414,188 | 49.1 | % | ||||||||||
| Mortgage and other loan receivables | 39,177,927 | 27.7 | % | |||||||||||
| Fixed maturity securities, trading, at fair value | 18,805,470 | 13.3 | % | |||||||||||
| Other investments | 9,683,326 | 6.8 | % | |||||||||||
| Funds withheld receivable at interest | 2,713,645 | 1.9 | % | |||||||||||
| Policy loans | 1,556,030 | 1.2 | % | |||||||||||
| Equity securities at fair value | 19,737 | — | % | |||||||||||
| Total investments | $ | 141,370,323 | 100.0 | % | ||||||||||
35
Capital
Capital strength allows insurance companies to meet their future policyholder obligations and to support the growth of their businesses. Global Atlantic believes it has built a strong financial foundation to meet these objectives. Global Atlantic is well capitalized, and its capital position, combined with annual capital generation from its in-force book of business and third-party capital, helps it to fund new business volume growth. Global Atlantic takes a responsible and flexible capital approach to allocating capital to where it believes is the most attractive alternative available. Global Atlantic manages its capital and liquidity position with the objective of maintaining sufficient capital and liquidity to be able to capture investment opportunities as they arise and meet policyholder obligations, even in times of foreseeable stress.
The financial strength of Global Atlantic’s life insurance operating subsidiaries is recognized by several ratings agencies. The financial strength ratings of these subsidiaries are “A” with a stable outlook from A.M. Best Company, Inc. (“A.M. Best”), “A2” with a stable outlook from Moody’s Investors Service, Inc. (“Moody’s”), “A-” with a positive outlook from S&P Global Ratings (“S&P”), and “A” with a stable outlook from Fitch Ratings, Inc. ("Fitch").
Global Atlantic also sponsors third-party co-investment vehicles to participate alongside Global Atlantic in qualifying reinsurance opportunities. These sponsored reinsurance sidecar vehicles provide third-party capital to support reinsurance transactions and are not consolidated into our financial statements. As of December 31, 2023, third parties have committed capital to the sponsored reinsurance sidecar vehicles of approximately $3.3 billion, of which $2.2 billion has been deployed.
Competition
Our asset management business competes with other investment managers for both fund investors and investment opportunities. The firm's competitors consist primarily of sponsors of public and private investment funds, real estate development companies, BDCs, investment banks, commercial finance companies and operating companies acting as strategic buyers. We believe that competition for fund investors is based primarily on investment performance, investor liquidity and willingness to invest, investor perception of investment managers' drive, focus and alignment of interest, business reputation, duration of relationships, quality of services, pricing, fund terms including fees, and the relative attractiveness of the types of investments that have been or are to be made. We believe that competition for investment opportunities is based primarily on the pricing, terms and structure of a proposed investment and certainty of execution. In addition to these traditional competitors within the global investment management industry, we also face competition from local and regional firms, financial institutions and sovereign wealth funds in the various countries in which we invest. In certain emerging markets, local firms may have more established relationships with the companies in which we are attempting to invest. These competitors often fall into one of the aforementioned categories but in some cases may represent new types of fund investors, including high net worth individuals, family offices and state-sponsored entities.
There are numerous funds focused on private equity, real assets, credit and hedge fund strategies that compete for investor capital. Fund managers have also increasingly adopted investment strategies outside of their traditional focus. For example, funds focused on credit and equity strategies have become active in taking control positions in companies, while private equity funds have acquired minority equity or debt positions in publicly listed companies. This convergence heighten competition for investments. Furthermore, as institutional fund investors increasingly consolidate their relationships for multiple investment products with a few investment firms, competition for capital from such institutional fund investors may become more acute. However, such consolidation may also lead institutional fund investors to prefer more established investment firms, which could help us to compete against newer entrants or investment firms that are smaller in size or offer more limited types of investment strategies.
Some of the entities that we compete with as an investment firm may have greater financial, technical, marketing and other resources and more personnel than us and, in the case of some asset classes, longer operating histories, more established relationships or greater experience. Several of our competitors also have raised, or may raise, significant amounts of capital and have investment objectives that are similar to the investment objectives of our funds, which may create additional competition for investment opportunities. Some of these competitors may also have lower costs of capital and access to funding sources that are not available to us, which may create competitive advantages for them. In addition, some of these competitors may have higher risk tolerances, different risk assessments or lower return thresholds, which could allow them to consider a wider range of investments and to bid more aggressively than us for investments. Strategic buyers may also be able to achieve synergistic cost savings or revenue enhancements with respect to a targeted portfolio company, which may provide them with a competitive advantage in bidding for such investments.
36
Our capital markets business competes primarily with investment banks and independent broker-dealers in North America, Europe, Asia-Pacific and the Middle East. We principally focus our capital markets activities on the firm, our portfolio companies and fund investors, but we also seek to service other third parties. While we generally target customers with whom we have existing relationships, those customers may have similar relationships with the firm's competitors, many of whom will have access to competing securities transactions, greater financial, technical or marketing resources or more established reputations than us.
Global Atlantic operates in highly competitive markets. Within individual markets, Global Atlantic faces a variety of large and small industry participants. Large, established insurers often operate with the benefit of well-known brands, entrenched distribution relationships or proprietary distribution. The insurance industry has also seen an influx of new entrants, particularly in retirement products, who may be able to price new business aggressively, with a higher investment risk tolerance, seeking to gain market share or increase assets under management. All of these companies compete for individual markets sales. Global Atlantic’s flow reinsurance business may also be impacted by competition among insurers in individual markets. The competitiveness of Global Atlantic’s product offerings will depend on the actions of its competitors and Global Atlantic’s ability to actively manage its product offerings. In institutional markets, there have been many block reinsurance transactions as many insurers continue to reevaluate their commitment to business lines and seek reinsurance solutions as a way to de-emphasize or divest non-core businesses, reduce risk, seek capital relief or improve profitability. The block reinsurance and pension risk transfer markets are also experiencing competition due to new entrants, including entrants based outside of the United States. Increased competition may make it more difficult for Global Atlantic to identify transactions with terms that are commercially acceptable based on its risk tolerance and target return objectives. Increased competition may also increase regulatory scrutiny of individual or institutional markets activity.
Competition is also intense for the attraction and retention of qualified employees and consultants. Our ability to continue to compete effectively in our businesses will depend upon our ability to attract new investment professionals, other employees and consultants and retain and motivate our existing investment professionals, other employees and consultants. We are also impacted by Global Atlantic's ability to attract and retain insurance professionals in the United States and Bermuda, including wholesalers, actuaries, risk management professionals and agents.
Human Capital
We believe our people are the key to our success and are what sets our firm apart. We strive to create a workplace environment where employees thrive both professionally and personally. At KKR, our philosophy is to ensure we manage our investments in people – our human capital – as rigorously and effectively as we do our financial capital. Our key focuses include driving exceptional performance and enhancing our firm culture.
Our primary goal in human capital management is to attract, develop and retain talent at KKR by providing meaningful and well-understood careers for our people. We therefore focus on employee training and professional development. Where appropriate, we offer workshops, mentoring and executive coaching to supplement on-the-job experiences and ongoing feedback and coaching to maximize performance. In addition, fostering a culture of physical, mental, and emotional health and wellness is a priority for KKR, and we offer tools and resources to our employees so they can make informed health care decisions for themselves and their families.
We seek to have a well-rounded, inclusive workplace — one that is reflective of our shareholders, fund investors, Global Atlantic's policyholders, the clients and other stakeholders with whom we collaborate, and the communities in which we live and conduct our business. In 2014, KKR established the Inclusion & Diversity Council (the "IDC"), a committee led by senior leaders to seek to ensure that KKR is an entrepreneurial, vibrant, and innovative organization that values diverse teams and varied perspectives, lifestyles and backgrounds. The IDC’s goal is to attract, develop, and retain the best possible talent, actively work to make KKR a more diverse and inclusive workplace.
37
As of December 31, 2023, we employed approximately 4,490 people worldwide:
| Asset Management Investment Professionals and KKR Capstone | 791 | ||||
| Other Asset Management Employees | 1,944 | ||||
| Total Asset Management Employees | 2,735 | ||||
| Global Atlantic Professionals and Employees | 1,553 | ||||
Other(1) | 202 | ||||
| Total Employees | 4,490 | ||||
(1)"Other" includes employees of companies in which we own a majority of the common equity, who are not directly managed by KKR or Global Atlantic. This category does not include Senior Advisors and Other Advisors.
Asset Management Investment Professionals and KKR Capstone
Our investment professionals come from diverse professional backgrounds in private equity, real assets, credit and other asset classes and include employees with operations, strategic consulting, risk management, liability management and finance experience. As a group, these professionals provide us with a strong global team for identifying attractive investment opportunities, creating value and generating superior returns.
We have developed an institutionalized process for creating value in investments. As part of our effort, we utilize a team of operating professionals at KKR Capstone, who work exclusively with our investment professionals and portfolio company management teams or our designees. With professionals in North America, Europe and the Asia-Pacific, KKR Capstone provides additional expertise for assessing investment opportunities and assisting managers of portfolio companies in defining strategic priorities and implementing operational changes.
Other Asset Management Employees
Our other asset management employees come from diverse professional backgrounds in capital markets, operations, economics, capital raising, client services, public affairs, finance, tax, legal, compliance, risk management, human capital, and information technology. As a group, these professionals provide us with a strong team for overseeing investments and performing capital markets activities, servicing our existing fund investors and creating relationships with new fund investors globally. Additionally, a majority of these other professionals are responsible for supporting the global infrastructure of KKR.
Global Atlantic Professionals and Employees
Global Atlantic employs professionals with diverse professional backgrounds in the insurance industry, including individual channel sales, reinsurance, investment origination and allocation, risk management, actuarial and support functions. Global Atlantic's employees seek to provide attractive products for Global Atlantic's policyholders, solutions for its clients and risk-adjusted returns for its investors.
Senior Advisors and Other Advisors
To complement the expertise of our investment professionals, we have a team of senior advisors and other advisors. While not KKR employees, they provide us with additional operational and strategic insights. The responsibilities of these advisors include serving on the boards of our portfolio companies, helping us source and evaluate individual investment opportunities and assisting portfolio companies with operational matters. These individuals include current and former chief executive officers, chief financial officers and chairpersons of major corporations and others holding leading positions of public agencies worldwide.
38
Responsible Investment Management
In our experience, thoughtfully incorporating business-relevant environmental, social and governance (“ESG”), regulatory, public policy and geopolitical issues in our investment process can help us both create and protect value and reduce risk in our investments and to generate strong returns for our clients and investors.
Where appropriate, we seek to incorporate business-relevant ESG, regulatory and geopolitical, considerations into our investment decision-making and investment management practices, globally across asset classes, with a focus on creating and protecting value for our portfolio companies and assets. This generally includes considering business-relevant risks and opportunities identified during the diligence process and taking those considerations into account, alongside other business issues, when making an investment decision. This also includes, where applicable, engaging on these issues with our investments.
KKR has been publicly committed to responsible investment since Kohlberg Kravis Roberts & Co L.P. became a signatory of the UN-supported Principles for Responsible Investment ("PRI") in 2009. We believe that we have a history of innovation and progress when it comes to thoughtfully integrating and managing sustainability-related issues in a manner that is designed to manage risk and create value.
KKR generally takes a company-specific approach to ESG-focused diligence and engagement, where we endeavor to focus on business-relevant topics that KKR and the company or asset determine are most significant for protecting and maximizing value. When conducting our investment due diligence, we rely upon our experience and also look to the topics and industry-specific issues identified by the Sustainability Accounting Standards Board ("SASB") Standards as an input when identifying business-relevant ESG issues.
To support the implementation of this work across asset classes, we assign members of our sustainable investing team who have asset-specific experience to support our investment teams, who are ultimately responsible for identifying, assessing, and managing business-relevant ESG-related risks and opportunities where applicable throughout the investment process.
We also strive to advance the transparency of our sustainability practices. KKR has a Responsible Investment Policy that describes our ESG integration and management processes, which is publicly available. We also publish an annual Sustainability Report, which we sought to align with the applicable SASB standards and the recommendations of the Task Force on Climate-related Financial Disclosures ("TCFD").
39
Organizational Structure
The following simplified diagram, which excludes multiple legal entities, illustrates our organizational structure as of February 29, 2024.
(1)KKR Management LLP, which is owned by senior KKR employees, is the sole holder of Series I preferred stock of KKR & Co. Inc. The Series I preferred stock will be redeemed and cancelled, and KKR & Co. Inc.'s common stock will become vested with all common voting powers on a one vote per share basis, on the "Sunset Date" (which will be no later than December 31, 2026 as provided in the Reorganization Agreement); see "Certain Relationships and Related Transactions, and Director Independence" in this report.
(2)Carried interest earned from our investment funds is allocated to Associates Holdings, which we refer to as the carry pool, from which carried interest that is earned from our investment funds is allocable to our employees and other persons. This entity and the carry pool are not reflected in the organizational structure chart. See "Part III—Item 11—Executive Compensation" and "Part II. Item 7. Management’s Discussion and Analysis—Critical Accounting Policies and Estimates—Asset Management—Expenses—Compensation and Benefits" in this report for further detail on the percentage of carried interest that is allocable to the carry pool. A wholly-owned subsidiary of KKR & Co. Inc. will become the general partner of Associates Holdings and thereby acquire control of the carry pool on the "Sunset Date" (which will be no later than December 31, 2026 as provided in the Reorganization Agreement; see "Certain Relationships and Related Transactions, and Director Independence" in this report).
(3)Includes Kohlberg Kravis Roberts & Co. L.P., the SEC-registered investment adviser, which in turn is the parent company of KKR's other principal investment management and broker-dealer subsidiaries. See "—Regulation" for further detail on these subsidiaries.
(4)Includes KKR Financial Holdings LLC and KKR Group Finance Co. Holdings Limited, which owns the issuers of KKR's outstanding senior notes.
(5)On January 2, 2024, Global Atlantic became a wholly-owned subsidiary of KKR.
40
Regulation
Our operations are subject to regulation and supervision in a number of jurisdictions. The level of regulation and supervision to which we are subject varies from jurisdiction to jurisdiction and is based on the type of business activity involved. We, in conjunction with our outside advisors and counsel, seek to manage our business and operations in compliance with such regulation and supervision. The regulatory and legal requirements that apply to our activities are subject to change from time to time and may become more restrictive, which may make compliance with applicable requirements more difficult or expensive or otherwise restrict our ability to conduct our business activities in the manner in which they are now conducted. Changes in applicable regulatory and legal requirements, including changes in their enforcement, could materially and adversely affect our business and our financial condition and results of operations. As a matter of public policy, the regulatory bodies that regulate our business activities are generally responsible for safeguarding the integrity of the securities, insurance and financial markets and protecting fund investors and policyholders who participate in those markets rather than protecting the interests of our stockholders. For further information regarding potential risks relating to these and other regulatory and legal requirements that could significantly affect our business, see the "Risk Factors" section of this report, including "—Risks Related to Our Business—Extensive regulation of our businesses affects our activities and creates the potential for significant liabilities and penalties, which could materially and adversely affect KKR."
United States
Regulation as an Investment Adviser
We conduct our advisory business through our investment adviser subsidiaries, including Kohlberg Kravis Roberts & Co. L.P. and its wholly-owned subsidiaries, KKR Credit Advisors (US) LLC, KKR Registered Advisor LLC and KKR Credit Advisors (Singapore) Pte. Ltd., each of which is registered as an investment adviser with the SEC under the Investment Advisers Act of 1940 (the "Investment Advisers Act"). We also jointly own with a third party FS/KKR Advisor, LLC, which is an investment adviser registered with the SEC under the Investment Advisers Act. In addition, we own a majority of Global Atlantic's investment adviser, Global Atlantic Investment Advisors, LLC, which is another investment adviser registered with the SEC under the Investment Advisers Act. The investment advisers are subject to, among other Investment Advisers Act provisions, the anti-fraud provisions of the Investment Advisers Act and to fiduciary duties derived from these provisions, which apply to our relationships with our advisory clients globally, including funds that we manage. These provisions and duties impose restrictions and obligations on us with respect to our dealings with our fund investors and our investments, including for example restrictions on agency cross and principal transactions. Our registered investment advisers are subject to periodic SEC examinations and other requirements under the Investment Advisers Act and related regulations primarily intended to benefit advisory clients. These additional requirements relate, among other things, to maintaining an effective and comprehensive compliance program, record-keeping and reporting requirements and disclosure requirements. The Investment Advisers Act generally grants the SEC broad administrative powers, including the power to limit or restrict an investment adviser from conducting advisory activities in the event it fails to comply with federal securities laws. Additional sanctions that may be imposed for failure to comply with applicable requirements include the prohibition of individuals from associating with an investment adviser, the revocation of registrations and other censures and fines.
KKR Credit Advisors (US) LLC, KKR Registered Advisor LLC and Kohlberg Kravis Roberts & Co. L.P. are also subject to regulation as investment advisers to RICs under the Investment Company Act. Each of KKR Income Opportunities Fund, KKR Credit Opportunities Portfolio and KKR Real Estate Select Trust Inc. is a closed-end RIC. The Investment Company Act and the rules thereunder, among other things, regulate the relationship between a registered investment company and its investment adviser and prohibit or restrict principal transactions and joint transactions. FS/KKR Advisor serves as investment adviser to FS KKR Capital Corp. and KKR FS Income Trust, which are subject to regulations applicable to BDCs under the Investment Company Act, including portfolio construction requirements and limitations on transactions with affiliates. Certain subsidiaries of Kohlberg Kravis Roberts & Co. L.P. also serve as investment advisers to publicly listed companies, including KKR Real Estate Finance Trust and Crescent Energy.
41
Regulation as a Broker-Dealer
KKR Capital Markets, LLC, one of our subsidiaries, is registered as a broker-dealer with the SEC under the Exchange Act and in 53 U.S. states and territories, and is a member of FINRA. Global Atlantic's distribution of insurance products that are regulated as securities is conducted by Global Atlantic Distributors, LLC, which is also registered as a broker-dealer with the SEC under the Exchange Act and in 52 U.S. states and territories, and is also a member of the FINRA. As registered broker-dealers, KKR Capital Markets, LLC and Global Atlantic Distributors, LLC are subject to periodic SEC and FINRA examinations and reviews. A broker-dealer is subject to legal requirements covering all aspects of its securities business, including sales and trading practices, public and private securities offerings, the suitability of investments, use and safekeeping of customers' funds and securities, capital structure, record-keeping and retention and the conduct and qualifications of directors, officers, employees and other associated persons. These requirements include the SEC's "uniform net capital rule," which specifies the minimum level of net capital that a broker-dealer must maintain, requires a significant part of the broker-dealer's assets to be kept in relatively liquid form, imposes certain requirements that may have the effect of prohibiting a broker-dealer from distributing or withdrawing its capital and subjects any distributions or withdrawals of capital by a broker-dealer to notice requirements. These and other requirements also include rules that limit a broker-dealer's ratio of subordinated debt to equity in its regulatory capital composition, constrain a broker-dealer's ability to expand its business under certain circumstances and impose additional requirements when the broker-dealer participates in securities offerings of affiliated entities. Violations of these requirements may result in censures, fines, the issuance of cease-and-desist orders, revocation of licenses or registrations, the suspension or expulsion from the securities industry of the broker-dealer or its officers or employees or other similar consequences by regulatory bodies.
Insurance Regulation
Our U.S. insurance subsidiaries are subject to regulation and supervision under U.S. federal and state laws. Each U.S. state, the District of Columbia and U.S. territories and possessions have insurance laws that apply to companies licensed to carry on an insurance business in the applicable jurisdiction. The primary regulator of an insurance company, however, is located in the insurance company's state of domicile. Both Commonwealth Annuity and Life Insurance Company ("CwA") and First Allmerica Financial Life Insurance Company ("FAFLIC") are organized and domiciled in the Commonwealth of Massachusetts; Accordia Life and Annuity Company ("Accordia") is organized and domiciled in the State of Iowa; and Forethought Life Insurance Company ("FLIC") is organized and domiciled in the State of Indiana (together, these four companies constitute our "U.S. insurance subsidiaries"). Additionally, our U.S. insurance subsidiaries are licensed to transact insurance business in, and are subject to regulation and supervision by, all 50 states of the United States and the District of Columbia and the U.S. Virgin Islands.
State insurance authorities have broad administrative powers over each of our U.S. insurance subsidiaries with respect to all aspects of the insurance business. Insurance subsidiaries must prepare financial statements on regulatory capital in accordance with statutory financial accounting, must report on their risk management and corporate governance and must receive regulatory approval for certain transactions, including transactions with affiliates. As part of their routine regulatory oversight process, state insurance departments conduct periodic detailed examinations of the books, records, accounts and operations of insurance companies that are domiciled in their states. Examinations are generally carried out in cooperation with the insurance departments of other, non-domiciliary states under guidelines promulgated by the National Association of Insurance Commissioners (the "NAIC"). State insurance departments also regularly conduct regulatory inquiries of the insurance companies licensed in their states.
We also have special purpose financial captive insurance company subsidiaries domiciled in Vermont and Iowa that provide reinsurance to Accordia in order to facilitate the financing of redundant reserve requirements associated with the application of the NAIC Model Regulation entitled "Valuation of Life Insurance Policies Model Regulation" ("Regulation XXX") and NAIC Actuarial Guideline XXXVIII ("AG38"). The application of both Regulation XXX and AG38 requires Global Atlantic to maintain statutory reserves which may be in excess of reserves required under GAAP.
The rates, policy terms, and conditions of reinsurance agreements generally are not subject to regulation by any regulatory authority. However, the ability of a primary insurer to take credit for the reinsurance purchased from reinsurance companies is a significant component of reinsurance regulation. Typically, a primary insurer will only enter into a reinsurance agreement if it can obtain credit against its reserves on its statutory basis financial statements for the reinsurance ceded to the reinsurer.
42
Our U.S. insurance subsidiaries are subject to restrictions on the payment of dividends. Any proposed dividend in excess of the amount permitted by law is considered an "extraordinary dividend or distribution" and may not be paid until it has been approved, or a 30-day waiting period has passed during which it has not been disapproved, by the commissioner of the applicable domiciliary state of the U.S. insurance subsidiary. None of our special purpose financial captive insurance company subsidiaries may declare or pay dividends or distributions in any form to us other than in accordance with its transaction agreements and governing licensing order.
State insurance holding company laws and regulations generally provide that no person, corporation or other entity may acquire control of an insurance company, or a controlling interest in any parent company of an insurance company, without the prior approval of such insurance company's domiciliary state insurance regulator. Under the laws of each of our U.S. insurance subsidiaries' domiciliary states, acquiring, directly or indirectly, 10% or more of the voting securities of an insurance company or its parent company is presumptively considered to have acquired control of the insurer, although such presumption may be rebutted by a showing that control does not in fact exist.
Finally, while the United States federal government in most contexts currently does not directly regulate the insurance business, the Federal Insurance Office (the "FIO") established by the Dodd-Frank Wall Street Reform and Consumer Protection Act (the "Dodd-Frank Act") now has an oversight role in respect to insurance regulation.
Ireland
We have a number of subsidiaries which are authorized and regulated by the CBI. The CBI is responsible for, among other things, regulating and supervising firms that provide financial services in Ireland, including broker-dealers and investment firms. The CBI also develops and maintains regulatory policies for Ireland's financial services sector. The CBI has the authority to approve applications from financial services providers in Ireland, monitor compliance with its standards, and take enforcement action for non-compliance. Violation of the CBI's requirements may result in administrative sanctions; investigations; refusal, revocation or cancellation of authorization or registrations; criminal prosecution; and/or reports to other agencies.
KKR Alternative Investment Management Unlimited Company, KKR Credit Advisors (Ireland) Unlimited Company and KKR Capital Markets (Ireland) Limited Company are regulated by the CBI. KKR Alternative Investment Management Unlimited Company is an authorized European Union ("EU") alternative investment manager permitted to conduct portfolio management, risk management and certain administrative activities. KKR Credit Advisors (Ireland) Unlimited Company is authorized to carry out a number of regulated activities under the Markets in Financial Instruments Directive (“MiFID”), including receiving and transmitting orders, portfolio management and providing investment advice. KKR Credit Advisors (Ireland) Unlimited Company is also subject to limited regulatory supervision in Germany through KKR Credit Advisors Ireland Frankfurt Branch, France through KKR Credit Advisors Ireland Paris Branch, and Denmark through KKR Credit Advisors Ireland Copenhagen Branch, where these entities operate under the MiFID Freedom of Establishment rules. KKR Capital Markets (Ireland) Limited Company is authorized to engage in a number of regulated activities regulated under MiFID, including dealing as principal or agent, making arrangements in relation to certain types of specified investments, and arranging the safeguarding and administration of assets. KKR Capital Markets (Ireland) Limited also benefits from a passport under the single market directives to offer services cross border into all countries in the European Economic Area.
United Kingdom
We have several subsidiaries which are authorized and regulated by the FCA under the Financial Services and Markets Act 2000 ("FSMA"). FSMA and related rules govern most aspects of investment business, including investment management, sales, research and trading practices, provision of investment advice, corporate finance, use and safekeeping of client funds and securities, regulatory capital, record-keeping, margin practices and procedures, approval standards for individuals, anti-money laundering, periodic reporting and settlement procedures. The FCA is responsible for administering these requirements and our compliance with the FSMA and related rules. Violations of these requirements may result in censures, fines, imposition of additional requirements, injunctions, restitution orders, revocation or modification of permissions or registrations, the suspension or expulsion from certain "controlled functions" within the financial services industry of officers or employees performing such functions or other similar consequences.
KKR Capital Markets Partners LLP has permission to engage in a number of regulated activities regulated under FSMA, including dealing as principal or agent and arranging deals in relation to certain types of specified investments and arranging the safeguarding and administration of assets. Kohlberg Kravis Roberts & Co. Partners LLP has permission to engage in a number of regulated activities including advising on and arranging deals relating to corporate finance business in relation to certain types of specified investments. KKR Credit Advisors (EMEA) LLP has permission to engage in a number of regulated activities including managing, advising on and arranging deals in relation to certain types of specified investments.
43
Bermuda
Our insurance subsidiaries organized in Bermuda, Global Atlantic Re and Global Atlantic Assurance, and Global Atlantic sponsored co-investment vehicles are subject to regulation and supervision by the Bermuda Monetary Authority ("BMA") and compliance with all applicable Bermuda laws and Bermuda insurance statutes and regulations, including but not limited to the Bermuda Insurance Act. The Bermuda Insurance Act grants to the BMA powers to supervise, investigate and intervene in the affairs of insurance companies and to approve any change or controllers. The Bermuda Insurance Act imposes solvency, capital and liquidity standards and auditing and reporting requirements on Bermuda insurance companies. The Bermuda Insurance Act prohibits our Bermuda insurance subsidiaries from declaring or paying any dividends during any financial year unless certain financial conditions are met or prior approval from the BMA is received. A Bermuda licensed insurer is required to maintain a sufficiently staffed principal office in Bermuda.
Other Jurisdictions
Certain other subsidiaries or funds that we advise are registered with, have been licensed by or have obtained authorizations to operate in their respective jurisdictions outside of the United States. These registrations, licenses or authorizations relate to providing investment advice, broker-dealer activities, marketing of securities and other regulated activities. Failure to comply with the laws and regulations governing these subsidiaries and funds that have been registered, licensed or authorized could expose us to liability and/or damage our reputation.
In Europe, we operate in accordance with the EU Alternative Investment Fund Managers Directive (the “AIFMD”), which establishes a comprehensive regulatory and supervisory framework for alternative investment fund managers (“AIFMs”) that manage or market alternative investment funds (“AIFs”) in the EU.
In Canada, KKR Capital Markets LLC also relies on the international dealer exemption under the Securities Act (Ontario) and the equivalent in other provinces of Canada. This permits us to trade in non-Canadian equity and debt securities with certain types of investors located in Ontario, Canada.
FS/KKR Advisor, LLC, KKR Credit Advisors (Ireland) Unlimited Company, KKR Credit Advisors (US) LLC, and Kohlberg Kravis Roberts & Co. L.P. rely on the international investment fund manager exemption under the Securities Act (Ontario) and the equivalent, in the case of FS/KKR Advisor, LLC, KKR Credit Advisors (US) LLC, and Kohlberg Kravis Roberts & Co. L.P., in Québec. This exemption permits these entities to act as investment fund manager in respect of funds that have investors in the relevant provinces.
KKR Credit Fund Advisors LLC and KKR FI Advisors LLC rely on the international adviser exemption under the Securities Act (Ontario). This permits these entities to engage in limited types of advising and/or portfolio management in respect of certain types of investors located in Ontario, Canada.
In Japan, KKR Capital Markets Japan Ltd. is registered as a Type I and Type II Financial Instruments Business Operator (broker-dealer) under the Financial Instruments and Exchange Act of Japan, and a money lender under the Money Lending Business Act of Japan. KKR Capstone Japan Limited is licensed by the Tokyo Metropolitan Government to provide paid employment placement services. In addition, KJRM is registered as a Type II Financial Instruments Business Operator (broker-dealer), Investment Management Business Operator and Investment Advisory Business Operator under the Financial Instruments and Exchange Act of Japan, and a real estate broker and entrustment-based agency servicer for transactions under the Real Estate Brokerage Act of Japan.
In the United Arab Emirates, KKR MENA Limited, a Dubai International Financial Centre company, is licensed to arrange deals in investments, advise on financial products and arrange custody, and is regulated by the Dubai Financial Services Authority.
In Saudi Arabia, KKR Saudi Limited is licensed by the Capital Market Authority of Saudi Arabia and is authorized for the activity of arranging in the securities business.
In Australia, KKR Australia Pty Limited and KKR Australia Investment Management Pty Limited are Australian financial services licensees and are authorized to provide advice on and deal in financial products for wholesale clients, and are regulated by the Australian Securities and Investments Commission.
In Hong Kong, KKR Capital Markets Asia Limited is licensed by the Securities and Futures Commission in Hong Kong to carry on dealing in securities, advising on securities and asset management regulated activities.
44
In Singapore, KKR Singapore Pte. Ltd. and KKR Credit Advisors (Singapore) Pte. Ltd. each holds a capital markets services license to conduct fund management for institutional investors and accredited investors and is regulated by Monetary Authority of Singapore. KKR Credit Advisors (Singapore) Pte. Ltd. is also registered as an investment adviser with the SEC under the Investment Advisers Act.
In Mauritius, KKR Holdings Mauritius, Ltd. is an unrestricted investment adviser authorized to manage portfolios of securities and give advice on securities transactions and is regulated by the Financial Services Commission, Mauritius.
In India, KKR India Asset Finance Limited is registered with the Reserve Bank of India as a non-deposit taking non-banking financial company and is authorized to undertake lending and financing activities. In addition, certain of our funds are registered with SEBI as a foreign portfolio investor or a foreign venture capital investor to make investments in Indian securities. We also own companies in India that are authorized to act as the investment manager of an infrastructure investment trust registered with SEBI and to act as an investment manager and sponsor of alternative investment funds.
In China, KKR Investment Management (Hainan) Co., Ltd. is a private fund manager registered with the Asset Management Association of China and granted with the qualification and quota of Qualified Domestic Limited Partnership (“QDLP”) in Hainan, to carry on fundraising by means of private placement for the purpose of raising QDLP funds and to launch, manage and operate QDLP funds.
From time to time, one or more of our investment funds or their related investment vehicles or management companies may be regulated as a mutual fund by the Cayman Islands Monetary Authority, regulated as an investment limited partnership by CBI, listed on the Irish Stock Exchange, notified with the Financial Services Agency of Japan for sale pursuant to certain private placement exemptions and/or for investment pursuant to certain exemption, registered with the Financial Supervisory Service of the Republic of Korea, licensed or regulated by SEBI, subject to the regulatory supervision of the Commission de Surveillance du Secteur Financier of Luxembourg, notified with the Netherlands Authority for Financial Markets for sale pursuant to certain private placement exemptions, or registered under the Investment Company Act.
Website and Availability of SEC Filings
Our website address is www.kkr.com. Information on our website is not incorporated by reference herein and is not a part of this report. We make available free of charge on our website or provide a link on our website to our Annual Report on Form 10-K, Quarterly Reports on Form 10-Q and Current Reports on Form 8-K, and any amendments to those reports filed or furnished pursuant to Section 13(a) or 15(d) of the Exchange Act, as soon as reasonably practicable after those reports are electronically filed with, or furnished to, the SEC. To access these filings, go to our Investor Relations website, available at ir.kkr.com, and then visit the "SEC Filings & Annual Letters" section of this website. In addition, these reports and the other documents we file with the SEC are available at a website maintained by the SEC at www.sec.gov.
From time to time, we may use our website as a channel of distribution of material information. Financial and other material information regarding our company is routinely posted on and accessible at www.kkr.com. Financial and other material information regarding Global Atlantic is routinely posted on and accessible at www.globalatlantic.com. In addition, you may automatically receive e-mail alerts and other information about our company by enrolling your e-mail address by visiting the "Contacts & Email Alerts" section of our Investor Relations website, available at ir.kkr.com.
45
ITEM 1A. RISK FACTORS
Investing in our securities involves risk. Persons investing in our securities should carefully consider the risks described below and the other information contained in this report and other filings that we make from time to time with the SEC, including our consolidated financial statements and accompanying notes. Any of the following risks could materially and adversely affect our business, financial condition, results of operations, cash flows, and prospects. We could also be materially and adversely affected by additional factors that apply to all companies generally, as well as other risks that are not currently known to us or that we currently view to be immaterial. While we may attempt to mitigate known risks to the extent practicable and reasonable, we can provide no assurance, and we make no representation, that our mitigation efforts, if any, will be successful. The following risk factors have been organized by category; however, many of the risks are interrelated, and as a result, should be read together to fully understand the risks involved with investing in our securities, regardless of whether a cross-reference is included in any particular risk factor to another risk factor. See also "Business—Competition," "Business—Regulation" and "Management's Discussion and Analysis of Financial Condition and Results of Operations" for a discussion of certain business, competitive, regulatory, market, economic and other conditions that may materially and adversely affect us.
Risks Related to Our Business
Difficult market and economic conditions can, and periodically do, materially and adversely affect KKR.
We operate an investment management business where we manage investment vehicles that invest in alternative asset classes and also conduct a related capital markets business. We also operate, through our insurance subsidiaries, an insurance business that provides retirement, life and reinsurance products. Our investment management and insurance businesses, and therefore our financial results, are materially affected by market and economic conditions or events throughout the world in the countries in which we operate, invest or have investors, including conditions relating to interest rates, fiscal and monetary stimulus (and stimulus withdrawal), availability of credit, inflation rates, economic uncertainty growth (and contraction), changes in laws (including laws relating to taxation), trade barriers, commodity prices, currency exchange rates, foreign exchange controls, liquidity conditions in equity and debt capital markets, and other conditions or events. These market and economic conditions are not in our control and are often difficult, if not impossible, to predict, manage, mitigate, hedge or foresee. Examples of how these market and economic conditions may materially and adversely affect our businesses include the following, each of which could materially and adversely impact our business or financial results:
•the performance and value of the investments held by us (including our insurance subsidiaries) and our investment vehicles,
•opportunities for us (including our insurance subsidiaries) and our investment vehicles to make, exit and realize value from our and their investments,
•our ability to find suitable investments or secure financing for investments on attractive terms,
•the attractiveness of our investment vehicles and insurance products to investors and policyholders, respectively, including our ability to raise capital for new or successor funds and other investment vehicles on attractive terms,
•the frequency and size of fees generated from our capital markets business in connection with the issuance and placement of equity and debt securities, loans and credit facilities,
•the availability and cost of capital for our insurance subsidiaries and our investment vehicles’ portfolio companies,
•policyholder behavior, including policyholders electing to defer paying insurance premiums, stop paying insurance premiums altogether or surrender their policies,
•the amount and frequency of claims and policy benefit payments,
•the cost of providing guaranteed insurance benefits, and
•insurance capital requirements and collateral requirements under various insurance laws and agreements with third parties.
46
In addition, the impact of these conditions has exacerbated, and will likely continue to exacerbate, other risks discussed in this report, including with respect to valuations, the cost of credit and debt financing terms, and our ability to identify, execute and exit investments on attractive terms. In particular, see “—Risks Related to Our Business—Many parts of our earnings and cash flow are highly variable due to the nature of our business.” For a discussion of the risks relating to our asset management business, see the disclosures under “—Risks Related to Our Investment Activities,” and for a discussion of the risks relating to our insurance business, please see the disclosures under “—Risks Related to Our Insurance Activities.”
Geopolitical developments and other local and global events outside of our control can, and periodically do, materially and adversely impact KKR.
Geopolitical developments and other local and global events outside of our control can, and periodically do, materially and adversely impact various aspects of KKR and its businesses. We are a global financial institution with operations, investors and investments located in many countries around the world, which are not immune to geopolitical developments. Geopolitical developments and other local and global events outside of our control, including trade conflict, sanctions (reciprocal or unilateral), restrictions on foreign direct investment, trade barriers, civil unrest, national and international security events (including the outbreak of war, terrorist acts or other hostilities), can, and occasionally do, materially and adversely impact our ability to conduct our investment management and insurance businesses, as well as our portfolio companies and other investments. These risks have increased in both scale and complexity due to intensifying geopolitical competition and conflicts, including the ongoing Russian invasion of Ukraine and unrest in the Middle East, heightened geopolitical competition between China and other major world economies, heightened levels of political populism leading to regulatory volatility, and increased attention to global threats, including climate change. We have a number of offices located in multiple countries around the world, including China, South Korea, Japan, Australia, the United Kingdom, France, Germany, United Arab Emirates, Saudi Arabia, and elsewhere, and we seek investors from various countries throughout the world for our investment products and, to a lesser extent, our insurance business’s products. In particular, our investment strategies target opportunities globally, including across the Americas, Europe, Asia-Pacific, and the Middle East. Political instability and extremism, conflict, and civil unrest in any region where we have material business operations or investments may have a material adverse effect on us.
Any escalation in an actual or perceived trade war or barriers to investment between the U.S. and other countries or regions could chill or limit business opportunities, and otherwise negatively affect our investment management and insurance businesses. In addition, intensifying rivalries and conflicts in in the Asia-Pacific, Middle East, Europe and globally have created new complexities in the international business environment, including through the imposition of sanctions, national security-motivated regulatory changes, and protectionist policies by certain countries. Occurrence of war or hostilities involving a country in which we have investments, investors, insurance counterparties or employees could adversely affect our business.
We (including our insurance subsidiaries) may have direct investments in a region or a country that is experiencing one of the aforementioned events, and we may also be materially and adversely affected by the occurrence of such events as a result of indirect exposure that our portfolio companies or other investments may have through other interconnectivities such as supply chains, commodity prices and general macroeconomic exposure. The value of our investments can be materially impacted by trade wars or other governmental actions related to tariffs or international trade agreements and policies that materially constrain cross-border flows of investment, which have the potential to increase costs, decrease margins, reduce the competitiveness of products and services offered by portfolio companies and adversely affect the revenues and profitability of portfolio companies whose businesses rely on goods imported from or exported to any country impacted by such policies. In addition, tariff increases may adversely affect suppliers and certain other customers of our portfolio companies, which could amplify any negative impact. Further, the occurrence of war or hostilities involving a country in which we have investments or where our portfolio companies operate or have other interconnectivity could adversely affect the performance of these portfolio companies and their investments.
Even with limited direct exposure to Russia prior to its invasion of Ukraine, the conflict and related sanctions imposed on Russia have exacerbated and may further exacerbate these trends, including with respect to oil and gas prices. Policies, such as restrictions on exports of food, have also increased globally as a result of Russia's invasion of Ukraine. Beginning in February 2022, the United States and other countries began imposing, and have continued to impose, meaningful sanctions targeting Russia as a result of actions taken by Russia in Ukraine. For example, in October 2023, a UK court expanded the definition of “ownership or control” under UK sanctions that broadens the impact of UK sanctions on Russian entities. We and our portfolio companies will be required to comply with these and potentially additional sanctions imposed by the United States and by other countries, for which the full costs, burdens, and limitations on our and our portfolio companies' businesses and prospects are currently unknown and may become significant.
47
It is not possible to predict the broader or longer-term consequences of the Russian invasion of Ukraine or continued tensions between the U.S. (and other countries) and China. Similarly, escalation in tensions between the U.S. (as well as other major economies) and China, the inability of the U.S. and China to reach further trade agreements, the continued use of reciprocal sanctions by each country, or broadening implementation of investment restriction regimes in or related to China, may contribute to a slowing of global economic growth and adversely affect the revenues and profitability of our portfolio companies and other investments. These conflicts could result in further sanctions, embargoes, regional instability, geopolitical shifts and adverse effects on macroeconomic conditions, security conditions, currency exchange rates, exchange controls and financial markets.
Natural disasters and catastrophes, including public health crises, and potential changes in climate conditions could materially and adversely affect KKR.
Natural disasters or catastrophes, such as public health crises, extreme weather events, climate change, earthquakes, tsunamis and floods could have an adverse impact on our ability to conduct our investment management and insurance businesses. Such disasters and catastrophes could limit or even materially prohibit our ability to conduct any investment activities in certain locations. In addition, claims arising from the occurrence of such events could have an adverse effect on our insurance activities, in particular with respect to lapses and surrenders of existing policies, as well as sales of new policies. More specifically, public health crises, pandemics and epidemics, such as those caused by new strains of viruses such as the SARS-CoV-2 virus (COVID-19), may occur from time to time, which could directly and indirectly impact us in material respects that we are unable to predict or control, including by threatening our employees’ well-being and morale and interrupting business activities, including disrupting travel, investment activities, policy claim payouts, fundraising and new policy sales. In addition, we may be materially and adversely affected as a result of many related factors outside our control, including the effectiveness of governmental responses to a public health crisis, pandemic or epidemic, the extension, amendment or withdrawal of any programs or initiatives established by governments and the timing and speed of economic recovery. Actions taken in response may contribute to significant volatility in the financial markets, resulting in increased volatility in equity prices (including our common stock), material interest rate changes, supply chain disruptions, such as simultaneous supply and demand shock to global, regional and national economies, and an increase in inflationary pressures.
In particular, our headquarters and most of our senior administrative personnel are located in our New York City office. Any disruption in the operation of, or inability to access, our New York City office could have a significant impact on our business, and such risk of disruption or inaccessibility could be heightened during a terrorist attack, a public health crisis or pandemic located in or around New York City. It is impossible to predict with certainty the possible future material adverse effects to us arising from natural or man-made disasters or catastrophes, or any other public health crisis, pandemic or epidemic, and these effects may include the exacerbation of many of the other risks discussed in this report, especially with respect to our investment activities.
Potential changes in climatic conditions, together with the response or failure to respond to these changes, could precipitate natural disasters. While the precise future effects of climate change are unknown, it is possible that climate change could affect precipitation levels, droughts, wildfires, agricultural production, wind levels, annual sunshine, sea levels and the severity and frequency of storms and other severe weather events. These events and the disruptions that they cause, alone or in combination, also have the potential to strain or deplete infrastructure and response capabilities generally. See also "—Risks Related to Our Investment Activities—Our investments in real assets such as real estate, infrastructure and energy may expose us to increased risks and liabilities." We and our investments also face climate transition risks that could arise, for example, from climate-related legislation and policy developments (both domestically and internationally), and business trends and changes in consumer behavior related to climate change and technology (such as the process of transitioning to a lower-carbon economy). New climate-related regulations or interpretations of existing laws may result in enhanced disclosure obligations, which could negatively affect our and our investment vehicles’ investments and materially increase the regulatory burden and cost of compliance.
Public health crises, pandemics, wars, terrorist attacks, epidemics and weather events could also directly and indirectly impact us and our portfolio companies and other investments in material respects that we are unable to predict or control, which could materially and adversely impact valuations, especially valuations of investments directly in or collateralized by real assets, loans or other assets as well as portfolio companies that rely on physical factories, plants or stores located in the affected areas.
48
We have significant liquidity requirements, and adverse market and economic conditions may adversely affect our sources of liquidity, which could materially and adversely affect KKR.
We expect that our primary liquidity needs will consist of cash required to support and grow our investment management and insurance businesses and to meet policyholder obligations and various other obligations. We also have debt securities outstanding and indebtedness outstanding under various credit facilities. On the scheduled maturity dates of these debt obligations, depending on the market conditions, we may not be able to refinance or renew them on attractive or commercially reasonable terms or at all. See “Management’s Discussion and Analysis of Financial Condition and Results of Operations—Liquidity Needs” for further information regarding our liquidity needs along with our capital commitments as of December 31, 2023 and Note 16 “Debt Obligations” in our financial statements for further information regarding our senior notes, credit facilities and other outstanding debt obligations.
For a discussion of our liquidity needs for our investment activities, please see “—Risks Related to Our Investment Activities—Our investment activities have significant liquidity requirements, and changes in debt or equity markets may materially and adversely affect our investment activities.” We have used, and from time to time may continue to use, our balance sheet to provide credit support for our general partners' obligations to our investment vehicles and to facilitate certain investment transactions entered into by our investment vehicles. See "—Risks Related to Our Business—Certain types of investment vehicles, especially those offered to individual investors, may subject us to a variety of risks, including new and greater levels of public and regulatory scrutiny, regulation, risk of litigation and reputational risk, which could materially and adversely affect us."
The underwriting commitments for our capital markets business may require significant cash obligations, and these commitments may put pressure on our liquidity. One of the credit facilities obtained by our capital markets business can only be used in connection with the general corporate and working capital needs of our capital markets business, including placing and underwriting securities offerings, and another credit facility can only be used to facilitate the settlement of debt transactions syndicated by our capital markets business. To the extent we commit to buy and sell an issue of securities in firm commitment underwritings or otherwise, we expect to borrow under these revolving credit facilities or may require other sources of liquidity to fund such obligations, which, depending on the size and timing of the obligations, may limit our ability to enter into other underwriting arrangements or similar activities, service existing debt obligations or otherwise grow our business. Regulatory net capital requirements may also limit the ability of our broker-dealer subsidiaries to participate in underwriting or other transactions.
Depending on market and economic conditions, we may not be able to meet our liquidity needs, refinance or renew our debt obligations, or find alternate sources of financing (including issuing debt or equity capital) on attractive or commercially reasonable terms or at all. Furthermore, the incurrence of additional debt could result in downgrades of our existing corporate credit ratings, which could limit the availability of future financing and increase our costs of borrowing. In the event that our liquidity requirements were to exceed available liquid assets, we could be forced to sell assets or seek to raise debt or equity capital on unfavorable terms. Moreover, the failure to comply with covenants contained in any of our debt agreements could trigger prepayment obligations that could materially and adversely affect us by causing additional liquidity constraints. Any default under these agreements (including through defaults on other debt that may result in cross-defaults on these agreements), and any resulting acceleration of the borrower’s outstanding indebtedness, could have a material adverse effect on us and could also cause a cross-default under our corporate revolving credit facility, which, if not cured or waived, could have a material adverse effect.
49
Although KFN and Global Atlantic are subsidiaries of KKR, KFN and Global Atlantic each has its own indebtedness outstanding. The terms of their respective indebtedness impose limitations on these companies' current and future operations and may restrict their ability to make distributions to KKR. With respect to Global Atlantic, our insurance subsidiaries are also subject to regulatory restrictions that are expected to restrict their ability to make distributions to KKR. We also could be forced to sell investments at a loss in connection with our insurance business to cover policyholder benefits, surrenders, withdrawals, recaptures or collateralization requirements of Global Atlantic’s reinsurance commitments or other events. Many of the products in Global Atlantic’s in-force book allow policyholders to withdraw their funds, also referred to as a surrender, under defined circumstances. In addition, certain of Global Atlantic’s reinsurance agreements include provisions requiring that under certain circumstances Global Atlantic provides collateral to support performance of its reinsurance commitments, including trust balances. Our insurance subsidiaries manage their liabilities and configure their investment portfolios to provide and maintain sufficient liquidity to support anticipated withdrawal demands, surrenders, contract benefits and maturities. While our insurance subsidiaries own a significant amount of liquid assets, a portion of their assets are considered less liquid. Unanticipated withdrawal or surrender activity or liquidity demands in connection with recaptures or collateralization requirements could, under some circumstances, require our insurance subsidiaries to dispose of assets on unfavorable terms, which could have a material adverse effect on KKR. Moreover, reinsurance agreements may provide for recapture rights on the part of Global Atlantic’s ceding company clients, and a substantial portion of Global Atlantic’s reinsurance agreements require that Global Atlantic hold or provide collateral to support performance of Global Atlantic’s reinsurance commitments. We may be forced to sell investments as a result of a recapture of its reinsurance business or as a result of the need to hold additional collateral that meets the associated investment guidelines, which could have a material adverse effect on KKR.
AUM, referred to as perpetual capital, is subject to material reduction, including through withdrawal, redemption or dividends, and termination.
We refer to a significant portion of our AUM from time to time as perpetual capital, because it has an indefinite term with no predetermined requirement to return invested capital to investors upon the realization of investments. This AUM includes the capital of our registered investment vehicles, certain unregistered investment vehicles, listed companies, and insurance companies, and it excludes our traditional private equity investment vehicles, similarly structured investment vehicles, and hedge fund partnerships. In addition to fluctuations based on the valuations of the underlying investments of the AUM, this capital is subject, however, to withdrawals, redemptions and periodic payments such as dividends. Perpetual capital may also be reduced through elections by investment vehicle investors to redeem their investment, which is permitted in certain of our vehicles. See “—Risks Related to Our Investment Activities—Investors in certain of our investment vehicles are entitled to redeem their investments in these vehicles on a periodic basis, and certain of our investment advisory agreements may be terminated with minimal notice.” In addition, we expect that the capital arising from KKR’s investment management agreements with our insurance subsidiaries would, in general, be reduced if outflows to pay policyholder obligations under Global Atlantic’s insurance policies and reinsurance agreements exceed inflow from writing new insurance policies or entering into new reinsurance transactions. Moreover, perpetual capital may be removed from our AUM under certain circumstances, because the underlying investment management agreement may be terminated by a client for specific reasons like poor investment performance, and perpetual capital may also be terminated by a client’s failure to renew our investment management agreement. Therefore, our investors should not view this component of our AUM as being permanent without exception, because it can be subject to material reductions and even termination.
Many parts of our earnings and cash flow are highly variable due to the nature of our business.
Many parts of our earnings are highly variable from quarter to quarter due to volatility of investment valuations, the investment returns by our funds and other investment vehicles, and the accrual and payment of carried interest and fees earned from our investment activities. We recognize earnings on investments in our investment vehicles based on our allocable share of realized and unrealized gains (or losses) reported by such investment vehicles and for certain of our recent investment vehicles when a performance hurdle is achieved, which in each case are subject to significant uncertainty and risk, including as a result of other risks discussed in this report. During times of market volatility, the fair value of the investments we own or manage, especially any publicly traded equity securities, are more variable, and volatility in the equity markets may have a significant impact on our reported results. A decline in realized or unrealized gains, a failure to achieve a performance hurdle or an increase in realized or unrealized losses, would adversely affect KKR’s financial results.
50
The timing and receipt of carried interest from our investment vehicles are unpredictable and will contribute to the volatility of our cash flows. With respect to our carry paying funds, subject to the terms of their respective governing agreements, carried interest is generally eligible to be distributed to the general partner of the fund with a clawback provision only after all of the following are met: (i) a realization event has occurred (e.g., sale of a portfolio company, dividend, etc.); (ii) the fund has achieved positive overall investment returns since its inception, in excess of performance hurdles where applicable, and is accruing carried interest; and (iii) with respect to investments with a fair value below cost (which we refer to as a netting hole as discussed above), cost has been returned to fund investors in an amount sufficient to reduce remaining cost to the investments' fair value. Even after all of the preceding conditions are met, the general partner of a carry paying fund may, in its sole discretion, decide to defer the distribution of carried interest to it to a later date. Carried interest payments from investments depend on our investment vehicles’ performance and opportunities for realizing gains, which may be limited. It typically takes a substantial period of time to identify attractive investment opportunities, to raise all the funds needed to make an investment, and then to realize the cash value of an investment through a sale, public offering or other exit to generate carried interest proceeds. To the extent an investment is not profitable, no carried interest will be received from our investment vehicles with respect to that investment and, to the extent such investment remains unprofitable, we will only be entitled to a management fee on that investment. Furthermore, certain vehicles and separately managed accounts may not provide for the payment of any carried interest at all. Even if an investment proves to be profitable, it may be several years before any profits can be realized in cash. We cannot predict when, or if, any realization of investments will occur. In addition, if finance providers, such as commercial and investment banks, make it difficult for potential purchasers to secure financing to purchase companies in our investment funds’ portfolio, it may decrease potential realization events and the potential to earn carried interest. If we were to have a realization event in a particular quarter, the event may have a significant impact on our cash flows during the quarter that may not be replicated in subsequent quarters. A decline in realized or unrealized gains, or an increase in realized or unrealized losses, would adversely affect our financial results, which could further increase the volatility of our quarterly results under GAAP. See “Management’s Discussion and Analysis of Financial Condition and Results of Operations—Liquidity—Sources of Liquidity” for further information regarding the conditions for carried interest to become distributable.
The timing and receipt of carried interest also vary with the life cycle of certain of our investment vehicles. For our carry-paying investment vehicles that have completed their investment periods and are able to realize mature investments, sometimes referred to as being in a “harvesting period,” we are more likely to receive larger carried interest distributions than our carry-paying investment vehicles that are in their fundraising or investment periods that precede the harvesting period since those investment vehicles are less likely to realize their investments and, even if they did, we are more likely to defer carried interest distributions due to the potential for a clawback. During times when a significant portion of our AUM is attributable to carry-paying investment vehicles that are not in their harvesting periods, we may receive substantially lower carried interest distributions.
Fee income, which we recognize when contractually earned, can vary due to fluctuations in AUM, the number of investment transactions made by our investment vehicles, the number of portfolio companies we manage, the fee provisions contained in our investment vehicles and other investment products and transactions by our capital markets business. In any particular quarter, fee income may vary significantly due to the variances in size and frequency of transaction fees or fees received by our capital markets business. For further information on the amount of our total management, monitoring and transaction fees, please see “Management’s Discussion and Analysis of Financial Condition and Results of Operations—Analysis of Segment Operating Results” and Note 2 “Summary of Significant Accounting Policies—Fees and Other” in our financial statements.
Additionally, a decline in the pace, size, or value of investments by our investment vehicles would result in our receiving less revenue from fees. The transaction and management or monitoring fees that we earn are driven in part by the pace at which our investment vehicles make investments and the size of those investments. Any decline in that pace or the size of investments would reduce our revenue from transaction and management or monitoring fees. Likewise, during an attractive selling environment, our investment vehicles may capitalize on increased opportunities to exit investments. Any increase in the pace at which our investment vehicles exit investments, if not offset by new commitments and investments, would reduce future management fees. Additionally, in certain of our investment vehicles that derive management fees only on the basis of invested capital, the pace at which we make investments, the length of time we hold such investments, and the timing of disposition will directly impact our revenues. Many factors could cause such a decline in the pace of investment or the transaction and management or monitoring fees we receive, including the other risks discussed in this report.
With respect to our insurance business, block reinsurance transactions are expected to create variability in our financial results in or for the period in which this type of transaction is executed, for example by significantly increasing policy benefits in that period, depending on the types of liabilities reinsured. In addition, aspects of how our insurance business is required to report certain investments and liabilities is expected to add volatility to our financial results from quarter to quarter.
51
The "clawback" provisions in the agreements governing our carry-paying funds may give rise to a contingent obligation that may require us to return or contribute significant amounts to our funds and fund investors.
Carry distributions may give rise to clawback obligations. The partnership documents governing our carry-paying funds, including funds relating to private equity, credit and real assets investments, generally include a "clawback" provision that, if triggered, may give rise to a contingent obligation requiring the general partner to return amounts to the fund for distribution to the fund investors at the end of the life of the fund. Under a clawback obligation, upon the liquidation of a fund or other event as set forth in the terms governing the fund, the general partner is required to return, typically on an after-tax basis, previously distributed carry to the extent that, due to the diminished performance of later investments, the aggregate amount of carry distributions received by the general partner during the term of the fund exceed the amount to which the general partner was ultimately entitled, after taking into account the effects of any performance thresholds. We would continue to be subject to the clawback obligation even if carry has been distributed to current or former employees or other persons through our carry pool. If such current or former employees or other persons do not satisfy their share of any clawback obligation, we will be responsible for funding the entire clawback obligation and may need to seek other sources of liquidity to fund such an obligation. Not all carry may be recoverable from current or former employees and other persons once it has been distributed by us. As of December 31, 2023, approximately $546 million of carried interest was subject to this clawback obligation, assuming that all applicable carry-paying funds were liquidated at their December 31, 2023 fair values. Had the investments in such carry-paying funds been liquidated at zero value, the clawback obligation would have been approximately $3.5 billion.
Because carried interest is typically based on actual cash distributions to investors, for a fund that has an aggregate fair value above aggregate cost, and is otherwise accruing carried interest, but has one or more investments where fair value is below cost, the shortfall between cost and fair value for such investments is referred to as a "netting hole." If present, a netting hole will reduce the carried interest we otherwise would earn because, before any realized gains can be distributed to the general partner as carried interest, these netting holes must be "filled" through a return of capital to fund investors in an amount sufficient to reduce the remaining cost to the investments' fair value.
In addition, we have entered into strategic investor partnerships with certain investors, generally through separately managed accounts, which have longer investment periods, often of 20 years or more, may offer reduced fees for such investors, provide for investments across different investment strategies and may require netting across various funds in which they invest, in effect potentially creating a netting hole across funds. Since strategic investor partnerships have longer investment periods and invest in multiple strategies, as compared to our traditional private equity fund structure, these fund structures may increase the risk of a clawback and the possibility of a netting hole because, over a longer investment period, a period of reduced performance following periods of performance adequate to realize carried interest is more likely to occur.
Our inability to raise additional or successor funds, to raise funds with as favorable terms or comparable size as existing or predecessor funds, or to raise capital for other investment vehicles could materially and adversely affect KKR.
Our inability to successfully raise additional or successor funds (or raise successor funds of a comparable size as our predecessor funds, or raise funds with as favorable terms) could materially and adversely affect our revenues or profitability. In connection with raising new funds or securing additional investments in existing funds, we negotiate terms for such funds and investments with our fund limited partners. The outcome of such negotiations could result in our agreement to terms that are materially less favorable to us than prior terms or terms of funds advised by our competitors, which could materially and adversely affect us in a number of ways, including to restrict our ability to raise investment funds with investment objectives or strategies that compete with existing funds, reduce fee revenues we earn, reduce the percentage of profits on third-party capital in which we share, increase the performance hurdle required to be generated on investment prior to our right to receive carried interest, limit the ability of certain investment vehicles to invest alongside our other investment vehicles, add expenses and obligations for us in managing the fund or increase our potential liabilities. Furthermore, as institutional investors increasingly consolidate their relationships with investment firms and competition becomes more acute, we may receive more requests to modify the terms in our new funds. Certain of our newer funds also include more favorable terms for fund investors that commit to early closes for our funds. Additionally, in certain funds, we have agreed to charge management fees based on invested capital or net asset value as opposed to charging management fees based on committed capital. In certain cases, we have provided “fee holidays” to certain investors during which we do not charge management fees for a fixed period of time (such as the first six months). Certain institutional investors have also publicly criticized certain fund fee and expense structures, including monitoring fees and transaction fees. We have received, and expect to continue to receive, requests from a variety of fund investors and groups representing such investors to decrease fees and to modify our carried interest and incentive fee structures, which could result in a reduction or delay in the timing of receipt of the fees and carried interest and incentive fees we earn. The SEC has focused on certain fund fees and expenses, including whether such fees and expenses were appropriately disclosed to fund investors, and such focus may lead to increased publicity that could cause fund investors to further resist our receipt of certain fees and expense reimbursements.
52
The number of funds and other investment vehicles raising capital varies from year to year, and in years where relatively few of our investment vehicles are raising capital, the growth of our AUM, FPAUM and associated fees may be significantly lower. There is no assurance that fundraises for new strategies, successor funds or other investment vehicles will experience similar success as our existing or predecessor funds or other investment vehicles in the future. Our current private equity funds and certain other funds and investment vehicles have a finite life and a finite amount of commitments from fund investors. Once a fund nears the end of its investment period, our success depends on our ability to raise additional or successor funds in order to keep making investments and, over the long term, earning management fees (although our funds and investment vehicles continue to earn management fees after the expiration of their investment periods, they are generally at a reduced rate). Even if we are successful in raising successor funds, to the extent we are unable to raise successor funds of a comparable size to our predecessor funds or the extent that we are delayed in raising such successor funds, our revenues may decrease as the investment period of our predecessor funds expire and associated fees decrease. The performance of our funds also impacts our ability to raise capital, and deterioration in the performance of our funds or other investment vehicles would result in challenges to future fundraising. Our fundraising may also be negatively impacted by any change in, or rebalancing of, fund investors' asset allocation policies, including successor funds raised by us when unfavorable economic or market circumstances exist.
Our ability to attract new capital and investors in our investment vehicles is driven, in part, by the extent to which they continue to see the alternative asset management industry generally, and our investment products specifically, as attractive means for capital appreciation or income. Failure or inability to raise capital with insurance sponsored vehicles may adversely impact growth in our insurance business. Our ability to raise new investment vehicles could be hampered if the general appeal of alternative asset investments were to decline. An investment in a limited partner interest in an alternative asset fund like private equity is less liquid than an exchange traded instrument and the returns on such investment may be more volatile than an investment in securities for which there is a more active and transparent market. Our ability to raise capital is also highly dependent on market and economic conditions, and adverse conditions could materially and adversely affect our ability to raise capital and, as a result, our financial performance, including, for example, as a result of investor preference for investments in certain of our investment vehicles, waning because investors view other investment opportunities, such as government debt, as producing a higher risk-adjusted return. See “—Risks Related to Our Business—Difficult market and economic conditions can, and periodically do, materially and adversely affect KKR.”
Fund investors could seek to redeploy capital away from certain of our credit or other investment vehicles, which permit redemptions on relatively short notice, in order to meet liquidity needs or invest in other asset classes or with other managers. Alternative asset investments could also fall into disfavor as a result of concerns about liquidity and short-term or long-term performance. Fundraising is competitive, and there is no assurance that fundraises for our flagship investment funds or other investment vehicles or for our newer strategies and their successor funds or other investment vehicles will experience similar success. If we are unable to successfully raise comparably sized or larger funds, our AUM, FPAUM, and associated fees attributable to new capital raised in future periods may be lower than in prior years. There is no guarantee we would be able to raise comparably sized or larger funds as those described in “Business—Our Business.”
Institutional investors that have suffered from decreasing returns, liquidity pressure, increased volatility or difficulty maintaining target asset allocations may materially decrease or temporarily suspend making new investments in our investment funds. Such concerns could be exhibited, in particular, by public pension funds, which have historically been among the largest investors in alternative assets. Many public pension funds are significantly underfunded and their funding problems have been, and may in the future be, exacerbated by economic downturn. Concerns with liquidity could cause such public pension funds to reevaluate the appropriateness of alternative assets, and other institutional investors may reduce their overall portfolio allocations to alternative assets. The evolving preferences of our fund investors, including sovereign wealth funds and public pension funds, may necessitate that alternatives to the traditional investment fund structure become a larger part of our business going forward, such as separately managed accounts, democratized investment vehicles, specialized funds and co-investment vehicles, and strategic investor partnerships whereby we manage certain investors' capital across a variety of our products on separately negotiated terms, which could increase our cost of raising capital at the scale we have historically achieved. There can be no assurance that such alternatives will be as profitable to us as the traditional investment fund structure, and the impact such a trend could have on our results of operations, if widely implemented, is unclear. In order to try to satisfy the evolving preferences of investors, we have begun, and will continue, to offer a wide array of investment vehicles and, assuming overall investor demand and available capital for allocations to the alternative asset class remains steady, investor allocations to certain of our investment vehicles may detract from the allocations potentially available to other of our investment vehicles. Moreover, certain institutional investors are demonstrating a preference to in-source their own investment professionals and to make direct investments in alternative assets without the assistance of investment advisers like us. Such institutional investors may become our competitors and could cease to be our clients. All of these factors could result in a smaller overall pool of available capital in our industry or a smaller pool of institutional capital for our traditional closed-end funds.
53
In addition, the asset allocation rules or regulations or investment policies to which such third-party investors are subject could inhibit or restrict the ability of third-party investors to make investments in our investment funds. In addition to federal law, changes in state and local law may limit investment activities of state pension plans and insurance companies. Coupled with a lack of distributions from their existing investment portfolios, many of these investors may have been left with disproportionately outsized remaining commitments to, and invested capital in, a number of investment funds, which may significantly limit their ability to make new commitments to third-party managed investment funds such as those advised by us. There is no assurance that the amount of commitments investors are making to alternative asset vehicles will continue at recent levels or that our ability to raise capital from investors will not be hampered. Any of these developments could materially and adversely affect our financial performance.
The investment management and insurance businesses are intensely competitive.
We compete for both investors and investment opportunities and business in both our asset management business and in our insurance business. Our asset management business is highly fragmented, with our competitors consisting primarily of sponsors of public and private investment funds, real estate development companies, business development companies, investment banks, commercial finance companies and operating companies acting as strategic buyers of businesses. The insurance market is also highly fragmented, with our competitors consisting of insurance companies, reinsurance companies and other financial institutions that offer investment products. We believe that competition for investors in our investment vehicles is based primarily on: (i) investment performance; (ii) investor liquidity and willingness to invest; (iii) investor perception of investment managers’' drive, focus and alignment of interest; (iv) business reputation; (v) the duration of relationships with investors; (vi) the quality of services provided to investors; (vii) pricing (including investment terms, fees and expense reimbursement); (viii) the relative attractiveness of the types of investments that have been or will be made; and (ix) consideration for environmental, social and governance issues. We believe that competition for investors in our insurance products is based primarily on: (i) price; (ii) terms and conditions; (iii) relationships; (iv) quality of service and execution certainty; (v) capital and perceived financial strength (including third-party ratings); (vi) technology, innovation and ease of use; (vii) breadth of product offerings; and (viii) reputation, experience and brand recognition. We believe that competition for investment opportunities is based primarily on the pricing, terms and structure of a proposed investment and certainty of execution.
A number of factors serve to increase our competitive risks, including:
•a number of our competitors in some of our businesses may have greater financial, technical, marketing and other resources and more personnel than we do and, in the case of some asset classes or geographic regions, longer operating histories, more established relationships, greater expertise or better reputation;
•with respect to our insurance business, many of our competitors are large and well-established, and some have greater market share or breadth of distribution, assume a greater level of risk while maintaining financial strength ratings, or have higher financial strength, claims-paying or credit ratings than Global Atlantic does, or benefit by offering various lines of insurance, from diversification of risks and possible positive impacts on capital requirements;
•with respect to our insurance business, technological advancements and innovation are occurring at a rapid pace in distribution, underwriting, recordkeeping, advisory, claims and operations, and that pace may increase, particularly as other companies increasingly use data analytics and technology as part of their business strategy, which could require our insurance business to incur additional costs to maintain its competitive position;
•investors may materially decrease their allocations in new investment vehicles due to their experiences following an economic downturn, the limited availability of capital, regulatory requirements or a desire to consolidate their relationships with investment firms;
•some of our competitors may have agreed to terms on their investment funds or products that are more favorable to investors than our funds or products, such as lower management fees, greater fee sharing or higher performance hurdles for carried interest, and therefore we may be forced to match or otherwise revise our terms to be less favorable to us than they have been in the past and, further, some of our competitors may be willing to pay higher placement fees in order to gain distribution of their private wealth products;
•some of our funds may not perform as well as competitors' funds or other available investment products;
•our competitors have raised or may raise significant amounts of capital, and many of them have similar investment objectives and strategies to our funds, which may create additional competition for investment opportunities and may reduce the size and duration of pricing inefficiencies that many alternative investment strategies seek to exploit;
54
•some of these competitors may also have a lower cost of capital and access to funding sources that are not available to us, which may create competitive disadvantages for us with respect to investment opportunities;
•some of our competitors may have higher risk tolerances, different risk assessments or lower return thresholds, which could allow them to consider a wider variety of investments and to bid more aggressively than us for investments;
•some of our competitors may be subject to less regulation or less regulatory scrutiny and accordingly may have more flexibility to undertake and execute certain businesses or investments than we do and/or bear less expense to comply with such regulations than we do;
•there are relatively few barriers to entry impeding the formation of new funds, including a relatively low cost of entering these businesses, and the successful efforts of new entrants into our various lines of business, including major commercial and investment banks and other financial institutions, have resulted in increased competition;
•some fund investors may prefer to invest with an investment manager that is not publicly traded, is smaller or manages fewer investment products;
•other industry participants will from time to time seek to recruit our investment professionals and other employees away from us;
•the use of generative artificial intelligence tools by our competitors may disrupt our industry and existing business models, including ours; and
•we may be unable to adequately protect KKR's brand, logo, or intellectual property in the U.S. or foreign countries, which may result in its infringement, misappropriation or diminishment.
We may lose investment opportunities in the future if we do not match investment prices, structures and terms offered by competitors. Our competitors for investment opportunities that are corporate buyers may be able to achieve synergistic cost savings in respect of an investment, which may provide them with a competitive advantage in bidding for an investment. Alternatively, we may experience decreased investment returns and increased risks of loss if we match investment prices, structures and terms offered by competitors. There is a risk that fees and carried interest in the alternative investment management industry will decline, without regard to the historical performance of a manager. Fee or carried interest income reductions on existing or future funds, without corresponding decreases in our cost structure, could materially and adversely affect our revenues and profitability.
In addition, if interest rates were to rise or if market conditions for competing investment or insurance products become or are more favorable, and such products begin to offer rates of return superior to those achieved by our investment vehicles or insurance products, the attractiveness of our investment vehicles or insurance products relative to investments in other investment products could decrease. This competitive pressure could materially and adversely affect our ability to make successful investments, limit our ability to raise future funds or write new insurance policies and result in increased policy surrenders, any of which would adversely impact our business, results of operations and cash flow.
We are subject to focus by some of our fund investors, stockholders, regulators and other stakeholders on environmental, social and governance matters.
Some investors in our investment vehicles, stockholders, regulators and other stakeholders are increasingly focused on sustainability matters, such as climate change and environmental stewardship, diversity, equity and inclusion (“DEI”), human rights, support for local communities, corporate governance and transparency, or other environmental- or social-related areas. Certain of these investors consider our record of, and approach to, responsible investing, in determining whether to invest in our investment vehicles. Certain investors have also demonstrated increased activism with respect to investing, including by urging alternative asset managers to take (or refrain from taking) certain actions that could adversely impact the value of an investment and at times have conditioned future capital commitments on such actions. Increased focus and activism related to sustainability matters may constrain our capital deployment opportunities. Similarly, current and prospective stockholders and fund investors, may use third-party benchmarks to measure our responsible investment practices and to decide whether to make an investment, and failure to meet their standards may materially and adversely affect us. There can be no assurance that we will be able to accomplish any sustainability-related goals or commitments that we have announced or may announce in the future, as such statements are, or reflect, estimates, aspirations and/or expectations only at the time of announcement. More broadly, there can be no assurance that our responsible investment policies and procedures will remain unchanged because we continuously review our approach to these issues. Thus, such policies and procedures could change, even materially, or may not be applied to a particular investment. KKR may determine at any time that it is not feasible or practical to implement or complete certain of
55
its sustainability-related initiatives, policies, and procedures based on considerations relating to particular business, regulatory, policy, geopolitics, cost, timing, or other considerations. Growing interest on the part of investors and regulators in ESG factors and increased demand for, and scrutiny of, asset managers' sustainability-related disclosure, have also increased the risk that asset managers could be perceived as, or accused of, making inaccurate or misleading statements regarding these matters. The occurrence of any of the foregoing could have a material and adverse impact on us, including on our reputation.
Although we view our sustainable investing approach as a tool for value creation and value protection, different stakeholder groups have divergent views on the merits of integrating sustainability considerations into the investment process. This divergence exists across the jurisdictions and localities where KKR operates, in which case it may result in conflicting sustainability-related regulations and legal frameworks which increases our compliance costs and our risk of non-compliance. The increased regulatory and legal complexity and heightened risk of public scrutiny could impact our reputation and lead to increased inquiries, investigations, and reactive stakeholder engagements.
Additionally, our business could be adversely affected if we or our portfolio companies fail to comply with applicable ESG regulations. If regulators enact new rules, disagree with our responsible investing procedures or standards, or require methodology that is different from our current practice, it may materially and adversely affect us in various ways, including the incurrence of significant compliance costs and an increase in the risk of litigation and regulatory action. Several jurisdictions impose or have proposed restrictions around the offering of sustainability investment vehicles through labelling, disclosure or marketing requirements at both the investment vehicle and asset management level. There has been increased regulatory focus on the sustainability-related practices of investment managers, including in relation to improving transparency regarding the definition, measurement and disclosure of ESG factors. There are many recently proposed and final ESG rules, regulations, priorities and enforcement actions that may materially and adversely affect us, including the following:
•In the United States, various proposals by the SEC regarding, among others, enhanced disclosure requirements around ESG practices for investment managers, registered investment companies and advisers and rules aimed at enhancing and standardizing climate-related disclosures for registrants, which, if adopted, would require climate-related disclosures beyond current requirements or practice. In addition, unless challenges to the rules are successful, California’s recently enacted climate legislation will require certain companies that do business in California to provide certain climate-related disclosures.
•In the EU, several ESG-related rules have been finalized or proposed, including proposals that affect the manner in which asset managers and portfolio companies operate within the EU and also, in certain circumstances, outside the EU, including also mandatory disclosure and reporting requirements, which supplement the disclosure framework set out in the Sustainable Finance Disclosure Regulation (“SFDR”) (which many of our funds as well as our Irish AIFMs are currently subject to, including funds subject to the transparency requirements under Articles 8 and 9 of SFDR) and the Corporate Sustainability Reporting Directive (“CSRD”), which introduce significantly more detailed sustainability reporting requirements and significantly expand the number of EU and non-EU companies subject to this reporting framework. The SFDR framework is currently under review and it can be expected that further changes will be introduced.
•In Asia, various regulators have introduced requirements for asset managers to integrate climate risk considerations in investment and risk management processes and disclosures, together with enhanced disclosure and reporting, and have also issued enhanced rules for certain investment vehicles on general ESG risk management and disclosure.
Globally, a lack of harmonization in relation to ESG legal and regulatory reform across the jurisdictions in which we operate may affect our future implementation of, and compliance with, rapidly developing ESG standards and requirements. Additionally, collecting, measuring, and reporting sustainability information and metrics can be costly, difficult and time consuming, is subject to evolving reporting standards, and can present numerous operational, reputational, financial, legal and other risks. Compliance efforts by asset managers raise a number of challenges, including with respect to the allocation of significant resources to both comply with regulatory requirements and implement monitoring and related controls both at firm level and at product level, as well as challenges related to product classification. Generally, we expect investor demands and the prevailing legal environment to require us to devote additional resources to sustainability matters in our review of prospective investments and management of existing investments, which will increase our expenses.
56
Changes in relevant tax laws, regulations or treaties or an adverse interpretation of these items by tax authorities could adversely impact our effective tax rate and tax liability.
Our effective tax rate and tax liability is based on the application of current income tax laws, regulations and treaties. These laws, regulations and treaties are complex, and the manner which they apply to us and our investment vehicles is sometimes open to interpretation. Significant management judgment is required in determining our provision for income taxes, our deferred tax assets and liabilities and any valuation allowance recorded against our net deferred tax assets. Although management believes its application of current laws, regulations and treaties to be correct and sustainable upon examination by the tax authorities, the tax authorities could challenge our interpretation resulting in additional tax liability or adjustment to our income tax provision that could increase our effective tax rate. Tax laws, regulations or treaties newly enacted or enacted in the future may cause us to revalue our net deferred tax assets and have a material change to our effective tax rate and tax liabilities.
There could be significant changes in U.S. tax law and regulations. While the likelihood and nature of any such legislation or regulations is uncertain, any such changes could materially increase the amount of taxes we or our portfolio companies are required to pay. The U.S. Federal government signed into law the Inflation Reduction Act of 2022, which, among other things, imposes a corporate minimum "book" tax on certain large corporations, creates a non-deductible 1% excise tax on net stock repurchases made by certain publicly traded corporations after December 31, 2022, and modifies certain clean energy investment tax credits. These changes could materially increase the amount of taxes and tax-related regulatory and compliance costs we and our portfolio companies are required to pay. For example, increases in the corporate tax rate may adversely impact the cash flow of our portfolio companies and result in our investment vehicles' selling assets at values that are less than we projected, which could in turn have negative impact to the investment vehicle's performance and to the pace of realizations. Further, final regulations relating to compensation for certain covered employees under Section 162(m) could meaningfully reduce the amount of related tax deductions available to us.
Additionally, foreign, state and local governments may enact laws that could result in further changes to foreign, state and local taxation and materially affect us in jurisdictions in which we or our portfolio companies operate.
In addition to general tax law changes discussed above, there could be significant changes in U.S. federal, state, local or foreign tax law, regulations or interpretations that could adversely affect the taxation of carried interest, which could have an adverse effect on our ability to recruit, retain and motivate employees and key personnel. Investments generally must be held for more than three years for carried interest to be treated for U.S. federal income tax purposes as capital gain. The holding period requirement may result in some of our carried interest being taxed as ordinary income to our U.S. employees and other key personnel, which could materially increase the amount of taxes that they would be required to pay and may incentivize employees to hold investments for longer periods. This may create a conflict of interest between investment vehicle investors (whose investments would receive such capital gain treatment after a holding period of only one year) and the general partner on the execution, closing or timing of sales of investments in connection with the receipt of carried interest.
Multi-national companies, such as us, continue to be a focus by the U.S. Congress, the Organization for Economic Co-operation and Development (the "OECD") and other government agencies in jurisdictions in which we and our affiliates invest or do business. The OECD, which represents a coalition of member countries, is contemplating changes to numerous long-standing tax principles through its base erosion and profit shifting ("BEPS") project, which is focused on a number of issues, including profit shifting among affiliated entities in different jurisdictions, interest deductibility and eligibility for the benefits of double tax treaties. The OECD also recently finalized guidelines that recommend certain multinational enterprises to be subject to a minimum 15% tax rate, effective from 2024 ("Pillar Two").
Various countries have implemented or intend to implement the OECD’s recommended model rules. By way of example, the Council of the European Union formally adopted Pillar Two and required all 27 EU member states to adopt local legislation during 2023 to implement Pillar Two rules that apply in respect of the fiscal years beginning from December 31, 2023. Our business and our sponsored vehicles' and portfolio companies' businesses could be significantly impacted if the model rules, or any future variation, have been or will be implemented in any of the countries in which our business, our portfolio companies' businesses, or our investment structures are located. Effective tax rates could increase within our business, our portfolio companies’ businesses, or our investment structures, including by way of higher levels of tax being imposed than is currently the case, possible denial of deductions or increased withholding taxes and/or profits being allocated differently. The proposals may also lead to an increase in the complexity, burden and cost of tax compliance. Given ongoing design, implementation and administration, the timing, scope, and impact of any relevant domestic legislation or multilateral conventions remain subject to significant uncertainty.
See Note 18 "Income Taxes" in our financial statements for further information regarding various tax matters.
57
We depend on the efforts, skills, reputations, business contacts, and conduct of our employees and our ability to retain our employees and to recruit prospective employees.
We depend on the efforts, skills, reputations and business contacts of our employees, including our Co-Founders, Co-Chief Executive Officers and other key personnel, the information and deal flow they and others generate during the normal course of their activities and the synergies among the diverse fields of expertise and knowledge held by our professionals. Our success is highly dependent upon our employees and other key personnel, who are not obligated to remain employed with us, and to a substantial degree on our ability to retain and motivate our employees and other key personnel and to strategically recruit, retain and motivate new talented employees, including qualified investment professionals.
Our employees and other key personnel possess substantial experience and expertise and have strong business relationships with investors in our investment funds and distributors of our other investment vehicles and other members of the business community. As a result, the loss of these personnel could jeopardize our relationships with these individuals and entities, result in the reduction of AUM or investment opportunities, or render us unable to maintain operations and support growth of our businesses. The loss of services of any key personnel could also harm our ability to maintain or grow AUM in existing investment vehicles or raise additional funds in the future.
Furthermore, the agreements governing our committed capital funds generally provide that in the event certain "key persons" (for example, investment professionals who are named as "key executives" for certain geographically or product focused investment vehicles) cease to actively manage an investment vehicle or be substantially involved in KKR activities, investors in the investment vehicle will be entitled to reduce, in whole or in part, their capital commitments available for further investments on an investor-by-investor basis. In the case of many of our funds, investors may be permitted to terminate their investment in the event a "key persons" provision is triggered, which could lead to the liquidation of those funds. In addition, the occurrence of such a "key person" event could cause us to agree to less favorable ongoing terms with respect to the affected fund. Although we periodically engage in discussions with the limited partners of our funds regarding a waiver of such provisions with respect to executives involved in geographically or product focused funds whose departures have occurred or are anticipated, such waiver is not guaranteed, and our limited partners' refusal to provide a waiver may have a material adverse effect on our business and financial results.
Our insurance business similarly depends on the ability to attract and retain experienced insurance professionals in the jurisdictions where it operates. Global Atlantic does not have a captive distribution force and depends on the ability to attract and retain experienced insurance professionals in the jurisdictions where it operates. If Global Atlantic is unable to recruit, onboard and retain insurance professionals, Global Atlantic may not be able to maintain its operations and support growth of the business.
Our most important asset is our people, and our continued success is highly dependent upon the efforts of our employees and other key personnel. If we cannot retain and motivate our employees and other key personnel and recruit, retain and motivate new employees and other key personnel, our business may be materially and adversely affected. The market for talented and qualified candidates is extremely competitive. Our ability to recruit, retain and motivate our employees is dependent on our ability to offer highly attractive incentive opportunities, compensation and benefits, some of which could be adversely impacted by any changes in regulation or tax law that impacts certain forms of incentives or other remuneration that we may typically offer employees, such as carried interest. For example, we allocate carried interest to our employees, and if tax laws alter the favorable tax characteristics of carried interest, then the value of the carry as an incentive tool is materially diminished. Furthermore, clawback provisions related to our equity incentive awards may render such compensation less attractive. The loss of any incentive compensation tools may cause us to incur additional expenses to pay competitively with other firms. Efforts to retain or attract employees, including our investment professionals, may result in significant additional expenses, which could materially and adversely affect KKR. In addition, our ability to successfully identify, hire, and promote employees may be impacted by legal and judicial developments outside of our control and may necessitate changes to employment practices. For example, some advocacy groups and state attorneys general have asserted that the U.S. Supreme Court’s decision striking down race-based affirmative action in higher education in June 2023 should be analogized to private employment matters and private contract matters, and scrutiny of certain corporate DEI practices since this decision have been increasing.
58
As noted above, one of the ways we recruit, retain and motivate our employees is by allocating a portion of the carried interest that we earn from our investment vehicles, which we refer to as the carry pool. There can be no assurance that the carry pool will have sufficient cash available to continue to make cash payments in the future, and fluctuations from the distributions generated from the carry pool could render the compensation that KKR separately pays to them to be less attractive. In these circumstances, in order to retain and motivate our employees, we may be required to pay these employees a higher amount of cash compensation to retain and motivate them than we otherwise would have paid, which would increase our compensation expense. We are not permitted under our certificate of incorporation to increase the percentage of carried interest allocable to the carry pool without the consent of a majority of our independent directors. In the future, if less carried interest from the carry pool is allocated to employees, this may result in less cash payments to employees. To the extent the carried interest allocated to the carry pool decreases, we may be limited in our ability to attract, retain and motivate talented employees and other key personnel and we may need to increase the level of cash compensation that we pay.
Additionally, we have granted and expect to continue to grant equity awards from our equity incentive plans, which has caused and will cause dilution. If we increase the use of equity awards in the future, expense associated with equity-based compensation may increase materially. The value of the equity awards may drop or be volatile, which may make our equity less attractive to our employees. Regulations may also impose restrictions on our equity compensation. For example, in 2023, the SEC adopted rules related to incentive-based compensation "clawback," which were then implemented through final stock exchange rules. In the future, rules such as these may result in us substantially revising our compensation strategy, increase our compensation and other costs and may materially and adversely affect our ability to recruit and retain qualified employees. Additionally, in the EU, clawback of compensation may apply in certain circumstances. To the extent our equity incentive programs are not effective, we may be limited in our ability to attract, retain and motivate talented employees and other key personnel and we may need to increase the level of cash compensation that we pay.
We seek to retain our senior employees by having them agree to a confidentiality and restrictive covenant agreement. However, there is no guarantee that the confidentiality and restrictive covenant agreements to which they are subject, together with our other arrangements with them, will prevent them from leaving us, joining our competitors or otherwise competing with us. Depending on which entity is a party to these agreements and/or the laws applicable to them, we may not be able to, or may choose not to, enforce them or become subject to lawsuits or other claims, and certain of these agreements might be waived, modified or amended at any time without our consent. Many U.S. states and countries in which we operate have proposed, considered, or have already adopted, laws and rules which significantly limit or ban noncompete clauses between employers and their employees, which could both limit our ability to enter into such restrictive covenants and our ability to enforce them. Even where enforceable, these agreements expire after a certain period of time, at which point our employees will be free to compete against us.
Our commitment to maintain an inviting work environment significantly supports our ability to recruit and retain employees and maintain our culture. We strive to maintain a work environment that reinforces our culture of collaboration, inclusiveness, motivation and alignment of interests with fund investors. Growth and expansion of our businesses has necessitated extensive hiring of new employees over the last few years. While we are focused on the importance of maintaining our culture when making hiring decisions, rapid expansions of our employee headcount do present challenges to maintaining our culture, including, after a hire is made, continuing to ensure that the hire is integrated into our firm culture. If we do not continue to develop an inviting work environment and maintain our culture, our ability to compete successfully and achieve our business objectives could be impaired, which could materially and adversely affect our business, results of operations and financial condition.
On the other hand, our business could be damaged by the misconduct of our employees. We depend to a large extent on our business relationships and our reputation for integrity and high-caliber professional services to attract and retain fund investors and qualified professionals and to pursue investment opportunities for our investment vehicles. Misconduct by our employees could impair our ability to retain and recruit our employees, to attract and retain clients and may subject us to significant legal liability and reputational harm. For example, we are subject to substantial regulatory and contractual obligations and standards arising from our business, such as fiduciary duties, regulatory and legal obligations and confidentiality, relating to the assets we manage. The violation of these obligations or standards by any of our employees would adversely affect our clients and us. Our current and former employees may also become subject to allegations of sexual harassment, racial and gender discrimination or other similar misconduct, which, regardless of the ultimate outcome, may result in adverse publicity that could significantly harm our reputation. Furthermore, our business often requires that we deal with confidential matters with respect to our investment opportunities and completed investments. If our employees were improperly to use or disclose confidential information, we could become subject significant litigation or investigations, including with respect to violations of applicable securities laws. It is not always possible to detect or deter such misconduct, and the precautions we take may not be effective in all cases.
59
Our employees frequently engage in manual individual processes, which bear varying levels of execution risk, including the risk of unintentional mistakes or errors, which could materially and adversely affect us. See also “—Risks Related to Our Business—We rely significantly on third-party service providers and other intermediaries, which exposes us to operational, reputational and other risks that could materially and adversely affect KKR.”
We rely significantly on third-party service providers and other intermediaries, which exposes us to operational, reputational and other risks that could materially and adversely affect KKR.
We rely on third parties whom we do not control for significant operational support and assistance with other aspects of our business, including for various operational, accounting, and data processes and systems as well as on the systems of third parties who provide services to us. Other aspects of our business that depend on the services of third parties include law firms, accounting firms, prime brokers, custodians, escrow agents, placement agents, distribution partners, administrators and other consultants and agents to carry out administrative or other services, including insurance policy administration, securities transactions, recordkeeping, tax preparation, government filings, paying agent services, trustee services, technology services, administration services, and tax and accounting services. If any of these processes or systems do not operate properly, are disabled or not appropriately updated, or if the third parties’ services are erroneous, sub-standard or otherwise deficient, we could suffer financial loss, a disruption of our businesses, liability to us or our investment vehicles, regulatory intervention, fines, sanctions or reputational damage.
In certain third-party service provider relationships, including those where services are provided to our registered investment advisers or broker dealer subsidiaries, we may be held liable if those service providers, their employees or their own third-party service providers are found to have violated regulations or engaged in misconduct. There can be no assurances that we or one of our investment vehicles will not experience, directly or indirectly, such negative impacts or otherwise be subject to or implicated by litigation or investigations involving any possible violation of such laws by such third-party service providers. For example, we or our investment vehicles may enter into agreements with third parties under which such parties will be entitled to indemnification under certain circumstances, including with respect to sanctions, fines, or penalties, including civil damage actions, imposed in connection with their activities related to our investment vehicles' investments.
If we elect to replace any of these third-party service providers, we may incur costs or business disruptions in connection with finding, retaining and operationalizing suitable new providers. In addition, the time and attention of our senior management may be diverted away from ongoing business operations. From time to time, service disruptions have affected our products. For example, Global Atlantic has settled policyholder and agent class action litigation matters and a number of regulatory matters stemming from service disruptions caused by our third-party administrator for life insurance policies. In addition, periods of rapid sales of Global Atlantic’s products have resulted and may in the future result in service disruptions, which may cause significant financial and reputational harm and draw increased scrutiny from regulators. A disaster, disruption, error or inability to operate or provide any of these services by us or our vendors or third parties with whom we conduct business, including a disruption involving electronic communications or other services used by us, our vendors or third parties with whom we conduct business, including paying agents and escrow agents, or directly affecting our principal offices, could have a material adverse impact on our financial results and our ability to continue to operate our business without interruption. Our business continuation or disaster recovery programs may not be sufficient to mitigate the harm that may result from such a disaster or disruption. In addition, insurance and other safeguards might only partially reimburse us for our losses, if at all. While we have endeavored to mitigate the risk of other disruptions in the future, there can be no guarantee these mitigation efforts will be successful. We may continue to experience reputational impacts and heightened regulatory scrutiny as a result of these matters.
We and these third parties operate in businesses that are highly dependent on information systems and technology, and certain of our businesses are also highly dependent on our ability to process and evaluate, on a daily basis, transactions across markets and geographies in a time-sensitive, efficient and accurate manner. If any of our service providers fails to provide us with timely and accurate data, the accuracy of our financial reporting and our financial statements may be impacted. We cannot ensure that erroneous information received from third parties will be identified and resolved such that the information is included without error, which may impact our business and servicing quality. The precautions we take to prevent and detect this activity may not be effective in all cases. We are subject to risks of errors and mistakes made by these third parties, which may be attributed to us and could materially and adversely affect us. We may be unsuccessful in seeking reimbursement or indemnification from these third-party service providers.
60
Our insurance business relies on third parties to distribute its insurance products, and any adversity with its third-party distributors could have a material adverse effect on our insurance business. Since Global Atlantic does not have captive or proprietary distribution or engage in direct sales, if Global Atlantic's products are not retained on or added to the platforms of its distribution partners, sales of Global Atlantic's products may be materially reduced. Global Atlantic relies on banks, broker-dealers, insurance agencies and independent agents to distribute its retirement and traditional life insurance products, including preneed. Global Atlantic's distribution partners are not captive and may sell retirement and life insurance products of Global Atlantic's competitors. If Global Atlantic's competitors offer products that are more attractive, pay higher commission rates to the sales representatives or offer a better service experience, these representatives may concentrate their efforts in selling Global Atlantic's competitors' products. Global Atlantic competes with other insurance companies to place products with distribution partners. Key distribution partners may merge, change their business models in ways that affect how Global Atlantic's products are sold, or terminate their distribution contracts with Global Atlantic, or new distribution channels could emerge and adversely impact the effectiveness of Global Atlantic's distribution efforts. Consolidation of distributors and/or other industry changes may increase competition for access to distributors and increase the likelihood of products being dropped from a distributor or that distributors will try to renegotiate the terms of any existing selling agreements to terms less favorable to Global Atlantic. Distribution partners may also stop offering one or more of Global Atlantic's products, for a period of time or permanently, for a variety of reasons, including Global Atlantic's financial strength pricing or servicing. If any one of such distributors were to terminate its relationship with Global Atlantic or reduce the amount of sales which it produces, our insurance business would likely be adversely affected. In addition, some of Global Atlantic's distribution partners and potential partners use proprietary or third-party scoring systems in determining which products to sell. If Global Atlantic's scores fall to levels unacceptable to its distribution partners, they may no longer distribute Global Atlantic's products to their customers, which would have a negative impact on our insurance business. If Global Atlantic is unable to place its products or retain its products on the platforms of distribution partners, we may be materially and adversely affected.
In instances where we hold assets at a prime broker and/or custodian, in the event of the insolvency of such entity, our investment vehicles may not be able to recover equivalent assets in full as they will rank among the prime broker's and custodian's unsecured creditors in relation to assets that the prime broker or custodian borrows, lends or otherwise uses. In addition, our and our investment vehicles’ cash held with a prime broker or custodian may not be segregated from the prime broker's or custodian's own cash, and our investment vehicles therefore may rank as unsecured creditors in relation to that cash. The inability to recover assets from the prime broker or custodian could have a material adverse impact on the performance of our investment vehicles and our financial results.
Furthermore, we rely on individual consultants and other contingent workers, who are not our employees but work directly in our business alongside our employees. Certain aspects of our business also depends on the efforts, skills, reputations, and business contacts, and conduct of these consultants and other contingent workers, sometimes to the same extent as our employees. We expect to continue to rely on the engagement of consultants and other contingent workers to service important aspects of our business, and our failure to retain them or to find their replacements could adversely impact KKR. In addition, even though these consultants and other contingent workers are not our employees, there are circumstances when their misconduct could adversely impact KKR to the same degree as if they were our employees. The risks of having such consultants and other contingent workers as integral parts of our business are similar to the risks for employees as discussed in “—Risks Related to Our Business—We depend on the efforts, skills, reputations, business contacts, and conduct of our employees and our ability to retain our employees and to recruit prospective employees.”
Cyber-security failures and data security breaches may disrupt or have a material adverse impact on our businesses, operations and investments.
Our investment vehicle investors, stockholders, regulators and other stakeholders are increasingly focused on cybersecurity risk management. In today’s current threat landscape, we are continuously facing various security threats on a regular basis, including ongoing cybersecurity threats to and attacks on our information technology infrastructure that are intended to gain access to our proprietary information, destroy data or disable, degrade or sabotage our systems. The risk of a security breach or disruption, particularly through accidental actions or omissions by trusted insiders, cyber-attacks or cyber intrusions, including by computer hackers, viruses, foreign governments, and cyber terrorists, has increased as the number, intensity, and sophistication of attempted attacks and intrusions from around the world have increased. Although we take protective measures and endeavor to modify them as circumstances warrant, our computer systems, software and networks may be vulnerable to unauthorized access, theft, misuse, computer viruses or other malicious code, and other events that could have a security impact (including the deployment of harmful malware, ransomware, denial-of-service attacks, social engineering, and other means to affect service reliability and threaten the confidentiality, integrity, and availability of information). We may be exposed to more significant risk if these acts are taken by state actors. Our employees have been and expect to continue to be the target of fraudulent calls and emails, and the subject of impersonations and fraudulent requests for money, such as attempts to redirect material payment amounts in a transaction to a fraudulent bank account, and other forms of activities. These same cybersecurity
61
breaches, cyber-attack and cyber intrusions could also be employed against our various stakeholders or other third parties, including to impersonate KKR or its employees, which could cause similar security impacts to our stakeholders and other third parties and materially and adversely impact us or our investment vehicles. Cyber-criminals may attempt to redirect payments required to be paid at the closings of our investments to unauthorized accounts, which we or the services providers we retain, like administrators, paying agents and escrow agents, may not be able to detect or protect against. The costs related to cyber or other security threats or disruptions may not be fully insured or indemnified by others, including by our service providers.
Cybersecurity has become a top priority for regulators around the world. Rapidly developing and changing cybersecurity laws and regulations could further increase compliance costs and subject us to enforcement risks and reputational damage. Many jurisdictions in which we operate have laws and regulations relating to data privacy, cybersecurity and protection of personal information, including the U.K.’s Data Protection Act 2018, the European General Data Protection Regulation (“GDPR”) that became effective in May 2018, the E.U.’s Digital Operational Resilience Act, which became effective in January 2023 and will apply from January 2025, the Gramm-Leach-Bliley Act of 1999 as amended in June 2023 and the California Consumer Privacy Act (“CCPA”) that became effective in January 2020 and is amended by the California Privacy Rights Act (“CPRA”), which became operative in January 2023. The CPRA imposed additional obligations on companies covered by the legislation, including by expanding consumers’ rights with respect to certain sensitive personal information. The CPRA also creates a new state agency that is vested with authority to implement and enforce the CCPA and the CPRA. Global Atlantic is subject to the New York State Department of Financial Services (“NYSDFS”) cybersecurity regulation. On November 1, 2023, the NYSDFS finalized amendments to its cybersecurity regulations effective in April 2024 (the “NYSDFS Cybersecurity Amendments”), which, among other things, would impose additional governance requirements, require the implementation of additional safeguards, impose various requirements on larger companies, require new and increased obligations related to written policies and procedures, heighten requirements around audits and risk assessments, and necessitate additional reporting requirements for cybersecurity incidents. More specifically, the NYSDFS Cybersecurity Amendments would also (i) establish and maintain a cybersecurity program designed to ensure the confidentiality, integrity and availability of their information systems; (ii) implement and maintain a written cybersecurity policy setting forth policies and procedures for the protection of their information systems and nonpublic information; and (iii) review and update any risk assessments at least annually, as well as whenever a change in the business or technology causes a material change to cyber risk.
Furthermore, the SEC has underscored its focus on cybersecurity. In July 2023, the SEC adopted new cybersecurity disclosure rules, aimed at enhancing and standardizing disclosures made by public companies regarding cybersecurity risk management, strategy, governance and incident reporting. Some jurisdictions have also enacted laws requiring companies to notify individuals of data security breaches involving certain types of personal data. In February 2022, the SEC also proposed similar cybersecurity regulations for regulated investment advisers. If adopted in its proposed form, the proposed rule would require implementation of written cybersecurity policies and procedures to address cybersecurity risk in addition to requiring registered investment advisers to report significant cybersecurity incidents affecting the investment adviser or the investment vehicles it advises within 48 hours to the SEC, and would impose a new recordkeeping policy and internal review requirements related to cybersecurity. If this proposal is adopted, it could increase our compliance costs and potential regulatory liability related to cybersecurity. The SEC has also proposed a similar cybersecurity rule for broker-dealers and other security market participants which would require subject entities to implement policies and procedures that are reasonably designed to address their cybersecurity risks and, at least annually, review and assess the design and effectiveness of their cybersecurity policies and procedures, including whether they reflect changes in cybersecurity risk over the time period covered by the review. Many regulators have indicated an intention to take more aggressive enforcement actions regarding cybersecurity matters, and private litigation resulting from such matters is increasing and resulting in progressively larger judgments and settlements.
We cannot assure you that our cyber risk management efforts and our investment in information technology will prevent significant breakdowns, data leakages, breaches in our systems, or those of our third-party vendors and other contractors and consultants, or other cyber incidents that could have a material adverse effect upon our reputation, business, operations, or financial condition. The techniques used by cyber criminals change frequently, may not be recognized until launched, and can originate from a wide variety of sources, including outside groups such as external service providers, organized crime affiliates, terrorist organizations, hostile foreign governments or agencies, or cybersecurity researchers. Breaches in security could potentially jeopardize our, our employees’, our investment vehicle investors’, insurance policyholders’ or our counterparties’ confidential and other information processed and stored in, and transmitted through, our computer systems and networks, or otherwise cause interruptions or malfunctions in our, our employees’, our investment vehicle investors’, insurance policyholders’, our counterparties’ or third parties’ operations, which could result in significant losses, increased costs, disruption of our business, liability to our investment vehicle investors and other counterparties, regulatory intervention or reputational damage. Furthermore, if we experience a cybersecurity incident and fail to comply with the relevant notification laws and regulations, it could result in regulatory investigations and penalties, which could lead to negative publicity and may cause our investment vehicle investors and clients to lose confidence in the effectiveness of our security measures.
62
Our third-party service providers could also experience, and recently have experienced, any of the above cybersecurity threats, fraudulent activities or security breaches, and as a result, unauthorized individuals could improperly gain access to our confidential data through such third parties. Any interruption or deterioration in the performance of these third parties or cybersecurity incidents involving these third parties could impair the quality of our and our investment vehicles’ operations and could impact our reputation and materially and adversely affect us. We may also have insufficient recourse against such third parties and may have to expend significant resources to mitigate the impact of such an event, and to develop and implement protections to prevent future events of this nature from occurring.
Our portfolio companies also rely on data processing systems and the secure processing, storage and transmission of information, including payment and health information. A disruption or compromise of these systems could have a material adverse effect on the value of these businesses. Our investment vehicles may also invest in strategic assets having a national or regional profile or in infrastructure, the nature of which could expose them to a greater risk of being subject to a terrorist attack or security breach than other assets or businesses. Such an event may have material adverse consequences on our investment or assets of the same type or may require portfolio companies to increase spending on preventative security measures or insurance coverage.
Artificial intelligence could increase competitive, operational, legal and regulatory risks to our businesses in ways that we cannot predict.
The use of artificial intelligence by us and others, and the overall adoption of artificial intelligence throughout society, may exacerbate or create new and unpredictable competitive, operational, legal and regulatory risks to our businesses. There is substantial uncertainty about the extent to which artificial intelligence will result in dramatic changes throughout the world, and we may not be able to anticipate, prevent, mitigate, or remediate all of the potential risks, challenges, or impacts of such changes. These changes could potentially disrupt, among other things, our business models, investment strategies, operational processes, and our ability to identify and hire employees. Some of our competitors may be more successful than us in the development and implementation of new technologies, including services and platforms based on artificial intelligence, to address investor demands or improve operations. If we are unable to adequately advance our capabilities in these areas, or do so at a slower pace than others in our industry, we may be at a competitive disadvantage.
If the data we, or third parties whose services we rely on, use in connection with the possible development or deployment of artificial intelligence is incomplete, inadequate or biased in some way, the performance of our products, services, and businesses could suffer. In addition, we analyze data through different means, including manual reviews, automated rules as well as the use of artificial intelligence and machine learning technologies to better manage our business. Recent technological advances in artificial intelligence and machine-learning technology both present opportunities and pose risks to us. Data in technology that uses artificial intelligence may contain a degree of inaccuracy and error, which could result in flawed algorithms in various models used in our businesses. Our personnel or the personnel of our service providers could, without being known to us, improperly utilize artificial intelligence and machine learning-technology while carrying out their responsibilities. This could reduce the effectiveness of artificial intelligence technologies and adversely impact us and our operations to the extent that we rely on the work product of such artificial intelligence in such operations.
There is also a risk that artificial intelligence may be misused or misappropriated by our employees or third parties engaged by us. For example, a user may input confidential information, including material non-public information or personally identifiable information, into artificial intelligence applications, resulting in such information becoming a part of a dataset that is accessible by third party technology applications and users, including our competitors. Further, we may not be able to control how third-party artificial intelligence that we choose to use are developed or maintained, or how data we input is used or disclosed, even where we have sought contractual protections with respect to these matters. The misuse or misappropriation of our data could have an adverse impact on our reputation and could subject us to legal and regulatory investigations or actions or create competitive risk.
In addition, the use of artificial intelligence by us or others may require compliance with legal or regulatory frameworks that are not fully developed or tested, and we may face litigation and regulatory actions related to our use of artificial intelligence. There has been increased scrutiny, including from global regulators, regarding the use of "big data," diligence of data sets and oversight of data vendors. Our ability to use data to gain insights into and manage our business may be limited in the future by regulatory scrutiny and legal developments. See also “—Risks Related to Our Business—Rapidly developing and changing global privacy and data laws and regulations could further increase compliance costs and subject us to enforcement risks and reputational damage” and “—Risks Related to Our Business—Cyber-security failures and data security breaches may disrupt or have a material adverse impact on our businesses, operations and investments.”
63
Rapidly developing and changing global privacy and data laws and regulations could further increase compliance costs and subject us to enforcement risks and reputational damage.
We and our portfolio companies are subject to various risks and costs associated with the collection, processing, storage and transmission of personal information and other sensitive and confidential information. This data is wide ranging and relates to our investors, employees, insurance policyholders, contractors and other counterparties and third parties. Any inability, or perceived inability, by us or our portfolio companies to adequately address privacy concerns, or comply with applicable privacy laws, regulations, policies, industry standards and guidance, related contractual obligations, or other privacy legal obligations, even if unfounded, could result in significant regulatory and third party liability, increased costs, disruption of our and our portfolio companies’ business and operations, and a loss of investment vehicle investor confidence and other reputational damage.
Our employees (and, in certain cases, third-party service providers) have access to, and process, personal information of our investors, insurance policyholders, employees, contractors and other counterparties and third parties through a variety of media, including information technology systems. Our and our third-party service providers’ information systems and technology may not be able to adequately protect the information of our investors, employees, insurance policyholders, contractors and other counterparties and third parties, may not be suitable for new products and strategies and may be subject to security risks. We rely on various internal processes and controls to protect the confidentiality of client information that is accessible to, or in the possession of, us, our employees and certain vendors and third-party administrators. It is possible that an employee could, intentionally or unintentionally, disclose or misappropriate confidential client information or our data could be the subject of a cybersecurity attack. Our third-party administrators and their employees also have access to, and routinely process, personal information of our investors, employees, insurance policyholders, contractors and other counterparties and third parties, and we are also dependent on such third parties and their systems to protect such data. If we or one of our subsidiary’s employees, or one of our or a subsidiary’s third-party vendors or administrators’ employees, unintentionally share confidential client information or such information as a result of a cybersecurity attack or otherwise, we may be unable to control or mitigate this occurrence even if we offer remediation, such as credit monitoring, to the impacted parties. Misappropriation or intentional or unintentional inappropriate disclosure or misuse of client confidential information could occur even if individuals are properly trained and adequate internal controls and policies and procedures are maintained.
Pursuant to U.S. federal and state laws, various government agencies have established rules protecting the privacy and security of personal information. We and our portfolio companies may be required to comply with both U.S. federal and state laws and regulations related to privacy. For example, the CCPA provides for enhanced consumer protections for California residents, a private right of action for data breaches of certain personal information and statutory fines and damages for such data breaches or other CCPA violations, as well as a requirement of “reasonable” cybersecurity. The CCPA was expanded on January 1, 2023, when the CPRA amendments to the CCPA became operative. Additional U.S. states have passed their own comprehensive consumer privacy laws, some of which went into effect in 2023 or will go into effect in 2024, and other states are considering doing so. These state laws may expand our compliance obligations and impact our business or the businesses of our portfolio companies. Most states have enacted laws to which we are subject, and which vary significantly from jurisdiction to jurisdiction, to safeguard the privacy and security of personal information. Global Atlantic, in particular, processes sensitive personal information of its policyholders, which exposes Global Atlantic to heightened risk. Global Atlantic is subject to the NYSDFS cybersecurity regulation. The NYSDFS Cybersecurity Amendments significantly expand the regulation by the NYSDFS of data privacy matters. Global Atlantic is also subject to the California Consumer Privacy Act. At the U.S. federal level, we are subject to the Gramm-Leach-Bliley Act of 1999 as amended in June 2023, which imposes privacy requirements on financial institutions, including obligations to protect and safeguard consumers’ nonpublic personal information and records, and limits the ability to share and reuse such information. In March 2023, the SEC proposed amendments to Regulation S-P, its rules implementing The Gramm-Leach-Bliley Act, which, if adopted, would require broker-dealers, registered investment companies and investment advisers to adopt written policies and procedures creating an incident response program to deal with unauthorized access to customer information, including procedures for notifying persons affected by the incident within 30 days.
In addition, we and our portfolio companies are required to comply with certain non-U.S. privacy laws, including, for example, the GDPR and UK Data Protection Act, as well as laws in other jurisdictions globally. Global laws in this area are rapidly increasing in the scale and depth of their requirements and are also often extra-territorial in nature. In addition, a wide range of regulators and private actors are seeking to enforce these privacy laws with increased scrutiny and growing penalties, including across regions and borders. Furthermore, we frequently have privacy compliance requirements because of our contractual obligations with counterparties. As new privacy-related laws and regulations are implemented, the time, cost and resources needed for us and our portfolio companies to comply with such laws and regulations continues to increase. These legal, regulatory, and contractual obligations heighten our privacy obligations in the ordinary course of conducting our business in the U.S. and internationally. Furthermore, failure to comply with U.S. and foreign privacy, data protection, and data security
64
laws and regulations could result in government investigations or enforcement actions (which could include civil or criminal penalties), private litigation, claims, or public statements against us or adverse publicity. Claims that we have violated individuals’ privacy rights, failed to comply with privacy, data protection, and data security laws, or breached our contractual obligations, even if we are not found liable, could be expensive and time consuming to defend, could result in adverse publicity and could have a material adverse effect on us. Many regulators have indicated an intention to take more aggressive enforcement actions regarding data privacy matters, and private litigation resulting from such matters is increasing and resulting in progressively larger judgments and settlements.
Regulators are also increasing scrutiny and considering, and in some cases enacting, regulation of the use of artificial intelligence technologies. In April 2023, the U.S. Federal Trade Commission (“FTC”), DOJ, CFPB, and EEOC released a joint statement on artificial intelligence, demonstrating their interest in monitoring the development and use of automated systems and enforcement of their respective laws and regulations. In October 2023, the Biden Administration passed an executive order on Safe, Secure, and Trustworthy Artificial Intelligence which establishes new standards for AI safety and security. The NAIC has established a dedicated working group and adopted bulletins and reports on the use of artificial intelligence by insurers. Existing laws and regulations may be interpreted in new ways, which would affect the way in which we or our portfolio companies use artificial intelligence and machine learning technology. In addition to the U.S. regulatory framework, the EU is in the process of finalizing a new regulation on artificial intelligence (the "EU AI Act"), parts of which are slated to take effect from late 2024. The EU AI Act is a legal framework, which will govern the development and deployment of artificial intelligence placed on the EU market, used in the EU, or where the output is used or intended to be used within the EU. The framework is expected to ban certain uses of artificial intelligence outright and impose material obligations on both the providers and deployers of certain other artificial intelligence activities. The fine threshold for non-compliance is expected to be 35 million euros or 7% of total annual worldwide turnover, whichever is higher, and regulators are expected to have powers to remove non-compliant products from the EU market. Other jurisdictions, such as Canada and Brazil, are also considering similar legal frameworks.
Once effective, regulations relating to artificial intelligence may expand our compliance obligations and impact our business or the business of our portfolio companies. In July 2023, the SEC proposed new predictive data analytics rules, which would require registered investment advisers (and broker-dealers) to eliminate or neutralize (rather than just disclosing and mitigating) certain conflicts of interest posed by covered technologies including artificial intelligence and machine-learning, with respect to their interactions with clients and investors in pooled investment vehicles. In order to limit their potential liability under this rule, our investment adviser entities could choose to change or discontinue some of their activities related to such technologies. We cannot predict what, if any, actions may be taken, but such developments could have a materially adverse impact to us.
We may expand into new investment strategies, geographic markets and businesses and new types of investors or seek to expand our business or change our strategic focus with new strategic initiatives, which may result in additional risks and uncertainties in our businesses.
Our organizational documents do not limit our ability to enter into new lines of business, and we may expand into new investment strategies, geographic markets, businesses, types of investors and investment products. We intend to seek to grow our businesses by increasing AUM in existing businesses, pursuing new investment strategies (including investment opportunities in new asset classes), developing new types of investment structures and products (such as publicly listed vehicles, separately managed accounts and structured products), expanding into new geographic markets and businesses and seeking investments from investor bases we have traditionally not pursued, such as individual investors, which subject us to additional risk. See also “—Risks Related to Our Business—Certain types of investment vehicles, especially those offered to individual investors, may subject us to a variety of risks, including new and greater levels of public and regulatory scrutiny, regulation, risk of litigation and reputational risk, which could materially and adversely affect us.” We have in the past opened many offices to conduct our asset management and capital markets businesses around the world in Europe, the Middle East and Asia-Pacific, which we intend to grow and expand. We have also launched a number of new investment initiatives in various asset classes or geographies, such as climate investments and infrastructure investments in the Asia-Pacific region, and increasingly manage investment vehicles owned by individual investors, which subject us to additional risk. Introducing new types of investment structures and products could increase the complexities involved in managing such investments, including ensuring compliance with applicable regulatory requirements and terms of the investment vehicles.
65
Our organic growth strategy focuses on providing resources to foster business expansion, such that we achieve a level of scale and profitability. Given our diverse platform, these initiatives could create conflicts of interests with existing products, increase our costs and expose us to new market risks, and legal and regulatory requirements. The success of our organic growth strategy will also depend on, among other things, our ability to correctly identify and create products that appeal to the limited partners of our funds and vehicles. While we have made significant expenditures to develop these new strategies and products, there is no assurance that they will achieve a satisfactory level of scale and profitability.
We have and may continue to pursue growth through acquisitions of, or investments in, new businesses, other investment management companies, acquisitions of critical business partners, strategic partnerships, other alternative or traditional investment managers, or other strategic initiatives which also may include entering into new lines of business. In addition, we expect opportunities will arise to acquire other alternative or traditional investment managers. For example, in April 2022, we expanded into the Japanese real estate market by acquiring KJRM, a Japanese real estate asset manager. In February 2021, we expanded into the insurance business by acquiring a majority controlling equity interest in Global Atlantic before acquiring the remaining minority equity interest in January 2024 to make Global Atlantic a wholly owned subsidiary. For further detail on the challenges and risks related to this acquisition, see “—Risks Related to Our Insurance Activities—The Global Atlantic acquisition may not achieve its intended benefits, and certain difficulties, costs or expenses may outweigh such intended benefits.”
Contemporaneously with the November 2023 announcement of our agreement to acquire the remaining equity interests in Global Atlantic, we announced a series of other strategic initiatives, which became effective with the January 2024 closing of the Global Atlantic transaction. These strategic initiatives are expected to be implemented in the first quarter of 2024 and include (i) creating a new business segment, Strategic Holdings, (ii) modifying KKR’s compensation structure to allocate a greater percentage to carried interest and a lesser percentage to fee-related earnings, and (iii) introducing a new reporting framework called “Total Operating Earnings.” We currently believe that we will receive stable recurring revenues from our expectations that a larger percentage of our earnings will shift to what we consider to be more stable recurring revenues related to our increased ownership interest in Global Atlantic and our future growth expectations over time in dividend payments from portfolio companies included in our new Strategic Holdings segment. However, these are our current expectations and not a guarantee that they will be realized as currently expected or be as accretive to our earnings as we currently believe they will be. Investors should consider the risks related to the implementation of these strategic initiatives. For example, expected dividend amounts and investment returns in the new business segment Strategic Holdings may be materially less than our current expectations or not materialize at all, and the volatility of employee compensation as a result of the modification of our compensation framework could impact our ability to hire, retain, and motivate our employees whom we are dependent on. See "—Risks Related to Our Business—We depend on the efforts, skills, reputations, business contacts, and conduct of our employees and our ability to retain our employees and to recruit prospective employees." In addition, we may not achieve some or all of the expected benefits of our ownership, as of January 2, 2024, of 100% of Global Atlantic. See "—Risks Related to Our Insurance Activities—The Global Atlantic acquisition may not achieve its intended benefits, and certain difficulties, costs or expenses may outweigh such intended benefits."
To the extent we make strategic investments or acquisitions, undertake other strategic initiatives, expand into new investment strategies or geographic markets, or enter into a new line of business, we will face numerous risks and uncertainties, including risks associated with:
•the required investment of capital and other resources;
•delays or failure to complete an acquisition or other transaction in a timely manner or at all, which may subject us to damages or require us to pay significant costs;
•lawsuits challenging an acquisition or unfavorable judgments in such lawsuits, which may prevent the closing of the transaction, cause delays, or require us to incur substantial costs including in costs associated with the indemnification of directors;
•the failure to realize the anticipated benefits from an acquired business or strategic partnership in a timely manner, if at all;
•combining, integrating or developing operational and management systems and controls, including an acquired business's internal controls and procedures;
•integration of the businesses, including the employees of an acquired business;
66
•disagreements with joint venture partners or other stakeholders in our hedge fund partnerships and our strategic partnerships;
•the additional business risks of the acquired business and the broadening of our geographic footprint;
•properly managing conflicts of interests;
•our ability to obtain requisite regulatory approvals and licenses without undue cost or delay and without being required to comply with material restrictions or material conditions that would be detrimental to us or to the combined organization;
•our ability to comply with new regulatory regimes; and
•becoming subject to new laws and regulations with which we are not familiar, or from which we are currently exempt, that may lead to increased litigation and regulatory risk and costs.
Our liquidity, business, results of operations and financial condition could be materially and adversely affected if we fail to manage our balance sheet commitments.
Our balance sheet assets provide us with a significant source of capital to grow and expand our business, increase our participation in our transactions and underwrite commitments in our capital markets business. We have used our balance sheet assets to underwrite loans, securities or other financial instruments, which we generally expect to syndicate to third parties. We have also entered into arrangements with third parties that reduce our risk associated with holding unsold securities when underwriting certain debt transactions, which enables our capital markets business to underwrite a larger amount. To the extent that we are unable to syndicate our commitments to third parties or our risk reduction arrangements do not fully perform as anticipated, we may be required to sell such investments at a significant loss or hold them indefinitely. If we are required to retain investments on our balance sheet for an extended period of time, our results would be directly impacted by the performance of such investments and it would also impair our capital markets business' ability to complete additional transactions, either of which could materially and adversely affect us.
We generally have a larger balance sheet than many of our competitors, and consequently, the performance of these balance sheet assets has a greater impact on our results of operations. In particular, during a period when our balance sheet assets are concentrated in a limited number of investments, results from a small number of investments can have a significant impact on our balance sheet performance. Our success in deploying our balance sheet assets and generating returns on this capital, particularly as it relates to our new expected business segment, Strategic Holdings (the performance of which depends on the investment performance, and dividends of, many of our balance sheet assets), will depend, among other things, on the availability of suitable opportunities after giving priority in investment opportunities to our advisory clients, the level of competition from other companies that may have greater financial resources and our ability to value potential development or acquisition opportunities accurately and negotiate acceptable terms for those opportunities. The success of our new Strategic Holdings segment will be dependent on the success of our balance sheet strategy.
Our balance sheet assets have been a significant source of capital for new strategies and products. To the extent that such strategies or products are not successful, or our balance sheet assets cease to provide adequate liquidity, we would realize losses on our balance sheet investments or become limited in our ability to seed new businesses or support our existing business as effectively as contemplated. For example, we may acquire investments using our balance sheet capital and warehouse these investments while fundraising a particular investment vehicle. We expect our balance sheet capital to be returned to us if such investment vehicle has a successful fundraise. However, if the fundraising is not successful, or if investment vehicle investors are not willing to pay for these warehoused investments, then this may materially and adversely affect KKR, including by potentially realizing losses on these warehoused investments.
We have developed and completed several structured transactions in which our balance sheet provides subordinated or equity financing and third-party investors provide senior financing to an investment vehicle that invests in our investment vehicles and certain other investment assets. We have also entered into a similarly structured transaction where the cash flows of our balance sheet's capital commitments to our investment vehicles have been effectively pledged as collateral for the investment vehicle. In addition to the increased operational complexity and cost that arise from the structure and bespoke terms of these transactions, because of the subordinated nature of KKR's interests, we are at risk of losing all of our interests in these transactions ahead of any third party if the investments do not perform as expected. See Note 24 “Commitments and Contingencies—Funding Commitments and Others” for total balance sheet investments made by KKR in these structured transactions and for the amount we have agreed to invest or otherwise be liable for and/or to provide liquidity upon certain termination events (the maximum amount of which is currently unknown).
67
Extensive regulation of our businesses affects our activities and creates the potential for significant liabilities and penalties, which could materially and adversely affect KKR.
Our business is subject to extensive regulation, legislative focus and regulatory scrutiny, and our compliance with laws and regulations is subject to frequent examinations, inquiries and investigations by U.S. federal and state as well as non-U.S. governmental agencies and regulators and self-regulatory organizations in the various jurisdictions in which we operate around the world. See Note 24 "Commitments and Contingencies—Litigation" in our financial statements for a description of certain pending matters.
Any of these governmental and regulatory authorities may challenge our and our employees’ compliance with any applicable laws and regulations, and we and our employees could become subject to civil or criminal proceedings brought by them for such noncompliance. Many of these regulators are empowered to impose fines, penalties, restrictions on activities, suspensions of personnel or other sanctions, including censure, the issuance of cease-and-desist orders or the suspension or expulsion of applicable licenses, authorizations and memberships. Any resolution of claims brought by a governmental and regulatory authority may, in addition to the imposition of significant monetary penalties, require an admission of wrongdoing or include adverse limitations or prohibitions on our ability to conduct our business. Even if a sanction is not imposed, or a sanction imposed against us or our personnel by a regulator were small in monetary amount, the adverse publicity relating to the regulatory activity or imposition of these sanctions could be significant.
Any of the foregoing consequences or events may damage our relationships with existing and potential investors in our publicly traded stock, our investment vehicles or our insurance products, impair our ability to raise capital for our investment vehicles, impair our ability to carry out investment activities, impair our ability to conduct our insurance business, and contravene provisions concerning compliance with laws and regulations in the agreements to which we are a party. In addition, as discussed further below, certain events could disqualify KKR from relying on private placement exemptions from registration under the Securities Act, which would materially and adversely affect our ability to raise financing for KKR and our ability to conduct our capital markets business. Moreover, any of these governmental or regulatory actions could also lead to increased exposure to: other allegations, examinations, inquiries or investigations by other U.S. and non-U.S. governmental and regulatory agencies on related or unrelated matters, civil litigation by our stockholders, fund investors, or other third parties, or could have other negative effects, which could materially and adversely affect us.
The private equity industry has been and continues to be under intense regulatory and news media scrutiny with governmental officials and regulators focusing on the private equity industry's fees, the taxation of its investments, business practices, antitrust compliance and operations of its portfolio companies, conflicts of interest, and other issues. In particular, the SEC's areas of focus on private equity firms have included, among others, fiduciary duty and compliance programs, conflicts of interest allocation of investment opportunities, the allocation of fees and expenses, including the acceleration of monitoring fees and the allocation of broken-deal and other expenses, valuation practices, the disclosure, use and compensation of operating partners or consultants as well as third-party compliance or similar service providers, outside investment and business activities of firm principals and employees, group purchasing arrangements, disclosure of affiliated service providers, disclosure of conflicts of interest and investment risks, adherence to notice, consent and other contractual requirements, electronic communications, cyber-security, data privacy and protection, the use of purchased data, valuation, retail investors, foreign bribery and corruption, and policies covering custody, auditing, handling of material nonpublic information, insider trading, business continuity and transition planning, conflicts of interest relating to liquidity, such as certain adviser-led fund restructurings, as well as private fund advisers' portfolio strategies, risk management, and investment recommendations and allocations.
Certain Recent and Potential Regulatory Developments
•In October 2023, the U.S. Department of Labor proposed a rule that, if finalized, would materially increase the likelihood that a fund sponsor could inadvertently become a fiduciary to plans governed by The Employee Retirement Income Security Act of 1974 ("ERISA"), individual retirement accounts (“IRAs”) within the meaning of Section 4975 of the Code, and similar plans, by reason of being deemed to have rendered investment advice in the context of fundraising and investor engagement. The proposal broadly applies to any communication made to ERISA-governed plans, IRAs, and their fiduciaries that would reasonably be viewed as a suggestion that the plan engage in, or refrain from taking, a particular course of action, and, therefore, may potentially create a fiduciary relationship between the fund sponsor and an ERISA plan or IRA for purposes of that communication. In the event that the fund sponsor was deemed to be an investment advice fiduciary, such fund sponsor would generally need to satisfy a complicated exemption to avoid a self-dealing prohibited transaction under ERISA and the Code.
68
•In August 2023, the SEC adopted new rules and amendments to existing rules under the Investment Advisers Act of 1940 (the “Advisers Act”) (collectively, the “Private Fund Adviser Rules”), which includes, among other things, requiring registered investment advisers, like KKR, to: (i) prepare and distribute to private fund investors quarterly statements containing detailed information about compensation, fees and expenses, portfolio investments, and performance; obtain an annual audit for the private funds that they manage; and require registered advisers to obtain a fairness or valuation opinion and make certain disclosures in connection with adviser-led secondary transactions; (ii) be restricted from engaging in various practices unless they satisfy specified disclosure requirements and, in some cases, consent requirements, including charging various fees and borrowing money from a private fund client; (iii) be prohibited from providing preferential treatment to investors with regard to liquidity and information rights unless certain conditions are met; and (iv) retain certain records evidencing their compliance with the rules. The compliance dates for the Private Fund Adviser Rules are generally in September 2024 or March 2025, although the rules are being challenged in court by various private fund industry organizations. While the full extent of the Private Funds Adviser Rules’ impact cannot yet be determined, it is generally anticipated that they will have a significant effect on private fund advisers and their operations, including by increasing regulatory and compliance costs and burdens and heightening the risk of regulatory action.
•In May 2023, the SEC adopted changes to Form PF, a confidential form relating to reporting by private funds, which expands existing reporting obligations by requiring large hedge fund advisers to make a filing within 72 hours of certain current reporting events and large private equity fund advisers to provide additional information regarding general partner clawbacks and fund strategy and borrowing in their annual Form PF filings. The compliance dates for these expanded Form PF reporting requirements are in December 2023 and June 2024. In addition, in February 2024, the SEC and the Commodity Futures Trading Commission (“CFTC”) jointly adopted amendments to Form PF that expand the information that private fund advisers must provide in their Form PF filings. The compliance date for these joint amendments is expected to be in the first half of 2025. The SEC has also adopted new and amended rules applicable to KKR and/or its investment advisory and other entities that, among other things, shorten the deadlines for filing beneficial ownership reports with the SEC, require annual reporting of votes on say-on-pay proxy matters, and increase reporting of short positions in equity securities.
•The FTC and the Antitrust Division of the U.S. Department of Justice ("DOJ") have recently announced a number of initiatives and policy shifts to increase antitrust enforcement in the United States, where we and many of our portfolio companies conduct business. For example, on December 18, 2023, the FTC and the DOJ jointly issued the final updated Merger Guidelines, which describe and guide FTC and DOJ’s review of mergers and acquisitions under the federal antitrust laws. These Merger Guidelines reflect the U.S. government’s commitment to rigorous and aggressive antitrust enforcement practices. DOJ enforcement of Section 8 has resulted in a number of director resignations from companies (including private equity investments) since the effort began in October 2022. Across all areas of antitrust enforcement, FTC and DOJ officials have explicitly identified the private equity industry an area of focus. The increased scope and vigor of antitrust regulation and enforcement could impact our business, the investment activities of us and our funds and the businesses of our portfolio companies. These initiatives are consistent with statements by officials from both the FTC and the DOJ's Antitrust Division, including the May 2023 statement by DOJ Assistant Attorney General Jonathan Kanter that the enforcement of Section 8 will continue to be a focus for DOJ. In prior years, for example, in speeches in June and September 2022, in highlighting enforcement priorities, a DOJ Antitrust Division official stated that the DOJ is reviewing whether companies including private equity are fully complying with obligations with respect to merger filings under the Hart-Scott-Rodino ("HSR") Act. In November 2022, the FTC issued a policy statement regarding the scope of unfair methods of competition under Section 5 of the Federal Trade Commission Act, declaring that Section 5 reaches beyond the Sherman and Clayton Acts to encompass various types of unfair conduct that tend to negatively affect competition conditions, including private equity roll ups, price discrimination, interlocking directorates, and non-compete agreements. The FTC also announced in September 2022 that it would increase enforcement of the Robinson Patman Act, which targets price discrimination, across all industries. Please see Note 24 "Commitments and Contingencies—Litigation" in our financial statements for further information with respect to the DOJ’s antitrust investigations pending against us.
69
•In September 2022, the SEC announced charges against 15 broker-dealers and one affiliated investment adviser for failures by those firms and their employees to maintain and preserve required electronic communications. The firms agreed to pay combined penalties of more than $1.1 billion and agreed to implement improvements to their compliance policies and procedures to settle these matters. In 2023 and 2024, over 40 broker-dealers, investment advisory firms and/or credit rating agencies also agreed to penalties and agreed to implement improvements to their compliance policies and procedures to settle these matters. A failure by KKR to maintain and preserve required electronic communications could result in further regulatory investigations, charges, penalties and potential disqualifications, as KKR and certain other alternative asset managers and investment advisers are presently subject to inquiries by the SEC related to business-related electronic communications. Please see Note 24 "Commitments and Contingencies—Litigation" in our financial statements for further information with respect to the SEC’s pending investigations against KKR.
•The SEC's amended rule for investment adviser marketing became effective in November 2022. The rule increases regulatory obligations and imposes more prescriptive requirements on investment advisers' marketing activities, including prohibitions on advertisements that are misleading or contain material statements that an investment adviser cannot substantiate, as well as requirements for performance advertising and the use of placement agent arrangements. The rule impacts the marketing of certain of our funds and other investment advisory functions both within and outside of the United States.
•On February 15, 2023, the SEC proposed amendments to the custody rule for SEC-registered investment advisers. If adopted, the amendments would require, among other things, the adviser to: obtain certain contractual terms from each advisory client’s qualified custodian; document that privately offered securities cannot be maintained by a qualified custodian; and promptly obtain verification from an independent public accountant of any purchase, sale or transfer of privately offered securities. The amendments also would apply to all assets of a client, including real estate and other assets that generally are not considered securities under the federal securities laws. If adopted, these amendments could expose our registered investment advisers to additional regulatory liability, increase compliance costs, and impose limitations on our investing activities.
•On October 26, 2022, the SEC proposed a new rule and related amendments to prohibit SEC-registered investment advisers from outsourcing certain services or functions to service providers without meeting certain requirements, including substantial diligence and monitoring obligations.
On August 13, 2022, the National Association of Insurance Commissioners (“NAIC”) Executive Committee and Plenary adopted a list of “Regulatory Considerations Applicable (But Not Exclusive) to Private Equity (PE) Owned Insurers” (the “NAIC List”). The NAIC and state insurance regulators will use the NAIC List to review additional information related to affiliates and investment structures (including revisions to the capital charges for asset-backed securities, in particular CLOs), investment management agreements, governance, market conduct practices and use of third-party administrators. For example, insurance regulators, including the NAIC, have increasingly focused on the terms and structure of investment management agreements, including whether they are at arms' length, establish a control relationship with the insurance company, grant the asset manager excessive authority or oversight over the investment strategy of the insurance company or provide for management fees that are not fair and reasonable or termination provisions that make it difficult or costly for the insurer to terminate the agreement. Regulators have also increasingly focused on the risk profile of certain investments held by insurance companies (including, without limitation, structured credit assets such as collateralized loan obligations), appropriateness of investment ratings and potential conflicts of interest (including affiliated investments), and potential misalignment of incentives and any potential risks from these and other aspects of an insurance company's relationship with alternative asset managers that may impact the insurance company's risk profile. This enhanced scrutiny may increase the risk of regulatory actions against us and could result in new or amended regulations that limit our ability, or make it more burdensome or costly, to enter into or amend existing investment management agreements or advisory with insurance companies and thereby grow our insurance strategy. Our relationships with Global Atlantic and other insurers and reinsurers is expected to be subject to additional scrutiny and potentially additional regulatory requirements, which may have a material impact on us. See also "—Risks Related to our Insurance Activities— Global Atlantic's businesses are heavily regulated across numerous jurisdictions, including with respect to capital requirements, and changes in regulation could reduce the profitability of our insurance business."
70
The AIFMD provides for a comprehensive regulatory and supervisory framework for AIFMs managing or marketing alternative investment funds in the EU. The AIFMD imposes various substantive regulatory requirements on AIFMs, including a subsidiary of ours which is authorized as an AIFM by the Central Bank of Ireland, and there have been a number of significant changes that, if adopted, will affect our business:
•On November 25, 2021, the European Commission (the "Commission") published draft legislative proposals in the form of a directive amending the AIFMD. The draft legislative proposals address delegation arrangements, liquidity risk management, supervisory reporting, provision of depositary and custody services and loan origination by alternative investment funds.
•On August 2, 2021, Commission Delegated Regulation (EU) 231/2013 was amended to require sustainability risks and sustainability preferences to be integrated into the investment decision-making and risk management processes of AIFMs. The amendments applied from August 1, 2022.
•On November 28, 2022, the EU adopted Regulation (EU) 2022/2560 on foreign subsidies distorting the internal market, coming into force in mid-2023, which, subject to certain thresholds, will require mandatory notification of acquisitions involving financial contributions by non-EU governments. In July 2022, the UK put forth a new bill (the "Financial Services and Markets Bill") which makes significant reforms to the regulation of the UK financial services sector. The Financial Services and Markets Bill contains measures to, among other things: (i) establish a framework for the revocation of EU financial services law that was retained in English law following Brexit; (ii) reform the legislative framework governing the UK's capital markets; (iii) reform the financial promotion framework; and (iv) give the FCA and the Prudential Regulation Authority ("PRA") a new secondary objective to advance long-term economic growth and international competitiveness of the UK. The exact impact of these changes is not yet known, but they could result in increasing and, ultimately, potentially significant divergence between the UK's financial services regulatory framework and the EU financial services framework, which could increase regulatory compliance costs across our business and impact the ability of our regulated portfolio companies to scale across the UK and EU markets. The European Market Infrastructure Regulation ("EMIR"), the legislation amending EMIR ("EMIR Refit") and their UK equivalents, which impose various reporting, margining and central clearing requirements on certain derivative transactions.
•Changes to AIFMD are expected to be formally agreed to in early 2024 and would come into effect in 2026. These changes may increase the compliance burdens on certain of our funds and require them to make changes to their operations, including, among other things, in respect of their use of leverage, which could impact the returns of such funds.
Additionally, our business could be adversely affected if we or our portfolio companies fail to comply with existing and potential new applicable ESG regulations. The potential impact to us of these regulations is further described in “—Risks Related to Our Business—We are subject to focus by some of our fund investors, stockholders, regulators and other stakeholders on environmental, social and governance matters.”
Additionally, our business could be adversely affected if we or our portfolio companies fail to comply with existing and potential new applicable regulations relating to artificial intelligence, including the EU AI Act. The potential impact to us of these regulations is in “—Risks Related to Our Business—Rapidly developing and changing global privacy and data laws and regulations could further increase compliance costs and subject us to enforcement risks and reputational damage” and "—Risks Related to Our Business—Cyber-security failures and data security breaches may disrupt or have a material adverse impact on our businesses, operations and investments."
Any of these changes or potential changes in the regulatory framework applicable to our business (including any changes or potential changes that are not described above or that we are unaware of or that may arise from new leadership at regulators and in governments in the U.S. and abroad), as well as adverse news media attention, may: impose additional expenses or capital requirements on us; limit our fundraising for our investment products; result in limitations in the manner in which our business is conducted; have an adverse impact upon our results of operations, financial condition, reputation or prospects; impair employee retention or recruitment; and require substantial attention by senior management. It is impossible to determine the extent of the impact of any new laws, regulations, initiatives or regulatory guidance that may be proposed or may become law on our business or the markets in which we operate. If enacted, any new law, regulation, initiatives or regulatory guidance could negatively impact our funds and us in a number of ways, including: increasing our costs and the cost for our funds of investing, borrowing, hedging or operating; increasing the funds' or our regulatory operating costs; imposing additional burdens on our funds' or our staff; and potentially requiring the disclosure of sensitive information. Even if not enacted, evaluating and responding to new rulemaking proposals could result in increased costs and require significant attention from management. In addition, we may be materially and adversely affected by changes in the interpretation or enforcement of existing laws and
71
rules by these governmental authorities, courts, regulators and self-regulatory organizations. New laws, regulations, initiatives or regulatory guidance, or changes in interpretation or enforcement, could make compliance more difficult or more expensive, affect the manner in which we conduct business and divert significant management and operational resources and attention from our business. Moreover, an increase in regulatory investigations and new or enhanced reporting requirements of the trading and other investment activities of alternative investment management funds and firms, including our funds and us, is possible. Such investigations and reporting requirements could impose additional expenses on us, require the attention of senior management, increase the complexity of managing our business, or result in fines or other sanctions if we or any of our funds are deemed to have violated any law or regulations.
Current Alternative Asset Manager Legal and Regulatory Environment.
We regularly rely on exemptions in the United States from various requirements of the Securities Act, the Exchange Act, the Investment Company Act, the Commodity Exchange Act and ERISA in conducting our investment management activities. These exemptions are sometimes highly complex and may in certain circumstances, depend on compliance by third parties whom we do not control. If for any reason these exemptions were to become unavailable to us, we could become subject to additional restrictive and costly registration requirements, regulatory action or third-party claims and our business could be materially and adversely affected.
For example, in raising new funds or certain other vehicles, we typically rely on private placement exemptions from registration under the Securities Act, including Rule 506 of Regulation D. However, Rule 506 becomes unavailable to issuers (including our funds) if the issuer or any of its "covered persons" (certain officers and directors and also certain third parties including, among others, promoters, placement agents and beneficial owners of 20% of outstanding voting securities of the issuer) has been the subject of a "disqualifying event," which includes a variety of criminal, regulatory and civil matters (so-called "bad actor" disqualification). If our funds (or other vehicles) or any of the covered persons associated with our funds (or other vehicles) are subject to a disqualifying event, one or more of our funds could lose the ability to raise capital in a Rule 506 private offering for a significant period of time, which could significantly impair their ability to raise new funds (or other products) and our ability to organize and offer new funds (or other vehicles), and, therefore, could materially and adversely affect us. We also rely on Rule 506 in connection with our capital markets business activities, including with respect to various fundraising activities discussed above and in connection with transactions in which our investment funds or insurance companies may participate as a purchaser or a seller of securities. The occurrence of a disqualifying event could materially and adversely affect our ability to raise financings for KKR and our ability to conduct our capital markets business, which depends on KKR’s ability to participate in unregistered securities offerings. In addition, if certain of our employees or any potential significant investor has been the subject of a disqualifying event, we could be required to reassign or terminate such an employee or we could be required to reduce or refuse the investment of such an investor, which could impair our relationships with investors, harm our reputation or make it more difficult to raise new funds (or other products). As we expand the array of vehicles that we offer to retail investors, we may increasingly rely on the Rule 506(c) safe harbor so that we can incorporate general solicitation or general advertising into offerings for certain investment products, which will require us to implement a more robust protocol to validate accredited investor status.
We are and will become further subject to additional regulatory and compliance burdens because our product offerings and investment platform include retail investors. For example, certain of our investment vehicles are registered under the Investment Company Act as investment companies. These funds and their investment advisers are subject to the Investment Company Act and the rules thereunder, which, among other things, regulate the relationship between a registered investment company and its investment adviser and prohibit or severely restrict principal transactions and joint transactions. In addition, we have one or more affiliates, which provide investment advisory services to a BDC. BDCs are subject to certain restrictions and prohibitions under the Investment Company Act. If the entity fails to meet the requirements for a BDC, it may be regulated as a closed-end investment company under the Investment Company Act and become subject to substantially more regulatory restrictions, which could limit its operating flexibility and in turn result in decreased profitability for our affiliated advisor. We have also launched holding company conglomerates that are structured and operated in a manner that does not subject these entities to registration or regulation under the Investment Company Act. If a holding company conglomerate were required to register under the Investment Company Act, the applicable restrictions could make it impractical for the company to operate its business plans as contemplated, which could cause KKR significant harm and materially and adversely affect our business strategy and prospects. As our business expands, we may be required to make additional registrations under the Investment Company Act or similar laws, including in jurisdictions outside the United States. Compliance with these and other U.S. and non-U.S. rules will increase our compliance costs and create potential for additional liabilities and penalties, which would divert management's attention from our business and investments.
72
Rule 206(4)-5 under the Investment Advisers Act regulates "pay to play" practices by investment advisers involving campaign contributions and other payments to elected officials or candidates for political office who are able to exert influence on government clients. Among other restrictions, the rule prohibits investment advisers from providing advisory services for compensation to a government client for two years, subject to very limited exceptions, after the investment adviser, its senior executives or its personnel involved in soliciting investments from government entities make contributions to certain candidates and officials in position to influence the hiring of an investment adviser by such government client. Advisers are required to implement compliance policies designed, among other matters, to track contributions by certain of the adviser's employees and engagements of third parties that solicit government entities and to keep certain records in order to enable the SEC to determine compliance with the rule. There has also been similar rulemaking on a state-level regarding "pay to play" practices by investment advisers, including in California and New York. FINRA has released its own set of "pay to play" regulations that effectively prohibit the receipt of compensation from state or local government agencies for solicitation and distribution activities within two years of a prohibited contribution by a broker- dealer or one of its covered associates. Any failure on our part to comply with these rules could cause us to lose compensation for our advisory services or expose us to significant penalties and reputational damage.
Other Financial Markets Regulation.
Certain requirements imposed by regulators in the United States and abroad, as well as by U.S. and non-U.S. legislation and proposed legislation, are designed primarily to ensure the integrity of the financial markets or other objectives and are not principally designed to protect our stockholders. These laws and regulations often serve to limit our activities.
U.S. federal bank regulatory agencies have issued leveraged lending guidance covering transactions characterized by a degree of financial leverage. Although the status of the U.S. federal bank regulatory agencies' 2013 leveraged lending guidance is currently uncertain as the U.S. Government Accountability Office determined, in October 2017, that such guidance is subject to review under the U.S. Congressional Review Act, the possibility exists that, under the current or future administrations, the U.S. federal bank regulatory agencies could apply leveraged lending guidance in its 2013 form, or implement a revised or new rule that limits leveraged lending by banks. If applied by the U.S. federal bank regulatory agencies as a binding restriction, such guidance or rules could limit the amount or availability of debt financing available to borrowers and may increase the cost of financing we are able to obtain for our transactions and may cause the returns on our investments to suffer. Moreover, there has been recurring consideration among U.S. and non-U.S. regulators regarding the role of nonbank institutions in providing credit and, particularly, so-called “shadow banking,” a term generally taken to refer to financial intermediation involving entities and activities outside the regulated banking system.
In addition, the Financial Stability Oversight Council (“FSOC”), an interagency body charged with identifying and monitoring systemic risk to financial markets, can designate certain nonbank financial companies as systemically important financial institutions (“SIFI”) to be supervised by the U.S. Board of Governors of the Federal Reserve System. Currently, there are no nonbank financial companies with a nonbank SIFI designation. The FSOC has, however, designated certain nonbank financial companies as SIFIs in the past, and additional nonbank financial companies, which may include large asset management companies, may be designated as SIFIs in the future. In November 2023, FSOC adopted amendments to its guidance regarding procedures for designating nonbank financial companies as SIFIs, which eliminated FSOC’s prioritization of an “activities-based” approach under its prior guidance for identifying, assessing and addressing potential risks to financial stability. The elimination of an “activities-based” approach over designation of an individual firm as a nonbank SIFI under the amendments to the FSOC’s nonbank SIFI designation guidance adopted in November 2023 may increase the likelihood of FSOC designating one or more asset management companies as a nonbank SIFI. If we were to be designated as a SIFI, or if any of our business activities were to be identified by the FSOC or any other regulatory agency as warranting enhanced regulation or supervision by certain regulators, we could be subject to materially greater regulatory burdens, which could adversely impact our compliance and other costs, the implementation of certain of our investment strategies and our profitability. Both the FSOC 2022 and 2023 annual reports noted the potential for increased interconnectivity of the financial markets as a result of private equity firms’ growing role in the insurance sector and raised concerns with the growing concentration of private debt and other complex alternative investments on the balance sheets of insurers owned by private equity firms. The FSOC 2023 annual report re-emphasized its support for the ongoing monitoring of companies in this industry to ensure the adequacy and effectiveness of regulatory and supervisory tools and its support for strengthening supervisory, credit analysis, risk management and capital frameworks applicable to insurers. In addition to FSOC’s recent focus on the private equity industry more generally, the International Monetary Fund has urged global insurance authorities, and FSOC, to focus specifically on the relationships between private equity and insurance companies.
73
The SEC has adopted a rule that requires a U.S. broker-dealer, or a natural person who is an associated person of a broker-dealer, to act in the best interest of a retail customer when making a recommendation of any securities transaction or investment strategy involving securities, without placing the financial or other interest of the broker, dealer or natural person who is an associated person of a broker-dealer making the recommendation ahead of the interest of the retail customer ("Regulation Best Interest"). The term "retail customer" is defined as a natural person who uses such a recommendation primarily for personal, family or household purposes, without reference to investor sophistication or net worth. The "best interest" standard would be satisfied through compliance with certain disclosure, duty of care, conflict of interest mitigation and compliance obligations. Regulation Best Interest may impose additional costs to us if we continue to expand our product offerings and investment platforms to retail customers. For discussions of the risks posed by Regulation Best Interest and similar rules on Global Atlantic, see "—Risks Related to Our Insurance Activities—Global Atlantic's businesses are heavily regulated across numerous jurisdictions, including with respect to capital requirements, and changes in regulation could reduce the profitability of our insurance business.”
The CFTC, and in certain cases the SEC, has proposed or adopted regulations governing transactions in futures and swaps, which may limit our trading activities and our ability to implement effective hedging strategies or increase the costs of compliance. In general, our subsidiaries have not registered as regulated entities with the CFTC, and our funds generally operate pursuant to exemptions from registration, but certain transactions in futures and swaps remain subject to regulatory requirements regardless of our registration status. Among other things, CFTC regulations require aggregation of positions in futures and swaps on physical commodities that are under common ownership, for purposes of compliance with position limits. We and other asset management firms rely on an exemption from aggregation for portfolio companies that hold positions in the relevant contracts. In addition, our funds are subject to regulatory minimum swap margin requirements, which increase the costs of trading and could make it infeasible in certain instances. Any changes in application or interpretation of the rules applicable to futures and swaps, including rules regarding registration, reporting, margin, capital requirements, and position limits, could result in significant costs for us and our funds.
Certain of the investment vehicles we manage and certain portfolio companies that engage in originating, lending and/or servicing loans, may consider investments that would subject us to U.S. state and federal regulation, borrower disclosure requirements, limits on fees and interest rates on some loans, state lender licensing requirements, stress testing and other regulatory requirements in the conduct of their business. If our investment vehicles or portfolio companies engage in these activities, they may also be subject to consumer disclosures and substantive requirements on consumer loan terms and other federal regulatory requirements applicable to consumer lending that are administered by the U.S. Consumer Financial Protection Bureau. These U.S. state and federal regulatory programs are designed to protect borrowers. There is a potential for increased risk of legislative and regulatory action that could adversely limit and affect our and our portfolio companies' businesses relating to these activities.
U.S. state and federal regulators and other governmental entities have authority to bring administrative enforcement actions or litigation to enforce compliance with applicable lending or consumer protection laws, with remedies that can include fines and monetary penalties, restitution of borrowers, injunctions to conform to law, or limitation or revocation of licenses and other remedies and penalties. In addition, lenders and servicers may be subject to litigation brought by or on behalf of borrowers for violations of laws or unfair or deceptive practices. If we enter into transactions that subject us to these risks, failure to conform to applicable regulatory and legal requirements could be costly and have a detrimental impact on certain of our investment vehicles and ultimately on us.
In Europe and the Asia-Pacific, there are also laws and regulations that are designed to ensure the integrity of the financial markets or other objectives and are not principally designed to protect our stockholders. For example, our European subsidiaries and investment vehicles managed by us are subject to various EU-wide laws, regulations, their respective national implementing legislation and, for our UK subsidiaries, specific UK rules and regulations, including:
•finalized rules and guidance published by the FCA in July 2022 regarding its new Consumer Duty which sets out a new standard of care applicable to firms providing products to retail customers. This standard of care sets out new outcomes related to products and services, price and value, consumer understanding and consumer support. Firms must now consider the needs and characteristics of their retail customers to ensure that these outcomes are being met and that the products and services provided are appropriate for the customers in question. These rules only apply to products offered to retail customers in the UK, and as certain of our products are now available to such investors through third-party distributors, these new rules may increase the regulatory compliance cost of doing business in the UK;
74
•the second Markets in Financial Instruments Directive ("MiFID II") and its UK equivalent (as implemented in English law via the European Union (Withdrawal) Act 2018, the Markets in Financial Instruments (Capital Markets) (Amendment) Regulations 2021 and the rules of the FCA), which imposes a range of compliance requirements on our business in areas such as transaction reporting, marketing infrastructure and securities and derivatives trading;
•the Market Abuse Regulation ("MAR") and its UK equivalent, which requires, among other things, systems and controls regarding inside information, record keeping and other prescribed procedures for market soundings, and conflicts of interest and other relevant disclosure when providing investment recommendations;
•the EU's Investment Firms Directive and the Investment Firms Regulation and their UK equivalents, which imposes a prudential regime for certain investment firms in Europe (including capital and liquidity standards), as well as various governance and remuneration obligations (including certain performance adjustment requirements to variable remuneration such as malus and clawback that apply in certain circumstances), with different rules applying depending on an investment firm's classification, which is based on factors such as the firm's size and the nature of its activities;
•other EU bank regulatory initiatives, including the Second Bank Recovery and Resolution Directive and the European Banking Authority's guidelines on limits to exposures to shadow banking entities which carry out banking activities outside a regulated framework under EU law (including funds employing leverage on a substantial basis, within the meaning of AIFMD and its implementing rules, and credit funds);
•the Securitization Regulation and its UK equivalent, which establishes due diligence, risk retention and disclosure regarding certain of our European investments, subsidiaries and CLOs;
•the Short Selling Regulation and its UK equivalent, which limits naked short selling of sovereign bonds and stocks;
•the Financial Conglomerates Directive and its UK equivalent, which establishes a prudential regime for financial conglomerates to address perceived risks associated with large cross-sector businesses, and could increase the costs of investing in insurance companies, investment firms and banks located in the EU;
•the Sustainable Finance Disclosure Regulation, Taxonomy Regulation and the accompanying regulatory technical standards, which impose sustainability risk assessment requirements and ESG-specific transparency disclosure and reporting requirements;
•the Securities Financing Transaction Regulation, which requires securities financing transactions to be reported to trade repositories, places additional reporting requirements on investment managers and introduces prior risk disclosures and written consent before assets are rehypothecated;
•the GDPR and its UK equivalent, which imposes stringent data protection requirements and provides for significant penalties for noncompliance; and
•the European regulation on digital operational resilience for the financial sector, and the associated directive, designed to harmonize and strengthen digital operational resilience requirements for the EU's financial services sector.
As noted above, any changes or potential or proposed changes in the regulatory framework applicable to our business may impose conduct standards, additional expenses or capital requirements on us; limit our fundraising for our investment products; result in limitations in the manner in which our business is conducted; impair employee retention or recruitment; require substantial attention by senior management; or otherwise materially and adversely impact us.
Portfolio Company Legal and Regulatory Environment
We are subject to certain laws, such as certain environmental laws, takeover laws, anti-bribery, trade sanctions, trade control, anti-money laundering and anti-corruption laws, escheat or abandoned property laws, antitrust laws, data privacy and data protection laws, foreign direct investment laws and insolvency laws that may impose requirements on us and our portfolio companies as an affiliated group. As a result, we could become jointly and severally liable for all or part of fines imposed on, or debts of, our portfolio companies or be fined directly for violations committed by portfolio companies, and such fines imposed directly on us could be greater than those imposed on the portfolio company. Moreover, portfolio companies may seek to hold us responsible if any fine imposed on them is increased because of their membership in a larger group of affiliated companies. For example, on January 27, 2021, the Court of Justice of the European Union ("CJEU") affirmed the 2014 decision of the European Commission to fine 11 producers of underground and submarine high voltage power cables a total of 302 million euros for participation in a ten-year market and customer sharing cartel. Fines were also imposed, and confirmed by the CJEU, on parent companies of the producers involved, including Goldman Sachs, the former parent company of one of the cartel
75
members. Similarly, on July 29, 2021, the United Kingdom Competition and Markets Authority announced that it had fined a pharmaceutical company and its former parent companies, two private equity firms, more than 100 million British pounds for abuse of dominance by charging excessive and unfair prices. In addition, the U.S. Department of Justice has increasingly named private equity sponsors as co-defendants in cases brought under the False Claims Act involving allegedly unlawful conduct by portfolio companies. In various cases, private equity sponsors and portfolio companies have settled claims by agreeing to the payment of substantial monetary penalties. In addition, compliance with certain laws or contracts could also require us to commit significant resources and capital towards information gathering and monitoring, thereby increasing our operating costs. For example, because we may indirectly control voting securities in public utilities subject to regulation by the Federal Energy Regulatory Commission ("FERC"), including entities that may hold FERC authorization to charge market-based rates for sales of wholesale power and energy, we may be subject to certain FERC regulations, including regulations requiring us and our portfolio companies to collect, report and keep updated substantial information concerning our control of such voting interests and voting interests in other related energy companies, corporate officers, and our direct and indirect investment in such utilities and related companies. Additionally, certain of our portfolio companies may be subject to reporting requirements under Australia’s Foreign Acquisitions and Takeovers Act (1975), which is administered by the Foreign Investment Review Board (“FIRB”), because of the composition of KKR’s investment funds, among other reasons. Such rules may subject our portfolio companies and us to costly and burdensome data collection and reporting requirements, and penalties for non-compliance.
In the United States, certain statutes may subject us or our funds to the liabilities of our portfolio companies. The Comprehensive Environmental Response, Compensation and Liability Act ("CERCLA"), also referred to as the "Superfund," requires cleanup of sites from which there has been a release or threatened release of hazardous substances, and authorizes the U.S. Environmental Protection Agency to take any necessary response action at Superfund sites, including ordering potentially responsible parties liable for the release to pay for such actions. Potentially responsible parties are broadly defined under CERCLA and could include us.
In addition, we or certain of our investment vehicles could potentially be held liable under ERISA for the pension obligations of one or more of our portfolio companies if we or the investment vehicle were determined to be a "trade or business" under ERISA and deemed part of the same "controlled group" as the portfolio company under such rules, and the pension obligations of any particular portfolio company could be material. On March 28, 2016, a Federal District Court judge in Massachusetts ruled that two private equity funds affiliated with Sun Capital were jointly and severally responsible for unfunded pension liabilities of a Sun Capital portfolio company. While neither fund held more than an 80% ownership interest of the portfolio company, the percentage required under existing regulations to find liability, the court found the funds had formed a partnership-in-fact conducting a trade or business and that as a result each fund was jointly and severally liable for the portfolio company's unfunded pension liabilities. While a federal appellate court only upheld certain aspects of the District Court holding, if the rationale of the District Court decision were to be applied by other courts, we or certain of our investment funds could be held liable under ERISA for certain pension obligations of portfolio companies. In addition, if this same rationale were expanded to apply also for U.S. federal income tax purposes, then certain of our investors could be subject to increased U.S. income tax liability or filing obligations in certain contexts. Similar laws that could be applied with similar results also exist outside of the United States. Moreover, if the general accounts or separate accounts of one or more of our insurance subsidiaries were to constitute "plan assets" for purposes of ERISA, in the absence of an exemption we could incur liability under the prohibited transaction provisions of ERISA and the Code as a result of any investment management activities by KKR with respect to, or transactions involving Global Atlantic or KKR's investment vehicles with respect to, such general account or separate account assets, and we could become prohibited from being compensated for managing our insurance subsidiaries' assets. See also "Certain Recent and Potential Regulatory Developments" above regarding the October 2023 U.S. Department of Labor proposed rule that, if finalized, would materially increase the likelihood that an investment adviser, such as us, could inadvertently become a fiduciary to certain retirement plans by reason of being deemed to have rendered investment advice.
Similarly, our portfolio companies may be subject to contractual obligations, which may impose obligations or restrictions on their affiliates. The interpretation of such contractual provisions will depend on local laws. Given that we do not control all of our portfolio companies, and that our portfolio companies generally operate independently of each other, there is a risk that we could contravene one or more of such laws, regulations and contractual arrangements due to limited access and opportunities to monitor compliance. In addition, compliance with these laws or contracts could require us to commit significant resources and capital towards information gathering and monitoring, thereby increasing our operating costs.
76
Because of our ownership interest in portfolio companies, attention on our portfolio companies can also result in attention on us. For example, in the past, heightened governmental scrutiny of the healthcare, educational and other industries has resulted in requests by a U.S. Congressional committee and members of Congress for information from us about our investments in portfolio companies that operate in these industries. Congressional scrutiny and other similar inquiries by governmental bodies may damage our reputation and may also result in potential legislation designed to further regulate portfolio companies or the industries in which they operate, which may materially and adversely affect our portfolio companies' businesses, which in turn could decrease the value of our investments. Significant failures of our investments to comply with laws and regulations applicable to them could affect the ability of our funds or us to invest in other companies in certain industries in the future and could harm our reputation.
For additional information about our litigation and regulatory matters, see Note 24 "Commitments and Contingencies—Litigation" in our financial statements. For additional information about regulatory risks we face with respect to portfolio companies in various asset classes, such as real assets, or risks we face with respect to our insurance business, please see other risks discussed in this report, including “—Risks Related to Our Investment Activities—Our investments in real assets such as real estate, infrastructure and energy may expose us to increased risks and liabilities” and “—Risks Related to Our Insurance Activities—Global Atlantic's businesses are heavily regulated across numerous jurisdictions, including with respect to capital requirements, and changes in regulation could reduce the profitability of our insurance business.”
Anti-corruption, sanctions and foreign direct investment laws
Federal, state and foreign anti-corruption and trade sanctions laws and restrictions on foreign direct investment applicable to us and our portfolio companies create the potential for significant liabilities and penalties, the inability to complete transactions, imposition of significant costs and burdens, and reputational harm. If we fail to comply with these laws and regulations, we could be exposed to claims for damages, civil or criminal financial penalties, reputational harm, incarceration of our employees, restrictions on our operations and other liabilities, any of which could materially and adversely affect our business, results of operations and financial condition. In addition, we may be subject to successor liability for FCPA violations or other acts of bribery, or violations of applicable sanctions, other export control or foreign direct investment laws committed by companies in which we or our funds invest or which we or our funds acquire.
We are subject to a number of laws and regulations governing payments and contributions to political persons or other third parties, including restrictions imposed by the Foreign Corrupt Practices Act ("FCPA"), as well as trade sanctions and trade control laws administered by the Office of Foreign Assets Control ("OFAC"), the U.S. Department of Commerce and the U.S. Department of State, and anti-money laundering laws, including the Corporate Transparency Act ("CTA"). The FCPA is intended to prohibit bribery of foreign governments and their officials and political parties, and requires public companies in the United States to keep books and records that accurately and fairly reflect those companies' transactions. OFAC, the U.S. Department of Commerce and the U.S. Department of State administer and enforce various trade control laws and regulations, including economic and trade sanctions based on U.S. foreign policy and national security goals against targeted foreign states, organizations and individuals. In February 2024, the U.S. Department of the Treasury's Financial Crimes Enforcement Network ("FinCEN") proposed a rule that would require registered investment advisers and exempt reporting advisers ("ERAs") to, among other measures, adopt an anti-money laundering and countering the financing of terrorism ("AML/CFT") program and file certain reports with FinCEN. The proposed rule would also delegate authority to the SEC to examine registered investment advisers' and ERAs' compliance with these requirements. If this proposal is adopted, it could impose additional regulatory obligations related to AML/CFT on our investment advisory business. These laws and regulations implicate a number of aspects of our business, including servicing existing investment vehicle investors, finding new investors, and sourcing new investments, as well as activities by the portfolio companies in our investment portfolio or other controlled investments. Some of these regulations provide that penalties can be imposed on us for the conduct of a portfolio company, even if we have not ourselves violated any regulation.
The Iran Threat Reduction and Syrian Human Rights Act of 2012 ("ITRA") expanded the scope of U.S. sanctions against Iran and requires public reporting companies to disclose in their annual or quarterly reports certain dealings or transactions the company or its affiliates "knowingly" engaged in during the previous reporting period involving Iran or other individuals and entities targeted by certain OFAC sanctions. Disclosure of such activity, even if such activity is not subject to sanctions under applicable law, and any sanctions actually imposed on us or our affiliates as a result of these activities, could harm our reputation and have a negative impact on our business.
77
The U.S. government has also implemented and expanded a number of economic and trade sanctions programs and export controls that target Chinese entities and nationals on national security grounds and has imposed restrictions on acquiring and retaining interests in the securities of certain Chinese entities. These initiatives target, for example, entities associated with the Chinese government's response to political demonstrations in Hong Kong, the Chinese government's treatment of Uighurs and other ethnic minorities, the Chinese government's capabilities to conduct surveillance on its own population and internationally, and more broadly the capabilities of the Chinese military, paramilitary, security and police forces, among other things. The U.S. has also enacted rules aimed at restricting China's ability to obtain advanced computing chips, develop and maintain supercomputers, and manufacture advanced semiconductors, as well as expanded export control laws to reach additional items produced outside of the United States, restricted the ability of U.S. persons to support the development or production of integrated circuits at certain semiconductor fabrication facilities in China, and added new license requirements for certain items destined for China. In return, China has issued rules and laws to counteract the impact of foreign sanctions on Chinese persons by enabling Chinese citizens, legal persons, and other organizations to seek remedies as a result of prohibitions or restrictions on normal economic, trade, and related activities with persons of other countries, and authorized the imposition of countermeasures such that a company that complies with U.S. sanctions against a Chinese entity may then face penalties in China. China has also instituted tariffs on certain U.S. goods and may impose additional tariffs on U.S. products in the future. For example, in 2023, China restricted the export of gallium and germanium products, which are used in the fabrication of microchips, and may impose additional export restrictions in the future.
Similar laws in non-U.S. jurisdictions, such as EU sanctions and blocking statutes, the UK Bribery Act, as well as other applicable anti-bribery, anti-corruption, anti-money laundering, or sanction or other export control, or related laws in the United States and abroad, may also impose stricter or more onerous requirements than the FCPA, OFAC, the U.S. Department of Commerce, the U.S. Department of State or U.S. Department of Treasury, and implementing them may disrupt our business or cause us to incur significantly more costs to comply with those laws. Different laws may also contain conflicting provisions, making compliance with all laws more difficult. For example, the EU has adopted measures, such as Council Regulation (EC) No. 2271/96, that could restrict certain persons and entities subject to EU jurisdiction from complying with extra-territorial sanctions imposed by other jurisdictions, such as the U.S.
In addition, the U.S. and many non-U.S. countries have laws designed to protect national security or to restrict foreign direct investment. For example, under the U.S. Foreign Investment Risk Review Modernization Act ("FIRRMA"), the Committee on Foreign Investment in the United States ("CFIUS") has the authority to review, block or impose conditions on investments by non-U.S. persons in U.S. companies or real assets deemed critical or sensitive to the United States. Many non-U.S. jurisdictions have similar laws, for example: the EU has adopted an EU-wide mechanism to screen foreign investment on national security grounds and most EU Member States now have a foreign investment screening mechanism in place or has initiated a consultative or legislative process expected to result in the adoption of a new mechanism or amendments to an existing mechanism, adopted a regulation aimed at regulation of foreign subsidies that could distort the internal EU market; certain transactions in Australia are subject to review by the Foreign Investment Review Board; transactions in the UK must comply with the National Security and Investment Act 2021; and transactions in China must comply with the Measures for the Security Review of Foreign Investment. In addition, during 2022, Japan enacted economic security legislation to protect Japanese national security from adverse economic activities, focusing in particular on protecting sensitive industry sectors, such as semiconductors, rare earths, infrastructure, as well as research and development of defense and dual-use technologies. Beginning in February 2022, the United States and other countries imposed sanctions targeting Russia as a result of actions taken by Russia in Ukraine. In addition, in 2023, certain U.S. states have enacted their own state-level restrictions on Chinese investments. The U.S. government also announced in 2023 an Advanced Notice of Proposed Rule Making, which is seeking comments on a proposed rule that would restrict out-bound investments by U.S. persons in certain national security technologies and products. Other countries may adopt similar outbound investment restrictions in the future. In addition, a number of U.S. states are passing and implementing state laws prohibiting or otherwise restricting the acquisition of interests in real property located in the state by foreign persons. These laws may impact the ability of non-U.S. limited partners to participate in certain of our investment strategies.
78
Under these laws, governments have the authority to impose a variety of actions, including requirements for the advance screening or notification of certain transactions, blocking or imposing conditions on certain transactions, limiting the size of foreign equity investments or control by foreign investors, and restricting the employment of foreigners as key personnel. These actions could limit our ability to find suitable investments, cause delays in consummating transactions, result in the abandonment of transactions, and impose burdensome operational requirements on our portfolio companies. These laws could also negatively impact our fundraising and syndication activities by causing us to exclude or limit certain investors in our funds or co-investors for our transactions. Moreover, these laws may make it difficult for us to identify suitable buyers for our investments that we want to exit and could constrain the universe of exit opportunities generally. Complying with these laws imposes potentially significant costs and complex additional burdens, and any failure by us or our portfolio companies to comply with them could expose us significant penalties, sanctions, loss of future investment opportunities, additional regulatory scrutiny, and reputational harm.
We face significant harm as a result of legal claims, litigations, investigations, and negative publicity.
The activities of our businesses, including the investment decisions we make and the activities of our employees, may subject us, our business, and our employees, officers and directors to the risk of litigation by third parties, including various governmental and regulatory authorities who may conduct examinations, inquiries and investigations of KKR. See "—Risks Related to Our Business—Extensive regulation of our businesses affects our activities and creates the potential for significant liabilities and penalties, which could materially and adversely affect KKR.” Other potential litigants include our stockholders, our fund investors, holders of our or our portfolio companies' debt or equity, our insurance policyholders, and a variety of other potential litigants. For a description of certain litigation against KKR, see Note 24 "Commitments and Contingencies—Litigation" in our financial statements.
We, our investment vehicles and our employees are each exposed to the risks of litigation relating to our investment activities or insurance business, as well as relating to actions taken by the officers and directors (some of whom may be KKR employees) of our portfolio companies, such as lawsuits by other stockholders of our public portfolio companies or holders of debt instruments of our portfolio companies. We are also exposed to risks of litigation, investigation or negative publicity in the event of any transactions that are alleged not to have been properly considered and approved under applicable law.
Although investors in our funds do not have legal remedies against us, the general partners of our funds, our funds, our employees or our affiliates solely based on their dissatisfaction with the investment performance of those funds, such investors may have remedies against us, the general partners of our funds, our funds, our employees or our affiliates to the extent any losses result from fraud, gross negligence, willful misconduct or other similar misconduct. While the general partners and investment advisers to our investment funds, including their directors, officers, employees and affiliates, are generally indemnified to the fullest extent permitted by law with respect to their conduct in connection with the management of the business and affairs of our investment funds, such indemnity generally does not extend to actions determined to have involved fraud, gross negligence, willful misconduct or other similar misconduct. If any civil or criminal lawsuits were brought against us and resulted in a finding of substantial legal liability or culpability, the lawsuit could materially and adversely affect us.
In addition, public attention could at any time focus on us, our industry or companies in which our investment vehicles are invested, which could result in heightened scrutiny and criticisms of our business and our investments, including governmental or regulatory inquiries and investigations or other adverse consequences. See "—Risks Related to Our Business—Extensive regulation of our businesses affects our activities and creates the potential for significant liabilities and penalties, which could materially and adversely affect KKR" and "—Risks Related to Our Business—We are subject to focus by some of our fund investors, stockholders, regulators and other stakeholders on environmental, social and governance matters." We depend to a large extent on our business relationships and our reputation for integrity and high-caliber professional services to attract and retain investors and qualified professionals and to pursue investment opportunities. As a result, allegations of improper conduct by private litigants or by governmental or regulatory authorities, whether the ultimate outcome is favorable or unfavorable to us, as well as negative publicity and press speculation about us, our investment activities or the private equity industry in general, whether or not valid, may harm our reputation, cause volatility and speculation in the trading of our common stock, and impair our relationships with existing and prospective investors, employees, and other stakeholders.
79
Certain types of investment vehicles, especially those offered to individual investors, may subject us to a variety of risks, including new and greater levels of public and regulatory scrutiny, regulation, risk of litigation and reputational risk, which could materially and adversely affect us.
We have increasingly undertaken business initiatives to increase the number and type of investment products and vehicles we offer to investors, especially individual investors. We have also launched holding company conglomerates that are structured and operated in a manner permitting them to be excluded from the definition of “investment company” under the Investment Company Act. The offering of opportunities to invest in investment companies registered under the Investment Company Act (or other non-U.S. investment vehicles) and in operating companies not registered under the Investment Company Act may result in increased risks, including the vehicles we call K-Series, which could materially and adversely affect us. Our investment adviser subsidiaries or affiliates externally manage or advise a number of such vehicles, some of which are publicly traded, which involves heightened risks of litigation. To the extent opportunities to invest in these types of vehicles are made available to individual (non-institutional) investors (including public investors as well as investors often described as high net worth individuals, family offices, mass affluent individuals or accredited investors), this expansion of our investor base may enhance the level of risks applicable to us and also may introduce new types of risks. The principal risks associated with many of these types of vehicles include:
•Operational risks, such as obligations to conduct more frequent valuation processes. These types of requirements will place increased demands on our employees, require administrative, operational and accounting resources, and incur significant expenses;
•Compliance and regulatory risks, such as managing potential conflicts of interest relating to allocation of potential investment opportunities and otherwise, conducting due diligence on distribution partners, and compliance with the requirements of, or for exclusion from regulation under, the Investment Company Act and other securities laws and regulations (see also "—Risks Related to Our Investment Activities—Third-party investors in our investment vehicles with commitment-based structures may not satisfy their contractual obligation to fund capital calls when requested by us, which could adversely affect an investment vehicle's operations and performance");
•Liquidity risk, such as sizing of liquidity reserves in order to satisfy any periodic investor redemption requests, which is a feature that is typically not allowed for investors in our traditional investment vehicles. See "—Risks Related to Our Investment Activities—Investors in certain of our investment vehicles are entitled to redeem their investments in these vehicles on a periodic basis, and certain of our investment advisory agreements may be terminated with minimal notice";
•Litigation risks, such as claims related to adequacy of disclosures, suitability and board of director oversight. Failure to comply with these requirements could result in civil lawsuits, regulatory penalties, enforcement actions, or potentially lead to suspension of trading, de-listing from an exchange, de-registration or liquidation. Many of these vehicles may also face significant additional litigation risks, including the increased potential for class actions and other investor lawsuits, which would distract our employees, including our investment professionals. The boards of directors of these vehicles and their investors could also seek recourse against KKR itself for any alleged mismanagement by our investment adviser subsidiaries or affiliates; and
•Reputational risk, as we may incur significant costs in connection with such investments, which ultimately may result in significant losses, as well as reputational harm. Furthermore, if the investors in these vehicles were to be dissatisfied with the investment performance or disagree with investment strategies employed by us, they may seek to cause the board of directors of the relevant vehicle to terminate its investment management agreement with us or change the terms of such agreement in a manner that is less favorable to us or redeem their investment to the extent permitted.
We have and expect to continue to distribute products through new channels, including through unaffiliated firms, and we may not be able to effectively monitor or control the manner of their distribution, which could result in litigation against us or reputational harm, including with respect to, among other things, claims that products distributed through such channels are distributed to customers for whom they are unsuitable or distributed in any other inappropriate manner. The distribution of products through new channels whether directly or through market intermediaries, including in the individual investor or private wealth management channel, could expose us to additional regulatory risk in the form of allegations of improper conduct and/or actions by state and federal regulators against us with respect to, among other things, product suitability, conflicts of interest and the adequacy of disclosure to customers to whom our products are distributed through those channels. In addition, legislative and regulatory action could adversely limit and affect our efforts to seek, or to manage vehicles that have investments from, individual investors. Although we seek to ensure through due diligence and onboarding procedures that the third-party channels through which individual investors access our investment products conduct themselves responsibly, we are exposed to the risks of reputational damage and legal liability to the extent such third parties improperly sell our products to
80
investors. For example, in certain cases, we may be viewed as responsible for the content of materials prepared by third-party distributors. Similarly, there is a risk that our employees involved in the direct distribution of our products, or employees who oversee independent advisors, brokerage firms and other third parties around the world involved in distributing our products, do not follow our compliance and supervisory procedures.
Although individual investors have not constituted a substantial amount of our historic investment vehicle investor base, it is likely that we will increasingly undertake business initiatives to increase the number and type of vehicles we offer to individual investors. We expect investment opportunities offered to individual investors to continue to grow to represent a larger percentage of our AUM as our historical pools of capital provided by institutional investors, such as pension funds, do not grow as much in the future. Accordingly, we are, and may become further, subject to additional regulatory and compliance requirements because our product offerings and investment platform will begin to include a higher percentage of individual investors as compared to our historical investor base.
In some cases, our investment vehicles are distributed to individual investors indirectly through third party managed vehicles sponsored by brokerage firms, banks or third-party feeder providers, and in other cases, directly to the qualified clients of banks, independent investment advisors and broker-dealers. In other cases, we create investment products specifically designed for direct investment by individual investors in the U.S. or similar investors in non-U.S. jurisdictions. Our initiatives to expand our individual investor base, including marketing, creating and maintaining the types of products and vehicles that they may invest in, requires the investment of significant time, effort and resources, including the potential hiring of additional personnel, the implementation of new operational, compliance and other systems and processes and the development or implementation of new technology. There is no assurance that our efforts to grow our individual investor assets under management will be successful. In addition, these aforementioned efforts to expand our individual investor base and/or our focus on the development of these vehicles could be negatively perceived as a strategic realignment of our focus by our traditional investment vehicle investors, which may be perceived as adverse to their interests, and which could cause us to be materially and adversely affected to the extent our traditional investment vehicle investors decide to move investments to our competitors.
The distribution of products suitable for individual investors, including through new channels whether directly or through market intermediaries, could expose us to allegations of improper conduct and/or actions by state and federal regulators in the U.S. and regulators in jurisdictions outside of the U.S. with respect to, among other things, product suitability, investor classification, compliance with securities laws, conflicts of interest regarding investment allocations, the adequacy of disclosure to customers to whom our products are distributed through those channels, including with respect to frequency and complexity of the valuation process for private assets and liquidity and execution of timely processes, such as ongoing general management and satisfying investor redemption requests in accordance with organization documents. Increased risk of legislative and regulatory action could adversely limit and affect our efforts to seek, or to manage vehicles that have investments from, individual investors.
We have entered into and plan to enter into investment management agreements with other similar investment vehicle types and other vehicle types in the future. Such vehicles may allow us to invest potentially more capital and potentially receive relatively more stable fee revenues, while providing varying amounts of liquidity to investors in such vehicles (pursuant to the terms of the applicable governing agreements). However, these vehicles may be subject to the heightened regulatory requirements applicable to certain semi-liquid vehicles, including compliance with the laws and regulations of the SEC, the Investment Company Act (or the requirements for exclusion from regulation thereunder), the Exchange Act, the Sarbanes-Oxley Act of 2002 and any national securities exchanges on which their securities are listed, among others. As our business expands, we may be required to register additional vehicles under the Investment Company Act or similar laws, including in jurisdictions outside of the United States. Compliance with these and other U.S. and non-U.S. rules will increase our compliance costs and create potential for additional liabilities and penalties, which could divert the attention of management of these investment vehicles from their business and investments. Relatedly, as we expand the distribution of these products to investors outside of the U.S., we are increasingly exposed to risks in non-U.S. jurisdictions. While these risks are similar to those that we face in the distribution of products to investors in the U.S., securities laws and other applicable regulatory regimes in many jurisdictions, including the UK and the EEA, are extensive, complex, and vary by local jurisdiction. As a result, this expansion subjects us to additional regulatory risk and potential litigation.
81
Our capital markets activities expose us to material risks.
Through our broker-dealer subsidiaries and their related entities, we provide a broad range of capital markets services that include acting as an advisor or as an agent, principal, underwriter, syndicator, arranger or other form of intermediary in connection with securities transactions, debt or equity syndications, loan transactions, derivative transactions and other types of financings and financial arrangements. We rely upon our counterparties to consummate the transactions that they indicate or commit to enter into with us. However, we may incur significant losses in connection with our capital markets activities, including to the extent that, for any reason, (i) our counterparties fail to acquire or pay for the securities, debt, equity or loans that we expected to sell, place or syndicate to them, or (ii) we are unable to receive our anticipated payments for any other transaction or are otherwise unable to dispose of any financial exposure that we incur at the prices that we anticipated or at all. The incurrence of any such losses may cause a materially adverse impact to our results of operations, financial condition or liquidity. We also may be subject to potential underwriter liability or regulatory consequences for material misstatements or omissions in prospectuses or other offering documents relating to transactions in which we are involved. We conduct capital markets activities in connection with transactions in which our investment funds or insurance companies may participate as a purchaser or a seller of securities, which could constitute a conflict of interest or subject us to regulatory scrutiny, liabilities or reputational harm.
Risk management activities may not be effective and, consequently, may adversely affect us.
KKR seeks to identify, monitor and manage financial and non-financial risks effectively. However, KKR cannot guarantee that it can accurately or effectively price, identify and predict, manage or ameliorate its risks. Gaps in our (including our insurance subsidiaries’) risk management policies and procedures may leave us exposed to unidentified or unanticipated risk, which could materially and adversely affect us. Developing an effective framework for assessing and managing risks is complex. No framework or strategy can completely insulate KKR from all risks, and KKR may be unable to identify all risks and limit its exposures based on its assessments. Furthermore, there can be no assurance that KKR can effectively review and monitor all risks or that all of KKR’s employees will follow its risk management policies and procedures. If KKR’s modeling of, processes relating to, analysis of or management of risk do not accurately predict and appropriately respond to future risk exposures, such risks could have a material adverse effect on KKR.
With respect to our investing activities in our asset management business, we employ hedging strategies or certain forms of derivative instruments to limit our exposure to changes in the relative values of investments that may result from market developments, including changes in prevailing interest rates, currency exchange rates, commodity prices, equity prices and general market risks. The use of derivative financial instruments and these risk management strategies may not be properly designed to hedge, manage or other reduce the risks as intended, may not be properly implemented as designed, or otherwise not effectively offset the risks we have identified. We may not have identified, or may not even be able to identify, all the material risks relevant for our capital markets activities or insurance business, and we also may choose not to hedge, in whole or in part, any of the risks that have been identified. In addition, the scope of risk management activities undertaken by us is selective and varies based on the level and volatility of interest rates, prevailing foreign currency exchange rates, the types of investments that are made and other changing market conditions. We do not seek to hedge our exposure in all currencies or all investments, which means that our exposure to certain market risks are not limited. Where applicable, we use hedging transactions and other derivative instruments to reduce the effects of a decline in the value of a position, but they do not eliminate the possibility of fluctuations in the value of the position or prevent losses if the value of the position declines. Such transactions may also limit the opportunity for gain if the value of a position increases. Moreover, it may not be possible to limit the exposure to a market development that is so generally anticipated that a hedging or other derivative transaction cannot be entered into at an acceptable price.
The success of any hedging or other derivative transactions that we enter into generally will depend on our ability to correctly predict market changes. As a result, while we may enter into such transactions in order to reduce our exposure to market risks, unanticipated market changes may result in poorer overall investment performance than if the hedging or other derivative transaction had not been executed. In addition, the degree of correlation between price movements of the instruments used in connection with hedging activities and price movements in a position being hedged may vary. Moreover, for a variety of reasons, we may not seek or be successful in establishing a perfect correlation between the instruments used in hedging or other derivative transactions and the positions being hedged. An imperfect correlation could prevent us from achieving the intended result and could give rise to a loss. In addition, it may not be possible to fully or perfectly limit our exposure against all changes in the value of its investments, because the value of investments is likely to fluctuate as a result of a number of factors, some of which will be beyond our control or ability to hedge.
82
While hedging arrangements may reduce certain risks, such arrangements themselves may entail certain other risks. These arrangements may require the posting of cash collateral, including at a time when an investment vehicle has insufficient cash or illiquid assets such that the posting of the cash is either impossible or requires the sale of assets at prices that do not reflect their underlying value. Moreover, these hedging arrangements may generate significant transaction costs, including potential tax costs, which reduce the returns generated by an investment vehicle.
In our capital markets business, one part of our capital markets risk management strategy is to enter into arrangements with third parties that are designed to reduce our risk when underwriting certain debt transactions. See "Management's Discussion and Analysis of Financial Condition and Results of Operations—Contractual Obligations, Commitments and Contingencies" for additional information about the amount of these arrangements as of December 31, 2023. If these counterparties or other derivative counterparties or clearinghouses fail or refuse to meet their obligations, then our efforts to mitigate risks may prove to be ineffective or inefficient, and we may experience a materially adverse impact to our results of operations, financial condition or liquidity. If such failure or refusal were to occur, or if these counterparties fail to renew their arrangements and we are unable to find suitable replacements, then our ability to continue to conduct large capital markets transactions or insure certain insurance products with guaranteed benefits in the future may be impaired.
In our insurance business, our hedging activities seek to mitigate economic impacts relating to Global Atlantic’s insurance products, which may result in additional volatility in GAAP results, adverse impacts on regulatory capital, and may not effectively offset any changes in insurance reserves. Global Atlantic is also subject to the risk that its derivative counterparties or clearinghouse may fail or refuse to meet their obligations to Global Atlantic under derivative financial instruments. If Global Atlantic's derivative counterparties or clearinghouse fail, refuse to meet their obligations in this regard or there is insufficient collateral to cover potential obligations, Global Atlantic's efforts to mitigate risks to which it is subject may prove to be ineffective or inefficient.
In addition, Global Atlantic uses risk management strategies, including hedging and reinsurance, to manage the economic exposure to interest rates and equity markets of products with guaranteed benefits. Certain of Global Atlantic's liabilities include guaranteed minimum death benefits, guaranteed minimum withdrawal benefits or no-lapse guarantees. These guarantees are designed to protect policyholders against significant downturns in securities markets and interest rates, or to provide certain minimum levels of coverage. Changes in markets that increase hedging costs may adversely impact the profitability of these products. Furthermore, Global Atlantic is subject to the risk that changes in policyholder behavior or mortality, combined with adverse market events, produce economic losses not addressed by the risk management techniques employed. Changes in markets or deviations in expected policyholder behavior or loss of reinsurance coverage may result in the requirement to hold additional reserves with respect to these policies, which may negatively impact Global Atlantic's liquidity or require it to raise additional capital. An increase in these liabilities would result in a decrease in Global Atlantic's net income. In addition, declining equity market prices, increasing equity market volatility and declining interest rates can result in an increase in the cost of providing variable annuity policy benefits and can increase required reserves, reducing Global Atlantic's profitability. These, individually or collectively, could have a material adverse effect on Global Atlantic.
Risks Related to Our Investment Activities
As an investment manager, we sponsor and manage funds and other investment vehicles that make investments worldwide on behalf of third-party investors and, in connection with those activities, are typically required to deploy our own capital in those investments. These investments are subject to many material risks and uncertainties as discussed below. In addition, with respect to the investments of our insurance subsidiaries and other investments on our balance sheet, which we manage for our own behalf, the risks and uncertainties discussed below may have a greater impact on our results of operations and financial condition as we directly bear the full risk of those investments in our financial results.
Future results of our investments may be different than, and may not achieve the levels of, any of our historical returns.
We have presented in this report certain information relating to our investment returns, such as net and gross internal rates of return (IRR), multiples of invested capital (MOIC) and realized and unrealized investment values for investment vehicles that we have sponsored, managed or operated. Historical returns of our investment vehicles should not be relied upon as indicative of the future results that you should expect from our investment vehicles and are not indicative of the future results of our insurance subsidiaries or our balance assets. In particular, the future results may differ significantly from their historical results for the following reasons, among others:
•the rates of returns of our investment vehicles reflect unrealized gains as of the applicable valuation date that may never be realized, which may adversely affect the ultimate value realized from their investments;
83
•certain historical returns that we present in this report are based on the performance of our historical private equity funds, the results of which have already been realized and are significantly less relevant for raising capital for our future investment vehicles;
•the future performance of our investment vehicles will be affected by various market and economic conditions and other factors;
•in some historical periods, the rates of return of some of our investment vehicles have been positively influenced by a number of investments that experienced a substantial decrease in the average holding period of such investments and rapid and substantial increases in value following the dates on which those investments were made; those trends and rates of return may not be repeated in the future as the actual or expected length of holding periods related to investments is likely longer than such historical periods;
•our newly established investment vehicles may generate lower returns during the period that they take to deploy their capital, which may result in little or no carried interests due to performance hurdles;
•our investment vehicles' returns have benefited from investment opportunities and various market and economic conditions in certain historical periods that may not repeat themselves;
•we may create new investment vehicles and investment products in the future that reflect a different asset mix in terms of allocations among investment vehicles, investment strategies, geographic and industry exposure, vintage year and economic terms; and our historical rates of return reflect our historical cost structure, which has varied and may vary further in the future.
Future returns will also be affected by the risks described elsewhere in this report, including risks of the industry sectors and businesses in which a particular investment is made and changes in laws. Future results of our insurance business may also be different than its historical performance as a result of various factors. See “—Risks Related to Our Insurance Activities—The Global Atlantic acquisition may not achieve its intended benefits, and certain difficulties, costs or expenses may outweigh such intended benefits.”
Our valuation methodologies for certain assets can be subjective, and the fair value of assets established pursuant to such subjective methodologies is uncertain and may never be realized.
There are no readily ascertainable market prices for a substantial majority of illiquid investments held by us and our investment vehicles. When determining fair values of investments, we use the last reported market price as of the applicable statement of financial condition date for investments that have readily observable market prices. When an investment does not have a readily available market price, the fair value of the investment represents the value, as determined by us in good faith, at which the investment could be sold in an orderly disposition over a reasonable period of time between willing parties other than in a forced or liquidation sale. There is no single standard for determining fair value in good faith, and in many cases fair value is best expressed as a range of fair values from which a single estimate may be derived. For our illiquid investments, we use a variety of valuation methodologies, including a market multiples approach and discounted cash flow analysis, and we engage third parties to assist us with certain aspects of our valuations. These methodologies typically require estimates of key inputs and significant assumptions and judgments. We also consider a range of additional factors that we deem relevant, for example, the applicability of a control premium or illiquidity discount, and determining these factors may involve a significant degree of our management's judgment and the judgment of management of our portfolio companies. For information about our valuation methodologies and processes, please see “Note 2—Summary of Significant Accounting Policies—Fair Value Measurements.”
Because valuations, and in particular valuations of investments for which market quotations are not readily available, are inherently uncertain, may fluctuate over short periods of time and are typically based on estimates and significant assumptions and judgments, determinations of fair value may differ materially from the values that would have resulted if a readily observable market price had existed. Even if market quotations are available for our investments, such quotations may not reflect the value that we would actually be able to realize because of various factors, including possible illiquidity associated with a large ownership position, subsequent illiquidity in the market for a company's securities, future market price volatility or the potential for a future loss in market value based on poor industry conditions or the market's view of overall company and management performance. Our financial results could be adversely affected if the values of investments that we record is materially higher than the values that are ultimately realized upon the disposal of the investments, and changes in values attributed to investments from quarter to quarter may result in volatility in our AUM, which could materially affect our financial results that we report from period to period. There can be no assurance that the investment values that we record from time to time will ultimately be realized, including the investment values that are presented in this report.
84
Because there is significant uncertainty in the valuation of, or in the stability of the value of, illiquid investments, the fair values of investments reflected in an investment vehicle's net asset value (“NAV”) do not necessarily reflect the prices that would actually be obtained by us on behalf of the investment vehicle when such investments are realized. For example, there may be known or unknown liabilities such as tax exposures with respect to investments, especially those outside the United States, which may not be fully reflected in valuations. Realizations at values significantly lower than the values at which investments have been reflected in a prior investment vehicle's NAVs would result in losses for the applicable investment vehicle and the loss of any accrued carried interest and other fees. Also, if realizations of our investments produce values materially different than the carrying values reflected in a prior investment vehicle's NAVs, investors in such vehicles may lose confidence in us, which could in turn result in difficulty in raising capital for future funds or other investment vehicles. In addition, because we value our entire portfolio using the methodologies described in this report only on a periodic basis, subsequent events that may have a material impact on those valuations may not be reflected until the next periodic valuation date.
In addition, the range of potential valuation methodologies and the potential exercise of our subjective judgment in determining valuation might cause some of our investors or regulators to question our valuations or methodologies. There can be no assurance that our policies will address all necessary valuation factors or completely eliminate potential conflicts of interest in such determinations or that we will be able to achieve some valuations. The SEC continues to focus on issues related to valuation of private investment vehicles, including consistent application of the methodology, disclosure, and conflicts of interest, in its enforcement, examination, and rulemaking activities. Changes in these factors can have a significant effect on the results of the valuation methodologies used to value our portfolio, and our reported fair values for these assets could vary materially if these factors from prior quarters were to change significantly.
Various market and economic conditions and events outside of our control that are difficult to quantify or predict may have a significant impact on the valuation of our investments and, therefore, on our financial results.
Global equity markets, which have been and are expected to continue to be volatile, significantly impact the valuation of our equity investments in portfolio companies. For our equity investments that are publicly listed and thus have readily observable market prices, global equity markets have a direct impact on valuation, because their values are determined by their listed prices in the public markets. For our equity investments that are not publicly listed, global equity markets have an indirect impact on valuation as we often utilize market multiples (i.e., stock price of comparable companies divided by earnings or cash flow) as a critical input to ascertain fair value of our investments that do not have readily observable market prices. In our private equity business, a substantial amount of investments are in equities, so a change in global equity prices or in equity market volatility is expected to significantly impact the value of our private equity investments. Therefore, if equity valuations decline (due to multiple contraction or otherwise), then performance of our private equity portfolio may be materially and adversely impacted. In our insurance business, a change in equity prices also impacts our equity-linked annuity and life insurance products, including with respect to hedging costs related to and fee-income earned on those products.
The credit markets can also impact the valuations of our equity investments in portfolio companies. For example, we typically use a discounted cash flow analysis as one of the methodologies to ascertain the fair value of many of our investments that do not have readily observable market prices. If applicable interest rates rise, then the assumed cost of capital for the equity investments in our portfolio companies would be expected to increase under the discounted cash flow analysis, and this effect would negatively impact their valuations if not offset by other factors. Conversely, a fall in interest rates can positively impact valuations of equity investments in certain portfolio companies if not offset by other factors. For example, the positive impact of falling interest rates on discounted cash flow valuations may offset the negative impact of the market multiples valuation approach, and may result in less of a decline in value than for those publicly listed equity investments.
Rising U.S. interest rates may also negatively impact certain foreign currencies that depend on foreign capital flows. Higher interest rates in conjunction with slower growth or weaker currencies in some emerging market economies have caused, and may further cause, the default risk of these countries and companies that operate predominantly in those countries to increase, and this could impact the value of our investments in portfolio companies that operate in these regions. Rising interest rates typically create downward pressure on the price of real estate and the value of fixed-rate debt investments made by our funds or our insurance segment. Finally, low interest rates related to monetary stimulus and economic stagnation may also negatively impact expected returns on certain investments as the demand for relatively higher returning assets increases and supply decreases.
85
The credit markets directly impact the valuations of the credit investments that we (including our insurance subsidiaries) and our investment vehicles own. Interest income earned from debt investments with floating interest rates should increase if the applicable benchmark interest rate were to rise, and the reverse is true if the applicable benchmark interest rate were to decline. However, during periods of rising interest rates, the obligor of such floating rate debt may become less able to pay its debt obligations, which could have the effect of impairing the value of its debt obligations. For debt investments with fixed interest rates, changes in interest rates generally will also cause the value of the fixed rate debt to vary inversely to such changes, although any losses or gains would in most cases not be realized if the fixed rate debt is held to maturity.
Foreign exchange rates can materially impact the valuations of our investments that are denominated in currencies other than the U.S. dollar. Factors that may affect currency values include trade balances, the ability of countries to pay their national debt, levels of short-term interest rates, differences in relative values of similar assets in different currencies, long-term opportunities for investment and capital appreciation and political developments. We make investments and receive capital commitments that are denominated in currencies other than the U.S. dollar. The appreciation or depreciation of the U.S. dollar is expected to contribute to a decrease or increase, respectively, in the U.S. dollar value of our non-U.S. investments to the extent unhedged. In addition, an appreciating U.S. dollar would be expected to make the exports of U.S.-based companies less competitive, which may lead to a decline in their export revenues, if any, while a depreciating U.S. dollar would be expected to have the opposite effect. For our investments denominated in currencies other than the U.S. dollar, the depreciation in such currencies will generally contribute to the decrease in the valuation of such investments, to the extent unhedged, and adversely affect the U.S. dollar equivalent revenues of portfolio companies with substantial revenues denominated in such currencies, while the appreciation in such currencies would be expected to have the opposite effect. Areas that have central bank quantitative easing or tightening campaigns affecting their interest rates relative to the United States could potentially experience further currency volatility relative to the U.S. dollar. In addition, various countries and regulatory bodies may implement controls on foreign exchange and outbound remittances of currency, which could impact the value, in U.S. dollars, of our investments.
Conditions in commodity markets impact the valuations of our portfolio companies and other investments in a variety of ways, including through the direct or indirect impact on the cost of the inputs used in their operations, as well as the pricing and profitability of the products or services that they sell. The price of commodities has historically been subject to substantial volatility, which among other things, could be driven by economic, monetary, political or weather-related factors. If the operating partners for certain of our investments or our portfolio companies are unable to raise prices to offset increases in the cost of raw materials or other inputs, or if customers defer purchases of or seek substitutes for these products, these investments or portfolio companies could experience lower operating income which may in turn reduce their valuation. With respect to our energy investments, when commodity prices decline, or if a decline is not offset by other factors, we would expect the value of these investments to be adversely impacted, to the extent unhedged. In general, we expect downward price movements to have a negative impact on the fair value of our energy portfolio, all other things being equal, given those commodity prices are an input in our valuation models. The reverse is true for upward price movements. However, because we may use near-term commodity derivative transactions to hedge our exposures, long-term oil and natural gas prices may be a more significant driver of the valuation of our energy investments than spot prices. Apart from our direct energy investments, a number of our other investments may be dependent to varying degrees on the energy sector through, for example, the provision of equipment and services used in energy exploration and production. These companies may also benefit from an increase or suffer from a decline in commodity prices.
The market values of commercial real estate assets are subject to volatility and may be adversely affected by a number of factors, including, but not limited to, national, regional and local economic conditions (which may be adversely affected by industry slowdowns and other factors); local real estate conditions; changes or continued weakness in specific industry segments; construction quality, age and design; demographic factors; retroactive changes to building or similar codes, tenant demand, market occupancy and rental rate trends, and capitalization rates and valuation trends. The macroeconomic environment, prevailing real estate fundamentals and micro-market dynamics where real estate property is located are all factors that impact valuations of our real estate investments. Office real estate valuations in the U.S. and globally, in particular, proved to be highly volatile during 2023 as a based on a variety of more challenging macroeconomic fundamentals described above, including as a result of tenant demand and employees of potential tenants continuing to work from home at a higher frequency than many expected.
86
The valuations of our investments can be impacted by many other factors unrelated to market or economic conditions, including (i) geopolitical developments and other local and global events, (ii) natural disasters and catastrophes, including public health crises, (iii) data security breaches and cyber-security failures, and (iv) material litigations, governmental sanctions, or the failure to comply with applicable law. The valuation of our investments may also be impacted by other factors that may or may not be foreseeable or in our control, for example: decreasing revenues, increasing costs, credit rating downgrades, difficulty in obtaining financing on attractive terms or at all, financial losses, contractual defaults, or insolvency. These and other risks that have impacted, and may continue to affect, the valuation of our investments are described in “—Risks Related to Our Business,” as most of these risks to our business also are risks to the valuation of our investments.
To the extent these and other risks were to occur to one of our portfolio companies or other investments, then it is likely that the value of such investment would be materially and adversely affected, which would be expected to contribute to an adverse impact to our financial results.
Our investment activities have significant liquidity requirements, and changes in debt or equity markets may materially and adversely affect our investment activities.
Our liquidity requirements are significant and, in some cases, involve capital that will remain invested for extended periods of time or, in other cases, involve capital that is able to be withdrawn more frequently by investment vehicle investors, subject to certain limits. Commitments to our investment vehicles and our insurance subsidiaries will require significant cash outlays over time, and there can be no assurance that we will be able to generate sufficient cash flows from realizations of investments to fund them or achieve the valuations of such investments.
Moreover, our investment vehicles and our insurance subsidiaries use leverage to fund their investments and to enhance their returns. For example, our investment vehicles regularly seek to have credit facilities as subscription lines to bridge capital commitments. If a lender under one or more of our or our investment vehicles’ credit lines were to become insolvent, we may have difficulty replacing the credit line and one or more of our investment vehicles may face disruptions in operations. In addition, concerns about, or a default by, one large market participant could lead to significant liquidity problems for other market participants, which may in turn expose us to significant losses. Counterparty default risk may arise from events or circumstances that are difficult to detect, foresee or evaluate. We may not accurately anticipate the impact of market stress or counterparty financial condition, and as a result, we may not have taken sufficient action to reduce these risks effectively, which, if left unmitigated, could have a material adverse effect on our investments.
Liquidity conditions in both equity and credit capital markets may tighten and affect the availability and cost of capital for our investment vehicles’ portfolio companies. For example, changes in the debt financing markets may negatively impact our ability to obtain attractive financing for our investments or to refinance existing debt, and may increase the cost of such financing or refinancing if it is obtained, which could lead to lower-yielding investments and potentially adversely impact our financial results or negatively impact our business in other ways. With respect to our private equity and real assets businesses, if we are unable to obtain committed debt financing for potential acquisitions or can only obtain debt at an increased interest rate or on unfavorable terms, we may have difficulty completing otherwise profitable acquisitions or may generate lower profits, either of which could lead to a decrease in the investment income earned by us. Any failure by lenders to provide previously committed financing can also expose us to potential claims by sellers of businesses that we may have contracted to purchase. Similarly, the issuance of CLOs relies on the use of leverage, including various secured and unsecured borrowings.
Our ability to generate returns on these assets would be reduced to the extent that changes in market conditions, including changes to short-, medium- or long-term interest rates, cause the cost of our financing to increase relative to the income that can be derived from the assets acquired or financed. An increase in either the general levels of interest rates or in the risk spread demanded by lenders or other debt holders would also make it more expensive to finance investments. During periods of rising or higher interest rates, certain investments with floating interest rate loans may have greater challenges in meeting their debt service obligations if their benchmark interest rates were to rise materially, or if these investments’ lenders or debt holders generally are unwilling to extend or refinance their loans or debt securities on similarly attractive terms. Any of these events could result in defaults, foreclosures or bankruptcies, which would likely reduce the value of our investments and could result in decreased net income. An increase in interest rates and other changes in the financial markets could also negatively impact the values of certain assets or investments and the ability of our balance sheet assets, funds and their portfolio companies may be negatively impacted, which could impair the value of our investment in those portfolio companies and lead to a decrease in the investment income earned by us. In some cases, the inability of our portfolio companies to refinance or extend maturities may result in the inability of those companies to repay debt at maturity or pay interest when due, and may cause those companies to sell assets, undergo a recapitalization or seek bankruptcy protection, any of which would also likely impair the value of our investment and lead to a decrease in investment income earned by us.
87
Similarly, our portfolio companies regularly utilize the corporate debt markets in order to obtain financing for operations. To the extent that credit markets render such financing difficult to obtain or more expensive, this may negatively impact the operating performance of us and these portfolio companies. In addition, to the extent that conditions in the credit markets impair the ability of our portfolio companies to refinance or extend maturities on their outstanding debt, either on favorable terms or at all, the operating performance of those portfolio companies may be negatively impacted, which could impair the value of our investment in those portfolio companies and lead to a decrease in the investment income earned by us. In some cases, the inability of our portfolio companies to refinance or extend maturities may result in the inability of those companies to repay debt at maturity or pay interests when due, and may cause the companies to sell assets, undergo a recapitalization or seek bankruptcy protection, any of which would also likely impair the value of our investment and lead to a decrease in the investment income earned by us.
In addition, counterparties have generally reacted to recent market volatility by tightening their underwriting standards and increasing their margin requirements for all categories of financing, which has the result of decreasing the overall amount of leverage available and increasing the costs of borrowing. Many of our investment vehicles have credit lines, and if a lender under one or more of these credit lines were to become insolvent, we may have difficulty replacing the credit line and one or more of our investment vehicles may face liquidity problems. Default risk may arise from events or circumstances that are difficult to detect, foresee or evaluate. In addition, concerns about, or a default by, one large market participant could lead to significant liquidity problems for other market participants, which may in turn expose us to significant losses. We may not accurately anticipate the impact of market stress or counterparty financial condition, and as a result, we may not have taken sufficient action to reduce these risks effectively, which, if left unmitigated, could have a material adverse effect on our investments.
In addition, LIBOR and certain other floating rate benchmark indices to which our floating rate debt historically was tied to are the subject of recent national, international and regulatory guidance and reforms. Transition away from LIBOR as a benchmark reference for interest rates may affect the cost of capital and require amending or restructuring existing debt instruments and related hedging arrangements for our investment vehicles and our portfolio companies, and may impact the value of floating rate securities or loans based on LIBOR that we (including our insurance subsidiaries) or our investment vehicles have held, all of which may result in additional costs or adversely affect our investments.
In January 2021, International Swaps and Derivatives Association amended the definitions used in derivative contracts to incorporate Secured Overnight Financing Rate (“SOFR”) as the successor rate to LIBOR. Furthermore, on December 16, 2022, the U.S. Board of Governors of the Federal Reserve System (the “Federal Reserve Board”) adopted the final rule that implements the Adjustable Interest Rate (LIBOR) Act by identifying benchmark rates based on SOFR that replaced LIBOR in certain financial contracts after June 30, 2022. Remaining tenors of USD LIBOR ceased to be published as of June 30, 2023 in the United States, and SOFR became the predominant replacement for LIBOR. On April 3, 2023, the FCA announced its decision to require LIBOR’s administrator to continue to publish certain LIBOR short tenors pursuant to an unrepresentative synthetic methodology through September 30, 2024 and thereafter is expected to be permanently discontinued.
Certain credit assets held by our investment vehicles and our insurance subsidiaries and long-term indebtedness incurred by our investment vehicles, our insurance subsidiaries and our portfolio companies may have residual exposure that bears interest at variable interest rates, including rates linked to LIBOR. We, our investment vehicles and our portfolio companies have other LIBOR-based debt instruments and related hedging arrangements that may require amending or restructuring, which may be difficult, costly and time consuming. In situations where our existing LIBOR-based contracts do not contain clear fallback language governing the transition to a successor reference rate, we or our investment vehicles could incur increased costs, including litigation-related costs, related to the determination of an appropriate successor rate.
Dependence on significant leverage in our investments could adversely affect our ability to achieve attractive rates of return on those investments.
Because many of our investments often rely heavily on the use of leverage, our ability to achieve attractive rates of return will depend on our continued ability to access sufficient sources of indebtedness at attractive rates, which are based, in part, on market interest rates that can fluctuate along with other market and economic conditions. Our credit funds and insurance companies use varying degrees of leverage when making investments. Similarly, private equity investments often include the issuance of high yield debt securities or leveraged loans. In many private equity investments, indebtedness may constitute a substantial majority of a portfolio company's total capitalization. The absence of available sources of sufficient debt financing for extended periods of time could therefore materially and adversely affect our investment vehicles and our portfolio companies.
88
In June 2011, the Basel Committee on Banking Supervision, an international body comprised of senior representatives of bank supervisory authorities and central banks from 27 countries, including the United States, announced the final framework for a comprehensive set of capital and liquidity standards, commonly referred to as “Basel III,” for internationally active banking organizations and certain other types of financial institutions. These standards have generally required banks to hold more capital than under the previous capital framework, reduce leverage and improve liquidity standards, and bank supervisory authorities, including in the United States, which may in the future, adopt additional related standards that require banks to further increase their capital or liquidity. U.S. federal banking regulators have adopted, and continue to adopt, update and amend, final regulations to implement these standards for U.S. banking organizations. These and similar banking regulations implemented by federal and state banking regulators may limit the amount or availability of debt financing, may increase the cost of financing we are able to obtain for our transactions and may cause the returns on our investments to suffer.
When our existing portfolio investments reach the point when debt incurred to finance those investments matures in significant amounts and must be either repaid or refinanced, those investments may materially suffer if they have generated insufficient cash flow to repay maturing debt and there is insufficient capacity and availability in the financing markets to permit them to refinance maturing debt on satisfactory terms, or at all. If the financing for such purposes were to be unavailable or uneconomic when significant amounts of the debt incurred to finance our existing portfolio investments start to come due, these investments could be materially and adversely affected. In the event of default or potential default under applicable financing arrangements, one or more of our portfolio companies may go bankrupt, which could give rise to substantial investment losses, adverse claims or litigation against us or our employees and damage to our reputation.
Among the sectors particularly challenged by downturns in the global credit markets are the CLO and leveraged finance markets. We have significant exposure to these markets through our CLO vehicles. There can be no assurance that market conditions giving rise to these types of consequences will not occur, re-occur, subsist or become more acute in the future. Our CLO vehicles have historically experienced an increase in downgrades, depreciations in market value and defaults in respect of leveraged loans in their collateral during downturns in credit markets. Because our CLO structures involve complex collateral and other arrangements, the documentation for such structures is complex, is subject to differing interpretations and involves legal risk. Each of these vehicles is a special purpose company that issues to us and other investors notes secured by a pool of collateral consisting primarily of corporate leveraged loans. In most cases, our CLO holdings are deeply subordinated, representing the CLO vehicle's substantial leverage, which increases both the opportunity for higher returns as well as the magnitude of losses when compared to holders or investors that rank more senior to us in right of payment. These loans and bonds also generally involve a higher degree of risk than investment grade rated debt, including the risks described in the paragraphs above. The CLOs' portfolio profile tests set limits on the amount of discounted obligations a CLO can hold. During any time that a CLO issuer exceeds such a limit, the ability of the CLO's manager to sell assets and reinvest available principal proceeds into substitute assets is restricted. In such circumstances, CLOs may fail certain over-collateralization tests, which would cause diversions of cash flows away from us as holders of the more junior CLO, which may impact our cash flows. The ability of the CLOs to make interest payments to the holders of the senior notes of those structures is highly dependent upon the performance of the CLO collateral. If the collateral in those structures were to experience a significant decrease in cash flow due to an increased default level, payment of all principal and interest outstanding may be accelerated as a result of an event of default or by holders of the senior notes. An inability to continue to utilize CLOs or other similar financing vehicles successfully could limit our ability to fund future investments, grow our business or fully execute our business strategy and we may be materially and adversely affected. Many of our credit-oriented investment vehicles, including CLO vehicles, regularly use significant leverage to finance their assets. An inability of such vehicles to continue to raise or utilize leverage, to refinance or extend the maturities of their outstanding indebtedness or to maintain adequate levels of collateral under the terms of their CLOs limit their ability to grow their business, reinvest principal cash, distribute cash to us or fully execute their business strategy, and our results of operations may be materially and adversely affected. If these vehicles are unable to maintain their operating results and access to capital resources, they could face substantial liquidity problems and might be required to dispose of material assets or operations to meet debt service and other obligations. These CLO strategies and the value of the assets of such CLO vehicles are also sensitive to changes in interest rates because these strategies rely on borrowed money and because the value of the underlying portfolio loans can fall when interest rates rise. If interest rates on CLO borrowings increase and the interest rates on the portfolio loans do not also increase, the CLO strategy is unlikely to achieve its projected returns. Also, if interest rates increase in the future, our CLO portfolio will likely experience a reduction in value because it would hold assets receiving below market rates of interest.
89
Our credit-oriented funds and CLOs may choose to use leverage as part of their respective investment programs and regularly borrow a substantial amount of their capital. The use of leverage poses a significant degree of risk and enhances the possibility of a significant loss in the value of the investment portfolio. A fund may borrow money from time to time to purchase or carry securities or debt obligations or may enter into derivative transactions (such as total return swaps) with counterparties that have embedded leverage. The interest expense and other costs incurred in connection with such borrowing may not be recovered by appreciation in the securities or debt obligations purchased or carried and will be lost—and the timing and magnitude of such losses may be accelerated or exacerbated—in the event of a decline in the market value of such securities or debt obligations. Gains realized with borrowed funds may cause the fund's NAV to increase at a faster rate than would be the case without borrowings. However, if investment results fail to cover the cost of borrowings, the fund's NAV could also decrease faster than if there had been no borrowings.
Any decrease in the value of credit instruments that we have invested in or any increase in the cost of credit financing would reduce our returns and decrease our net income.
Various exposures to, and investments in, the securities of leveraged companies or companies that are experiencing significant financial or business difficulties involve significant risks.
We have equity and debt investments in companies that have a significant amount of leverage as well as companies that are currently experiencing, or in the future may experience, significant financial or business difficulties. Our traditional private equity funds typically finance their equity investment in a portfolio company with high yield debt securities and/or leveraged loans. Our real assets funds also often finance a portion of their investment using debt. Certain credit investment vehicles, including CLOs, also hold securities or financial instruments of highly leveraged companies, other companies that are experiencing significant financial or business difficulties or otherwise below investment grade debt. Investments in leveraged companies or companies experiencing financial or business difficulties generally entail greater risk, and such investments are also inherently more sensitive to declines in their company’s revenues, increases in their company’s expenses, interest rate changes, and other adverse economic, market and industry developments. High yield, below investment grade or unrated debt is often less liquid than investment grade rated debt, and loans and other forms of debt that are not marketable securities are also not liquid. For further information about the fair market value of investment grade corporate loans and securities we indirectly hold through our CLO vehicles that have a below investment grade rating as of December 31, 2023, see Note 2 "Summary of Significant Accounting Policies—Significant Account Policies - Asset Management—Investments" in our financial statements
The incurrence of a significant amount of indebtedness by a company could, among other things, subject the entity to a number of restrictive covenants, terms and conditions, any violation of which would be viewed by creditors as an event of default and could materially impact our ability to realize value from our investment; allow even moderate reductions in operating cash flow to render it unable to service its indebtedness; give rise to an obligation to make mandatory prepayments of debt using excess cash flow, which might limit the company’s ability to respond to changing industry conditions to the extent additional cash is needed for the response, to make unplanned but necessary capital expenditures or to take advantage of growth opportunities; limit the entity's ability to adjust to changing market conditions, thereby placing it at a competitive disadvantage compared to its competitors who have relatively less debt; limit the company’s ability to engage in strategic acquisitions that might be necessary to generate attractive returns or further growth; and limit the company’s ability to obtain additional financing or increase the cost of obtaining such financing, including for capital expenditures, working capital or other general corporate purposes.
A leveraged company's income and equity also tend to increase or decrease at a greater rate than would otherwise be the case if money had not been borrowed. As a result, the risk of loss associated with a leveraged company is generally greater than for comparable companies with comparatively less debt. For example, leveraged companies could default on their debt obligations due to a decrease in revenues and cash flow precipitated by an economic downturn or by poor relative performance at such a company. Similarly, the leveraged nature of some of our investments in real assets increases the risk that a decline in the fair value of the underlying real asset will result in their abandonment or foreclosure. In the absence of appropriate hedging measures, changes in interest rates generally will also cause the value of fixed rate debt investments to vary inversely to such changes. The obligor of a debt security or instrument may not be able or willing to pay interest or to repay principal when due in accordance with the terms of the associated agreement and collateral may not be available or sufficient to cover such liabilities. Commercial bank lenders and other creditors may be able to contest payments to the holders of other debt obligations of the same obligor in the event of default under their commercial bank loan agreements. Sub-participation interests in syndicated debt may be subject to certain additional risks as a result of having no direct contractual relationship with underlying borrowers. Debt securities and instruments may be rated below investment grade by recognized rating agencies or unrated and face ongoing uncertainties and exposure to adverse business, financial or economic conditions and the issuer's failure to make timely interest and principal payments.
90
Certain of our investment vehicles, especially in our strategic investment group credit strategy, may hold interests in business enterprises involved in work-outs, liquidations, reorganizations, bankruptcies and similar transactions and may purchase high-risk receivables. An investment in such business enterprises entails the risk that the transaction in which such business enterprise is involved either will be unsuccessful, will take considerable time or will result in a distribution of cash or a new security the value of which will be less than the purchase price to the fund of the security or other financial instrument in respect of which such distribution is received. In addition, if an anticipated transaction does not in fact occur, we or the fund may be required to sell the investment at a loss. Investments in troubled companies may also be adversely affected by U.S. federal and state and non-U.S. laws relating to, among other things, fraudulent conveyances, voidable preferences, lender liability and a bankruptcy court's discretionary power to disallow, subordinate or disenfranchise particular claims. Investments in securities and private claims of troubled companies made in connection with an attempt to influence a restructuring proposal or plan of reorganization in a bankruptcy case may also involve substantial litigation, which has the potential to adversely impact us or unrelated investment vehicles or portfolio companies. Companies that were not in financial distress at the time we or our investment vehicles made investments may in the future require work-outs, liquidations, reorganizations, bankruptcies or similar transactions, and as a result, become subject to the same risks described above. Because there is substantial uncertainty concerning the outcome of transactions involving financially troubled companies, there is a potential risk of loss of the entire investment in such company. Such investments involve a substantial degree of risk, and a decline in value of the assets would have a material adverse effect on our financial performance.
Our equity investments and some of our debt investments rank junior to investments made by others, exposing us to greater risk of losing our investment.
In addition, in many cases, the companies in which we or our investment vehicles invest have, or are permitted to have, outstanding indebtedness or equity securities that rank senior to our or our investment vehicle's investment. By their terms, such instruments may provide that their holders are entitled to receive payments of distributions, interest or principal on or before the dates on which payments are to be made in respect of our or our investment vehicle's investment. Also, in the event of insolvency, liquidation, dissolution, reorganization or bankruptcy of a company in which an investment is made, holders of securities ranking senior to our investment would typically be entitled to receive payment in full before distributions could be made in respect of our investment. In addition, debt investments made by us or our investment vehicles in our portfolio companies may be equitably subordinated to the debt investments made by third parties in our portfolio companies. After repaying senior security holders, the company may not have any remaining assets to use for repaying amounts owed in respect of our investment. To the extent that any assets remain, holders of claims that rank equally with our investment would be entitled to share on an equal and ratable basis in distributions that are made out of those assets. Also, during periods of financial distress or following insolvency, the ability of us or our investment vehicles to influence a company's affairs and to take actions to protect an investment will likely be substantially less than that of the senior creditors.
The due diligence process that we undertake in connection with our investments may not reveal all facts that may be relevant in connection with an investment.
Before making our investments, we conduct due diligence that we believe to be reasonable and appropriate based on the facts and circumstances applicable to each investment. The objective of the due diligence process is to identify attractive investment opportunities based on the facts and circumstances surrounding an investment, to identify possible risks associated with that investment and, in the case of private equity investments, to prepare a framework that may be used from the date of an acquisition to drive operational achievement and value creation. When conducting due diligence, we typically evaluate a number of important business, financial, tax, accounting, ESG, technological, cyber-security, data privacy, regulatory and legal issues in determining whether or not to proceed with an investment. Outside consultants, legal advisors, accountants and investment banks are involved in the due diligence process in varying degrees depending on the type of investment. Nevertheless, when conducting due diligence and making an assessment regarding an investment, we rely on resources available to us, including information provided by the target of the investment and, in some circumstances, third-party investigations. The due diligence process may at times be subjective with respect to newly organized companies or carve-out transactions for which only limited information is available.
Instances of bribery, fraud, accounting irregularities and other improper, illegal or corrupt practices can be difficult to detect, and fraud and other deceptive practices can be widespread in certain jurisdictions. Several of our investment vehicles invest in emerging market countries that may not have established laws and regulations that are as stringent as in more developed nations, or where existing laws and regulations may not be consistently enforced. For example, our investment vehicles invest throughout jurisdictions that have material perceptions of corruption according to international rating standards. Due diligence on investment opportunities in these jurisdictions is frequently more complicated because consistent and uniform commercial practices in such locations may not have developed. Bribery, fraud, accounting irregularities and corrupt practices can be especially difficult to detect in such locations.
91
The due diligence conducted for certain of our strategies is limited to publicly available information. Accordingly, we cannot be certain that the due diligence investigation that we will carry out with respect to any investment opportunity will reveal or highlight all relevant considerations that may be necessary or helpful in evaluating such investment opportunity, including the existence of contingent liabilities. We also cannot be certain that our due diligence investigations will result in investments being successful or that the actual financial performance of an investment will not fall short of the financial projections we used when evaluating that investment.
We often pursue investment opportunities that involve unique business, regulatory, legal or other complexities, including complexities arising from the large size of our investment or from a lack of control over the investment, which involves significant risks.
We often pursue complex investment opportunities, which can often involve substantially greater business, regulatory or legal complexities compared to investments made by traditional asset managers. Our tolerance for complexity presents risks, as such transactions can be more difficult, expensive and time consuming to finance and execute, and it can be more difficult to manage or realize value from these types of investments. Other risks that are often inherent in these kinds of transactions include the following:
•Our transactions may entail a high level of regulatory scrutiny, and our investment may be subject to complex regulatory requirements and instances of non-compliance at the investment level may subject us to reputational harm or, in certain cases, liability.
•Our transactions may involve complex tax structuring that could be challenged or disregarded, which may result in losing treaty benefits or would otherwise adversely impact our investments. These complex tax structures are costly to establish, monitor and maintain, and as we pursue a larger number of transactions across multiple assets classes and in multiple jurisdictions, such costs will increase and the risk that a tax matter is overlooked or inadequately or inconsistently addressed will increase.
•We or our investment vehicles may acquire an investment that is subject to significant liabilities, including contingent liabilities, which could be unknown to us at the time of acquisition or, if they are known to us, we may not accurately assess or protect against the risks that they present, which could result in material unforeseen losses.
•We rely on the management of our portfolio companies or other third party operators to provide for financial projections and other information about their companies, businesses or assets, which may not be accurate or realistic and thus could result in performance to fall short of our expectations or even result in bankruptcy. We also rely on the management of our portfolio companies or other third party operators, and their systems and processes, for ongoing financial and other information in support of the valuations of our investments in or with them.
•In connection with the disposition of an investment in a portfolio company, we or an investment vehicle may be required to make representations about the business and financial affairs of such portfolio company typical of those made in connection with the sale of a business, and we or our investment vehicles may also be required to indemnify the purchasers of such investment to the extent that any such representations are inaccurate; these arrangements may result in the incurrence of contingent liabilities by us or an investment vehicle, even after the disposition of an investment.
We often make investments in companies, businesses and assets that, in of themselves, involve a high degree of risk, including those: (1) that have limited financial resources and may be unable to meet their obligations under their outstanding indebtedness, which may be accompanied by a significant deterioration in the value of their equity securities or any collateral or guarantees provided with respect to their debt, (2) that significantly depend on their founders and other key persons, the loss of whom could materially and adversely impact the investment, (3) that are businesses or divisions acquired from larger operating entities that require significant and costly rebuilding or replacement of business operations functions, (4) that are subject to litigation or regulatory scrutiny or may be at risk of having significant failures to comply with law (including practices or issues which may not be discovered through due diligence), (5) that are engaged in rapidly changing businesses with products subject to a substantial risk of obsolescence and require substantial additional capital to support their operations, finance expansion or maintain their competitive position, and (6) that operate in an industry that is subject to extensive domestic and foreign regulation (including companies that supply services to governmental agencies), such as the financial services industry, telecommunications industry, defense and government services industry, healthcare industry, oil and gas industry, waste management industry and food industry.
92
In addition, as we depend on the efforts, skills, reputations, business contacts, and conduct of individuals affiliated with our portfolio companies (including employees of such portfolio companies), we may be adversely affected, including our reputation, if there is misconduct by senior management or other employees of portfolio companies in which we invest, including through successor liability, and we may be unable to control or mitigate such misconduct. Such misconduct may also negatively affect the valuation of our investments in such portfolio companies. See “—Risks Related to Our Business—We depend on the efforts, skills, reputations, business contacts, and conduct of our employees and our ability to retain our employees and to recruit prospective employees” for human capital-related risks that also are applicable for us with respect to portfolio companies and other investments.
We also make large private equity and real assets investments, which involve certain complexities and risks that are not encountered in small- and medium-sized investments. For example, larger transactions may be more difficult to finance and exiting larger deals may present incremental challenges. In addition, larger transactions may pose greater challenges in implementing changes in the company's management, culture, finances or operations, and may entail greater scrutiny by regulators, interest groups and other third parties. These constituencies may be more active in opposing larger investments by private equity firms. In some transactions, the amount of equity capital that is required to complete a large capitalization private equity or real asset transaction may be significant and may require significantly more capital than is then available for investment by our investment funds. The consequences to us and our investment vehicles of an unsuccessful larger investment could be more severe given the size of the investment. Moreover, we could be required to commit significant amounts of our capital to such large investments.
When we enter into large transactions where the overall size may exceed what we consider appropriate for our investment vehicles, we often seek to syndicate a portion of our capital commitment. A syndication transaction involves KKR seeking third parties to commit equity to our investments, typically as passive co-investors, so that our firm can retain a level of control over the investment. However, if we are unable to syndicate all or part of such commitment, or if such co-investors fail to fund their commitments, we may be required to fund the remaining commitment amount from our balance sheet. If we are required to keep on our balance sheet a large portion of the capital commitment that could not be syndicated to third parties, poor performance of such large investment may have a material adverse impact on our financial results. Alternatively, we may enter into consortium transactions, which involves an equity investment in which two or more firms serve as equity sponsors. Consortium transactions generally entail a reduced level of control by our firm over the investment because governance rights must be shared with the other consortium investors. Accordingly, we may not be able to control decisions, including decisions relating to the management and operation of the company and the timing and nature of any exit, which could result in the risks described herein.
In addition, we and our investment vehicles hold investments that include debt instruments and equity securities of companies that we do not control. Such instruments and securities may be acquired through trading activities or through purchases of securities from the issuer, or we may purchase such instruments and securities on a principal basis. Our investment vehicles may acquire minority equity interests, particularly when making private equity investments in Asia, making growth equity investments or sponsoring investments as part of an consortium transaction or through many of our credit funds. Our funds may also dispose of a portion of their majority equity investments in portfolio companies over time in a manner that results in the funds retaining a minority investment. Non-control investments will be subject to the risk that the company in which the investment is made may make business, financial or management decisions with which we do not agree, or that the majority stakeholders or the management of the company may take risks or otherwise act in a manner that does not serve our interests.
The failure of our investments, whether because of the material diminution of value, bankruptcy, failure to comply with laws, or otherwise, could subject us to various adverse effects in addition to adversely affecting our financial results, including causing us reputational harm, the diminished ability to raise successor funds or new investment vehicles, and limitations on our ability to invest in similar companies, regions or industries in the future.
93
We make investments that are highly concentrated by type of issuer, geographic region, asset types, or otherwise.
The governing agreements of our funds and other investment vehicles contain only limited investment restrictions and only limited requirements as to diversification of investments, either by geographic region or asset type. Our private equity funds generally permit up to 20% of the fund to be invested in a single company. We also manage funds that invest in a single asset class such as growth equity, infrastructure or real estate, or funds that focus on particular geographic region. Because a significant portion of an investment vehicle's capital may be invested in a single investment or portfolio company, a loss with respect to such investment or portfolio company could have a material adverse impact on such investment vehicle's capital. Accordingly, a lack of diversification on the part of an investment vehicle could materially and adversely affect an investment vehicle's performance. Similarly, our balance sheet has significant exposures to certain portfolio companies, in particular large investments in a small number of portfolio companies that we have made through our core private equity strategy. Because we hold interests in some of our portfolio companies both through our balance sheet investments in our private equity investment vehicles and direct co-investments, fluctuation in the fair values of these portfolio companies may have a disproportionate impact on the investment income earned by us as compared to other portfolio companies. In these circumstances, losses may have an even greater impact on us, as we would directly bear the full extent of such losses. As a result, our financial performance is expected to be subject to greater volatility depending on such companies' operating results and other idiosyncratic factors specific to such companies. See "Management's Discussion and Analysis of Financial Condition and Results of Operations—Non-GAAP Balance Sheet Measures" for information on significant investments held on our balance sheet, including a list of the 20 largest investments held on our balance sheet.
Many of our investments are illiquid, and we may fail to realize any profits from our investments for a considerable period of time or lose some or all of the capital invested.
We (including our insurance subsidiaries) and our investment vehicles hold investments in securities that are not publicly traded. In many cases, we may be prohibited by contract or by applicable securities laws from selling such securities at many points in time. We will generally not be able to sell these securities publicly unless their sale is registered under applicable securities laws, or unless an exemption from such registration is available, and then only at such times when we do not possess material nonpublic information. Our ability to dispose of investments is heavily dependent on the capital markets and in particular the public equity markets. For example, the ability to realize any value from an investment may depend upon the ability to complete an initial public offering of the portfolio company in which such investment is made. Even if the securities are publicly traded, large holdings of securities can often be disposed of only over a substantial length of time, exposing our investment returns to risks of downward movement in market prices during the intended disposition period. Moreover, because the investment strategy of many of our investment vehicles, particularly in our private equity strategy, often entails having representation on the public portfolio company’s board of directors, and we may be restricted in our ability to effect such sales during certain time periods. In addition, market conditions and the regulatory environment can also delay our ability to exit and realize value from these investments. For example, rising interest rates and challenging credit markets may make it difficult for potential buyers to raise sufficient capital to purchase our investments. Although the equity markets are not the only means by which we exit investments from our funds, the strength and liquidity of the U.S. and relevant global equity markets generally, and the initial public offering market specifically, affect the valuation of, and our ability to successfully exit, our equity positions in the portfolio companies of our funds in a timely manner. We may also realize investments through strategic sales. Difficult market and economic conditions could increase the cost of credit or cause a degradation in debt financing terms for potential buyers, either of which may adversely impact our ability to identify, execute and exit investments on attractive terms. When financing is not available or becomes too costly, it may be more difficult to find a buyer that can successfully raise sufficient capital to purchase our investments. In addition, volatile debt and equity markets may also make the exit of our investments more difficult to execute. Government policies regarding certain regulations, such as antitrust law, national security or restrictions on foreign investment in certain of our portfolio companies or assets can also limit our and our investment vehicles’ exit opportunities.
In addition, as many of our funds have a finite term, we could also be forced to dispose of investments sooner than otherwise desirable. Accordingly, under certain conditions, our funds may be forced to either sell their investments at lower prices than they had expected to realize or defer sales that they had planned to make, potentially for a considerable period of time. Moreover, with respect to investments that we hold directly, we may determine that we may be required to sell these investments alongside our funds’ investments at such times.
We also have made and expect to continue to make significant capital investments in our current and future funds and other investment vehicles. Contributing capital to these investment vehicles is risky, and we may lose some or all of the principal amount of our investments.
94
Our investments in real assets such as real estate, infrastructure and energy may expose us to increased risks and liabilities.
Investments in real assets, including in portfolio companies with significant holdings of these types of assets, which may include real estate, infrastructure, oil and gas properties and other energy assets, may expose us to increased risks and liabilities that are inherent in the ownership of real assets as compared to investments in other asset classes.
For example, investments in real assets may, among other things, involve the following risks.
•Our investment vehicles, and directly or indirectly KKR through our insurance subsidiaries or general partner interests in our funds, may be subject to increased risk of liability under environmental laws that impose, regardless of fault, joint and several liability for the cost of remediating contamination and compensation for damages. In addition, changes in environmental laws or regulations or the environmental condition of an investment may create liabilities that did not exist at the time of acquisition and may not have been foreseeable. Even in cases where we are indemnified by a seller with respect to an investment against liabilities arising out of violations of environmental laws and regulations, there can be no assurance as to the financial viability of the seller to satisfy such indemnities or our ability to achieve enforcement of such indemnities.
•Investments in real assets may be subject to additional risk of liability for personal and property injury, for which we may not be fully insured or indemnified, or impose significant operating challenges and costs, for example with respect to compliance with zoning, environmental or other applicable laws.
•Investments in real assets may be subject to construction risks, including: (i) labor disputes, shortages of material and skilled labor, or work stoppages; (ii) the availability and timely receipt of zoning and other regulatory or environmental approvals; (iii) the availability of construction financing on favorable terms, or at all; (iv) slower than projected construction progress and the unavailability or late delivery of necessary equipment; (v) less than optimal coordination with public utilities in the relocation of their facilities; (vi) natural disasters, adverse weather conditions and unexpected construction conditions; (vii) accidents or the breakdown or failure of construction equipment or processes; and (viii) catastrophic events such as explosions, fires and terrorist activities or cyberattacks, and other similar events. Recourse against the contractor may be subject to liability caps or may be subject to default or insolvency on the part of the contractor. These risks could create substantial unanticipated delays or expenses and, under certain circumstances, could result in prolonged construction periods or prevent completion of construction activities once undertaken, which could cause investments to not be cash generative for a prolonged period or indefinitely.
•Investments in real assets may involve significantly enhanced risks relating to significant catastrophic or force majeure events, which could materially and adversely affect us, including, among other effects, causing personal injury or loss of life, damage to property, or disruptions of service, any of which may result in permanent loss of customers, litigation, or penalties for regulatory or contractual non-compliance.
•The management of the business or operations of a real asset may be contracted to a third-party management company unaffiliated with us. Although it would be possible to replace any such operator, the failure of such an operator to adequately perform its duties or to act in ways that are in the best interest of the investment, or the breach by an operator of applicable agreements or laws, rules and regulations, including instances of bribery, fraud or other deceptive practices, could have a material adverse effect on us. Real asset investments may involve the subcontracting of activities in respect of projects, and as a result our investments are subject to the risk that contractual provisions passing liabilities to a subcontractor could be ineffective, the subcontractor fails to perform services that it has agreed to perform, and subcontractor insolvency.
•Technology advances, legislative changes, or changes in consumer’s preferences or ESG-focus may decrease the value of our real assets investments.
•Real assets may be especially prone to adverse consequences of climate change and prolonged and potentially accelerating changes in climatic conditions, together with the response or failure to respond to these changes, could have a significant impact on the revenues, expenses and conditions of real assets and our related investments. See "—Risks Related to Our Business—Natural disasters and catastrophes, including public health crises, and potential changes in climate conditions could materially and adversely affect KKR." Although we may invest in a diverse range of real assets, certain types of real assets are subject to heightened risks, including certain infrastructure assets, such as in the renewable energy industry, which is a rapidly evolving market and contractual arrangements related to air craft leasing are impacted by the cyclical and competitive attributes of the airline industry.
95
Without limiting the foregoing risks, investments that we manage and may make in the future in the oil and gas industry may present specific environmental, safety and other inherent risks. Such investments are subject to stringent and complex foreign, federal, state and local laws, ordinances and regulations specific to oil and gas industries, including, for example, those governing transportation, exploration and production of oil and natural gas. There are also various conservation laws and regulations applicable to oil and natural gas production and related operations, in addition to regulations governing occupational health and safety, the discharge of materials into the environment and other practices relating to environmental protection. Failure to comply with applicable laws, ordinances and regulations may result in the assessment of administrative, civil and criminal penalties, the imposition of remedial obligations, the incurrence of delays in the permitting, development or expansion of projects and the issuance of orders enjoining some or all of our operations in affected areas. These laws, ordinances and regulations may also restrict the rate of oil and natural gas production below the rate that would otherwise be possible, require additional permits for operations or require the installation of additional pollution control equipment, the costs of each of which could be material and reduce profitability. In addition to the risks listed above, our oil and gas investments are subject to other risks, such as:
•commodity price volatility and realized oil, natural gas and natural gas liquid (“NGL”) prices;
•adverse variations from estimates of reserves, production, prices and expenditure requirements, and associated inability to replace reserves through exploration and development activities;
•information technology failures or cyberattacks;
•for non-operated properties, dependence on the skill, ability and decisions of third-party operators, their exploration, development, drilling and completion activities, the timing and cost of drilling, completing and operating wells and their ability to comply with applicable laws, rules and regulations;
•political and economic conditions and events in foreign oil, natural gas and NGL producing countries, including embargoes, continued hostilities in the Middle East and other sustained military campaigns, the armed conflict in Ukraine and associated economic sanctions on Russia, conditions in South America, Central America and China, and acts of terrorism or sabotage; and
•if commodity prices decline and remain depressed for a prolonged period, the possibility that a significant portion of our development projects becomes uneconomic and cause significant write-downs of the value of our oil and gas properties.
Similarly, investments in both commercial and residential real estate are subject to the specific risks inherent in the ownership and operation of real estate and real estate-related businesses and assets. These risks include those generally associated with the ownership of real property, such as: general and local economic conditions; changes in supply of and demand for competing properties in an area; fluctuations in the average occupancy; the financial resources of tenants; changes in building, environmental and other laws; energy and supply shortages; various uninsured or uninsurable risks; natural disasters; changes in government regulations (such as rent control); changes in real property tax rates; changes in interest rates; the reduced availability of mortgage funds that may render the sale or refinancing of properties difficult or impracticable; negative developments in the economy; and contingent liabilities on disposition of assets. Our real estate investments are also subject to additional risks, including the following:
•The success of certain investments will depend on the ability to restructure and effectuate improvements in the operations of the applicable properties, and there is no assurance that we will be successful in implementing such restructuring programs and/or improvements;
•If we acquire direct or indirect interests in undeveloped land or underdeveloped real property, which may often be non-income producing, they will be subject to the risks normally associated with such assets and development activities, including risks relating to the availability and timely receipt of zoning and other regulatory or environmental approvals, the cost and timely completion of construction, and the availability of both construction and permanent financing on favorable terms;
•The strategy of our real estate investment vehicles may be based, in part, on the availability for purchase of assets at favorable prices followed by the continuation or improvement of market conditions or on the availability of refinancing. No assurance can be given that real estate businesses or assets can be acquired or disposed of at favorable prices or that refinancing will be available;
96
•In connection with obtaining commercial loans backed by real estate, the lender will typically require a “bad boy” guarantee, in which our investment vehicles and we (including our insurance subsidiaries) may guarantee liability for environmental liabilities and bad acts including fraud, intentional misrepresentation, voluntary bankruptcy and other acts. It is expected that commercial real estate financing arrangements generally will require "bad boy" guarantees and in the event such guarantee is called, a fund's or our assets could be materially and adversely affected;
•The acquisition, ownership and disposition of real properties carries certain litigation risks pertaining to liabilities arising before, during and after the period of ownership. For example, litigation may be commenced by third parties such as renters or tradesmen with respect to activities that took place prior to the acquisition of such property. After the sale of a real estate asset, buyers may later sue for losses associated with problems alleged not to have been assumed by the buyer; and
•We manage REITs, which may be affected by changes in the value of their underlying properties and by defaults by borrowers or tenants. REITs depend on their ability to generate cash flow to make distributions and may be impacted by changes in tax laws or by a failure to qualify for tax-free pass through income. Investments in real estate debt investments may be unsecured and subordinated to a substantial amount of indebtedness and may not be protected by financial covenants. Non-performing real estate loans may require a substantial amount of workout negotiations and/or restructuring, which may entail, among other things, a substantial reduction in the interest rate and a substantial write-down of the principal of such loan. Investments in commercial mortgage loans are subject to risks of delinquency, foreclosure and loss of principal. In the event of any default under a mortgage loan held directly by our investment vehicle or us, our investment vehicle or we will bear a risk of loss of principal to the extent of any deficiency between the value of the collateral and the principal and accrued interest of the loan. Investments in assets or businesses that are distressed may have little or no near-term cash flow and involve a high degree of risk. Such investments subject to bankruptcy or insolvency could be subordinated or disallowed.
Our infrastructure investments are also subject to additional risks, including the following:
•the acquisition of infrastructure assets involves substantive continuing involvement by, or an ongoing commitment to, regulatory agencies, which often have considerable discretion to change or increase regulation of the operations of infrastructure assets. There can be no assurance that (i) existing regulations applicable to acquisitions generally or the infrastructure assets will not be revised or reinterpreted; (ii) new laws and regulations will not be adopted or become applicable to infrastructure assets, which might impose conditions on the construction, operations and activities of an infrastructure asset as a condition to receiving regulatory approval or to satisfy regulatory requirements; (iii) the technology, equipment, processes and procedures selected by infrastructure assets to comply with current and future regulatory requirements will meet such requirements; (iv) such infrastructure assets’ business and financial conditions will not be materially and adversely affected by such future changes in, or reinterpretation of, laws and regulations (including the possible loss of exemptions from laws and regulations) or any failure to comply with such current and future laws and regulations; or (v) regulatory agencies or other third parties will not bring enforcement actions in which they disagree with regulatory decisions made by other regulatory agencies. Infrastructure assets may rely on complex government licenses, concessions, leases or contracts, which may be difficult to obtain or maintain. Furthermore, regulatory agencies could be influenced by political considerations and could make decisions that adversely affect an infrastructure asset’s business, infrastructure assets may become politicized, which could attract an undesirable level of publicity;
•in many instances, the operation or acquisition of infrastructure assets may involve an ongoing commitment to or from municipal, state, federal or foreign government or regulatory agencies. The nature of these obligations exposes the owners of infrastructure assets to a higher level of regulatory control than is typically imposed on other businesses, which could prevent operation of a facility owned by an infrastructure asset, the completion of a previously announced acquisition or sale to third parties, or could otherwise result in additional costs and material adverse consequences to an infrastructure asset and investments in such assets;
•infrastructure investments may require operators to manage such investments, and such operators' failure to comply with laws may materially and adversely affect the value of such investments and cause us serious reputational and legal harm;
•from a commercial perspective, revenues for such investments may rely on contractual agreements for the provision of services with a limited number of counterparties and are consequently subject to heightened counterparty default risk;
•the operations and cash flow of infrastructure investments are also more sensitive to inflation and, in certain cases, commodity price risk; and
97
•services provided by infrastructure investments may be subject to rate regulations by government entities that determine or limit prices that may be charged and users of applicable services, or government entities in response to such users, may react negatively to any adjustments in rates, which may reduce the profitability of such infrastructure investments'.
Our growth equity strategy invests in emerging and less established companies that are heavily dependent on new technologies where success is less certain.
Our growth equity investment vehicles may make investments in companies that are in a conceptual or early stage of development. These companies are often characterized by short operating histories, new technologies and products, quickly evolving markets, management teams that may have limited experience working together and, in many cases, negative cash flow, all of which enhance the difficulty of evaluating these investment opportunities and the ultimate success of such investments. Other substantial operational risks to which such companies are subject include: uncertain market acceptance of the company's products or services; a high degree of regulatory risk for new or untried or untested business models, products and services; high levels of competition among similarly situated companies; new competing products and technology; lower barriers to entry and downward pricing pressure; lower capitalizations and fewer financial resources; the potential for rapid organizational or strategic change; and susceptibility to personal misconduct by or departure of key executives or founders. In addition, growth equity companies may be more susceptible to macroeconomic effects and industry downturns, and their valuations may be more volatile depending on the achievement of milestones, such as receiving a governmental license or approval. Growth equity companies generally depend heavily on intellectual property rights, including patents, trademarks and proprietary products or processes. The ability to effectively enforce patent, trademark and other intellectual property laws in a cost-effective manner will affect the value of many of these companies. The presence of patents or other intellectual property rights belonging to other parties may lead to the termination of the research and development of a portfolio company's particular product. In addition, if a portfolio company infringes on third-party patents or other intellectual property rights, it could be prevented from using certain third-party technologies or forced to acquire licenses in order to obtain access to such technologies at a high cost.
We make investments in companies and assets that are based outside of the United States, which may expose us to additional risks not typically associated with investing in companies that are based in the United States or materially exacerbate risks associated with investing in companies and assets based in the United States.
We invest a significant portion of our assets under management in the equity, debt, loans or other securities of issuers and in other assets that are based outside of the United States. Investing in companies or assets that are based or have significant operations in countries outside of the United States and, in particular, in emerging markets such as China and India, Eastern Europe, South and Southeast Asia, Latin America and Africa, involves risks and considerations that are not typically associated with investments in companies or assets established in the United States. These risks may include the following:
•the possibility of restrictions on foreign direct investment and exchange control regulations;
•restrictions on repatriation of profit on investments or of capital invested;
•the imposition of non-U.S. taxes or withholding taxes on income or gain with respect to certain assets and/or changes in tax law;
•differences in the legal and regulatory environment, such as the recognition of information barriers, or enhanced legal and regulatory compliance;
•greater levels of corruption and potential exposure to the FCPA and other laws that prohibit improper payments or offers of payments to foreign governments, their officials and other third parties;
•violations of trade sanctions or trade control regimes and the potential for the imposition of new or additional tariffs;
•limitations on borrowings to be used to fund acquisitions or dividends;
•limitations on the deductibility of interest and other financing costs and expense for income tax purposes in certain jurisdictions;
•limitations on permissible counterparties in our transactions or consolidation rules that effectively restrict the types of businesses in which we may invest;
98
•political risks generally, including political and social instability, nationalization, expropriation of assets or political hostility to investments by foreign or private equity investors;
•less liquid markets;
•reliance on a more limited number of commodity inputs, service providers or distribution mechanisms;
•adverse fluctuations in currency exchange rates and costs associated with conversion of investment principal and income from one currency into another;
•higher rates of inflation;
•less available current information about an issuer;
•higher transaction costs;
•less government supervision of exchanges, brokers and issuers;
•less developed bankruptcy and other laws;
•greater application of concepts like equitable subordination, which may, in bankruptcy or insolvency, result in the subordination of debt or other senior interests held by our investment funds, vehicles or accounts in companies in which our investment funds, vehicles or accounts also hold equity interests;
•difficulty in enforcing contractual obligations;
•lack of uniform or robust accounting, auditing, financial reporting standards, practices and disclosure requirements, and less government supervision and regulation;
•less stringent requirements relating to fiduciary duties;
•fewer investor protections; and
•greater price volatility.
See also “—Risks Related to Our Business—Extensive regulation of our businesses affects our activities and creates the potential for significant liabilities and penalties, which could materially and adversely affect KKR,” “—Risks Related to Our Business—Difficult market and economic conditions can, and periodically do, materially and adversely affect KKR,” and “—Risks Related to Our Business—Geopolitical developments and other…”
Third-party investors in our investment vehicles with commitment-based structures may not satisfy their contractual obligation to fund capital calls when requested by us, which could adversely affect an investment vehicle's operations and performance.
Investors in our funds and certain other investment vehicles make capital commitments that our funds and other investment vehicles are entitled to call from those investors at any time during prescribed periods. We depend on these investors fulfilling their commitments when we call capital from them in order for such investment vehicles to consummate investments and otherwise pay their obligations (for example, management fees) when due. Any such investor that did not fund a capital call would generally be subject to several possible penalties, including having a significant amount of existing investment forfeited in that investment vehicle. However, the impact of the penalty is directly correlated to the amount of capital previously invested by the investor in the investment vehicle. If an investor has invested little or no capital, for instance, early in the life of the investment vehicle, then the forfeiture penalty may not be as meaningful. Investors may in the future also negotiate for lesser or reduced penalties at the outset of the investment vehicle, thereby inhibiting our ability to enforce the funding of a capital call. If our investment vehicle investors were to fail to satisfy a significant amount of capital calls for any particular investment vehicle or investment vehicles, the operation and performance of those investment vehicles could be materially and adversely affected.
Our business activities may give rise to a conflict of interest with our clients.
As we have expanded and as we continue to expand the number and scope of our businesses, we increasingly confront potential conflicts of interest relating to investment activities among our various investment vehicles and also our own investments made by our balance sheet, which includes our insurance subsidiaries. For example:
99
•In pursuing the interest of our fund investors, we may take actions that could reduce our AUM or our profits that we could otherwise realize in the short term;
•We may be required to allocate investment opportunities among investment vehicles that may have overlapping investment objectives, including vehicles that may have different fee structures, and among KKR investment vehicles (including vehicles in which KKR employees may invest) and third-party co-investors;
•We may decide to transfer (or not to transfer) assets owned by us on our balance sheet to investment vehicles or accounts we manage, which could give rise to claims of conflicts of interest, including with respect to the nature of these assets and the method by which they were valued;
•We may, on behalf of our investment vehicles or our balance sheet (including our insurance subsidiaries), buy, sell, hold or otherwise deal with securities or other investments that may be purchased, sold or held by our other investment vehicles or that are otherwise issued by a portfolio company in which our investment vehicles or we invest. Conflicts of interest may arise between an investment vehicle, on one hand, and KKR (including our insurance subsidiaries), on the other, or among our investment vehicles, including those relating to the purchase or sale of investments, the structuring or exercise of rights with respect to investment transactions, and the advice we provide to our investment vehicles and our insurance subsidiaries. For example, KKR or a specific investment vehicle may sell an investment at a different time or for different consideration than other investment vehicles;
•We may invest on behalf of our investment vehicles, or for our own account, in a portfolio company of one investment vehicle that is a competitor, service provider, supplier, customer, or other counterparty with respect to a portfolio company of another investment vehicle;
•We may structure an investment in a manner that may be attractive to investment vehicle investors from a tax perspective even though KKR is required to pay corporate taxes;
•A decision to acquire material non-public information about a company while pursuing an investment opportunity for a particular investment vehicle or our own account may result in our having to restrict the ability of other investment vehicles to take any action with regards to that company or its securities;
•Our fiduciary obligations to our investment vehicle investors may preclude us from pursuing attractive proprietary investment opportunities, in particular as we enter into strategic relationships with broad investment mandates similar to the investments we make with our balance sheet;
•Conflicts may arise in allocating investments, time, services, expenses or resources among the investment activities of our investment vehicles, KKR (including our insurance subsidiaries), other KKR-affiliated entities and the employees of KKR;
•Our employees have made personal investments in a variety of our investment vehicles, which may result in conflicts of interest among investors of our investment vehicles or stockholders regarding investment decisions for these investment vehicles;
•Our entitlement to receive carried interest from many of our investment vehicles may create an incentive for us to make riskier and more speculative investments on behalf of an investment vehicle than would be the case in the absence of such an arrangement. In addition, for our investment vehicles that pay carried interest based on accrued rather than realized gains, the amount of carried interest to which we are entitled and the timing of its receipt will depend on our valuation of the investment vehicle's investment;
•Under the 2017 Tax Act, investments must be held for more than three years, rather than the prior requirement of more than one year, for carried interest to be treated for U.S. federal income tax purposes as capital gain, which may create a conflict of interest between the limited partner investors (whose investments would receive such capital gain treatment after a holding period of only one year) and the general partner on the execution, closing or timing of sales of an investment vehicle's investments in connection with the receipt of carried interest;
•From time to time, one of our funds or other investment vehicles (including CLOs) may seek to effect a purchase or sale of an investment with one or more of our other funds or other investment vehicles in a so-called "cross transaction," or we (including our insurance subsidiaries) as a principal may seek to effect a purchase or sale of our investment with one or more of our funds or other investment vehicles in a so-called "principal transaction";
100
•A dispute may arise between our portfolio companies, and if such dispute is not resolved amicably or results in litigation, it could cause significant reputational harm to us, and our investment vehicle investors may become dissatisfied with our handling of the dispute;
•The investors in our investment vehicles are based in a wide variety of jurisdictions and take a wide variety of forms, and consequently have diverging interests among themselves from a regulatory, tax or legal perspective or with respect to investment policies and target risk/return profiles; and
•We or our affiliates, including our capital markets business, may receive fees or other compensation in connection with specific transactions or different clients that may give rise to conflicts. The decision to take on an opportunity in one of our businesses may, as a practical matter, also limit the ability of one or our other businesses to take advantage of other related opportunities.
In addition, allocating investment opportunities appropriately frequently involves significant and subjective judgments. The risk that investors in our investment vehicles or regulators could challenge allocation decisions as inconsistent with our obligations under applicable law, governing fund agreements, or our own policies cannot be eliminated. Moreover, the perception of noncompliance with such requirements or policies could harm our reputation with fund investors. As with our investment allocation decisions generally, there is a risk that regulators or investors in our investment vehicles could challenge our allocations of co-investment opportunities or fees and expenses. For example, any steps taken by the SEC to preclude or limit certain conflicts of interest would make it more difficult for our investment vehicles to pursue transactions that may otherwise be attractive to the fund and its investors, which may adversely impact fund performance.
In addition, our investment vehicles also invest in a broad range of asset classes throughout the corporate capital structure. These investments include investments in corporate loans and debt securities, preferred equity securities and common equity securities. In certain cases, we (including our insurance subsidiaries) or our investment vehicles may invest in different parts of the same company's capital structure. For example, our credit investment vehicles may invest in different classes of the same company's debt and may make debt investments in a company that is owned by one of our private equity investment vehicles. In those cases, the interests of KKR and our investment vehicles may not always be aligned, which could create actual or potential conflicts of interest or the appearance of such conflicts. For example, one of our private equity funds could have an interest in pursuing an acquisition, divestiture or other transaction that, in its judgment, could enhance the value of the private equity investment, even though the proposed transaction would subject one of our credit investment vehicle's debt investments to additional or increased risks.
We may also invest, or cause different investment vehicles to invest, in a single portfolio company, for example, where the investment vehicle that made an initial investment no longer has capital available to invest. In certain cases, we may require that a transaction or investment be approved by fund investors or their advisory committees, be approved by a committee of independent directors of Global Atlantic, be approved by an independent valuation expert, be subject to a fairness opinion, be based on arm's-length pricing data or be calculated in accordance with a formula provided for in an investment vehicle's governing documents prior to the completion of the relevant transaction or investment to address potential conflicts of interest. Such instances include principal transactions where we or our affiliates warehouse an investment in a portfolio company for the benefit of one or more of our investment vehicles pending the contribution of committed capital by the investors in such investment vehicles, follow-on investments by an investment vehicle other than an investment vehicle that made an initial investment in a company, or transactions in which we arrange for one of our investment vehicles to buy a security from, or sell a security to, another one of our investment vehicles.
While we will try to mitigate these conflicts of interests, or when transactions may be suitable for multiple accounts, including our insurance subsidiaries and our own balance sheet, we may be unsuccessful in such mitigation efforts, or we may be obliged to take an action or refrain from taking an action that would be advantageous to us as a firm. To the extent we are unable to effectively manage these conflicts of interest, our reputation, business and financial results may be adversely affected.
Appropriately dealing with actual or perceived conflicts of interest is complex and difficult and we could suffer reputational damage or potential liability if we fail, or appear to fail, to deal appropriately with conflicts as they arise. Regulatory scrutiny on, or litigation in connection with, conflicts of interest could have a material adverse effect on our reputation, which could in turn materially and adversely affect our business in a number of ways, including as a result of an inability to raise additional investment vehicles, an inability or unwillingness for customers to enter into or establish new insurance business with Global Atlantic without material restrictions or at all, and a reluctance of counterparties to do business with us.
101
Investors in certain of our investment vehicles are entitled to redeem their investments in these vehicles on a periodic basis, and certain of our investment advisory agreements may be terminated with minimal notice.
Unlike investors in our traditional real estate and infrastructure funds, which in general do not permit redemptions of their fund interests until the liquidation of the funds upon their scheduled dates to terminate, our core real estate and infrastructure funds permit their investors to redeem their fund interests from time to time. Substantial redemptions could be triggered by a number of events, including investment performance, events in the markets, significant change in our personnel, our removal or replacement as the investment manager of the investment vehicle, legal or regulatory issues that investors perceive to have a bearing on the investment vehicle, or other events. While the general partner of such funds has no obligation to take any actions to satisfy redemption requests other than out of available cash in the investment vehicle, actions taken to meet substantial redemption requests could result in material adverse effect to the fund’s investments, ability to make new investments, or otherwise be able to achieve its investment objects, which could negatively impact our financial results.
Investors in certain of our leveraged credit investment vehicles may generally submit redemptions to redeem their investments on a quarterly, monthly, or other periodic basis (subject to, in some cases, the expiration of a specified period of time or, in certain cases, a withdrawal fee on withdrawals before the expiration of a specified period), subject to the applicable investment vehicle’s specific redemption provisions. Factors that could result in investors leaving our investment vehicles include changes in interest rates that make other investments more attractive, changes in or rebalancing due to investors’ asset allocation policy, changes in investor perception regarding our focus or alignment of interest, unhappiness with an investment vehicle’s performance or investment strategy, changes in our reputation, departures or changes in responsibilities of key investment professionals, and performance and liquidity needs of investment vehicle investors. In a declining market or period of economic disruption or uncertainty, the pace of redemptions and consequent reduction in our AUM could accelerate. The decrease in revenues that would result from significant redemptions from our investment vehicles or other similar investment vehicles could have a material adverse effect on our business, revenues, net income and cash flows.
We also currently sponsor, and expect to further sponsor, investment vehicles that are offered to individual investors where the terms of such vehicles typically permit periodic redemptions in accordance with the terms set forth in their applicable disclosure documents. There is a risk that such vehicles will lack adequate liquidity to satisfy any unexpected redemption requests, which may occur for a variety of reasons, including, in addition to the ones identified above, compliance obligations of their investors and increases in their investors’ liquidity needs, which tend to be more pronounced during periods of market volatility and which may escalate in any period and be particularly pronounced for investment vehicles whose governing agreements permit investment vehicle investors, up to certain limits or caps, to submit redemption requests periodically, including potentially as frequently as monthly. Any such redemptions would decrease our AUM and revenues. While terms such as caps or limits on redemption amounts may potentially reduce some of the risks around liquidity, decreased AUM and revenues and other concerns, there could still be significant and materially adverse reputational harm caused by redemption requests that in the aggregate trigger any caps or limits that legally permit our vehicles to “gate” or not honor redemption requests, and this could also cause materially adverse harm to the respective investment vehicle. During periods of market volatility, investor subscriptions to such vehicles are likely to be reduced, and investor redemption or repurchase requests are likely to be elevated, which may negatively impact the fees we earn from such vehicles.
The inclusion of redemption features in the investment vehicles offered by us create heightened risk of operational error, including with respect to the calculation of net asset values. Any such errors could adversely affect the exercise of redemption rights by their investors and could materially and adversely affect our revenues and profitability, including as a result of any resulting litigation or regulatory investigations. In addition, general concerns about market or macroeconomic conditions not specific to us or our investment vehicles could materially increase the number of redemption requests our investment vehicles receive, which would further enhance these risks.
A portion of assets invested in our investment vehicles in the Credit and Liquid Strategies business line are managed through separately managed accounts or entities structured for investment by one investor or related investors whereby we earn management and incentive fees, and we intend to continue to seek additional separately managed account or single entity mandates. The investment management agreements we enter into in connection with managing separately managed accounts or entities on behalf of certain clients may be terminated by such clients on little or no notice. In addition, we provide sub-advisory services to other investment advisers and managers. Such investment advisers and managers could terminate our sub-advisory agreements on little or no notice. In the case of any such terminations, the management and incentive fees we earn in connection with managing such account or company would immediately cease, which could result in a material adverse impact on our revenues.
102
In addition, certain investment vehicles in our Credit and Liquid Strategies business line are registered under the Investment Company Act as management investment companies. These investment vehicles and their respective investment advisers are subject to the Investment Company Act and the rules thereunder. The management fees we and our affiliate receive for managing registered investment companies and BDCs will generally be subject to contractual rights the company’s board of directors has to terminate KKR’s or our affiliate’s management of an account on as short as 60 days’ prior notice. Termination of these agreements would reduce the fees we earn from the relevant investment vehicles, which could have a material adverse effect on us.
Finally, certain of our investment management agreements with clients, including our agreements with KREF, Crescent, Global Atlantic and other investment vehicles, may be terminated by the client based on the terms stated in those agreements, which include the possibility to terminate due to materially poor investment management.
Our stakes in our hedge fund partnerships subject us to numerous additional risks.
Our stakes in our hedge fund partnerships subject us to numerous additional risks applicable to hedge funds and funds of funds, including the following:
•Generally, there are few limitations on the execution of investment strategies of a hedge fund or fund of funds, which are subject to the sole discretion of the management company or the general partner of such funds;
•A fund of funds is subject to unique risks related to the limited rights it has to withdraw, redeem, transfer or otherwise liquidate its investments from the underlying hedge funds or other funds in which it invests, including restrictions on the redemption of capital and on the amount, frequency, timing and size of redemptions;
•Hedge funds may engage in short selling, which is subject to theoretically unlimited loss, in that the price of the underlying security could theoretically increase without limit, thus increasing the cost of buying those securities to cover the short position. Purchasing securities to close out the short position can itself cause the prices of the securities to rise further, thereby exacerbating the loss;
•Hedge funds may enter into CDS as investments or hedges. CDS involve greater risks than investing in the reference obligation directly. For example, purchasing securities to close out short positions can itself cause the prices of the securities to rise further, thereby exacerbating the loss;
•Hedge funds are exposed to the risk that a counterparty will not settle a transaction in accordance with its terms and conditions because of a dispute over the terms of the contract (whether or not bona fide) or because of a credit or liquidity problem, thus causing the fund to suffer a loss. Counterparty risk is accentuated for contracts with longer maturities where events may intervene to prevent settlement, or where the fund has concentrated its transactions with a single or small group of counterparties. Generally, hedge funds are not restricted from dealing with any particular counterparty or from concentrating any or all of their transactions with one counterparty;
•The efficacy of investment and trading strategies depends largely on the ability to establish and maintain an overall market position in a combination of financial instruments. A hedge fund’s trading orders may not be executed in a timely and efficient manner due to various circumstances. In such event, the funds might only be able to acquire some but not all of the components of the position, or if the overall position were to need adjustment, the funds might not be able to make such adjustment. As a result, the funds would not be able to achieve the market position selected by the management company or general partner of such funds, and might incur a loss in liquidating their position;
•Hedge funds may make investments that they do not advantageously dispose of prior to the date the applicable fund is dissolved, either by expiration of such fund’s term or otherwise. Although we generally expect that investments will be disposed of prior to dissolution or be suitable for in-kind distribution at dissolution, these funds may have to sell, distribute or otherwise dispose of investments at a disadvantageous time as a result of dissolution. This would result in a lower than expected return on the investments and, perhaps, on the fund itself;
•Hedge funds may rely on computer programs, internal infrastructure and services, quantitative models (both proprietary models and those supplied by third parties) and information and data provided by third parties to trade, clear and settle securities and other transactions, among other activities, which are critical to the oversight of certain funds’ activities. If any such models, information or data prove to be incorrect or incomplete, any decisions made in reliance thereon could expose the funds to potential risks. Any hedging based on faulty models, information or data may prove to be unsuccessful and adversely impact a fund’s profits;
103
•Hedge fund investments are also subject to risks relating to investments in commodities, futures, options and other derivatives, the prices of which are highly volatile and may be subject to the theoretically unlimited risk of loss in certain circumstances, including if the fund writes a call option. Price movements of commodities, futures and options contracts and payments pursuant to swap agreements are influenced by many factors, including market and economic conditions and geopolitics. Most U.S. commodities exchanges limit fluctuations in certain commodity interest prices during a single day by imposing “daily price fluctuation limits” or “daily limits,” the existence of which may reduce liquidity or effectively curtail trading in particular markets. Hedge funds and funds of these hedge funds may also be subject to extensive regulations, including those of CFTC; and
•The timing and receipt of incentive fees earned as part of our hedge fund partnerships are also highly dependent on the net asset value of these funds and their investment strategies, which could add to volatility in our quarterly results and cash flow, as we are exposed to the volatility and fluctuations in financial results of these hedge fund managers and could become exposed to lawsuits or other liabilities arising from their business and operations.
Our investments in hedge fund managers may subject us to additional regulatory complexities or scrutiny if we are deemed to control the company for regulatory purposes, despite our minority interest. These asset managers may also be dependent on their founders and other key persons, and the loss of these key personnel could adversely impact our investment.
To the extent the financial condition of one or more of our third-party hedge fund managers with which we have hedge fund partnerships is adversely affected by these risks, our financial results would be adversely effected.
Risks Related to our Insurance Activities
Through our ownership of Global Atlantic, we operate an insurance business, which is subject to material risks and uncertainties that are different from, and incremental to, the risks relating to KKR’s asset management business or KKR’s management of Global Atlantic’s investments.
The Global Atlantic acquisition may not achieve its intended benefits, and certain difficulties, costs or expenses may outweigh such intended benefits.
The acquisition of Global Atlantic may still result in material difficulties and costs, both for KKR and for Global Atlantic, which may be exacerbated now that KKR owns 100% of Global Atlantic as of January 2, 2024. In addition, we may still be unable to realize all of the anticipated benefits of the Global Atlantic acquisition, including whether the Global Atlantic business will continue to operate and grow in the manner we anticipate. A significant portion of the benefit of the acquisition is anticipated to come from KKR's role as investment adviser for Global Atlantic's insurance subsidiaries. Prior to KKR's acquisition of a majority stake in Global Atlantic in 2021, KKR had not managed the entirety of the investment assets of an insurance company or assets of insurance companies at this scale. With respect to Global Atlantic, such difficulties will continue to include complying with financial reporting and disclosure requirements as a subsidiary of a public company and the costs of remediating such difficulties. With respect to KKR, such difficulties include unknown potential liabilities from owning Global Atlantic, such as potential regulatory changes or claims from former investors in Global Atlantic.
In addition, Global Atlantic's historical growth rates may not be indicative of its future growth, Global Atlantic may not be able to identify attractive insurance markets, reinsurance opportunities or investments with returns that are as favorable as Global Atlantic's historical returns or grow new business volumes at historical levels, or Global Atlantic may not effectively manage its growth. To maintain or increase investment returns, it may be necessary to expand the scope of Global Atlantic's investing activities to asset classes in which Global Atlantic historically has not invested, which may increase the risk of Global Atlantic's investment portfolio. Growth opportunities may be in new or adjacent product offerings and in new jurisdictions where Global Atlantic historically has had less experience. Pursuing opportunities in these new areas may subject Global Atlantic to new and complex insurance regulations and business considerations. If Global Atlantic is unable to find or manage profitable growth opportunities, it will be more difficult for Global Atlantic to continue to grow and could materially affect Global Atlantic. In addition, if preferences for Global Atlantic's individual or institutional products change or Global Atlantic is unable to offer competitive pricing and attractive terms, Global Atlantic's revenues and results of operations may be materially and adversely impacted. Moreover, as an insurance company, Global Atlantic's ability to grow is dependent on the sufficiency of its capital base to support that growth. Global Atlantic may need to seek additional capital to manage its growth, and Global Atlantic may not be able to maintain its current strong capital position as it grows. As Global Atlantic grows, it must invest additional assets, which poses increased investment risk. Growth may also increase the risk of service problems, and Global Atlantic may need to expend additional resources to provide consistent service. Any service problems may cause reputational harm or increased scrutiny by regulators. Future growth will also impose added responsibilities on Global Atlantic's management and will introduce additional regulatory complexity.
104
Many of the foregoing factors will be outside of our control and any one of them could result in increased costs, decreases in the amount of expected revenues and diversion of management's time and energy, which could adversely affect KKR.
Volatile market and economic conditions, including sustained periods of low interest rates, a sustained increase in interest rates and other interest rate fluctuations, may adversely affect our insurance business.
Global Atlantic's benefit liabilities are sensitive to changing market and economic conditions, in particular benefit liabilities related to Global Atlantic's fixed-indexed annuity and indexed universal life products and products with guaranteed minimum withdrawal or surrender or secondary guarantee features. In times of difficult market and economic conditions, Global Atlantic's policyholders may choose to defer paying insurance premiums, stop paying insurance premiums altogether or surrender their policies, or there could be an elevated rate of defaults within certain of Global Atlantic's investments. In addition, actual or perceived difficult conditions in the capital markets may discourage individuals from making investment decisions and purchasing Global Atlantic's products. Global Atlantic has from time to time experienced an elevated incidence of life insurance claims during periods of increased unemployment, which may adversely impact utilization of benefits relative to Global Atlantic's assumptions. The estimated cost of providing guaranteed minimum withdrawal and death benefits of certain insurance products requires Global Atlantic to make various assumptions about the overall performance of equity markets over the life of the product. Therefore, significant declines in equity markets could cause Global Atlantic to incur significant operating losses and capital increases due to, among other reasons, the impact of such decline on guarantees related to Global Atlantic's annuity products, including from increases in liabilities, increased capital requirements and/or collateral requirements associated with certain of Global Atlantic's agreements.
Interest rate risk in particular is a significant market risk for our insurance business, as fluctuations in market interest rates can expose Global Atlantic to the risk of reduced income in respect of its investment portfolio, increases in the cost of acquiring or maintaining its insurance liabilities, increases in the cost of hedging, or other fluctuations in Global Atlantic's financial, capital and operating profile which materially and adversely affect its business. This risk arises from Global Atlantic's holdings in interest rate-sensitive assets and liabilities, which include annuity products and long-duration life insurance policies, derivative contracts with payments linked to the level of interest rates or with market values which fluctuate based on the level of interest rates, and the fixed income assets Global Atlantic owns in its investment portfolio. Interest rate risk also includes adverse changes in customer behavior that may occur as a result of changes in interest rates. Both rising and declining interest rates can negatively affect our insurance business.
Periods of rising or higher interest rates may result in differing impacts on Global Atlantic’s business. We generally expect the yield on new investment purchases and income from any floating rate investments held in Global Atlantic’s investment portfolio to increase as interest rates rise, and higher interest rates also generally tend to increase the demand for certain of Global Atlantic’s products. However, higher interest rates may result in increased surrenders on interest-sensitive products, such as annuity contracts and certain life insurance policies, which may adversely affect Global Atlantic's earnings related to those products. This risk is present across most of Global Atlantic's insurance products, which can typically be surrendered for the cash value, less any applicable surrender charge, at any time. Higher policyholder surrenders may occur in response to rising interest rates as higher crediting rate investments might become available to policyholders in a higher rate environment. Global Atlantic may also need additional liquidity to pay insurance liabilities in excess of its assumptions due to market impacts on policyholder behavior. This increase in surrender outflows may create cash flow mismatches between cash received from Global Atlantic's investments versus cash needed to make policyholder liability payments as policyholders may surrender in higher numbers than expected. This mismatch could result in losses if assets must be liquidated at a loss to meet the increased policyholder obligations, which could result in potentially significant realized losses and a corresponding reduction in net income. If Global Atlantic fails to adequately cash flow match liabilities sold with higher benefits and interest rates fall while Global Atlantic holds that liability, Global Atlantic may not generate its expected earnings on those liabilities.
105
In addition, the majority of our investments at Global Atlantic are in investment grade credit instruments. An increase in market interest rates could also have a material adverse effect on the value of Global Atlantic's investment portfolio (as rising interest rates will decrease the fair value of Global Atlantic’s credit investments and the value of embedded derivatives associated with funds withheld reinsurance transactions) at a time when Global Atlantic may be forced to liquidate investments. Sales of those investments at a loss, for example to raise cash to meet policyholder obligations upon surrender earlier than expected (as described above) or as Global Atlantic rotates out of investments acquired with new reinsurance transactions to our desired asset mix during a period of rising or higher rates compared to when the investment was acquired, is expected to decrease our net income in that period and such decrease could be significant. In addition, Global Atlantic expects that substantially all of its unrealized losses will not be realized as it intends to hold these investments until recovery of the losses, which may be at maturity, as part of its asset liability cash-flow matching strategy. However, if the market or industry- or company-specific factors relating to these investments deteriorate meaningfully Global Atlantic may be required to recognize an impairment to goodwill and may realize losses as a result of credit defaults or impairments on investments, either of which could have a material adverse effect on our results of operations and financial condition. An increase in surrenders or withdrawals also may cause Global Atlantic to accelerate the amortization of deferred acquisition costs ("DAC") and value of business acquired ("VOBA"), resulting in a decline in net income. Global Atlantic's cost of insurance on new business is generally expected to be elevated, including higher hedging costs, during a higher rate environment, as benefits to policyholders on new business will generally be higher.
During periods of falling interest rates, Global Atlantic may also face cash flow mismatches between interest earned on its investment portfolio and policy liabilities that may be crediting higher rates. When rates decline more policyholders might hold onto their products than expected because those products seem more attractive. However, Global Atlantic's ability to lower crediting rates is subject to several constraints. For instance, minimum crediting rates are filed with and approved by state regulators, and certain products contain interest rate guarantee periods and other characteristics that restrict this ability, among other restrictions. In addition, competition and other factors, including the potential for increases in surrenders and withdrawals, may limit Global Atlantic's ability to adjust or maintain crediting rates at levels necessary to avoid decreases in earnings under certain conditions. Prolonged periods of low interest rates could challenge product development and product attractiveness and may also result in Global Atlantic earning lower margins on new business volumes than Global Atlantic has historically earned. Lower interest rates may reduce the demand for Global Atlantic's insurance products, leading to lower sales. In addition, lower interest rates may make the reinsurance solutions Global Atlantic is able to offer more expensive to potential clients, decreasing their interest in executing reinsurance transactions with Global Atlantic. In a period of declining interest rates, Global Atlantic's investment earnings may decline because new investments will likely bear lower interest rates, and Global Atlantic may not be able to fully offset the decline in investment earnings with lower liability costs on the products these investments support. In addition, the yield on Global Atlantic's floating rate assets will decline as interest rates decline, reducing Global Atlantic's investment income. During periods of declining interest rates, life insurance and annuity products also may be relatively more attractive to consumers due to minimum guarantees, resulting in a higher percentage of contracts remaining in force than originally estimated, causing greater claims costs and asset/liability cash flow mismatches. Conversely, management actions to reduce rates on inforce contracts in response to declining interest rates may result in greater surrenders than originally estimated, which may adversely affect Global Atlantic's earnings related to those products. While Global Atlantic seeks to cash-flow match its assets to its policy liabilities, greater market volatility and uncertainty has made matching more difficult. To the extent that Global Atlantic does not or is unsuccessful in cash-flow matching, our insurance business will face the risk of having to reinvest in lower-yielding assets, reducing investment income. Moreover, certain of Global Atlantic's life insurance policies have a longer duration than available investment assets, and, in a declining rate environment, as assets backing these policies mature, the proceeds may have to be reinvested in lower-yielding assets, reducing investment income.
In addition, calculations of required insurance capital may move with interest rate movements and result in greater capital needs during economic downturns. The value of Global Atlantic’s assets and liabilities are inputs in the calculation of required capital, and the valuation of both assets and liabilities are sensitive to changes in interest rates.
The difference between shorter-term and longer-term rates (also known as the yield curve) may also impact our insurance business. Global Atlantic's investments are typically in longer-duration assets. Accordingly, the crediting rates offered on Global Atlantic's products typically appear more appealing when the yield curve is steeper, and Global Atlantic is better able to differentiate its products from shorter-term alternatives. As such, a flatter yield curve could present challenges to sales in the individual markets line of our insurance business.
106
We may be required to accelerate the amortization of deferred revenues and expenses, including DAC and VOBA.
Our insurance business incurs significant costs in connection with acquiring new and renewal insurance business. DAC consists of commissions and other costs that are directly related to the successful acquisition of new or renewal insurance contracts. Deferrable sales inducements ("DSI") are generated by annuities that offer enhanced crediting rates or bonus payments to policyholders. VOBA represents the difference between the carrying value of the purchased in-force insurance contract liabilities at the time of the business combination and the estimated fair value of insurance and reinsurance contracts. Global Atlantic establishes an unearned revenue reserve ("URR") liability for revenues from certain universal life insurance products that are deferred to future periods and an unearned front-end load ("UFEL") for gross premium in excess of the benefit reserve plus additional insurance liability for certain preneed contracts. For limited pay contracts, a deferred revenue liability ("DRL") that represents the gross premium less the net premium is established. Each of DAC, VOBA, URR, UFEL and DRL requires significant estimates to establish and amortize. In conjunction with the Global Atlantic acquisition, purchase accounting required Global Atlantic to write-down intangibles, including DAC and VOBA, and then reestablish the new VOBA at the fair value for Global Atlantic. These purchase accounting adjustments will impact Global Atlantic's emergence of earnings in the future.
Global Atlantic periodically revises the key assumptions used in the calculation of the amortization of DAC, VOBA, URR, UFEL and DSI as part of the assumption review process. To the extent policy or contract terminations exceed projected levels, then the amortization of deferred revenues and expenses will be accelerated in the period of the change and will result in a charge to income, which could have a material adverse effect on Global Atlantic's profitability.
Differences between Global Atlantic's policyholder behavior estimates, reserve assumptions and actual claims experience, in particular with respect to the timing and magnitude of claims and surrenders, may adversely affect KKR.
Global Atlantic holds reserves to pay future policy benefits and claims. Global Atlantic's reserves are estimated based on data and models that include many assumptions and projections, which are inherently uncertain and involve significant judgment, including assumptions as to the levels and/or timing of receipt or payment of premiums, benefits, claims, expenses, interest credits, investment results (including equity and other market returns), mortality, morbidity, longevity and persistency.
While Global Atlantic periodically reviews the adequacy of its reserves and the assumptions underlying those reserves. We cannot determine with precision the amounts that Global Atlantic will pay for, or the timing of payment of, actual benefits, claims and expenses or whether the assets supporting policy liabilities, together with future premiums, will grow to the level assumed prior to the payment of benefits or claims. For Global Atlantic's directly issued fixed-rate annuities, reserves are equal to policyholder account balances before applicable surrender charges, and lapse, surrender rates and persistency assumptions are important assumptions used in calculating these reserves and drivers of profitability with respect to these products. Advances in technology, including predictive medical technology that enables consumers to select products better matched to their individual longevity or mortality risk profile and other medical breakthroughs that extend lives, could cause Global Atlantic's future experience to deviate significantly from actuarial assumptions, which could adversely impact the level of reserves and profitability. The resulting acceleration of expense amortization, reduced spread or increased payments could have a material adverse effect on our insurance business.
If actual experience differs significantly from assumptions or estimates, certain balances included in Global Atlantic's balance sheet may not be adequate, particularly DAC, VOBA, policy reserves and other actuarial balances. If Global Atlantic concludes that its reserves, together with future premiums, are insufficient to cover future policy benefits and claims, Global Atlantic would be required to increase its reserves and incur income statement charges for the period in which it makes the determination, which could have a material adverse effect on our insurance business. The increase in the statutory reserves of our insurance subsidiaries may negatively affect liquidity and capitalization.
Changes in regulations relating to reserves, such as implementation of principle-based reserving, may cause fluctuations to the amount of statutory reserves held and could adversely impact our insurance business. The NAIC is developing a new principle-based approach for fixed annuities that, if implemented, could result in higher statutory reserves and may cause greater fluctuations in the amount of statutory reserves held. There can be no guarantee as to whether these changes will be implemented or their impact on Global Atlantic.
107
Estimates used in the preparation of financial statements and models for insurance products may differ materially from actual experience as these determinations involve a significant degree of judgment.
GAAP requires the application of accounting guidance and policies that often involve a significant degree of judgment when accounting for insurance products. These estimates include, but are not limited to, premium persistency, future policy benefits and related expenses, valuation of embedded derivatives, valuation and impairment of investments and amortization of deferred revenues and expenses. These accounting estimates require the use of assumptions, some of which are highly uncertain at the time of estimation. These estimates are based on judgment, current facts and circumstances and, when applicable, internally developed models. Therefore, actual results could differ from these estimates, possibly in the near term. Inaccuracies could result in, among other things, an increase in policyholder benefit reserves or acceleration of the amortization of deferred revenues and expenses, such as DAC and VOBA, which would result in a charge to earnings, a restatement of Global Atlantic's historical financial statements or other material adjustments. Additionally, the potential for unforeseen developments, including changes in laws, regulations or accounting standards, may result in losses and loss expenses materially different from the reserves initially established.
In addition, Global Atlantic employs models to price products, calculate reserves, value assets and generate projections used to estimate future pre-tax income, as well as to evaluate risk, determine internal capital requirements and perform stress testing, among other uses. These models rely on estimates and projections that are inherently uncertain, may use incomplete, outdated or incorrect data or assumptions and may not operate properly. As Global Atlantic's businesses continue to expand and evolve, the number and complexity of models it employs has grown, increasing exposure to error in the design, implementation or use of models, including the associated data input, controls and assumptions, and the controls in place to mitigate their risk may not be effective in all cases. Limitations or errors in the design, implementation or use of these models may be material and could lead Global Atlantic to make wrong or suboptimal decisions in aspects of its business, which could have a material adverse effect on our insurance business.
Global Atlantic's growth strategy includes reinsurance of insurance obligations written by unaffiliated insurance companies, and its ability to both consummate and realize the anticipated financial benefits from reinsurance transactions is uncertain.
Global Atlantic has grown and intends to continue growing its business through block reinsurance transactions, flow reinsurance, pension risk transfer reinsurance and the issuance of funding agreements. Global Atlantic routinely reviews potential reinsurance transactions, some of which may be material. To the extent Global Atlantic is unable to consummate suitable reinsurance transaction opportunities on acceptable terms, its future growth may be negatively impacted. Even if Global Atlantic does find suitable opportunities on commercially acceptable terms, Global Atlantic may not be able to consummate these transactions because of the regulatory approvals required or other considerations. There is no assurance Global Atlantic will continue to be successful in these institutional markets.
Competition, in particular with respect to transaction pricing, makes it more difficult to identify transactions with terms that are commercially acceptable based on Global Atlantic's objectives and analyses. Moreover, the NAIC is considering, and certain states have enacted, insurance business transfer laws that permit insurers to transfer blocks of business to other insurers by operation of law. Such transfers could become a viable alternative structure to block reinsurance transactions and consequently may materially and adversely impact Global Atlantic's ability to identify and enter into new block reinsurance transactions.
If Global Atlantic enters into a reinsurance transaction, there can be no assurance that the transaction will achieve the results expected at the time the transaction is executed. Certain Global Atlantic reinsurance transactions include cessions to third-party reinsurers, exposing Global Atlantic to counterparty risk that may be concentrated. In the event these counterparties become financially distressed, Global Atlantic may recapture liabilities it intended to reinsure off its balance sheet and may require additional capital to back these liabilities. In addition, Global Atlantic assumes servicing for policyholders and if servicing disruptions arise, Global Atlantic may experience customer complaints, regulatory intervention, or other adverse impacts.
With respect to potential future reinsurance transactions, there can be no assurance that opportunities will persist, and even if opportunities do persist, there can be no assurance that Global Atlantic will have sufficient capital available, or to the extent it does have sufficient capital, that such capital will be available in the necessary entities, to continue growing this part of Global Atlantic's business.
108
Global Atlantic sponsors co-investment vehicles ("Co-Invest Vehicles"), including the Ivy Entities, which have capital committed to invest alongside Global Atlantic in certain block reinsurance, pension risk transfer and other reinsurance transactions that Global Atlantic enters into during their investment period. Global Atlantic does not control the Co-Invest Vehicles, and Global Atlantic is subject to the risk that the Co-Invest Vehicles fail or refuse to fund their portion of a particular transaction, in which case Global Atlantic would have contractual remedies against the defaulting Co-Invest Vehicles, but not directly against their shareholders or lenders. Global Atlantic is also subject to the risk that a Co-Invest Vehicle fails to meet its obligations under any funds withheld reinsurance arrangements with Global Atlantic.
As a result of any of the foregoing risks, Global Atlantic may realize materially less than the anticipated financial benefits from reinsurance transactions, or Global Atlantic's reinsurance transactions may be unprofitable or result in losses.
Global Atlantic's actual or perceived financial strength impacts its ability to sell its products, and a downgrade in Global Atlantic's ratings or in the ratings of its insurance subsidiaries could materially and adversely affect Global Atlantic's ability to compete, raise equity or issue debt.
Financial strength ratings are published by various nationally recognized statistical rating organizations ("NRSROs") and similar entities not formally recognized as NRSROs. Rating organizations periodically review the financial performance, capital adequacy and condition of insurers, including Global Atlantic's insurance and reinsurance subsidiaries. Rating agencies also consider general economic conditions and other circumstances outside the rated company's control in assigning a rating. The various rating agencies periodically review and may modify their standards, established guidelines and capital models from time to time. There can be no assurance that Global Atlantic's ratings will not be negatively impacted by any such changes.
If Global Atlantic's capital levels are deemed insufficient, Global Atlantic could be required to reduce its risk profile in order to maintain its current ratings, by, for example, reinsuring and/or retroceding some of Global Atlantic's business, materially altering its business and sales plans or by raising additional capital. Any such action could have a material adverse effect on our insurance business.
Downgrades in Global Atlantic's credit ratings or changes to its rating outlook, or downgrades or changes in outlook to the financial strength ratings of Global Atlantic's insurance subsidiaries, could have a material adverse effect on our insurance business in many ways, including limiting access to distributors, restricting Global Atlantic's ability to generate sales, decreasing profitability, increasing policy lapse activity, limiting access to capital markets and potentially increasing the cost of debt, which could adversely affect liquidity. For example, Global Atlantic believes that a downgrade in the A.M. Best rating of our U.S. insurance subsidiaries could materially impact their sales and access to new distribution relationships. The ability of our subsidiaries to engage in reinsurance transactions—and to do so absent substantial obligations to collateralize performance of their respective obligations—may depend in part on their financial condition and is influenced by their ratings. If an independent rating agency downgrades or withdraws any of Global Atlantic's ratings, Global Atlantic could be limited in, or prevented from, writing any new insurance and reinsurance contracts; some existing contracts may be terminated or may require Global Atlantic to enhance certain credit terms; the pricing terms Global Atlantic can obtain may be adversely affected; and Global Atlantic's borrowing costs or ability to access the capital markets could be materially and adversely impacted. Downgrades in credit or financial strength ratings may increase the regulatory scrutiny to which Global Atlantic and its insurance subsidiaries are subjected. In addition, failure by Global Atlantic to maintain minimum RBC ratio requirements in certain contracts could permit the counterparty to terminate the contract, recapture business or require posting of additional collateral. There is no guarantee that Global Atlantic will be able to maintain its ratings in the future, and we cannot provide any assurances that actions taken by ratings agencies would not result in a material adverse effect on our insurance business.
109
Global Atlantic faces risks associated with business it reinsures and business it cedes to reinsurers, which could cause a material adverse effect on our insurance business.
As part of Global Atlantic's overall risk management strategy, it cedes business to other insurance companies through reinsurance. Global Atlantic's inability to collect from its reinsurers (including reinsurance clients in transactions where Global Atlantic reinsures business net of ceded reinsurance) on its reinsurance claims could have a material adverse effect on our insurance business. Although reinsurers are liable to Global Atlantic to the extent of the reinsurance coverage it acquires, Global Atlantic remains primarily liable as the direct insurer on all risks that it writes; therefore, Global Atlantic's reinsurance agreements do not eliminate its obligation to pay claims. As a result, Global Atlantic is subject to the risk that it may not recover amounts due from reinsurers. The risk could arise primarily in two situations: (1) Global Atlantic's reinsurers may dispute some of its reinsurance claims based on contract terms, and, as a result, Global Atlantic may receive partial or no payment or (2) Global Atlantic's reinsurers may default on their obligations. While Global Atlantic may manage these risks through transaction-related diligence, contract terms, collateral requirements, hedging, and other oversight mechanisms, Global Atlantic's efforts may not be successful. A reinsurer's insolvency, or its inability or unwillingness to make payments due to Global Atlantic under the terms of the relevant reinsurance agreements, could have a material adverse effect on our insurance business.
Global Atlantic also bears the risk that the companies that reinsure its mortality risk on a yearly renewable term, where the reinsurer may reset the premium and other terms each year, increase the premiums they charge to levels Global Atlantic deems unacceptable. If that occurs, Global Atlantic will either need to pay such increased premiums, which will affect margins and financial results, or alternatively, Global Atlantic will need to limit or potentially terminate reinsurance, which will increase the risks that Global Atlantic retains.
Conversely, certain of our insurance subsidiaries assume liabilities from other insurance companies. Changes in the ratings, creditworthiness or market perception of such ceding companies or in the administration of policies reinsured to Global Atlantic could cause policyholders of contracts reinsured to Global Atlantic to surrender or lapse their policies in unexpected amounts. In addition, to the extent such ceding companies do not perform their obligations under the relevant reinsurance agreements, Global Atlantic may not achieve the results intended and could suffer unexpected losses. Certain reinsurance transactions require additional operational support, administration, regulatory filings and compliance with jurisdiction-specific laws and regulations, subjecting Global Atlantic to additional scrutiny and risks. These risks could materially and adversely affect our insurance business.
Changes in accounting standards could adversely impact our insurance business.
Global Atlantic's financial statements are subject to the application of GAAP, which is periodically revised, reinterpreted and/or expanded. Accordingly, from time-to-time Global Atlantic is required to adopt new guidance or interpretations, or could be subject to existing guidance as Global Atlantic enters into new transactions or business lines, which may have a material effect on Global Atlantic that is either unexpected or has a greater impact than expected. Upon the February 2021 closing of the acquisition of Global Atlantic by KKR, Global Atlantic established a new accounting basis for purchase accounting, under which all identifiable assets acquired, and liabilities assumed were measured and recorded at fair value as of the date of the closing. In addition, certain accounting standards applicable to public entities became applicable to Global Atlantic.
We adopted, effective January 1, 2023 with a transition date of January 1, 2021, new accounting guidance issued by the FASB for insurance companies that issue or reinsure long-duration contracts such as life insurance and annuities. Going forward, Global Atlantic believes that the new standard will increase volatility in its consolidated financial statements, in particular due to the requirement to remeasure certain policy liabilities each quarter, either at fair value or using current market discount rates, with changes recorded in either net income or other comprehensive income. In addition, the new guidance had a significant impact on Global Atlantic's systems, processes and controls.
In June 2016, FASB issued new guidance on the measurement of credit losses on financial instruments, including reinsurance recoverables, under GAAP. This guidance replaced the incurred loss impairment methodology with a requirement to reflect current expected credit losses in amortized cost instead of recognizing losses as incurred. Following the February 2021 closing of the Global Atlantic acquisition, this standard became applicable to Global Atlantic and required increases in expected credit losses on financial instruments measured at amortized cost, including loan receivables and reinsurance recoverables, which are recognized as a charge to earnings.
110
The GAAP changes for long-duration contracts, the measurement of credit losses on financial instruments, application of purchase accounting in connection with the February 2021 closing of the Global Atlantic acquisition or other GAAP changes in accounting standards could affect the way Global Atlantic accounts for and reports significant areas of its business, could impose special demands on Global Atlantic in the areas of governance, employee training, internal controls and disclosure, and will likely affect how Global Atlantic manages its business. As a result, the required adoption of future accounting standards could have a material adverse impact on our insurance business.
The NAIC has approved Statutory Accounting Principles ("SAP") for U.S. insurance companies that have been implemented by the domiciliary states of Global Atlantic's U.S. insurance subsidiaries. The NAIC from time to time considers amendments to the Statutory Accounting Principles and is currently considering various amendments to the Statutory Accounting Principles that impact investment transactions, including, for example, definitions of affiliated and related party transactions and capital charge determinations for loan-backed and structured securities. In addition, the NAIC has expressed concerns and is considering changes related to filing exempt status for certain securities or loans, which generally allows the use of an NRSRO rating for purposes of capital assessment as opposed to requiring review by the Securities Valuation Office. The NAIC adopted, and is considering additional, changes to the NAIC ratings assigned to privately rated securities. These changes and future changes raise uncertainty with respect to the NAIC ratings of, and consequently capital required to be held for, certain investments.
In addition, the NAIC Accounting Practices and Procedures Manual, or the "Accounting Manual," provides that state insurance departments may permit insurance companies domiciled therein to depart from the Statutory Accounting Principles by granting them permitted accounting practices. Global Atlantic makes use of permitted practices today and may seek approval to use additional permitted practices in the future. Permitted practices do not preempt legislative or regulatory changes to the Statutory Accounting Principles. Accordingly, there is a risk that Global Atlantic may not be able to continue to use a previously granted permitted practice. In addition, we cannot predict whether or when the insurance departments of the states of domicile of its competitors may permit Global Atlantic's competitors to utilize advantageous accounting practices that depart from the Statutory Accounting Principles, the use of which is not permitted by the insurance departments of the states of domicile of Global Atlantic's U.S. insurance subsidiaries. Any change in the Statutory Accounting Principles or permitted practices could have a material adverse impact on the capital Global Atlantic is required to hold in its business and consequently on its profitability and ability to grow.
Our Bermuda insurance subsidiaries are licensed to conduct insurance business by the BMA. In 2016, the BMA made significant changes to Bermuda's regulatory and supervisory regimes, to achieve equivalence with the EU's Directive 2009/138EC, as amended (Solvency II). On March 24, 2016, and (retroactively) effective as of January 1, 2016, a number of changes were instituted for commercial insurers and insurance groups to enhance statutory and prudential reporting requirements. In that regard, the BMA implemented the Economic Balance Sheet ("EBS") framework ("EBS Framework"), which is now used as the basis to determine an insurer's enhanced capital requirement. Bermuda-licensed commercial insurers are required to prepare prescribed statutory financial statements. Global Atlantic's Bermuda insurance subsidiaries' financial statements prepared in accordance with GAAP act as the basis on which statutory financial statements are prepared, subject to application of certain prudential filters. These statutory financial statements, in turn, form the starting basis for the preparation of the EBS. The statutory financial statements also form the basis for assessing each Bermuda insurance subsidiary's ordinary dividend capacity, Minimum Margin of Solvency and class of registration as an insurer in Bermuda. The EBS Framework and statutory financial statements are embedded in the BMA's legislative and regulatory regime. The European Insurance and Occupational Pensions Authority conducted a review of Solvency II in 2020 and noted that a number of amendments to Solvency II are required to ensure that the regulatory framework continues as a well-functioning risk-based regime. In 2023, the BMA issued a series of consultation papers exploring updates to its framework, including updated requirements for reserves, capital and governance. The BMA is in the process of implementing these requirements and could propose further updates to certain aspects of the EBS Framework. If any such updates materially increase the ECR, it could materially increase the amount of capital Global Atlantic is required to hold to meet its BSCR and BMA requirements.
Changes to GAAP, SAP, the Bermuda EBS Framework or capital models may be complex, require significant resources to implement and have an impact on our controls, which may be significant. Failure to implement or take appropriate or effective management actions in response to such changes may have a material adverse impact on our insurance business. Global Atlantic can give no assurances that the impacts of current, proposed or future changes to GAAP, SAP, Bermuda EBS Framework, capital models or any components or interpretation thereof, the grant of permitted accounting practices to Global Atlantic's competitors or future changes to legal, accounting, capital or financial regimes will not have a negative impact or material adverse effect on our insurance business.
111
Global Atlantic may experience volatility in its net income under GAAP due to its funds withheld and modified coinsurance transactions.
Global Atlantic assumes certain policy risks written by other insurance companies via reinsurance that may be on a funds withheld or modified coinsurance basis. Funds withheld coinsurance and modified coinsurance differ from coinsurance and certain other forms of reinsurance in that the assets equal to the net statutory reserves are withheld and legally owned by the ceding company, while the related investment risk is transferred to the reinsurer. Global Atlantic is subject to the investment performance but does not directly control the investments. Under GAAP accounting these funds withheld and modified coinsurance contracts create embedded derivatives for both the ceding company and the reinsuring company, and each embedded derivative must be measured at fair value. The valuation of these embedded derivatives is sensitive to the market environment, including credit spreads of the assets held by the ceding insurer, and can generate significant volatility in net income depending on market conditions. Changes in the fair value of embedded derivatives are recorded in investment related gains/losses on the consolidated statements of operation.
Global Atlantic holds a significant portion of its reinsurance assets in trust, which may restrict Global Atlantic's ability to invest those assets and also may permit the ceding company to withdraw those assets from the trust in certain circumstances.
In certain reinsurance transactions where Global Atlantic is the reinsurer, it must provide collateral to the ceding company. State regulation and the ability of Global Atlantic insurance subsidiaries to obtain or maintain regulatory designation as a certified or reciprocal jurisdiction reinsurer impact the amount of collateral Global Atlantic must provide. A significant portion of the collateral that Global Atlantic provides to its reinsurance clients is provided in the form of assets held in a trust for the benefit of the counterparty. Global Atlantic’s obligation to hold assets in trust restricts its ability to use such assets to support liquidity for other business purposes. Global Atlantic's investment of assets held in trust is restricted based on the terms of the trust agreement and associated investment guidelines. As such, Global Atlantic may not have flexibility to invest such assets as it otherwise might, and Global Atlantic's investment returns on such assets may therefore be less than if they were not held in trust. In addition, in certain circumstances the ceding company may be allowed to withdraw assets from the trust if Global Atlantic fails to pay amounts due under the applicable reinsurance agreement.
Certain of Global Atlantic's reinsurance agreements contain triggers that permit the reinsurance client to recapture some or all of the reinsured portfolio, which, if triggered, may have a material adverse effect on Global Atlantic.
Certain of Global Atlantic's reinsurance agreements contain triggers that, if breached, may result in the reinsured party having the right to recapture the reinsured business or terminate the reinsurance agreement. A recapture trigger permits the ceding company to reassume under certain circumstances all or a portion of the risk ceded to Global Atlantic. For reinsurance transactions in which the ceding company cedes all or a portion of the risk to Global Atlantic, Global Atlantic's reinsurance agreements typically include a recapture right that is triggered if, for example, Global Atlantic fails to maintain certain minimum levels of capitalization or certain minimum levels of reserves to support the business reinsured. These reinsurance agreements also typically include provisions that provide for termination of the agreement and recapture of the business upon the occurrence of insolvency, rehabilitation, non-payment of amounts due, material breach of contract provisions or failure to provide the ceding company with the ability to take reserve credit. The economic, financial and liquidity impact from the loss of the recaptured business, in addition to Global Atlantic's economic hardships at the time of recapture, may have a material adverse effect on our insurance business.
The determination of the amount of impairments and allowances for credit losses recognized on Global Atlantic's investments is highly subjective and could materially affect our insurance business.
The determination of the amount of impairments and allowances for credit losses is based upon Global Atlantic's periodic evaluation and assessment of known and inherent risks associated with the respective asset class and the specific investment being reviewed. Such evaluations and assessments are revised as conditions change and new information becomes available. Management updates its evaluations regularly and reflects changes in allowances and impairments in its financial results as such evaluations are revised. Impairments result in a non-cash charge to earnings during the period in which the impairment charge is taken. Changes in allowances for credit losses can result in either a charge or credit to earnings.
For example, an allowance is recognized on Global Atlantic's fixed maturity securities when the fair value of the security is less than its amortized cost basis and credit related losses are deemed to have occurred. The determination of the allowance requires assessment of the security's expected future cash flows, which depend on a variety of macroeconomic factors and security-specific considerations. Similarly, the determination of the allowance on Global Atlantic's mortgage and other loan receivables requires an assessment of expected credit losses that considers current, historical and forecasted macroeconomic data and loan-specific factors. As expectations change based on macroeconomic data and individual investment considerations, the associated allowance for credit losses can be adjusted, up or down, and such change may be material.
112
There can be no assurance that management has accurately determined the amount of impairments and allowances for credit losses recognized in Global Atlantic's financial statements and their potential impact on regulatory capital. Furthermore, additional impairments and allowance provisions may be taken in the future, which could have a material adverse effect on our insurance business.
Global Atlantic's membership in Federal Home Loan Banks subjects Global Atlantic to potential liquidity and other risks.
Our U.S. insurance subsidiaries are each members of one of the Federal Home Loan Banks of Des Moines, Indianapolis and Boston, which allows those companies to borrow against certain of their investments, such as commercial mortgage loans, eligible under the applicable Federal Home Loan Bank definition to be posted as collateral. If those sources of borrowing by those companies were to no longer be available to them, or if the Federal Home Loan Banks issue a capital call on the preferred shares owned by our insurance companies, the liquidity of such insurance subsidiaries could be materially and adversely affected. The Federal Housing Finance Authority is currently undertaking a review of the Federal Home Loan Banks and their membership. If the applicable insurance subsidiary's creditworthiness falls below the minimum required or if legislative or other political actions cause changes to the Federal Home Loan Bank mandate or to the eligibility of life insurance companies to be members of the Federal Home Loan Bank system, Global Atlantic may lose access to this funding and be required to find other sources to replace it.
From time to time, Global Atlantic participates in repurchase and reverse repurchase transactions that subject Global Atlantic to liquidity risks.
Global Atlantic currently has a committed repurchase facility and from time to time participates in repurchase transactions. Under these repurchase agreements, Global Atlantic sells fixed income securities to third-party counterparties, primarily major brokerage firms and commercial banks, with a concurrent agreement to repurchase those same securities at a determined future date.
These repurchase agreements are required to be secured by collateral, which may negatively impact Global Atlantic's liquidity if Global Atlantic is required to post additional collateral (for example, due to a decline in the value of collateral already posted) or unable to extend an expiring repurchase agreement by entering into a new repurchase agreement.
In addition, Global Atlantic invests in securities the cash it receives from its repurchase counterparties. Those securities may decline in value during the term of the repurchase agreements. If Global Atlantic sells those securities at a loss, Global Atlantic may not have enough cash to fund the obligation that it has to its counterparties under the repurchase agreements. Under adverse capital market and economic conditions, liquidity may broadly deteriorate, further restricting Global Atlantic's ability to sell the securities and fund the obligation that it has to its counterparties.
Global Atlantic may also from time to time participate in reverse repurchase agreements whereby Global Atlantic purchases fixed income securities from third parties in exchange for cash, with a concurrent obligation by such third parties to repurchase those same securities from Global Atlantic at a determined future date. In the case of default by any such third party, Global Atlantic runs the risk that such third party may not repurchase the security when required. In the event of the bankruptcy or other default of such third party in a repurchase agreement, Global Atlantic could experience both delays in liquidating the underlying security and losses, including but not limited to (1) a possible decline in the value of the collateral received from Global Atlantic's counterparties during the period while Global Atlantic seeks to enforce its rights therein, (2) possible subnormal levels of income and lack of access to income during this period and (3) expenses of enforcing Global Atlantic's rights.
Changes in relevant tax laws, regulations or treaties or an adverse interpretation of these items by tax authorities could adversely impact our insurance business.
Unless the context otherwise requires, the term "Bermuda insurance subsidiaries" as used here refers to (1) Global Atlantic Assurance Limited and (2) Global Atlantic Re Limited with respect to any period ending prior to January 1, 2018, the effective date of the election made pursuant to Section 953(d) of the Code to treat Global Atlantic Re as a U.S. corporation for U.S. federal income tax purposes. “GAFL” refers to Global Atlantic Financial Limited, which, prior to January 2, 2024, was a Bermuda exempted company. Effective January 2, 2024, GAFL continued its corporate existence as a Delaware company and changed its name to Global Atlantic Limited (Delaware).
113
The IRS could contend that Global Atlantic or our non-U.S. subsidiaries are or were engaged in trade or business within the United States and subject to U.S. federal income taxes. Certain Global Atlantic subsidiaries are non-U.S. companies that are treated as corporations for U.S. federal income tax purposes. The Bermuda insurance subsidiaries and GAFL prior to 2024 have conducted, and the insurance subsidiaries intend to conduct, substantially all of their operations outside the United States and to limit their U.S. contacts with the intention that the Bermuda insurance subsidiaries not be treated as engaged in trade or business within the United States. However, there is considerable uncertainty as to when a non-U.S. corporation is engaged in trade or business within the United States, and there can be no assurance that the IRS will not contend that the Bermuda insurance subsidiaries are or were engaged in trade or business within the United States. If the Bermuda insurance subsidiaries were considered to be engaged in trade or business within the United States, such company could be subject to U.S. corporate income taxes and branch profits taxes on the portion of its earnings and profits that is or was effectively connected to such trade or business within the United States. If the IRS were to contend successfully our Bermuda insurance subsidiaries or any of our other current or future non-U.S. subsidiaries are or were engaged in trade or business within the United States, our insurance business could be materially and adversely affected.
There is U.S. federal income tax risk associated with reinsurance transactions, intercompany transactions and distributions between U.S. companies and their non-U.S. affiliates, including from the Base Erosion and Anti-Abuse Tax (the "BEAT") on certain U.S. companies that make deductible payments to related non-U.S. companies in taxable years beginning after December 31, 2017. While Global Atlantic has taken certain steps to mitigate the effect of the BEAT, there can be no assurances that these steps will be successful. In addition, the Code permits the IRS to reallocate, recharacterize, or adjust items of income, deduction or certain other items related to a reinsurance agreement between related parties to reflect the proper "amount, source or character" for each item. Further, the tax treatment of certain aspects of reinsurance ceded to a non-U.S. reinsurer on a funds withheld coinsurance basis is uncertain. If the IRS were successfully to challenge Global Atlantic's intercompany reinsurance arrangements between its subsidiaries or Global Atlantic's tax treatment of funds withheld coinsurance with non-U.S. reinsurers (including the Bermuda insurance subsidiaries), our insurance business could be materially and adversely affected. There are significant cross-border transactions in place among Global Atlantic's affiliates, some of which Global Atlantic treats as loans or swaps for tax purposes, and Global Atlantic may expand the scope of its cross-border intercompany transactions in the future. There are also significant cross-border reinsurance transactions in place with non-U.S. third parties. If the IRS were to successfully challenge the tax treatment of these transactions, or if legislation were enacted, or administrative guidance promulgated, that altered the expected tax treatment of such transactions, our insurance business could be materially and adversely affected.
Changes in U.S. tax law could also affect the products that our insurance subsidiaries sell. Many of the products our insurance subsidiaries sell benefit from one or more forms of tax-favored status under current U.S. federal and state income tax regimes. For example, our insurance subsidiaries sell and reinsure annuity contracts that allow the policyholders to defer the recognition of taxable income earned within the contract. In addition, current U.S. federal income tax law permits the exclusion from taxation of death benefits paid under life insurance contracts. Changes in U.S. tax laws that alter the tax benefits or treatment of certain products could result in a material reduction in demand for our insurance subsidiaries' products and could affect policyholder behavior with respect to existing annuity products in ways that are difficult to predict, for example increasing the expected lapse rate or, if the treatment of existing contracts is grandfathered, reducing the rate at which existing contracts are surrendered or rolled over. In addition, changes in corporate tax rates and/or individual tax rates and/or the estate tax exclusion could impact the competitiveness of Global Atlantic’s product pricing or demand for such products, which could affect our insurance subsidiaries’ ability to attract or retain clients or could reduce the profitability of our insurance products and have a material adverse effect on our insurance business.
For periods prior to January 2, 2024, the IRS may successfully challenge GAFL's status as a non-U.S. corporation for U.S. federal income tax purposes. Under U.S. federal income tax law, a corporation is generally considered for U.S. federal income tax purposes to be a tax resident of the jurisdiction of its organization or incorporation. Because GAFL was a Bermuda-incorporated exempted entity prior to January 2, 2024, it would generally be classified as a non-U.S. corporation (and, therefore, a non-U.S. tax resident) under these rules for periods prior to 2024. However, Section 7874 of the Code ("Section 7874") provides an exception to this general rule under which a non-U.S. incorporated entity may, in certain circumstances, be treated as a U.S. corporation for U.S. federal income tax purposes.
However, the rules under Section 7874 are relatively complex and there is limited guidance regarding their application. There can be no assurance that the IRS will agree with the position that GAFL should not be treated as a U.S. corporation for U.S. federal income tax purposes for periods prior to 2024. If for such periods GAFL were to be treated as a U.S. corporation for U.S. federal income tax purposes under Section 7874 or for any other reason, GAFL would be subject to substantial additional historic U.S. federal income tax liability, including taxation of all of Global Atlantic's Bermuda insurance subsidiaries' subpart F income and global intangible low-taxed income, as defined under Section 951A(b) of the Code, which could have a material adverse effect on our insurance business.
114
On April 1, 2016, Global Atlantic completed a reorganization of GAFL (the "GAFL Reorganization"). As a result of the GAFL Reorganization, Section 7874 limits the ability of Global Atlantic's U.S. holding company and its U.S. affiliates to utilize certain U.S. tax attributes (including net operating losses and certain tax credits) to offset, during the ten-year period following the GAFL Reorganization, their U.S. taxable income, or related income tax liability, resulting from certain (1) transfers to related foreign persons of stock or other properties of Global Atlantic's U.S. holding company and its U.S. affiliates, and (2) income received or accrued from related foreign persons during such period by reason of a license of any property by Global Atlantic's U.S. holding company and its U.S. affiliates.
The effect of Bermuda's commitment to the OECD to eliminate harmful tax practices is uncertain and could adversely affect Global Atlantic's tax status in Bermuda. The OECD has published reports and launched a global dialogue among member and non-member countries on measures to limit harmful tax competition. These measures are largely directed at counteracting the effects of income tax havens and preferential income tax regimes in countries around the world. According to the OECD, Bermuda is a jurisdiction that has substantially implemented the internationally agreed tax standard and as such is listed on the OECD "whitelist." However, we are not able to predict whether any future changes will be made to this "whitelist" classification or whether any such changes will subject Global Atlantic and our Bermuda-domiciled subsidiaries to additional taxes. See "—Risks Related to Our Business—Changes in relevant tax laws, regulations or treaties or an adverse interpretation of these items by tax authorities could adversely impact our effective tax rate and tax liability" for discussions of the OECD's BEPS project.
Bermuda enacted legislation in December 2023 implementing a corporate tax aimed at multinational enterprises with revenues generally exceeding €750 million. The Bermuda corporate income tax (“CIT”) is a flat minimum tax based upon 15% of reported financial profits. The CIT comes into effect for tax years beginning in 2025, however implementation may be delayed for certain groups for up to five years. The legislation provides for various offsets and credits. It is not presently expected that the Bermuda CIT will have a significant impact upon Global Atlantic’s financial performance. However, there is uncertainty regarding the implementation of the CIT and its application to insurance companies, and the impact of the CIT on Global Atlantic and Bermuda-based businesses of its sponsored vehicles will continue to be assessed.
See Note 18 "Income Taxes" in our financial statements for further information regarding various tax matters.
Global Atlantic's businesses are heavily regulated across numerous jurisdictions, including with respect to capital requirements, and changes in regulation could reduce the profitability of our insurance business.
Our insurance and reinsurance subsidiaries are highly regulated by, among others, insurance regulators in the United States and Bermuda, and changes in regulations affecting our insurance business may reduce Global Atlantic's profitability and limit its growth. The laws and regulations of the jurisdictions in which our insurance and reinsurance subsidiaries are domiciled or may be deemed commercially domiciled may require these companies to, among other things, maintain minimum levels of statutory capital, surplus and liquidity, meet solvency standards, submit to periodic examinations of their financial condition, restrict payments of dividends and distributions of capital, restrict our ability, in certain cases, to write insurance and reinsurance policies, make certain types of investments and distribute funds, and restrict the type and concentration of investments that can be made. For example, due to regulatory restrictions on the payment of dividends, our U.S. insurance subsidiaries may not declare a dividend in 2024 to their holding companies without prior domiciliary state regulatory approval. Offering new products or offering products in additional jurisdictions will also subject Global Atlantic to additional regulation and compliance requirements. With respect to investments, our insurance and reinsurance subsidiaries must comply with applicable regulations regarding the type and concentration of investments it may make. These restrictions are set forth in investment guidelines that KKR's investment management subsidiary must comply with when providing investment management to our insurance companies. These restrictions may limit Global Atlantic's ability to invest and KKR's ability to earn fees on those investments. In addition, our insurance and reinsurance subsidiaries are subject to laws and regulations governing affiliate transactions. The investment management agreements between the KKR investment manager and our insurance subsidiaries were approved by applicable insurance regulators, and any changes of such agreements, including with respect to fees, must receive applicable regulatory approval. These affiliate transaction rules are particularly important to Global Atlantic given (1) its relationship with KKR and (2) the fact that its business strategy involves reinsuring business among its subsidiaries.
If our relationships, or our reputation with, various regulatory authorities were to deteriorate, our insurance business could be materially and adversely affected, including by making it more difficult, or impossible, for Global Atlantic to obtain necessary consents and approvals.
115
In addition to the regulations of the jurisdictions where our insurance subsidiaries are domiciled, Global Atlantic also must obtain licenses to sell insurance in other states and U.S. jurisdictions. Our non-U.S. insurance subsidiaries have and may obtain certified reinsurer and reciprocal jurisdiction reinsurer status in various U.S. states. Most state regulatory authorities are granted broad discretion in connection with their decisions to grant, renew or revoke licenses and approvals that are subject to state statutes. If Global Atlantic is unable to renew the requisite licenses and obtain the necessary approvals or otherwise does not comply with applicable regulatory requirements, the insurance regulatory authorities could stop, or temporarily suspend Global Atlantic from conducting some or all of its operations as well as impose fines.
All 50 U.S. states, the District of Columbia and the U.S. Virgin Islands have insurance guaranty association laws that require insurance companies doing business within those jurisdictions to participate in various types of guaranty associations or other similar arrangements. It is possible that a large insolvency could require extraordinary assessments on our insurance subsidiaries. We cannot predict the amount, nature or timing of any future assessments or legislation, any of which could have a material adverse impact on our insurance business.
At the United States federal level, the Dodd-Frank Act established the Federal Insurance Office ("FIO") within the U.S. Department of the Treasury to monitor the insurance industry. FIO publications or reports, some of which are periodically submitted to Congress, could continue to increase scrutiny of the industry and ultimately lead to changes in the regulation of insurers and reinsurers in the United States, which could negatively impact our insurance business.
All U.S. states allow reinsurers from approved non-U.S. jurisdictions, including for example Bermuda, to apply for reciprocal reinsurer status. A reinsurer with reciprocal reinsurer status is not required to post collateral to a U.S.-based ceding insurer for that ceding insurer to obtain credit in its statutory financial statements for that reinsurance. We cannot predict the impact of the removal of collateral requirements for reciprocal jurisdiction reinsurers in certain states may have on our insurance business, including its competitiveness in reinsurance transactions.
Insurance regulators have increased their scrutiny of the insurance regulatory framework in the United States, and some state legislatures have considered or enacted laws that alter, and in many cases increase, state authority to regulate insurance holding companies and insurance and reinsurance companies. The NAIC and state insurance regulators are increasingly focused on the relationships between alternative asset managers and insurers. This focus significantly increases scrutiny of insurance companies strategically partnered with alternative asset managers and the potential for additional regulation. We are unable to predict whether, when or in what form and what impact such regulatory changes will have on our insurance business, including after our acquisition of the remaining equity interest in Global Atlantic in January 2024. Insurance regulations also include restrictions on investments, including limits, regulatory approvals of affiliate investments, permissible asset classes, capital required and with respect to what assets or portion of assets may back reserves. These regulations may materially and adversely impact Global Atlantic’s returns and capital requirements.
Historically, Bermuda has faced criticism for its tax and regulatory rules and such views may persist. In addition, capital regulations applicable to our insurance subsidiaries may impose meaningful limitations on our insurance business. Insurance companies are subject to minimum capital and surplus requirements that vary by the jurisdiction where the insurance company is domiciled and are generally subject to change over time. In the United States, our insurance subsidiaries are subject to RBC standards and other minimum capital and surplus requirements imposed by state laws. The RBC standards are based upon the Risk-Based Capital for Insurers Model Act, promulgated by the NAIC, as adopted by Global Atlantic's domiciliary insurance regulators. Global Atlantic's Bermuda insurance subsidiaries are subject to Bermuda Solvency Capital Requirements ("BSCR") standards and other minimum capital and surplus requirements imposed by the BMA. Any failure to meet applicable requirements or minimum statutory capital requirements could subject Global Atlantic to examination or corrective action by regulators, including limitations on Global Atlantic's writing additional business or engaging in finance activities, supervision, receivership or liquidation. New statutory accounting guidance or changes or clarifications in interpretations of existing guidance—including but not limited to any new guidance, changes or clarifications resulting from the recommendations of the NAIC's Securities Valuation Office with respect to capital required for holding all tranches of a structured security—may adversely impact our insurance subsidiaries, including by limiting our ability to originate, or invest in, certain assets on behalf of our insurance subsidiaries or causing our insurance subsidiaries to increase their required capital in respect of such assets, thus making such asset exposures less attractive to our insurance subsidiaries, which may materially and adversely affect our business.
116
RBC ratios of U.S. retirement and life companies like Global Atlantic are impacted by factors beyond Global Atlantic's control, such as the statutory federal tax rate. Future changes in federal corporate tax rates could similarly impact RBC ratios. In addition, the NAIC from time to time considers changes to factors used in calculating RBC. The NAIC is pursuing a variety of reforms to its RBC framework, which could increase the capital requirements for Global Atlantic's U.S. insurance subsidiaries. The NAIC is considering revisions to the capital charges for asset-backed-securities, in particular CLOs, with a focus on increasing the capital charge on the mezzanine or residual tranches (i.e., equity securities) of these securitizations. Recent proposals would increase the applicable capital charge of such residual tranches or equity securities of asset-based securitizations from 30% to 45% as of year-end 2024. The NAIC has also developed a group capital calculation. It is unclear how the group capital calculation will interact with existing capital requirements for insurance companies in the United States and with international capital standards. In Bermuda, the BMA continues to review the BSCR on an ongoing basis, including to maintain its equivalency with Solvency II. We cannot predict the likelihood of changes to the capital requirements to which Global Atlantic is subject, whether such changes will have an impact on RBC ratios or whether Global Atlantic will need to raise and hold additional capital in response to such changes and any such changes may have a material adverse effect on our insurance business. Moreover, the determination of RBC is based on the NAIC designation of the assets in which Global Atlantic invests. NAIC designation for certain investments depends on the applicable NRSRO rating. If there are changes in an NRSRO's methodology, Global Atlantic's ability to invest in such assets may be impacted and Global Atlantic's investment results may be adversely impacted, or Global Atlantic may need to increase its required capital.
Regulators continue to propose or adopt fiduciary rules, best interest standards and other similar laws and regulations applicable to the sale of retirement and life insurance products, including the Department of Labor’s October 2023 proposal redefining the scope of “investment advice fiduciary” under ERISA. These rules, standards, laws and regulations generally require advisers providing investment recommendations to act in the client's best interest or put the client's interest ahead of their own interest. Global Atlantic faces uncertainty regarding the adoption of these rules and regulations, including that the SEC, Department of Labor and state insurance departments may adopt potentially conflicting or overlapping standards. These new and proposed regulations may fundamentally change the way financial advisors, agents, and financial institutions do business. These rules may impact the way in which Global Atlantic's products are marketed and offered by its distribution partners, which could have an impact on customer demand, impact the margins our insurance business makes on its products or increase compliance costs and burdens. These rules and potential rules could cause a material decline in sales of Global Atlantic's products in the individual channel, such as variable annuities and fixed-indexed annuities. Regulators in enforcement actions and private litigants could also find it easier to attempt to extend fiduciary status to, or to claim fiduciary or contractual breach by, advisors who would not be deemed fiduciaries under current regulations. Such laws and regulations may have a material adverse impact on the industry and may have a material adverse impact on our insurance business.
The cost of compliance with existing laws and regulations, including capital requirements, is high, and the cost of compliance with any changed, new or additional regulatory requirements could have a material adverse effect on our insurance business, including further restricting our ability to conduct business and our ability to continue to comply with applicable laws and regulations, which could impact Global Atlantic's potential growth and could subject Global Atlantic to fines and other sanctions. Global Atlantic also must balance overlapping and potentially conflicting regulations and accounting rules and interpretations thereof (which may also change over time), including in response to changes in the overall business environment.
Our Bermuda insurance subsidiaries are subject to regulation by the BMA that may restrict their operations, and we cannot guarantee that insurance supervisors in the United States or elsewhere will not in the future assert that our Bermuda insurance subsidiaries are subject to additional licensing requirements.
The BMA regulates and supervises each of our Bermuda insurance subsidiaries on a stand-alone basis in Bermuda. The Bermuda Insurance Act and the policies of and/or other codes issued by the BMA relevant to insurers require each of our Bermuda reinsurance subsidiaries to, among other requirements, maintain a minimum level of capital and surplus; satisfy solvency standards; comply with restrictions on dividends; obtain prior approval or provide notification to the BMA of changes in shareholder controller shares; make financial statement filings; prepare a financial condition report; maintain a head office in Bermuda from which each of our Bermuda insurance subsidiaries' insurance business will be directed and managed; and allow for the performance of certain periodic examinations of its financial condition. These statutes and regulations may restrict Global Atlantic's ability to write insurance and reinsurance policies, distribute funds and pursue its investment strategy. Our Bermuda insurance subsidiaries will be exposed to any changes in the political environment in Bermuda.
117
The Bermuda insurance and reinsurance regulatory framework is subject to scrutiny from many jurisdictions. As a result of such overseas scrutiny, the BMA has implemented and imposed additional requirements on the licensed insurance companies it regulates to achieve equivalence under Solvency II, the solvency regime applicable to the EU insurance sector. As such, Bermuda's reinsurance industry operates in a legal and regulatory environment that is deemed to be equivalent with that of the EU. The BMA's additional requirements resulting from Solvency II equivalence include enhanced solvency and governance requirements imposed on insurers and reinsurers. As part of the additional requirements, the BMA has also established a group solvency framework that could further enhance the required capital and solvency requirements if the BMA is deemed to be the group regulator. There is a risk that if Solvency II were amended in any way, Bermuda may be required to amend its regulatory regime to maintain its equivalence under Solvency II, which could lead to changes in the regulatory regime administered by the BMA.
The BMA continues to consider further revisions to the Bermuda capital ratio, called BSCR, and may propose further updates to certain aspects of the EBS Framework. Any such updates may materially increase the capital our Bermuda insurance subsidiaries must hold.
We cannot provide any assurances that insurance supervisors in the United States or elsewhere will not review Global Atlantic's activities and assert that our Bermuda insurance subsidiaries are subject to a U.S. jurisdiction's requirements. In addition, our Bermuda insurance subsidiaries may be subject to indirect regulatory requirements imposed by jurisdictions that may limit Global Atlantic's ability to provide reinsurance. For example, our Bermuda insurance subsidiaries' ability to write reinsurance may be subject, in certain cases, to arrangements satisfactory to applicable supervisory bodies. Regulatory scrutiny or proposed legislation and regulations may have the effect of imposing additional requirements upon, or restricting reinsurance from, U.S. insurers to non-U.S. insurers, in particular between affiliated insurance companies. Reinsurance between our U.S. and Bermuda insurance subsidiaries is subject to approval by the applicable U.S. domiciliary state insurance department, and there can be no guarantee such approval will be obtained. Furthermore, Global Atlantic Re Limited reinsures substantially all of Global Atlantic's variable annuity business. If Global Atlantic Re Limited were no longer able to reinsure such business or if Global Atlantic had to recapture variable annuity business reinsured to Global Atlantic Re Limited due to changes in laws or regulations applicable to Global Atlantic Re Limited, Global Atlantic would likely experience increased fluctuations in its RBC ratio attributable to the sensitivity of variable annuities to changes in equity and interest rate markets. A loss of or inability to obtain reciprocal or certified reinsurer status for Global Atlantic's non-U.S. insurance companies may result in requiring additional collateral to be posted with respect to Global Atlantic's existing reinsurance agreements, which may have a material adverse effect on our insurance business.
If in the future our Bermuda insurance subsidiaries were to become subject to regulation under the laws of any state in the United States or the laws of the United States or of any other country, Global Atlantic may consider various alternatives to or restructuring of its operations. If Global Atlantic attempts to license its Bermuda insurance subsidiaries in another jurisdiction, for instance, Global Atlantic may not be able to do so and the modification of the conduct of its business or the noncompliance with insurance statutes and regulations could significantly and negatively affect our insurance business.
Any material changes or failures with respect to the above could have a material adverse effect on our Bermuda insurance business.
Global Atlantic may not be able to mitigate the reserve strain associated with statutory accounting rules, potentially resulting in a negative impact on Global Atlantic's capital position or in a need to increase prices or reduce sales of certain insurance products.
The application of certain statutory accounting rules for term life insurance policies with long-term premium guarantees and universal life policies with secondary guarantees requires Global Atlantic to maintain reserves at a level that exceeds what our insurance subsidiaries' actuarial assumptions for the applicable business would otherwise require. Global Atlantic has special purpose financial captive insurance company subsidiaries ("captives") domiciled in Vermont and Iowa that facilitate the financing of the redundant reserve requirements associated with these statutory accounting rules. These arrangements are subject to review by state insurance regulators and rating agencies.
Further changes in such statutory accounting rules will likely make it difficult for Global Atlantic to establish new captive financing arrangements on a basis consistent with its current captives. As a result of these restrictions on financing redundant reserves, the implementation of new captive structures in the future may be less capital-efficient, may lead to lower product returns and/or increased product pricing, or may result in reduced sales of certain products.
118
Certain of the reserve financing facilities Global Atlantic has put in place will mature prior to the run-off of the liabilities they support. As a result, we cannot provide any assurances that it will be able to continue to implement actions either to mitigate the strain of redundant reserves on future sales of term and universal life insurance products or maintain collateral support related to Global Atlantic's captives or existing third-party reinsurance arrangements to which one of our captive reinsurance subsidiaries is a party. If Global Atlantic is unable to continue to implement those actions or maintain existing collateral support, it may be required to increase statutory reserves or incur higher operating costs than currently anticipated.
It is also unclear what additional actions and regulatory changes will result from the continued scrutiny of captive reinsurers and reform efforts by the NAIC and other regulatory bodies. The NAIC is evaluating changes to accounting rules regarding surplus notes with linked assets, a structure used in certain captive reserve financing transactions, and Global Atlantic is monitoring for any changes that may impact its statutory financial statements. If state insurance regulators determine to restrict Global Atlantic's use of captive reinsurers, it could require Global Atlantic to increase statutory reserves, incur higher operating or tax costs or reduce sales. If Global Atlantic is unsuccessful or unable to finance these noneconomic reserves, the competitiveness, capital and financial position and results of operations of our insurance business may be materially and adversely affected.
Risks Related to Our Organizational Structure
The Series I preferred stockholder’s significant voting power limits the ability of holders of our common stock to influence our business, and conflicts of interest may arise among the Series I preferred stockholder and the holders of our common stock.
The Series I preferred stockholder has significant voting power, which limits the ability of holders of our common stock to influence our business. Our Co-Executive Chairmen, when acting together, jointly control the Series I preferred stockholder and thereby the vote of the Series I preferred stock held by it.
The Series I preferred stockholder has the ability to appoint and remove members of our board of directors and has the right to approve certain corporate actions as specified in our certificate of incorporation. If the holders of our common stock are dissatisfied with the performance of our board of directors, they have no ability to remove any of our directors, with or without cause. Through its ability to elect our board of directors and its approval rights over certain corporate transactions, the Series I preferred stockholder may be deemed to control our business and affairs, including influence over the amount and timing of our investments and dispositions, indebtedness and cash expenditures (including those relating to compensation, issuances of capital stock or Group Partnership Units, tax liabilities and amounts of reserves).
The vote of our Series I preferred stock will determine the outcome of all matters that are not listed below as being subject to a vote by our common stock.
Holders of our common stock are entitled to vote with respect to:
•Any amendment of our certificate of incorporation to change the par value of our common stock or the powers, preferences or special rights of our common stock in a way that would affect our common stock adversely;
•A conversion of the legal entity form of KKR & Co. Inc.;
•A transfer, domestication or continuance of KKR & Co. Inc. to a foreign jurisdiction.
•A sale, exchange or disposition of all or substantially all of our assets;
•A merger, consolidation or other business combination;
•An increase in the number of authorized shares of Series I preferred stock; and
•Certain amendments to our certificate of incorporation that would have a material adverse effect on our common stock relative to the other classes of our stock.
Furthermore, holders of our common stock have the right to vote on the adoption of a new equity compensation plan, any material amendment to an existing equity compensation plan, and an issuance of common stock if, based on the number of shares or the voting power outstanding before such issuance, more than 1% of our common stock is issued to our affiliates and other related parties or more than 20% of our common stock is issued in any transaction, subject to certain limited exemptions.
119
Our amended and restated certificate of incorporation and amended and restated bylaws contain additional provisions affecting the holders of our common stock, including limitations on the calling of meetings of the stockholders and procedures for submitting proposals for business to be considered at meetings of the stockholders. In addition, any person that beneficially acquires 20% or more of any class of stock then outstanding without the consent of our board of directors (other than the Series I preferred stockholder) is unable to vote such stock on any matter submitted to such stockholders.
In addition, although the affirmative vote of a majority of our directors is required for any action to be taken by our board of directors, certain specified actions will also require the approval of the Series I preferred stockholder, which is controlled by our Co-Executive Chairmen when acting together. These actions consist of the following:
•the entry into a debt financing arrangement by us in an amount in excess of 10% of our then existing long-term indebtedness (other than the entry into certain intercompany debt financing arrangements);
•the issuance by us or our subsidiaries of any securities that would (i) represent, after such issuance, or upon conversion, exchange or exercise, as the case may be, at least 5% on a fully diluted, as converted, exchanged or exercised basis, of any class of our or their equity securities or (ii) have designations, preferences, rights, priorities or powers that are more favorable than those of our common stock;
•the adoption by us of a shareholder rights plan;
•the amendment of our certificate of incorporation, certain provisions of our bylaws relating to our board of directors and officers or the operating agreement of KKR Group Partnership;
•the exchange or disposition of all or substantially all of our assets or the assets of KKR Group Partnership;
•the merger, sale or other combination of our company or KKR Group Partnership with or into any other person;
•the transfer, mortgage, pledge, hypothecation or grant of a security interest in all or substantially all of the assets of KKR Group Partnership;
•the appointment or removal of a Chief Executive Officer or a Co-Chief Executive Officer;
•the termination of our employment of any of our officers or the officers of any of our subsidiaries or the termination of the association of a partner with any of our subsidiaries, in each case, without cause;
•the liquidation or dissolution of us or KKR Group Partnership; and
•the withdrawal, removal or substitution of any person as the general partner of KKR Group Partnership or the transfer of beneficial ownership of all or any part of a general partner interest in KKR Group Partnership to any person other than a wholly-owned subsidiary.
Accordingly, our Board may be prevented from causing us to take any of the actions discussed above if the Series I preferred stockholder does not provide its approval to any such action, even if the Board believes such action may be in the best interest of us and our stockholders.
As a result, conflicts of interest may arise among the Series I preferred stockholder and its controlling persons, on the one hand, and us and the holders of our common stock, on the other hand.
For a more detailed description of our common stock and Series I preferred stock, see “Description of Securities Registered Pursuant to Section 12 of the Securities Exchange Act of 1934,” which is filed as an exhibit to this report. In addition, by no later than December 31, 2026, we agreed in the Reorganization Agreement to (i) eliminate our Series I preferred stock and (ii) establish voting rights for our common stock on a one vote per share basis for all matters subject to a common stockholders’ vote under Delaware corporate law, including with respect to the election of directors. For more information about the transactions contemplated by the Reorganization Agreement, see “Certain Relationships and Related Transactions, and Director Independence—Reorganization Agreement.”
120
As a “controlled company,” we qualify for some exemptions from the corporate governance and other requirements of the NYSE and are not required to comply with certain provisions of U.S. securities laws.
Prior to the Sunset Date, we are a “controlled company” within the meaning of the corporate governance standards of the NYSE. As a “controlled company” we have elected not to comply with certain corporate governance requirements of the NYSE, including the requirements: (i) that the listed company have a nominating and corporate governance committee that is composed entirely of independent directors, (ii) that the listed company have a compensation committee that is composed entirely of independent directors and (iii) that the compensation committee be required to consider certain independence factors when engaging compensation consultants, legal counsel and other committee advisers. Accordingly, holders of our common stock do not currently have the same protections afforded to stockholders of companies that are subject to all of the corporate governance requirements of the NYSE.
Prior to the Sunset Date, we are not required to file proxy statements or information statements under Section 14 of the Exchange Act, unless a vote of holders of our common stock is required. Accordingly, legal causes of action and remedies under Section 14 of the Exchange Act for inadequate or misleading information in proxy statements are currently not generally available to holders of our common stock. In addition, until Sunset Date, we are not subject to the “say-on-pay,” and “say-on-frequency” provisions of the Dodd-Frank Act or “pay for performance” compensation disclosure. As a result, our stockholders do not currently have an opportunity to provide a non-binding vote on the compensation of our named executive officers or receive additional compensation disclosure. Moreover, holders of our common stock are currently unable to bring matters before our annual meeting of stockholders or nominate directors at such meeting, nor can they currently generally submit stockholder proposals under Rule 14a-8 of the Exchange Act.
Following the elimination of our Series I preferred stock on or before December 31, 2026, pursuant to the Reorganization Agreement, we will no longer be exempted from the foregoing corporate governance requirements of the NYSE (following a transition period), and we will be required to comply with the foregoing provisions of the U.S. securities laws. For more information about the transactions contemplated by the Reorganization Agreement, see "Certain Relationships and Related Transactions, and Director Independence—Reorganization Agreement."
Our certificate of incorporation states that the Series I preferred stockholder is under no obligation to consider the separate interests of the other stockholders and contains provisions limiting the liability of the Series I preferred stockholder.
Subject to applicable law, our certificate of incorporation contains provisions limiting the duties owed by the Series I preferred stockholder and contains provisions allowing the Series I preferred stockholder to favor its own interests and the interests of its controlling persons over us and the holders of our common stock. Our certificate of incorporation contains provisions stating that the Series I preferred stockholder is under no obligation to consider the separate interests of the other stockholders (including the tax consequences to such stockholders) in deciding whether or not to authorize us to take (or decline to authorize us to take) any action as well as provisions stating that the Series I preferred stockholder shall not be liable to the other stockholders for damages or equitable relief for any losses, liabilities or benefits not derived by such stockholders in connection with such decisions.
Even if there is deemed to be a breach of the obligations set forth in our certificate of incorporation, our certificate of incorporation provides that the Series I preferred stockholder will not be liable to us or the holders of our common stock for any acts or omissions unless there has been a final and non-appealable judgment by a court of competent jurisdiction determining that the Series I preferred stockholder or its officers and directors acted in bad faith or engaged in fraud or willful misconduct. These provisions restrict the remedies available to stockholders with respect to actions of the Series I preferred stockholder.
In addition, we have agreed to indemnify the Series I preferred stockholder and its affiliates and any member, partner, tax matters partner (as defined in U.S. Internal Revenue Code of 1986, as amended (the "Code"), as in effect prior to 2018), partnership representative (as defined in the Code), officer, director, employee, agent, fiduciary or trustee of any of KKR or its subsidiaries (which includes KKR Group Partnership), the Series I preferred stockholder or any of our or the Series I preferred stockholder's affiliates and certain other specified persons (collectively, "Indemnitees"), to the fullest extent permitted by law, against any and all losses, claims, damages, liabilities, joint or several, expenses (including legal fees and expenses), judgments, fines, penalties, interest, settlements or other amounts incurred by any Indemnitee. We have agreed to provide this indemnification unless there has been a final and non-appealable judgment by a court of competent jurisdiction determining that the Indemnitee acted in bad faith or engaged in fraud or willful misconduct. We have also agreed to provide this indemnification for criminal proceedings.
121
The provision of our certificate of incorporation requiring exclusive venue in the state and federal courts located in the State of Delaware or federal district courts of the United States for certain types of lawsuits may have the effect of discouraging lawsuits against us and our directors, officers and stockholders.
Our certificate of incorporation requires that (i) any derivative action, suit or proceeding brought on behalf of KKR, (ii) any action, suit or proceeding asserting a claim of breach of a fiduciary duty owed by any current or former director, officer, employee or stockholder of KKR to KKR or KKR's stockholders, (iii) any action, suit or proceeding asserting a claim arising pursuant to any provision of the Delaware General Corporation Law ("DGCL"), our certificate of incorporation or our bylaws or as to which the DGCL confers jurisdiction on the Court of Chancery of the State of Delaware or (iv) any action, suit or proceeding asserting a claim governed by the internal affairs doctrine may only be brought in the Court of Chancery of the State of Delaware or, if such court does not have subject matter jurisdiction thereof, the federal district court located in the State of Delaware. In addition, the federal district courts of the United States are the exclusive forum for the resolution of any action, suit or proceeding asserting a cause of action arising under the Securities Act and the Exchange Act. This provision may have the effect of discouraging lawsuits against us and our directors, officers and stockholders.
An investment in our common stock is not an investment in any of our investment vehicles, insurance companies or other businesses operated by our subsidiaries, and the assets and revenues of our investment vehicles are not directly available to us.
Our common stock only represents an investment in securities of KKR & Co. Inc., the holding company of the KKR business. While our historical consolidated financial statements include financial information, including assets and revenues, of certain investment vehicles on a consolidated basis, and our future financial statements will continue to consolidate certain of these investment vehicles, such assets and revenues belong to the investment vehicle and not to us except to a limited extent through management fees, carried interest or other incentive income, distributions and other proceeds arising from our agreements with these investment vehicles, as discussed in more detail in this report. Additionally, given our holding company structure, an investment in our common stock is not an investment directly in our insurance companies or any other businesses that may be operated by our subsidiaries.
Our common stock price may decline due to the large number of shares eligible for future sale, and issued or issuable pursuant to our equity incentive plans or as consideration in acquisitions.
The market price of our common stock could decline as a result of sales of a large number of shares in the market or the perception that such sales could occur. These sales, or the possibility that these sales may occur, also might make it more difficult for us to sell shares of common stock in the future at a time and at a price that we deem appropriate.
In addition, we have issued and will continue to issue equity awards that vest into or are exchangeable for shares of our common stock pursuant to our 2019 Equity Incentive Plan. We are authorized to grant equity awards equal to 15% of the aggregate number of shares of common stock outstanding and KKR Group Partnership Units (excluding KKR Group Partnership Units held by KKR & Co. Inc. or its subsidiaries) (together, "Diluted Common Shares") minus the number of shares underlying any outstanding equity awards granted under our 2019 Equity Incentive Plan that have not yet been delivered upon vesting. Under the 2019 Equity Incentive Plan, on the first day of each fiscal year, the number of shares of common stock available for issuance of future awards under our 2019 Equity Incentive Plan will be adjusted upwards to 15% of the aggregate number of shares of common stock outstanding and KKR Group Partnership Units (excluding KKR Group Partnership Units held by KKR & Co. Inc. or its subsidiaries) outstanding at the close of business on the last day of the immediately preceding fiscal year, minus the number of shares underlying any outstanding equity awards granted under our 2019 Equity Incentive Plan that have not yet been delivered upon vesting. In addition, previously issued awards that were canceled or are canceled in the future, or in certain cases, withheld in respect of tax withholding obligations, are or will become available for further grant under the terms of our 2019 Equity Incentive Plan. For the number of equity awards available for issuance, see Note 19 "Equity Based Compensation" in our financial statements. For other information about our equity awards, see also "Executive Compensation—KKR & Co. Inc. Equity Incentive Plan." In the past, we have issued and sold our common stock to generate cash proceeds to pay withholding taxes, social benefit payments or similar payments payable by us in respect of awards granted pursuant to our Equity Incentive Plans or the amount of cash delivered in respect of awards granted pursuant to our Equity Incentive Plans that are settled in cash instead of shares of common stock. We may issue and sell shares of our common stock in the future for similar purposes or for any other purpose we deem to be appropriate.
122
We have used, and in the future may continue to use, our common stock or securities convertible, exchangeable or exercisable into our common stock as consideration in connection with acquisitions and strategic investments. For example, in connection with the acquisition of a majority of the equity interest of Global Atlantic on February 1, 2021, we issued 23.0 million shares of Series C Mandatory Convertible Preferred Stock; in connection with KKR's acquisition of KKR Financial Holdings LLC ("KFN") on April 30, 2014, we issued the equivalent of approximately 104.3 million shares of our common stock; in connection with KKR's acquisition of Avoca on February 19, 2014, we issued the equivalent of approximately 4.9 million shares of our common stock; and in connection with KKR's initial acquisition on November 2, 2015 and subsequent increases in ownership of Marshall Wace, we issued the equivalent of approximately 23.0 million shares of our common stock. In addition, in connection with other investments, we may make certain future contingent payments in the form of common stock or securities convertible, exchangeable or exercisable into our common stock. If our valuations of these transactions are not accurate or if the value of these acquisitions and investments is not realized, the value of our common stock as well as our dividend per share of common stock may decline.
Future issuances of preferred stock may cause the price of our common stock to decline, which may negatively impact our common stockholders.
Our board of directors is authorized to issue series of shares of preferred stock (including preferred stock convertible into common stock) without any action on the part of our stockholders and, with respect to each such series, fix, without stockholder approval (except as may be required by our certificate of incorporation or any certificate of designation relating to any outstanding series of preferred stock), the designation of such series, the powers (including voting powers), preferences and relative, participating, optional and other special rights, and the qualifications, limitations or restrictions thereof, of such series of preferred stock and the number of shares of such series. Any series of preferred stock we may issue in the future will rank senior to all of our common stock with respect to the payment of dividends or upon our liquidation, dissolution, or winding-up. We have issued series of preferred stock in the past, and if we issue cumulative preferred stock in the future that has preference over our common stock with respect to the payment of dividends or upon our liquidation, dissolution, or winding up, or if we issue preferred stock with voting rights that dilute the voting power of our common stockholders in the instances in which they have the right to vote, the market price of our common stock could decrease. Similarly, the limited partnership agreement of KKR Group Partnership authorizes the general partner of KKR Group Partnership to issue an unlimited number of additional securities of KKR Group Partnership with such designations, preferences, rights, powers and duties that are different from, and may be senior to, those applicable to the KKR Group Partnership Units, and which may be exchangeable for KKR Group Partnership Units.
Our certificate of incorporation provides us with a right to acquire all of the then outstanding shares of common stock under specified circumstances, which may adversely affect the price of our common stock and the ability of holders of our common stock to participate in further growth in our stock price.
Our certificate of incorporation provides that, if at any time, either (i) less than 10% of the total shares of any class our stock then outstanding (other than Series I preferred stock and other series of preferred stock) is held by persons other than the Series I preferred stockholder and its affiliates or (ii) we are subjected to registration under the provisions of the Investment Company Act, we may exercise our right to call and purchase all of the then outstanding shares of common stock held by persons other than the Series I preferred stockholder or its affiliates or assign this right to the Series I preferred stockholder or any of its affiliates. As a result, a stockholder may have his or her shares of our common stock purchased from him or her at an undesirable time or price and in a manner which adversely affects the ability of a stockholder to participate in further growth in our stock price.
123
We intend to pay periodic dividends to the holders of our common stock, but our ability to do so may be limited by our holding company structure, contractual restrictions, our cash flow from operations and available liquidity.
We intend to pay cash dividends on a quarterly basis. We are a holding company and have no material assets other than the KKR Group Partnership Units that we hold through wholly-owned subsidiaries and have no independent means of generating income. The declaration and payment of dividends to our stockholders will be at the sole discretion of our board of directors, and our dividend policy may be changed at any time. The declaration and payment of dividends is subject to legal, contractual and regulatory restrictions on the payment of dividends by us or our subsidiaries, including restrictions contained in our debt agreements, the terms of our certificate of incorporation, and such other factors as the board of directors considers relevant including, among others: our available cash and current and anticipated cash needs, including funding of investment commitments and debt service and future debt repayment obligations; general economic and business conditions; our strategic plans and prospects; our results of operations and financial condition; and our capital requirements. Under Section 170 of the DGCL, our board of directors may only declare and pay dividends either out of our surplus (as defined in DGCL) or in case there is no such surplus, out of our net profits for the fiscal year in which the dividend is declared and/or the preceding fiscal year. However, dividends may not be declared out of net profits if our capital, computed in accordance with DGCL, shall have been diminished by depreciation in the value of our property, or by losses, or otherwise, to an amount less than the aggregate amount of the capital represented by the issued and outstanding stock of all classes having a preference upon the distribution of assets. Furthermore, by paying cash dividends rather than investing that cash in our businesses, we risk slowing the pace of our growth, or not having a sufficient amount of cash to fund our operations, new investments or unanticipated capital expenditures, should the need arise. In addition, if we issue preferred stock in the future, it will rank senior to our common stock with respect to the payment of dividends.
We will be required to pay certain principals for most of the benefits relating to our use of tax attributes we receive from historical exchanges of our common stock for KKR Group Partnership Units.
We are required to make certain payments under a tax receivable agreement to certain principals who have exchanged prior to May 30, 2022 their KKR Holdings Units for shares of common stock as transferees of KKR Group Partnership Units. Certain of these exchanges resulted in an increase in our share of the tax basis of the tangible and intangible assets of KKR Group Partnership, primarily attributable to a portion of the goodwill inherent in our business. This increase in tax basis may increase (for tax purposes) depreciation and amortization and therefore reduce the amount of income tax we would otherwise be required to pay in the future. This increase in tax basis may also decrease gain (or increase loss) on future dispositions of certain capital assets to the extent tax basis is allocated to those capital assets. Under the tax receivable agreement, these former principals are entitled to receive 85% of the amount of cash tax savings, if any, in U.S. federal, state and local income tax that we realize as a result of this increase in tax basis, as well as 85% of the amount of any such savings we actually realize as a result of increases in tax basis that arise due to future payments under the agreement. These payment obligations are obligations of KKR Group Co. Inc. and its wholly-owned subsidiary, KKR Group Holdings Corp., which are treated as corporations for U.S. tax purposes. The amount of payments due under the tax receivable agreement depends on the amount of tax savings in any given year, which will vary depending upon a number of factors, including the number of units previously exchanged, the price of our common stock at the time of such exchanges, the extent to which such exchanges were taxable, the amount and timing of our taxable income, prevailing corporate tax rates over time, and whether we are subject to the corporate alternative minimum book tax.
The tax receivable agreement was terminated on May 30, 2022 pursuant to the Reorganization Agreement. However, all obligations of KKR Group Co. Inc. to make payments arising under the tax receivable agreement with respect to the final exchange on May 18, 2022 and any exchanges completed prior to such exchange remain outstanding until fully paid. For information about management's best estimate of the amounts expected to be owed under the tax receivable agreement, please see "Management's Discussion and Analysis of Financial Condition and Results of Operations—Liquidity Needs—Tax Receivable Agreement" in this report. For further information generally, see also "Certain Relationships and Related Transactions, and Director Independence."
We may need to incur debt to finance payments under the tax receivable agreement to the extent our cash resources are insufficient to meet our obligations under the tax receivable agreement as a result of timing discrepancies or otherwise. Payments under the tax receivable agreement will be based upon the tax reporting positions that we will determine. We are not aware of any issue that would cause the IRS to challenge a tax basis increase. However, our former principals will not be required to reimburse us for any payments previously made under the tax receivable agreement if such tax basis increase, or the tax benefits we claim arising from such increase, is successfully challenged by the IRS. As a result, in certain circumstances, payments under the tax receivable agreement could be in excess of our cash tax savings. Our ability to achieve benefits from any tax basis increase, and the payments to be made under the tax receivable agreement, will depend upon a number of factors, as discussed above, including the timing and amount of our future taxable income.
124
If we were deemed to be an "investment company" subject to regulation under the Investment Company Act, applicable restrictions could make it impractical for us to continue our business as contemplated and could have a material adverse effect on our business.
A person will generally be deemed to be an "investment company" for purposes of the Investment Company Act if:
•it is or holds itself out as being engaged primarily, or proposes to engage primarily, in the business of investing, reinvesting or trading in securities; or
•absent an applicable exemption, it owns or proposes to acquire investment securities having a value exceeding 40% of the value of its total assets (exclusive of U.S. government securities and cash items) on an unconsolidated basis.
We regard ourselves as an investment management firm. We are engaged primarily in the business of providing investment management services and, through Global Atlantic, the insurance business, and not in the business of investing, reinvesting or trading in securities. Accordingly, we do not believe that we are an "orthodox" investment company as defined in Section 3(a)(1)(A) of the Investment Company Act and described in the first bullet point above.
With regard to the second bullet point above, which describes an “investment company” as defined in Section 3(a)(1)(C) of the Investment Company Act (referred to herein as the “40% test”), we have no material assets other than our equity interests in our sole subsidiary, which in turn has no material assets other than general partner interests in KKR Group Partnership. Through these interests, we indirectly are vested with all management and control over KKR Group Partnership. We do not believe our equity interests in our subsidiary are investment securities, and we believe that the capital interests of the general partners of our investment vehicles in their respective investment vehicles are neither securities nor investment securities. Accordingly, based on our determination, less than 40% of our total assets (exclusive of U.S. government securities and cash items) on an unconsolidated basis are comprised of assets that could be considered investment securities. However, certain of our subsidiaries have a significant number of investment securities, and we expect to make investments in other investment securities from time to time. We monitor these holdings regularly to confirm our continued compliance with the 40% test. The need to comply with this 40% test may cause us to restrict our business and subsidiaries with respect to the assets in which we can invest and/or the types of securities we may issue, sell investment securities, including on unfavorable terms, acquire assets or businesses that could change the nature of our business or potentially take other actions that may be viewed as adverse by the holders of our common stock, in order to ensure conformity with exceptions provided by, and rules and regulations promulgated under, the Investment Company Act.
The Investment Company Act and the rules and regulations thereunder contain detailed parameters for the organization and operation of investment companies. Among other things, the Investment Company Act and the rules and regulations thereunder limit or prohibit transactions with affiliates, impose limitations on the issuance of debt and equity securities, generally prohibit the issuance of options and impose certain governance requirements. We intend to conduct our operations so that we will not be deemed to be an investment company under the Investment Company Act. If anything were to happen which would cause us to be deemed to be an investment company under the Investment Company Act, requirements imposed by the Investment Company Act, including limitations on our capital structure, ability to transact business with affiliates and ability to compensate key employees, would make it impractical for us to continue our business as currently conducted, impair the agreements and arrangements between and among us, and materially and adversely affect us. In addition, we may be required to limit the amount of investments that we make as a principal, potentially divest of our investments or otherwise conduct our business in a manner that does not subject us to the registration and other requirements of the Investment Company Act.
With respect to our subsidiary Global Atlantic, we believe it is not and does not propose to be primarily engaged in the business of investing, reinvesting or trading in securities, and we do not believe that Global Atlantic has held itself out as such. Global Atlantic is primarily engaged through its wholly-owned insurance companies in the business of writing insurance, and on an unconsolidated basis, Global Atlantic expects that in excess of 65% of Global Atlantic's gross income will be derived from its wholly-owned insurance companies. Global Atlantic's holding companies do not own or propose to own investment securities in excess of the 40% test. Global Atlantic's insurance companies intend to operate so that in excess of 65% of their business is derived from insurance business, meaning such entities are exempt from designation as an investment company under Section 3(c)(6) of the Investment Company Act. If Global Atlantic were deemed an investment company, restrictions imposed by the Investment Company Act, including limitations on capital structure and ability to transact with affiliates, will likely make it impractical for Global Atlantic to continue its business operations as currently conducted. Global Atlantic may need to take significant actions to avoid registration as an investment company.
125
With respect to our subsidiary KFN, we believe it is not and does not propose to be primarily engaged in the business of investing, reinvesting or trading in securities, and we do not believe that KFN has held itself out as such. KFN conducts its operations primarily through its majority-owned subsidiaries, which is either outside of the definition of an investment company as defined in the Investment Company Act or excepted from such definition under the Investment Company Act. KFN monitors its holdings regularly to confirm its continued compliance with the 40% test described in the second bullet point above, and restricts its subsidiaries with respect to the assets in which each of them can invest and/or the types of securities each of them may issue in order to ensure conformity with exceptions provided by, and rules and regulations promulgated under, the Investment Company Act. If the SEC were to disagree with KFN's treatment of one or more of its subsidiaries as being excepted from the Investment Company Act, with its determination that one or more of its other holdings are not investment securities for purposes of the 40% test, or with its determinations as to the nature of its business or the manner in which it holds itself out, KFN and/or one or more of its subsidiaries could be required either (i) to change substantially the manner in which it conducts its operations to avoid being subject to the Investment Company Act or (ii) to register as an investment company. Either of these would likely have a material adverse effect on KFN, its ability to service its indebtedness and to make distributions on its shares, and on the market price of its securities, and could thereby materially and adversely affect us.
In 2011, the SEC published an advance notice of proposed rulemaking regarding Rule 3a-7 under the Investment Company Act and a concept release seeking information on Section 3(c)(5)(C) of the Investment Company Act, two provisions with which KKR's subsidiaries, including KFN, must comply under the 40% test described above. Among the issues for which the SEC has requested comment is whether Rule 3a-7 should be modified so that parent companies of subsidiaries that rely on Rule 3a-7 should treat their interests in such subsidiaries as investment securities for purposes of the 40% test. The SEC also requested information about the nature of entities that invest in mortgages and mortgage-related pools and how the SEC staff's interpretive positions in connection with Section 3(c)(5)(C) affect these entities. Although no further action has been taken by the SEC, any guidance or action from the SEC or its staff, including changes that the SEC may ultimately propose and adopt to the way Rule 3a-7 applies to entities or new or modified interpretive positions related to Section 3(c)(5)(C), could further inhibit KKR's ability, or the ability of any of its subsidiaries, including KFN, to pursue its current or future operating strategies, which could have a material adverse effect on us.
We may from time to time undertake reorganizations that may adversely impact us.
From time to time, we may undertake reorganizations or make other changes to our organizational structure. For example, on July 1, 2018, we converted from a Delaware limited partnership to a Delaware corporation; on January 1, 2020, we completed an reorganization to, among other changes, consolidate the three intermediate holdings companies for KKR's business; and, most recently, on May 31, 2022, we completed the mergers contemplated by the Reorganization Agreement by which KKR acquired KKR Holdings. We also committed to undertake another reorganization by the Sunset Date (as defined in the Reorganization Agreement), which will occur not later than December 31, 2026, whereby control of KKR by our Series I preferred stock will be eliminated. These reorganizations or changes, including the reorganization scheduled to occur on the Sunset Date, could be disruptive to our business, result in significant expense, require regulatory approvals, and may not be successful in achieving its objectives or fail to result in the intended or expected benefits, any of which could materially and adversely impact us. For more information about the Reorganization Agreement, see "Certain Relationships and Related Transactions, and Director Independence—Reorganization Agreement" in this report.
Anti-takeover provisions in our organizational documents could delay or prevent a change of control.
In addition to the provisions related to our Series I preferred stock and Series I preferred stockholder described in this report, certain provisions in our certificate of incorporation and bylaws may discourage, delay or prevent a merger or acquisition that a stockholder may consider favorable by, for example:
•permitting our board of directors to issue one or more series of preferred stock;
•requiring advance notice for stockholder proposals and nominations if they are ever permitted by applicable law; and
•placing limitations on convening stockholder meetings.
These provisions may also discourage acquisition proposals or delay or prevent a change in control. See "Description of Securities Registered Pursuant to Section 12 of the Securities Exchange Act of 1934," which is filed as an exhibit to this report.
126
ITEM 1B. UNRESOLVED STAFF COMMENTS
None.
ITEM 1C. CYBERSECURITY
Cybersecurity Governance
KKR has a Chief Information Security Officer (the “KKR CISO”), who leads an information security team (the “KKR information security team”) that is responsible for information security at KKR’s asset management business, including its cybersecurity strategy and program, which includes, among other things, annual employee training about cybersecurity risks and new employee onboarding about KKR’s security policies. The KKR information security team’s mandates can be broadly grouped into three categories: (i) operations and engineering, (ii) threat detection and response and (iii) governance.
The KKR information security team members have a variety of relevant skill sets and expertise. For example, prior to joining KKR, KKR’s CISO was the CISO at another large financial institution where he was responsible for their global information security program. KKR’s CISO also has prior experience in various information security roles, including security architecture, application security, engineering and operations. He holds a Bachelor of Science in computer science from the New York University Polytechnic School of Engineering, is a Certified Information Systems Security Professional (CISSP) and holds a Series 99 – Operations Professional Exam certification. In addition, KKR information security team members have various backgrounds in information security, including in financial services and critical infrastructure, and the team maintains various levels of certifications – including CISSP, GIAC security operations certification, certified information security manager, and other certifications focused on specific technologies.
The KKR CISO chairs the technology and information security risk committee for KKR’s asset management business, which consists of employees from the firm’s technology group and other groups, including risk, legal and compliance. The technology and information security risk committee is responsible for overseeing the cybersecurity risk environment for KKR’s asset management business, which includes identifying and monitoring KKR’s technology risks, including those related to information security, business disruption, fraud and privacy related risks, and also promoting cybersecurity awareness at the firm. The technology and information security risk committee reports to KKR’s risk and operations committee, which consists of senior level employees of KKR who focus on KKR’s overall operations and enterprise risk management, including the Chief Operating Officer, Chief Compliance Officer, Chief Legal Officer and Chief Financial Officer. Periodically, including at least annually and more often as circumstances may require, management will present to the Audit Committee and the Risk Committee of our Board of Directors on various topics relating to KKR's technology risks, including KKR’s cybersecurity program (including the results of an annual cybersecurity table top exercise), cybersecurity issues (including those relating to data protection, insider threats, regulatory changes, and geopolitical cyber threat management), and risk management (including the results of periodic technology audits).
KKR also has a Chief Information Security Officer dedicated to our insurance business (the “GA CISO”), who has more than 20 years of experience in various information security and technology roles. The GA CISO leads an information security team that is focused on overseeing the cybersecurity strategy and program for Global Atlantic. The GA CISO reports periodically, including at least annually and more often as circumstances may require, to the risk committee of Global Atlantic’s board of directors (whose members include non-executive directors unaffiliated with KKR) and members of KKR’s risk and operations committee. The GA CISO also provides ad hoc reporting to Global Atlantic’s management-level committees and Global Atlantic’s board of directors and its risk committee. Material information affecting our insurance business is also reported by the GA CISO or his or her designee to KKR’s risk and operations committee, certain members of which would, as appropriate, report such material information to our Board of Directors or its Audit Committee or Risk Committee.
Cybersecurity Risk Management and Strategy
KKR’s asset management business has a cybersecurity incident response plan as a key component of its cybersecurity program, which is generally incorporated as part of our enterprise risk management program. The KKR CISO and KKR’s Chief Compliance Officer co-chair a cybersecurity incident response team (“KKR CIRT”), which aims to manage and mitigate the risk and impact of cybersecurity breach events at KKR’s asset management business, including those arising from third-party service providers, including those providers that have access to KKR’s customer and employee data. Cybersecurity considerations affect the selection and oversight of our third-party service providers. We perform diligence on third parties that have access to our systems, data or facilities.
127
Members of the KKR CIRT include members of the firm’s legal, technology, compliance, risk, public affairs, fundraising and finance groups. KKR has established a notification decision framework to determine when the KKR CIRT will provide notifications regarding certain cybersecurity incidents, with different severity thresholds triggering notifications to different recipient groups, including the risk and operations committee, senior members of management, and our Board of Directors or its committees.
The KKR information security team undertakes a variety of measures to monitor and manage the cybersecurity risks of KKR’s asset management business. For example, the KKR information security team monitors our technology infrastructure with tools designed to detect suspicious behavior. Our technology platforms and applications are designed to enable us to monitor user and network behavior at KKR’s asset management business, identify threats using certain analytics, and mitigate attacks across various layers of the enterprise. The KKR information security team conducts regular internal and external audits with third-party cybersecurity experts to identify and evaluate potential weaknesses in our cybersecurity systems. Some of these third-party monitoring functions continue throughout the year while other third-party security experts are periodically retained to audit specific areas of the cybersecurity program. In addition, the KKR information security team conducts periodic phishing simulations, and they also conduct periodic employee training on KKR’s security policies and controls and provide other security trainings as part of new employee onboarding.
KKR also has a cybersecurity incident response plan that is specific to our insurance business. The plan sets forth the roles and responsibilities of the Global Atlantic incident response team, which is comprised of Global Atlantic employees representing key business functions at our insurance business. Global Atlantic utilizes several mechanisms to monitor and manage the cybersecurity risks of our insurance business, including to prevent, and prepare to respond to, an incident. This includes maintaining relationships with external incident response organizations, performing periodic cybersecurity risk assessments, overseeing and monitoring risks from cybersecurity threats associated with third-party service providers, and ensuring that Global Atlantic employees complete security awareness training relating to cybersecurity best practices. Global Atlantic also has a cybersecurity notification framework in place to determine when appropriate notifications and escalations are required to be provided to the senior members of Global Atlantic’s management, members of Global Atlantic’s board of directors and members of KKR’s risk and operations committee, certain member of which would, as appropriate, report such information to our Board of Directors or its Audit Committee or Risk Committee.
As of the date of this filing, we do not believe that our business strategy, results of operations or financial conditions have been materially affected by any cybersecurity incidents for the reporting period covered by this report. However, institutions like us, as well as our employees, service providers and other third parties, have experienced information security and cybersecurity attacks in the past and will likely continue to be the target of increasingly sophisticated cyber actors. For a discussion of how risks from cybersecurity threats may affect us, see “Part 1. Item 1A. Risk Factors—Risks Related to Our Business—Cyber-security failures and data security breaches may disrupt or have a material adverse impact on our businesses, operations and investments” in this Annual Report on Form 10-K.
ITEM 2. PROPERTIES
Our principal executive office is located at 30 Hudson Yards, New York, New York. We also lease space for our other offices in North America, Europe, Middle East, and Asia-Pacific. We consider these facilities to be suitable and adequate for the management and operations of our business.
ITEM 3. LEGAL PROCEEDINGS.
For a discussion of KKR's legal proceedings, see the section entitled "Litigation" appearing in Note 24 "Commitments and Contingencies" in our financial statements included elsewhere in this report, which is incorporated herein by reference.
ITEM 4. MINE SAFETY DISCLOSURES.
Not applicable.
128
PART II
ITEM 5. MARKET FOR REGISTRANT'S COMMON EQUITY, RELATED STOCKHOLDER MATTERS AND ISSUER PURCHASES OF EQUITY SECURITIES.
Shares of our common stock are listed on the NYSE under the symbol "KKR."
The number of holders of record of our common stock as of February 27, 2024 was 43. This does not include the number of stockholders that hold shares in "street-name" through banks or broker-dealers.
Dividend Policy
Under our current dividend policy for common stock that we announced on February 6, 2024, we expect to pay our common stockholders an annualized dividend of $0.70 per share of common stock, equal to a quarterly dividend of $0.175 per share of common stock, beginning with the dividend to be declared with respect to the first quarter of 2024. On February 6, 2024, we declared a regular dividend of $0.165 per share of common stock under our prior dividend policy for the quarter ended December 31, 2023, payable on March 1, 2024 to common stockholders of record as of the close of business on February 16, 2024.
Because we make our investment in our business through a holding company structure and the applicable holding companies do not own any material cash-generating assets other than their direct and indirect holdings in KKR Group Partnership Units, dividends are expected to be funded in the following manner:
•KKR Group Partnership will make distributions to holders of KKR Group Partnership Units, which consists of our wholly-owned corporate subsidiaries (one of which acts as the general partner of KKR Group Partnership), KKR Holdings II and KKR Holdings III, in proportion to their percentage interests in KKR Group Partnership;
•Second, our wholly-owned corporate subsidiaries will distribute to us the amount of any distributions that they receive from KKR Group Partnership, after deducting any applicable taxes; and
•Third, we will distribute to holders of our common stock the amount of dividends declared by our Board of Directors from the distributions that we receive from our wholly-owned corporate subsidiaries.
The limited partnership agreement of KKR Group Partnership provides for cash distributions, which are referred to as "tax distributions," to the partners of the partnership if we determine that the taxable income of the partnership will give rise to taxable income for its partners, including holders of restricted holdings units who are limited partners of KKR Holdings II and KKR Holdings III. KKR Group Partnership may make tax distributions in the future, from time to time, to provide distributions to pay for any U.S. or non-U.S. tax liabilities of the partners of KKR Holdings II and KKR Holdings III.
The declaration and payment of any dividends to holders of our common stock or holders of any preferred stock which may be issued in the future are subject to the discretion of our Board of Directors, which may change our dividend policy at any time or from time to time, and the terms of our certificate of incorporation. There can be no assurance that dividends will be made as intended or at all or that any particular dividend policy will be maintained. Furthermore, the declaration and payment of distributions and dividends is subject to legal, contractual and regulatory restrictions on the payment of dividends and distributions by us or our subsidiaries, including restrictions contained in our debt agreements, the terms of our preferred stock, and such other factors as the Board of Directors considers relevant including, among others: our available cash and current and anticipated cash needs, including funding of investment commitments and debt service and future debt repayment obligations; general economic and business conditions; our strategic plans and prospects; our results of operations and financial condition; and our capital requirements. See "Management's Discussion and Analysis of Financial Condition and Results of Operations—Liquidity—Sources of Liquidity." In addition, under Section 170 of the DGCL, our Board of Directors may only declare and pay dividends either out of our surplus (as defined in DGCL) or in case there is no such surplus, out of our net profits for the fiscal year in which the dividend is declared and/or the preceding fiscal year.
129
Share Repurchases in the Fourth Quarter of 2023
As of February 6, 2024, there was approximately $194 million remaining for further repurchases under KKR's current share repurchase program.
Under our current repurchase program, KKR is authorized to repurchase its common stock from time to time in open market transactions, in privately negotiated transactions or otherwise. The timing, manner, price and amount of any common stock repurchases will be determined by KKR in its discretion and will depend on a variety of factors, including legal requirements, price and economic and market conditions. KKR expects that the program, which has no expiration date, will continue to be in effect until the maximum approved dollar amount has been used. The program does not require KKR to repurchase any specific number of shares of common stock, and the program may be suspended, extended, modified or discontinued at any time. In addition to the repurchases of common stock described above, the repurchase program is used for the retirement (by cash settlement or the payment of tax withholding amounts upon net settlement) of equity awards issued pursuant to our Equity Incentive Plans representing the right to receive shares of common stock.
The table below sets forth the information with respect to repurchases made by or on behalf of KKR & Co. Inc. or any "affiliated purchaser" (as defined in Rule 10b-18(a)(3) under the Exchange Act) of our common stock for the periods presented. During the fourth quarter of 2023, no shares of common stock were repurchased and 160,718 equity awards were retired.
| Issuer Purchases of Common stock | |||||||||||||||||||||||
| (amounts in thousands, except share and per share amounts) | |||||||||||||||||||||||
| Total Number of Shares Purchased | Average Price Paid Per Share | Total Number of Shares Purchased as Part of Publicly Announced Plans or Programs | Approximate Dollar Value of Shares that May Yet Be Purchased Under the Plans or Programs (1) | ||||||||||||||||||||
Month #1 (October 1, 2023 to October 31, 2023) | — | $ | — | — | $ | 193,999 | |||||||||||||||||
Month #2 (November 1, 2023 to November 30, 2023) | — | $ | — | — | $ | 193,999 | |||||||||||||||||
Month #3 (December 1, 2023 to December 31, 2023) | — | $ | — | — | $ | 193,999 | |||||||||||||||||
Total through December 31, 2023 | — | ||||||||||||||||||||||
(1) On February 7, 2023, KKR announced the increase to the total available amount under the repurchase program to $500 million. The repurchase program does not have an expiration date.
ITEM 6. [Reserved]
130
ITEM 7. MANAGEMENT'S DISCUSSION AND ANALYSIS OF FINANCIAL CONDITION AND RESULTS OF OPERATIONS
The following discussion and analysis should be read in conjunction with the consolidated financial statements of KKR & Co. Inc., together with its consolidated subsidiaries, and the related notes included elsewhere in this report. In addition, this discussion and analysis contains forward-looking statements and involves numerous risks and uncertainties, including those described under "Cautionary Note Regarding Forward-looking Statements" and "Risk Factors." Actual results may differ materially from those contained in any forward-looking statements.
Business Environment
Our asset management and insurance businesses are affected by the various market and economic conditions of the various countries and regions in which we operate. Market and economic conditions are expected to continue to have a substantial impact on our financial condition, results of operations and our business in various ways that we are unable to control, including our ability to make new investments, the valuations of the investments we manage, the amount of investment proceeds we realize when we exit our investments, the timing for such realization activity, our ability to fundraise or to sell our various investment and insurance products and services, and the level of our capital markets activities, as discussed in the "Risk Factors" section of this Report.
In 2023, the United States continued to experience economic growth despite monetary policy tightening by the Federal Reserve Board in response to high inflation. In Europe, the European Union experienced growth in 2023, albeit at a weaker rate as compared to 2022, and the European Central Bank also raised interest rates in response to high inflation. In Asia, its two largest economies experienced different economic conditions. In Japan, its economy grew in 2023 at a higher rate than in prior periods, and Japan’s economy experienced an uptick in inflation. In China, its economy grew in 2023 but at a lower-than-expected rate due to various headwinds, including concerns about the levels of certain government debt and its property sector. The U.S. Federal Reserve Board has signaled that they would likely no longer raise interest rates and would likely ease monetary policy in 2024, assuming inflation were to return close to its 2% target. The European Central Bank stated its intention to keep its key rates at current levels until its inflation would also return to its 2% target. The Bank of Japan stated its intention to continue to maintain low interest rates until its inflation rate increases more meaningfully. The People's Bank of China pledged its support of the Chinese economy with moderate interest rate cuts and increased bank lending. In addition, slowing growth in certain real estate sectors with excess near-term supply has negatively impacted and may continue to negatively impact the valuations of assets in such sectors in the near-term.
Several key economic indicators in the United States and in other countries and regions in which we operate include:
•GDP. In the United States, real gross domestic product (“GDP”) expanded by 2.5% for the year ended December 31, 2023, compared to an expansion of 1.9% for the year ended December 31, 2022. Euro Area real GDP is estimated to have increased by 0.5% for the year ended December 31, 2023, down from 3.4% for the year ended December 31, 2022. In Japan, real GDP is estimated to have increased by 2.0% for the year ended December 31, 2023, up from 1.0% growth for the year ended December 31, 2022. Real GDP in China increased by 5.2% for the year ended December 31, 2023, compared to growth of 3.0% reported for the year ended December 31, 2022.
•Interest Rates. The effective federal funds rate set by the U.S. Federal Reserve Board was 5.33% as of December 31, 2023, up from 4.33% as of December 31, 2022. The short-term benchmark interest rate set by the European Central Bank was 4.5% as of December 31, 2023, up from 2.5% as of December 31, 2022. The short-term benchmark interest rate set by the Bank of Japan was -0.1% as of December 31, 2023, unchanged from December 31, 2022. The short-term benchmark interest rate set by The People's Bank of China was 3.45% as of December 31, 2023, unchanged from 3.45% as of December 31, 2022.
•Inflation. The U.S. core consumer price index rose 3.9% on a year-over-year basis as of December 31, 2023, down from 5.7% on a year-over-year basis as of December 31, 2022. Euro Area core inflation was 3.4% as of December 31, 2023, down from 5.2% as of December 31, 2022. In Japan, core inflation rose to 2.8% on a year-over-year basis as of December 31, 2023, up from 1.6% on a year-over-year basis as of December 31, 2022. Core inflation in China was 0.6% on a year-over-year basis as of December 31, 2023, down from 0.7% as of December 31, 2022.
•Unemployment. The U.S. unemployment rate was 3.7% as of December 31, 2023, up from 3.5% as of December 31, 2022. Euro Area unemployment was 6.4% as of December 31, 2023, down from 6.7% as of December 31, 2022. The unemployment rate in Japan was 2.4% as of December 31, 2023, down from 2.5% as of December 31, 2022. The unemployment rate in China was 5.0% as of December 31, 2023, down from 6.1% as of December 31, 2022.
131
In 2023, the United States equity markets, generally appreciated on a year-over-year basis, with varying volatility throughout the year, and the U.S. 10-year benchmark treasury yield also fluctuated throughout the year to end at a rate lower at year-end than its peak during the year. European and Japanese equity markets generally appreciated, although Japan less significantly than the United States, on a year-over-year basis, and the Chinese equity markets declined on a year-over-year basis.
Several key financial market indicators in the United States and in other countries and regions in which we operate include:
•Equity Markets. For the year ended December 31, 2023, the S&P 500 was up 26.3%, the MSCI Europe Index was up 26.1%, the MSCI Asia Index was up 11.8% and the MSCI World Index was up 24.4% on a total return basis including dividends. Equity market volatility as evidenced by the Chicago Board Options Exchange Market Volatility Index (VIX), a measure of volatility, ended at 12.5 as of December 31, 2023, decreasing from 21.7 as of December 31, 2022, and peaking at 26.5 as of March 13, 2023.
•Credit Markets. During the year ended December 31, 2023, U.S. investment grade corporate bond spreads (BofA Merrill Lynch US Corporate Index) tightened by 34 basis points. The non-investment grade credit indices were up during the year ended December 31, 2023 with the S&P/LSTA Leveraged Loan Index up 13.4% and the BofAML HY Master II Index up 13.4%. During the year ended December 31, 2023, the 10-year government bond yields rose 0.4 basis points in the United States, fell 55 basis points in Germany, rose 19 basis points in Japan, fell 14 basis points in the UK and fell 28 basis points in China.
•Commodity Markets. During the year ended December 31, 2023, the 3-year forward price of WTI crude oil decreased approximately 6.3%, and the 3-year forward price of natural gas decreased from approximately $4.99 per MMBtu to $4.44 per MMBtu as of December 31, 2022 and December 31, 2023. The Japan spot LNG import price decreased to approximately $15.09 per MMBtu as of December 31, 2023 from approximately $28.46 per MMBtu as of December 31, 2022.
•Foreign Exchange Rates. For the year ended December 31, 2023, the euro rose 3.1%, the British pound rose 5.4%, the Japanese yen fell 7.0%, and the Chinese renminbi fell 2.8%, respectively, relative to the U.S. dollar.
Other Trends, Uncertainties and Risks Related to Our Business
Please refer to the "Risk Factors" section of this report for important additional detail regarding risks, uncertainties and other conditions that could have a material favorable or unfavorable impact on our businesses, including the impact of market and economic conditions on valuations of investments. These risks, uncertainties and other conditions should be read in conjunction with this Business Environment section and the entire Risk Factor section. In particular, see "Risks Related to Our Investment Activities—Our valuation methodologies for certain assets can be subjective, and the fair value of assets established pursuant to such subjective methodologies is uncertain and may never be realized” and “Risks Related to Our Investment Activities—Various market and economic conditions and events outside of our control that are difficult to quantify or predict may have a significant impact on the valuation of our investments; which may make them volatile and we may not be able to realize them at such values.”
Basis of Accounting and Key Financial Measures under GAAP
We manage our business using certain financial measures and key operating metrics since we believe these metrics measure the productivity of our operating activities. We prepare our consolidated financial statements in accordance with accounting principles generally accepted in the United States of America (“GAAP”). See Note 2 “ Summary of Significant Accounting Policies” in our financial statements and “Critical Accounting Policies and Estimates” contained in this section below. Our key Segment and non-GAAP financial measures and operating metrics are discussed below.
Adoption of New Accounting Standard
Effective January 1, 2023, we adopted new accounting guidance for insurance and reinsurance companies that issue long-duration contracts (“LDTI”) with retrospective application to February 1, 2021, the date of the 2021 GA Acquisition. For a more detailed discussion of the adoption of the LDTI, see Note 2 "Summary of Significant Accounting Policies" in our financial statements included in this report.
132
Key Segment and Non-GAAP Performance Measures
The following key segment and non-GAAP performance measures are used by management in making operational and resource deployment decisions as well as assessing the performance of KKR's business. They include certain financial measures that are calculated and presented using methodologies other than in accordance with GAAP. These performance measures as described below are presented prior to giving effect to the allocation of income (loss) between KKR & Co. Inc. and holders of exchangeable securities and as such represent the entire KKR business in total. In addition, these performance measures are presented without giving effect to the consolidation of certain investment funds and collateralized financing entities ("CFEs") that KKR manages.
We believe that providing these segment and non-GAAP performance measures on a supplemental basis to our GAAP results is helpful to stockholders in assessing the overall performance of KKR's business. These non-GAAP measures should not be considered as a substitute for financial measures calculated in accordance with GAAP. Reconciliations of these non-GAAP measures to the most directly comparable financial measures calculated and presented in accordance with GAAP, where applicable are included under "—Analysis of Non-GAAP Balance Sheet Measures—Reconciliations to GAAP Measures."
Modification of Segment Information and Non-GAAP Measures
In connection with the adoption of LDTI (see Note 2 in our financial statements), KKR reevaluated the manner in which it makes operational and resource deployment decisions and assesses the overall performance of KKR's business. Effective with the three months ended March 31, 2023, the items detailed below have changed with respect to the preparation of the reports used by KKR's chief operating decision makers. As a result, KKR has modified the presentation of its segment financial information with retrospective application to all prior periods presented. The most significant changes between KKR's current segment presentation and our previous segment presentation are as follows:
(1)implementation of the accounting changes as a result of LDTI within KKR’s Insurance Segment. KKR excludes (i) changes in the fair value of market risk benefits and other policy liabilities and the associated derivatives, (ii) fees attributed to guaranteed benefits, and (iii) losses at contract issue on payout annuities from the Insurance Segment Operating Earnings. These items are excluded from Insurance Segment Operating Earnings and we believe these items do not reflect the underlying performance of this business;
(2)Global Atlantic book value includes the impact of LDTI except for the impacts recorded in other comprehensive income, which are excluded from book value; and
(3)reporting on a pre-tax basis Insurance Segment Operating Earnings (which was previously reported on an after-tax basis).
We believe these adjustments and changes reflect how management evaluates the Insurance business. We believe this approach enhances the transparency and visibility of the drivers of Global Atlantic’s underlying operating performance.
Fee Related Earnings, Asset Management Segment Operating Earnings, and Total Asset Management Segment Revenues are not impacted by LDTI or the adjustments and changes noted above. Therefore, these Non-GAAP measures have not been recast for the historical periods.
As discussed in Note 2 "Summary of Significant Accounting Policies" in our financial statements, our historical consolidated GAAP financial results have been recast to reflect the adoption of LDTI on a full retrospective basis. Certain of our historical Non-GAAP measures have been recast to reflect the adoption of LDTI along with the adjustments and changes noted above.
133
After-tax Distributable Earnings
After-tax distributable earnings is a non-GAAP performance measure of KKR’s earnings, which is derived from KKR’s reported segment results. After-tax distributable earnings is used to assess the performance of KKR’s business operations and measures the earnings potentially available for distribution to its equity holders or reinvestment into its business. After-tax distributable earnings is equal to Distributable Operating Earnings less Interest Expense, Net Income Attributable to Noncontrolling Interests and Income Taxes on Operating Earnings. Series C Mandatory Convertible Preferred Stock dividends have been excluded from After-tax Distributable Earnings (for the periods when this preferred stock was still outstanding), because the definition of Adjusted Shares used to calculate After-tax Distributable Earnings per Adjusted Share assumes that all shares of Series C Mandatory Convertible Preferred Stock have been converted to shares of common stock of KKR & Co. Inc. Income Taxes on Operating Earnings represents the (i) amount of income taxes that would be paid assuming that all pre-tax Asset Management distributable earnings were allocated to KKR & Co. Inc. and taxed at the same effective rate, which assumes that all securities exchangeable into shares of common stock of KKR & Co. Inc. were exchanged and (ii) the amount of income taxes on Insurance Segment Operating Earnings. Income taxes on Insurance Segment Operating Earnings represent the total current and deferred tax expense or benefit on income before taxes adjusted to eliminate the impact of the tax expense or benefit associated with the non-operating adjustments. Income Taxes on Operating Earnings includes the benefit of tax deductions arising from equity-based compensation, which reduces operating income taxes during the period. Equity based compensation expense is excluded from After-tax Distributable Earnings, because (i) KKR believes that the cost of equity awards granted to employees does not contribute to the earnings potentially available for distributions to its equity holders or reinvestment into its business and (ii) excluding this expense makes KKR’s reporting metric more comparable to the corresponding metric presented by other publicly traded companies in KKR’s industry, which KKR believes enhances an investor’s ability to compare KKR’s performance to these other companies. If tax deductions from equity-based compensation were to be excluded from Income Taxes on Operating Earnings, KKR’s After-tax Distributable Earnings would be lower and KKR’s effective tax rate would appear to be higher, even though a lower amount of income taxes would have actually been paid or payable during the period. KKR separately discloses the amount of tax deduction from equity-based compensation for the period reported and the effect of its inclusion in After-tax Distributable Earnings for the period. KKR makes these adjustments when calculating After-tax Distributable Earnings in order to more accurately reflect the net realized earnings that are expected to be or become available for distribution to KKR’s equity holders or reinvestment into KKR’s business. However, After-tax Distributable Earnings does not represent and is not used to calculate actual dividends under KKR’s dividend policy, which is a fixed amount per period, and After-tax Distributable Earnings should not be viewed as a measure of KKR’s liquidity.
Book Value
Book Value is a non-GAAP performance measure of the net assets of KKR and is used by management primarily in assessing the unrealized value of KKR’s net assets presented on a basis that (i) excludes the net assets that are allocated to investors in KKR’s investment funds and other noncontrolling interest holders, (ii) includes the net assets that are attributable to certain securities exchangeable into shares of common stock of KKR & Co. Inc., and (iii) includes KKR’s ownership of the net assets of Global Atlantic. We believe this measure is useful to stockholders as it provides additional insight into the net assets of KKR excluding those net assets that are allocated to investors in KKR’s investment funds and other noncontrolling interest holders. KKR's book value includes the net impact of KKR's tax assets and liabilities as calculated under GAAP. Series C Mandatory Convertible Preferred Stock had been included in book value, because the definition of adjusted shares used to calculate book value per adjusted share assumes that all shares of Series C Mandatory Convertible Preferred Stock had, prior to its redemption, been converted to shares of common stock of KKR & Co. Inc. To calculate Global Atlantic book value and to make it more comparable with the corresponding metric presented by other publicly traded companies in Global Atlantic’s industry, Global Atlantic book value excludes (i) accumulated other comprehensive income and (ii) accumulated change in fair value of reinsurance balances and related assets, net of income tax.
134
Distributable Operating Earnings
Distributable operating earnings is a non-GAAP performance measure that KKR believes is useful to stockholders as it provides a supplemental measure of our operating performance without taking into account items that KKR does not believe arise from or relate directly to KKR's operations. Distributable Operating Earnings excludes: (i) equity-based compensation charges, (ii) amortization of acquired intangibles, (iii) strategic corporate-related charges and (iv) non-recurring items, if any. Strategic corporate-related charges arise from corporate actions and consist primarily of (i) impairments, (ii) transaction costs from strategic acquisitions, and (iii) depreciation on real estate that KKR owns and occupies. Inter-segment transactions are not eliminated from segment results when management considers those transactions in assessing the results of the respective segments. These transactions include (i) management fees earned by KKR as the investment adviser for Global Atlantic insurance companies and (ii) interest income and expense based on lending arrangements where one or more KKR subsidiaries borrow from a Global Atlantic insurance subsidiary. Inter-segment transactions are recorded by each segment based on the definitive documents that contain arms' length terms and comply with applicable regulatory requirements. Distributable Operating Earnings represents operating earnings of KKR’s Asset Management and Insurance segments.
Asset Management Segment Operating Earnings is the segment profitability measure used to make operating decisions and to assess the performance of the asset management segment and is comprised of: (i) Fee Related Earnings, (ii) Realized Performance Income, (iii) Realized Performance Income Compensation, (iv) Realized Investment Income, and (v) Realized Investment Income Compensation. Asset Management Segment Operating Earnings excludes the impact of: (i) unrealized gains (losses) on investments, (ii) unrealized carried interest, and (iii) related unrealized carried interest compensation. Management fees earned by KKR as the adviser, manager or sponsor for its investment funds, vehicles and accounts, including its Global Atlantic insurance companies, are included in Asset Management Segment Operating Earnings.
Insurance Segment Operating Earnings is the segment profitability measure used to make operating decisions and to assess the performance of the Insurance segment. This measure is presented before income taxes and is comprised of: (i) Net Investment Income, (ii) Net Cost of Insurance, (iii) General, Administrative, and Other Expenses, and (iv) Net Income Attributable to Noncontrolling Interests. The non-operating adjustments made to derive Insurance Segment Operating Earnings excludes the impact of: (i) investment gains (losses) which include realized gains (losses) related to asset/liability matching investments strategies and unrealized investment gains (losses) and (ii) non-operating changes in policy liabilities and derivatives which includes (a) changes in the fair value of market risk benefits and other policy liabilities measured at fair value and related benefit payments, (b) fees attributed to guaranteed benefits, (c) derivatives used to manage the risks associated with policy liabilities, and (d) losses at contract issuance on payout annuities. Insurance Segment Operating Earnings includes (i) realized gains and losses not related to asset/liability matching investments strategies and (ii) the investment management costs that are earned by KKR as the investment adviser of the Global Atlantic insurance companies.
Fee Related Earnings
Fee related earnings is a performance measure used to assess the asset management segment’s generation of profits from revenues that are measured and received on a recurring basis and are not dependent on future realization events. KKR believes this measure is useful to stockholders as it provides additional insight into the profitability of KKR’s fee generating asset management and capital markets businesses and other recurring revenue streams. FRE equals (i) Management Fees, including fees paid by the Insurance segment to the asset management segment and fees paid by certain insurance co-investment vehicles, (ii) Transaction and Monitoring Fees, Net and (iii) Fee Related Performance Revenues, less (x) Fee Related Compensation, and (y) Other Operating Expenses.
Fee Related Performance Revenues refers to the realized portion of Incentive Fees from certain AUM that has an indefinite term and for which there is no immediate requirement to return invested capital to investors upon the realization of investments. Fee related performance revenues consists of performance fees (i) to be received from our investment funds, vehicles and accounts on a recurring basis, and (ii) that are not dependent on a realization event involving investments held by the investment fund, vehicle or account.
Fee Related Compensation refers to the compensation expense, excluding equity-based compensation, paid from (i) Management Fees, (ii) Transaction and Monitoring Fees, Net, and (iii) Fee Related Performance Revenues.
Other Operating Expenses represents the sum of (i) occupancy and related charges and (ii) other operating expenses.
135
Total Asset Management Segment Revenues
Total Asset Management Segment Revenues is a performance measure that represents the realized revenues of the asset management segment (which excludes unrealized carried interest and unrealized net gains (losses) on investments) and is the sum of (i) Management Fees, (ii) Transaction and Monitoring Fees, Net, (iii) Fee Related Performance Revenues, (iv) Realized Performance Income, and (v) Realized Investment Income. KKR believes that this performance measure is useful to stockholders as it provides additional insight into the realized revenues generated by KKR's asset management segment.
Other Terms and Capital Metrics
Adjusted Shares
Adjusted shares represents shares of common stock of KKR & Co. Inc. outstanding under GAAP adjusted to include (i) for any reporting period prior to the redemption of the Series C Mandatory Convertible Preferred Stock in September 2023, the number of shares of common stock of KKR & Co. Inc. assumed to be issuable upon conversion of the Series C Mandatory Convertible Preferred Stock and (ii) certain securities exchangeable into shares of common stock of KKR & Co. Inc. Weighted average adjusted shares is used in the calculation of After-tax Distributable Earnings per Adjusted Share, and Adjusted Shares is used in the calculation of Book Value per Adjusted Share.
Assets Under Management
Assets under management represent the assets managed, advised or sponsored by KKR from which KKR is entitled to receive management fees or performance income (currently or upon a future event), general partner capital, and assets managed, advised or sponsored by our strategic BDC partnership and the hedge fund and other managers in which KKR holds an ownership interest. We believe this measure is useful to stockholders as it provides additional insight into the capital raising activities of KKR and its hedge fund and other managers and the overall activity in their investment funds and other managed or sponsored capital. KKR calculates the amount of AUM as of any date as the sum of: (i) the fair value of the investments of KKR's investment funds and certain co-investment vehicles; (ii) uncalled capital commitments from these funds, including uncalled capital commitments from which KKR is currently not earning management fees or performance income; (iii) the asset value of the Global Atlantic insurance companies; (iv) the par value of outstanding CLOs; (v) KKR's pro rata portion of the AUM of hedge fund and other managers in which KKR holds an ownership interest; (vi) all of the AUM of KKR's strategic BDC partnership; (vii) the acquisition cost of invested assets of certain non-US real estate investment trusts and (viii) the value of other assets managed or sponsored by KKR. The pro rata portion of the AUM of hedge fund and other managers is calculated based on KKR’s percentage ownership interest in such entities multiplied by such entity’s respective AUM. KKR's definition of AUM (i) is not based on any definition of AUM that may be set forth in the governing documents of the investment funds, vehicles, accounts or other entities whose capital is included in this definition, (ii) includes assets for which KKR does not act as an investment adviser, and (iii) is not calculated pursuant to any regulatory definitions.
Capital Invested
Capital invested is the aggregate amount of capital invested by (i) KKR’s investment funds and Global Atlantic insurance companies, (ii) KKR's Principal Activities business line as a co-investment, if any, alongside KKR’s investment funds, and (iii) KKR's Principal Activities business line in connection with a syndication transaction conducted by KKR's Capital Markets business line, if any. Capital invested is used as a measure of investment activity at KKR during a given period. We believe this measure is useful to stockholders as it provides a measure of capital deployment across KKR’s business lines. Capital invested includes investments made using investment financing arrangements like credit facilities, as applicable. Capital invested excludes (i) investments in certain leveraged credit strategies, (ii) capital invested by KKR’s Principal Activities business line that is not a co-investment alongside KKR’s investment funds, and (iii) capital invested by KKR’s Principal Activities business line that is not invested in connection with a syndication transaction by KKR’s Capital Markets business line. Capital syndicated by KKR's Capital Markets business line to third parties other than KKR’s investment funds or Principal Activities business line is not included in capital invested.
136
Fee Paying AUM
Fee paying AUM represents only the AUM from which KKR is entitled to receive management fees. We believe this measure is useful to stockholders as it provides additional insight into the capital base upon which KKR earns management fees. FPAUM is the sum of all of the individual fee bases that are used to calculate KKR's and its hedge fund and BDC partnership management fees and differs from AUM in the following respects: (i) assets and commitments from which KKR is not entitled to receive a management fee are excluded (e.g., assets and commitments with respect to which it is entitled to receive only performance income or is otherwise not currently entitled to receive a management fee) and (ii) certain assets, primarily in its private equity funds, are reflected based on capital commitments and invested capital as opposed to fair value because fees are not impacted by changes in the fair value of underlying investments.
Uncalled Commitments
Uncalled commitments is the aggregate amount of unfunded capital commitments that KKR’s investment funds and carry-paying co-investment vehicles have received from partners to contribute capital to fund future investments, and the amount of uncalled commitments is not reduced by capital invested using borrowings under an investment fund’s subscription facility until capital is called from our fund investors. We believe this measure is useful to stockholders as it provides additional insight into the amount of capital that is available to KKR’s investment funds and carry paying co-investment vehicles to make future investments. Uncalled commitments are not reduced for investments completed using fund-level investment financing arrangements or investments we have committed to make but remain unfunded at the reporting date.
137
Consolidated Results of Operations (GAAP Basis)
The following is a discussion of our consolidated results of operations on a GAAP basis for the years ended December 31, 2023 and 2022. You should read this discussion in conjunction with the financial statements and related notes included elsewhere in this report. See also "Risk Factors" and "—Business Environment" for more information about factors that may affect our business, financial performance, operating results and valuations.
Effective January 1, 2023, we adopted new accounting guidance for insurance and reinsurance companies that issue long-duration contracts (“LDTI”) with retrospective application to February 1, 2021, the date of the 2021 GA Acquisition. For a more detailed discussion of the adoption of LDTI, see Note 2 "Summary of Significant Accounting Policies" in our financial statements.
| Years Ended | |||||||||||||||||
| December 31, 2023 | December 31, 2022 | Change | |||||||||||||||
| ($ in thousands) | |||||||||||||||||
| Revenues | |||||||||||||||||
| Asset Management | |||||||||||||||||
| Fees and Other | $ | 2,963,869 | $ | 2,821,627 | $ | 142,242 | |||||||||||
| Capital Allocation-Based Income (Loss) | 2,843,437 | (2,500,509) | 5,343,946 | ||||||||||||||
| 5,807,306 | 321,118 | 5,486,188 | |||||||||||||||
| Insurance | |||||||||||||||||
| Net Premiums | 1,975,675 | 1,182,461 | 793,214 | ||||||||||||||
| Policy Fees | 1,260,249 | 1,261,721 | (1,472) | ||||||||||||||
| Net Investment Income | 5,514,902 | 4,118,246 | 1,396,656 | ||||||||||||||
| Net Investment-Related Gains (Losses) | (235,262) | (1,318,490) | 1,083,228 | ||||||||||||||
| Other Income | 176,442 | 139,124 | 37,318 | ||||||||||||||
| 8,692,006 | 5,383,062 | 3,308,944 | |||||||||||||||
| Total Revenues | 14,499,312 | 5,704,180 | 8,795,132 | ||||||||||||||
| Expenses | |||||||||||||||||
| Asset Management | |||||||||||||||||
| Compensation and Benefits | 3,012,687 | 1,144,666 | 1,868,021 | ||||||||||||||
| Occupancy and Related Charges | 93,391 | 77,271 | 16,120 | ||||||||||||||
| General, Administrative and Other | 1,056,899 | 993,548 | 63,351 | ||||||||||||||
| 4,162,977 | 2,215,485 | 1,947,492 | |||||||||||||||
| Insurance | |||||||||||||||||
Net Policy Benefits and Claims (including market risk benefit loss (gain) of $224,380 and $(673,399), respectively; remeasurement (gain) loss on policy liabilities: $15,497 and $(57,128), respectively.) | 6,362,257 | 2,358,238 | 4,004,019 | ||||||||||||||
| Amortization of Policy Acquisition Costs | 87,275 | 55,349 | 31,926 | ||||||||||||||
| Interest Expense | 173,883 | 87,182 | 86,701 | ||||||||||||||
| Insurance Expenses | 825,998 | 562,585 | 263,413 | ||||||||||||||
| General, Administrative and Other | 746,215 | 718,977 | 27,238 | ||||||||||||||
| 8,195,628 | 3,782,331 | 4,413,297 | |||||||||||||||
| Total Expenses | 12,358,605 | 5,997,816 | 6,360,789 | ||||||||||||||
| Investment Income (Loss) - Asset Management | |||||||||||||||||
| Net Gains (Losses) from Investment Activities | 3,025,383 | (1,665,537) | 4,690,920 | ||||||||||||||
| Dividend Income | 791,160 | 1,322,447 | (531,287) | ||||||||||||||
| Interest Income | 3,369,447 | 1,895,282 | 1,474,165 | ||||||||||||||
| Interest Expense | (2,772,088) | (1,550,777) | (1,221,311) | ||||||||||||||
| Total Investment Income (Loss) | 4,413,902 | 1,415 | 4,412,487 | ||||||||||||||
| Income (Loss) Before Taxes | 6,554,609 | (292,221) | 6,846,830 | ||||||||||||||
| Income Tax Expense (Benefit) | 1,197,523 | 125,393 | 1,072,130 | ||||||||||||||
138
| Years Ended | |||||||||||||||||
| December 31, 2023 | December 31, 2022 | Change | |||||||||||||||
| ($ in thousands) | |||||||||||||||||
| Net Income (Loss) | 5,357,086 | (417,614) | 5,774,700 | ||||||||||||||
| Net Income (Loss) Attributable to Redeemable Noncontrolling Interests | (5,405) | 2,792 | (8,197) | ||||||||||||||
| Net Income (Loss) Attributable to Noncontrolling Interests | 1,630,230 | 101,258 | 1,528,972 | ||||||||||||||
| Net Income (Loss) Attributable to KKR & Co. Inc. | 3,732,261 | (521,664) | 4,253,925 | ||||||||||||||
| Series C Mandatory Convertible Preferred Stock Dividends | 51,747 | 69,000 | (17,253) | ||||||||||||||
| Net Income (Loss) Attributable to KKR & Co. Inc. Common Stockholders | $ | 3,680,514 | $ | (590,664) | $ | 4,271,178 | |||||||||||
Consolidated Results of Operations (GAAP Basis) - Asset Management
Revenues
For the years ended December 31, 2023 and 2022, revenues consisted of the following:
| Years Ended | ||||||||||||||||||||
| December 31, 2023 | December 31, 2022 | Change | ||||||||||||||||||
| ($ in thousands) | ||||||||||||||||||||
| Management Fees | $ | 1,843,144 | $ | 1,682,466 | $ | 160,678 | ||||||||||||||
| Fee Credits | (297,936) | (532,355) | 234,419 | |||||||||||||||||
| Transaction Fees | 1,075,204 | 1,316,637 | (241,433) | |||||||||||||||||
| Monitoring Fees | 138,339 | 131,750 | 6,589 | |||||||||||||||||
| Incentive Fees | 29,117 | 33,537 | (4,420) | |||||||||||||||||
| Expense Reimbursements | 75,687 | 102,927 | (27,240) | |||||||||||||||||
| Consulting Fees | 100,314 | 86,665 | 13,649 | |||||||||||||||||
| Total Fees and Other | 2,963,869 | 2,821,627 | 142,242 | |||||||||||||||||
| Carried Interest | 2,304,623 | (2,068,662) | 4,373,285 | |||||||||||||||||
| General Partner Capital Interest | 538,814 | (431,847) | 970,661 | |||||||||||||||||
| Total Capital Allocation-Based Income (Loss) | 2,843,437 | (2,500,509) | 5,343,946 | |||||||||||||||||
| Total Revenues - Asset Management | $ | 5,807,306 | $ | 321,118 | $ | 5,486,188 | ||||||||||||||
Fees and Other
Total Fees and Other for the year ended December 31, 2023 increased compared to the year ended December 31, 2022 primarily as a result of an increase in management fees and a decrease in fee credits, which were partially offset by a lower level of transaction fees.
For a more detailed discussion of the factors that affected our transaction fees during the period, see "—Analysis of Asset Management Segment Operating Results."
The increase in management fees was primarily attributable to management fees earned on new capital raised over the past twelve months at Asia Pacific Infrastructure Investors II, Global Impact Fund II, Ascendant Fund, and Next Generation Technology Growth Fund III. The increase was partially offset by (i) a lower level of management fees from Americas Fund XII due to a step-down in the management fee rate in 2023 and a decrease in invested capital, (ii) management fees earned on new capital raised for North America Fund XIII in the first quarter of 2022 that was retroactive to the start of the fund's investment period, and (iii) a lower level of management fees from Asian Fund III due to a decrease in its fee base, invested capital, from the sale of investments. There were no management fees that were retroactive to the start of the fund's investment period for the year ended December 31, 2023 for North America Fund XIII.
139
Management fees due from consolidated investment funds and other vehicles are eliminated upon consolidation under GAAP. However, because these amounts are funded by, and earned from, noncontrolling interests, upon consolidation under GAAP, KKR's allocated share of the net income from the consolidated investment funds and other vehicles is increased by the amount of fees that are eliminated. Accordingly, net income (loss) attributable to KKR would be unchanged if such investment funds and other vehicles were not consolidated. For a more detailed discussion on the factors that affect our management fees during the period, see "—Analysis of Asset Management Segment Operating Results."
Fee credits decreased compared to the prior period primarily as a result of a lower level of transaction fees in our Private Equity, Real Assets and Credit and Liquid Strategies business lines in the current period. Fee credits owed to consolidated investment funds and other vehicles are eliminated upon consolidation under GAAP. However, because these amounts are owed to noncontrolling interests, upon consolidation under GAAP, KKR's allocated share of the net income from the consolidated investment funds is decreased by the amount of fee credits that are eliminated. Accordingly, net income (loss) attributable to KKR would be unchanged if such investment funds and other vehicles were not consolidated. Transaction and monitoring fees earned from KKR portfolio companies are not eliminated upon consolidation because those fees are earned from companies which are not consolidated. Furthermore, transaction fees earned in our capital markets business are not shared with fund investors. Accordingly, certain transaction fees are reflected in our revenues without a corresponding fee credit.
Capital Allocation-Based Income (Loss)
Capital Allocation-Based Income (Loss) for the year ended December 31, 2023 was positive primarily due to the net appreciation of the underlying investments in many of our unconsolidated carry-earning investment funds, most notably Americas Fund XII, Asian Fund III, and Global Infrastructure Investors III. Capital Allocation-Based Income (Loss) for the year ended December 31, 2022 was negative primarily due to the net depreciation of the underlying investments in many of our carry-earning investment funds, most notably Americas Fund XII, Asian Fund II, and Asian Fund III.
KKR generally calculates the carried interest that would be due to KKR for each investment fund, pursuant to the fund agreements, as if the fair value of the underlying investments were realized as of the reporting date, irrespective of whether such amounts have been realized. Since the fair value of the underlying investments varies between reporting periods, it is necessary to make adjustments to the amounts recorded as carried interest to reflect either (a) positive performance, resulting in an increase in the carried interest allocated to the general partner or (b) negative performance that would cause the amount due to KKR to be less than the amount previously recognized, resulting in a negative adjustment to carried interest allocated to the general partner. In each case, it is necessary to calculate the carried interest on cumulative results compared to the carried interest recorded to date and to make the required positive or negative adjustments.
Investment Income (Loss) - Asset Management
Net Gains (Losses) from Investment Activities for the year ended December 31, 2023
The net gains from investment activities for the year ended December 31, 2023 were comprised of net realized losses of $(776.5) million and net unrealized gains of $3,801.9 million.
Investment gains and losses relating to our general partner capital interest in our unconsolidated funds are not reflected in our discussion and analysis of Net Gains (Losses) from Investment Activities. Our economics associated with these gains and losses are reflected in Capital Allocation-Based Income (Loss) as described above.
Realized Gains and Losses from Investment Activities
For the year ended December 31, 2023, net realized losses related primarily to (i) a realized loss on our investment in GenesisCare Pty Ltd. (healthcare sector), (ii) realized losses from the distribution of certain assets to third-party investors in certain of our consolidated energy funds, predominantly allocated to noncontrolling interests based on their ownership in our investment funds, (iii) a realized loss on our investment in Envision Healthcare Corporation (healthcare sector), and (iv) realized losses on alternative credit investments, Hilding Anders International AB (consumer products sector) and Chembulk Group (transportation sector), predominantly allocated to noncontrolling interests based on their ownership in our investment funds. Partially offsetting these realized losses were realized gains primarily relating to (i) realizations on certain foreign exchange forward contracts, and (ii) the sale of our investment in KnowBe4, Inc. (NASDAQ: KNBE) and Flutter Entertainment PLC (LON: FLTR).
140
Unrealized Gains and Losses from Investment Activities
For the year ended December 31, 2023, net unrealized gains were driven primarily by (i) mark-to-market gains primarily relating to BridgeBio Pharma, Inc. (NASDAQ: BBIO), Exact Holding B.V. (technology sector), and USI, Inc. (financial services sector), (ii) the reversal of previously recognized unrealized losses relating to the realization activity described above, and (iii) certain investments held in our consolidated CLOs. These unrealized gains were partially offset by mark-to-market losses primarily relating to (i) PetVet Care Centers, LLC (healthcare sector), (ii) certain foreign exchange forward contracts, and (iii) debt obligations of our consolidated CLOs.
The factors that affect each investment strategy vary depending on the nature of the asset class and the valuation methodology employed. For the year ended December 31, 2023 net unrealized gains were primarily generated in the following asset classes:
•Traditional private equity and core private equity, which were primarily impacted by (i) the positive returns of global equity markets and the related increase of market multiples used in the market comparables methodology for the valuation of Level III investments, and (ii) overall positive operating performance of its portfolio companies;
•Credit, which were primarily impacted by positive performance of our CLOs and by the tightening of the credit spreads during the year; and
•Infrastructure, which primarily benefited from the positive operating performance of certain infrastructure assets and to a lesser extent by the positive returns of global equity markets and the related increase of market multiples used in the market comparables methodology for the valuation of Level III investments.
Partially offsetting the gains in the asset classes above, there were unrealized losses generated in the real estate investments, which, notwithstanding the positive operating performance at certain properties, were negatively impacted by capitalization rates widening further in 2023. See "Risk Factors" and "—Business Environment" for more information about the factors that may impact our business, financial performance, operating results and valuation.
Net Gains (Losses) from Investment Activities for the year ended December 31, 2022
The net losses from investment activities for the year ended December 31, 2022 were comprised of net realized gains of $1,298.5 million and net unrealized losses of $(2,964.0) million.
Realized Gains and Losses from Investment Activities
For the year ended December 31, 2022, net realized gains related primarily to (i) the sale of our investment in Fiserv, Inc. (NASDAQ: FISV), (ii) realizations on certain foreign exchange forward contracts, and (iii) the sale of real estate investments held in certain consolidated opportunistic real estate equity funds. Partially offsetting these realized gains were realized losses primarily relating to (i) various investments held in our consolidated alternative credit funds, (ii) a realized loss on Magneti Marelli CK Holdings (industrials sector) held in certain consolidated funds and (iii) realized losses from the sales of revolving credit facilities.
Unrealized Gains and Losses from Investment Activities
For the year ended December 31, 2022, net unrealized losses were driven primarily by mark-to-market losses from (i) certain debt investments held in our consolidated CLOs and consolidated alternative credit funds, (ii) OutSystems Holdings S.A. (technology sector) held in certain consolidated funds and (iii) the reversal of previously recognized unrealized gains relating to the realization activity described above. These unrealized losses were partially offset by mark-to-market gains related to (i) energy investments held in certain consolidated energy funds, (ii) USI, Inc., and (iii) ERM Worldwide Group Limited (services sector).
For a discussion of other factors that affected KKR's realized investment income, see "—Analysis of Asset Management Segment Operating Results." For additional information about net gains (losses) from investment activities, see Note 4 "Net Gains (Losses) from Investment Activities - Asset Management" in our financial statements.
141
Dividend Income
During the year ended December 31, 2023, dividend income was primarily from (i) our open-ended core infrastructure fund, Diversified Core Infrastructure Fund, (ii) our consolidated opportunistic real estate equity funds, and (iii) Cegid Group S.A. (technology sector) and Atlantic Aviation FBO Inc. (infrastructure: transportation sector), both held in our consolidated core vehicles. During the year ended December 31, 2022, dividend income was primarily from (i) our consolidated core plus and opportunistic real estate equity funds and (ii) our investment in Exact Group B.V. held in our consolidated core vehicles.
Significant dividends from portfolio companies and consolidated funds are generally not recurring quarterly dividends, and while they may occur in the future, their size and frequency are variable. For a discussion of other factors that affected KKR's dividend income, see "—Analysis of Asset Management Segment Operating Results."
Interest Income
The increase in interest income during the year ended December 31, 2023 compared to the year ended December 31, 2022 was primarily due to (i) the impact of closing CLOs that are consolidated subsequent to December 31, 2022, (ii) higher interest rates on floating rate investments held in consolidated CLOs and our consolidated private credit funds, and (iii) a higher level of interest income from certain of our consolidated private credit funds, related to an increase in the amount of capital deployed. For a discussion of other factors that affected KKR's interest income, see "—Analysis of Asset Management Segment Operating Results."
Interest Expense
The increase in interest expense during the year ended December 31, 2023 compared to the year ended December 31, 2022 was primarily due to (i) the increase in the amount of borrowings outstanding from certain consolidated funds and other vehicles, (ii) the impact of closing CLOs that are consolidated subsequent to December 31, 2022, (iii) higher interest rates on floating rate debt obligations held in consolidated CLOs, and (iv) the impact of issuances of KKR senior notes after December 31, 2022. For a discussion of other factors that affected KKR's interest expense, see "—Analysis of Non-GAAP Performance Measures."
Expenses - Asset Management
Compensation and Benefits
The increase in compensation and benefits during the year ended December 31, 2023 compared to the year ended December 31, 2022 was primarily due to accrued carried interest compensation in the current period compared to the reversal of previously recognized carried interest compensation in the prior period. Partially offsetting the increase is a lower level of accrued discretionary cash compensation resulting from a lower level of asset management segment revenues in the current period.
The number of equity-based compensation awards granted in 2023 is higher than in 2022 which is expected to result in a higher equity-based compensation expense in future periods. Additional equity grants made in 2024 or forfeitures of existing equity grants during 2024 would increase and decrease the amount of equity-based compensation expense to be recorded in the future, respectively.
General, Administrative and Other
The increase in general, administrative and other during the year ended December 31, 2023 compared to the year ended December 31, 2022 was primarily due to (i) a higher level of expenses from our consolidated investment funds and CLOs due to the impact of consolidating certain new funds and CLOs subsequent to December 31, 2022 and (ii) a higher level of information technology and other administrative costs in connection with the overall growth of the firm. The increase was partially offset by (i) a lower level of expenses reimbursable by our unconsolidated investment funds and (ii) a lower level of corporate travel costs and placement fees.
In periods of increased fundraising and to the extent that we use third parties to assist in our capital raising efforts, our General, Administrative and Other are expected to increase accordingly.
142
Consolidated Results of Operations (GAAP Basis) - Insurance
Assumption review
The assumptions on which reserves, deferred revenue and expenses are based are intended to represent an estimation of the benefits that are expected to be payable to, and fees or premiums that are expected to be collectible from, policyholders in future periods. Global Atlantic reviews the adequacy of its reserves, deferred revenue and expenses and the assumptions underlying those items at least annually, usually in the third quarter. As Global Atlantic analyzes its assumptions, to the extent Global Atlantic chooses to update one or more of those assumptions, there may be an “unlocking” impact. Generally, favorable unlocking means the change in assumptions required a reduction in reserves, or in deferred revenue liabilities, and unfavorable unlocking means the change in assumptions required an increase in reserves or in deferred revenue liabilities, or a reduction in deferred expenses.
The following table reflects the impact on net income before taxes and to insurance segment adjusted operating earnings from Global Atlantic’s assumption review:
| Years Ended | ||||||||||||||||||||
| December 31, 2023 | December 31, 2022 | Change | ||||||||||||||||||
| ($ in thousands) | ||||||||||||||||||||
| Total assumption review impact on income before taxes (GAAP basis) | $ | (15,497) | $ | 57,128 | $ | (72,625) | ||||||||||||||
| Assumption review impact on adjustments to derive insurance segment adjusted operating earnings | 15,826 | (89,961) | 105,787 | |||||||||||||||||
| Noncontrolling interests' share of assumption review impact | (121) | 12,043 | (12,164) | |||||||||||||||||
| Total assumption review impact on insurance segment adjusted operating earnings | $ | 208 | $ | (20,790) | $ | 20,998 | ||||||||||||||
For the year ended December 31, 2023, the net unfavorable impact on income before taxes was primarily due to (i) an increase in option cost assumptions for indexed products (net of the impact of reducing caps), (ii) an increase in mortality assumptions related to certain annuity products, and (iii) a decrease in expected surrenders on income annuities and life insurance products. These unfavorable impacts were partially offset by a favorable impact of lower expected surrenders on accumulation annuities. For the year ended December 31, 2022, the net favorable impact to income before taxes was primarily due to lower utilization of fixed-indexed annuity income benefits and higher variable annuity fees, offset by lower life and annuity surrender rates. The assumption review impact on adjustments to derive insurance segment adjusted operating earnings reflects the net impact of market risk benefits and other policy liabilities measured at fair value.
Revenues
For the years ended December 31, 2023 and 2022, revenues consisted of the following:
| Years Ended | ||||||||||||||||||||
| December 31, 2023 | December 31, 2022 | Change | ||||||||||||||||||
| ($ in thousands) | ||||||||||||||||||||
| Net Premiums | $ | 1,975,675 | $ | 1,182,461 | $ | 793,214 | ||||||||||||||
| Policy Fees | 1,260,249 | 1,261,721 | (1,472) | |||||||||||||||||
| Net Investment Income | 5,514,902 | 4,118,246 | 1,396,656 | |||||||||||||||||
| Net Investment-Related Gains (Losses) | (235,262) | (1,318,490) | 1,083,228 | |||||||||||||||||
| Other Income | 176,442 | 139,124 | 37,318 | |||||||||||||||||
| Total Insurance Revenues | $ | 8,692,006 | $ | 5,383,062 | $ | 3,308,944 | ||||||||||||||
143
Net Premiums
Net premiums increased for the year ended December 31, 2023 as compared to the year ended December 31, 2022 primarily due to an increase in initial premiums assumed from reinsurance transactions with life contingencies during the year ended December 31, 2023 as compared to the year ended December 31, 2022. The increase was partially offset by higher retrocessions to third party reinsurers during the year ended December 31, 2023 as compared to the year ended December 31, 2022. The initial premiums on assumed reinsurance were offset by a comparable increase in policy reserves reported within net policy benefits and claims (as discussed below).
Net investment income
Net investment income increased for the year ended December 31, 2023 as compared to the year ended December 31, 2022 primarily due to (i) increased average assets under management due to growth in assets in Global Atlantic's institutional market channel as a result of new reinsurance transactions and individual market channel sales and (ii) growth in portfolio yields due to higher market interest rates and the benefit in 2023 from rotating into higher yielding assets during 2022.
Net investment-related losses
The components of net investment-related losses were as follows:
| Years Ended | ||||||||||||||||||||
| December 31, 2023 | December 31, 2022 | Change | ||||||||||||||||||
| ($ in thousands) | ||||||||||||||||||||
| Funds withheld payable embedded derivatives | $ | (1,040,463) | $ | 3,448,710 | $ | (4,489,173) | ||||||||||||||
| Equity futures contracts | (116,766) | 167,924 | (284,690) | |||||||||||||||||
| Foreign currency forwards | 20,171 | 18,929 | 1,242 | |||||||||||||||||
| Credit risk contracts | (280) | (108) | (172) | |||||||||||||||||
| Equity index options | 482,121 | (895,602) | 1,377,723 | |||||||||||||||||
| Interest rate and foreign exchange contracts | (101,376) | (333,937) | 232,561 | |||||||||||||||||
| Funds withheld receivable embedded derivatives | 75,876 | (29,390) | 105,266 | |||||||||||||||||
| Other | — | (29,779) | 29,779 | |||||||||||||||||
| Net gains on derivative instruments | (680,717) | 2,346,747 | (3,027,464) | |||||||||||||||||
| Net other investment gains (losses) | 445,455 | (3,665,237) | 4,110,692 | |||||||||||||||||
| Net investment-related gains (losses) | $ | (235,262) | $ | (1,318,490) | $ | 1,083,228 | ||||||||||||||
Net gains on derivative instruments
The decrease in the fair value of embedded derivatives on funds withheld at interest payable for the year ended December 31, 2023 was primarily driven by the change in fair value of the underlying investments in the funds withheld at interest payable portfolio, which is primarily comprised of fixed maturity securities (designated as trading for accounting purposes), mortgage and other loan receivables, and other investments. The underlying investments in the funds withheld at interest payable portfolio increased in value during the year ended December 31, 2023 and decreased during the year ended December 31, 2022 due to market interest rates ending 2023 relatively flat (having generally increased during 2023, and then decreased at the end of fourth quarter 2023) as compared to a significant increase during the year ended December 31, 2022.
The decrease in the fair value of equity futures was driven primarily by the performance of equity markets. Global Atlantic purchases equity futures primarily to hedge the market risk in its variable annuity products which are accounted for in policy benefits and claims. The majority of Global Atlantic's equity futures are based on the S&P 500 Index, which increased during the year ended December 31, 2023, as compared to a decrease during the year ended December 31, 2022, resulting in respectively, a loss, and a gain, on equity futures contracts in the respective periods.
The increase in the fair value of interest rate and foreign exchange contracts was primarily driven by volatile market interest rates over the course of the year ended December 31, 2023, ending relatively flat for the year in general, as compared to a significant increase in market interest rates during the year ended December 31, 2022, resulting in a loss on interest rate contracts in both periods, respectively.
144
The increase in the fair value of equity index options was primarily driven by the performance of the indexes upon which call options are based. Global Atlantic purchases equity index options to hedge the market risk of embedded derivatives in indexed universal life and fixed-indexed annuity products (the change in which is accounted for in net policy benefits and claims). The majority of Global Atlantic's equity index call options are based on the S&P 500 Index, which increased during the year ended December 31, 2023, as compared to a decrease during the year ended December 31, 2022.
The increase in the fair value of embedded derivatives on funds withheld at interest receivable was primarily due to a narrowing of credit spreads during the year ended December 31, 2023 as compared to a widening of credit spreads during the year ended December 31, 2022.
Net other investment gains (losses)
The components of net other investment gains (losses) were as follows:
| Years Ended | ||||||||||||||||||||
| December 31, 2023 | December 31, 2022 | Change | ||||||||||||||||||
| ($ in thousands) | ||||||||||||||||||||
| Realized gains on investments not supporting asset-liability matching strategies | $ | 36,689 | $ | 87,198 | $ | (50,509) | ||||||||||||||
| Realized losses on available-for-sale fixed maturity debt securities | (64,140) | (559,987) | 495,847 | |||||||||||||||||
| Credit loss allowances | (373,282) | (456,176) | 82,894 | |||||||||||||||||
| Impairment of available-for-sale fixed maturity debt securities due to intent to sell | (26,741) | — | (26,741) | |||||||||||||||||
| Unrealized gains (losses) on fixed maturity securities classified as trading | 1,031,227 | (2,603,874) | 3,635,101 | |||||||||||||||||
| Unrealized (losses) gains on investments accounted under a fair-value option | (110,371) | 60,237 | (170,608) | |||||||||||||||||
| Unrealized losses on real estate investments recognized at fair value under investment company accounting | (115,840) | (42,870) | (72,970) | |||||||||||||||||
| Realized gains on funds withheld at interest, payable portfolio | 25,427 | 38,074 | (12,647) | |||||||||||||||||
| Realized losses on funds withheld at interest, receivable portfolio | (9,193) | (3,176) | (6,017) | |||||||||||||||||
| Other | 51,679 | (184,663) | 236,342 | |||||||||||||||||
| Net other investment-related gains (losses) | $ | 445,455 | $ | (3,665,237) | $ | 4,110,692 | ||||||||||||||
The increase in net other investment gains for the year ended December 31, 2023 as compared to net other investment losses for the year ended December 31, 2022, were primarily due to (i) an increase in unrealized gains on fixed maturity securities classified as trading which was primarily due to market interest rates ending the year relatively flat after being volatile during the year ended December 31, 2023 as compared to a significant increase in market interest rates during the year ended December 31, 2022, (ii) a decrease in realized losses on available-for-sale fixed maturity debt securities which was primarily due to a decrease in portfolio rotation activity during the year ended December 31, 2023, and (iii) an increase in gains from other investments, primarily due to a net decrease in realized losses from the disposition of renewable energy investments in the current and prior year.
Offsetting these increases in net other investment gains were (i) an increase in unrealized losses on investments accounted under a fair-value option, (ii) an increase in unrealized losses on real estate investments at fair-value under investment company accounting due to higher interest and capitalization rates during the year ended December 31, 2023 and (iii) a decrease in realized gains on investments not supporting asset-liability matching strategies.
145
Expenses
Net policy benefits and claims
Net policy benefits and claims increased for the year ended December 31, 2023 as compared to the year ended December 31, 2022 primarily due to (i) an increase in the value of embedded derivatives in Global Atlantic's indexed universal life and fixed indexed annuity products, as a result of higher equity market returns (as discussed above under "—Consolidated Results of Operations (GAAP Basis)—Revenues—Net investment-related gains (losses)," Global Atlantic purchases equity index options in order to hedge this risk, the fair value changes of which are accounted for in gains on derivative instruments, and generally offsetting the change in embedded derivative fair value reported in net policy benefits and claims), (ii) an increase in losses on market risk benefits due to market interest rates generally ending the year relatively flat after being volatile during the year ended December 31, 2023, as compared to a significant increase in market interest rates during the year ended December 31, 2022, (iii) an increase in net flows from both individual and institutional market channel sales, (iv) higher average funding costs due to higher crediting rates and the ordinary-course run-off of older business originated in a lower interest rate environment, (v) higher initial reserves assumed related to new reinsurance transactions with life contingencies in the year ended December 31, 2023 as compared to the year ended December 31, 2022, and (vi) an increase in unfavorable assumption review impacts as discussed above.
Offsetting these increases was a decrease in variable annuity market risk benefit liabilities primarily due to higher equity market returns for the year ended December 31, 2023 as compared to the year ended December 31, 2022.
Amortization of policy acquisition costs
Amortization of policy acquisition costs increased for the year ended December 31, 2023 as compared to the year ended December 31, 2022 primarily due to growth in Global Atlantic's individual market and institutional market channels.
Interest expense
Interest expense increased for the year ended December 31, 2023 as compared to the year ended December 31, 2022 primarily due to (i) a net increase in total debt outstanding, and (ii) an increase in interest expense on floating rate debt (i.e., Global Atlantic's fixed-to-floating swaps on its fixed rate debt) due to higher market interest rates during portions of the year ended December 31, 2023.
Insurance expenses
Insurance expenses increased for the year ended December 31, 2023 as compared to the year ended December 31, 2022 primarily due to increased commission expenses and reinsurance transaction expense allowances.
General, administrative and other
General, administrative and other increased for the year ended December 31, 2023 as compared to the year ended December 31, 2022 primarily due to increased employee compensation and benefits related expenses.
146
Other Consolidated Results of Operations (GAAP Basis)
Income Tax Expense (Benefit)
Income tax expense increased for the year ended December 31, 2023 as compared to the year ended December 31, 2022 primarily due to asset management net operating income in the current period as compared to a net operating loss in the prior period driven by Asset Management capital allocation-based losses. For a discussion of factors that impacted KKR's tax provision, see Note 18 "Income Taxes" in our financial statements included elsewhere in this report.
Net Income (Loss) Attributable to Noncontrolling Interests
Net income (loss) attributable to noncontrolling interests for the year ended December 31, 2023 relates primarily to net income (loss) attributable to: (i) exchangeable securities representing ownership interests in KKR Group Partnership, (ii) third party limited partner interests in consolidated investment funds and (iii) interests that third-party investors hold in Global Atlantic. Net income attributable to noncontrolling interests for the year ended December 31, 2023 was primarily related to net gains from investment activities at our consolidated investment funds and positive income allocable to interests that third party investors hold in Global Atlantic.
Net Income (Loss) Attributable to KKR & Co. Inc.
Net income (loss) attributable to KKR & Co. Inc. for the year ended December 31, 2023 was positive as compared to a net loss in the prior period. Net income attributable to KKR & Co. Inc. for the year ended December 31, 2023 was primarily driven by capital allocation-based income and net gains from investment activities in asset management in the period. The Net loss attributable to KKR & Co. Inc. for the year ended December 31, 2022 was driven by capital allocation-based losses and net losses from investment activities in asset management.
Consolidated Results of Operations (GAAP Basis)
The following is a discussion of our consolidated results of operations on a GAAP basis for the years ended December 31, 2022 and 2021. You should read this discussion in conjunction with the financial statements and related notes included elsewhere in this report. See also "Risk Factors" and "—Business Environment" for more information about factors that may affect our business, financial performance, operating results and valuations.
Effective January 1, 2023, we adopted new accounting guidance for insurance and reinsurance companies that issue long-duration contracts (“LDTI”) with retrospective application to February 1, 2021, the date of the 2021 GA Acquisition. For a more detailed discussion of the adoption of LDTI, see Note 2 "Summary of Significant Accounting Policies" in our financial statements.
147
| Years Ended | |||||||||||||||||
| December 31, 2022 | December 31, 2021 | Change | |||||||||||||||
| ($ in thousands) | |||||||||||||||||
| Revenues | |||||||||||||||||
| Asset Management | |||||||||||||||||
| Fees and Other | $ | 2,821,627 | $ | 2,850,154 | $ | (28,527) | |||||||||||
| Capital Allocation-Based Income (Loss) | (2,500,509) | 6,842,414 | (9,342,923) | ||||||||||||||
| 321,118 | 9,692,568 | (9,371,450) | |||||||||||||||
| Insurance | |||||||||||||||||
| Net Premiums | 1,182,461 | 2,226,078 | (1,043,617) | ||||||||||||||
| Policy Fees | 1,261,721 | 1,137,805 | 123,916 | ||||||||||||||
| Net Investment Income | 4,118,246 | 2,845,623 | 1,272,623 | ||||||||||||||
| Net Investment-Related Gains (Losses) | (1,318,490) | 203,753 | (1,522,243) | ||||||||||||||
| Other Income | 139,124 | 120,213 | 18,911 | ||||||||||||||
| 5,383,062 | 6,533,472 | (1,150,410) | |||||||||||||||
| Total Revenues | 5,704,180 | 16,226,040 | (10,521,860) | ||||||||||||||
| Expenses | |||||||||||||||||
| Asset Management | |||||||||||||||||
| Compensation and Benefits | 1,144,666 | 4,428,743 | (3,284,077) | ||||||||||||||
| Occupancy and Related Charges | 77,271 | 69,084 | 8,187 | ||||||||||||||
| General, Administrative and Other | 993,548 | 959,077 | 34,471 | ||||||||||||||
| 2,215,485 | 5,456,904 | (3,241,419) | |||||||||||||||
| Insurance | |||||||||||||||||
Net Policy Benefits and Claims (including market risk benefit loss (gain) of $(673,399) and $(152,424), respectively; remeasurement (gain) loss on policy liabilities: $(57,128) and $(71,227), respectively.) | 2,358,238 | 4,816,879 | (2,458,641) | ||||||||||||||
| Amortization of Policy Acquisition Costs | 55,349 | (35,377) | 90,726 | ||||||||||||||
| Interest Expense | 87,182 | 61,661 | 25,521 | ||||||||||||||
| Insurance Expenses | 562,585 | 358,878 | 203,707 | ||||||||||||||
| General, Administrative and Other | 718,977 | 555,321 | 163,656 | ||||||||||||||
| 3,782,331 | 5,757,362 | (1,975,031) | |||||||||||||||
| Total Expenses | 5,997,816 | 11,214,266 | (5,216,450) | ||||||||||||||
| Investment Income (Loss) - Asset Management | |||||||||||||||||
| Net Gains (Losses) from Investment Activities | (1,665,537) | 7,720,923 | (9,386,460) | ||||||||||||||
| Dividend Income | 1,322,447 | 698,800 | 623,647 | ||||||||||||||
| Interest Income | 1,895,282 | 1,485,470 | 409,812 | ||||||||||||||
| Interest Expense | (1,550,777) | (1,070,368) | (480,409) | ||||||||||||||
| Total Investment Income (Loss) | 1,415 | 8,834,825 | (8,833,410) | ||||||||||||||
| Income (Loss) Before Taxes | (292,221) | 13,846,599 | (14,138,820) | ||||||||||||||
| Income Tax Expense (Benefit) | 125,393 | 1,394,882 | (1,269,489) | ||||||||||||||
148
| Years Ended | |||||||||||||||||
| December 31, 2022 | December 31, 2021 | Change | |||||||||||||||
| ($ in thousands) | |||||||||||||||||
| Net Income (Loss) | (417,614) | 12,451,717 | (12,869,331) | ||||||||||||||
| Net Income (Loss) Attributable to Redeemable Noncontrolling Interests | 2,792 | 4,060 | (1,268) | ||||||||||||||
| Net Income (Loss) Attributable to Noncontrolling Interests | 101,258 | 7,715,251 | (7,613,993) | ||||||||||||||
| Net Income (Loss) Attributable to KKR & Co. Inc. | (521,664) | 4,732,406 | (5,254,070) | ||||||||||||||
| Series A Preferred Stock Dividends | — | 23,656 | (23,656) | ||||||||||||||
| Series B Preferred Stock Dividends | — | 12,991 | (12,991) | ||||||||||||||
| Series C Mandatory Convertible Preferred Stock Dividends | 69,000 | 69,000 | — | ||||||||||||||
| Net Income (Loss) Attributable to KKR & Co. Inc. Common Stockholders | $ | (590,664) | $ | 4,626,759 | $ | (5,217,423) | |||||||||||
149
Consolidated Results of Operations (GAAP Basis) - Asset Management
Revenues
For the years ended December 31, 2022 and 2021, revenues consisted of the following:
| Years Ended | ||||||||||||||||||||
| December 31, 2022 | December 31, 2021 | Change | ||||||||||||||||||
| ($ in thousands) | ||||||||||||||||||||
| Management Fees | $ | 1,682,466 | $ | 1,301,975 | $ | 380,491 | ||||||||||||||
| Fee Credits | (532,355) | (464,594) | (67,761) | |||||||||||||||||
| Transaction Fees | 1,316,637 | 1,552,621 | (235,984) | |||||||||||||||||
| Monitoring Fees | 131,750 | 134,472 | (2,722) | |||||||||||||||||
| Incentive Fees | 33,537 | 55,701 | (22,164) | |||||||||||||||||
| Expense Reimbursements | 102,927 | 178,572 | (75,645) | |||||||||||||||||
| Consulting Fees | 86,665 | 91,407 | (4,742) | |||||||||||||||||
| Total Fees and Other | 2,821,627 | 2,850,154 | (28,527) | |||||||||||||||||
| Carried Interest | (2,068,662) | 5,388,354 | (7,457,016) | |||||||||||||||||
| General Partner Capital Interest | (431,847) | 1,454,060 | (1,885,907) | |||||||||||||||||
| Total Capital Allocation-Based Income (Loss) | (2,500,509) | 6,842,414 | (9,342,923) | |||||||||||||||||
| Total Revenues - Asset Management | $ | 321,118 | $ | 9,692,568 | $ | (9,371,450) | ||||||||||||||
Fees and Other
Total Fees and Other for the year ended December 31, 2022 decreased compared to the year ended December 31, 2021 primarily as a result of a lower level of transaction fees, which was primarily offset by an increase in management fees.
For a more detailed discussion of the factors that affected our transaction fees during the period, see "—Analysis of Asset Management Segment Operating Results."
The increase in management fees was primarily attributable to management fees earned from North America Fund XIII, Global Infrastructure Investors IV and European Fund VI. This increase was partially offset by a decrease in management fees earned from European Fund V and Americas Fund XII as a result of entering their post-investment periods and, consequently, we now earn fees based on capital invested rather than capital committed and at a lower fee rate.
Management fees due from consolidated investment funds and other vehicles are eliminated upon consolidation under GAAP. However, because these amounts are funded by, and earned from, noncontrolling interests, upon consolidation under GAAP, KKR's allocated share of the net income from the consolidated investment funds and other vehicles is increased by the amount of fees that are eliminated. Accordingly, net income (loss) attributable to KKR would be unchanged if such investment funds and other vehicles were not consolidated. For a more detailed discussion on the factors that affect our management fees during the period, see "—Analysis of Asset Management Segment Operating Results."
Fee credits increased compared to the prior period as a result of a higher level of transaction fees from infrastructure transaction fee-generating investments in our Real Asset business line. Fee credits owed to consolidated investment funds are eliminated upon consolidation under GAAP. However, because these amounts are owed to noncontrolling interests, upon consolidation under GAAP, KKR's allocated share of the net income from the consolidated investment funds is decreased by the amount of fee credits that are eliminated. Accordingly, net income (loss) attributable to KKR would be unchanged if such investment funds and other vehicles were not consolidated. Transaction and monitoring fees earned from KKR portfolio companies are not eliminated upon consolidation because those fees are earned from companies which are not consolidated. Furthermore, transaction fees earned in our capital markets business are not shared with fund investors. Accordingly, certain transaction fees are reflected in our revenues without a corresponding fee credit.
150
Capital Allocation-Based Income (Loss)
Capital Allocation-Based Income (Loss) for the year ended December 31, 2022 was negative primarily due to the net depreciation of the underlying investments in many of our carry-earning investment funds, most notably Americas Fund XII, Asian Fund II, and Asian Fund III. Capital Allocation-Based Income (Loss) for the year ended December 31, 2021 was positive primarily due to the net appreciation of the underlying investments at our carry earning investment funds, most notably Americas Fund XII, Asian Fund III, and North America Fund XI.
KKR generally calculates the carried interest that would be due to KKR for each investment fund, pursuant to the fund agreements, as if the fair value of the underlying investments were realized as of the reporting date, irrespective of whether such amounts have been realized. Since the fair value of the underlying investments varies between reporting periods, it is necessary to make adjustments to the amounts recorded as carried interest to reflect either (a) positive performance, resulting in an increase in the carried interest allocated to the general partner or (b) negative performance that would cause the amount due to KKR to be less than the amount previously recognized, resulting in a negative adjustment to carried interest allocated to the general partner. In each case, it is necessary to calculate the carried interest on cumulative results compared to the carried interest recorded to date and to make the required positive or negative adjustments.
Investment Income (Loss) - Asset Management
Net Gains (Losses) from Investment Activities for the year ended December 31, 2022
The net losses from investment activities for the year ended December 31, 2022 were comprised of net realized gains of $1,298.5 million and net unrealized losses of $(2,964.0) million.
Investment gains and losses relating to our general partner capital interest in our unconsolidated funds are not reflected in our discussion and analysis of Net Gains (Losses) from Investment Activities. Our economics associated with these gains and losses are reflected in Capital Allocation-Based Income (Loss) as described above.
Realized Gains and Losses from Investment Activities
For the year ended December 31, 2022, net realized gains related primarily to (i) the sale of our investment in Fiserv, Inc., (ii) realizations on certain foreign exchange forward contracts, and (iii) the sale of real estate investments held in certain consolidated opportunistic real estate equity funds. Partially offsetting these realized gains were realized losses primarily relating to (i) various investments held in our consolidated alternative credit funds, (ii) a realized loss on Magneti Marelli CK Holdings held in certain consolidated funds and (iii) realized losses from the sales of revolving credit facilities.
Unrealized Gains and Losses from Investment Activities
For the year ended December 31, 2022, net unrealized losses were driven primarily by mark-to-market losses from (i) investments held in our consolidated CLOs and in certain consolidated alternative credit funds, (ii) OutSystems Holdings S.A. held in certain consolidated funds and (iii) the reversal of previously recognized unrealized gains relating to the realization activity described above. These unrealized losses were partially offset by mark-to-market gains related to (i) investments held in certain consolidated energy funds, (ii) USI, Inc., and (iii) ERM Worldwide Group Limited.
The extent and the factors that affect each investment strategy vary depending on the nature of the asset class and the valuation methodology employed. For the year ended December 31, 2022 net unrealized losses were primarily generated in the following asset classes:
•Traditional private equity (excluding core private equity), which was primarily impacted by (i) the negative returns of global equity markets and the related reduction of market multiples used in the market comparables methodology for the valuation of Level III investments, and (ii) the negative impact of higher interest rates and a higher market risk premium in 2022 on discount rates used in the discounted cash flow methodology for the valuation of Level III investments;
•Credit, which were primarily impacted by the widening of the credit spreads observed in the credit markets in 2022; and
•Real estate, which, notwithstanding the positive operating performance of certain properties, was negatively impacted by the reversal of previously recognized unrealized gains relating to the realization activity described above and the capitalization rates widening in the fourth quarter of 2022.
151
Partially offsetting the losses in the asset classes above, there were the unrealized gains generated in the following asset classes:
•Infrastructure and energy, which generally benefited from (i) higher oil and gas prices and (ii) the positive operating performance of certain infrastructure assets; and
•Core private equity, which generally benefited from the positive operating performance of its portfolio companies.
See "Risk Factors" and "—Business Environment" for more information about the factors that may impact our business, financial performance, operating results and valuation.
Net Gains (Losses) from Investment Activities for the year ended December 31, 2021
The net gains from investment activities for the year ended December 31, 2021 were comprised of net realized gains of $2,382.2 million and net unrealized gains of $5,338.7 million.
Realized Gains and Losses from Investment Activities
For the year ended December 31, 2021, net realized gains related primarily to the sales of investments held by KKR and certain consolidated funds, the most significant of which were in FanDuel Inc. (technology sector), Mr. Cooper Group Inc. (NASDAQ: COOP), and Darktrace Limited (LSE: DARK). Partially offsetting these realized gains were realized losses, the most significant of which were realized losses from various investments held in our consolidated credit funds and realized losses on certain hedging instruments.
Unrealized Gains and Losses from Investment Activities
For the year ended December 31, 2021, net unrealized gains related primarily to mark-to-market gains from investments held by KKR and certain consolidated funds, the most significant of which were PetVet Care Centers, LLC, Heartland Dental LLC (healthcare sector) and OutSystems Holdings S.A. Partially offsetting these unrealized gains were unrealized losses, the most significant of which were (i) the reversal of previously recognized unrealized gains relating to the realization activity described above and (ii) an unrealized loss on BridgeBio Pharma, Inc.
For a discussion of other factors that affected KKR's realized investment income, see "—Analysis of Asset Management Segment Operating Results" and Note 4 "Net Gains (Losses) from Investment Activities - Asset Management" in our financial statements.
Dividend Income
During the year ended December 31, 2022, dividend income was primarily from (i) our consolidated core plus and opportunistic real estate equity funds and (ii) our investment in Exact Group B.V. held in our consolidated core vehicles. During the year ended December 31, 2021, dividend income was primarily from (i) our consolidated real estate funds, (ii) our investment in Viridor Limited (infrastructure: energy and energy transition sector), and (iii) our investment in Arnott's Biscuits Limited (consumer products sector).
Significant dividends from portfolio companies and consolidated funds are generally not recurring quarterly dividends, and while they may occur in the future, their size and frequency are variable. For a discussion of other factors that affected KKR's dividend income, see "—Analysis of Asset Management Segment Operating Results."
Interest Income
The increase in interest income during the year ended December 31, 2022 compared to the year ended December 31, 2021 was primarily due to the (i) impact of closing additional CLOs that were consolidated during 2022 and higher interest rates on assets held in consolidated CLOs and (ii) a higher level of interest income from investments held in certain of our consolidated alternative credit funds, primarily related to an increase in the amount of capital deployed and higher interest rates. Partially offsetting these increases was the deconsolidation of KREF in the fourth quarter of 2021. For a discussion of other factors that affected KKR's interest income, see "—Analysis of Asset Management Segment Operating Results."
152
Interest Expense
The increase in interest expense during the year ended December 31, 2022 compared to the year ended December 31, 2021 was primarily due to (i) an increase in the amount of borrowings outstanding from consolidated funds and other vehicles, (ii) the impact of closing additional CLOs that were consolidated during 2022 and higher interest rates on debt obligations held in consolidated CLOs, and (iii) the impact of issuances of our notes after December 31, 2021. Partially offsetting these increases was the deconsolidation of KREF in the fourth quarter of 2021. For a discussion of other factors that affected KKR's interest expense, see "—Analysis of Non-GAAP Performance Measures."
Expenses - Asset Management
Compensation and Benefits
The decrease in compensation and benefits during the year ended December 31, 2022 compared to the year ended December 31, 2021 was primarily due to the reversal of previously recognized accrued carried interest, partially offset by (i) higher equity-based compensation charges and (ii) a higher level of discretionary cash compensation resulting from a higher level of segment fee related revenue and realized performance income in the current period.
General, Administrative and Other
The increase in general, administrative and other during the year ended December 31, 2022 compared to the year ended December 31, 2021 was primarily due to a higher level of (i) expenses at our consolidated funds and investment vehicles, (ii) strategic corporate transaction-related charges, (iii) professional fees, information technology and other administrative costs in connection with the growth of the firm, and (iv) travel related expenses as a result of a return of travel activity to pre- COVID-19 pandemic levels.
In periods of significant fundraising and to the extent that we use third parties to assist in our capital raising efforts, our General, Administrative and Other are expected to increase accordingly. Similarly, our General, Administrative and Other expenses are expected to increase as a result of increased levels of professional and other fees incurred as part of due diligence related to strategic acquisitions and new product development.
Consolidated Results of Operations (GAAP Basis) - Insurance
For the year-ended December 31, 2021, the results of Global Atlantic's insurance operations included in our consolidated results of operations are from the acquisition date, February 1, 2021, through December 31, 2021.
Assumption review
The assumptions on which reserves, deferred revenue and expenses are based are intended to represent an estimation of the benefits that are expected to be payable to, and fees or premiums that are expected to be collectible from, policyholders in future periods. Global Atlantic reviews the adequacy of its reserves, deferred revenue and expenses and the assumptions underlying those items at least annually, usually in the third quarter. As Global Atlantic analyzes its assumptions, to the extent Global Atlantic chooses to update one or more of those assumptions, there may be an “unlocking” impact. Generally, favorable unlocking means the change in assumptions required a reduction in reserves, or in deferred revenue liabilities, and unfavorable unlocking means the change in assumptions required an increase in reserves or in deferred revenue liabilities, or a reduction in deferred expenses.
153
The following table reflects the impact on net income before taxes and to insurance segment adjusted operating earnings from Global Atlantic’s assumption review:
| Years Ended | ||||||||||||||||||||
| December 31, 2022 | December 31, 2021 | Change | ||||||||||||||||||
| ($ in thousands) | ||||||||||||||||||||
| Total assumption review impact on income before taxes (GAAP basis) | $ | 57,128 | $ | 71,227 | $ | (14,099) | ||||||||||||||
| Assumption review impact on adjustments to derive insurance segment adjusted operating earnings | (89,961) | (59,247) | (30,714) | |||||||||||||||||
| Noncontrolling interests' share of assumption review impact | 12,043 | (4,612) | 16,655 | |||||||||||||||||
| Total assumption review impact on insurance segment adjusted operating earnings | $ | (20,790) | $ | 7,368 | $ | (28,158) | ||||||||||||||
For the year ended December 31, 2022, the net favorable unlocking impact on income before taxes was primarily due to lower utilization of fixed-indexed annuity income benefits and higher variable annuity fees, offset by lower life and annuity surrender rates. For the year ended December 31, 2021, the net favorable unlocking impact to income before taxes was primarily due to lower utilization of fixed-indexed annuity income benefits and lower annuity and long-term care claims, offset by higher activation of variable annuity income benefits. The unlocking of assumptions used in the calculation of market risk benefits and other policy reserves accounted for at fair value, which are excluded from the definition of insurance segment adjusted operating earnings, are reflected in the line item “Assumption review impact on adjustments to derive insurance segment adjusted operating earnings.”
Revenues
For the years ended December 31, 2022 and December 31, 2021, revenues consisted of the following:
| Years Ended | ||||||||||||||||||||
| December 31, 2022 | December 31, 2021 | Change | ||||||||||||||||||
| ($ in thousands) | ||||||||||||||||||||
| Net Premiums | $ | 1,182,461 | $ | 2,226,078 | $ | (1,043,617) | ||||||||||||||
| Policy Fees | 1,261,721 | 1,137,805 | 123,916 | |||||||||||||||||
| Net Investment Income | 4,118,246 | 2,845,623 | 1,272,623 | |||||||||||||||||
| Net Investment-Related (Losses) Gains | (1,318,490) | 203,753 | (1,522,243) | |||||||||||||||||
| Other Income | 139,124 | 120,213 | 18,911 | |||||||||||||||||
| Total Insurance Revenues | $ | 5,383,062 | $ | 6,533,472 | $ | (1,150,410) | ||||||||||||||
Net Premiums
Net premiums decreased for the year ended December 31, 2022 as compared to the year ended December 31, 2021 primarily due to lower initial premiums related to fewer reinsurance transactions with life contingencies assumed during the year ended December 31, 2022 as compared to the year ended December 31, 2021. The decrease was partially offset by lower retrocessions to third party reinsurers during the year ended December 31, 2022 as compared to the year ended December 31, 2021. The initial premiums on assumed reinsurance were offset by a comparable increase in policy reserves reported within net policy benefits and claims (as discussed below).
Policy fees
Policy fees increased for the year ended December 31, 2022 as compared to the year ended December 31, 2021 primarily due to one less month of activity reported in the prior financial reporting period as a result of the 2021 GA Acquisition on February 1, 2021.
154
Net investment income
Net investment income increased for the year ended December 31, 2022 as compared to the year ended December 31, 2021 primarily due to (i) higher yields on floating-rate investments due to higher market interest rates, (ii) rotation into higher yielding assets, (iii) increased average assets under management due to growth in assets in Global Atlantic's institutional market channel as a result of new reinsurance transactions and individual market channel sales, and (iv) one less month of activity reported in the prior financial reporting period as a result of the 2021 GA Acquisition having occurred on February 1, 2021.
Net investment-related (losses) gains
The components of net investment-related (losses) gains were as follows:
| Years Ended | ||||||||||||||||||||
| December 31, 2022 | December 31, 2021 | Change | ||||||||||||||||||
| ($ in thousands) | ||||||||||||||||||||
| Funds withheld payable embedded derivatives | $ | 3,448,710 | $ | 49,491 | $ | 3,399,219 | ||||||||||||||
| Equity futures contracts | 167,924 | (263,637) | 431,561 | |||||||||||||||||
| Foreign currency forwards | 18,929 | 2,484 | 16,445 | |||||||||||||||||
| Credit risk contracts | (108) | (400) | 292 | |||||||||||||||||
| Equity index options | (895,602) | 549,987 | (1,445,589) | |||||||||||||||||
| Interest rate and foreign exchange contracts | (333,937) | (146,920) | (187,017) | |||||||||||||||||
| Funds withheld receivable embedded derivatives | (29,390) | 31,740 | (61,130) | |||||||||||||||||
| Other | (29,779) | — | (29,779) | |||||||||||||||||
| Net gains on derivative instruments | 2,346,747 | 222,745 | 2,124,002 | |||||||||||||||||
| Net other investment losses | (3,665,237) | (18,992) | (3,646,245) | |||||||||||||||||
| Net investment-related (losses) gains | $ | (1,318,490) | $ | 203,753 | $ | (1,522,243) | ||||||||||||||
Net gains on derivative instruments
The increase in the fair value of embedded derivatives on funds withheld at interest payable for the year ended December 31, 2022 was primarily driven by the change in fair value of the underlying investments in the funds withheld at interest payable portfolio, which is primarily comprised of fixed maturity securities (designated as trading for accounting purposes), mortgage and other loan receivables, and other investments. The underlying investments in the funds withheld at interest payable portfolio declined in value in the current period primarily due to an increase in market interest rates and wider credit spreads.
The increase in the fair value of equity futures was driven primarily by the performance of equity markets. Global Atlantic purchases equity futures primarily to hedge the market risk in Global Atlantic's variable annuity products which are accounted for in net policy benefits and claims. The majority of Global Atlantic's equity futures are based on the S&P 500 Index, which decreased during the year ended December 31, 2022, as compared to an increase during the year ended December 31, 2021, resulting in, respectively, a gain and a loss on equity futures contracts in the respective periods.
The decrease in the fair value of equity index options was primarily driven by the performance of the indexes upon which call options are based. Global Atlantic purchases equity index options to hedge the market risk of embedded derivatives in indexed universal life and fixed-indexed annuity products (the change in which is accounted for in net policy benefits and claims). The majority of Global Atlantic's equity index call options are based on the S&P 500 Index, which decreased during the year ended December 31, 2022, as compared to the increase during the year ended December 31, 2021.
The decrease in the fair value of interest rate and foreign exchange contracts was primarily driven by an increase in market interest rates during both the year ended December 31, 2022 and the prior financial reporting period, resulting in a loss on interest rate contracts.
The decrease in the fair value of embedded derivatives on funds withheld at interest receivable was primarily due to widening of credit spreads during the year ended December 31, 2022, as compared to the tightening of credit spreads in the year ended December 31, 2021.
155
Net investment-related losses
The components of net other investment losses were as follows:
| Years Ended | ||||||||||||||||||||
| December 31, 2022 | December 31, 2021 | Change | ||||||||||||||||||
| ($ in thousands) | ||||||||||||||||||||
| Realized gains on investments not supporting asset-liability matching strategies | $ | 87,198 | $ | 527,788 | $ | (440,590) | ||||||||||||||
| Realized losses on available-for-sale fixed maturity debt securities | (559,987) | (201,411) | (358,576) | |||||||||||||||||
| Credit loss allowances | (456,176) | (249,338) | (206,838) | |||||||||||||||||
| Unrealized losses on fixed maturity securities classified as trading | (2,603,874) | (118,714) | (2,485,160) | |||||||||||||||||
| Unrealized gains on investments classified as trading or fair-value option | 60,237 | 39,758 | 20,479 | |||||||||||||||||
| Unrealized (losses) gains on real estate investments recognized at fair value under investment company accounting | (42,870) | 35,418 | (78,288) | |||||||||||||||||
| Realized gains (losses) on funds withheld at interest, payable portfolio | 38,074 | (30,015) | 68,089 | |||||||||||||||||
| Realized (losses) gains on funds withheld at interest, receivable portfolio | (3,176) | 12,418 | (15,594) | |||||||||||||||||
| Other | (184,663) | (34,896) | (149,767) | |||||||||||||||||
| Net other investment-related losses | $ | (3,665,237) | $ | (18,992) | $ | (3,646,245) | ||||||||||||||
The increase in net other investment losses for the year ended December 31, 2022 were primarily due to (i) an increase in unrealized losses on fixed maturity securities classified as trading was primarily due to an increase in interest rates and widening credit spreads in the current period, (ii) a decrease in realized gains on investments not supporting asset-liability matching strategies primarily due to the non-recurrence of a gain from the disposition of Origis USA, LLC (infrastructure: energy and energy transition sector) in the prior financial reporting period, (iii) the increase in realized losses on available-for-sale fixed maturity debt securities primarily due to portfolio rotation in a higher interest rate environment, (iv) an increase in credit loss allowances on mortgage and other loan receivables in the current period primarily due to an increase in credit risk of Global Atlantic's loan portfolio, offset in part by the recognition of an initial credit loan loss allowance upon the adoption of the current expected credit loss accounting standard concurrent with the 2021 GA Acquisition in the prior financial reporting period, and (v) realized losses on renewable energy investments in the current period.
Offsetting these losses were realized gains on funds withheld at interest payable portfolio.
Other income
Other income increased for the year ended December 31, 2022 as compared to the prior financial reporting period primarily due to one less month of activity reported in the prior financial reporting period as a result of the 2021 GA Acquisition having occurred on February 1, 2021.
156
Expenses
Net policy benefits and claims
Net policy benefits and claims decreased for the year ended December 31, 2022 as compared to the year ended December 31, 2021 primarily due to (i) an increase in gains on market risk benefit liabilities due to a higher increase in interest rates during the year ended December 31, 2022, as compared to the year ended December 31, 2021, (ii) lower initial reserves assumed related to fewer new reinsurance transactions with life contingencies in the year ended December 31, 2022 as compared to the year ended December 31, 2021, and (iii) a decrease in the value of embedded derivatives in Global Atlantic's interest sensitive life and fixed indexed annuity products, as a result of lower equity market returns (as discussed above under "—Consolidated Results of Operations (GAAP Basis)—Revenues—Net gains on derivatives instruments," Global Atlantic purchases equity index options in order to hedge this risk, the fair value changes of which are accounted for in gains on derivative instruments, and generally offsetting the change in embedded derivative fair value reported in net policy benefits and claims). This decrease was offset by (i) one less month of activity reported in the prior financial reporting period as a result of the 2021 GA Acquisition having occurred on February 1, 2021, (ii) an increase in net flows from both individual and institutional market channel sales, (iii) an increase in the market risk benefit liability due to lower equity market returns, (iv) higher funding costs on new business, and (v) favorable experience related to the assumption review described above under “—Consolidated Results of Operations (GAAP Basis) - Insurance—Assumption Review.”
Amortization of policy acquisition costs
Amortization of policy acquisition costs increased for the year ended December 31, 2022 as compared to the year ended December 31, 2021 primarily due to (i) a decrease in the net benefit (that is, a reduction to expense) from the amortization of the net negative insurance intangibles recognized as part of purchase accounting of the 2021 GA Acquisition, as the underlying business runs off, and (ii) growth in Global Atlantic's individual market channel.
Interest expense
Interest expense increased for the year ended December 31, 2022 as compared to the year ended December 31, 2021 primarily due to (i) a net increase in debt outstanding, including a draw on Global Atlantic's revolving credit facility in the quarter ended March 31, 2022, (ii) an increase in interest expense on floating rate debt (Global Atlantic's revolving facility and fixed-to-floating swaps on Global Atlantic's fixed rate debt) due to higher market rates, and (iii) the impact of one less month of activity reported in the prior financial reporting period as a result of the 2021 GA Acquisition having occurred on February 1, 2021.
Insurance expenses
Insurance expenses increased for the year ended December 31, 2022 as compared to the year ended December 31, 2021 primarily due to (i) one less month of activity reported in the prior financial reporting period as a result of the 2021 GA Acquisition having occurred on February 1, 2021, (ii) increased commission expense related to increased sales in Global Atlantic's individual market and increased reinsurance transactions, and (iii) increased reinsurance ceding expense allowances paid for policy administration services as a result of an increase in reinsurance transactions.
General, administrative and other
General, administrative and other increased for the year ended December 31, 2022 as compared to the year ended December 31, 2021 primarily due to (i) one less month of activity reported in the prior financial reporting period as a result of the 2021 GA Acquisition having occurred on February 1, 2021, (ii) increased employee compensation and benefits related expenses, (iii) increased professional service fees, and (iv) increased third-party administrator ("TPA") policy servicing fees, all due to growth of the business.
157
Other Consolidated Results of Operations (GAAP Basis)
Income Tax Expense (Benefit)
For the year ended December 31, 2022, income tax was an expense of $125.4 million compared to an income tax expense of $1,394.9 million in the prior period. The tax expense in the current period was generated primarily from net operating losses driven by capital allocation-based losses. For a discussion of factors that impacted KKR's tax provision, see Note 18 "Income Taxes" to the financial statements included elsewhere in this report.
Net Income (Loss) Attributable to Noncontrolling Interests
Net Income (Loss) attributable to noncontrolling interests for the year ended December 31, 2022 relates primarily to net income (loss) attributable to (i) exchangeable securities representing ownership interests in KKR Group Partnership, (ii) third party limited partner interests in consolidated investment funds, and (iii) interests that third party investors hold in Global Atlantic. Net Income attributable to noncontrolling interests for the year ended December 31, 2022 was primarily related to positive income allocable to interests that third party investors hold in Global Atlantic partially offset by (i) net losses from investment activities at our consolidated investment funds and (ii) a net loss attributable to exchangeable securities.
Net Income (Loss) Attributable to KKR & Co. Inc.
Net Loss attributable to KKR & Co. Inc. for the year ended December 31, 2022 was primarily due to (i) net capital allocation-based losses and (ii) net losses from investment activities, partially offset by (i) a higher level of management fees and (ii) a reversal of previously recognized accrued carried interest compensation, as described above.
158
Condensed Consolidated Statements of Financial Condition (GAAP Basis)
The following table provides our condensed consolidated statements of financial condition on a GAAP basis as of December 31, 2023 and December 31, 2022.
| (Amounts in thousands, except per share amounts) | ||||||||||||||
| As of | As of | |||||||||||||
| December 31, 2023 | December 31, 2022 | |||||||||||||
| Assets | ||||||||||||||
| Asset Management | ||||||||||||||
| Cash and Cash Equivalents | $ | 8,393,892 | $ | 6,705,325 | ||||||||||
| Investments | 98,634,801 | 92,375,463 | ||||||||||||
| Other Assets | 6,538,674 | 7,114,360 | ||||||||||||
| 113,567,367 | 106,195,148 | |||||||||||||
| Insurance | ||||||||||||||
| Cash and Cash Equivalents | 11,954,675 | 6,118,231 | ||||||||||||
| Investments | 141,370,323 | 124,199,176 | ||||||||||||
| Other Assets | 50,401,829 | 38,834,081 | ||||||||||||
| 203,726,827 | 169,151,488 | |||||||||||||
| Total Assets | $ | 317,294,194 | $ | 275,346,636 | ||||||||||
| Liabilities and Equity | ||||||||||||||
| Asset Management | ||||||||||||||
| Debt Obligations | $ | 44,886,870 | $ | 40,598,613 | ||||||||||
| Other Liabilities | 8,256,514 | 6,937,832 | ||||||||||||
| 53,143,384 | 47,536,445 | |||||||||||||
| Insurance | ||||||||||||||
| Debt Obligations | 2,587,857 | 2,128,166 | ||||||||||||
| Other Liabilities | 203,184,041 | 170,311,335 | ||||||||||||
| 205,771,898 | 172,439,501 | |||||||||||||
| Total Liabilities | $ | 258,915,282 | $ | 219,975,946 | ||||||||||
| Redeemable Noncontrolling Interests | 615,427 | 152,065 | ||||||||||||
| Stockholders' Equity | ||||||||||||||
| Stockholders' Equity - Series C Mandatory Convertible Preferred Stock | — | 1,115,792 | ||||||||||||
| Stockholders' Equity - Common Stock | 22,858,694 | 17,691,975 | ||||||||||||
| Noncontrolling Interests | 34,904,791 | 36,410,858 | ||||||||||||
| Total Equity | 57,763,485 | 55,218,625 | ||||||||||||
| Total Liabilities and Equity | $ | 317,294,194 | $ | 275,346,636 | ||||||||||
| KKR & Co. Inc. Stockholders' Equity - Common Stock Per Outstanding Share of Common Stock | $ | 25.83 | $ | 20.55 | ||||||||||
KKR & Co. Inc. Stockholders’ Equity - Common Stock per Outstanding Share of Common Stock was $25.83 as of December 31, 2023, up from $20.55 as of December 31, 2022. The increase was primarily due to (i) net income attributable to KKR & Co. Inc. common stockholders, (ii) the conversion of Series C Mandatory Convertible Preferred Stock in September 2023, and (iii) unrealized gains on available-for-sale-securities from Global Atlantic that are recorded in other comprehensive income partially offset by (i) dividends to common stockholders and (ii) repurchases of our common stock.
159
Consolidated Statements of Cash Flows (GAAP Basis)
The following is a discussion of our consolidated cash flows for the years ended December 31, 2023, 2022, and 2021. You should read this discussion in conjunction with the financial statements and related notes included elsewhere in this report.
The consolidated statements of cash flows include the cash flows of our consolidated entities, which include certain consolidated investment funds, CLOs and certain variable interest entities formed by Global Atlantic notwithstanding the fact that we may hold only a minority economic interest in those investment funds and CFEs. The assets of our consolidated investment funds and CFEs, on a gross basis, can be substantially larger than the assets of our business and, accordingly, could have a substantial effect on the cash flows reflected in our consolidated statements of cash flows. The primary cash flow activities of our consolidated funds and CFEs involve: (i) capital contributions from fund investors; (ii) using the capital of fund investors to make investments; (iii) financing certain investments with indebtedness; (iv) generating cash flows through the realization of investments; and (v) distributing cash flows from the realization of investments to fund investors. Because our consolidated funds are treated as investment companies for accounting purposes, certain of these cash flow amounts are included in our cash flows from operations.
Net Cash Provided (Used) by Operating Activities
Our net cash provided (used) by operating activities was $(1.5) billion, $(5.3) billion, and $(7.2) billion during the years ended December 31, 2023, 2022, and 2021, respectively. These amounts primarily included: (i) investments purchased (asset management), net of proceeds from investments (asset management) of $(8.6) billion, $(10.4) billion, and $(10.6) billion during the years ended December 31, 2023, 2022, and 2021, respectively, (ii) net realized gains (losses) on asset management investments of $(0.8) billion, $1.3 billion, and $2.4 billion during the years ended December 31, 2023, 2022, and 2021, respectively, (iii) change in unrealized gains (losses) on investments (asset management) of $3.8 billion, $(3.0) billion, and $5.3 billion during the years ended December 31, 2023, 2022, and 2021, respectively, (iv) capital allocation-based income (loss) of $2.8 billion, $(2.5) billion, and $6.8 billion during the years ended December 31, 2023, 2022, and 2021, respectively, (v) net investment and policy liability-related gains (losses) (insurance) of $(2.6) billion, $(0.4) billion, and $(0.7) billion during the years ended December 31, 2023, 2022, and 2021, respectively, and (vi) interest credited to policyholder account balances (net of policy fees) (insurance) of $2.8 billion, $1.2 billion, and $1.7 billion during the years ended December 31, 2023, 2022, and 2021, respectively. Investment funds are investment companies under GAAP and reflect their investments and other financial instruments at fair value.
Net Cash Provided (Used) by Investing Activities
Our net cash provided (used) by investing activities was $(3.9) billion, $(13.6) billion, and $(9.6) billion during the years ended December 31, 2023, 2022, and 2021, respectively. Our investing activities included: (i) investments purchased (insurance), net of proceeds from investments (insurance), of $(3.8) billion, $(11.8) billion, and $(9.1) billion during the years ended December 31, 2023, 2022, and 2021, respectively, (ii) the purchase of fixed assets of $(108.4) million, $(85.1) million, and $(102.0) million during the years ended December 31, 2023, 2022, and 2021, respectively, (iii) the acquisition of KJRM, net of cash acquired of $(1.7) billion during the year ended December 31, 2022, and (iv) the acquisition of Global Atlantic, net of cash acquired of $(0.5) billion during the year ended December 31, 2021.
Net Cash Provided (Used) by Financing Activities
Our net cash provided (used) by financing activities was $12.8 billion, $22.1 billion, and $20.4 billion during the years ended December 31, 2023, 2022, and 2021, respectively. Our financing activities primarily included: (i) contributions from, net of distributions to, our noncontrolling and redeemable noncontrolling interests of $6.4 billion, $6.6 billion, and $6.4 billion during the years ended December 31, 2023, 2022, and 2021, respectively, (ii) proceeds received, net of repayment of debt obligations, of $3.6 billion, $6.5 billion, and $8.9 billion during the years ended December 31, 2023, 2022, and 2021, respectively, (iii) additions to, net of withdrawals from, contractholder deposit funds (insurance) of $1.9 billion, $9.3 billion, and $5.9 billion during the years ended December 31, 2023, 2022, and 2021, respectively, (iv) reinsurance transactions, net of cash provided (insurance) of $1.2 billion, $69.6 million, and $610.3 million during the years ended December 31, 2023, 2022, and 2021, respectively, (v) common stock dividends of $(563.3) million, $(444.3) million, and $(331.4) million during the years ended December 31, 2023, 2022, and 2021, respectively, (vi) repurchases of common stock of $(289.8) million, $(346.7) million, and $(269.7) million during the years ended December 31, 2023, 2022, and 2021, respectively, and (vii) Series C Mandatory Convertible Preferred Stock dividends of $(51.7) million, $(69.0) million, and $(69.0) million during the years ended December 31, 2023, 2022, and 2021, respectively.
160
Analysis of Segment Operating Results
The following is a discussion of the results of our business on a segment basis for the years ended December 31, 2023, 2022, and 2021. You should read this discussion in conjunction with the information included under "—Key Segment and Non- GAAP Performance Measures" and the financial statements and related notes included elsewhere in this report. See "— Business Environment" for more information about factors that may impact our business, financial performance, operating results and valuations.
Analysis of Asset Management Segment Operating Results
The following tables set forth information regarding KKR's asset management segment operating results for the years ended December 31, 2023 and 2022.
| Years Ended | ||||||||||||||||||||
| December 31, 2023 | December 31, 2022 | Change | ||||||||||||||||||
| ($ in thousands) | ||||||||||||||||||||
| Management Fees | $ | 3,030,325 | $ | 2,656,487 | $ | 373,838 | ||||||||||||||
| Transaction and Monitoring Fees, Net | 720,654 | 775,933 | (55,279) | |||||||||||||||||
| Fee Related Performance Revenues | 94,427 | 90,665 | 3,762 | |||||||||||||||||
| Fee Related Compensation | (865,336) | (769,735) | (95,601) | |||||||||||||||||
| Other Operating Expenses | (596,284) | (585,999) | (10,285) | |||||||||||||||||
| Fee Related Earnings | 2,383,786 | 2,167,351 | 216,435 | |||||||||||||||||
| Realized Performance Income | 1,065,389 | 2,176,658 | (1,111,269) | |||||||||||||||||
| Realized Performance Income Compensation | (666,440) | (1,333,526) | 667,086 | |||||||||||||||||
| Realized Investment Income | 690,727 | 1,134,419 | (443,692) | |||||||||||||||||
| Realized Investment Income Compensation | (103,590) | (159,003) | 55,413 | |||||||||||||||||
| Asset Management Segment Operating Earnings | $ | 3,369,872 | $ | 3,985,899 | $ | (616,027) | ||||||||||||||
Management Fees
The following table presents management fees by business line:
| Years Ended | ||||||||||||||||||||
| December 31, 2023 | December 31, 2022 | Change | ||||||||||||||||||
| ($ in thousands) | ||||||||||||||||||||
| Management Fees | ||||||||||||||||||||
| Private Equity | $ | 1,286,062 | $ | 1,188,463 | $ | 97,599 | ||||||||||||||
| Real Assets | 825,735 | 679,890 | 145,845 | |||||||||||||||||
| Credit and Liquid Strategies | 918,528 | 788,134 | 130,394 | |||||||||||||||||
| Total Management Fees | $ | 3,030,325 | $ | 2,656,487 | $ | 373,838 | ||||||||||||||
The increase in Private Equity management fees was primarily attributable to management fees earned on new capital raised over the past twelve months at Global Impact Fund II, Ascendant Fund, and Next Generation Technology Growth Fund III. This increase was partially offset by (i) a lower level of management fees from Americas Fund XII due to a step-down in the management fee rate in 2023 and a decrease in invested capital, (ii) management fees earned on new capital raised for North America Fund XIII in the first quarter of 2022 that were retroactive to the start of the fund's investment period, and (iii) a lower level of management fees from Asian Fund III due to a decrease in its fee base, which had invested capital reduced from the sale of investments. There were no management fees that were retroactive to the start of the fund's investment period for the year ended December 31, 2023 for North America Fund XIII. During the fourth quarter of 2023, approximately $14.9 million of management fees were earned on new capital raised that is retroactive to the start of the relevant fund's investment period.
161
The increase in Real Assets management fees was primarily attributable to (i) management fees earned from Asia Pacific Infrastructure Investors II for the full year 2023, which entered its investment period in the third quarter of 2022, (ii) a higher level of management fees earned from Global Atlantic due to an increase in their assets being managed by our asset management segment, and (iii) management fees earned from Diversified Core Infrastructure Fund due to an increase in its fee base, due to higher capital inflows and investment appreciation year over year. This increase was partially offset by a lower level of management fees from our first Asia Pacific Infrastructure Investors fund in the current year as a result of entering its post-investment period in the third quarter of 2022 and, consequently, management fees being earned on invested capital rather than committed capital. During the fourth quarter of 2023, approximately $4.7 million of management fees were earned on new capital raised that is retroactive to the start of the relevant fund's investment period.
The increase in Credit and Liquid Strategies management fees was primarily attributable to (i) a higher level of management fees earned from Global Atlantic due to an increase in assets being managed by our asset management segment, (ii) a higher level of management fees earned from Marshall Wace, and (iii) the issuance of various U.S. and European CLOs over the last twelve months. The increase was partially offset by a lower level of management fees from certain SIG funds primarily due to (i) a decrease in its fee base from the sale of investments, and (ii) certain SIG funds which no longer pay management fees as a result of an agreement to waive such fees.
Transaction and Monitoring Fees, Net
The following table presents transaction and monitoring fees, net by business line:
| Years Ended | ||||||||||||||||||||
| December 31, 2023 | December 31, 2022 | Change | ||||||||||||||||||
| ($ in thousands) | ||||||||||||||||||||
| Transaction and Monitoring Fees, Net | ||||||||||||||||||||
| Private Equity | $ | 115,276 | $ | 120,410 | $ | (5,134) | ||||||||||||||
| Real Assets | 20,564 | 33,202 | (12,638) | |||||||||||||||||
| Credit and Liquid Strategies | 7,197 | 22,018 | (14,821) | |||||||||||||||||
| Capital Markets | 577,617 | 600,303 | (22,686) | |||||||||||||||||
| Total Transaction and Monitoring Fees, Net | $ | 720,654 | $ | 775,933 | $ | (55,279) | ||||||||||||||
Our Private Equity, Real Assets and Credit and Liquid Strategies business lines earn transaction and monitoring fees from portfolio companies, and under the terms of the management agreements with certain of our investment funds, we are required to share all or a portion of such fees with our fund investors. For most of our investment funds, transaction and monitoring fees are credited against fund management fees up to 100% of the amount of the transaction and monitoring fees attributable to that investment fund, which results in a decrease of our monitoring and transaction fees. Additionally, transaction fees are generally not earned with respect to energy and real estate investments. Our Capital Markets business line earns transaction fees, which are generally not shared with fund investors.
The decrease in transaction and monitoring fees, net is primarily due to a lower level of transaction fees earned in our Capital Markets business line. The decrease in capital markets transaction fees was primarily due to a decrease in the size of capital markets transactions for the year ended December 31, 2023, compared to the year ended December 31, 2022. Overall, we completed 239 capital markets transactions for the year ended December 31, 2023, of which 45 represented equity offerings and 194 represented debt offerings, as compared to 240 transactions for the year ended December 31, 2022, of which 29 represented equity offerings and 211 represented debt offerings. We earn fees in connection with underwriting, syndication and other capital markets services. While each of the capital markets transactions that we undertake in this business line is separately negotiated, our fee rates are generally higher with respect to underwriting or syndicating equity offerings than with respect to debt offerings, and the amount of fees that we earn for similar transactions generally correlates with overall transaction sizes.
Our capital markets fees are generated in connection with activity involving our private equity, real assets and credit funds as well as from third-party companies. For the year ended December 31, 2023, approximately 13% of our transaction fees in our Capital Markets business line were earned from unaffiliated third parties as compared to approximately 14% for the year ended December 31, 2022. Our transaction fees are comprised of fees earned from North America, Europe, and the Asia-Pacific region. For the year ended December 31, 2023, approximately 39% of our transaction fees were generated outside of North America as compared to approximately 46% for the year ended December 31, 2022. Our Capital Markets business line is dependent on the overall capital markets environment, which is influenced by equity prices, credit spreads, and volatility. Our Capital Markets business line does not generate monitoring fees.
162
Transaction and monitoring fees, net were lower for the year ended December 31, 2023 compared to the prior year across our Private Equity, Real Assets and Credit and Liquid Strategies business lines primarily due to the decrease in transaction activity resulting in a decline in the level of capital invested year over year. See "—Analysis of Asset Management Segment Operating Results—Capital Invested" for more information about capital invested by business line.
Fee Related Performance Revenues
The following table presents fee related performance revenues by business line:
| Years Ended | ||||||||||||||||||||
| December 31, 2023 | December 31, 2022 | Change | ||||||||||||||||||
| ($ in thousands) | ||||||||||||||||||||
| Fee Related Performance Revenues | ||||||||||||||||||||
| Private Equity | $ | — | $ | — | $ | — | ||||||||||||||
| Real Assets | 21,648 | 51,183 | (29,535) | |||||||||||||||||
| Credit and Liquid Strategies | 72,779 | 39,482 | 33,297 | |||||||||||||||||
| Total Fee Related Performance Revenues | $ | 94,427 | $ | 90,665 | $ | 3,762 | ||||||||||||||
Fee related performance revenues represent performance fees that are (i) expected to be received from our investment funds, vehicles and accounts on a recurring basis, and (ii) not dependent on a realization event involving investments held by the investment fund, vehicle or account.
These performance fees are primarily earned from FSK in our Credit and Liquid Strategies business line and KKR Property Partners Americas ("KPPA") (our open-ended core plus real estate fund), KREST, KREF, and KJRM in our Real Assets business line.
Fee related performance revenues were higher for the year ended December 31, 2023 compared to the prior period primarily due to a higher level of performance revenues earned from FSK in the current year. For the year ended December 31, 2023, there were no performance revenues earned from KPPA partially offsetting the increase in performance revenues from FSK.
Fee Related Compensation
The increase in fee related compensation for the year ended December 31, 2023 compared to the prior period was primarily due to a higher level of compensation recorded in connection with the higher level of revenues included within fee related earnings.
Other Operating Expenses
The increase in other operating expenses for the year ended December 31, 2023 compared to the prior period was primarily due to a higher level of information technology, occupancy, and other administrative costs in connection with the overall growth of the firm, partially offset by a lower level of corporate travel costs and placement fees.
Fee Related Earnings
The increase in fee related earnings for the year ended December 31, 2023 compared to the prior period is primarily due to a higher level of management fees from our Private Equity, Real Assets, and Credit and Liquid Strategies business lines, partially offset by a lower level of transaction and monitoring fees, net, and a higher level of fee related compensation and other operating expenses, as described above.
163
Realized Performance Income
The following table presents realized performance income by business line:
| Years Ended | ||||||||||||||||||||
| December 31, 2023 | December 31, 2022 | Change | ||||||||||||||||||
| ($ in thousands) | ||||||||||||||||||||
| Realized Performance Income | ||||||||||||||||||||
| Private Equity | $ | 938,790 | $ | 1,903,580 | $ | (964,790) | ||||||||||||||
| Real Assets | 67,018 | 113,465 | (46,447) | |||||||||||||||||
| Credit and Liquid Strategies | 59,581 | 159,613 | (100,032) | |||||||||||||||||
| Total Realized Performance Income | $ | 1,065,389 | $ | 2,176,658 | $ | (1,111,269) | ||||||||||||||
| Years Ended | ||||||||||||||||||||
| December 31, 2023 | December 31, 2022 | Change | ||||||||||||||||||
| ($ in thousands) | ||||||||||||||||||||
| Private Equity | ||||||||||||||||||||
| Americas Fund XII | $ | 357,618 | $ | 197,023 | $ | 160,595 | ||||||||||||||
| Core Investment Vehicles | 220,075 | 262,219 | (42,144) | |||||||||||||||||
| Asian Fund III | 178,947 | 104,601 | 74,346 | |||||||||||||||||
| European Fund IV | 61,841 | 86,233 | (24,392) | |||||||||||||||||
| Global Impact Fund | 35,361 | — | 35,361 | |||||||||||||||||
| Co-Investment Vehicles and Other | 32,894 | 55,868 | (22,974) | |||||||||||||||||
| Next Generation Technology Growth Fund | 24,248 | — | 24,248 | |||||||||||||||||
| North America Fund XI | 23,486 | 932,428 | (908,942) | |||||||||||||||||
| 2006 Fund | 4,271 | 231,689 | (227,418) | |||||||||||||||||
Total Realized Carried Interest (1) | 938,741 | 1,870,061 | (931,320) | |||||||||||||||||
| Incentive Fees | 49 | 33,519 | (33,470) | |||||||||||||||||
| Total Realized Performance Income | $ | 938,790 | $ | 1,903,580 | $ | (964,790) | ||||||||||||||
| Years Ended | ||||||||||||||||||||
| December 31, 2023 | December 31, 2022 | Change | ||||||||||||||||||
| ($ in thousands) | ||||||||||||||||||||
| Real Assets | ||||||||||||||||||||
| Global Infrastructure Investors II | $ | 38,145 | $ | 17,693 | $ | 20,452 | ||||||||||||||
| Real Estate Partners Americas II | 27,599 | 95,772 | (68,173) | |||||||||||||||||
| Co-Investment Vehicles and Other | 1,274 | — | 1,274 | |||||||||||||||||
Total Realized Carried Interest (1) | 67,018 | 113,465 | (46,447) | |||||||||||||||||
| Incentive Fees | — | — | — | |||||||||||||||||
| Total Realized Performance Income | $ | 67,018 | $ | 113,465 | $ | (46,447) | ||||||||||||||
164
| Years Ended | ||||||||||||||||||||
| December 31, 2023 | December 31, 2022 | Change | ||||||||||||||||||
| ($ in thousands) | ||||||||||||||||||||
| Credit and Liquid Strategies | ||||||||||||||||||||
| Alternative Credit and Other Funds | $ | — | $ | 10,334 | $ | (10,334) | ||||||||||||||
Total Realized Carried Interest (1) | — | 10,334 | (10,334) | |||||||||||||||||
| Incentive Fees | 59,581 | 149,279 | (89,698) | |||||||||||||||||
| Total Realized Performance Income | $ | 59,581 | $ | 159,613 | $ | (100,032) | ||||||||||||||
(1)The above tables exclude any funds for which there was no realized carried interest during the periods presented.
Realized performance income includes (i) realized carried interest from our carry-earning funds and (ii) incentive fees not included in Fee Related Performance Revenues.
Realized carried interest in our Private Equity business line for the year ended December 31, 2023 consisted primarily of (i) realized proceeds from the sale of our investments in AppLovin Corporation (NASADAQ: APP) held by Americas Fund XII and Kokusai Electric Corporation (TYO: 6525) held by Asian Fund III and (ii) performance income from our core investment vehicles. Realized carried interest in our Private Equity business line for the year ended December 31, 2022 consisted primarily of realized proceeds from the sale of our investments in Internet Brands, Inc. (technology sector) and CHI Overhead Doors, Inc. (manufacturing sector) held by North America Fund XI, Fiserv, Inc. held by 2006 Fund, and performance income from our core investment vehicles.
Realized carried interest in our Real Assets business line for the year ended December 31, 2023 consisted primarily of (i) realized proceeds from the sale of our investments in X-Elio Energy, S.L. (infrastructure: power and utilities sector) and Telxius Telecom, S.A.U. (infrastructure: telecommunications software sector), both held by Global Infrastructure Investors II, and (ii) realized proceeds from dividends received and sales of various investments held by Real Estate Partners Americas II. Realized carried interest in our Real Assets business line for the year ended December 31, 2022 consisted primarily of realized proceeds from dividends received and sales of various investments held by Real Estate Partners Americas II.
During the year ended December 31, 2023, there was no realized carried interest earned in our Credit and Liquid Strategies business line. Realized carried interest in our Credit and Liquid Strategies business line for the year ended December 31, 2022, consisted primarily of realized proceeds from the sale of various investments at certain carry paying funds in our leveraged credit strategy.
Incentive fees consist of performance fees earned from (i) our hedge fund partnerships, (ii) investment management agreements with KKR sponsored investment vehicles, and (iii) investment management agreements to provide KKR’s investment strategies to funds managed by a UK investment fund manager.
Incentive fees in our Private Equity business line decreased for the year ended December 31, 2023 compared to the prior period as a result of incentive fees not being earned from certain levered multi-asset investment vehicles in the current period. Incentive fees in our Credit and Liquid Strategies business line decreased for the year ended December 31, 2023 compared to the prior period primarily as a result of a lower level of performance fees earned from our hedge fund partnership, Marshall Wace. During the years ended December 31, 2023 and 2022, there were no incentive fees earned in our Real Assets business line.
Realized Performance Income Compensation
The decrease in realized performance income compensation for the year ended December 31, 2023 compared to the prior period is primarily due to a lower level of compensation recorded in connection with the lower level of realized performance income.
165
Realized Investment Income
The following table presents realized investment income from our Principal Activities business line:
| Years Ended | ||||||||||||||||||||
| December 31, 2023 | December 31, 2022 | Change | ||||||||||||||||||
| ($ in thousands) | ||||||||||||||||||||
| Realized Investment Income | ||||||||||||||||||||
| Net Realized Gains (Losses) | $ | 230,055 | $ | 530,284 | $ | (300,229) | ||||||||||||||
| Interest Income and Dividends, Net | 460,672 | 604,135 | (143,463) | |||||||||||||||||
| Total Realized Investment Income | $ | 690,727 | $ | 1,134,419 | $ | (443,692) | ||||||||||||||
The decrease in realized investment income is primarily due to a lower level of net realized gains and a lower level of interest income and dividends, net. The amount of realized investment income depends on the transaction activity of our funds and our subsidiaries, which can vary from period to period.
For the year ended December 31, 2023, net realized gains were comprised of realized gains primarily from the sale of our investments in AppLovin Corporation, Pembina Gas Infrastructure Inc. (infrastructure: midstream sector), and Resolution Life Group Holdings, L.P. (financial services sector). Partially offsetting these realized gains were realized losses, the most significant of which were (i) a realized loss on our private equity investment, GenesisCare Pty Ltd., (ii) a realized loss on our private equity investment, Envision Healthcare Corporation, and (iii) realized losses from the sales of various revolving credit facilities.
For the year ended December 31, 2022, net realized gains were comprised of realized gains primarily from the sale of our investments in Fiserv, Inc., Internet Brands, Inc., Viridor Limited, and CHI Overhead Doors, Inc. Partially offsetting these realized gains were realized losses, the most significant of which were (i) a realized loss on our alternative credit investment, Hilding Anders International AB, (ii) a realized loss on Magneti Marelli CK Holdings, and (iii) realized losses from the sales of various revolving credit facilities.
For the year ended December 31, 2023, interest income and dividends, net were comprised of (i) interest income primarily from our investments in CLOs and cash, and (ii) dividend income primarily from our investments in Diversified Core Infrastructure Fund, Cegid Group S.A., KREF, KREST, and Crescent.
For the year ended December 31, 2022, interest income and dividends, net were comprised of (i) dividend income primarily from our investments in levered multi-asset investment vehicles, Exact Holdings B.V., Internet Brands, Inc., Pembina Gas Infrastructure Inc., and our real estate investments, including our investment in KPPA and KREF, and (ii) interest income primarily from our investments in CLOs.
Following the KKR Capstone acquisition on January 1, 2020, KKR's after-tax distributable earnings includes the net income (loss) from KKR Capstone within realized investment income (loss). For the year ended December 31, 2023, total fees attributable to KKR Capstone were $100.3 million and total expenses attributable to KKR Capstone were $77.6 million. For KKR Capstone-related adjustments in reconciling asset management segment revenues to GAAP revenues see "—Non-GAAP Balance Sheet Measures—Reconciliations to GAAP Measures."
We expect to realize at least $500.0 million of realized carried interest and realized investment income (loss) in the first half of 2024 from transactions that are pending or closed after December 31, 2023. Some of these transactions are not complete, and are subject to the satisfaction of closing conditions, including regulatory approvals; therefore, there can be no assurance if or when such transactions will be completed. In addition, we may realize gains or losses based on transactions or other events that occur after the date of filing this report, which could impact, positively or negatively, the total amount of our realized performance income from carried interest and realized investment income (loss). Therefore, our actual realized carried interest and realized investment income for the first half of 2024 may be materially higher or lower than $500.0 million.
Realized Investment Income Compensation
The decrease in realized investment income compensation for the year ended December 31, 2023 compared to the prior period is primarily due to a lower level of compensation recorded in connection with the lower level of realized investment income.
166
Operating and Capital Metrics
The following table presents certain key operating and capital metrics as of December 31, 2023 and December 31, 2022:
| As of | ||||||||||||||||||||
| December 31, 2023 | December 31, 2022 | Change | ||||||||||||||||||
| ($ in millions) | ||||||||||||||||||||
| Assets Under Management | $ | 552,801 | $ | 503,897 | $ | 48,904 | ||||||||||||||
| Fee Paying Assets Under Management | $ | 446,408 | $ | 411,923 | $ | 34,485 | ||||||||||||||
| Uncalled Commitments | $ | 98,557 | $ | 107,679 | $ | (9,122) | ||||||||||||||
The following table presents one of our key capital metrics for the years ended December 31, 2023 and 2022:
| Years Ended | ||||||||||||||||||||
| December 31, 2023 | December 31, 2022 | Change | ||||||||||||||||||
| ($ in millions) | ||||||||||||||||||||
| Capital Invested | $ | 44,010 | $ | 71,411 | $ | (27,401) | ||||||||||||||
Assets Under Management
Private Equity
The following table reflects the changes in the AUM of our Private Equity business line from December 31, 2022 to December 31, 2023:
| ($ in millions) | |||||
| December 31, 2022 | $ | 165,147 | |||
| New Capital Raised | 6,901 | ||||
| Distributions and Other | (9,340) | ||||
| Change in Value | 13,669 | ||||
| December 31, 2023 | $ | 176,377 | |||
AUM of our Private Equity business line was $176.4 billion at December 31, 2023, an increase of $11.3 billion, compared to $165.1 billion at December 31, 2022.
The increase was primarily attributable to (i) an appreciation in investment value from Americas Fund XII, Asian Fund III, and our core private equity strategy, and to a lesser extent (ii) new capital raised from private equity vehicles for private wealth investors, Ascendant Fund, and Global Impact Fund II. Partially offsetting the increase was distributions to fund investors primarily as a result of realized proceeds, most notably from Americas Fund XII, our core private equity strategy, and Asian Fund III.
For the year ended December 31, 2023, the value of our traditional private equity investment portfolio increased by 16%. This was comprised of a 63% increase in share prices of publicly held investments and a 10% increase in value of our privately held investments. For the year ended December 31, 2023, the value of our growth equity investment portfolio increased 14% and our core private equity investment portfolio increased 6%.
The most significant increases in share prices of our publicly held investments were increases in AppLovin Corporation, Kokusai Electric Corporation, and BridgeBio Pharma, Inc. These increases were partially offset by decreases in share prices of other publicly held investments, the most significant of which was ZJLD Group Inc. (HKG: 6979). The prices of publicly held companies may experience volatile changes following the reporting period. See "Risk Factors" and "—Business Environment" for more information about the factors, such as volatility, that may impact our business, financial performance, operating results and valuations.
167
The most significant increases in the value of our privately held investments were increases in USI, Inc., Cloudera, Inc. (technology sector), and Exact Holdings B.V. These increases in value on our privately held investments were partially offset by decreases in the value of certain other privately held investments, the most significant of which were Accell Group N.V. (consumer products sector), PetVet Care Centers, LLC, and GenesisCare Pty Ltd. The increased valuations of individual companies in our privately held investments, in the aggregate, generally related to (i) individual company performance, (ii) an increase in the value of market comparables, and (iii) with respect to USI, Inc., an increase in valuation related to a partial sale transaction. The decreased valuations of individual companies in our privately held investments, in the aggregate, relating primarily to challenging market and economic conditions. See "Risk Factors" and "—Business Environment" for more information about the factors that may impact our business, financial performance, operating results and valuation.
Real Assets
The following table reflects the changes in the AUM of our Real Assets business line from December 31, 2022 to December 31, 2023:
| ($ in millions) | |||||
| December 31, 2022 | $ | 118,592 | |||
| New Capital Raised | 15,984 | ||||
| Distributions and Other | (7,112) | ||||
| Redemptions | (311) | ||||
| Change in Value | 3,780 | ||||
| December 31, 2023 | $ | 130,933 | |||
AUM of our Real Assets business line was $130.9 billion at December 31, 2023, an increase of $12.3 billion, compared to $118.6 billion at December 31, 2022.
The increase was primarily attributable to (i) new capital raised from Global Atlantic under our investment management agreements with our insurance companies, infrastructure vehicles for private wealth investors, and Diversified Core Infrastructure Fund, and to a lesser extent (ii) an appreciation in investment value from Global Infrastructure Investors III and Global Infrastructure Investors IV. Partially offsetting the increase were (i) payments to Global Atlantic policyholders, and (ii) distributions to fund investors as a result of realized proceeds, most notably from Global Infrastructure Investors II.
For the year ended December 31, 2023, the value of our infrastructure investment portfolio increased 18%, the value of our opportunistic real estate equity investment portfolio decreased by 2%, and the value of our energy investment portfolio decreased by 7%.
The most significant increases in value across our Real Assets portfolio were increases in FiberCop S.p.A. (infrastructure: telecommunications infrastructure sector), CyrusOne Inc. (infrastructure: asset leasing sector), and Atlantic Aviation FBO Inc. These increases in value were partially offset by decreases in value relating primarily to various assets held in our opportunistic real estate equity investment portfolio and energy portfolio. The increased valuations of individual companies or assets in the aggregate, generally related to (i) individual company or asset performance and (ii) a decrease in interest rates which reduced the cost of capital in our discounted cash flow methodology for certain valuations. The decreased valuations of individual companies or assets in the aggregate, generally related to an increase in capitalization rates and discount rates which generally negatively impacted our real estate equity portfolio, and a decrease in oil and natural gas prices, which generally negatively impact our energy portfolio. The prices of publicly held companies may experience volatile changes following the reporting period. See "Risk Factors" and "—Business Environment" for more information about the factors that may impact our business, financial performance, operating results and valuations.
168
Credit and Liquid Strategies
The following table reflects the changes in the AUM of our Credit and Liquid Strategies business line from December 31, 2022 to December 31, 2023:
| ($ in millions) | |||||
| December 31, 2022 | $ | 220,158 | |||
| New Capital Raised | 46,581 | ||||
| Distributions and Other | (18,237) | ||||
| Redemptions | (8,036) | ||||
| Change in Value | 5,025 | ||||
| December 31, 2023 | $ | 245,491 | |||
AUM of our Credit and Liquid Strategies business line totaled $245.5 billion at December 31, 2023, an increase of $25.3 billion compared to AUM of $220.2 billion at December 31, 2022.
The increase was primarily attributable to (i) new capital raised from Global Atlantic, various private credit funds, and the issuance of CLOs, and to a lesser extent (ii) appreciation in investment value on assets managed by Marshall Wace, and across our leveraged credit and private credit investment funds. Partially offsetting the increase were (i) payments to Global Atlantic policyholders, (ii) distributions to, and redemptions from, fund investors at certain leveraged credit funds, and (iii) redemptions at Marshall Wace.
See also "—Business Environment" for more information about the factors that may impact our business, financial performance, operating results and valuations.
Fee Paying Assets Under Management
Private Equity
The following table reflects the changes in the FPAUM of our Private Equity business line from December 31, 2022 to December 31, 2023:
| ($ in millions) | |||||
| December 31, 2022 | $ | 102,261 | |||
| New Capital Raised | 10,533 | ||||
| Distributions and Other | (5,483) | ||||
| Change in Value | 415 | ||||
| December 31, 2023 | $ | 107,726 | |||
FPAUM of our Private Equity business line was $107.7 billion at December 31, 2023, an increase of $5.4 billion, compared to $102.3 billion at December 31, 2022.
The increase was primarily attributable to new capital raised from private equity vehicles for private wealth investors, our core private equity strategy portfolio, and Ascendant Fund. Partially offsetting the increase was (i) a reduction in FPAUM for the write-off of Envision Healthcare Corporation and GenesisCare Pty. Ltd., (ii) distributions to fund investors primarily as a result of realized proceeds, most notably from Americas Fund XII, and (iii) a reduction in fee base for European Fund III and China Growth Fund, which no longer pay management fees.
Uncalled capital commitments from private equity funds and other investment vehicles from which KKR is currently not earning management fees amounted to approximately $16.5 billion at December 31, 2023, which includes capital commitments reserved for follow-on investments for funds that have completed their investment periods. This capital will generally begin to earn management fees upon deployment of the capital or upon the commencement of the fund's investment period. The average annual management fee rate associated with this capital is approximately 1.0%. The date on which we begin to earn fees (as specified above) is not guaranteed to occur and may not occur for an extended period of time. If and when such management fees are earned, a portion of existing FPAUM may cease paying fees or pay lower fees, thus offsetting a portion of any new management fees earned.
169
Real Assets
The following table reflects the changes in the FPAUM of our Real Assets business line from December 31, 2022 to December 31, 2023:
| ($ in millions) | |||||
| December 31, 2022 | $ | 103,532 | |||
| New Capital Raised | 16,645 | ||||
| Distributions and Other | (6,766) | ||||
| Redemptions | (311) | ||||
| Net Changes in Fee Base of Certain Funds | (805) | ||||
| Change in Value | (41) | ||||
| December 31, 2023 | $ | 112,254 | |||
FPAUM of our Real Assets business line was $112.3 billion at December 31, 2023, an increase of $8.8 billion, compared to $103.5 billion at December 31, 2022.
The increase was primarily attributable to new capital raised from Global Atlantic, Diversified Core Infrastructure Fund, and infrastructure vehicles for private wealth investors. Partially offsetting the increase were (i) payments to Global Atlantic policyholders, (ii) a change in fee base for both Real Estate Partners Europe II and Asia Real Estate Partners as a result of entering their post-investment periods, during which we earn fees on invested capital rather than committed capital, and (iii) distributions to fund investors as a result of realized proceeds, most notably from Global Infrastructure Investors II.
Uncalled capital commitments from real assets investment funds from which KKR is currently not earning management fees amounted to approximately $9.7 billion at December 31, 2023, which includes capital commitments reserved for follow-on investments for funds that have completed their investment periods. This capital will generally begin to earn management fees upon deployment of the capital or upon the commencement of the fund's investment period. The average annual management fee rate associated with this capital is approximately 1.2%. The date on which we begin to earn fees (as specified above) is not guaranteed to occur and may not occur for an extended period of time. If and when such management fees are earned, a portion of existing FPAUM may cease paying fees or pay lower fees, thus offsetting a portion of any new management fees earned.
Credit and Liquid Strategies
The following table reflects the changes in the FPAUM of our Credit and Liquid Strategies business line from December 31, 2022 to December 31, 2023:
| ($ in millions) | |||||
| December 31, 2022 | $ | 206,130 | |||
| New Capital Raised | 43,968 | ||||
| Distributions and Other | (19,619) | ||||
| Redemptions | (8,036) | ||||
| Change in Value | 3,985 | ||||
| December 31, 2023 | $ | 226,428 | |||
FPAUM of our Credit and Liquid Strategies business line was $226.4 billion at December 31, 2023, an increase of $20.3 billion compared to $206.1 billion at December 31, 2022.
The increase was primarily attributable to (i) new capital raised from Global Atlantic, various private credit funds, and the issuance of CLOs, and to a lesser extent (ii) appreciation of the assets managed by Marshall Wace and investments across our leveraged credit and private credit investment funds. Partially offsetting the increase were (i) payments to Global Atlantic policyholders, (ii) distributions to, and redemptions from, fund investors at certain leveraged credit funds, (iii) redemptions at Marshall Wace, and (iv) a reduction in fee base for certain SIG funds, which no longer pay management fees.
170
Uncalled capital commitments from credit investment funds from which KKR is currently not earning management fees amounted to approximately $13.1 billion at December 31, 2023. This capital will generally begin to earn management fees upon deployment of the capital or upon the commencement of the fund's investment period. The average annual management fee rate associated with this capital is approximately 0.7%. The date on which we begin to earn fees (as specified above) is not guaranteed to occur and may not occur for an extended period of time. If and when such management fees are earned, a portion of existing FPAUM may cease paying fees or pay lower fees, thus offsetting a portion of any new management fees earned.
See "Risk Factors" and "—Business Environment" for more information about the factors that may impact our business, financial performance, operating results and valuations.
Uncalled Commitments
Private Equity
As of December 31, 2023, our Private Equity business line had $57.4 billion of remaining uncalled commitments that could be called for investments in new transactions as compared to $65.9 billion as of December 31, 2022. The decrease was primarily attributable to capital called from fund investors to make investments during the period, which was partially offset by new capital commitments from fund investors.
Real Assets
As of December 31, 2023, our Real Assets business line had $24.7 billion of remaining uncalled commitments that could be called for investments in new transactions as compared to $27.5 billion as of December 31, 2022. The decrease was primarily attributable to capital called from fund investors to make investments during the period, which was partially offset by new capital commitments from fund investors.
Credit and Liquid Strategies
As of December 31, 2023, our Credit and Liquid Strategies business line had $16.5 billion of remaining uncalled commitments that could be called for investments in new transactions as compared to $14.3 billion as of December 31, 2022. The increase was primarily attributable to new capital commitments from fund investors, which was partially offset by capital called from fund investors to make investments during the period.
Capital Invested
Private Equity
For the year ended December 31, 2023, $13.5 billion of capital was invested by our Private Equity business line, as compared to $18.8 billion for the year ended December 31, 2022. The decrease was driven primarily by a $6.7 billion decrease in capital invested in our traditional private equity strategy, partially offset by a $2.3 billion increase in capital invested in our core private equity strategy. During the year ended December 31, 2023, 59% of capital deployed in private equity was in transactions in North America, 35% was in Europe, and 6% was in the Asia-Pacific region. The number of large private equity investments made in any quarterly or year-to-date period is volatile and, consequently, a significant amount of capital invested in one period or a few periods may not be indicative of a similar level of capital deployment in future periods.
Real Assets
For the year ended December 31, 2023, $15.5 billion of capital was invested by our Real Assets business line, as compared to $27.8 billion for the year ended December 31, 2022. The decrease was driven primarily by a $6.6 billion decrease in capital invested in our real estate strategy and a $5.5 billion decrease in capital invested in our infrastructure strategy. During the year ended December 31, 2023, 47% of capital deployed in real assets was in transactions in North America, 31% was in Europe, and 22% was in the Asia-Pacific region. The number of large real assets investments made in any quarterly or year-to-date period is volatile and, consequently, a significant amount of capital invested in one period or a few periods may not be indicative of a similar level of capital deployment in future periods.
Credit and Liquid Strategies
For the year ended December 31, 2023, $15.0 billion of capital was invested by our Credit and Liquid Strategies business line, as compared to $24.7 billion for the year ended December 31, 2022. The decrease was primarily due to a lower level of capital deployed in our private credit strategies. During the year ended December 31, 2023, 80% of capital deployed was in transactions in North America, 17% was in Europe, and 3% was in the Asia-Pacific region.
171
Analysis of Insurance Segment Operating Results
Effective January 1, 2023, we adopted new accounting guidance for insurance and reinsurance companies that issue long-duration contracts (“LDTI”) with retrospective application to February 1, 2021, the date of the 2021 GA Acquisition. For a more detailed discussion of the adoption of the LDTI, see Note 2 "Summary of Significant Accounting Policies" in our financial statements.
The following tables set forth information regarding KKR's insurance segment operating results for the years ended December 31, 2023 and 2022:
| Years Ended | |||||||||||||||||
| December 31, 2023 | December 31, 2022 | Change | |||||||||||||||
| ($ in thousands) | |||||||||||||||||
| Net Investment Income | $ | 5,377,817 | $ | 4,112,244 | $ | 1,265,573 | |||||||||||
| Net Cost of Insurance | (3,283,009) | (2,295,133) | (987,876) | ||||||||||||||
| General, Administrative and Other | (805,109) | (638,274) | (166,835) | ||||||||||||||
| Pre-tax Operating Earnings | 1,289,699 | 1,178,837 | 110,862 | ||||||||||||||
| Pre-tax Operating Earnings Attributable to Noncontrolling Interests | (473,062) | (454,075) | (18,987) | ||||||||||||||
| Insurance Segment Operating Earnings | $ | 816,637 | $ | 724,762 | $ | 91,875 | |||||||||||
Insurance Segment Operating Earnings
Insurance segment operating earnings increased for the year ended December 31, 2023 as compared to the year ended December 31, 2022 primarily due to higher net investment income resulting from the increase in the investment portfolio due to the inflows from new business volumes and higher average yields. The increase was offset in part by (i) higher net cost of insurance, primarily due to the growth in both the individual market and institutional market channels and the associated higher funding costs on the new business and the ordinary course run off of older business that was originated in a lower rate environment, and (ii) a corresponding increase in general and administrative expenses.
Net Investment Income
Net investment income increased for the year ended December 31, 2023 as compared to the year ended December 31, 2022 primarily due to (i) increased average assets under management due to growth in assets in the institutional market channel as a result of new reinsurance transactions and individual market channel sales from new business growth, (ii) increases in portfolio yields due to higher market interest rates, and (iii) the benefit in 2023 of rotating into higher yielding assets during 2022. Offsetting these increases to net investment income was a decrease in variable investment income, primarily due to a decrease in net realized gains from the sale of investments not related to asset/liability matching strategies.
Net Cost of Insurance
Net cost of insurance increased for the year ended December 31, 2023 as compared to the year ended December 31, 2022 primarily due to (i) growth in reserves in the institutional market as a result of new reinsurance transactions and in the individual market as a result of new business volumes, and (ii) higher average funding costs due to higher crediting rates and the routine run-off of older business originated in a lower interest rate environment.
General, Administrative and Other Expenses
General and administrative expenses increased for the year ended December 31, 2023 as compared to the year ended December 31, 2022 primarily due to (i) an increase in interest expense on floating rate debt (i.e., Global Atlantic's fixed-to-floating swaps on its fixed rate debt) due to higher market interest rates and higher total debt outstanding, and (ii) increased employee compensation and benefits-related expenses.
172
Pre-tax Operating Earnings Attributable to Noncontrolling Interests
Pre-tax operating earnings attributable to noncontrolling interests increased for the year ended December 31, 2023 as compared to the year ended December 31, 2022 in proportion to the increase in insurance segment operating earnings for the comparable period. Pre-tax operating earnings attributable to noncontrolling interests represent the proportionate interest in the insurance segment operating earnings attributable to third party co-investors in Global Atlantic.
Analysis of Non-GAAP Performance Measures
The following is a discussion of our Non-GAAP performance measures for the years ended December 31, 2023 and 2022:
| Years Ended | ||||||||||||||||||||
| December 31, 2023 | December 31, 2022 | Change | ||||||||||||||||||
| ($ in thousands) | ||||||||||||||||||||
| Asset Management Segment Operating Earnings | $ | 3,369,872 | $ | 3,985,899 | $ | (616,027) | ||||||||||||||
| Insurance Segment Operating Earnings | 816,637 | 724,762 | 91,875 | |||||||||||||||||
| Distributable Operating Earnings | 4,186,509 | 4,710,661 | (524,152) | |||||||||||||||||
| Interest Expense | (357,084) | (315,189) | (41,895) | |||||||||||||||||
| Net Income Attributable to Noncontrolling Interests | (25,950) | (23,200) | (2,750) | |||||||||||||||||
| Income Taxes on Operating Earnings | (763,382) | (859,964) | 96,582 | |||||||||||||||||
| After-tax Distributable Earnings | $ | 3,040,093 | $ | 3,512,308 | $ | (472,215) | ||||||||||||||
Distributable Operating Earnings
The decrease in distributable operating earnings for the year ended December 31, 2023 compared to the prior period was primarily due to a lower level of asset management segment operating earnings partially offset by a higher level of insurance segment operating earnings. For a discussion of the asset management and insurance segment operating earnings, see "—Analysis of Asset Management Segment Operating Results" and "—Analysis of Insurance Segment Operating Results."
After-tax Distributable Earnings
The decrease in after-tax distributable earnings for the year ended December 31, 2023 compared to the prior period was primarily due to a lower level of distributable operating earnings and an increase in interest expense partially offset by a decrease in income taxes on operating earnings.
Interest Expense
The increase in interest expense for the year ended December 31, 2023 compared to the prior period was primarily due to (i) the issuance of fixed rate notes in the current year and (ii) higher market interest rates and higher revolving borrowings outstanding in the current year under the KCM short-term credit facility for use in our capital markets business line.
Income Taxes on Operating Earnings
The decrease in income taxes on operating earnings for the year ended December 31, 2023 compared to the prior period was primarily due to a lower level of asset management segment operating earnings.
For the years ended December 31, 2023 and 2022, the amount of the tax benefit from equity-based compensation included in income taxes on operating earnings was $51.3 million and $65.4 million, respectively. The inclusion of the tax benefit from equity-based compensation in After-tax Distributable Earnings had the effect of increasing this measure by 2% for both periods.
173
Analysis of Asset Management Segment Operating Results
The following tables set forth information regarding KKR's asset management segment operating results for the years ended December 31, 2022 and 2021:
| Years Ended | ||||||||||||||||||||
| December 31, 2022 | December 31, 2021 | Change | ||||||||||||||||||
| ($ in thousands) | ||||||||||||||||||||
| Management Fees | $ | 2,656,487 | $ | 2,071,440 | $ | 585,047 | ||||||||||||||
| Transaction and Monitoring Fees, Net | 775,933 | 1,004,241 | (228,308) | |||||||||||||||||
| Fee Related Performance Revenues | 90,665 | 45,852 | 44,813 | |||||||||||||||||
| Fee Related Compensation | (769,735) | (702,387) | (67,348) | |||||||||||||||||
| Other Operating Expenses | (585,999) | (449,155) | (136,844) | |||||||||||||||||
| Fee Related Earnings | 2,167,351 | 1,969,991 | 197,360 | |||||||||||||||||
| Realized Performance Income | 2,176,658 | 2,141,596 | 35,062 | |||||||||||||||||
| Realized Performance Income Compensation | (1,333,526) | (1,239,177) | (94,349) | |||||||||||||||||
| Realized Investment Income | 1,134,419 | 1,613,244 | (478,825) | |||||||||||||||||
| Realized Investment Income Compensation | (159,003) | (241,994) | 82,991 | |||||||||||||||||
| Asset Management Segment Operating Earnings | $ | 3,985,899 | $ | 4,243,660 | $ | (257,761) | ||||||||||||||
Management Fees
The following table presents management fees by business line:
| Years Ended | ||||||||||||||||||||
| December 31, 2022 | December 31, 2021 | Change | ||||||||||||||||||
| ($ in thousands) | ||||||||||||||||||||
| Management Fees | ||||||||||||||||||||
| Private Equity | $ | 1,188,463 | $ | 967,038 | $ | 221,425 | ||||||||||||||
| Real Assets | 679,890 | 437,102 | 242,788 | |||||||||||||||||
| Credit and Liquid Strategies | 788,134 | 667,300 | 120,834 | |||||||||||||||||
| Total Management Fees | $ | 2,656,487 | $ | 2,071,440 | $ | 585,047 | ||||||||||||||
The increase in Private Equity business line management fees was primarily attributable to a higher level of management fees earned from North America Fund XIII and European Fund VI. The increase was partially offset by a decrease in management fees earned from European Fund V and Americas Fund XII as a result of entering their post-investment periods and, consequently, we now earn fees based on capital invested rather than capital committed and at a lower fee rate. During the fourth quarter of 2022, approximately $11 million of management fees were earned on new capital raised that is retroactive to the start of the fund's investment period.
The increase in Real Assets business line management fees was primarily due to (i) a higher level of management fees earned from Global Infrastructure Investors IV, (ii) an increase in management fees earned from Global Atlantic and (iii) management fees earned on assets managed by KJRM, which we acquired in 2022. These increases were partially offset by a decrease in management fees earned from (i) Real Estate Partners Americas II as a result of a decline in capital invested from investment realizations (of which this investment fund's fee base is invested capital) and (ii) Global Infrastructure Investors III as a result of entering its post-investment period and, consequently, we now earn fees based on capital invested rather than capital committed.
The increase in Credit and Liquid Strategies business line management fees was primarily attributable to (i) an increase in management fees earned from Global Atlantic and (ii) a higher level of management fees earned from FSK.
174
Transaction and Monitoring Fees, Net
The following table presents transaction and monitoring fees, net by business line:
| Years Ended | ||||||||||||||||||||
| December 31, 2022 | December 31, 2021 | Change | ||||||||||||||||||
| ($ in thousands) | ||||||||||||||||||||
| Transaction and Monitoring Fees, Net | ||||||||||||||||||||
| Private Equity | $ | 120,410 | $ | 122,478 | $ | (2,068) | ||||||||||||||
| Real Assets | 33,202 | 20,687 | 12,515 | |||||||||||||||||
| Credit and Liquid Strategies | 22,018 | 14,181 | 7,837 | |||||||||||||||||
| Capital Markets | 600,303 | 846,895 | (246,592) | |||||||||||||||||
| Total Transaction and Monitoring Fees, Net | $ | 775,933 | $ | 1,004,241 | $ | (228,308) | ||||||||||||||
Our Capital Markets business line earns transaction fees, which are not shared with fund investors. The decrease in transaction fees was primarily due to a decrease in the number of capital markets transactions for the year ended December 31, 2022, compared to the year ended December 31, 2021. Overall, we completed 240 capital markets transactions for the year ended December 31, 2022, of which 29 represented equity offerings and 211 represented debt offerings, as compared to 358 transactions for the year ended December 31, 2021, of which 60 represented equity offerings and 298 represented debt offerings. We earned fees in connection with underwriting, syndication and other capital markets services. While each of the capital markets transactions that we undertake in this business line is separately negotiated, our fee rates are generally higher with respect to underwriting or syndicating equity offerings than with respect to debt offerings, and the amount of fees that we earn for similar transactions generally correlates with overall transaction sizes.
Our capital markets fees are generated in connection with our Private Equity, Real Assets, and Credit and Liquid Strategies business lines as well as from third-party companies. For the year ended December 31, 2022, approximately 14% of our transaction fees in our Capital Markets business line were earned from unaffiliated third parties as compared to approximately 23% for the year ended December 31, 2021. Our transaction fees are comprised of fees earned from North America, Europe, and the Asia-Pacific region. For the year ended December 31, 2022, approximately 46% of our transaction fees were generated outside of North America as compared to approximately 38% for the year ended December 31, 2021. Our Capital Markets business line is dependent on the overall capital markets environment, which is influenced by equity prices, credit spreads, and volatility. Our Capital Markets business line does not generate monitoring fees.
Our Private Equity, Real Assets, and Credit and Liquid Strategies business lines separately earn transaction and monitoring fees from portfolio companies, and under the terms of the management agreements with certain of our investment funds, we are required to share all or a portion of such fees with our fund investors. Additionally, transaction fees are generally not earned with respect to energy and real estate investments.
The decrease in our Private Equity business line transaction and monitoring fees, net, was primarily attributable to a lower average transaction fee earned in 2022. During the year ended December 31, 2022, there were 77 transaction fee-generating investments that paid an average fee of $5.3 million compared to 76 transaction fee-generating investments that paid an average fee of $5.5 million during the year ended December 31, 2021. For the year ended December 31, 2022, approximately 46% of Private Equity transaction fees were paid by companies in North America, 31% were paid from companies in the Asia-Pacific region, and 23% were paid from companies in Europe. Transaction fees vary by investment based upon a number of factors, the most significant of which are transaction size, the amount of the fees as set forth in the transaction agreements, the complexity of the transaction, and KKR's role in the transaction.
175
Fee Related Performance Revenues
The following table presents fee related performance revenues by business line:
| Years Ended | ||||||||||||||||||||
| December 31, 2022 | December 31, 2021 | Change | ||||||||||||||||||
| ($ in thousands) | ||||||||||||||||||||
| Fee Related Performance Revenues | ||||||||||||||||||||
| Private Equity | $ | — | $ | — | $ | — | ||||||||||||||
| Real Assets | 51,183 | 9,068 | 42,115 | |||||||||||||||||
| Credit and Liquid Strategies | 39,482 | 36,784 | 2,698 | |||||||||||||||||
| Total Fee Related Performance Revenues | $ | 90,665 | $ | 45,852 | $ | 44,813 | ||||||||||||||
Fee related performance revenues were higher for the year ended December 31, 2022 compared to the prior period primarily due to performance revenues earned from KPPA and KJRM in the current period.
Fee Related Compensation
The increase in fee related compensation for the year ended December 31, 2022 compared to the prior period was primarily due to a higher level of compensation recorded in connection with the higher level of revenues included within fee related earnings.
Other Operating Expenses
The increase in other operating expenses for the year ended December 31, 2022 compared to the prior period was primarily due to (i) a higher level of professional fees, information technology and other administrative costs in connection with the growth of the firm and (ii) an increase in travel related expenses as a result of a return of travel activity to pre-COVID-19 pandemic levels.
Fee Related Earnings
The increase in fee related earnings for the year ended December 31, 2022 compared to the prior period is primarily due to a higher level of management fees from our Private Equity, Real Assets, and Credit and Liquid Strategies business lines and a higher level of fee related performance revenues, partially offset by a lower level of transaction and monitoring fees, net, and a higher level of fee related compensation and other operating expenses, as described above.
Realized Performance Income
The following table presents realized performance income by business line:
| Years Ended | ||||||||||||||||||||
| December 31, 2022 | December 31, 2021 | Change | ||||||||||||||||||
| ($ in thousands) | ||||||||||||||||||||
| Realized Performance Income | ||||||||||||||||||||
| Private Equity | $ | 1,903,580 | $ | 1,678,753 | $ | 224,827 | ||||||||||||||
| Real Assets | 113,465 | 97,312 | 16,153 | |||||||||||||||||
| Credit and Liquid Strategies | 159,613 | 365,531 | (205,918) | |||||||||||||||||
| Total Realized Performance Income | $ | 2,176,658 | $ | 2,141,596 | $ | 35,062 | ||||||||||||||
176
| Years Ended | ||||||||||||||||||||
| December 31, 2022 | December 31, 2021 | Change | ||||||||||||||||||
| ($ in thousands) | ||||||||||||||||||||
| Private Equity | ||||||||||||||||||||
| North America Fund XI | $ | 932,428 | $ | 433,708 | $ | 498,720 | ||||||||||||||
| Core Investment Vehicles | 262,219 | 80,937 | 181,282 | |||||||||||||||||
| 2006 Fund | 231,689 | 219,737 | 11,952 | |||||||||||||||||
| Americas Fund XII | 197,023 | 207,559 | (10,536) | |||||||||||||||||
| Asian Fund III | 104,601 | 387,863 | (283,262) | |||||||||||||||||
| European Fund IV | 86,233 | 186,476 | (100,243) | |||||||||||||||||
| Co-Investment Vehicles and Other | 55,868 | 90,305 | (34,437) | |||||||||||||||||
| Next Generation Technology Growth Fund | — | 32,544 | (32,544) | |||||||||||||||||
| European Fund III | — | 353 | (353) | |||||||||||||||||
Total Realized Carried Interest (1) | 1,870,061 | 1,639,482 | 230,579 | |||||||||||||||||
| Incentive Fees | 33,519 | 39,271 | (5,752) | |||||||||||||||||
| Total Realized Performance Income | $ | 1,903,580 | $ | 1,678,753 | $ | 224,827 | ||||||||||||||
| Years Ended | ||||||||||||||||||||
| December 31, 2022 | December 31, 2021 | Change | ||||||||||||||||||
| ($ in thousands) | ||||||||||||||||||||
| Real Assets | ||||||||||||||||||||
| Real Estate Partners Americas II | $ | 95,772 | $ | — | $ | 95,772 | ||||||||||||||
| Global Infrastructure Investors II | 17,693 | 72,862 | (55,169) | |||||||||||||||||
| Real Estate Partners Europe | — | 18,200 | (18,200) | |||||||||||||||||
| Co-Investment Vehicles and Other | — | 3,283 | (3,283) | |||||||||||||||||
| Global Infrastructure Investors | — | 2,967 | (2,967) | |||||||||||||||||
Total Realized Carried Interest (1) | 113,465 | 97,312 | 16,153 | |||||||||||||||||
| Incentive Fees | — | — | — | |||||||||||||||||
| Total Realized Performance Income | $ | 113,465 | $ | 97,312 | $ | 16,153 | ||||||||||||||
| Years Ended | ||||||||||||||||||||
| December 31, 2022 | December 31, 2021 | Change | ||||||||||||||||||
| ($ in thousands) | ||||||||||||||||||||
| Credit and Liquid Strategies | ||||||||||||||||||||
| Alternative Credit and Other Funds | $ | 10,334 | $ | 15,336 | $ | (5,002) | ||||||||||||||
Total Realized Carried Interest (1) | 10,334 | 15,336 | (5,002) | |||||||||||||||||
| Incentive Fees | 149,279 | 350,195 | (200,916) | |||||||||||||||||
| Total Realized Performance Income | $ | 159,613 | $ | 365,531 | $ | (205,918) | ||||||||||||||
(1)The above tables exclude any funds for which there was no realized carried interest during the periods presented.
Realized performance income includes (i) realized carried interest from our carry earning funds and (ii) incentive fees not included in Fee Related Performance Revenues.
Realized carried interest in our Private Equity business line for the year ended December 31, 2022 consisted primarily of realized proceeds from the sales of our investments in Internet Brands, Inc. and CHI Overhead Doors, Inc. held by North America Fund XI, Fiserv, Inc. held by 2006 Fund, and performance income from our core investment vehicles.
177
Realized carried interest in our Private Equity business line for the year ended December 31, 2021 consisted primarily of realized proceeds from the sales of our investments in Kokusai Electric Corporation, The Bountiful Company (consumer products sector), Ingersoll Rand Inc. (NYSE: IR), Academy Sports & Outdoors Inc. (NASDAQ: ASO), and Endeavor Group Holdings, Inc. (NASDAQ: EDR).
Realized carried interest in our Real Assets business line for the year ended December 31, 2022 consisted primarily of realized proceeds from dividends received and sales of various investments held by Real Estate Partners Americas II.
Realized carried interest in our Real Assets business line for the year ended December 31, 2021 consisted primarily of realized proceeds from (i) the sale of our infrastructure investments, Calisen PLC (LSE: CLSN LN) and Telxius Telecom S.A.U. and (ii) dividends received from and sales of various investments held by Real Estate Partners Europe.
Incentive fees consist of performance fees earned from (i) our hedge fund partnerships, (ii) investment management agreements with KKR sponsored investment vehicles, and (iii) investment management agreements to provide KKR’s investment strategies to funds managed by a UK investment fund manager.
Incentive fees in our Private Equity business line decreased for the year ended December 31, 2022 compared to the prior period as a result of a lower level of incentive fees being earned from assets we manage under a sub-advisory agreement with a UK investment fund manager in 2022. Incentive fees in our Credit and Liquid Strategies business line decreased for the year ended December 31, 2022 compared to the prior period primarily as a result of a lower level of performance fees earned from our hedge fund partnership, Marshall Wace.
Realized Performance Income Compensation
The increase in realized performance income compensation for the year ended December 31, 2022 compared to the prior period is primarily due to a higher level of compensation recorded in connection with the higher level of realized performance income.
Realized Investment Income
The following table presents realized investment income from our Principal Activities business line for the years ended December 31, 2022 and 2021:
| Years Ended | ||||||||||||||||||||
| December 31, 2022 | December 31, 2021 | Change | ||||||||||||||||||
| ($ in thousands) | ||||||||||||||||||||
| Realized Investment Income | ||||||||||||||||||||
| Net Realized Gains (Losses) | $ | 530,284 | $ | 1,199,414 | $ | (669,130) | ||||||||||||||
| Interest Income and Dividends, Net | 604,135 | 413,830 | 190,305 | |||||||||||||||||
| Total Realized Investment Income | $ | 1,134,419 | $ | 1,613,244 | $ | (478,825) | ||||||||||||||
The decrease in realized investment income is primarily due to a lower level of net realized gains, partially offset by a higher level of interest income and dividends, net. The amount of realized investment income depends on the transaction activity of our funds and our subsidiaries, which can vary from period to period.
For the year ended December 31, 2022, net realized gains were comprised of realized gains primarily from the sale of our investments in Fiserv, Inc., Internet Brands, Inc., Viridor Limited, and CHI Overhead Doors, Inc. Partially offsetting these realized gains were realized losses, the most significant of which were (i) a realized loss on our alternative credit investment, Hilding Anders International AB, (ii) a realized loss on Magneti Marelli CK Holdings, and (iii) realized losses from the sales of various revolving credit facilities.
For the year ended December 31, 2021, net realized gains were comprised of realized gains primarily from the sale of our investments in FanDuel Inc., Mr. Cooper Group Inc., Fiserv, Inc., The Bountiful Company, and BridgeBio Pharma Inc. Partially offsetting these realized gains were realized losses, the most significant of which were realized losses on certain hedging instruments.
178
For the year ended December 31, 2022, interest income and dividends, net were comprised of (i) dividend income primarily from levered multi-asset investment vehicles, our investments in Exact Holdings B.V., Internet Brands, Inc. and Pembina Gas Infrastructure Inc., and our real estate investments, including our investment in KPPA and KREF, and (ii) interest income primarily from our investments in CLOs.
For the year ended December 31, 2021, interest income and dividends, net were comprised of (i) dividend income primarily from our real estate investments, including our investment in KREF, as well as our investments in Viridor Limited, Kokusai Electric Corporation, and Arnott's Biscuits Limited and (ii) interest income primarily from our investments in CLOs and, to a lesser extent, our other credit investments. See "—Non-GAAP Balance Sheet Measures."
Following the KKR Capstone acquisition on January 1, 2020, KKR's after-tax distributable earnings includes the net income (loss) from KKR Capstone within realized investment income (loss). For the year ended December 31, 2022, total fees attributable to KKR Capstone were $86.7 million and total expenses attributable to KKR Capstone were $81.7 million. For KKR Capstone-related adjustments in reconciling asset management segment revenues to GAAP revenues see "—Non-GAAP Balance Sheet Measures—Reconciliations to GAAP Measures."
Realized Investment Income Compensation
The decrease in realized investment income compensation for the year ended December 31, 2022 compared to the prior period is primarily due to a lower level of compensation recorded in connection with the lower level of realized investment income.
Operating and Capital Metrics
The following table presents certain key operating and capital metrics as of December 31, 2022 and December 31, 2021:
| As of | ||||||||||||||||||||
| December 31, 2022 | December 31, 2021 | Change | ||||||||||||||||||
| ($ in millions) | ||||||||||||||||||||
| Assets Under Management | $ | 503,897 | $ | 470,555 | $ | 33,342 | ||||||||||||||
| Fee Paying Assets Under Management | $ | 411,923 | $ | 357,389 | $ | 54,534 | ||||||||||||||
| Uncalled Commitments | $ | 107,679 | $ | 111,822 | $ | (4,143) | ||||||||||||||
The following table presents one of our key capital metrics for the years ended December 31, 2022 and 2021::
| Years Ended | ||||||||||||||||||||
| December 31, 2022 | December 31, 2021 | Change | ||||||||||||||||||
| ($ in millions) | ||||||||||||||||||||
| Capital Invested | $ | 71,411 | $ | 73,318 | $ | (1,907) | ||||||||||||||
Assets Under Management
Private Equity
The following table reflects the changes in the AUM of our Private Equity business line from December 31, 2021 to December 31, 2022:
| ($ in millions) | |||||
| December 31, 2021 | $ | 173,745 | |||
| New Capital Raised | 18,087 | ||||
| Distributions and Other | (16,171) | ||||
| Change in Value | (10,514) | ||||
| December 31, 2022 | $ | 165,147 | |||
AUM of our Private Equity business line was $165.1 billion at December 31, 2022, a decrease of $8.6 billion, compared to $173.7 billion at December 31, 2021.
179
The decrease was primarily attributable to (i) distributions to fund investors primarily as a result of realized proceeds, most notably from North America Fund XI, 2006 Fund, and Americas Fund XII, (ii) the liquidation of KKR Acquisition Holdings I, our special purpose acquisition company, and (iii) a decrease in investment value from Americas Fund XII, Asian Fund III, and Asian Fund II. Partially offsetting these decreases was new capital raised from European Fund VI, a new strategic investor partnership investing across multi-strategies, and Next Generation Technology Growth Fund III.
For the year ended December 31, 2022, the value of our traditional private equity investment portfolio decreased by 14%. This was comprised of a 57% decrease in share prices of various publicly held investments and a 1% decrease in value of our privately held investments. For the year ended December 31, 2022, the value of our growth equity investment portfolio decreased 11% and our core private equity investment portfolio increased 7%.
The most significant decreases in share prices of our publicly held investments were decreases in AppLovin Corporation, Max Healthcare Institute Limited (NSE: MAXHEALTH), and GoTo Gojek Tokopedia PT Tbk (IDX: GOTO). These decreases were partially offset by increases in share prices of other publicly held investments, the most significant of which were Hensoldt AG (FRA: HAG) and KnowBe4, Inc. The prices of publicly held companies may experience volatile changes following the reporting period. See "Risk Factors" and "—Business Environment" for more information about the factors, such as volatility, that may impact our business, financial performance, operating results and valuations.
The most significant decreases in the value of our privately held investments were decreases in Kokusai Electric Corporation, OneStream Software, LLC (technology sector), and Unzer GmbH (financial services sector). These decreases in value on our privately held investments were partially offset by increases in the value of certain other privately held investments, the most significant of which were CHI Overhead Doors, Inc., ERM Worldwide Group Limited, and Internet Brands, Inc. The decreased valuations of individual companies in our privately held investments, in the aggregate, generally related to (i) an unfavorable business outlook and (ii) a decrease in the value of market comparables, both influenced by challenging market and economic conditions. The increased valuations of individual companies in our privately held investments, in the aggregate, generally related to (i) individual company performance, (ii) with respect to CHI Overhead Doors, Inc., an increase in valuation reflecting an agreement to exit the investment, which was executed in the period, and (iii) with respect to Internet Brands, Inc. an increase in valuation driven by a partial sale transaction, which was executed in the period. See "Risk Factors and "—Business Environment" for more information about the factors that may impact our business, financial performance, operating results and valuations.
Real Assets
The following table reflects the changes in the AUM of our Real Assets business line from December 31, 2021 to December 31, 2022:
| ($ in millions) | |||||
| December 31, 2021 | $ | 83,303 | |||
| New Capital Raised | 29,244 | ||||
Acquisitions and Other(1) | 13,779 | ||||
| Distributions and Other | (6,369) | ||||
| Change in Value | (1,365) | ||||
| December 31, 2022 | $ | 118,592 | |||
(1)Reflects the AUM of KJRM at closing of $12,730 million and represents an adjustment reflecting a change in the fee base of Global Atlantic's management fees from market value to book value.
AUM of our Real Assets business line was $118.6 billion at December 31, 2022, an increase of $35.3 billion, compared to $83.3 billion at December 31, 2021.
The increase was primarily attributable to (i) assets managed by KJRM, which we acquired in 2022, and (ii) new capital raised from Global Atlantic, Asia Pacific Infrastructure Investors II and Diversified Core Infrastructure Fund. Partially offsetting these increases were payments to Global Atlantic policyholders and distributions to fund investors as a result of realized proceeds, most notably from Global Infrastructure Investors III and Real Estate Partners Americas II. The decrease in investment value was due to the impact of the (i) decline in the value of the Japanese yen associated with assets managed by KJRM and the decline in value of our real estate credit portfolio partially offset by the increase in value across our energy, infrastructure and opportunistic real estate equity investment portfolios.
180
For the year ended December 31, 2022, the value of our energy investment portfolio increased by 18%, the value of our infrastructure investment portfolio increased 5%, and the value of our opportunistic real estate equity investment portfolio increased by 3%.
The most significant increases in the value of our privately held investments related to various assets held in our energy portfolio, Sempra Global, L.P. (Infrastructure: energy and energy transition sector), and Viridor Limited. These increases in value were partially offset by decreases in value relating primarily to Colonial Enterprises, Inc. (infrastructure: midstream sector) and various assets held in our opportunistic real estate equity investment portfolio. The increased valuations of individual companies or assets in our privately held investments, in the aggregate, generally related to individual company or asset performance. The decreased valuations of individual companies or assets in our privately held investments, in the aggregate, generally related to (i) a decrease in the value of market comparables and (ii) an unfavorable business outlook, both relating primarily to challenging market and economic conditions. See "Risk Factors" and "—Business Environment" for more information about the factors that may impact our business, financial performance, operating results and valuations.
The most significant decrease in share prices of our publicly held investments was a decrease in First Gen Corporation (PM: FGEN). The prices of publicly held companies may experience volatile changes following the reporting period. See "Risk Factors" and "— Business Environment" for more information about factors, such as volatility, that may impact our business, financial performance, operating results and valuations.
Credit and Liquid Strategies
The following table reflects the changes in the AUM of our Credit and Liquid Strategies business line from December 31, 2021 to December 31, 2022:
| ($ in millions) | |||||
| December 31, 2021 | $ | 213,507 | |||
| New Capital Raised | 33,883 | ||||
Acquisitions and Other(1) | 7,997 | ||||
| Distributions and Other | (15,854) | ||||
| Redemptions | (6,030) | ||||
| Change in Value | (13,345) | ||||
| December 31, 2022 | $ | 220,158 | |||
(1)Represents an adjustment reflecting a change in the fee base of Global Atlantic's management fees from market value to book value.
AUM of our Credit and Liquid Strategies business line totaled $220.2 billion at December 31, 2022, an increase of $6.7 billion compared to AUM of $213.5 billion at December 31, 2021.
The increase was primarily attributable to (i) new capital raised from Global Atlantic and various alternative and leveraged credit investment vehicles and (ii) the change in fee base for Global Atlantic's management fees from fair market value to book value. Partially offsetting these increases were (i) payments to Global Atlantic policyholders, (ii) redemptions at Marshall Wace, (iii) distributions to fund investors at certain alternative credit funds and (iv) a decline in investment value on the assets managed across our leveraged credit portfolio.
See also "Risk Factors" and "—Business Environment" for more information about the factors that may impact our business, financial performance, operating results and valuations.
181
Fee Paying Assets Under Management
Private Equity
The following table reflects the changes in the FPAUM of our Private Equity business line from December 31, 2021 to December 31, 2022:
| ($ in millions) | |||||
| December 31, 2021 | $ | 87,890 | |||
| New Capital Raised | 20,735 | ||||
| Distributions and Other | (3,887) | ||||
| Net Changes in Fee Base of Certain Funds | (1,573) | ||||
| Change in Value | (904) | ||||
| December 31, 2022 | $ | 102,261 | |||
FPAUM of our Private Equity business line was $102.3 billion at December 31, 2022, an increase of $14.4 billion, compared to $87.9 billion at December 31, 2021.
The increase was primarily attributable to new capital raised from European Fund VI, Next Generation Technology Growth Fund III, and Global Impact Fund II. Partially offsetting this increase were decreases from (i) distributions to fund investors, primarily as a result of realized proceeds, most notably from North America Fund XI and Asian Fund III, and (ii) a change in fee base for European Fund V as a result of entering its post-investment period, during which we earn fees on invested capital rather than committed capital.
Uncalled capital commitments from private equity funds and other investment vehicles from which KKR is currently not earning management fees amounted to approximately $18.6 billion at December 31, 2022, which includes capital commitments reserved for follow-on investments for funds that have completed their investment periods. This capital will generally begin to earn management fees upon deployment of the capital or upon the commencement of the fund's investment period. The average annual management fee rate associated with this capital is approximately 1.0%. The date on which we begin to earn fees (as specified above) is not guaranteed to occur and may not occur for an extended period of time. If and when such management fees are earned, a portion of existing FPAUM may cease paying fees or pay lower fees, thus offsetting a portion of any new management fees earned.
Real Assets
The following table reflects the changes in the FPAUM of our Real Assets business line from December 31, 2021 to December 31, 2022:
| ($ in millions) | |||||
| December 31, 2021 | $ | 66,965 | |||
| New Capital Raised | 32,315 | ||||
Acquisitions and Other(1) | 13,779 | ||||
| Distributions and Other | (4,685) | ||||
| Net Changes in Fee Base of Certain Funds | (1,125) | ||||
| Change in Value | (3,717) | ||||
| December 31, 2022 | $ | 103,532 | |||
(1)Reflects the FPAUM of KJRM at closing of $12,730 million and represents an adjustment reflecting a change in the fee base of Global Atlantic's management fees from market value to book value.
FPAUM of our Real Assets business line was $103.5 billion at December 31, 2022, an increase of $36.5 billion, compared to $67.0 billion at December 31, 2021.
182
The increase was primarily attributable to (i) assets managed by KJRM, which we acquired in 2022, and (ii) new capital raised from Global Atlantic, Asia Pacific Infrastructure Investors II, and Diversified Core Infrastructure Fund. Partially offsetting these increases were (i) payments to Global Atlantic policyholders, (ii) a change in fee base for Asia Pacific Infrastructure Investors as a result of entering its post-investment period, during which we earn fees on invested capital rather than committed capital, and (iii) distributions to fund investors as a result of realized proceeds, most notably from Global Infrastructure Investors III.
Uncalled capital commitments from real assets investment funds from which KKR is currently not earning management fees amounted to approximately $10.3 billion at December 31, 2022, which includes capital commitments reserved for follow-on investments for funds that have completed their investment periods. This capital will generally begin to earn management fees upon deployment of the capital or upon the commencement of the fund's investment period. The average annual management fee rate associated with this capital is approximately 1.2%. The date on which we begin to earn fees (as specified above) is not guaranteed to occur and may not occur for an extended period of time. If and when such management fees are earned, a portion of existing FPAUM may cease paying fees or pay lower fees, thus offsetting a portion of any new management fees earned.
Credit and Liquid Strategies
The following table reflects the changes in the FPAUM of our Credit and Liquid Strategies business line from December 31, 2021 to December 31, 2022:
| ($ in millions) | |||||
| December 31, 2021 | $ | 202,534 | |||
| New Capital Raised | 29,430 | ||||
Acquisitions and Other(1) | 7,997 | ||||
| Distributions and Other | (15,097) | ||||
| Redemptions | (6,030) | ||||
| Change in Value | (12,704) | ||||
| December 31, 2022 | $ | 206,130 | |||
(1)Represents an adjustment reflecting a change in the fee base of Global Atlantic's management fees from market value to book value.
FPAUM of our Credit and Liquid Strategies business line was $206.1 billion at December 31, 2022, an increase of $3.6 billion compared to $202.5 billion at December 31, 2021.
The increase was primarily attributable to (i) new capital raised from Global Atlantic and various alternative and leveraged credit investment vehicles and (ii) the change in fee base for Global Atlantic's management fees from fair market value to book value. Partially offsetting these increases were (i) payments to Global Atlantic policyholders, (ii) redemptions at Marshall Wace, (iii) distributions to fund investors at certain alternative credit funds and (iv) a decline in investment value on the assets managed across our leveraged credit portfolio.
Uncalled capital commitments from investment funds in our Credit and Liquid Strategies business line from which KKR is currently not earning management fees amounted to approximately $10.3 billion at December 31, 2022. This capital will generally begin to earn management fees upon deployment of the capital or upon the commencement of the fund's investment period. The average annual management fee rate associated with this capital is approximately 0.7%. The date on which we begin to earn fees (as specified above) is not guaranteed to occur and may not occur for an extended period of time. If and when such management fees are earned, which will occur over an extended period of time, a portion of existing FPAUM may cease paying fees or pay lower fees, thus offsetting a portion of any new management fees earned.
See "Risk Factors" and "—Business Environment" for more information about the factors that may impact our business, financial performance, operating results and valuations.
183
Uncalled Commitments
Private Equity
As of December 31, 2022, our Private Equity business line had $65.9 billion of remaining uncalled capital commitments that could be called for investments in new transactions as compared to $66.3 billion as of December 31, 2021. The decrease was primarily attributable to capital called from fund investors to make investments during the period, which was partially offset by new capital commitments from fund investors.
Real Assets
As of December 31, 2022, our Real Assets business line had $27.5 billion of remaining uncalled capital commitments that could be called for investments in new transactions as compared to $35.2 billion as of December 31, 2021. The decrease was primarily attributable to capital called from fund investors to make investments during the period, which was partially offset by new capital commitments from fund investors.
Credit and Liquid Strategies
As of December 31, 2022, our Credit and Liquid Strategies business line had $14.3 billion of remaining uncalled capital commitments that could be called for investments in new transactions as compared to $10.3 billion as of December 31, 2021. The increase was primarily attributable to new commitments from fund investors, which was partially offset by capital called from fund investors to make investments during the period.
Capital Invested
Private Equity
For the year ended December 31, 2022, $18.8 billion of capital was invested by our Private Equity business line, as compared to $17.6 billion for the year ended December 31, 2021. The increase was driven primarily by a $2.4 billion increase in capital invested in our traditional private equity strategy, partially offset by a $1.5 billion decrease in capital invested in our core private equity strategy. During the year ended December 31, 2022, 56% of capital deployed in private equity was in transactions in North America, 26% was in the Asia-Pacific region, and 18% was in Europe. The number of large private equity investments made in any quarterly or year-to-date period is volatile and, consequently, a significant amount of capital invested in one period or a few periods may not be indicative of a similar level of capital deployment in future periods.
Real Assets
For the year ended December 31, 2022, $27.8 billion of capital was invested by our Real Assets business line, as compared to $21.4 billion for the year ended December 31, 2021. The increase was driven primarily by a $4.1 billion increase in capital invested in our infrastructure strategy and a $1.6 billion increase in capital invested in our real estate strategy. During the year ended December 31, 2022, 69% of capital deployed in real assets was in transactions in North America, 23% was in Europe, and 8% was in the Asia-Pacific region. The number of large Real Asset investments made in any quarterly or year-to-date period is volatile and, consequently, a significant amount of capital invested in one period or a few periods may not be indicative of a similar level of capital deployment in future periods.
Credit and Liquid Strategies
For the year ended December 31, 2022, $24.7 billion of capital was invested by our Credit and Liquid Strategies business line, as compared to $34.4 billion for the year ended December 31, 2021. The decrease was primarily due to a lower level of capital deployed across our direct lending and SIG strategies. During the year ended December 31, 2022, 87% of capital deployed was in transactions in North America, 9% was in Europe, and 4% was in the Asia-Pacific region.
184
Analysis of Insurance Segment Operating Results
As discussed above, our insurance segment consists solely of the operations of Global Atlantic, which was acquired on February 1, 2021. For the year ended December 31, 2021, the results of our insurance segment is from the acquisition date, February 1, 2021, through December 31, 2021.
The following tables set forth information regarding KKR's insurance segment operating results for the years ended December 31, 2022 and December 31, 2021:
| Years Ended | ||||||||||||||||||||
| December 31, 2022 | December 31, 2021 | Change | ||||||||||||||||||
| ($ in thousands) | ||||||||||||||||||||
| Net Investment Income | $ | 4,112,244 | $ | 3,329,570 | $ | 782,674 | ||||||||||||||
| Net Cost of Insurance | (2,295,133) | (1,564,264) | (730,869) | |||||||||||||||||
| General, Administrative and Other | (638,274) | (500,410) | (137,864) | |||||||||||||||||
| Pre-tax Operating Earnings | 1,178,837 | 1,264,896 | (86,059) | |||||||||||||||||
| Pre-tax Operating Earnings Attributable to Noncontrolling Interests | (454,075) | (489,456) | 35,381 | |||||||||||||||||
| Insurance Segment Operating Earnings | $ | 724,762 | $ | 775,440 | $ | (50,678) | ||||||||||||||
Insurance Segment Operating Earnings
Insurance segment operating earnings decreased for the year ended December 31, 2022 as compared to the year ended December 31, 2021 primarily due to (i) higher net cost of insurance, primarily due to the growth in both Global Atlantic's individual market and institutional market channels and higher funding cost on new business, and (ii) a corresponding increase in general and administrative expenses. The decrease was offset in part by (i) higher net investment income resulting from an increase in average assets under management due to growth of the business, and higher average yields, and (ii) one less month of activity reported in the prior financial reporting period as a result of the 2021 GA Acquisition having occurred on February 1, 2021.
Net Investment Income
Net investment income increased for the year ended December 31, 2022 as compared to the year ended December 31, 2021 primarily due to (i) one less month of activity reported in the prior financial reporting period as a result of the 2021 GA Acquisition having occurred on February 1, 2021, (ii) growth in portfolio yields due to higher market interest rates on floating rate investments, (iii) rotation into higher yielding assets, and (iv) increased average assets under management due to growth in assets in Global Atlantic's institutional market channel as a result of new reinsurance transactions and individual market channel sales from new business growth. Offsetting these increases to net investment income was a decrease in variable investment income, primarily due to the non-recurrence of net realized gains from the sale of investments not related to asset/liability matching strategies, including in particular the disposition of Origis USA, LLC, reported in the prior financial reporting period.
Net Cost of Insurance
Net cost of insurance increased for the year ended December 31, 2022 as compared to the year ended December 31, 2021 primarily due to (i) one less month of activity reported in the prior financial reporting period as a result of the 2021 GA Acquisition having occurred on February 1, 2021, (ii) growth in reserves in the institutional market as a result of new reinsurance transactions and in the individual market as a result of new business volumes, and (iii) higher funding costs on new business originated, and (iv) the impact of assumption review (as described in “—Consolidated Results of Operations (GAAP Basis)—Insurance—Assumption Review” above).
General, Administrative and Other Expenses
General and administrative expenses increased for the year ended December 31, 2022 as compared to the year ended December 31, 2021 primarily due to (i) one less month of activity reported in the prior financial reporting period as a result of the 2021 GA Acquisition having occurred on February 1, 2021, (ii) increased employee compensation and benefits-related expenses, (iii) increased professional service fees, and (iv) increased TPA policy servicing fees, all due to growth of the business.
185
Pre-tax Operating Earnings Attributable to Noncontrolling Interests
Pre-tax operating earnings attributable to noncontrolling interests decreased for the year ended December 31, 2022 as compared to the year ended December 31, 2021 in proportion to the decrease in insurance segment operating earnings for the comparable period. Pre-tax operating earnings attributable to noncontrolling interests represent the proportionate interest in the insurance segment operating earnings attributable to third party investors in Global Atlantic.
Analysis of Non-GAAP Performance Measures
The following is a discussion of our Non-GAAP performance measures for the years ended December 31, 2022 and 2021:
| Years Ended | ||||||||||||||||||||
| December 31, 2022 | December 31, 2021 | Change | ||||||||||||||||||
| ($ in thousands) | ||||||||||||||||||||
| Asset Management Segment Operating Earnings | $ | 3,985,899 | $ | 4,243,660 | $ | (257,761) | ||||||||||||||
| Insurance Segment Operating Earnings | 724,762 | 775,440 | (50,678) | |||||||||||||||||
| Distributable Operating Earnings | 4,710,661 | 5,019,100 | (308,439) | |||||||||||||||||
| Interest Expense | (315,189) | (250,183) | (65,006) | |||||||||||||||||
| Preferred Dividends | — | (19,201) | 19,201 | |||||||||||||||||
| Net Income Attributable to Noncontrolling Interests | (23,200) | (23,664) | 464 | |||||||||||||||||
| Income Taxes on Operating Earnings | (859,964) | (809,962) | (50,002) | |||||||||||||||||
| After-tax Distributable Earnings | $ | 3,512,308 | $ | 3,916,090 | $ | (403,782) | ||||||||||||||
Distributable Operating Earnings
The decrease in distributable operating earnings for the year ended December 31, 2022 compared to the prior period is primarily due to a lower level of asset management segment operating earnings and insurance segment operating earnings. For a discussion of the asset management and insurance segment operating earnings, see "—Analysis of Asset Management Segment Operating Results" and "—Analysis of Insurance Segment Operating Results."
After-tax Distributable Earnings
The decrease in after-tax distributable earnings for the year ended December 31, 2022 compared to the prior period was primarily due to a lower level of distributable operating earnings and an increase in interest expense and income taxes on operating earnings, partially offset by a decrease in preferred dividends.
Interest Expense
The increase in interest expense for the year ended December 31, 2022 compared to the prior period is due primarily to debt issuances by KKR's financing subsidiaries.
Preferred Dividends
The decrease in preferred dividends for the year ended December 31, 2022 compared to the prior period was attributable to the redemption of all of our Series A and B preferred.
Income Taxes on Operating Earnings
The increase in income taxes on operating earnings for the year ended December 31, 2022 compared to the prior period was primarily due to a lower tax benefit from equity-based compensation and an increase in U.S. state and local taxes.
For the years ended December 31, 2022 and 2021, the amount of the tax benefit from equity-based compensation included in income taxes on operating earnings was $65.4 million and $123.1 million, respectively. The inclusion of the tax benefit from equity-based compensation in After-tax Distributable Earnings had the effect of increasing this measure by 2% and 3%, respectively, for the years ended December 31, 2022 and 2021.
186
Non-GAAP Balance Sheet Measures
Book Value
The following table presents our calculation of book value as of December 31, 2023 and December 31, 2022:
| As of | |||||||||||||||||
| December 31, 2023 | December 31, 2022 | ||||||||||||||||
| ($ in thousands) | |||||||||||||||||
| (+) | Cash and Short-term Investments | $ | 5,441,908 | $ | 3,256,515 | ||||||||||||
| (+) | Investments | 18,405,295 | 17,628,327 | ||||||||||||||
| (+) | Net Unrealized Performance Income (1) | 3,375,807 | 2,509,589 | ||||||||||||||
| (+) | Other Assets, Net (2) | 6,498,269 | 6,979,235 | ||||||||||||||
| (+) | Global Atlantic Book Value | 4,988,280 | 4,409,873 | ||||||||||||||
| (-) | Debt Obligations - KKR (excluding KFN and Global Atlantic) | 7,191,020 | 6,957,932 | ||||||||||||||
| (-) | Debt Obligations - KFN | 948,517 | 948,517 | ||||||||||||||
| (-) | Tax Liabilities, Net | 2,101,774 | 1,648,600 | ||||||||||||||
| (-) | Other Liabilities | 913,008 | 911,612 | ||||||||||||||
| (-) | Noncontrolling Interests | 29,936 | 32,843 | ||||||||||||||
| Book Value | $ | 27,525,304 | $ | 24,284,035 | |||||||||||||
| Book Value Per Adjusted Share | $ | 30.95 | $ | 27.27 | |||||||||||||
| Adjusted Shares | 889,469,232 | 890,628,190 | |||||||||||||||
(1)The following table provides net unrealized performance income by business line:
| As of | ||||||||||||||
| December 31, 2023 | December 31, 2022 | |||||||||||||
| ($ in thousands) | ||||||||||||||
| Private Equity Business Line | $ | 2,850,342 | $ | 2,199,869 | ||||||||||
| Real Assets Business Line | 397,593 | 212,974 | ||||||||||||
| Credit and Liquid Strategies Business Line | 127,872 | 96,746 | ||||||||||||
| Total | $ | 3,375,807 | $ | 2,509,589 | ||||||||||
(2)Other Assets, Net include our (i) ownership interest in FS/KKR Advisor, (ii) minority ownership interests in hedge fund partnerships, and (iii) the net assets of KJRM.
Book value increased 13% from December 31, 2022. The increase was primarily attributable to (i) the net appreciation in the value of our investment portfolio, (ii) an increase in net unrealized carried interest, most notably from Americas Fund XII, Asian Fund III, and Global Infrastructure Investors III, and (iii) the positive impact of our after-tax distributable earnings recognized in the period. Partially offsetting these increases were the payment of dividends and repurchases of our common stock during the period. The value of our asset management segment investments increased 12% in the period. For a further discussion, see "—Consolidated Results of Operations (GAAP Basis) - Asset Management—Investment Income (Loss) - Asset Management—Unrealized Gains and Losses from Investment Activities." For a discussion of the changes in our investment portfolio, see "—Analysis of Asset Management Segment Operating Results—Assets Under Management." For a discussion of factors that impacted KKR's after-tax distributable earnings, see "—Analysis of Non-GAAP Performance Measures—After-tax Distributable Earnings" and for more information about the factors that may impact our business, financial performance, operating results and valuations, see "Risk Factors" "—Business Environment."
187
The following table presents the holdings of our investments in the asset management segment by asset class as of December 31, 2023. To the extent investments are realized at values below their cost in future periods, after-tax distributable earnings would be adversely affected by the amount of such loss, if any, during the period in which the realization event occurs.
| As of December 31, 2023 | ||||||||||||||||||||
| ($ in thousands) | ||||||||||||||||||||
Investments (1) | Cost | Fair Value | Fair Value as a Percentage of Total Investments | |||||||||||||||||
| Core Private Equity | $ | 2,864,489 | $ | 6,668,834 | 36.2 | % | ||||||||||||||
| Traditional Private Equity | 1,315,063 | 2,844,147 | 15.5 | % | ||||||||||||||||
| Growth Equity | 410,440 | 1,278,110 | 6.9 | % | ||||||||||||||||
| Private Equity Total | 4,589,992 | 10,791,091 | 58.6 | % | ||||||||||||||||
| Real Estate | 1,816,614 | 1,798,888 | 9.8 | % | ||||||||||||||||
| Infrastructure | 958,432 | 1,170,925 | 6.4 | % | ||||||||||||||||
| Energy | 831,215 | 891,397 | 4.8 | % | ||||||||||||||||
| Real Assets Total | 3,606,261 | 3,861,210 | 21.0 | % | ||||||||||||||||
| Leveraged Credit | 1,346,725 | 1,264,761 | 6.9 | % | ||||||||||||||||
| Alternative Credit | 876,495 | 980,942 | 5.3 | % | ||||||||||||||||
| Credit Total | 2,223,220 | 2,245,703 | 12.2 | % | ||||||||||||||||
| Other | 1,640,134 | 1,507,291 | 8.2 | % | ||||||||||||||||
| Total Investments | $ | 12,059,607 | $ | 18,405,295 | 100.0 | % | ||||||||||||||
(1)Investments is a term used solely for purposes of financial presentation of a portion of KKR's balance sheet and includes majority ownership of subsidiaries that operate KKR's asset management and insurance businesses, including the general partner interests of KKR's investment funds. Investments presented are principally the assets measured at fair value that are held by KKR's asset management segment, which, among other things, does not include the underlying investments held by Global Atlantic and Marshall Wace.
188
| As of December 31, 2023 | ||||||||||||||
| ($ in thousands) | ||||||||||||||
Top 20 Investments: (1) | Cost | Fair Value | ||||||||||||
| USI, Inc. | $ | 833,195 | $ | 1,914,535 | ||||||||||
| PetVet Care Centers, LLC | 355,715 | 1,134,006 | ||||||||||||
| Heartland Dental, LLC | 375,365 | 824,288 | ||||||||||||
| Exact Holding B.V. | 213,362 | 757,336 | ||||||||||||
| Arnott's Biscuits Limited | 250,841 | 533,994 | ||||||||||||
| BridgeBio Pharma, Inc. (NASDAQ: BBIO) | 59,799 | 483,769 | ||||||||||||
| 1-800 Contacts Inc. | 300,178 | 435,095 | ||||||||||||
| Barracuda Networks, Inc. | 432,831 | 432,831 | ||||||||||||
| Roompot B.V. | 349,036 | 420,613 | ||||||||||||
| ERM Worldwide Group Limited | 228,710 | 366,321 | ||||||||||||
| Crescent Energy Company (NYSE: CRGY) | 531,293 | 354,085 | ||||||||||||
| Internet Brands, Inc. | 331,163 | 336,479 | ||||||||||||
| APRIL Group | 280,213 | 331,692 | ||||||||||||
| IVIRMA Global SL | 321,871 | 330,288 | ||||||||||||
| Teaching Strategies, LLC | 307,162 | 307,162 | ||||||||||||
| The Bay Clubs Company, LLC | 257,879 | 274,657 | ||||||||||||
| Shriram General Insurance Co. | 245,470 | 246,689 | ||||||||||||
| FiberCop S.p.A. | 127,742 | 245,665 | ||||||||||||
| Viridor Limited | 131,959 | 209,875 | ||||||||||||
| PortAventura | 155,803 | 196,480 | ||||||||||||
| Total Top 20 Investments | $ | 6,089,587 | $ | 10,135,860 | ||||||||||
(1)This list of investments identifies the twenty largest companies or assets based on their fair values as of December 31, 2023. It does not deduct fund or vehicle level debt, if any, incurred in connection with funding the investment. This list excludes (i) investments expected to be syndicated, (ii) investments expected to be transferred in connection with a new fundraising, (iii) investments in funds and other entities that are owned by one or more third parties and established for the purpose of making investments and (iv) the portion of any investment that may be held through collateralized loan obligations or levered multi-asset investment vehicles, if any. For additional information about the asset classes of the investments held on KKR's balance sheet see "—Our Business—Principal Activities" for the "Holdings by Asset Class" pie chart. The fair value figures include the co-investment and the limited partner and/or general partner interests held by KKR in the underlying investment, if applicable.
With respect to KKR's book value relating to its insurance business, KKR includes Global Atlantic's book value, which consists of KKR's pro rata equity interest in Global Atlantic on a GAAP basis, excluding (i) accumulated other comprehensive income (loss) and (ii) accumulated change in fair value of reinsurance embedded derivative balances and related assets, net of income tax. KKR believes this presentation of Global Atlantic's book value is comparable with the corresponding metric presented by other publicly traded companies in Global Atlantic's industry. As of December 31, 2023, KKR's pro rata interest in Global Atlantic's book value was $5.0 billion. For more information about the composition and credit quality of Global Atlantic's investments on a consolidated basis, please see "—Global Atlantic's Investment Portfolio" below.
189
Global Atlantic's Investment Portfolio
As of December 31, 2023, 96% and 88% of Global Atlantic's available-for-sale ("AFS") fixed maturity securities were considered investment grade under ratings from the Securities Valuation Office of the NAIC and NRSROs, respectively. As of December 31, 2022, 95% and 85% of Global Atlantic's AFS fixed maturity securities were considered investment grade under ratings from NAIC and NRSROs, respectively. Securities where a rating by an NRSRO was not available are considered investment grade if they have an NAIC designation of “1” or “2.” The three largest asset categories in Global Atlantic's AFS fixed-maturity security portfolio as of December 31, 2023 were Corporate securities, residential mortgage-backed securities ("RMBS") and commercial mortgage-backed securities ("CMBS"), comprising 28%, 6% and 5% of Global Atlantic's investment portfolio, respectively. Within these categories, 95%, 96% and 93% of Global Atlantic's Corporate, RMBS and CMBS securities, respectively, were investment grade according to NAIC ratings and 95%, 61% and 56% of its Corporate, RMBS and CMBS securities, respectively, were investment grade according to NRSRO ratings as of December 31, 2023. The three largest asset categories in Global Atlantic's AFS fixed-maturity security portfolio as of December 31, 2022 were Corporate, RMBS and CMBS securities, comprising 29%, 5% and 5% of Global Atlantic's investment portfolio, respectively. Within these categories, 94%, 95% and 95% of Global Atlantic's Corporate, RMBS and CMBS securities, respectively, were investment grade according to NAIC ratings and 94%, 45% and 53% of its Corporate, RMBS and CMBS securities, respectively, were investment grade according to NRSRO ratings as of December 31, 2022. NRSRO and NAIC ratings have different methodologies. Global Atlantic believes the NAIC ratings methodology, which considers the likelihood of recovery of amortized cost as opposed to the recovery of all contractual payments including the principal at par, as the more appropriate way to view the ratings quality of its AFS fixed maturity portfolio since a large portion of its holdings were purchased at a significant discount to par value. The portion of Global Atlantic's investment portfolio consisting of floating rate assets was 27% and 29% as of December 31, 2023 and December 31, 2022, respectively.
Within the funds withheld receivable at interest portfolio, 97% of the fixed maturity securities were investment grade by NAIC designation as of both December 31, 2023 and December 31, 2022.
Trading fixed maturity securities back funds withheld payable at interest where the investment performance is ceded to reinsurers under the terms of the respective reinsurance agreements.
Credit quality of AFS fixed maturity securities
The Securities Valuation Office of the NAIC evaluates the AFS fixed maturity security investments of insurers for regulatory reporting and capital assessment purposes and assigns securities to one of six credit quality categories called “NAIC designations.” Using an internally developed rating is permitted by the NAIC if no rating is available. These designations are generally similar to the credit quality designations of NRSROs for marketable fixed maturity securities, except for certain structured securities as described below. NAIC designations of “1,” highest quality, and “2,” high quality, include fixed maturity securities generally considered investment grade by NRSROs. NAIC designations “3” through “6” include fixed maturity securities generally considered below investment grade by NRSROs.
Consistent with the NAIC Process and Procedures Manual, an NRSRO rating was assigned based on the following criteria: (i) the equivalent S&P rating where the security is rated by one NRSRO; (ii) the equivalent S&P rating of the lowest NRSRO when the security is rated by two NRSROs; and (iii) the equivalent S&P rating of the second lowest NRSRO if the security is rated by three or more NRSROs. If the lowest two NRSROs’ ratings are equal, then such rating will be the assigned rating. NRSROs’ ratings available for the periods presented were S&P, Fitch, Moody’s, DBRS, Inc. and Kroll Bond Rating Agency, Inc. If no rating is available from a rating agency, then an internally developed rating is used.
Substantially all of the AFS fixed maturity securities portfolio, 96% and 95% as of December 31, 2023 and December 31, 2022, respectively, was invested in investment grade assets with a NAIC rating of 1 or 2.
The portion of the AFS fixed maturity securities portfolio that was considered below investment grade by NAIC designation was 4% and 5% as of December 31, 2023 and December 31, 2022, respectively. Pursuant to Global Atlantic's investment guidelines, Global Atlantic actively monitors the percentage of its portfolio that is held in investments rated NAIC 3 or lower and must obtain an additional approval from Global Atlantic's management investment committee before making a significant investment in an asset rated NAIC 3 or lower.
190
Corporate fixed maturity securities
Global Atlantic maintains a diversified portfolio of corporate fixed maturity securities across industries and issuers. As of December 31, 2023 and December 31, 2022, 58% and 59% of the AFS fixed maturity securities portfolio was invested in corporate fixed maturity securities, respectively. As of December 31, 2023 and December 31, 2022, approximately 6% and 5% of the portfolio is denominated in foreign currency, respectively.
As of December 31, 2023 and December 31, 2022, 95% and 94% of the total fair value of corporate fixed maturity securities is rated NAIC investment grade, respectively, and 95% and 94% is rated NRSROs investment grade, respectively.
Residential mortgage-backed securities
As of December 31, 2023 and December 31, 2022, 11% and 10% of the AFS fixed maturity securities portfolio was invested in RMBS, respectively. RMBS are securities constructed from pools of residential mortgages and backed by payments from those pools. Excluding limitations on access to lending and other extraordinary economic conditions, Global Atlantic would expect prepayments of principal on the underlying loans to accelerate with decreases in market interest rates and diminish with increases in market interest rates.
The NAIC designations for RMBS, including prime, sub-prime, alt-A, and adjustable rate mortgages with variable payment options ("Option ARM"), are based upon a comparison of the bond’s amortized cost to the NAIC’s loss expectation for each security. Accordingly, an investment in the same security at a lower cost may result in a higher quality NAIC designation in recognition of the lower likelihood the investment would result in a realized loss. Prime residential mortgage lending includes loans to the most creditworthy borrowers with high quality credit profiles. Alt-A is a classification of mortgage loans where the risk profile of the borrower is between prime and sub-prime, which also includes certain non-qualified mortgages. Sub-prime mortgage lending is the origination of residential mortgage loans to borrowers with weak credit profiles.
As of December 31, 2023 and December 31, 2022, 89% and 90%, respectively, of RMBS securities that are below investment grade as rated by the NRSRO, carry an NAIC 1 ("highest quality") designation, respectively.
As of December 31, 2023, Alt-A, Option ARM, Re-Performing and Sub-prime represent 45%, 21%, 10% and 10% of the total RMBS portfolio ($7.9 billion), respectively. As of December 31, 2022, Alt-A, Option ARM, Re-Performing and Sub-prime represent 31%, 28%, 14% and 12% of the total RMBS portfolio ($6.4 billion), respectively.
Unrealized gains and losses for AFS fixed maturity securities
Global Atlantic's investments in AFS fixed maturity securities are reported at fair value with changes in fair value recorded in other comprehensive income as unrealized gains or losses, net of taxes and offsets. Unrealized gains and losses can be created by changes in interest rates or by changes in credit spreads.
As of December 31, 2023 and December 31, 2022, Global Atlantic had gross unrealized losses on below investment grade AFS fixed maturity securities of $750.3 million and $917.6 million based on NRSRO rating and $267.2 million and $224.9 million based on NAIC ratings, respectively. As of December 31, 2023, unrealized losses were not recognized in net income on these debt securities since Global Atlantic neither intends to sell the securities nor does it believe that it is more likely than not that it will be required to sell these securities before recovery of their cost or amortized cost basis.
Credit quality of mortgage and other loan receivables
Mortgage and other loan receivables consist of commercial and residential mortgage loans, consumer loans and other loan receivables. As of both December 31, 2023 and December 31, 2022, 28% of Global Atlantic's total investments consisted of mortgage and other loan receivables.
Global Atlantic invests in U.S. mortgage loans, comprised of first lien and mezzanine commercial mortgage loans and first lien residential mortgage loans. For Global Atlantic’s commercial mortgage loan portfolio, the most prevalent property type is multi-family residential buildings, which represents over half of the portfolio as of both December 31, 2023 and December 31, 2022. Office and retail properties represent approximately 23% and 28% of the portfolio as of December 31, 2023 and December 31, 2022, respectively.
191
Global Atlantic's commercial mortgage loans are assigned NAIC designations, with designations “CM1” and “CM2” considered to be investment grade. As of December 31, 2023 and December 31, 2022, 89% and 88% of the commercial mortgage loan portfolio were rated investment grade based on NAIC designation, respectively. The payment status of over 98% and over 99% of the commercial mortgage loan portfolio is current as of December 31, 2023 and December 31, 2022, respectively.
The loan-to-value ratio is expressed as a percentage of the current amount of the loan relative to the value of the underlying collateral. As of December 31, 2023 and December 31, 2022, approximately 88% and 84%, respectively, of the commercial mortgage loans have a loan-to-value ratio of 70% or less and for December 31, 2023 and December 31, 2022, 2% and 3% have loan-to-value ratio over 90%, respectively.
Changing economic conditions and updated assumptions affect Global Atlantic’s assessment of the collectibility of commercial mortgage loans. Changing vacancies and rents are incorporated into the analysis that Global Atlantic performs to measure the allowance for credit losses. In addition, Global Atlantic continuously monitors its commercial mortgage loan portfolio to identify risk. Areas of emphasis are properties that have exposure to specific geographic events or have deteriorating credit.
As of December 31, 2023, the payment status of 96% of the residential mortgage loan portfolio is current, and approximately $231.2 million is 90 days or more past due or in process of foreclosure (representing 2% of the total residential mortgage portfolio). As of December 31, 2022, the payment status of 96% of the residential mortgage loan portfolio was current and approximately $192.3 million were 90 days or more past due or in process of foreclosure (representing 2% of the total residential mortgage portfolio).
The weighted average loan-to-value ratio for residential mortgage loans was 63% and 64% as of December 31, 2023 and December 31, 2022, respectively.
Global Atlantic's residential mortgage loan portfolio primarily includes mortgage loans backed by single family rental properties, prime loans and re-performing loans that were purchased at a discount after they were modified and returned to performing status. Global Atlantic has also extended financing to counterparties in the form of repurchase agreements secured by mortgage loans, including performing and non-performing mortgage loans.
Global Atlantic’s consumer loan portfolio is primarily comprised of home improvement loans, residential solar loans, student loans and auto loans. As of December 31, 2023, 97% of the consumer loan portfolio is in current status and approximately $34.8 million is 90 days or more past due or in process of foreclosure (representing 1% of the total consumer loan portfolio).
192
Reconciliations to GAAP Measures
The following tables reconcile the most directly comparable financial measures calculated and presented in accordance with GAAP to KKR's non-GAAP financial measures:
Revenues
| Years Ended | |||||||||||||||||
| December 31, 2023 | December 31, 2022 | December 31, 2021 | |||||||||||||||
| ($ in thousands) | |||||||||||||||||
| Total GAAP Revenues | $ | 14,499,312 | $ | 5,704,180 | $ | 16,226,040 | |||||||||||
| Impact of Consolidation and Other | 861,928 | 841,711 | 808,174 | ||||||||||||||
| Asset Management Adjustments: | |||||||||||||||||
| Capital Allocation-Based Income (Loss) (GAAP) | (2,843,437) | 2,500,509 | (6,842,414) | ||||||||||||||
| Realized Carried Interest | 1,005,759 | 1,993,860 | 1,752,130 | ||||||||||||||
| Realized Investment Income | 690,727 | 1,134,419 | 1,613,244 | ||||||||||||||
| Capstone Fees | (100,314) | (86,665) | (91,407) | ||||||||||||||
| Expense Reimbursements | (75,687) | (102,927) | (178,572) | ||||||||||||||
| Insurance Adjustments: | |||||||||||||||||
| Net Premiums | (1,975,675) | (1,182,461) | (2,226,078) | ||||||||||||||
| Policy Fees | (1,260,249) | (1,261,721) | (1,137,805) | ||||||||||||||
| Other Income | (176,442) | (139,124) | (120,213) | ||||||||||||||
(Gains) Losses from Investments (1) | 700,380 | 472,053 | 544,357 | ||||||||||||||
| Non-operating Changes in Policy Liabilities and Derivatives | (346,963) | 1,072,572 | (141,513) | ||||||||||||||
Total Segment Revenues (2) | $ | 10,979,339 | $ | 10,946,406 | $ | 10,205,943 | |||||||||||
(1)Includes (gains) losses on funds withheld receivables and payables embedded derivatives.
(2)Total Segment Revenues is comprised of (i) Management Fees, (ii) Transaction and Monitoring Fees, Net, (iii) Fee Related Performance Revenues, (iv) Realized Performance Income, (v) Realized Investment Income, and (vi) Net Investment Income.
193
Net Income (Loss) Attributable to KKR & Co. Inc. Common Stockholders
| Years Ended | |||||||||||||||||
| December 31, 2023 | December 31, 2022 | December 31, 2021 | |||||||||||||||
| ($ in thousands) | |||||||||||||||||
| Net Income (Loss) - KKR Common Stockholders (GAAP) | $ | 3,680,514 | $ | (590,664) | $ | 4,626,759 | |||||||||||
| Preferred Stock Dividends | 51,747 | 69,000 | 105,647 | ||||||||||||||
| Net Income (Loss) Attributable to Noncontrolling Interests | 1,624,825 | 104,050 | 7,719,311 | ||||||||||||||
| Income Tax Expense (Benefit) | 1,197,523 | 125,393 | 1,394,882 | ||||||||||||||
| Income (Loss) Before Tax (GAAP) | $ | 6,554,609 | $ | (292,221) | $ | 13,846,599 | |||||||||||
| Impact of Consolidation and Other | (1,569,591) | (394,427) | (5,064,946) | ||||||||||||||
Equity-based Compensation - KKR Holdings(1) | — | 119,834 | 161,283 | ||||||||||||||
| Preferred Stock Dividends | — | — | (19,201) | ||||||||||||||
| Income Taxes on Operating Earnings | (763,382) | (859,964) | (809,962) | ||||||||||||||
| Asset Management Adjustments: | |||||||||||||||||
| Unrealized (Gains) Losses | (1,534,934) | 2,002,082 | (2,590,280) | ||||||||||||||
| Unrealized Carried Interest | (1,656,974) | 4,231,359 | (4,043,135) | ||||||||||||||
| Unrealized Carried Interest Compensation (Carry Pool) | 792,758 | (1,753,396) | 1,751,912 | ||||||||||||||
Strategic Corporate Related Charges(2) | 31,805 | 94,629 | 25,153 | ||||||||||||||
| Equity-based Compensation | 230,858 | 210,756 | 183,100 | ||||||||||||||
| Equity-based Compensation - Performance based | 271,958 | 238,929 | 78,230 | ||||||||||||||
Insurance Adjustments:(3) | |||||||||||||||||
(Gains) Losses from Investments(3)(4) | 363,956 | 379,647 | 352,819 | ||||||||||||||
Non-operating Changes in Policy Liabilities and Derivatives(3) | 228,929 | (584,495) | (39,858) | ||||||||||||||
Strategic Corporate Related Charges(3) | 7,347 | 15,215 | 15,808 | ||||||||||||||
Equity-based and Other Compensation(3) | 71,579 | 93,508 | 58,622 | ||||||||||||||
Amortization of Acquired Intangibles(3) | 11,175 | 10,852 | 9,946 | ||||||||||||||
| After-tax Distributable Earnings | $ | 3,040,093 | $ | 3,512,308 | $ | 3,916,090 | |||||||||||
| Interest Expense | 357,084 | 315,189 | 250,183 | ||||||||||||||
| Preferred Stock Dividends | — | — | 19,201 | ||||||||||||||
| Net Income Attributable to Noncontrolling Interests | 25,950 | 23,200 | 23,664 | ||||||||||||||
| Income Taxes on Operating Earnings | 763,382 | 859,964 | 809,962 | ||||||||||||||
| Distributable Operating Earnings | $ | 4,186,509 | $ | 4,710,661 | $ | 5,019,100 | |||||||||||
| Insurance Segment Operating Earnings | (816,637) | (724,762) | (775,440) | ||||||||||||||
| Realized Performance Income | (1,065,389) | (2,176,658) | (2,141,596) | ||||||||||||||
| Realized Performance Income Compensation | 666,440 | 1,333,526 | 1,239,177 | ||||||||||||||
| Realized Investment Income | (690,727) | (1,134,419) | (1,613,244) | ||||||||||||||
| Realized Investment Income Compensation | 103,590 | 159,003 | 241,994 | ||||||||||||||
| Fee Related Earnings | $ | 2,383,786 | $ | 2,167,351 | $ | 1,969,991 | |||||||||||
| Insurance Segment Operating Earnings | 816,637 | 724,762 | 775,440 | ||||||||||||||
| Realized Performance Income | 1,065,389 | 2,176,658 | 2,141,596 | ||||||||||||||
| Realized Performance Income Compensation | (666,440) | (1,333,526) | (1,239,177) | ||||||||||||||
| Realized Investment Income | 690,727 | 1,134,419 | 1,613,244 | ||||||||||||||
| Realized Investment Income Compensation | (103,590) | (159,003) | (241,994) | ||||||||||||||
| Depreciation and Amortization | 46,727 | 33,809 | 25,940 | ||||||||||||||
| Adjusted EBITDA | $ | 4,233,236 | $ | 4,744,470 | $ | 5,045,040 | |||||||||||
(1)Represents equity-based compensation expense in connection with the allocation of KKR Holdings Units, which were not dilutive to common stockholders of KKR & Co. Inc.
(2)For the year ended December 31, 2022, strategic corporate related charges include a $40.7 million realized loss from foreign exchange derivatives that were entered into in connection with the acquisition of KJRM and that were settled upon closing in the second quarter of 2022.
(3)Amounts represent the portion allocable to KKR & Co. Inc.
(4)Includes (gains) losses on funds withheld receivables and payables embedded derivatives.
194
KKR & Co. Inc. Stockholders' Equity - Common Stock
| As of | |||||||||||
| December 31, 2023 | December 31, 2022 | ||||||||||
| ($ in thousands) | |||||||||||
| KKR & Co. Inc. Stockholders' Equity - Common Stock | $ | 22,858,694 | $ | 17,691,975 | |||||||
| Series C Mandatory Convertible Preferred Stock | — | 1,115,792 | |||||||||
| Impact of Consolidation and Other | 409,663 | 399,318 | |||||||||
| Exchangeable Securities | 221,303 | 128,850 | |||||||||
| Accumulated Other Comprehensive Income (AOCI) and Other (Insurance) | 4,035,644 | 4,948,100 | |||||||||
| Book Value | $ | 27,525,304 | $ | 24,284,035 | |||||||
The following table provides a reconciliation of KKR's GAAP Shares of Common Stock Outstanding to Adjusted Shares:
| As of | |||||||||||
| December 31, 2023 | December 31, 2022 | ||||||||||
| GAAP Shares of Common Stock Outstanding | 885,005,588 | 861,110,478 | |||||||||
| Adjustments: | |||||||||||
Exchangeable Securities (1) | 4,463,644 | 2,695,142 | |||||||||
Common Stock - Series C Mandatory Convertible Preferred Stock (2) | — | 26,822,570 | |||||||||
Adjusted Shares (3) | 889,469,232 | 890,628,190 | |||||||||
Unvested Equity Awards and Exchangeable Securities (4) | 41,660,450 | 35,457,274 | |||||||||
(1)Consists of vested restricted holdings units granted under our 2019 Equity Incentive Plan, which were exchangeable for shares of KKR & Co. Inc. common stock on a one-for-one basis.
(2)Assumes that all shares of Series C Mandatory Convertible Preferred Stock have been converted into shares of KKR & Co. Inc. common stock for any reporting period prior to the redemption of the Series C Mandatory Convertible Preferred Stock.
(3)Amounts exclude unvested equity awards granted under our Equity Incentive Plans.
(4)Represents equity awards granted under our Equity Incentive Plans. Excludes market condition awards that did not meet their market-price based vesting conditions as of December 31, 2023 and December 31, 2022.
Liquidity
We manage our liquidity and capital requirements by (a) focusing on our cash flows before the consolidation of our funds and CFEs and the effect of changes in short term assets and liabilities, which we anticipate will be settled for cash within one year, and (b) seeking to maintain access to sufficient liquidity through various sources. The overall liquidity framework and cash management approach of our insurance business are also based on seeking to build an investment portfolio that is cash flow matched, providing cash inflows from insurance assets that meet our insurance companies' expected cash outflows to pay their liabilities. Our primary cash flow activities typically involve: (i) generating cash flow from operations; (ii) generating income from investment activities, by investing in investments that generate yield (namely interest and dividends), as well as through the sale of investments and other assets; (iii) funding capital commitments that we have made to, and advancing capital to, our funds and CLOs; (iv) developing and funding new investment strategies, investment products, and other growth initiatives, including acquisitions of other investments, assets, and businesses; (v) underwriting and funding capital commitments in our capital markets business; (vi) distributing cash flow to our stockholders and any holders of our preferred stock, if any; and (vii) paying borrowings, interest payments, and repayments under credit agreements, our senior and subordinated notes, and other borrowing arrangements. See "—Liquidity," "—Liquidity Needs" and "—Dividends and Stock Repurchases."
See "Risk Factors" and "—Business Environment" for more information on factors that may impact our business, financial performance, operating results and valuations.
195
Sources of Liquidity
Our primary sources of liquidity consist of amounts received from: (i) our operating activities, including the fees earned from our funds, portfolio companies, and capital markets transactions; (ii) realizations on carried interest from our investment funds; (iii) interest and dividends from investments that generate yield, including our investments in CLOs; (iv) in our insurance business, cash inflows in respect of new premiums, policyholder deposits, reinsurance transactions and funding agreements, including through memberships in FHLBs; (v) realizations on and sales of investments and other assets, including the transfers of investments or other assets for fund formations (including CLOs and other investment vehicles); and (vi) borrowings, including advances under our revolving credit facilities, debt offerings, repurchase agreements, and other borrowing arrangements. In addition, we may generate cash proceeds from issuances of our or our subsidiaries' equity securities.
Many of our investment funds like our private equity and real assets funds provide for carried interest. With respect to our carry-paying investment funds, carried interest is eligible to be distributed to the general partner of the fund only after all of the following are met: (i) a realization event has occurred (e.g., sale of a portfolio company, dividend, etc.); (ii) the vehicle has achieved positive overall investment returns since its inception, in excess of performance hurdles where applicable, and is accruing carried interest; and (iii) with respect to investments with a fair value below cost, cost has been returned to fund investors in an amount sufficient to reduce remaining cost to the investments' fair value. Even after all of the preceding conditions are met, the general partner of the fund may, in its sole discretion, decide to defer the distribution of carried interest to it to a later date. In addition, these funds generally include what is called a “clawback” provision, which provides that the general partner must return any carried interest that is paid in excess of what the general partner is entitled to receive at the end of the term of the fund, as discussed further below.
As of December 31, 2023, certain of our investment funds had met the first and second criteria, as described above, but did not meet the third criteria. In these cases, carried interest accrues on the consolidated statement of operations, but will not be distributed in cash to us as the general partner of an investment fund upon a realization event. For a fund that has a fair value above cost, overall, and is otherwise accruing carried interest, but has one or more investments where fair value is below cost, the shortfall between cost and fair value for such investments is referred to as a "netting hole." When netting holes are present, realized gains on individual investments that would otherwise allow the general partner to receive carried interest distributions are instead used to return invested capital to our funds' limited partners in an amount equal to the netting hole. Once netting holes have been filled with either (a) return of capital equal to the netting hole for those investments where fair value is below cost or (b) increases in the fair value of those investments where fair value is below cost, then realized carried interest will be distributed to the general partner upon a realization event. A fund that is in a position to pay cash carry refers to a fund for which carried interest is expected to be paid to the general partner upon the next material realization event, which includes funds with no netting holes as well as funds with a netting hole that is sufficiently small in size such that the next material realization event would be expected to result in the payment of carried interest. Strategic investor partnerships with fund investors may require netting across the various funds in which they invest, which may reduce the carried interest we otherwise would have earned if such fund investors were to have invested in our funds without the existence of the strategic investor partnership.
As of December 31, 2023, netting holes in excess of $50 million existed at European Fund V, Asian Fund III, and Health Care Strategic Growth Fund in the amounts of $105 million, $97 million, and $73 million, respectively. In accordance with the criteria set forth above, other funds currently have and may in the future develop netting holes, and netting holes for those and other funds may otherwise increase or decrease in the future. There are also investment funds that are not accruing carried interest and do not have a netting hole although they may be in a clawback position. If the investment fund has distributed carried interest, but subsequently does not have sufficient value to provide for the distribution of carried interest at the end of the life of the investment fund, the general partner is typically required to return previously distributed carried interest to the fund investors. Although our current and former employees who received distributions of carried interest subject to clawback are required to return them to KKR, it is KKR’s obligation to return carried interest subject to clawback to the fund investors. As of December 31, 2023, approximately $546 million of carried interest was subject to this clawback obligation, assuming that all applicable carry-paying funds and their alternative investment vehicles were liquidated at their December 31, 2023 fair values. As of December 31, 2023, Asian Fund II is the only investment fund with a clawback obligation in excess of $50 million. See Note 24 "Commitments and Contingencies—Contingent Repayment Guarantees" in our financial statements included elsewhere in this report for further information. See also the negative amounts included in the Carried Interest column in the table included in this Item 7 in “Asset Management—Private Equity” for further information on clawback obligations.
We have access to funding under various credit facilities, other borrowing arrangements and other sources of liquidity that we have entered into with major financial institutions or which we receive from the capital markets.
196
For a discussion of our debt obligations, including our debt securities, revolving credit agreements and loans, see Note 16 "Debt Obligations" in our financial statements.
Liquidity Needs
We expect that our (including Global Atlantic's) primary liquidity needs will consist of cash required to meet various obligations, including, without limitation, to:
•continue to support and grow our asset management business, including seeding new investment strategies, supporting capital commitments made by our vehicles to existing and future funds, co-investments and any net capital requirements of our capital markets companies and otherwise supporting the investment vehicles that we sponsor;
•continue to support and grow our insurance business;
•grow and expand our businesses generally, including by acquiring or launching new, complementary or adjacent businesses;
•warehouse investments in portfolio companies or other investments for the benefit of one or more of our funds, accounts or CLOs or other investment vehicles pending the contribution of committed capital by the fund investors in such vehicles, and advancing capital to them for operational or other needs;
•service debt obligations including the payment of obligations at maturity, on interest payment dates or upon redemption, as well as any contingent liabilities, including from litigation, that may give rise to future cash payments, including funding requirements to levered investment vehicles or structured transactions;
•fund cash operating expenses and contingencies, including for litigation matters and guarantees;
•pay corporate income taxes and other taxes;
•pay policyholders and amounts in our insurance business related to investment, reinvestment, reinsurance or funding agreement activity;
•pay amounts that may become due under our tax receivable agreement;
•pay cash dividends in accordance with our dividend policy for our common stock or the terms of our preferred stock, if any;
•underwrite commitments, advance loan proceeds and fund syndication commitments within our capital markets business;
•post or return collateral in respect of derivative contracts;
•acquire other assets (including businesses, investments and other assets) for our businesses, some of which may be required to satisfy regulatory requirements for our capital markets business or risk retention requirements for CLOs (to the extent they may apply);
•address capital needs of regulated subsidiaries as well as non-regulated subsidiaries; and
•repurchase shares of our common stock or retire equity awards pursuant to the share repurchase program or repurchase or redeem other securities issued by us.
For a discussion of KKR's share repurchase program, see Note 22 "Equity" in our financial statements.
Capital Commitments
The agreements governing our active investment funds generally require the general partners of the funds to make minimum capital commitments to such funds, which generally range from 2% to 8% of a fund's total capital commitments at final closing, but may be greater for certain funds (i) where we are pursuing newer strategies, (ii) where third party investor demand is limited, and (iii) where a larger commitment is consistent with the asset allocation strategy in our Principal Activities business line, including core investments and exposure to the Asia-Pacific region.
197
The following table presents our uncalled commitments to our active investment funds and other vehicles as of December 31, 2023:
| Uncalled Commitments | |||||
| Private Equity | ($ in millions) | ||||
| Core Investment Vehicles | $ | 3,066 | |||
| Ascendant Fund | 312 | ||||
| European Fund VI | 146 | ||||
| Health Care Strategic Growth Fund II | 90 | ||||
| Asian Fund IV | 84 | ||||
| North America Fund XIII | 80 | ||||
| Next Generation Technology Growth Fund III | 21 | ||||
| Global Impact Fund II | 17 | ||||
| Other Private Equity Vehicles | 938 | ||||
| Total Private Equity Commitments | 4,754 | ||||
| Real Assets | |||||
| Asia Pacific Infrastructure Investors II | 342 | ||||
| Real Estate Partners Americas III | 80 | ||||
| Asia Real Estate Partners | 63 | ||||
| Real Estate Partners Europe II | 63 | ||||
| Global Infrastructure Investors IV | 17 | ||||
| Other Real Assets Vehicles | 1,330 | ||||
| Total Real Assets Commitments | 1,895 | ||||
| Credit and Liquid Strategies | |||||
| Opportunities Fund II | 116 | ||||
| Asia Credit Opportunities | 94 | ||||
| Dislocation Opportunities Fund | 69 | ||||
| Asset-Based Finance Partners | 68 | ||||
| Lending Partners IV | 16 | ||||
| Lending Partners Europe II | 16 | ||||
| Private Credit Opportunities Partners II | 7 | ||||
| Other Credit and Liquid Strategies Vehicles | 633 | ||||
| Total Credit and Liquid Strategies Commitments | 1,019 | ||||
| Total Uncalled Commitments | $ | 7,668 | |||
Other Commitments
In addition to the uncalled commitments to our investment funds as shown above, KKR has entered into contractual commitments primarily with respect to underwriting transactions, debt financing, revolving credit facilities, and equity syndications in our Capital Markets business line. As of December 31, 2023, these commitments amounted to $0.3 billion.
Whether these amounts are actually funded, in whole or in part, depends on the contractual terms of such commitments, including the satisfaction or waiver of any conditions to closing or funding. Our capital markets business has arrangements with third parties, which reduce our risk under certain circumstances when underwriting certain debt transactions, and thus our unfunded commitments as of December 31, 2023 have been reduced to reflect the amount to be funded by such third parties. In the case of purchases of investments or assets in our Principal Activities business line, the amount to be funded includes amounts that are intended to be syndicated to third parties, and the actual amounts to be funded may be less. For more information about our Capital Markets business line's risks, see "Risk Factors—Risks Related to Our Business—Our capital markets activities expose us to material risks" in this report.
198
From time to time, we fund various underwriting, syndication and fronting commitments in our capital markets business in connection with the arranging or underwriting of loans, securities or other financial instruments, for which we may draw all or substantially all of our availability for borrowings under our available credit facilities. We generally expect these borrowings by our capital markets business to be repaid promptly as these commitments are syndicated to third parties or otherwise fulfilled or terminated, although we may in some instances elect to retain a portion of the commitments for our own investment. For more information about our capital markets business risks, see "Risk Factors—Risks Related to Our Business—Our capital markets activities expose us to material risks" in this report.
Tax Receivable Agreement
On May 30, 2022, KKR terminated the tax receivable agreement with KKR Holdings other than with respect to exchanges of KKR Holdings Units completed prior to such date. As of December 31, 2023, an undiscounted payable of $406.7 million has been recorded in due to affiliates in the financial statements representing management's best estimate of the amounts currently expected to be owed for certain exchanges of KKR Holdings Units that took place prior to the termination of the tax receivable agreement. As of December 31, 2023, approximately $76.7 million of cumulative cash payments have been made under the tax receivable agreement since inception.
Dividends and Stock Repurchases
A dividend of $0.165 per share of our common stock has been declared and will be paid on March 1, 2024 to holders of record of our common stock as of the close of business on February 16, 2024.
On September 15, 2023, each outstanding share of the Series C Mandatory Convertible Preferred Stock automatically converted into 1.1700 shares of common stock, subject to cash being paid to holders in lieu of fractional shares, as applicable. In addition, a dividend of $0.75 per share of Series C Mandatory Convertible Preferred Stock was paid on September 15, 2023 to holders of record of Series C Mandatory Convertible Preferred Stock as of the close of business on September 1, 2023.
When KKR & Co. Inc. receives distributions from KKR Group Partnership, holders of exchangeable securities receive their pro rata share of such distributions from KKR Group Partnership.
The declaration and payment of dividends to our common stockholders will be at the sole discretion of our Board of Directors, and our dividend policy may be changed at any time. We announced on February 6, 2024 that our current dividend policy will be to pay dividends to holders of our common stock in an annual aggregate amount of $0.70 per share (or a quarterly dividend of $0.175 per share) beginning with the dividend to be announced with the results of the quarter ending March 31, 2024. The declaration of dividends is subject to the discretion of our Board of Directors based on a number of factors, including KKR’s future financial performance and other considerations that the Board of Directors deems relevant, and compliance with the terms of KKR & Co. Inc.'s certificate of incorporation and applicable law. For U.S. federal income tax purposes, any dividends we pay (including dividends on our preferred stock) generally will be treated as qualified dividend income for U.S. individual stockholders to the extent paid out of our current or accumulated earnings and profits, as determined for U.S. federal income tax purposes. There can be no assurance that future dividends will be made as intended or at all or that any particular dividend policy for our common stock will be maintained. Furthermore, the declaration and payment of distributions by KKR Group Partnership and our other subsidiaries may also be subject to legal, contractual and regulatory restrictions, including restrictions contained in our debt agreements.
Since 2015, KKR has repurchased, or retired equity awards representing, a total of 91.9 million shares of common stock for $2.5 billion, which equates to an average price of $27.32 per share. For further information, see "Part II—Item 5—Market for Registrant's Common Equity, Related Stockholder Matters and Issuer Purchases of Equity Securities."
Contractual Obligations, Commitments and Contingencies
In the ordinary course of business, we (including Global Atlantic) and our consolidated funds and CFEs enter into contractual arrangements that may require future cash payments. Contractual arrangements include (1) commitments to fund the purchase of investments or other assets (including obligations to fund capital commitments as the general partner of our investment funds) or to fund collateral for derivative transactions or otherwise, (2) obligations arising under our senior notes, subordinated notes, and other indebtedness, (3) commitments by our capital markets business to underwrite transactions or to lend capital, (4) obligations arising under insurance policies written, (5) other contractual obligations, including servicing agreements with third-party administrators for insurance policy administration, and (6) commitments to fund the business, operations or investments of our subsidiaries. In addition, we may incur contingent liabilities for claims that may be made against us in the future. For more information about these contingent liabilities, please see Note 24 "Commitments and Contingencies" in our financial statements.
199
The following table sets forth information relating to anticipated future cash payments as of December 31, 2023 excluding consolidated funds and CFEs with a reconciliation of such amounts to anticipated future cash payments by us (including Global Atlantic) and our consolidated funds and CFEs.
| Payments due by Period | ||||||||||||||||||||||||||||||||
| Types of Contractual Obligations | <1 Year | 1-3 Years | 3-5 Years | >5 Years | Total | |||||||||||||||||||||||||||
| ($ in millions) | ||||||||||||||||||||||||||||||||
| Asset Management | ||||||||||||||||||||||||||||||||
Uncalled commitments to investment funds (1) | $ | 7,668.0 | $ | — | $ | — | $ | — | $ | 7,668.0 | ||||||||||||||||||||||
Debt payment obligations (2) | — | 35.5 | 575.1 | 7,470.9 | 8,081.5 | |||||||||||||||||||||||||||
Interest obligations on debt payment obligations (3) | 355.5 | 590.0 | 582.7 | 3,877.1 | 5,405.3 | |||||||||||||||||||||||||||
Underwriting commitments (4) | 19.9 | — | — | — | 19.9 | |||||||||||||||||||||||||||
Lending commitments (5) | 192.3 | — | — | — | 192.3 | |||||||||||||||||||||||||||
Purchase commitments (6) | 68.6 | — | — | — | 68.6 | |||||||||||||||||||||||||||
| Lease obligations | 56.0 | 99.8 | 60.5 | 203.3 | 419.6 | |||||||||||||||||||||||||||
Insurance (7) | ||||||||||||||||||||||||||||||||
Policy liabilities (8) | 17,018.5 | 33,917.3 | 29,888.6 | 111,065.0 | 191,889.4 | |||||||||||||||||||||||||||
Debt payment obligations (9) | — | 200.0 | — | 2,550.0 | 2,750.0 | |||||||||||||||||||||||||||
Interest obligations on debt payment obligations (10) | 145.0 | 295.0 | 303.0 | 1,623.0 | 2,366.0 | |||||||||||||||||||||||||||
Purchase and lease commitments (11) | 58.7 | 88.3 | 54.7 | 363.5 | 565.2 | |||||||||||||||||||||||||||
| Total Contractual Obligations of KKR | $ | 25,582.5 | $ | 35,225.9 | $ | 31,464.6 | $ | 127,152.8 | $ | 219,425.8 | ||||||||||||||||||||||
(+) Uncalled commitments of consolidated funds (12) | 17,746.4 | — | — | — | 17,746.4 | |||||||||||||||||||||||||||
(+) Debt payment obligations of consolidated funds, CFEs and Other (13) | 3,127.4 | 1,447.3 | 1,510.9 | 30,630.6 | 36,716.2 | |||||||||||||||||||||||||||
(+) Corporate real estate borrowings (14) | 490.0 | — | — | — | 490.0 | |||||||||||||||||||||||||||
(+) Interest obligations of consolidated funds, CFEs and Other (15) | 2,402.1 | 4,173.8 | 3,958.3 | 8,123.9 | 18,658.1 | |||||||||||||||||||||||||||
| Total Consolidated Contractual Obligations | $ | 49,348.4 | $ | 40,847.0 | $ | 36,933.8 | $ | 165,907.3 | $ | 293,036.5 | ||||||||||||||||||||||
(1)These uncalled commitments represent amounts committed by us to fund a portion of the purchase price paid for each investment made by our investment funds which are actively investing. Because capital contributions are due on demand, the above commitments have been presented as falling due within one year. However, given the size of such commitments and the pace at which our investment funds make investments, we expect that the capital commitments presented above will be called over a period of several years. See "—Liquidity Needs" and Note 16 "Debt Obligations" in our financial statements.
(2)Amounts include senior notes and subordinated notes issued by KKR and its subsidiaries. KFN's debt obligations are non-recourse to KKR beyond the assets of KFN.
(3)These interest obligations on debt represent estimated interest to be paid over the term of the related debt obligation, which has been calculated assuming the debt outstanding at December 31, 2023 is not repaid until its maturity. Future interest rates are assumed to be those in effect as of December 31, 2023, including both variable and fixed rates, as applicable, provided for by the relevant debt agreements. The amounts presented above include accrued interest on outstanding indebtedness.
(4)Represents various commitments in our capital markets business in connection with the underwriting of loans, securities and other financial instruments. These commitments are shown net of amounts syndicated.
(5)Represents obligations in our capital markets business to lend under various revolving credit facilities.
(6)Represents commitments of KKR's asset management business line including KFN to fund the purchase of various investments.
(7)Global Atlantic has other obligations related to collateral payable held for derivative instruments ($45.1 million) and outstanding commitments to make investments in commercial mortgage loans, other lending facilities and other investments ($4.2 billion) which have not been included in the above table as the exact timing of these payments cannot be estimated. Global Atlantic's debt obligations are non-recourse to KKR beyond the assets of Global Atlantic.
(8)Policy liabilities for insurance obligations consist of amounts required to meet future obligations for future policy benefits and policy account balances. Amounts presented in the table represent estimated cash payments under such contracts, including significant assumptions related to the receipt of future premiums, mortality, lapse, renewal, withdrawal, and annuitization comparable with actual experience. These assumptions also include market growth and policy crediting. All estimated cash payments are not discounted to present value. Accordingly, the total of cash flows presented for all years of $191.9 billion significantly exceeds total policy liabilities of $160.1 billion recorded on the statements of financial condition as of December 31, 2023. Estimated cash payments are also presented gross of reinsurance. Due to the significance of the assumptions used, the amounts presented could differ materially from actual results.
(9)The payments due by period for debt obligations reflect the contractual maturities of principal.
(10)Reflects estimated future interest payments. Future interest on variable rate debt (which includes borrowing under Global Atlantic's revolving credit facility and the subordinated debentures) was computed using prevailing rates as of December 31, 2023 and, as such, does not consider the impact of future rate movements. Future interest on fixed rate debt was computed using the stated rate on the obligations.
200
(11)Reflects operational servicing agreements with third-party administrators for policy administration.
(12)Represents uncalled commitments of our consolidated funds excluding KKR's portion of uncalled commitments as the general partner of the respective funds. Because capital contributions are due on demand, the above commitments have been presented as falling due within one year. However, given the size of such commitments and the pace at which our investment funds make investments, we expect that the capital commitments presented above will be called over a period of several years. See "—Liquidity Needs" and Note 16 "Debt Obligations" in our financial statements.
(13)Amounts include (i) financing arrangements entered into by our consolidated funds with the objective of providing liquidity to the funds of $8.5 billion, (ii) debt securities issued by our consolidated CLOs of $25.3 billion and (iii) borrowings collateralized by fund investments, fund co-investments and other assets held by levered investment vehicles of $2.9 billion. Debt securities issued by consolidated CLO entities are supported solely by the investments held at the CLO vehicles and are not collateralized by assets of any other KKR entity. Borrowings by levered investment vehicles are supported solely by the investments held at the investment vehicles and are not collateralized by assets of any other KKR entity. Obligations under financing arrangements entered into by our consolidated funds are generally limited to our pro rata equity interest in such funds. Our management companies bear no obligations to repay any financing arrangements at our consolidated funds.
(14)Represents a debt obligation in connection with the ownership of KKR office space.
(15)The interest obligations on debt of our CFEs and other borrowings represent estimated interest to be paid over the term of the related debt obligation, which has been calculated assuming the debt outstanding at December 31, 2023 is not repaid until its maturity. Future interest rates are assumed to be those in effect as of December 31, 2023, including both variable and fixed rates, as applicable, provided for by the relevant debt agreements. The amounts presented above include accrued interest on outstanding indebtedness.
The commitment table above excludes contractual amounts owed under the tax receivable agreement because the ultimate amount and timing of the amounts due are not presently known. See "—Liquidity Needs—Tax Receivable Agreement" in this report and "Risk Factors—Risks Related to Our Organizational Structure—We will be required to pay certain principals for most of the benefits relating to our use of tax attributes we receive from historical exchanges of our common stock for KKR Group Partnership Units" in this report.
Off Balance Sheet Arrangements
We do not have any off-balance sheet financings or liabilities other than contractual commitments and other legal contingencies incurred in the normal course of our business.
Critical Accounting Policies and Estimates
The preparation of our financial statements in accordance with GAAP requires our management to make estimates and judgments that affect the reported amounts of assets and liabilities, disclosure of contingent assets and liabilities, and reported amounts of fees, capital allocation-based income (loss), expenses, investment income, and income taxes. Our management bases these estimates and judgments on available information, historical experience and other assumptions that we believe are reasonable under the circumstances. However, these estimates, judgments and assumptions are often subjective and may be impacted negatively based on changing circumstances or changes in our analyses. If actual amounts are ultimately different from those estimated, judged or assumed, revisions are included in the financial statements in the period in which the actual amounts become known. We believe our critical accounting policies could potentially produce materially different results if we were to change underlying estimates, judgments or assumptions.
For a further discussion about our critical accounting policies, see Note 2 "Summary of Significant Accounting Policies" in our financial statements included in this report.
Basis of Accounting
We consolidate the financial results of KKR Group Partnership and its consolidated entities, which include the accounts of our investment advisers, broker-dealers, Global Atlantic’s insurance companies, the general partners of certain unconsolidated investment funds, general partners of consolidated investment funds and their respective consolidated investment funds and certain other entities including CFEs.
When an entity is consolidated, we reflect the accounts of the consolidated entity, including its assets, liabilities, revenues, expenses, investment income, cash flows and other amounts, on a gross basis. While the consolidation of an investment fund or entity does not have an effect on the amounts of Net Income Attributable to KKR or KKR's stockholders' equity that KKR reports, the consolidation does significantly impact the financial statement presentation under GAAP. This is due to the fact that the accounts of the consolidated entities are reflected on a gross basis while the allocable share of those amounts that are attributable to third parties are reflected as single line items. The single line items in which the accounts attributable to third parties are recorded are presented as noncontrolling interests on the consolidated statements of financial condition and net income (loss) attributable to noncontrolling interests on the consolidated statements of operations.
201
The presentation in the financial statements reflect the significant industry diversification of KKR by its acquisition of Global Atlantic. Global Atlantic operates an insurance business, and KKR operates an asset management business, each of which possess distinct characteristics. As a result, KKR developed a two-tiered presentation approach for the financial statements in this Management's Discussion and Analysis. KKR believes that these separate presentations provide a more informative view of the consolidated financial position and results of operations than traditional aggregated presentations. KKR believes that reporting Global Atlantic’s insurance operations separately is appropriate given, among other factors, the relative significance of Global Atlantic’s policy liabilities, which are not obligations of KKR (other than the insurance companies that issued them). If a traditional aggregated presentation were to be used, KKR would expect to eliminate or combine several identical or similar captions, which would condense the presentations but would reduce transparency. KKR also believes that using a traditional aggregated presentation would result in no new line items compared to the two-tier presentation included in the financial statements in this report.
Consolidation
KKR consolidates all entities that it controls either through a majority voting interest or as the primary beneficiary of variable interest entities (“VIEs”). The following discussion is intended to provide supplemental information about how the application of consolidation principles impact our financial results, and management’s process for implementing those principles including areas of significant judgment. For a detailed description of our accounting policy on consolidation, see Note 2 "Summary of Significant Accounting Policies" in our financial statements included in this report.
As part of its consolidation procedures, KKR evaluates: (1) whether it holds a variable interest in an entity, (2) whether the entity is a VIE, and (3) whether the KKR’s involvement would make it the primary beneficiary. The determination that KKR holds a controlling financial interest in an investment vehicle significantly changes the presentation of our consolidated financial statements.
The assessment of whether we consolidate an investment vehicle we manage requires the application of significant judgment. These judgments are applied both at the time we become involved with an investment vehicle and on an ongoing basis and include, but are not limited to:
•Determining whether our management fees, carried interests or incentive fees represent variable interests - We make judgments as to whether the fees we earn are commensurate with the level of effort required for those fees and at market rates. In making this judgment, we consider, among other things, the extent of third party investment in the entity and the terms of any other interests we hold in the VIE.
•Determining whether a legal entity qualifies as a VIE - For those entities where KKR holds a variable interest, management determines whether each of these entities qualifies as a VIE and, if so, whether or not KKR is the primary beneficiary. The assessment of whether the entity is a VIE is generally performed qualitatively, which requires judgment. These judgments include: (a) determining whether the equity investment at risk is sufficient to permit the entity to finance its activities without additional subordinated financial support, (b) evaluating whether the equity holders, as a group, can make decisions that have a significant effect on the economic performance of the entity, (c) determining whether two or more parties’ equity interests should be aggregated, and (d) determining whether the equity investors have proportionate voting rights to their obligations to absorb losses or rights to receive returns from an entity. Entities that do not qualify as VIEs are generally assessed for consolidation as voting interest entities. Under the voting interest entity model, KKR consolidates those entities it controls through a majority voting interest.
•Concluding whether KKR has an obligation to absorb losses or the right to receive benefits that could potentially be significant to the VIE - As there is no explicit threshold in GAAP to define “potentially significant,” we must apply judgment and evaluate both quantitative and qualitative factors to conclude whether this threshold is met.
Changes to these judgments could result in a change in the consolidation conclusion for a legal entity.
Fair Value Measurements
Fair value is the price that would be received to sell an asset or paid to transfer a liability in an orderly transaction between market participants at the measurement date under current market conditions.
GAAP establishes a hierarchical disclosure framework which prioritizes and ranks the level of market price observability used in measuring financial instruments at fair value. Investments and other financial instruments measured and reported at fair value are classified and disclosed based on the observability of inputs used in the determination of fair values, as follows:
202
Level I
Pricing inputs are unadjusted, quoted prices in active markets for identical assets or liabilities as of the measurement date.
Level II
Pricing inputs are other than quoted prices in active markets, which are either directly or indirectly observable as of the measurement date, and fair value is determined through the use of models or other valuation methodologies.
Level III
Pricing inputs are unobservable for the financial instruments and include situations where there is little, if any, market activity for the financial instrument. The inputs into the determination of fair value require significant management judgment or estimation. The valuation of our Level III investments at December 31, 2023 represents management's best estimate of the amounts that we would anticipate realizing on the sale of these investments in an orderly transaction at such date.
In certain cases, the inputs used to measure fair value may fall into different levels of the fair value hierarchy. In such cases, the level in the fair value hierarchy within which the fair value measurement in its entirety falls has been determined based on the lowest level input that is significant to the fair value measurement in its entirety.
Level III Valuation Methodologies
Our investments and financial instruments are impacted by various economic conditions and events outside of our control that are difficult to quantify or predict, which may have a significant impact on the valuation of our investments and, therefore, on the carried interest and investment income we realize. Additionally, a change in interest rates could have a significant impact on valuations.
Across the total Level III private equity investment portfolio (including core private equity investments), and including investments in both consolidated and unconsolidated investment funds, approximately 60% of the fair value is derived from investments that are valued based exactly 50% on market comparables and 50% on a discounted cash flow analysis. Less than 1% of the fair value of this Level III private equity investment portfolio is derived from investments that are valued either based 100% on market comparables or 100% on a discounted cash flow analysis. As of December 31, 2023, the overall weights ascribed to the market comparables methodology, the discounted cash flow methodology, and a methodology based on pending sales for this portfolio of Level III private equity investments were 39%, 54%, and 7%, respectively.
There is inherent uncertainty involved in the valuation of Level III investments, and there is no assurance that, upon liquidation, KKR will realize the values reflected in our valuations. Our valuations may differ significantly from the values that would have been used had an active market for the investments existed, and it is reasonably possible that the difference could be material. See "Risk Factors" and "—Business Environment" for more information on factors that may impact our business, financial performance, operating results and valuations.
Key unobservable inputs that have a significant impact on our Level III valuations as described above are included in Note 9 "Fair Value Measurements" in our financial statements.
203
Level III Valuation Process
The valuation process involved for Level III measurements is completed on a quarterly basis and is designed to subject the valuation of Level III investments to an appropriate level of consistency, oversight, and review.
For private equity and real asset investments classified as Level III, investment professionals prepare preliminary valuations based on their evaluation of financial and operating data, company specific developments, market valuations of comparable companies and other factors. KKR begins its procedures to determine the fair values of its Level III assets approximately one month prior to the end of a reporting period, and KKR follows additional procedures to ensure that its determinations of fair value for its Level III assets are appropriate as of the relevant reporting date. These preliminary valuations are reviewed by an independent valuation firm engaged by KKR to perform certain procedures in order to assess the reasonableness of KKR's valuations annually for all Level III private equity and real asset investments and quarterly for investments other than certain investments, which have values less than preset value thresholds and which in the aggregate comprise less than 1% of the total value of KKR's Level III private equity and real asset investments. The valuations of certain real asset investments are determined solely by independent valuation firms without the preparation of preliminary valuations by our investment professionals, and instead such independent valuation firms rely on valuation information available to it as a broker or valuation firm. For credit investments, an independent valuation firm is generally engaged by KKR to assist with the valuations of most investments classified as Level III. The valuation firm either provides a value, provides a valuation range from which KKR's investment professionals select a point in the range to determine the valuation, or performs certain procedures in order to assess the reasonableness of KKR's valuations. After reflecting any input from the independent valuation firm, the valuation proposals are submitted for review and approval by KKR's valuation committees. As of December 31, 2023, less than 4% of the total value of our Level III credit investments were not valued with the engagement of an independent valuation firm.
For Level III investments in Asset Management, KKR has a global valuation committee that is responsible for coordinating and implementing the firm's valuation process to ensure consistency in the application of valuation principles across portfolio investments and between periods. The global valuation committee is assisted by the asset class-specific valuation committees that exist for private equity (including core equity investments and certain impact investments), growth equity (including certain impact investments), real estate, energy, infrastructure and credit. The asset class-specific valuation committees are responsible for the review and approval of all preliminary Level III valuations in their respective asset classes on a quarterly basis. The members of these valuation committees are comprised of investment professionals, including the heads of each respective strategy, and professionals from business operations functions such as legal, compliance and finance, who are not primarily responsible for the management of the investments. All Level III valuations for investments in Asset Management are also subject to approval by the global valuation committee, which is comprised of senior employees including investment professionals and professionals from business operations functions, and includes KKR's Chief Financial Officer, Chief Legal Officer and General Counsel, and Chief Compliance Officer. When valuations are approved by the global valuation committee after reflecting any input from it, the valuations of Level III investments, as well as the valuations of Level I and Level II investments, are presented to the Audit Committee of the Board of Directors of KKR & Co. Inc. and are then reported to the Board of Directors.
Level III investments held by Global Atlantic are valued on the basis of pricing services, broker-dealers or internal models. Global Atlantic performs a quantitative and qualitative analysis and review of the information and prices received from independent pricing services as well as broker-dealers to verify that it represents a reasonable estimate of fair value. As of December 31, 2023, approximately 88% of these investments were priced via external sources, while approximately 12% were valued on the basis of internal models. For all the internally developed models, Global Atlantic seeks to verify the reasonableness of fair values by analyzing the inputs and other assumptions used. These preliminary valuations are reviewed, based on certain thresholds, by an independent valuation firm engaged by Global Atlantic to perform certain procedures in order to assess the reasonableness of Global Atlantic's valuations. When valuations are approved by Global Atlantic's management, the valuations of its Level III investments, as well as the valuations of Level I and Level II investments, are presented to the Audit Committee of the Board of Directors of KKR & Co. Inc. and are then reported to the Board of Directors.
As of December 31, 2023, upon completion by, where applicable, independent valuation firms of certain limited procedures requested to be performed by them on certain Level III investments, the independent valuation firms concluded that the fair values, as determined by KKR (including Global Atlantic), of those investments reviewed by them were reasonable. The limited procedures did not involve an audit, review, compilation or any other form of examination or attestation under generally accepted auditing standards and were not conducted on all Level III investments. We are responsible for determining the fair value of investments in good faith, and the limited procedures performed by an independent valuation firm are supplementary to the inquiries and procedures that we are required to undertake to determine the fair value of the commensurate investments.
204
As described above, Level II and Level III investments were valued using internal models with significant unobservable inputs, and our determinations of the fair values of these investments may differ materially from the values that would have resulted if readily observable inputs had existed. Additional external factors may cause those values, and the values of investments for which readily observable inputs exist, to increase or decrease over time, which may create volatility in our earnings and the amounts of assets and stockholders' equity that we report from time to time.
Changes in the fair value of investments impacts the amount of carried interest that is recognized as well as the amount of investment income that is recognized for investments held directly in Asset Management and through our consolidated funds as described below. We estimate that an immediate 10% decrease in the fair value of investments held directly and through consolidated investment funds generally would result in a commensurate change in the amount of net gains (losses) from investment activities for investments held directly and through investment funds and a more significant impact to the amount of carried interest recognized, regardless of whether the investment was valued using observable market prices or management estimates with significant unobservable pricing inputs. With respect to consolidated investment funds, the impact that the consequential decrease in investment income would have on net income attributable to KKR would generally be significantly less than the amount described above, given that a majority of the change in fair value of our consolidated funds would be attributable to noncontrolling interests and therefore we are only impacted to the extent of our carried interest and our balance sheet investments. With respect to Insurance, a decrease in investment income for certain assets where investment gains and losses are recognized through the statement of operations would impact KKR only to the extent of our economic ownership interest in Global Atlantic.
As of December 31, 2023, there were no investments which represented greater than 5% of total investments on a GAAP basis. On a segment basis, as of December 31, 2023, investments which represented greater than 5% of total asset management segment investments consisted of USI, Inc. and PetVet Care Centers, LLC and valued at $1,915 million and $1,134 million, respectively. Our investment income on a GAAP basis and our book value can be impacted by volatility in the public markets related to our holdings of publicly traded securities, including our sizable holdings of Crescent and BridgeBio Pharma, Inc. See "Risk Factors" and "—Business Environment" for a discussion of factors that may impact the valuations of our investments, financial results, operating results and valuations, and "—Non-GAAP Balance Sheet Measures" for additional information regarding our largest holdings on a segment basis.
Business Combinations
KKR accounts for business combinations using the acquisition method of accounting, under which the purchase price of the acquisition is allocated to the assets acquired and liabilities assumed using the fair values determined by management as of the acquisition date.
Management’s determination of fair value of assets acquired and liabilities assumed at the acquisition date is based on the best information available in the circumstances and may incorporate management’s own assumptions and involve a significant degree of judgment. We use our best estimates and assumptions to accurately assign fair value to the tangible and identifiable intangible assets acquired and liabilities assumed at the acquisition date as well as the useful lives of those acquired intangible assets. Examples of critical estimates in valuing certain of the intangible assets we have acquired include, but are not limited to, future expected cash inflows and outflows, future fundraising assumptions, expected useful life, discount rates and income tax rates. Our estimates for future cash flows are based on historical data, various internal estimates and certain external sources, and are based on assumptions that are consistent with the plans and estimates we are using to manage the underlying assets acquired. We estimate the useful lives of the intangible assets based on the expected period over which we anticipate generating economic benefit from the asset. We base our estimates on assumptions we believe to be reasonable but that are unpredictable and inherently uncertain. Unanticipated events and circumstances may occur that could affect the accuracy or validity of such assumptions, estimates or actual result.
Income Taxes
Significant judgment is required in estimating the provision for (benefit from) income taxes, current and deferred tax balances (including valuation allowance), accrued interest or penalties and uncertain tax positions. In evaluating these judgments, we consider, among other items, projections of taxable income (including the character of such income), beginning with historic results and incorporating assumptions of the amount of future pretax operating income. These assumptions about future taxable income require significant judgment and are consistent with the plans and estimates that KKR uses to manage its business. A portion of the deferred tax assets are not considered to be more likely than not to be realized. For that portion of the deferred tax assets for Global Atlantic, a valuation allowance has been recorded. Revisions in estimates and/or actual costs of a tax assessment may ultimately be materially different from the recorded accruals and unrecognized tax benefits, if any. Please see Note 18 "Income Taxes" in our financial statements in this report for further details.
205
Critical Accounting Policies and Estimates - Asset Management
Revenues
Fees and Other
Fees and other consist primarily of (i) management and incentive fees from providing investment management services to unconsolidated funds, CLOs, other vehicles, and separately managed accounts; (ii) transaction fees earned in connection with successful investment transactions and from capital markets activities; (iii) monitoring fees from providing services to portfolio companies; (iv) expense reimbursements from certain investment funds and portfolio companies; and (v) consulting fees. These fees are based on the contractual terms of the governing agreements and are recognized when earned, which coincides with the period during which the related services are performed and in the case of transaction fees, upon closing of the transaction. Monitoring fees may provide for a termination payment following an initial public offering or change of control. These termination payments are recognized in the period when the related transaction closes.
Transaction fee calculations and management fee calculations based on committed capital or invested capital typically do not require discretion and therefore do not require the use of significant estimates or judgments. Management fee calculations based on net asset value depend on the fair value of the underlying investments within the investment vehicles. Estimates and assumptions are made when determining the fair value of the underlying investments within the funds and could vary depending on the valuation methodology that is used as well as economic conditions.
Capital Allocation-Based Income (Loss)
Capital allocation-based income (loss) is earned from those arrangements whereby KKR serves as general partner and includes income or loss from KKR's capital interest as well as "carried interest" which entitles KKR to a disproportionate allocation of investment income or loss from an investment fund's limited partners.
Carried interest is recognized upon appreciation of the funds’ investment values above certain return hurdles set forth in their partnership agreement. KKR recognizes revenues attributable to capital allocation-based income based upon the amount that would be due pursuant to the fund partnership agreement at each period end as if the funds were terminated at that date. Accordingly, the amount recognized reflects KKR’s share of the gains and losses of the associated funds’ underlying investments measured at their then-current fair values relative to the fair values as of the end of the prior period. Because of the inherent uncertainty in measuring the fair value of investments in the absence of observable market prices as previously discussed, these estimated values may differ significantly from the values that would have been used had a ready market for the investments existed, and it is reasonably possible that the difference could be material.
Expenses
Compensation and Benefits
Compensation and Benefits expense includes (i) base cash compensation consisting of salaries and wages, (ii) benefits, (iii) carry pool allocations, (iv) equity-based compensation and (v) discretionary cash bonuses.
To supplement base cash compensation, benefits, carry pool allocations, and equity-based compensation, we typically pay discretionary cash bonuses, which are included in Compensation and Benefits expense in the consolidated statements of operations, based principally on the level of (i) management fees and other fee revenues (including incentive fees), (ii) realized carried interest and (iii) realized investment income earned during the year. The amounts paid as discretionary cash bonuses, if any, are at our sole discretion and vary from individual to individual and from period to period, including having no cash bonus. We accrue discretionary cash bonuses when payment becomes probable and reasonably estimable which is generally in the period when we make the decision to pay discretionary cash bonuses and is based upon a number of factors, including the recognition of fee revenues, realized carried interest, realized investment income and other factors determined during the year.
206
Beginning in 2021, we expect to pay our employees by assigning a percentage range to each component of asset management segment revenues. Prior to January 1, 2024, based on the current components and blend of our asset management segment revenues on an annual basis, we expected to use approximately: (i) 20‐25% of fee related revenues, (ii) 60‐70% of realized carried interest and incentive fees not included in fee related performance revenues or earned from our hedge fund partnerships, and (iii) 10‐20% of realized investment income and hedge fund partnership incentive fees, to pay our asset management employees. Beginning in January 2024, we expect to use approximately: (i) 15%-20% of fee related revenues, (ii) 70%-80% of realized carried interest and incentive fees not included in fee related performance revenues or earned from our hedge fund partnerships, and (iii) 10%-20% of realized investment income and hedge fund partnership incentive fees, to pay our asset management employees. Because these ranges are applied to applicable asset management segment revenue components independently, and on an annual basis, the amount paid as a percentage of total asset management segment revenue will vary and will, for example, likely be higher in a period with relatively higher realized carried interest and lower in a period with relatively lower realized carried interest. We decide whether to pay a discretionary cash bonus and determine the percentage of applicable revenue components to pay compensation only upon the occurrence of the realization event. There is no contractual or other binding obligation that requires us to pay a discretionary cash bonus to the asset management employees, except in limited circumstances.
Assuming that we had accrued compensation of (i) 65% of the unrealized carried interest earned by the funds that allocate 40% and 43% to the carry pool and (ii) 15% of the unrealized net gains in our Principal Activities business line (in each case at the mid-point of the ranges above), KKR & Co. Inc. Stockholders’ Equity – Common Stock as of December 31, 2023 would have been reduced by approximately $1.88 per share, compared to our reported $25.83 per share on such date, and our book value as of December 31, 2023 would have been reduced by approximately $1.88 per adjusted share, compared to our reported book value of $30.95 per adjusted share on such date.
Carry Pool Allocation
With respect to our funds that provide for carried interest, we allocate a portion of the realized and unrealized carried interest that we earn to Associates Holdings, which we refer to as the carry pool, from which our asset management employees and certain other carry pool participants are eligible to receive a carried interest allocation. As of December 31, 2023, the allocation is determined based upon a fixed arrangement between Associates Holdings and us, and we do not exercise discretion on whether to make an allocation to the carry pool upon a realization event. We refer to the portion of carried interest that we allocate to the carry pool as the carry pool percentage. These amounts are accounted for as compensatory profit sharing arrangements in Accrued Expenses and Other Liabilities within the accompanying consolidated statements of financial condition in conjunction with the related carried interest income and are recorded as compensation expense. Upon a reversal of carried interest income, the related carry pool allocation, if any, is also reversed. Accordingly, such compensation expense is subject to both positive and negative adjustments.
As of December 31, 2023, the carry pool percentage was fixed at 40%, 43% or 65% by investment fund, depending on the fund’s vintage. For funds that closed after December 31, 2020 but before December 31, 2023, the carry pool percentage was fixed at 65%. For all funds that closed after June 30, 2017 but before December 31, 2020, the carry pool percentage was fixed at 43%, and the carry pool percentage was fixed at 40% for older funds that contributed to our carry pool. Effective January 2, 2024, we are authorized to apply a carry pool percentage in excess of these fixed percentages of up to 80% for all funds. As of the date of this filing, no carry pool percentage has been changed for our funds that have closed on or before December 31, 2023. This increase to the carry pool percentage was approved by a majority of our independent directors, and the carry pool percentage may not be increased above 80% without the further approval of a majority of our independent directors.
As disclosed above, we record compensation for our asset management employees in an amount that equates to 60‐70% of realized carried interest and incentive fees which are not included in fee related performance revenues or earned from our hedge fund partnerships. The amounts recorded as compensation for the year ended December 31, 2023 and certain prior periods are greater than the amounts allocated to the carry pool for those periods. Any amounts recorded as compensation that are higher than the amounts allocated in accordance with the percentages referenced above represent discretionary cash bonus compensation to our asset management employees. The amounts paid as discretionary cash bonuses, if any, are at our discretion and vary from individual to individual and from period to period, including having no cash bonus at all for certain employees. See "—Revenues—Capital Allocation-Based Income (Loss)" and "—Compensation and Benefits" above.
207
On the Sunset Date (which will not be later than December 31, 2026), KKR will acquire control of Associates Holdings and will commence making decisions regarding the allocation of the carry proceeds pursuant to the limited partnership agreement of Associates Holdings. Until the Sunset Date, our Co-Founders will continue to make decisions regarding the allocation of the carry proceeds to themselves and others, pursuant to the limited partnership agreement of Associates Holdings, provided that any allocation of carry proceeds to the Co-Founders will be on a percentage basis consistent with past practice. For additional information about the Sunset Date and the Reorganization Agreement, see Note 1 "Organization" in our financial statements included in this report.
Equity-based Compensation
In addition to the cash-based compensation and carry pool allocations as described above, employees receive equity awards under our Equity Incentive Plans, most of which are subject to service-based vesting typically over a three to five-year period from the date of grant, and some of which are also subject to the achievement of market-based conditions. Certain of these awards are subject to post-vesting transfer restrictions and minimum retained ownership requirements.
Compensation expense relating to the issuance of equity-based awards is measured at fair value on the grant date. In determining the aggregate fair value of any award grants, we make judgments as to the grant-date fair value, particularly for certain restricted units with a vesting condition based upon market conditions, whose grant date fair values are based on a probability distributed Monte-Carlo simulation. See Note 19 "Equity Based Compensation,” in our financial statements included in this report for further discussion and activity of these awards.
Investment Income (Loss) -Net Gains (Losses) from Investment Activities
Net gains (losses) from investment activities consist of realized and unrealized gains and losses arising from our investment activities as well as income earned from certain equity method investments. Fluctuations in net gains (losses) from investment activities between reporting periods is driven primarily by changes in the fair value of our investment portfolio as well as the realization of investments. The fair value of, as well as the ability to recognize gains from, our investments is significantly impacted by the global financial markets, which, in turn, affects the net gains (losses) from investment activities recognized in any given period. Upon the disposition of an investment, previously recognized unrealized gains and losses are reversed and an offsetting realized gain or loss is recognized in the current period. Since our investments are carried at fair value, fluctuations between periods could be significant due to changes to the inputs to our valuation process over time. For a further discussion of our fair value measurements and fair value of investments, see the above "—Critical Accounting Policies and Estimates—Fair Value Measurements."
Critical Accounting Policies and Estimates – Insurance
Policy liabilities
Policy liabilities, or collectively, “reserves,” are the portion of past premiums or assessments received that are set aside to meet future policy and contract obligations as they become due. Interest accrues on the reserves and on future premiums, which may also be available to pay for future obligations. Global Atlantic establishes reserves to pay future policy benefits, claims, and certain expenses for its life policies and annuity contracts.
Global Atlantic's reserves are estimated based on models that include many actuarial assumptions and projections. These assumptions and projections, which are inherently uncertain, involve significant judgment, including assumptions as to the levels and/or timing of premiums, benefits, claims, expenses, interest credits, investment results (including equity market returns), mortality, longevity, and persistency.
The assumptions on which reserves are based are intended to represent an estimation of experience for the period that policy benefits are payable. Global Atlantic reviews the adequacy of its reserves and the assumptions underlying those reserves at least annually. Global Atlantic cannot, however, determine with precision the amount or the timing of actual benefit payments. If actual experience is better than or equal to the assumptions, then reserves would be adequate to provide for future benefits and expenses. If experience is worse than the assumptions, additional reserves may be required to meet future policy and contract obligations. This would result in a charge to Global Atlantic's net income during the period in which excess benefits are paid or an increase in reserves occurs.
208
For a majority of Global Atlantic's in-force policies, including its interest-sensitive life policies and most annuity contracts, the base policy reserve is equal to the account value. For these products, the account value represents Global Atlantic's obligation to repay to the policyholder the amounts held with Global Atlantic on deposit. However, there are several significant blocks of business where policy reserves, in addition to the account value, are explicitly calculated, including variable annuities, fixed-indexed annuities, interest-sensitive life products (including those with secondary guarantees), and preneed policies.
The critical accounting estimates and related sensitivities, reported below have been updated from those reported in the Annual Report to reflect the impact from the adoption of LDTI (see Note 2 "Summary of Significant Accounting Policies" in our financial statements included in this report.)
Market risk benefits
Market risk benefits are contracts or contract features that both provide protection to the policyholder from other-than-nominal capital market risk and expose Global Atlantic to other-than-nominal capital market risk. Market risk benefits include certain contract features on fixed annuity and variable annuity products, including minimum guarantees to policyholders, such as guaranteed minimum death benefits (GMDBs), guaranteed minimum withdrawal benefits (GMWBs), and long-term care benefits (which are capped at the return of account value plus one or two times the account value).
Some of Global Atlantic's variable annuity and fixed-indexed annuity contracts contain a GMDB feature that provides a guarantee that the benefit received at death will be no less than a prescribed minimum amount, even if the account balance is reduced to zero. This amount is based on either the net deposits paid into the contract, the net deposits accumulated at a specified rate, the highest historical account value on a contract anniversary, or sometimes a combination of these values. If the GMDB is higher than the current account value at the time of death, Global Atlantic incurs a cost equal to the difference.
Global Atlantic issues fixed-indexed annuity and variable annuity contracts with a guaranteed minimum withdrawal feature. GMWB are an optional benefit where the contract owner is entitled to withdraw a maximum amount of their benefit base each year.
Once exercised, living benefit features provide annuity policyholders with a minimum guaranteed stream of income for life. A policyholder’s annual income benefit is generally based on an annual withdrawal percentage multiplied by the benefit base. The benefit base is defined in the policy and is generally the initial premium, reduced by any partial withdrawals and increased by a defined percentage, formula or index credits. Any living benefit payments are first deducted from the account value. Global Atlantic is responsible for paying any excess guaranteed living benefits still owed after the account value has reached zero.
The ultimate cost of these benefits will depend on the level of market returns and the level of contractual guarantees, as well as policyholder behavior, including surrenders, withdrawals, and benefit utilization. For Global Atlantic's fixed-indexed annuity products, costs also include certain non-guaranteed terms that impact the ultimate cost, such as caps on crediting rates that Global Atlantic can, in its discretion, reset annually.
See Note 17 — “Policy liabilities” in our financial statements for additional information.
209
As of December 31, 2023, the net market risk liability balance totaled $1.1 billion. As of December 31, 2023, the liability balances for market risk benefits were $868.3 million for fixed-indexed annuities and $238.5 million for variable and other annuities. The increase (decrease) to the net market risk benefit liability balance as a result of hypothetical changes in interest rates, instrument-specific credit risk, equity market prices, expected mortality, and expected surrenders are summarized in the table below. This sensitivity considers the direct effect of such changes only and not changes in any other assumptions used in or items considered in the measurement of such balances.
| As of December 31, 2023 | ||||||||||||||
| Fixed-indexed annuity | Other | |||||||||||||
| ($ in thousands) | ||||||||||||||
| Balance | $ | 868,268 | $ | 238,469 | ||||||||||
| Hypothetical change: | ||||||||||||||
| +50 bps interest rates | (133,210) | (52,782) | ||||||||||||
| -50 bps interest rates | 149,220 | 58,690 | ||||||||||||
| +50 bps instrument-specific credit risk | (127,981) | (28,591) | ||||||||||||
| -50 bps instrument-specific credit risk | 142,883 | 31,460 | ||||||||||||
| +10% equity market prices | (46,934) | (53,674) | ||||||||||||
| -10% equity market prices | 28,964 | 60,217 | ||||||||||||
| 95% of expected mortality | 41,872 | 7,144 | ||||||||||||
| 105% of expected mortality | (39,435) | (6,395) | ||||||||||||
| 90% of expected surrenders | 24,283 | 3,721 | ||||||||||||
| 110% of expected surrenders | (23,102) | (3,591) | ||||||||||||
Note: Hypothetical changes to the market risk benefits liability balance do not reflect the impact of related hedges.
Policy liabilities accounted for under a fair value option
Variable annuity contracts offered and assumed by Global Atlantic provide the contractholder with a GMDB. The liabilities for these benefits are included in policy liabilities. Global Atlantic elected the fair value option to measure the liability for certain of these variable annuity contracts valued at $354.0 million as of December 31, 2023. Fair value is calculated as the present value of the estimated death benefits less the present value of the GMDB fees, using 1,000 risk neutral scenarios. Global Atlantic discounts the cash flows using the U.S. Treasury rates plus an adjustment for instrument-specific credit risk in the consolidated statement of financial condition. The change in the liabilities for these benefits is included in policy benefits and claims in the consolidated statement of operations.
As of December 31, 2023, variable annuities accounted for using the fair value option totaled $354.0 million. The increase (decrease) in the reserves for variable annuities accounted for using the fair value option as a result of hypothetical changes in interest rates, instrument-specific credit risk, equity market prices, expected mortality, and expected surrenders are summarized in the table below. This sensitivity considers the direct effect of such changes only and not changes in any other assumptions used in or items considered in the measurement of such balances.
| As of December 31, 2023 | ||||||||
| Variable annuities | ||||||||
| ($ in thousands) | ||||||||
| Balance | $ | 354,001 | ||||||
| Hypothetical change: | ||||||||
| +50 bps interest rates | (22,535) | |||||||
| -50 bps interest rates | 24,425 | |||||||
| +50 bps instrument-specific credit risk | (15,046) | |||||||
| -50 bps instrument-specific credit risk | 15,613 | |||||||
| +10% equity market prices | (17,354) | |||||||
| -10% equity market prices | 20,139 | |||||||
| 95% of expected mortality | (5,538) | |||||||
| 105% of expected mortality | 5,284 | |||||||
| 90% of expected surrenders | 1,200 | |||||||
| 110% of expected surrenders | (1,173) | |||||||
Note: Hypothetical changes to the liability balances do not reflect the impact of related hedges.
210
Liability for future policyholder benefits
A liability for future policy benefits, which is the present value of estimated future policy benefits to be paid to or on behalf of policyholders and certain related expenses less the present value of estimated future net premiums to be collected from policyholders, is accrued as premium revenue is recognized. The liability is estimated using current assumptions that include mortality, lapses, and expenses. These current assumptions are based on judgments that consider Global Atlantic’s historical experience, industry data, and other factors, and are updated quarterly and the current period change in the liability is recognized as a separate component of benefit expense in the consolidated income statement.
As of December 31, 2023, the liability for future policy benefits totaled $8.6 billion, net of reinsurance, split between $8.2 billion associated with payout annuity products, and $393.4 million of life and other insurance products. The increase (decrease) as a result of hypothetical changes in interest rates, credit spreads, expected mortality, and expected surrenders and lapses are summarized in the table below. This sensitivity considers the direct effect of such changes only and not changes in any other assumptions used in or items considered in the measurement of such balances.
| As of December 31, 2023 | ||||||||||||||
| Payout annuities | Life and other | |||||||||||||
| ($ in thousands) | ||||||||||||||
| Balance | $ | 8,156,842 | $ | 393,355 | ||||||||||
| Hypothetical change: | ||||||||||||||
| +50 bps interest rates | (149,006) | (127,657) | ||||||||||||
| -50 bps interest rates | 160,612 | 137,622 | ||||||||||||
| +50 bps credit spreads | (121,028) | (130,025) | ||||||||||||
| -50 bps credit spreads | 125,780 | 135,004 | ||||||||||||
95% of expected mortality(1) | 54,650 | 30,024 | ||||||||||||
105% of expected mortality(1) | (51,862) | (28,586) | ||||||||||||
| 90% of expected surrenders/lapses | — | (2,209) | ||||||||||||
| 110% of expected surrenders/lapses | — | 1,790 | ||||||||||||
Note: Hypothetical changes to the liability for future policy benefits balance do not reflect the impact of related hedges.
(1)Includes decrements for terminations of disability insurance
Additional liability for annuitization, death, or other insurance benefits: no-lapse guarantees
Global Atlantic has in-force interest-sensitive life contracts where it provides a secondary guarantee to the policyholder. The policy can remain in-force, even if the base policy account value is zero, as long as contractual secondary guarantee requirements have been met. The primary risk to Global Atlantic is that the premium collected under these policies, together with the investment return Global Atlantic earns on that premium, is ultimately insufficient to pay the policyholder’s benefits and the expenses associated with issuing and administering these policies. Global Atlantic holds an additional reserve in connection with these guarantees.
The additional reserves related to interest-sensitive life products with secondary guarantees are calculated using methods similar to those described above under “—Critical Accounting Policies and Estimates - Insurance—Policy liabilities—Market risk benefits.” The costs related to these secondary guarantees are recognized over the life of the contracts through the accrual and subsequent release of a reserve which is revalued each period. The reserve is calculated based on assessments, over a range of economic scenarios to incorporate the variability in the obligation that may occur under different environments. The change in the reserve is included in policy benefits and claims in the consolidated statements of operations.
As of December 31, 2023, the interest-sensitive life additional liability balance totaled $7.1 billion. The increase (decrease) to the interest-sensitive life additional liability balance, as a result of hypothetical changes in interest rates, equity market prices, annual equity growth, expected mortality, and expected surrenders are summarized in the table below. This sensitivity considers
211
the direct effect of such changes only and not changes in any other assumptions used in or items considered in the measurement of the interest-sensitive life no-lapse guarantee liability balance.
| As of December 31, 2023 | ||||||||
| Interest-sensitive life | ||||||||
| ($ in thousands) | ||||||||
| Balance | $ | 7,053,847 | ||||||
| Hypothetical change: | ||||||||
| +50 bps interest rates | 520 | |||||||
| -50 bps interest rates | (521) | |||||||
| +10% equity market prices | (637) | |||||||
| -10% equity market prices | (1,094) | |||||||
| 1% lower annual equity growth | (3,478) | |||||||
| 95% of expected mortality | (30,855) | |||||||
| 105% of expected mortality | 30,464 | |||||||
| 90% of expected surrenders | 22,504 | |||||||
| 110% of expected surrenders | (21,422) | |||||||
Note: Hypothetical changes to the interest-sensitive life additional liability for annuitization, death, or other insurance benefits balance do not reflect the impact of related hedges.
Embedded derivatives in policy liabilities and funds withheld
Global Atlantic's fixed-indexed annuity, variable annuity and indexed universal life products contain equity-indexed features, which are considered embedded derivatives and are required to be measured at fair value.
Global Atlantic calculates the embedded derivative as the present value of future projected benefits in excess of the projected guaranteed benefits, using an option budget as the indexed account value growth rate. In addition, the fair value of the embedded derivative is reduced to reflect instrument specific credit risk on Global Atlantic's obligation (i.e., Global Atlantic's own credit risk).
Changes in interest rates, future index credits, instrument-specific credit risk, projected withdrawal and surrender activity, and mortality on fixed-indexed annuity and interest-sensitive life products can have a significant impact on the value of the embedded derivative.
Valuation of embedded derivatives – Fixed-indexed annuities
Fixed-indexed annuity contracts allow the policyholder to elect a fixed interest rate of return or a market indexed strategy where interest credited is based on the performance of an index, such as the S&P 500 Index, or other indexes. The market indexed strategy is an embedded derivative, similar to a call option. The fair value of the embedded derivative is computed as the present value of benefits attributable to the excess of the projected policy contract values over the projected minimum guaranteed contract values. The projections of policy contract values are based on assumptions for future policy growth, which include assumptions for expected index credits, future equity option costs, volatility, interest rates, and policyholder behavior. The projections of minimum guaranteed contract values include the same assumptions for policyholder behavior as are used to project policy contract values. The embedded derivative cash flows are discounted using a risk-free interest rate increased by instrument-specific credit risk tied to Global Atlantic's own credit rating.
Valuation of embedded derivatives – Interest-sensitive life products
Interest-sensitive life products allow a policyholder’s account value to grow based on the performance of certain equity indexes, which results in an embedded derivative similar to a call option. The embedded derivative related to the index is bifurcated from the host contract and measured at fair value. The valuation of the embedded derivative is the present value of future projected benefits in excess of the projected guaranteed benefits, using the option budget as the indexed account value growth rate and the guaranteed interest rate as the guaranteed account value growth rate. Present values are based on discount rate curves determined at the valuation date or issue date as well as assumed lapse and mortality rates. The discount rate equals the forecast treasury rate increased by instrument-specific credit risk tied to Global Atlantic’s own credit rating. Changes in discount rates and other assumptions such as spreads and/or option budgets can have a substantial impact on the embedded derivative.
212
Valuation of embedded derivatives in modified coinsurance or funds withheld
Global Atlantic's reinsurance agreements include modified coinsurance and coinsurance with funds withheld arrangements that include terms that require payment by the ceding company of a principal amount plus a return that is based on a proportion of the ceding company’s return on a designated portfolio of assets. Because the return on the funds withheld receivable or payable is not clearly and closely related to the host insurance contract, these contracts are deemed to contain embedded derivatives, which are measured at fair value. Global Atlantic is exposed to both the interest rate and credit risk of the assets. Changes in discount rates and other assumptions can have a significant impact on this embedded derivative. The fair value of the embedded derivatives is included in the funds withheld receivable at interest and funds withheld payable at interest line items on our consolidated statement of financial condition. The change in the fair value of the embedded derivatives is recorded in net investment-related gains (losses) in the consolidated statement of operations.
As of December 31, 2023, the embedded derivative liability balance totaled $3.6 billion for fixed-indexed annuities, and $458.3 million for interest-sensitive life. The increase (decrease) to the embedded derivatives on fixed-indexed annuity and indexed universal life as a result of hypothetical changes in interest rates, credit spreads, and equity market prices are summarized in the table below. This sensitivity considers the direct effect of such changes only and not changes in any other assumptions used in or items considered in the measurement of such balances.
| As of December 31, 2023 | ||||||||||||||
| Fixed-indexed annuities | Interest sensitive life | |||||||||||||
| ($ in thousands) | ||||||||||||||
| Balance | $ | 3,587,371 | $ | 458,302 | ||||||||||
| Hypothetical change: | ||||||||||||||
| +50 bps interest rates | (67,424) | (3,939) | ||||||||||||
| -50 bps interest rates | 71,503 | 4,106 | ||||||||||||
| +50 bps credit spreads | (85,038) | (3,939) | ||||||||||||
| -50 bps credit spreads | 88,802 | 4,106 | ||||||||||||
| +10% equity market prices | 455,208 | 42,210 | ||||||||||||
| -10% equity market prices | (376,313) | (87,422) | ||||||||||||
Note: Hypothetical changes to the market risk benefits liability balance do not reflect the impact of related hedges.
As of December 31, 2023, the embedded derivative balance for modified coinsurance or funds withheld arrangements was a $2.5 billion net asset ($88.7 million in funds withheld receivables at interest, and $(2.4) billion in funds withheld payable at interest). The increase (decrease) to the embedded derivatives on fixed-indexed annuity and interest-sensitive life products as a result of hypothetical changes in interest rates and investment credit spreads are summarized in the table below. This sensitivity considers the direct effect of such changes only and not changes in any other assumptions used in or items considered in the measurement of such balances.
| As of December 31, 2023 | ||||||||||||||
| Embedded derivative on funds withheld receivable at interest | Embedded derivative on funds withheld payable at interest | |||||||||||||
| ($ in thousands) | ||||||||||||||
| Balance | $ | 88,661 | $ | (2,447,303) | ||||||||||
| Hypothetical change: | ||||||||||||||
| +50 bps interest rates | (16,738) | (1,014,317) | ||||||||||||
| -50 bps interest rates | 22,577 | 1,096,853 | ||||||||||||
| +50 bps investment credit spreads | (38,815) | (879,367) | ||||||||||||
| -50 bps investment credit spreads | 38,815 | 961,903 | ||||||||||||
Note: Hypothetical changes to the funds withheld receivable and payable embedded derivative balances do not reflect the impact of related hedges or trading assets which back the funds withheld at interest.
Recently Issued Accounting Pronouncements
For a full discussion of recently issued accounting pronouncements, see Note 2 "Summary of Significant Accounting Policies" in our financial statements.
213
ITEM 7A. QUANTITATIVE AND QUALITATIVE DISCLOSURES ABOUT MARKET RISK
Our exposure to market risks primarily relates to movements in the fair value of investments, including the effect that those movements have on our management fees, carried interest, and net gains from investment activities. The fair value of investments may fluctuate in response to changes in the values of investments, foreign currency exchange rates, and interest rates. Additionally, interest rate movements can adversely impact the amount of interest income we receive on credit instruments bearing variable rates and could also impact the amount of interest that we pay on debt obligations bearing variable rates. Global Atlantic has material exposure to market volatility in interest rates, credit spreads, and equity prices through its insurance liabilities, many of which are structured to have exposure to market level changes, its investment portfolio and its hedge program. The quantitative information provided in this section was prepared using estimates and assumptions that management believes are appropriate. The actual impact of a hypothetical adverse movement in these risks could be materially different from the amounts shown below.
The Board of Directors is responsible for oversight and the overall governance of KKR. Our Board of Directors has five standing committees: an Audit Committee, a Risk Committee, a Conflicts Committee, a Nominating and Corporate Governance Committee and an Executive Committee. For further information about KKR & Co. Inc.'s Board of Directors or its committees, see “Part III—Item 10. Directors, Executive Officers and Corporate Governance—Board Committees.”
Management of Market Risk
Asset Management
When we commit capital from our Principal Activities business line to investments or transactions, a balance sheet committee of senior employees, including our Co-Executive Chairmen, one of our Co-Chief Executive Officers, and the Chief Financial Officer, must approve the investment or transaction before it may be made. The committee has delegated authority to other senior employees to approve certain investments or transactions, subject to maximum commitment sizes or other limitations determined by the committee. In addition, this committee supervises activities governing KKR's capital structure, liquidity, and the composition of our balance sheet.
Certain securities transactions by our capital markets business are subject to risk tolerance limits, regulatory capital requirements, and the review and approval of one or more committees in compliance with rules applicable to broker-dealers pursuant to the Exchange Act. When our capital is committed to capital markets transactions after diligence is conducted, such transactions are subject to the review and approval of a capital markets underwriting committee. These transactions are also subject to risk tolerance limits. The risk tolerance limits establish the level of investment we may make in a single company or type of transaction, for example, and are designed to avoid undue concentration and risk exposure. Regulatory capital requirements also place limits on the size of securities underwritings the capital markets business can conduct based on quantitative measure of assets, liabilities, and certain off-balance-sheet items. Aggregate balance sheet risk and capital deployed for transactions are monitored on an ongoing basis by the balance sheet committee referenced above.
With respect to the funds and other investment vehicles through which we make investments for our fund investors, KKR manages risk by subjecting transactions to the review and approval of an applicable investment committee or portfolio manager; a portfolio management committee (or other designated senior employees) then regularly monitors these investments. Before making an investment, investment professionals endeavor to identify risks in due diligence, evaluating, among other things, business, financial, legal and regulatory issues, financial data, and other information relevant to a particular investment. An investment team presents the investment and its identified risks to an investment committee or a portfolio manager, which must approve each investment before it may be made. If an investment is made, a portfolio management committee (or other designated senior employees) is responsible for working with our investment professionals to monitor the investment on an ongoing basis.
214
Insurance
The board of directors of TGAFG, which is the holding company for Global Atlantic, has established a risk committee that has primary oversight of market risk at Global Atlantic. This risk committee has adopted Global Atlantic’s risk appetite principles that form the foundation of Global Atlantic’s enterprise risk management program. The risk appetite principles include: (1) protect policyholders by seeking to maintain adequate capital and liquidity resources to honor its obligations to policyholders under situations reflecting stress scenarios calibrated to the worst modern economic cycles; (2) deliver value by remaining in a position of strength during periods of adverse market conditions, and (3) protect the franchise by identifying and cost-effectively managing risks that could adversely and materially impact franchise value. The Global Atlantic enterprise risk management program formalizes the review of financial and non-financial risks and establishes risk management controls. Global Atlantic monitors risks on an aggregate, legal entity and product basis, monitoring different factors, including financial and insurance, investment, hedge management, operational, and legal, compliance and regulatory risks to confirm that its risks remain within established risk limits and tolerances.
For a discussion of Global Atlantic's hedge program, see "—Insurance Segment Market Risks—Hedge Program."
Management of General Business Risk
Asset Management
KKR has a risk and operations committee comprised of senior employees from across our asset management business and operating functions, and it includes our Chief Financial Officer, Chief Operating Officer, Chief Legal Officer and General Counsel, Chief Compliance Officer, and other senior employees from KKR's asset management business and Global Atlantic. The risk and operations committee focuses on KKR's operations and enterprise risk management. This committee is aided by various other committees focused on the oversight of risks to our business, including a global conflicts and compliance committee. This committee focuses on the most significant operating and business risks, which includes, among others, regulatory, cyber, operational, geopolitical, and reputational risks.
KKR has a global conflicts and compliance committee comprised of senior employees from across our asset management business and operations, and it includes, among others, our Chief Financial Officer, Chief Legal Officer and General Counsel, and Chief Compliance Officer. The global conflicts and compliance committee focuses on new or potential conflicts of interest that may arise in KKR's business, including, but not limited to, conflicts relating to specific transactions as well as potential conflicts involving the overall activities of KKR and its various businesses. This committee also reviews and monitors certain compliance matters.
KKR's technology and information security committee is responsible for reviewing and monitoring global technology risks including information security, business disruption and fraud related risks. For further information about this committee’s role with respect to oversight of cybersecurity risks, see "Item 1C-Cybersecurity."
In addition, KKR has other committees comprised of senior employees across our asset management business and operations that consider potential risks to our business.
Insurance
The TGAFG board of directors is responsible for oversight and the overall governance of Global Atlantic's business and operations. The TGAFG board includes among its members one of our Co-Chief Executive Officers. To assist with its oversight of Global Atlantic, the TGAFG board of directors has established an audit, risk, investment, operations & technology, nominating & governance, compensation and special transaction review committee.
215
Asset Management Segment Market Risks
The following is a discussion of the significant market risk exposures for KKR's asset management business.
Changes in Fair Value
The majority of our investments as of December 31, 2023, are reported at fair value. Net changes in the fair value of investments impact the net gains (losses) from investment activities in our consolidated statements of operations. Based on investments held as of December 31, 2023, we estimate that an immediate 10% decrease in the fair value of investments generally would result in a commensurate change in the amount of net gains (losses) from investment activities (except that carried interest would likely be more significantly impacted), regardless of whether the investment was valued using observable market prices or management estimates with significant unobservable pricing inputs. The impact that the consequential decrease in investment income would have on net income attributable to KKR & Co. Inc. would generally be significantly less than the amount described above, given that a significant portion of the change in fair value would be attributable to noncontrolling interests and therefore we are only impacted to the extent of our carried interest and our balance sheet investments and to a lesser extent our management fees. Because of this, the quantitative information that follows represents the impact that a reduction to each of the income streams shown below would have on net income attributable to KKR & Co. Inc. before income taxes. The actual impact to individual line items within the consolidated statements of operations would differ from the amounts shown below as a result of (i) the elimination of management fees and carried interest as a result of the consolidation of certain investment funds and CFEs and (ii) the gross-up of net gains (losses) from investment activities, in each case as a result of the consolidation of certain investment funds and CFEs.
Based on the fair value of investments as of December 31, 2023, we estimate that an immediate, hypothetical 10% decline in the fair value of investments would result in declines in net income attributable to KKR & Co. Inc. before income taxes in 2023 from reductions in the following items, if not offset by other factors:
| December 31, 2023 | ||||||||||||||||||||
| Management Fees | Carried Interest, Net of Carry Pool Allocation | Net Gains/(Losses) From Investment Activities Including General Partner Capital Interest | ||||||||||||||||||
| ($ in thousands) | ||||||||||||||||||||
Hypothetical 10% Decline in Fair Value of Investments (1) | $ | 50,011 | (2) | $ | 902,575 | (3) | $ | 1,831,293 | (3) | |||||||||||
(1)An immediate, hypothetical 10% decline in the fair value of investments would also impact our ability to earn incentive fees. Since the majority of our incentive fees are not subject to clawback, a 10% decline in fair value would generally result in the recognition of no incentive fees on a prospective basis and result in lower net income relative to prior years where such incentive fees may have been earned.
(2)Represents an annualized reduction in management fees.
(3)Decrease would impact our statement of operations in a single quarter. With respect to carried interest, for purposes of this analysis the impact of preferred returns are ignored.
Management Fees
Our management fees in our Private Equity and Real Assets business lines are generally calculated based on the amount of capital committed or invested by a fund, as described under "—Business—Our Business—Private Equity" and "—Business—Our Business—Real Assets." Accordingly, movements in the fair value of investments do not significantly affect the amount of fees we may charge in Private Equity and Real Assets funds. Management fees in our infrastructure funds are calculated based on the NAV of the fund and, in some cases, we additionally earn management fees on the fund's remaining commitment.
In the case of our Credit and Liquid Strategies business line, management fees are often calculated based on the average NAV of the fund for that particular period, although certain funds in our Credit and Liquid Strategies business line have management fees based on the amount of capital invested. In the case of our CLO vehicles, management fees are calculated based on the collateral of the vehicle. The collateral is based on the par value of the investments and cash on hand.
216
To the extent that management fees are calculated based on the NAV of the fund's investments, the amount of fees that we may charge will increase or decrease in direct proportion to the effect of changes in the fair value of the fund's investments. The proportion of our management fees that are based on NAV depends on the number and type of funds in existence. For the year ended December 31, 2023, the fund management fees that were recognized based on the NAV of the applicable funds was approximately 17%.
Publicly Traded Securities
Our investment vehicles and KKR's balance sheet, including through its principal activities business line, hold certain investments in companies whose securities are publicly traded. The market prices of securities may be volatile and are likely to fluctuate due to a number of factors beyond our control. These factors include actual or anticipated fluctuations in the quarterly and annual results of such companies or of other companies in the industries in which they operate, market perceptions concerning the availability of additional securities for sale, general economic, social or political developments, industry conditions, changes in government regulation, shortfalls in operating results from levels forecasted by securities analysts, the general state of the securities markets and other material events, such as significant management changes, re-financings, acquisitions, and dispositions. In addition, although a substantial portion of our investments are comprised of investments in portfolio companies whose securities are not publicly traded, the value of these privately held investments may also fluctuate as our Level III investments are valued in part using a market comparables analysis. Consequently, due to similar factors beyond our control as described above for portfolio companies whose securities are publicly traded, the value of these Level III investments may fluctuate with market prices. See the "Risk Factors" section of this report and "Management's Discussion and Analysis of Financial Condition and Results of Operations—Business Environment."
Exchange Rate Risk
Our investment vehicles and KKR's balance sheet hold investments denominated in currencies other than the U.S. dollar. Those investments expose us and our fund investors to the risk that the value of the investments will be affected by changes in exchange rates between the currency in which the investments are denominated and the currency in which the investments are made. Additionally, a portion of our management fees are denominated in non-U.S. dollar currencies. Our policy is to generally reduce these risks by employing hedging techniques, including using foreign currency options and foreign exchange forward contracts to reduce exposure to future changes in exchange rates when a meaningful amount of capital has been invested in currencies other than the currencies in which the investments are denominated.
Our primary exposure to exchange rate risk relates to movements in the value of exchange rates between the U.S. dollar and other currencies in which our investments are denominated (including euros, British pounds, Japanese yen, among others), net of the impact of foreign exchange hedging strategies. The quantitative information that follows represents the impact that a reduction to each of the income streams shown below would have on net income attributable to KKR & Co. Inc. before income taxes. The actual impact to individual line items within the statements of operations would differ from the amounts shown below as a result of (i) the elimination of carried interest as a result of the consolidation of certain investment funds and (ii) the gross-up of net gains (losses) from investment activities, in each case as a result of the consolidation of certain investment funds and CLO vehicles.
217
We estimate that an immediate, hypothetical 10% decline in the exchange rates between the U.S. dollar and all of the major foreign currencies in which our investments were denominated as of December 31, 2023 (i.e., an increase in the value of the U.S. dollar against these foreign currencies) would result in declines in net income attributable to KKR & Co. Inc. before income taxes in 2023 from reductions in the following items, net of the impact of foreign exchange hedging strategies, if not offset by other factors:
| December 31, 2023 | |||||||||||||||||
| Carried Interest, Net of Carry Pool Allocation | Net Gains/(Losses) From Investment Activities Including General Partner Capital Interest | ||||||||||||||||
| ($ in thousands) | |||||||||||||||||
Hypothetical 10% Decline in Foreign Currencies Against the U.S. Dollar (1) | $ | 188,785 | (2) | $ | 379,599 | (2) | |||||||||||
(1)An immediate, hypothetical 10% decline in exchange rates between the U.S. dollar and all of the major foreign currencies in which our investments were denominated would not be expected to materially impact our management fees or incentive fees. The majority of our funds in which we are entitled to earn incentive fees are denominated in U.S. dollars. Additionally, our management fees that are denominated in non-U.S. dollar currencies are generally hedged.
(2)Decrease would impact our statement of operations in a single quarter. With respect to carried interest, for purposes of this analysis the impact of preferred returns are ignored.
Interest Rate Risk
Valuation of Investments
Changes in credit markets and in particular, interest rates, can impact investment valuations, particularly our Level III investments, and may have offsetting results depending on the valuation methodology used. For example, we typically use a discounted cash flow analysis as one of the methodologies to ascertain the fair value of our investments that do not have readily observable market prices. If applicable interest rates rise, then the assumed cost of capital for those portfolio companies would be expected to increase under the discounted cash flow analysis, and this effect would negatively impact their valuations if not offset by other factors. Conversely, a fall in interest rates can positively impact valuations of certain portfolio companies if not offset by other factors. These impacts could be substantial depending upon the magnitude of the change in interest rates. In certain cases, the valuations obtained from the discounted cash flow analysis and the other primary methodology we use, the market multiples approach, may yield different and offsetting results. For example, the positive impact of falling interest rates on discounted cash flow valuations may offset the negative impact of the market multiples valuation approach and may result in less of a decline in value than for those investments that had a readily observable market price. Finally, low interest rates related to monetary stimulus and economic stagnation may also negatively impact expected returns on all investments, as the demand for relatively higher return assets increases and supply decreases.
Interest Income
We and certain consolidated investment vehicles, including CLOs, hold credit investments that generate interest income based on variable interest rates. We are exposed to interest rate risk relating to investments that generate yield since a meaningful portion of credit investments held by us and our consolidated investment vehicles, including CLOs, earn income based on variable interest rates. The impact on net income attributable to KKR & Co. Inc. resulting from a decrease of a hypothetical 100 basis points in variable interest rates used in the recognition of interest income would not be expected to be material since a substantial portion of this decrease would be attributable to noncontrolling interests and CLO third party noteholders.
218
Interest Expense
We and certain consolidated investment vehicles, including CLOs, have debt obligations that include revolving credit agreements, certain investment financing arrangements and debt securities issued by CLO vehicles that accrue interest at variable rates. Changes in these rates would affect the amount of interest payments that our consolidated investment vehicles, including CLOs, would have to make. With respect to consolidated investment vehicles and CLOs, the impact on net income attributable to KKR & Co. Inc. resulting from an increase of a hypothetical 100 basis points in variable interest rates used in the recognition of interest expense would not be expected to be material since a substantial portion of this increase would be attributable to noncontrolling interests and third party CLO noteholders. With respect to debt obligations held by KKR and not in the consolidated investment vehicles or CLOs, as of December 31, 2023, KKR had debt obligations outstanding with an aggregate principal amount of approximately $258.5 million that accrues interest at a variable rate. Our policy is to reduce these risks by employing hedging techniques, including using interest rate swaps. The impact on net income attributable to KKR & Co. Inc. resulting from an increase of a hypothetical 100 basis points in variable interest rates used in the recognition of interest expense, net of the impact of interest rate hedging strategies, would not be expected to be material.
Credit Risk
We are party to agreements providing for various financial services and transactions that contain an element of risk in the event that the counterparties are unable to meet the terms of such agreements. In these agreements, we depend on these counterparties to make payment or otherwise perform. We generally endeavor to reduce our risk of exposure by limiting the counterparties with which we enter into financial transactions to reputable financial institutions. In addition, availability of financing from financial institutions may be uncertain due to market events, and we may not be able to access these financing markets.
219
Insurance Segment Market Risks
The following is a discussion of the significant market risk exposures for our insurance business conducted through Global Atlantic.
Hedge Program
To manage market risk, Global Atlantic established a hedge program that seeks to mitigate economic impacts primarily from interest rate and equity price movements, while taking into consideration accounting and capital impacts. For Global Atlantic's fixed-indexed annuity and interest-sensitive life policies, Global Atlantic generally seeks to use static hedges to offset the exposure primarily created by changes in embedded derivative balances. For Global Atlantic's variable annuity policies, Global Atlantic generally seeks to dynamically hedge its exposure to changes in the value of the guarantee Global Atlantic provides to policyholders. In the context of specific reinsurance or other transactions in Global Atlantic's institutional channel or strategic acquisitions, Global Atlantic may also enter into hedges which are designed to limit short-term market risks to the economic value of the target assets. From time to time, Global Atlantic also enters into hedges designed to limit the volatility associated with changes in the value of its general account assets or changes to net investment income as a result of interest rate or credit spread movements, while also taking into consideration economic impacts. While not the primary focus of its hedging strategy, Global Atlantic also enters into currency swaps and forwards to manage foreign exchange rate risks with respect to certain investments denominated in foreign currencies. Global Atlantic also enters into inflation swaps to manage inflation risk associated with inflation-indexed preneed policies. Where Global Atlantic has derivative instruments that are designated and qualify as accounting hedges, these derivative instruments receive hedge accounting.
Global Atlantic's hedge program is not designed to, and may not be effective in, offsetting all impacts to net income, assets under management, statutory capital or economic values. Movements in market variables other than interest rates and equity market prices that are not explicitly hedged can also cause net income volatility. See "Risk Factors—Risks Related to Our Insurance Activities—Volatile market and economic conditions, including sustained periods of low interest rates, a sustained increase in interest rates and other interest rate fluctuations, may adversely affect our insurance business" and "Risk Factors—Risks Related to Our Business—Risk management activities may not be effective and, consequently, may adversely affect us."
Sensitivities
Global Atlantic evaluates the sensitivity of net income to specific changes in interest rates, credit spreads and equity prices projected using internal models. All of the estimated sensitivities assume that all other factors remain constant and reflect the impact of related hedges assuming no hedge rebalancing in Global Atlantic's dynamic program, as explained further below.
Global Atlantic's internal models project impacts as of a specific date, and are measured relative to a starting level reflecting its assets and liabilities at that date and the actuarial factors, investment activity, and assumed investment returns associated with insurance liabilities. The models measure the impact of changing one factor at a time and assume that all other factors remain unchanged. Actual results can differ significantly from these estimates for a variety of reasons, including the interaction among these factors when more than one changes, discretionary actions by management in response to such changes, differences between the return of the underlying fund and the return on the index being hedged, actual experience differing from the assumptions, changes in business mix, effective tax rates and other market factors, and limitations inherent in the use of models. For these reasons, the sensitivities should only be viewed as directional estimates of the impacts on Global Atlantic's net income and shareholders’ equity, excluding accumulated other comprehensive income ("AOCI"), and actual changes in response to such scenarios may differ materially from estimates provided.
For the dynamic portion of the hedge program, Global Atlantic primarily uses interest rate and equity futures to hedge liabilities which have option-like embedded derivatives. As such, Global Atlantic's program requires frequent rebalancing as markets move to ensure that the hedges are being re-sized to the new liability exposure. In addition, certain of the underlying variable annuity separate account funds are managed volatility funds, so Global Atlantic's market exposures may change substantially after sharp market moves. The point-in-time estimates provided in this section assume no hedge rebalancing and, as such, the impact on Global Atlantic's consolidated net income may be different from what is shown below.
220
Interest rate risk
Global Atlantic is exposed to interest rate risk as a result of changes in the level and volatility of interest rates. Changes in the level and volatility of interest rates primarily impacts the fair value reported in our consolidated financial statements of the following:
•embedded derivatives associated with modified coinsurance and coinsurance with funds withheld payables or receivables;
•embedded derivatives associated with variable annuities, fixed-indexed annuities and interest sensitive life products;
•policy liabilities accounted under the fair value option,
•market risk benefits, and
•financial instruments held in Global Atlantic's investment portfolio and used in its hedge program.
Changes in fair value of the foregoing are generally recorded as gains or losses in the consolidated statement of operations. For specific derivatives designated as cash flow hedges of forecasted bond purchases and receiving hedge accounting treatment, gains or losses are recorded in accumulated other comprehensive income and reclassified to net investment income following the qualifying purchases of available-for-sale securities, as an adjustment to the yield earned over the life of the purchased securities, using the effective interest method.
Due to the dynamic lapse sensitivities within Global Atlantic's models, market volatility in interest rates also impacts the reserves and deferred acquisition costs of certain fixed annuity products, changes in which are recorded in the consolidated statement of operations.
In periods following interest rate moves, Global Atlantic will also recognize a change in the income earned on certain of its floating-rate assets and the cost of funding on certain of Global Atlantic's liabilities recorded in the consolidated statement of operations.
Effect of interest rate sensitivity
In the table below, Global Atlantic estimates the impact of a 50 basis point increase/(decrease) in interest rates, from a parallel shift in the yield curve, from levels as of December 31, 2023 to its net income and shareholders’ equity, excluding AOCI. These sensitivities include the impact of related hedges and adjustments to DAC attributable to interest rate changes.
| December 31, 2023 | ||||||||||||||
Hypothetical change(1) | ||||||||||||||
| +50 Basis points | -50 Basis points | |||||||||||||
| ($ in thousands) | ||||||||||||||
| Total estimated net income and shareholders’ equity excluding AOCI sensitivity (point in time) | $ | 163,003 | $ | (165,739) | ||||||||||
Total estimated net income and shareholders’ equity excluding AOCI sensitivity (over 12 months)(2) | 47,454 | (47,454) | ||||||||||||
(1)The point in time and over 12 months total estimated impacts reflect the impact of hedges within Global Atlantic's liability hedging program, as well as hedges designed to limit surplus volatility resulting from interest rate movements.
(2)Excludes point in time impact. Estimated sensitivity to a hypothetical change over 12 months does not take into account any management actions that may be taken to mitigate actual impacts.
The estimated point in time impact is driven by a net decrease/(increase) in the value of (i) the embedded derivatives associated with Global Atlantic's modified coinsurance and coinsurance with funds withheld payables and receivables, (ii) the embedded derivatives associated with its fixed-indexed annuity, interest sensitive life products, and variable annuities accounted for under the fair value option, (iii) market risk benefits, and (iv) the remeasurement gain/loss of the liability for future policy benefits. These are largely offset by a loss/(gain) in financial instruments used in Global Atlantic's hedging program, investments classified as trading, and loans designated under the fair value option, based on balances in place as of year end. These estimated changes include the related income tax impacts.
221
The impact over 12 months is driven by an increase/(decrease) in the income earned on Global Atlantic's floating rate assets, and partially offset by an increase/(decrease) in the cost of its floating-rate liabilities.
In the table below Global Atlantic estimates the impact of a 50 basis point increase/(decrease) in interest rates, for a parallel shift in the yield curve, from levels as of December 31, 2023 to Global Atlantic's AOCI.
| December 31, 2023 | ||||||||||||||
| Hypothetical change | ||||||||||||||
| +50 Basis points | -50 Basis points | |||||||||||||
| ($ in thousands) | ||||||||||||||
| Total estimated AOCI sensitivity (point in time) | $ | (1,338,318) | $ | 1,379,943 | ||||||||||
The estimated point in time impact is primarily driven by a (i) net (decrease)/increase in the value of Global Atlantic's available-for-sale fixed maturity securities which are carried at fair value with unrealized gains and losses, (ii) the effect of changes in the discount rates used to measure traditional and limited-payment long duration insurance contracts, and (iii) the effect on additional insurance liabilities when unrealized gains and losses are included in the investment margin while calculating the present value of expected assessments for the benefit ratio; all of which are reported in AOCI. The estimated changes include the related income tax impacts.
Credit spread risk
Global Atlantic is exposed to credit spread risk as a result of changes in the spread between the yields on its funds withheld payables and receivables at interest and yields on comparable U.S. Treasury securities. Global Atlantic's reinsurance agreements include modified coinsurance and funds withheld coinsurance arrangements. Such arrangements are deemed to contain embedded derivatives, which are measured at fair value, and are therefore impacted by the mark-to-market value of the related assets. Changes in the credit spreads associated with the assets impact the mark-to-market value of the assets. There is additional instrument-specific credit spread risk exposure inherent in Global Atlantic's credit spread used in valuing embedded derivative liabilities, which serves to mitigate net credit exposure. Global Atlantic may choose to enter into hedge positions to manage credit spread risk. As of December 31, 2023, Global Atlantic had a $600 thousand credit derivative position.
Effect of credit spread sensitivity
In the table below, Global Atlantic estimates the impact of a 50 basis points increase/(decrease) in credit spreads from levels as of December 31, 2023 to its net income and shareholders’ equity, excluding AOCI. These estimated changes include the related income tax impacts and include impacts on instrument-specific credit risk used in valuing embedded derivative liabilities.
| December 31, 2023 | ||||||||||||||
| Hypothetical change | ||||||||||||||
| +50 Basis points | -50 Basis points | |||||||||||||
| ($ in thousands) | ||||||||||||||
| Total estimated net income and shareholders’ equity excluding AOCI sensitivity (point in time) | $ | 181,690 | $ | (187,903) | ||||||||||
In the table below Global Atlantic estimates the impact of a 50 basis point increase/(decrease) in instrument-specific credit risk on market risk benefits, for a parallel shift in the yield curve, from levels as of December 31, 2023 to its AOCI.
| December 31, 2023 | ||||||||||||||
| Hypothetical change | ||||||||||||||
| +50 Basis points | -50 Basis points | |||||||||||||
| ($ in thousands) | ||||||||||||||
| Total estimated AOCI sensitivity (point in time) | $ | 123,692 | $ | (137,731) | ||||||||||
The estimated point in time impact is driven primarily by the effect of changes in the fair value of a market risk benefit attributable to a change in the instrument-specific credit risk. The estimated changes include the related income tax impacts.
222
Equity price risk
Global Atlantic is exposed to equity price risk as a result of changes in the level and volatility of equity prices.
Changes in the level and volatility of equity prices primarily impacts the fair value reported in the consolidated financial statements of the following:
•embedded derivatives and market risk benefits associated with Global Atlantic's variable annuities, fixed-indexed annuities and interest sensitive products;
•financial instruments held in Global Atlantic's investment portfolio and used in its hedge program; and
•certain of Global Atlantic's alternative assets.
Changes in fair value of the foregoing are recorded as gains or losses in our consolidated statements of operations.
In addition, certain of the fees Global Atlantic earns in its variable annuity and variable universal life blocks are calculated on the account values, which are exposed to equity price risk. These changes impact our net income over the periods following equity price moves.
Effect of equity price sensitivity
In the table below, Global Atlantic estimates the impact of a 10% increase/(decrease) in equity prices from levels as of December 31, 2023 to its net income and shareholders’ equity, excluding AOCI. These sensitivities include the impact of related hedges but exclude the potential impact of alternative assets, because the fair value of these investments do not necessarily move directly in line with movements in public equity markets.
| December 31, 2023 | ||||||||||||||
Hypothetical change(1) | ||||||||||||||
| +10% Equity Prices | -10% Equity Prices | |||||||||||||
| ($ in thousands) | ||||||||||||||
| Total estimated net income and shareholders’ equity excluding AOCI sensitivity (point in time) | $ | (14.861) | $ | 10,129 | ||||||||||
Total estimated net income and shareholders’ equity excluding AOCI sensitivity (over 12 months)(2) | $ | 4,660 | $ | (5.161) | ||||||||||
(1)From time to time, Global Atlantic may choose to enter into additional hedges to mitigate economic exposure to equity markets.
(2)Excludes point in time impact. Estimated sensitivity to a hypothetical change over 12 months does not take into account any management actions that may be taken to mitigate actual impacts.
The estimated point-in-time impact is driven by an increase/(decrease) in the value of (i) the embedded derivatives associated with Global Atlantic's fixed-indexed annuity and interest sensitive life products, (ii) its variable annuity embedded derivatives, (iii) market risk benefits, and (iv) a gains (losses) in financial instruments used in its hedging program based on balances in place at year-end. These estimated changes include the impact of related amortization of deferred revenue and expenses and related income tax impacts.
For a discussion of current market conditions, see "Risk Factors" and "Management's Discussion and Analysis of Financial Condition and Results of Operations—Business Environment."
223
ITEM 8. FINANCIAL STATEMENTS AND SUPPLEMENTARY DATA
INDEX TO CONSOLIDATED FINANCIAL STATEMENTS
| Report of Independent Registered Public Accounting Firm | |||||
| Consolidated Statements of Financial Condition as of December 31, 2023 and 2022 | |||||
| Consolidated Statements of Operations for the Years Ended December 31, 2023, 2022 and 2021 | |||||
| Consolidated Statements of Comprehensive Income (Loss) for the Years Ended December 31, 2023, 2022 and 2021 | |||||
| Consolidated Statements of Changes in Equity for the Years Ended December 31, 2023, 2022 and 2021 | |||||
| Consolidated Statements of Cash Flows for the Years Ended December 31, 2023, 2022 and 2021 | |||||
| Notes to Consolidated Financial Statements | |||||
224
REPORT OF INDEPENDENT REGISTERED PUBLIC ACCOUNTING FIRM
To the Shareholders and the Board of Directors of KKR & Co. Inc.:
Opinions on the Financial Statements and Internal Control over Financial Reporting
We have audited the accompanying consolidated statement of financial condition of KKR & Co. Inc. and its subsidiaries (the "Company") as of December 31, 2023 and 2022, the related consolidated statements of operations, comprehensive income (loss), changes in equity, and cash flows for each of the three years in the period ended December 31, 2023, and the related notes and the schedule listed in the Index at Item 15 (collectively referred to as the "financial statements"). We also have audited the Company’s internal control over financial reporting as of December 31, 2023, based on criteria established in Internal Control — Integrated Framework (2013) issued by the Committee of Sponsoring Organizations of the Treadway Commission (COSO).
In our opinion, the financial statements referred to above present fairly, in all material respects, the financial position of the Company as of December 31, 2023 and 2022, and the results of its operations and its cash flows for each of the three years in the period ended December 31, 2023, in conformity with accounting principles generally accepted in the United States of America. Also, in our opinion, the Company maintained, in all material respects, effective internal control over financial reporting as of December 31, 2023, based on criteria established in Internal Control — Integrated Framework (2013) issued by COSO.
Accounting Pronouncement Recently Adopted
As discussed in Note 2 to the financial statements, effective January 1, 2023, the Company adopted Accounting Standards Update (ASU) 2018-12, Financial Services – Insurance (Topic 944): Targeted Improvements to the Accounting for Long-Duration Contracts, with retrospective application to February 1, 2021. The adoption of ASU 2018-12 is also communicated as a critical audit matter below.
Basis for Opinions
The Company’s management is responsible for these financial statements, for maintaining effective internal control over financial reporting, and for its assessment of the effectiveness of internal control over financial reporting, included in the accompanying Management’s Report on Internal Control over Financial Reporting. Our responsibility is to express an opinion on these financial statements and an opinion on the Company’s internal control over financial reporting based on our audits. We are a public accounting firm registered with the Public Company Accounting Oversight Board (United States) (PCAOB) and are required to be independent with respect to the Company in accordance with the U.S. federal securities laws and the applicable rules and regulations of the Securities and Exchange Commission and the PCAOB.
We conducted our audits in accordance with the standards of the PCAOB. Those standards require that we plan and perform the audits to obtain reasonable assurance about whether the financial statements are free of material misstatement, whether due to error or fraud, and whether effective internal control over financial reporting was maintained in all material respects.
Our audits of the financial statements included performing procedures to assess the risks of material misstatement of the financial statements, whether due to error or fraud, and performing procedures to respond to those risks. Such procedures included examining, on a test basis, evidence regarding the amounts and disclosures in the financial statements. Our audits also included evaluating the accounting principles used and significant estimates made by management, as well as evaluating the overall presentation of the financial statements. Our audit of internal control over financial reporting included obtaining an understanding of internal control over financial reporting, assessing the risk that a material weakness exists, and testing and evaluating the design and operating effectiveness of internal control based on the assessed risk. Our audits also included performing such other procedures as we considered necessary in the circumstances. We believe that our audits provide a reasonable basis for our opinions.
225
Definition and Limitations of Internal Control over Financial Reporting
A company’s internal control over financial reporting is a process designed to provide reasonable assurance regarding the reliability of financial reporting and the preparation of financial statements for external purposes in accordance with generally accepted accounting principles. A company’s internal control over financial reporting includes those policies and procedures that (1) pertain to the maintenance of records that, in reasonable detail, accurately and fairly reflect the transactions and dispositions of the assets of the company; (2) provide reasonable assurance that transactions are recorded as necessary to permit preparation of financial statements in accordance with generally accepted accounting principles, and that receipts and expenditures of the company are being made only in accordance with authorizations of management and directors of the company; and (3) provide reasonable assurance regarding prevention or timely detection of unauthorized acquisition, use, or disposition of the company’s assets that could have a material effect on the financial statements.
Because of its inherent limitations, internal control over financial reporting may not prevent or detect misstatements. Also, projections of any evaluation of effectiveness to future periods are subject to the risk that controls may become inadequate because of changes in conditions, or that the degree of compliance with the policies or procedures may deteriorate.
Critical Audit Matters
The critical audit matters communicated below are matters arising from the current-period audit of the financial statements that were communicated or required to be communicated to the audit committee and that (1) relate to accounts or disclosures that are material to the financial statements and (2) involved our especially challenging, subjective, or complex judgments. The communication of critical audit matters does not alter in any way our opinion on the financial statements, taken as a whole, and we are not, by communicating the critical audit matters below, providing separate opinions on the critical audit matters or on the accounts or disclosures to which they relate.
Fair Value—Level III Investments—Refer to Notes 2, 7, and 9 to the financial statements
Critical Audit Matter Description
KKR & Co. Inc. and the funds it sponsors and manages have certain investments measured at fair value using unobservable pricing inputs and are classified as Level III Investments. These Level III investments have limited observable market activity and the inputs used in the determination of fair value require significant management judgment or estimation.
In addition, the Company recognizes carried interest from vehicles and accounts that are advised, sponsored or managed by one or more of its subsidiaries (“investment funds”) based on cumulative fund performance to date. At the end of each reporting period, the Company calculates the carried interest that would be due to the Company for each investment fund, pursuant to the investment fund agreements. Certain of the investment funds’ investments are valued using unobservable inputs and thus are classified as Level III in the fair value hierarchy. The change in the fair value of the underlying Level III Investments held by the investment funds is a significant input into the determination of carried interest for each reporting period. As the fair value of underlying investments varies between reporting periods, it is necessary to adjust the amounts recorded as carried interest. Accrued but unpaid carried interest as of the reporting date is reflected in investments in the consolidated statements of financial condition.
We identified certain Level III Investments as a critical audit matter because of the unobservable pricing inputs management used to estimate fair value, and changes in the fair value of these investments directly impacts the amount of unrealized carried interest the Company accrues for the period as well as unrealized investment income recorded during the period.
Performing audit procedures to evaluate the appropriateness of these inputs required a high degree of auditor judgment and an increased extent of effort, including the need to involve our fair value specialists who possess significant investment valuation expertise.
How the Critical Audit Matter Was Addressed in the Audit
Our audit procedures related to the unobservable pricing inputs used by management to estimate the fair values of Level III Investments included the following, among others:
•We involved more senior, more experienced audit team members to perform audit procedures.
•We tested the effectiveness of controls over the determination of the fair value of Level III Investments.
226
•With the assistance of our fair value specialists, we evaluated management’s process for Level III Investments valuation, including their determination of the unobservable pricing inputs used to estimate fair value.
•We assessed the consistency by which management applied its process.
•We evaluated the Company’s historical ability to accurately estimate fair value of Level III Investments by comparing previous estimates of fair value to market transactions with third parties.
Policy Liabilities — Valuation of Policy Liabilities Associated with the Fixed-Indexed Annuity Product — Refer to Notes 2, 8, 9, and 17 to the financial statements
Critical Audit Matter Description
The Company’s products include the fixed-indexed annuity product, which contains equity indexed features that are considered embedded derivatives and are required to be measured at fair value. In addition, certain fixed-indexed annuity contracts are issued with guarantees, which are considered Market Risk Benefits (“MRBs”).
Management applies significant judgment in selecting assumptions used to estimate the value of embedded derivative liabilities and MRBs associated with the fixed-indexed annuity product. Changes in market conditions or variations in certain assumptions could result in significant fluctuations in these estimates. Principal assumptions include surrender, withdrawal, benefit utilization, mortality, option budgets, future index credits, equity market return, interest rates, and nonperformance risk assumptions.
We identified the valuation of embedded derivative liabilities, and MRBs associated with the fixed-indexed annuity product as a critical audit matter because of the inherent management judgement required in selecting assumptions.
Performing audit procedures to evaluate the judgments made and the reasonableness of assumptions and models used in the valuations required a high degree of auditor judgment and an increased extent of auditor effort. The audit effort included the use of professionals with specialized skill and knowledge, including our valuation, modeling, and actuarial specialists, to assist in performing these procedures and evaluating the audit evidence obtained from these procedures.
How the Critical Audit Matter Was Addressed in the Audit
Our audit procedures related to the valuation of embedded derivative liabilities and MRBs associated with the fixed-indexed annuity product included the following, among others:
•We involved more senior, more experienced audit team members to perform audit procedures.
•We tested the effectiveness of controls over the assumptions, including controls over the underlying data used in the valuation of these liabilities.
•With the assistance of our valuation, modeling, and actuarial specialists, we:
◦Evaluated the methods and judgments applied by management in the determination of principal assumptions used in the valuation of embedded derivative liabilities and MRBs associated with the fixed-indexed annuity product.
◦Evaluated the results of underlying experience studies, capital market projections, and judgments applied by management in setting the assumptions.
◦Developed an independent estimate of embedded derivative liabilities and MRBs associated with the fixed-indexed annuity production on a sample basis and evaluated differences.
227
ASU 2018-12 Implementation – Refer to Note 2 to the financial statements
Critical Audit Matter Description
Effective January 1, 2023, KKR adopted new accounting guidance for the insurance and reinsurance companies that issue long-duration contracts (“LDTI”), with retrospective application to February 1, 2021 (“GA Acquisition Date”), coinciding with the acquisition of Global Atlantic by KKR (see Accounting Pronouncement Recently Adopted explanatory paragraph above).
The adoption of LDTI significantly modified the Company’s accounting for and disclosure of long duration insurance contracts, including the modification of certain complex valuation models and the introduction of a new model for a new category of benefits referred to as MRBs. Audit procedures to evaluate the full retrospective adoption of LDTI required significant audit effort, including the involvement of our actuarial specialists.
How the Critical Audit Matter Was Addressed in the Audit
Our audit procedures related to the adoption of LDTI included the following, among others:
•We involved senior, more experienced audit team members, including actuarial specialists, to plan and perform audit procedures.
•We tested the effectiveness of controls, including those related to the changes made to measurement models.
•We evaluated the appropriateness of the Company’s accounting policies and methodologies involved in the adoption of the LDTI.
•We involved our actuarial specialists to assist us in evaluating the reasonableness and conceptual soundness of the measurement models.
/s/ Deloitte & Touche LLP
February 29, 2024
We have served as the Company's auditor since 2006.
228
KKR & CO. INC.
CONSOLIDATED STATEMENTS OF FINANCIAL CONDITION
(Amounts in Thousands, Except Share and Per Share Data)
| December 31, 2023 | December 31, 2022 | ||||||||||
| Assets | |||||||||||
| Asset Management | |||||||||||
| Cash and Cash Equivalents | $ | $ | |||||||||
| Restricted Cash and Cash Equivalents | |||||||||||
| Investments | |||||||||||
| Due from Affiliates | |||||||||||
| Other Assets | |||||||||||
| Insurance | |||||||||||
| Cash and Cash Equivalents | $ | $ | |||||||||
| Restricted Cash and Cash Equivalents | |||||||||||
| Investments | |||||||||||
| Reinsurance Recoverable | |||||||||||
| Insurance Intangible Assets | |||||||||||
| Other Assets | |||||||||||
| Separate Account Assets | |||||||||||
| Total Assets | $ | $ | |||||||||
| Liabilities and Equity | |||||||||||
| Asset Management | |||||||||||
| Debt Obligations | $ | $ | |||||||||
| Due to Affiliates | |||||||||||
| Accrued Expenses and Other Liabilities | |||||||||||
| Insurance | |||||||||||
Policy Liabilities (market risk benefit liabilities: $ | $ | $ | |||||||||
| Debt Obligations | |||||||||||
| Funds Withheld Payable at Interest | |||||||||||
| Accrued Expenses and Other Liabilities | |||||||||||
| Reinsurance Liabilities | |||||||||||
| Separate Account Liabilities | |||||||||||
| Total Liabilities | |||||||||||
229
| December 31, 2023 | December 31, 2022 | ||||||||||
| Commitments and Contingencies (See Note 24) | |||||||||||
| Redeemable Noncontrolling Interests (See Note 23) | $ | $ | |||||||||
| Stockholders' Equity | |||||||||||
Series C Mandatory Convertible Preferred Stock, $ | $ | $ | |||||||||
Series I Preferred Stock, $ | |||||||||||
Common Stock, $ | |||||||||||
| Additional Paid-In Capital | |||||||||||
| Retained Earnings | |||||||||||
| Accumulated Other Comprehensive Income (Loss) ("AOCI") | ( | ( | |||||||||
| Total KKR & Co. Inc. Stockholders' Equity | |||||||||||
| Noncontrolling Interests (See Note 22) | |||||||||||
| Total Equity | |||||||||||
| Total Liabilities and Equity | $ | $ | |||||||||
See notes to financial statements.
230
KKR & CO. INC.
CONSOLIDATED STATEMENTS OF FINANCIAL CONDITION (CONTINUED)
(Amounts in Thousands)
The following presents the portion of the consolidated balances provided in the consolidated statements of financial condition attributable to consolidated variable interest entities ("VIEs"). As of December 31, 2023 and 2022, KKR's consolidated VIEs consist primarily of (i) certain collateralized financing entities ("CFEs") holding collateralized loan obligations ("CLOs"), (ii) certain investment funds, and (iii) certain VIEs formed by Global Atlantic. The noteholders, creditors and equity holders of these VIEs have no recourse to the assets of any other KKR entity.
With respect to consolidated CLOs and certain investment funds, the following assets may only be used to settle obligations of these consolidated VIEs and the following liabilities are only the obligations of these consolidated VIEs and not generally to KKR. Additionally, KKR has no right to the benefits from, nor does KKR bear the risks associated with, the assets held by these VIEs beyond KKR's beneficial interest therein and any income generated from the VIEs. There are neither explicit arrangements nor does KKR hold implicit variable interests that would require KKR to provide any material ongoing financial support to the consolidated VIEs, beyond amounts previously committed to them, if any.
With respect to certain other VIEs consolidated by Global Atlantic, Global Atlantic has formed certain VIEs to hold investments, including fixed maturity securities, consumer and other loans, renewable energy, transportation and real estate. These VIEs issue beneficial interests primarily to Global Atlantic’s insurance companies.
| December 31, 2023 | |||||||||||||||||||||||
| Consolidated CLOs | Consolidated Funds and Other Investment Vehicles | Other VIEs | Total | ||||||||||||||||||||
| Assets | |||||||||||||||||||||||
| Asset Management | |||||||||||||||||||||||
| Cash and Cash Equivalents | $ | $ | $ | $ | |||||||||||||||||||
| Restricted Cash and Cash Equivalents | |||||||||||||||||||||||
| Investments | |||||||||||||||||||||||
| Other Assets | |||||||||||||||||||||||
| Insurance | |||||||||||||||||||||||
| Cash and Cash Equivalents | |||||||||||||||||||||||
| Investments | |||||||||||||||||||||||
| Other Assets | |||||||||||||||||||||||
| Total Assets | $ | $ | $ | $ | |||||||||||||||||||
| Liabilities | |||||||||||||||||||||||
| Asset Management | |||||||||||||||||||||||
| Debt Obligations | $ | $ | $ | $ | |||||||||||||||||||
| Accrued Expenses and Other Liabilities | |||||||||||||||||||||||
| Insurance | |||||||||||||||||||||||
| Accrued Expenses and Other Liabilities | |||||||||||||||||||||||
| Total Liabilities | $ | $ | $ | $ | |||||||||||||||||||
231
| December 31, 2022 | |||||||||||||||||||||||
| Consolidated CLOs | Consolidated Funds and Other Investment Vehicles | Other VIEs | Total | ||||||||||||||||||||
| Assets | |||||||||||||||||||||||
| Asset Management | |||||||||||||||||||||||
| Cash and Cash Equivalents | $ | $ | $ | $ | |||||||||||||||||||
| Restricted Cash and Cash Equivalents | |||||||||||||||||||||||
| Investments | |||||||||||||||||||||||
| Other Assets | |||||||||||||||||||||||
| Insurance | |||||||||||||||||||||||
| Cash and Cash Equivalents | |||||||||||||||||||||||
| Investments | |||||||||||||||||||||||
| Other Assets | |||||||||||||||||||||||
| Total Assets | $ | $ | $ | $ | |||||||||||||||||||
| Liabilities | |||||||||||||||||||||||
| Asset Management | |||||||||||||||||||||||
| Debt Obligations | $ | $ | $ | $ | |||||||||||||||||||
| Accrued Expenses and Other Liabilities | |||||||||||||||||||||||
| Insurance | |||||||||||||||||||||||
| Accrued Expenses and Other Liabilities | |||||||||||||||||||||||
| Total Liabilities | $ | $ | $ | $ | |||||||||||||||||||
See notes to financial statements.
232
KKR & CO. INC.
CONSOLIDATED STATEMENTS OF OPERATIONS
(Amounts in Thousands, Except Share and Per Share Data)
| Years Ended December 31, | |||||||||||||||||
| 2023 | 2022 | 2021 | |||||||||||||||
| Revenues | |||||||||||||||||
| Asset Management | |||||||||||||||||
| Fees and Other | $ | $ | $ | ||||||||||||||
| Capital Allocation-Based Income (Loss) | ( | ||||||||||||||||
| Insurance | |||||||||||||||||
| Net Premiums | |||||||||||||||||
| Policy Fees | |||||||||||||||||
| Net Investment Income | |||||||||||||||||
| Net Investment-Related Gains (Losses) | ( | ( | |||||||||||||||
| Other Income | |||||||||||||||||
| Total Revenues | |||||||||||||||||
| Expenses | |||||||||||||||||
| Asset Management | |||||||||||||||||
| Compensation and Benefits | |||||||||||||||||
| Occupancy and Related Charges | |||||||||||||||||
| General, Administrative and Other | |||||||||||||||||
| Insurance | |||||||||||||||||
Net Policy Benefits and Claims (including market risk benefit loss (gain) of $ | |||||||||||||||||
| Amortization of Policy Acquisition Costs | ( | ||||||||||||||||
| Interest Expense | |||||||||||||||||
| Insurance Expenses | |||||||||||||||||
| General, Administrative and Other | |||||||||||||||||
| Total Expenses | |||||||||||||||||
| Investment Income (Loss) - Asset Management | |||||||||||||||||
| Net Gains (Losses) from Investment Activities | ( | ||||||||||||||||
| Dividend Income | |||||||||||||||||
| Interest Income | |||||||||||||||||
| Interest Expense | ( | ( | ( | ||||||||||||||
| Total Investment Income (Loss) | |||||||||||||||||
| Income (Loss) Before Taxes | ( | ||||||||||||||||
| Income Tax Expense (Benefit) | |||||||||||||||||
233
| Years Ended December 31, | |||||||||||||||||
| 2023 | 2022 | 2021 | |||||||||||||||
| Net Income (Loss) | ( | ||||||||||||||||
| Net Income (Loss) Attributable to Redeemable Noncontrolling Interests | ( | ||||||||||||||||
| Net Income (Loss) Attributable to Noncontrolling Interests | |||||||||||||||||
| Net Income (Loss) Attributable to KKR & Co. Inc. | ( | ||||||||||||||||
| Series A Preferred Stock Dividends | |||||||||||||||||
| Series B Preferred Stock Dividends | |||||||||||||||||
| Series C Mandatory Convertible Preferred Stock Dividends | |||||||||||||||||
| Net Income (Loss) Attributable to KKR & Co. Inc. Common Stockholders | $ | $ | ( | $ | |||||||||||||
| Net Income (Loss) Attributable to KKR & Co. Inc. Per Share of Common Stock | |||||||||||||||||
| Basic | $ | $ | ( | $ | |||||||||||||
| Diluted | $ | $ | ( | $ | |||||||||||||
| Weighted Average Shares of Common Stock Outstanding | |||||||||||||||||
| Basic | |||||||||||||||||
| Diluted | |||||||||||||||||
See notes to financial statements.
234
KKR & CO. INC.
CONSOLIDATED STATEMENTS OF COMPREHENSIVE INCOME (LOSS)
(Amounts in Thousands)
| Years Ended December 31, | |||||||||||||||||
| 2023 | 2022 | 2021 | |||||||||||||||
| Net Income (Loss) | $ | $ | ( | $ | |||||||||||||
| Other Comprehensive Income (Loss), Net of Tax: | |||||||||||||||||
| Unrealized Gains (Losses) on Available-For-Sale Securities and Other | ( | ( | |||||||||||||||
| Net effect of changes in discount rates and instrument-specific credit risk on policy liabilities | ( | ||||||||||||||||
| Foreign Currency Translation Adjustments | ( | ( | ( | ||||||||||||||
| Comprehensive Income (Loss) | ( | ||||||||||||||||
| Comprehensive Income (Loss) Attributable to Redeemable Noncontrolling Interests | ( | ||||||||||||||||
| Comprehensive Income (Loss) Attributable to Noncontrolling Interests | ( | ||||||||||||||||
| Comprehensive Income (Loss) Attributable to KKR & Co. Inc. | $ | $ | ( | $ | |||||||||||||
See notes to financial statements.
235
KKR & CO. INC. CONSOLIDATED STATEMENTS OF CHANGES IN EQUITY (Amounts in Thousands, Except Share and Per Share Data) | |||||||||||
| Year Ended December 31, 2023 | |||||||||||
| Amounts | Shares | ||||||||||
| Series C Mandatory Convertible Preferred Stock | |||||||||||
| Beginning of Period | $ | ||||||||||
| Conversion of Series C Mandatory Convertible Preferred Stock | ( | ( | |||||||||
| End of Period | |||||||||||
| Series I Preferred Stock | |||||||||||
| Beginning of Period | — | ||||||||||
| End of Period | — | ||||||||||
| Common Stock | |||||||||||
| Beginning of Period | |||||||||||
| Clawback of Transfer Restricted Shares | — | ( | |||||||||
| Net Delivery of Common Stock (Equity Incentive Plans) | |||||||||||
| Conversion of Series C Mandatory Convertible Preferred Stock | |||||||||||
| Repurchases of Common Stock | ( | ( | |||||||||
| End of Period | |||||||||||
| Additional Paid-In Capital | |||||||||||
| Beginning of Period (as previously reported for the prior period) | |||||||||||
| Beginning of Period (as revised for the prior period) | |||||||||||
| Conversion of Series C Mandatory Convertible Preferred Stock | |||||||||||
| Excise Tax on Repurchases of Common Stock | ( | ||||||||||
| Net Delivery of Common Stock (Equity Incentive Plans) | ( | ||||||||||
| Repurchases of Common Stock | ( | ||||||||||
| Equity-Based Compensation | |||||||||||
| Change in KKR & Co. Inc.'s Ownership Interest (See Note 22) | |||||||||||
| Tax Effects of Changes in Ownership and Other | |||||||||||
| End of Period | |||||||||||
| Retained Earnings | |||||||||||
| Beginning of Period (as previously reported for the prior period) | |||||||||||
| Adoption of New Accounting Standard (See Note 2) | |||||||||||
| Beginning of Period (as revised for the prior period) | |||||||||||
| Net Income (Loss) Attributable to KKR & Co. Inc. | |||||||||||
Series C Mandatory Convertible Preferred Stock Dividends ($ | ( | ||||||||||
Common Stock Dividends ($ | ( | ||||||||||
| End of Period | |||||||||||
| Accumulated Other Comprehensive Income (Loss) (net of tax) | |||||||||||
| Beginning of Period (as previously reported for the prior period) | ( | ||||||||||
| Adoption of New Accounting Standard (See Note 2) | |||||||||||
| Beginning of Period (as revised for the prior period) | ( | ||||||||||
| Other Comprehensive Income (Loss) | |||||||||||
| Change in KKR & Co. Inc.'s Ownership Interest (See Note 22) | ( | ||||||||||
| End of Period | ( | ||||||||||
| Total KKR & Co. Inc. Stockholders' Equity | |||||||||||
| Noncontrolling Interests (See Note 22) | |||||||||||
| Total Equity | $ | ||||||||||
| Redeemable Noncontrolling Interests (See Note 23) | $ | ||||||||||
236
KKR & CO. INC. CONSOLIDATED STATEMENTS OF CHANGES IN EQUITY (CONTINUED) (Amounts in Thousands, Except Share and Per Share Data) | |||||||||||
| Year Ended December 31, 2022 | |||||||||||
| Amounts | Shares | ||||||||||
| Series C Mandatory Convertible Preferred Stock | |||||||||||
| Beginning of Period | $ | ||||||||||
| Conversion of Series C Mandatory Convertible Preferred Stock | — | ( | |||||||||
| End of Period | |||||||||||
| Series I Preferred Stock | |||||||||||
| Beginning of Period | — | ||||||||||
| End of Period | — | ||||||||||
| Series II Preferred Stock | |||||||||||
| Beginning of Period | |||||||||||
| Cancellation of Series II Preferred Stock - Holdings Merger (See Note 1) | ( | ( | |||||||||
| Cancellation of Series II Preferred Stock | ( | ( | |||||||||
| End of Period | |||||||||||
| Common Stock | |||||||||||
| Beginning of Period | |||||||||||
| Clawback of Transfer Restricted Shares | — | ( | |||||||||
| Exchange of KKR Holdings Units | |||||||||||
| Holdings Merger (See Note 1) | |||||||||||
| Net Delivery of Common Stock (Equity Incentive Plans) | |||||||||||
| Conversion of Series C Mandatory Convertible Preferred Stock | — | ||||||||||
| Repurchases of Common Stock | ( | ( | |||||||||
| End of Period | |||||||||||
| Additional Paid-In Capital | |||||||||||
| Beginning of Period (as previously reported) | |||||||||||
| Adoption of New Accounting Standard (See Note 2) | — | ||||||||||
| Beginning of Period | |||||||||||
| Exchange of KKR Holdings Units | |||||||||||
| Holdings Merger (See Note 1) | |||||||||||
| Tax Effects - Holdings Merger and Other (See Note 1) | ( | ||||||||||
| Net Delivery of Common Stock (Equity Incentive Plans) | ( | ||||||||||
| Repurchases of Common Stock | ( | ||||||||||
| Equity-Based Compensation | |||||||||||
| Change in KKR & Co. Inc.'s Ownership Interest (See Note 22) | |||||||||||
| End of Period | |||||||||||
| Retained Earnings | |||||||||||
| Beginning of Period (as previously reported) | |||||||||||
| Adoption of New Accounting Standard (See Note 2) | |||||||||||
| Beginning of Period (as revised) | |||||||||||
| Net Income (Loss) Attributable to KKR & Co. Inc. | ( | ||||||||||
Series C Mandatory Convertible Preferred Stock Dividends ($ | ( | ||||||||||
Common Stock Dividends ($ | ( | ||||||||||
| End of Period | |||||||||||
| Accumulated Other Comprehensive Income (Loss) (net of tax) | |||||||||||
| Beginning of Period (as previously reported) | ( | ||||||||||
| Adoption of New Accounting Standard (See Note 2) | |||||||||||
| Beginning of Period (as revised) | ( | ||||||||||
| Other Comprehensive Income (Loss) | ( | ||||||||||
| Exchange of KKR Holdings Units | ( | ||||||||||
| Holdings Merger (See Note 1) | ( | ||||||||||
| Change in KKR & Co. Inc.'s Ownership Interest (See Note 22) | ( | ||||||||||
| End of Period | ( | ||||||||||
| Total KKR & Co. Inc. Stockholders' Equity | |||||||||||
| Noncontrolling Interests (See Note 22) | |||||||||||
| Total Equity | $ | ||||||||||
| Redeemable Noncontrolling Interests (See Note 23) | $ | ||||||||||
237
KKR & CO. INC. CONSOLIDATED STATEMENTS OF CHANGES IN EQUITY (Continued) (Amounts in Thousands, Except Share and Per Share Data) | |||||||||||
| Year Ended December 31, 2021 | |||||||||||
| Amounts | Shares | ||||||||||
| Series A and B Preferred Stock | |||||||||||
| Beginning of Period | $ | ||||||||||
| Redemption of Series A Preferred Stock | ( | ( | |||||||||
| Redemption of Series B Preferred Stock | ( | ( | |||||||||
| End of Period | |||||||||||
| Series C Mandatory Convertible Preferred Stock | |||||||||||
| Beginning of Period | |||||||||||
| End of Period | |||||||||||
| Series I Preferred Stock | |||||||||||
| Beginning of Period | — | ||||||||||
| End of Period | — | ||||||||||
| Series II Preferred Stock | |||||||||||
| Beginning of Period | |||||||||||
| Cancellation of Series II Preferred Stock | ( | ( | |||||||||
| End of Period | |||||||||||
| Common Stock | |||||||||||
| Beginning of Period | |||||||||||
| Private Placement Share Issuance | |||||||||||
| Exchange of KKR Holdings Units | |||||||||||
| Net Delivery of Common Stock (Equity Incentive Plans) | |||||||||||
| Clawback of Transfer Restricted Shares | — | ( | |||||||||
| Repurchases of Common Stock | ( | ( | |||||||||
| End of Period | |||||||||||
| Additional Paid-In Capital | |||||||||||
| Beginning of Period | |||||||||||
| Private Placement Share Issuance | |||||||||||
| Exchange of KKR Holdings Units | |||||||||||
| Tax Effects - Exchange of KKR Holdings Units and Other | |||||||||||
| Net Delivery of Common Stock (Equity Incentive Plans) | ( | ||||||||||
| Repurchases of Common Stock | ( | ||||||||||
| Equity-Based Compensation | |||||||||||
| End of Period | |||||||||||
| Retained Earnings | |||||||||||
| Beginning of Period | |||||||||||
| Net Income (Loss) Attributable to KKR & Co. Inc. | |||||||||||
Series A Preferred Stock Dividends ($ | ( | ||||||||||
| Redemption of Series A Preferred Stock | ( | ||||||||||
Series B Preferred Stock Dividends ($ | ( | ||||||||||
| Redemption of Series B Preferred Stock | ( | ||||||||||
Series C Mandatory Convertible Preferred Stock Dividends ($ | ( | ||||||||||
Common Stock Dividends ($ | ( | ||||||||||
| End of Period | |||||||||||
| Accumulated Other Comprehensive Income (Loss) (net of tax) | |||||||||||
| Beginning of Period | ( | ||||||||||
| Other Comprehensive Income (Loss) | ( | ||||||||||
| Exchange of KKR Holdings Units | ( | ||||||||||
| End of Period | ( | ||||||||||
| Total KKR & Co. Inc. Stockholders' Equity | |||||||||||
| Noncontrolling Interests (See Note 22) | |||||||||||
| Total Equity | $ | ||||||||||
| Redeemable Noncontrolling Interests (See Note 23) | $ | ||||||||||
See notes to financial statements.
238
KKR & CO. INC.
CONSOLIDATED STATEMENTS OF CASH FLOWS
(Amounts in Thousands)
| Years Ended December 31, | |||||||||||||||||
| 2023 | 2022 | 2021 | |||||||||||||||
| Operating Activities | |||||||||||||||||
| Net Income (Loss) | $ | $ | ( | $ | |||||||||||||
| Adjustments to Reconcile Net Income (Loss) to Net Cash Provided (Used) by Operating Activities: | |||||||||||||||||
| Equity-Based and Other Non-Cash Compensation | |||||||||||||||||
| Net Realized (Gains) Losses - Asset Management | ( | ( | |||||||||||||||
| Change in Unrealized (Gains) Losses - Asset Management | ( | ( | |||||||||||||||
| Capital Allocation-Based (Income) Loss - Asset Management | ( | ( | |||||||||||||||
| Net Investment and Policy Liability-Related (Gains) Losses - Insurance | |||||||||||||||||
| Net Accretion and Amortization | |||||||||||||||||
| Interest Credited to Policyholder Account Balances (net of Policy Fees) - Insurance | |||||||||||||||||
| Other Non-Cash Amounts | ( | ||||||||||||||||
| Cash Flows Due to Changes in Operating Assets and Liabilities: | |||||||||||||||||
| Reinsurance Transactions and Acquisitions, Net of Cash Provided - Insurance | |||||||||||||||||
| Change in Premiums, Notes Receivable and Reinsurance Recoverable, Net of Reinsurance Premiums Payable - Insurance | |||||||||||||||||
| Change in Deferred Policy Acquisition Costs - Insurance | ( | ( | ( | ||||||||||||||
| Change in Policy Liabilities and Accruals, Net - Insurance | ( | ( | ( | ||||||||||||||
| Change in Consolidation | ( | ( | ( | ||||||||||||||
| Change in Due from / to Affiliates | ( | ( | |||||||||||||||
| Change in Other Assets | |||||||||||||||||
| Change in Accrued Expenses and Other Liabilities | ( | ||||||||||||||||
| Investments Purchased - Asset Management | ( | ( | ( | ||||||||||||||
| Proceeds from Investments - Asset Management | |||||||||||||||||
| Net Cash Provided (Used) by Operating Activities | ( | ( | ( | ||||||||||||||
| Investing Activities | |||||||||||||||||
| Acquisition of Global Atlantic, Net of Cash Acquired | ( | ||||||||||||||||
| Acquisition of KJRM, Net of Cash Acquired | ( | ||||||||||||||||
| Purchases of Fixed Assets | ( | ( | ( | ||||||||||||||
| Investments Purchased - Insurance | ( | ( | ( | ||||||||||||||
| Proceeds from Investments - Insurance | |||||||||||||||||
| Other Investing Activities, Net - Insurance | ( | ||||||||||||||||
| Net Cash Provided (Used) by Investing Activities | ( | ( | ( | ||||||||||||||
| Financing Activities | |||||||||||||||||
| Series A and B Preferred Stock Dividends | ( | ||||||||||||||||
| Series C Mandatory Convertible Preferred Stock Dividends | ( | ( | ( | ||||||||||||||
| Common Stock Dividends | ( | ( | ( | ||||||||||||||
| Distributions to Redeemable Noncontrolling Interests | ( | ( | ( | ||||||||||||||
| Contributions from Redeemable Noncontrolling Interests | |||||||||||||||||
| Distributions to Noncontrolling Interests | ( | ( | ( | ||||||||||||||
| Contributions from Noncontrolling Interests | |||||||||||||||||
| Redemption of Series A and B Preferred Stock | ( | ||||||||||||||||
| Net Delivery of Common Stock (Equity Incentive Plans) | ( | ( | ( | ||||||||||||||
| Repurchases of Common Stock | ( | ( | ( | ||||||||||||||
| Private Placement Share Issuance | |||||||||||||||||
| Proceeds from Debt Obligations | |||||||||||||||||
| Repayment of Debt Obligations | ( | ( | ( | ||||||||||||||
| Financing Costs Paid | ( | ( | ( | ||||||||||||||
| Additions to Contractholder Deposit Funds - Insurance | |||||||||||||||||
| Withdrawals from Contractholder Deposit Funds - Insurance | ( | ( | ( | ||||||||||||||
239
| Years Ended December 31, | |||||||||||||||||
| 2023 | 2022 | 2021 | |||||||||||||||
| Reinsurance Transactions, Net of Cash Provided - Insurance | |||||||||||||||||
| Other Financing Activity, Net - Insurance | |||||||||||||||||
| Net Cash Provided (Used) by Financing Activities | |||||||||||||||||
| Effect of exchange rate changes on cash, cash equivalents and restricted cash | ( | ( | |||||||||||||||
| Net Increase/(Decrease) in Cash, Cash Equivalents and Restricted Cash | $ | $ | $ | ||||||||||||||
| Cash, Cash Equivalents and Restricted Cash, Beginning of Period | |||||||||||||||||
| Cash, Cash Equivalents and Restricted Cash, End of Period | $ | $ | $ | ||||||||||||||
| Cash, Cash Equivalents and Restricted Cash are comprised of the following: | |||||||||||||||||
| Beginning of the Period | |||||||||||||||||
| Asset Management | |||||||||||||||||
| Cash and Cash Equivalents | $ | $ | $ | ||||||||||||||
| Restricted Cash and Cash Equivalents | |||||||||||||||||
| Total Asset Management | |||||||||||||||||
| Insurance | |||||||||||||||||
| Cash and Cash Equivalents | $ | $ | $ | ||||||||||||||
| Restricted Cash and Cash Equivalents | |||||||||||||||||
| Total Insurance | |||||||||||||||||
| Cash, Cash Equivalents and Restricted Cash, Beginning of Period | $ | $ | $ | ||||||||||||||
| End of the Period | |||||||||||||||||
| Asset Management | |||||||||||||||||
| Cash and Cash Equivalents | $ | $ | $ | ||||||||||||||
| Restricted Cash and Cash Equivalents | |||||||||||||||||
| Total Asset Management | |||||||||||||||||
| Insurance | |||||||||||||||||
| Cash and Cash Equivalents | $ | $ | $ | ||||||||||||||
| Restricted Cash and Cash Equivalents | |||||||||||||||||
| Total Insurance | |||||||||||||||||
| Cash, Cash Equivalents and Restricted Cash, End of Period | $ | $ | $ | ||||||||||||||
See notes to financial statements.
240
KKR & CO. INC.
CONSOLIDATED STATEMENTS OF CASH FLOWS (CONTINUED)
(Amounts in Thousands)
| Years Ended December 31, | |||||||||||||||||
| 2023 | 2022 | 2021 | |||||||||||||||
| Supplemental Disclosures of Cash Flow Information | |||||||||||||||||
| Payments for Interest | $ | $ | $ | ||||||||||||||
| Payments for Income Taxes | $ | $ | $ | ||||||||||||||
| Payments for Operating Lease Liabilities | $ | $ | $ | ||||||||||||||
| Supplemental Disclosures of Non-Cash Investing and Financing Activities | |||||||||||||||||
| Non-Cash Contribution from Noncontrolling Interests | $ | $ | $ | ||||||||||||||
| Non-Cash Distribution to Noncontrolling Interests | $ | ( | $ | $ | |||||||||||||
| Non-Cash Distribution to Redeemable Noncontrolling Interests | $ | $ | $ | ( | |||||||||||||
| Debt Obligations - Net Gains (Losses), Translation and Other | $ | ( | $ | $ | |||||||||||||
| Tax Effects - Exchange of KKR Holdings L.P. Units and Other (See Note 1) | $ | $ | ( | $ | |||||||||||||
| Tax Effects of Changes in Ownership and Other | $ | $ | $ | ||||||||||||||
| Right-of-Use Assets obtained in Exchange for new Operating Lease Liabilities | $ | $ | $ | ||||||||||||||
| Investments Acquired through Reinsurance Agreements | $ | $ | $ | ||||||||||||||
| Contractholder Deposit Funds Acquired through Reinsurance Agreements | $ | $ | $ | ||||||||||||||
| Change in Consolidation | |||||||||||||||||
| Investments - Asset Management | $ | ( | $ | ( | $ | ( | |||||||||||
| Investments - Insurance | $ | ( | $ | $ | |||||||||||||
| Due from Affiliates | $ | $ | $ | ( | |||||||||||||
| Other Assets | $ | ( | $ | ( | $ | ( | |||||||||||
| Debt Obligations | $ | $ | ( | $ | ( | ||||||||||||
| Due to Affiliates | $ | $ | ( | $ | ( | ||||||||||||
| Accrued Expenses and Other Liabilities | $ | ( | $ | ( | $ | ( | |||||||||||
| Noncontrolling Interests | $ | ( | $ | $ | ( | ||||||||||||
| Redeemable Noncontrolling Interests | $ | ( | $ | $ | |||||||||||||
See notes to financial statements.
241
KKR & CO. INC.
NOTES TO FINANCIAL STATEMENTS
(All Amounts in Thousands, Except Share and Per Share Data, and Except Where Noted)
1. ORGANIZATION
KKR & Co. Inc. (NYSE: KKR), through its subsidiaries (collectively, "KKR"), is a leading global investment firm that offers alternative asset management as well as capital markets and insurance solutions. KKR aims to generate attractive investment returns by following a patient and disciplined investment approach, employing world-class people, and supporting growth in its portfolio companies and communities. KKR sponsors investment funds that invest in private equity, credit and real assets and has strategic partners that manage hedge funds. KKR’s insurance subsidiaries offer retirement, life and reinsurance products under the management of The Global Atlantic Financial Group LLC ("TGAFG" and, together with its insurance companies and other subsidiaries, "Global Atlantic").
KKR & Co. Inc. is the parent company of KKR Group Co. Inc., which in turn owns KKR Group Holdings Corp., which is the general partner of KKR Group Partnership L.P. ("KKR Group Partnership"). KKR & Co. Inc. both indirectly controls KKR Group Partnership and indirectly holds Class A partner interests in KKR Group Partnership ("KKR Group Partnership Units") representing economic interests in KKR's business. As of December 31, 2023, KKR & Co. Inc. held indirectly approximately 99.5 % of the KKR Group Partnership Units. The remaining balance is held indirectly by KKR employees through restricted holdings units representing an ownership interest in KKR Group Partnership Units, which may be exchanged for shares of common stock of KKR & Co. Inc. ("exchangeable securities"). As limited partner interests, these KKR Group Partnership Units are non-voting and do not entitle anyone other than KKR to manage its business and affairs. KKR Group Partnership also has outstanding limited partner interests that provide for a carry pool provided by KKR Associates Holdings L.P. ("Associates Holdings").
References to "KKR" in these financial statements refer to KKR & Co. Inc. and its subsidiaries, including Global Atlantic, unless the context requires otherwise, especially in sections where "KKR" is intended to refer to the asset management business only. References in these financial statements to "principals" are to KKR's current and former employees who held interests in KKR's business through KKR Holdings prior to the Reorganization Mergers (as defined below). References to "Global Atlantic" in these financial statements includes the insurance companies and other subsidiaries of Global Atlantic, which are consolidated by KKR.
Reorganization Agreement
On October 8, 2021, KKR entered into a Reorganization Agreement (the "Reorganization Agreement") with KKR Holdings L.P. ("KKR Holdings"), KKR Management LLP (which holds the sole outstanding share of Series I preferred stock), Associates Holdings, and the other parties thereto. Pursuant to the Reorganization Agreement, the parties agreed to undertake a series of integrated transactions to effect a number of transformative structural and governance changes, some of which were completed on May 31, 2022, and other changes to be completed in the future. On May 31, 2022, KKR completed the merger transactions ("Reorganization Mergers") contemplated by the Reorganization Agreement pursuant to which KKR acquired KKR Holdings (which changed its name to KKR Group Holdings L.P.) and all of the KKR Group Partnership Units held by it.
Pursuant to the Reorganization Agreement, the following transactions will occur in the future on the Sunset Date (as defined below):
i.the control of KKR & Co. Inc. by KKR Management LLP and the Series I Preferred Stock held by it will be eliminated,
ii.the voting rights for all common stock of KKR & Co. Inc., including with respect to the election of directors, will be established on a one vote per share basis, and
iii.KKR will acquire control of Associates Holdings, the entity providing for the allocation of carry proceeds to KKR employees, also known as the carry pool.
242
Notes to Financial Statements (Continued)
2. SUMMARY OF SIGNIFICANT ACCOUNTING POLICIES
Basis of Presentation
The accompanying consolidated financial statements (referred to hereafter as the "financial statements") have been prepared in accordance with accounting principles generally accepted in the United States of America ("GAAP").
KKR consolidates the financial results of KKR Group Partnership and its consolidated entities, which include the accounts of KKR's investment management and capital markets companies, the general partners of certain unconsolidated investment funds, general partners of consolidated investment funds and their respective consolidated investment funds, Global Atlantic’s insurance companies and certain other entities including CFEs. References to Global Atlantic hereafter includes the insurance companies of Global Atlantic, which are consolidated by KKR starting on the 2021 GA Acquisition Date.
The presentations in the consolidated statement of financial condition and consolidated statement of operations reflect the significant industry diversification of KKR by its acquisition of Global Atlantic. Global Atlantic operates an insurance business, and KKR operates an asset management business, each of which possess distinct characteristics. As a result, KKR developed a two-tiered approach for the financial statements presentation, where Global Atlantic's insurance operations are presented separately from KKR's asset management business. KKR believes that these separate presentations provide a more informative view of the consolidated financial position and results of operations than traditional aggregated presentations and that reporting Global Atlantic’s insurance operations separately is appropriate given, among other factors, the relative significance of Global Atlantic’s policy liabilities, which are not obligations of KKR & Co. Inc. (other than the insurance companies that issued them). If a traditional aggregate presentation were to be used, KKR would expect to eliminate or combine several identical or similar captions, which would condense the presentations, but would also reduce the level of information presented. KKR also believes that using a traditional aggregate presentation would result in no new line items compared to the two-tier presentation included in the financial statements in this report.
In addition, in connection with the Global Atlantic acquisition, we organized our business into two segments: Asset Management and Insurance. Global Atlantic’s operations constitute the insurance segment. See Note 21 "Segment Reporting."
The summary of the significant accounting policies has been organized considering the two-tiered approach and includes a section for common accounting policies and an accounting policy section for each of the two tiers when a policy is specific to one of the tiers.
In the ordinary course of business, KKR’s Asset Management business and Global Atlantic enter into transactions with each other, which may include transactions pursuant to their investment management agreements and financing arrangements. All the investment management and financing arrangements between KKR's Asset Management business and Global Atlantic are eliminated in consolidation; however, KKR's allocated share of the net income from the consolidation of Global Atlantic is increased by the amount of fees earned from and decreased by the amount of interest expense incurred from noncontrolling interest holders in Global Atlantic. Accordingly, the elimination of these fees and interest impacts the net income (loss) attributable to KKR and KKR stockholders' equity for the pro-rata ownership of the noncontrolling interests in Global Atlantic.
All intercompany transactions and balances have been eliminated.
SIGNIFICANT ACCOUNTING POLICIES - COMMON AMONG ASSET MANAGEMENT AND INSURANCE
Use of Estimates and Risks and Uncertainties
243
Notes to Financial Statements (Continued)
Principles of Consolidation
The types of entities KKR assesses for consolidation include (i) subsidiaries, including management companies, broker-dealers and general partners of investment funds that KKR manages, (ii) entities that have the attributes of an investment company, like investment funds, (iii) CFEs, (iv) Global Atlantic and its insurance companies beginning on February 1, 2021, and (v) other entities. Each of these entities is assessed for consolidation on a case by case basis depending on the specific facts and circumstances surrounding that entity.
Pursuant to its consolidation policy, KKR first considers whether an entity is considered a VIE and therefore whether to apply the consolidation guidance under the VIE model. Entities that do not qualify as VIEs are assessed for consolidation as voting interest entities ("VOEs") under the voting interest model.
KKR's funds are, for GAAP purposes, investment companies and therefore are not required to consolidate their investments in portfolio companies even if majority-owned and controlled. Rather, the consolidated funds and vehicles reflect their investments at fair value as described below in "—Fair Value Measurements."
An entity in which KKR holds a variable interest is a VIE if any one of the following conditions exist: (a) the total equity investment at risk is not sufficient to permit the legal entity to finance its activities without additional subordinated financial support, (b) the holders of the equity investment at risk (as a group) lack either the direct or indirect ability through voting rights or similar rights to make decisions about a legal entity's activities that have a significant effect on the success of the legal entity or the obligation to absorb the expected losses or right to receive the expected residual returns, or (c) the voting rights of some investors are disproportionate to their obligation to absorb the expected losses of the legal entity, their rights to receive the expected residual returns of the legal entity, or both and substantially all of the legal entity's activities either involve or are conducted on behalf of an investor with disproportionately few voting rights. Limited partnerships and other similar entities where unaffiliated limited partners have not been granted (i) substantive participatory rights or (ii) substantive rights to either dissolve the partnership or remove the general partner ("kick-out rights") are VIEs. KKR's investment funds that are not CFEs (i) are generally limited partnerships, (ii) generally provide KKR with operational discretion and control, and (iii) generally have fund investors with no substantive rights to impact ongoing governance and operating activities of the fund, including the ability to remove the general partner, and, as such, the limited partners do not have kick-out rights. Accordingly, most of KKR's investment funds are categorized as VIEs.
KKR consolidates all VIEs in which it is the primary beneficiary. A reporting entity is determined to be the primary beneficiary if it holds a controlling financial interest in a VIE. A controlling financial interest is defined as (a) the power to direct the activities of a VIE that most significantly impact the VIE's economic performance and (b) the obligation to absorb losses of the VIE that could potentially be significant to the VIE or the right to receive benefits from the VIE that could potentially be significant to the VIE. The consolidation guidance requires an analysis to determine (i) whether an entity in which KKR holds a variable interest is a VIE and (ii) whether KKR's involvement, through holding interests directly or indirectly in the entity or contractually through other variable interests (for example, management and performance income), would give it a controlling financial interest. Performance of that analysis requires the exercise of judgment. Fees earned by KKR that are customary and commensurate with the level of effort required to provide those services, and where KKR does not hold other economic interests in the entity that would absorb more than an insignificant amount of the expected losses or returns of the entity, would not be considered to be variable interests. KKR factors in all economic interests including interests held through related parties, to determine if it holds a variable interest. KKR determines whether it is the primary beneficiary of a VIE at the time it becomes involved with a VIE and reconsiders that conclusion when facts and circumstances change.
For entities that are determined not to be VIEs, these entities are generally considered VOEs and are evaluated under the voting interest model. KKR consolidates VOEs it controls through a majority voting interest or through other means.
The consolidation assessment, including the determination as to whether an entity qualifies as a VIE or VOE, depends on the facts and circumstances for each entity, and therefore certain of KKR's investment funds may qualify as VIEs whereas others may qualify as VOEs.
With respect to CLOs (which are generally VIEs), in KKR's role as collateral manager, KKR generally has the power to direct the activities of the CLO that most significantly impact the economic performance of the entity. In some, but not all cases, KKR, through its residual interest in the CLO may have variable interests that represent an obligation to absorb losses of, or a right to receive benefits from, the CLO that could potentially be significant to the CLO. In cases where KKR has both the power to direct the activities of the CLO that most significantly impact the CLO's economic performance and the obligation to absorb losses of the CLO or the right to receive benefits from the CLO that could potentially be significant to the CLO, KKR is deemed to be the primary beneficiary and consolidates the CLO.
244
Notes to Financial Statements (Continued)
Global Atlantic has formed certain VIEs to hold investments, including investments in transportation, renewable energy, consumer and other loans and fixed maturity securities. These VIEs issue beneficial interests primarily to Global Atlantic’s insurance companies, and Global Atlantic maintains the power to direct the activities of the VIEs that most significantly impact their economic performance and bears the obligation to absorb losses or receive benefits from the VIEs that could potentially be significant. Accordingly, Global Atlantic is the primary beneficiary of these VIEs, which are consolidated in Global Atlantic’s results.
For certain consolidated renewable energy partnerships consolidated by Global Atlantic's insurance companies, Global Atlantic uses a hypothetical liquidation at book value ("HLBV") method to allocate income and cash flows based on third-party investors’ claim to net assets, including those for the noncontrolling interests and redeemable noncontrolling interests.
KKR classifies certain noncontrolling interests with redemption features that are not solely within the control of KKR outside of permanent equity on its consolidated statements of financial condition. These redeemable noncontrolling interests are reported using the greater of the carrying value at each reporting date as determined by the HLBV method or the estimated redemption value in each reporting period.
Noncontrolling Interests
Noncontrolling interests in consolidated entities of KKR represent the non-redeemable ownership interests that are held primarily by:
(i)third party fund investors in KKR's consolidated funds and certain other entities;
(ii)third parties in KKR's Capital Markets business line;
(iii)certain current and former employees who hold exchangeable securities; and
(iv)third parties in KKR's insurance business including GA Rollover Investors, GA Co-Investors and third-party investors in Global Atlantic's consolidated renewable energy entities and certain other entities.
For further details see Note 22 "Equity." Noncontrolling interests held by KKR Holdings before the closing of the Reorganization Mergers are described in Note 1 "Organization."
Cash and Cash Equivalents
Generally KKR considers all liquid short‑term investments with original maturities of three months or less when purchased to be cash equivalents. Cash and cash equivalents includes cash held at consolidated entities, which represents cash that, although not legally restricted, is not available generally to fund liquidity needs of KKR, as the use of such funds is generally limited to the investment activities of KKR's investment funds and CFEs. The carrying values of cash and cash equivalents are considered to be reasonable estimates of their fair values.
Restricted Cash and Cash Equivalents
Restricted cash and cash equivalents primarily represent amounts that are held by third parties under certain of KKR's financing and derivative transactions. The duration of this restricted cash generally matches the duration of the related financing or derivative transaction. Global Atlantic’s restricted cash principally includes certain cash and cash equivalents held in trusts formed for the benefit of ceding companies or held in connection with open derivative transactions. The carrying values of restricted cash and cash equivalents are considered to be reasonable estimates of their fair values.
Fair Value Measurements
Fair value is the price that would be received to sell an asset or paid to transfer a liability in an orderly transaction between market participants at the measurement date under current market conditions. Where available, fair value is based on observable market prices or parameters or derived from such prices or parameters. Where observable prices or inputs are not available, valuation techniques are applied. These valuation techniques involve varying levels of management estimation and judgment, the degree of which is dependent on a variety of factors.
245
Notes to Financial Statements (Continued)
GAAP establishes a hierarchical disclosure framework which prioritizes and ranks the level of market price observability used in measuring financial instruments at fair value. Market price observability is affected by a number of factors, including the type of financial instrument, the characteristics specific to the financial instrument and the state of the marketplace, including the existence and transparency of transactions between market participants. Financial instruments with readily available quoted prices in active markets generally will have a higher degree of market price observability and a lesser degree of judgment used in measuring fair value.
Investments and financial instruments measured and reported at fair value are classified and disclosed based on the observability of inputs used in the determination of fair values, as follows:
Level I - Pricing inputs are unadjusted, quoted prices in active markets for identical assets or liabilities as of the measurement date. The types of financial instruments included in this category are publicly-listed equities, U.S. government and agencies securities, and securities sold short.
Level II - Pricing inputs are other than quoted prices in active markets, which are either directly or indirectly observable as of the measurement date, and fair value is determined through the use of models or other valuation methodologies. The types of financial instruments included in this category are credit investments, fixed-income securities held by consolidated insurance companies, investments and debt obligations of consolidated CLO entities, convertible debt securities indexed to publicly-listed securities, less liquid and restricted equity securities, certain funds withheld payable at interest, and certain over-the-counter derivatives such as foreign currency option and forward contracts.
Level III - Pricing inputs are unobservable for the financial instruments and include situations where there is little, if any, market activity for the financial instrument. The inputs into the determination of fair value require significant management judgment or estimation. The types of financial instruments generally included in this category are private portfolio companies, real assets investments, certain credit investments, equity method investments for which the fair value option was elected, certain fixed-income and structured securities held by the consolidated insurance subsidiaries, reinsurance recoverables carried at fair value, certain insurance policy liabilities carried at fair value, and certain embedded derivatives related to (i) certain funds withheld payable at interest, and (ii) annuities and indexed universal life products, which contain equity-indexed features.
In certain cases, the inputs used to measure fair value may fall into different levels of the fair value hierarchy. In such cases, the level in the fair value hierarchy within which the fair value measurement in its entirety falls has been determined based on the lowest level input that is significant to the fair value measurement in its entirety. KKR's assessment of the significance of a particular input to the fair value measurement in its entirety requires judgment and consideration of factors specific to the asset.
A significant decrease in the volume and level of activity for the asset or liability is an indication that transactions or quoted prices may not be representative of fair value because in such market conditions there may be increased instances of transactions that are not orderly. In those circumstances, further analysis of transactions or quoted prices is needed, and a significant adjustment to the transactions or quoted prices may be necessary to estimate fair value.
The availability of observable inputs can vary depending on the financial asset or liability and is affected by a wide variety of factors, including, for example, the type of instrument, whether the instrument has recently been issued, whether the instrument is traded on an active exchange or in the secondary market, and current market conditions. To the extent that valuation is based on models or inputs that are less observable or unobservable in the market, the determination of fair value requires additional judgment. Accordingly, the degree of judgment exercised by KKR in determining fair value is greatest for instruments categorized in Level III. The variability and availability of the observable inputs affected by the factors described above may cause transfers between Levels I, II, and III, which KKR recognizes at the beginning of the reporting period.
Investments and other financial instruments that have readily observable market prices (such as those traded on a securities exchange) are stated at the last quoted sales price as of the reporting date. KKR does not adjust the quoted price for these investments, even in situations where KKR holds a large position and a sale could reasonably affect the quoted price.
Management's determination of fair value is based upon the methodologies and processes described below and may incorporate assumptions that are management's best estimates after consideration of a variety of internal and external factors.
246
Notes to Financial Statements (Continued)
Level II Valuation Methodologies
Credit Investments, U.S. Municipal Securities, Corporate Bonds and Structured Securities: These financial instruments generally have bid and ask prices that can be observed in the marketplace. Bid prices reflect the highest price that KKR and others are willing to pay for an instrument. Ask prices represent the lowest price that KKR and others are willing to accept for an instrument. For financial instruments whose inputs are based on bid-ask prices obtained from third party pricing services, fair value may not always be a predetermined point in the bid-ask range. KKR's policy is generally to allow for mid-market pricing and adjusting to the point within the bid-ask range that meets KKR's best estimate of fair value. KKR may also use model-derived valuations whose inputs are observable or whose significant value drivers are observable.
Investments and Debt Obligations of Consolidated CLO Vehicles: Investments of consolidated CLO vehicles are reported within Investments of Consolidated CFEs and are valued using the same valuation methodology as described above for credit investments. Under ASU 2014-13, KKR measures CLO debt obligations on the basis of the fair value of the financial assets of the CLO.
Securities Indexed to Publicly-Listed Securities: These securities are typically valued using standard convertible security pricing models. The key inputs into these models that require some amount of judgment are the credit spreads utilized and the volatility assumed. To the extent the company being valued has other outstanding debt securities that are publicly-traded, the implied credit spread on the company's other outstanding debt securities would be utilized in the valuation. To the extent the company being valued does not have other outstanding debt securities that are publicly-traded, the credit spread will be estimated based on the implied credit spreads observed in comparable publicly-traded debt securities. In certain cases, an additional spread will be added to reflect an illiquidity discount due to the fact that the security being valued is not publicly-traded. The volatility assumption is based upon the historically observed volatility of the underlying equity security into which the convertible debt security is convertible and/or the volatility implied by the prices of options on the underlying equity security.
Equity Securities: The valuation of certain equity securities is based on (i) an observable price for an identical security adjusted for the effect of a restriction or leverage that collateralized the equity securities and (ii) quoted prices for identical or similar instruments in markets that are not active.
Derivatives: The valuation incorporates observable inputs comprising yield curves, foreign currency rates, interest rate volatility and credit spreads.
Level III Valuation Methodologies
Private Equity Investments: KKR generally employs two valuation methodologies when determining the fair value of a private equity investment. The first methodology is typically a market comparables analysis that considers key financial inputs, which may take into account recent public and private transactions and other available measures. The second methodology utilized is typically a discounted cash flow analysis, which incorporates significant assumptions and judgments. Estimates of key inputs used in this methodology include the weighted average cost of capital for the investment and assumed inputs used to calculate terminal values, such as exit EBITDA multiples. The results of the discounted cash flow approach can be significantly impacted by these estimates. Other inputs are also used in both methodologies. In addition, when a definitive agreement has been executed to sell an investment, KKR generally considers a significant determinant of fair value to be the consideration to be received by KKR pursuant to the executed definitive agreement.
Upon completion of the valuations conducted using these methodologies, a weighting is ascribed to each method, and an illiquidity discount is typically applied where appropriate. The ultimate fair value recorded for a particular investment will generally be within a range suggested by the two methodologies, except that the value may be higher or lower than such range in the case of investments being sold pursuant to an executed definitive agreement.
When determining the weighting ascribed to each valuation methodology, KKR considers, among other factors, the availability of direct market comparables, the applicability of a discounted cash flow analysis, the expected hold period and manner of realization for the investment, and in the case of investments being sold pursuant to an executed definitive agreement, an estimated probability of such sale being completed. These factors can result in different weightings among investments in the portfolio and in certain instances may result in up to a 100 % weighting to a single methodology.
247
Notes to Financial Statements (Continued)
When an illiquidity discount is to be applied, KKR seeks to take a uniform approach across its portfolio and generally applies a minimum 5 % discount to all private equity investments. KKR then evaluates such private equity investments to determine if factors exist that could make it more challenging to monetize the investment and, therefore, justify applying a higher illiquidity discount. These factors generally include (i) the nature of KKR's governance rights, (ii) whether the portfolio company is undergoing significant restructuring activity or similar factors, and (iii) characteristics about the portfolio company regarding its size and/or whether the portfolio company is experiencing, or expected to experience, a significant decline in earnings. These factors generally make it less likely that a portfolio company would be sold or publicly offered in the near term at a price indicated by using just a market multiples and/or discounted cash flow analysis, and these factors tend to reduce the number of opportunities to sell an investment and/or increase the time horizon over which an investment may be monetized. Depending on the applicability of these factors, KKR determines the amount of any incremental illiquidity discount to be applied above the 5 % minimum, and during the time KKR holds the investment, the illiquidity discount may be increased or decreased, from time to time, based on changes to these factors. The amount of illiquidity discount applied at any time requires considerable judgment about what a market participant would consider and is based on the facts and circumstances of each individual investment. Accordingly, the illiquidity discount ultimately considered by a market participant upon the realization of any investment may be higher or lower than that estimated by KKR in its valuations.
In the case of growth equity investments, enterprise values may be determined using the market comparables analysis and discounted cash flow analysis described above. A scenario analysis may also be conducted to subject the estimated enterprise values to a downside, base and upside case, which involves significant assumptions and judgments. A milestone analysis may also be conducted to assess the current level of progress towards value drivers that we have determined to be important, which involves significant assumptions and judgments. The enterprise value in each case may then be allocated across the investment's capital structure to reflect the terms of the security and subjected to probability weightings. In certain cases, the values of growth equity investments may be based on recent or expected financings or other transactions.
Real Asset Investments: Real asset investments in infrastructure, real estate, and energy are valued using one or a combination of the discounted cash flow analysis, market comparables analysis and direct income capitalization methods, which in each case incorporates significant assumptions and judgments.
Infrastructure investments are generally valued using the discounted cash flow analysis. Key inputs used in this methodology can include the weighted average cost of capital and assumed inputs used to calculate terminal values, such as exit EBITDA multiples.
Real estate investments are generally valued using a combination of direct income capitalization and discounted cash flow analysis. Certain real estate investments are valued by KKR based on ranges of valuations determined by independent valuation firms. Key inputs used in such methodologies that require estimates include an unlevered discount rate, current capitalization rate and exit capitalization rate. The valuations of real assets investments also use other inputs.
Energy investments are generally valued using a discounted cash flow approach, and where applicable, a market approach using comparable companies and transactions. Key inputs used in our valuations include (i) the weighted average cost of capital, (ii) future commodity prices, as quoted on indices, and long-term commodity price forecasts, and (iii) the asset’s projected future operating performance.
Credit Investments: Credit investments are valued using values obtained from dealers or market makers, and where these values are not available, credit investments are generally valued by KKR based on ranges of valuations determined by an independent valuation firm. Valuation models are based on discounted cash flow analyses, for which the key inputs are determined based on market comparables, which incorporate similar instruments from similar issuers.
Real Estate Mortgage Loans: Real estate mortgage loans are illiquid, structured investments that are specific to the property and its operating performance. KKR engages an independent valuation firm to estimate the fair value of each loan. KKR reviews the quarterly loan valuation estimates provided by the independent valuation firm. These loans are generally valued using a discounted cash flow model using discount rates derived from observable market data applied to the capital structure of the respective sponsor and estimated property value.
Other Investments: With respect to other investments including equity method investments, KKR generally employs the same valuation methodologies as described above for private equity, credit investments and real assets investments when valuing these other investments.
248
Notes to Financial Statements (Continued)
Funds withheld at interest: The funds withheld receivables and payables at interest carried at fair value are primarily valued based on the fair value of the underlying investments, which have quoted prices or other observable inputs to pricing. A portion of the funds withheld receivable and payables at interest carried at fair value represent embedded derivatives and are generally valued as the difference between the fair value of the underlying assets and the carrying value of the host contract at the balance sheet date.
Reinsurance recoverables: Reinsurance recoverables carried at fair value are valued using present value techniques that consider inputs including mortality and surrender rates for the associated policies, as well as estimates of policy expenses and the cost of capital held in support of the related closed block policy liabilities.
Insurance policy liabilities, insurance embedded derivatives, and market risk benefits: Certain insurance policy liabilities that are carried at fair value are valued using present value techniques that discount estimated liability cash flows at a rate that reflects the variability of those cash flows and also consider policyholder behavior (including lapse rates, surrender rates and mortality).
Closed block policy liabilities carried at fair value are valued using present value techniques that consider inputs including mortality and surrender rates for the respective policies, as well as estimates of policy expenses and the cost of capital held in support of the liabilities.
Insurance embedded derivative liabilities are related to our fixed-indexed annuity, variable annuity and indexed universal life products, which contain equity-indexed features. These embedded derivative liabilities are calculated as the present value of future projected benefits in excess of the projected guaranteed benefits, using an option budget as the indexed account value growth rate and considering an adjustment to reflect the risk of nonperformance on our obligation and inputs such as projected withdrawal and surrender activity, and mortality. KKR calculates nonperformance risk using a blend of observable peer holding company credit spreads, adjusted to reflect the claims paying ability of our insurance entities, as well as an adjustment to reflect the priority of policyholder claims.
Market risk benefits include certain contract features on fixed annuity and variable annuity products. These features include minimum guarantees to policyholders, such as guaranteed minimum death benefits (GMDBs), guaranteed minimum withdrawal benefits (GMWBs), and long-term care benefits (i.e., capped at the return of account value plus one or two times the account value). Market risk benefits are measured at fair value using a non-option and option valuation approach based on current net amounts at risk, market data, experience, and other factors.
Key unobservable inputs that have a significant impact on KKR's Level III valuations as described above are included in Note 9 "Fair Value Measurements." KKR utilizes several unobservable pricing inputs and assumptions in determining the fair value of its Level III financial instruments. These unobservable pricing inputs and assumptions may differ by financial instruments and in the application of KKR's valuation methodologies. KKR's reported fair value estimates could vary materially if KKR had chosen to incorporate different unobservable pricing inputs and other assumptions or, for certain applicable investments, if KKR only used either the discounted cash flow methodology or the market comparables methodology instead of assigning a weighting to both methodologies.
Business Combinations
Goodwill and Intangible Assets
Goodwill represents the excess of acquisition cost over the fair value of net tangible and intangible assets acquired in connection with an acquisition. Goodwill is assessed for impairment annually in the third quarter of each fiscal year or more frequently if circumstances indicate impairment may have occurred. Goodwill and Intangible Assets are recorded in Other Assets in the accompanying consolidated statements of financial condition.
249
Notes to Financial Statements (Continued)
In accordance with GAAP, KKR has the option to either (i) perform a quantitative impairment test or (ii) first perform a qualitative assessment (commonly known as "step zero") to determine whether it is more likely than not that the fair value of a reporting unit is less than its carrying amount, in which case the quantitative test would then be performed. When performing a quantitative impairment test, KKR compares the fair value of a reporting unit with its carrying amount, including goodwill. If the fair value of the reporting unit is less than its carrying amount, the goodwill impairment loss is equal to the excess of the carrying value over the fair value, limited to the carrying amount of goodwill allocated to that reporting unit. The estimated fair values of the reporting units are derived based on valuation techniques KKR believes market participants would use for each respective reporting unit. The estimated fair values are generally determined by utilizing a discounted cash flow methodology and methodologies that incorporate market multiples of certain comparable companies.
KKR tests goodwill for impairment at the reporting unit level, which is generally at the level of or one level below its reportable segments, on an annual basis, or, when an event occurs or circumstances change that would more likely than not reduce the fair value of a reporting unit below its carrying amount. Goodwill recorded as a result of the acquisition of Global Atlantic has been allocated to the insurance segment, and goodwill recorded as a result of the acquisition of KJR Management ("KJRM") has been allocated to the asset management segment.
During the third quarter of 2023, KKR performed its annual impairment analysis for the goodwill recorded at the asset management and insurance reporting units.
KKR elected to perform step zero for the purposes of its impairment analysis for the goodwill recorded at the asset management and insurance reporting units. Based upon these assessments, KKR determined that it is more likely than not that the fair value of the reporting unit exceeds its carrying value. Factors considered in the qualitative assessment included macroeconomic conditions, industry and market considerations, cost factors, current and projected financial performance, changes in management or strategy and market capitalization.
Additionally, during the third quarter of 2023, KKR performed its annual impairment analysis on KJRM’s investment management contracts recorded at KKR’s asset management business, which were determined to have indefinite useful lives and are not subject to amortization. KKR elected to perform a qualitative assessment for the purposes of its impairment analysis. Based upon this assessment, KKR determined that it is more likely than not that the fair value of the KJRM investment management contracts exceeded their carrying value. Factors considered in the qualitative assessment included macroeconomic conditions, industry and market considerations, cost factors, and current and projected financial performance.
Fixed Assets, Depreciation and Amortization
Foreign Currency
Consolidated entities that have a functional currency that differs from KKR's reporting currency are (i) KKR's investment management and capital markets companies located outside the United States and (ii) certain CFEs. Foreign currency denominated assets and liabilities are translated using the exchange rates prevailing at the end of each reporting period. Results of foreign operations are translated at the weighted average exchange rate for each reporting period. Translation adjustments are included as a component of accumulated other comprehensive income (loss) until realized. Foreign currency income or expenses resulting from transactions outside of the functional currency of a consolidated entity are recorded as incurred in general, administrative and other expense in the consolidated statements of operations.
Leases
At contract inception, KKR determines if an arrangement contains a lease by evaluating whether (i) the identified asset has been deployed in the contract explicitly or implicitly and (ii) KKR obtains substantially all of the economic benefits from the use of that underlying asset and directs how and for what purpose the asset is used during the term of the contract. Additionally, at contract inception KKR will evaluate whether the lease is an operating or finance lease. Right-of-use ("ROU") assets represent KKR’s right to use an underlying asset for the lease term and lease liabilities represent KKR’s obligation to make lease payments arising from the lease.
250
Notes to Financial Statements (Continued)
ROU assets and the associated lease liabilities are recognized at the commencement date based on the present value of the future minimum lease payments over the lease term. The discount rate implicit in the lease is generally not readily determinable. Consequently, KKR uses its incremental borrowing rate based on the information available including, but not limited to, collateral assumptions, the term of the lease, and the economic environment in which the lease is denominated at the commencement date in determining the present value of the future lease payments. The ROU assets are recognized as the initial measurement of the lease liabilities plus any initial direct costs and any prepaid lease payments less lease incentives received, if any. The lease terms may include options to extend or terminate the lease which are accounted for when it is reasonably certain that KKR will exercise that option. Certain leases that include lease and non-lease components are accounted for as one single lease component. In addition to contractual rent payments, occupancy lease agreements generally include additional payments for certain costs incurred by the landlord, such as building expenses and utilities. To the extent these are fixed or determinable, they are included as part of the lease payments used to measure the operating lease liability.
Operating lease expense is recognized on a straight-line basis over the lease term and is recorded within Occupancy and Related Charges in the accompanying consolidated statements of operations. The ROU assets are included in Other Assets and the lease liabilities are included in Accrued Expenses and Other Liabilities in the accompanying consolidated statements of financial condition. See Note 14 "Other Assets and Accrued Expenses and Other Liabilities."
Comprehensive Income (Loss)
Comprehensive income is defined as the change in equity of a business enterprise during a period from transactions and other events and circumstances, excluding those resulting from contributions from and distributions to owners. In the accompanying consolidated financial statements, comprehensive income is recorded net of income taxes and is comprised of (i) Net Income (Loss), as presented in the consolidated statements of operations, (ii) unrealized gains (losses) on available-for-sale securities and other (iii) net effect of changes in discount rates and instrument-specific credit risk on policy liabilities and (iv) foreign currency translation.
The tax benefit (expense) related to items of other comprehensive income was $(339 ) million, $1,688 million, and $81 million for the years ended December 31, 2023, 2022 and 2021, respectively.
Income Taxes
KKR & Co. Inc. is a domestic corporation for U.S. federal income tax purposes and is subject to U.S. federal, state and local income taxes at the entity level on its share of taxable income. In addition, KKR Group Partnership and certain of its subsidiaries operate as partnerships for U.S. federal tax purposes but as taxable entities for certain state, local or non-U.S. tax purposes. Moreover, certain corporate subsidiaries of KKR, including certain subsidiaries of Global Atlantic, are domestic corporations for U.S. federal income tax purposes and are subject to U.S. federal, state, and local income taxes.
Deferred Income Taxes
Income taxes are accounted for using the asset and liability method of accounting. Under this method, deferred tax assets and liabilities are recognized for the expected future tax consequences of differences between the carrying amounts of assets and liabilities and their respective tax basis, using tax rates in effect for the year in which the differences are expected to reverse. The effect on deferred assets and liabilities of a change in tax rates is recognized in the consolidated statements of operations in the period when the change is enacted.
Deferred tax assets, which are recorded in Other Assets within the consolidated statements of financial condition, are reduced by a valuation allowance when, based on the weight of available evidence, it is more likely than not that some portion or all of the deferred tax assets will not be realized. When evaluating the realizability of the deferred tax assets, all evidence, both positive and negative, is considered. Items considered when evaluating the need for a valuation allowance include the ability to carry back losses, future reversals of existing temporary differences, tax planning strategies, and expectations of future earnings.
For a particular tax‑paying component of an entity and within a particular tax jurisdiction, deferred tax assets and liabilities are offset and presented as a single amount within Other Assets or Accrued and Other Liabilities, as applicable, in the accompanying statements of financial condition.
251
Notes to Financial Statements (Continued)
Uncertain Tax Positions
KKR analyzes its tax filing positions in all of the U.S. federal, state and local tax jurisdictions and foreign tax jurisdictions where it is required to file income tax returns, as well as for all open tax years in these jurisdictions. If, based on this analysis, KKR determines that uncertainties in tax positions exist, a reserve is established. The reserve for uncertain tax positions is recorded in Accrued and Other Liabilities in the accompanying statements of financial condition. KKR recognizes accrued interest and penalties related to uncertain tax positions within the provision for income taxes in the consolidated statements of operations.
KKR records uncertain tax positions on the basis of a two‑step process: (a) determination is made whether it is more likely than not that the tax positions will be sustained based on the technical merits of the position and (b) those tax positions that meet the more‑likely‑than‑not threshold are recognized as the largest amount of tax benefit that is greater than 50 percent likely to be realized upon ultimate settlement with the related tax authority.
Net Income (Loss) attributable to KKR & Co. Inc. per share of common stock
Net Income (Loss) attributable to KKR per share of common stock (Basic) is computed by dividing earnings (losses) attributable to KKR common stockholders by the weighted average number of common shares outstanding for the period. Net Income (Loss) attributable to KKR per share of common stock (Diluted) reflects the assumed conversion of all dilutive securities.
For further information on net income (loss) per common share, see Note 13 "Net Income (Loss) Attributable to KKR & Co. Inc. per Share of Common Stock" to the financial statements.
SIGNIFICANT ACCOUNTING POLICIES - ASSET MANAGEMENT
The significant accounting policies applicable to KKR’s asset management business are described below.
Investments
Investments consist primarily of private equity, credit, investments of consolidated CFEs, real assets, equity method and other investments. Investments denominated in currencies other than the entity's functional currency are valued based on the spot rate of the respective currency at the end of the reporting period with changes related to exchange rate movements reflected in the consolidated statements of operations. Security and loan transactions are recorded on a trade date basis. Further disclosure on investments is presented in Note 7 "Investments."
The following describes the types of securities held within each investment class.
Private Equity - Consists primarily of equity investments in operating businesses, including growth equity investments.
Credit - Consists primarily of investments in below investment grade corporate debt securities (primarily high yield bonds and syndicated bank loans), originated, distressed and opportunistic credit, real estate mortgage loans, and interests in unconsolidated CLOs.
Investments of Consolidated CFEs - Consists primarily of investments in below investment grade corporate debt securities (primarily high yield bonds and syndicated bank loans) held directly by the consolidated CLOs.
Real Assets - Consists primarily of investments in (i) infrastructure assets, (ii) real estate, principally residential and commercial real estate assets and businesses, and (iii) energy related assets, principally oil and natural gas properties.
Equity Method - Other - Consists primarily of (i) certain direct interests in operating companies in which KKR is deemed to exert significant influence under GAAP and (ii) certain interests in partnerships and joint ventures that hold private equity and real assets investments.
Equity Method - Capital Allocation-Based Income - Consists primarily of (i) the capital interest KKR holds as the general partner in certain investment funds, which are not consolidated and (ii) the carried interest component of the general partner interest, which are accounted for as a single unit of account.
Other - Consists primarily of investments in common stock, preferred stock, warrants and options of companies that are not private equity, real assets, credit or investments of consolidated CFEs.
252
Notes to Financial Statements (Continued)
Investments held by Consolidated Investment Funds
The consolidated investment funds are, for GAAP purposes, investment companies and reflect their investments and other financial instruments, including portfolio companies that are majority-owned and controlled by KKR's investment funds, at fair value. KKR has retained this specialized accounting for the consolidated investment funds in consolidation. Accordingly, the unrealized gains and losses resulting from changes in fair value of the investments and other financial instruments held by the consolidated investment funds are reflected as a component of Net Gains (Losses) from Investment Activities in the consolidated statements of operations.
Certain energy investments are made through consolidated investment funds, including investments in working and royalty interests in oil and natural gas properties as well as investments in operating companies that operate in the energy industry. Since these investments are held through consolidated investment funds, such investments are reflected at fair value as of the end of the reporting period.
Investments in operating companies that are held through KKR's consolidated investment funds are generally classified within private equity investments and investments in working and royalty interests in oil and natural gas properties are generally classified as real asset investments.
Fair Value Option
For certain investments and other financial instruments, KKR has elected the fair value option. Such election is irrevocable until the occurrence of certain qualifying events as defined in ASC 825, when KKR has, in addition to the ability to elect or the option to cease applying the fair value option to an eligible item to which it was previously applied. and is applied on a financial instrument by financial instrument basis at initial recognition. KKR has elected the fair value option for certain private equity, real assets, credit, investments of consolidated CFEs, equity method - other and other financial instruments not held through a consolidated investment fund. Accounting for these investments at fair value is consistent with how KKR accounts for its investments held through consolidated investment funds. Changes in the fair value of such instruments are recognized in Net Gains (Losses) from Investment Activities in the consolidated statements of operations. Interest income on interest bearing credit securities on which the fair value option has been elected is based on stated coupon rates adjusted for the accretion of purchase discounts and the amortization of purchase premiums. This interest income is recorded within Interest Income in the consolidated statements of operations.
Equity Method
For certain investments in entities over which KKR exercises significant influence but which do not meet the requirements for consolidation and for which KKR has not elected the fair value option, KKR uses the equity method of accounting. The carrying value of equity method investments, for which KKR has not elected the fair value option, is determined based on the amounts invested by KKR, adjusted for the equity in earnings or losses of the investee allocated based on KKR's respective ownership percentage, less distributions.
For equity method investments for which KKR has not elected the fair value option, KKR records its proportionate share of the investee's earnings or losses based on the most recently available financial information of the investee, which in certain cases may lag the date of KKR's financial statements by no more than three calendar months. As of December 31, 2023, equity method investees for which KKR reports financial results on a lag include Marshall Wace LLP ("Marshall Wace").
KKR evaluates its equity method investments for which KKR has not elected the fair value option for impairment whenever events or changes in circumstances indicate that the carrying amounts of such investments may not be recoverable.
The carrying value of investments classified as Equity Method - Capital Allocation-Based Income approximates fair value, because the underlying investments of the unconsolidated investment funds are reported at fair value.
Financial Instruments held by Consolidated CFEs
KKR measures both the financial assets and financial liabilities of the consolidated CFEs in its financial statements using the more observable of the fair value of the financial assets and the fair value of the financial liabilities which results in KKR's consolidated net income (loss) reflecting KKR's own economic interests in the consolidated CFEs including (i) changes in the fair value of the beneficial interests retained by KKR and (ii) beneficial interests that represent compensation for services rendered.
253
Notes to Financial Statements (Continued)
For the consolidated CLOs, KKR has determined that the fair value of the financial assets of the consolidated CLOs is more observable than the fair value of the financial liabilities of the consolidated CLOs. As a result, the financial assets of the consolidated CLOs are being measured at fair value and the financial liabilities are being measured in consolidation as: (1) the sum of the fair value of the financial assets and the carrying value of any nonfinancial assets that are incidental to the operations of the CLOs less (2) the sum of the fair value of any beneficial interests retained by KKR (other than those that represent compensation for services) and KKR's carrying value of any beneficial interests that represent compensation for services. The resulting amount is allocated to the individual financial liabilities (other than the beneficial interests retained by KKR).
Due from and Due to Affiliates
KKR considers its principals and their related entities, unconsolidated investment funds and the portfolio companies of its funds to be affiliates for accounting purposes. Receivables from and payables to affiliates are recorded at their current settlement amount.
Derivative instruments
Securities Sold Short
Whether part of a hedging transaction or a transaction in its own right, securities sold short represent obligations of KKR to deliver the specified security at the contracted price at a future point in time, and thereby create a liability to repurchase the security in the market at the prevailing prices. The liability for such securities sold short, which is recorded in Accrued Expenses and Other Liabilities in the statement of financial condition, is marked to market based on the current fair value of the underlying security at the reporting date with changes in fair value recorded as unrealized gains or losses in Net Gains (Losses) from Investment Activities in the accompanying consolidated statements of operations. These transactions may involve market risk in excess of the amount currently reflected in the accompanying consolidated statements of financial condition.
Fees and Other
Fees and Other, as detailed above, are accounted for as contracts with customers. Under ASC 606, Revenue from Contracts with Customers ("ASC 606"), KKR is required to (a) identify the contract(s) with a customer, (b) identify the performance obligations in the contract, (c) determine the transaction price, (d) allocate the transaction price to the performance obligations in the contract, and (e) recognize revenue when (or as) KKR satisfies its performance obligation. In determining the transaction price, KKR has included variable consideration only to the extent that it is probable that a significant reversal in the amount of cumulative revenue recognized would not occur when the uncertainty associated with the variable consideration is resolved.
254
Notes to Financial Statements (Continued)
The following table summarizes KKR's revenues from contracts with customers:
| Revenue Type | Customer | Performance Obligation | Performance Obligation Satisfied Over Time or Point In Time (1) | Variable or Fixed Consideration | Payment Terms | Subject to Return Once Recognized | Classification of Uncollected Amounts (2) | ||||||||||||||||
| Management Fees | Investment funds, CLOs and other vehicles | Investment management services | Over time as services are rendered | Variable consideration since varies based on fluctuations in the basis of the management fee over time | Typically quarterly or annually in arrears | No | Due from Affiliates | ||||||||||||||||
| Transaction Fees | Portfolio companies and third party companies | Advisory services and debt and equity arranging and underwriting | Point in time when the transaction (e.g. underwriting) is completed | Fixed consideration | Typically paid on or shortly after transaction closes | No | Due from Affiliates (portfolio companies) Other Assets (third parties) | ||||||||||||||||
| Monitoring Fees | |||||||||||||||||||||||
| Recurring Fees | Portfolio companies | Monitoring services | Over time as services are rendered | Variable consideration since varies based on fluctuations in the basis of the recurring fee | Typically quarterly in arrears | No | Due from Affiliates | ||||||||||||||||
| Termination Fees | Portfolio companies | Monitoring services | Point in time when the termination is completed | Fixed consideration | Typically paid on or shortly after termination occurs | No | Due from Affiliates | ||||||||||||||||
| Incentive Fees | Investment funds and other vehicles | Investment management services that result in achievement of minimum investment return levels | Over time as services are rendered | Variable consideration since contingent upon the investment fund and other vehicles achieving more than stipulated investment return hurdles | Typically paid shortly after the end of the performance measurement period | No | Due from Affiliates | ||||||||||||||||
| Expense Reimbursements | Investment funds and portfolio companies | Investment management and monitoring services | Point in time when the related expense is incurred | Fixed consideration | Typically shortly after expense is incurred | No | Due from Affiliates | ||||||||||||||||
| Consulting Fees | Portfolio companies and other companies | Consulting and other services | Over time as services are rendered | Fixed consideration | Typically quarterly in arrears | No | Due from Affiliates | ||||||||||||||||
(1)For performance obligations satisfied at a point in time, there were no significant judgments made in evaluating when a customer obtains control of the promised service.
(2)For amounts classified in Other Assets, see Note 14 "Other Assets and Accrued Expenses and Other Liabilities." For amounts classified in Due from Affiliates, see Note 20 "Related Party Transactions."
Management Fees
KKR provides investment management services to investment funds, CLOs, and other vehicles and entities in exchange for a management fee. Management fees are generally determined quarterly based on an annual rate and are generally based upon a percentage of the capital committed, capital invested or net asset value during the investment period, if applicable. Thereafter, management fees are generally based on a percentage of remaining invested capital, net asset value, gross assets or as otherwise defined in the respective contractual agreements. Since some of the factors that cause the fees to fluctuate are outside of KKR's control, management fees are considered to be constrained and are therefore not included in the transaction price. Revenue recognized for the investment management services provided is generally determined at the end of the period because these management fees are payable on a regular basis (typically quarterly) and the uncertainty for that period is resolved.
255
Notes to Financial Statements (Continued)
Management fees earned from KKR's consolidated investment funds and other vehicles and entities are eliminated in consolidation. However, because these amounts are funded by, and earned from, noncontrolling interests, KKR's allocated share of the net income from the consolidated investment funds and other vehicles is increased by the amount of fees that are eliminated. Accordingly, net income (loss) attributable to KKR and KKR’s stockholder’s equity would be unchanged, if such investment funds and other vehicles were not consolidated.
Management fee calculations based on committed capital or invested capital are mechanical in nature and therefore do not require the use of significant estimates or judgments. Management fee calculations based on net asset value, total assets, or investment fair value depend on the fair value of the underlying investments within the investment vehicle.
Fee Credits
Under the terms of the management agreements with certain of its investment funds, KKR is required to share with such funds an agreed upon percentage of certain fees, including monitoring and transaction fees earned from portfolio companies ("Fee Credits"). Investment funds earn Fee Credits only with respect to monitoring and transaction fees that are allocable to the fund's investment in the portfolio company and not, for example, any fees allocable to capital invested through co-investment vehicles. Fee Credits are calculated after deducting certain costs incurred in connection with pursuing potential investments that do not result in completed transactions ("broken-deal expenses") and generally amount to 80 % for older funds formed on or prior to January 1, 2015, or 100 % for newer funds, of allocable monitoring and transaction fees after broken-deal expenses are recovered, although the actual percentage may vary from fund to fund. Fee Credits are recognized and owed to investment funds concurrently with the recognition of monitoring fees, transaction fees and broken-deal expenses. Since Fee Credits are payable to investment funds, amounts owed are generally applied as a reduction of the management fee that is otherwise billed to the investment fund. Fee credits are recorded as a reduction of revenues in the consolidated statement of operations. Fee Credits owed to investment funds are recorded in Due to Affiliates on the consolidated statements of financial condition. See Note 20 "Related Party Transactions."
Transaction Fees
KKR (i) arranges debt and equity financing, places and underwrites securities offerings, and provides other types of capital markets services for companies seeking financing in its Capital Markets business line and (ii) provides advisory services in connection with successful Private Equity, Real Assets and Credit and Liquid Strategies business line portfolio company investment transactions, in each case, in exchange for a transaction fee. Transaction fees are separately negotiated for each transaction and are generally based on (i) for Capital Markets business line transactions, a percentage of the overall transaction size and (ii) for Private Equity, Real Assets and Credit and Liquid Strategies business line transactions, a percentage of either total enterprise value of an investment or a percentage of the aggregate price paid for an investment. After the contract is established, there are no significant judgments made when determining the transaction price.
Monitoring Fees
KKR provides services in connection with monitoring portfolio companies in exchange for a fee. Recurring monitoring fees are separately negotiated for each portfolio company. In addition, certain monitoring fee arrangements may provide for a termination payment following an initial public offering or change of control as defined in the contractual terms of the related agreement. These termination payments are recognized in the period when the related transaction closes. After the contract is established, there are no significant judgments made when determining the transaction price.
Incentive Fees
KKR provides investment management services to certain investment funds, CLOs and other vehicles in exchange for a management fee as discussed above and, in some cases an incentive fee when KKR is not entitled to a carried interest. Incentive fee rates generally range from 5 % to 20 % of investment gains. Incentive fees are considered a form of variable consideration as these fees are subject to reversal, and therefore the recognition of such fees is deferred until the end of each fund's measurement period when the performance-based incentive fees become fixed and determinable. Incentive fees are generally paid within 90 days of the end of the investment vehicles' measurement period. After the contract is established, there are no significant judgments made when determining the transaction price.
Incentive fees earned from KKR's consolidated investment funds, CLOs, and other vehicles are eliminated in consolidation. However, because these amounts are funded by, and earned from, noncontrolling interests, KKR's allocated share of the net income from the consolidated investment funds, CLOs, and other vehicles is increased by the amount of fees that are eliminated. Accordingly, net income (loss) attributable to KKR would be unchanged if such investment funds and other vehicles were not consolidated.
256
Notes to Financial Statements (Continued)
Expense Reimbursements
Providing investment management services to investment funds and monitoring KKR’s portfolio companies require KKR to arrange for services on behalf of them. In those situations where KKR is acting as an agent on behalf of its investment funds or portfolio companies, it presents the cost of services on a net basis as a reduction of Revenues. In all other situations, KKR is primarily responsible for fulfilling the services and is therefore acting as a principal for those arrangements for accounting purposes. As a result, the expense and related reimbursement associated with those services is presented on a gross basis. Costs incurred are classified within Expenses and reimbursements of such costs are classified as Expense Reimbursements within Revenues on the consolidated statements of operations. After the contract is established, there are no significant judgments made when determining the transaction price.
Consulting Fees
KKR provides consulting and other services to portfolio companies and other companies in exchange for a consulting fee. Consulting fees are separately negotiated with each company for which services are provided. After the contract is established, there are no significant judgments made when determining the transaction price.
Capital Allocation-Based Income (Loss)
Capital allocation-based income (loss) is earned from those arrangements where KKR has a general partner capital interest and is entitled to a disproportionate allocation of investment income (referred to hereafter as "carried interest"). KKR accounts for its general partner interests in capital allocation-based arrangements as financial instruments under ASC 323, Investments - Equity Method and Joint Ventures ("ASC 323") since the general partner has significant governance rights in the investment funds in which it invests, which demonstrates significant influence. In accordance with ASC 323, KKR records equity method income based on the proportionate share of the income of the investment fund, including carried interest, assuming the investment fund was liquidated as of each reporting date pursuant to each investment fund's governing agreements. Accordingly, these general partner interests are accounted for outside of the scope of ASC 606. Other arrangements surrounding contractual incentive fees through an advisory contract are separate and distinct and accounted for in accordance with ASC 606. In these incentive fee arrangements, accounted for in accordance with ASC 606, KKR’s economics in the entity do not involve an allocation of capital. See "Incentive Fees" above.
Carried interest is allocated to the general partner based on cumulative fund performance to date, and where applicable, subject to a preferred return to the funds' limited partners. At the end of each reporting period, KKR calculates the carried interest that would be due to KKR for each investment fund, pursuant to the fund agreements, as if the fair value of the underlying investments were realized as of such date, irrespective of whether such amounts have been realized. As the fair value of underlying investments varies between reporting periods, it is necessary to make adjustments to amounts recorded as carried interest to reflect either (a) positive performance resulting in an increase in the carried interest allocated to the general partner or (b) negative performance that would cause the amount due to KKR to be less than the amount previously recognized, resulting in a negative adjustment to carried interest allocated to the general partner. In each case, it is necessary to calculate the carried interest on cumulative results compared to the carried interest recorded to date and to make the required positive or negative adjustments. KKR ceases to record negative carried interest allocations once previously recognized carried interest allocations for an investment fund have been fully reversed. KKR is not obligated to make payments for guaranteed returns or hurdles and, therefore, cannot have negative carried interest over the life of an investment fund. Accrued but unpaid carried interest as of the reporting date is reflected in Investments in the consolidated statements of financial condition.
Compensation and Benefits
Compensation and Benefits expense includes (i) base cash compensation consisting of salaries and wages, (ii) benefits, (iii) carry pool allocations, (iv) equity-based compensation, and (v) discretionary cash bonuses.
To supplement base cash compensation, benefits, carry pool allocations, and equity-based compensation, KKR typically pays discretionary cash bonuses, which are included in Compensation and Benefits expense in the consolidated statements of operations, based principally on the level of segment (i) management fees and other fee revenues (including incentive fees), (ii) realized performance income and (iii) realized investment income earned during the year. The amounts paid as discretionary cash bonuses, if any, are at KKR’s sole discretion and vary by individual to individual and from period to period, including having no cash bonus. KKR accrues discretionary cash bonuses when payment becomes probable and reasonably estimable which is generally in the period when KKR makes the decision to pay discretionary cash bonuses and is based upon a number of factors including the recognition of segment fee revenues, realized performance income, realized investment income and other factors determined during the year.
257
Notes to Financial Statements (Continued)
KKR decides whether to pay a discretionary cash bonus and determines the percentage of applicable revenue components to pay compensation only upon the occurrence of the realization event. There is no contractual or other binding obligation that requires KKR to pay a discretionary cash bonus to its employees, except in limited circumstances.
Carry Pool Allocation
With respect to our funds that provide for carried interest, KKR allocates a portion of the realized and unrealized carried interest that KKR earns to Associates Holdings, which is referred to as the carry pool, from which KKR's asset management employees and certain other carry pool participants are eligible to receive a carried interest allocation. As of December 31, 2023, the allocation is determined based upon a fixed arrangement between Associates Holdings and KKR, and KKR does not exercise discretion on whether to make an allocation to the carry pool upon a realization event. We refer to the portion of carried interest that KKR allocates to the carry pool as the carry pool percentage. These amounts are accounted for as compensatory profit sharing arrangements in Accrued Expenses and Other Liabilities within the accompanying consolidated statements of financial condition in conjunction with the related carried interest income and are recorded as compensation expense. Upon a reversal of carried interest income, the related carry pool allocation, if any, is also reversed. Accordingly, such compensation expense is subject to both positive and negative adjustments.
As of December 31, 2023, the carry pool percentage was fixed at 40 %, 43 % or 65 % by investment fund, depending on the fund’s vintage. For funds that closed after December 31, 2020 but before December 31, 2023, the carry pool percentage was fixed at 65 %. For all funds that closed after June 30, 2017 but before December 31, 2020, the carry pool percentage was fixed at 43 %, and the carry pool percentage was fixed at 40 % for older funds that contributed to KKR's carry pool. Effective January 2, 2024, KKR is authorized to apply a carry pool percentage in excess of these fixed percentages of up to 80 % for all funds. As of the date of this filing, no carry pool percentage has been changed for our funds that have closed on or before December 31, 2023. This increase to the carry pool percentage was approved by a majority of KKR's independent directors, and the carry pool percentage may not be increased above 80 % without the further approval of a majority of KKR's independent directors.
Equity-based Compensation
In addition to the cash-based compensation and carry pool allocations as described above, employees receive equity awards under the Amended and Restated KKR & Co. Inc. 2010 Equity Incentive Plan (the "2010 Equity Incentive Plan") and the Amended and Restated KKR & Co. Inc. 2019 Equity Incentive Plan (the "2019 Equity Incentive Plan" and, together with the 2010 Equity Incentive Plan, the "Equity Incentive Plans"). Most of these awards are subject to service-based vesting typically over a to five-year period from the date of grant, while in certain cases vesting is subject to the achievement of market conditions. Certain of these awards are subject to transfer restrictions and minimum retained ownership requirements. KKR considers both historical volatility and implied volatility in estimating expected volatility. All these awards are equity-classified and the related expense is recognized in Compensation and Benefits. The total tax benefit recognized in the income statement for equity based compensation was $18.7 million, $26.6 million, and $66.9 million for the years ended December 31, 2023, 2022, and 2021, respectively.
Profit Sharing Plan
General, Administrative and Other
General, administrative and other expense consists primarily of professional fees paid to legal advisors, accountants, advisors and consultants, insurance costs, travel and related expenses, communications and information services, depreciation and amortization charges, broken-deal expenses, placement fees and other general operating expenses. A portion of these general administrative and other expenses, in particular broken-deal expenses, are borne by fund investors.
258
Notes to Financial Statements (Continued)
Investment Income
Investment income consists primarily of the net impact of:
i.Realized and unrealized gains and losses on investments, securities sold short, derivatives and debt obligations of consolidated CFEs which are recorded in Net Gains (Losses) from Investment Activities. Upon disposition of an investment, previously recognized unrealized gains or losses are reversed and a realized gain or loss is recognized.
ii.Foreign exchange gains and losses relating to mark‑to‑market activity on foreign exchange forward contracts, foreign currency options and foreign denominated debt which are recorded in Net Gains (Losses) from Investment Activities.
iii.Dividends, which are recognized on the ex‑dividend date, or, in the absence of a formal declaration of a record date, on the date it is received.
iv.Interest income, which is recognized as earned.
SIGNIFICANT ACCOUNTING POLICIES - INSURANCE
The significant accounting policies applicable to KKR’s insurance business, which is conducted by Global Atlantic, are described below.
Investments
In the normal course of business, Global Atlantic enters into transactions involving various types of investments.
Investments include the following: U.S. government and agency obligations; commercial mortgage-backed securities ("CMBS"), residential mortgage-backed securities ("RMBS"), collateralized loan obligations (“CLOs"), collateralized bond obligations ("CBOs"), and all other structured securities, consisting primarily of asset-backed securities ("ABS") (collectively, "structured securities"); corporate bonds; state and political subdivision obligations; foreign government obligations; equity securities; mortgage and other loan receivables; policy loans; and other non-derivative investments.
Available-for-sale fixed maturity securities
Global Atlantic primarily accounts for its fixed maturity securities (including bonds, structured securities and redeemable preferred stock) as available-for-sale ("AFS"). AFS fixed maturity securities are generally recorded on a trade-date basis and are carried at fair value. Impairment associated with AFS fixed maturity securities is recognized as an allowance for credit losses. The allowance for credit losses is established either by a charge to net investment-related losses in the consolidated statements of operations, for securities identified as credit impaired after purchase, or by a gross-up recognition of an initial allowance for purchased credit deteriorated ("PCD") securities.
PCD securities are those purchased by Global Atlantic that were assessed at acquisition as having experienced a more-than-insignificant deterioration in credit quality since their origination. Global Atlantic considers an AFS fixed maturity security to be PCD if there are indicators of a credit loss at the acquisition date or, in the case of structured securities, if there is a significant difference between contractual cash flows and expected cash flows at acquisition. PCD securities also include those AFS fixed maturity securities previously held by Global Atlantic that were similarly assessed at the time of the 2021 GA Acquisition. The initial amortized cost for a PCD security equals the purchase price plus the initial allowance for credit losses. The initial allowance for credit losses is determined using a discounted cash flow method based on the best estimate of the present value of cash flows expected to be collected. After purchase, the accounting for a PCD security is generally consistent with that applied to all other securities.
Unrealized gains and losses on AFS fixed maturity securities, net of tax and insurance intangible amortization, are reported in accumulated other comprehensive income ("AOCI") in the consolidated statements of financial condition. Realized investment gains and losses are recognized on a first-in first-out ("FIFO") basis and are reported in net investment-related losses in the consolidated statements of operations. The amortized cost of fixed maturity securities is adjusted for impairment charge-offs, amortization of premiums and accretion of discounts. Such amortization and accretion is calculated using the effective yield method and included in net investment income in the consolidated statements of operations.
259
Notes to Financial Statements (Continued)
For structured securities, Global Atlantic recognizes interest income using a constant effective yield based on estimated cash flows generated from internal models utilizing interest rate, default and prepayment assumptions. Effective yields for structured securities that are not of high credit quality are recalculated and adjusted prospectively based on changes in expected undiscounted future cash flows, after consideration of any appropriate recognition or release of an allowance for credit losses. For structured securities that are of high credit quality, effective yields are recalculated based on payments received and updated prepayment expectations, and amortized cost is adjusted to the amount that would have existed had the new effective yield been applied since acquisition with a corresponding charge or credit to net investment income. Prepayment fees are recorded when earned in net investment income in the consolidated statements of operations.
Global Atlantic generally suspends accrual of interest for securities that are more than 90 days past due and reverses any related accrued interest to net investment income in the consolidated statements of operations. When a security is in non-accrual status, coupon payments are recognized as interest income as cash is received, subject to consideration as to the overall collectibility of the security. A security is returned to accrual status when Global Atlantic determines that the collection of amounts due is probable. The allowance for credit losses excludes accrued interest from the amortized cost basis for which losses are estimated.
Trading fixed maturity securities
Global Atlantic accounts for certain fixed maturity securities as trading at acquisition, based on intent or via the election of the fair value option. Trading securities are generally recorded on a trade-date basis and are carried at fair value, with realized and unrealized gains and losses reported in net investment-related gains (losses) in the consolidated statements of operations. Interest income from these securities is reported in net investment income. Trading securities, which are primarily used to match asset and liability accounting, back funds withheld payable at interest where the investment performance is ceded to reinsurers under the terms of the respective reinsurance agreements.
Equity securities
Global Atlantic accounts for its investments in equity securities (including common stock and non-redeemable preferred stock) that do not require equity method accounting or result in consolidation, at fair value. Realized and unrealized investment gains and losses are reported in net investment-related gains (losses) in the consolidated statements of operations.
Mortgage and other loan receivables
Global Atlantic purchases and originates mortgage and other loan receivables, and these loans are carried at cost, less the allowance for credit losses and as adjusted for amortization/accretion of premiums/discounts. The allowance for credit losses is established either by a charge to net investment-related losses in the consolidated statements of operations or, for PCD mortgage and other loan receivables, by a gross-up recognition of the initial allowance in the consolidated statements of financial condition.
PCD mortgage and other loan receivables are those purchased by Global Atlantic that were assessed at acquisition as having experienced a more-than-insignificant deterioration in credit quality since their origination. PCD mortgage and other loan receivables also include those mortgage and other loan receivables previously held by Global Atlantic that were similarly assessed at the time of the 2021 GA Acquisition. The initial amortized cost for a PCD mortgage or other loan receivable equals the purchase price plus the initial allowance for credit losses. The initial allowance for credit losses is determined using a method consistent with that used for other similar loans. See further discussion of allowance methods below. After purchase, the accounting for a PCD mortgage or other loan receivable is consistent with that applied to all other mortgage and other loan receivables. As part of the 2021 GA Acquisition, Global Atlantic identified $3.7 billion of PCD mortgage and other loan receivables with a related allowance of $120.3 million. The initial allowance on the non-PCD mortgage and other loan receivables was recognized outside the purchase accounting analysis and had an impact on the consolidated statements of operations of $183.6 million.
Loan premiums or discounts are amortized or accreted using the effective yield method. Interest income is accrued on the principal balance of each loan based on its contractual interest rate. The accrual of interest is generally suspended when the collection of interest is no longer probable or the collection of any portion of principal is doubtful. Global Atlantic generally suspends accrual of interest for loans that are more than 90 days past due and reverses any related accrued interest to net investment income in the consolidated statements of operations. When a loan is in non-accrual status, coupon payments are generally recognized as interest income as cash is received, subject to consideration as to the overall collectibility of the loan. A loan is returned to accrual status when Global Atlantic determines that the collection of principal and interest due is probable. The allowance for credit losses excludes accrued interest from the amortized cost basis for which losses are estimated.
260
Notes to Financial Statements (Continued)
Policy loans
Policy loans are loans policyholders take out against their life insurance policies. Each policy loan is fully collateralized by the cash surrender value of the policyholder’s life insurance policy. Policy loans are carried at unpaid principal balances. Interest income on such loans is recognized as earned using the contractually agreed upon interest rate and reflected in net investment income in the consolidated statements of operations. Generally, interest is capitalized on the associated policy’s anniversary date.
Other investments
Other investments in the consolidated statements of financial condition include Global Atlantic’s investments in investment partnerships, for which Global Atlantic does not have voting control or power to direct activities. These investments are accounted for using the equity method of accounting unless Global Atlantic’s interest is so minor that it has virtually no influence over partnership operating or financial policies. The equity method of accounting requires that the investments be initially recorded at cost and the carrying amount of the investment subsequently be adjusted to recognize Global Atlantic’s share of the earnings and losses of the investee. Where there is a difference between the cost of the investment and Global Atlantic’s proportionate share of the equity method investee’s net assets, this basis difference is accreted to net investment income over the life of the underlying assets. In applying the equity method, Global Atlantic uses financial information provided by the investee, generally on a one to three month lag due to the timing of the receipt of related financial statements.
The income from Global Atlantic’s equity method investments is included in net investment income in the consolidated statements of operations. In limited circumstances, Global Atlantic elects to apply the fair value option to investment partnerships, which are carried at fair value with unrealized gains and losses reported in net investment-related gains (losses) in the consolidated statements of operations. The contributions to and distributions from investment partnerships are classified as investing activities within the consolidated statements of cash flows.
Global Atlantic consolidates investment partnerships and other entities when it has a controlling financial interest. The results of certain consolidated investment entities are reported on a one to three month lag and intervening events are evaluated for materiality and recognition by disclosure or otherwise, as appropriate.
Included in other investments are Global Atlantic’s investments in renewable energy entities, including partnerships and limited liability companies. Respective investments are consolidated when Global Atlantic has a controlling financial interest, or are accounted for using the equity method of accounting when Global Atlantic has the ability to exercise significant influence but not control. These investments involve tiered capital structures that facilitate a waterfall of returns and allocations to ensure the efficient use of tax credits. A conventional income statement oriented approach to the equity method of accounting, or to the recognition of noncontrolling interests (when Global Atlantic is consolidating the investment), based on ownership percentages does not accurately reflect the proper allocation of income and cash flows for these investments. Instead, Global Atlantic uses the HLBV which is a balance sheet oriented approach to the equity method of accounting and to the recognition of noncontrolling interests that allocates income and cash flows based on changes to each investor’s claim to net assets assuming a liquidation of the investee as of each reporting date, including an assessment of the likelihood of liquidation in determining the contractual provisions to utilize when applying the HLBV method.
Investments in real assets included in other investments in the consolidated statements of financial condition relate to Global Atlantic’s consolidated investments in renewable energy entities and investments in transportation assets. The income, as well as the depreciation and other expenses associated with these tangible assets is reported in net investment income in the consolidated statements of operations.
Income on consolidated investments in renewable energy entities is earned from the sale of the energy generated under long-term contracts. Income on investments in transportation assets is earned from the lease of these assets. Tangible assets associated with renewable energy entities primarily comprise solar energy systems, which are depreciated on a straight-line basis over their estimated useful lives of generally 35 years. Transportation assets are primarily aircraft and railcars, which are depreciated to their estimated salvage value on a straight-line basis over their remaining useful lives. These useful lives generally range up to 25 years for aircraft and 45 years for railcars, as determined from the date of manufacture.
261
Notes to Financial Statements (Continued)
Global Atlantic has certain investments in real estate held in consolidated investment companies that account for such real estate at fair value under investment company accounting, and this specialized accounting is retained in consolidation. Real estate investments are generally valued using a combination of direct income capitalization and discounted cash flow analysis. Certain real estate investments are valued based on ranges of valuations determined by independent valuation firms. Investments in real estate that are carried at depreciated cost are depreciated on a straight-line basis over estimated useful lives of up to 40 years. Net rental income and depreciation on the investments in real estate are recognized in net investment income and changes in the fair value of real estate in consolidated investment companies are recognized in net investment-related gains (losses) in the consolidated statements of operations.
Investments in Federal Home Loan Bank ("FHLB") common stock are also included in other investments in the consolidated statements of financial condition and are accounted at cost.
Derivative instruments
Derivatives are instruments that derive their values from underlying asset prices, indices, foreign exchange rates, reference rates and other inputs or a combination of these factors. Derivatives may be privately negotiated contracts, which are usually referred to as over-the-counter ("OTC") derivatives, or they may be listed and traded on an exchange ("exchange-traded"). Global Atlantic’s derivative instruments are primarily used to hedge certain risks, including interest rate risk, equity market risk and foreign exchange risk. Where certain criteria are met, some of these hedging arrangements may achieve hedge accounting.
Derivative instruments are recognized at estimated fair value in either funds withheld receivable at interest, other assets, funds withheld payable at interest or accrued expenses and other liabilities in the consolidated statements of financial condition, with changes in fair value recorded in net investment-related gains (losses) in the consolidated statements of operations. Where certain qualifying criteria are met, some derivative instruments are designated as accounting hedges and are recognized at estimated fair value in derivative assets or accrued expenses and other liabilities in the consolidated statements of financial condition. For derivative instruments designated as fair value hedges, changes in fair value are recognized in the consolidated statements of operations, in the same line where the hedged item is reported. For derivative instruments designated as cash flow hedges, changes in fair value are initially recognized in accumulated other comprehensive income (loss) in the consolidated statements of financial condition and subsequently reclassified to the consolidated statements of operations when the hedged item affects earnings, in the same line item where the hedged item is reported.
Investment credit losses and impairment
Available-for-sale fixed maturity securities
One of the significant estimates related to AFS securities is the evaluation of those investments for credit losses. The evaluation of investments for credit losses is a quantitative and qualitative quarterly process that is subject to risks and uncertainties and involves significant estimates and judgments by management. Changes in the estimates and judgments used in such analysis can have a significant impact on the consolidated statements of operations. Considerations relevant to the evaluation of credit losses may include the severity of any loss position, as well as changes in market interest rates, changes in business climate, management changes, litigation, government actions, and other similar factors that may impact an issuer’s ability to meet current and future principal and interest obligations. Indicators of credit impairment may also include changes in credit ratings, the frequency of late payments, pricing levels and deterioration in any, or a combination of, key financial ratios, financial statements, revenue forecasts and cash flow projections.
For AFS fixed maturity securities in an unrealized loss position, Global Atlantic first considers the intent to sell a security, or whether it is more-likely-than-not that it will be required to sell the security, before the recovery of its amortized cost. If Global Atlantic intends to sell an AFS fixed maturity security with an unrealized loss or it is more-likely-than-not that it will be required to sell an AFS fixed maturity security with an unrealized loss before recovery of its amortized cost basis, the amortized cost is written down to fair value and a corresponding charge is recognized to net investment-related losses.
262
Notes to Financial Statements (Continued)
For AFS fixed maturity securities in an unrealized loss position that Global Atlantic does not intend to sell, and will not be required to sell, Global Atlantic bifurcates the impairment into two components: credit impairment and non-credit impairment. Credit impairments are measured as the difference between the security’s cost or amortized cost and its estimated recoverable value, which is the present value of its expected future cash flows discounted at the current effective interest rate. The estimated recoverable value is subject to a floor equal to the fair value of the security. The remaining difference between the security’s fair value and the recoverable value, if any, is the non-credit impairment. Credit impairments are recognized in the allowance for credit losses on AFS fixed maturity securities, which is established via a charge to net investment-related losses in the consolidated statements of operations, and non-credit impairments are charged to accumulated other comprehensive income in the consolidated statements of financial condition.
In determining the estimated recoverable value, the review of expected future cash flows for structured securities includes assumptions about key systemic risks (e.g., unemployment rates, housing prices) and loan-specific information (e.g., delinquency rates, loan-to-value ratios). Estimating future cash flows is a quantitative and qualitative process that incorporates information received from third parties, along with assumptions and judgments about the future performance of the underlying collateral. For corporate and government bonds the recoverable value is determined using cash flow estimates that consider facts and circumstances relevant to the security and the issuer, including overall financial strength and secondary sources of repayment as well as pending restructuring or disposition of assets. Where information for such cash flow estimates is limited or deemed not reliable, fair value is considered the best estimate of the recoverable value.
In periods subsequent to the initial recognition of an allowance for credit losses on a fixed maturity security, whether for a PCD security or a security impaired since purchase, Global Atlantic continues to monitor credit loss expectations. Deterioration in the estimated recoverable value of a credit impaired security is recognized as an addition to the allowance for credit losses, as limited by the amount by which the security’s fair value is less than amortized cost. Improvements in the estimated recoverable value of a credit impaired security or improvements in the fair value of a credit impaired security that limit the amount of the allowance result in reductions in the allowance for credit losses, which are recognized as a credit to net investment-related gains in the consolidated statements of income.
Amounts are charged off against the allowance for credit losses when deemed uncollectible or when Global Atlantic determines that it intends to sell, or more likely than not will be required to sell, the security. Charge-offs are reflected as a decrease in the allowance and a direct write down in the amortized cost of the security. If Global Atlantic recovers all or a portion of an amount previously written off on a credit impaired security, the recovery is recognized as a realized investment gain.
Mortgage and other loan receivables
Global Atlantic updates its estimate of the expected credit losses on its investments in mortgage and other loan receivables each quarter. For loans that share similar risk characteristics, expected credit losses are measured on a pool basis. For loans that do not share similar risk characteristics, expected credit losses are measured individually. Loans subject to individual evaluation include those loans that are collateral dependent, where the borrower is experiencing financial difficulty. For these collateral dependent loans, expected credit losses are measured as the difference between the fair value of the collateral (less costs to sell, where the collateral is to be sold) and the amortized cost basis of the loan.
For commercial mortgage loans, the current expected credit losses are estimated using a model that evaluates the probability that each loan will default and estimates the amount of loss given the occurrence of such a default over the life of each loan in the portfolio. The model incorporates historical and current data on the relevant property market and projects potential future paths for each loan’s collateral, considering both the net income to be generated by the collateral real estate and its market value. The model considers how macroeconomic forecasts (such as gross domestic product, unemployment, and interest rates) influence commercial real estate market factors (including vacancy rates, rental and income growth rates, property value changes), and in turn how commercial real estate market conditions, in combination with loan specific information (including debt service coverage and loan to value), drive commercial mortgage loan credit risk.
For residential mortgage loans and consumer loans, the current expected credit losses are primarily estimated using a discounted cash flow model. The model considers loan-specific information as well as current, historical and forecasted data relevant to the respective loans, including home prices, interest rates and unemployment. Expected cash flows are projected for each loan and are discounted using the effective interest rate of the respective loan. Any shortfalls between the discounted cash flows and the amortized cost of each individual loan are aggregated to determine the total allowances on the residential mortgage loan and consumer loan portfolios. For certain residential mortgage loans secured by single-family rental properties, current expected credit losses are determined using a model consistent with that described above for commercial mortgage loans.
263
Notes to Financial Statements (Continued)
With regard to the use of forecasts in the determination of Global Atlantic’s current expected credit losses, the reversion of forecasts to historical data is based on reversion dynamics that depend on the specific variable and its interaction with the other parameters of the respective model; however, the forecasts generally tend to revert to a long-term equilibrium trend within two to three years from the forecast start date.
For the investment in other loan receivables, a variety of methodologies are used to estimate the respective current expected credit losses. These methodologies consider the terms specific to each loan, including the value of any collateral, and evaluate the risk of loss over the life of these loans.
Global Atlantic also assesses and measures an allowance for credit losses arising from off-balance sheet commitments, including loan commitments, that are not unconditionally cancellable by Global Atlantic. This allowance for credit losses for off-balance sheet commitments is determined using methods consistent with those used for the associated mortgage and other loan receivable class, as described above, and is recognized in other liabilities in the consolidated statements of financial condition, since there is no funded asset for the committed amount.
When all or a portion of a loan is deemed uncollectible, the uncollectible portion of the carrying amount of the loan is charged off against the allowance. If Global Atlantic recovers all or a portion of an amount previously written off on a credit impaired loan, the recovery is recognized as a realized investment gain.
Other investments
The determination of the amount of impairment on other classes of investments also requires significant judgment and is based upon a periodic evaluation and assessment of known and inherent risks associated with the respective asset class. Such assessments are revised as conditions change and new information becomes available.
Impairment of consolidated renewable energy assets and transportation assets, as well as investments in real estate carried at depreciated cost, is assessed whenever events or changes in circumstances indicate that the carrying amount may not be recoverable. When indicators of impairment are present, a recoverability test is performed to determine if the sum of the estimated undiscounted future cash flows attributable to the assets is greater than the carrying amount. If the undiscounted estimated future cash flows are less than the carrying amount, an impairment loss is recognized based on the amount by which the carrying amount exceeds its estimated fair value.
Impairment of investments subject to the equity method of accounting is assessed whenever events or circumstances suggest that the carrying amount may not be recoverable. An impairment charge is recognized in earnings for a decline in value that is determined to be other than temporary and is measured as the difference between the carrying amount and the fair value of the equity method investment as of the balance sheet date.
Deferral and amortization of certain revenues and expenses
Deferrals
Deferred policy acquisition costs ("DAC") consist of commissions and other costs that are directly related to the successful acquisition of new or renewal life insurance or annuity contracts. DAC is estimated using a group approach, instead of on an individual contract level. DAC groups, or cohorts, are by product type and issue year and consistent with the groups used in estimating the associated insurance liability. DAC is recorded in insurance intangibles in the consolidated statements of financial condition.
Value of business acquired ("VOBA") represents the difference between the carrying value of the purchased insurance contract liabilities at the time of the business combination and the estimated fair value of insurance and reinsurance contracts. VOBA can be either positive or negative. Positive VOBA is recorded in insurance intangibles. Negative VOBA is recorded in the same financial statement line in the consolidated statements of financial condition as the associated reserves.
For limited-payment products (e.g., payout annuities), gross premiums received in excess of net premiums are deferred at initial recognition as a deferred profit liability (“DPL”). DPL is measured using assumptions consistent with those used in the measurement of the liability for future policy benefits, including discount rate, mortality, lapses, and expenses. DPL is recorded in policy liabilities in the consolidated statements of financial condition.
For certain preneed contracts, the gross premium is in excess of the benefit reserve plus additional insurance liability. An unearned front-end load ("UFEL") is established to defer the recognition of this front-end load. UFEL is recorded in policy liabilities in the consolidated statements of financial condition.
264
Notes to Financial Statements (Continued)
Amortization
DAC is amortized on a constant level basis for the grouped contracts over the expected economic life of the related contracts. Global Atlantic amortizes DAC for all products on a constant level basis based on policy count, except for DAC for traditional life products that are amortized on a constant level basis based on face amount. The constant level bases used for amortization are projected using mortality and lapse assumptions that are based on Global Atlantic's experience, industry data, and other factors and are consistent with those used for the liability for future policy benefits. If those projected assumptions change in future periods, they will be reflected in the cohort level amortization basis at that time. Unexpected lapses, due to higher mortality and lapse experience than expected, are recognized in the current period as a reduction of the capitalized balances.
Amortization of DAC is included in amortization of policyholder acquisition costs in the consolidated statements of operations.
VOBA is generally amortized using the same methodology and assumptions used to amortize DAC.
DPL is amortized and recognized in proportion to insurance in-force for life insurance contracts and expected future benefit payments for annuity contracts. Interest is accreted on the balance of the DPL using the discount rate determined at contract issuance. Global Atlantic reviews and updates its estimates of cash flows for the DPL at the same time as the estimates of cash flows for the liability for future policy benefits. When cash flows are updated, the updated estimates are used to recalculate the DPL at contract issuance. The recalculated DPL as of the beginning of the current reporting period is compared to the carrying amount of the DPL as of the beginning of the current reporting period, and any difference is recognized as either a charge or credit to net policy benefits and claims.
UFEL is amortized consistent with the amortization of DAC on preneed contracts.
The key assumptions used in the calculation of the amortization of these balances are reviewed quarterly and updated if actual experience or other evidence suggests that current assumptions should be revised. In addition, Global Atlantic formally reviews assumptions annually as part of the assumptions review process. The effects of changes in assumptions are recorded in net income in the period in which the changes are made.
Internal replacements
Separate accounts
Separate account assets and liabilities represent segregated funds administered and invested by Global Atlantic for the benefit of variable annuities and variable universal life insurance contractholders and certain pension funds. Global Atlantic reports separately, as assets and liabilities, investments held in the separate accounts and liabilities of separate accounts if: (1) such separate accounts are legally recognized; (2) assets supporting the contract liabilities are legally insulated from Global Atlantic’s general account liabilities; (3) investments are directed by the contract owner or participant; and (4) all investment performance, net of contract fees and assessments, is passed through to the contract owner.
265
Notes to Financial Statements (Continued)
Policy liabilities
Policy liabilities, or collectively, “reserves,” are the portion of past premiums or assessments received that are set aside to meet future policy and contract obligations as they become due. Interest accrues on these reserves and on future premiums, which may also be available to pay for future obligations. Global Atlantic establishes reserves to pay future policyholder benefits, claims, and certain expenses for its life policies and annuity contracts.
Reserves are estimates based on models that include many actuarial assumptions and projections. These assumptions and projections, which are inherently uncertain, involve significant judgment, including assumptions as to the levels and/or timing of premiums, benefits, claims, expenses, interest credits, investment results (including equity market returns), mortality, longevity, and persistency.
The assumptions on which reserves are based are intended to represent an estimation of experience for the period that policyholder benefits are payable. The adequacy of these reserves and the assumptions underlying those reserves are reviewed at least annually. Global Atlantic cannot, however, determine with precision the amount or the timing of actual policyholder benefit payments. If actual experience is better than or equal to the assumptions, then reserves would be adequate to provide for future policyholder benefits and expenses. If experience is worse than the assumptions, additional reserves may be required to meet future policy and contract obligations. This would result in a charge to Global Atlantic’s net income during the period in which excess policyholder benefits are paid or an increase in reserves occurs.
For a majority of Global Atlantic’s in-force policies, including its universal life policies and most annuity contracts, the base policy reserve is equal to the account value. For these products, the account value represents Global Atlantic’s obligation to repay to the policyholder the amounts held on deposit. However, there are several significant blocks of business where additional policyholder reserves are explicitly calculated, including fixed-indexed annuities, variable annuities, universal life with secondary guarantees, indexed universal life and preneed policies.
Annuity contracts
Fixed indexed annuities ("FIA")
Policy liabilities for fixed-indexed annuities earning a fixed rate of interest and certain other fixed-rate annuity products are computed under a retrospective deposit method and represent policyholder account balances before applicable surrender charges. For certain fixed-rate annuity products, an additional reserve was established for above market interest rate guarantees upon acquisition. These reserves are amortized on a straight-line basis over the remaining guaranteed interest rate period.
Certain of Global Atlantic’s fixed-indexed annuity products enable the policyholder to allocate contract value between a fixed crediting rate and strategies which reflect the change in the value of an index, such as the S&P 500 Index or other indices. These products are accounted for as investment-type contracts. The liability for these products consists of a combination of the underlying account value and an embedded derivative value. The liability for the underlying account value is primarily based on policy guarantees and its initial value is the difference between the premium payment and the fair value of the embedded derivative. Thereafter, the account value liability is determined in a manner consistent with the accounting for a deposit liability under the “effective yield method.” All future host balances are determined as: (1) the initial host balance; (2) plus interest; (3) less applicable policyholder benefits. The interest rate used in the prior roll forward is re-determined on each valuation date, per the effective yield method. The embedded derivative component’s fair value is based on an estimate of the policyholders’ expected participation in future increases in the relevant index. The fair value of this embedded derivative component includes assumptions, including those about future interest rates and investment yields, future costs for options used to hedge the contract obligations, projected withdrawal and surrender activity, benefit utilization and the level and limits on contract participation in any future increases in the respective index option. The account value liability and embedded derivative are recorded in policy liabilities in the consolidated statements of financial condition, with changes in value of the liabilities recorded in policy benefits and claims in the consolidated statements of operations.
Contractholder deposit funds reserves for certain assumed blocks of fixed-indexed and fixed-rate annuity products are accounted for as investment-type contracts. A net liability (consisting of the benefit reserve plus deferred revenue liability less ceding commission paid between a ceding and assuming reinsurance company) is established at inception and amortized under the effective yield method.
266
Notes to Financial Statements (Continued)
Global Atlantic issues registered index-linked annuity ("RILA") contracts, which are similar to FIAs in offering the policyholder the opportunity to participate in the performance of a market index, subject to a cap or adjusted for a participation rate. In contrast to the FIA, the RILA enables policyholders to earn higher returns but with the risk of loss to principal and related earnings. In particular, if performance of the market indices is negative, the policyholder may potentially absorb losses, subject to downside protection in the form of either a "buffer" or a "floor" specified in the contract. A "buffer" is protection from downside performance up to a certain percentage, typically 10 percent, with uncapped losses thereafter. A "floor" is protection from downside performance in excess of the "floor," e.g., if the floor is 10% then the policyholder absorbs losses up to 10% but not in excess.
The RILA is accounted for similar to the FIA. The RILA host contract is calculated at the inception of the contract as the value of the initial premium minus the value of the index option, which is an embedded derivative. That initial host value is then accreted to the guaranteed surrender value at the end of the surrender charge period. The RILA index option, which is an embedded derivative, is required to be measured at fair value. Fair value represents the policyholders’ expected participation in future increases in the relevant index and is calculated as the excess cash flows from the indexed crediting feature above the guaranteed cash flows. The excess cash flows are based on the option budget methodology whereby the indexed account is projected to grow by the option budget. A key difference from a standard FIA product is that the RILA policyholder can lose principal on this investment. Therefore, it is possible that the embedded derivative can become negative. The option budget will be calculated depending on the product type and strategy. The growth in the indexed account will be projected based on the value of the options dependent upon the strategy and associated hedge construction. The fair value of this embedded derivative component includes assumptions, including those about future interest rates and investment yields, future costs for options used to hedge the contract obligations, projected withdrawal and surrender activity, benefit utilization and the level and limits on contract participation in any future increases in the respective index option. The account value liability and embedded derivative are recorded in policy liabilities in the consolidated statements of financial condition, with changes in value of the liabilities recorded in policy benefits and claims in the consolidated statements of operations.
Variable annuities
Global Atlantic issues and assumes variable annuity contracts for which the liabilities are included in policy liabilities in the consolidated statements of financial condition. The change in the liabilities for these benefits is included in policy benefits and claims in the consolidated statements of operations. Variable annuity contracts may have certain guarantees that are accounted for as market risk benefits, which are discussed in more detail below.
Funding agreements
Global Atlantic issues funding agreements to certain unaffiliated special purpose entities that have issued debt securities for which payment of interest and principal is secured by such funding agreements. Global Atlantic also has similar obligations to Federal Home Loan Banks. Global Atlantic’s funding agreements are considered investment type contracts and liabilities are net deposits plus accrued and unpaid interest. Global Atlantic's obligation is reported in policy liabilities in the consolidated statements of financial condition. Interest expense is calculated using the effective interest method and recorded in policy benefits and claims in the consolidated statements of operations.
Interest-sensitive life products
For universal life policies, the base policy reserve is the policyholder account value.
Policy liabilities for indexed universal life with returns linked to the performance of a specified market index are equal to the sum of two components: (1) the fair value of the embedded derivative; and (2) the host (or guaranteed) component. The fair value of the embedded derivative component is based on the fair value of the policyholders’ expected participation in future increases in the relevant index over the life of the contract. The fair value of this embedded derivative component includes assumptions, including those about future interest rates and investment yields, future costs for options used to hedge the contract obligations, projected benefits, benefit utilization and the level and limits on contract participation in any future increases in the respective index option.
The initial host balance is established at the time of premium payment and is equal to the total account value less the embedded derivative component. Thereafter, the balance of the host component is determined in a manner consistent with the accounting for a deposit liability under the “effective yield method.” All future host balances are determined as: (1) the initial host balance; (2) plus interest; (3) less applicable policyholder benefits. The interest rate used in the prior roll forward is re-determined on each valuation date, per the effective yield method.
267
Notes to Financial Statements (Continued)
Preneed policies
Global Atlantic’s preneed life insurance contracts are accounted for as universal life-type contracts which require that the retrospective deposit method be used. That accounting method establishes a liability for policyholder benefits in an amount determined by the account or contract balance that accrues to the benefit of the policyholder. This account value is deemed to be equal to the contract’s statutory cash surrender value. The majority of Global Atlantic’s preneed insurance contracts feature death benefits with a discretionary death benefit growth rate. Global Atlantic has the discretion to adjust these rates up or down. Global Atlantic has established an additional reserve for expected future discretionary benefits which is reflected as policy liabilities in the consolidated statements of financial condition. Global Atlantic has also issued preneed insurance contracts with crediting rates tied to inflation as measured by the U.S. Consumer Price Index.
Traditional life and limited payment contracts
Liability for future policy benefits
A liability for future policy benefits, which is the present value of estimated future policy benefits to be paid to or on behalf of policyholders and certain related expenses less the present value of estimated future net premiums to be collected from policyholders, is accrued as premium revenue is recognized. The liability is estimated using current assumptions that include mortality, lapses, and expenses. These current assumptions are based on judgments that consider Global Atlantic’s historical experience, industry data, and other factors.
For nonparticipating traditional and limited-payment contracts, contracts are grouped into cohorts by contract type and issue year. The liability is adjusted for differences between actual and expected experience. With the exception of the expense assumption, Global Atlantic reviews its historical and future cash flow assumptions quarterly and updates the net premium ratio used to calculate the liability each time the assumptions are changed. Global Atlantic has elected to use expense assumptions that are locked in at contract inception and are not subsequently reviewed or updated.
Each quarter, Global Atlantic updates its estimate of cash flows expected over the entire life of a group of contracts using actual historical experience and current future cash flow assumptions. These updated cash flows are discounted using the discount rate or curve on the original contract issue date to calculate the revised net premiums and net premium ratio, which are used to derive an updated liability for future policy benefits. This amount is then compared to the carrying amount of the liability before the updating of cash flow assumptions to determine the current period change in liability estimate. This current period change in the liability is the liability remeasurement gain or loss and is presented parenthetically as a separate component of benefit expense in the consolidated statements of operations.
For nonparticipating traditional and limited-payment contracts, the discount rate assumption is a spot rate yield curve that is derived based on upper medium grade (low credit risk) fixed-income instruments with similar duration to the liability. Global Atlantic uses one or more external indices of corporate credit issues as its proxy for these instruments. The discount rate assumption is updated quarterly and used to remeasure the liability at the reporting date, with the resulting change in the discount rate reflected in other comprehensive income. For liability cash flows between two market observable points on the yield curve, Global Atlantic interpolates the effective yield by holding the marginal rates constant. For liability cash flows that are projected beyond the last market-observable point on the yield curve, Global Atlantic uses the last market-observable yield level.
Payout annuities
Payout annuities include single premium immediate annuities, annuitizations of deferred annuities, pension risk transfer and structured settlements. These contracts subject the insurer to risks over a period that extends beyond the period or periods in which premiums are collected. These contracts may be either non-life contingent or life contingent. Non-life contingent annuities are accounted for as investment contracts. For life contingent annuities, Global Atlantic records a liability at the present value of future annuity payments and estimated future expenses calculated using expected mortality and costs, and expense assumptions. Any gross premiums received in excess of the net premium is the DPL and is recognized separately in income in a constant relationship with the discounted amount of the insurance in-force or expected future benefit payments. These liabilities are recorded in policy liabilities in the consolidated statements of financial condition.
Also included under payout annuities are liabilities for disability income benefits which pertain primarily to disability income policies that are already in claim payout status. Liabilities for disability income benefits are calculated as the present value of future disability payments and estimated future expenses using expected mortality and costs, and interest assumptions. The liabilities are recorded in policy liabilities in the consolidated statements of financial condition.
268
Notes to Financial Statements (Continued)
Whole and term life
Global Atlantic has established liabilities for amounts payable under insurance policies, including whole life insurance and term life insurance policies. These policies provide death benefits in exchange for a guaranteed level premium for a specified period of time and, in the case of whole life, a guaranteed minimum cash surrender value. Generally, liabilities for these policies are calculated as the present value of future expected benefits to be paid, reduced by the present value of future expected net premiums. Current assumptions are used in the establishment of liabilities for future policyholder benefits including mortality, policy lapse, renewal, investment returns, inflation, expenses and other contingent events as appropriate for the respective product. Each quarter, Global Atlantic updates its estimate of cash flows using actual historical experience and current future cash flow assumptions. These updated cash flows are discounted using the discount rate or curve on the original contract issue date to calculate the revised net premiums and net premium ratio, which are used to derive an updated liability for future policy benefits. This amount is then compared to the carrying amount of the liability before the updating of cash flow assumptions to determine the current period change in liability estimate. This current period change in the liability is the liability remeasurement gain or loss and is presented parenthetically as a separate component of benefit expense in the consolidated statements of operations.
Policy liabilities for participating whole life insurance policies are equal to the aggregate of: (1) net level premium reserves for death and endowment policyholder benefits (calculated based upon the non-forfeiture interest rate, and mortality rated guarantee in calculating the cash surrender values described in such contracts); and (2) the liability for terminal dividends.
Product guarantees
Market risk benefits
Market risk benefits are contracts or contract features that both provide protection to the policyholder from other-than-nominal capital market risk and expose Global Atlantic to other-than-nominal capital market risk.
Market risk benefits include certain contract features on fixed annuity and variable annuity products. These features include minimum guarantees to policyholders, such as guaranteed minimum death benefits (“GMDBs”), guaranteed minimum withdrawal benefits (“GMWBs”), and long-term care benefits (which are capped at the return of account value plus one or two times the account value). Market risk benefits are measured at fair value using a non-option and option valuation approach based on current net amounts at risk, market data, experience, and other factors. Changes in fair value are recognized in net income each period with the exception of the portion of the change in fair value due to a change in the instrument-specific credit risk, which is recognized in other comprehensive income.
Additional liability for annuitization, death, or other insurance benefits
Global Atlantic establishes additional liabilities for contracts or contract features that provide for potential benefits in addition to the account balance but are not market risk benefits or embedded derivatives. These benefits include annuitization benefits and death or other insurance benefits (e.g., universal life secondary guarantees). For these benefits, the liability is the sum of the current benefit ratio multiplied by cumulative assessments and accreted interest, less excess payments.
In particular, Global Atlantic holds additional liabilities for universal life products with secondary guarantees, sometimes referred to as no-lapse guarantees. The additional liabilities are measured using the benefit ratio approach where excess benefits are spread over the life of the contract based on assessments collected from the policyholder. Generally, total expected excess benefit payments are the aggregate of death claims after the policyholder account value is exhausted. The exception is when the cost of insurance charges are insufficient to produce consistently positive earnings in the future. In this case, all death benefits are deemed to be excess benefits. For annuitization benefits, the benefit ratio is the present value of expected annuitization payments to be made less the accrued account balance at the expected annuitization date divided by the present value of expected assessments during the accumulation phase of the contract, discounted at the contract rate. Expected annuitization payments and related incremental claim adjustment expenses, expected assessments, and expected excess payments are calculated using discount rate, mortality, lapse, and expense assumptions.
Global Atlantic recognizes a shadow reserve adjustment for the additional insurance liabilities when unrealized gains and losses are included in the investment margin while calculating the present value of expected assessments for the benefit ratios. Shadow reserve adjustments are recognized in other comprehensive income.
For additional liabilities for death or other insurance benefits, the discount rate assumption is based on the contract rate at inception. The mortality, lapse, and expense assumptions are based on Global Atlantic’s experience, industry data, and other factors. Assumptions are reviewed and updated, if necessary, at least annually. When those assumptions are updated, the benefit ratio and the liability are remeasured, with the resulting gain or loss reflected in total benefits expense.
269
Notes to Financial Statements (Continued)
Outstanding claims
Closed blocks
Through its insurance companies, Global Atlantic has acquired several closed blocks of participating life insurance policies. Global Atlantic has elected to account for the closed block policy liabilities using the fair value option.
The assets and cash flow generated by the closed blocks inure solely to the benefit of the holders of policies included in the closed blocks. All closed block assets will ultimately be paid out as policyholder benefits and through policyholder dividends. In the event that the closed blocks’ assets are insufficient to meet the benefits of the closed blocks' benefits, general assets of Global Atlantic would be used to meet the contractual benefits to the closed blocks’ policyholders.
Reinsurance
Consistent with the overall business strategy, Global Atlantic assumes certain policy risks written by other insurance companies on a coinsurance, modified coinsurance or funds withheld coinsurance basis. Reinsurance accounting is applied for these ceded and assumed transactions when risk transfer provisions have been met. To meet risk transfer requirements, a long-duration reinsurance contract must transfer mortality or morbidity risks, and subject the reinsurer to a reasonable possibility of a significant loss. Those contracts that do not meet risk transfer requirements are accounted for using deposit accounting. Global Atlantic seeks to diversify risk and limits its overall financial exposure through reinsurance.
With respect to ceded reinsurance, Global Atlantic values reinsurance recoverables on reported claims at the time the underlying claim is recognized in accordance with contract terms. For future policyholder benefits, Global Atlantic estimates the amount of reinsurance recoverables based on the terms of the reinsurance contracts and historical reinsurance recovery information. The reinsurance recoverables are based on what Global Atlantic believes are reasonable estimates and the balance is reported as an asset in the consolidated statements of financial condition. However, the ultimate amount of the reinsurance recoverable is not known until all claims are settled.
The cost of reinsurance, which is the difference between the amount paid for a reinsurance contract and the amount of the liabilities for policy benefits relating to the underlying reinsured contracts, is deferred and amortized over the reinsurance contract period for short-duration contracts, or over the terms of the reinsured policies on a basis consistent with the reporting of those policies for long-duration contracts. Generally, Global Atlantic amortizes cost of reinsurance based on policy count or effective yield method, retrospectively calculated based on actual and projected future cash flows. Cost of reinsurance assets and liabilities are reported in insurance intangibles and policy liabilities in the consolidated statements of financial condition, respectively. Reinsurance contracts do not relieve Global Atlantic from its obligations to policyholders, and failure of reinsurers to honor their obligations could result in losses to Global Atlantic; consequently, allowances are established for expected credit losses, via a charge to policy benefits and claims in the consolidated statements of operations. Global Atlantic’s funds withheld receivable at interest and reinsurance recoverable assets are reviewed for expected credit losses by considering credit ratings for each reinsurer, historical insurance industry specific default rate factors, rights of offset, expected recovery rates upon default and the impact of other terms specific to the reinsurance arrangement.
270
Notes to Financial Statements (Continued)
For funds withheld and modified coinsurance agreements, Global Atlantic has the right to receive or obligation to pay the total return on assets supporting the funds withheld receivable at interest or funds withheld payable at interest. This indirectly exposes Global Atlantic to the credit risk of the underlying assets. As a result, funds withheld coinsurance and modified coinsurance agreements are viewed as total return swaps and accounted for as embedded derivatives. Embedded derivatives are required to be separated from the host contracts and measured at fair value with changes in fair value recognized in net income. Generally, the embedded derivative is measured as the difference between the fair value of the underlying assets and the carrying value of the host contract at the balance sheet date. The fair value of the embedded derivative is included in the funds withheld receivable at interest or the funds withheld payable at interest on the consolidated statements of financial condition. Changes in the fair value of the embedded derivative are reported in operating activities on the consolidated statements of cash flows.
Recognition of insurance revenue and related benefits
Premiums related to whole life and term life insurance contracts and payout contracts with life contingencies are recognized in premiums in the consolidated statements of operations when due from the contractholders.
Amounts received as payment for universal life and investment-type contracts are reported as deposits to contractholder account balances and recorded in policy liabilities in the consolidated statements of financial condition. Amounts received as payment for Global Atlantic’s fixed fund variable annuities are reported as a component of policy liabilities in the consolidated statements of financial condition. Revenues from these contracts consist primarily of fees assessed against the contractholder account balance for mortality, policy administration, separate account administration and surrender charges, and are reported in policy fees in the consolidated statements of operations. Additionally, Global Atlantic earns investment income from the investment of contract deposits in Global Atlantic’s insurance companies' general account portfolio, which is reported in net investment income in the consolidated statements of operations.
Fees assessed that represent compensation to Global Atlantic for benefits to be provided in future periods and certain other fees are established as an unearned revenue reserve liability and amortized into revenue over the expected life of the related contracts in proportion to estimated gross profits in a manner consistent with DAC for these contracts. Unearned revenue reserves are reported in policy liabilities in the consolidated statements of financial condition and amortized into policy fees in the consolidated statements of operations. Benefits and expenses for these products include claims in excess of related account balances, expenses for contract administration and interest credited to contractholder account balances in the consolidated statements of operations.
Global Atlantic primarily earns revenues from premiums, policy fees, income from investments, and other administration, management, and distribution fees. For the year ended December 31, 2023, Global Atlantic’s revenue was sourced in its entirety from the Americas (100 %), based on the geographic region of the reporting subsidiary company. Additionally, none of Global Atlantic’s customers contributed more than 10% of KKR's total consolidated revenues and predominantly all of Global Atlantic’s fixed assets are located in the United States.
Other income
Insurance expenses
General, administrative and other expenses
Equity-based, incentive and other deferred compensation
Global Atlantic has established a long-term incentive plan to foster and promote its long-term financial success. Compensation expense for Global Atlantic’s incentive awards is recognized only when vesting is deemed to be probable.
271
Notes to Financial Statements (Continued)
Global Atlantic measures compensation cost for service-based, equity-classified share-based payment awards at fair value as of the grant date and recognizes it in general, administrative and other expenses in the consolidated statements of operations as compensation expense over the requisite service period for awards expected to vest. Global Atlantic recognizes the expense using the straight-line attribution method, with adjustments for estimated forfeitures. For awards with performance-based vesting, expense recognition is deferred until the performance factor occurs or becomes probable.
Adoption of new accounting pronouncements
Targeted improvements to the accounting for long-duration contracts
Effective January 1, 2023, Global Atlantic adopted new accounting guidance for insurance and reinsurance companies that issue long-duration contracts (“LDTI”), with retrospective application to February 1, 2021 ("2021 GA Acquisition Date"), coinciding with the acquisition of Global Atlantic by KKR ("2021 GA Acquisition").
The following table summarizes the balance of, and changes in, the liability for future policy benefits as of February 1, 2021 due to the adoption of LDTI.
| Liability for future policy benefits | Payout annuities | Other | Total | ||||||||||||||
| Balance, as of February 1, 2021 | $ | $ | $ | ||||||||||||||
| Change in discount rate assumptions | |||||||||||||||||
| Adjusted balance, as of February 1, 2021 | $ | $ | $ | ||||||||||||||
The increase to the liability for future policy benefits as of February 1, 2021, was primarily due to remeasuring the liability using a discount rate based on a spot rate yield curve that is derived based on upper medium grade (low credit risk) fixed-income instruments with similar duration to the liability.
The following table summarizes the balance of, and changes in, the net liability position of market risk benefits (previously recorded as product guarantees included within policy liabilities in the consolidated statement of financial condition) as of February 1, 2021 due to the adoption of LDTI.
| Market risk benefits | Fixed-indexed annuities | Variable- and other annuities | Total | ||||||||||||||
Balance, as of February 1, 2021(1) | $ | $ | $ | ||||||||||||||
| Adjustment for the difference between prior carrying amount and market risk benefit value | |||||||||||||||||
| Adjusted balance, as of February 1, 2021 | $ | $ | $ | ||||||||||||||
(1)The $1,220.4 million balance associated with market risk benefits prior to transition was previously recorded as product guarantees either as an embedded derivative in contractholder deposits of $236.0 million, or as an additional liability for insurance benefits of $984.4 million under policy liabilities extinguished at transition, and remeasured as market risk benefits.
The transition approach for market risk benefits requires assessing products to determine whether contracts or contract features expose Global Atlantic to other than nominal capital market risk. The balance at February 1, 2021 reflects the population of market risk benefits identified. The increase to the carrying value of the market risk benefit liability as of February 1, 2021, reflects the required adjustment to remeasure the liability at fair value using current net amounts at risk, market data, experience, and other factors. The change primarily reflects the impact of discount rates and instrument-specific credit risk as of the transition date.
272
Notes to Financial Statements (Continued)
The following table summarizes the balance of, and changes in, reinsurance recoverable as of February 1, 2021 due to the adoption of LDTI.
| Reinsurance recoverable | Fixed indexed annuities | Payout annuities | Other | Total | |||||||||||||||||||
| Balance, as of February 1, 2021 | $ | $ | $ | $ | |||||||||||||||||||
| Change in discount rate assumptions | |||||||||||||||||||||||
| Adjusted balance, as of February 1, 2021, net of reinsurance | $ | $ | $ | $ | |||||||||||||||||||
The following table summarizes the balance of, and changes in, value of business acquired, net as of February 1, 2021 due to the adoption of LDTI.
| VOBA | Fixed indexed annuities | Fixed-rate annuities | Payout annuities | Interest-sensitive life | Variable annuities | Other | Total | ||||||||||||||||||||||||||||||||||
| Balance, as of February 1, 2021 | $ | $ | $ | $ | $ | $ | $ | ||||||||||||||||||||||||||||||||||
| Adjustment to reflect transition impact to balance established as part of purchase accounting upon the 2021 GA Acquisition | |||||||||||||||||||||||||||||||||||||||||
| Adjusted balance, as of February 1, 2021 | $ | $ | $ | $ | $ | $ | $ | ||||||||||||||||||||||||||||||||||
The following table summarizes the balance of, and changes in, negative value of business acquired, net as of February 1, 2021 due to the adoption of LDTI.
| Negative VOBA | Fixed indexed annuities | Fixed-rate annuities | Payout annuities | Interest-sensitive life | Variable annuities | Other | Total | ||||||||||||||||||||||||||||||||||
| Balance, as of February 1, 2021 | $ | $ | $ | $ | $ | $ | $ | ||||||||||||||||||||||||||||||||||
| Adjustment to reflect transition impact to balance established as part of purchase accounting upon the 2021 GA Acquisition | ( | ||||||||||||||||||||||||||||||||||||||||
| Adjusted balance, as of February 1, 2021 | $ | $ | $ | $ | $ | $ | $ | ||||||||||||||||||||||||||||||||||
As a result of the 2021 GA Acquisition, Global Atlantic established a new accounting basis to reflect the fair value of assets and liabilities on the 2021 GA Acquisition Date, including resetting retained earnings, deferred acquisition costs and accumulated other comprehensive income to zero. As a result of the transition coinciding with the acquisition by KKR, the transition impact of the adoption was recorded as a change to the present value of future profits reflected in the value of business acquired insurance intangible asset recognized as part of purchase accounting.
The following table presents the effect of transition adjustments on the value of business acquired assets and liabilities due to the adoption of LDTI.
| February 1, 2021 | |||||||||||
| VOBA | Negative VOBA | ||||||||||
| Reinsurance recoverable | $ | ( | $ | ||||||||
| Liability for future policy benefits | ( | ||||||||||
| Market risk benefits | |||||||||||
| Total transition adjustments | $ | $ | ( | ||||||||
273
Notes to Financial Statements (Continued)
As a result of the retrospective application of the LDTI adoption, KKR adjusted certain previously reported amounts in its consolidated statements of financial condition, consolidated statements of operations, consolidated statements of comprehensive income, and consolidated statements of cash flows, as follows:
| Consolidated statement of financial condition as of December 31, 2022 | As previously reported | Adjustment | As revised | ||||||||||||||
| Reinsurance recoverable | $ | $ | ( | $ | |||||||||||||
| Insurance intangible assets | |||||||||||||||||
| Other assets | ( | ||||||||||||||||
| Total assets | ( | ||||||||||||||||
| Policy liabilities | ( | ||||||||||||||||
| Accrued expenses and other liabilities | ( | ||||||||||||||||
| Total liabilities | ( | ||||||||||||||||
| Additional paid-in capital | |||||||||||||||||
| Retained earnings | |||||||||||||||||
| Accumulated other comprehensive income (loss) | ( | ( | |||||||||||||||
| Noncontrolling interests | |||||||||||||||||
| Total equity | |||||||||||||||||
The cumulative impact of the retrospective application of the LDTI adoption increased net income attributable to shareholders by $319.5 million and $65.9 million for each of the periods ended December 31, 2022 and 2021, respectively ($385.4 million cumulatively), and increased other comprehensive income by $589.6 million and $10.3 million for each of the periods ended December 31, 2022 and 2021, respectively ($599.9 million cumulatively). These increases were primarily as a result of an increase in discount rates and Global Atlantic’s instrument-specific credit risk during each of the respective periods.
| Consolidated statement of operations for the year ended December 31, 2022 | As previously reported | Adjustment | As revised | ||||||||||||||
| Policy fees | $ | $ | ( | $ | |||||||||||||
Net policy benefits and claims(1) | ( | ||||||||||||||||
| Amortization of policy acquisition costs | |||||||||||||||||
| Insurance expenses | ( | ||||||||||||||||
| General, administrative and other | |||||||||||||||||
| Income tax expense (benefit) | ( | ||||||||||||||||
| Net Income (Loss) | ( | ( | |||||||||||||||
| Net Income (Loss) Attributable to KKR & Co. Inc. Common Stockholders | ( | ( | |||||||||||||||
| Net Income (Loss) Attributable to KKR & Co. Inc. Per Share of Common Stock – Basic | ( | ( | |||||||||||||||
Net Income (Loss) Attributable to KKR & Co. Inc. Per Share of Common Stock – Diluted | ( | ( | |||||||||||||||
_________________
(1)Includes adjustment for market risk benefit gain for the year ended December 31, 2022 of $(673.4 ) million.
| Consolidated statement of operations for the year ended December 31, 2021 | As previously reported | Adjustment | As revised | ||||||||||||||
| Policy fees | $ | $ | ( | $ | |||||||||||||
Net policy benefits and claims(1) | ( | ||||||||||||||||
| Amortization of policy acquisition costs | ( | ( | |||||||||||||||
| Income tax expense (benefit) | |||||||||||||||||
| Net Income (Loss) | |||||||||||||||||
| Net Income (Loss) Attributable to KKR & Co. Inc. Common Stockholders | |||||||||||||||||
| Net Income (Loss) Attributable to KKR & Co. Inc. Per Share of Common Stock – Basic | |||||||||||||||||
Net Income (Loss) Attributable to KKR & Co. Inc. Per Share of Common Stock – Diluted | |||||||||||||||||
_________________
(1)Includes adjustment for market risk benefit gain for the year ended December 31, 2021 of $(152.4 ) million.
274
Notes to Financial Statements (Continued)
| Consolidated statement of comprehensive loss for the year ended December 31, 2022 | As previously reported | Adjustment | As revised | ||||||||||||||
| Unrealized Gains (Losses) on Available-For-Sale Securities and Other | $ | ( | $ | ( | $ | ( | |||||||||||
| Net effect of changes in discount rates and instrument-specific credit risk on policy liabilities | |||||||||||||||||
| Comprehensive Income (Loss) | ( | ( | |||||||||||||||
| Comprehensive Income (Loss) Attributable to KKR & Co. Inc. | ( | ( | |||||||||||||||
| Consolidated statement of comprehensive income for the year ended December 31, 2021 | As previously reported | Adjustment | As revised | ||||||||||||||
| Unrealized Gains (Losses) on Available-For-Sale Securities and Other | $ | ( | $ | ( | $ | ( | |||||||||||
| Net effect of changes in discount rates and instrument-specific credit risk on policy liabilities | |||||||||||||||||
| Comprehensive Income (Loss) | |||||||||||||||||
| Comprehensive Income (Loss) Attributable to KKR & Co. Inc. | |||||||||||||||||
| Consolidated statement of cash flow for the year ended December 31, 2022 | As previously reported | Adjustment | As revised | ||||||||||||||
| Net realized (gains) losses on insurance operations | $ | $ | ( | $ | |||||||||||||
| Other non-cash amounts | |||||||||||||||||
| Change in policy liabilities and accruals, net | ( | ( | ( | ||||||||||||||
| Change in other assets | |||||||||||||||||
| Change in accrued expenses and other liabilities | ( | ( | ( | ||||||||||||||
| Consolidated statement of cash flow for the year ended December 31, 2021 | As previously reported | Adjustment | As revised | ||||||||||||||
| Net realized (gains) losses on insurance operations | $ | $ | ( | $ | |||||||||||||
| Other non-cash amounts | ( | ( | |||||||||||||||
| Change in Premiums, Notes Receivable and Reinsurance Recoverable, Net of Reinsurance Premiums Payable - Insurance | ( | ||||||||||||||||
| Change in Deferred Policy Acquisition Costs - Insurance | ( | ( | |||||||||||||||
| Change in policy liabilities and accruals, net | ( | ( | ( | ||||||||||||||
| Change in other assets | |||||||||||||||||
| Change in accrued expenses and other liabilities | ( | ||||||||||||||||
Troubled debt restructurings and vintage disclosures
In March 2022, the FASB issued new guidance regarding the modification of receivables, which affects their recognition and measurement. The guidance eliminates the concept of troubled debt restructurings and instead requires all modifications to be analyzed to determine whether they result in a new receivable or a continuation of an existing receivable. The guidance also makes related updates to the measurement of expected credit losses for receivables. The new guidance requires additional disclosures for receivable modifications involving borrowers experiencing financial difficulty as well as disclosure of loan charge-offs by origination year (vintage). For entities that have already adopted ASC 326 (addressing credit losses on financial instruments), the guidance was effective for fiscal years beginning after December 15, 2022, including interim periods within those fiscal years. KKR adopted this accounting standard effective January 1, 2023. Refer to Note 7 “—Investments—Loan modifications” for additional information.
Future application of accounting standards
Fair value measurement of equity security subject to contractual sale restriction
In June 2022, the FASB issued Accounting Standard Update ("ASU") 2022-03, ASC Subtopic 820 “Fair Value Measurement of Equity Securities Subject to Contractual Sale Restrictions.” According to ASU 2022-03, the reporting company should not consider contractual sale restrictions when measuring the equity security’s fair value and is not allowed to recognize a contractual sale restriction as a separate unit of account. ASU 2022-03 is effective for fiscal years beginning after December 15, 2023, and interim periods within those fiscal years. Early adoption is permitted for both interim and annual financial statements that have not yet been issued or made available for issuance. The adoption is not expected to have a material impact on KKR's consolidated financial statements.
275
Notes to Financial Statements (Continued)
Accounting for Investments in Tax Credit Structures
In March 2023, the FASB issued ASU 2023-02 "Investments - Equity Method and Joint Ventures (Topic 323): Accounting for Investments in Tax Credit Structures Using the Proportional Amortization Method." ("ASU 2023-02"). ASU 2023-02 intends to expand the population of investments in tax credit structures that may be eligible to apply the proportional amortization method (“PAM”), if certain criteria are met. The election to use the PAM can be made on a tax credit program-by-program basis. Under the new guidance, certain disclosures are required for investments in tax credit programs for which the PAM is elected. The guidance is effective for fiscal years beginning after December 15, 2023, with early adoption permitted. The adoption is not expected to have a material impact on KKR's consolidated financial statements.
Improvements to Reportable Segment Disclosures
In November 2023, the FASB issued ASU 2023-07 "Segment Reporting (Topic 280): Improvements to Reportable Segment Disclosures" ("ASU 2023-07"). ASU 2023-07 intends to improve reportable segment disclosure requirements, primarily through enhanced disclosures about significant segment expenses. This is effective for fiscal years beginning after December 15, 2023, and interim periods within fiscal years beginning after December 15, 2024. KKR is currently evaluating the impact of the adoption of this guidance on its consolidated financial statements and disclosures.
Improvements to Income Tax Disclosures
In December 2023, the FASB issued ASU 2023-09 "Improvements to Income Tax Disclosures" ("ASU 2023-09"). ASU 2023-09 intends to enhance the transparency and decision usefulness of income tax disclosures, requiring disaggregated information about an entity’s effective tax rate reconciliation as well as income taxes paid. This is effective for fiscal years beginning after December 15, 2024. KKR is currently evaluating the impact of the adoption of this guidance on its consolidated financial statements and disclosures.
276
Notes to Financial Statements (Continued)
3. REVENUES - ASSET MANAGEMENT
For the years ended December 31, 2023, 2022, and 2021, respectively, Asset Management revenues consisted of the following:
| Years Ended December 31, | ||||||||||||||||||||
| 2023 | 2022 | 2021 | ||||||||||||||||||
| Management Fees | $ | $ | $ | |||||||||||||||||
| Fee Credits | ( | ( | ( | |||||||||||||||||
| Transaction Fees | ||||||||||||||||||||
| Monitoring Fees | ||||||||||||||||||||
| Incentive Fees | ||||||||||||||||||||
| Expense Reimbursements | ||||||||||||||||||||
| Consulting Fees | ||||||||||||||||||||
| Total Fees and Other | ||||||||||||||||||||
| Carried Interest | ( | |||||||||||||||||||
| General Partner Capital Interest | ( | |||||||||||||||||||
| Total Capital Allocation-Based Income (Loss) | ( | |||||||||||||||||||
| Total Revenues - Asset Management | $ | $ | $ | |||||||||||||||||
KKR earns management fees, incentive fees and capital allocation-based income (loss) from investment funds, CLOs, and other vehicles whose primary focus is making investments in specified geographical locations and KKR also earns transaction, monitoring, and consulting fees from portfolio companies located in varying geographies. For the years ended December 31, 2023, 2022, and 2021, over 10% of consolidated revenues were earned in the United States.
For the year ended December 31, 2023, $1.8 billion, $0.6 billion, and $0.6 billion of total fees and other were generated in the Americas, Europe/Middle East, and Asia-Pacific, respectively. For the year ended December 31, 2022, $1.7 billion, $0.5 billion, and $0.6 billion of total fees and other were generated in the Americas, Europe/Middle East, and Asia-Pacific, respectively. For the year ended December 31, 2021, $1.5 billion, $0.7 billion, and $0.6 billion of total fees and other were generated in the Americas, Europe/Middle East, and Asia-Pacific, respectively. The determination of the geographic region was based on the geographic focus of the associated investment vehicle or where the portfolio company is headquartered.
For the year ended December 31, 2023, $1.5 billion, $0.4 billion, and $0.9 billion of total capital allocation-based income (loss) were generated in the Americas, Europe/Middle East, and Asia-Pacific, respectively. For the year ended December 31, 2022, $(1.6 ) billion, $0.1 billion, and $(1.0 ) billion of total capital allocation-based income (loss) were generated in the Americas, Europe/Middle East, and Asia-Pacific, respectively. For the year ended December 31, 2021, $4.9 billion, $0.5 billion, and $1.4 billion of total capital allocation-based income (loss) were generated in the Americas, Europe/Middle East, and Asia-Pacific, respectively. The determination of the geographic region was based on the geographic focus of the associated investment vehicle.
For the year ended December 31, 2023, revenues from one of KKR’s flagship private equity funds contributed more than 10% of KKR's total consolidated revenues representing approximately $1.0 billion of total consolidated revenues. For the year ended December 31, 2022, revenues from one of KKR’s flagship private equity funds contributed more than 10% of KKR's total fees and other representing approximately $0.2 billion. For the year ended December 31, 2022, revenues from three of KKR’s flagship private equity funds contributed more than 10% of KKR's total capital allocation-based income (loss) representing approximately $(2.6 ) billion. For the year ended December 31, 2021, revenues from two of KKR’s flagship private equity funds contributed more than 10% of KKR's total consolidated revenues representing approximately $4.5 billion of total consolidated revenues.
277
Notes to Financial Statements (Continued)
4. NET GAINS (LOSSES) FROM INVESTMENT ACTIVITIES - ASSET MANAGEMENT
Net Gains (Losses) from Investment Activities in the consolidated statements of operations consist primarily of the realized and unrealized gains and losses on investments (including foreign exchange gains and losses attributable to foreign denominated investments and related activities) and other financial instruments, including those for which the fair value option has been elected. Unrealized gains or losses result from changes in the fair value of these investments and other financial instruments during a period. Upon disposition of an investment or financial instrument, previously recognized unrealized gains or losses are reversed and an offsetting realized gain or loss is recognized in the current period.
The following table summarizes total Net Gains (Losses) from Investment Activities:
| For the Year Ended December 31, 2023 | |||||||||||||||||
| Net Realized Gains (Losses) | Net Unrealized Gains (Losses) | Total | |||||||||||||||
Private Equity (1) | $ | ( | $ | $ | |||||||||||||
Credit (1) | ( | ||||||||||||||||
Investments of Consolidated CFEs (1) | ( | ||||||||||||||||
Real Assets (1) | ( | ( | |||||||||||||||
Equity Method - Other (1) | |||||||||||||||||
Other Investments (1) | ( | ( | |||||||||||||||
Foreign Exchange Forward Contracts and Options (2) | ( | ( | |||||||||||||||
Securities Sold Short (2) | ( | ( | |||||||||||||||
Other Derivatives (2) | |||||||||||||||||
Debt Obligations and Other (3) | ( | ( | |||||||||||||||
| Net Gains (Losses) From Investment Activities | $ | ( | $ | $ | |||||||||||||
| For the Year Ended December 31, 2022 | |||||||||||||||||
| Net Realized Gains (Losses) | Net Unrealized Gains (Losses) | Total | |||||||||||||||
Private Equity (1) | $ | $ | ( | $ | ( | ||||||||||||
Credit (1) | ( | ( | ( | ||||||||||||||
Investments of Consolidated CFEs (1) | ( | ( | ( | ||||||||||||||
Real Assets (1) | |||||||||||||||||
Equity Method - Other (1) | ( | ( | |||||||||||||||
Other Investments (1) | ( | ( | |||||||||||||||
Foreign Exchange Forward Contracts and Options (2) | ( | ||||||||||||||||
Securities Sold Short (2) | |||||||||||||||||
Other Derivatives (2) | ( | ||||||||||||||||
Debt Obligations and Other (3) | ( | ||||||||||||||||
| Net Gains (Losses) From Investment Activities | $ | $ | ( | $ | ( | ||||||||||||
| For the Year Ended December 31, 2021 | |||||||||||||||||
| Net Realized Gains (Losses) | Net Unrealized Gains (Losses) | Total | |||||||||||||||
Private Equity (1) | $ | $ | $ | ||||||||||||||
Credit (1) | ( | ||||||||||||||||
Investments of Consolidated CFEs (1) | |||||||||||||||||
Real Assets (1) | |||||||||||||||||
Equity Method - Other (1) | |||||||||||||||||
Other Investments (1) | ( | ||||||||||||||||
Foreign Exchange Forward Contracts and Options (2) | ( | ||||||||||||||||
Securities Sold Short (2) | |||||||||||||||||
Other Derivatives (2) | ( | ( | |||||||||||||||
Debt Obligations and Other (3) | ( | ||||||||||||||||
| Net Gains (Losses) From Investment Activities | $ | $ | $ | ||||||||||||||
(1)See Note 7 "Investments."
(2)See Note 8 "Derivatives" and Note 14 "Other Assets and Accrued Expenses and Other Liabilities."
278
Notes to Financial Statements (Continued)
5. NET INVESTMENT INCOME - INSURANCE
Net investment income for Global Atlantic is comprised primarily of interest income, including amortization of premiums and accretion of discounts, based on yields that change due to expectations in projected cash flows, dividend income from common and preferred stock, earnings from investments accounted for under equity method accounting, and lease income on other investments.
The components of net investment income were as follows:
| Years Ended December 31, | |||||||||||||||||
| 2023 | 2022 | 2021 | |||||||||||||||
| Fixed maturity securities – interest and other income | $ | $ | $ | ||||||||||||||
| Mortgage and other loan receivables | |||||||||||||||||
| Investments in transportation and other leased assets | |||||||||||||||||
| Investments in renewable energy | |||||||||||||||||
| Investments in real estate | |||||||||||||||||
| Short-term and other investment income | |||||||||||||||||
| Income assumed from funds withheld receivable at interest | |||||||||||||||||
| Policy loans | |||||||||||||||||
| Equity securities – dividends and other income | |||||||||||||||||
| Income ceded to funds withheld payable at interest | ( | ( | ( | ||||||||||||||
| Gross investment income | |||||||||||||||||
| Less investment expenses: | |||||||||||||||||
| Investment management and administration | |||||||||||||||||
| Transportation and renewable energy asset depreciation and maintenance | |||||||||||||||||
| Interest expense on derivative collateral and repurchase agreements | |||||||||||||||||
| Net investment income | $ | $ | $ | ||||||||||||||
279
Notes to Financial Statements (Continued)
6. NET INVESTMENT-RELATED GAINS (LOSSES) - INSURANCE
Net investment-related gains (losses) from insurance operations primarily consists of (i) realized gains (losses) from the disposal of investments, (ii) unrealized gains (losses) from investments held for trading, equity securities, real estate investments accounted for under investment company accounting, and investments with fair value remeasurements recognized in earnings as a result of the election of a fair-value option, (iii) unrealized gains (losses) on funds withheld at interest, (iv) unrealized gains (losses) from derivatives (excluding certain derivatives designated as hedge accounting instruments), and (v) allowances for credit losses, and other impairments of investments.
Net investment-related gains (losses) were as follows:
| Years Ended December 31, | |||||||||||||||||
| 2023 | 2022 | 2021 | |||||||||||||||
| Realized losses on available-for-sale fixed maturity debt securities | $ | ( | $ | ( | $ | ( | |||||||||||
| Credit loss allowances on available-for-sale securities | ( | ( | |||||||||||||||
| Credit loss allowances on mortgage and other loan receivables | ( | ( | ( | ||||||||||||||
| Allowances on unfunded commitments | ( | ( | |||||||||||||||
| Impairment of available-for-sale fixed maturity debt securities due to intent to sell | ( | ||||||||||||||||
| Unrealized gains (losses) on fixed maturity securities classified as trading | ( | ( | |||||||||||||||
| Unrealized (losses) gains on investments recognized under the fair-value option | ( | ||||||||||||||||
| Unrealized (losses) gains on real estate investments recognized at fair value under investment company accounting | ( | ( | |||||||||||||||
| Net (losses) gains on derivative instruments | ( | ||||||||||||||||
| Realized gains (losses) on funds withheld at interest payable portfolio | ( | ||||||||||||||||
| Realized (losses) gains on funds withheld at interest receivable portfolio | ( | ( | |||||||||||||||
| Realized gains on equity investments | |||||||||||||||||
| Other realized gains (losses) | ( | ( | |||||||||||||||
| Net investment-related gains (losses) | $ | ( | $ | ( | $ | ||||||||||||
Allowance for credit losses
Available-for-sale fixed maturity securities
The table below presents a roll-forward of the allowance for credit losses recognized for fixed maturity securities held by Global Atlantic:
| Year Ended December 31, 2023 | Year Ended December 31, 2022 | ||||||||||||||||||||||||||||||||||
| Corporate | Structured | Total | Corporate | Structured | Total | ||||||||||||||||||||||||||||||
| Balance, as of beginning of period | $ | $ | $ | $ | $ | $ | |||||||||||||||||||||||||||||
| Initial credit loss allowance recognized on securities with no previously recognized allowance | |||||||||||||||||||||||||||||||||||
| Initial credit loss allowance recognized on purchased credit deteriorated ("PCD") securities | |||||||||||||||||||||||||||||||||||
| Accretion of initial credit loss allowance on PCD securities | |||||||||||||||||||||||||||||||||||
| Reductions due to sales (or maturities, pay downs or prepayments) during the period of securities with a previously recognized credit loss allowance | ( | ( | ( | ( | ( | ||||||||||||||||||||||||||||||
| Net additions / reductions for securities with a previously recognized credit loss allowance | ( | ( | ( | ||||||||||||||||||||||||||||||||
| Balances charged off | ( | ( | ( | ( | |||||||||||||||||||||||||||||||
| Balance, as of end of period | $ | $ | $ | $ | $ | $ | |||||||||||||||||||||||||||||
280
Notes to Financial Statements (Continued)
| Year Ended December 31, 2021 | |||||||||||||||||
| Corporate | Structured | Total | |||||||||||||||
Balance, as of beginning of period(1) | $ | $ | $ | ||||||||||||||
| Initial credit loss allowance recognized on securities with no previously recognized allowance | |||||||||||||||||
| Initial credit loss allowance recognized on PCD securities | |||||||||||||||||
| Accretion of initial credit loss allowance on PCD securities | |||||||||||||||||
| Reductions due to sales (or maturities, pay downs or prepayments) during the period of securities with a previously recognized credit loss allowance | ( | ( | |||||||||||||||
| Net additions / reductions for securities with a previously recognized credit loss allowance | ( | ( | |||||||||||||||
| Balance, as of end of period | $ | $ | $ | ||||||||||||||
(1)For the year ended December 31, 2021, includes securities designated as purchased credit impaired as of the time of the acquisition of Global Atlantic.
Mortgage and other loan receivables
Changes in the allowance for credit losses on mortgage and other loan receivables held by Global Atlantic are summarized below:
| Year Ended December 31, 2023 | Year Ended December 31, 2022 | ||||||||||||||||||||||||||||||||||||||||||||||
| Commercial Mortgage Loans | Residential Mortgage Loans | Consumer and Other Loan Receivables | Total | Commercial Mortgage Loans | Residential Mortgage Loans | Consumer and Other Loan Receivables | Total | ||||||||||||||||||||||||||||||||||||||||
| Balance, as of beginning of period | $ | $ | $ | $ | $ | $ | $ | $ | |||||||||||||||||||||||||||||||||||||||
| Net provision (release) | ( | ||||||||||||||||||||||||||||||||||||||||||||||
Charge-offs(2) | ( | ( | ( | ( | ( | ( | ( | ||||||||||||||||||||||||||||||||||||||||
| Recoveries of amounts previously charged-off | — | — | — | — | |||||||||||||||||||||||||||||||||||||||||||
| Balance, as of end of period | $ | $ | $ | $ | $ | $ | $ | $ | |||||||||||||||||||||||||||||||||||||||
| Year Ended December 31, 2021 | |||||||||||||||||||||||
| Commercial Mortgage Loans | Residential Mortgage Loans | Consumer and Other Loan Receivables | Total | ||||||||||||||||||||
Balance, as of beginning of period(1) | $ | $ | $ | $ | |||||||||||||||||||
| Net provision (release) | |||||||||||||||||||||||
| Loans purchased with credit deterioration | |||||||||||||||||||||||
| Charge-offs | ( | ( | |||||||||||||||||||||
| Balance, as of end of period | $ | $ | $ | $ | |||||||||||||||||||
(1)For the year ended December 31, 2021, includes loans designated as purchased credit deteriorated as of the time of the acquisition of Global Atlantic.
(2)Consumer and other loan receivables included $12.8 million of recoveries for the year ended December 31, 2022.
281
Notes to Financial Statements (Continued)
Proceeds and gross gains and losses from voluntary sales
The proceeds from voluntary sales and the gross gains and losses on those sales of available-for-sale ("AFS") fixed maturity securities were as follows:
| Years Ended December 31, | |||||||||||||||||
| 2023 | 2022 | 2021 | |||||||||||||||
| AFS fixed maturity securities: | |||||||||||||||||
| Proceeds from voluntary sales | $ | $ | $ | ||||||||||||||
| Gross gains | $ | $ | $ | ||||||||||||||
| Gross losses | $ | ( | $ | ( | $ | ( | |||||||||||
282
Notes to Financial Statements (Continued)
7. INVESTMENTS
Investments consist of the following:
| December 31, 2023 | December 31, 2022 | ||||||||||
| Asset Management | |||||||||||
| Private Equity | $ | $ | |||||||||
| Credit | |||||||||||
| Investments of Consolidated CFEs | |||||||||||
| Real Assets | |||||||||||
| Equity Method - Other | |||||||||||
| Equity Method - Capital Allocation-Based Income | |||||||||||
| Other Investments | |||||||||||
| Investments - Asset Management | $ | $ | |||||||||
| Insurance | |||||||||||
Fixed maturity securities, available-for-sale, at fair value(1) | $ | $ | |||||||||
| Mortgage and other loan receivables | |||||||||||
Fixed maturity securities, trading, at fair value(2) | |||||||||||
| Other investments | |||||||||||
| Funds withheld receivable at interest | |||||||||||
| Policy loans | |||||||||||
| Equity securities at fair value | |||||||||||
| Investments - Insurance | $ | $ | |||||||||
| Total Investments | $ | $ | |||||||||
(1)Amortized cost of $78.7 billion and $73.6 billion, net of credit loss allowances of $268.7 million and $128.3 million, respectively.
(2)Amortized cost of $20.5 billion and $14.8 billion, respectively.
As of both December 31, 2023 and 2022, there were no investments which represented greater than 5
283
Notes to Financial Statements (Continued)
Equity Method
KKR evaluates its equity method investments for which KKR has not elected the fair value option for impairment whenever events or changes in circumstances indicate that the carrying amounts of such investments may not be recoverable. During the years ended December 31, 2023, 2022 and 2021, there were no
Summarized Financial Information
KKR evaluates each of its equity method investments to determine if any are significant as defined in the regulations promulgated by the U.S. Securities and Exchange Commission (the "SEC"). As of and for the years ended December 31, 2023, 2022, and 2021, no individual equity method investment held by KKR met the significance criteria. As such, KKR is not required to present separate financial statements for any of its equity method investments.
The following table shows summarized financial information relating to the statements of financial condition for all of KKR's equity method investments assuming 100
| December 31, 2023 | December 31, 2022 | ||||||||||
| Asset Management | |||||||||||
| Total Assets | $ | $ | |||||||||
| Total Liabilities | $ | $ | |||||||||
| Total Equity | $ | $ | |||||||||
| Insurance | |||||||||||
| Total Assets | $ | $ | |||||||||
| Total Liabilities | $ | $ | |||||||||
| Total Equity | $ | $ | |||||||||
The following table shows summarized financial information relating to the statements of operations for all of KKR's equity method investments assuming 100
| For the Years Ended December 31, | |||||||||||||||||
| 2023 | 2022 | 2021 | |||||||||||||||
| Asset Management | |||||||||||||||||
| Investment Related Revenues | $ | $ | $ | ||||||||||||||
| Other Revenues | |||||||||||||||||
| Investment Related Expenses | |||||||||||||||||
| Other Expenses | |||||||||||||||||
| Net Realized and Unrealized Gains (Losses) from Investments | ( | ||||||||||||||||
| $ | $ | $ | |||||||||||||||
| Insurance | |||||||||||||||||
| Revenues | $ | $ | $ | ||||||||||||||
| Expenses | |||||||||||||||||
| $ | ( | $ | $ | ||||||||||||||
| Net Income (Loss) | $ | $ | $ | ||||||||||||||
284
Notes to Financial Statements (Continued)
Fixed maturity securities
The cost or amortized cost and fair value for AFS fixed maturity securities were as follows:
| Cost or amortized cost | Allowance for Credit Losses (1)(2) | Gross unrealized | Fair value | ||||||||||||||||||||||||||
| As of December 31, 2023 | gains | losses | |||||||||||||||||||||||||||
| AFS fixed maturity securities portfolio by type: | |||||||||||||||||||||||||||||
| U.S. government and agencies | $ | $ | $ | $ | ( | $ | |||||||||||||||||||||||
| U.S. state, municipal and political subdivisions | ( | ||||||||||||||||||||||||||||
| Corporate | ( | ( | |||||||||||||||||||||||||||
| Residential mortgage-backed securities, or “RMBS” | ( | ( | |||||||||||||||||||||||||||
| Commercial mortgage-backed securities, or “CMBS” | ( | ( | |||||||||||||||||||||||||||
| Collateralized bond obligations, or “CBOs” | ( | ( | |||||||||||||||||||||||||||
| CLOs | ( | ( | |||||||||||||||||||||||||||
| Asset-backed securities, or “ABSs” | ( | ( | |||||||||||||||||||||||||||
| Total AFS fixed maturity securities | $ | $ | ( | $ | $ | ( | $ | ||||||||||||||||||||||
(1)Represents the cumulative amount of credit impairments that have been recognized in the consolidated statements of operations (as net investment (losses) gains) or that were recognized as a gross-up of the purchase price of PCD securities. Amount excludes unrealized losses related to non-credit impairment.
(2)Includes credit loss allowances on purchase-credit deteriorated fixed-maturity securities of $(12.8 ) million.
| Cost or amortized cost | Allowance for Credit Losses (1)(2) | Gross unrealized | Fair value | ||||||||||||||||||||||||||
| As of December 31, 2022 | gains | losses | |||||||||||||||||||||||||||
| AFS fixed maturity securities portfolio by type: | |||||||||||||||||||||||||||||
| U.S. government and agencies | $ | $ | $ | $ | ( | $ | |||||||||||||||||||||||
| U.S. state, municipal and political subdivisions | ( | ||||||||||||||||||||||||||||
| Corporate | ( | ( | |||||||||||||||||||||||||||
| RMBS | ( | ( | |||||||||||||||||||||||||||
| CMBS | ( | ( | |||||||||||||||||||||||||||
| CBOs | ( | ( | |||||||||||||||||||||||||||
| CLOs | ( | ( | |||||||||||||||||||||||||||
| ABSs | ( | ( | |||||||||||||||||||||||||||
| Total AFS fixed maturity securities | $ | $ | ( | $ | $ | ( | $ | ||||||||||||||||||||||
(1)Represents the cumulative amount of credit impairments that have been recognized in the consolidated statements of operations (as net investment (losses) gains) or that were recognized as a gross-up of the purchase price of PCD securities. Amount excludes unrealized losses related to non-credit impairment.
(2)Includes credit loss allowances on purchase-credit deteriorated fixed-maturity securities of $(29.9 ) million.
Actual maturities may differ from contractual maturities because borrowers may have the right to call or prepay obligations with or without call or prepayment penalties, or Global Atlantic may have the right to put or sell the obligations back to the issuers. Structured securities are shown separately as they have periodic payments and are not due at a single maturity.
285
Notes to Financial Statements (Continued)
The maturity distribution for AFS fixed maturity securities is as follows:
| As of December 31, 2023 | Cost or amortized cost (net of allowance) | Fair value | |||||||||
| Due in one year or less | $ | $ | |||||||||
| Due after one year through five years | |||||||||||
| Due after five years through ten years | |||||||||||
| Due after ten years | |||||||||||
| Subtotal | |||||||||||
| RMBS | |||||||||||
| CMBS | |||||||||||
| CBOs | |||||||||||
| CLOs | |||||||||||
| ABSs | |||||||||||
| Total AFS fixed maturity securities | $ | $ | |||||||||
Purchased credit deteriorated securities
Certain securities purchased by Global Atlantic were assessed at acquisition as having experienced a more-than-insignificant deterioration in credit quality since their origination. These securities are identified as PCD, and a reconciliation of the difference between the purchase price and the par value of these PCD securities is below:
| Years Ended December 31, | |||||||||||||||||
| 2023 | 2022 | 2021 | |||||||||||||||
| Purchase price of PCD securities acquired during the current period | $ | $ | $ | ||||||||||||||
| Allowance for credit losses at acquisition | |||||||||||||||||
| Discount attributable to other factors | |||||||||||||||||
| Par value | $ | $ | $ | ||||||||||||||
Securities in a continuous unrealized loss position
The following tables provide information about AFS fixed maturity securities that have been continuously in an unrealized loss position:
| Less than 12 months | 12 months or more | Total | |||||||||||||||||||||||||||||||||
| As of December 31, 2023 | Fair value | Unrealized losses | Fair value | Unrealized losses | Fair value | Unrealized losses | |||||||||||||||||||||||||||||
| AFS fixed maturity securities portfolio by type: | |||||||||||||||||||||||||||||||||||
| U.S. government and agencies | $ | $ | ( | $ | $ | ( | $ | $ | ( | ||||||||||||||||||||||||||
| U.S. state, municipal and political subdivisions | ( | ( | ( | ||||||||||||||||||||||||||||||||
| Corporate | ( | ( | ( | ||||||||||||||||||||||||||||||||
| RMBS | ( | ( | ( | ||||||||||||||||||||||||||||||||
| CBOs | ( | ( | ( | ||||||||||||||||||||||||||||||||
| CMBS | ( | ( | ( | ||||||||||||||||||||||||||||||||
| CLOs | ( | ( | ( | ||||||||||||||||||||||||||||||||
| ABSs | ( | ( | ( | ||||||||||||||||||||||||||||||||
| Total AFS fixed maturity securities in a continuous loss position | $ | $ | ( | $ | $ | ( | $ | $ | ( | ||||||||||||||||||||||||||
286
Notes to Financial Statements (Continued)
| Less than 12 months | 12 months or more | Total | |||||||||||||||||||||||||||||||||
| As of December 31, 2022 | Fair value | Unrealized losses | Fair value | Unrealized losses | Fair value | Unrealized losses | |||||||||||||||||||||||||||||
| AFS fixed maturity securities portfolio by type: | |||||||||||||||||||||||||||||||||||
| U.S. government and agencies | $ | $ | ( | $ | $ | ( | $ | $ | ( | ||||||||||||||||||||||||||
| U.S. state, municipal and political subdivisions | ( | ( | ( | ||||||||||||||||||||||||||||||||
| Corporate | ( | ( | ( | ||||||||||||||||||||||||||||||||
| RMBS | ( | ( | ( | ||||||||||||||||||||||||||||||||
| CBOs | ( | ( | ( | ||||||||||||||||||||||||||||||||
| CMBS | ( | ( | ( | ||||||||||||||||||||||||||||||||
| CLOs | ( | ( | ( | ||||||||||||||||||||||||||||||||
| ABSs | ( | ( | ( | ||||||||||||||||||||||||||||||||
| Total AFS fixed maturity securities in a continuous loss position | $ | $ | ( | $ | $ | ( | $ | $ | ( | ||||||||||||||||||||||||||
Unrealized gains and losses can be created by changing interest rates or several other factors, including changing credit spreads. Global Atlantic had gross unrealized losses on below investment grade AFS fixed maturity securities of $694.6 million and $836.3 million as of December 31, 2023 and 2022, respectively. The single largest unrealized loss on AFS fixed maturity securities was $53.4 million and $60.4 million as of December 31, 2023 and 2022, respectively. Global Atlantic had 5,886 and 6,328 securities in an unrealized loss position as of December 31, 2023 and 2022, respectively.
As of December 31, 2023, AFS fixed maturity securities in an unrealized loss position for 12 months or more consisted of 5,053 debt securities. These debt securities primarily relate to Corporate, RMBS, and U.S. state, municipal and political subdivisions fixed maturity securities, which have depressed values due primarily to an increase in interest rates since the purchase of these securities. Unrealized losses were not recognized in net income on these debt securities since Global Atlantic neither intends to sell the securities nor does it believe that it is more likely than not that it will be required to sell these securities before recovery of their cost or amortized cost basis. For securities with significant declines in value, individual security level analysis was performed utilizing underlying collateral default expectations, market data, and industry analyst reports.
Mortgage and other loan receivables
Mortgage and other loan receivables consist of the following:
| December 31, 2023 | December 31, 2022 | ||||||||||
Commercial mortgage loans(1) | $ | $ | |||||||||
Residential mortgage loans(1) | |||||||||||
| Consumer loans | |||||||||||
Other loan receivables(2) | |||||||||||
| Total mortgage and other loan receivables | |||||||||||
Allowance for credit losses(3) | ( | ( | |||||||||
| Total mortgage and other loan receivables, net of allowance for credit losses | $ | $ | |||||||||
(1)Includes $697.4 million and $787.5 million of loans carried at fair value using the fair value option as of December 31, 2023 and 2022, respectively. The fair value option was elected for these loans for asset-liability matching purposes. These loans had unpaid principal balances of $785.2 million and $871.2 million as of December 31, 2023 and 2022, respectively.
(2)As of December 31, 2023 and 2022, other loan receivables consisted primarily of loans collateralized by aircraft of $315.4 million and $282.3 million, respectively, and loans collateralized by residential mortgages of $200.0
(3)Includes credit loss allowances on purchase-credit deteriorated mortgage and other loan receivables of $(91.7 ) million and $(106.2 ) million as of December 31, 2023 and 2022, respectively.
287
Notes to Financial Statements (Continued)
The maturity distribution for residential and commercial mortgage loans was as follows as of December 31, 2023:
| Years | Residential | Commercial | Total mortgage loans | ||||||||||||||
| 2024 | $ | $ | $ | ||||||||||||||
| 2025 | |||||||||||||||||
| 2026 | |||||||||||||||||
| 2027 | |||||||||||||||||
| 2028 | |||||||||||||||||
| Thereafter | |||||||||||||||||
| Total | $ | $ | $ | ||||||||||||||
Actual maturities could differ from contractual maturities, because borrowers may have the right to prepay (with or without prepayment penalties) and loans may be refinanced.
Global Atlantic diversifies its mortgage loan portfolio by both geographic region and property type to reduce concentration risk. The following tables present the mortgage loans by geographic region and property type:
| Mortgage loans – carrying value by geographic region | December 31, 2023 | December 31, 2022 | |||||||||||||||||||||
| Pacific | $ | % | $ | % | |||||||||||||||||||
| West South Central | % | % | |||||||||||||||||||||
| South Atlantic | % | % | |||||||||||||||||||||
| Middle Atlantic | % | % | |||||||||||||||||||||
| East North Central | % | % | |||||||||||||||||||||
| Mountain | % | % | |||||||||||||||||||||
| New England | % | % | |||||||||||||||||||||
| East South Central | % | % | |||||||||||||||||||||
| West North Central | % | % | |||||||||||||||||||||
| Other regions | % | % | |||||||||||||||||||||
| Total by geographic region | $ | % | $ | % | |||||||||||||||||||
| Mortgage loans – carrying value by property type | December 31, 2023 | December 31, 2022 | |||||||||||||||||||||
| Residential | $ | % | $ | % | |||||||||||||||||||
| Office building | % | % | |||||||||||||||||||||
| Multi-family | % | % | |||||||||||||||||||||
| Industrial | % | % | |||||||||||||||||||||
| Retail | % | % | |||||||||||||||||||||
| Warehouse | % | % | |||||||||||||||||||||
| Other property types | % | % | |||||||||||||||||||||
| Total by property type | $ | % | $ | % | |||||||||||||||||||
As of December 31, 2023 and 2022, Global Atlantic had $510.9 million and $192.3 million of mortgage loans that were 90 days or more past due or are in the process of foreclosure, respectively, and have been classified as non-income producing (non-accrual status). Global Atlantic ceases accrual of interest on loans that are more than 90 days past due or are in the process of foreclosure and recognizes income as cash is received.
288
Notes to Financial Statements (Continued)
Credit quality indicators
Mortgage and loan receivable performance status
The following table represents the portfolio of mortgage and loan receivables by origination year and performance status as of December 31, 2023 and 2022:
| By year of origination | |||||||||||||||||||||||||||||||||||||||||
Performance status as of December 31, 2023 | 2023 | 2022 | 2021 | 2020 | 2019 | Prior | Total | ||||||||||||||||||||||||||||||||||
| Commercial mortgage loans | |||||||||||||||||||||||||||||||||||||||||
| Current-period gross charge-offs | $ | $ | $ | $ | $ | ( | $ | ( | $ | ( | |||||||||||||||||||||||||||||||
| Current | $ | $ | $ | $ | $ | $ | $ | ||||||||||||||||||||||||||||||||||
| 30 to 59 days past due | |||||||||||||||||||||||||||||||||||||||||
| 60 to 89 days past due | |||||||||||||||||||||||||||||||||||||||||
| 90 days or more past due or in process of foreclosure | |||||||||||||||||||||||||||||||||||||||||
| Total commercial mortgage loans | $ | $ | $ | $ | $ | $ | $ | ||||||||||||||||||||||||||||||||||
| Residential mortgage loans | |||||||||||||||||||||||||||||||||||||||||
| Current-period gross charge-offs | $ | ( | $ | ( | $ | ( | $ | ( | $ | ( | $ | ( | $ | ( | |||||||||||||||||||||||||||
| Current | $ | $ | $ | $ | $ | $ | $ | ||||||||||||||||||||||||||||||||||
| 30 to 59 days past due | |||||||||||||||||||||||||||||||||||||||||
| 60 to 89 days past due | |||||||||||||||||||||||||||||||||||||||||
| 90 days or more past due or in process of foreclosure | |||||||||||||||||||||||||||||||||||||||||
| Total residential mortgage loans | $ | $ | $ | $ | $ | $ | $ | ||||||||||||||||||||||||||||||||||
| Consumer loans | |||||||||||||||||||||||||||||||||||||||||
| Current-period gross charge-offs | $ | ( | $ | ( | $ | ( | $ | ( | $ | ( | $ | ( | $ | ( | |||||||||||||||||||||||||||
| Current | $ | $ | $ | $ | $ | $ | $ | ||||||||||||||||||||||||||||||||||
| 30 to 59 days past due | |||||||||||||||||||||||||||||||||||||||||
| 60 to 89 days past due | |||||||||||||||||||||||||||||||||||||||||
| 90 days or more past due or in process of foreclosure | |||||||||||||||||||||||||||||||||||||||||
| Total consumer loans | $ | $ | $ | $ | $ | $ | $ | ||||||||||||||||||||||||||||||||||
| Total mortgage and consumer loan receivables | $ | $ | $ | $ | $ | $ | $ | ||||||||||||||||||||||||||||||||||
289
Notes to Financial Statements (Continued)
| By year of origination | |||||||||||||||||||||||||||||||||||||||||
Performance status as of December 31, 2022 | 2022 | 2021 | 2020 | 2019 | 2018 | Prior | Total | ||||||||||||||||||||||||||||||||||
| Commercial mortgage loans | |||||||||||||||||||||||||||||||||||||||||
| Current | $ | $ | $ | $ | $ | $ | $ | ||||||||||||||||||||||||||||||||||
| 30 to 59 days past due | |||||||||||||||||||||||||||||||||||||||||
| 60 to 89 days past due | |||||||||||||||||||||||||||||||||||||||||
| 90 days or more past due or in process of foreclosure | |||||||||||||||||||||||||||||||||||||||||
| Total commercial mortgage loans | $ | $ | $ | $ | $ | $ | $ | ||||||||||||||||||||||||||||||||||
| Residential mortgage loans | |||||||||||||||||||||||||||||||||||||||||
| Current | $ | $ | $ | $ | $ | $ | $ | ||||||||||||||||||||||||||||||||||
| 30 to 59 days past due | |||||||||||||||||||||||||||||||||||||||||
| 60 to 89 days past due | |||||||||||||||||||||||||||||||||||||||||
| 90 days or more past due or in process of foreclosure | |||||||||||||||||||||||||||||||||||||||||
| Total residential mortgage loans | $ | $ | $ | $ | $ | $ | $ | ||||||||||||||||||||||||||||||||||
| Total mortgage loans | $ | $ | $ | $ | $ | $ | $ | ||||||||||||||||||||||||||||||||||
The following table represents the portfolio of consumer loan receivables by performance status:
| Performance status | December 31, 2022 | |||||||
| Consumer loans | ||||||||
| Current | $ | |||||||
| 30 to 59 days past due | ||||||||
| 60 to 89 days past due | ||||||||
| 90 days or more past due or in process of foreclosure | ||||||||
| Total consumer loans | $ | |||||||
Loan-to-value ratio on mortgage loans
The loan-to-value ratio is expressed as a percentage of the current amount of the loan relative to the value of the underlying collateral. The following table summarizes Global Atlantic's loan-to-value ratios for its commercial mortgage loans as of December 31, 2023 and 2022:
Loan-to-value as of December 31, 2023, by year of origination | Carrying value loan-to-value 70% and less | Carrying value loan-to-value 71% - 90% | Carrying value loan-to-value over 90% | Total carrying value | |||||||||||||||||||
| 2023 | $ | $ | $ | $ | |||||||||||||||||||
| 2022 | |||||||||||||||||||||||
| 2021 | |||||||||||||||||||||||
| 2020 | |||||||||||||||||||||||
| 2019 | |||||||||||||||||||||||
| 2018 | |||||||||||||||||||||||
| Prior | |||||||||||||||||||||||
| Total commercial mortgage loans | $ | $ | $ | $ | |||||||||||||||||||
290
Notes to Financial Statements (Continued)
Loan-to-value as of December 31, 2022, by year of origination | Carrying value loan-to-value 70% and less | Carrying value loan-to-value 71% - 90% | Carrying value loan-to-value over 90% | Total carrying value | |||||||||||||||||||
| 2022 | $ | $ | $ | $ | |||||||||||||||||||
| 2021 | |||||||||||||||||||||||
| 2020 | |||||||||||||||||||||||
| 2019 | |||||||||||||||||||||||
| 2018 | |||||||||||||||||||||||
| 2017 | |||||||||||||||||||||||
| Prior | |||||||||||||||||||||||
| Total commercial mortgage loans | $ | $ | $ | $ | |||||||||||||||||||
Changing economic conditions and updated assumptions affect Global Atlantic's assessment of the collectibility of commercial mortgage loans. Changing vacancies and rents are incorporated into the analysis that Global Atlantic performs to measure the allowance for credit losses. In addition, Global Atlantic continuously monitors its commercial mortgage loan portfolio to identify risk. Areas of emphasis are properties that have exposure to specific geographic events or have deteriorating credit.
The weighted average loan-to-value ratio for Global Atlantic's residential mortgage loans was 63 % and 64 % as of December 31, 2023 and 2022, respectively.
Loan modifications
Global Atlantic may modify the terms of a loan when the borrower is experiencing financial difficulties, as a means to optimize recovery of amounts due on the loan. Modifications may involve temporary relief, such as payment forbearance for a short period time (where interest continues to accrue) or may involve more substantive changes to a loan. Changes to the terms of a loan, pursuant to a modification agreement, are factored into the analysis of the loan’s expected credit losses, under the allowance model applicable to the loan.
For commercial mortgage loans, modifications for borrowers experiencing financial difficulty are tailored for individual loans and may include interest rate relief, maturity extensions or, less frequently, principal forgiveness. For both residential mortgage loans and consumer loans, the most common modifications for borrowers experiencing financial difficulty, aside from insignificant delays in payment, typically involve deferral of missed payments to the end of the loan term, interest rate relief, or maturity extensions.
The table below presents the carrying value of loans to borrowers experiencing financial difficulty, for which modifications have been granted during the year ended December 31, 2023.
Year ended December 31, 2023 by loan type | Deferral of Amounts Due | Interest Rate Relief | Maturity Extension | Combination(1) | Total | Percentage of total carrying value outstanding | |||||||||||||||||||||||||||||
| Commercial mortgage loans | $ | $ | $ | $ | $ | % | |||||||||||||||||||||||||||||
| Residential mortgage loans | % | ||||||||||||||||||||||||||||||||||
| Consumer loans | % | ||||||||||||||||||||||||||||||||||
Total(2) | $ | $ | $ | $ | $ | ||||||||||||||||||||||||||||||
(1)Includes modifications involving deferral of amounts due, interest rate relief and/or maturity extension.
(2)Loans may have been modified more than once during the year; in this circumstance, the loan is only included once in this table. In addition, certain loans that were modified in prior quarters have since been repaid in full.
All of the commercial mortgage loans that had a combination of modifications had both interest rate relief and maturity extensions. For these loans, the interest rate relief generally involved either a change from a floating rate or a decrease in fixed rate to a weighted average rate of 3.6 %. The maturity extensions for these loans added a weighted-average of 2.5 years to the life of the loans. In addition, one of the commercial mortgage loans that had a combination of modifications had forgiveness of a portion of the principal due. Global Atlantic has commitments to lend additional funds of $93.8 million for the modified commercial mortgage loans disclosed above.
291
Notes to Financial Statements (Continued)
The table below presents the performance status of the loans modified during the year ended December 31, 2023.
Performance status as of December 31, 2023 by loan type | Current | 30-59 days past due | 60-89 days past due | 90 days or more past due or in process of foreclosure | Total | ||||||||||||||||||||||||
| Commercial mortgage loans | $ | $ | $ | $ | $ | ||||||||||||||||||||||||
| Residential mortgage loans | |||||||||||||||||||||||||||||
| Consumer loans | |||||||||||||||||||||||||||||
| Total | $ | $ | $ | $ | $ | ||||||||||||||||||||||||
Other investments
Other investments consist of the following:
| December 31, 2023 | December 31, 2022 | ||||||||||
Investments in real estate(1) | $ | $ | |||||||||
Investments in renewable energy(2) | |||||||||||
Investments in transportation and other leased assets(3) | |||||||||||
| Other investment partnerships | |||||||||||
| Federal Home Loan Bank (FHLB) common stock and other investments | |||||||||||
| Total other investments | $ | $ | |||||||||
(1)Investments in real estate are held in consolidated investment companies that use fair value accounting.
(2)Net of accumulated depreciation attributed to consolidated renewable energy assets of $154.1 million and $229.7 million as of December 31, 2023 and 2022, respectively.
(3)Net of accumulated depreciation of $313.6 million and $230.2 million as of December 31, 2023 and 2022, respectively.
The total amount of other investments accounted for using the equity method of accounting was $143.3 million and $1.1 billion as of December 31, 2023 and 2022, respectively. Global Atlantic's maximum exposure to loss related to these equity method investments is limited to the carrying value of these investments plus unfunded commitments of $19.7 million and $21.0 million as of December 31, 2023 and 2022, respectively.
In addition, Global Atlantic has investments that would otherwise require the equity method of accounting for which the fair value option has been elected. The carrying amount of these investments was $175.3 million and $264.9 million as of December 31, 2023 and 2022, respectively.
Repurchase agreement transactions
As of December 31, 2023 and 2022, Global Atlantic participated in repurchase agreements with a notional value of $1.4 billion and $798.9 million, respectively. As collateral for these transactions, Global Atlantic typically posts AFS fixed maturity securities and residential mortgage loans, which are included in Insurance - Investments in the consolidated statements of financial condition. The gross obligation for repurchase agreements is reported in other liabilities in the consolidated statements of financial condition.
292
Notes to Financial Statements (Continued)
The carrying value of assets pledged for repurchase agreements by type of collateral and remaining contractual maturity of the repurchase agreements as of December 31, 2023 and 2022 is presented in the following tables:
| As of December 31, 2023 | Overnight | <30 Days | 30 - 90 Days | > 90 Days | Total | ||||||||||||||||||||||||
| AFS corporate securities | $ | $ | $ | $ | $ | ||||||||||||||||||||||||
| Residential mortgage loans | |||||||||||||||||||||||||||||
| Total assets pledged | $ | $ | $ | $ | $ | ||||||||||||||||||||||||
| As of December 31, 2022 | Overnight | <30 Days | 30 - 90 Days | > 90 Days | Total | ||||||||||||||||||||||||
| AFS corporate securities | $ | $ | $ | $ | $ | ||||||||||||||||||||||||
| Total assets pledged | $ | $ | $ | $ | $ | ||||||||||||||||||||||||
Other pledges and restrictions
Certain Global Atlantic subsidiaries are members of regional banks in the FHLB system and such membership requires the members to own stock in these FHLBs. Global Atlantic owns an aggregate of $131.7 million and $129.3 million (accounted for at cost basis) of stock in FHLBs as of December 31, 2023 and 2022, respectively. In addition, Global Atlantic insurance company subsidiaries have entered into funding agreements with the FHLB, which require that Global Atlantic pledge eligible assets, such as fixed maturity securities and mortgage loans, as collateral. Assets pledged as collateral for these funding agreements had a carrying value of $3.6
Insurance – statutory deposits
As of December 31, 2023 and 2022, the carrying value of the assets on deposit with various state and U.S. governmental authorities were $148.5 million and $142.7 million, respectively.
293
Notes to Financial Statements (Continued)
8. DERIVATIVES
Asset Management
KKR and certain of its consolidated funds have entered into derivative transactions as part of their overall risk management for the asset management business and investment strategies. These derivative contracts are not designated as hedging instruments for accounting purposes. Such contracts may include forward, swap and option contracts related to foreign currencies and interest rates to manage foreign exchange risk and interest rate risk arising from certain assets and liabilities. All derivatives are recognized in Other Assets or Accrued Expenses and Other Liabilities and are presented on a gross basis in the consolidated statements of financial condition and measured at fair value with changes in fair value recorded in Net Gains (Losses) from Investment Activities in the accompanying consolidated statements of operations. KKR's derivative financial instruments contain credit risk to the extent that its counterparties may be unable to meet the terms of the agreements. KKR attempts to reduce this risk by limiting its counterparties to major financial institutions with strong credit ratings.
Insurance
Global Atlantic holds derivative instruments that are primarily used in its hedge program. Global Atlantic has established a hedge program that seeks to mitigate economic impacts primarily from interest rate and equity price movements, while taking into consideration accounting and capital impacts.
Global Atlantic hedges interest rate and equity market risks associated with its insurance liabilities including fixed-indexed annuities, indexed universal life policies, variable annuity policies and variable universal life policies, among others. For fixed-indexed annuities and indexed universal life policies, Global Atlantic generally seeks to use static hedges to offset the exposure primarily created by changes in its embedded derivative balances. Global Atlantic generally purchases options which replicate the crediting rate strategies, often in the form of call spreads. Call spreads are the purchase of a call option matched by the sale of a different call option. For variable annuities and variable universal life policies, Global Atlantic generally seeks to dynamically hedge its exposure to changes in the value of the guarantee it provides to policyholders. Doing so requires the active trading of several financial instruments to respond to changes in market conditions. In addition, Global Atlantic enters into inflation swaps to manage inflation risk associated with inflation-indexed preneed policies.
In the context of specific reinsurance transactions in the institutional channel or acquisitions, Global Atlantic may also enter into hedges which are designed to limit short-term market risks to the economic value of the target assets. From time to time, Global Atlantic also enters into hedges designed to mitigate interest rate and credit risk in investment income, interest expense, and fair value of assets and liabilities. In addition, Global Atlantic enters into currency swaps and forwards to manage any foreign exchange rate risks that may arise from investments denominated in foreign currencies.
Global Atlantic attempts to mitigate the risk of loss due to ineffectiveness under these derivative investments through a regular monitoring process which evaluates the program’s effectiveness. Global Atlantic monitors its derivative activities by reviewing portfolio activities and risk levels. Global Atlantic also oversees all derivative transactions to ensure that the types of transactions entered into and the results obtained from those transactions are consistent with both Global Atlantic's risk management strategy and its policies and procedures.
The restricted cash which was held in connection with open derivative transactions with exchange brokers was $133.0 million and $278.7 million as of December 31, 2023 and 2022, respectively.
Global Atlantic also has embedded derivatives related to reinsurance contracts that are accounted for on a modified coinsurance and funds withheld basis. An embedded derivative exists because the arrangement exposes the reinsurer to third-party credit risk. These embedded derivatives are included in funds withheld receivable and payable at interest in the consolidated statements of financial condition.
Credit Risk
Global Atlantic may be exposed to credit-related losses in the event of nonperformance by its counterparties to derivatives. Generally, the current credit exposure of Global Atlantic’s derivatives is limited to the positive fair value of derivatives less any collateral received from the counterparty.
Global Atlantic manages the credit risk on its derivatives by entering into derivative transactions with highly rated financial institutions and other creditworthy counterparties and, where feasible, by trading through central clearing counterparties. Global Atlantic further manages its credit risk on derivatives via the use of master netting agreements, which require the daily posting of collateral by the party in a liability position. Counterparty credit exposure and collateral values are monitored regularly and
294
Notes to Financial Statements (Continued)
measured against counterparty exposure limits. The provisions of derivative transactions may allow for the termination and settlement of a transaction if there is a downgrade to Global Atlantic’s financial strength ratings below a specified level.
The fair value and notional value of the derivative assets and liabilities were as follows:
| As of December 31, 2023 | Notional Value | Derivative Assets | Derivative Liabilities | ||||||||||||||
| Asset Management | |||||||||||||||||
| Foreign Exchange Contracts and Options | $ | $ | $ | ||||||||||||||
| Other Derivatives | |||||||||||||||||
| Total Asset Management | $ | $ | $ | ||||||||||||||
| Insurance | |||||||||||||||||
| Derivatives designated as hedge accounting instruments: | |||||||||||||||||
| Interest rate contracts | $ | $ | $ | ||||||||||||||
| Foreign currency contracts | |||||||||||||||||
| Total derivatives designated as hedge accounting instruments | $ | $ | $ | ||||||||||||||
| Derivatives not designated as hedge accounting instruments: | |||||||||||||||||
| Interest rate contracts | $ | $ | $ | ||||||||||||||
| Equity market contracts | |||||||||||||||||
| Foreign currency contracts | |||||||||||||||||
| Credit risk contracts | |||||||||||||||||
| Total derivatives not designated as hedge accounting instruments | $ | $ | $ | ||||||||||||||
Impact of netting(2) | — | ( | ( | ||||||||||||||
Total Insurance(1) | $ | $ | $ | ||||||||||||||
| Fair value included within total assets and liabilities | $ | $ | $ | ||||||||||||||
(1)Excludes embedded derivatives. The fair value of these embedded derivatives related to assets was $88.7 million and the fair value of these embedded derivatives related to liabilities was $1.6 billion as of December 31, 2023.
(2)Represents netting of derivative exposures covered by qualifying master netting agreements.
| As of December 31, 2022 | Notional Value | Derivative Assets | Derivative Liabilities | ||||||||||||||
| Asset Management | |||||||||||||||||
| Foreign Exchange Contracts and Options | $ | $ | $ | ||||||||||||||
| Other Derivatives | |||||||||||||||||
| Total Asset Management | $ | $ | $ | ||||||||||||||
| Insurance | |||||||||||||||||
| Derivatives designated as hedge accounting instruments: | |||||||||||||||||
| Interest rate contracts | $ | $ | $ | ||||||||||||||
| Foreign currency contracts | |||||||||||||||||
| Total derivatives designated as hedge accounting instruments | $ | $ | $ | ||||||||||||||
| Derivatives not designated as hedge accounting instruments: | |||||||||||||||||
| Interest rate contracts | $ | $ | $ | ||||||||||||||
| Equity market contracts | |||||||||||||||||
| Foreign currency contracts | |||||||||||||||||
| Credit risk contracts | |||||||||||||||||
| Total derivatives not designated as hedge accounting instruments | $ | $ | $ | ||||||||||||||
Impact of netting(2) | — | ( | ( | ||||||||||||||
Total Insurance(1) | $ | $ | $ | ||||||||||||||
| Fair value included within total assets and liabilities | $ | $ | $ | ||||||||||||||
295
Notes to Financial Statements (Continued)
(1)Excludes embedded derivatives. The fair value of these embedded derivatives related to assets was $12.8 million and the fair value of these embedded derivatives related to liabilities was $(1.3 ) billion as of December 31, 2022.
(2)Represents netting of derivative exposures covered by qualifying master netting agreements.
Derivatives designated as accounting hedges
Where Global Atlantic has derivative instruments that are designated and qualify as accounting hedges, these derivative instruments receive hedge accounting.
Global Atlantic has designated foreign exchange ("FX") derivative contracts, including forwards and swaps, to hedge the foreign currency risk associated with foreign currency-denominated bonds in fair value hedges. These foreign currency-denominated bonds are accounted for as AFS fixed maturity securities. Changes in the fair value of the hedged AFS fixed maturity securities due to changes in spot exchange rates are reclassified from AOCI to earnings, which offsets the earnings impact of the spot changes of the FX derivative contracts, both of which are recognized within investment-related (losses) gains. The effectiveness of these hedges is assessed using the spot method. Changes in the fair value of the FX derivative contracts related to changes in the spot-forward difference are excluded from the assessment of hedge effectiveness and are deferred in AOCI and recognized in earnings using a systematic and rational method over the life of the FX derivative contracts.
Global Atlantic has designated interest rate swaps to hedge the interest rate risk associated with certain debt and policy liabilities. These fair value hedges qualify for the shortcut method of assessing hedge effectiveness.
The following table presents the financial statement classification, carrying amount and cumulative fair value hedging adjustments for qualifying hedged assets and liabilities:
| As of December 31, 2023 | As of December 31, 2022 | ||||||||||||||||||||||
| Carrying amount of hedged assets/(liabilities) | Cumulative amount of fair value hedging adjustments included in the carrying amount of hedged assets/(liabilities)(1) | Carrying amount of hedged assets/(liabilities) | Cumulative amount of fair value hedging adjustments included in the carrying amount of hedged assets/(liabilities)(1) | ||||||||||||||||||||
AFS fixed maturity securities(2) | $ | $ | $ | $ | ( | ||||||||||||||||||
| Debt | ( | ( | ( | ( | |||||||||||||||||||
| Policy liabilities | ( | ( | ( | ( | |||||||||||||||||||
(1)Includes $27.8 million and $53.1 million of hedging adjustments on discontinued hedging relationships as of December 31, 2023 and 2022, respectively.
(2)Carrying amount is the amortized cost for AFS debt securities.
Global Atlantic has designated bond forwards to hedge the interest rate risk associated with the planned purchase of AFS debt securities in cash flow hedges. These arrangements are hedging purchases from January 2024 through December 2027 and are expected to affect earnings until 2053. Regression analysis is used to assess the effectiveness of these hedges.
As of December 31, 2023 and 2022, there was a cumulative loss of $(126.9 ) million and $(169.8 ) million, respectively, on the currently designated bond forwards recorded in accumulated other comprehensive loss. Amounts deferred in accumulated other comprehensive loss are reclassified to net investment income following the qualifying purchases of AFS securities, as an adjustment to the yield earned over the life of the purchased securities, using the effective interest method.
Global Atlantic estimates that the amount of gains/losses in accumulated other comprehensive loss to be reclassified into earnings in the next 12 months will not be material.
296
Notes to Financial Statements (Continued)
Derivative results
The following table presents the financial statement classification and amount of gains (losses) recognized on derivative instruments and related hedged items, where applicable:
| Year ended December 31, 2023 | |||||||||||||||||||||||||||||||||||
| Net Gains (Losses) from Investment Activities | Net investment-related gains (losses) | Net investment income | Net policy benefits and claims | Interest expense | Change in AOCI | ||||||||||||||||||||||||||||||
| Derivatives designated as hedge accounting instruments: | |||||||||||||||||||||||||||||||||||
| Fair value hedges | |||||||||||||||||||||||||||||||||||
| Gains (losses) on derivatives designated as hedge instruments: | |||||||||||||||||||||||||||||||||||
| Interest rate contracts | $ | — | $ | — | $ | — | $ | ( | $ | ( | $ | — | |||||||||||||||||||||||
| Foreign currency contracts | — | ( | — | — | — | ||||||||||||||||||||||||||||||
| Total gains (losses) on derivatives designated as hedge instruments | $ | — | $ | ( | $ | — | $ | ( | $ | ( | $ | ||||||||||||||||||||||||
| Gains (losses) on hedged items: | |||||||||||||||||||||||||||||||||||
| Interest rate contracts | $ | — | $ | — | $ | — | $ | $ | $ | — | |||||||||||||||||||||||||
| Foreign currency contracts | — | — | — | — | — | ||||||||||||||||||||||||||||||
| Total gains (losses) on hedged items | $ | — | $ | $ | — | $ | $ | $ | — | ||||||||||||||||||||||||||
| Amortization for gains (losses) excluded from assessment of effectiveness: | |||||||||||||||||||||||||||||||||||
| Foreign currency contracts | $ | — | $ | $ | — | $ | — | $ | — | $ | — | ||||||||||||||||||||||||
| Total amortization for gains (losses) excluded from assessment of effectiveness | — | — | — | — | — | ||||||||||||||||||||||||||||||
| Total gains (losses) on fair value hedges, net of hedged items | $ | — | $ | $ | — | $ | — | $ | — | $ | |||||||||||||||||||||||||
| Cash flow hedges | |||||||||||||||||||||||||||||||||||
| Interest rate contracts | $ | — | $ | $ | ( | $ | — | $ | — | $ | |||||||||||||||||||||||||
| Total gains (losses) on cash flow hedges | $ | — | $ | $ | ( | $ | — | $ | — | $ | |||||||||||||||||||||||||
| Derivatives not designated as hedge accounting instruments: | |||||||||||||||||||||||||||||||||||
| Asset Management | |||||||||||||||||||||||||||||||||||
| Foreign Exchange Contracts and Options | $ | ( | $ | — | $ | — | $ | — | $ | — | $ | — | |||||||||||||||||||||||
| Other Derivatives | — | — | — | — | — | ||||||||||||||||||||||||||||||
| Total included in Net Gains (Losses) from Investment Activities | $ | ( | $ | — | $ | — | $ | — | $ | — | $ | — | |||||||||||||||||||||||
| Insurance | |||||||||||||||||||||||||||||||||||
| Embedded derivatives - funds withheld receivable | $ | — | $ | $ | — | $ | — | $ | — | $ | — | ||||||||||||||||||||||||
| Embedded derivatives - funds withheld payable | — | ( | — | — | — | — | |||||||||||||||||||||||||||||
| Equity index options | — | — | — | — | — | ||||||||||||||||||||||||||||||
| Equity future contracts | — | ( | — | — | — | — | |||||||||||||||||||||||||||||
| Interest rate and foreign exchange contracts | — | ( | — | — | — | — | |||||||||||||||||||||||||||||
| Credit risk contracts | — | ( | — | — | — | — | |||||||||||||||||||||||||||||
| Total gains (losses) on derivatives not designated as hedge accounting instruments from Insurance Activities | $ | — | $ | ( | $ | — | $ | — | $ | — | $ | — | |||||||||||||||||||||||
| Total | $ | ( | $ | ( | $ | ( | $ | — | $ | — | $ | ||||||||||||||||||||||||
297
Notes to Financial Statements (Continued)
| Year ended December 31, 2022 | |||||||||||||||||||||||||||||||||||
| Net Gains (Losses) from Investment Activities | Net investment-related gains (losses) | Net investment income | Net policy benefits and claims | Interest expense | Change in AOCI | ||||||||||||||||||||||||||||||
| Derivatives designated as hedge accounting instruments: | |||||||||||||||||||||||||||||||||||
| Fair value hedges | |||||||||||||||||||||||||||||||||||
| Gains (losses) on derivatives designated as hedge instruments: | |||||||||||||||||||||||||||||||||||
| Interest rate contracts | $ | — | $ | — | $ | — | $ | ( | $ | ( | $ | — | |||||||||||||||||||||||
| Foreign currency contracts | — | — | — | — | ( | ||||||||||||||||||||||||||||||
| Total gains (losses) on derivatives designated as hedge instruments | $ | — | $ | $ | — | $ | ( | $ | ( | $ | ( | ||||||||||||||||||||||||
| Gains (losses) on hedged items: | |||||||||||||||||||||||||||||||||||
| Interest rate contracts | $ | — | $ | — | $ | — | $ | $ | $ | — | |||||||||||||||||||||||||
| Foreign currency contracts | — | ( | — | — | — | — | |||||||||||||||||||||||||||||
| Total gains (losses) on hedged items | $ | — | $ | ( | $ | — | $ | $ | $ | — | |||||||||||||||||||||||||
| Amortization for gains (losses) excluded from assessment of effectiveness: | |||||||||||||||||||||||||||||||||||
| Foreign currency contracts | $ | — | $ | $ | — | $ | — | $ | — | $ | — | ||||||||||||||||||||||||
| Total amortization for gains (losses) excluded from assessment of effectiveness | $ | — | $ | $ | — | $ | — | $ | — | $ | — | ||||||||||||||||||||||||
| Total gains (losses) on fair value hedges, net of hedged items | $ | — | $ | $ | — | $ | — | $ | — | $ | ( | ||||||||||||||||||||||||
| Cash flow hedges | |||||||||||||||||||||||||||||||||||
| Interest rate contracts | $ | — | $ | $ | $ | — | $ | — | $ | ( | |||||||||||||||||||||||||
| Total gains (losses) on cash flow hedges | $ | — | $ | $ | $ | — | $ | — | $ | ( | |||||||||||||||||||||||||
| Derivatives not designated as hedge accounting instruments: | |||||||||||||||||||||||||||||||||||
| Asset Management | |||||||||||||||||||||||||||||||||||
| Foreign Exchange Contracts and Options | $ | $ | — | $ | — | $ | — | $ | — | $ | — | ||||||||||||||||||||||||
| Other Derivatives | — | — | — | — | — | ||||||||||||||||||||||||||||||
| Total included in Net Gains (Losses) from Investment Activities | $ | $ | — | $ | — | $ | — | $ | — | $ | — | ||||||||||||||||||||||||
| Insurance | |||||||||||||||||||||||||||||||||||
| Embedded derivatives - funds withheld receivable | $ | — | $ | ( | $ | — | $ | — | $ | — | $ | — | |||||||||||||||||||||||
| Embedded derivatives - funds withheld payable | — | — | — | — | — | ||||||||||||||||||||||||||||||
| Equity index options | — | ( | — | — | — | — | |||||||||||||||||||||||||||||
| Equity future contracts | — | — | — | — | — | ||||||||||||||||||||||||||||||
| Interest rate and foreign exchange contracts | — | ( | — | — | — | — | |||||||||||||||||||||||||||||
| Credit risk contracts | — | ( | — | — | — | — | |||||||||||||||||||||||||||||
| Other | — | ( | — | — | — | — | |||||||||||||||||||||||||||||
| Total gains (losses) on derivatives not qualifying as hedge accounting instruments from Insurance Activities | $ | — | $ | $ | — | $ | — | $ | — | $ | — | ||||||||||||||||||||||||
| Total | $ | $ | $ | $ | — | $ | — | $ | ( | ||||||||||||||||||||||||||
298
Notes to Financial Statements (Continued)
| Year ended December 31, 2021 | |||||||||||||||||||||||||||||||||||
| Net Gains (Losses) from Investment Activities | Net investment-related gains (losses) | Net investment income | Net policy benefits and claims | Interest expense | Change in AOCI | ||||||||||||||||||||||||||||||
| Derivatives designated as hedge accounting instruments: | |||||||||||||||||||||||||||||||||||
| Fair value hedges | |||||||||||||||||||||||||||||||||||
| Gains (losses) on derivatives designated as hedge instruments: | |||||||||||||||||||||||||||||||||||
| Interest rate contracts | $ | — | $ | — | $ | — | $ | ( | $ | ( | $ | — | |||||||||||||||||||||||
| Foreign currency contracts | — | — | — | — | |||||||||||||||||||||||||||||||
| Total gains (losses) on derivatives designated as hedge instruments | $ | — | $ | $ | — | $ | ( | $ | ( | $ | |||||||||||||||||||||||||
| Gains (losses) on hedged items: | |||||||||||||||||||||||||||||||||||
| Interest rate contracts | $ | — | $ | — | $ | — | $ | $ | $ | — | |||||||||||||||||||||||||
| Foreign currency contracts | — | ( | — | — | — | — | |||||||||||||||||||||||||||||
| Total gains (losses) on hedged items | $ | — | $ | ( | $ | — | $ | $ | $ | — | |||||||||||||||||||||||||
| Amortization for gains (losses) excluded from assessment of effectiveness: | |||||||||||||||||||||||||||||||||||
| Foreign currency contracts | $ | — | $ | $ | — | $ | — | $ | — | $ | — | ||||||||||||||||||||||||
| Total amortization for gains (losses) excluded from assessment of effectiveness | $ | — | $ | $ | — | $ | — | $ | — | $ | — | ||||||||||||||||||||||||
| Total gains (losses) on fair value hedges, net of hedged items | $ | — | $ | $ | — | $ | — | $ | — | $ | |||||||||||||||||||||||||
| Cash flow hedges | |||||||||||||||||||||||||||||||||||
| Interest rate contracts | $ | — | $ | $ | $ | — | $ | — | $ | ||||||||||||||||||||||||||
| Total gains (losses) on cash flow hedges | $ | — | $ | $ | $ | — | $ | — | $ | ||||||||||||||||||||||||||
| Derivatives not designated as hedge accounting instruments: | |||||||||||||||||||||||||||||||||||
| Asset Management | |||||||||||||||||||||||||||||||||||
| Foreign Exchange Contracts and Options | $ | $ | — | $ | — | $ | — | $ | — | $ | — | ||||||||||||||||||||||||
| Other Derivatives | ( | — | — | — | — | — | |||||||||||||||||||||||||||||
| Total included in Net Gains (Losses) from Investment Activities | $ | $ | — | $ | — | $ | — | $ | — | $ | — | ||||||||||||||||||||||||
| Insurance | |||||||||||||||||||||||||||||||||||
| Embedded derivatives - funds withheld receivable | $ | — | $ | $ | — | $ | — | $ | — | $ | — | ||||||||||||||||||||||||
| Embedded derivatives - funds withheld payable | — | — | — | — | — | ||||||||||||||||||||||||||||||
| Equity index options | — | — | — | — | — | ||||||||||||||||||||||||||||||
| Equity future contracts | — | ( | — | — | — | — | |||||||||||||||||||||||||||||
| Interest rate and foreign exchange contracts | — | ( | — | — | — | — | |||||||||||||||||||||||||||||
| Credit risk contracts | — | ( | — | — | — | — | |||||||||||||||||||||||||||||
| Total gains (losses) on derivatives not qualifying as hedge accounting instruments from Insurance Activities | $ | — | $ | $ | — | $ | — | $ | — | $ | — | ||||||||||||||||||||||||
| Total | $ | $ | $ | $ | — | $ | — | $ | |||||||||||||||||||||||||||
299
Notes to Financial Statements (Continued)
Collateral
The amount of Global Atlantic's net derivative assets and liabilities after consideration of collateral received or pledged were as follows:
| As of December 31, 2023 | Gross amount recognized | Gross amounts offset in the statements of financial position(1) | Net amounts presented in the statements of financial condition | Collateral (received) / pledged | Net amount after collateral | ||||||||||||||||||||||||
| Derivative assets (excluding embedded derivatives) | $ | $ | ( | $ | $ | ( | $ | ||||||||||||||||||||||
| Derivative liabilities (excluding embedded derivatives) | $ | $ | ( | $ | $ | $ | ( | ||||||||||||||||||||||
(1)Represents netting of derivative exposures covered by qualifying master netting agreements.
| As of December 31, 2022 | Gross amount recognized | Gross amounts offset in the statements of financial position(1) | Net amounts presented in the statements of financial condition | Collateral (received) / pledged | Net amount after collateral | ||||||||||||||||||||||||
| Derivative assets (excluding embedded derivatives) | $ | $ | ( | $ | $ | ( | $ | ||||||||||||||||||||||
| Derivative liabilities (excluding embedded derivatives) | $ | $ | ( | $ | $ | $ | |||||||||||||||||||||||
(1)Represents netting of derivative exposures covered by qualifying master netting agreements.
300
Notes to Financial Statements (Continued)
9. FAIR VALUE MEASUREMENTS
The following tables summarize the valuation of assets and liabilities measured and reported at fair value by the fair value hierarchy. Investments classified as Equity Method - Other, for which the fair value option has not been elected, and Equity Method - Capital Allocation-Based Income have been excluded from the tables below.
Assets, at fair value:
| December 31, 2023 | |||||||||||||||||||||||
| Level I | Level II | Level III | Total | ||||||||||||||||||||
| Asset Management | |||||||||||||||||||||||
| Private Equity | $ | $ | $ | $ | |||||||||||||||||||
| Credit | |||||||||||||||||||||||
| Investments of Consolidated CFEs | |||||||||||||||||||||||
| Real Assets | |||||||||||||||||||||||
| Equity Method - Other | |||||||||||||||||||||||
| Other Investments | |||||||||||||||||||||||
| Total Investments | $ | $ | $ | $ | |||||||||||||||||||
| Foreign Exchange Contracts and Options | |||||||||||||||||||||||
| Other Derivatives | |||||||||||||||||||||||
| Total Assets at Fair Value - Asset Management | $ | $ | $ | $ | |||||||||||||||||||
| Insurance | |||||||||||||||||||||||
| AFS fixed maturity securities: | |||||||||||||||||||||||
| U.S. government and agencies | $ | $ | $ | $ | |||||||||||||||||||
| U.S. state, municipal and political subdivisions | |||||||||||||||||||||||
| Corporate | |||||||||||||||||||||||
| Structured securities | |||||||||||||||||||||||
| Total AFS fixed maturity securities | $ | $ | $ | $ | |||||||||||||||||||
| Trading fixed maturity securities: | |||||||||||||||||||||||
| U.S. government and agencies | $ | $ | $ | $ | |||||||||||||||||||
| U.S. state, municipal and political subdivisions | |||||||||||||||||||||||
| Corporate | |||||||||||||||||||||||
| Structured securities | |||||||||||||||||||||||
| Total trading fixed maturity securities | $ | $ | $ | $ | |||||||||||||||||||
| Equity securities | |||||||||||||||||||||||
| Mortgage and other loan receivables | |||||||||||||||||||||||
| Other investments | (1) | ||||||||||||||||||||||
| Funds withheld receivable at interest | |||||||||||||||||||||||
| Reinsurance recoverable | |||||||||||||||||||||||
| Derivative assets: | |||||||||||||||||||||||
| Equity market contracts | |||||||||||||||||||||||
| Interest rate contracts | |||||||||||||||||||||||
| Foreign currency contracts | |||||||||||||||||||||||
| Impact of netting | ( | ( | (2) | ( | |||||||||||||||||||
| Total derivative assets | $ | ( | $ | $ | $ | ||||||||||||||||||
| Separate account assets | |||||||||||||||||||||||
| Total Assets at Fair Value - Insurance | $ | $ | $ | $ | |||||||||||||||||||
| Total Assets at Fair Value | $ | $ | $ | $ | |||||||||||||||||||
301
Notes to Financial Statements (Continued)
| December 31, 2022 | |||||||||||||||||||||||
| Level I | Level II | Level III | Total | ||||||||||||||||||||
| Asset Management | |||||||||||||||||||||||
| Private Equity | $ | $ | $ | $ | |||||||||||||||||||
| Credit | |||||||||||||||||||||||
| Investments of Consolidated CFEs | |||||||||||||||||||||||
| Real Assets | |||||||||||||||||||||||
| Equity Method - Other | |||||||||||||||||||||||
| Other Investments | |||||||||||||||||||||||
| Total Investments | $ | $ | $ | $ | |||||||||||||||||||
| Foreign Exchange Contracts and Options | |||||||||||||||||||||||
| Other Derivatives | |||||||||||||||||||||||
| Total Assets at Fair Value - Asset Management | $ | $ | $ | $ | |||||||||||||||||||
| Insurance | |||||||||||||||||||||||
| AFS fixed maturity securities: | |||||||||||||||||||||||
| U.S. government and agencies | $ | $ | $ | $ | |||||||||||||||||||
| U.S. state, municipal and political subdivisions | |||||||||||||||||||||||
| Corporate | |||||||||||||||||||||||
| Structured securities | |||||||||||||||||||||||
| Total AFS fixed maturity securities | $ | $ | $ | $ | |||||||||||||||||||
| Trading fixed maturity securities: | |||||||||||||||||||||||
| U.S. government and agencies | $ | $ | $ | $ | |||||||||||||||||||
| U.S. state, municipal and political subdivisions | |||||||||||||||||||||||
| Corporate | |||||||||||||||||||||||
| Structured securities | |||||||||||||||||||||||
| Total trading fixed maturity securities | $ | $ | $ | $ | |||||||||||||||||||
| Equity securities | |||||||||||||||||||||||
| Mortgage and other loan receivables | |||||||||||||||||||||||
| Other investments | (1) | ||||||||||||||||||||||
| Funds withheld receivable at interest | |||||||||||||||||||||||
| Reinsurance recoverable | |||||||||||||||||||||||
| Derivative assets: | |||||||||||||||||||||||
| Equity market contracts | |||||||||||||||||||||||
| Interest rate contracts | |||||||||||||||||||||||
| Foreign currency contracts | |||||||||||||||||||||||
| Impact of netting | ( | ( | (2) | ( | |||||||||||||||||||
| Total derivative assets | $ | $ | $ | $ | |||||||||||||||||||
| Separate account assets | |||||||||||||||||||||||
| Total Assets at Fair Value - Insurance | $ | $ | $ | $ | |||||||||||||||||||
| Total Assets at Fair Value | $ | $ | $ | $ | |||||||||||||||||||
(1)Other investments excluded from the fair value hierarchy include certain real estate and private equity funds for which fair value is measured at net asset value per share as a practical expedient. As of December 31, 2023 and 2022, the fair value of these investments was $138.5 million and $148.9 million, respectively.
(2)Represents netting of derivative exposures covered by qualifying master netting agreements.
302
Notes to Financial Statements (Continued)
Liabilities, at fair value:
| December 31, 2023 | |||||||||||||||||||||||
| Level I | Level II | Level III | Total | ||||||||||||||||||||
| Asset Management | |||||||||||||||||||||||
| Securities Sold Short | $ | $ | $ | $ | |||||||||||||||||||
| Foreign Exchange Contracts and Options | |||||||||||||||||||||||
| Unfunded Revolver Commitments | (1) | ||||||||||||||||||||||
| Other Derivatives | |||||||||||||||||||||||
| Debt Obligations of Consolidated CFEs | |||||||||||||||||||||||
| Total Liabilities at Fair Value - Asset Management | $ | $ | $ | $ | |||||||||||||||||||
| Insurance | |||||||||||||||||||||||
| Policy liabilities (including market risk benefits) | $ | $ | $ | (3) | $ | ||||||||||||||||||
| Closed block policy liabilities | |||||||||||||||||||||||
| Funds withheld payable at interest | ( | ( | |||||||||||||||||||||
| Derivative instruments payable: | |||||||||||||||||||||||
| Equity market contracts | |||||||||||||||||||||||
| Interest rate contracts | |||||||||||||||||||||||
| Foreign currency contracts | |||||||||||||||||||||||
| Credit contracts | |||||||||||||||||||||||
| Impact of netting | ( | ( | (2) | ( | |||||||||||||||||||
| Total derivative instruments payable | |||||||||||||||||||||||
Embedded derivative – interest-sensitive life products | |||||||||||||||||||||||
| Embedded derivative – annuity products | |||||||||||||||||||||||
| Total Liabilities at Fair Value - Insurance | $ | $ | $ | $ | |||||||||||||||||||
| Total Liabilities at Fair Value | $ | $ | $ | $ | |||||||||||||||||||
303
Notes to Financial Statements (Continued)
| December 31, 2022 | |||||||||||||||||||||||
| Level I | Level II | Level III | Total | ||||||||||||||||||||
| Asset Management | |||||||||||||||||||||||
| Securities Sold Short | $ | $ | $ | $ | |||||||||||||||||||
| Foreign Exchange Contracts and Options | |||||||||||||||||||||||
| Unfunded Revolver Commitments | (1) | ||||||||||||||||||||||
| Other Derivatives | |||||||||||||||||||||||
| Debt Obligations of Consolidated CFEs | |||||||||||||||||||||||
| Total Liabilities at Fair Value - Asset Management | $ | $ | $ | $ | |||||||||||||||||||
| Insurance | |||||||||||||||||||||||
| Policy liabilities (including market risk benefits) | $ | $ | $ | (3) | $ | ||||||||||||||||||
| Closed block policy liabilities | |||||||||||||||||||||||
| Funds withheld payable at interest | ( | ( | |||||||||||||||||||||
| Derivative instruments payable: | |||||||||||||||||||||||
| Equity market contracts | |||||||||||||||||||||||
| Interest rate contracts | |||||||||||||||||||||||
| Foreign currency contracts | |||||||||||||||||||||||
| Credit contracts | |||||||||||||||||||||||
| Impact of netting | ( | ( | (2) | ( | |||||||||||||||||||
| Total derivative instruments payable | |||||||||||||||||||||||
Embedded derivative – interest-sensitive life products | |||||||||||||||||||||||
| Embedded derivative – annuity products | |||||||||||||||||||||||
| Total Liabilities at Fair Value - Insurance | $ | $ | $ | $ | |||||||||||||||||||
| Total Liabilities at Fair Value | $ | $ | $ | $ | |||||||||||||||||||
(1)These unfunded revolver commitments are valued using the same valuation methodologies as KKR's Level III credit investments.
(2)Represents netting of derivative exposures covered by qualifying master netting agreements.
(3)Includes market risk benefit of $1.1 billion and $682.0 million as of December 31, 2023 and 2022, respectively.
304
Notes to Financial Statements (Continued)
The following tables summarize changes in assets and liabilities measured and reported at fair value for which Level III inputs have been used to determine fair value for the years ended December 31, 2023, 2022 and 2021, respectively. For certain insurance disclosures, the beginning of the period represents balances as of the 2021 GA Acquisition Date.
| For the Year Ended December 31, 2023 | ||||||||||||||||||||||||||||||||
| Balance, Beg. of Period | Transfers In / (Out) - Changes in Consolidation(1) | Transfers In | Transfers Out | Net Purchases/Issuances/Sales/Settlements | Balance, End of Period | Changes in Net Unrealized Gains (Losses) Included in OCI related to Level III Assets and Liabilities still held as of the Reporting Date | ||||||||||||||||||||||||||
| Assets | ||||||||||||||||||||||||||||||||
| Asset Management | ||||||||||||||||||||||||||||||||
| Private Equity | $ | $ | $ | $ | ( | $ | $ | $ | $ | $ | $ | |||||||||||||||||||||
| Credit | ( | ( | ||||||||||||||||||||||||||||||
| Real Assets | ( | ( | ( | ( | ||||||||||||||||||||||||||||
| Equity Method - Other | ( | ( | ||||||||||||||||||||||||||||||
| Other Investments | ( | ( | ( | |||||||||||||||||||||||||||||
| Other Derivatives | ( | |||||||||||||||||||||||||||||||
| Total Assets - Asset Management | $ | $ | ( | $ | $ | ( | $ | $ | $ | $ | $ | $ | ||||||||||||||||||||
| Insurance | ||||||||||||||||||||||||||||||||
| AFS fixed maturity securities: | ||||||||||||||||||||||||||||||||
| Corporate fixed maturity securities | $ | $ | $ | $ | $ | $ | $ | $ | $ | $ | ||||||||||||||||||||||
| Structured securities | ( | |||||||||||||||||||||||||||||||
| Total AFS fixed maturity securities | ( | |||||||||||||||||||||||||||||||
| Trading fixed maturity securities: | ||||||||||||||||||||||||||||||||
| Corporate fixed maturity securities | ( | ( | ( | ( | ||||||||||||||||||||||||||||
| Structured securities | ( | ( | ( | |||||||||||||||||||||||||||||
| Total trading fixed maturity securities | ( | ( | ( | ( | ||||||||||||||||||||||||||||
| Equity securities | ( | ( | ( | |||||||||||||||||||||||||||||
| Mortgage and other loan receivables | ( | ( | ( | |||||||||||||||||||||||||||||
| Other investments | ( | ( | ||||||||||||||||||||||||||||||
| Funds withheld receivable at interest | ||||||||||||||||||||||||||||||||
| Reinsurance recoverable | ( | ( | ||||||||||||||||||||||||||||||
| Total Assets - Insurance | $ | $ | $ | $ | ( | $ | $ | ( | $ | $ | $ | ( | $ | |||||||||||||||||||
| Total | $ | $ | ( | $ | $ | ( | $ | $ | $ | $ | $ | $ | ||||||||||||||||||||
(1)For transfers (out) - changes in consolidation, in certain instances, KKR's economic interests became insignificant and certain investment vehicles are no longer consolidated as a result of additional amounts subscribed for by third party investors.
305
Notes to Financial Statements (Continued)
| For the Year Ended December 31, 2022 | ||||||||||||||||||||||||||||||||
| Balance, Beg. of Period | Transfers In / (Out) - Changes in Consolidation | Transfers In | Transfers Out | Net Purchases/Issuances/Sales/Settlements | Change in OCI | Balance, End of Period | Changes in Net Unrealized Gains (Losses) Included in OCI related to Level III Assets and Liabilities still held as of the Reporting Date | |||||||||||||||||||||||||
| Assets | ||||||||||||||||||||||||||||||||
| Asset Management | ||||||||||||||||||||||||||||||||
| Private Equity | $ | $ | ( | $ | $ | ( | $ | $ | ( | $ | $ | $ | ( | $ | ||||||||||||||||||
| Credit | ( | ( | ( | ( | ||||||||||||||||||||||||||||
| Real Assets | ||||||||||||||||||||||||||||||||
| Equity Method - Other | ( | ( | ||||||||||||||||||||||||||||||
| Other Investments | ( | ( | ( | |||||||||||||||||||||||||||||
| Other Derivatives | ( | |||||||||||||||||||||||||||||||
| Total Assets - Asset Management | $ | $ | $ | $ | ( | $ | $ | ( | $ | ( | $ | $ | ( | $ | ||||||||||||||||||
| Insurance | ||||||||||||||||||||||||||||||||
| AFS fixed maturity securities: | ||||||||||||||||||||||||||||||||
| Corporate fixed maturity securities | $ | $ | $ | $ | ( | $ | $ | ( | $ | ( | $ | $ | $ | ( | ||||||||||||||||||
| Structured securities | ( | ( | ( | |||||||||||||||||||||||||||||
| Total AFS fixed maturity securities | ( | ( | ( | ( | ||||||||||||||||||||||||||||
| Trading fixed maturity securities: | ||||||||||||||||||||||||||||||||
| Corporate fixed maturity securities | ( | ( | ( | |||||||||||||||||||||||||||||
| Structured securities | ( | ( | ( | |||||||||||||||||||||||||||||
| Total trading fixed maturity securities | ( | ( | ( | |||||||||||||||||||||||||||||
| Equity securities | ( | ( | ||||||||||||||||||||||||||||||
| Mortgage and other loan receivables | ( | ( | ||||||||||||||||||||||||||||||
| Other investments | ||||||||||||||||||||||||||||||||
| Funds withheld receivable at interest | ( | |||||||||||||||||||||||||||||||
| Reinsurance recoverable | ( | ( | ||||||||||||||||||||||||||||||
| Total Assets - Insurance | $ | $ | $ | $ | ( | $ | $ | ( | $ | ( | $ | $ | ( | $ | ( | |||||||||||||||||
| Total | $ | $ | $ | $ | ( | $ | $ | ( | $ | ( | $ | $ | ( | $ | ( | |||||||||||||||||
306
Notes to Financial Statements (Continued)
| For the Year Ended December 31, 2023 | |||||||||||||||||
| Purchases | Issuances | Sales | Settlements | Net Purchases/ Issuances/ Sales/ Settlements | |||||||||||||
| Assets | |||||||||||||||||
| Asset Management | |||||||||||||||||
| Private Equity | $ | $ | $ | ( | $ | $ | |||||||||||
| Credit | ( | ( | ( | ||||||||||||||
| Real Assets | ( | ( | |||||||||||||||
| Equity Method - Other | ( | ( | |||||||||||||||
| Other Investments | ( | ( | |||||||||||||||
| Other Derivatives | |||||||||||||||||
| Total Assets - Asset Management | $ | $ | $ | ( | $ | ( | $ | ||||||||||
| Insurance | |||||||||||||||||
| AFS fixed maturity securities: | |||||||||||||||||
| Corporate fixed maturity securities | $ | $ | $ | ( | $ | ( | $ | ||||||||||
| Structured securities | ( | ( | |||||||||||||||
| Total AFS fixed maturity securities | ( | ( | |||||||||||||||
| Trading fixed maturity securities: | |||||||||||||||||
| Corporate fixed maturity securities | ( | ( | ( | ||||||||||||||
| Structured securities | ( | ( | ( | ||||||||||||||
| Total trading fixed maturity securities | ( | ( | ( | ||||||||||||||
| Equity securities | ( | ( | |||||||||||||||
| Mortgage and other loan receivables | ( | ( | ( | ||||||||||||||
| Other investments | ( | ||||||||||||||||
| Reinsurance recoverable | ( | ( | |||||||||||||||
| Total Assets - Insurance | $ | $ | $ | ( | $ | ( | $ | ||||||||||
| Total | $ | $ | $ | ( | $ | ( | $ | ||||||||||
| For the Year Ended December 31, 2022 | |||||||||||||||||
| Purchases | Issuances | Sales | Settlements | Net Purchases/ Issuances/ Sales/ Settlements | |||||||||||||
| Assets | |||||||||||||||||
| Asset Management | |||||||||||||||||
| Private Equity | $ | $ | $ | ( | $ | $ | |||||||||||
| Credit | ( | ( | |||||||||||||||
| Real Assets | ( | ( | |||||||||||||||
| Equity Method - Other | ( | ||||||||||||||||
| Other Investments | ( | ( | |||||||||||||||
| Other Derivatives | ( | ||||||||||||||||
| Total Assets - Asset Management | $ | $ | $ | ( | $ | ( | $ | ||||||||||
| Insurance | |||||||||||||||||
| AFS fixed maturity securities: | |||||||||||||||||
| Corporate fixed maturity securities | $ | $ | $ | ( | $ | ( | $ | ||||||||||
| Structured securities | ( | ( | |||||||||||||||
| Total AFS fixed maturity securities | ( | ( | |||||||||||||||
| Trading fixed maturity securities: | |||||||||||||||||
| Corporate fixed maturity securities | ( | ( | |||||||||||||||
| Structured securities | ( | ( | |||||||||||||||
| Total trading fixed maturity securities | ( | ( | |||||||||||||||
| Equity securities | |||||||||||||||||
| Mortgage and other loan receivables | ( | ( | |||||||||||||||
| Other investments | ( | ||||||||||||||||
| Funds withheld receivable at interest | |||||||||||||||||
| Reinsurance recoverable | ( | ( | |||||||||||||||
| Total Assets - Insurance | $ | $ | $ | ( | $ | ( | $ | ||||||||||
| Total | $ | $ | $ | ( | $ | ( | $ | ||||||||||
307
Notes to Financial Statements (Continued)
| For the Year Ended December 31, 2023 | |||||||||||||||||||||||||||||
| Balance, Beg. of Period | Transfers In / (Out) - Changes in Consolidation | Transfers In | Transfers Out | Net Purchases/Sales/Settlements/Issuances | Balance, End of Period | ||||||||||||||||||||||||
| Liabilities | |||||||||||||||||||||||||||||
| Asset Management | |||||||||||||||||||||||||||||
| Unfunded Revolver Commitments | $ | $ | $ | $ | $ | $ | ( | $ | $ | $ | ( | ||||||||||||||||||
| Total Liabilities - Asset Management | $ | $ | $ | $ | $ | $ | ( | $ | $ | $ | ( | ||||||||||||||||||
| Insurance | |||||||||||||||||||||||||||||
| Policy liabilities | $ | $ | $ | $ | $ | ( | $ | $ | $ | $ | |||||||||||||||||||
| Closed block policy liabilities | ( | ( | |||||||||||||||||||||||||||
| Funds withheld payable at interest | ( | ( | |||||||||||||||||||||||||||
Embedded derivative – interest-sensitive life products | ( | ||||||||||||||||||||||||||||
| Embedded derivative – annuity products | |||||||||||||||||||||||||||||
| Total Liabilities - Insurance | $ | $ | $ | $ | $ | $ | $ | $ | $ | ||||||||||||||||||||
| Total | $ | $ | $ | $ | $ | $ | $ | $ | $ | ( | |||||||||||||||||||
308
Notes to Financial Statements (Continued)
| For the Year Ended December 31, 2022 | |||||||||||||||||||||||||||||
| Balance, Beg. of Period | Transfers In / (Out) - Changes in Consolidation | Transfers In | Transfers Out | Net Purchases/Sales/Settlements/Issuances | Balance, End of Period | ||||||||||||||||||||||||
| Liabilities | |||||||||||||||||||||||||||||
| Asset Management | |||||||||||||||||||||||||||||
| Unfunded Revolver Commitments | $ | $ | $ | $ | $ | $ | $ | $ | $ | ||||||||||||||||||||
| Total Liabilities - Asset Management | $ | $ | $ | $ | $ | $ | $ | $ | $ | ||||||||||||||||||||
| Insurance | |||||||||||||||||||||||||||||
| Policy liabilities | $ | $ | $ | $ | $ | $ | ( | $ | ( | $ | $ | ||||||||||||||||||
| Closed block policy liabilities | ( | ( | ( | ||||||||||||||||||||||||||
| Funds withheld payable at interest | ( | ( | ( | ||||||||||||||||||||||||||
Embedded derivative – interest-sensitive life products | ( | ||||||||||||||||||||||||||||
| Embedded derivative – annuity products | ( | ||||||||||||||||||||||||||||
| Total Liabilities - Insurance | $ | $ | $ | $ | $ | $ | ( | $ | ( | $ | $ | ||||||||||||||||||
| Total | $ | $ | $ | $ | $ | $ | ( | $ | ( | $ | $ | ||||||||||||||||||
309
Notes to Financial Statements (Continued)
| Year Ended December 31, 2023 | |||||||||||
| Issuances | Settlements | Net Issuances/Settlements | |||||||||
| Liabilities | |||||||||||
| Asset Management | |||||||||||
| Unfunded Revolver Commitments | $ | $ | $ | ||||||||
| Total Liabilities - Asset Management | $ | $ | $ | ||||||||
| Insurance | |||||||||||
| Policy liabilities | $ | $ | ( | $ | ( | ||||||
| Closed block policy liabilities | ( | ( | |||||||||
Embedded derivative – interest-sensitive life products | ( | ( | |||||||||
| Embedded derivative – annuity products | ( | ||||||||||
| Total Liabilities - Insurance | $ | $ | ( | $ | |||||||
| Total | $ | $ | ( | $ | |||||||
| Year Ended December 31, 2022 | |||||||||||
| Issuances | Settlements | Net Issuances/Settlements | |||||||||
| Liabilities | |||||||||||
| Asset Management | |||||||||||
| Unfunded Revolver Commitments | $ | $ | ( | $ | |||||||
| Total Liabilities - Asset Management | $ | $ | ( | $ | |||||||
| Insurance | |||||||||||
| Policy liabilities | $ | $ | ( | $ | |||||||
| Closed block policy liabilities | ( | ( | |||||||||
| Funds withheld payable at interest | |||||||||||
Embedded derivative – interest-sensitive life products | ( | ||||||||||
| Embedded derivative – annuity products | ( | ||||||||||
| Total Liabilities - Insurance | $ | $ | ( | $ | |||||||
| Total | $ | $ | ( | $ | |||||||
Total realized and unrealized gains and losses recorded for Asset Management - Level III assets and liabilities are reported in Net Gains (Losses) from Investment Activities in the accompanying consolidated statements of operations while Insurance - Level III assets and liabilities are reported in Net Investment Gains and Policy Benefits and Claims in the accompanying consolidated statements of operations.
The following table presents additional information about valuation methodologies and significant unobservable inputs used for financial assets and liabilities that are measured and reported at fair value and categorized within Level III as of December 31, 2023. Because input information includes only those items for which information is reasonably available, balances shown below may not equal total amounts reported for such Level III assets and liabilities:
| Level III Assets | Fair Value December 31, 2023 | Valuation Methodologies & Inputs | Unobservable Input(s) (1) | Weighted Average (2) | Range | Impact to Valuation from an Increase in Input (3) | ||||||||||||||||||||||||||||||||
| ASSET MANAGEMENT | ||||||||||||||||||||||||||||||||||||||
| Private Equity | $ | |||||||||||||||||||||||||||||||||||||
| Private Equity | $ | Inputs to market comparables, discounted cash flow and transaction price | Illiquidity Discount | Decrease | ||||||||||||||||||||||||||||||||||
| Weight Ascribed to Market Comparables | (4) | |||||||||||||||||||||||||||||||||||||
| Weight Ascribed to Discounted Cash Flow | (5) | |||||||||||||||||||||||||||||||||||||
| Weight Ascribed to Transaction Price | (6) | |||||||||||||||||||||||||||||||||||||
| Market comparables | Enterprise Value/LTM EBITDA Multiple | Increase | ||||||||||||||||||||||||||||||||||||
| Enterprise Value/Forward EBITDA Multiple | Increase | |||||||||||||||||||||||||||||||||||||
| Discounted cash flow | Weighted Average Cost of Capital | Decrease | ||||||||||||||||||||||||||||||||||||
| Enterprise Value/EBITDA Exit Multiple | Increase | |||||||||||||||||||||||||||||||||||||
310
Notes to Financial Statements (Continued)
| Level III Assets | Fair Value December 31, 2023 | Valuation Methodologies & Inputs | Unobservable Input(s) (1) | Weighted Average (2) | Range | Impact to Valuation from an Increase in Input (3) | ||||||||||||||||||||||||||||||||
| Growth Equity | $ | Inputs to market comparables, discounted cash flow and milestones | Illiquidity Discount | Decrease | ||||||||||||||||||||||||||||||||||
| Weight Ascribed to Market Comparables | (4) | |||||||||||||||||||||||||||||||||||||
| Weight Ascribed to Discounted Cash Flow | (5) | |||||||||||||||||||||||||||||||||||||
| Weight Ascribed to Transaction Price | ||||||||||||||||||||||||||||||||||||||
| Weight Ascribed to Milestones | (6) | |||||||||||||||||||||||||||||||||||||
| Scenario Weighting | Base | Increase | ||||||||||||||||||||||||||||||||||||
| Downside | Decrease | |||||||||||||||||||||||||||||||||||||
| Upside | Increase | |||||||||||||||||||||||||||||||||||||
| Market Comparables | Enterprise Value/Revenues Multiple | Increase | ||||||||||||||||||||||||||||||||||||
| Credit | $ | Yield Analysis | Yield | Decrease | ||||||||||||||||||||||||||||||||||
| Net Leverage | Decrease | |||||||||||||||||||||||||||||||||||||
| EBITDA Multiple | Increase | |||||||||||||||||||||||||||||||||||||
| Real Assets | $ | |||||||||||||||||||||||||||||||||||||
| Energy | $ | Inputs to market comparables, discounted cash flow and transaction price | Weight Ascribed to Market Comparables | (4) | ||||||||||||||||||||||||||||||||||
| Weight Ascribed to Discounted Cash Flow | (5) | |||||||||||||||||||||||||||||||||||||
| Weight Ascribed to Transaction Price | (6) | |||||||||||||||||||||||||||||||||||||
| Market comparables | Enterprise Value/LTM EBITDA Multiple | Increase | ||||||||||||||||||||||||||||||||||||
| Enterprise Value/Forward EBITDA Multiple | Increase | |||||||||||||||||||||||||||||||||||||
| Discounted cash flow | Weighted Average Cost of Capital | Decrease | ||||||||||||||||||||||||||||||||||||
| Average Price Per BOE (8) | $ | $ | Increase | |||||||||||||||||||||||||||||||||||
| Infrastructure | $ | Inputs to market comparables, discounted cash flow and transaction price | Illiquidity Discount | Decrease | ||||||||||||||||||||||||||||||||||
| Weight Ascribed to Market Comparables | (4) | |||||||||||||||||||||||||||||||||||||
| Weight Ascribed to Discounted Cash Flow | (5) | |||||||||||||||||||||||||||||||||||||
| Weight Ascribed to Transaction Price | (6) | |||||||||||||||||||||||||||||||||||||
| Market comparables | Enterprise Value/LTM EBITDA Multiple | Increase | ||||||||||||||||||||||||||||||||||||
| Enterprise Value/Forward EBITDA Multiple | Increase | |||||||||||||||||||||||||||||||||||||
| Discounted cash flow | Weighted Average Cost of Capital | Decrease | ||||||||||||||||||||||||||||||||||||
| Enterprise Value/EBITDA Exit Multiple | Increase | |||||||||||||||||||||||||||||||||||||
| Real Estate | $ | Inputs to direct income capitalization, discounted cash flow and transaction price | Weight Ascribed to Direct Income Capitalization | (7) | ||||||||||||||||||||||||||||||||||
| Weight Ascribed to Discounted Cash Flow | (5) | |||||||||||||||||||||||||||||||||||||
| Weight Ascribed to Transaction Price | (6) | |||||||||||||||||||||||||||||||||||||
| Direct income capitalization | Current Capitalization Rate | Decrease | ||||||||||||||||||||||||||||||||||||
| Discounted cash flow | Exit Capitalization Rate | Decrease | ||||||||||||||||||||||||||||||||||||
| Unlevered Discount Rate | Decrease | |||||||||||||||||||||||||||||||||||||
| Equity Method - Other | $ | Inputs to market comparables, discounted cash flow and transaction price | Illiquidity Discount | Decrease | ||||||||||||||||||||||||||||||||||
| Weight Ascribed to Market Comparables | (4) | |||||||||||||||||||||||||||||||||||||
| Weight Ascribed to Discounted Cash Flow | (5) | |||||||||||||||||||||||||||||||||||||
| Weight Ascribed to Transaction Price | (6) | |||||||||||||||||||||||||||||||||||||
| Market comparables | Enterprise Value/LTM EBITDA Multiple | Increase | ||||||||||||||||||||||||||||||||||||
| Enterprise Value/Forward EBITDA Multiple | Increase | |||||||||||||||||||||||||||||||||||||
| Discounted cash flow | Weighted Average Cost of Capital | Decrease | ||||||||||||||||||||||||||||||||||||
| Enterprise Value/EBITDA Exit Multiple | Increase | |||||||||||||||||||||||||||||||||||||
| Other Investments | $ | (9) | Inputs to market comparables, discounted cash flow and transaction price | Illiquidity Discount | Decrease | |||||||||||||||||||||||||||||||||
| Weight Ascribed to Market Comparables | (4) | |||||||||||||||||||||||||||||||||||||
| Weight Ascribed to Discounted Cash Flow | (5) | |||||||||||||||||||||||||||||||||||||
| Weight Ascribed to Transaction Price | (6) | |||||||||||||||||||||||||||||||||||||
| Market comparables | Enterprise Value/LTM EBITDA Multiple | Increase | ||||||||||||||||||||||||||||||||||||
| Enterprise Value/Forward EBITDA Multiple | Increase | |||||||||||||||||||||||||||||||||||||
311
Notes to Financial Statements (Continued)
| Level III Assets | Fair Value December 31, 2023 | Valuation Methodologies & Inputs | Unobservable Input(s) (1) | Weighted Average (2) | Range | Impact to Valuation from an Increase in Input (3) | ||||||||||||||||||||||||||||||||
| Discounted cash flow | Weighted Average Cost of Capital | Decrease | ||||||||||||||||||||||||||||||||||||
| Enterprise Value/EBITDA Exit Multiple | Increase | |||||||||||||||||||||||||||||||||||||
| INSURANCE | ||||||||||||||||||||||||||||||||||||||
| Corporate fixed maturity securities | $ | Discounted cash flow | Discount Spread | Decrease | ||||||||||||||||||||||||||||||||||
| Structured securities | $ | Discounted cash flow | Discount Spread | Decrease | ||||||||||||||||||||||||||||||||||
| Constant Prepayment Rate | Increase/Decrease | |||||||||||||||||||||||||||||||||||||
| Constant Default Rate | Decrease | |||||||||||||||||||||||||||||||||||||
| Loss Severity | Decrease | |||||||||||||||||||||||||||||||||||||
| Other investments | $ | Discounted cash flow | Vacancy rate | Decrease | ||||||||||||||||||||||||||||||||||
| Discount rate | Decrease | |||||||||||||||||||||||||||||||||||||
| Terminal capitalization rate | Decrease | |||||||||||||||||||||||||||||||||||||
| Funds withheld receivable at interest | $ | Discounted cash flow | Duration/Weighted Average Life | Increase | ||||||||||||||||||||||||||||||||||
| Contractholder Persistency | Increase | |||||||||||||||||||||||||||||||||||||
| Instrument-specific credit risk | Decrease | |||||||||||||||||||||||||||||||||||||
| Reinsurance recoverable | $ | Present value of expenses paid from the open block plus the cost of capital held in support of the liabilities. | Expense assumption | $ | The average expense assumption is between $ | Increase | ||||||||||||||||||||||||||||||||
| Unobservable inputs are a market participant’s view of the expenses, a risk margin on the uncertainty of the level of expenses and a cost of capital on the capital held in support of the liabilities. | Expense risk margin | Decrease | ||||||||||||||||||||||||||||||||||||
| Cost of capital | Increase | |||||||||||||||||||||||||||||||||||||
| Discounted cash flow | Mortality Rate | Increase | ||||||||||||||||||||||||||||||||||||
| Surrender Rate | Increase | |||||||||||||||||||||||||||||||||||||
(1)In determining certain of these inputs, management evaluates a variety of factors including economic conditions, industry and market developments, market valuations of comparable companies and company specific developments including exit strategies and realization opportunities. KKR has determined that market participants would take these inputs into account when valuing the investments and debt obligations. "LTM" means last twelve months, and "EBITDA" means earnings before interest, taxes, depreciation and amortization.
(2)Inputs were weighted based on the fair value of the investments included in the range.
(3)Unless otherwise noted, this column represents the directional change in the fair value of the Level III investments that would result from an increase to the corresponding unobservable input. A decrease to the unobservable input would have the opposite effect. Significant increases and decreases in these inputs in isolation could result in significantly higher or lower fair value measurements.
(4)The directional change from an increase in the weight ascribed to the market comparables approach would increase the fair value of the Level III investments if the market comparables approach results in a higher valuation than the discounted cash flow approach and transaction price. The opposite would be true if the market comparables approach results in a lower valuation than the discounted cash flow approach and transaction price.
(5)The directional change from an increase in the weight ascribed to the discounted cash flow approach would increase the fair value of the Level III investments if the discounted cash flow approach results in a higher valuation than the market comparables approach, transaction price and direct income capitalization approach. The opposite would be true if the discounted cash flow approach results in a lower valuation than the market comparables approach, transaction price and direct income capitalization approach.
(6)The directional change from an increase in the weight ascribed to the transaction price or milestones would increase the fair value of the Level III investments if the transaction price or milestones results in a higher valuation than the market comparables and discounted cash flow approach. The opposite would be true if the transaction price or milestones results in a lower valuation than the market comparables approach and discounted cash flow approach.
312
Notes to Financial Statements (Continued)
(7)The directional change from an increase in the weight ascribed to the direct income capitalization approach would increase the fair value of the Level III investments if the direct income capitalization approach results in a higher valuation than the discounted cash flow approach. The opposite would be true if the direct income capitalization approach results in a lower valuation than the discounted cash flow approach.
(8)The total energy fair value amount includes multiple investments (in multiple locations throughout North America) that are held in different investment funds and produce varying quantities of oil, condensate, natural gas liquids, and natural gas. Commodity price may be measured using a common volumetric equivalent where one barrel of oil equivalent ("BOE") is determined using the ratio of six thousand cubic feet of natural gas to one barrel of oil, condensate or natural gas liquids. The price per BOE is provided to show the aggregate of all price inputs for the various investments over a common volumetric equivalent although the valuations for specific investments may use price inputs specific to the asset for purposes of our valuations. The discounted cash flows include forecasted production of liquids (oil, condensate, and natural gas liquids) and natural gas with a forecasted revenue ratio of approximately 88 % liquids and 12 % natural gas.
(9)Consists primarily of investments in common stock, preferred stock, warrants and options of companies that are not private equity, real assets, credit, equity method - other or investments of consolidated CFEs.
| Level III Liabilities | Fair Value December 31, 2023 | Valuation Methodologies | Unobservable Input(s) (1) | Weighted Average (2) | Range | Impact to Valuation from an Increase in Input (3) | ||||||||||||||||||||||||||||||||
| ASSET MANAGEMENT | ||||||||||||||||||||||||||||||||||||||
| Unfunded Revolver Commitments | $ | Yield Analysis | Yield | Decrease | ||||||||||||||||||||||||||||||||||
| INSURANCE | ||||||||||||||||||||||||||||||||||||||
Policy liabilities | $ | Policy liabilities under fair value option: | ||||||||||||||||||||||||||||||||||||
| Present value of best estimate liability cash flows. Unobservable inputs include a market participant view of the risk margin included in the discount rate which reflects the variability of the cash flows. | Risk Margin Rate | Decrease | ||||||||||||||||||||||||||||||||||||
| Policyholder behavior is also a significant unobservable input, including lapse, surrender and mortality. | Surrender Rate | Decrease | ||||||||||||||||||||||||||||||||||||
| Mortality Rate | Increase | |||||||||||||||||||||||||||||||||||||
| Market risk benefit: | ||||||||||||||||||||||||||||||||||||||
| Fair value using a non-option and option valuation approach | Interest rates (10 and 30 year Treasury) | Decrease | ||||||||||||||||||||||||||||||||||||
Instrument-specific credit risk (10 and 30 year) | Decrease | |||||||||||||||||||||||||||||||||||||
| Policyholder behavior is also a significant unobservable input, including lapse, surrender, and mortality. | Mortality Rate | Increase | ||||||||||||||||||||||||||||||||||||
| Surrender Rate | Increase | |||||||||||||||||||||||||||||||||||||
313
Notes to Financial Statements (Continued)
| Level III Liabilities | Fair Value December 31, 2023 | Valuation Methodologies | Unobservable Input(s) (1) | Weighted Average (2) | Range | Impact to Valuation from an Increase in Input (3) | ||||||||||||||||||||||||||||||||
| Closed block policy liabilities | $ | Present value of expenses paid from the open block plus the cost of capital held in support of the liabilities. | Expense assumption | $ | The average expense assumption is between $ | Increase | ||||||||||||||||||||||||||||||||
| Instrument-specific credit risk | Decrease | |||||||||||||||||||||||||||||||||||||
| Unobservable inputs are a market participant’s view of the expenses, a risk margin on the uncertainty of the level of expenses and a cost of capital on the capital held in support of the liabilities. | Expense Risk Margin | Decrease | ||||||||||||||||||||||||||||||||||||
| Cost of Capital | Increase | |||||||||||||||||||||||||||||||||||||
| Discounted cash flow | Mortality Rate | Increase | ||||||||||||||||||||||||||||||||||||
| Surrender Rate | Increase | |||||||||||||||||||||||||||||||||||||
| Funds withheld payable at interest | $ | ( | Discounted cash flow | Duration/Weighted Average Life | Decrease | |||||||||||||||||||||||||||||||||
| Contractholder Persistency | Decrease | |||||||||||||||||||||||||||||||||||||
| Instrument-specific credit risk | Decrease | |||||||||||||||||||||||||||||||||||||
Embedded derivative – interest-sensitive life products | $ | Policy persistency is a significant unobservable input. | Lapse Rate | Decrease | ||||||||||||||||||||||||||||||||||
| Mortality Rate | Decrease | |||||||||||||||||||||||||||||||||||||
| Future costs for options used to hedge the contract obligations | Option Budge Assumption | Increase | ||||||||||||||||||||||||||||||||||||
| Instrument-specific credit risk | Decrease | |||||||||||||||||||||||||||||||||||||
| Embedded derivative – annuity products | $ | Policyholder behavior is a significant unobservable input, including utilization and lapse. | Utilization: | |||||||||||||||||||||||||||||||||||
| Fixed-indexed annuity | Decrease | |||||||||||||||||||||||||||||||||||||
| Surrender Rate: | ||||||||||||||||||||||||||||||||||||||
| Retail FIA | Decrease | |||||||||||||||||||||||||||||||||||||
| Institutional FIA | Decrease | |||||||||||||||||||||||||||||||||||||
| Mortality Rate: | ||||||||||||||||||||||||||||||||||||||
| Retail FIA | Decrease | |||||||||||||||||||||||||||||||||||||
| Institutional FIA | Decrease | |||||||||||||||||||||||||||||||||||||
| Future costs for options used to hedge the contract obligations | Option Budge Assumption: | |||||||||||||||||||||||||||||||||||||
| Retail RIA | Increase | |||||||||||||||||||||||||||||||||||||
| Institutional FIA | Increase | |||||||||||||||||||||||||||||||||||||
| Instrument-specific credit risk | Decrease | |||||||||||||||||||||||||||||||||||||
(1)In determining certain of these inputs, management evaluates a variety of factors including economic conditions, industry and market developments, market valuations of comparable companies and company specific developments including exit strategies and realization opportunities. KKR has determined that market participants would take these inputs into account when valuing the investments and debt obligations. "LTM" means last twelve months, and "EBITDA" means earnings before interest, taxes, depreciation and amortization.
(2)Inputs were weighted based on the fair value of the investments included in the range.
(3)Unless otherwise noted, this column represents the directional change in the fair value of the Level III investments that would result from an increase to the corresponding unobservable input. A decrease to the unobservable input would have the opposite effect. Significant increases and decreases in these inputs in isolation could result in significantly higher or lower fair value measurements.
314
Notes to Financial Statements (Continued)
In the table above, certain private equity investments may be valued at cost for a period of time after an acquisition as the best indicator of fair value. In addition, certain valuations of private equity investments may be entirely or partially derived by reference to observable valuation measures for a pending or consummated transaction.
The various unobservable inputs used to determine the Level III valuations may have similar or diverging impacts on valuation. Significant increases and decreases in these inputs in isolation and interrelationships between those inputs could result in significantly higher or lower fair value measurements as noted in the table above.
Financial Instruments Not Carried At Fair Value
Asset management financial instruments are primarily measured at fair value on a recurring basis, except as disclosed in Note 16 "Debt Obligations."
The following tables present carrying amounts and fair values of Global Atlantic’s financial instruments which are not carried at fair value as of December 31, 2023 and 2022:
| Fair Value Hierarchy | |||||||||||||||||||||||||||||
| As of December 31, 2023 | Carrying Value | Level I | Level II | Level III | Fair Value | ||||||||||||||||||||||||
| ($ in thousands) | |||||||||||||||||||||||||||||
| Financial assets: | |||||||||||||||||||||||||||||
| Insurance | |||||||||||||||||||||||||||||
| Mortgage and other loan receivables | $ | $ | $ | $ | $ | ||||||||||||||||||||||||
| Policy loans | |||||||||||||||||||||||||||||
| FHLB common stock and other investments | |||||||||||||||||||||||||||||
| Funds withheld receivables at interest | |||||||||||||||||||||||||||||
| Cash and cash equivalents | |||||||||||||||||||||||||||||
| Restricted cash and cash equivalents | |||||||||||||||||||||||||||||
| Total financial assets | $ | $ | $ | $ | $ | ||||||||||||||||||||||||
| Financial liabilities: | |||||||||||||||||||||||||||||
| Insurance | |||||||||||||||||||||||||||||
| Policy liabilities - policyholder account balances | $ | $ | $ | $ | $ | ||||||||||||||||||||||||
| Funds withheld payables at interest | |||||||||||||||||||||||||||||
| Debt obligations | |||||||||||||||||||||||||||||
| Securities sold under agreements to repurchase | |||||||||||||||||||||||||||||
| Total financial liabilities | $ | $ | $ | $ | $ | ||||||||||||||||||||||||
315
Notes to Financial Statements (Continued)
| Fair Value Hierarchy | |||||||||||||||||||||||||||||
| As of December 31, 2022 | Carrying Value | Level I | Level II | Level III | Fair Value | ||||||||||||||||||||||||
| ($ in thousands) | |||||||||||||||||||||||||||||
| Financial assets: | |||||||||||||||||||||||||||||
| Insurance | |||||||||||||||||||||||||||||
| Mortgage and other loan receivables | $ | $ | $ | $ | $ | ||||||||||||||||||||||||
| Policy loans | |||||||||||||||||||||||||||||
| FHLB common stock and other investments | |||||||||||||||||||||||||||||
| Funds withheld receivables at interest | |||||||||||||||||||||||||||||
| Cash and cash equivalents | |||||||||||||||||||||||||||||
| Restricted cash and cash equivalents | |||||||||||||||||||||||||||||
| Total financial assets | $ | $ | $ | $ | $ | ||||||||||||||||||||||||
| Financial liabilities: | |||||||||||||||||||||||||||||
| Insurance | |||||||||||||||||||||||||||||
| Policy liabilities - policyholder account balances | $ | $ | $ | $ | $ | ||||||||||||||||||||||||
| Funds withheld payables at interest | |||||||||||||||||||||||||||||
| Debt obligations | |||||||||||||||||||||||||||||
| Securities sold under agreements to repurchase | |||||||||||||||||||||||||||||
| Total financial liabilities | $ | $ | $ | $ | $ | ||||||||||||||||||||||||
316
Notes to Financial Statements (Continued)
10. FAIR VALUE OPTION
The following table summarizes the financial instruments for which the fair value option has been elected:
| December 31, 2023 | December 31, 2022 | ||||||||||
| Assets | |||||||||||
| Asset Management | |||||||||||
| Credit | $ | $ | |||||||||
| Investments of Consolidated CFEs | |||||||||||
| Real Assets | |||||||||||
| Equity Method - Other | |||||||||||
| Other Investments | |||||||||||
| Total Asset Management | $ | $ | |||||||||
| Insurance | |||||||||||
| Mortgage and other loan receivables | $ | $ | |||||||||
| Other investments | |||||||||||
| Reinsurance recoverable | |||||||||||
| Total Insurance | $ | $ | |||||||||
| Total Assets | $ | $ | |||||||||
| Liabilities | |||||||||||
| Asset Management | |||||||||||
| Debt Obligations of Consolidated CFEs | $ | $ | |||||||||
| Total Asset Management | $ | $ | |||||||||
| Insurance | |||||||||||
| Policy liabilities | $ | $ | |||||||||
| Total Insurance | $ | $ | |||||||||
| Total Liabilities | $ | $ | |||||||||
317
Notes to Financial Statements (Continued)
The following table presents the net realized and unrealized gains (losses) on financial instruments for which the fair value option was elected:
| For the Year Ended December 31, 2023 | |||||||||||||||||
| Net Realized Gains (Losses) | Net Unrealized Gains (Losses) | Total | |||||||||||||||
| Assets | |||||||||||||||||
| Asset Management | |||||||||||||||||
| Credit | $ | ( | $ | $ | ( | ||||||||||||
| Investments of Consolidated CFEs | ( | ||||||||||||||||
| Real Assets | ( | ( | |||||||||||||||
| Equity Method - Other | |||||||||||||||||
| Other Investments | ( | ||||||||||||||||
| Total Asset Management | $ | $ | $ | ||||||||||||||
| Insurance | |||||||||||||||||
| Mortgage and other loan receivables | $ | $ | ( | $ | ( | ||||||||||||
| Other investments | ( | ( | |||||||||||||||
| Total Insurance | $ | $ | ( | $ | ( | ||||||||||||
| Total Assets | $ | $ | $ | ||||||||||||||
| Liabilities | |||||||||||||||||
| Asset Management | |||||||||||||||||
| Debt Obligations of Consolidated CFEs | $ | ( | $ | ( | $ | ( | |||||||||||
| Total Asset Management | $ | ( | $ | ( | $ | ( | |||||||||||
| Insurance | |||||||||||||||||
| Policy liabilities | $ | $ | $ | ||||||||||||||
| Total Insurance | $ | $ | $ | ||||||||||||||
| Total Liabilities | $ | ( | $ | ( | $ | ( | |||||||||||
318
Notes to Financial Statements (Continued)
| For the Year Ended December 31, 2022 | |||||||||||||||||
| Net Realized Gains (Losses) | Net Unrealized Gains (Losses) | Total | |||||||||||||||
| Assets | |||||||||||||||||
| Asset Management | |||||||||||||||||
| Credit | $ | ( | $ | ( | $ | ( | |||||||||||
| Investments of Consolidated CFEs | ( | ( | ( | ||||||||||||||
| Real Assets | |||||||||||||||||
| Equity Method - Other | ( | ( | ( | ||||||||||||||
| Other Investments | ( | ( | |||||||||||||||
| Total Asset Management | $ | ( | $ | ( | $ | ( | |||||||||||
| Insurance | |||||||||||||||||
| Mortgage and other loan receivables | $ | $ | ( | $ | ( | ||||||||||||
| Other investments | |||||||||||||||||
| Total Insurance | $ | $ | $ | ||||||||||||||
| Total Assets | $ | ( | $ | ( | $ | ( | |||||||||||
| Liabilities | |||||||||||||||||
| Asset Management | |||||||||||||||||
| Debt Obligations of Consolidated CFEs | $ | ( | $ | $ | |||||||||||||
| Total Asset Management | $ | ( | $ | $ | |||||||||||||
| Insurance | |||||||||||||||||
| Policy liabilities | $ | $ | $ | ||||||||||||||
| Total Insurance | $ | $ | $ | ||||||||||||||
| Total Liabilities | $ | ( | $ | $ | |||||||||||||
| For the Year Ended December 31, 2021 | |||||||||||||||||
| Net Realized Gains (Losses) | Net Unrealized Gains (Losses) | Total | |||||||||||||||
| Assets | |||||||||||||||||
| Asset Management | |||||||||||||||||
| Credit | $ | $ | $ | ||||||||||||||
| Investments of Consolidated CFEs | |||||||||||||||||
| Real Assets | ( | ||||||||||||||||
| Equity Method - Other | ( | ||||||||||||||||
| Other Investments | |||||||||||||||||
| Total Asset Management | $ | $ | $ | ||||||||||||||
| Insurance | |||||||||||||||||
| Mortgage and other loan receivables | $ | $ | ( | $ | ( | ||||||||||||
| Other investments | |||||||||||||||||
| Total Insurance | $ | $ | $ | ||||||||||||||
| Total Assets | $ | $ | $ | ||||||||||||||
| Liabilities | |||||||||||||||||
| Asset Management | |||||||||||||||||
| Debt Obligations of Consolidated CFEs | $ | $ | ( | $ | ( | ||||||||||||
| Total Asset Management | $ | $ | ( | $ | ( | ||||||||||||
| Insurance | |||||||||||||||||
| Policy liabilities | $ | $ | $ | ||||||||||||||
| Total Insurance | $ | $ | $ | ||||||||||||||
| Total Liabilities | $ | $ | $ | ||||||||||||||
319
Notes to Financial Statements (Continued)
11. INSURANCE INTANGIBLES, UNEARNED REVENUE RESERVES AND UNEARNED FRONT-END LOADS
The following reflects the reconciliation of the components of insurance intangibles to the total balance reported in the consolidated statements of financial condition as of December 31, 2023 and 2022:
| December 31, | December 31, | ||||||||||
| 2023 | 2022 | ||||||||||
| Deferred acquisition costs | $ | $ | |||||||||
| Value of business acquired | |||||||||||
| Cost-of-reinsurance intangibles | |||||||||||
| Total insurance intangibles | $ | $ | |||||||||
Deferred acquisition costs
The following tables reflect the deferred acquisition costs roll-forward by product category for the years ended December 31, 2023, 2022 and 2021:
| Year ended December 31, 2023 | |||||||||||||||||||||||||||||
| Fixed rate annuities | Fixed indexed annuities | Interest sensitive life | Other | Total | |||||||||||||||||||||||||
| Balance, as of the beginning of the period | $ | $ | $ | $ | $ | ||||||||||||||||||||||||
| Capitalizations | |||||||||||||||||||||||||||||
| Amortization expense | ( | ( | ( | ( | ( | ||||||||||||||||||||||||
| Balance, as of the end of the period | $ | $ | $ | $ | $ | ||||||||||||||||||||||||
| Year ended December 31, 2022 | |||||||||||||||||||||||||||||
| Fixed rate annuities | Fixed indexed annuities | Interest sensitive life | Other | Total | |||||||||||||||||||||||||
| Balance, as of the beginning of the period | $ | $ | $ | $ | $ | ||||||||||||||||||||||||
| Capitalizations | |||||||||||||||||||||||||||||
| Amortization expense | ( | ( | ( | ( | ( | ||||||||||||||||||||||||
| Balance, as of the end of the period | $ | $ | $ | $ | $ | ||||||||||||||||||||||||
| Year ended December 31, 2021 | |||||||||||||||||||||||||||||
| Fixed rate annuities | Fixed indexed annuities | Interest sensitive life | Other | Total | |||||||||||||||||||||||||
| Balance, as of the beginning of the period | $ | $ | $ | $ | $ | ||||||||||||||||||||||||
| Capitalizations | |||||||||||||||||||||||||||||
| Amortization expense | ( | ( | ( | ( | ( | ||||||||||||||||||||||||
| Balance, as of the end of the period | $ | $ | $ | $ | $ | ||||||||||||||||||||||||
Value of business acquired
The following tables reflect the value of business acquired, or “VOBA” asset roll-forward by product category for the years ended December 31, 2023, 2022 and 2021:
| Year ended December 31, 2023 | |||||||||||||||||||||||||||||||||||
| Fixed rate annuities | Fixed indexed annuities | Interest sensitive life | Variable annuities | Other | Total | ||||||||||||||||||||||||||||||
| Balance, as of the beginning of the period | $ | $ | $ | $ | $ | $ | |||||||||||||||||||||||||||||
| Amortization expense | ( | ( | ( | ( | ( | ||||||||||||||||||||||||||||||
| Balance, as of the end of the period | $ | $ | $ | $ | $ | $ | |||||||||||||||||||||||||||||
320
Notes to Financial Statements (Continued)
| Year ended December 31, 2022 | |||||||||||||||||||||||||||||||||||
| Fixed rate annuities | Fixed indexed annuities | Interest sensitive life | Variable annuities | Other | Total | ||||||||||||||||||||||||||||||
| Balance, as of the beginning of the period | $ | $ | $ | $ | $ | $ | |||||||||||||||||||||||||||||
| Amortization expense | ( | ( | ( | ( | ( | ( | |||||||||||||||||||||||||||||
| Balance, as of the end of the period | $ | $ | $ | $ | $ | $ | |||||||||||||||||||||||||||||
| Year ended December 31, 2021 | |||||||||||||||||||||||||||||||||||
| Fixed rate annuities | Fixed indexed annuities | Interest sensitive life | Variable annuities | Other | Total | ||||||||||||||||||||||||||||||
| Balance, as of the beginning of the period | $ | $ | $ | $ | $ | $ | |||||||||||||||||||||||||||||
| Amortization expense | ( | ( | ( | ( | ( | ( | |||||||||||||||||||||||||||||
| Balance, as of the end of the period | $ | $ | $ | $ | $ | $ | |||||||||||||||||||||||||||||
The following tables reflect the negative value of business acquired, or “negative VOBA” liability roll-forward by product category for the years ended December 31, 2023, 2022 and 2021:
| Year ended December 31, 2023 | |||||||||||||||||||||||||||||||||||
| Fixed rate annuities | Fixed indexed annuities | Interest sensitive life | Variable annuities | Other | Total | ||||||||||||||||||||||||||||||
| Balance, as of the beginning of the period | $ | $ | $ | $ | $ | $ | |||||||||||||||||||||||||||||
| Amortization expense | ( | ( | ( | ( | ( | ( | |||||||||||||||||||||||||||||
| Balance, as of the end of the period | $ | $ | $ | $ | $ | $ | |||||||||||||||||||||||||||||
| Year ended December 31, 2022 | |||||||||||||||||||||||||||||||||||
| Fixed rate annuities | Fixed indexed annuities | Interest sensitive life | Variable annuities | Other | Total | ||||||||||||||||||||||||||||||
| Balance, as of the beginning of the period | $ | $ | $ | $ | $ | $ | |||||||||||||||||||||||||||||
| Amortization expense | ( | ( | ( | ( | ( | ( | |||||||||||||||||||||||||||||
| Balance, as of the end of the period | $ | $ | $ | $ | $ | $ | |||||||||||||||||||||||||||||
| Year ended December 31, 2021 | |||||||||||||||||||||||||||||||||||
| Fixed rate annuities | Fixed indexed annuities | Interest sensitive life | Variable annuities | Other | Total | ||||||||||||||||||||||||||||||
| Balance, as of the beginning of the period | $ | $ | $ | $ | $ | $ | |||||||||||||||||||||||||||||
| Amortization expense | ( | ( | ( | ( | ( | ( | |||||||||||||||||||||||||||||
| Balance, as of the end of the period | $ | $ | $ | $ | $ | $ | |||||||||||||||||||||||||||||
Estimated future amortization of VOBA and Negative VOBA as of December 31, 2023 is as follows:
| Years | VOBA | Negative VOBA | Total, net | ||||||||||||||
| 2024 | $ | $ | ( | $ | ( | ||||||||||||
| 2025 | ( | ( | |||||||||||||||
| 2026 | ( | ||||||||||||||||
| 2027 | ( | ||||||||||||||||
| 2028 | ( | ||||||||||||||||
| Thereafter | ( | ||||||||||||||||
| Total | $ | $ | ( | $ | |||||||||||||
321
Notes to Financial Statements (Continued)
Unearned revenue reserves and unearned front-end loads
| Years Ended December 31, | |||||||||||||||||
| 2023 | 2022 | 2021 | |||||||||||||||
| Preneed | |||||||||||||||||
Balance, as of the beginning of the period | $ | $ | $ | ||||||||||||||
| Deferral | |||||||||||||||||
| Amortized to income during the year | ( | ( | ( | ||||||||||||||
| Balance, as of the end of the period | $ | $ | $ | ||||||||||||||
Significant inputs, judgments, assumptions for DAC and related amortization amounts
Global Atlantic considers surrender rates, mortality rates, and other relevant policy decrements in determining the expected life of the contract. As a part of Global Atlantic's actual experience update for the year ended December 31, 2023, Global Atlantic updated mortality and surrender assumptions. These updates reduced the amortization rate for DAC and related amortization amounts by $4.4 million per year. For the year ended December 31, 2022, Global Atlantic observed that there was no significant change in relevant inputs, judgments, or assumptions requiring an update of the amortization rate for DAC and related amortization amounts.
322
Notes to Financial Statements (Continued)
12. REINSURANCE
Global Atlantic maintains a number of reinsurance treaties with third parties whereby Global Atlantic assumes annuity and life policies on a coinsurance, modified coinsurance or funds withheld basis. Global Atlantic also maintains other reinsurance treaties including the cession of certain annuity, life and health policies.
The effects of all reinsurance agreements on the consolidated statements of financial condition were as follows:
| December 31, 2023 | December 31, 2022 | ||||||||||
| Policy liabilities: | |||||||||||
| Direct | $ | $ | |||||||||
| Assumed | |||||||||||
| Total policy liabilities | |||||||||||
Ceded(1) | ( | ( | |||||||||
| Net policy liabilities | $ | $ | |||||||||
(1)Reported within reinsurance recoverable within the consolidated statements of financial condition.
A key credit quality indicator is a counterparty’s A.M. Best financial strength rating. A.M. Best ratings are an independent opinion of a reinsurer’s ability to meet ongoing obligations to policyholders. Global Atlantic mitigates counterparty credit risk by requiring collateral and credit enhancements in various forms including engaging in funds withheld at interest and modified coinsurance transactions. The following shows the amortized cost basis of Global Atlantic’s reinsurance recoverable and funds withheld receivable at interest by credit quality indicator and any associated credit enhancements Global Atlantic has obtained to mitigate counterparty credit risk:
| As of December 31, 2023 | As of December 31, 2022 | ||||||||||||||||||||||||||||||||||
A.M. Best Rating(1) | Reinsurance recoverable and funds withheld receivable at interest(2) | Credit enhancements(3) | Net reinsurance credit exposure(4) | Reinsurance recoverable and funds withheld receivable at interest(2) | Credit enhancements(3) | Net reinsurance credit exposure(4) | |||||||||||||||||||||||||||||
| A++ | $ | $ | $ | $ | $ | $ | |||||||||||||||||||||||||||||
| A+ | |||||||||||||||||||||||||||||||||||
| A | |||||||||||||||||||||||||||||||||||
| A- | |||||||||||||||||||||||||||||||||||
| B++ | |||||||||||||||||||||||||||||||||||
| B+ | |||||||||||||||||||||||||||||||||||
| B | |||||||||||||||||||||||||||||||||||
| B- | ( | ||||||||||||||||||||||||||||||||||
| C++/C+ | ( | ||||||||||||||||||||||||||||||||||
Not rated or private rating(5) | |||||||||||||||||||||||||||||||||||
| Total | $ | $ | $ | $ | $ | $ | |||||||||||||||||||||||||||||
(1)Ratings are periodically updated (at least annually) as A.M. Best issues new ratings.
(2)At amortized cost, excluding any associated embedded derivative assets and liabilities.
(3)Includes funds withheld payable at interest and deferred intangible reinsurance assets and liabilities.
(4)Includes credit loss allowance of $21.0 million and $41.2 million as of December 31, 2023 and 2022, respectively, held against reinsurance recoverable.
(5)Includes $30.8 billion and $19.7 billion as of December 31, 2023 and 2022, respectively, associated with cessions to co-investment vehicles (the "sponsored reinsurance sidecar vehicles") that participate in qualifying reinsurance transactions sourced by Global Atlantic.
As of December 31, 2023 and 2022, Global Atlantic had $2.7 billion and $2.9 billion of funds withheld receivable at interest, respectively, with six
323
Notes to Financial Statements (Continued)
The effects of reinsurance on the consolidated statements of operations were as follows:
| Years Ended December 31, | |||||||||||||||||
| 2023 | 2022 | 2021 | |||||||||||||||
| Net premiums: | |||||||||||||||||
| Direct | $ | $ | $ | ||||||||||||||
Assumed(1) | |||||||||||||||||
| Ceded | ( | ( | ( | ||||||||||||||
| Net premiums | $ | $ | $ | ||||||||||||||
(1)Includes related party activity of $8.7 million for the year ended December 31, 2021.
| Years Ended December 31, | |||||||||||||||||
| 2023 | 2022 | 2021 | |||||||||||||||
| Policy fees: | |||||||||||||||||
| Direct | $ | $ | $ | ||||||||||||||
Assumed(1) | |||||||||||||||||
| Ceded | ( | ( | ( | ||||||||||||||
| Net policy fees | $ | $ | $ | ||||||||||||||
(1)Includes related party activity of $6.2 million for the year ended December 31, 2021.
| Years Ended December 31, | |||||||||||||||||
| 2023 | 2022 | 2021 | |||||||||||||||
| Net policy benefits and claims: | |||||||||||||||||
| Direct | $ | $ | $ | ||||||||||||||
Assumed(1) | |||||||||||||||||
| Ceded | ( | ( | ( | ||||||||||||||
| Net policy benefits and claims | $ | $ | $ | ||||||||||||||
(1)Includes related party activity of $76.2 million for the year ended December 31, 2021.
Global Atlantic holds collateral for and provides collateral to its reinsurance clients. Global Atlantic held $36.7 billion and $26.1 billion of collateral in the form of funds withheld payable on behalf of its reinsurers as of December 31, 2023 and 2022, respectively. As of December 31, 2023 and 2022, reinsurers held collateral of $1.2 billion and $1.3 billion on behalf of Global Atlantic, respectively. A significant portion of the collateral that Global Atlantic provides to its reinsurance clients is provided in the form of assets held in a trust for the benefit of the counterparty. As of December 31, 2023 and 2022, these trusts held in excess of the $81.8 billion and $65.8 billion of assets they are required to hold in order to support reserves of $79.4 billion and $62.4 billion, respectively. Of the cash held in trust, Global Atlantic classified $90.8 million and $31.3 million as restricted as of December 31, 2023 and 2022, respectively.
324
Notes to Financial Statements (Continued)
13. NET INCOME (LOSS) ATTRIBUTABLE TO KKR & CO. INC. PER SHARE OF COMMON STOCK
For the years ended December 31, 2023, 2022 and 2021, basic and diluted Net Income (Loss) attributable to KKR & Co. Inc. per share of common stock were calculated as follows:
| Years Ended December 31, | |||||||||||||||||
| 2023 | 2022 | 2021 | |||||||||||||||
| Net Income (Loss) Available to KKR & Co. Inc. Common Stockholders - Basic | $ | $ | ( | $ | |||||||||||||
(+) Series C Mandatory Convertible Preferred Dividend (if dilutive) (1) | |||||||||||||||||
| Net Income (Loss) Available to KKR & Co. Inc. Common Stockholders - Diluted | $ | $ | ( | $ | |||||||||||||
| Basic Net Income (Loss) Per Share of Common Stock | |||||||||||||||||
| Weighted Average Shares of Common Stock Outstanding - Basic | |||||||||||||||||
| Net Income (Loss) Attributable to KKR & Co. Inc. Per Share of Common Stock - Basic | $ | $ | ( | $ | |||||||||||||
| Diluted Net Income (Loss) Per Share of Common Stock | |||||||||||||||||
| Weighted Average Shares of Common Stock Outstanding - Basic | |||||||||||||||||
| Incremental Common Shares: | |||||||||||||||||
Assumed vesting of dilutive equity awards (2) | |||||||||||||||||
Assumed conversion of Series C Mandatory Convertible Preferred Stock (1) | |||||||||||||||||
| Weighted Average Shares of Common Stock Outstanding - Diluted | |||||||||||||||||
| Net Income (Loss) Attributable to KKR & Co. Inc. Per Share of Common Stock - Diluted | $ | $ | ( | $ | |||||||||||||
(1)For the years ended December 31, 2023 and 2021, the impact of Series C Mandatory Convertible Preferred Stock calculated under the if-converted method was dilutive, and as such (i) shares of common stock (assuming a conversion ratio based on the average volume weighted average price per share of common stock over each reporting period) were included in the Weighted Average Shares of Common Stock Outstanding - Diluted and (ii) Series C Mandatory Convertible Preferred dividends were added back to Net Income (Loss) Available to KKR & Co. Inc. Common Stockholders - Diluted. For the year ended December 31, 2022, the impact of Series C Mandatory Convertible Preferred Stock is excluded from the calculation of Diluted Net Income (Loss) Attributable to KKR & Co. Inc. Per Share of Common Stock because inclusion of such shares would be anti-dilutive having the effect of decreasing the loss per share of common stock.
325
Notes to Financial Statements (Continued)
Exchangeable Securities
For the years ended December 31, 2023, 2022, and 2021 KKR Holdings Units and vested restricted holdings units (as defined in Note 19 "Equity Based Compensation") have been excluded from the calculation of Net Income (Loss) Attributable to KKR & Co. Inc. Per Share of Common Stock - Diluted since the exchange of these units would not dilute KKR & Co. Inc.'s ownership interests in KKR Group Partnership. Since May 31, 2022, there are no outstanding KKR Holdings Units. See Note 1 "Organization" in our financial statements.
| Years Ended December 31, | |||||||||||||||||
| 2023 | 2022 | 2021 | |||||||||||||||
| Weighted Average KKR Holdings Units | |||||||||||||||||
| Weighted Average Vested Restricted Holdings Units | |||||||||||||||||
| Total | |||||||||||||||||
Market Condition Awards
For the years ended December 31, 2023, 2022, and 2021 25.7 million, 17.5 million, and 9.1 million, respectively, of unvested equity awards that are subject to market price based and service-based vesting conditions were excluded from the calculation of Net Income (Loss) Attributable to KKR & Co. Inc. Per Share of Common Stock - Diluted since the market price based vesting condition was not satisfied. See Note 19 "Equity Based Compensation" in our financial statements.
326
Notes to Financial Statements (Continued)
14. OTHER ASSETS AND ACCRUED EXPENSES AND OTHER LIABILITIES
Other Assets consist of the following:
| December 31, 2023 | December 31, 2022 | ||||||||||
| Asset Management | |||||||||||
Unsettled Investment Sales (1) | $ | $ | |||||||||
| Receivables | |||||||||||
Due from Broker (2) | |||||||||||
| Deferred Tax Assets, net (See Note 18) | |||||||||||
| Interest Receivable | |||||||||||
Fixed Assets, net (3) | |||||||||||
Foreign Exchange Contracts and Options (4) | |||||||||||
Goodwill (5) | |||||||||||
Intangible Assets (6) | |||||||||||
| Derivative Assets | |||||||||||
| Prepaid Taxes | |||||||||||
| Prepaid Expenses | |||||||||||
| Deferred Financing Costs | |||||||||||
| Other | |||||||||||
| Total Asset Management | $ | $ | |||||||||
| Insurance | |||||||||||
Unsettled Investment Sales(1) and Derivative Collateral Receivables | $ | $ | |||||||||
| Deferred Tax Assets, net | |||||||||||
| Derivative Assets | |||||||||||
| Accrued Investment Income | |||||||||||
| Goodwill | |||||||||||
Intangible Assets and Deferred Sales Inducements(8) | |||||||||||
| Premiums and Other Account Receivables | |||||||||||
| Other | |||||||||||
| Prepaid Taxes | |||||||||||
| Market Risk Benefit Asset | |||||||||||
| Total Insurance | $ | $ | |||||||||
| Total Other Assets | $ | $ | |||||||||
(1)Represents amounts due from third parties for investments sold for which cash settlement has not occurred.
(2)Represents amounts held at clearing brokers resulting from securities transactions.
(3)Net of accumulated depreciation and amortization of $257.4 million and $188.8 million as of December 31, 2023 and December 31, 2022, respectively. Depreciation and amortization expense of $68.4 million, $54.6 million, and $46.5 million for the years ended December 31, 2023, 2022, and 2021, respectively, are included in General, Administrative and Other in the accompanying consolidated statements of operations. Additionally, KKR’s fixed assets are predominantly located in the United States.
(4)Represents derivative financial instruments used to manage foreign exchange risk arising from certain foreign currency denominated investments. Such instruments are measured at fair value with changes in fair value recorded in Net Gains (Losses) from Investment Activities in the accompanying consolidated statements of operations. See Note 4 "Net Gains (Losses) from Investment Activities - Asset Management" in our financial statements for the net changes in fair value associated with these instruments.
(5)As of December 31, 2023, the carrying value of goodwill is recorded and assessed for impairment at the reporting unit. As of December 31, 2023, there are approximately $(34.2 ) million of cumulative foreign currency translation adjustments included in AOCI related to the goodwill recorded as result of the acquisition of KJRM.
(6)As of December 31, 2023, there are approximately $(116.8 ) million of cumulative foreign currency translation adjustments included in AOCI related to the intangible assets recorded as result of the acquisition of KJRM.
(7)For Asset Management, non-cancelable operating leases consist of leases for office space in North America, Europe, Asia and Australia. KKR is the lessee under the terms of the operating leases. The operating lease cost was $67.8 million, $54.2 million, and $49.0 million for the years ended December 31, 2023, 2022, and 2021, respectively. For Insurance, non-cancelable operating leases consist of leases for office space and land in the U.S. For the years ended December 31, 2023, 2022 and 2021, the operating lease cost was $21.9 million, $25.0 million and $14.6 million, respectively. Insurance lease right-of-use assets are reported net of $20.6 million and $21.8 million in deferred rent and lease incentives as of December 31, 2023 and 2022, respectively.
327
Notes to Financial Statements (Continued)
(8)The definite life intangible assets are amortized using the straight-line method over the useful life of the assets which is an average of 14 years. The indefinite life intangible assets are not subject to amortization. The amortization expense of definite life intangible assets was $17.6 million, $17.6 million and $16.2 million for the years ended December 31, 2023, 2022, and 2021, respectively.
Accrued Expenses and Other Liabilities consist of the following:
| December 31, 2023 | December 31, 2022 | ||||||||||
| Asset Management | |||||||||||
Amounts Payable to Carry Pool (1) | $ | $ | |||||||||
Unsettled Investment Purchases (2) | |||||||||||
Securities Sold Short (3) | |||||||||||
| Derivative Liabilities | |||||||||||
| Accrued Compensation and Benefits | |||||||||||
| Interest Payable | |||||||||||
Foreign Exchange Contracts and Options (4) | |||||||||||
| Accounts Payable and Accrued Expenses | |||||||||||
| Taxes Payable | |||||||||||
| Uncertain Tax Positions | |||||||||||
| Unfunded Revolver Commitments | |||||||||||
| Deferred Tax Liabilities, net (See Note 18) | |||||||||||
| Other Liabilities | |||||||||||
| Total Asset Management | $ | $ | |||||||||
| Insurance | |||||||||||
Unsettled Investment Purchases(2) and Derivative Collateral Liabilities | $ | $ | |||||||||
| Accrued Expenses | |||||||||||
| Insurance Operations Balances in Course of Settlement | |||||||||||
| Securities Sold Under Agreements to Repurchase | |||||||||||
| Derivative Liabilities | |||||||||||
| Accrued Employee Related Expenses | |||||||||||
| Tax Payable to Former Parent Company | |||||||||||
| Interest Payable | |||||||||||
| Accounts and Commissions Payable | |||||||||||
| Other Tax Related Liabilities | |||||||||||
| Total Insurance | $ | $ | |||||||||
| Total Accrued Expenses and Other Liabilities | $ | $ | |||||||||
(1)Represents the amount of carried interest payable to current and former KKR employees arising from KKR's investment funds and co-investment vehicles that provide for carried interest.
(2)Represents amounts owed to third parties for investment purchases for which cash settlement has not occurred.
(3)Represents the obligations of KKR to deliver a specified security at a future point in time. Such securities are measured at fair value with changes in fair value recorded in Net Gains (Losses) from Investment Activities in the accompanying consolidated statements of operations. See Note 4 "Net Gains (Losses) from Investment Activities - Asset Management" in our financial statements for the net changes in fair value associated with these instruments.
(4)Represents derivative financial instruments used to manage foreign exchange risk arising from certain foreign currency denominated investments. Such instruments are measured at fair value with changes in fair value recorded in Net Gains (Losses) from Investment Activities in the accompanying consolidated statements of operations. See Note 4 "Net Gains (Losses) from Investment Activities - Asset Management" in our financial statements for the net changes in fair value associated with these instruments.
(5)For Asset Management, operating leases for office space have remaining lease terms that range from approximately 1 year to 17 years, some of which include options to extend the leases from 5 years to 10 years. The weighted average remaining lease terms were 10.3 years and 10.4 years as of December 31, 2023 and December 31, 2022, respectively. The weighted average discount rates were 2.9 % and 2.5 % as of December 31, 2023 and December 31, 2022, respectively. For Insurance, operating leases for office space have remaining lease terms that range from approximately 1 year to 11 years, some of which include options to extend the leases for up to 10 years. The weighted average remaining lease terms were 7.6 years and 7.0 years as of December 31, 2023 and 2022, respectively. The weighted average discount rates were 4.4 % and 3.6 % as of December 31, 2023 and 2022, respectively. The weighted average remaining lease terms for land were 43.7 years and 26.9 years as of December 31, 2023 and 2022, respectively.
328
Notes to Financial Statements (Continued)
15. VARIABLE INTEREST ENTITIES
Consolidated VIEs
KKR consolidates certain VIEs in which it is determined that KKR is the primary beneficiary. The consolidated VIEs are predominately CLOs and certain investment funds sponsored by KKR. The primary purpose of these VIEs is to provide strategy specific investment opportunities to earn investment gains, current income or both in exchange for management fees and performance income. KKR's investment strategies differ for these VIEs; however, the fundamental risks have similar characteristics, including loss of invested capital and loss of management fees and performance income. KKR does not provide performance guarantees and has no other financial obligation to provide funding to these consolidated VIEs, beyond amounts previously committed, if any. Furthermore, KKR consolidates certain VIEs that are formed by Global Atlantic to hold investments, including investments in transportation, renewable energy, consumer and other loans and fixed maturity securities.
Unconsolidated VIEs
KKR holds variable interests in certain VIEs which are not consolidated as it has been determined that KKR is not the primary beneficiary. VIEs that are not consolidated predominantly include certain investment funds sponsored by KKR as well as certain investment partnerships where Global Atlantic retains an economic interest. KKR's investment strategies differ by investment fund; however, the fundamental risks have similar characteristics, including loss of invested capital and loss of management fees and performance income. KKR's maximum exposure to loss as a result of its investments in the unconsolidated investment funds is the carrying value of such investments, including KKR's capital interest and any unrealized carried interest. Accordingly, disaggregation of KKR's involvement by type of unconsolidated investment fund would not provide more useful information. For these unconsolidated investment funds in which KKR is the sponsor, KKR may have an obligation as general partner to provide commitments to such investment funds. As of December 31, 2023, KKR's commitments to these unconsolidated investment funds were $2.6 billion. KKR has not provided any financial support other than its obligated amount as of December 31, 2023. Additionally, Global Atlantic also has unfunded commitments of $22.7 million in relation to other limited partnership interests as of December 31, 2023.
As of December 31, 2023 and December 31, 2022, the maximum exposure to loss, before allocations to the carry pool and noncontrolling interests, if any, for those VIEs in which KKR is determined not to be the primary beneficiary but in which it has a variable interest is as follows:
| December 31, 2023 | December 31, 2022 | ||||||||||
| Investments - Asset Management | $ | $ | |||||||||
| Due from (to) Affiliates, net - Asset Management | |||||||||||
| Maximum Exposure to Loss - Asset Management | $ | $ | |||||||||
| Other Investment Partnerships - Insurance | $ | $ | |||||||||
| Investment in Renewable Energy - Insurance | |||||||||||
| Maximum Exposure to Loss - Insurance | $ | $ | |||||||||
| Total Maximum Exposure to Loss | $ | $ | |||||||||
329
Notes to Financial Statements (Continued)
16. DEBT OBLIGATIONS
Asset Management Debt Obligations
In Asset Management, KKR enters into credit agreements and issues debt for its general operating and investment purposes. KKR consolidates and reports debt obligations of KKR Financial Holdings LLC, a KKR subsidiary ("KFN"), which are non-recourse to KKR beyond the assets of KFN. From time to time, KKR may provide credit support for the funding obligations of its subsidiaries.
Certain of KKR's consolidated investment funds have entered into financing arrangements with financial institutions, generally to provide liquidity to such investment funds. These financing arrangements are generally not direct obligations of the general partners of KKR's investment funds (beyond KKR's capital interest) or its management companies. Such borrowings have varying maturities and bear interest at floating rates. Borrowings are generally secured by the investment purchased with the proceeds of the borrowing and/or the uncalled capital commitment of each respective fund. When an investment vehicle borrows, the proceeds are available only for use by that investment vehicle and are not available for the benefit of other investment vehicles or KKR. Collateral within each investment vehicle is also available only against borrowings by that investment vehicle and not against the borrowings of other investment vehicles or KKR.
In certain other cases, investments and other assets held directly by majority-owned consolidated investment vehicles and other entities have been funded with borrowings that are collateralized by the investments and assets they own. These borrowings are non-recourse to KKR beyond the investments or assets serving as collateral or the capital that KKR has committed to fund such investment vehicles. Such borrowings have varying maturities and generally bear interest at fixed rates.
In addition, consolidated CFEs issue debt securities to third-party investors which are collateralized by assets held by the CFE. Debt securities issued by CFEs are supported solely by the assets held at the CFEs and are not collateralized by assets of any other KKR entity. CFEs also may have warehouse facilities with banks to provide liquidity to the CFE. The CFE's debt obligations are non-recourse to KKR beyond the assets of the CFE.
330
Notes to Financial Statements (Continued)
KKR's Asset Management debt obligations consisted of the following:
| December 31, 2023 | December 31, 2022 | |||||||||||||||||||||||||||||||||||||
| Financing Available | Borrowing Outstanding | Fair Value | Financing Available | Borrowing Outstanding | Fair Value | |||||||||||||||||||||||||||||||||
| Revolving Credit Facilities: | ||||||||||||||||||||||||||||||||||||||
| Corporate Credit Agreement | $ | $ | $ | $ | $ | $ | ||||||||||||||||||||||||||||||||
KCM Credit Agreement (1) | ||||||||||||||||||||||||||||||||||||||
| KCM 364-Day Revolving Credit Agreement | ||||||||||||||||||||||||||||||||||||||
Notes Issued: (2) | ||||||||||||||||||||||||||||||||||||||
KKR ¥ | (5) | — | — | |||||||||||||||||||||||||||||||||||
KKR ¥ | (5) | — | — | |||||||||||||||||||||||||||||||||||
KKR ¥ | (5) | — | — | |||||||||||||||||||||||||||||||||||
KKR ¥ | (5) | — | — | |||||||||||||||||||||||||||||||||||
KKR € | (5) | — | — | |||||||||||||||||||||||||||||||||||
KKR $ | (5) | — | — | |||||||||||||||||||||||||||||||||||
KKR ¥ | (5) | — | — | |||||||||||||||||||||||||||||||||||
KKR ¥ | (5) | — | — | |||||||||||||||||||||||||||||||||||
KKR $ | (5) | — | — | |||||||||||||||||||||||||||||||||||
KKR ¥ | (5) | — | — | |||||||||||||||||||||||||||||||||||
KKR ¥ | (5) | — | — | |||||||||||||||||||||||||||||||||||
KKR ¥ | (5) | — | — | |||||||||||||||||||||||||||||||||||
KKR ¥ | (5) | — | — | |||||||||||||||||||||||||||||||||||
KKR ¥ | (5) | — | — | |||||||||||||||||||||||||||||||||||
KKR ¥ | (5) | — | — | |||||||||||||||||||||||||||||||||||
KKR $ | (5) | — | — | |||||||||||||||||||||||||||||||||||
KKR ¥ | (5) | — | — | |||||||||||||||||||||||||||||||||||
KKR $ | (5) | — | — | |||||||||||||||||||||||||||||||||||
KKR $ | (5) | — | — | |||||||||||||||||||||||||||||||||||
KKR $ | (5) | — | — | |||||||||||||||||||||||||||||||||||
KKR $ | (5) | — | — | |||||||||||||||||||||||||||||||||||
KKR ¥ | (5) | — | — | |||||||||||||||||||||||||||||||||||
KKR $ | (6) | — | — | |||||||||||||||||||||||||||||||||||
KFN $ | (3) | — | — | |||||||||||||||||||||||||||||||||||
KFN $ | (3) | — | — | |||||||||||||||||||||||||||||||||||
KFN $ | (3) | — | — | |||||||||||||||||||||||||||||||||||
KFN Issued Junior Subordinated Notes (4) | (3) | — | — | |||||||||||||||||||||||||||||||||||
Other Debt Obligations(1)(7) | ||||||||||||||||||||||||||||||||||||||
| $ | $ | $ | $ | $ | $ | |||||||||||||||||||||||||||||||||
331
Notes to Financial Statements (Continued)
(1)Financing available is reduced by the dollar amounts specified in any issued letters of credit.
(2)Borrowing outstanding includes: (i) unamortized note discount (net of premium), as applicable and (ii) unamortized debt issuance costs, as applicable. Financing costs related to the issuance of the notes have been deducted from the note liability and are being amortized over the life of the notes.
| December 31, 2023 | December 31, 2022 | ||||||||||
KKR Issued | $ | $ | |||||||||
KKR Issued | |||||||||||
KKR Issued | |||||||||||
KKR Issued | |||||||||||
KKR Issued | |||||||||||
KKR Issued | |||||||||||
KKR Issued | |||||||||||
KKR Issued | |||||||||||
KKR Issued | |||||||||||
KKR Issued | |||||||||||
KKR Issued | |||||||||||
KKR Issued | |||||||||||
KKR Issued | |||||||||||
KKR Issued | |||||||||||
KKR Issued | |||||||||||
KKR Issued | |||||||||||
KKR Issued | |||||||||||
KKR Issued | |||||||||||
KKR Issued | |||||||||||
KKR Issued | |||||||||||
KKR Issued | |||||||||||
KKR Issued | |||||||||||
KKR Issued | |||||||||||
KFN Issued | |||||||||||
KFN Issued | |||||||||||
KFN Issued | |||||||||||
| $ | $ | ||||||||||
(3)These debt obligations are classified as Level III within the fair value hierarchy and valued using the same valuation methodologies as KKR's Level III credit investments.
(4)KKR consolidates KFN and reports KFN's outstanding $258.5 million aggregate principal amount of junior subordinated notes. The weighted average interest rate is 8.1 % and 6.9 % and the weighted average years to maturity is 12.8 years and 13.8 years as of December 31, 2023 and December 31, 2022, respectively.
(5)The notes are classified as Level II within the fair value hierarchy and fair value is determined by third party broker quotes.
(6)The notes are classified as Level I within the fair value hierarchy and fair value is determined by quoted prices in active markets since the debt is publicly listed.
(7)As of December 31, 2023 and December 31, 2022, the borrowing outstanding and fair value reflects the elimination for the portion of these debt obligations that are held by Global Atlantic.
(8)On March 22, 2023, the 2023 Notes matured, and KKR Group Finance Co. IV LLC repaid the principal and accrued interest in full.
KCM Short-Term Credit Agreement
On April 7, 2023, KKR Capital Markets Holdings L.P. and certain other capital markets subsidiaries (the "KCM Borrowers") replaced their existing 364-day revolving credit agreement with a new 364-day revolving credit agreement (the "KCM Short-Term Credit Agreement”) with Mizuho Bank, Ltd., as administrative agent, and one or more lenders party thereto. The KCM Short-Term Credit Agreement replaces the prior 364-day revolving credit agreement, dated as of April 8, 2022, between the KCM Borrowers and the administrative agent, and one or more lenders party to the KCM Short-Term Agreement, which was terminated according to its terms on April 7, 2023. The KCM Short-Term Credit Agreement provides for revolving borrowings up to $750 million, expires on April 5, 2024, and ranks pari passu with the existing $750 million revolving credit facility provided by them for KKR's capital markets business (the "KCM Credit Agreement").
332
Notes to Financial Statements (Continued)
If a borrowing is made under the KCM Short-Term Credit Agreement, the interest rate will vary depending on the type of drawdown requested. If the borrowing is (i) denominated in U.S. dollars and a term rate, it will be based on the term Secured Overnight Financing Rate ("SOFR"), (ii) denominated in euros, it will be based on EURIBOR and (iii) denominated in pounds sterling, it will be based on the Sterling Overnight Interbank Average Rate ("SONIA"), in each case, plus the applicable margin which ranges initially between 1.50 % and 2.75 %, depending on the duration of the loan. If the borrowing is an ABR Loan, it will be based on the greater of (i) the federal funds rate plus 0.50 % and (ii) term SOFR for one-month tenor plus 1.00 %, in each case, plus the applicable margin which ranges initially between 0.50 % and 1.75 % depending on the amount and nature of the loan. Borrowings under the KCM Short-Term Credit Agreement may only be used to facilitate the settlement of debt transactions syndicated by KKR's capital markets business. Obligations under the KCM Short-Term Credit Agreement are limited to the KCM Borrowers, which are solely entities involved in KKR's capital markets business, and liabilities under the KCM Short-Term Credit Agreement are non-recourse to other parts of KKR.
The KCM Short-Term Credit Agreement contains customary representations and warranties, events of default, and affirmative and negative covenants, including a financial covenant providing for a maximum debt to equity ratio for the KCM Borrowers. The KCM Borrowers' obligations under the KCM Short-Term Credit Agreement are secured by certain assets of the KCM Borrowers, including a pledge of equity interests of certain subsidiaries of the KCM Borrowers.
Repayment of KKR Issued 2023 Yen Senior Notes
On March 23, 2018, KKR Group Finance Co. IV LLC, an indirect subsidiary of KKR & Co. Inc., issued ¥40.3 billion aggregate principal amount of its (i) ¥25.0 billion 0.509 % Senior Notes due 2023 (the "2023 Notes"), (ii) ¥5.0 billion 0.764 % Senior Notes due 2025 (the "2025 Notes") and (iii) ¥10.3 billion 1.595 % Senior Notes due 2038 (the "2038 Notes" and, together with the 2023 Notes and the 2025 Notes, the "JPY Notes"). On March 22, 2023, the 2023 Notes matured, and KKR Group Finance Co. IV LLC repaid the principal and accrued interest in full.
KKR Issued Yen Senior Notes
On May 25, 2023, KKR Group Finance Co. XI LLC, an indirect subsidiary of KKR & Co. Inc., completed the offering of (i) ¥44.7 billion aggregate principal amount of its 1.428 % Senior Notes due May 25, 2028 (the “2028 Notes”), (ii) ¥1.8 billion aggregate principal amount of its 1.614 % Senior Notes due May 24, 2030 (the “2030 Notes”), (iii) ¥1.5 billion aggregate principal amount of its 1.939 % Senior Notes due May 25, 2033 (the “2033 Notes”), (iv) ¥3.0 billion aggregate principal amount of its 2.312 % Senior Notes due May 25, 2038 (the “2038 Notes”), (v) ¥4.5 billion aggregate principal amount of its 2.574 % Senior Notes due May 22, 2043 (the “2043 Notes”) and (vi) ¥6.0 billion aggregate principal amount of its 2.747 % Senior Notes due May 23, 2053 (the “2053 Notes” and, together with the 2028 Notes, the 2030 Notes, the 2033 Notes, the 2038 Notes and the 2043 Notes, the “Yen Notes”). The Yen Notes are guaranteed by KKR & Co. Inc. and KKR Group Partnership.
The Yen Notes bear interest at the rates, and will mature on the dates, set forth above unless earlier redeemed. Interest on the Yen Notes accrues from May 25, 2023 and is payable semi-annually in arrears on May 25 and November 25 of each year, commencing on November 25, 2023 and ending on the applicable maturity date. The Yen Notes are unsecured and unsubordinated obligations of KKR Group Finance Co. XI LLC. The Yen Notes are fully and unconditionally guaranteed, jointly and severally, by each of the guarantors. The guarantees are unsecured and unsubordinated obligations of the guarantors.
The Yen Notes were issued pursuant to an indenture, dated as of April 26, 2022, among KKR Group Finance Co. XI LLC, KKR Group Co. Inc. (formerly known as KKR & Co. Inc.), KKR Group Partnership and The Bank of New York Mellon Trust Company, N.A., as trustee. The indenture governing the Yen Notes includes covenants, including limitations on KKR Group Finance Co. XI LLC’s and the Guarantors’ ability to, subject to exceptions, incur indebtedness secured by liens on voting stock or profit participating equity interests of their subsidiaries or merge, consolidate or sell, transfer or convey all or substantially all of their assets. The indenture also provides for events of default and further provides that the trustee or the holders of not less than 25 % in aggregate principal amount of the outstanding Yen Notes may declare the Yen Notes immediately due and payable upon the occurrence and during the continuance of any event of default after expiration of any applicable grace period. In the case of specified events of bankruptcy, insolvency, receivership or reorganization, the principal amount of the Yen Notes and any accrued and unpaid interest on the Yen Notes automatically become due and payable. KKR Group Finance Co. XI LLC may redeem the Yen Notes at its option, in whole but not in part, at a redemption price equal to 100 % of the principal amount of the Yen Notes to be redeemed, together with interest accrued and unpaid to, but excluding, the date fixed for redemption, at any time, in the event of certain changes affecting taxation as provided in the indenture governing the Yen Notes. If a change of control repurchase event occurs, the Yen Notes are subject to repurchase by KKR Group Finance Co. XI LLC at a repurchase price in cash equal to 101 % of the aggregate principal amount of the Yen Notes repurchased plus any accrued and unpaid interest on the Yen Notes repurchased to, but not including, the date of repurchase.
333
Notes to Financial Statements (Continued)
Other Asset Management Debt Obligations
As of December 31, 2023, other debt obligations consisted of the following:
| Financing Available | Borrowing Outstanding | Fair Value | Weighted Average Interest Rate | Weighted Average Remaining Maturity in Years | |||||||||||||||||||||||||
Financing Facilities of Consolidated Funds and Other (1) | $ | $ | $ | ||||||||||||||||||||||||||
| Debt Obligations of Consolidated CLOs | (2) | ||||||||||||||||||||||||||||
| $ | $ | $ | |||||||||||||||||||||||||||
(1)Includes borrowings collateralized by fund investments, fund co-investments and other assets held by levered investment vehicles of $2.9 billion.
(2)The senior notes of the consolidated CLOs had a weighted average interest rate of 6.9 %. The subordinated notes of the consolidated CLOs do not have contractual interest rates but instead receive a pro rata amount of the net distributions from the excess cash flows of the respective CLO vehicle. Accordingly, weighted average borrowing rates for the subordinated notes are based on cash distributions during the period, if any.
Debt obligations of consolidated CLOs are collateralized by assets held by each respective CLO vehicle and assets of one CLO vehicle may not be used to satisfy the liabilities of another. As of December 31, 2023, the fair value of the consolidated CLO assets was $27.1 billion. This collateral consisted of Cash and Cash Equivalents, Investments, and Other Assets.
Insurance Debt Obligations
Global Atlantic's debt obligations consisted of the following:
| December 31, 2023 | December 31, 2022 | ||||||||||||||||||||||||||||||||||
| Financing Available | Borrowing Outstanding | Fair Value(2) | Financing Available | Borrowing Outstanding | Fair Value(2) | ||||||||||||||||||||||||||||||
| Revolving Credit Facilities: | |||||||||||||||||||||||||||||||||||
| Global Atlantic revolving credit facility, due August 2026 | $ | $ | $ | $ | $ | $ | |||||||||||||||||||||||||||||
| Notes Issued and Others: | |||||||||||||||||||||||||||||||||||
| Global Atlantic senior notes, due October 2029 | |||||||||||||||||||||||||||||||||||
| Global Atlantic senior notes, due June 2031 | |||||||||||||||||||||||||||||||||||
| Global Atlantic senior notes, due June 2033 | |||||||||||||||||||||||||||||||||||
| Global Atlantic subordinated debentures, due October 2051 | |||||||||||||||||||||||||||||||||||
| $ | $ | ||||||||||||||||||||||||||||||||||
Purchase accounting adjustments(1) | |||||||||||||||||||||||||||||||||||
| Debt issuance costs, net of accumulated amortization | ( | ( | |||||||||||||||||||||||||||||||||
| Fair value loss of hedged debt obligations, recognized in earnings | ( | ( | |||||||||||||||||||||||||||||||||
| $ | $ | ||||||||||||||||||||||||||||||||||
(1)The amortization of the purchase accounting adjustments was $3.1 million, $7.8 million and $4.9 million for the years ended December 31, 2023, 2022 and 2021, respectively.
(2)These debt obligations are classified as Level III within the fair value hierarchy and valued using the same valuation methodologies as KKR's Level III credit investments.
Global Atlantic Credit Agreement
Global Atlantic (Fin) Company ("GA FinCo") and Global Atlantic Limited (Delaware) (formerly known as Global Atlantic Financial Limited, "GALD") are both wholly-owned indirect subsidiaries of TGAFG, the holding company for the Global Atlantic business.
On August 4, 2021, GA FinCo, as borrower, and GALD, as guarantor, entered into a Credit Agreement (the "GA Credit Agreement") with Wells Fargo Bank, N.A., as administrative agent, and other lenders thereto. The GA Credit Agreement provides for up to $1.0 billion of revolving borrowings (with the option to request an increase of up to an additional $250 million), including up to $500 million of letters of credit, and has a maturity of August 2026.
On September 23, 2022, GA FinCo amended the GA Credit Agreement with Wells Fargo Bank, N.A., as administrative agent, and other lenders thereto. The principal amendments made were to replace LIBOR based interest rates with interest rates
334
Notes to Financial Statements (Continued)
based on term SOFR with certain rate adjustments. Beginning on September 30, 2022, interest on any funded balances will accrue at term SOFR plus a spread ranging from 1.225 % to 2.100 %.
As of December 31, 2023, there was $200 million in revolving borrowings outstanding and no letters of credit outstanding under the GA Credit Agreement.
Global Atlantic Senior Notes due 2033
In June 2023, Global Atlantic (Fin) Company, or “GA FinCo,” a Delaware corporation and an indirect subsidiary of TGAFG, issued $650 million aggregate principal amount of 7.950 % senior unsecured notes due 2033 (the “GA 2033 Senior Notes”). This included $500 million issued on June 15, 2023, and a subsequent reopening of $150 million issued on June 21, 2023. The proceeds of the 2033 Senior Notes were used, in part, to repay outstanding indebtedness under Global Atlantic's revolving credit facility. Remaining proceeds are intended to be used for Global Atlantic's general corporate purposes. The GA 2033 Senior Notes were issued pursuant to an indenture, dated as of October 7, 2019, among GA FinCo, as issuer, GALD, as guarantor, and U.S. Bank National Association, as trustee, and supplemented by the Third and Fourth Supplemental Indentures, dated as of June 15, 2023 and June 21, 2023, respectively, among GA FinCo, GALD and the trustee. The GA 2033 Senior Notes are fully and unconditionally guaranteed on a senior unsecured basis by GALD.
The GA 2033 Senior Notes bear interest at a rate of 7.950 % per year. Interest on the GA 2033 Senior Notes is payable semi-annually in arrears on June 15 and December 15 of each year, beginning on December 15, 2023. The GA 2033 Senior Notes will mature on June 15, 2033. GA FinCo may, at its option, redeem some or all of the GA 2033 Senior Notes at any time: (i) prior to March 15, 2033 at a redemption price equal to 100 % of the principal amount of the GA 2033 Senior Notes to be redeemed plus a “make-whole” premium and accrued and unpaid interest, if any, to the date of redemption; and (ii) on or after March 15, 2033 at a redemption price equal to 100 % of the principal amount of the GA 2033 Senior Notes to be redeemed, plus accrued and unpaid interest to the date of redemption.
Debt Covenants
Borrowings of KKR (including Global Atlantic) contain various debt covenants. These covenants do not, in management's opinion, materially restrict KKR's operating business or investment strategies as of December 31, 2023. KKR (including Global Atlantic) was in compliance with such debt covenants in all material respects as of December 31, 2023.
| Scheduled principal payments for Asset Management debt obligations at December 31, 2023 are as follows: | |||||||||||||||||||||||
Revolving Credit Facilities | Notes Issued | Other Debt Obligations | Total | ||||||||||||||||||||
| 2024 | |||||||||||||||||||||||
| 2025 | |||||||||||||||||||||||
| 2026 | |||||||||||||||||||||||
| 2027 | |||||||||||||||||||||||
| 2028 | |||||||||||||||||||||||
| Thereafter | |||||||||||||||||||||||
| $ | $ | $ | $ | ||||||||||||||||||||
| Scheduled principal payments for Insurance debt obligations at December 31, 2023 are as follows: | |||||||||||||||||||||||
Revolving Credit Facilities | Notes Issued | Other Debt Obligations | Total | ||||||||||||||||||||
| 2024 | $ | $ | $ | $ | |||||||||||||||||||
| 2025 | |||||||||||||||||||||||
| 2026 | |||||||||||||||||||||||
| 2027 | |||||||||||||||||||||||
| 2028 | |||||||||||||||||||||||
| Thereafter | |||||||||||||||||||||||
| $ | $ | $ | $ | ||||||||||||||||||||
335
Notes to Financial Statements (Continued)
17. POLICY LIABILITIES
The following reflects the reconciliation of the components of policy liabilities to the total balance reported in the consolidated statements of financial condition as of December 31, 2023 and 2022:
| December 31, 2023 | December 31, 2022 | ||||||||||
| Policyholders’ account balances | $ | $ | |||||||||
| Liability for future policy benefits | |||||||||||
| Additional liability for annuitization, death, or other insurance benefits | |||||||||||
| Market risk benefit liability | |||||||||||
Other policy-related liabilities(1) | |||||||||||
| Total policy liabilities | $ | $ | |||||||||
(1)Other policy-related liabilities as of December 31, 2023 and 2022 primarily consist of negative VOBA ($867.9 million and $1.0 billion, respectively), policy liabilities accounted under a fair value option ($1.2 billion and $1.3 billion, respectively), embedded derivatives associated with contractholder deposit funds ($4.0 billion and $2.2 billion, respectively), cost-of-reinsurance liabilities ($1.8 billion and $108.4 million, respectively) and outstanding claims ($235.1 million and $253.7 million, respectively).
Policyholders’ account balances
The following reflects the policyholders’ account balances roll-forward for the years ended December 31, 2023 and 2022, and the policyholders’ account balances weighted average interest rates, net amount at risk, and cash surrender value as of those dates:
| Year ended December 31, 2023 | |||||||||||||||||||||||||||||||||||
| Fixed rate annuities | Fixed indexed annuities | Interest sensitive life | Funding agreements | Other(1) | Total | ||||||||||||||||||||||||||||||
| Balance as of beginning of period | $ | $ | $ | $ | $ | $ | |||||||||||||||||||||||||||||
| Issuances and premiums received | |||||||||||||||||||||||||||||||||||
| Benefit payments, surrenders, and withdrawals | ( | ( | ( | ( | ( | ( | |||||||||||||||||||||||||||||
Interest(2) | |||||||||||||||||||||||||||||||||||
Other activity(3) | ( | ( | ( | ( | |||||||||||||||||||||||||||||||
| Balance as of end of period | $ | $ | $ | $ | $ | $ | |||||||||||||||||||||||||||||
| Less: reinsurance recoverable | ( | ( | ( | ( | ( | ||||||||||||||||||||||||||||||
| Balance as of end of period, net of reinsurance recoverable | $ | $ | $ | $ | $ | $ | |||||||||||||||||||||||||||||
| Average interest rate | % | % | % | % | % | % | |||||||||||||||||||||||||||||
Net amount at risk, gross of reinsurance(4) | $ | $ | $ | $ | $ | $ | |||||||||||||||||||||||||||||
Cash surrender value(5) | $ | $ | $ | $ | $ | $ | |||||||||||||||||||||||||||||
(1)“Other” consists of activity related to payout annuities (without life contingencies), preneed, variable annuities and life products.
(2)Interest includes interest credited to policyholders’ account values, and interest accreted in other components of the policyholder account balance, including investment-type contract values, host amounts for contractholder deposits with embedded derivatives, funding agreements and other associated reserves.
(3) “Other activity” includes policy charges, fees and commissions, transfers, assumption changes, fair value changes and the impact of hedge fair value adjustments.
(4)Net amount at risk represents the difference between the face value of the insurance policy and the reserve accumulated under that same policy.
(5)Cash surrender values are reported net of any applicable surrender charges, net of reinsurance.
336
Notes to Financial Statements (Continued)
| Year ended December 31, 2022 | |||||||||||||||||||||||||||||||||||
| Fixed rate annuities | Fixed indexed annuities | Interest sensitive life | Funding agreements | Other(1) | Total | ||||||||||||||||||||||||||||||
| Balance as of beginning of period | $ | $ | $ | $ | $ | $ | |||||||||||||||||||||||||||||
| Issuances and premiums received | |||||||||||||||||||||||||||||||||||
| Benefit payments, surrenders, and withdrawals | ( | ( | ( | ( | ( | ( | |||||||||||||||||||||||||||||
Interest(2) | |||||||||||||||||||||||||||||||||||
Other activity(3) | ( | ( | ( | ( | ( | ( | |||||||||||||||||||||||||||||
| Balance as of end of period | $ | $ | $ | $ | $ | $ | |||||||||||||||||||||||||||||
| Less: reinsurance recoverable | ( | ( | ( | ( | ( | ||||||||||||||||||||||||||||||
| Balance as of end of period, net of reinsurance recoverable | $ | $ | $ | $ | $ | $ | |||||||||||||||||||||||||||||
| Average interest rate | % | % | % | % | % | % | |||||||||||||||||||||||||||||
Net amount at risk, gross of reinsurance(4) | $ | $ | $ | $ | $ | $ | |||||||||||||||||||||||||||||
Cash surrender value(5) | $ | $ | $ | $ | $ | $ | |||||||||||||||||||||||||||||
(1)“Other” consists of activity related to payout annuities (without life contingencies), preneed, variable annuities and life products.
(2)Interest includes interest credited to policyholders’ account values, and interest accreted in other components of the policyholder account balance, including investment-type contract values, host amounts for contractholder deposits with embedded derivatives, funding agreements and other associated reserves.
(3)“Other activity” includes policy charges, fees and commissions, transfers, assumption changes, fair value changes and the impact of hedge fair value adjustments.
(4)Net amount at risk represents the difference between the face value of the insurance policy and the reserve accumulated under that same policy.
(5)Cash surrender values are reported net of any applicable surrender charges, net of reinsurance.
The following table presents the account values by range of guaranteed minimum crediting rates and the related range of difference, in basis points, between rates being credited to policyholders and the respective guaranteed minimums. Account values, as disclosed below, differ from policyholder account balances as they exclude balances associated with index credits, contractholder deposit fund host balances, funding agreements, and other associated reserves. In addition, policyholder account balances include discounts and premiums on assumed business which are not reflected in account values.
| As of December 31, 2023 | |||||||||||||||||||||||||||||||||||
| Account values with adjustable crediting rates subject to guaranteed minimums: | |||||||||||||||||||||||||||||||||||
| Range of guaranteed minimum crediting rates: | At guaranteed minimum | Greater than | Total | ||||||||||||||||||||||||||||||||
Less than | $ | $ | $ | $ | $ | $ | |||||||||||||||||||||||||||||
Greater than | |||||||||||||||||||||||||||||||||||
| Total | $ | $ | $ | $ | $ | $ | |||||||||||||||||||||||||||||
| Percentage of total | % | % | % | % | % | % | |||||||||||||||||||||||||||||
| As of December 31, 2022 | |||||||||||||||||||||||||||||||||||
| Account values with adjustable crediting rates subject to guaranteed minimums: | |||||||||||||||||||||||||||||||||||
| Range of guaranteed minimum crediting rates: | At guaranteed minimum | Greater than | Total | ||||||||||||||||||||||||||||||||
Less than | $ | $ | $ | $ | $ | $ | |||||||||||||||||||||||||||||
Greater than | |||||||||||||||||||||||||||||||||||
| Total | $ | $ | $ | $ | $ | $ | |||||||||||||||||||||||||||||
| Percentage of total | % | % | % | % | % | % | |||||||||||||||||||||||||||||
337
Notes to Financial Statements (Continued)
Liability for future policy benefits
The following tables summarize the balances of, and changes in, the liability for future policy benefits for traditional and limited-payment contracts for the years ended December 31, 2023 and 2022:
| Years Ended | |||||||||||||||||||||||||||||||||||
| December 31, 2023 | December 31, 2022 | ||||||||||||||||||||||||||||||||||
Payout annuities(1) | Other(2) | Total | Payout annuities(1) | Other(2) | Total | ||||||||||||||||||||||||||||||
| Present value of expected net premiums | |||||||||||||||||||||||||||||||||||
| Balance as of beginning of the period | $ | $ | ( | $ | ( | $ | $ | ( | $ | ( | |||||||||||||||||||||||||
| Balance at original discount rate | $ | $ | ( | $ | ( | $ | $ | ( | $ | ( | |||||||||||||||||||||||||
| Effect of changes in cash flow assumptions | |||||||||||||||||||||||||||||||||||
| Effect of actual variances from expected experience | ( | ( | ( | ( | |||||||||||||||||||||||||||||||
| Adjusted beginning of period balance | ( | ( | ( | ( | |||||||||||||||||||||||||||||||
| Interest | ( | ( | ( | ( | |||||||||||||||||||||||||||||||
| Net premiums collected | |||||||||||||||||||||||||||||||||||
| Ending balance at original discount rate | ( | ( | ( | ( | |||||||||||||||||||||||||||||||
| Effect of changes in discount rate assumptions | |||||||||||||||||||||||||||||||||||
| Balance as of the end of the period | $ | $ | ( | $ | ( | $ | $ | ( | $ | ( | |||||||||||||||||||||||||
| Present value of expected future policy benefits | |||||||||||||||||||||||||||||||||||
| Balance as of beginning of the period | $ | $ | $ | $ | $ | $ | |||||||||||||||||||||||||||||
| Balance at original discount rate | $ | $ | $ | $ | $ | $ | |||||||||||||||||||||||||||||
| Effect of changes in cash flow assumptions | ( | ( | ( | ( | ( | ||||||||||||||||||||||||||||||
| Effect of actual variances from expected experience | ( | ( | |||||||||||||||||||||||||||||||||
| Adjusted beginning of period balance | |||||||||||||||||||||||||||||||||||
| Issuances | |||||||||||||||||||||||||||||||||||
| Interest | |||||||||||||||||||||||||||||||||||
| Benefit payments | ( | ( | ( | ( | ( | ( | |||||||||||||||||||||||||||||
| De-recognition (lapses and withdrawals) | ( | ( | |||||||||||||||||||||||||||||||||
| Ending balance at original discount rate | |||||||||||||||||||||||||||||||||||
| Effect of changes in discount rate assumptions | ( | ( | ( | ( | ( | ( | |||||||||||||||||||||||||||||
| Balance as of the end of the period | |||||||||||||||||||||||||||||||||||
| Net liability for future policy benefits | |||||||||||||||||||||||||||||||||||
Less: reinsurance recoverable(3) | ( | ( | ( | ( | ( | ||||||||||||||||||||||||||||||
| Net liability for future policy benefits, net of reinsurance recoverables | $ | $ | $ | $ | $ | $ | |||||||||||||||||||||||||||||
(1)Payout annuities generally only have a single premium received at contract inception. As a result, the liability for future policy benefits generally would not reflect a present value for future premiums for payout annuities.
(2)“Other” consists of activity related to variable annuities, traditional life insurance, preneed insurance and fixed-rate annuity products.
(3)Reinsurance recoverables associated with the liability for future policy benefits is net of the effect of changes in discount rate assumptions of $389.9 million and $(1.8 ) billion for the years ended December 31, 2023 and 2022, respectively.
338
Notes to Financial Statements (Continued)
The following table summarizes the amount of gross premiums related to traditional and limited-payment contracts recognized in the consolidated statements of operations for the years ended December 31, 2023, 2022 and 2021:
| Gross premiums | |||||||||||||||||
| Years ended December 31, | |||||||||||||||||
| 2023 | 2022 | 2021 | |||||||||||||||
| Payout annuities | $ | $ | $ | ||||||||||||||
| Other | |||||||||||||||||
| Total products | $ | $ | $ | ||||||||||||||
The following table reflects the weighted-average duration and weighted-average interest rates of the future policy benefit liability as of December 31, 2023 and 2022:
| As of December 31, 2023 | |||||||||||
| Payout annuities | Other | ||||||||||
| Weighted-average interest rates, original discount rate | % | % | |||||||||
| Weighted-average interest rates, current discount rate | % | % | |||||||||
| Weighted-average liability duration (years, current rates) | |||||||||||
| As of December 31, 2022 | |||||||||||
| Payout annuities | Other | ||||||||||
| Weighted-average interest rates, original discount rate | % | % | |||||||||
| Weighted-average interest rates, current discount rate | % | % | |||||||||
| Weighted-average liability duration (years, current rates) | |||||||||||
The following reflects the undiscounted ending balance of expected future gross premiums and expected future benefits and payments for traditional and limited-payment contracts, as of December 31, 2023 and 2022:
| As of December 31, 2023 | |||||||||||
| Payout annuities | Other | ||||||||||
| Expected future benefit payments, undiscounted | $ | $ | |||||||||
| Expected future benefit payments, discounted (original discount rate) | |||||||||||
| Expected future benefit payments, discounted (current discount rate) | |||||||||||
| Expected future gross premiums, undiscounted | |||||||||||
| Expected future gross premiums, discounted (original discount rate) | |||||||||||
| Expected future gross premiums, discounted (current discount rate) | |||||||||||
| As of December 31, 2022 | |||||||||||
| Payout annuities | Other | ||||||||||
| Expected future benefit payments, undiscounted | $ | $ | |||||||||
| Expected future benefit payments, discounted (original discount rate) | |||||||||||
| Expected future benefit payments, discounted (current discount rate) | |||||||||||
| Expected future gross premiums, undiscounted | |||||||||||
| Expected future gross premiums, discounted (original discount rate) | |||||||||||
| Expected future gross premiums, discounted (current discount rate) | |||||||||||
339
Notes to Financial Statements (Continued)
Significant inputs, judgments and assumptions used in measuring future policyholder benefits
Significant policyholder behavior and other assumption inputs to the calculation of the liability for future policy benefits include discount rates, mortality and, for life insurance, lapse rates. Global Atlantic reviews all assumptions at least annually, and more frequently if necessary. Accordingly, as part of the annual assumption review conducted during the year ended December 31, 2023, premium and lapse assumptions were revised for traditional life insurance products (included with the “Other” category), which resulted in a $4.2 million favorable impact to net income before taxes.
For the years ended December 31, 2023 and 2022, Global Atlantic recognized $(315.0 ) million and $1.4 billion, net of reinsurance, in other comprehensive income, respectively, due to changes in the future policy benefits estimate from updating discount rates. During the years ended December 31, 2023 and 2022, there were no changes to the methods used to determine the discount rates.
Additional liability for annuitization, death, or other insurance benefits
The following tables reflect the additional liability for annuitization, death, or other insurance benefits roll-forward for the years ended December 31, 2023 and 2022:
| Years ended December 31, | |||||||||||
| 2023 | 2022 | ||||||||||
| Balance as of beginning of period | $ | $ | |||||||||
| Effect of changes in cash flow assumptions | |||||||||||
| Effect of changes in experience | ( | ( | |||||||||
| Adjusted balance as of beginning of period | |||||||||||
| Issuances | |||||||||||
| Assessments | |||||||||||
| Benefits paid | ( | ( | |||||||||
| Interest | |||||||||||
| Balance as of end of period | |||||||||||
| Less: impact of unrealized investment gain and losses | |||||||||||
| Less: reinsurance recoverable, end of period | |||||||||||
| Balance, end of year, net of reinsurance recoverable and impact of unrealized investment gains and losses | $ | $ | |||||||||
The additional liability for annuitization, death, or other insurance benefits relates primarily to secondary guarantees on certain interest-sensitive life products, and preneed insurance.
The following reflects the amount of gross assessments recognized for the additional liability for annuitization, death, or other insurance benefits in the consolidated statements of operations for the years ended December 31, 2023, 2022 and 2021:
| Gross assessments | |||||||||||||||||
| Years ended December 31, | |||||||||||||||||
| 2023 | 2022 | 2021 | |||||||||||||||
| Total amount recognized within revenue in the consolidated statements of operations | $ | $ | $ | ||||||||||||||
The following reflects the weighted average duration and weighted average interest rate for the additional liability for annuitization, death, or other insurance benefits as of December 31, 2023 and 2022:
| As of | |||||||||||
| December 31, 2023 | December 31, 2022 | ||||||||||
| Weighted-average interest, current discount rate | % | % | |||||||||
| Weighted-average liability duration (years) | |||||||||||
Significant inputs, judgments and assumptions used in measuring the additional liabilities for annuitization, death, or other insurance benefits
Significant policyholder behavior assumption inputs to the calculation of the additional liability for annuitization, death, or other insurance benefits include mortality and lapse rates. Global Atlantic reviews all assumptions at least annually, and more
340
Notes to Financial Statements (Continued)
frequently if necessary. Accordingly, as part of the annual assumption review conducted during the year ended December 31, 2023, assumptions for lapse rates, investment yields, and option budget costs were updated, which resulted in a $13.8 million increase in the additional liability for annuitization, death, and other insurance benefits. During the year ended December 31, 2022, assumptions for lapse rates and investment yields were updated, which resulted in a $18.3 million increase in the liability.
Market risk benefits
The following table presents the balances of, and changes in, market risk benefits:
| Years ended | |||||||||||||||||||||||||||||||||||
| December 31, 2023 | December 31, 2022 | ||||||||||||||||||||||||||||||||||
| Fixed-indexed annuity | Variable- and other annuities | Total | Fixed-indexed annuity | Variable- and other annuities | Total | ||||||||||||||||||||||||||||||
| Balance as of beginning of period | $ | $ | $ | $ | $ | $ | |||||||||||||||||||||||||||||
| Balance as of beginning of period, before impact of changes in instrument-specific credit risk | $ | $ | $ | $ | $ | $ | |||||||||||||||||||||||||||||
| Issuances | ( | ||||||||||||||||||||||||||||||||||
| Interest | |||||||||||||||||||||||||||||||||||
| Attributed fees collected | |||||||||||||||||||||||||||||||||||
| Benefit payments | ( | ( | ( | ( | ( | ( | |||||||||||||||||||||||||||||
| Effect of changes in interest rates | ( | ( | ( | ( | ( | ||||||||||||||||||||||||||||||
| Effect of changes in equity markets | ( | ( | ( | ||||||||||||||||||||||||||||||||
| Effect of actual experience different from assumptions | ( | ( | |||||||||||||||||||||||||||||||||
| Effect of changes in other future expected assumptions | ( | ( | ( | ( | |||||||||||||||||||||||||||||||
| Balance as of end of period before impact of changes in instrument-specific credit risk | |||||||||||||||||||||||||||||||||||
| Effect of changes in instrument-specific credit risk | ( | ( | ( | ||||||||||||||||||||||||||||||||
| Balance as of end of period | |||||||||||||||||||||||||||||||||||
| Less: reinsurance recoverable as of the end of the period | ( | ( | ( | ( | |||||||||||||||||||||||||||||||
| Balance as of end of period, net of reinsurance recoverable | $ | $ | $ | $ | $ | $ | |||||||||||||||||||||||||||||
| Net amount at risk | $ | $ | $ | $ | $ | $ | |||||||||||||||||||||||||||||
| Weighted-average attained age of contract holders (years) | |||||||||||||||||||||||||||||||||||
The following reflects the reconciliation of the market risk benefits reflected in the preceding table to the amounts reported in an asset and liability position, respectively, in the consolidated statements of financial condition as of December 31, 2023 and 2022:
| As of December 31, 2023 | As of December 31, 2022 | ||||||||||||||||||||||||||||||||||
| Asset | Liability | Net | Asset | Liability | Net | ||||||||||||||||||||||||||||||
| Fixed-indexed annuities | $ | $ | $ | ( | $ | $ | $ | ( | |||||||||||||||||||||||||||
| Variable- and other annuities | ( | ( | |||||||||||||||||||||||||||||||||
| Total | $ | $ | $ | ( | $ | $ | $ | ( | |||||||||||||||||||||||||||
Significant inputs, judgments, and assumptions used in measuring market risk benefits
Significant policyholder behavior and other assumption inputs to the calculation of the market risk benefits include interest rates, instrument-specific credit risk, mortality rates, surrender rates, and utilization rates. Global Atlantic reviews all assumptions at least annually, and more frequently if evidence suggests. Accordingly, as part of the annual assumption review conducted during the year ended December 31, 2023, assumptions for fixed-indexed annuity surrender and partial withdrawals,
341
Notes to Financial Statements (Continued)
and variable annuity surrender and activations were updated, which resulted in a $37.6 million favorable impact to net income before taxes. During the year ended December 31, 2022, assumptions for fixed-indexed annuity activations, surrender rates, option budgets, and variable and other annuity rider fees and termination rates were updated, which resulted in a $102.1 million favorable impact to net income before taxes.
Separate account liabilities
Separate account assets and liabilities consist of investment accounts established and maintained by Global Atlantic for certain variable annuity and interest-sensitive life insurance contracts. Some of these contracts include minimum guarantees such as GMDBs and GMWBs that guarantee a minimum payment to the policyholder.
The assets that support these variable annuity and interest-sensitive life insurance contracts are measured at fair value and are reported as separate account assets on the consolidated statements of financial condition. An equivalent amount is reported as separate account liabilities. Market risk benefit assets and liabilities for minimum guarantees are valued and presented separately from separate account assets and separate account liabilities. For more information on market risk benefits see “—Market risk benefits” in this footnote. Policy charges assessed against the policyholders for mortality, administration and other services are included in “Policy fees” in the consolidated statements of operations.
The following table presents the balances of and changes in separate account liabilities:
| December 31, 2023 | December 31, 2022 | ||||||||||||||||||||||||||||||||||
| Variable annuities | Interest-sensitive life | Total | Variable annuities | Interest-sensitive life | Total | ||||||||||||||||||||||||||||||
| Balance as of beginning of period | $ | $ | $ | $ | $ | $ | |||||||||||||||||||||||||||||
| Premiums and deposits | |||||||||||||||||||||||||||||||||||
| Surrenders, withdrawals and benefit payments | ( | ( | ( | ( | ( | ( | |||||||||||||||||||||||||||||
| Investment performance | ( | ( | ( | ||||||||||||||||||||||||||||||||
| Other | ( | ( | ( | ( | ( | ( | |||||||||||||||||||||||||||||
| Balance as of end of period | $ | $ | $ | $ | $ | $ | |||||||||||||||||||||||||||||
Cash surrender value as of end of period(1) | $ | $ | $ | $ | $ | $ | |||||||||||||||||||||||||||||
(1)Cash surrender value attributed to the separate accounts does not reflect the impact of surrender charges; surrender charges are attributed to policyholder account balances recorded in the general account.
The following table presents the aggregate fair value of assets, by major investment asset type, supporting separate accounts:
| December 31, 2023 | December 31, 2022 | ||||||||||
| Asset type: | |||||||||||
| Managed volatility equity/fixed income blended fund | $ | $ | |||||||||
| Equity | |||||||||||
| Fixed income | |||||||||||
| Money market | |||||||||||
| Alternative | |||||||||||
| Total assets supporting separate account liabilities | $ | $ | |||||||||
342
Notes to Financial Statements (Continued)
Closed blocks
Summarized financial information of Global Atlantic’s closed blocks is as follows:
| December 31, 2023 | December 31, 2022 | ||||||||||
| Assets | |||||||||||
| Total investments | $ | $ | |||||||||
| Cash and cash equivalents | |||||||||||
| Accrued investment income | |||||||||||
| Reinsurance recoverable | |||||||||||
| Deferred income taxes | |||||||||||
| Total assets | |||||||||||
| Liabilities | |||||||||||
| Policy liabilities | |||||||||||
| Policyholder dividend obligation at fair value | |||||||||||
| Policyholder dividends payable at fair value | |||||||||||
| Total policy liabilities | |||||||||||
| Accrued expenses and other liabilities | |||||||||||
| Total liabilities | |||||||||||
| Excess of closed block liabilities over assets designated to the closed blocks and maximum future earnings to be recognized from closed block assets and liabilities | $ | $ | ( | ||||||||
| Years Ended | |||||||||||||||||
| December 31, 2023 | December 31, 2022 | December 31, 2021 | |||||||||||||||
| Revenues | |||||||||||||||||
| Premiums and other income | $ | ( | $ | ( | $ | ||||||||||||
| Net investment expense | ( | ||||||||||||||||
| Total revenues | ( | ( | |||||||||||||||
| Benefits and expenses | |||||||||||||||||
| Policy benefits and claims | ( | ( | ( | ||||||||||||||
| Other expenses | ( | ||||||||||||||||
| Total benefits and expenses | ( | ( | ( | ||||||||||||||
| Net contribution from the closed blocks | |||||||||||||||||
| Income tax (benefit) expense | ( | ||||||||||||||||
| Net (loss) income | $ | $ | ( | $ | |||||||||||||
Many expenses related to the closed block operations are charged to operations outside the closed blocks; accordingly, the contribution from the closed blocks does not represent the actual profitability of the closed block operations.
The closed blocks of business represent policies acquired through acquisition, which were valued at fair value as of the acquisition date.
343
Notes to Financial Statements (Continued)
18. INCOME TAXES
KKR & Co. Inc. is a domestic corporation for U.S. federal income tax purposes and is subject to U.S. federal, state and local income taxes at the entity level on its share of taxable income. In addition, KKR Group Partnership and certain of its subsidiaries operate as partnerships for U.S. federal tax purposes but as taxable entities for certain state, local or non-U.S. tax purposes. Moreover, certain corporate subsidiaries of KKR, including certain subsidiaries of Global Atlantic, are domestic corporations for U.S. federal income tax purposes and are subject to U.S. federal, state, and local income taxes.
Income before income taxes includes the following components:
| For the Years Ended December 31, | |||||||||||||||||
| 2023 | 2022 | 2021 | |||||||||||||||
| Income before Income Taxes: | |||||||||||||||||
| United States | $ | $ | ( | $ | |||||||||||||
| Foreign | |||||||||||||||||
| Total Income before Income Taxes | $ | $ | ( | $ | |||||||||||||
The provision (benefit) for income taxes consists of the following:
| For the Years Ended December 31, | |||||||||||||||||
| 2023 | 2022 | 2021 | |||||||||||||||
| Current | |||||||||||||||||
| Federal | $ | $ | $ | ||||||||||||||
| State and Local | |||||||||||||||||
| Foreign | |||||||||||||||||
| Subtotal | |||||||||||||||||
| Deferred | |||||||||||||||||
| Federal | ( | ||||||||||||||||
| State and Local | ( | ||||||||||||||||
| Foreign | ( | ( | |||||||||||||||
| Subtotal | ( | ||||||||||||||||
| Total Income Taxes | $ | $ | $ | ||||||||||||||
The following table reconciles the U.S. Federal Statutory Tax Rate to the Effective Income Tax Rate:
| For the Years Ended December 31, | |||||||||||||||||
| 2023 | 2022 | 2021 | |||||||||||||||
| Statutory U.S. Federal Income Tax Rate | % | % | % | ||||||||||||||
Income not attributable to KKR & Co. Inc. (1) | ( | % | ( | % | ( | % | |||||||||||
| Foreign Income Taxes | ( | % | % | % | |||||||||||||
| State and Local Income Taxes | % | ( | % | % | |||||||||||||
| Compensation Charges not attributable to KKR & Co. Inc. | % | % | % | ||||||||||||||
| Other | ( | % | % | ( | % | ||||||||||||
| Effective Income Tax Rate | % | ( | % | % | |||||||||||||
(1)Represents primarily income attributable to (i) noncontrolling interests for all periods. This item also includes investment income of certain entities and net carried interest of certain general partners of KKR investment funds that were not subject to U.S. federal income taxes prior to the conversion of KKR & Co. L.P. to KKR & Co. Inc.
344
Notes to Financial Statements (Continued)
A summary of the tax effects of the temporary differences is as follows:
| Asset Management | December 31, 2023 | December 31, 2022 | |||||||||
| Deferred Tax Assets | |||||||||||
| Fund Management Fee Credits | $ | $ | |||||||||
| Equity Based Compensation | |||||||||||
KKR Holdings Unit Exchanges (1) | |||||||||||
Depreciation and Amortization (2) | |||||||||||
| Operating Lease Liability | |||||||||||
| Other | |||||||||||
| Total Deferred Tax Assets before Valuation Allowance | |||||||||||
| Valuation Allowance | |||||||||||
| Total Deferred Tax Assets | |||||||||||
| Deferred Tax Liabilities | |||||||||||
Investment Basis Differences / Net Unrealized Gains & Losses (2)(3) | |||||||||||
Indefinite Lived Intangible Asset(4) | |||||||||||
| Operating Lease Right-of-Use Asset | |||||||||||
| Other | |||||||||||
| Total Deferred Tax Liabilities | |||||||||||
| Total Deferred Taxes, Net | $ | ( | $ | ( | |||||||
(1)In connection with exchanges of KKR Holdings units into common stock of KKR & Co. Inc., KKR records a deferred tax asset associated with an increase in KKR & Co. Inc.'s share of the tax basis of the tangible and intangible assets of KKR Group Partnership. This amount is offset by an adjustment to record amounts due to KKR Holdings and principals under the tax receivable agreement, which is included within Due to Affiliates in the consolidated statements of financial condition. The net impact of these adjustments was recorded as an adjustment to equity at the time of the exchanges.
(2)This deferred tax item includes a portion of the tax benefit KKR recognized as a result of the step-up in tax basis generated by the conversion of KKR & Co. L.P. to KKR & Co. Inc.
(3)This deferred tax item includes a portion of the tax liability KKR recognized as a result of the Reorganization Mergers. See Note 1 "Organization" in our financial statements.
(4)In connection with the acquisition of KJRM in 2022, KKR recognized a deferred tax liability resulting from the difference in the book and tax basis of the indefinite lived intangibles as of the acquisition date.
| Insurance | December 31, 2023 | December 31, 2022 | |||||||||
| Deferred Tax Assets | |||||||||||
| Insurance Reserves | $ | $ | |||||||||
| Insurance Intangibles | |||||||||||
| Net Operating Loss and Capital Loss Carryforwards | |||||||||||
| Insurance Investment Basis Differences, Including Derivatives | |||||||||||
| Other | |||||||||||
| Total Deferred Tax Assets before Valuation Allowance | |||||||||||
| Valuation Allowance | ( | ( | |||||||||
| Total Deferred Tax Assets | |||||||||||
| Deferred Tax Liabilities | |||||||||||
| Insurance Loss Reserve Adjustment | |||||||||||
| Other | |||||||||||
| Total Deferred Tax Liabilities | |||||||||||
| Total Deferred Taxes, Net | $ | $ | |||||||||
Management assesses the available positive and negative evidence to estimate whether sufficient future taxable income will be generated to permit use of the existing deferred tax assets.
345
Notes to Financial Statements (Continued)
In 2022, changes in market conditions, including rapidly rising interest rates, impacted the unrealized tax gains and losses in the available for sale securities portfolios of Global Atlantic, resulting in deferred tax assets related to net unrealized tax capital losses for which the carryforward period has not yet begun. As such, when assessing recoverability, Global Atlantic considered our ability and intent to hold the underlying securities to recovery. Based on all available evidence, Global Atlantic concluded that a valuation allowance should be established on a portion of the deferred tax assets related to unrealized tax capital losses that are not more-likely-than-not to be realized, which represents the portion of the portfolio Global Atlantic estimates it would not be able to hold to recovery. For the year ended December 31, 2023, Global Atlantic maintained $89.3 million of valuation allowance associated with the unrealized tax capital losses in the available for sale securities portfolio. The valuation allowance establishment was allocated to other comprehensive income. Based on available evidence and various assumptions as to the timing of income, KKR believes it is likely that all other deferred tax assets will be realized.
As of December 31, 2023, the Global Atlantic (Fin) Company ("GA FinCo") consolidated group has a U.S. federal net operating loss ("NOL") carryforward of $274 million; $56 million will begin to expire in 2034 and the remainder has an indefinite life. The GA FinCo consolidated group also has capital loss carryforwards of $143 million which will begin to expire in 2027. In addition, Global Atlantic Re had a federal NOL of $3.5 billion, all of which has an indefinite life.
As of December 31, 2023, KKR has accumulated undistributed earnings generated by certain foreign subsidiaries for which we have not recorded any deferred taxes with respect to outside U.S. federal income tax basis difference on these subsidiaries because of our ability and intent to reinvest such earnings indefinitely unless they can be distributed tax free. KKR will continue to evaluate its capital management plans. It is not practicable for us to determine the amount of unrecognized deferred income tax liability due to the complexity associated with the hypothetical calculation.
As a result of the Reorganization Mergers (see Note 1 "Organization" in our financial statements), KKR recorded additional deferred tax liabilities of $1,095 million with a corresponding decrease to Additional Paid-In Capital during the twelve months ended December 31, 2022.
On August 16, 2022, the Inflation Reduction Act (the “IRA”) was signed into law. The IRA enacted a new 15% corporate minimum tax ("CAMT") on the "adjusted financial statement income" of certain large corporations, which became effective on January 1, 2023. In addition, the IRA enacted a 1% excise tax on corporate stock repurchases completed after December 31, 2022. While KKR expects to have a corporate alternative minimum tax ("CAMT") liability for the year ending December 31, 2023, there is no material impact to its provision for income taxes given that any current year payments made under CAMT would be permitted to be carried forward and used as credits in future years, resulting in a deferred tax benefit. KKR will continue to review and monitor the issuance of additional guidance from the U.S. Treasury and the IRS.
Tax Contingencies
KKR files its tax returns as prescribed by the tax laws of the jurisdictions in which it operates. In the normal course of business, KKR is subject to examination by U.S. federal and certain state, local and foreign tax regulators. As of December 31, 2023, tax returns of KKR and its predecessor entities are no longer subject to examinations for years before 2017 for U.S. federal tax returns and 2012 for state and local tax returns under general statute of limitations provisions.
At December 31, 2023, 2022 and 2021, KKR's unrecognized tax benefits relating to uncertain tax positions, excluding related interest and penalties, consisted of the following:
| For the Years Ended December 31, | |||||||||||||||||
| 2023 | 2022 | 2021 | |||||||||||||||
| Unrecognized Tax Benefits, beginning of period | $ | $ | $ | ||||||||||||||
| Gross increases in tax positions in prior periods | |||||||||||||||||
| Gross decreases in tax positions in prior periods | ( | ( | ( | ||||||||||||||
| Gross increases in tax positions in current period | |||||||||||||||||
| Lapse of statute of limitations | ( | ( | ( | ||||||||||||||
| Settlements with taxing authorities | ( | ( | |||||||||||||||
| Unrecognized Tax Benefits, end of period | $ | $ | $ | ||||||||||||||
If the above tax benefits were recognized, the effective income tax rate would be reduced. KKR believes that there could be a decrease to the tax positions up to $0.3 million within 12 months of the reporting date but the impact of such decrease to the effective tax rate would not be significant.
346
Notes to Financial Statements (Continued)
KKR recognizes interest and penalties accrued related to unrecognized tax benefits as income tax expense. Related to the unrecognized tax benefits, KKR had a net decrease of accrued penalties of $1.3 million and interest of $6.7 million during 2023 and in total, as of December 31, 2023, recognized a liability for penalties of $2.0 million and interest of $5.1 million. During 2022, penalties of $2.0 million and interest of $2.0 million were accrued and in total, as of December 31, 2022, recognized a liability for penalties of $3.2 million and interest of $11.8 million. During 2021, penalties of $2.6 million and interest of $0.5 million were accrued and in total, as of December 31, 2021, recognized a liability for penalties of $5.2 million and interest of $13.8 million.
347
Notes to Financial Statements (Continued)
19. EQUITY BASED COMPENSATION
| For the Years Ended December 31, | |||||||||||||||||
| 2023 | 2022 | 2021 | |||||||||||||||
KKR Equity Incentive Plan Awards(1) | $ | $ | $ | ||||||||||||||
KKR Holdings Awards (2) | |||||||||||||||||
| Total | $ | $ | $ | ||||||||||||||
(1)For the years ended December 31, 2023, 2022 and 2021, KKR recorded equity based compensation related to our insurance business of $15.4 million, $9.0 million, and $11.7 million respectively.
(2)Represents equity-based compensation expense in connection with the allocation of units of KKR Holdings, which were not dilutive to common stockholders of KKR & Co. Inc.
Asset Management
KKR Equity Incentive Plan Awards
Under KKR's Equity Incentive Plans, KKR is permitted to grant equity awards representing ownership interests in KKR & Co. Inc. common stock. On March 29, 2019, the 2019 Equity Incentive Plan became effective. Following the effectiveness of the 2019 Equity Incentive Plan, KKR no longer makes further grants under the 2010 Equity Incentive Plan, and the 2019 Equity Incentive Plan became KKR's only plan for providing new equity-based awards by KKR & Co. Inc. Outstanding awards under the 2010 Equity Incentive Plan will remain outstanding, unchanged and subject to the terms of the 2010 Equity Incentive Plan and their respective equity award agreements, until the vesting, expiration or lapse of such awards in accordance with their terms. The total number of equity awards representing shares of common stock that may be issued under the 2019 Equity Incentive Plan is equivalent to 15 % of the aggregate number of the shares of common stock and KKR Group Partnership Units (excluding KKR Group Partnership Units held by KKR & Co. Inc. or its wholly-owned subsidiaries), subject to annual adjustment. As of December 31, 2023, 46,426,437 shares may be issued under the 2019 Equity Incentive Plan. Equity awards granted pursuant to the Equity Plans generally consist of (i) restricted stock units that convert into shares of common stock of KKR & Co. Inc. (or cash equivalent) upon vesting and (ii) restricted holdings units that are exchangeable into shares of common stock of KKR & Co. Inc. upon vesting and certain other conditions.
Service-Vesting Awards
Under the Equity Incentive Plans, KKR grants restricted stock units and restricted holdings units that are subject to service-based vesting, typically over a to -year period from the date of grant (referred to hereafter as "Service-Vesting Awards"). In certain cases, these Service-Vesting Awards may have a percentage of the award that vests immediately upon grant, and certain Service-Vesting Awards may have vesting periods longer than five years . Additionally, some but not all Service-Vesting Awards are subject to transfer restrictions and/or minimum retained ownership requirements. Generally, the transfer restriction period, if applicable, lasts for (i) one year with respect to one-half of the interests vesting on any vesting date and (ii) two years with respect to the other one-half of the interests vesting on such vesting date. While providing services to KKR, some but not all of these awards are also subject to minimum retained ownership rules requiring the award recipient to continuously hold shares of common stock equivalents equal to at least 15 % of their cumulatively vested awards that have or had the minimum retained ownership requirement. Holders of the Service-Vesting Awards do not participate in dividends until such awards have met their vesting requirements.
Expense associated with the vesting of these Service-Vesting Awards is based on the closing price of KKR & Co. Inc. common stock on the date of grant, discounted for the lack of participation rights in the expected dividends on unvested equity awards. Expense is recognized on a straight line basis over the life of the award and assumes a forfeiture rate of up to 7 % annually based upon expected turnover by class of recipient.
As of December 31, 2023, there was approximately $933.9 million of total estimated unrecognized expense related to unvested Service-Vesting Awards, which is expected to be recognized over the weighted average remaining requisite service period of 2.8 years.
348
Notes to Financial Statements (Continued)
A summary of the status of unvested Service-Vesting Awards granted under the Equity Incentive Plans from January 1, 2023 through December 31, 2023 is presented below:
Shares (1) | Weighted Average Grant Date Fair Value | ||||||||||
| Balance, January 1, 2023 | $ | ||||||||||
| Granted | |||||||||||
| Vested | ( | ||||||||||
| Forfeitures | ( | ||||||||||
| Balance, December 31, 2023 | $ | ||||||||||
(1)Unvested Service-Vesting Awards include restricted stock units granted to Global Atlantic employees.
Market Condition Awards
Under the Equity Incentive Plans, KKR also grants restricted stock units and restricted holdings units that are subject to both a service-based vesting condition and a market price based vesting condition (referred to hereafter as "Market Condition Awards") for certain employees. The following is a discussion of Market Condition Awards, excluding the Co-CEO Awards (as defined below), except where discussed below.
The number of Market Condition Awards (other than the Co-CEO awards) that will vest depend upon (i) the market price of KKR common stock reaching certain price targets that range from $45.00 to $140.00 and (ii) the employee being employed by KKR on a certain date, which typically ranges from to six years from the date of grant (with exceptions for involuntary termination without cause, death and permanent disability). The market price vesting condition is met when the average closing price of KKR common stock during 20 consecutive trading days meets or exceeds the stock price targets. Holders of the Market Condition Awards do not participate in dividends until such awards have met both their service-based and market price based vesting requirements. Additionally, these awards are subject to additional transfer restrictions and minimum retained ownership requirements after vesting.
Due to the existence of the service requirement, the vesting period for these Market Condition Awards (other than the Co-CEO awards) is explicit, and as such, compensation expense will be recognized on (i) a straight-line basis over the period from the date of grant through the date the award recipient is required to be employed by KKR and (ii) assumes a forfeiture rate of up to 7 % annually based upon expected turnover. The fair value of the awards granted are based on a Monte Carlo simulation valuation model. In addition, the grant date fair value assumes that holders of the Market Condition Awards will not participate in dividends until such awards have met all of their vesting requirements.
Below is a summary of the grant date fair value based on the Monte Carlo simulation valuation model and the significant assumptions used to estimate the grant date fair value of these Market Condition Awards:
| Weighted Average | Range | ||||||||||
| Grant Date Fair Value | $ | $ | |||||||||
| Closing KKR share price as of valuation date | $ | $ | |||||||||
| Risk Free Rate | |||||||||||
| Volatility | |||||||||||
| Dividend Yield | |||||||||||
| Expected Cost of Equity | |||||||||||
As of December 31, 2023, there was approximately $650.0 million of total estimated unrecognized expense related to these unvested Market Condition Awards, which is expected to be recognized over the weighted average remaining requisite service period of 3.6 years.
349
Notes to Financial Statements (Continued)
A summary of the status of unvested Market Condition Awards granted under the Equity Incentive Plans from January 1, 2023 through December 31, 2023 is presented below:
| Shares | Weighted Average Grant Date Fair Value | ||||||||||
| Balance, January 1, 2023 | $ | ||||||||||
| Granted | |||||||||||
| Vested | ( | ||||||||||
| Forfeitures | ( | ||||||||||
| Balance, December 31, 2023 | $ | ||||||||||
As of December 31, 2023, 18.4 million of these Market Condition awards have met their market price based vesting condition.
Co-CEO Awards
On December 9, 2021, the Board of Directors approved grants of 7.5 million restricted holdings units to each of KKR’s Co-Chief Executive Officers that are subject to both a service-based vesting condition and a market price based vesting condition (referred to hereafter as "Co-CEOs Awards"). For both Co-Chief Executive Officers, 20 95.80 , $105.80 , $115.80 , $125.80 and $135.80 . The market price based vesting condition is met when the average closing price of KKR common stock during 20 consecutive trading days meets or exceeds the stock price targets. In addition to the market price based vesting conditions, in order for the award to vest, the Co-Chief Executive Officer is required to be employed by KKR on December 31, 2026 (with exceptions for involuntary termination without cause, death and permanent disability).
These awards will be automatically canceled and forfeited upon the earlier of a Co-Chief Executive Officer’s termination of service (except for involuntary termination without cause, death or permanent disability) or the failure to meet the market price based vesting condition by December 31, 2028 (for which continued service is required if the market price vesting condition is met after December 31, 2026). Co-CEO Awards do not participate in dividends until such awards have met both their service-based and market price based vesting requirements. Additionally, these awards are subject to additional transfer restrictions and minimum retained ownership requirements after vesting.
Due to the existence of the service requirement, the vesting period for these Co-CEO Awards is explicit, and as such, compensation expense will be recognized on a straight-line basis over the period from the date of grant through December 31, 2026 given the derived service period is less than the explicit service period. The fair value of the awards granted are based on a Monte Carlo simulation valuation model. In addition, the grant date fair value assumes that these Co-CEO Awards will not participate in dividends until such awards have met all of their vesting requirements.
Below is a summary of the grant date fair value based on the Monte Carlo simulation valuation model and the significant assumptions used to estimate the grant date fair value of these Co-CEO Awards:
| Grant Date Fair Value | $ | ||||
| Closing KKR share price as of valuation date | $ | ||||
| Risk Free Rate | % | ||||
| Volatility | % | ||||
| Dividend Yield | % | ||||
| Expected Cost of Equity | % | ||||
As of December 31, 2023, there was approximately $435.1 million of total estimated unrecognized expense related to these unvested Co-CEO Awards, which is expected to be recognized ratably from January 1, 2024 to December 31, 2026. As of December 31, 2023, none of these Co-CEO awards have met their market price based vesting condition.
350
Notes to Financial Statements (Continued)
Insurance
Global Atlantic recognized $77.8 million, $72.0 million and $63.9 million for the years ended December 31, 2023, 2022 and 2021, respectively, of expense related to equity-based compensation and long-term incentive awards.
The income tax benefit recognized by Global Atlantic with respect to the equity-based compensation and long-term incentive plans for the years ended December 31, 2023, 2022 and 2021 was $17.8 million, $11.5 million and $11.0 million, respectively, and was recognized as income tax benefit in the consolidated statements of operations.
Equity Classified Awards - KKR Equity Incentive Plan Awards
On February 1, 2021, in connection with the 2021 GA Acquisition, employees of Global Atlantic were awarded restricted stock units under the 2019 Equity Incentive Plan. These awards are subject to service-based vesting conditions, and expense associated with the vesting of these awards is based on the closing price of KKR & Co. Inc. common stock on the date of grant, consistent with other awards granted under the 2019 Equity Incentive Plan as described above.
On July 1, 2021, a grant of a Market Condition Award was made under the 2019 Equity Incentive Plan. This award is subject to meeting certain market price based vesting conditions of KKR common stock but has no service vesting condition. Expense associated with the grant date fair value of this award of $10.5 million was fully recognized in the three months ended September 30, 2021.
Global Atlantic recognized $15.4 million, $9.0 million and $11.7 million for the years ended December 31, 2023, 2022 and 2021, respectively, of total equity-based compensation expense associated with these awards.
Liability Classified Awards - Book Value Awards
On February 1, 2021, Global Atlantic adopted the Global Atlantic Financial Company Book Value Award Plan ("GA Book Value Plan") to enhance the ability of Global Atlantic to attract, motivate and retain its employees and to promote the success of the Global Atlantic business.
The GA Book Value Plan authorizes the grant of cash-settled awards ("book value awards," or "BVAs") representing the right to receive one or more payments upon vesting equal to the product of an initial dollar value set by the award multiplied by a pre-determined formula as of each applicable vesting date. The predetermined formula is equal to the quotient determined by dividing the book value of one share of TGAFG on the applicable vesting date by the book value of a share on the original grant date, subject to adjustments. Book value awards generally vest in three equal, annual installments, subject to continued employment.
On February 1, 2021, under the terms of the GA Merger Agreement and in accordance with applicable plan documentation, former Global Atlantic restricted share awards that were unvested immediately prior to the closing of the 2021 GA Acquisition converted into the right to receive a number of book value awards under the GA Book Value Plan having the same value and the same vesting schedule as the former Global Atlantic restricted share awards immediately prior to the closing of the 2021 GA Acquisition.
An aggregate of 3,020,017 unvested former Global Atlantic restricted share awards having a fair value of $29.47 per share were converted to book value awards at an aggregate grant-date value of $89.0 million. On February 28, 2021, book value awards having an aggregate value of approximately $28.0 million vested as set forth in the former Global Atlantic grant agreements and resulted in a cash payment of $17.0 million to participants, net of applicable tax withholding.
Also in connection with the 2021 GA Acquisition, on February 1, 2021, Global Atlantic employees were issued a one-time grant of book value awards having an aggregate initial value of $23.0 million. These one-time book value awards vest over five (5 ) years, with the first 25 % vesting on April 1, 2023 and the remainder vesting 25 % annually on April 1 each subsequent year until fully vested, subject to continued employment. Global Atlantic is recording compensation expense over the vesting schedule of the awards, net of an estimated forfeiture rate of 4 %.
On March 1, 2021, pursuant to the GA Book Value Plan, book value awards having an aggregate initial value of approximately $32 million were granted. Such book value awards generally vest annually over three years in equal increments, subject to continued employment. Global Atlantic is recording compensation expense over the vesting schedule of the awards, net of an estimated forfeiture rate of 4 %.
351
Notes to Financial Statements (Continued)
Global Atlantic began recognizing long-term incentive expense for the book value awards described above at the grant dates, based on their initial value, net of a 4 % estimated forfeiture rate. Global Atlantic adjusts expense periodically for changes in book value until the awards are settled or forfeited. Expense recognized on forfeited awards is reversed in the period of forfeiture.
On April 1, 2023, BVAs having an aggregate value of approximately $35 million vested as set forth under the terms of the Book Value Plan agreements and resulted in a cash payment on April 3, 2023 of an aggregate $21 million to unit holders, net of applicable tax withholdings.
On February 28, 2023, BVAs having an aggregate value of approximately $24 million vested as set forth under the pre-acquisition grant agreements and resulted in a cash payment of an aggregate $14 million to participants, net of applicable tax withholdings.
The table below presents the activity related to book value awards for the year ended December 31, 2023:
| Year Ended | |||||
| December 31, 2023 | |||||
| Outstanding amount as of beginning of period | $ | ||||
| Granted | |||||
| Forfeited | ( | ||||
| Impact of change in book value on outstanding awards | |||||
| Vested and cash-settled | ( | ||||
| Outstanding amount as of end of period | $ | ||||
Global Atlantic recognized $62.3 million, $63.0 million and $52.2 million for the years ended December 31, 2023, 2022 and 2021, respectively, of compensation expense associated with these awards. As of December 31, 2023, the remaining unamortized compensation expenses of $72.1 million are expected to be recognized over a remaining average period of 1.98 years.
GA Equity Incentive Plan Awards
On June 24, 2021, Global Atlantic issued 1,000 non-voting incentive shares to a Bermuda exempted partnership owned by certain Global Atlantic employees, who are eligible to receive incentive units under Global Atlantic's Senior Management Equity Incentive Plan ("GA Equity Incentive Plan"). These incentive units represent an interest in the receipt of certain amounts based on Global Atlantic's book value, market value, and AUM, in each case as derived in part from the value of TGAFG’s fully-diluted equity shares.
On June 24, 2021, Global Atlantic granted approximately 808 incentive units under the GA Equity Incentive Plan. The book value component of the incentive units vests 20 % per year on the anniversary of the 2021 GA Acquisition Date, as long as the grantee remains then employed, and will be settled in cash. The market value and AUM components of the incentive units cliff vest upon the earlier to occur of (i) the fifth anniversary of the 2021 GA Acquisition Date, or (ii) a change of control, and will be settled in a variable number of TGAFG’s non-voting common shares. TGAFG shares issued under the AUM component of the Plan are exchangeable for shares of KKR. Except in the event of termination due to death or disability, generally, unvested market value and AUM amounts are forfeited upon a termination of employment.
The GA Equity Incentive Plan is accounted for as a hybrid compensation plan, consisting of one component most closely aligned with a profit-sharing plan under ASC 710, Compensation - General, as well as other components within scope of ASC 718, Compensation - Stock Compensation, in all cases with obligations liability-classified. Accordingly, with regard to awards within scope of ASC 710, Global Atlantic records expense based on payouts deemed to be probable and reasonably estimable based on the book value growth of Global Atlantic at the grant date and at each reporting period. For award components subject to liability-classification under ASC 718, Global Atlantic records expense, net of a 0 % estimated forfeiture rate, based on the fair value of awards granted, with periodic adjustments to expense for changes in fair value, over the requisite 5 -year service period.
The aggregate value of the GA Equity Incentive Plan awards at the initial date of grant was $197.0 million, based on the intrinsic value of the book value component ($5.0 million), as determined by applying the book value profit share percentage rate to Global Atlantic’s net book value growth at the date of grant, and the fair value of the market value and AUM components at the date of grant ($192.0 million, collectively), based on the projected growth in value of each component over the 5 -year vesting schedule and applying a forfeiture rate of 0 %. Expense is remeasured accordingly at each reporting period and adjusted as needed until the awards are forfeited or settled.
352
Notes to Financial Statements (Continued)
During the year ended December 31, 2023, 273 incentive units were granted to employees and 118 incentive units were forfeited. As of December 31, 2023 and 2022, there were approximately 1,000 and 845 incentive units outstanding under the Plan, respectively.
Global Atlantic recorded compensation expense of $37.6 million, $89.1 million and $43.3 million for the years ended December 31, 2023, 2022 and 2021, respectively, for the GA Units granted under the GA Equity Incentive Plan, with a corresponding offset to other liabilities. As of December 31, 2023, there was approximately $48.6 million of unrecognized expense related to the GA Units granted under the GA Equity Incentive Plan with a weighted average service period remaining of 2.09 years.
353
Notes to Financial Statements (Continued)
20. RELATED PARTY TRANSACTIONS
Due from Affiliates consists of:
| December 31, 2023 | December 31, 2022 | ||||||||||
| Amounts due from unconsolidated investment funds | $ | $ | |||||||||
| Amounts due from portfolio companies | |||||||||||
| Due from Affiliates | $ | $ | |||||||||
Due to Affiliates consists of:
| December 31, 2023 | December 31, 2022 | ||||||||||
Amounts due to current and former employees under the tax receivable agreement (1) | $ | $ | |||||||||
| Amounts due to unconsolidated investment funds | |||||||||||
| Due to Affiliates | $ | $ | |||||||||
(1)See Note 1 "Organization" in our financial statements.
Tax Receivable Agreement
KKR Group Co. Inc. (formerly KKR & Co. Inc.) and KKR Holdings were parties to a tax receivable agreement, which required KKR to pay to KKR Holdings or to its limited partners a portion of any cash tax savings realized by KKR resulting from their exchange of KKR Group Partnership Units for shares of common stock. In connection with the Reorganization Mergers, KKR Holdings and KKR terminated the tax receivable agreement on May 30, 2022; provided that, notwithstanding such termination of the tax receivable agreement, all obligations of KKR to make payments arising under the tax receivable agreement with respect to any exchanges completed prior to May 30, 2022 remain outstanding until fully paid.
Prior to the Reorganization Mergers, KKR was required to acquire KKR Group Partnership Units from time to time pursuant to the exchange agreement with KKR Holdings. The KKR Group Partnership made an election under Section 754 of the Code that was effective for each taxable year in which an exchange of KKR Group Partnership Units for shares of common stock occurred, which may have resulted in an increase in KKR's tax basis of the assets of KKR Group Partnership at the time of an exchange of KKR Group Partnership Units. Certain of these exchanges were expected to result in an increase in KKR's share of the tax basis of the tangible and intangible assets of the KKR Group Partnership, primarily attributable to a portion of the goodwill inherent in KKR's business that would not otherwise have been available. This increase in tax basis may have increased depreciation and amortization deductions for tax purposes and therefore reduced the amount of income tax KKR otherwise would be required to pay. This increase in tax basis may have also decreased gain (or increased loss) on future dispositions of certain capital assets to the extent tax basis is allocated to those capital assets.
The tax receivable agreement required KKR to pay to KKR Holdings, or to current and former principals who exchanged KKR Holdings Units for shares of common stock (as transferees of KKR Group Partnership Units), 85 % of the amount of cash savings, if any, in U.S. federal, state and local income tax that KKR realized as a result of the increase in tax basis described above, as well as 85 % of the amount of any such savings KKR actually realized as a result of increases in tax basis that arose due to future payments under the agreement. KKR benefited from the remaining 15 % of cash savings, if any, in income tax that it realized.
These payment obligations are obligations of KKR Group Co. Inc. (formerly KKR & Co. Inc.) and its wholly-owned subsidiary, KKR Group Holdings Corp., which are treated as corporations for U.S. tax purposes, but are not payment obligations of KKR & Co. Inc. or KKR Group Partnership L.P., and are recorded within Due to Affiliates in the accompanying consolidated statements of financial condition. Payments made under the tax receivable agreement are required to be made within 90 days of the filing of KKR's tax returns, which may result in a timing difference between the tax savings received by KKR and the cash payments made to the exchanging holders of KKR Group Partnership Units.
354
Notes to Financial Statements (Continued)
Effective July 1, 2018, we amended the tax receivable agreement to reflect the conversion of KKR & Co. L.P. to KKR Group Co. Inc. (formerly KKR & Co. Inc.) on July 1, 2018 (the "Conversion"). The amendment also provides that, in the event the maximum U.S. federal corporate income tax rate is increased to a rate higher than 21.0% within the five- year period following the Conversion, for exchanges pursuant to the exchange agreement that take place within that five-year period (other than exchanges following the death of an individual), payments of cash tax savings realized as a result of such exchanges shall be calculated by applying a U.S. federal corporate income tax rate not to exceed 21.0%. The amendment also clarified that the tax benefit payments with respect to exchanges completed at any time prior to the Conversion will be calculated without taking into account the step-up in tax basis in our underlying assets that we generated in 2018 as a result of the Conversion.
For the years ended December 31, 2023, 2022 and 2021, cash payments that have been made under the tax receivable agreement were $16.3 million, $10.3 million, and $7.2 million, respectively. KKR expects to benefit from the remaining 15 % of cash savings, if any, in income tax that they realize. As of December 31, 2023, $13.5 million of cumulative income tax savings have been realized.
Discretionary Investments
Certain of KKR's current and former employees and other qualifying personnel are permitted to invest, and have invested, their own capital in KKR's funds, in side-by-side investments with these funds and the firm, as well as in funds managed by its hedge fund partnerships. Side-by-side investments are made on the same terms and conditions as those acquired by the applicable fund or the firm, except that the side-by-side investments do not subject the investor to management fees or a carried interest. The cash contributed by these individuals aggregated $629.0 million, $714.8 million, and $685.8 million for the years ended December 31, 2023, 2022 and 2021, respectively.
Aircraft and Other Services
Certain of our senior employees own aircraft that are used for KKR's business in the ordinary course of its operations. The hourly rates that KKR pays for the use of these aircraft are based on current market rates for chartering private aircraft of the same type. KKR incurred $3.4 million, $2.9 million, and $1.7 million for the use of these aircraft for the years ended December 31, 2023, 2022 and 2021, respectively, of which substantially all was paid to entities controlled by Messrs. Kravis and Roberts, and of which substantially all was borne by KKR rather than its investment funds (which indirectly bear the cost of some of these flights at commercial airline rates).
Facilities
Messrs. Kravis and Roberts, including their estate planning trusts, whose beneficiaries include their children, and certain other senior employees who are not executive officers of KKR, are minority limited partners in a real estate partnership that owns KKR's Menlo Park location. Payments made to this partnership were $9.5 million, $8.8 million, and $8.6 million for the years ended December 31, 2023, 2022 and 2021, respectively. In November 2022, this lease was renewed for another 15 -year term.
355
Notes to Financial Statements (Continued)
21. SEGMENT REPORTING
KKR operates through two
•Asset Management - the asset management business offers a broad range of investment management services to investment funds, vehicles and accounts (including Global Atlantic) and provides capital markets services to portfolio companies and third parties. This reportable segment also reflects how its business lines operate collaboratively with predominantly a single expense pool.
•Insurance - the insurance business is operated by Global Atlantic, which is a leading U.S. retirement and life insurance company that provides a broad suite of protection, legacy and savings products and reinsurance solutions to clients across individual and institutional markets. Global Atlantic primarily generates income by earning a spread between its investment income and the cost of policyholder benefits.
KKR’s segment profitability measure used to make operating decisions and assess performance across KKR’s reportable segments is presented prior to giving effect to the allocation of income (loss) among KKR & Co. Inc. and holders of any exchangeable securities, and the consolidation of the investment funds, vehicles and accounts that KKR advises, manages or sponsors (including CFEs). KKR's segment profitability measure excludes: (i) equity-based compensation charges, (ii) amortization of acquired intangibles, (iii) strategic corporate related charges and (iv) non-recurring items, if any. Strategic corporate related items arise from corporate actions and consist primarily of (i) impairments, (ii) transaction costs from strategic acquisitions, and (iii) depreciation on real estate that KKR owns and occupies. Inter-segment transactions are not eliminated from segment results when management considers those transactions in assessing the results of the respective segments. These transactions include (i) management fees earned by KKR as the investment adviser for Global Atlantic insurance companies and (ii) interest income and expense based on lending arrangements where one or more KKR subsidiaries borrow from a Global Atlantic insurance subsidiary. Inter-segment transactions are recorded by each segment based on the definitive documents that contain arms' length terms and comply with applicable regulatory requirements. Segment operating earnings for the asset management and insurance segments is further defined as follows:
•Asset Management Segment Operating Earnings is the segment profitability measure used to make operating decisions and to assess the performance of the asset management segment and is comprised of: (i) Fee Related Earnings, (ii) Realized Performance Income, (iii) Realized Performance Income Compensation, (iv) Realized Investment Income, and (v) Realized Investment Income Compensation. Asset Management Segment Operating Earnings excludes the impact of: (i) unrealized gains (losses) on investments, (ii) unrealized carried interest, and (iii) related unrealized carried interest compensation (carry pool). Management fees earned by KKR as the adviser, manager or sponsor for its investment funds, vehicles and accounts, including its Global Atlantic insurance companies, are included in Asset Management Segment Operating Earnings.
•Insurance Segment Operating Earnings is the segment profitability measure used to make operating decisions and to assess the performance of the Insurance segment. This measure is presented before income taxes and is comprised of: (i) Net Investment Income, (ii) Net Cost of Insurance, (iii) General, Administrative, and Other Expenses, and (iv) Net Income Attributable to Noncontrolling Interests. The non-operating adjustments made to derive Insurance Segment Operating Earnings excludes the impact of: (i) investment gains (losses) which include realized gains (losses) related to asset/liability matching investments strategies and unrealized investment gains (losses) and (ii) non-operating changes in policy liabilities and derivatives which includes (a) changes in the fair value of market risk benefits and other policy liabilities measured at fair value and related benefit payments, (b) fees attributed to guaranteed benefits, (c) derivatives used to manage the risks associated with policy liabilities, and (d) losses at contract issuance on payout annuities. Insurance Segment Operating Earnings includes (i) realized gains and losses not related to asset/liability matching investments strategies and (ii) the investment management costs that are earned by KKR as the investment adviser of the Global Atlantic insurance companies.
356
Notes to Financial Statements (Continued)
Modification of Segment Information
In connection with the adoption of LDTI (see Note 2 in our financial statements), KKR reevaluated the manner in which it makes operational and resource deployment decisions and assesses the overall performance of KKR's business. As a result, KKR has modified the presentation of its segment financial information effective as of and for the year ended December 31, 2023 with retrospective application to all prior periods presented. The most significant changes are as follows:
(1)implementation of the accounting changes as a result of LDTI within KKR’s insurance segment. KKR excludes (i) changes in the fair value of market risk benefits and other policy liabilities and the associated derivatives, (ii) fees attributed to guaranteed benefits, and (iii) losses at contract issuance on payout annuities from the Insurance Segment Operating Earnings. These items are excluded from Insurance Segment Operating Earnings, because the chief operating decision-makers believe these items do not reflect the underlying performance of this business; and
(2)reporting on a pre-tax basis Insurance Segment Operating Earnings (which was previously reported on an after-tax basis).
357
Notes to Financial Statements (Continued)
Segment Presentation
The following tables set forth information regarding KKR's segment results:
| For the Years Ended December 31, | |||||||||||||||||
| 2023 | 2022 | 2021 | |||||||||||||||
| Asset Management | |||||||||||||||||
Management Fees (1) | $ | $ | $ | ||||||||||||||
| Transaction and Monitoring Fees, Net | |||||||||||||||||
| Fee Related Performance Revenues | |||||||||||||||||
| Fee Related Compensation | ( | ( | ( | ||||||||||||||
| Other Operating Expenses | ( | ( | ( | ||||||||||||||
| Fee Related Earnings | |||||||||||||||||
| Realized Performance Income | |||||||||||||||||
| Realized Performance Income Compensation | ( | ( | ( | ||||||||||||||
Realized Investment Income (2) | |||||||||||||||||
| Realized Investment Income Compensation | ( | ( | ( | ||||||||||||||
| Asset Management Segment Operating Earnings | $ | $ | $ | ||||||||||||||
| Insurance | |||||||||||||||||
Net Investment Income (1) (2) | $ | $ | $ | ||||||||||||||
| Net Cost of Insurance | ( | ( | ( | ||||||||||||||
| General, Administrative and Other | ( | ( | ( | ||||||||||||||
| Pre-tax Operating Earnings | |||||||||||||||||
| Pre-tax Operating Earnings Attributable to Noncontrolling Interests | ( | ( | ( | ||||||||||||||
| Insurance Segment Operating Earnings | $ | $ | $ | ||||||||||||||
| Total Segment Operating Earnings | $ | $ | $ | ||||||||||||||
(1) Includes intersegment management fees of $ | |||||||||||||||||
(2) Includes intersegment interest expense and income of $ | |||||||||||||||||
| As of December 31, | |||||||||||||||||
| 2023 | 2022 | ||||||||||||||||
| Segment Assets: | |||||||||||||||||
| Asset Management | $ | $ | |||||||||||||||
| Insurance | |||||||||||||||||
| Total Segment Assets | $ | $ | |||||||||||||||
| For the Years Ended December 31, | |||||||||||||||||
| Noncash expenses excluded from Segment Operating Earnings | 2023 | 2022 | 2021 | ||||||||||||||
| Equity Based Compensation and Other | |||||||||||||||||
| Asset Management | $ | $ | $ | ||||||||||||||
Insurance (1) | |||||||||||||||||
| Total Non-cash expenses | $ | $ | $ | ||||||||||||||
(1)Amounts include the portion allocable to noncontrolling interests.
358
Notes to Financial Statements (Continued)
Reconciliations of Total Segment Amounts
The following tables reconcile the Segment Revenues, Segment Operating Earnings, and Segment Assets to their equivalent GAAP measure:
| For the Years Ended December 31, | |||||||||||||||||
| 2023 | 2022 | 2021 | |||||||||||||||
| Total GAAP Revenues | $ | $ | $ | ||||||||||||||
| Impact of Consolidation and Other | |||||||||||||||||
| Asset Management Adjustments: | |||||||||||||||||
| Capital Allocation-Based Income (Loss) (GAAP) | ( | ( | |||||||||||||||
| Realized Carried Interest | |||||||||||||||||
| Realized Investment Income | |||||||||||||||||
| Capstone Fees | ( | ( | ( | ||||||||||||||
| Expense Reimbursements | ( | ( | ( | ||||||||||||||
| Insurance Adjustments: | |||||||||||||||||
| Net Premiums | ( | ( | ( | ||||||||||||||
| Policy Fees | ( | ( | ( | ||||||||||||||
| Other Income | ( | ( | ( | ||||||||||||||
(Gains) Losses from Investments(1) | |||||||||||||||||
| Non-operating Changes in Policy Liabilities and Derivatives | ( | ( | |||||||||||||||
Total Segment Revenues (2) | $ | $ | $ | ||||||||||||||
(1)Includes gains and losses on funds withheld receivables and payables embedded derivatives.
(2)Total Segment Revenues is comprised of (i) Management Fees, (ii) Transaction and Monitoring Fees, Net, (iii) Fee Related Performance Revenues, (iv) Realized Performance Income, (v) Realized Investment Income, and (vi) Net Investment Income.
| For the Years Ended December 31, | |||||||||||||||||
| 2023 | 2022 | 2021 | |||||||||||||||
| Income (Loss) Before Tax (GAAP) | $ | $ | ( | $ | |||||||||||||
| Impact of Consolidation and Other | ( | ( | ( | ||||||||||||||
| Interest Expense | |||||||||||||||||
Equity-based compensation - KKR Holdings(1) | |||||||||||||||||
| Asset Management Adjustments: | |||||||||||||||||
| Unrealized (Gains) Losses | ( | ( | |||||||||||||||
| Unrealized Carried Interest | ( | ( | |||||||||||||||
| Unrealized Carried Interest Compensation (Carry Pool) | ( | ||||||||||||||||
Strategic Corporate Related Charges(2) | |||||||||||||||||
| Equity-based compensation | |||||||||||||||||
| Equity-based compensation - Performance based | |||||||||||||||||
Insurance Adjustments:(3) | |||||||||||||||||
(Gains) Losses from Investments(3)(4) | |||||||||||||||||
Non-operating Changes in Policy Liabilities and Derivatives(3) | ( | ( | |||||||||||||||
Strategic Corporate Related Charges(3) | |||||||||||||||||
Equity-based and Other Compensation(3) | |||||||||||||||||
Amortization of Acquired Intangibles(3) | |||||||||||||||||
| Total Segment Operating Earnings | $ | $ | $ | ||||||||||||||
(1)Represents equity-based compensation expense in connection with the allocation of units of KKR Holdings, which were not dilutive to common stockholders of KKR & Co. Inc.
(2)For the year ended December 31, 2022, strategic corporate related charges include a $40.7 million realized loss from foreign exchange derivatives that were entered into in connection with the acquisition of KJRM and that were settled upon closing in the second quarter of 2022.
(3)Amounts represent the portion allocable to KKR & Co. Inc.
(4)Includes gains and losses on funds withheld receivables and payables embedded derivatives.
359
Notes to Financial Statements (Continued)
| As of | |||||||||||
| December 31, 2023 | December 31, 2022 | ||||||||||
| Total GAAP Assets | $ | $ | |||||||||
| Impact of Consolidation and Reclassifications | ( | ( | |||||||||
| Carry Pool Reclassifications | ( | ( | |||||||||
| Total Segment Assets | $ | $ | |||||||||
22. EQUITY
Stockholders' Equity
Common Stock
The common stock of KKR & Co. Inc. is entitled to vote as provided by its certificate of incorporation, Delaware General Corporation Law and the rules of the New York Stock Exchange ("NYSE"). Subject to preferences that apply to any shares of preferred stock outstanding at the time on which dividends are payable, the holders of common stock are entitled to receive dividends out of funds legally available if the Board of Directors, in its discretion, determines to declare dividends and then only at the times and in the amounts that the Board of Directors may determine. The common stock is not entitled to preemptive rights and is not subject to conversion, redemption or sinking fund provisions.
Series I Preferred Stock
Except for any distribution required by Delaware law to be made upon a dissolution event, the holders of Series I preferred stock do not have any economic rights to receive dividends. Series I preferred stock is entitled to vote on various matters that may be submitted to vote of the stockholders and the other matters as set forth in the certificate of incorporation. Upon a dissolution event, each holder of Series I preferred stock will be entitled to a payment equal to $0.01 per share of Series I preferred stock. The Series I preferred stock will be eliminated on the Sunset Date (as defined in Note 1 "Organization"), which is scheduled to occur not later than December 31, 2026.
Series C Mandatory Convertible Preferred Stock
On August 14, 2020, KKR & Co. Inc. issued 23,000,000 shares, or $1.15 billion aggregate liquidation preference, of its 6.00 % Series C Mandatory Convertible Preferred Stock (the "Series C Mandatory Convertible Preferred Stock").
On September 15, 2023, the mandatory conversion date, each share of Series C Mandatory Convertible Preferred Stock then outstanding automatically converted into 1.1700 shares of KKR & Co. Inc.'s common stock, in each case, subject to the receipt of cash in lieu of fractional shares. The number of shares of common stock issuable upon conversion was determined based on the average volume weighted average price per share of common stock over the 20 consecutive trading day period beginning on, and including, the 21 st scheduled trading day immediately prior to September 15, 2023. Upon conversion of the Series C Mandatory Convertible Preferred Stock, no outstanding shares of Series C Mandatory Convertible Preferred Stock remained issued or outstanding. Holders of record at the close of business on September 1, 2023 separately received a final quarterly cash dividend of $0.75 per share of the Series C Mandatory Convertible Preferred Stock, payable on the conversion date.
In connection with the redemption of the Series C Mandatory Convertible Preferred Stock, KKR Group Partnership's preferred units with economic terms designed to mirror those of the Series C Mandatory Convertible Preferred Stock automatically converted into KKR Group Partnership Units on a one -for-one basis relative to the number of shares of common stock issued in respect of the conversion of Series C Mandatory Convertible Preferred Stock.
360
Notes to Financial Statements (Continued)
Share Repurchase Program
Under KKR's repurchase program, shares of common stock of KKR & Co. Inc. may be repurchased from time to time in open market transactions, in privately negotiated transactions or otherwise. The timing, manner, price and amount of any repurchases will be determined by KKR in its discretion and will depend on a variety of factors, including legal requirements, price and economic and market conditions. In addition to the repurchases of common stock, the repurchase program will be used for the retirement (by cash settlement or the payment of tax withholding amounts upon net settlement) of equity awards granted pursuant to our Equity Incentive Plans representing the right to receive common stock. KKR expects that the program, which has no expiration date, will be in effect until the maximum approved dollar amount has been used. The program does not require KKR to repurchase or retire any specific number of shares of common stock or equity awards, respectively, and the program may be suspended, extended, modified or discontinued at any time. As of February 6, 2024, there was approximately $194 million remaining under the program.
The following table presents KKR & Co. Inc. common stock that has been repurchased or equity awards retired under the repurchase program:
| For the Years Ended December 31, | ||||||||||||||||||||
| 2023 | 2022 | 2021 | ||||||||||||||||||
| Shares of common stock repurchased | ||||||||||||||||||||
| Equity awards for common stock retired | ||||||||||||||||||||
Change in KKR & Co. Inc.'s Ownership Interest
Vesting of restricted holdings units results in a change in ownership in KKR Group Partnership L.P., while KKR retains a controlling interest, and is accounted for as an equity transaction between the controlling and noncontrolling interests. The impact of the vesting of restricted holdings units are included within "Change in KKR & Co. Inc.'s Ownership Interest." Additionally, in December 2023, Global Atlantic completed a $400 million equity raise. The impact of (i) the vesting of restricted holdings units and (ii) the change in ownership in Global Atlantic after the equity raise are included within "Change in KKR & Co. Inc.'s Ownership Interest."
Noncontrolling Interests
Noncontrolling interests in consolidated entities represent the non-redeemable ownership interests in KKR that are held primarily by:
(i)third party fund investors in KKR's consolidated funds and certain other entities;
(ii)third parties in KKR's Capital Markets business line;
(iii)certain current and former employees who hold exchangeable securities; and
(iv)third parties in KKR's insurance business including GA Rollover Investors, GA Co-Investors and third-party investors in Global Atlantic's consolidated renewable energy entities and certain other entities.
361
Notes to Financial Statements (Continued)
The following table presents the calculation of total noncontrolling interests:
| For the Years Ended December 31, | |||||||||||||||||
| 2023 | 2022 | 2021 | |||||||||||||||
| Beginning of Period (as previously reported for the prior period) | $ | $ | $ | ||||||||||||||
| Adoption of New Accounting Standard (See Note 2) | |||||||||||||||||
| Balance at the beginning of the period (as revised for the prior period) | |||||||||||||||||
| Net Income (Loss) Attributable to Noncontrolling Interests | |||||||||||||||||
| Other Comprehensive Income (Loss), net of tax | ( | ( | |||||||||||||||
| Change in KKR & Co. Inc.'s Ownership Interest | ( | ( | |||||||||||||||
| Equity Based Compensation (Non Cash Contribution) | |||||||||||||||||
| Capital Contributions | |||||||||||||||||
| Capital Distributions | ( | ( | ( | ||||||||||||||
| Exchange of KKR Holdings units to Common Stock | ( | ( | |||||||||||||||
Holdings Merger (1) | ( | ||||||||||||||||
Impact of Acquisition (2) | |||||||||||||||||
Changes in Consolidation (3) | ( | ( | |||||||||||||||
| Balance at the end of the period | $ | $ | $ | ||||||||||||||
(1)Refer to Note 1 "Organization" for further information on the Reorganization Mergers that closed on May 31, 2022, pursuant to which KKR acquired KKR Holdings and all of the KKR Group Partnership Units held by it, and all outstanding KKR Holdings Units were exchanged for KKR & Co. Inc. common stock.
(2)Represents other noncontrolling interests at the 2021 GA Acquisition Date.
(3)In certain instances, KKR's economic interests became insignificant and certain investment vehicles are no longer consolidated as a result of additional amounts subscribed for by third party investors.
362
Notes to Financial Statements (Continued)
23. REDEEMABLE NONCONTROLLING INTERESTS
Redeemable noncontrolling interests represent:
(i) Noncontrolling interests of certain KKR investment funds and vehicles that are subject to periodic redemption by fund investors following the expiration of a specified period of time, or may be withdrawn subject to a redemption fee during the period when capital may not be otherwise withdrawn. Consolidated fund investor's interests subject to redemption as described above are presented as Redeemable Noncontrolling Interests in the accompanying consolidated statements of financial condition and presented as Net Income (Loss) Attributable to Redeemable Noncontrolling Interests in the accompanying consolidated statements of operations. When redeemable amounts become legally payable to fund investors, they are classified as a liability and included in Accounts Payable, Accrued Expenses and Other Liabilities in the accompanying consolidated statements of financial condition.
(ii) Global Atlantic has redeemable noncontrolling interests related to renewable energy entities of approximately $47.8 million and $82.7 million as of December 31, 2023 and 2022, respectively, as determined by the hypothetical liquidation at book value ("HLBV") method. The estimated redemption value of redeemable noncontrolling interests is calculated as the discounted cash flows subsequent to the expected flip date of the respective renewable energy entity. The flip date represents the date at which the allocation of income and cash flows among the investors in the entity is adjusted, pursuant to the redeemable noncontrolling interest investors having achieved an agreed-upon return. The flip date of renewable energy partnerships determines when the redeemable noncontrolling interests are eligible to be redeemed. Eligible redemption dates range from January 1, 2028 to June 30, 2028. For the redeemable noncontrolling interests outstanding as of December 31, 2023 and 2022, the estimated redemption value that would be due at the respective redemption dates is $3.2 million and $5.3 million, respectively.
The following table presents the calculation of Redeemable Noncontrolling Interests:
| For the Years Ended December 31, | |||||||||||||||||
| 2023 | 2022 | 2021 | |||||||||||||||
| Balance at the beginning of the period | $ | $ | $ | ||||||||||||||
| Impact of Acquisition | |||||||||||||||||
| Net Income (Loss) Attributable to Redeemable Noncontrolling Interests | ( | ||||||||||||||||
| Capital Contributions | |||||||||||||||||
| Capital Distributions | ( | ( | ( | ||||||||||||||
| Changes in Consolidation | ( | ||||||||||||||||
| Balance at the end of the period | $ | $ | $ | ||||||||||||||
363
Notes to Financial Statements (Continued)
24. COMMITMENTS AND CONTINGENCIES
Funding Commitments and Others
As of December 31, 2023, KKR had unfunded commitments consisting of $7.7 billion to its investment funds and vehicles. KKR has also agreed for certain of its investment vehicles to fund or otherwise be liable for a portion of their investment losses (up to a maximum of approximately $86.1 million) and/or to provide them with liquidity upon certain termination events (the maximum amount of which is unknown until the scheduled termination date of the investment vehicle).
In addition to these uncalled commitments and funding obligations to KKR's investment funds and vehicles, KKR has entered into contractual commitments primarily with respect to underwriting transactions, debt financing, revolving credit facilities, and syndications in KKR's Capital Markets business line. As of December 31, 2023, these commitments amounted to $280.8 million. Whether these amounts are actually funded, in whole or in part, depends on the contractual terms of such commitments, including the satisfaction or waiver of any conditions to closing or funding. KKR's capital markets business has arrangements with third parties, which reduce its risk when underwriting certain debt transactions, and thus our unfunded commitments as of December 31, 2023 have been reduced to reflect the amount to be funded by such third parties. As of December 31, 2023, KKR's capital markets business line has entered into such arrangements representing a total notional amount of $4.5 billion. In the case of purchases of investments or assets in our Principal Activities business line, the amount to be funded includes amounts that are intended to be syndicated to third parties, and the actual amounts to be funded may be less.
Global Atlantic has commitments to purchase or fund investments of $4.2 billion as of December 31, 2023. These commitments include those related to mortgage loans, other lending facilities and other investments. For those commitments that represent a contractual obligation to extend credit, Global Atlantic has recorded a liability of $49.4 million for current expected credit losses as of December 31, 2023.
In addition, Global Atlantic has entered into certain forward flow agreements to purchase loans. Global Atlantic's obligations under these agreements are subject to change, curtailment, and cancellation based on various provisions including repricing mechanics, due diligence reviews, and performance or pool quality, among other factors.
As of December 31, 2023, purchase commitments under agreements with third-party administrators and other service providers were as follows:
| 2024 | $ | |||||||
| 2025 | ||||||||
| 2026 | ||||||||
| 2027 | ||||||||
| 2028 | ||||||||
| Thereafter | ||||||||
| Total | $ | |||||||
364
Notes to Financial Statements (Continued)
Non-cancelable Operating Leases
KKR's non-cancelable operating leases consist of leases of office space around the world. There are no material rent holidays, contingent rent, rent concessions or leasehold improvement incentives associated with any of these property leases. In addition to base rentals, certain lease agreements are subject to escalation provisions and rent expense is recognized on a straight‑line basis over the term of the lease agreement.
As of December 31, 2023, the approximate aggregate future lease payments required on the asset management operating leases are as follows:
| 2024 | $ | |||||||
| 2025 | ||||||||
| 2026 | ||||||||
| 2027 | ||||||||
| 2028 | ||||||||
| Thereafter | ||||||||
Total lease payments required (1) | ||||||||
| Less: Imputed Interest | ||||||||
| $ | ||||||||
(1) Lease payments required exclude approximately $456 million for leases signed, but not yet commenced. These leases related to corporate offices and will commence in 2024 with lease terms of 15 years.
Global Atlantic also enters into land leases for its consolidated investments in renewable energy.
As of December 31, 2023, the approximate aggregate future lease payments required on the Global Atlantic operating leases are as follows:
| 2024 | $ | |||||||
| 2025 | ||||||||
| 2026 | ||||||||
| 2027 | ||||||||
| 2028 | ||||||||
| Thereafter | ||||||||
| Total lease payments required | ||||||||
| Less: Imputed Interest | ||||||||
| $ | ||||||||
Contingent Repayment Guarantees
The partnership documents governing KKR's carry-paying investment funds and vehicles generally include a "clawback" provision that, if triggered, may give rise to a contingent obligation requiring the general partner to return amounts to the fund for distribution to the fund investors at the end of the life of the fund. Under a clawback obligation, upon the liquidation of a fund, the general partner is required to return, typically on an after-tax basis, previously distributed carry to the extent that, due to the diminished performance of later investments, the aggregate amount of carry distributions received by the general partner during the term of the fund exceed the amount to which the general partner was ultimately entitled, including the effects of any performance thresholds. KKR has guaranteed its general partners' clawback obligations.
365
Notes to Financial Statements (Continued)
As of December 31, 2023, approximately $546 million of carried interest was subject to this clawback obligation, assuming that all applicable carry-paying funds and their alternative investment vehicles were liquidated at their December 31, 2023 fair values. Although KKR would be required to remit the entire amount to fund investors that are entitled to receive the clawback payment, KKR would be entitled to seek reimbursement of approximately $222 million of that amount from Associates Holdings, which is not a KKR subsidiary. As of December 31, 2023, Associates Holdings had access to cash reserves sufficient to reimburse the full $222 million that would be due to KKR. If the investments in all carry-paying funds were to be liquidated at zero value, the clawback obligation would have been approximately $3.5 billion, and KKR would be entitled to seek reimbursement of approximately $1.5 billion of that amount from Associates Holdings. KKR will acquire control of Associates Holdings when a subsidiary of KKR becomes its general partner upon the closing of the transactions contemplated to occur on the Sunset Date (as defined in Note 1 "Organization"), which will occur not later than December 31, 2026.
Carried interest is recognized in the consolidated statements of operations based on the contractual conditions set forth in the agreements governing the fund as if the fund were terminated and liquidated at the reporting date and the fund's investments were realized at the then estimated fair values. Amounts earned pursuant to carried interest are earned by the general partner of those funds to the extent that cumulative investment returns are positive and where applicable, preferred return thresholds have been met. If these investment amounts earned decrease or turn negative in subsequent periods, recognized carried interest will be reversed and to the extent that the aggregate amount of carry distributions received by the general partner during the term of the fund exceed the amount to which the general partner was ultimately entitled, a clawback obligation would be recorded. For funds that are consolidated, this clawback obligation, if any, is reflected as an increase in noncontrolling interests in the consolidated statements of financial condition. For funds that are not consolidated, this clawback obligation, if any, is reflected as a reduction of KKR's investment balance as this is where carried interest is initially recorded.
Indemnifications and Other Guarantees
Asset Management Segment
KKR may incur contingent liabilities for claims that may be made against it in the future. KKR enters into contracts that contain a variety of representations, warranties and covenants, including indemnifications. KKR (including KFN) and certain of KKR's investment funds have provided and provide certain credit support, such as indemnities and guarantees, relating to a variety of matters, including non-recourse carve-out guarantees for fraud, willful misconduct and other wrongful acts in connection with the financing of (i) certain real estate investments that we have made, including KKR's corporate real estate, and (ii) certain investment vehicles that KKR manages or sponsors.
KKR also has provided, and provides, credit support in connection with the Asset Management business, including:
i.to certain of its subsidiaries' obligations in connection with a limited number of investment vehicles that KKR manages,
ii.in connection with repayment and funding obligations to third-party lenders on behalf of certain employees, excluding its executive officers, in connection with their personal investments in KKR investment funds and a levered multi-asset investment vehicle,
iii.to one of its hedge fund partnerships,
iv.through a contingent guarantee of a subsidiary’s loan repayment obligations, which does not become effective unless and until its loan becomes accelerated due to certain specified events of default involving the investment vehicles managed by KJRM,
v.the obligations of our subsidiaries' funding obligations to our investment vehicles, and
vi.certain of our investment vehicles to fund or otherwise be liable for a portion of their investment losses and/or to provide them with liquidity upon certain termination events (the maximum amount of which is unknown until the scheduled termination date of the investment vehicle).
KKR may also become liable for certain fees payable to sellers of businesses or assets if a transaction does not close, subject to certain conditions, if any, specified in the acquisition agreements for such businesses or assets.
366
Notes to Financial Statements (Continued)
Insurance Segment
The Global Atlantic business was formerly owned by The Goldman Sachs Group, Inc. (together with its subsidiaries, "Goldman Sachs"). In connection with the separation of Global Atlantic from Goldman Sachs in 2013, Global Atlantic entered into a tax benefit payment agreement with Goldman Sachs. Under the tax benefit payment agreement, GA FinCo is obligated to make annual payments out of available cash, guaranteed by GAFG, to Goldman Sachs over an approximately 25-year period totaling $214.0 million. As of December 31, 2023, the present value of the remaining amount to be paid is $62.5 million. Although these payments are subordinated and deferrable, deferral of these payments would result in restrictions on distributions by GA FinCo and GAFG.
In lieu of funding certain investments in loan facilities to third party borrowers in cash, Global Atlantic has arranged or participated in letters of credit issued by third-party banks on behalf of the borrowers in the amount of $14.7 million, as of December 31, 2023, with expiration dates between May 2024 and November 2024. Global Atlantic has available lines of credit that would allow for additional letters of credit to be issued on behalf of certain borrowers, up to $160.3 million, as of December 31, 2023. For accounting purposes, these letters of credit are considered guarantees of certain obligations of the borrowers. If a letter of credit were to be drawn, Global Atlantic would be obligated to repay the issuing third-party bank, and Global Atlantic would recognize a loan receivable from the borrowers on the consolidated statements of financial condition. Global Atlantic monitors the likelihood of these letters of credit being drawn, and any related contingent obligation. As of both December 31, 2023 and 2022, the expected credit loss on the contingent liability associated with these letters of credit was not material.
Unless otherwise stated above, KKR's maximum exposure under the arrangements described under this section “—Indemnifications and Other Guarantees” are currently unknown as there are no stated or notional amounts included in these arrangements and KKR's liabilities for these matters would require a claim to be made against KKR in the future.
Legal Proceedings
From time to time, KKR (including Global Atlantic) is involved in various legal proceedings, requests for information, lawsuits, arbitration and claims incidental to the conduct of KKR's businesses. KKR's asset management and insurance businesses are also subject to extensive regulation, which may result in regulatory or other legal proceedings against them. Moreover, in the ordinary course of business, KKR is and can be both the defendant and the plaintiff in numerous lawsuits with respect to acquisitions, bankruptcy, insolvency and other events. Such lawsuits may involve claims that adversely affect the value of certain investments owned by KKR's funds and Global Atlantic's insurance companies.
Kentucky Matter
In December 2017, KKR & Co. L.P. (which is now KKR Group Co. Inc.) and its then Co-Chief Executive Officers, Henry Kravis and George Roberts, were named as defendants in a lawsuit filed in Kentucky state court (the “2017 Action”) alleging, among other things, the violation of fiduciary and other duties in connection with certain separately managed accounts that Prisma Capital Partners LP, a former subsidiary of KKR, manages for the Kentucky Retirement Systems. Also named as defendants in the lawsuit are certain current and former trustees and officers of the Kentucky Retirement Systems, Prisma Capital Partners LP, and various other service providers to the Kentucky Retirement Systems and their related persons. The 2017 Action was dismissed at the direction of the Supreme Court of Kentucky for lack of Kentucky constitutional standing. This dismissal became final on February 16, 2024.
On July 21, 2020, the Office of the Attorney General, on behalf of the Commonwealth of Kentucky, filed a new lawsuit in the same Kentucky state court (the “2020 AG Action”) making essentially the same allegations as those raised in the 2017 Action, including against what was then KKR & Co. Inc. (now KKR Group Co. Inc.) and Messrs. Kravis and Roberts. On September 14, 2023, KKR & Co. Inc., Messrs. Kravis and Roberts and other defendants moved to dismiss the 2020 AG Action. Oral arguments on the motion to dismiss the 2020 AG Action are scheduled for February 29, 2024.
In January 2021, some of the attorneys for the plaintiffs in the 2017 Action filed a new lawsuit on behalf of a new set of plaintiffs, who claim to be “Tier 3” members of Kentucky Retirement Systems (the “Tier 3 Plaintiffs”), alleging substantially the same allegations as in the 2017 Action. On July 9, 2021, the Tier 3 Plaintiffs served an amended complaint, which purports to assert, on behalf of a class of beneficiaries of Kentucky Retirement Systems, direct claims for breach of fiduciary duty and civil violations under the Racketeer Influenced and Corrupt Organizations Act (“RICO”). This complaint was removed to the U.S. District Court for the Eastern District of Kentucky, which has entered an order staying this case until the completion of the 2020 AG Action. On August 20, 2021, the Tier 3 Plaintiffs and other individual plaintiffs filed a second complaint in Kentucky state court (the “Second Tier 3 Action”), purportedly on behalf of Kentucky Retirement Systems’ funds, alleging the same claims against what was then KKR & Co. Inc. (now KKR Group Co. Inc.) and Messrs. Kravis and Roberts as in the July 9th
367
Notes to Financial Statements (Continued)
amended complaint but without the RICO or class action allegations. KKR and the other defendants have moved to dismiss the Second Tier 3 Action. On October 26, 2023, the trial court heard oral arguments on these motions to dismiss.
On March 24, 2022, in a separate declaratory judgment action brought by the Commonwealth of Kentucky regarding the enforceability of certain indemnification provisions available to what was then KKR & Co. Inc. (now KKR Group Co. Inc.) and Prisma Capital Partners LP, the Kentucky state court concluded that it has personal jurisdiction over KKR & Co. Inc. in that action, and that the indemnification provisions violated the Kentucky Constitution and were therefore unenforceable. On December 1, 2023, the Kentucky Court of Appeals reversed the trial court’s summary judgment on the issue of personal jurisdiction over KKR & Co. Inc., but affirmed the trial court’s rulings that the indemnification provisions violated the Kentucky Constitution and were unenforceable. On February 5, 2024, the Kentucky Court of Appeals denied the petitions of KKR & Co. Inc. and others for rehearing. The deadline to file a motion with the Supreme Court of Kentucky for discretionary review of the Court of Appeals’ December 1, 2023 decision is March 6, 2024.
KKR intends to continue to vigorously defend against these claims against KKR and Messrs. Kravis and Roberts.
Regulatory Matters
KKR currently is, and expects to continue to become from time to time, subject to various examinations, inquiries and investigations by various U.S. and non-U.S. governmental and regulatory agencies. Such examinations, inquiries and investigations may result in the commencement of civil, criminal or administrative proceedings, or the imposition of fines, penalties, or other remedies, against KKR and its personnel. KKR is subject to periodic examinations of its regulated businesses by various U.S. and non-U.S. governmental and regulatory agencies, including but not limited to the Securities and Exchange Commission ("SEC"), Financial Industry Regulatory Authority ("FINRA"), the U.K. Financial Conduct Authority, Central Bank of Ireland, Monetary Authority of Singapore, U.S. state insurance regulatory authorities, and the Bermuda Monetary Authority. KKR may also become subject to inquiries or investigations (through a request for information, civil investigative demand, subpoena or otherwise) by any of the foregoing governmental and regulatory agencies as well as by any other U.S. or non-U.S. governmental or regulatory agency, including but not limited to the SEC, U.S. Department of Justice ("DOJ"), U.S. state attorney generals, and similar non-U.S. governmental or regulatory agencies. KKR is currently subject to investigations by the Antitrust Division of the DOJ related to antitrust matters, including civil investigative demands and a grand jury subpoena seeking information with respect to the accuracy and completeness of certain filings made by KKR pursuant to the premerger notification requirements under the Hart-Scott-Rodino Act of 1976 for certain transactions in 2021 and 2022. In addition, KKR is currently subject to an investigation by the Antitrust Division of the DOJ related to the restrictions on interlocking directorates under Section 8 of the Clayton Act. KKR is also currently subject to investigations by the SEC related to business-related electronic communications, including with respect to the preservation of text messages and similar communications on electronic messaging applications under the Investment Advisers Act of 1940. KKR is currently cooperating with each of these named investigations.
Loss Contingencies
KKR establishes an accrued liability for legal or regulatory proceedings only when those matters present loss contingencies that are both probable and reasonably estimable. KKR includes in its financial statements the amount of any reserve for regulatory, litigation and related matters that Global Atlantic includes in its financial statements. No loss contingency is recorded for matters where such losses are either not probable or reasonably estimable (or both) at the time of determination. Such matters also have the possibility of resulting in losses in excess of any amounts accrued. To the extent KKR can in any particular period estimate an aggregate range of reasonably possible losses, these decisions involve significant judgment given that it is inherently difficult to determine whether any loss for a matter is probable or even possible or to estimate the amount of any loss in many legal, governmental and regulatory matters.
Estimating an accrued liability or a reasonably possible loss involves significant judgment due to many uncertainties, including among others: (i) the proceeding may be in early stages; (ii) damages sought may be unspecified, unsupportable, unexplained or uncertain; (iii) discovery may not have been started or is incomplete; (iv) there may be uncertainty as to the outcome of pending appeals or motions; (v) there may be significant factual issues to be resolved; (vi) there may be novel legal issues or unsettled legal theories to be presented or a large number of parties; or (vii) the proceeding relates to a regulatory examination, inquiry, or investigation. It is not possible to predict the ultimate outcome of all pending litigations, arbitrations, claims, and governmental or regulatory examinations, inquiries, investigations and proceedings, and some of the matters discussed above seek or may seek potentially large or indeterminate relief. Consequently, management is unable as of the date of filing of this report to estimate an amount or range of reasonably possible losses related to matters pending against KKR. In addition, any amounts accrued as loss contingencies or disclosed as reasonably possible losses may be, in part or in whole, subject to insurance or other payments such as contributions and indemnity, which may reduce any ultimate loss.
368
Notes to Financial Statements (Continued)
As of the date of filing this report, management does not believe, based on currently available information, that the outcomes of the matters pending against KKR will have a material adverse effect upon its financial statements. However, given the potentially large and/or indeterminate relief sought or that may be sought in certain of these matters and the inherent unpredictability of litigations, arbitrations, claims, and governmental or regulatory examinations, inquiries, investigations and proceedings, it is possible that an adverse outcome in certain matters could have a material adverse effect on KKR's financial results in any future period. In addition, there can be no assurance that material losses will not be incurred from claims that have not yet been asserted or those where potential losses have not yet been determined to be probable or possible and reasonably estimable.
Other Financing Arrangements
Global Atlantic has financing arrangements with unaffiliated third parties to support the reserves of its affiliated special purpose reinsurers. Total fees associated with these financing arrangements were $20.3 million, $20.1 million and $16.4 million for the years ended December 31, 2023, 2022 and 2021, respectively, and are included in insurance expenses in the consolidated statements of operations. As of both December 31, 2023 and 2022, the total capacity of the financing arrangements with third parties was $2.3
Other than the matters disclosed above, there were no outstanding or unpaid balances from the financing arrangements with unaffiliated third parties as of both December 31, 2023 and 2022.
369
Notes to Financial Statements (Continued)
25. CAPITAL & REGULATORY REQUIREMENTS
Insurance subsidiary capital requirements
All of our Global Atlantic insurance companies are subject to minimum capital and surplus requirements. Insurance companies typically operate in excess of such requirements. Failure to maintain such minimum capital will result in regulatory actions, including in certain circumstances regulatory takeover of the insurance company.
In the United States, our Global Atlantic's insurance companies are subject to risk based capital ("RBC") standards and other minimum capital and surplus requirements imposed by state laws. The RBC formula is intended to measure the adequacy of the insurance company’s statutory surplus in relation to the risks inherent in its business. The RBC formula requires higher surplus in relation to items deemed to have higher risk. Regulatory action is triggered beginning at 200% RBC and below.
Our Global Atlantic Bermuda insurance companies are subject to Bermuda Solvency Capital Requirements ("BSCR") standards and other minimum capital and surplus requirements imposed by the BMA. The BMA expects that insurers operate at or above a BSCR ratio of at least 120%.
Each of our Global Atlantic insurance companies exceeded the minimum requirements that would trigger regulatory action for all periods presented in this report.
Insurance subsidiary dividend restrictions
Payments of dividends by our U.S. and Bermuda-domiciled insurance companies are restricted by insurance statutes and regulations. Our ability to pay dividends out of our U.S.-domiciled insurance companies is limited to the dividend paying capacity of Global Atlantic's indirect insurance subsidiary, Commonwealth Annuity and Life Insurance Company (“Commonwealth”). Commonwealth has negative unassigned surplus and while it remains so, Commonwealth must obtain written approval from the Massachusetts Division of Insurance prior to the payment of any dividend or distribution. Without prior regulatory approval, and subject to maintaining certain solvency requirements, our U.S. and Bermuda insurance subsidiaries, may declare ordinary dividends or distributions to their holding companies during 2024, as follows:
| Ordinary dividend and distribution capacity | ||||||||
| ($ in thousands) | ||||||||
| U.S. domiciled | ||||||||
| Commonwealth Annuity and Life Insurance Company | ||||||||
| Bermuda domiciled | ||||||||
Global Atlantic Re Limited(1) | $ | |||||||
| Global Atlantic Assurance Limited | ||||||||
Shareholders’ equity of our principal U.S.-domiciled insurance subsidiary, Commonwealth Annuity and Life Insurance Company, determined pursuant to statutory accounting rules was approximately $4.3 billion and $4.2 billion as of December 31, 2023 and 2022, respectively. Statutory surplus computed under those methodologies differ from equity reported in accordance with U.S. GAAP primarily because fixed maturity securities are required to be carried at cost or amortized cost, embedded derivatives on funds withheld reinsurance balances are not recognized, policy acquisition costs are expensed when incurred and asset valuation and interest maintenance reserves are required to be held. Life insurance reserves are calculated based upon different assumptions and the recognition of deferred tax assets is based on different recoverability assumptions.
Combined shareholders’ equity of our Bermuda-domiciled insurance subsidiaries determined pursuant to statutory accounting rules was approximately $3.4 billion and $2.2 billion as of December 31, 2023 and 2022, respectively. Bermuda reinsurers file statutory financial statements with the Bermuda Monetary Authority (the "BMA") that may differ from U.S. GAAP. For example, Bermuda statutory surplus differs from U.S. GAAP primarily due to a modification that permits our Bermuda insurance subsidiaries to not measure the embedded derivative included within certain funds withheld coinsurance agreements at fair value.
370
Notes to Financial Statements (Continued)
26. SUBSEQUENT EVENTS
Common Stock Dividend
A dividend of $0.165 0.66 to $0.70 .
Acquisition of the Remaining Interests of Global Atlantic
371
ITEM 9. CHANGES IN AND DISAGREEMENTS WITH ACCOUNTANTS ON ACCOUNTING AND FINANCIAL DISCLOSURE
None.
ITEM 9A. CONTROLS AND PROCEDURES
Evaluation of Disclosure Controls and Procedures
We maintain disclosure controls and procedures (as such term is defined in Rules 13a-15(e) and 15d-15(e) under the Exchange Act) that are designed to ensure that the information required to be disclosed by us in the reports filed or submitted by us under the Exchange Act is recorded, processed, summarized and reported within the time periods specified in the SEC's rules and forms and such information is accumulated and communicated to management, including the Co-Chief Executive Officers and the Chief Financial Officer, as appropriate, to allow timely decisions regarding required disclosure. Any controls and procedures, no matter how well designed and operated, can provide only reasonable assurances of achieving the desired control objectives.
We carried out an evaluation, under the supervision and with the participation of our management, including the Co-Chief Executive Officers and the Chief Financial Officer, of the effectiveness of the design and operation of our disclosure controls and procedures as of December 31, 2023. Based upon that evaluation, our Co-Chief Executive Officers and Chief Financial Officer have concluded that, as of December 31, 2023, our disclosure controls and procedures were effective to accomplish their objectives at the reasonable assurance level.
Management's Report on Internal Control Over Financial Reporting
Our management is responsible for establishing and maintaining adequate internal control over financial reporting. Internal control over financial reporting (as defined in Rule 13a-15(f) and 15d-15(f) under the Exchange Act) is a process designed by, or under the supervision of, a company's principal executive and principal financial officers and effected by the Board of Directors, management and other personnel, to provide reasonable assurance regarding the reliability of financial reporting and the preparation of financial statements for external purposes in accordance with generally accepted accounting principles and includes those policies and procedures that:
•Pertain to the maintenance of records that in reasonable detail accurately and fairly reflect the transactions and dispositions of the assets of the company;
•Provide reasonable assurance that transactions are recorded as necessary to permit preparation of financial statements in accordance with generally accepted accounting principles, and that receipts and expenditures of the company are being made only in accordance with authorizations of management and directors of the company; and
•Provide reasonable assurance regarding prevention or timely detection of unauthorized acquisition, use, or disposition of the company's assets that could have a material effect on the financial statements.
Our management assessed the effectiveness of our internal control over financial reporting as of December 31, 2023. In making this assessment, management used the criteria set forth by the Committee of Sponsoring Organizations of the Treadway Commission (COSO) in Internal Control—Integrated Framework that was issued in 2013. Based on its assessment, our management has concluded that, as of December 31, 2023, our internal control over financial reporting is effective.
Changes in Internal Control Over Financial Reporting
No changes in our internal control over financial reporting (as such term is defined in Rule 13a-15(f) of the Exchange Act) occurred during the fourth quarter of 2023 that materially affected, or are reasonably likely to materially affect, our internal control over financial reporting.
Attestation Report of the Independent Registered Public Accounting Firm
Deloitte & Touche LLP, our independent registered public accounting firm that audited our consolidated financial statements included in this report, has issued its attestation report on our internal control over financial reporting, which is included in Financial Statements and Supplementary Data.
372
ITEM 9B. OTHER INFORMATION
None.
ITEM 9C. DISCLOSURE REGARDING FOREIGN JURISDICTIONS THAT PREVENT INSPECTIONS
None.
373
PART III
ITEM 10. DIRECTORS, EXECUTIVE OFFICERS AND CORPORATE GOVERNANCE
Directors and Executive Officers
The following table presents certain information concerning our Board of Directors and executive officers.
| Name | Age | Position(s) | |||||||||
| Henry R. Kravis | 80 | Co-Executive Chairman and Director | |||||||||
| George R. Roberts | 80 | Co-Executive Chairman and Director | |||||||||
| Joseph Y. Bae | 52 | Co-Chief Executive Officer and Director | |||||||||
| Scott C. Nuttall | 51 | Co-Chief Executive Officer and Director | |||||||||
| Adriane M. Brown | 65 | Director | |||||||||
| Matthew R. Cohler | 46 | Director | |||||||||
| Mary N. Dillon | 62 | Director | |||||||||
Arturo Gutiérrez Hernández | 57 | Director | |||||||||
| Xavier B. Niel | 56 | Director | |||||||||
| Kimberly A. Ross | 58 | Director | |||||||||
| Patricia F. Russo | 71 | Director | |||||||||
| Robert W. Scully | 74 | Director | |||||||||
| Evan T. Spiegel | 33 | Director | |||||||||
| Robert H. Lewin | 44 | Chief Financial Officer | |||||||||
| Dane E. Holmes | 53 | Chief Administrative Officer | |||||||||
| Ryan D. Stork | 52 | Chief Operating Officer | |||||||||
| Kathryn K. Sudol | 49 | Chief Legal Officer and General Counsel | |||||||||
Henry R. Kravis co-founded KKR in 1976 and serves as our Co-Executive Chairman. Prior to his current position, he was our Co-Chief Executive Officer until October 2021. He is actively involved in managing the firm and serves on each of the regional Private Equity Investment Committees. Mr. Kravis currently serves on the boards of Axel Springer, ICONIQ Capital, LLC and Catalio Capital Management, LP. He also serves as a director, chairman emeritus, trustee or executive committee member of several cultural, professional, and educational institutions, including The Business Council (former chairman), Claremont McKenna College, Columbia Business School (former co-chairman), Mount Sinai Hospital, the Partnership for New York City (former chairman), the Partnership Fund for New York City (founder), Rockefeller University (former vice chairman), and Sponsors for Educational Opportunity (chairman). He earned a B.A. from Claremont McKenna College in 1967 and an M.B.A. from the Columbia Business School in 1969. Mr. Kravis has more than four decades of experience financing, analyzing, and investing in public and private companies, as well as serving on the boards of a number of KKR portfolio companies. As our Co-Founder, Co-Executive Chairman and former Co-Chief Executive Officer, Mr. Kravis has an intimate knowledge of KKR's business, which allows him to provide insight into various aspects of our business and is of significant value to our Board of Directors. Mr. Kravis and Mr. Roberts are first cousins.
George R. Roberts co-founded KKR in 1976 and serves as our Co-Executive Chairman. Prior to his current position, he was Co-Chief Executive Officer until October 2021. He is actively involved in managing the firm and serves on each of the regional Private Equity Investment Committees. Mr. Roberts has served as a director or trustee of several cultural and educational institutions, including Claremont McKenna College. He is also Founder and Chairman of the board of directors of REDF, a San Francisco nonprofit organization. He earned a B.A. from Claremont McKenna College in 1966 and a J.D. from the University of California (Hastings) Law School in 1969. Mr. Roberts has more than four decades of experience financing, analyzing, and investing in public and private companies, as well as serving on the boards of a number of KKR portfolio companies. As our Co-Founder, Co-Executive Chairman and former Co-Chief Executive Officer, Mr. Roberts has an intimate knowledge of KKR's business, which allows him to provide insight into various aspects of our business and is of significant value to our Board of Directors. Mr. Roberts and Mr. Kravis are first cousins.
Joseph Y. Bae joined KKR in 1996 and is our Co-Chief Executive Officer. Prior to his current position, he served as Co-President and Co-Chief Operating Officer from 2017 to 2021, and he has been a member of our Board of Directors since July
374
2017. Mr. Bae has held numerous leadership roles at KKR. He was the architect of KKR’s expansion in Asia, building one of the largest and most successful platforms in the market. In addition to his role developing KKR’s Asia-Pacific platform, he has presided over business building in the firm’s private markets businesses, which included leading or serving on all of the investment committees and implementing the firm’s modern thematic investment approach. Mr. Bae serves on the firm’s Inclusion and Diversity Council. He is active in a number of non-profit educational and cultural institutions, including co-founding and serving on the board of The Asian American Foundation, a member of Harvard University’s Global Advisory Council and as a board member of the Lincoln Center. Mr. Bae’s intimate knowledge of KKR’s business and operations and his experience in a variety of senior leadership roles within KKR provide significant value to our Board of Directors.
Scott C. Nuttall joined KKR in 1996 and is our Co-Chief Executive Officer. Prior to his current position, he served as Co-President and Co-Chief Operating Officer from 2017 to 2021, and he has been a member of our Board of Directors since July 2017. Mr. Nuttall has had numerous leadership roles at KKR. He was the architect of the firm’s major strategic development initiatives, including leading KKR’s public listing, developing the firm’s balance sheet strategy, overseeing the development of KKR’s Public Markets businesses in the credit and hedge fund space as well as the creation of the firm’s capital markets, capital raising and insurance businesses. Mr. Nuttall serves on KKR’s Balance Sheet Committee and the firm’s Inclusion and Diversity Council. He was a member of the board of directors of Fiserv, Inc. until 2022. He has also served on the boards of various non-profit institutions with a particular focus on education, most recently as Co-Chairman of Teach for America – New York. Mr. Nuttall's intimate knowledge of KKR's business and operations and his experience in a variety of senior leadership roles within KKR provide significant value to our Board of Directors.
Adriane M. Brown has been a member of our Board of Directors since June 2021. Ms. Brown joined Flying Fish Ventures, as a Venture Partner in November 2018 and became a Managing Partner of the venture capital firm in February 2021. Prior to that, Ms. Brown served as President and Chief Operating Officer for Intellectual Ventures, an invention and investment company, from January 2010 through July 2017, and served as a Senior Advisor until December 2018. Before joining Intellectual Ventures, Ms. Brown served as President and Chief Executive Officer of Honeywell Transportation Systems. Over the course of 10 years at Honeywell, she held leadership positions serving the aerospace and automotive markets globally. Prior to Honeywell, Ms. Brown spent 19 years at Corning, Inc., ultimately serving as Vice President and General Manager, Environmental Products Division, having started her career there as a shift supervisor. Ms. Brown serves on the boards of directors of American Airlines Group Inc., Axon Enterprise, Inc., e-Bay Inc., and the International Women's Forum. Ms. Brown previously served on the boards of directors of Allergan Plc and Raytheon Company until 2020. Ms. Brown holds a Doctorate of Humane Letters and a bachelor’s degree in environmental health from Old Dominion University, and is a winner of its Distinguished Alumni Award. She also holds a master’s degree in management from the Massachusetts Institute of Technology where she was a Sloan Fellow. Ms. Brown’s leadership in technology businesses and industrial companies as well as her investment and financial experience bring important expertise to the oversight and development of our business.
Matthew R. Cohler has been a member of our Board of Directors since December 2021. Mr. Cohler is a former General Partner at the venture capital firm Benchmark, where for over a decade he led early-stage investments in Internet and software startup businesses. He currently serves as a director and nominating and governance committee member at Asana, as a director and audit committee member at 1stDibs and as a director at several privately held companies. Previously he served as a director, audit committee member and nominating and governance committee member at Domo, as a director and audit committee member at Uber and as a director at privately held companies including Duo Security, Instagram and Tinder. Prior to Benchmark, Mr. Cohler was Vice President at Facebook, where he was the company’s seventh employee, and Vice President at LinkedIn, where he was part of the company’s founding team. He serves on the board of trustees at Environmental Defense Fund (Vice Chair), on the board of governors at the San Francisco Symphony (Vice President) and on the investment committee at the Chan Zuckerberg Initiative and at the Yale Investments Office. He holds a B.A. from Yale University, cum laude and with distinction in the study of music. Mr. Cohler’s knowledge and experience as a venture capitalist and director of multiple leading companies in the technology industry bring to our Board of Directors important insight and perspectives to our business and future development.
Mary N. Dillon has been a member of our Board of Directors since September 2018. Ms. Dillon serves as the President and Chief Executive Officer of Foot Locker, Inc. and is a member of its board of directors. Ms. Dillon formerly served as a member of the board of directors of Ulta Beauty, Inc., a beauty products retailer, from 2013 to 2022, and was its Executive Chair from June 2021 through June 2022. From 2013 to June 2021, she was the Chief Executive Officer of Ulta Beauty, and before then she served as President and Chief Executive Officer and member of the board of directors of United States Cellular Corporation, a provider of wireless telecommunication services, from 2010 to 2013. Prior to joining U.S. Cellular, Ms. Dillon served as Global Chief Marketing Officer and Executive Vice President of McDonald’s Corporation from 2005 to 2010, where she led its worldwide marketing efforts and global brand strategy. Prior to joining McDonald’s, Ms. Dillon held several positions of increasing responsibility at PepsiCo Corporation, including as President of the Quaker Foods division from 2004 to 2005 and as Vice President of Marketing for Gatorade and Quaker Foods from 2002 to 2004. Ms. Dillon served as a director of
375
Target Corporation from 2007 to 2013 and as a member of its compensation committee from 2009 to 2013. Ms. Dillon joined the board of directors of Starbucks in January 2016 and served as chair of its compensation and management development committee, and as a member of the nominating and corporate governance committee through August 2022. Ms. Dillon provides our Board of Directors with valuable knowledge and insights she gained through her various senior management and leadership roles, including as the chief executive officer of a publicly traded company. In addition, with over 30 years of experience in consumer-driven businesses, Ms. Dillon brings to our Board of Directors her extensive operational and marketing expertise in the retail industry.
Arturo Gutiérrez Hernández has been a member of our Board of Directors since March 2021. Mr. Gutiérrez has served as the Chief Executive Officer of Arca Continental, one of the largest Coca-Cola bottlers in the world, since January 2019. Mr. Gutiérrez held several executive positions in the company from 2001 to 2018, including Deputy Chief Executive Officer, Chief Operating Officer, Head of the Mexico Beverages Division, Executive Vice President of Human Resources, Director of Corporate Planning and General Counsel. He serves on several boards of industry-related companies, including Piasa, and he holds positions on several international and national industry councils. He also serves on the Nuevo Leon Transformation Industry Chamber and the Coca-Cola Mexico Foundation. Mr. Gutiérrez earned a law degree from Escuela Libre de Derecho, in Mexico City, and an L.L.M. from Harvard University, as a Fulbright Scholar. Mr. Gutiérrez provides our Board of Directors with valuable knowledge, perspectives and insights from his leadership of a large multinational business based in Latin America and from his broad experience in various aspects of the consumer staples, including operational, financial, business development and legal areas.
Xavier B. Niel has been a member of our Board of Directors since March 2018. Mr. Niel is the Founder and Chairman of the board of Iliad SA, a French telecommunications company that owns the internet provider Free and the low-cost mobile operator Free Mobile. Mr. Niel also owns majority stakes in telecom operators in various countries. He has been involved in the data communications, internet and telecommunications industry since the late 1980s. In 2010, Mr. Niel founded Kima Ventures SAS, which is an active early-stage investor. In 2013, he created 42, a school that trains computer specialists in France, and in 2017, he opened Station-F, a startup campus located in Paris. Mr. Niel brings significant value to our Board of Directors due to his extensive experience as an entrepreneur who founded multiple companies, in addition to his leadership and technology experience.
Kimberly A. Ross has been a member of the Board of Directors since September 2023. Ms. Ross is a member of the board of directors of Nestlé S.A., Northrop Grumman Corporation, and The Cigna Group. Ms. Ross served as Chief Financial Officer of WeWork Inc. from March 2020 through October 2020. Ms. Ross served as Senior Vice President and Chief Financial Officer of Baker Hughes Company, an energy technology company, from September 2014 to July 2017. Before joining Baker Hughes, Ms. Ross served as Executive Vice President and Chief Financial Officer of Avon Products, Inc., a global manufacturer and marketer of beauty and related products, from November 2011 until October 2014. Prior to joining Avon, Ms. Ross served as the Executive Vice President and Chief Financial Officer of Royal Ahold N.V., a food retail company, from 2007 to 2011 and held a variety of senior management positions during her tenure there, which began in 2001. Ms. Ross has significant international business experience through her service as an executive of large public companies with international operations. Ms. Ross also provides our Board of Directors with valuable knowledge and experience in corporate finance, financial planning and analysis, strategy, mergers and acquisitions, corporate restructuring, financial reporting, and internal audit as well as IT operations oversight.
Patricia F. Russo has been a member of our Board of Directors since April 2011. Ms. Russo served as Chief Executive Officer of Alcatel-Lucent from 2006 to 2008. Prior to the merger of Alcatel and Lucent in 2006, she served as Chairman of Lucent Technologies, Inc. from 2003 to 2006, and as President and Chief Executive Officer from 2002 to 2006. Before rejoining Lucent in 2002, Ms. Russo was President and Chief Operating Officer of Eastman Kodak Company from March 2001 to December 2001. She has served as the Chairman of Hewlett Packard Enterprise Company since 2015, as a director of Merck & Co., Inc. since 2009 and as a director of General Motors Company since 2009, including as lead independent director from March 2010 to January 2014 and again since June 2021. Prior to its merger with Merck in 2009, Ms. Russo served as a director of Schering-Plough since 1995, and she served as a director of Hewlett Packard Company from 2011 to November 2015. From November 2016 to May 2018, Ms. Russo also served on the board of Arconic Inc., which separated from Alcoa Inc., where Ms. Russo served as a director from 2008 to November 2016. She graduated from Georgetown University with a bachelor’s degree in political science and history, and obtained an Advanced Management Degree from Harvard Business School’s Advanced Management Program. Ms. Russo's management and leadership experience as chief executive officer of complex global companies as well as her experience with corporate strategy, mergers and acquisitions, and sales and marketing brings to our Board of Directors important expertise to the oversight and development of our business. Ms. Russo also brings extensive experience in corporate governance as a member of boards and board committees of other public companies.
376
Robert W. Scully has been a member of our Board of Directors since July 2010. Mr. Scully was a member of the Office of the Chairman of Morgan Stanley from 2007 until his retirement in 2009, where he had previously been Co-President of the firm, Chairman of global capital markets and Vice Chairman of investment banking. Prior to joining Morgan Stanley in 1996, he served as a Managing Director at Lehman Brothers and at Salomon Brothers. Mr. Scully has served as a director of Zoetis Inc. since June 2013, Chubb Limited since January 2016, and prior to its acquisition of Chubb Limited, a director of ACE Limited from May 2014 to January 2016. Previously, he was a director of UBS Group AG from May 2016 to April 2020, a director of Bank of America Corporation from August 2009 to May 2013 and a public governor of the Financial Industry Regulatory Authority, Inc. from October 2014 to May 2016. He has also served as a director of GMAC Financial Services and MSCI Inc. He holds an A.B. from Princeton University and an M.B.A. from Harvard Business School. Mr. Scully serves on the board of Teach For All, a global non-profit organization dedicated to developing collective leadership in education and is a member of the Nassau Hall Society at Princeton University. Mr. Scully previously was Chair or Co-Chair of Teach for America, NY for more than a dozen years and served on the Board of Dean’s Advisors of Harvard Business School. Mr. Scully's 35-year career in the financial services industry brings to our Board of Directors important expertise to the oversight of our business. In addition, his leadership experience with a global financial services company brings an industry perspective to our business development within and outside the United States as well as issues such as talent development, senior client relationship management, strategic initiatives, risk management and audit and financial reporting.
Evan T. Spiegel has been a member of our Board of Directors since October 2021. Mr. Spiegel is the Co-Founder of Snap Inc., a publicly traded technology company that believes the camera represents the greatest opportunity to improve the way that people live and communicate, and has served as its Chief Executive Officer and a member of its board of directors since 2012. In 2017, Mr. Spiegel formed the Spiegel Family Fund, a non-profit humanitarian organization which supports organizations across the arts, education, housing and human rights. Mr. Spiegel currently serves on the boards of directors of Snap Inc. and the Berggruen Institute. Mr. Spiegel holds a bachelor’s degree in Engineering, Product Design from Stanford University. Mr. Spiegel’s experience as a co-founder and executive of a leading company in technology services brings to our Board of Directors important insight and perspectives to our business and future development.
Robert H. Lewin joined KKR in 2004 and is our Chief Financial Officer. Since joining KKR, Mr. Lewin held a number of positions at the firm, including as an investor in private equity, co-leading the firm’s credit and capital markets businesses, serving as Treasurer and Head of Corporate Development and most recently as Head of Human Capital & Strategic Talent. From 2006 through 2010, Mr. Lewin resided in Hong Kong, helping to launch KKR’s Asia business. Mr. Lewin has a Bachelor of Science from the University of Pennsylvania. He currently serves on the board of Answer the Call, a non-profit organization.
Dane E. Holmes joined KKR as Chief Administrative Officer in 2023. Prior to becoming the Chief Administrative Officer, Mr. Holmes was a member of our Board of Directors from March 2021 to December 2023. Mr. Holmes was previously the Chairman and Chief Executive Officer of Eskalera, Inc., from 2020 to 2023, an enterprise software company he co-founded. Prior to Eskalera, Mr. Holmes was the Global Head of Human Capital Management at Goldman Sachs from 2017 to 2019 and served as a member of the firm’s management committee. He held many positions at Goldman Sachs from 2001 to 2017, including global head of investor relations, and Mr. Holmes served on a variety of committees, including its risk committee, client and business standards committee, and global diversity committee. Mr. Holmes serves on several non-profit boards and is currently the chair of Storycorps and the former chair and current board member of The Ron Brown Scholar Program. Mr. Holmes earned a B.A. from Columbia University.
Ryan D. Stork joined KKR in 2022 and is our Chief Operating Officer. Prior to joining KKR, Mr. Stork was at BlackRock Inc. where he held multiple leadership roles for more than 20 years, including most recently as Deputy Chief Operating Officer from 2019 to 2021 and as Chairman of Asia Pacific from 2014 to 2019. Previously, he was also the Global Head of Aladdin – BlackRock’s investment and risk management technology platform, Head of the Institutional Client Business in Continental Europe, and Co‑Head of the Financial Institutions Group. He was also a member of BlackRock’s Global Executive Committee and a board member of BlackRock’s Foundation. Prior to joining BlackRock, Ryan worked at PennCorp Financial Group, Conning Asset Management, and The Travelers Insurance Companies. Mr. Stork received a BBA in Finance & Accounting from the University of Massachusetts, Amherst.
Kathryn K. Sudol joined KKR in 2022 and is our Chief Legal Officer and General Counsel. Prior to her current position, she served as KKR's General Counsel from September 2022 through March 2023 and its Secretary from September 2022 through June 2023. Prior to joining KKR, Ms. Sudol was a partner with Simpson Thacher & Bartlett LLP for 24 years where she held numerous leadership roles, including as Global Co-Head of Mergers & Acquisitions, a long-time member of the firm’s Executive Committee and head of the firm’s M&A practice in Asia from 2010 through 2018. Ms. Sudol currently serves as a member of the Board of Trustees of New York University School of Law. She earned a B.S., with honors, from Northwestern University and a J.D. from New York University School of Law.
377
Independence and Composition of the Board of Directors
Our Board of Directors consists of thirteen directors, nine of whom, Messrs. Cohler, Gutiérrez, Niel, Scully and Spiegel and Mses. Brown, Dillon, Ross and Russo, are independent under NYSE rules relating to corporate governance matters and the independence standards described in our corporate governance guidelines.
Because the Series I preferred stockholder has more than 50% of the voting power for the election of our directors, we are a "controlled company" within the meaning of the corporate governance standards of the NYSE. Under these standards, a "controlled company" may elect not to comply with certain corporate governance standards, including the requirements (1) that a majority of its board of directors consist of independent directors, (2) that its board of directors have a compensation committee that is comprised entirely of independent directors with a written charter addressing the committee's purpose and responsibilities and (3) that its board of directors have a nominating and corporate governance committee that is comprised entirely of independent directors with a written charter addressing the committee's purpose and responsibilities. We currently utilize the second and third of these exemptions. See "Risk Factors—Risks Related to Our Organizational Structure—As a "controlled company," we qualify for some exemptions from the corporate governance and other requirements of the NYSE and are not required to comply with certain provisions of U.S. securities laws." While we are exempt from NYSE rules relating to board independence, we intend to maintain a board of directors that consists of at least a majority of directors who are independent under NYSE rules. In the event that we cease to be a "controlled company" and our shares of common stock continue to be listed on the NYSE, we will be required to comply with these provisions within the applicable transition periods. In connection with the Reorganization Agreement, at a future date not to be later than December 2026 and subject to the satisfaction of certain conditions, we expect to no longer be a "controlled company," and thereafter we expect to comply with all of the then existing NYSE rules regarding corporate governance. For more information, see also "Certain Relationships and Related Transactions, and Director Independence—Reorganization Agreement."
In addition, our Board of Directors has considered transactions and relationships between KKR and the companies and organizations on whose boards or other similar governing bodies where our independent directors also serve or where our independent directors serve as executive officers, including investments made by such companies in the portfolio companies in which KKR or its funds are invested, and certain personal investments made by our independent directors in companies in which certain of our executive officers have also invested. It was determined that none of these transactions or relationships adversely impacted the independence of our independent directors.
We seek to enhance the diversity of our Board of Directors to encompass a broad range of expertise, experience and backgrounds. We believe that a diverse board of directors can strengthen the board’s effectiveness in fulfilling its oversight role. Among our thirteen directors on our Board of Directors, four of our directors have self-identified as women, and three of our directors have self-identified as non-white.
Board Committees
Our Board of Directors has five standing committees: an Audit Committee, a Risk Committee, a Conflicts Committee, a Nominating and Corporate Governance Committee and an Executive Committee. Because we are a "controlled company," our Board of Directors is not required by NYSE rules to establish a Compensation Committee or a Nominating and Corporate Governance Committee or to meet certain other substantive NYSE corporate governance requirements until the consummation of all the transactions contemplated by the Reorganization Agreement. For more information about the transactions contemplated by the Reorganization Agreement, see "Certain Relationships and Related Transactions, and Director Independence—Reorganization Agreement." While the Board of Directors has established a Nominating and Corporate Governance Committee, we currently rely on available exemptions concerning the committee's composition and mandate.
Audit Committee
The Audit Committee consists of Messrs. Scully (Chair) and Cohler and Ms. Russo. The purpose of the Audit Committee is to provide assistance to the Board of Directors in fulfilling its responsibility with respect to its oversight of: (i) the quality and integrity of our financial statements, including investment valuations; (ii) our compliance with legal and regulatory requirements; (iii) our independent registered public accounting firm's qualifications, independence and performance; and (iv) the performance of our internal audit function. The members of the Audit Committee meet the independence standards and financial literacy requirements for service on an Audit Committee of a Board of Directors pursuant to the Exchange Act and NYSE rules applicable to audit committees. Our Board of Directors has determined that each of Messrs. Scully and Cohler and Ms. Russo is an "audit committee financial expert" within the meaning of Item 407(d)(5) of Regulation S-K. The Audit Committee has a charter, which is available on our website at www.kkr.com under the corporate governance page for our stockholders at the "Investor Center" section.
378
Risk Committee
The Risk Committee consists of Mr. Cohler (Chair) and Mses. Brown and Dillon. The purpose of the Risk Committee is to provide assistance to the Board of Directors with respect to its oversight of KKR’s levels of risk, risk assessment and risk management, and its oversight of KKR’s overall risk management framework, including monitoring KKR’s reporting systems for compliance with legal and regulatory requirements.
Conflicts Committee
The Conflicts Committee consists of Messrs. Scully (Chair) and Gutierrez and Mses. Dillon and Russo. The Conflicts Committee is responsible for reviewing specific matters that the Board of Directors believes may involve a conflict of interest and for enforcing our rights under any of the tax receivable agreement, the limited partnership agreement of KKR Group Partnership, our certificate of incorporation, our bylaws (collectively, the "covered agreements") against the former partners of KKR Holdings or the current or former partner of Associates Holdings and the exchange agreement. The Conflicts Committee is also authorized to take any action pursuant to any authority or rights granted to such committee under any covered agreement or with respect to any amendment, supplement, modification or waiver to any such agreement that would purport to modify such authority or rights. In addition, the Conflicts Committee shall approve any amendment to any of the covered agreements that in the reasonable judgment of our Board of Directors is, or will result in, a conflict of interest. The Conflicts Committee will determine if the resolution of any conflict of interest submitted to it is fair and reasonable to us. The Conflicts Committee may review and approve any related person transactions, other than those that are approved pursuant to our related person policy, as described under "Certain Relationships and Related Transactions, and Director Independence—Statement of Policy Regarding Transactions with Related Persons," and may establish guidelines or rules to cover specific categories of transactions. The members of the Conflicts Committee meet the independence standards under our corporate governance guidelines as required for service on the committee in accordance with its charter.
Nominating and Corporate Governance Committee
The Nominating and Corporate Governance Committee consists of Messrs. Kravis (Co-Chair), Roberts (Co-Chair) and Scully. The Nominating and Corporate Governance Committee is responsible for identifying and recommending candidates for appointment to the Board of Directors and for assisting and advising the Board of Directors with respect to matters relating to the general operation of the Board of Directors and corporate governance matters. Mr. Scully meets the independence standards under the rules of the NYSE as required for service on the Nominating and Corporate Governance Committee in accordance with its charter.
Executive Committee
The Executive Committee consists of Messrs. Kravis and Roberts. The purpose of the Executive Committee is to act, when necessary, in place of the full Board of Directors during periods in which the Board of Directors is not in session or with respect to matters delegated to the committee, which includes oversight of our Equity Plans. The Executive Committee is authorized and empowered to act as if it were the full Board of Directors in overseeing our business and affairs, except that it is not authorized or empowered to take actions that have been specifically delegated to other board committees or to take actions with respect to: (i) the declaration of dividends on our common stock; (ii) a merger or consolidation of us with or into another entity; (iii) a sale, lease or exchange of all or substantially all of our assets; (iv) a liquidation or dissolution of us; (v) any action that must be submitted to a vote of the Series I preferred stockholder or our stockholders; or (vi) any action that may not be delegated to a board committee under our certificate of incorporation, our bylaws or the DGCL.
Code of Business Conduct and Ethics
We have a Code of Business Conduct and Ethics that applies to our directors, officers and employees, and is available on our website at ir.kkr.com under the corporate governance page for our stockholders at the "Environmental, Social & Corporate Governance" section. In accordance with, and to the extent required by the rules and regulations of the SEC, we intend to disclose any amendment to or waiver of the Code of Business Conduct and Ethics on behalf of an executive officer or director either on our website or in a Current Report on Form 8-K filing.
Corporate Governance Guidelines
Our Board of Directors has a governance policy, which addresses matters such as the Board of Directors' responsibilities and duties, the Board of Directors' composition and compensation and director independence. The governance guidelines are available on our website at www.kkr.com under corporate governance section for our stockholders at the "Investor Center" section.
379
Communications to the Board of Directors
The non-executive members of our Board of Directors meet regularly. At each meeting of the non-executive members, the non-executive directors choose a director to lead the meeting. All interested parties, including any employee or stockholder, may send communications to the non-executive members of our Board of Directors by writing to: Investor Relations, KKR & Co. Inc., 30 Hudson Yards, New York, New York 10001.
380
ITEM 11. EXECUTIVE COMPENSATION
Compensation Discussion and Analysis
Compensation Philosophy
In general, our compensation program for our employees has three primary objectives: (1) to attract, motivate and retain them, (2) to align their interests with those of our stockholders and other stakeholders and (3) to reinforce our culture and values.
Our employees. Our business is dependent on the services of our employees, including our named executive officers. Among other things, we depend on their ability, where applicable, to find, select and execute investments, manage and improve portfolio company operations, find and develop relationships with fund investors and other sources of capital, find, select and execute capital markets opportunities, and operate our various businesses, and we cannot compete effectively without their continued employment with us. Therefore, it is important that our key employees are compensated in a manner that motivates them to excel consistently and encourages them to remain with the firm.
Alignment of interests. Management equity ownership in the businesses in which we invest has been a guiding principle throughout our firm's history, and we apply that principle to ourselves: every senior employee of the firm is expected to have an equity interest in KKR. This equity ownership serves to align the interests of our senior employees, including our named executive officers, with those of our stockholders. In addition, because we invest in and alongside our investment funds and have a carry pool from which we can allocate to our senior employees a portion of the carried interest that we generate through our business, we believe that our senior employees' interests are also aligned with those of our investors in the funds, vehicles and accounts that we manage, which in turn benefits our stockholders. Moreover, senior Global Atlantic employees have equity interests based on the long term performance of Global Atlantic, which we believe aligns their interests with those of its various stakeholders.
Culture and values. One of our most important values for our senior employees is our "one firm" approach with shared responsibility and success, and we also subscribe to a culture of meritocracy and fairness. Therefore, compensation for our senior employees is based on the performance of the firm as a whole as well as on an individual's contributions to the firm. For example, we generally do not compensate our senior employees based merely on an individual's accomplishments in relation to the profits and losses of his or her business unit. In addition, we conduct, at least annually, an evaluation process based on input from a wide range of persons regarding each employee's contribution to the firm, including his or her commitment to the firm's culture and values. We believe that using this kind of evaluation process also promotes a measure of objectivity as a balance to a single manager's judgment.
Named Executive Officers. We refer to our two Co-Executive Chairmen (Henry Kravis and George Roberts), our two Co-Chief Executive Officers (Joseph Bae and Scott Nuttall), our Chief Financial Officer (Robert Lewin), and our Chief Administrative Officer (Dane Holmes), as our "named executive officers" for the year ended December 31, 2023. Mr. Holmes become our Chief Administrative Officer as of December 29, 2023. Our hiring and compensation determinations for Mr. Holmes took into account the fact that Mr. Holmes has extensive experience in leadership and management roles in the financial services, including as the global head of human capital management at Goldman Sachs and in numerous other leadership roles during his 12-year career at the firm. Our determinations also took into account Mr. Holmes' understanding of our business from his time serving as an independent director of KKR & Co. Inc. We believe that the elements of compensation discussed below for our named executive officers serve these primary objectives. We are neither required to conduct say-on-pay or say-on-frequency votes nor to provide disclosures relating to pay-versus-performance under the Dodd-Frank Act. However, we intend periodically to review the elements of our compensation, and we may make changes to the compensation structure relating to one or more named executive officers based on the outcome of such reviews from time to time.
Compensation Elements
Base Salary
For 2023, Messrs. Kravis, Roberts, Bae, Nuttall, Lewin and Holmes were each paid an annual salary of $300,000 (which was pro-rated for Mr. Holmes and which excludes his fees received as an independent director of KKR & Co. Inc.). We believe that the base salary of our named executive officers should typically not be the most significant component of total compensation. Our Co-Executive Chairmen determined that $300,000 is a sufficient minimum base salary for our named executive officers.
381
Year-End Bonus Compensation
Our Co-Executive Chairmen did not receive any year-end cash bonus compensation in 2023. They have decided at this time not to receive any year-end cash bonus compensation, which permits our firm to make greater year-end cash bonus payments to our other employees in order to motivate and retain them for the benefit of the firm. See "—Other Compensation" below for certain incidental benefits provided to them by the firm. In 2023, our Chief Administrative Officer did not receive any year-end cash bonus compensation as his employment with us began on December 29, 2023.
In 2023, our Co-Chief Executive Officers were awarded year-end cash compensation as bonus payments that were determined by our Co-Executive Chairmen. In 2023, our Chief Financial Officer was awarded year-end cash compensation as bonus payments that were determined by our Co-Chief Executive Officers.
With respect to our named executive officers who received year-end cash bonus compensation, certain factors that were considered when determining the size of their bonus payments include (i) their respective contributions and accomplishments in 2023 in terms of driving commercial results for the firm, leading and managing people, and living the firm's values; (ii) their respective performance and contributions relative to other senior employees at the firm; and (iii) their respective performance and contributions in 2023 as compared to the prior year.
Although the firm benefited from an increase in fee related earnings, the investment environment for realizations and monetizations resulted in lower carried interest and realized investment income in 2023. In particular, the firm's total asset management segment revenues were down 18% in 2023 as compared to 2022. In addition, in assessing the contributions by our Co-Chief Executive Officers, their joint leadership of the firm and their day-to-day management of the firm's business were considered. In assessing our Chief Financial Officer, our Co-Chief Executive Officers considered his service as the Chief Financial Officer and his leadership and oversight of our finance, tax and accounting functions and related operations and his role with respect to strategic initiatives undertaken by the firm.
Based on the firm's 2023 results and the individual contributions described above, our Co-Executive Chairmen determined the aggregate size of the bonus payments to our Co-Chief Executive Officers, and our Co-Chief Executive Officers determined the aggregate size of the bonus payment to our Chief Financial Officer. In making these determinations, our Co-Executive Chairmen and Co-Chief Executive Officers also considered the feedback from other employees. We believe that the discretion given to our Co-Executive Chairmen and Co-Chief Executive Officers permits them to award bonus compensation in an amount they determine to be necessary to motivate and retain these named executive officers.
The cash bonus amounts paid to our Co-Chief Executive Officers and Chief Financial Officer for 2023 are reflected in the Bonus column of the 2023 Summary Compensation Table below. As noted above, our Chief Administrative Officer did not receive a cash bonus.
Incentive Equity Awards
From time to time, we may grant equity awards consisting of restricted holdings units from our 2019 Equity Incentive Plan. Restricted holdings units are equity awards issued that provide the recipient with the right to exchange them on a one-for-one basis for our common stock after vesting and subject to satisfying certain other conditions. The overall objectives of these grants are principally to incentivize our most senior employees, to align their interests with those of our stockholders, and to retain them by providing meaningful long-term economic incentives. These awards were not designed to be a regularly recurring equity grant as part of an annual year-end compensation program. KKR currently intends that no additional equity incentive awards will be granted to Messrs. Bae and Nuttall during the five years following the grants they received in December 2021.
In August 2023, we granted Mr. Lewin 500,000 restricted holdings units with market price and cliff service vesting conditions, which provide for vesting based on average prices of common stock ranging from $95.80 to $135.80 divided into five equal increments. Tranches of these restricted holdings units become eligible to vest in 20% increments upon the average closing price of KKR common stock during 20 consecutive trading days meeting or exceeding the specified stock price targets, of which none had been achieved as of December 31, 2023. In addition to the market price vesting condition, in order for Mr. Lewin’s restricted holdings units to vest, he must be employed by us on December 31, 2028, subject to certain exceptions (including continued service if the market price vesting conditions are satisfied between December 31, 2028 and December 31, 2029). These restricted holdings units are subject to one- and two-year transfer restrictions after vesting and are subject to minimum retained ownership requirements.
In December 2023, we granted Mr. Holmes 200,000 restricted holdings units with market price and cliff service vesting conditions on the same terms as Mr. Lewin’s grant described immediately above. In December 2023, we also granted Mr.
382
Holmes 200,000 restricted units, which will vest in six equal installments commencing on October 1, 2024 and then each May 1st from May 1, 2025 through May 1, 2029, subject to continued service through each respective vesting date. All of these restricted holdings units are subject to one- and two-year transfer restrictions after vesting and are subject to minimum retained ownership requirements.
Although, we have not recently granted year-end equity awards to our executive officers annually, we may make such equity grants from time to time. For example, certain named executive officers received long-term incentive equity awards and equity awards with respect to year-end compensation in 2021.
See also “—Narrative Disclosure to Summary Compensation Table and Grants of Plan-Based Awards Table.”
Carried Interest
As of December 31, 2023, the carry pool percentage was fixed at 40%, 43% or 65% by investment fund, depending on the fund’s vintage. For funds that closed after December 31, 2020 but before December 31, 2023, the carry pool percentage was fixed at 65%. For all funds that closed after June 30, 2017 but before December 31, 2020, the carry pool percentage was fixed at 43%, and the carry pool percentage was fixed at 40% for older funds that contributed to KKR's carry pool. Effective January 2, 2024, KKR is authorized to apply a carry pool percentage in excess of these fixed percentages of up to 80% for all funds. As of the date of this filing, no carry pool percentage has been changed for our funds that have closed on or before December 31, 2023. This increase to the carry pool percentage was approved by a majority of KKR's independent directors, and the carry pool percentage may not be increased above 80% without the further approval of a majority of KKR's independent directors. Carry pool allocations for the named executive officers are made by first determining a total dollar value for the named executive officer's interest in the carry pool. Due to our Co-Executive Chairmen's unique status as Co-Founders of our firm, our Co-Founders determine their own allocation from the carry pool, subject to changes relating to the Sunset Date (which will occur no later than December 31, 2026) as described below. To make the total dollar value determination for the other named executive officers, our Co-Founders take into consideration the executive officer's involvement with investments and impact on the portfolio, the size of the executive officer's bonus as well as the recommendations by our Co-Chief Executive Officers and other factors similar to those considered when determining the size of the bonus, as described under "—Executive Compensation—Compensation Elements—Year-End Bonus Compensation." However, the total dollar value available to be allocated to the named executive officers and other employees is limited by the total amount of investments made by our investment funds during the fiscal year, and executive officers and other employees may not be allocated any dollar value of carry in any given year. For certain older funds, carry pool allocations were determined based on a percentage applied on an investment-by-investment basis. After a total dollar value, if any, for each named executive officer was determined, such dollar value was then divided by the total allocable dollar value of investments made by our funds for the year, which yielded a certain percentage for the named executive officer. This percentage was then applied consistently to each investment made during the year. Because the size of each investment was different, the nominal amount of the carry pool allocation have differed by investment, although the percentage applied to each investment is consistent. For our recent funds, carry pool allocations are determined based on a percentage applied on a fund-by-fund basis. The dollar value, if any, for each named executive officer is determined and then allocated to the applicable funds, and such dollar value is then divided by the total allocable dollar value of investments made by that fund for the year to yield a percentage for that particular fund. If carry is paid prior to the end of a fund's investment period, this percentage is applied at that time. At the end of the investment period, an adjustment would be made to account for any difference in percentages applied at the times carry was paid during the investment period (taking vesting into account) and the percentage determined for a particular fund based on the total dollar values allocated to the named executive officer for such fund divided by the total allocable dollars invested during the entire investment period of such fund. The carried interest allocated to the carry pool is maintained and administered by Associates Holdings, which is not currently a subsidiary of ours. On the Sunset Date, KKR will acquire control of Associates Holdings and will commence making decisions regarding the allocation of carried interest pursuant to the limited partnership agreement of Associates Holdings. Until the Sunset Date, our Co-Founders will continue to make decisions regarding the allocation of carried interest to themselves and others, pursuant to the limited partnership agreement of Associates Holdings, provided that any allocation of carried interest to the Co-Founders will be on a percentage basis consistent with past practice. For more information see “Certain Relationships and Related Transactions, and Director Independence—Reorganization Agreement,” “Certain Defined Terms Used in this Report” and “Business—Organizational Structure” in this report.
Carried interest, if any, from the carry pool in respect of any particular investment or fund is only paid in cash after all of the following are met: (i) a realization event has occurred (e.g., sale of a portfolio company, dividend, etc.); (ii) the vehicle has achieved positive overall investment returns since its inception, in excess of performance hurdles where applicable, and is accruing carried interest; and (iii) with respect to investments with a fair value below cost, cost has been returned to fund investors in an amount sufficient to reduce remaining cost to the investments' fair value. To the extent any "clawback" obligation is triggered, carried interest previously distributed by the fund would have to be returned to such fund, thereby
383
reducing the named executive officer's overall compensation for any such year. A portion of certain carried interest payable is generally not distributed to the recipient and is instead held in escrow in the recipient's name in order to enhance the recipient's ability to satisfy any future clawback obligation. Because the amount of carried interest payable is directly tied to the realized performance of the underlying investments, we believe this fosters a strong alignment of interests among the investors in those funds and the named executive officers, and thus benefits our stockholders. In addition, several of our competitors use participation in carried interest as an important incentive, and we believe that we must do the same in order to attract and retain the most qualified senior employees.
Participation in our carry pool for our senior employees, including our named executive officers, is subject only to service-based vesting with certain exceptions, including additional vesting upon death, disability or certain retirement events. In general, the vesting for carry pool allocations is over a four-year period (other than for our Co-Founders). Vesting serves as an employment retention mechanism and enhances the alignment of interests between a participant in our carry pool and the firm as well as the limited partners in our investment funds. Due to our Co-Executive Chairmen's status as Co-Founders of our firm, our Co-Founders are typically completely vested in their carry pool allocations upon grant.
Carry pool allocations after December 31, 2018, whether or not vested, are subject to forfeiture if the recipient violates his or her confidentiality and restrictive covenant agreement. See "—Narrative Disclosure to Summary Compensation Table and Grants of Plan‑Based Awards—Terms of Confidentiality and Restrictive Covenant Agreements."
Other Compensation
We have a program to match certain charitable donations made by our senior employees, including our executive officers, and we also pay for certain miscellaneous benefits for them, including tax preparation and financial planning services. In addition, our Co-Executive Chairmen are reimbursed by us for the use of a car and driver, and we pay for the compensation of certain personnel who administer personal matters for them. We believe that these benefits are appropriate in light of the time that they spend on our business, the limited compensation paid by us for their services and their unique status as Co-Founders of our firm.
Minimum Retained Ownership
While employed by us, unless waived in whole or in part, each of our named executive officers is required to hold at least 25% of the cumulative amount of restricted holdings units that have satisfied the vesting conditions during the duration of his or her employment with the firm. From time to time, the transfer restrictions and minimum retained ownership requirements applicable to any restricted stock units (which term includes the transfer-restricted shares of common stock that may have been delivered upon settlement of such restricted stock units) granted to certain of our named executive officers in the past have been and may be transferred to such employees' other restricted holdings units or common stock, if any, so that the total units or shares of equity subject to transfer restrictions and minimum retained ownership requirements are expected to be the same, unless waived.
Compensation and Risk
Our compensation program includes elements that we believe discourage excessive risk-taking and align the compensation of our employees with the long-term performance of the firm. For example, all compensation elements are allocated at the discretion of our firm or by our Co-Executive Chairmen or our Co-Chief Executive Officers based on the considerations described above, and a significant majority of the equity awards granted to our employees are subject to a multi-year vesting conditions, one- and two-year post-vesting transfer restriction periods and/or a minimum retained ownership requirement and subject to forfeiture in connection with the breach of certain restrictive covenant obligations. Because our equity awards typically have multi-year vesting provisions, the actual amount of compensation realized by the recipient will be tied to the long-term performance of our common stock. Pursuant to our internal policies, our employees are not permitted to buy or sell derivative securities, including for hedging purposes, or to engage in short-selling to hedge their economic risk of ownership. In addition, we only make cash payments of carried interest to our employees when profitable investments have been realized and after sufficient cash has been distributed to the investors in our funds. Moreover, the general partner of a fund is required to return carried interest distributions to the fund due to, for example, underperformance by the relevant fund subsequent to the payment of such carried interest. Accordingly, the employees would be subject to a "clawback," i.e., be required to return carried interest payments previously made, all of which further discourages excessive risk-taking by our personnel.
384
2023 Summary Compensation Table
The following table presents summary information concerning compensation that was paid for services rendered by our named executive officers during the fiscal years ended December 31, 2021, 2022 and 2023.
In 2021, 2022 and 2023, our named executive officers received dividends on shares of common stock they hold. Because these dividends are not considered to be compensation, they are not reflected as compensation in the table below. Distributions from KKR Holdings prior to its acquisition by KKR in May 2021 are also not included in the Compensation table below. There are certain contractual arrangements we entered into with KKR Holdings in October 2009 and thereafter, including a tax receivable agreement, which relate to payments to our named executive officers that are not compensatory and are described in "Certain Relationships and Related Transactions, and Director Independence."
Carried interest distributions to our named executive officers from the carry pool for the years ended December 31, 2021, 2022 and 2023 are reflected in the All Other Compensation column in the table below.
| Name and Principal Position | Year | Salary ($) | Bonus ($) | Stock Awards ($) (1) | All Other Compensation ($) (2) | Total ($) | |||||||||||||||||||||||||||||||||||
| Henry R. Kravis | 2023 | 300,000 | — | — | 34,976,652 | (3) | 35,276,652 | ||||||||||||||||||||||||||||||||||
Co-Executive Chairman | 2022 | 300,000 | — | 29,991,767 | 78,055,688 | 108,347,455 | |||||||||||||||||||||||||||||||||||
| 2021 | 300,000 | — | — | 67,154,677 | 67,454,677 | ||||||||||||||||||||||||||||||||||||
| George R. Roberts | 2023 | 300,000 | — | — | 34,918,579 | (4) | 35,218,579 | ||||||||||||||||||||||||||||||||||
Co-Executive Chairman | 2022 | 300,000 | — | 29,991,711 | 78,017,254 | 108,308,965 | |||||||||||||||||||||||||||||||||||
| 2021 | 300,000 | — | — | 67,209,901 | 67,509,901 | ||||||||||||||||||||||||||||||||||||
| Joseph Y. Bae | 2023 | 300,000 | 13,000,000 | — | 36,659,449 | (5) | 49,959,449 | ||||||||||||||||||||||||||||||||||
| Co-Chief Executive Officer | 2022 | 300,000 | 19,350,000 | — | 60,349,836 | 79,999,836 | |||||||||||||||||||||||||||||||||||
| 2021 | 300,000 | 24,700,000 | 476,261,500 | 58,374,648 | 559,636,148 | ||||||||||||||||||||||||||||||||||||
| Scott C. Nuttall | 2023 | 300,000 | 13,000,000 | — | 33,807,444 | (6) | 47,107,444 | ||||||||||||||||||||||||||||||||||
| Co-Chief Executive Officer | 2022 | 300,000 | 19,350,000 | — | 58,618,684 | 78,268,684 | |||||||||||||||||||||||||||||||||||
| 2021 | 300,000 | 24,700,000 | 442,161,500 | 55,980,932 | 523,142,432 | ||||||||||||||||||||||||||||||||||||
Robert H. Lewin | 2023 | 300,000 | 5,200,000 | 15,975,000 | 4,469,737 | (7) | 25,944,737 | ||||||||||||||||||||||||||||||||||
| Chief Financial Officer | 2022 | 300,000 | 5,950,000 | — | 8,178,845 | 14,428,845 | |||||||||||||||||||||||||||||||||||
| 2021 | 300,000 | 6,450,000 | 30,690,000 | 8,585,091 | 46,025,091 | ||||||||||||||||||||||||||||||||||||
| Dane E. Holmes (8) | 2023 | 1,250 | — | 26,190,667 | 322,950 | (9) | 26,514,867 | ||||||||||||||||||||||||||||||||||
| Chief Administrative Officer | |||||||||||||||||||||||||||||||||||||||||
| (1) | Stock awards reflected in the table above for each year presented represent the value of the restricted holdings units and granted in such reporting period and the grant of units in KKR Holdings ("KKR Holdings Units"), prior to the acquisition of KKR Holdings by KKR in May 2022. Fair value of the restricted holdings units and KKR Holdings Units granted to our named executive officers are calculated in accordance with Accounting Standards Codification Topic 718, Compensation-Stock Compensation ("ASC Topic 718"). See Note 19 "Equity Based Compensation" in our consolidated financial statements included elsewhere in this report for additional information about the valuation assumptions with respect to all grants reflected in this column. These amounts reflect the aggregate grant date fair values calculated under ASC Topic 718, and may not correspond to the actual value that will be recognized by our named executive officers. | ||||||||||||||||||||||||||||||||||||||||
| (2) | Carried interest is presented on the basis of cash received by our named executive officers in the respective fiscal year. We believe that presenting actual cash received by our named executive officers is a more representative disclosure of their compensation than presenting accrued carried interest, because carried interest is paid only if and when there are profitable realization events relating to the underlying investments. Carried interest also includes amounts retained and allocated for distribution to the respective named executive officer, but not yet distributed to the named executive officer, which could be used to fund potential future clawback obligations if any were to arise. | ||||||||||||||||||||||||||||||||||||||||
385
| (3) | Consists of $34,123,192 in cash payments of carried interest from the carry pool during 2023. For 2023, also consists of the following payments made by KKR (unless otherwise noted): $174,307 related to the cost of Mr. Kravis' and his spouse's use of a car and driver during 2023; $619,153 related to certain personnel who administer personal matters for Mr. Kravis during 2023 (the entire cost of which is reported, because we do not separately track whether their time is spent for business or personal reasons); $25,000 related to financial planning services fees; $25,000 related to tax preparation fees; and up to $10,000 of other miscellaneous benefits. SEC rules require that transportation and other expenses not directly and integrally related to our business be disclosed as compensation to Mr. Kravis. KKR also paid certain amounts for the use for KKR business of aircraft owned by an entity controlled by Mr. Kravis as described in “Certain Relationships and Related Party Transactions, Director Independence – Firm Use of Private Aircraft.” From time to time, family members and other personal guests of Mr. Kravis may accompany him on flights or otherwise on business travel, for which KKR incurs no incremental out of pocket cost. | ||||||||||||||||||||||||||||||||||||||||
| (4) | Consists of $34,055,679 in cash payments of carried interest from the carry pool during 2023. For 2023, also consists of the following payments made by KKR (unless otherwise noted): $195,035 related to the cost of Mr. Roberts' use of a car and driver during 2023; $557,865 related to certain personnel who administer personal matters for Mr. Roberts during 2023 (the entire cost of which is reported, because we do not separately track whether their time is spent for business or personal reasons); $25,000 related to financial planning services fees; $25,000 related to tax preparation fees; $50,000 of matching charitable donations; and up to $10,000 of other miscellaneous benefits. SEC rules require that transportation and other expenses not directly and integrally related to our business be disclosed as compensation to Mr. Roberts. KKR also paid certain amounts for the use for KKR business of aircraft owned by an entity controlled by Mr. Roberts as described in “Certain Relationships and Related Party Transactions, Director Independence – Firm Use of Private Aircraft.” From time to time, family members and other personal guests of Mr. Roberts may accompany him on flights or otherwise on business travel, for which KKR incurs no incremental out of pocket cost. | ||||||||||||||||||||||||||||||||||||||||
| (5) | Consists of $36,609,449 in cash payments of carried interest from the carry pool during 2023. For 2023, also consists of the following payments made by KKR (unless otherwise noted): $25,000 related to financial planning services fees and $25,000 related to tax preparation fees. From time to time, family members and other personal guests of Mr. Bae may accompany him on flights or otherwise on business travel, for which KKR incurs no incremental cost. | ||||||||||||||||||||||||||||||||||||||||
| (6) | Consists of $33,707,444 in cash payments of carried interest from the carry pool during 2023. For 2023, also consists of the following payments made by KKR (unless otherwise noted): $25,000 related to financial planning services fees; $25,000 related to tax preparation fees; and $50,000 of matching charitable donations. | ||||||||||||||||||||||||||||||||||||||||
| (7) | Consists of $4,369,737 in cash payments of carried interest from the carry pool during 2023. For 2023, also consists of the following payments made by KKR (unless otherwise noted): $25,000 related to financial planning services fees; $25,000 related to tax preparation fees and $50,000 of matching charitable donations. | ||||||||||||||||||||||||||||||||||||||||
| (8) | Mr. Holmes became one of our named executive officers in 2023, and therefore, only his compensation information for the fiscal year ended December 31, 2023 is provided in the table. Mr. Holmes's salary was pro-rated based on his partial year of service, beginning in December 2023. | ||||||||||||||||||||||||||||||||||||||||
| (9) | Consists of the following amounts paid in connection with Mr. Holmes prior service in 2023 as a director of KKR & Co. Inc.: $140,301 of fees earned or paid in cash and 3,029 restricted stock units (with a value of $182,649 which represents the aggregate grant date fair value of restricted stock units calculated in the same manner as described for other directors of KKR & Co. Inc. in the “Director Compensation” stock grant table below) granted on October 2, 2023, which were forfeited in connection with Mr. Holmes’ resignation as a director before the vesting date of October 1, 2024. The table excludes 4,134 restricted stock units granted on October 20, 2022 and vested on October 1, 2023, which were previously reported in our 2022 Annual Report, in connection with Mr. Holmes’ prior service as a director. | ||||||||||||||||||||||||||||||||||||||||
386
Grants of Plan-Based Awards in 2023
The following table provides supplemental information relating to grants of equity awards in the year ended December 31, 2023 provided in our 2023 Summary Compensation Table.
| Estimated Future Payouts Under Equity Incentive Plan Awards | |||||||||||||||||||||||
| Name | Grant Date | Threshold (#) | Target (#) | Maximum (#) | All Other Stock Awards: Number of Shares of Stock or Units (#) | Grant Date Fair Value of Stock and Options Awards ($) (1) | |||||||||||||||||
| Henry R. Kravis | — | — | — | — | — | $ | — | ||||||||||||||||
| George R. Roberts | — | — | — | — | — | $ | — | ||||||||||||||||
| Joseph Y. Bae | — | — | — | — | — | $ | — | ||||||||||||||||
| Scott C. Nuttall | — | — | — | — | — | $ | — | ||||||||||||||||
Robert H. Lewin (2) | 8/4/2023 | 100,000 (3) | — | 500,000 | — | $ | 15,975,000 | ||||||||||||||||
Dane E. Holmes (2) | 12/29/2023 | 40,000 (3) | — | 200,000 | — | $ | 11,374,000 | ||||||||||||||||
| 12/29/2023 | — | — | — | 200,000 | (2) | $ | 14,816,667 | ||||||||||||||||
(1)The amounts represent the grant date fair value of the KKR Holdings Units or restricted holdings units, as applicable, as calculated in accordance with ASC Topic 718. See Note 19 "Equity Based Compensation" in our consolidated financial statements included elsewhere in this report for additional information about the valuation assumptions with respect to all grants reflected in this table. These amounts reflect the aggregate grant date fair values calculated under ASC Topic 718 and may not correspond to the actual value that will be recognized by our named executive officers.
(2)The amounts represent restricted holdings units granted under our 2019 Equity Incentive Plan in the fiscal year ended December 31, 2023. The terms of these restricted holdings units are described under the caption "—Narrative Disclosure to Summary Compensation Table and Grants of Plan-Based Awards Table" below. The amount reported for Mr. Holmes excludes the 3,029 restricted stock units granted on October 2, 2023 in connection with Mr. Holmes’ service as a director, which were forfeited.
(3)20% of the award granted is eligible to vest at the threshold market price of $95.80 and additional tranches of the award are eligible to vest at various prices up to $135.80.
Narrative Disclosure to Summary Compensation Table and Grants of Plan-Based Awards Table
Terms of KKR Holdings Units
On May 31, 2022, KKR completed the Reorganization Mergers contemplated by the Reorganization Agreement pursuant to which KKR acquired KKR Holdings and all of the KKR Group Partnership Units held by it. Before the completion of the Reorganization Mergers, certain of our named executive officers held interests in our business through KKR Holdings Units.
Pursuant to the Reorganization Agreement, 500,000 outstanding KKR Holdings Units held by each of Messrs. Kravis and Roberts and 1,455,000 outstanding KKR Holdings Units held by each of Messrs. Bae and Nuttall, each of which had previously been scheduled to vest on October 1, 2022, were accelerated to vest immediately prior to the closing of the Reorganization Mergers, and such KKR Holdings Units became vested and received their allocable share of the common stock in connection with the Reorganization Mergers. The two-year transfer restrictions applicable to such KKR Holdings Units will continue to apply to the shares received in exchange therefor pursuant to the Reorganization Agreement until October 1, 2024 (with the customary one-year transfer restriction having expired on October 1, 2023). The 500,000 KKR Holdings Units held by each of Messrs. Kravis and Roberts were already considered fully vested given their age and years of service at KKR.
In addition, KKR Holdings allocated 1,150,000 KKR Holdings Units to each of Messrs. Bae and Nuttall, of which 30% had been subject to forfeiture had such executive not been employed by KKR on October 1, 2022 (except in the case of death or permanent disability). The number of KKR units allocated to Messrs. Bae and Nuttall was determined by Messrs. Kravis and Roberts, and the allocations were made as part of the Reorganization Mergers, which were approved by our board of directors following the recommendation of our conflicts committee. These KKR Holdings Units were exchanged for shares of common stock in connection with the Reorganization Mergers and are subject to customary one- and two-year transfer restrictions with the two-year transfer restriction applying until October 1, 2024 (with the customary one-year transfer restriction having expired on October 1, 2023). In addition, Messrs. Kravis and Roberts were authorized to allocate the balance of any outstanding and unallocated KKR Holdings Units, in their sole discretion, to themselves or others, on such terms as they determined, prior to the
387
closing of the Reorganization Mergers. In May 2022, KKR Holdings allocated 535,185 and 535,184 KKR Holdings Units to each of Messrs. Kravis and Roberts, respectively, which were fully vested upon allocation.
Terms of Restricted Holdings Units
Restricted holdings units granted under our 2019 Equity Incentive Plan are equity awards, for which the number of shares of common stock in respect of such awards is subject to the overall limitation on the number of shares of common stock that may be awarded under the 2019 Equity Incentive Plan. The overall restricted holdings units program was approved by a committee of independent directors of our board of directors. KKR's independent directors are ineligible to receive restricted holdings units.
In general, restricted holdings units are subject to either (i) a service-based vesting condition with vesting in annual installments over a multi‑year period (generally three to five years) from a specified date, subject to the recipient's continued employment with us on the applicable vesting dates, subject to exceptions, or (ii) a market price-based vesting condition where the portion of the units that satisfies stock price target requirements will vest on a scheduled vesting date (generally five years from the grant date), subject to the recipient's continued employment with us on the scheduled vesting date, subject to exceptions. Certain restricted holdings units agreements may also contain additional vesting requirements.
Restricted holdings units provide the holder the ability, after vesting and the satisfaction of certain other conditions, to exchange them for shares of our common stock on a one-for-one basis (or at the discretion of KKR, cash in an amount equal to the fair market value of the shares of common stock that would otherwise be deliverable in such exchange). There is no tax receivable agreement in place for such exchange of restricted holdings units granted under the 2019 Equity Incentive Plan, and therefore, we will receive 100% of any tax benefits arising from the exchange of restricted holdings units granted under that plan. Prior to vesting, restricted holdings units are not entitled to any distributions from us. Following vesting, restricted holdings units become entitled to receive distributions from us. The amount of distribution per vested restricted holdings unit is equal to the amount distributed on one KKR Group Partnership Unit. To the extent that distributions are made on a KKR Group Partnership Unit that corresponds to a restricted holdings units that is not vested, such distribution amount will be allocated or otherwise applied in a manner we may determine in our discretion. Upon vesting, restricted holdings units are generally subject to additional restrictions, including transfer restrictions, which typically lasts for (1) one year with respect to one-half of the units vesting on such vesting date and (2) two years with respect to the other one-half of the units vesting on such vesting date, and minimum retained ownership requirements, which obligate the recipients to continuously hold at least 25% of their cumulatively vested restricted holdings units, unless waived. Transfer restricted units become fully vested and transferable and may be exchanged into shares of common stock at the end of the transfer restriction period if the holder is not terminated for cause and has complied with the terms of his or her confidentiality and restrictive covenant agreement during the transfer restrictions period. See "—Terms of Confidentiality and Restrictive Covenant Agreements" below.
Terms of Confidentiality and Restrictive Covenant Agreements
The confidentiality and restrictive covenant agreements with each of our named executive officers include prohibitions on them competing with us or soliciting our fund investors, clients or employees while employed by us and during a restricted period following their departure from the firm. These agreements also have non-disparagement obligations and require our named executive officers to protect and use the firm's confidential information only in accordance with confidentiality restrictions set forth in the agreement.
The restricted periods for our Co‑Executive Chairmen expire two years from termination for both the prohibitions on competition with us and the prohibitions on the solicitation of our fund investors, clients and employees. In cases where a Co-Executive Chairman is terminated involuntarily and for reasons not constituting cause, such periods are reduced to one year from termination. The restricted periods for our other named executive officers expire (1) in the case of the prohibitions on competition with us, 12 months from termination and (2) in the case of the prohibitions on the solicitation of our fund investors, clients, and employees, 15 months from termination. These agreements also require that we, and our Co-Executive Chairmen and other named executive officers, provide advance notice prior to termination of employment.
Our named executive officers (other than our Co‑Executive Chairmen) have entered into these confidentiality and restrictive covenant agreements with us through their restricted holdings unit grant agreements. Because our Co‑Executive Chairmen have not received any restricted holdings units from us, their confidentiality and restrictive covenant agreements were solely with KKR Holdings, which KKR acquired in May 2022.
Notwithstanding the foregoing, KKR complies with California's ban on non-competition provisions as provided in California Business and Professional Code Section 16600, and all terms relating to non-competition following the termination of a named executive officer's employment in California, are void.
388
Outstanding Equity Awards at 2023 Fiscal Year‑End
The following table sets forth information concerning unvested restricted holdings units for each of the named executive officers as of December 31, 2023.
| Stock Awards | |||||||||||||||||
| Name | Number of Shares or Units of Stock that Have Not Vested (#) | Market Value of Shares or Units of Stock that Have Not Vested ($) (1) | Equity Incentive Plan Awards: Number of Unearned Shares, Units or Other Rights That Have Not Vested (#) | Equity Incentive Plan Awards: Market or Payout Value of Unearned Shares, Units or Other Rights That Have Not Vested ($) (1) | |||||||||||||
| Henry R. Kravis | — | $ | — | — | $ | — | |||||||||||
| George R. Roberts | — | $ | — | — | $ | — | |||||||||||
| Joseph Y. Bae | 1,000,000 (2) | $ | 82,850,000 | 7,500,000 (3) | $ | 621,375,000 | |||||||||||
| Scott C. Nuttall | — | $ | — | 7,500,000 (4) | $ | 621,375,000 | |||||||||||
| Robert H. Lewin | 900,000 (5) | $ | 74,565,000 | 500,000 (6) | $ | 41,425,000 | |||||||||||
| Dane E. Holmes | 200,000 (7) | $ | 16,570,000 | 200,000 (8) | $ | 16,570,000 | |||||||||||
(1)These amounts are based on the closing market price of our common stock on the last trading day of the year ended December 31, 2023, which was $82.85 per share.
(2)Includes 1,000,000 restricted holdings units granted on February 18, 2021 ("2021 Grant"), the vesting of which was subject to the average closing price of our common stock during 20 consecutive trading days meeting or exceeding certain specified stock price targets between $45.00 and $70.00 per share, all of which were achieved prior to December 31, 2021. These 2021 Grant restricted holdings units will vest on May 1, 2026 if the named executive officer continues to serve as an employee until that date, subject to certain exceptions.
(3)Represents 7,500,000 restricted holdings units granted on December 9, 2021, which will vest upon the average closing price of our common stock during 20 consecutive trading days meeting or exceeding specified stock price targets ranging from $95.80 to $135.80. Restricted holdings units that satisfy this market price vesting condition are eligible to vest beginning on December 31, 2026, if the named executive officer continues to serve as an employee until that date, subject to certain exceptions, and will expire if not vested on or prior to December 31, 2028.
(4)Represents 7,500,000 restricted holdings units granted on December 9, 2021, which will vest upon the average closing price of our common stock during 20 consecutive trading days meeting or exceeding specified stock price targets ranging from $95.80 to $135.80. Restricted holdings units that satisfy this market price vesting condition are eligible to vest beginning on December 31, 2026, if the named executive officer continues to serve as an employee until that date, subject to certain exceptions, and will expire if not vested on or prior to December 31, 2028.
(5)Represents 900,000 restricted holdings units granted on February 18, 2021, the vesting of which was subject to the average closing price of our common stock during 20 consecutive trading days meeting or exceeding certain specified stock price targets between $45.00 and $70.00 per share, all of which were achieved prior to December 31, 2021. These restricted holdings units will vest on May 1, 2026 if the named executive officer continues to serve as an employee until that date, subject to certain exceptions.
(6)Represents 500,000 restricted holdings units granted on August 4, 2023, which will vest upon the average closing price of our common stock during 20 consecutive trading days meeting or exceeding specified stock price targets ranging from $95.80 to $135.80. Restricted holdings units that satisfy this market price vesting condition are eligible to vest beginning on December 31, 2028, if the named executive officer continues to serve as an employee until that date, subject to certain exceptions, and will expire if not vested on or prior to December 31, 2029.
(7)Represents (i) 200,000 restricted holdings units granted on December 29, 2023, which will vest in six equal annual installments beginning October 1, 2024 and then each May 1st from May 1, 2025 through May 1, 2029, subject to the named executive officer’s continued service as an employee on each vesting date.
(8)Represents 200,000 restricted holdings units granted on December 29, 2023, which will vest upon the average closing price of our common stock during 20 consecutive trading days meeting or exceeding specified stock price targets ranging from $95.80 to $135.80. Restricted holdings units that satisfy this market price vesting condition are eligible to vest beginning on December 31, 2028, if the named executive officer continues to serve as an employee until that date, subject to certain exceptions, and will expire if not vested on or prior to December 31, 2029.
389
Option Exercises and Stock Vested in 2023
The following table sets forth information concerning the vesting of restricted stock units held by each of our named executive officers during the year ended December 31, 2023.
| Stock Awards | |||||||||||||||||||||||||||||||||||
| Name | Number of Shares Acquired on Vesting (#) | Value Realized on Vesting ($) | |||||||||||||||||||||||||||||||||
| Henry R. Kravis | — | $ | — | ||||||||||||||||||||||||||||||||
| George R. Roberts | — | $ | — | ||||||||||||||||||||||||||||||||
| Joseph Y. Bae | — | $ | — | ||||||||||||||||||||||||||||||||
| Scott C. Nuttall | — | $ | — | ||||||||||||||||||||||||||||||||
| Robert H. Lewin | — | $ | — | ||||||||||||||||||||||||||||||||
Dane E. Holmes (1) | — | $ | — | ||||||||||||||||||||||||||||||||
(1)Excludes the 4,134 restricted stock units granted on October 20, 2022 in connection with Mr. Holmes’ service as a director, which vested on October 1, 2023.
Pension Benefits for 2023
We provided no pension benefits during the fiscal year ended December 31, 2023.
Nonqualified Deferred Compensation for 2023
We provided no defined contribution plan for the deferral of compensation on a basis that is not tax‑qualified during the fiscal year ended December 31, 2023.
Potential Payments Upon Termination or Change in Control
Upon termination of employment (other than due to death or permanent disability), vesting generally ceases for restricted holdings units that have not vested. In addition, transfer-restricted vested restricted holdings units remain subject to transfer restrictions for one- and two-year periods, except as described below. See "Security Ownership of Certain Beneficial Owners and Management and Related Stockholder Matters" for additional information regarding the common stock held by our named executive officers.
In general, a named executive officer who retires after the first date on which his or her age plus years of service to KKR equals 80 ("qualified retirement") will generally (i) vest in his or her unvested restricted holdings units (for those with service based vesting conditions) that would otherwise vest within two years following retirement and (ii) vest in a pro rata portion of his or her unvested and restricted holdings units (for those with market price based vesting conditions) that satisfied the stock price target requirements at the time of qualified retirement, in each case, subject to compliance, if applicable, with the requirement that the holder not violate the terms and conditions of his or her confidentiality and restrictive covenants during the period in which such restricted holdings units, if applicable, remains transfer restricted over the one- and two-year periods from the original vesting date. However, the additional vesting terms upon a qualified retirement do not apply to the restricted holdings units awarded to the Co-Chief Executive Officers in December 2021.
Upon death or permanent disability, generally (i) a holder of restricted holdings units (for those with service based vesting conditions) will become vested with respect to service based vesting conditions in all restricted holdings units, respectively, and (ii) a holder of restricted holdings units (for those with market price based conditions) will be eligible to vest in a pro rata portion of his or her unvested restricted holdings units that satisfy the stock price target requirements at a prescribed time, which include the time of death or permanent disability or at the end of the service based vesting requirement. Upon vesting, restricted holdings units will become permitted to be exchanged into shares of common stock after the applicable transfer restrictions following vesting have lapsed. In addition, upon a change in control of KKR, a holder of restricted holdings units may become immediately vested in all unvested restricted holdings units. The values of unvested restricted holdings units held by the named executive officers as of December 31, 2023 are set forth above in "—Outstanding Equity Awards at 2023 Fiscal Year-End."
390
Upon termination of employment, vesting generally ceases for carried interest allocations, some of which are subject to forfeiture for breach of the confidentiality and restrictive covenant agreement, to the extent permitted under applicable law. In addition, carried interest allocations generally become immediately vested upon death or disability, and certain carried interest allocations permit additional vesting upon retirement.
Pay Ratio Disclosure
For the fiscal year ended December 31, 2023:
•the median of the annual total compensation of all employees of our company (other than Messrs. Bae and Nuttall, who are our Co-Chief Executive Officers as of December 31, 2023) was $202,500;
•the annual total compensation of Messrs. Bae and Nuttall were $49,959,449 and $47,107,444, respectively; and
•the ratio of the averaged annual total compensation of our Co-Chief Executive Officers to the median of the annual total compensation of all other employees was 240 to 1.
To identify the median employee for the purpose of providing the information above, we examined the compensation of all our current employees (other than our Co-Chief Executive Officers) as of December 31, 2023, using, based on our payroll records, a consistently applied compensation measure consisting of such employees' annual salary, annual cash bonus, actual overtime, carried interest payouts and equity granted. Employees on unpaid leave of absence, employees who gave notice of departure and were not part of the regular year-end compensation process are excluded from the calculation. Compensation of employees who were employed for less than the full year of 2023 were annualized only if they were part of the regular year-end compensation process. The calculation excludes our non-U.S. employees based in India. These 178 employees comprise less than 5% of our total 4,440 U.S. and non.-U.S. employees included for purposes of this calculation (which amount includes our employees based in India). We reviewed all compensation in U.S. dollars, using the relevant exchange rate for any compensation paid in other currencies. After identifying the median employee, we calculated annual total compensation for such employee using the same methodology we use for our principal executive officers as set forth in "—2023 Summary Compensation Table." As noted in “—Compensation Discussion and Analysis," distributions from KKR Holdings and dividends paid on shares of common stock are not considered compensation and accordingly are not included in the pay ratio calculation above. The above CEO pay ratio represents a reasonable good faith estimate, calculated in a manner consistent with SEC rules based on our payroll and employment records and the methodology described above.
Director Compensation
We limit compensation for service on our board of directors to the independent directors. During 2023, each independent director received (1) an annual cash retainer of $110,000, which increased to $130,000 effective September 20, 2023, (2) an additional annual cash retainer of $15,000 if such independent director is a member of the nominating and corporate governance committee, (3) an additional annual cash retainer of $25,000 if such independent director is a member of the audit committee and an additional annual cash retainer of $25,000 (in addition to the annual cash retainer as a member of the audit committee) if such independent director serves as the chairman of the audit committee, (4) an additional annual cash retainer of $10,000 if such independent director is a member of the conflicts committee, which increased to $15,000 effective September 20, 2023, and an additional annual cash retainer of $15,000 (in addition to the annual cash retainer as a member of the conflicts committee) if such independent director serves as the chairman of the conflicts committee, and (5) an additional annual cash retainer of $20,000 if such independent director is a member of the risk committee and an additional annual cash retainer of $20,000 (in addition to the annual cash retainer as a member of the risk committee) if such independent director serves as the chairman of the risk committee.
391
Cash retainers are pro-rated if, during the fiscal year, a director joins or resigns from the board of directors, a director joins or resigns from a committee or the amount of a retainer is increased or decreased. In addition, on October 2, 2023, restricted stock units were granted to each independent director pursuant to our 2019 Equity Incentive Plan.
| Name | Fees Earned or Paid in Cash ($) | Stock Awards ($) (1) | Total ($) | ||||||||
| Adriane M. Brown | 126,658 | 182,649 | 309,307 | ||||||||
| Matthew R. Cohler | 144,726 | 182,649 | 327,375 | ||||||||
| Mary N. Dillon | 138,068 | 182,649 | 320,717 | ||||||||
Joseph A. Grundfest (2) | 80,000 | — | 80,000 | ||||||||
Arturo Gutiérrez Hernández | 127,055 | 182,649 | 309,704 | ||||||||
John B. Hess (3) | 55,000 | — | 55,000 | ||||||||
Dane E. Holmes (4) | 140,301 | 182,649 | 322,950 | ||||||||
Raymond J. McGuire (5) | 63,014 | — | 63,014 | ||||||||
| Xavier B. Niel | 115,644 | 182,649 | 298,293 | ||||||||
Kimberly A. Ross (6) | 36,685 | 182,649 | 219,334 | ||||||||
| Patricia F. Russo | 140,822 | 182,649 | 323,471 | ||||||||
| Robert W. Scully | 182,808 | 182,649 | 365,457 | ||||||||
| Evan T. Spiegel | 115,644 | 182,649 | 298,293 | ||||||||
(1)Represents the aggregate grant date fair value of restricted stock units granted to each of the independent directors during the year ended December 31, 2023 as calculated in accordance with ASC Topic 718. See Note 19 "Equity Based Compensation" in our consolidated financial statements included elsewhere in this report for additional information about the valuation assumptions with respect to all grants reflected in this column. These amounts reflect the aggregate grant date fair values calculated under ASC Topic 718 and may not correspond to the actual value that will be recognized by the independent directors.
(2)Mr. Grundfest retired from our board of directors in June 2023. The 4,134 restricted stock units granted to Mr. Grundfest on October 20, 2022 vested and were settled into an equal number of shares of KKR common stock on October 1, 2023.
(3)Mr. Hess retired from our board of directors in June 2023. The 4,134 restricted stock units granted to Mr. Hess on October 20, 2022 vested and were settled into an equal number of shares of KKR common stock on October 1, 2023.
(4)In connection with his appointment as Chief Administrative Officer, Mr. Holmes resigned as a director in December 2023. Accordingly, his compensation is presented above in the "2023 Summary Compensation Table" and related sections in light of Mr. Holmes' status as a named executive officer in 2023. The 3,029 restricted stock units granted to Mr. Holmes on October 2, 2023 were forfeited in connection with Mr. Holmes' resignation as a director before the vesting date of October 1, 2024.
(5)Mr. McGuire retired from our board of directors in June 2023. The 4,134 restricted stock units granted to Mr. McGuire on October 20, 2022 vested and were settled into an equal number of shares of KKR common stock on October 1, 2023.
(6)Ms. Ross was appointed to our board of directors on September 20, 2023.
392
The following table details grants of restricted stock units to each independent director in the year ended December 31, 2023. The table includes the grant date and grant date fair value of 2023 restricted stock units and the aggregate number of unvested restricted stock units as of December 31, 2023 owned by each independent director who served as a director during the year ended December 31, 2023:
| Name | Grant Date (1) | Stock Awards (#) | Grant Date Fair Value ($) (2) | Total Number of Unvested Stock Awards on December 31, 2023 (#) | ||||||||||
| Adriane M. Brown | 10/2/2023 | 3,029 | 182,649 | 3,029 | ||||||||||
| Matthew R. Cohler | 10/2/2023 | 3,029 | 182,649 | 3,029 | ||||||||||
| Mary N. Dillon | 10/2/2023 | 3,029 | 182,649 | 3,029 | ||||||||||
Joseph A. Grundfest (3) | — | — | — | — | ||||||||||
Arturo Gutiérrez Hernández | 10/2/2023 | 3,029 | 182,649 | 3,029 | ||||||||||
John B. Hess (4) | — | — | — | — | ||||||||||
Dane E. Holmes (5) | 10/2/2023 | 3,029 | 182,649 | — | ||||||||||
Raymond J. McGuire (6) | — | — | — | — | ||||||||||
| Xavier B. Niel | 10/2/2023 | 3,029 | 182,649 | 3,029 | ||||||||||
Kimberly A. Ross (7) | 10/2/2023 | 3,029 | 182,649 | 3,029 | ||||||||||
| Patricia F. Russo | 10/2/2023 | 3,029 | 182,649 | 3,029 | ||||||||||
| Robert W. Scully | 10/2/2023 | 3,029 | 182,649 | 3,029 | ||||||||||
| Evan T. Spiegel | 10/2/2023 | 3,029 | 182,649 | 3,029 | ||||||||||
(1)The restricted stock units were granted on October 2, 2023 and will vest on October 1, 2024, subject to the grantee's continued service through the vesting date. The grants were each approved by the board of directors on September 20, 2023.
(2)Represents the grant date fair value of restricted stock units granted to each of the independent directors during the year ended December 31, 2023 as calculated in accordance with ASC Topic 718. See Note 19 "Equity Based Compensation" in our consolidated financial statements included elsewhere in this report for additional information about the valuation assumptions with respect to all grants reflected in this column. These amounts reflect the aggregate grant date fair values calculated under ASC Topic 718 and may not correspond to the actual value that will be recognized by the independent directors.
(3)Mr. Grundfest retired from our board of directors in June 2023. The 4,134 restricted stock units granted to Mr. Grundfest on October 20, 2022 vested and were settled into an equal number of shares of KKR common stock on October 1, 2023.
(4)Mr. Hess retired from our board of directors in June 2023. The 4,134 restricted stock units granted to Mr. Hess on October 20, 2022 vested and were settled into an equal number of shares of KKR common stock on October 1, 2023.
(5)In connection with his appointment as chief administrative officer, Mr. Holmes resigned as a director in December 2023. Accordingly, his compensation is presented above in the "2023 Summary Compensation Table" and related sections in light of Mr. Holmes' status as named executive officer in 2023. The 3,029 restricted stock units granted to Mr. Holmes on October 2, 2023 were forfeited on December 13, 2023, in connection with Mr. Holmes' resignation as a director before the vesting date of October 1, 2024, which required his continued service through that vesting date.
(6)Mr. McGuire retired from our board of directors in June 2023. The 4,134 restricted stock units granted to Mr. McGuire on October 20, 2022 vested and were settled into an equal number of shares of KKR common stock on October 1, 2023.
(7)Ms. Ross was appointed to our board of directors on September 20, 2023.
KKR & Co. Inc. Equity Incentive Plan
Our outstanding equity awards were granted under the Amended and Restated KKR & Co. Inc. 2019 Equity Incentive Plan, which we refer to as our 2019 Equity Incentive Plan. Following the effectiveness of our 2019 Equity Incentive Plan, it is our only plan for providing equity awards. Our 2019 Equity Incentive Plan has a term of 10 years from the effective date.
Administration
Our board of directors or a committee or subcommittee thereof administers or will administer, as applicable, our Equity Incentive Plan (the "Administrator"). The Administrator has the authority to make all decisions, determinations and interpretations with respect to the administration of our 2019 Equity Incentive Plan, including determining who will receive awards thereunder, the number of shares of common stock underlying the awards and the terms and conditions of the awards, and is permitted, subject to applicable law, to delegate all or any part of its responsibilities and powers to any employee or employees selected by it in accordance with the terms of the 2019 Equity Incentive Plan. The board of directors authorized its executive committee (consisting of Messrs. Kravis and Roberts) to act as the Administrator under the 2019 Equity Incentive
393
Plan, provided that (i) the Executive Committee is not authorized to make grants with respect to the executive officers without approval of the board of directors and (ii) the board of directors reserved the power and authority to act as the Administrator and to modify the power and authority of the Executive Committee under the 2019 Equity Incentive Plan.
Common Stock Subject to the Plan
As of December 31, 2023, 46,426,437 shares of common stock were available for issuance in respect of outstanding awards and the grant of future awards, representing 15% of the Diluted Common Shares outstanding at the close of business on December 31, 2023, minus the number of shares underlying any outstanding equity awards granted under our 2019 Equity Incentive Plan that have not yet been delivered upon vesting. Under the 2019 Equity Incentive Plan, the aggregate number of shares of common stock available under the plan will be increased, on the first day of each fiscal year, by a number of shares of common stock equal to the positive difference, if any, between (x) 15% of the number of Diluted Common Shares outstanding at the close of business on the last day of the immediately preceding fiscal year minus (y) the number of shares of common stock available for issuance in respect of outstanding awards and the grant of future awards, in each case, under our 2019 Equity Incentive Plan as of the last day of such year, unless the Administrator in its sole discretion should decide to increase the number of shares of common stock available under the plan by a lesser amount on any such date. As a result, on the first day of each fiscal year, the number of shares of common stock available for issuance of future awards under our 2019 Equity Incentive Plan will be adjusted upwards to 15% of the number of Diluted Common Shares outstanding at the close of business on the last day of the immediately preceding fiscal year, minus the number of shares underlying any outstanding equity awards granted under our 2019 Equity Incentive Plan that have not yet been delivered upon vesting. Therefore, we expect that the number of shares of common stock available for issuance of future awards under our 2019 Equity Incentive Plan will increase at the beginning of each fiscal year compared to the end of the immediately preceding fiscal year if, during the immediately preceding year, there has been (i) any increase in the aggregate number of shares of common stock and KKR Group Partnership Units outstanding or (ii) any delivery of underlying shares upon vesting of outstanding equity awards under our 2019 Equity Incentive Plan.
Restricted Stock Units and Other Equity-Based Awards
The Administrator may grant or sell awards of restricted stock units, restricted holdings units, common stock, restricted common stock, deferred restricted common stock, phantom restricted common stock, or any other awards that are valued in whole or in part by reference to, or are otherwise based on the fair market value of, our common stock. Any of these or other equity-based awards may be in such form, and dependent on such conditions, as the Administrator determines, including the right to receive, or vest with respect to, one or more shares of common stock (or the equivalent cash value of such shares) upon the completion of a specified period of service, the occurrence of an event and/or the attainment of performance objectives. The Administrator may determine whether any such equity-based awards will be payable in cash, shares of common stock or other assets or a combination of cash, common stock and other assets.
Options and Stock Appreciation Rights
The Administrator may award non-qualified stock options and stock appreciation rights. Options and stock appreciation rights granted under the 2019 Equity Incentive Plan will become vested and exercisable at such times and upon such terms and conditions as may be determined by the Administrator at the time of grant, but no option or stock appreciation right will be exercisable for a period of more than ten years after it is granted. The exercise price per share will be determined by the Administrator, provided that options and stock appreciation rights granted to participants who are U.S. taxpayers will not be granted with an exercise price less than 100% of the fair market value per share of common stock on the date of grant. To the extent permitted by the Administrator, the exercise price of an option may be paid in cash or its equivalent, in shares of common stock having a fair market value equal to the aggregate exercise price and satisfying such other requirements as may be imposed by the Administrator, partly in cash and partly in shares of common stock or net settlement in shares of common stock. As determined by the Administrator, stock appreciation rights may be settled in shares of common stock, cash or any combination thereof.
Compensation Committee Interlocks and Insider Participation
Because we are a "controlled company" within the meaning of the corporate governance standards of the NYSE, our board of directors is not required by NYSE rules to establish a compensation committee. Messrs. Kravis and Roberts, our Co-Executive Chairmen, participated in discussions regarding executive compensation, and Messrs. Bae and Nuttall, our Co-Chief Executive Officers, participated in discussions regarding the compensation of our other executive officers. For a description of certain transactions between us and our executive officers and directors, see "Certain Relationships and Related Transactions, and Director Independence."
394
Compensation Committee Report
Our board of directors does not have a compensation committee. The entire board of directors has reviewed and discussed with management the foregoing Compensation Discussion and Analysis and, based on such review and discussion, has determined that the Compensation Discussion and Analysis should be included in this report.
| Henry R. Kravis | |||||
| George R. Roberts | |||||
| Joseph Y. Bae | |||||
| Scott C. Nuttall | |||||
| Adriane M. Brown | |||||
| Matthew R. Cohler | |||||
| Mary N. Dillon | |||||
Arturo Gutiérrez Hernández | |||||
| Xavier B. Niel | |||||
| Kimberly A. Ross | |||||
| Patricia F. Russo | |||||
| Robert W. Scully | |||||
| Evan T. Spiegel | |||||
395
ITEM 12. SECURITY OWNERSHIP OF CERTAIN BENEFICIAL OWNERS AND MANAGEMENT AND RELATED STOCKHOLDER MATTERS
The following table sets forth the beneficial ownership of our common stock by:
•each person known to us to beneficially own more than 5% of our common stock based on our review of filings with the SEC;
•each of our directors and named executive officers; and
•our directors and executive officers as a group.
The percentage of beneficial ownership is based on 885,005,588 shares of common stock issued and outstanding as of February 27, 2024. Beneficial ownership is in each case determined in accordance with the rules of the SEC, and includes equity securities of which that person has the right to acquire beneficial ownership within 60 days of February 27, 2024. Under these rules, more than one person may be deemed a beneficial owner of the same securities and a person may be deemed a beneficial owner of securities as to which he has no economic interest. The table below does not reflect ownership of the sole outstanding share of our Series I preferred stock by KKR Management LLP, which exercises significant voting power as set forth in our certificate of incorporation.
Name (1) | Common Stock Beneficially Owned (2) | Percentage of Common Stock Beneficially Owned | |||||||||||||||||||||||||||
George R. Roberts (3) | 88,192,855 | 9.97% | |||||||||||||||||||||||||||
Henry R. Kravis (4) | 83,370,688 | 9.42 | |||||||||||||||||||||||||||
Scott C. Nuttall (5) | 21,064,424 | 2.38 | |||||||||||||||||||||||||||
Joseph Y. Bae (6) | 18,331,070 | 2.07 | |||||||||||||||||||||||||||
| Adriane M. Brown | 7,398 | * | |||||||||||||||||||||||||||
Matthew R. Cohler (7) | 93,301 | * | |||||||||||||||||||||||||||
| Mary N. Dillon | 23,118 | * | |||||||||||||||||||||||||||
| Arturo Gutiérrez Hernández | 8,513 | * | |||||||||||||||||||||||||||
| Xavier B. Niel | 26,006 | * | |||||||||||||||||||||||||||
| Kimberly A. Ross | 0 | * | |||||||||||||||||||||||||||
| Patricia F. Russo | 82,592 | * | |||||||||||||||||||||||||||
| Robert W. Scully | 170,592 | * | |||||||||||||||||||||||||||
| Evan T. Spiegel | 6,613 | * | |||||||||||||||||||||||||||
| Robert H. Lewin | 1,209,226 | * | |||||||||||||||||||||||||||
| Dane E. Holmes | 8,513 | * | |||||||||||||||||||||||||||
Directors and executive officers as a group (20 persons) (3)(4)(5)(6)(8) | 212,774,908 | 24.04% | |||||||||||||||||||||||||||
*Less than 1.0%.
(1)The address of each director is c/o KKR & Co. Inc., 30 Hudson Yards, New York, New York, 10001. The address of each executive officer, except Mr. Roberts, is c/o Kohlberg Kravis Roberts & Co. L.P., 30 Hudson Yards, New York, New York 10001. The address of Mr. Roberts is c/o Kohlberg Kravis Roberts & Co. L.P., 2800 Sand Hill Road, Suite 200, Menlo Park, California 94025.
(2)Unless otherwise indicated, each individual has sole voting power and sole investment power with respect to the shares owned.
(3)Includes (i) 2,130,000 shares held by a charitable foundation over which Mr. Roberts has shared voting power and (ii) 1,043,242 shares held by a limited partnership over which Mr. Roberts has sole investment power.
(4)Includes (i) 15,277 shares held by Mr. Kravis's spouse over which Mr. Kravis may be deemed to share investment and voting power and (ii) 1,549,369 shares held by a limited partnership over which Mr. Kravis has sole investment power.
(5)Includes (i) 129,301 shares held by a trust over which Mr. Nuttall has the right to acquire shared investment and voting power, (ii) 2,782 shares held by a limited liability company over which Mr. Nuttall may be deemed to share investment and voting power, and (iii) 920,000 shares held by a charitable foundation over which Mr. Nuttall has shared voting power, which shares have not been sold as of the date of this filing. Not included in the table above is 211,540 shares held by a charitable foundation for which Mr. Nuttall has non-binding advisory powers, which shares have not been sold as of the date of this filing.
(6)Includes 384,257 shares held by a trust over which Mr. Bae has the right to acquire shared investment and voting power. Not included in the table above is 250,000 shares held by a charitable foundation for which Mr. Bae has non-binding advisory powers, which shares have not been sold as of the date of this filing.
(7)The shares that Mr. Cohler beneficially owns are held by a trust over which Mr. Cohler has shared investment and voting power.
396
(8)Includes 179,999 restricted holdings units which are vested or scheduled to vest within 60 days of February 27, 2024.
Securities Authorized for Issuance under 2019 Equity Compensation Plan
The table set forth below provides information concerning the awards that may be issued under our 2019 Equity Incentive Plan as of December 31, 2023.
Number of Securities to be Issued Upon Exercise of Outstanding Options, Warrants and Rights (1) | Weighted‑Average Exercise Price of Outstanding Options, Warrants and Rights | Number of Securities Remaining Available for Future Issuance Under Equity Compensation Plans (excluding securities reflected in the first column) (2) | |||||||||
| Equity Compensation Plan Approved by Security Holders | 80,339,872 | — | 46,426,437 | ||||||||
| Equity Compensation Plan Not Approved by Security Holders | — | — | — | ||||||||
| Total | 80,339,872 | — | 46,426,437 | ||||||||
(1)Reflects the aggregate number of restricted stock units granted under our 2019 Equity Incentive Plan and outstanding as of December 31, 2023.
(2)The aggregate number of shares of common stock available under our 2019 Equity Incentive Plan is increased, on the first day of each fiscal year, by a number of shares of common stock equal to the positive difference, if any, between (x) 15% of the number of diluted shares of common stock outstanding at the close of business on the last day of the immediately preceding fiscal year minus (y) the number of shares of common stock available for issuance in respect of outstanding awards and the grant of future awards, in each case, under our 2019 Equity Incentive Plan as of the last day of such year, unless the Administrator in its sole discretion should decide to increase the number of shares of common stock available under the plan by a lesser amount on any such date. We have filed registration statements on Form S-8 under the Securities Act to register shares of common stock covered by our Equity Incentive Plans. Accordingly, upon issuance pursuant to our 2019 Equity Incentive Plan, these shares of common stock will be available for sale in the open market.
397
ITEM 13. CERTAIN RELATIONSHIPS AND RELATED TRANSACTIONS, AND DIRECTOR INDEPENDENCE
The following description is a summary of the material terms of the agreements described below, and does not contain all of the information that you may find useful. For additional information, you should read the copies of such agreements, all of which have been previously filed with the SEC or incorporated by reference as exhibits to this report.
Reorganization Agreement
On October 8, 2021, KKR entered into a Reorganization Agreement with KKR Holdings, Associates Holdings, KKR Management (the holder of the sole outstanding share of Series I preferred stock), and the other parties thereto. Pursuant to the Reorganization Agreement, the parties agreed to undertake a series of integrated transactions to effect a number of transformative structural and governance changes, including (a) the acquisition by KKR of KKR Holdings and all of the KKR Group Partnership Units held by it (which as noted below is completed), (b) the future elimination of voting control by KKR Management and the Series I preferred stock held by it, (c) the future establishment of voting rights for all common stock on a one vote per share basis, including with respect to the election of directors, and (d) the future control of the carry pool by KKR.
On May 31, 2022, the merger transactions (“Reorganization Mergers) contemplated by the Reorganization Agreement to simplify KKR’s corporate structure were completed. In the Reorganization Mergers, KKR acquired KKR Holdings (which changed its name to KKR Group Holdings L.P.) and 258.3 million KKR Group Partnership Units held by it, and in exchange KKR issued and delivered 266.8 million shares of common stock to the former limited partners of KKR Holdings. Following the Reorganization Mergers, our principals own the same common stock as the public stockholders of KKR & Co. Inc. (which was formerly known as KKR Aubergine Inc. and become the successor holding company of our business). For additional information about the Reorganization Mergers, please see Note 1 “Organization” in our financial statements included in this report.
On May 30, 2022, KKR's tax receivable agreement with KKR Holdings was terminated, other than with respect to exchanges of KKR Holdings Units for common stock that occurred prior to Reorganization Mergers.
The Reorganization Agreement further provides for:
(i) the future elimination of control of KKR & Co. Inc. by KKR Management, by having all voting power vested in the common stock of KKR & Co. Inc. on a one vote per share basis on the Sunset Date (as defined below), which will be no later than December 31, 2026, and
(ii) also on the Sunset Date, the future acquisition of control by KKR of Associates Holdings when a subsidiary of KKR & Co. Inc. will become the general partner of Associates Holdings.
The “Sunset Date” will be the earlier of (i) December 31, 2026 and (ii) the six-month anniversary of the first date on which the death or permanent disability of both our Co-Founders has occurred (or any earlier date consented to by KKR Management, in its sole discretion).
The incremental 8.5 million shares of common stock of KKR & Co. Inc. received in the Reorganization Mergers are not be transferable (except in the case of death or for estate planning purposes) prior to the Sunset Date, and in addition, KKR Management agreed not to transfer its ownership of the sole share of Series I preferred stock.
The transactions contemplated to occur under the Reorganization Agreement (including the Reorganization Mergers, the termination of the tax receivable agreement except with respect to exchanges of Holdings units made prior thereto, and the changes to occur effective on the Sunset Date) are all required to be consummated together as integrated transactions under the Reorganization Agreement. Because the Reorganization Mergers have been completed, the changes to occur effective on the Sunset Date are unconditional commitments of KKR Management, Associates Holdings, KKR & Co. Inc., and the other parties to the Reorganization Agreement.
Exchange Agreement
KKR Group Co. Inc. (formerly KKR & Co. Inc.) had an exchange agreement with KKR Holdings, pursuant to which KKR Holdings and its limited partners could have exchanged KKR Group Partnership Units held by or transferred to them for shares of our common stock on a one-for-one basis. The final exchange of KKR Group Partnership Units occurred on May 18, 2022. Following the completion of the Reorganization Mergers on May 31, 2022, there are no more exchanges of KKR Group Partnerships Units contemplated to occur. The exchange agreement was terminated on February 24, 2023.
398
Registration Rights Agreement
In connection with our NYSE listing, we entered into a registration rights agreement with KKR Holdings pursuant to which we granted KKR Holdings, its affiliates and transferees of its KKR Group Partnership Units (including the shares of KKR & Co. Inc. received in the Reorganization Mergers) the right, under certain circumstances and subject to certain restrictions, to require us to register under the Securities Act our common stock (and other securities convertible into or exchangeable or exercisable for shares of our common stock) held or acquired by them. Under the registration rights agreement, holders of registration rights have the right to require us to make available shelf registration statements permitting sales of shares of common stock into the market from time to time over an extended period. In addition, holders of registration rights will have the ability to exercise certain piggyback registration rights in connection with registered offerings requested by other holders of registration rights or initiated by us. On October 1, 2010, the registration statement we filed pursuant to this agreement was declared effective, and related post-effective amendments were declared effective on April 14, 2011, September 21, 2011, July 10, 2018 and June 7, 2022.
Tax Receivable Agreement
We had a tax receivable agreement with KKR Holdings, pursuant to which we were required to pay to KKR Holdings or to its limited partners a portion of the tax savings realized by exchanges of KKR Group Partnership Units for shares of common stock pursuant to the exchange agreement described above. As noted above, the tax receivable agreement was terminated on May 30, 2022, but we remain obligated to make payments under the tax receivable agreement with respect to any exchanges completed prior to May 30, 2022.
KKR Group Partnership made an election under Section 754 of the Code that was effective for each taxable year in which an exchange of KKR Group Partnership Units for shares of common stock occurred prior to May 30, 2022, which may have resulted in an increase in our tax basis of the assets of KKR Group Partnership at the time of an exchange of KKR Group Partnership Units. Certain of these exchanges have resulted in an increase in our share of the tax basis of the tangible and intangible assets of KKR Group Partnership, primarily attributable to a portion of the goodwill inherent in our business that would not otherwise have been available. This increase in tax basis has increased certain depreciation and amortization deductions for tax purposes and therefore is expected to reduce the amount of income tax we otherwise would be required to pay. This increase in tax basis is expected to also decrease gain (or increase loss) on future dispositions of certain capital assets to the extent tax basis is allocated to those capital assets.
The surviving payment obligations under the tax receivable agreement require us to pay to former limited partners of KKR Holdings who exchanged KKR Holdings Units for shares of common stock 85% of the amount of cash savings, if any, in U.S. federal, state and local income tax that we realized as a result of the increase in tax basis described above, as well as 85% of the amount of any such savings we actually realize as a result of increases in tax basis that arise due to future payments under the agreement. We benefit from the remaining 15% of cash savings, if any, in income tax that we realize.
These payment obligations are obligations of KKR Group Co. Inc. and its wholly-owned subsidiary, KKR Group Holdings Corp., which are treated as corporations for U.S. tax purposes, but are not payment obligations of KKR & Co. Inc. or KKR Group Partnership L.P. Payments made under the tax receivable agreement are required to be made within 90 days of the filing of our tax returns, which may result in a timing difference between the tax savings received by KKR and the cash payments made to the former limited partners of KKR Holdings. There is no tax receivable agreement in place for any exchange of restricted holdings units granted under the 2019 Equity Incentive Plan, and therefore, we will receive 100% of any tax benefits arising from such exchanges unless we exercise discretion to make tax distributions to holders of restricted holdings units.
For purposes of the tax receivable agreement, cash savings in income tax is computed by comparing our actual income tax liability to the amount of such taxes that we would have been required to pay had there been no increase to the tax basis of the tangible and intangible assets of KKR Group Partnership as a result of the exchanges of KKR Group Partnership Units and had we not entered into the tax receivable agreement. The surviving payment obligations of the tax receivable agreement continue until all such tax benefits have been utilized or expired.
Effective July 1, 2018, we amended the tax receivable agreement to reflect our conversion to a corporation. The amendment also provides that, in the event the maximum U.S. federal corporate income tax rate is increased to a rate higher than 21.0% within the five-year period following the conversion, for exchanges pursuant to the exchange agreement that take place within that five-year period (other than exchanges following the death of an individual), payments of cash tax savings realized as a result of such exchanges shall be calculated by applying a U.S. federal corporate income tax rate not to exceed 21.0%. The amendment also clarifies that the tax benefit payments with respect to exchanges completed at any time prior to the
399
Conversion will be calculated without taking into account the step-up in tax basis in our underlying assets that we generated in 2018 as a result of the Conversion.
Estimating the amount of payments that may be made under the tax receivable agreement is by its nature imprecise, insofar as the calculation of amounts payable depends on a variety of factors. The actual increase in tax basis, as well as the amount and timing of any payments under the tax receivable agreement, will vary based upon a number of factors, including the amount of tax, if any, we were required to pay aside from any tax benefit from the exchanges, and the timing of any such payment. If we did not have taxable income aside from any tax benefit from the exchanges, we were not required to make payments under the tax receivable agreement for that taxable year because no tax savings would have been actually realized. The amount of tax, if any, we are required to pay aside from any tax benefit from the exchanges, and the timing of any such payment. If we do not have taxable income aside from any tax benefit from the exchanges, we will not be required to make payments under the tax receivable agreement for that taxable year because no tax savings will have been actually realized.
We expect that as a result of the amount of the increases in the tax basis of the tangible and intangible assets of KKR Group Partnership, assuming no material changes in the relevant tax law and that we earn sufficient taxable income to realize the full tax benefit of the increased amortization of our assets, future payments under the tax receivable agreement could be significant. As of December 31, 2023, an undiscounted payable of $406.7 million has been recorded in due to affiliates in the financial statements representing management's best estimate of the amounts currently expected to be owed for certain exchanges of KKR Holdings Units that took place prior to the termination of the tax receivable agreement. The payments under the tax receivable agreement are not conditioned upon our principals' continued ownership of us and are required to be made within 90 days of the filing of our tax returns. During the year ended December 31, 2023, an aggregate of $16.3 million was made to our current and former principals, including our executive officers, and KKR Holdings. The independent directors of our Board of Directors are not eligible to receive payments under the tax receivable agreement. For further information, see Note 20 "Related Party Transactions" in our financial statements and "Management's Discussion and Analysis of Financial Condition and Results of Operations—Liquidity Needs—Tax Receivable Agreement" in this report.
Decisions made by our senior principals in the course of running our business, such as with respect to mergers, asset sales, other forms of business combinations or other changes of control, may influence the timing and amount of payments received by principals who exchanged KKR Holdings Units prior to May 30, 2022 under the tax receivable agreement. For example, the earlier disposition of assets following an exchange or acquisition transaction generally would accelerate payments under the tax receivable agreement and would increase the present value of such payments, and the disposition of assets before an exchange or acquisition transaction would generally increase a principals' tax liability without giving rise to any rights of a principal to receive payments under the tax receivable agreement.
Payments under the tax receivable agreement are based upon the tax reporting positions that we determined. We are not aware of any issue that would cause the IRS to challenge a tax basis increase that we have taken. However, none of the former limited partners of KKR Holdings will reimburse us for any payments previously made under the tax receivable agreement if such tax basis increase, or the tax benefits we claimed arising from such increase, is successfully challenged by the IRS. As a result, in certain circumstances, payments to former limited partners of KKR Holdings under the tax receivable agreement could be in excess of our cash tax savings. Our ability to achieve benefits from any tax basis increase, and the payments to be made under this agreement, will depend upon a number of factors, as discussed above, including the timing and amount of our future income. See "Risk Factors—Risks Related to Our Organizational Structure—We will be required to pay certain principals for most of the benefits relating to our use of tax attributes we receive from historical exchanges of our common stock for KKR Group Partnership Units."
KKR Group Partnership Agreement
We control the general partner of KKR Group Partnership and, through KKR Group Partnership and its subsidiaries, the KKR business. KKR Group Partnership is the owner of the entirety of KKR's business.
Pursuant to the limited partnership agreement of KKR Group Partnership, we, as the controlling general partner of KKR Group Partnership, have the indirect right to determine when distributions will be made to the holders of KKR Group Partnership Units and the amount of any such distributions.
400
The limited partnership agreement of KKR Group Partnership provides for tax distributions to the holders of KKR Group Partnership Units if the general partner of the KKR Group Partnership determines that distributions from the KKR Group Partnership would otherwise be insufficient to cover the tax liabilities of a holder of a KKR Group Partnership Unit. Generally, these tax distributions will be computed based on our estimate of the net taxable income of the relevant partnership allocable to a holder of a KKR Group Partnership Unit multiplied by an assumed tax rate equal to the highest effective marginal combined U.S. federal, state and local income tax rate prescribed for an individual or corporate resident in New York, New York (taking into account the nondeductibility of certain expenses and the character of our income).
The limited partnership agreement of the KKR Group Partnership authorizes the general partner of the KKR Group Partnership to issue an unlimited number of additional securities of the KKR Group Partnership with such designations, preferences, rights, powers and duties that are different from, and may be senior to, those applicable to the KKR Group Partnership Units, and which may be exchangeable for KKR Group Partnership Units.
Firm Use of Private Aircraft
From time to time, we use private aircraft to transport employees for business purposes. In accordance with the KKR & Co. Inc.'s policy on reimbursement of the cost of use of private aircraft while traveling for business, we reimbursed certain of our executive officers for firm use of private aircraft.
Companies associated with Messrs. Kravis and Roberts own aircraft that are used for KKR's business in the ordinary course of our operations. Messrs. Kravis and Roberts funded the purchase of these aircraft with their personal funds and fund all operating, personnel and maintenance costs associated with their operation. The hourly rates that we pay for the use of these aircraft are based on current market rates for chartering private aircraft of the same type. For the year ended December 31, 2023, we paid a total of $3.4 million (including applicable taxes) for the use of these aircraft, of which substantially all was borne by us rather than our investment funds (which indirectly bear the cost of some of these flights at commercial airline rates). Of this total, $2.1 million relates to use of an aircraft owned by an entity controlled by Mr. Kravis, and $1.3 million relates to use of an aircraft owned by an entity controlled by Mr. Roberts.
Side-By-Side and Other Investments
Because fund investors typically are unwilling to invest their capital in a fund unless the fund's manager also invests its own capital in the fund's investments, our investment fund documents generally require the general partners of our investment funds to make minimum capital commitments to the funds. The amount of these commitments, which are negotiated by fund investors, generally range from 2% to 8% of a fund's total capital commitments at final closing, but may be greater for certain funds pursuing new strategies. When investments are made, the general partner contributes capital to the fund based on its fund commitment percentage and if applicable, acquires a capital interest in the investment that is not subject to a carried interest or management fees. Historically, these capital contributions have been funded with cash from operations that otherwise would be distributed to our employees.
We did not acquire capital interests in certain investments that were funded by our employees or others involved in our business prior to October 1, 2009. Rather, those capital interests were allocated to our employees or others involved in our business and are reflected in our financial statements as noncontrolling interests in consolidated entities to the extent that we hold the general partner interest in the fund. Any capital contributions that our private equity fund general partners are required to make to a fund will be funded by us and we will be entitled to receive our allocable share of the returns thereon.
In addition, certain of our current and former employees and certain other qualifying personnel are permitted to invest, and have invested, their own capital in our investment funds and vehicles, in side-by-side investments with our funds and the firm, as well as in funds managed by our hedge fund partnerships. Side-by-side investments are investments generally made on the same terms and conditions as those available to the applicable fund or the firm and, they, together with their investments in our funds and vehicles or the funds managed by our hedge fund partnerships, are not generally subject to management fees or a carried interest. The cash invested by our current and former employees and certain other qualifying personnel and their investment vehicles aggregated to $629.0 million for the year ended December 31, 2023, of which $51.1 million, $53.7 million, $33.8 million, $22.3 million, $4.7 million, $1.1 million, $3.5 million and $0.3 million was invested by Messrs. Kravis, Roberts, Bae, Nuttall, Lewin, Sorkin, Stork and Sudol and their personal or estate planning vehicles, respectively. These investments are not included in the accompanying consolidated financial statements. In addition, our funds invested $0.2 million in 2023 from the commitments of certain estate planning vehicles associated with Mr. Hess. Such investments associated with Mr. Hess were made on the same terms and conditions as for other fund investors including management fees and/or a carried interest applicable to the relevant fund.
401
Indemnification of Directors, Officers and Others
Under our certificate of incorporation, in most circumstances we will indemnify the following persons, to the fullest extent permitted by law, from and against all losses, claims, damages, liabilities, joint or several, expenses (including legal fees and expenses), judgments, fines, penalties, interest, settlements or other amounts: (a) the Series I preferred stockholder; (b) KKR Management in its capacity as the former general partner of KKR & Co. L.P. (the "Former Managing Partner"); (c) any person who is or was an affiliate of the Series I preferred stockholder or the Former Managing Partner; (d) any person who is or was a member, partner, tax matters partner (as defined in the Code, as in effect prior to 2018), partnership representative (as defined in the Code), officer, director, employee, agent, fiduciary or trustee of us or our subsidiaries, the KKR Group Partnership, the Series I preferred stockholder or the Former Managing Partner or any affiliate of us or our subsidiaries, the Series I preferred stockholder or the Former Managing Partner; (e) any person who is or was serving at our request or the request of the Former Managing Partner or any affiliate of us or the Former Managing Partner as an officer, director, employee, member, partner, tax matters partner, partnership representative, agent, fiduciary or trustee of another person (provided that a person shall not be an indemnitee by reason of providing, on a fee-for-services basis or similar arms-length compensatory basis, agency, advisory, consulting, trustee, fiduciary or custodial services); or (f) any person designated by us as an indemnitee as permitted by applicable law.
We have agreed to provide this indemnification unless there has been a final and non-appealable judgment by a court of competent jurisdiction determining that these persons acted in bad faith or engaged in fraud or willful misconduct. We have also agreed to provide this indemnification for criminal proceedings. Any indemnification under these provisions will only be out of our assets. Unless it otherwise agrees, the Series I preferred stockholder will not be liable for, or have any obligation to contribute or loan any monies or property to us to enable us to effectuate, indemnification. The indemnification of the persons described above shall be secondary to any indemnification such person is entitled from another person or the relevant KKR fund to the extent applicable. We may purchase insurance against liabilities asserted against, and expenses incurred by, persons in connection with their activities, regardless of whether we would have the power to indemnify the person against liabilities under our certificate of incorporation. We currently maintain liability insurance for our directors and officers. Such insurance would be available to our directors and officers in accordance with its terms.
In addition, we have entered into indemnification agreements with KKR Management and each of our directors. Each indemnification agreement provides that the indemnitee, subject to the limitations set forth in each indemnification agreement, will be indemnified and held harmless by us on an after-tax basis from and against any and all losses, claims, damages, liabilities, joint or several, expenses (including legal fees and expenses), judgments, fines, penalties, interest, settlements or other amounts arising from any and all threatened, pending or completed claims, demands, actions, suits or proceedings, whether civil, criminal, administrative or investigative, and whether formal or informal and including appeals, in which the indemnitee may be involved, or is threatened to be involved, as a party or otherwise, by reason of its status as an indemnitee or by reason of any action alleged to have been taken or omitted in such capacity, whether arising from alleged acts or omissions to act occurring on, before or after the date of such indemnification agreement. Each indemnification agreement provides that the indemnitee shall not be indemnified and held harmless if there has been a final and non-appealable judgment entered by an arbitral tribunal or court of competent jurisdiction determining that, in respect of the matter for which the indemnitee is seeking indemnification pursuant to the indemnification agreement, the indemnitee acted in bad faith or engaged in fraud or willful misconduct.
402
Guarantee of Contingent Obligations to Fund Partners; Indemnification
The partnership documents governing KKR's carry-paying investment funds and vehicles generally include a "clawback" provision that, if triggered, may give rise to a contingent obligation requiring the general partner to return amounts to the fund for distribution to the fund investors at the end of the life of the fund. Under a clawback obligation, upon the liquidation of a fund, the general partner is required to return, typically on an after-tax basis, previously distributed carry to the extent that, due to the diminished performance of later investments, the aggregate amount of carry distributions received by the general partner during the term of the fund exceed the amount to which the general partner was ultimately entitled, including the effects of any performance thresholds. As of December 31, 2023, $546.0 million of carried interest was subject to this clawback obligation, assuming that all applicable carry-paying funds were liquidated at their December 31, 2023 fair values. Had the investments in such funds been liquidated at zero value, the clawback obligation would have been approximately $3.5 billion. Carried interest is recognized in the consolidated statements of operations based on the contractual conditions set forth in the agreements governing the fund as if the fund were terminated and liquidated at the reporting date and the fund's investments were realized at the then estimated fair values. Amounts earned pursuant to carried interest are earned by the general partner of those funds to the extent that cumulative investment returns are positive and where applicable, preferred return thresholds have been met. If these investment amounts earned decrease or turn negative in subsequent periods, recognized carried interest will be reversed and to the extent that the aggregate amount of carry distributions received by the general partner during the term of the fund exceed the amount to which the general partner was ultimately entitled, a clawback obligation would be recorded. For funds that are consolidated, this clawback obligation, if any, is reflected as an increase in noncontrolling interests in the consolidated statements of financial condition. For funds that are not consolidated, this clawback obligation, if any, is reflected as a reduction of KKR's investment balance as this is where carried interest is initially recorded.
Menlo Park Office
Our office in Menlo Park, California, is owned by a real estate partnership that is controlled and majority-owned by persons unaffiliated with KKR and its executive officers. However, Messrs. Kravis and Roberts and their estate planning vehicles own and control a minority limited partner interest in the real estate partnership. In November 2022, KKR entered into a new 15-year lease with the real estate partnership, representing an annual rent of $6.3 million, subject to certain current and annual adjustments. Payments made from KKR to this real estate partnership aggregated $9.5 million for the year ended December 31, 2023.
Confidentiality and Restrictive Covenant Agreements
Our employees have entered into confidentiality and restrictive covenant agreements that include prohibitions on our employees competing with us or soliciting clients, investments or employees of our firm during a restricted period following their departure from the firm. For further information on these agreements, see "Executive Compensation—Narrative Disclosure to Summary Compensation Table and Grants of Plan-Based Awards Table—Terms of Confidentiality and Restrictive Covenant Agreements."
Other Transactions with Related Persons
We have entered, and may in the future continue to enter, into ordinary course transactions with unaffiliated entities known to us to beneficially own more than 5% of any class of our outstanding voting securities. These transactions may include investments by them in our funds generally on the same terms and conditions offered to other unaffiliated fund investors and participation in our capital markets transactions, including underwritings and syndications, generally on the same terms and conditions offered to other unaffiliated capital markets participants. See "Security Ownership of Certain Beneficial Owners and Management and Related Stockholder Matters."
403
Statement of Policy Regarding Transactions with Related Persons
Our Board of Directors adopted a written statement of policy for transactions with related persons (our "related person policy"). Our related person policy requires that a "related person" (as defined as in Item 404(a) of Regulation S-K) must promptly disclose to our General Counsel or other designated person any "related person transaction" (defined as any transaction, arrangement or relationship, or series of similar transactions, arrangements or relationships, including, without limitation, any loan, guarantee of indebtedness, transfer or lease of real estate, or use of company property that is reportable by us under Item 404(a) of Regulation S-K in which we were or are to be a participant and the amount involved exceeds $120,000 and in which any related person had or will have a direct or indirect material interest) and all material facts with respect thereto. Those individuals will then communicate that information to the Board of Directors. No related person transaction will be consummated without the approval or ratification of a committee of the board consisting exclusively of disinterested directors; provided, however, the conflicts committee of our Board of Directors has pre-approved: certain ordinary course transactions with persons known to us to beneficially own more than 5% of our outstanding common stock on terms generally not less favorable as obtained from other third parties, including investments in our funds as limited partners and participation in capital markets transactions like underwritings and syndications; the renewal of pre-existing strategic relationships with persons known to us to beneficially own more than 5% of our outstanding common stock; the use of aircraft owned by our senior employees for business purposes; certain investments by eligible employees in our funds, in side-by-side investments with our funds and the firm, as well as in funds managed by our hedge fund partnerships; and certain pro rata cash contributions to the KKR Group Partnership for cash management purposes. In addition, it is our policy that directors interested in a related person transaction should recuse themselves from any vote on a related person transaction in which they have an interest, unless otherwise permitted by applicable law.
Director Independence
See "Directors, Executive Officers and Corporate Governance—Independence and Composition of the Board of Directors" for information on director independence.
404
ITEM 14. PRINCIPAL ACCOUNTANT FEES AND SERVICES
The following table summarizes the aggregate fees for professional services provided by Deloitte & Touche LLP (PCAOB ID No. 34 ), the member firms of Deloitte Touche Tohmatsu Limited or their respective affiliates (collectively, the "Deloitte Entities") for the years ended December 31, 2023 and 2022.
| For the Year Ended December 31, 2023 | ||||||||||||||
| KKR | Completed Transactions | |||||||||||||
| ($ in thousands) | ||||||||||||||
| Audit Fees | $ | 63,607 | (1) | $ | — | |||||||||
| Audit-Related Fees | $ | 9,999 | (2) | $ | 31,917 | (5) | ||||||||
| Tax Compliance Fees | $ | 54,439 | (3) | $ | — | |||||||||
| Tax Planning and Advisory Fees | $ | 14,332 | (4) | $ | 11,253 | (5) | ||||||||
| All Other Fees | $ | 265 | $ | — | ||||||||||
| For the Year Ended December 31, 2022 | ||||||||||||||
| KKR | Completed Transactions | |||||||||||||
| ($ in thousands) | ||||||||||||||
| Audit Fees | $ | 58,959 | (1) | $ | — | |||||||||
| Audit-Related Fees | $ | 12,562 | (2) | $ | 22,101 | (5) | ||||||||
| Tax Compliance Fees | $ | 44,389 | (3) | $ | — | |||||||||
| Tax Planning and Advisory Fees | $ | 12,555 | (4) | $ | 10,654 | (5) | ||||||||
| All Other Fees | $ | 443 | $ | — | ||||||||||
(1)Audit Fees consisted of estimated fees for each audit year for (a) the audits of our consolidated financial statements in our Annual Report on Form 10-K and services related to, or required by, statute or regulation; (b) reviews of the interim condensed consolidated financial statements included in our quarterly reports on Form 10-Q; (c) comfort letters, consents and other services related to SEC and other regulatory filings; and (d) audit services provided to KKR funds and other corporate entities.
(2)Audit-Related Fees primarily included merger, acquisition, and investment due diligence services for strategic acquisitions or investments in target companies for in-process transactions and transactions not completed.
(3)Tax Compliance Fees consisted of fees for services rendered for tax compliance.
(4)Tax Planning and Advisory Fees primarily included tax planning and advisory services, as well as tax fees for merger, acquisition, and investment structuring services for strategic acquisitions or investments in target companies for in-process transactions and transactions not completed.
(5)Audit-Related and Tax Planning and Advisory Fees included merger, acquisition, and investment due diligence services for strategic acquisitions or investments in portfolio companies that have been completed. In addition, the Deloitte Entities provided audit, audit-related, tax and other services to the portfolio companies, which are approved directly by the portfolio company's management and are not included in the amounts presented here.
Our Audit Committee charter, which is available on our website at www.kkr.com under "Investor Center—Stockholders (KKR & Co. Inc.)—Environmental, Social & Corporate Governance—Corporate Governance—Audit Committee Charter," requires the Audit Committee to approve in advance all audit and non-audit related services to be provided by our independent registered public accounting firm in accordance with the audit and non-audit related services pre-approval policy. All services reported in the Audit, Audit-Related, Tax, and All Other categories above were approved by the Audit Committee.
405
PART IV
ITEM 15. EXHIBITS AND FINANCIAL STATEMENT SCHEDULES
(a) The following documents are filed as part of this report.
1. Financial Statements
See Item 8 above.
2. Financial Statement Schedules:
See Schedule II - Valuation and Qualifying Accounts - Years Ended December 31, 2023, 2022 and 2021 and Schedule IV - Reinsurance - Years Ended December 31, 2023, 2022 and 2021 - of this report on Form 10-K. The other schedules are omitted as they are not applicable or the amounts involved are not material.
3. Exhibits:
| 2.1 | ||||||||
| 2.2 | ||||||||
| 2.3 | ||||||||
| 2.4 | ||||||||
| 3.1 | ||||||||
| 3.2 | ||||||||
| 4.1 | ||||||||
| 4.2 | ||||||||
| 4.3 | ||||||||
406
| 4.4 | ||||||||
| 4.5 | ||||||||
| 4.6 | ||||||||
| 4.7 | ||||||||
| 4.8 | ||||||||
| 4.9 | ||||||||
| 4.10 | ||||||||
| 4.11 | ||||||||
| 4.12 | ||||||||
| 4.13 | ||||||||
| 4.14 | ||||||||
| 4.15 | ||||||||
| 4.16 | ||||||||
407
| 4.17 | ||||||||
| 4.18 | ||||||||
| 4.19 | ||||||||
| 4.20 | ||||||||
| 4.21 | ||||||||
| 4.22 | ||||||||
| 4.23 | ||||||||
| 4.24 | ||||||||
| 4.25 | ||||||||
| 4.26 | ||||||||
| 4.27 | ||||||||
| 4.28 | ||||||||
408
| 4.29 | ||||||||
| 4.30 | ||||||||
| 4.31 | ||||||||
| 4.32 | ||||||||
| 4.33 | ||||||||
| 4.34 | ||||||||
| 4.35 | ||||||||
| 4.36 | ||||||||
| 4.37 | ||||||||
| 4.38 | ||||||||
| 4.39 | ||||||||
| 4.40 | ||||||||
| 4.41 | ||||||||
409
| 4.42 | ||||||||
| 4.43 | ||||||||
| 4.44 | ||||||||
| 4.45 | ||||||||
| 4.46 | ||||||||
| 4.47 | ||||||||
| 4.48 | ||||||||
| 4.49 | ||||||||
| 4.50 | ||||||||
| 4.51 | ||||||||
| 4.52 | ||||||||
| 4.53 | ||||||||
| 4.54 | ||||||||
| 4.55 | ||||||||
410
| 4.56 | ||||||||
| 4.57 | ||||||||
| 4.58 | ||||||||
| 4.59 | ||||||||
| 4.60 | ||||||||
| 4.61 | ||||||||
| 10.1 | ||||||||
| 10.2 | ||||||||
| 10.3 | ||||||||
| 10.4 | ||||||||
| 10.5 | * | |||||||
| 10.6 | * | |||||||
| 10.7 | ||||||||
| 10.8 | ||||||||
| 10.9 | ||||||||
411
412
| 10.22 | * | |||||||
| 10.23 | * | |||||||
| 10.24 | * | |||||||
| 10.25 | * | |||||||
| 10.26 | * | |||||||
| 10.27 | * | |||||||
| 10.28 | * | |||||||
| 10.29 | * | |||||||
| 10.30 | * | |||||||
| 10.31 | * | |||||||
| 10.32 | * | |||||||
| 21.1 | ||||||||
| 22.1 | ||||||||
| 23.1 | ||||||||
| 31.1 | ||||||||
| 31.2 | ||||||||
| 31.3 | ||||||||
413
| 32.1 | ||||||||
| 32.2 | ||||||||
| 32.3 | ||||||||
| 97.1 | ||||||||
| 101 | Interactive data files pursuant to Rule 405 of Regulation S-T, formatted in Inline XBRL: (i) the Consolidated Statements of Financial Condition as of December 31, 2023 and December 31, 2022, (ii) the Consolidated Statements of Operations for the years ended December 31, 2023, 2022 and 2021, (iii) the Consolidated Statements of Comprehensive Income (Loss) for the years ended December 31, 2023, 2022 and 2021, (iv) the Consolidated Statements of Changes in Equity for the years ended December 31, 2023, 2022 and 2021 (v) the Consolidated Statements of Cash Flows for the years ended December 31, 2023, 2022 and 2021, and (vi) the Notes to the Consolidated Financial Statements. | |||||||
| 104 | Cover page interactive data file, formatted in Inline XBRL and contained in Exhibit 101. | |||||||
* Management contract or compensatory plan in which directors and/or executive officers are eligible to participate.
† Certain information contained in this agreement has been omitted because it is not material and is the type that the registrant treats as private or confidential.
The registrant hereby agrees to furnish to the SEC at its request copies of long-term debt instruments defining the rights of holders of outstanding long-term debt that are not required to be filed herewith.
The agreements and other documents filed as exhibits to this report are not intended to provide factual information or other disclosure other than with respect to the terms of the agreements or other documents themselves, and you should not rely on them for that purpose. In particular, any representations and warranties made by us in these agreements or other documents were made solely within the specific context of the relevant agreement or document and may not describe the actual state of affairs as of the date they were made or at any other time.
414
FINANCIAL STATEMENT SCHEDULES
| SCHEDULE II—VALUATION AND QUALIFYING ACCOUNTS | |||||||||||||||||||||||
| Valuation Allowance for Deferred Tax Assets | |||||||||||||||||||||||
| (in thousands) | |||||||||||||||||||||||
| Asset Management | |||||||||||||||||||||||
| Balance at Beginning of Period | Tax Valuation Allowance Charged to Income Tax Provision | Tax Valuation Allowance Credited to Balance Sheet | Balance at End of Period | ||||||||||||||||||||
| Year Ended: | |||||||||||||||||||||||
| December 31, 2021 | $ | $ | $ | $ | |||||||||||||||||||
| December 31, 2022 | $ | $ | $ | (1) | $ | ||||||||||||||||||
| December 31, 2023 | $ | $ | $ | $ | |||||||||||||||||||
| (1) A valuation allowance was recorded for deferred tax assets related to foreign loss carryforwards that were not considered to be more likely than not realized prior to their expiration. These deferred taxes and associated valuation allowances were reversed in 2022 as a result of a deconsolidation transaction. | |||||||||||||||||||||||
| Insurance | |||||||||||||||||||||||
| Balance at Beginning of Period | Tax Valuation Allowance Charged to Income Tax Provision | Tax Valuation Allowance Charged to Balance Sheet | Balance at End of Period | ||||||||||||||||||||
| Year Ended: | |||||||||||||||||||||||
| December 31, 2021 | $ | $ | $ | $ | |||||||||||||||||||
| December 31, 2022 | $ | $ | $ | (2) | $ | ( | |||||||||||||||||
| December 31, 2023 | $ | ( | $ | $ | $ | ( | |||||||||||||||||
| (2) A valuation allowance was recorded for deferred tax assets related to unrealized tax capital losses that are not considered to be more likely than not to be realized prior to their expiration. The valuation allowance establishment was allocated to other comprehensive income. | |||||||||||||||||||||||
415
| Insurance | |||||||||||||||||||||||||||||||||||||||||
| Year Ended December 31, 2023 | |||||||||||||||||||||||||||||||||||||||||
| Additions | |||||||||||||||||||||||||||||||||||||||||
| Balance at Beginning of Period | Charged to costs and expenses | Assumed | Recoveries | Deductions | Charge-off | Balance at End of Period | |||||||||||||||||||||||||||||||||||
| Reserves deducted from assets to which they apply: | |||||||||||||||||||||||||||||||||||||||||
| Credit loss allowance on available-for-sale securities | $ | $ | $ | $ | $ | ( | $ | ( | $ | ||||||||||||||||||||||||||||||||
| Credit loss allowance on loans | ( | $ | |||||||||||||||||||||||||||||||||||||||
| Credit loss allowance on unfunded commitments | ( | $ | |||||||||||||||||||||||||||||||||||||||
| Credit loss allowance on reinsurance recoverables | ( | $ | |||||||||||||||||||||||||||||||||||||||
| Year Ended December 31, 2022 | |||||||||||||||||||||||||||||||||||||||||
| Additions | |||||||||||||||||||||||||||||||||||||||||
| Balance at Beginning of Period | Charged to costs and expenses | Assumed | Recoveries | Deductions | Charge-off | Balance at End of Period | |||||||||||||||||||||||||||||||||||
| Reserves deducted from assets to which they apply: | |||||||||||||||||||||||||||||||||||||||||
| Credit loss allowance on available-for-sale securities | $ | $ | $ | $ | $ | ( | $ | ( | $ | ||||||||||||||||||||||||||||||||
| Credit loss allowance on loans | ( | ||||||||||||||||||||||||||||||||||||||||
| Credit loss allowance on unfunded commitments | |||||||||||||||||||||||||||||||||||||||||
| Credit loss allowance on reinsurance recoverables | |||||||||||||||||||||||||||||||||||||||||
| Year Ended December 31, 2021 | |||||||||||||||||||||||||||||||||||||||||
| Additions | |||||||||||||||||||||||||||||||||||||||||
| Balance at Beginning of Period | Charged to costs and expenses | Assumed | Recoveries | Deductions | Charge-off | Balance at End of Period | |||||||||||||||||||||||||||||||||||
| Reserves deducted from assets to which they apply: | |||||||||||||||||||||||||||||||||||||||||
| Credit loss allowance on available-for-sale securities | $ | $ | ( | $ | $ | $ | ( | $ | $ | ||||||||||||||||||||||||||||||||
| Credit loss allowance on loans | ( | ||||||||||||||||||||||||||||||||||||||||
| Credit loss allowance on unfunded commitments | |||||||||||||||||||||||||||||||||||||||||
| Credit loss allowance on reinsurance recoverables | |||||||||||||||||||||||||||||||||||||||||
416
| SCHEDULE IV—REINSURANCE | |||||||||||||||||||||||||||||
| As of December 31, 2023 | |||||||||||||||||||||||||||||
| Gross Amount | Ceded to Other Companies | Assumed from Other Companies | Net Amount | Percentage of Amount Assumed to Net | |||||||||||||||||||||||||
| ($ in thousands) | |||||||||||||||||||||||||||||
| Life insurance in-force | $ | $ | ( | $ | $ | % | |||||||||||||||||||||||
| Premiums and other considerations: | |||||||||||||||||||||||||||||
| Premiums | $ | $ | ( | $ | $ | % | |||||||||||||||||||||||
| Policy fees | ( | % | |||||||||||||||||||||||||||
| As of December 31, 2022 | |||||||||||||||||||||||||||||
| Gross Amount | Ceded to Other Companies | Assumed from Other Companies | Net Amount | Percentage of Amount Assumed to Net | |||||||||||||||||||||||||
| ($ in thousands) | |||||||||||||||||||||||||||||
| Life insurance in-force | $ | $ | ( | $ | $ | % | |||||||||||||||||||||||
| Premiums and other considerations: | |||||||||||||||||||||||||||||
| Premiums | $ | $ | ( | $ | $ | % | |||||||||||||||||||||||
| Policy fees | $ | $ | ( | $ | $ | % | |||||||||||||||||||||||
| As of December 31, 2021 | |||||||||||||||||||||||||||||
| Gross Amount | Ceded to Other Companies | Assumed from Other Companies | Net Amount | Percentage of Amount Assumed to Net | |||||||||||||||||||||||||
| ($ in thousands) | |||||||||||||||||||||||||||||
| Life insurance in-force | $ | $ | ( | $ | $ | % | |||||||||||||||||||||||
| Premiums and other considerations: | |||||||||||||||||||||||||||||
| Premiums | $ | $ | ( | $ | $ | % | |||||||||||||||||||||||
| Policy fees | $ | $ | ( | $ | $ | % | |||||||||||||||||||||||
417
ITEM 16. FORM 10-K SUMMARY
None.
418
SIGNATURES
Pursuant to requirements of Section 13 or 15(d) of the Securities Exchange Act of 1934, the registrant has duly caused this report to be signed on its behalf by the undersigned, thereunto duly authorized.
| Date: | February 29, 2024 | ||||||||||
| KKR & CO. INC. | |||||||||||
| /s/ ROBERT H. LEWIN | |||||||||||
| Name: | Robert H. Lewin | ||||||||||
| Title: | Chief Financial Officer | ||||||||||
Pursuant to the requirements of the Securities Exchange Act of 1934, this report has been signed below by the following persons on behalf of the registrant and in the capacities and on the dates indicated.
| Signature | Title | Date | ||||||||||||
| /s/ HENRY R. KRAVIS | Co-Executive Chairman, Director | February 29, 2024 | ||||||||||||
| Henry R. Kravis | ||||||||||||||
| /s/ GEORGE R. ROBERTS | Co-Executive Chairman, Director | February 29, 2024 | ||||||||||||
| George R. Roberts | ||||||||||||||
| /s/ JOSEPH Y. BAE | Director, Co-Chief Executive Officer | February 29, 2024 | ||||||||||||
| Joseph Y. Bae | (principal executive officer) | |||||||||||||
| /s/ SCOTT C. NUTTALL | Director, Co-Chief Executive Officer | February 29, 2024 | ||||||||||||
| Scott C. Nuttall | (principal executive officer) | |||||||||||||
| /s/ ADRIANE M. BROWN | Director | February 29, 2024 | ||||||||||||
| Adriane M. Brown | ||||||||||||||
| /s/ MATTHEW R. COHLER | Director | February 29, 2024 | ||||||||||||
| Matthew R. Cohler | ||||||||||||||
| /s/ MARY N. DILLON | Director | February 29, 2024 | ||||||||||||
| Mary N. Dillon | ||||||||||||||
/s/ ARTURO GUTIÉRREZ HERNÁNDEZ | Director | February 29, 2024 | ||||||||||||
Arturo Gutiérrez Hernández | ||||||||||||||
| /s/ XAVIER B. NIEL | Director | February 29, 2024 | ||||||||||||
| Xavier B. Niel | ||||||||||||||
| /s/ KIMBERLY A. ROSS | Director | February 29, 2024 | ||||||||||||
| Kimberly A. Ross | ||||||||||||||
| /s/ PATRICIA F. RUSSO | Director | February 29, 2024 | ||||||||||||
| Patricia F. Russo | ||||||||||||||
| /s/ ROBERT W. SCULLY | Director | February 29, 2024 | ||||||||||||
| Robert W. Scully | ||||||||||||||
| /s/ EVAN T. SPIEGEL | Director | February 29, 2024 | ||||||||||||
| Evan T. Spiegel | ||||||||||||||
419
| Signature | Title | Date | ||||||||||||
| /s/ ROBERT H. LEWIN | Chief Financial Officer (principal financial and accounting officer) | February 29, 2024 | ||||||||||||
| Robert H. Lewin | ||||||||||||||
420