UNITED STATES
SECURITIES AND EXCHANGE COMMISSION
Washington, D.C. 20549
FORM
(Mark One)
ANNUAL REPORT PURSUANT TO SECTION 13 OR 15(d) OF THE SECURITIES EXCHANGE ACT OF 1934 |
For the fiscal year ended
OR
TRANSITION REPORT PURSUANT TO SECTION 13 OR 15(d) OF THE SECURITIES EXCHANGE ACT OF 1934 |
For the transition period from to
Commission file number
(Exact name of registrant as specified in its charter)
| ||
(State or Other Jurisdiction of Incorporation or Organization) | (I.R.S. Employer Identification No.) | |
(Address of Principal Executive Offices) | (Zip Code) |
Registrant’s telephone number, including area code (
Securities registered pursuant to Section 12(b) of the Act:
Title of each class | Trading Symbol | Name of each exchange on which registered |
Securities registered pursuant to Section 12(g) of the Act:
NONE
(Title of class)
Indicate by check mark if the registrant is a well-known seasoned issuer, as defined in Rule 405 of the Securities Act.
No ☐ |
Indicate by check mark if the registrant is not required to file reports pursuant to Section 13 or Section 15(d) of the Act.
Yes ☐ |
Indicate by check mark whether the registrant (1) has filed all reports required to be filed by Section 13 or 15(d) of the Securities Exchange Act of 1934 during the preceding 12 months (or for such shorter period that registrant was required to file such reports), and (2) has been subject to such filing requirements for the past 90 days.
No ☐ |
Indicate by check mark whether the registrant has submitted electronically every Interactive Data File required to be submitted pursuant to Rule 405 of Regulation S-T (§232.405 of this chapter) during the preceding 12 months (or for such shorter period that the registrant was required to submit such files).
No ☐ |
Indicate by check mark whether the registrant is a large accelerated filer, an accelerated filer, a non-accelerated filer, a smaller reporting company, or an emerging growth company. See the definitions of “large accelerated filer,” “accelerated filer,” “smaller reporting company,” and “emerging growth company” in Rule 12b-2 of the Exchange Act.
Accelerated filer ☐ | |||
Non-accelerated filer ☐ | Smaller reporting company | ||
Emerging growth company | |||
If an emerging growth company, indicate by check mark if the registrant has elected not to use the extended transition period for complying with any new or revised financial accounting standards provided pursuant to Section 13(a) of the Exchange Act. ☐
Indicate by check mark whether the registrant has filed a report on and attestation to its management's assessment of the effectiveness of its internal control over financial reporting under Section 404(b) of the Sarbanes-Oxley Act (15 U.S.C. 7262(b)) by the registered public accounting firm that prepared or issued its audit report.
If securities are registered pursuant to Section 12(b) of the Act, indicate by check mark whether the financial statements of the registrant included in the filing reflect the correction of an error to previously issued financial statements.
Yes ☐ |
Indicate by check mark whether any of those error corrections are restatements that required a recovery analysis of incentive-based compensation received by any of the registrant’s executive officers during the relevant recovery period pursuant to §240.10D-1(b).
Yes ☐ | No ☒ |
Indicate by check mark whether the registrant is a shell company (as defined by Rule 12b-2 of the Exchange Act).
Yes | No ☒ |
The aggregate market value of the voting and non-voting common equity held by non-affiliates computed by reference to the average bid and asked price of such common equity, as of the last business day of the registrant’s most recently completed second fiscal quarter (August 12, 2023). $
The number of shares outstanding of the registrant's common stock, as of the latest practicable date.
Documents Incorporated by Reference:
Portions of Kroger’s definitive proxy statement for its 2024 annual meeting of shareholders, which shall be filed with the Securities and Exchange Commission within 120 days after the end of the fiscal year to which this Report relates, are incorporated by reference into Part III of this Report.
The Kroger Co.
Form 10-K
For the Fiscal Year Ended February 3, 2024
Table of Contents
PART I
FORWARD LOOKING STATEMENTS.
This Annual Report on Form 10-K contains forward-looking statements about our future performance. These statements are based on our assumptions and beliefs in light of the information currently available to us. These statements are subject to a number of known and unknown risks, uncertainties and other important factors, including the risks and other factors discussed in “Risk Factors” below, that could cause actual results and outcomes to differ materially from any future results or outcomes expressed or implied by such forward looking statements. Such statements are indicated by words such as “achieve,” “affect,” “anticipate,” “assumptions,” “believe,” “committed,” “continue,” “could,” “deliver,” “effect,” “enable,” “estimate,” “expects,” “future,” “goal,” “growth,” “intended,” “likely,” “may,” “model,” “objective,” “plan,” “position,” “program,” “range,” “result,” “strategy,” “strive,” “strong,” “target,” “trend,” “will” and “would,” and similar words or phrases. Moreover, statements in the sections entitled Risk Factors, Management’s Discussion and Analysis of Financial Condition and Results of Operations (“MD&A”), and elsewhere in this report regarding our expectations, projections, beliefs, intentions or strategies are forward-looking statements within the meaning of Section 21E of the Securities Exchange Act of 1934, as amended.
Various uncertainties and other factors could cause actual results to differ materially from those contained in the forward-looking statements. These include:
| ● | The extent to which our sources of liquidity are sufficient to meet our requirements may be affected by the state of the financial markets and the effect that such condition has on our ability to issue commercial paper at acceptable rates. Our ability to borrow under our committed lines of credit, including our bank credit facilities, could be impaired if one or more of our lenders under those lines is unwilling or unable to honor its contractual obligation to lend to us, or in the event that global pandemics, natural disasters or weather conditions interfere with the ability of our lenders to lend to us. Our ability to refinance maturing debt may be affected by the state of the financial markets. |
| ● | Our ability to achieve sales, earnings and incremental FIFO operating profit goals may be affected by: the risks relating to or arising from our proposed nationwide opioid litigation settlement, including our ability to finalize and effectuate the settlement, the scope and coverage of the ultimate settlement and the expected financial or other effects that could result from the settlement; our proposed transaction with Albertsons, including, among other things, our ability to consummate the proposed transaction and related divestiture plan, including on the terms of the merger agreement and divestiture plan, on the anticipated timeline, with the required regulatory approvals, and/or resolution of pending litigation challenging the merger; labor negotiations; potential work stoppages; changes in the unemployment rate; pressures in labor; changes in government-funded benefit programs; changes in the types and numbers of businesses that compete with us; pricing and promotional activities of existing and new competitors, and the aggressiveness of that competition; our response to these actions; the state of the economy, including interest rates, the current inflationary environment and future potential inflationary, disinflationary and/or deflationary trends and such trends in certain commodities, products and/or operating costs; the geopolitical environment including wars and conflicts; unstable political situations and social unrest; changes in tariffs; the effect that fuel costs have on consumer spending; volatility of fuel margins; manufacturing commodity costs; supply constraints; diesel fuel costs related to our logistics operations; trends in consumer spending; the extent to which our customers exercise caution in their purchasing in response to economic conditions; the uncertainty of economic growth or recession; stock repurchases; changes in the regulatory environment in which we operates; our ability to retain pharmacy sales from third- party payors; consolidation in the healthcare industry, including pharmacy benefit managers; our ability to negotiate modifications to multi-employer pension plans; natural disasters or adverse weather conditions; the effect of public health crises or other significant catastrophic events; the potential costs and risks associated with potential cyber-attacks or data security breaches; the success of our future growth plans; the ability to execute our growth strategy and value creation model, including continued cost savings, growth of our alternative profit businesses, and our ability to better serve our customers and to generate customer loyalty and sustainable growth through our strategic pillars of fresh, Our Brands, personalization, and seamless; and the successful integration of merged companies and new partnerships. |
2
| ● | Our ability to achieve these goals may also be affected by our ability to manage the factors identified above. Our ability to execute our financial strategy may be affected by our ability to generate cash flow. |
| ● | Our adjusted effective tax rate may differ from the expected rate due to changes in tax laws, the status of pending items with various taxing authorities, and the deductibility of certain expenses. |
We cannot fully foresee the effects of changes in economic conditions on our business.
Other factors and assumptions not identified above, including those discussed in Part 1, Item 1A of this Annual Report, could also cause actual results to differ materially from those set forth in the forward-looking information. Accordingly, actual events and results may vary significantly from those included in, contemplated or implied by forward-looking statements made by us or our representatives. We undertake no obligation to update the forward-looking information contained in this filing.
Our ability to complete our proposed transaction with Albertsons may be affected by various factors, including those set forth in Part I, Item 1A of this Annual Report. Risk Factors included in this Annual Report on Form 10-K and other factors as may be described in subsequent filings with the SEC.
ITEM 1. | BUSINESS. |
The Kroger Co. (the “Company” or “Kroger”) was founded in 1883 and incorporated in 1902. Our Company is built on the foundation of our retail grocery business, which includes the added convenience of our retail pharmacies and fuel centers. Our strategy is focused on growing customer loyalty by delivering great value and convenience, and investing in four strategic pillars: Fresh, Our Brands, Data & Personalization and Seamless.
We also utilize the data and traffic generated by our retail business to deliver incremental value and services for our customers that generates alternative profit streams. These alternative profit streams would not exist without our core retail business.
Our revenues are predominately earned and cash is generated as consumer products are sold to customers in our stores, fuel centers and via our online platforms. We earn income predominately by selling products at price levels that produce revenues in excess of the costs we incur to make these products available to our customers. Such costs include procurement and distribution costs, facility occupancy and operational costs, and overhead expenses. Our fiscal year ends on the Saturday closest to January 31. All references to 2023, 2022 and 2021 are to the fiscal years ended February 3, 2024, January 28, 2023 and January 29, 2022, respectively, unless specifically indicated otherwise.
We maintain a web site (www.thekrogerco.com) that includes the Kroger Fact Book and other additional information about the Company. Kroger’s website and any reports or other information made available by Kroger through its website are not part of or incorporated by reference into this Annual Report on Form 10-K. We make available through our web site, free of charge, our annual reports on Form 10-K, our quarterly reports on Form 10-Q, our current reports on Form 8-K and our interactive data files, including amendments. These forms are available as soon as reasonably practicable after we have filed them with, or furnished them electronically to, the SEC.
Kroger is diversified across brands, product categories, channels of distribution, geographies and consumer demographics. Our combination of assets includes the following:
3
Stores
As of February 3, 2024, Kroger operates supermarkets under a variety of local banner names in 35 states and the District of Columbia. As of February 3, 2024, Kroger operated, either directly or through its subsidiaries, 2,722 supermarkets, of which 2,257 had pharmacies and 1,665 had fuel centers. Approximately 50% of our supermarkets were operated in Company-owned facilities, including some Company-owned buildings on leased land. Our stores operate under a variety of banners that have strong local ties and brand recognition. We connect with customers through our expanding seamless ecosystem and the consistent delivery of a full, fresh, and friendly customer experience. Fuel sales are an important part of our revenue, net earnings and loyalty offering. Our fuel strategy is to include a fuel center at each of our supermarket locations when it is feasible and it is expected to be profitable. Each fuel center typically includes five to ten islands of fuel dispensers and storage tanks with capacity for 40,000 to 50,000 gallons of fuel. Supermarkets are generally operated under one of the following formats: combination food and drug stores (“combo stores”); multi-department stores; marketplace stores; or price impact warehouses.
The combo store is the primary grocery store format. We believe this format is successful because the stores are large enough to offer the specialty departments, including natural food and organic sections, pharmacies, general merchandise, pet centers and high-quality perishables such as fresh seafood and organic produce.
Multi-department stores are significantly larger in size than combo stores. In addition to the departments offered at a typical combo store, multi-department stores sell a wide selection of general merchandise items such as apparel, home fashion and furnishings, outdoor living, electronics, automotive products and toys.
Marketplace stores are smaller in size than multi-department stores. They offer full-service grocery, pharmacy and health and beauty care departments as well as an expanded perishable offering and general merchandise area that includes apparel, home goods and toys.
Price impact warehouse stores offer a “no-frills, low cost” warehouse format and feature everyday low prices plus promotions for a wide selection of grocery and health and beauty care items. Quality meat, dairy, baked goods and fresh produce items provide strategic differentiation for price impact warehouse stores. The average size of a price impact warehouse store is similar to that of a combo store.
Seamless Digital Ecosystem
We offer a convenient shopping experience for our customers regardless of how they choose to shop with us, including Pickup, Delivery and Ship. We offer Pickup and Harris Teeter ExpressLane™ — personalized, order online, pick up at the store services — at 2,350 of our supermarkets and provide Delivery, which allows us to offer digital solutions to substantially all of our customers. Our Delivery solutions include orders delivered to customers from retail store locations, customer fulfillment centers powered by Ocado and orders placed through third-party platforms. These channels allow us to serve customers anything, anytime and anywhere with zero compromise on selection, convenience, and price. We also provide relevant customer-facing apps and interfaces that have the features customers want that are also reliable, easy to use and deliver a seamless customer experience across our store and digital channels.
Merchandising and Manufacturing
Our Brands products play an important role in our merchandising strategy and represented over $31 billion of our sales in 2023. Our supermarkets, on average, stock over 12,600 private label items. Our Brands products are primarily produced and sold in three “tiers.” Private Selection® is our main premium quality brand, offering customers culinary foods and ingredients that deliver amazing eating experiences. The Kroger® brand, which represents the majority of our private label items, is designed to consistently satisfy and delight customers with quality products that exceed or meet the national brand in taste and efficacy, as well as with unique and differentiated products. Big K®, Smart Way® and Heritage Farm® are some of our value brands, designed to deliver good quality at a very affordable price. In addition to our three “tiers,” Our Brands offers customers a variety of natural and organic products with Simple Truth® and Simple Truth Organic®. Both Simple Truth® and Simple Truth Organic® are free from a defined list of artificial ingredients that some customers have told us they do not want in their food, and the Simple Truth Organic products are USDA certified organic.
4
Approximately 30% of Our Brands units and 43% of the grocery category Our Brands units sold in our supermarkets are produced in our food production plants; the remaining Our Brands items are produced to our strict specifications by outside manufacturers. We perform a “make or buy” analysis on Our Brands products and decisions are based upon a comparison of market-based transfer prices versus open market purchases. As of February 3, 2024, we owned 33 food production plants. These plants consisted of 14 dairies, nine deli or bakery plants, five grocery product plants, two beverage plants, one meat plant and two cheese plants.
Our Data
We are evolving into a more diverse business. The traffic and data generated by our retail business, including pharmacies and fuel centers, is enabling this transformation. Kroger serves approximately 62 million households annually and because of our rewards program, over 95% of customer transactions are tethered to a Kroger loyalty card. Our 20 years of investment in data science capabilities is allowing us to utilize this data to create personalized experiences and value for our customers and is also enabling our fast-growing, high operating margin alternative profit businesses, including data analytic services and third-party media revenue. Our retail media business – Kroger Precision Marketing – provides differentiated media capabilities for our consumer packaged goods partners and other industry verticals. It is a key driver of our digital profitability and alternative profit.
Proposed Merger with Albertsons
As previously disclosed, on October 13, 2022, we entered into a merger agreement with Albertsons. The proposed merger is expected to accelerate our go-to-market strategy that includes Fresh, Our Brands, Personalization and Seamless, and continue our track record of investments across lowering prices, enhancing the customer experience, and increasing associate wages and benefits. For additional information about the proposed merger with Albertsons, see Note 16 to the Consolidated Financial Statements.
SEGMENTS
We operate supermarkets, multi-department stores and fulfillment centers throughout the United States. Our retail operations, which represent 97% of our consolidated sales, is our only reportable segment. We aggregate our operating divisions into one reportable segment due to the operating divisions having similar economic characteristics with similar long-term financial performance. In addition, our operating divisions offer customers similar products, have similar distribution methods, operate in similar regulatory environments, purchase the majority of the merchandise for retail sale from similar (and in many cases identical) vendors on a coordinated basis from a centralized location, serve similar types of customers, and are allocated capital from a centralized location. Our operating divisions are organized primarily on a geographical basis so that the operating division management team can be responsive to local needs of the operating division and can execute company strategic plans and initiatives throughout the locations in their operating division. This geographical separation is the primary differentiation between these retail operating divisions. The geographical basis of organization reflects how the business is managed and how our Chief Executive Officer, who acts as our chief operating decision maker, assesses performance internally. All of our operations are domestic. Revenues, profits and losses and total assets are shown in our Consolidated Financial Statements set forth in Item 8 below.
SEASONALITY
The majority of our revenues are generally not seasonal in nature. However, revenues tend to be higher during the major holidays throughout the year. Additionally, certain significant events including inclement weather systems, particularly winter storms, tend to affect our sales trends.
5
HUMAN CAPITAL MANAGEMENT
Our People
We want Kroger to be a place where our customers love to shop and associates love to work. This is why we aim to create working environments where associates feel encouraged and supported to be their best selves every day. As of February 3, 2024, Kroger employed nearly 414,000 full- and part-time employees. Our people are essential to our success, and we focus intentionally on attracting, developing and engaging a diverse workforce that represents the communities we serve. We strive to create a culture of opportunity and take seriously our role as a leading employer in the United States. Kroger has provided a large number of people with first jobs, new beginnings and lifelong careers. We have long been guided by our values – Honesty, Integrity, Respect, Safety, Diversity and Inclusion.
Attracting & Developing Our Talent
To deliver on our customers’ experiences and remain competitive with union and non-union employers, we continually try to improve how we attract and retain talent. In addition to competitive wages, quality benefits and a safe work environment, we offer a broad range of employment opportunities for workers of all ages and aspirations. Many retail roles offer opportunities to learn new skills, grow and advance careers.
Associates at all levels of Kroger have access to training and education programs to build their skills and prepare for the roles they want. In 2023, we spent approximately $210 million on training our associates through onboarding, leadership development programs and programs designed to upskill associates across the Company. We continue to invest in new platforms and applications to make learning more accessible to our associates.
Beyond our own programs, associates can take advantage of our tuition reimbursement benefit, which offers up to $3,500 annually — $21,000 over the course of employment — toward continuing education. These funds can be applied to education programs like certifications, associate or graduate degrees. Approximately 7,000 associates, 94% of whom are hourly, have taken advantage of our tuition reimbursement program in 2023. Kroger has invested approximately $54 million in this program since it launched in 2018.
Rewarding Our Associates
As we continue to operate in a challenging labor market, we are dedicated to attracting and retaining the right talent across the organization to be able to continue delivering for our customers. We are investing in our associates by expanding our industry-leading benefits, including continuing education, training and development and health and wellness. During 2023, we increased associate wages resulting in an average hourly rate of nearly $19, and a rate of nearly $25 with comprehensive benefits factored in, which is a 33% increase in rate in the last five years. Over the last five years, we have now invested more than $2.4 billion in incremental wage investments. We remain committed to supporting our associates with investments in wages and comprehensive benefits that are sustainable and will allow us to continue to keep products affordable for the communities we serve. We expect to make continued associate investments in 2024.
Promoting Diversity, Equity & Inclusion
Diversity and inclusion have been among Kroger’s values for decades. We strive to reflect the communities we serve and foster a culture that inspires collaboration and feeds the human spirit. We have taken a very thoughtful and purposeful approach to enact meaningful change and develop what we believe are the right actions to achieve true and lasting equality. Our Framework for Action: Diversity, Equity & Inclusion plan reflects our desire to redefine, deepen, and advance our commitment, mobilizing our people, passion, scale and resources. This ongoing commitment includes the following framework pillars: Create a More Inclusive Culture; Develop Diverse Talent; Advance Diverse Partnerships; Advance Equitable Communities; and Deeply Listen and Report Progress.
6
Creating a Safe Environment
Our associates’ safety is a top priority. It is also one of our core values. We prioritize providing the right safety training and equipment, safe working conditions and resources to maintain and improve associates’ well-being. Through our strategy to set clear expectations, routine monitoring, and regular communication and engagement, we reduce the number of injuries and accidents that happen in our workplace. We track health and safety metrics centrally for an enterprise-wide view of issues, trends and opportunities and monitor associate injury performance including total injuries, Occupational Safety and Health Administration (“OSHA”) injury rates, and lost-time injuries, as well as customer injury metrics like slip-and-fall injuries. We also track the completion of required training for associates, and we regularly share these metrics with leaders and relevant team members to inform management decisions.
Supporting Labor Relations
A majority of our employees are covered by collective bargaining agreements negotiated with local unions affiliated with one of several different international unions. There are approximately 350 such agreements, usually with terms of three to five years. Wages, health care and pensions are included in all of these collective bargaining agreements that cover approximately 65% of our associates. Our objective is to negotiate contracts that balance wage increases that are competitive with union and non-union employers and provide affordable healthcare for associates with keeping groceries affordable for the communities we serve. Our obligation is to do this in a way that maintains a financially sustainable business.
MANAGING CLIMATE IMPACTS
Managing climate change impacts is an important part of Thriving Together, Kroger’s Environmental, Social & Governance (“ESG”) strategy and has been a focus for our business for many years. With a large portfolio of supermarkets, distribution warehouses and food production plants, as well as a complex supply chain, we recognize Kroger’s effect on our climate. We continue to explore opportunities and take steps to reduce the effects of our operations on the environment and to reduce the potential risk of a changing climate on our operations. This includes enhancing our operational efficiency, increasing our usage of renewable energy and investing in new technologies. The key elements of our climate strategy are included below.
Governance
Climate effects are managed by leadership with input from several departments across the business. The Public Responsibilities Committee of the Board of Directors oversees our responsibilities as a corporate citizen and Kroger’s practices related to environmental sustainability, including climate effects, along with other environmental and social topics of material importance. Kroger discloses detailed energy and emissions data, as well as our approach to managing climate-related topics, in our annual ESG Report, which can be found at www.thekrogerco.com/esgreport.
Risk assessment
To help identify and manage climate-related risks to our business, we conducted a quantitative climate risk assessment to determine the likelihood that different physical climate risks, including drought, extreme heat and extreme precipitation, would affect Kroger’s operations at representative facilities in different geographies and, in turn, potentially increase operating costs for these facilities. As a result of our risk assessments, we do not currently anticipate the modeled physical risks to adversely affect our financial condition, results of operations or cash flows for the foreseeable future. We plan to continue these climate risk assessments moving forward.
Kroger also acknowledges that current and emerging climate-related legislation could affect our business. As a result of state and federal requirements regarding the phase down of hydrofluorocarbon (“HFC”) refrigerants, we anticipate steadily replacing our refrigerant infrastructure to reach required levels, which could incur significant costs to the business. If legislation required an accelerated timeline regarding the phase down of HFC refrigerants, we could incur higher costs. Any such legislation will affect all retailers using refrigerants in their operations.
7
Climate adaptation
To help prepare for and manage a variety of risk scenarios, including natural disasters and business disruptions to our supply chain, we maintain more than 200 business continuity plans. We have installed technologies and processes to ensure our supermarkets, food production plants, fulfillment centers and supply chain can respond quickly and remain operational. We also monitor energy availability and costs to help anticipate how changing climate patterns, like increasing temperatures, could affect our energy-sourcing costs and activities. Our teams also monitor transition risks due to climate change, including the effect possible new legislation may have on our business.
Climate mitigation
For many years, Kroger has implemented emission reduction projects, including energy efficiency improvements, refrigerant leak detection and mitigation measures, renewable energy installations and procurement and fleet efficiencies. In 2020, we set a goal to reduce absolute greenhouse gas (“GHG”) emissions from our operations (scope 1 and 2 emissions) by 30% by 2030, against a 2018 baseline. The goal was developed using climate science and is aligned with the Paris Agreement, specifically supporting a well-below 2°C climate scenario according to the absolute contraction method. Kroger is reviewing its GHG reduction target against the requirements of the Science Based Targets initiative. In 2023, we completed our first full Scope 3 emissions baseline.
Additional discussion about our approach to managing climate effects is included in our annual ESG Report. The information in our ESG Report is not part of or incorporated by reference into this Annual Report on Form 10-K.
8
INFORMATION ABOUT OUR EXECUTIVE OFFICERS
The following is a list of the names and ages of the executive officers and the positions held by each such person. Except as otherwise noted, each person has held office for at least five years. Each officer will hold office at the discretion of the Board for the ensuing year until removed or replaced.
Name |
| Age |
| Recent Employment History |
Mary E. Adcock | 48 | Ms. Adcock was elected Senior Vice President effective May 1, 2019 and is responsible for retail operations as well as the oversight of all Kroger retail divisions. From June 2016 to April 2019, she served as Group Vice President of Retail Operations. Prior to that, Ms. Adcock held leadership roles in Kroger’s Columbus Division, including Vice President of Operations and Vice President of Merchandising. Prior to that, Ms. Adcock served as Vice President of Natural Foods Merchandising and as Vice President of Deli/Bakery Manufacturing and held several leadership positions in the manufacturing department, including human resources manager, general manager and division operations manager. Ms. Adcock joined Kroger in 1999 as human resources assistant manager at the Country Oven Bakery in Bowling Green, Kentucky. | ||
Stuart W. Aitken | 52 | Mr. Aitken was named Senior Vice President and Chief Merchant and Marketing Officer in August 2020. He was elected Senior Vice President in February 2019 and served as Group Vice President from June 2015 to February 2019. He is responsible for sales, pricing, promotional and category planning for fresh foods, center store and general merchandise categories, as well as analytics & execution, e-commerce and Digital Merchandising, Sourcing and Our Brands. Prior to joining Kroger, he served as the chief executive officer of dunnhumby USA, LLC. Mr. Aitken has over 15 years of marketing, academic and technical experience across a variety of industries, and held various leadership roles with other companies, including Michaels Stores and Safeway, Inc. | ||
Gabriel Arreaga | 49 | Mr. Arreaga was elected Senior Vice President of Supply Chain in December 2020. He is responsible for the Company’s industry-leading Supply Chain organization, Logistics, Inventory & Replenishment, Manufacturing, and Fulfillment Centers. Prior to Kroger, Mr. Arreaga served as Senior Vice President of Supply Chains for Mondelez, where he was responsible for all operations and functions from field to consumer, internal and external factories, fulfillment centers, direct to store branches, Logistics and product development. He was also Global Vice President of Operations for Stanley Black and Decker and held numerous leadership roles at Unilever including Vice President of Food and Beverage Operations. | ||
Yael Cosset | 50 | Mr. Cosset was elected Senior Vice President and Chief Information Officer in May 2019 and is responsible for leading Kroger’s digital strategy, focused on building Kroger’s presence in the marketplace in digital channels, personalization and e-commerce. In August 2020, he also assumed responsibility for Kroger’s alternative profit businesses, including Kroger’s data analytics subsidiary, 84.51 ͦ LLC and Kroger Personal Finance. Prior to that, Mr. Cosset served as Group Vice President and Chief Digital Officer, and also as Chief Commercial Officer and Chief Information Officer of 84.51° LLC. Prior to joining Kroger, Mr. Cosset served in several leadership roles at dunnhumby USA, LLC, including Executive Vice President of Consumer Markets and Global Chief Information Officer. | ||
9
Carin L. Fike | 55 | Ms. Fike was elected Vice President and Treasurer effective April 2017. Prior to that, she served as Assistant Treasurer and also as Director of Investor Relations. Ms. Fike began her career with Kroger in 1999 as a manager in the Financial Reporting department after working with PricewaterhouseCoopers in various roles, including audit manager. | ||
Todd A. Foley | 54 | Mr. Foley was named Senior Vice President and Interim Chief Financial Officer in March 2024. Prior to that, he served as Group Vice President, Interim Chief Financial Officer and Corporate Controller from February 2024 to March 2024. Prior to that, he served as Group Vice President and Corporate Controller from October 2021 to February 2024. From April 2017 to September 2021, Mr. Foley served as Vice President and Corporate Controller. Before that, he held several leadership roles, including Vice President and Treasurer, Assistant Corporate Controller, and Controller of Kroger’s Cincinnati/Dayton division. Mr. Foley began his career with Kroger in 2001 as an audit manager in the Internal Audit Department after working for PricewaterhouseCoopers in various roles, including senior audit manager. | ||
Valerie L. Jabbar | 55 | Ms. Jabbar was elected Senior Vice President effective August 19, 2021 and is responsible for the oversight of several Kroger retail divisions. From July 2020 to August 2021, she served as Group Vice President of Center Store Merchandising, and from September 2018 to June 2020, as Group Vice President of Merchandising. Prior to that, she served as President of the Ralphs Division from July 2016 to August 2018. Before that, Ms. Jabbar served as Vice President of Merchandising for the Ralphs Division and as Vice President of Merchandising for the Mid-Atlantic Division. She also held several leadership roles, including assistant store director, category manager, Drug/GM coordinator, G.O. Seasonal manager, assistant director of Drug/GM and director of Drug GM, and district manager in the Fry’s Division. She joined the Company in 1987 as a clerk in the Fry’s Division. | ||
Kenneth C. Kimball | 58 | Mr. Kimball was elected Senior Vice President in March 2022 and is responsible for the oversight of several Kroger retail divisions. From April 2016 to March 2022, he served as President of the Smith’s Division. Prior to that, he held several leadership roles with the Ralphs Division, including Vice President of Operations and Vice President of Merchandising. Prior to that, he held leadership roles, including store manager, district manager, and director in the Smith’s Division as well as Senior Vice President of Sales and Merchandising and Group Vice President of Retail Operations. Mr. Kimball joined the Company in 1984 as a clerk in the Smith’s Division. | ||
Timothy A. Massa | 57 | Mr. Massa was elected Senior Vice President in June 2018 and serves as the company’s Chief People Officer, leading all areas of Human Resources and Labor Relations, including total rewards, labor relations, diversity, business unit human resources, people operations, training and development, talent hiring, retention and engagement, corporate affairs, and associate communications. He also leads the areas of shared services and aviation. Prior to that, Mr. Massa served as Group Vice President of Human Resources and Labor Relations from June 2014 to June 2018. Mr. Massa joined Kroger in October 2010 as Vice President, Corporate Human Resources and Talent Development. Prior to joining Kroger, Mr. Massa served in various Human Resources leadership roles for 21 years at Procter & Gamble, most recently serving as Global Human Resources Director of Customer Business Development. | ||
10
W. Rodney McMullen | 63 | Mr. McMullen was elected Chairman of the Board effective January 1, 2015, and Chief Executive Officer effective January 1, 2014. Prior to that, he served as President and Chief Operating Officer from August 2009 to December 2013. Prior to that he held numerous leadership roles, including Vice Chairman, Executive Vice President of Strategy, Planning and Finance, Executive Vice President and Chief Financial Officer, Senior Vice President, Group Vice President and Chief Financial Officer, Vice President, Control and Financial Services, and Vice President, Planning and Capital Management. Mr. McMullen joined Kroger in 1978 as a part-time stock clerk. | ||
Brian W. Nichols | 51 | Mr. Nichols was elected Vice President, Corporate Controller in March 2024 and is responsible for oversight of Kroger’s Corporate Accounting and Corporate Tax departments, as well as the Company’s Accounting Centers and Accounting Modernization, Pension Investment, and Insurance and Claims teams. Prior to that, he served as Vice President, Assistant Corporate Controller from April 2021 to March 2024. From May 2018 to April 2021, Mr. Nichols served as Senior Director and Assistant Corporate Controller. Prior to that, he held several leadership roles, including Senior Manager of Corporate and External Financial Reporting and Senior Financial Analyst of SEC Reporting. Mr. Nichols joined Kroger in 2000 as Assistant Controller of the Central Division. | ||
Christine S. Wheatley | 53 | Ms. Wheatley was elected Senior Vice President, General Counsel, and Secretary in May 2023. Prior to this, she served as Group Vice President, Secretary and General Counsel from May 2014 to May 2023. She joined Kroger in February 2008 as Corporate Counsel, and thereafter served as Senior Attorney, Senior Counsel, and Vice President. Before joining Kroger, Ms. Wheatley was engaged in the private practice of law for 11 years, most recently as a partner at Porter Wright Morris & Arthur in Cincinnati. |
COMPETITIVE ENVIRONMENT
For the disclosure related to our competitive environment, see Item 1A under the heading “Competitive Environment.”
ITEM 1A. | RISK FACTORS. |
There are risks and uncertainties that can affect our business. The significant risk factors are discussed below. The following information should be read together with “Management’s Discussion and Analysis of Financial Condition and Results of Operations,” which includes forward-looking statements and factors that could cause us not to realize our goals or meet our expectations.
11
OUR PROPOSED TRANSACTION WITH ALBERTSONS CREATES INCREMENTAL BUSINESS, REGULATORY AND REPUTATIONAL RISKS
On October 13, 2022, we entered into a merger agreement with Albertsons Companies Inc. (“Albertsons”), which sets forth the terms of our proposed transaction. In connection with the proposed transaction, Kroger and Albertsons entered into a comprehensive divestiture plan with C&S Wholesale Grocers, LLC for the combined sale of certain stores, distribution centers, offices and private label brands. The proposed transaction with Albertsons and the divestiture plan entails important risks, including, among others: the expected timing and likelihood of completion of the proposed transaction and divestiture plan, including the timing, receipt and terms and conditions of any required governmental and regulatory clearance of the proposed transaction and divestiture plan, and/or resolution of pending litigation challenging the merger; the effect of the proposed divestiture plan; the occurrence of any event, change or other circumstances that could give rise to the termination of the merger agreement or divestiture agreement; the outcome of any legal proceedings that have been instituted and may in the future be instituted against the parties and others following announcement of the merger agreement and proposed transaction or divestiture plan; the inability to consummate the proposed transaction or divestiture plan due to the failure to satisfy other conditions to complete the proposed transaction or divestiture plan; risks that the proposed transaction or divestiture plan disrupts our current plans and operations; the ability to identify and recognize, including on the expected timeline, the anticipated total shareholder return (“TSR”), revenue and EBITDA expectations; the amount of the costs, fees, expenses and charges related to the proposed transaction or divestiture plan; the risk that transaction and/or integration costs are greater than expected, including as a result of conditions regulators put on any approvals of the transaction; the potential effect of the announcement and/or consummation of the proposed transaction or divestiture plan on relationships, including with associates, suppliers and competitors; our ability to maintain an investment grade credit rating; the risk that management’s attention is diverted from other matters; risks related to the potential effect of general economic, political and market factors, including changes in the financial markets as a result of inflation or measures implemented to address inflation, and any epidemic, pandemic or disease outbreaks, on Kroger, Albertsons or the proposed transaction or divestiture plan; the risk of adverse effects on the market price of our or Albertsons’s securities or on Albertsons’s or our operating results for any reason; the occurrence of any event, change or other circumstances that could give rise to the termination of the merger agreement or divestiture agreement; and other risks described in our filings with the SEC.
INTEGRATION OF NEW BUSINESS AND STRATEGIC ALLIANCES
In addition to the above, we enter into mergers, acquisitions and strategic alliances with expected benefits including, among other things, operating efficiencies, procurement savings, innovation and sharing of best practices, that may allow for future growth. Achieving the anticipated or desired benefits may be subject to a number of significant challenges and uncertainties, including, without limitation, whether unique corporate cultures will work collaboratively in an efficient and effective manner, the coordination of geographically separate organizations, the possibility of imprecise assumptions underlying expectations regarding potential synergies, capital requirements, and the integration process (including the integration of internal controls into our business operations), unforeseen expenses and delays and competitive factors in the marketplace. We could also encounter unforeseen transaction and integration-related costs or other circumstances such as unforeseen liabilities or other issues. Many of these potential circumstances are outside of our control and any of them could result in increased costs, decreased revenue, decreased synergies and the diversion of management time and attention. If we are unable to achieve our objectives within the anticipated time frame, or at all, the expected benefits may not be realized fully or at all, or may take longer to realize than expected, which could have an adverse effect on our business, financial condition, results of operations or cash flows.
12
COMPETITIVE ENVIRONMENT
The operating environment for the food retailing industry continues to be characterized by the proliferation of local, regional, and national retailers, including both retail and digital formats, and intense and ever-increasing competition ranging from online retailers, mass merchant, club stores, regional chains, deep discounters, and dollar stores, as well as ethnic, specialty and natural food stores. With the proliferation of grocery delivery – both by retailers and third-party delivery service providers – customers have an even wider range of retailers from which to choose. Customers continue to expect a great shopping experience both in-store and online. The industry continues to be shaped by e-commerce, cooking at home and prepared foods to go and other customer needs and preferences. Customers want to be able to shop on their own terms with zero compromise whether at brick and mortar stores or online, pick-up or delivery, depending on their particular trip needs and other factors. If we do not appropriately or accurately anticipate customer preferences or fail to quickly adapt to these ever-changing preferences, our sales and profitability could be adversely affected. If we fail to meet the evolving needs of our customers, our ability to compete and our financial condition, results of operations or cash flows could be adversely affected.
We are continuing to enhance the customer connection with investments in our four strategic pillars – Seamless, Personalization, Fresh, and Our Brands. Each of these strategies is designed to better serve our customers and to generate customer loyalty and sustainable growth momentum. We believe our plans to continue to improve these four strategic pillars will enable us to meet the wide-ranging needs and expectations of our customers. If we are unable to continue to enhance the foregoing key elements of our connection with customers, or they fail to strengthen customer loyalty, our ability to compete and our financial condition, results of operations or cash flows could be adversely affected. Our ecosystem monetizes the traffic and data insights generated by our retail grocery business to create fast-growing, asset-light and margin-rich revenue streams. Growth in loyal households, customer traffic and digitally engaged customers allow us to grow profits and power the flywheel in our model. We may be unsuccessful in implementing our alternative profit strategy, which could adversely affect our business growth and our financial condition, results of operations or cash flows. The nature and extent to which our competitors respond to the evolving and competitive industry by developing and implementing their competitive strategies could adversely affect our profitability.
In addition, evolving customer preferences and the advancement of online, delivery, ship to home and mobile channels in our industry increase the competitive environment. We must anticipate and meet these evolving customer preferences and continue to implement technology, software and processes to be able to conveniently and cost-effectively fulfill customer orders. Providing flexible fulfillment options and implementing new technology is complex and may not meet customer preferences. If we are not successful in reducing or offsetting the cost of fulfilling orders outside of our in-store channel with efficiencies, cost-savings, expense reductions, or alternative revenues, our financial condition, results of operations or cash flows could be adversely affected.
In addition, if we do not successfully develop and maintain a relevant digital experience for our customers, our business, financial condition, results of operations or cash flows could be adversely affected. Digital retailing is rapidly evolving, and we must keep pace with new developments by our competitors as well as the evolving needs and preferences of our customers. We must compete by offering a convenient shopping experience for our customers regardless of how they choose to shop with us, and by investing in providing and maintaining relevant customer-facing apps and interfaces that have the features customers want that are also reliable and easy to use. The future success of the digital business will also depend on the efficiency and cost effectiveness of fulfilling orders across our modalities, whether in store, in pickup-only locations or through customer fulfillment centers powered by Ocado.
13
PRODUCT SAFETY
Customers count on Kroger to provide them with safe food and drugs and other merchandise. Concerns regarding the safety of the products that we sell could cause shoppers to avoid purchasing certain products from us, or to seek alternative sources of supply even if the basis for the concern is outside of our control. Any lost confidence on the part of our customers would be difficult and costly to reestablish. We could be adversely affected by personal injury or product liability claims, product recalls, or other health and safety issues, which occur from time to time. If we sell products that cause illness or injury to customers, resulting from product contamination or spoilage, the presence of certain substances, or damage caused in handling, storage or transportation, we could be exposed to claims or litigation. Any issue regarding the safety of items, whether Our Brands items manufactured by us or for us or CPG products we sell, regardless of the cause, could have a substantial and adverse effect on our reputation, financial condition, results of operations or cash flows.
EMPLOYEE MATTERS
Nearly two-thirds of our associates are covered by collective bargaining agreements with unions, and our relationship with those unions, including a prolonged work stoppage affecting a substantial number of locations, could have a material adverse effect on our financial condition, results of operations or cash flows. We are a party to approximately 350 collective bargaining agreements. Upon the expiration of our collective bargaining agreements, work stoppages by the affected workers could occur (and have occurred in the past) if we are unable to negotiate new contracts with labor unions. In addition, changes to national labor policy could affect labor relations with our associates and relationships with unions. Further, if we are unable to control health care, pension and wage costs, or if we have insufficient operational flexibility under our collective bargaining agreements, we may experience increased operating costs and an adverse effect on our financial condition, results of operations or cash flows.
We have committed to paying fair wages and providing the benefits that were collectively bargained with the United Food and Commercial Workers (“UFCW”) and other labor unions representing associates. Our ability to control labor and benefit costs is subject to numerous internal and external factors, including regulatory changes, wage rates, and healthcare and other insurance costs. Changes to wage regulations, including further increases in the minimum wage or ordinances related to pay or working conditions enacted by local governments, could have an effect on our future financial condition, results of operations or cash flows. Our ability to meet our labor needs, while controlling wages and other costs, is subject to numerous external factors, including the available qualified workforce in each area where we are located, unemployment levels within those areas, wage rates, and changes in employment and labor laws.
Our continued success depends on the ongoing contributions of our associates, including members of our senior management and other key personnel. We must recruit, hire, develop and retain qualified associates with an increasingly large range of skills to meet the needs of our evolving and complex business. We compete with other retail and non-retail businesses for these associates and invest significant resources in training and motivating them. Competition among potential employers has resulted, and may in the future result, in increased associate costs and has from time to time affected our ability to recruit and retain associates. We may not be able to attract or retain sufficient highly qualified associates in the future, which could have a material adverse effect on our business, financial condition, results of operations or cash flows.
DATA AND TECHNOLOGY
Our business is increasingly dependent on information technology systems that are complex and vital to continuing operations, resulting in an expansion of our technological presence and corresponding risk exposure. If we were to experience difficulties maintaining or operating existing systems or implementing new systems, we could incur significant losses due to disruptions in our operations. As we modernize legacy systems, if we are unable to successfully implement those systems in a coordinated manner across internal and external stakeholders, we could be subject to business interruption or reputation risk with our customers, suppliers or associates.
Through our sales and marketing activities, we collect and store some personal information that our customers provide to us. We also gather and retain information about our associates in the normal course of business. Under certain circumstances, we may share information with vendors that assist us in conducting our business, as required by law, or otherwise in accordance with our privacy policy.
14
Our technology systems have been, and may be in the future, disrupted from circumstances beyond our control, as we regularly defend against and respond to data security incidents. Cyber-attackers have targeted and accessed, and may in the future again target and, if successful, access information stored in our or our vendors’ systems in order to misappropriate confidential customer or business information. Due to ongoing geopolitical conflicts, there is an increased possibility of cyberattacks that could either directly or indirectly affect our operations. Although we have implemented procedures to protect our information, and require our vendors to do the same, we cannot be certain that our security systems will successfully defend against, or be able to effectively respond to, rapidly evolving, increasingly sophisticated cyber-attacks as they become more difficult to detect and defend against. Further, a Kroger associate, a contractor or other third party with whom we do business may in the future circumvent our security measures in order to obtain information or may inadvertently cause a breach involving information. In addition, hardware, software or applications we may use may have inherent defects, vulnerabilities, or could be inadvertently or intentionally applied or used in a way that could compromise our information security.
Our cybersecurity program, continued investment in our information technology systems, and our processes to evaluate and select vendors with reasonable information security controls may not effectively insulate us from potential attacks, data breaches or disruptions to our business operations, which could result in a loss of customers or business information, negative publicity, damage to our reputation, and exposure to claims from customers, financial institutions, regulatory authorities, payment card associations, associates and other persons. Any such events could have an adverse effect on our business, financial condition, results of operations or cash flows and may not be covered by our insurance. In addition, compliance with privacy and information security laws and standards may result in significant expense due to increased investment in technology and the development of new operational processes and may require us to devote significant management resources to address these issues. The costs of attempting to protect against the foregoing risks and the costs of responding to cyber-attacks are significant. Following a cyber-attack, our and/or our vendors’ remediation efforts may not be successful, and a cyber-attack could result in interruptions, delays or cessation of service, and loss of existing or potential customers. In addition, breaches of our and/or our vendors’ security measures and the unauthorized dissemination of sensitive personal information or confidential information about us or our customers could expose our customers’ private information and our customers to the risk of financial or medical identity theft, or expose us or other third parties to a risk of loss or misuse of this information, and result in investigations, regulatory enforcement actions, material fines and penalties, loss of customers and business relationships, litigation or other actions which could have a material adverse effect on our brands, reputation, business, financial condition, results of operations or cash flows.
Data governance failures can adversely affect our reputation and business. Our business depends on our customers’ willingness to entrust us with their personal information. Events that adversely affect that trust, including inadequate disclosure to our customers of our uses of their information, failures to honor new and evolving data privacy rights, failing to keep our information technology systems and our customers’ sensitive information secure from significant attack, theft, damage, loss or unauthorized disclosure or access, whether as a result of our action or inaction (including human error) or that of our business associates, vendors or other third parties, could adversely affect our brand and reputation and operating results and also could expose and/or has exposed us to mandatory disclosure to the media, litigation (including class action litigation), governmental investigations and enforcement proceedings, material fines, penalties and/or remediation costs, and compensatory, special, punitive and statutory damages, consent orders, and/or injunctive relief, any of which could adversely affect our businesses, financial condition, results of operations or cash flows. Large scale data breaches at other entities, including supply chain security vulnerabilities, increase the challenge we and our vendors face in maintaining the security of our information technology systems and proprietary information and of our customers’ information. There can be no assurance that such failures will not occur, or if any do occur, that we will detect them or that they can be sufficiently remediated.
The use of data by our business and our business associates is highly regulated. Privacy and information-security laws and regulations change, and compliance with them may result in cost increases due to, among other things, systems changes and the development of new processes. If we, our third-party service providers, or those with whom we share information fail to comply with laws and regulations, or self-regulatory regimes, that apply to all or parts of our business, such as section 5 of the FTC Act, the California Consumer Privacy Act (CCPA), the Health Insurance Portability and Accountability Act (HIPAA), or applicable international laws such as the EU General Data Protection Regulation (GDPR), our reputation could be damaged, possibly resulting in lost business, and we could be subjected to additional legal risk or financial losses as a result of non-compliance.
15
PAYMENT SYSTEMS
We accept payments using a variety of methods, including cash and checks, select credit and debit cards, and Kroger Pay, a mobile payment solution. As we offer new payment options to our customers, we may be subject to additional rules, regulations, compliance requirements, and higher fraud losses. For certain payment methods, we pay interchange and other related acceptance fees, along with additional transaction processing fees. We rely on third parties to provide payment transaction processing services for credit and debit cards. It could disrupt our business if these companies become unwilling or unable to provide these services to us, including due to short term disruption of service. We are also subject to evolving payment card association and network operating rules, including data security rules, certification requirements and rules governing electronic funds transfers. For example, we are subject to Payment Card Industry Data Security Standards (“PCI DSS”), which contain compliance guidelines and standards with regard to our security surrounding the physical and electronic storage, processing and transmission of individual cardholder data. If our payment card terminals or internal systems are breached or compromised, we may be liable for card re-issuance costs and other costs, subject to fines and higher transaction fees, and lose our ability to accept card payments from our members, or if our third-party service providers’ systems are breached or compromised, our business, financial condition, results of operations or cash flows could be adversely affected.
INDEBTEDNESS
Our indebtedness could reduce our ability to obtain additional financing for working capital, mergers and acquisitions or other purposes and could make us vulnerable to future economic downturns as well as competitive pressures. If debt markets do not permit us to refinance certain maturing debt, we may be required to dedicate a substantial portion of our cash flow from operations to payments on our indebtedness. Changes in our credit ratings, or in the interest rate environment, could have an adverse effect on our financing costs and structure.
LEGAL PROCEEDINGS AND INSURANCE
From time to time, we are a party to legal proceedings, including matters involving personnel and employment issues, personal injury, contract disputes, regulatory claims and other proceedings. Other legal proceedings purport to be brought as class actions on behalf of similarly situated parties. Some of these proceedings could result in a substantial loss to Kroger. We estimate our exposure to these legal proceedings and establish accruals for the estimated liabilities, where it is reasonably possible to estimate and where an adverse outcome is probable. Assessing and predicting the outcome of these matters involves substantial uncertainties. Adverse outcomes in these legal proceedings, or changes in our evaluations or predictions about the proceedings, could have an adverse effect on our financial condition, results of operations or cash flows. Please also refer to the “Litigation” section in Note 12 to the Consolidated Financial Statements.
We use a combination of insurance and self-insurance to provide for potential liability for workers’ compensation, automobile and general liability, property, director and officers’ liability, cyber risk exposure and associate health care benefits. Any actuarial projection of losses is subject to a high degree of variability. With respect to insured matters, we are liable for retention amounts that vary by the nature of the claim, and some losses may not be covered by insurance. Changes in legal claims, trends and interpretations, variability in inflation rates, changes in the nature and method of claims settlement, benefit level changes due to changes in applicable laws, insolvency of insurance carriers, and changes in discount rates could all affect our financial condition, results of operations or cash flows.
16
MULTI-EMPLOYER PENSION OBLIGATIONS
As discussed in more detail below in “Management’s Discussion and Analysis of Financial Condition and Results of Operations-Critical Accounting Policies-Multi-Employer Pension Plans,” Kroger contributes to several multi-employer pension plans based on obligations arising under collective bargaining agreements with unions representing associates covered by those agreements. We believe the present value of actuarially accrued liabilities in most of these multi-employer plans exceeds the value of the assets held in trust to pay benefits, and we expect that Kroger’s contributions to most of these funds will increase over the next few years. A significant increase to those funding requirements could adversely affect our financial condition, results of operations or cash flows. Despite the fact that the pension obligations of these funds are not the liability or responsibility of the Company, except as noted below, there is a risk that the agencies that rate our outstanding debt instruments could view the underfunded nature of these plans unfavorably, or adjust their current views unfavorably, when determining their ratings on our debt securities. Any downgrading of our debt ratings likely would adversely affect our cost of borrowing and access to capital.
We also currently bear the investment risk of two multi-employer pension plans in which we participate. In addition, we have been designated as the named fiduciary of these funds with sole investment authority of the assets of these funds. If investment results fail to meet our expectations, we could be required to make additional contributions to fund a portion of or the entire shortfall, which could have an adverse effect on our business, financial condition, results of operations or cash flows.
FUEL
We sell a significant amount of fuel in our 1,665 fuel centers, which could face increased regulation, including due to climate change or other environmental concerns, and demand could be affected by concerns about the effect of emissions on the environment as well as retail price increases. We are unable to predict future regulations, environmental effects, political unrest, acts of war or terrorism, disruptions to the economy, including but not limited to pandemics and other health crises, geopolitical conflicts and other matters that affect the cost and availability of fuel, and how our customers will react to such factors, which could adversely affect our financial condition, results of operations or cash flows.
ECONOMIC CONDITIONS
Our operating results could be materially affected by changes in overall economic conditions and other economic factors that affect consumer confidence and spending, including discretionary spending. Future economic conditions affecting disposable consumer income such as employment levels, business conditions, overall economic slowdown or recession, changes in housing market conditions, changes in government benefits such as SNAP/EBT, student loan relief, or child care credits, the availability of credit, interest rates, inflation, disinflation or deflation, tax rates and other matters could reduce consumer spending. Inflation could materially affect our operating results through increases to our cost of goods, supply chain costs and labor costs. In addition, the economic factors listed above, or any other economic factors or circumstances resulting in higher transportation, labor, insurance or healthcare costs or commodity prices, and other economic factors can increase our merchandise costs and operating, general and administrative expenses and otherwise adversely affect our financial condition, results of operations or cash flows. Increased fuel prices also have an effect on consumer spending and on our costs of producing and procuring products that we sell. A deterioration in overall economic conditions, including the uncertainty caused by inflation rate volatility, could adversely affect our business in many ways, including slowing sales growth, reducing overall sales and reducing gross margins. Geopolitical and catastrophic events, such as wars and conflicts, civil unrest, acts of terrorism or other acts of violence, including active shooter situations (which have occurred in the past at our locations), or the loss of merchandise as a result of shrink or industry-wide theft and organized retail crime, or pandemics or other health crises, and other matters that could reduce consumer spending, could materially affect our financial condition, results of operations or cash flows. We regularly maintain cash balances at third-party financial institutions in excess of the Federal Deposit Insurance Corporation (“FDIC”) insurance limit and are therefore reliant on banks and other financial institutions to safeguard and allow ready access to these assets. If banks or financial institutions enter receivership or become insolvent in the future in response to financial conditions affecting the banking system and financial markets, our ability to access our existing cash, cash equivalents and investments may be threatened. We are unable to predict how the global economy and financial markets will perform. If the global economy and financial markets do not perform as we expect, it could adversely affect our business, financial condition, results of operations or cash flows.
17
Our operating results could be adversely affected by any future disease outbreak, including pandemics, epidemics, or similar widespread health concerns. We cannot predict with certainty the extent that our operations may be affected by any effects of the foregoing on us or on our customers, suppliers, vendors, and other business partners, and each of their financial conditions; however, any adverse effect on these parties could materially and adversely affect us. To the extent that any health crisis affects the U.S. and global economy and our business, it may also heighten other risks described in this section, including but not limited to those related to consumer behavior and expectations, competition, implementation of strategic initiatives, cybersecurity threats, payment-related risks, supply chain disruptions, labor availability and cost, litigation and operational risk as a result of regulatory requirements.
LEGAL AND GOVERNMENT REGULATION
We are subject to various laws, regulations, and administrative practices that affect our business, including laws and regulations involving antitrust and competition, privacy, data protection, environmental, healthcare, anti-bribery, anti-corruption, tax, accounting, and financial reporting or other matters. These and other rapidly changing laws, regulations, policies and related interpretations, as well as increased enforcement actions by various governmental and regulatory agencies, create challenges for us, may alter the environment in which we do business and may increase the ongoing costs of compliance, which could adversely affect our financial condition, results of operations and cash flows. If we are unable to continue to meet these challenges and comply with all laws, regulations, policies and related interpretations, it could negatively affect our reputation and our business results. Additionally, we are currently, and in the future may be, subject to a number of inquiries, investigations, claims, proceeding, and requests for information from governmental agencies or private parties, the adverse outcomes of which could harm our business. Failure to successfully manage these new or pending regulatory and legal matters and resolve such matters without significant liability or damage to our reputation may adversely affect our financial condition, results of operations and cash flows. Furthermore, if new or pending legal or regulatory matters result in fines or costs in excess of the amounts accrued to date, that may also materially affect our financial condition, results of operations or cash flows.
In addition, increasing governmental and societal attention to environmental, social, and governance (“ESG”) matters, including expanding voluntary reporting, diligence, and disclosure on topics such as climate change, waste production, water usage, human capital, labor, and risk oversight, could expand the nature, scope, and complexity of matters that we are required to control, assess, and report and could negatively affect our reputation. Given our commitment to our ESG strategy, we have established and publicly announced certain goals which we may refine or even expand further in the future. The execution of this strategy to achieve these goals is subject to risks and uncertainties, many of which may be outside of our control and prove to be more costly than we anticipate. These risks and uncertainties include, but are not limited to, our ability to achieve our goals within the currently projected costs and the expected timeframes; unforeseen operational and technological difficulties; the outcome of research efforts and future technology developments; and the success of our collaborations with and reliance on third parties. Any failure, or perceived failure, to achieve these goals or the setting or publication of certain targets could damage our reputation and customer, investor and other stakeholder relationships, and may even result in regulatory enforcement action. Such conditions could have an adverse effect on our business, financial condition, results of operations or cash flows.
Additionally, we must comply with numerous provisions regulating, among other things, health and sanitation standards, food labeling and safety, equal employment opportunity, minimum wages and licensing for the sale of food, drugs, and alcoholic beverages. We cannot predict future laws, regulations, interpretations, administrative orders, or applications, or the effect they will have on our operations. They could, however, significantly increase the cost of doing business. They also could require the reformulation of some of the products that we sell (or manufacture for sale to third parties) to meet new standards. We also could be required to recall or discontinue the sale of products that cannot be reformulated. These changes could result in additional record keeping, expanded documentation of the properties of certain products, expanded or different labeling, or scientific substantiation. Any or all of these requirements could have an adverse effect on our financial condition, results of operations or cash flows.
18
WEATHER, NATURAL DISASTERS AND OTHER EVENTS
A large number of our stores, distribution facilities and fulfillment centers are geographically located in areas that are susceptible to hurricanes, tornadoes, floods, droughts, ice and snow storms and earthquakes. Weather conditions and natural disasters have, and may again in the future, disrupt our operations at one or more of our facilities, interrupt the delivery of products to our stores, substantially increase the cost of products, including supplies and materials and substantially increase the cost of energy needed to operate our facilities or deliver products to our facilities. Moreover, the effects of climate change, including those associated with extreme weather events, may affect our ability to procure needed commodities at costs and in quantities that are optimal for us or at all. Adverse weather or natural disasters and other matters that could reduce consumer spending, could materially affect our financial condition, results of operations or cash flows.
CLIMATE IMPACT
The long-term effects of global climate change present both physical risks, such as extreme weather conditions or rising sea levels, and transition risks, such as regulatory or technology changes, which are expected to be widespread and unpredictable. These changes could over time affect, for example, the availability and cost of products, commodities and energy including utilities, which in turn may affect our ability to procure goods or services required for the operation of our business at the quantities and levels we require. In addition, many of our operations and facilities are in locations that may be affected by the physical risks of climate change, and we face the risk of losses incurred as a result of physical damage to stores, distribution or fulfillment centers, loss or spoilage of inventory and business interruption caused by such events. We also use natural gas, diesel fuel, gasoline and electricity in our operations, all of which could face increased regulation and cost increases as a result of climate change or other environmental concerns. Transitioning to alternative energy sources, such as renewable electricity or electric vehicles, and investments in new technologies, could incur higher costs. Regulations limiting greenhouse gas emissions and energy inputs will also increase in coming years, which may increase our costs associated with compliance, tracking, reporting, and sourcing. These events and their effects could otherwise disrupt and adversely affect our operations and could have an adverse effect on our financial condition, results of operations or cash flows.
SUPPLY CHAIN
Disruption in our global supply chain could negatively affect our business. The products we sell are sourced from a wide variety of domestic and international vendors, and any future disruption in our supply chain or inability to find qualified vendors and access products that meet requisite quality and safety standards in a timely and efficient manner could adversely affect our business. The loss or disruption of such supply arrangements for any reason, labor disputes, loss or impairment of key manufacturing sites, acts of war or terrorism, disruptive global political events, quality control issues, a supplier’s financial distress, natural disasters or health crises, regulatory actions or ethical sourcing issues, trade sanctions or other external factors over which we have no control, could interrupt product supply and, if not effectively managed and remedied, have an adverse effect on our business, financial condition, results of operations or cash flows.
ITEM 1B. | UNRESOLVED STAFF COMMENTS. |
None.
19
ITEM 1C. | CYBERSECURITY. |
RISK MANAGEMENT AND STRATEGY
Securing Kroger’s business information, intellectual property, customer and employee data and technology systems is essential for the continuity of our businesses, meeting applicable regulatory requirements and maintaining the trust of our stakeholders. We have adopted enterprise cybersecurity risk mitigation and governance processes, which are set forth in the Kroger Cybersecurity Risk Management program (“CRM”), the Kroger Third-Party Cybersecurity Risk Management program (“TPCRM”), and the Kroger Cyber Incident Response Plan (“IR Plan”). Our approach is guided by the principles of the CRM, which includes monitoring threats and vulnerabilities and assessing and monitoring related controls, supporting the Corporate Information Security function, the Chief Information Security Officer (“CISO”) and Chief Information Officer (“CIO”). Kroger’s cybersecurity policies, standards, processes, and practices are integrated into our overarching risk management system in an effort to enhance our ability to safeguard our operations and information, which includes quarterly cybersecurity reporting to the Board, delivered by senior leadership.
Kroger Cyber Risk Management Program
The CRM was developed in collaboration with third-party consultants and is aligned with the National Institute of Standards and Technology (“NIST”), Risk Management Framework (“RMF”), Cybersecurity Framework (“CSF”) and the International Organization for Standardization 27001 (“ISO 27001”). The program includes security and privacy, risk-based controls, and incorporates lessons learned from cybersecurity incidents. Under Kroger’s CRM, cyber risks, including cyber threats and cyber events/incidents, are assessed, treated, and monitored on a continuous basis. We integrate lessons learned from incident response and cyber risk mitigation into our cyber risk management strategy, in an effort to improve overall cybersecurity on an ongoing basis. Kroger's CRM program is spearheaded by specific management positions, chosen for their expertise in the field as further discussed below.
In line with cyber risk management best practices, we have collaborated with recognized third-party experts as needed to align the CRM’s foundational processes, metrics, monitoring, and reporting with common frameworks such as NIST and RMF.
Third-Party Cyber Risk Management
Recognizing the potential vulnerabilities posed by third-party relationships, Kroger has implemented a comprehensive TPCRM program. The TPCRM program is designed to assess third-party cybersecurity risks by employing third-party risk assessments, vendor tiering, and a dedicated team tasked with recommending holistic improvements to strengthen Kroger’s cybersecurity posture, sourcing, and contracting processes. Kroger’s Information Security Operations Center (“iSOC”) responds to known third-party incidents on a continuous basis. The iSOC is a part of the Corporate Information Security (“CIS”) department and is responsible for detecting, responding to, and escalating security incidents. We partner directly with business stakeholders and technology custodians to determine an appropriate response to manage incident risk to minimize the effect to the business. This response process is a regular and critical function of the iSOC and is defined in a separate appendix to the IR Plan. Any material risk identified from these incidents is escalated and communicated using formal severity and impact criteria as defined in the IR Plan.
Kroger Cyber Incident Response Plan
The IR Plan documents the processes by which information security events are detected, identified, prioritized, and analyzed. The Kroger iSOC, CISO, legal counsel, and corporate affairs stakeholders are then engaged depending on the incident’s scope, business effect, and potential material risk. This cross-functional team is responsible for assessing an appropriate response and mitigation pathway. Once security events are identified through the enterprise detection and monitoring ecosystem, the IR Plan sets forth an incident prioritization/decision workflow to determine scope, business effect, and potential material risk. This workflow is implemented through collaboration with the iSOC, CISO, legal counsel, and corporate affairs stakeholders.
20
In addition to the processes outlined above, we have also implemented an information security training program for employees that includes security awareness training related to cyber security risks, simulated phishing emails and regular communication to the enterprise regarding cyber security risks.
We experience cybersecurity threats and incidents from time to time. We are not aware of any material risks from cybersecurity threats, including as a result of any previous cybersecurity incidents, that have materially affected or are reasonably likely to materially affect us, including our business strategy, our financial condition, results of operations or cash flows. There can be no assurance that cybersecurity threats will not have a material effect on us, including our business strategy, our financial condition, results of operations or cash flows. Please see “Item 1A. Risk Factors” for more information on our cybersecurity-related risks.
GOVERNANCE
Protection of our customers’ data is a fundamental priority for our Board and management team. Our risk management team is integrated into our CIS function and is led by our CIO and CISO. The risk management team reports to the CISO and has combined experience in information security, governance, and compliance, including domains such as engineering, architecture, cybersecurity, and privacy. This team is responsible for defining the program, cybersecurity governance, and gathering insights related to assessing, identifying, and managing cybersecurity threat risks, their severity, and mitigations.
Kroger’s CIO reports to the CEO and leads technology and digital capabilities for the Kroger Co., including the overall cybersecurity strategy. Kroger’s CIO & Chief Digital Officer, has over 20 years of both leading and transforming technology, digital growth, and e-commerce in the retail and food industry. Kroger’s interim CISO brings nearly 20 years of experience developing and leading security and risk programs. His experience includes governance, information security, and threat management.
The Audit Committee of Kroger’s Board of Directors is charged with oversight of data privacy and cybersecurity risks. Kroger’s CIO and CISO provide quarterly updates on cybersecurity risks and related mitigating actions to the Audit Committee, meet with the full Board at least annually and inform the Audit Committee immediately if a cybersecurity incident is deemed material. They report to the Audit Committee and the Board on compliance and regulatory issues, provide updates concerning continuously-evolving threats and mitigating actions, and present a NIST Cybersecurity Framework Scorecard. Additionally, the CIO and CISO discuss and present strategies to address geopolitical threats that may affect operations as well as technological changes, such as AI and quantum computing. In overseeing cybersecurity risks, the Audit Committee focuses on aggregated, thematic issues with a risk-based approach. Oversight of cybersecurity risk incorporates strategy metrics, third-party assessments, and internal audit and controls. An independent third party also regularly reports to the Audit Committee and the full Board on cybersecurity, and outside counsel advises the Board on best practices for cybersecurity oversight by the Board, and the evolution of that oversight over time. Management also reports on strategic key risk indicators, ongoing initiatives, and significant incidents and their effect.
ITEM 2. | PROPERTIES. |
As of February 3, 2024, we operated approximately 2,800 owned or leased supermarkets, distribution warehouses and food production plants through divisions, subsidiaries or affiliates. These facilities are located throughout the United States. We generally own store equipment, fixtures and leasehold improvements, as well as processing and food production equipment. The total cost of our owned assets and finance leases at February 3, 2024, was $56.7 billion while the accumulated depreciation was $31.5 billion.
21
We lease certain store real estate, warehouses, distribution centers, office space and equipment. We operate in leased facilities in approximately half of our store locations. Lease terms generally range from 10 to 20 years with options to renew for varying terms at our sole discretion. Certain leases also include options to purchase the leased property. Leases with an initial term of 12 months or less are not recorded on the balance sheet. Certain leases include escalation clauses or payment of executory costs such as property taxes, utilities or insurance and maintenance. Rent expense for leases with escalation clauses or other lease concessions are accounted for on a straight-line basis over the lease term. Our lease agreements do not contain any material residual value guarantees or material restrictive covenants. Certain properties or portions thereof are subleased to others for periods generally ranging from one to 20 years. For additional information on lease obligations, see Note 9 to the Consolidated Financial Statements.
ITEM 3. | LEGAL PROCEEDINGS. |
Incorporated by reference herein is information regarding certain legal proceedings in which we are involved as set forth under “Litigation” contained in Note 12 – “Commitments and Contingencies” in the notes to the Consolidated Financial Statements in Item 8 of Part II of this Annual Report.
ITEM 4. | MINE SAFETY DISCLOSURES. |
Not applicable.
PART II
ITEM 5. | MARKET FOR REGISTRANT’S COMMON EQUITY, RELATED STOCKHOLDER MATTERS AND ISSUER PURCHASES OF EQUITY SECURITIES. |
Our common stock is listed on the New York Stock Exchange under the symbol “KR.” As of March 27, 2024, there were 24,275 shareholders of record.
During 2023, we paid two quarterly cash dividends of $0.26 per share and two quarterly cash dividends of $0.29 per share. During 2022, we paid two quarterly cash dividends of $0.21 per share and two quarterly cash dividends of $0.26 per share. On March 1, 2024, we paid a quarterly cash dividend of $0.29 per share. On March 14, 2024, we announced that our Board of Directors declared a quarterly cash dividend of $0.29 per share, payable on June 1, 2024, to shareholders of record at the close of business on May 15, 2024. We currently expect to continue to pay comparable cash dividends on a quarterly basis, that will increase over time, depending on our earnings and other factors, including approval by our Board.
For information on securities authorized for issuance under our existing equity compensation plans, see Item 12 under the heading “Security Ownership of Certain Beneficial Owners and Management and Related Stockholder Matters.”
22
PERFORMANCE GRAPH
Set forth below is a line graph comparing the five-year cumulative total shareholder return on our common shares, based on the market price of the common shares and assuming reinvestment of dividends, with the cumulative total return of companies in the Standard & Poor’s 500 Stock Index and a peer group composed of food and drug companies.
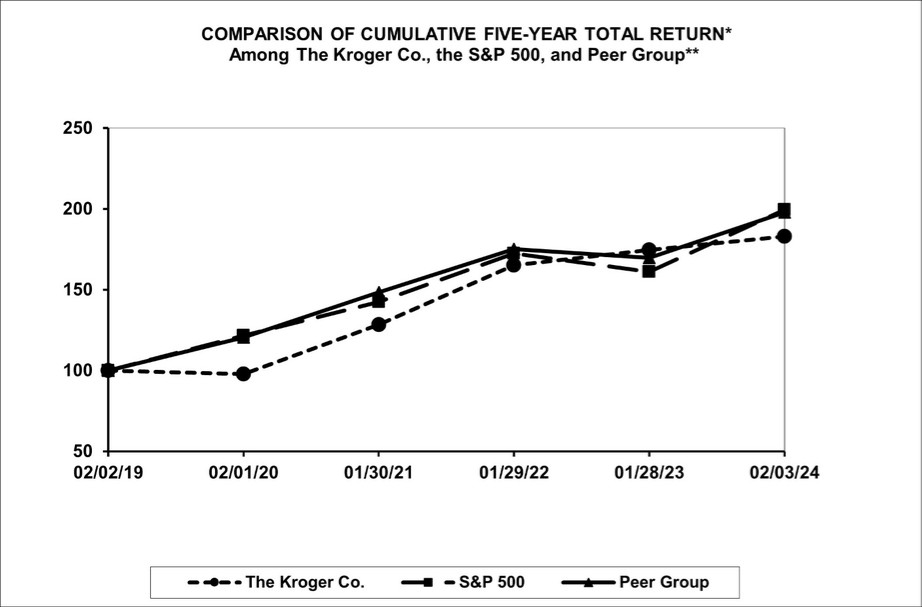
Base | INDEXED RETURNS |
| |||||||||||
Period | Years Ending |
| |||||||||||
Company Name/Index |
| 2018 |
| 2019 |
| 2020 |
| 2021 |
| 2022 |
| 2023 |
|
The Kroger Co. |
| 100 |
| 97.94 |
| 128.49 |
| 165.19 |
| 174.57 |
| 183.07 | |
S&P 500 Index |
| 100 |
| 121.56 |
| 142.53 |
| 172.46 |
| 161.03 |
| 199.42 | |
Peer Group |
| 100 |
| 120.67 |
| 148.43 |
| 175.27 |
| 169.86 |
| 197.90 | |
Kroger’s fiscal year ends on the Saturday closest to January 31.
Data supplied by Standard & Poor’s.
The foregoing Performance Graph will not be deemed incorporated by reference into any other filing, absent an express reference thereto.
* Total assumes $100 invested on February 2, 2019, in The Kroger Co., S&P 500 Index, and the Peer Group, with reinvestment of dividends.
** The Peer Group consists of Albertsons Companies, Inc. (included from June 26, 2020 when it began trading), Costco Wholesale Corporation, CVS Health Corporation, Koninklijke Ahold Delhaize N.V., Target Corp., Walgreens Boots Alliance Inc. and Walmart Inc.
23
The following table presents information on our purchases of our common shares during the fourth quarter of 2023:
ISSUER PURCHASES OF EQUITY SECURITIES
| Approximate Dollar |
| |||||||||
Value of Shares |
| ||||||||||
Total Number of | that May Yet Be |
| |||||||||
Shares Purchased | Purchased Under |
| |||||||||
Total Number | Average | as Part of Publicly | the Plans or |
| |||||||
of Shares | Price Paid Per | Announced Plans | Programs(4) |
| |||||||
Period(1) |
| Purchased(2) |
| Share(2) |
| or Programs(3) |
| (in millions) |
| ||
First period - four weeks | |||||||||||
November 5, 2023 to December 2, 2023 |
| 7,093 | $ | 44.09 |
| 6,900 | $ | 1,000 | |||
Second period - four weeks | |||||||||||
December 3, 2023 to December 30, 2023 |
| 82,059 | $ | 44.75 |
| 64,200 | $ | 1,000 | |||
Third period - five weeks | |||||||||||
December 31, 2023 to February 3, 2024 |
| 96,000 | $ | 46.07 |
| 96,000 | $ | 1,000 | |||
Total |
| 185,152 | $ | 45.41 |
| 167,100 | $ | 1,000 | |||
| (1) | The fourth quarter of 2023 contained two 28-day periods and one 35-day period. |
| (2) | Includes (i) shares repurchased under a program announced on December 6, 1999 to repurchase common shares to reduce dilution resulting from our employee stock option and long-term incentive plans, under which repurchases are limited to proceeds received from exercises of stock options and the tax benefits associated therewith (“1999 Repurchase Program”) and (ii) 18,052 shares that were surrendered to Kroger by participants under our long-term incentive plans to pay for taxes on restricted stock awards. |
| (3) | Represents shares repurchased under the 1999 Repurchase Program. |
| (4) | On September 9, 2022, our Board of Directors approved a $1.0 billion share repurchase program to reacquire shares via open market purchase or privately negotiated transactions, block trades, or pursuant to trades intending to comply with Rule 10b5-1 under the Securities Exchange Act of 1934, as amended (the “September 2022 Repurchase Program”). The amounts shown in this column reflect the amount remaining under the September 2022 Repurchase Program as of the specified period end dates. Amounts available under the 1999 Repurchase Program are dependent upon option exercise activity. The September 2022 Repurchase Program and the 1999 Repurchase Program do not have an expiration date but may be suspended or terminated by our Board of Directors at any time. No shares have been repurchased under the September 2022 authorization. During the third quarter of 2022, we paused our share repurchase program to prioritize de-leveraging following the proposed merger with Albertsons. |
ITEM 6. | RESERVED. |
Not applicable.
24
ITEM 7. | MANAGEMENT’S DISCUSSION AND ANALYSIS OF FINANCIAL CONDITION AND RESULTS OF OPERATIONS. |
The following discussion and analysis of financial condition and results of operations of The Kroger Co. should be read in conjunction with the “Forward-looking Statements” section set forth in Part I and the “Risk Factors” section set forth in Item 1A of Part I. MD&A is provided as a supplement to, and should be read in conjunction with, our Consolidated Financial Statements and the accompanying notes thereto contained in Item 8 of this report, as well as Part II, Item 7 “Management's Discussion and Analysis of Financial Condition and Results of Operations” of our Form 10-K for the year ended January 28, 2023, which provides additional information on comparisons of fiscal years 2022 and 2021.
OUR VALUE CREATION MODEL – DELIVERING CONSISTENT AND ATTRACTIVE TOTAL SHAREHOLDER RETURN
Kroger’s proven value creation model is allowing us to deliver today and invest for the future. The foundation of our value creation model is our omnichannel retail business, including fuel and health and wellness. By executing on our go-to-market strategy built on the four pillars of Fresh, Our Brands, Personalization and Seamless, we are creating a shopping experience that builds loyalty and grows sales. Our retail business generates traffic and data which accelerates growth in our high operating margin alternative profit businesses, like Kroger Precision Marketing. In turn, the value generated from these businesses enables us to reinvest back into our retail business.
We are focused on enhancing our pillars and delivering an exceptional customer experience to accelerate this flywheel effect. By expanding our store network and improving our digital capabilities, we expect to grow households and increase sales. Kroger has evolved into a more diverse business, with a model that provides more ways than ever to generate net earnings growth.
This will be achieved by:
| ● | Growing identical sales without fuel. Our plan involves maximizing growth opportunities in our retail business and is supported by continued strategic investments in our associates, greater value for our customers and our seamless ecosystem to ensure we deliver a full, fresh and friendly experience for every customer, every time. As more and more customers incorporate ecommerce into their permanent routines, we expect digital sales to grow at a double-digit rate – a faster pace than other food at home sales – over time; and |
| ● | Expanding operating margin through long-term initiatives in gross margin, growing alternative profit businesses, and productivity and cost saving initiatives that are focused on simplifying processes and utilizing technology to enhance the associate experience without affecting the customer experience. Together, these will enable us to improve operating margin, while balancing strategic price investments for customers and wage and benefit investments for associates. |
We expect to continue to generate strong free cash flow and are committed to being disciplined with capital deployment in support of our value creation model and stated capital allocation priorities. Our first priority is to invest in the business through attractive high return opportunities that drive long-term sustainable net earnings growth. We are committed to maintaining our current investment grade debt rating and our net total debt to adjusted EBITDA ratio target range of 2.30 to 2.50. We also expect to continue to grow our dividend over time and return excess cash to shareholders via stock repurchases, subject to Board approval. During the third quarter of 2022, we paused our share repurchase program to prioritize de-leveraging following the proposed merger with Albertsons.
We expect our value creation model will result in total shareholder return within our target range of 8% to 11% over time, which does not contemplate the effect of the proposed merger with Albertsons.
25
2023 EXECUTIVE SUMMARY
We achieved strong results in 2023, in line with our long-term growth model and built on three consecutive years of growth, despite navigating a challenging operating environment. By maintaining our long-term commitment to lower prices, through personalized promotions and rewards, we are increasing customer visits and growing loyal households through the strength of our retail business, continuing our evolution into a more diverse business, and our value creation model is providing us multiple ways to drive sustainable future growth.
Our results provided another proof point of the strength and resilience of our value creation model, which supported another year of strong free cash flow and adjusted net earnings per diluted share growth, excluding the 53rd week in fiscal year 2023 (the “Extra Week”). This was the result of continued momentum across several margin expansion initiatives, strong Our Brands performance, strong growth in alternative profit businesses, our ability to effectively manage product cost through strong sourcing practices, lower supply chain costs and a lower year-over-year LIFO charge. During the year, we continued to invest in wages and the associate experience as a way to support the delivery of a full, fresh and friendly customer experience. In 2023, we increased associate wages resulting in an average hourly rate of nearly $19, and a rate of nearly $25 with comprehensive benefits factored in, which is a 33% increase in rate in the last five years.
The following table provides highlights of our financial performance:
Financial Performance Data
($ in millions, except per share amounts)
Fiscal Year | |||||||||
| Percentage |
| |||||||
2023 | Change | 2022 | |||||||
Sales | $ | 150,039 | 1.2 | % | $ | 148,258 | |||
Sales without fuel and the Extra Week | $ | 130,988 | 1.1 | % | $ | 129,626 | |||
Net earnings attributable to The Kroger Co. | $ | 2,164 | (3.6) | % | $ | 2,244 | |||
Adjusted net earnings attributable to The Kroger Co. excluding the Extra Week | $ | 3,335 | 7.4 | % | $ | 3,104 | |||
Net earnings attributable to The Kroger Co. per diluted common share | $ | 2.96 | (3.3) | % | $ | 3.06 | |||
Adjusted net earnings attributable to The Kroger Co. per diluted common share excluding the Extra Week | $ | 4.56 | 7.8 | % | $ | 4.23 | |||
Operating profit | $ | 3,096 | (25.0) | % | $ | 4,126 | |||
Adjusted FIFO operating profit excluding the Extra Week | $ | 4,799 | (5.5) | % | $ | 5,079 | |||
Dividends paid | $ | 796 | 16.7 | % | $ | 682 | |||
Dividends paid per common share | $ | 1.10 | 17.0 | % | $ | 0.94 | |||
Identical sales excluding fuel(1) | 0.9 | % | N/A | 5.6 | % | ||||
FIFO gross margin rate, excluding fuel and the Extra Week, bps increase (decrease)(1) | 0.18 | N/A | (0.09) | ||||||
OG&A rate, excluding fuel, Adjusted Items and the Extra Week, bps increase (decrease)(1) | 0.21 | N/A | (0.19) | ||||||
(Decrease)/increase in total debt, including obligations under finance leases compared to prior fiscal year end | $ | (1,152) | N/A | $ | 14 | ||||
Share repurchases | $ | 62 | N/A | $ | 993 | ||||
| (1) | Identical sales without fuel would have grown 2.3% in fiscal 2023 if not for the reduction in pharmacy sales from the previously communicated termination of our agreement with Express Scripts effective December 31, 2022. In fiscal 2023, the terminated agreement had a positive effect on the FIFO gross margin rate, excluding fuel and the Extra Week, and a negative effect on the OG&A rate, excluding fuel, the Extra Week and the 2023 and 2022 Adjusted Items, as defined below. The overall net effect on adjusted FIFO operating profit was slightly positive. |
26
OVERVIEW
Notable items for 2023 are:
Shareholder Return
| ● | Achieved net earnings attributable to The Kroger Co. per diluted common share of $2.96, which represents a 3.3% decrease compared to 2022. The 2023 results include losses per diluted common share of $1.60 related to our opioid settlement charges. |
| ● | Net earnings include $179 million, $144 million net of tax, due to the Extra Week. The Extra Week in 2023 contributed $0.20 to our net earnings per diluted common share result for 2023. |
| ● | Achieved adjusted net earnings attributable to The Kroger Co. per diluted common share excluding the Extra Week of $4.56, which represents an 8% increase compared to 2022. Including the Extra Week, adjusted net earnings per diluted common share increased 13% compared to 2022. |
| ● | Achieved operating profit of $3.1 billion, which represents a 25% decrease compared to 2022. The 2023 results reflect charges of $1.5 billion related to our opioid settlement charges. |
| ● | Achieved adjusted FIFO operating profit excluding the Extra Week of $4.8 billion, which represents a 6% decrease compared to 2022. Including the Extra Week, adjusted FIFO operating profit decreased 2% compared to 2022. |
| ● | Generated cash flows from operations of $6.8 billion, which represents a 51% increase compared to 2022. |
| ● | Returned $0.8 billion to shareholders through dividend payments. |
Other Financial Results
| ● | Identical sales, excluding fuel, increased 0.9%. Identical sales, excluding fuel, would have grown 2.3% in 2023 if not for the reduction in pharmacy sales from our termination of our agreement with Express Scripts effective December 31, 2022. This terminated agreement had no material effect on profitability. |
| ● | Digital sales grew to $12 billion in annual sales. Digital sales include products ordered online and picked up at our stores and our Delivery and Ship solutions. Excluding the Extra Week, digital sales increased 12%, which was led by strength in our Delivery solutions, which grew by 25%. Delivery solutions growth was driven by our Boost membership program and expansion of our Kroger Delivery network. Our Delivery solutions include orders delivered to customers from retail store locations, customer fulfillment centers powered by Ocado and orders placed through third-party platforms. Our Ship solutions primarily include online orders placed through our owned platforms that are dispatched using mail service or third-party courier. |
| ● | Our LIFO charge for 2023 was $113 million, compared to $626 million in 2022. The decrease in LIFO charge was due to lower product cost inflation year-over-year. |
| ● | Alternative profit streams contributed $1.3 billion of operating profit in 2023. |
27
Significant Events
| ● | During the second quarter of 2023, we recognized opioid settlement charges of $1.4 billion, $1.1 billion net of tax, related to the nationwide opioid settlement framework to settle substantially all opioid lawsuits and claims against Kroger. We have agreed to make settlement payments related to the nationwide settlement framework of approximately $1.2 billion in equal installments over 11 years, and $177 million in equal installments over six years. During the first quarter of 2023, we recognized opioid settlement charges of $62 million, $49 million net of tax, related to all pending and future opioid litigation claims with the State of West Virginia, which are payable over 10 years. For additional information about our opioid settlement charges in 2023, see Note 12 to the Consolidated Financial Statements. |
| ● | On September 8, 2023, Kroger and Albertsons announced they have entered a definitive agreement with C&S Wholesale Grocers, LLC for the combined sale of 413 stores, eight distribution centers, two offices and five private label brands for approximately $1.9 billion cash, in connection with the proposed merger, subject to customary adjustments. The financial terms of this divestiture plan are in line with what we expected and allow us to reaffirm the shareholder value creation opportunity the proposed merger creates. For additional information about the proposed merger with Albertsons, see Note 16 to the Consolidated Financial Statements. |
OUR BUSINESS
The Kroger Co. (the “Company” or “Kroger”) was founded in 1883 and incorporated in 1902. Our Company is built on the foundation of our food retail business, which includes the added convenience of our retail pharmacies and fuel centers. Our strategy is focused on growing customer loyalty by delivering great value and convenience, and investing in four strategic pillars: Fresh, Our Brands, Data & Personalization and Seamless.
We also utilize the data and traffic generated by our retail business to deliver incremental value and services for our customers that generate alternative profit streams. These alternative profit streams would not exist without our core retail business.
Our revenues are predominately earned and cash is generated as consumer products are sold to customers in our stores, fuel centers and via our online platforms. We earn income predominately by selling products at price levels that produce revenues in excess of the costs we incur to make these products available to our customers. Such costs include procurement and distribution costs, facility occupancy and operational costs, and overhead expenses. Our retail operations, which represent 97% of our consolidated sales, is our only reportable segment.
Kroger is diversified across brands, product categories, channels of distribution, geographies and consumer demographics. Our combination of assets include the following:
Stores
As of February 3, 2024, Kroger operates supermarkets under a variety of local banner names in 35 states and the District of Columbia. As of February 3, 2024, Kroger operated, either directly or through its subsidiaries, 2,722 supermarkets, of which 2,257 had pharmacies and 1,665 had fuel centers. We connect with customers through our expanding seamless ecosystem and the consistent delivery of a full, fresh, and friendly customer experience. Fuel sales are an important part of our revenue, net earnings and loyalty offering. Our fuel strategy is to include a fuel center at each of our supermarket locations when it is feasible and it is expected to be profitable.
28
Seamless Digital Ecosystem
We offer a convenient shopping experience for our customers regardless of how they choose to shop with us, including Pickup, Delivery and Ship. We offer Pickup and Harris Teeter ExpressLane™ — personalized, order online, pick up at the store services — at 2,350 of our supermarkets and provide Delivery, which allows us to offer digital solutions to substantially all of our customers. Our Delivery solutions include orders delivered to customers from retail store locations, customer fulfillment centers powered by Ocado and orders placed through third-party platforms. These channels allow us to serve customers anything, anytime, and anywhere with zero compromise on selection, convenience, and price. We also provide relevant customer-facing apps and interfaces that have the features customers want that are also reliable, easy to use and deliver a seamless customer experience across our store and digital channels.
Merchandising and Manufacturing
Our Brands products play an important role in our merchandising strategy and represented over $31 billion of our sales in 2023. We own 33 food production plants, primarily bakeries and dairies, which supply approximately 30% of Our Brands units and 43% of the grocery category Our Brands units sold in our supermarkets; the remaining Our Brands items are produced to our strict specifications by outside manufacturers.
Our Data
We are evolving into a more diverse business. The traffic and data generated by our retail business, including pharmacies and fuel centers, is enabling this transformation. Kroger serves approximately 62 million households annually and because of our rewards program, over 95% of customer transactions are tethered to a Kroger loyalty card. Our 20 years of investment in data science capabilities is allowing us to utilize this data to create personalized experiences and value for our customers and is also enabling our fast-growing, high operating margin alternative profit businesses, including data analytic services and third-party media revenue. Our retail media business – Kroger Precision Marketing – provides best in class media capabilities for our consumer packaged goods partners and other industry verticals. It is a key driver of our digital profitability and alternative profit.
Proposed Merger with Albertsons
As previously disclosed, on October 13, 2022, we entered into a merger agreement with Albertsons. The proposed merger is expected to accelerate our go-to-market strategy that includes Fresh, Our Brands, Personalization and Seamless, and continue our track record of investments across lowering prices, enhancing the customer experience, and increasing associate wages and benefits. For additional information about the proposed merger with Albertsons, see Note 16 to the Consolidated Financial Statements.
USE OF NON-GAAP FINANCIAL MEASURES
The accompanying Consolidated Financial Statements, including the related notes, are presented in accordance with generally accepted accounting principles (“GAAP”). We provide non-GAAP measures, including First-In, First-Out (“FIFO”) gross margin, FIFO operating profit, adjusted FIFO operating profit, adjusted net earnings and adjusted net earnings per diluted share because management believes these metrics are useful to investors and analysts. These non- GAAP financial measures should not be considered as an alternative to gross margin, operating profit, net earnings and net earnings per diluted share or any other GAAP measure of performance. These measures should not be reviewed in isolation or considered as a substitute for our financial results as reported in accordance with GAAP.
We calculate FIFO gross margin as FIFO gross profit divided by sales. FIFO gross profit is calculated as sales less merchandise costs, including advertising, warehousing, and transportation expenses, but excluding the Last-In, First-Out (“LIFO”) charge. Merchandise costs exclude depreciation and rent expenses. FIFO gross margin is an important measure used by management, and management believes FIFO gross margin is a useful metric to investors and analysts because it measures the merchandising and operational effectiveness of our go-to-market strategy.
We calculate FIFO operating profit as operating profit excluding the LIFO charge. FIFO operating profit is an important measure used by management, and management believes FIFO operating profit is a useful metric to investors and analysts because it measures the operational effectiveness of our financial model.
29
The adjusted net earnings, adjusted net earnings per diluted share and adjusted FIFO operating profit metrics are important measures used by management to compare the performance of core operating results between periods. We believe adjusted net earnings, adjusted net earnings per diluted share and adjusted FIFO operating profit are useful metrics to investors and analysts because they present more accurate year-over-year comparisons of our net earnings, net earnings per diluted share and FIFO operating profit because adjusted items are not the result of our normal operations. Net earnings for 2023 include $179 million, $144 million net of tax, due to the Extra Week. In addition, net earnings for 2023 include the following, which we define as the “2023 Adjusted Items:”
| ● | Charges to operating, general and administrative expenses (“OG&A”) of $316 million, $268 million net of tax, for merger related costs and $1.5 billion, $1.2 billion net of tax, for opioid settlement charges (the “2023 OG&A Adjusted Items”). |
| ● | A gain in other income (expense) of $151 million, $116 million net of tax, for the unrealized gain on investments (the “2023 Other Income (Expense) Adjusted Items”). |
Net earnings for 2022 include the following, which we define as the “2022 Adjusted Items:”
| ● | Charges to operating, general and administrative expenses (“OG&A”) of $25 million, $19 million net of tax, for obligations related to withdrawal liabilities for certain multi-employer pension funds, $20 million, $15 million net of tax, for the revaluation of Home Chef contingent consideration, $44 million, $34 million net of tax, for merger related costs, $85 million, $67 million net of tax, for opioid settlement charges and $164 million for goodwill and fixed asset impairment charges related to Vitacost.com (the “2022 OG&A Adjusted Items”). |
| ● | Losses in other income (expense) of $728 million, $561 million net of tax, for the unrealized loss on investments (the “2022 Other Income (Expense) Adjusted Items”). |
Net earnings for 2021 include the following, which we define as the “2021 Adjusted Items:”
| ● | Charges to OG&A of $449 million, $344 million net of tax, for obligations related to withdrawal liabilities for a certain multi-employer pension fund, $66 million, $50 million net of tax, for the revaluation of Home Chef contingent consideration and $136 million, $104 million net of tax, for transformation costs (the “2021 OG&A Adjusted Items”). |
| ● | Losses in other income (expense) of $87 million, $68 million net of tax, related to company-sponsored pension plan settlements and $821 million, $628 million net of tax, for the unrealized loss on investments (the “2021 Other Income (Expense) Adjusted Items”). |
| ● | A reduction to income tax expense of $47 million primarily due to the completion of income tax audit examinations covering multiple years. |
30
The table below provides a reconciliation of net earnings attributable to The Kroger Co. to adjusted net earnings attributable to The Kroger Co. and a reconciliation of net earnings attributable to The Kroger Co. per diluted common share to adjusted net earnings attributable to The Kroger Co. per diluted common share excluding the 2023, 2022 and 2021 Adjusted Items:
Net Earnings per Diluted Share excluding the Adjusted Items
($ in millions, except per share amounts)
| 2023 |
| 2022 |
| 2021 |
| ||||
Net earnings attributable to The Kroger Co. | $ | 2,164 | $ | 2,244 | $ | 1,655 | ||||
(Income) expense adjustments | ||||||||||
Adjustment for pension plan withdrawal liabilities(1)(2) |
| — |
| 19 |
| 344 | ||||
Adjustment for company-sponsored pension plan settlement charges(1)(3) | — | — | 68 | |||||||
Adjustment for (gain) loss on investments(1)(4) | (116) | 561 | 628 | |||||||
Adjustment for Home Chef contingent consideration(1)(5) | — | 15 | 50 | |||||||
Adjustment for transformation costs(1)(6) | — | — | 104 | |||||||
Adjustment for merger related costs(1)(7) | 268 | 34 | — | |||||||
Adjustment for opioid settlement charges(1)(8) | 1,163 | 67 | — | |||||||
Adjustment for goodwill and fixed asset impairment charges related to Vitacost.com(1)(9) | — | 164 | — | |||||||
Adjustment for income tax audit examinations(1) | — | — | (47) | |||||||
Total Adjusted Items | 1,315 | 860 | 1,147 | |||||||
Net earnings attributable to The Kroger Co. excluding the Adjusted Items | $ | 3,479 | $ | 3,104 | $ | 2,802 | ||||
Extra Week adjustment(1)(10) | (144) | — | — | |||||||
Net earnings attributable to The Kroger Co. excluding the Adjusted Items and the Extra Week adjustment | $ | 3,335 | $ | 3,104 | $ | 2,802 | ||||
Net earnings attributable to The Kroger Co. per diluted common share | $ | 2.96 | $ | 3.06 | $ | 2.17 | ||||
(Income) expense adjustments | ||||||||||
Adjustment for pension plan withdrawal liabilities(11) |
| — |
| 0.03 |
| 0.45 | ||||
Adjustment for company-sponsored pension plan settlement charges(11) | — | — | 0.09 | |||||||
Adjustment for (gain) loss on investments(11) | (0.17) | 0.76 | 0.83 | |||||||
Adjustment for Home Chef contingent consideration(11) | — | 0.02 | 0.07 | |||||||
Adjustment for transformation costs(11) | — | — | 0.14 | |||||||
Adjustment for merger related costs(11) | 0.37 | 0.05 | — | |||||||
Adjustment for opioid settlement charges(11) | 1.60 | 0.09 | — | |||||||
Adjustment for goodwill and fixed asset impairment charges related to Vitacost.com(11) | — | 0.22 | — | |||||||
Adjustment for income tax audit examinations(11) | — | — | (0.07) | |||||||
Total Adjusted Items | 1.80 | 1.17 | 1.51 | |||||||
| ||||||||||
Net earnings attributable to The Kroger Co. per diluted common share excluding the Adjusted Items | $ | 4.76 | $ | 4.23 | $ | 3.68 | ||||
Extra Week adjustment(11) | (0.20) | — | — | |||||||
Net earnings attributable to The Kroger Co. per diluted common share excluding the Adjusted Items and the Extra Week adjustment | $ | 4.56 | $ | 4.23 | $ | 3.68 | ||||
Average numbers of common shares used in diluted calculation |
| 725 |
| 727 |
| 754 | ||||
31
Net Earnings per Diluted Share excluding the Adjusted Items (continued)
($ in millions, except per share amounts)
| (1) | The amounts presented represent the after-tax effect of each adjustment, which was calculated using discrete tax rates. |
| (2) | The pre-tax adjustment for pension plan withdrawal liabilities was $25 in 2022 and $449 in 2021. |
| (3) | The pre-tax adjustment for company-sponsored pension plan settlement charges was $87. |
| (4) | The pre-tax adjustment for (gain) loss on investments was $(151) in 2023, $728 in 2022 and $821 in 2021. |
| (5) | The pre-tax adjustment for Home Chef contingent consideration was $20 in 2022 and $66 in 2021. |
| (6) | The pre-tax adjustment for transformation costs was $136. Transformation costs primarily include costs related to store and business closure costs and third-party professional consulting fees associated with business transformation and cost saving initiatives. |
| (7) | The pre-tax adjustment for merger related costs was $316 in 2023 and $44 in 2022. Merger related costs primarily include third-party professional fees and credit facility fees associated with the proposed merger with Albertsons. |
| (8) | The pre-tax adjustment for opioid settlement charges was $1,475 in 2023 and $85 in 2022. |
| (9) | The pre-tax and after-tax adjustments for goodwill and fixed asset impairment charges related to Vitacost.com was $164. |
| (10) | The pre-tax Extra Week adjustment was $(179). |
| (11) | The amount presented represents the net earnings per diluted common share effect of each adjustment. |
Key Performance Indicators
We evaluate our results of operations and cash flows using a variety of key performance indicators, such as sales, identical sales, excluding fuel, FIFO gross margin, adjusted FIFO operating profit, adjusted net earnings, adjusted net earnings per diluted share and return on invested capital. We use these financial metrics and related computations to evaluate our operational effectiveness and our results of operations from period to period and to plan for near and long-term operating and strategic decisions. These key performance indicators should not be reviewed in isolation or considered as a substitute for our financial results as reported in accordance with GAAP. These measures, which are described in more detail in this Annual Report on Form 10-K, may not be comparable to similarly-titled performance indicators used by other companies.
32
RESULTS OF OPERATIONS
Sales
Total Sales
($ in millions)
|
| 2023 | Percentage |
|
| Percentage |
|
| |||||||||
2023 | Adjusted(1) | Change(2) | 2022 | Change(3) | 2021 | ||||||||||||
Total sales to retail customers without fuel(4) | $ | 132,284 | $ | 129,868 | 0.9 | % | $ | 128,664 | 5.2 | % | $ | 122,293 | |||||
Supermarket fuel sales | 16,621 | 16,340 | (12.3) | % |
| 18,632 | 26.9 | % |
| 14,678 | |||||||
Other sales(5) |
| 1,134 |
| 1,120 | 16.4 | % |
| 962 | 4.9 | % |
| 917 | |||||
Total sales | $ | 150,039 | $ | 147,328 | (0.6) | % | $ | 148,258 | 7.5 | % | $ | 137,888 | |||||
| (1) | The 2023 adjusted column represents the items presented in the 2023 column adjusted to remove the Extra Week. |
| (2) | This column represents the percentage change in 2023 adjusted sales compared to 2022. |
| (3) | This column represents the percentage change in 2022 compared to 2021. |
| (4) | Digital sales are included in the “Total sales to retail customers without fuel” line above. Digital sales include products ordered online and picked up at our stores and our Delivery and Ship solutions. Our Delivery solutions include orders delivered to customers from retail store locations, customer fulfillment centers powered by Ocado and orders placed through third-party platforms. Our Ship solutions primarily include online orders placed through our owned platforms that are dispatched using mail service or third-party courier. Digital sales increased approximately 12% in 2023 excluding the Extra Week, increased approximately 4% in 2022 and decreased approximately 3% in 2021. Digital sales growth for 2023 and 2022 was led by strength in our Delivery solutions, which grew by 25% in 2023 excluding the Extra Week and 25% in 2022. Delivery solutions growth was driven by our Boost membership program and expansion of our Kroger Delivery network. |
| (5) | Other sales primarily relate to external sales at food production plants, data analytic services and third-party media revenue. The increase in 2023, compared to 2022, and the increase in 2022, compared to 2021, is primarily due to an increase in data analytic services and third-party media revenue. |
Total 2023 adjusted sales represent total sales for 2023 excluding the Extra Week. Total 2023 adjusted sales decreased in 2023, compared to 2022, by 0.6%. The decrease was primarily due to the decrease in supermarket fuel sales, partially offset by the increase in total sales to retail customers without fuel. Total sales, excluding fuel, adjusted for the Extra Week, increased 1.1% in 2023, compared to 2022, which was primarily due to our identical sales increase, excluding fuel, of 0.9%. Identical sales, excluding fuel, in 2023, compared to 2022, increased primarily due to an increase in the number of loyal households shopping with us and an increase in basket value due to retail inflation, partially offset by a reduction in the number of items in basket and the termination of our agreement with Express Scripts effective December 31, 2022. Identical sales, excluding fuel, would have grown 2.3% in 2023 if not for the approximately $1.8 billion reduction in pharmacy sales from the termination of our agreement with Express Scripts effective December 31, 2022. Total adjusted fuel sales decreased 12.3% in 2023, compared to 2022, primarily due to a decrease in the average retail fuel price of 11.1% and a decrease in fuel gallons sold of 1.5%. The decrease in the average retail fuel price was caused by a decrease in the product cost of fuel.
Total sales increased in 2022, compared to 2021, by 7.5%. The increase was primarily due to increases in supermarket fuel sales and total sales to retail customers without fuel. Total sales, excluding fuel, increased 5.2% in 2022, compared to 2021, which was primarily due to our identical sales increase, excluding fuel, of 5.6%, partially offset by discontinued patient therapies at Kroger Specialty Pharmacy. Identical sales, excluding fuel, for 2022, compared to 2021, increased primarily due to an increase in the number of households shopping with us and an increase in basket value due to retail inflation, partially offset by a reduction in the number of items in basket and the termination of our agreement with Express Scripts. Identical sales without fuel would have grown 5.8% in 2022 if not for the reduction in pharmacy sales from our termination of our agreement with Express Scripts effective December 31, 2022. Total supermarket fuel sales increased 26.9% in 2022, compared to 2021, primarily due to an increase in the average retail fuel price of 28.5%, partially offset by a decrease in fuel gallons sold of 1.2%, which was less than the national average decline. The increase in the average retail fuel price was caused by an increase in the product cost of fuel.
33
We calculate identical sales, excluding fuel, as sales to retail customers, including sales from all departments at identical supermarket locations, Kroger Specialty Pharmacy businesses and Delivery and Ship solutions. We define a supermarket as identical when it has been in operation without expansion or relocation for five full quarters. We define Kroger Specialty Pharmacy businesses as identical when physical locations have been in operation continuously for five full quarters; discontinued patient therapies are excluded from the identical sales calculation starting in the quarter of transfer or termination. We define Kroger Delivery identical sales powered by Ocado based on geography. We include Kroger Delivery sales powered by Ocado as identical if the delivery occurs in an existing Kroger supermarket geography. If the Kroger Delivery sales powered by Ocado occur in a new geography, these sales are included as identical when deliveries have occurred to the new geography for five full quarters. Although identical sales is a relatively standard term, numerous methods exist for calculating identical sales growth. As a result, the method used by our management to calculate identical sales may differ from methods other companies use to calculate identical sales. It is important to understand the methods used by other companies to calculate identical sales before comparing our identical sales to those of other such companies. Our identical sales, excluding fuel, results are summarized in the following table. We used the identical sales, excluding fuel, dollar figures presented below to calculate percentage changes for 2023 and 2022.
Identical Sales
($ in millions)
| 2023 |
| 2022(1) |
| |||
Excluding fuel | $ | 131,748 | $ | 130,562 | |||
Excluding fuel |
| 0.9 | % |
| 5.6 | % | |
| (1) | Identical sales, excluding fuel, for 2022 were adjusted to a comparable 53 week basis by including week 1 of fiscal 2023 in our 2022 identical sales, excluding fuel, base. However, for the purpose of determining the percentage change in identical sales, excluding fuel, from 2021 to 2022, 2022 identical sales, excluding fuel, were not adjusted to include the sales from week 1 of 2023. |
Gross Margin, LIFO and FIFO Gross Margin
We define gross margin as sales minus merchandise costs, including advertising, warehousing, and transportation. Rent expense, depreciation and amortization expense, and interest expense are not included in gross margin.
Our gross margin rates, as a percentage of sales, were 22.24% in 2023 and 21.43% in 2022. This increase in rate was achieved while also investing in price to maintain a competitive price position and deliver greater value for our customers. The increase in rate in 2023, compared to 2022, resulted primarily from a decreased LIFO charge, an increase in our fuel gross margin, strong Our Brands performance, our ability to effectively manage product cost through strong sourcing practices, lower transportation costs, as a percentage of sales, and the effect of our terminated agreement with Express Scripts, partially offset by higher shrink, as a percentage of sales, and increased promotional price investment.
Our LIFO charge was $113 million in 2023 and $626 million in 2022. The decrease in our LIFO charge was attributable to lower product cost inflation for 2023 compared to 2022.
Our FIFO gross margin rate, which excludes the LIFO charge, was 22.31% in 2023, compared to 21.86% in 2022. Our fuel sales lower our FIFO gross margin rate due to the very low FIFO gross margin rate, as a percentage of sales, of fuel sales compared to non-fuel sales. Excluding the effect of fuel and the Extra Week, our FIFO gross margin rate increased 18 basis points in 2023, compared to 2022. This increase in rate was achieved while also investing in price to maintain a competitive price position and deliver greater value for our customers. This increase resulted primarily from strong Our Brands performance, our ability to effectively manage product cost through strong sourcing practices, lower transportation costs, as a percentage of sales, and the effect of our terminated agreement with Express Scripts, partially offset by increased promotional price investment and higher shrink, as a percentage of sales.
34
Operating, General and Administrative Expenses
OG&A expenses consist primarily of employee-related costs such as wages, healthcare benefit costs, retirement plan costs, utilities, and credit card fees. Rent expense, depreciation and amortization expense, and interest expense are not included in OG&A.
OG&A expenses, as a percentage of sales, were 17.50% in 2023 and 16.09% in 2022. The increase in 2023, compared to 2022, resulted primarily from planned investments in associates, costs related to strategic investments that are expected to drive future growth and the effect of our terminated agreement with Express Scripts and the 2023 OG&A Adjusted Items, partially offset by the 2022 OG&A Adjusted Items, broad-based cost savings initiatives that drive administrative efficiencies, store productivity and sourcing cost reductions and lower incentive plan costs.
Our fuel sales lower our OG&A rate, as a percentage of sales, due to the very low OG&A rate, as a percentage of sales, of fuel sales compared to non-fuel sales. Excluding the effect of fuel, the Extra Week, the 2023 OG&A Adjusted Items, the 2022 OG&A Adjusted Items, our OG&A rate increased 21 basis points in 2023, compared to 2022. This increase resulted primarily from planned investments in associates, costs related to strategic investments that are expected to drive future growth and the effect of our terminated agreement with Express Scripts, partially offset by broad-based cost savings initiatives that drive administrative efficiencies, store productivity and sourcing cost reductions and lower incentive plan costs.
Rent Expense
Rent expense remained relatively consistent, as a percentage of sales, for 2023 compared to 2022.
Depreciation and Amortization Expense
Depreciation and amortization expense increased, as a percentage of sales, in 2023, compared to 2022, primarily due to depreciation of equipment recorded under finance leases related to our Kroger Delivery customer fulfillment center location openings and additional depreciation associated with higher capital investments, partially offset by the Extra Week.
Operating Profit and FIFO Operating Profit
Operating profit was $3.1 billion, or 2.06% of sales, for 2023, compared to $4.1 billion, or 2.78% of sales, for 2022. Operating profit, as a percentage of sales, decreased 72 basis points in 2023, compared to 2022, due to increased OG&A and depreciation and amortization expenses, as a percentage of sales, and a decrease in fuel operating profit, partially offset by a higher FIFO gross margin rate, a decreased LIFO charge and the Extra Week.
FIFO operating profit was $3.2 billion, or 2.14% of sales, for 2023, compared to $4.8 billion, or 3.21% of sales, for 2022. FIFO operating profit, as a percentage of sales, excluding the 2023 and 2022 Adjusted Items and the Extra Week, decreased 15 basis points in 2023, compared to 2022, due to increased OG&A and depreciation and amortization expenses, as a percentage of sales and a decrease in fuel operating profit, partially offset by a higher FIFO gross margin rate.
Specific factors contributing to the trends driving operating profit and FIFO operating profit identified above are discussed earlier in this section.
35
The following table provides a reconciliation of operating profit to FIFO operating profit, and to Adjusted FIFO operating profit, excluding the 2023 and 2022 Adjusted Items:
Operating Profit excluding the Adjusted Items
($ in millions)
| 2023 |
| 2022 | ||||
Operating profit | $ | 3,096 | $ | 4,126 | |||
LIFO charge | 113 | 626 | |||||
| |||||||
FIFO Operating profit |
| 3,209 |
| 4,752 | |||
Adjustment for pension plan withdrawal liabilities | — | 25 | |||||
Adjustment for Home Chef contingent consideration | — | 20 | |||||
Adjustment for merger related costs(1) | 316 | 44 | |||||
Adjustment for opioid settlement charges(2) | 1,475 | 85 | |||||
Adjustment for goodwill and fixed asset impairment charges related to Vitacost.com | — | 164 | |||||
Other | (14) | (11) | |||||
2023 and 2022 Adjusted items | 1,777 | 327 | |||||
Adjusted FIFO operating profit excluding the adjusted items above | $ | 4,986 | $ | 5,079 | |||
Extra Week adjustment | (187) | — | |||||
Adjusted FIFO operating profit excluding the adjusted items above and the Extra Week | $ | 4,799 | $ | 5,079 | |||
| (1) | Merger related costs primarily include third-party professional fees and credit facility fees associated with the proposed merger with Albertsons. |
| (2) | Opioid settlement charges include settlements with the nationwide opioid settlement framework and the States of West Virginia and New Mexico. |
Interest Expense
Interest expense totaled $441 million in 2023 and $535 million in 2022. The decrease in interest expense in 2023, compared to 2022, was primarily due to decreased average total outstanding debt throughout 2023, compared to 2022, including both the current and long-term portions of obligations under finance leases and increased interest income earned on our cash and temporary cash investments due to rising interest rates and higher cash and temporary cash investment balances throughout 2023, compared to 2022, partially offset by the Extra Week.
Income Taxes
Our effective income tax rate was 23.5% in 2023 and 22.5% in 2022. The 2023 tax rate differed from the federal statutory rate due to the effect of state income taxes and non-deductible portion of opioid settlement charges, partially offset by the benefit from share-based payments and the utilization of tax credits. The 2022 tax rate differed from the federal statutory rate due to the effect of state income taxes and non-deductible goodwill impairment charges related to Vitacost.com, partially offset by the benefits from share-based payments and the utilization of tax credits.
36
Net Earnings and Net Earnings Per Diluted Share
Our net earnings are based on the factors discussed in the Results of Operations section.
Net earnings of $2.96 per diluted share for 2023 represented a decrease of 3.3% compared to net earnings of $3.06 per diluted share for 2022. Excluding the 2023 and 2022 Adjusted Items and the Extra Week, adjusted net earnings of $4.56 per diluted share for 2023 represented an increase of 7.8% compared to adjusted net earnings of $4.23 per diluted share for 2022. The increase in adjusted net earnings per diluted share resulted primarily from a decreased LIFO charge and lower interest expense, partially offset by decreased fuel earnings, higher income tax expense and decreased FIFO operating profit, excluding fuel.
RETURN ON INVESTED CAPITAL
We calculate return on invested capital (“ROIC”) by dividing adjusted ROIC operating profit for the prior four quarters by the average invested capital. Adjusted operating profit for ROIC purposes is calculated by excluding certain items included in operating profit, and adding back our LIFO charge, depreciation and amortization and rent to our U.S. GAAP operating profit of the prior four quarters. Average invested capital is calculated as the sum of (i) the average of our total assets, (ii) the average LIFO reserve and (iii) the average accumulated depreciation and amortization; minus (i) the average taxes receivable, (ii) the average trade accounts payable, (iii) the average accrued salaries and wages and (iv) the average other current liabilities, excluding accrued income taxes. Averages are calculated for ROIC by adding the beginning balance of the first quarter and the ending balance of the fourth quarter, of the last four quarters, and dividing by two. ROIC is a non-GAAP financial measure of performance. ROIC should not be reviewed in isolation or considered as a substitute for our financial results as reported in accordance with GAAP. ROIC is an important measure used by management to evaluate our investment returns on capital. Management believes ROIC is a useful metric to investors and analysts because it measures how effectively we are deploying our assets.
Although ROIC is a relatively standard financial term, numerous methods exist for calculating a company’s ROIC. As a result, the method used by our management to calculate ROIC may differ from methods other companies use to calculate their ROIC. We urge you to understand the methods used by other companies to calculate their ROIC before comparing our ROIC to that of such other companies.
37
The following table provides a calculation of ROIC for 2023 and 2022 on a 52 week basis ($ in millions):
Fiscal Year Ended | |||||||
February 3, | January 28, | ||||||
| 2024 | 2023 |
| ||||
Return on Invested Capital | |||||||
Numerator | |||||||
Operating profit on a 53 week basis in fiscal year 2023 | $ | 3,096 | $ | 4,126 | |||
Extra Week operating profit adjustment | (187) | — | |||||
LIFO charge |
| 113 |
| 626 | |||
Depreciation and amortization |
| 3,125 |
| 2,965 | |||
Rent on a 53 week basis in fiscal year 2023 |
| 891 |
| 839 | |||
Extra Week rent adjustment | (17) | — | |||||
Adjustment for Home Chef contingent consideration | — | 20 | |||||
Adjustment for pension plan withdrawal liabilities | — | 25 | |||||
Adjustment for goodwill and fixed asset impairment charges related to Vitacost.com | — | 164 | |||||
Adjustment for merger related costs | 316 | 44 | |||||
Adjustment for opioid settlement charges | 1,475 | 85 | |||||
Adjusted ROIC operating profit | $ | 8,812 | $ | 8,894 | |||
Denominator | |||||||
Average total assets | $ | 50,064 | $ | 49,355 | |||
Average taxes receivable(1) |
| (197) |
| (137) | |||
Average LIFO reserve |
| 2,253 |
| 1,883 | |||
Average accumulated depreciation and amortization(2) |
| 30,573 |
| 27,843 | |||
Average accounts payable |
| (10,280) |
| (10,016) | |||
Average accrued salaries and wages |
| (1,535) |
| (1,741) | |||
Average other current liabilities |
| (3,414) |
| (3,435) | |||
Average invested capital | $ | 67,464 | $ | 63,752 | |||
Return on Invested Capital |
| 13.06 | % |
| 13.95 | % | |
38
CRITICAL ACCOUNTING ESTIMATES
We have chosen accounting policies that we believe are appropriate to report accurately and fairly our operating results and financial position, and we apply those accounting policies in a consistent manner. Our significant accounting policies are summarized in Note 1 to the Consolidated Financial Statements.
The preparation of financial statements in conformity with GAAP requires us to make estimates and assumptions that affect the reported amounts of assets, liabilities, revenues, and expenses, and related disclosures of contingent assets and liabilities. We base our estimates on historical experience and other factors we believe to be reasonable under the circumstances, the results of which form the basis for making judgments about the carrying values of assets and liabilities that are not readily apparent from other sources. Actual results could differ from those estimates.
We believe the following accounting estimates are the most critical in the preparation of our financial statements because they involve the most difficult, subjective or complex judgments about the effect of matters that are inherently uncertain.
Impairments of Long-Lived Assets
We monitor the carrying value of long-lived assets for potential impairment each quarter based on whether certain triggering events have occurred. These events include current period losses combined with a history of losses or a projection of continuing losses or a significant decrease in the market value of an asset. When a triggering event occurs, we perform an impairment calculation, comparing projected undiscounted cash flows, utilizing current cash flow information and expected growth rates related to specific stores, to the carrying value for those stores. If we identify impairment for long-lived assets to be held and used, we compare the assets’ current carrying value to the assets’ fair value. Fair value is determined based on market values or discounted future cash flows. We record impairment when the carrying value exceeds fair market value. With respect to owned property and equipment held for disposal, we adjust the value of the property and equipment to reflect recoverable values based on our previous efforts to dispose of similar assets and current economic conditions. We recognize impairment for the excess of the carrying value over the estimated fair market value, reduced by estimated direct costs of disposal. We recorded asset impairments in the normal course of business totaling $69 million in 2023 and $68 million in 2022. We record costs to reduce the carrying value of long-lived assets in the Consolidated Statements of Operations as OG&A expense.
The factors that most significantly affect the impairment calculation are our estimates of future cash flows. Our cash flow projections look several years into the future and include assumptions on variables such as inflation, the economy and market competition. Application of alternative assumptions and definitions, such as reviewing long-lived assets for impairment at a different level, could produce significantly different results.
Business Combinations
We account for business combinations using the acquisition method of accounting. All the assets acquired, liabilities assumed and amounts attributable to noncontrolling interests are recorded at their respective fair values at the date of acquisition once we obtain control of an entity. The determination of fair values of identifiable assets and liabilities involves estimates and the use of valuation techniques when market value is not readily available. We use various techniques to determine fair value in such instances, including the income approach. Significant estimates used in determining fair value include, but are not limited to, the amount and timing of future cash flows, growth rates, discount rates and useful lives. The excess of the purchase price over fair values of identifiable assets and liabilities is recorded as goodwill. See Note 2 for further information about goodwill.
39
Goodwill
Our goodwill totaled $2.9 billion as of February 3, 2024. We review goodwill for impairment in the fourth quarter of each year and also upon the occurrence of triggering events. We perform reviews of each of our operating divisions and other consolidated entities (collectively, “reporting units”) that have goodwill balances. Generally, fair value is determined using a multiple of earnings, or discounted projected future cash flows, and we compare fair value to the carrying value of a reporting unit for purposes of identifying potential impairment. We base projected future cash flows on management’s knowledge of the current operating environment and expectations for the future. We recognize goodwill impairment for any excess of a reporting unit's carrying value over its fair value, not to exceed the total amount of goodwill allocated to the reporting unit.
In 2022, we recorded a goodwill impairment charge for Vitacost.com totaling $160 million. The talent and capabilities gained through the merger with Vitacost in 2014 have been key to advancing Kroger’s digital platform and growing our digital business to more than $10 billion in annual sales. As our digital strategy has evolved, our primary focus looking forward will be to effectively utilize our Pickup and Delivery capabilities. This reprioritization resulted in reduced long-term profitability expectations and a decline in the market value for one underlying channel of business and led to the impairment charge. Vitacost.com will continue to operate as an online platform providing great value natural, organic, and eco-friendly products for customers.
The annual evaluation of goodwill performed in 2023, 2022 and 2021 did not result in impairment for any of our reporting units other than Vitacost.com described above. Based on current and future expected cash flows, we believe additional goodwill impairments are not reasonably likely. A 10% reduction in fair value of our reporting units would not indicate a potential for impairment of our goodwill balance.
The 2023 fair value of our Kroger Specialty Pharmacy (“KSP”) reporting unit was estimated using multiple valuation techniques: a discounted cash flow model (income approach), a market multiple model and a comparable mergers and acquisition model (market approaches), with each method weighted in the calculation. The income approach relies on management’s projected future cash flows, estimates of revenue growth rates, margin assumptions and an appropriate discount rate. The market approaches require the determination of an appropriate peer group, which is utilized to derive estimated fair values based on selected market multiples. Our KSP reporting unit has a goodwill balance of $243 million.
For additional information relating to our results of the goodwill impairment reviews performed during 2023, 2022 and 2021, see Note 2 to the Consolidated Financial Statements.
The impairment review requires the extensive use of management judgment and financial estimates. Application of alternative estimates and assumptions could produce significantly different results. The cash flow projections embedded in our goodwill impairment reviews can be affected by several factors such as inflation, business valuations in the market, the economy, market competition and our ability to successfully integrate recently acquired businesses.
Multi-Employer Pension Plans
We contribute to various multi-employer pension plans based on obligations arising from collective bargaining agreements. These multi-employer pension plans provide retirement benefits to participants based on their service to contributing employers. The benefits are paid from assets held in trust for that purpose. Trustees are appointed in equal number by employers and unions. The trustees typically are responsible for determining the level of benefits to be provided to participants as well as for such matters as the investment of the assets and the administration of the plans.
We recognize expense in connection with these plans as contributions are funded or when commitments are probable and reasonably estimable, in accordance with GAAP. We made cash contributions to these plans of $635 million in 2023, $620 million in 2022 and $1.1 billion in 2021. The decrease in 2023 and 2022, compared to 2021 is due to the contractual payments we made in 2021 related to our commitments established for the restructuring of certain multi-employer pension plan agreements.
40
We continue to evaluate and address our potential exposure to under-funded multi-employer pension plans as it relates to our associates who are beneficiaries of these plans. These under-fundings are not our liability. When an opportunity arises that is economically feasible and beneficial to us and our associates, we may negotiate the restructuring of under-funded multi-employer pension plan obligations to help stabilize associates’ future benefits and become the fiduciary of the restructured multi-employer pension plan. The commitments from these restructurings do not change our debt profile as it relates to our credit rating since these off-balance sheet commitments are typically considered in our investment grade debt rating. We are currently designated as the named fiduciary of the UFCW Consolidated Pension Plan and the International Brotherhood of Teamsters (“IBT”) Consolidated Pension Fund and have sole investment authority over these assets. Significant effects of these restructuring agreements recorded in our Consolidated Financial Statements are:
| ● | In 2022, we incurred a $25 million charge, $19 million net of tax, for obligations related to withdrawal liabilities for certain multi-employer pension funds. |
| ● | In 2021, we incurred a $449 million charge, $344 million net of tax, for obligations related to withdrawal liabilities for a certain multi-employer pension fund. |
As we continue to work to find solutions to under-funded multi-employer pension plans, it is possible we could incur withdrawal liabilities for certain funds.
Based on the most recent information available to us, we believe the present value of actuarially accrued liabilities in most of these multi-employer plans exceeds the value of the assets held in trust to pay benefits, and we expect that our contributions to most of these funds will increase over the next few years. We have attempted to estimate the amount by which these liabilities exceed the assets, (i.e., the amount of underfunding), as of December 31, 2023. Because we are only one of a number of employers contributing to these plans, we also have attempted to estimate the ratio of our contributions to the total of all contributions to these plans in a year as a way of assessing our “share” of the underfunding. Nonetheless, the underfunding is not a direct obligation or liability of ours or of any employer.
As of December 31, 2023, we estimate our share of the underfunding of multi-employer pension plans to which we contribute was approximately $2.5 billion, $1.9 billion net of tax, which remained consistent with the estimated amount of underfunding as of December 31, 2022. Our estimate is based on the most current information available to us including actuarial evaluations and other data (that include the estimates of others), and such information may be outdated or otherwise unreliable.
We have made and disclosed this estimate not because, except as noted above, this underfunding is a direct liability of ours. Rather, we believe the underfunding is likely to have important consequences. In the event we were to exit certain markets or otherwise cease making contributions to these plans, we could trigger a substantial withdrawal liability. Any adjustment for withdrawal liability will be recorded when it is probable that a liability exists and can be reasonably estimated, in accordance with GAAP.
The amount of underfunding described above is an estimate and could change based on contract negotiations, returns on the assets held in the multi-employer pension plans, benefit payments or future restructuring agreements. The amount could decline, and our future expense would be favorably affected, if the values of the assets held in the trust significantly increase or if further changes occur through collective bargaining, trustee action or favorable legislation. On the other hand, our share of the underfunding could increase, and our future expense could be adversely affected if the asset values decline, if employers currently contributing to these funds cease participation or if changes occur through collective bargaining, trustee action or adverse legislation. We continue to evaluate our potential exposure to under-funded multi-employer pension plans. Although these liabilities are not a direct obligation or liability of ours, any commitments to fund certain multi-employer pension plans will be expensed when our commitment is probable and an estimate can be made.
41
The American Rescue Plan Act ("ARP Act"), which was signed into law on March 11, 2021, established a special financial assistance program for financially troubled multi-employer pension plans. Under the ARP Act, eligible multi-employer plans can apply to receive a cash payment in an amount projected by the Pension Benefit Guaranty Corporation to pay pension benefits through the plan year ending 2051. At the end of 2023, we expect certain multi-employer pension plans in which we participate, for which our estimated share of underfunding is approximately $1.1 billion, $850 million net of tax, to apply for funding in 2024, which may reduce a portion of our share of unfunded multi-employer pension plan liabilities.
See Note 15 to the Consolidated Financial Statements for more information relating to our participation in these multi-employer pension plans.
NEW ACCOUNTING STANDARDS
Refer to Note 17 to the Consolidated Financial Statements for recently issued accounting standards not yet adopted as of February 3, 2024.
LIQUIDITY AND CAPITAL RESOURCES
Cash Flow Information
The following table summarizes our net increase (decrease) in cash and temporary cash investments for 2023 and 2022:
| Fiscal Year | |||||
2023 |
| 2022 | ||||
Net cash provided by (used in) | ||||||
Operating activities | $ | 6,788 | $ | 4,498 | ||
Investing activities | (3,750) | (3,015) | ||||
Financing activities | (2,170) | (2,289) | ||||
Net increase (decrease) in cash and temporary cash investments | $ | 868 | $ | (806) | ||
Net cash provided by operating activities
We generated $6.8 billion of cash from operations in 2023, compared to $4.5 billion in 2022. Net earnings including noncontrolling interests, adjusted for non-cash items, generated approximately $6.0 billion of operating cash flow in 2023 compared to $7.7 billion in 2022. The change in operating assets and liabilities, including working capital, was $808 million in 2023 compared to $(3.2) billion in 2022. The change in operating assets and liabilities, including working capital, was primarily due to the following:
| ● | Cash flows for FIFO inventory were more favorable for 2023, compared to 2022, primarily due to a smaller effect of inflation in the current year on inventory balances and maintaining inventory at optimal levels through improved inventory management planning; |
| ● | An increase in long-term liabilities at the end of 2023, compared to the end of 2022, primarily due to an increase in the noncurrent portion of our accrued opioid settlement charges; |
| ● | Cash flows for accounts payable were more favorable in 2023, compared to 2022, due to increased accounts payable at the end of 2023, compared to the end of 2022, primarily due to timing of payments and management’s focus on working capital improvements; |
42
| ● | A decrease in income taxes receivable at the end of 2023, compared to the end of 2022, primarily due to applying our overpayment in 2022 to our estimated tax payments for 2023; and |
| ● | Cash flows for accounts receivable were more favorable in 2023, compared to 2022, due to decreased pharmacy receivables at the end of 2023, compared to the end of 2022, primarily due to timing of cash receipts and the termination of our agreement with Express Scripts. |
Net cash used by investing activities
Investing activities used cash of $3.8 billion in 2023, compared to $3.0 billion in 2022. The amount of cash used by investing activities increased in 2023, compared to 2022, primarily due to increased payments for property and equipment in 2023.
Net cash used by financing activities
We used $2.2 billion of cash for financing activities in 2023, compared to $2.3 billion in 2022. The amount of cash used for financing activities decreased in 2023, compared to 2022, primarily due to decreased treasury stock purchases, partially offset by increased payments on long-term debt including obligations under finance leases.
Capital Investments
Capital investments, including changes in construction-in-progress payables and excluding the purchase of leased facilities, totaled $3.6 billion in 2023 and $3.3 billion in 2022. Capital investments for the purchase of leased facilities totaled $21 million in 2022. We did not purchase any leased facilities in 2023. Our capital priorities align directly with our value creation model and our target to consistently grow net earnings. Our capital program includes initiatives to enhance the customer experience in stores, improve our process efficiency and enhance our digital capabilities through technology developments. Capital investments increased in 2023, compared to 2022, due to increasing our store capital investments compared to prior years. These investments are expected to drive sales growth and improve operating efficiency by removing cost and waste from our business.
The table below shows our supermarket storing activity and our total supermarket square footage for 2023, 2022 and 2021:
Supermarket Storing Activity
| 2023 |
| 2022 |
| 2021 |
| |
Beginning of year |
| 2,719 |
| 2,726 |
| 2,742 | |
Opened |
| 5 |
| 3 |
| 4 | |
Opened (relocation) |
| 2 |
| 1 |
| 4 | |
Closed (operational) |
| (1) |
| (10) |
| (20) | |
Closed (relocation) |
| (3) |
| (1) |
| (4) | |
End of year |
| 2,722 |
| 2,719 |
| 2,726 | |
Total supermarket square footage (in millions) |
| 180 |
| 179 |
| 179 |
Debt Management
Total debt, including both the current and long-term portions of obligations under finance leases, decreased $1.2 billion to $12.2 billion as of year-end 2023 compared to 2022. This decrease resulted primarily from the payment of $600 million of senior notes bearing an interest rate of 3.85% and the payment of $500 million of senior notes bearing an interest rate of 4.00%.
43
Common Share Repurchase Programs
We maintain share repurchase programs that comply with Rule 10b5-1 of the Securities Exchange Act of 1934, as amended (the “Exchange Act”) and allow for the orderly repurchase of our common shares, from time to time. The share repurchase programs do not have an expiration date but may be suspended or terminated by our Board of Directors at any time. We made open market purchases of our common shares totaling $821 million in 2022. During the third quarter of 2022, we paused our share repurchase program to prioritize de-leveraging following the proposed merger with Albertsons.
In addition, we also repurchase common shares under a program announced on December 6, 1999 to repurchase common shares to reduce dilution resulting from our employee stock option and long-term incentive plans, under which repurchases are limited to proceeds received from exercises of stock options and the tax benefits associated therewith (“1999 Repurchase Program”). This program is solely funded by proceeds from stock option exercises, and the tax benefit from these exercises. We repurchased approximately $62 million in 2023 and $172 million in 2022 of our common shares under the 1999 Repurchase Program.
On September 9, 2022, our Board of Directors approved a $1.0 billion share repurchase program to reacquire shares via open market purchase or privately negotiated transactions, block trades, or pursuant to trades intending to comply with Rule 10b5-1 under the Exchange Act (the “September 2022 Repurchase Program”). No shares have been repurchased under the September 2022 authorization. During the third quarter of 2022, we paused our share repurchase program to prioritize de-leveraging following the proposed merger with Albertsons. As of February 3, 2024, there was $1.0 billion remaining under the September 2022 Repurchase Program.
Dividends
The following table provides dividend information for 2023 and 2022 ($ in millions, except per share amounts):
2023 | 2022 | ||||
Cash dividends paid | $ | 796 | $ | 682 | |
Cash dividends paid per common share | $ | 1.10 | $ | 0.94 | |
Liquidity Needs
We held cash and temporary cash investments of $1.9 billion, as of the end of 2023, which reflects our elevated operating performance over the last few years and paused share repurchase program. We actively manage our cash and temporary cash investments in order to internally fund operating activities, support and invest in our core businesses, make scheduled interest and principal payments on our borrowings and return cash to shareholders through cash dividend payments and share repurchases. Our current levels of cash, borrowing capacity and balance sheet leverage provide us with the operational flexibility to adjust to changes in economic and market conditions. We remain committed to our dividend, and growing our dividend over time, subject to board approval, as well as share repurchase programs and we will evaluate the optimal use of any excess free cash flow, consistent with our capital allocation strategy.
44
The table below summarizes our short-term and long-term material cash requirements, based on year of maturity or settlement, as of February 3, 2024 (in millions of dollars):
| 2024 |
| 2025 |
| 2026 |
| 2027 |
| 2028 |
| Thereafter |
| Total |
| ||||||||
Contractual Obligations(1)(2) | ||||||||||||||||||||||
Long-term debt(3) | $ | 25 | $ | 92 | $ | 1,305 | $ | 611 | $ | 642 | $ | 7,512 | $ | 10,187 | ||||||||
Interest on long-term debt(4) | 450 | 446 | 418 | 387 | 375 | 4,163 | 6,239 | |||||||||||||||
Finance lease obligations | 243 | 240 | 240 | 242 | 238 | 1,359 | 2,562 | |||||||||||||||
Operating lease obligations | 961 | 898 | 838 | 784 | 722 | 5,738 | 9,941 | |||||||||||||||
Self-insurance liability(5) | 281 | 159 | 108 | 68 | 40 | 105 | 761 | |||||||||||||||
Construction commitments(6) | 1,374 | — | — | — | — | — | 1,374 | |||||||||||||||
Opioid settlement commitments(7) | 296 | 154 | 143 | 143 | 143 | 568 | 1,447 | |||||||||||||||
Purchase obligations(8) | 827 | 391 | 360 | 307 | 267 | 1,752 | 3,904 | |||||||||||||||
Total | $ | 4,457 | $ | 2,380 | $ | 3,412 | $ | 2,542 | $ | 2,427 | $ | 21,197 | $ | 36,415 | ||||||||
| (1) | The contractual obligations table excludes funding of pension and other postretirement benefit obligations, which totaled approximately $65 million in 2023. For additional information about these obligations, see Note 14 to the Consolidated Financial Statements. This table also excludes contributions under various multi-employer pension plans, which totaled $635 million in 2023. For additional information about these multi-employer pension plans, see Note 15 to the Consolidated Financial Statements. |
| (2) | The liability related to unrecognized tax benefits has been excluded from the contractual obligations table because a reasonable estimate of the timing of future tax settlements cannot be determined. |
| (3) | As of February 3, 2024, we had no outstanding commercial paper and no borrowings under our credit facility. |
| (4) | Amounts include contractual interest payments using the interest rate as of February 3, 2024 and stated fixed and swapped interest rates, if applicable, for all other debt instruments. |
| (5) | The amounts included for self-insurance liability related to workers’ compensation claims have been stated on a present value basis. |
| (6) | Amounts include funds owed to third parties for projects currently under construction. These amounts are reflected in “Accounts payable” in our Consolidated Balance Sheets. |
| (7) | Amounts include scheduled opioid settlement commitments related to the nationwide opioid settlement framework and the State of West Virginia. For additional information about our opioid settlement charges, see Note 12 to the Consolidated Financial Statements. |
| (8) | Amounts include commitments, many of which are short-term in nature, to be utilized in the normal course of business, such as several contracts to purchase raw materials utilized in our food production plants and several contracts to purchase energy to be used in our stores and food production plants. Our obligations also include management fees for facilities operated by third parties and outside service contracts. Any upfront vendor allowances or incentives associated with outstanding purchase commitments are recorded as either current or long-term liabilities in our Consolidated Balance Sheets. We included our future commitments for customer fulfillment centers for which we have placed an order as of February 3, 2024. We did not include our commitments associated with additional customer fulfillment centers that have not yet been ordered. We expect our future commitments for customer fulfillment centers will continue to grow as we place orders for additional customer fulfillment centers. |
We expect to meet our short-term and long-term liquidity needs with cash and temporary cash investments on hand as of February 3, 2024, cash flows from our operating activities and other sources of liquidity, including borrowings under our commercial paper program and bank credit facility. Our short-term and long-term liquidity needs include anticipated requirements for working capital to maintain our operations, pension plan commitments, interest payments and scheduled principal payments of debt and commercial paper, servicing our lease obligations, self-insurance liabilities, capital investments, scheduled opioid settlement payments and other purchase obligations. We may also require additional capital in the future to fund organic growth opportunities, additional customer fulfillment centers, joint ventures or other business partnerships, property development, acquisitions, dividends and share repurchases. In addition, we generally operate with a working capital deficit due to our efficient use of cash in funding operations and because we have consistent access to the capital markets. We believe we have adequate coverage of our debt covenants to continue to maintain our current investment grade debt ratings and to respond effectively to competitive conditions.
45
As previously disclosed, on October 13, 2022, we entered into a merger agreement with Albertsons. We expect to meet our liquidity needs for the proposed merger with cash and temporary cash investments on hand as of the merger closing date, cash flows from our operating activities and other sources of liquidity, including borrowings under our commercial paper program, senior notes issuances, bank credit facility and other sources of financing. In connection with the proposed merger, we entered into a commitment letter for a bridge term loan facility and executed a term loan credit agreement. For additional information about the proposed merger with Albertsons, see Note 16 to the Consolidated Financial Statements.
For additional information about our debt activity in 2023, see Note 5 to the Consolidated Financial Statements.
Factors Affecting Liquidity
We can currently borrow on a daily basis approximately $2.75 billion under our commercial paper program. At February 3, 2024, we had no outstanding commercial paper. Commercial paper borrowings are backed by our credit facility and reduce the amount we can borrow under the credit facility. If our short-term credit ratings fall, the ability to borrow under our current commercial paper program could be adversely affected for a period of time and increase our interest cost on daily borrowings under our commercial paper program. This could require us to borrow additional funds under the credit facility, under which we believe we have sufficient capacity. However, in the event of a ratings decline, we do not anticipate that our borrowing capacity under our commercial paper program would be any lower than $500 million on a daily basis. Factors that could affect our credit rating include changes in our operating performance and financial position, the state of the economy, conditions in the food retail industry and changes in our business model. Further information on the risks and uncertainties that can affect our business can be found in the “Risk Factors” section set forth in Item 1A of Part I of this Annual Report on Form 10-K. Although our ability to borrow under the credit facility is not affected by our credit rating, the interest cost and applicable margin on borrowings under the credit facility could be affected by a downgrade in our Public Debt Rating. “Public Debt Rating” means, as of any date, the rating that has been most recently announced by either S&P or Moody’s, as the case may be, for any class of non-credit enhanced long-term senior unsecured debt issued by Kroger. As of March 27, 2024, we had no commercial paper borrowings outstanding.
Our credit facility requires the maintenance of a Leverage Ratio (our “financial covenant”). A failure to maintain our financial covenant would impair our ability to borrow under the credit facility. This financial covenant is described below:
| ● | Our Leverage Ratio (the ratio of Net Debt to Adjusted EBITDA, as defined in the credit facility) was 1.10 to 1 as of February 3, 2024. If this ratio were to exceed 3.50 to 1, we would be in default of our revolving credit facility and our ability to borrow under the facility would be impaired. |
Our credit facility is more fully described in Note 5 to the Consolidated Financial Statements. We were in compliance with our financial covenant at February 3, 2024.
As of February 3, 2024, we maintained a $2.75 billion (with the ability to increase by $1.25 billion), unsecured revolving credit facility that, unless extended, terminates on July 6, 2026. Outstanding borrowings under the credit facility, commercial paper borrowings, and some outstanding letters of credit reduce funds available under the credit facility. As of February 3, 2024, we had no outstanding commercial paper and no borrowings under our revolving credit facility. The outstanding letters of credit that reduce funds available under our credit facility totaled $2 million as of February 3, 2024.
In connection with the proposed merger with Albertsons, on October 13, 2022, we entered into a commitment letter with certain lenders pursuant to which the lenders have committed to provide a 364-day $17.4 billion senior unsecured bridge term loan facility. The commitments are intended to be drawn to finance the proposed merger with Albertsons only to the extent we do not arrange for alternative financing prior to closing. As alternative financing for the proposed merger is secured, the commitments with respect to the bridge term loan facility under the commitment letter will be reduced.
46
On November 9, 2022, we executed a term loan credit agreement with certain lenders pursuant to which the lenders committed to provide, contingent upon the completion of the proposed merger with Albertsons and certain other customary conditions to funding, (1) senior unsecured term loans in an aggregate principal amount of $3.0 billion maturing on the third anniversary of the proposed merger closing date and (2) senior unsecured term loans in an aggregate principal amount of $1.75 billion maturing on the date that is 18 months after the proposed merger closing date (collectively, the “Term Loan Facilities”). Borrowings under the Term Loan Facilities will be used to pay a portion of the consideration and other amounts payable in connection with the proposed merger with Albertsons. The duration of the Term Loan Facilities will allow us to achieve our net total debt to adjusted EBITDA ratio target range of 2.30 to 2.50 within the first 18 to 24 months after the proposed merger closing date. The entry into the term loan credit agreement reduced the commitments under our bridge facility commitment letter from $17.4 billion to $12.65 billion. Borrowings under the Term Loan Facilities will bear interest at rates that vary based on the type of loan and our debt rating.
In addition to the available credit mentioned above, as of February 3, 2024, we had authorized for issuance $5 billion of securities remaining under a shelf registration statement filed with the SEC and effective on May 20, 2022.
We maintain surety bonds related primarily to our self-insured workers’ compensation claims. These bonds are required by most states in which we are self-insured for workers’ compensation and are placed with predominately third-party insurance providers to insure payment of our obligations in the event we are unable to meet our claim payment obligations up to our self-insured retention levels. These bonds do not represent liabilities of ours, as we already have reserves on our books for the claims costs. Market changes may make the surety bonds more costly and, in some instances, availability of these bonds may become more limited, which could affect our costs of, or access to, such bonds. Although we do not believe increased costs or decreased availability would significantly affect our ability to access these surety bonds, if this does become an issue, we would issue letters of credit, in states where allowed, to meet the state bonding requirements. This could increase our cost or decrease the funds available under our credit facility if the letters of credit were issued against our credit facility. We had $473 million of outstanding surety bonds as of February 3, 2024. These surety bonds expire during fiscal year 2024 and are expected to be renewed.
We have standby letters of credit outstanding as part of our insurance program and for other business purposes. The letters of credit for our insurance program collateralize obligations to our insurance carriers in connection with the settlement of potential claims. We have also provided a letter of credit which supports our commitment to build a certain number of fulfillment centers. The balance of this letter of credit reduces primarily upon the construction of each fulfillment center. If we do not reach our total purchase commitment, we will be responsible for the balance remaining on the letter of credit. We had $314 million of outstanding standby letters of credit as of February 3, 2024. These standby letters of credit expire during fiscal year 2024 or early fiscal year 2025 and most are expected to be renewed. Letters of credit do not represent liabilities of ours and are not reflected in our Consolidated Balance Sheets.
We also are contingently liable for leases that have been assigned to various third parties in connection with facility closings and dispositions. We could be required to satisfy obligations under the leases if any of the assignees are unable to fulfill their lease obligations. Due to the wide distribution of our assignments among third parties, and various other remedies available to us, we believe the likelihood that we will be required to assume a material amount of these obligations is remote. We have agreed to indemnify certain third-party logistics operators for certain expenses, including multi-employer pension plan obligations and withdrawal liabilities.
In addition to the above, we enter into various indemnification agreements and take on indemnification obligations in the ordinary course of business. Such arrangements include indemnities against third-party claims arising out of agreements to provide services to us; indemnities related to the sale of our securities; indemnities of directors, officers and employees in connection with the performance of their work; and indemnities of individuals serving as fiduciaries on benefit plans. While our aggregate indemnification obligation could result in a material liability, we are not aware of any current matter that could result in a material liability.
47
ITEM 7A. | QUANTITATIVE AND QUALITATIVE DISCLOSURES ABOUT MARKET RISK. |
FINANCIAL RISK MANAGEMENT
In addition to the risks inherent in our operations, we are exposed to market risk from a variety of sources, including changes in interest rates, commodity prices, the fair value of certain equity investments and defined benefit pension and other post-retirement benefit plans. Our market risk exposures are discussed below.
Interest Rate Risk
We manage our exposure to interest rates and changes in the fair value of our debt instruments primarily through the strategic use of our commercial paper program, variable and fixed rate debt, and interest rate swaps. Our current program relative to interest rate protection contemplates hedging the exposure to changes in the fair value of fixed-rate debt attributable to changes in interest rates. To do this, we use the following guidelines: (i) use average daily outstanding borrowings to determine annual debt amounts subject to interest rate exposure, (ii) limit the average annual amount subject to interest rate reset and the amount of floating rate debt to a combined total amount that represents 25% of the carrying value of our debt portfolio or less, (iii) include no leveraged products, and (iv) hedge without regard to profit motive or sensitivity to current mark-to-market status.
When we use derivative financial instruments, it is primarily to manage our exposure to fluctuations in interest rates. We do not enter into derivative financial instruments for trading purposes. As a matter of policy, all of our derivative positions are intended to reduce risk by hedging an underlying economic exposure. Because of the high correlation between the hedging instrument and the underlying exposure, fluctuations in the value of the instruments generally are offset by reciprocal changes in the value of the underlying exposure. The interest rate derivatives we use are straightforward instruments with liquid markets.
As of February 3, 2024 and January 28, 2023, we maintained five forward-starting interest rate swap agreements with a maturity date of August 1, 2027 with an aggregate notional amount totaling $5.4 billion. A forward-starting interest rate swap is an agreement that effectively hedges the variability in future benchmark interest payments attributable to changes in interest rates on the forecasted issuance of fixed-rate debt. We entered into these forward-starting interest rate swaps in order to lock in fixed interest rates on our forecasted issuances of debt. The fixed interest rates for these forward-starting interest rate swaps range from 3.00% to 3.78%. The variable rate component on the forward-starting interest rate swaps is the Secured Overnight Financing Rate (“SOFR”).
A notional amount of $2.4 billion of these forward-starting interest rate swaps was designated as a cash-flow hedge as defined by GAAP. Accordingly, the changes in fair value of these forward-starting interest rate swaps are recorded to other comprehensive income and reclassified into net earnings when the hedged transaction affects net earnings. As of February 3, 2024, the fair value of the interest rate swaps designated as cash flow hedges was recorded in “Other assets” for $125 million and accumulated other comprehensive income for $95 million, net of tax. As of January 28, 2023, the fair value of the interest rate swaps designated as cash flow hedges was recorded in “Other long-term liabilities” for $116 million and accumulated other comprehensive loss for $89 million, net of tax.
The remainder of the notional amount of $3.0 billion of the forward-starting interest rate swaps was not designated as a cash-flow hedge. Accordingly, the changes in the fair value of these forward-starting interest rate swaps not designated as cash-flow hedges are recognized through net earnings. As of February 3, 2024, the fair value of these swaps was recorded in “Other Assets” for $35 million and “Other long-term liabilities” for $3 million. In 2023, we recognized an unrealized gain of $174 million that is included in “Gain (loss) on investments” in our Consolidated Statements of Operations. As of January 28, 2023, the fair value of these swaps was recorded in “Other long-term liabilities” for $142 million. In 2022, we recognized an unrealized loss of $142 million related to these swaps that is included in “Gain (loss) on investments” in our Consolidated Statements of Operations.
Annually, we review with the Finance Committee of our Board of Directors compliance with the guidelines described above. The guidelines may change as our business needs dictate.
48
The tables below provide information about our underlying debt portfolio as of February 3, 2024 and January 28, 2023. The amounts shown for each year represent the contractual maturities of long-term debt, excluding finance leases, as of February 3, 2024 and January 28, 2023. Interest rates reflect the weighted average rate for the outstanding instruments. The variable rate debt is based on a reference rate using the forward yield curve as of February 3, 2024 and January 28, 2023. The Fair Value column includes the fair value of our debt instruments as of February 3, 2024 and January 28, 2023. We had no outstanding interest rate derivatives classified as fair value hedges as of February 3, 2024 or January 28, 2023. See Notes 5, 6 and 7 to the Consolidated Financial Statements.
February 3, 2024 |
| ||||||||||||||||||||||||
Expected Year of Maturity |
| ||||||||||||||||||||||||
| 2024 |
| 2025 |
| 2026 |
| 2027 |
| 2028 |
| Thereafter |
| Total |
| Fair Value |
| |||||||||
(in millions) |
| ||||||||||||||||||||||||
Debt | |||||||||||||||||||||||||
Fixed rate principal payments(1) | $ | (23) | $ | (19) | $ | (1,311) | $ | (616) | $ | (625) | $ | (7,521) | $ | (10,115) | $ | (9,256) | |||||||||
Average interest rate(1) |
| 2.41 | % |
| 3.03 | % |
| 3.00 | % |
| 3.68 | % |
| 4.50 | % |
| 4.56 | % | |||||||
Variable rate principal payments | $ | (9) | $ | (81) | $ | — | $ | — | $ | (22) | $ | (33) | $ | (145) | $ | (145) | |||||||||
Average interest rate |
| 7.19 | % |
| 3.07 | % |
| — |
| — |
| 7.94 | % |
| 7.19 | % | |||||||||
| (1) | The fixed rate principal payments exclude debt discounts and deferred financing costs of $73 million, of which $7 million is current and $66 million is long-term. The weighted average interest rate calculation excludes the effects of debt discounts and deferred financing costs. |
January 28, 2023 |
| ||||||||||||||||||||||||
Expected Year of Maturity |
| ||||||||||||||||||||||||
| 2023 |
| 2024 |
| 2025 |
| 2026 |
| 2027 |
| Thereafter |
| Total |
| Fair Value |
| |||||||||
(in millions) |
| ||||||||||||||||||||||||
Debt | |||||||||||||||||||||||||
Fixed rate principal payments(1) | $ | (1,127) | $ | (10) | $ | (10) | $ | (1,392) | $ | (612) | $ | (8,085) | $ | (11,236) | $ | (10,455) | |||||||||
Average interest rate(1) |
| 3.89 | % |
| 2.67 | % |
| 2.68 | % |
| 3.04 | % |
| 3.68 | % |
| 4.56 | % | |||||||
Variable rate principal payments | $ | (35) | $ | (22) | $ | (81) | $ | — | $ | — | $ | — | $ | (138) | $ | (138) | |||||||||
Average interest rate |
| 6.32 | % |
| 7.07 | % |
| 1.70 | % |
| — |
| — |
| — | ||||||||||
| (1) | The fixed rate principal payments exclude debt discounts and deferred financing costs of $82 million, of which $9 million is current and $73 million is long-term. The weighted average interest rate calculation excludes the effects of debt discounts and deferred financing costs. |
Based on our year-end 2023 variable rate debt levels, a 10 percent change in interest rates would be immaterial. See Note 6 to the Consolidated Financial Statements for further discussion of derivatives and hedging policies.
Commodity Price Risk
We are subject to commodity price risk generated by our purchases of meat, seafood and dairy products, among other food items. We purchase, manufacture and sell various commodity related food products and risk arises from the price volatility of these commodities. The price and availability of these commodities directly affects our results of operations. To help manage or minimize the effect of commodity price risk exposure on our operations, we use a combination of pricing features embedded within supply contracts, such as fixed-price and price-to-be-fixed contracts, and have the ability to increase or decrease retail prices to our customers as commodity prices change.
We are exposed to changes in the prices of diesel and unleaded fuel. The majority of our fuel contracts utilize index-based pricing formulas plus or minus a fixed locational/supplier differential. We expect to take delivery of these commitments in the normal course of business, and, as a result, these contracts qualify as normal purchases. While many of the indices are aligned, each index may fluctuate at a different pace, driving variability in the prices paid for fuel. Because of this, our operating results may be affected should the market price of fuel suddenly change by a significant amount, which can affect our operating results either positively or negatively in the short-term.
49
We manage our exposure to diesel fuel price changes through the strategic use of diesel fuel hedge contracts. When we use fuel hedge contracts, it is primarily to manage our exposure to fluctuations in diesel fuel prices for our logistics operations. We do not enter into fuel hedge arrangements for trading purposes. As a matter of policy, all of our hedge positions are intended to reduce risk by hedging an underlying economic exposure. Because of the high correlation between the hedging instrument and the underlying exposure, fluctuations in the value of the instruments generally are offset by reciprocal changes in the value of the underlying exposure. The diesel fuel hedge contracts we use are straightforward instruments with liquid markets. As of February 3, 2024, our outstanding diesel fuel hedge contracts had a total notional amount of $48 million. The fair value and effect to the Consolidated Statement of Operations of these contracts is insignificant.
We have entered into fixed price contracts to purchase electricity and natural gas for a portion of our energy needs. We expect to take delivery of these commitments in the normal course of business, and, as a result, these contracts qualify as normal purchases.
As of February 3, 2024, we had no commodity derivative contracts outstanding other than the diesel fuel hedge contracts described above. As of January 28, 2023, we had no commodity derivative contracts outstanding.
Equity Investment Risk
We are exposed to market price volatility for our equity investments in certain financial instruments, measured using Level 1 inputs, which are measured at fair value through net earnings. Fair value adjustments flow through “Gain (loss) on investments” in our Consolidated Statements of Operations. The change in fair value of certain Level 1 investments resulted in an unrealized loss of $66 million in 2023, $586 million in 2022 and $821 million in 2021. As of February 3, 2024, the fair value of our investments in certain Level 1 financial instruments was $578 million. As of January 28, 2023, the fair value of our investment in certain Level 1 financial instrument was $401 million. As of February 3, 2024, a 10% change in the fair value of these investments would be approximately $58 million. For additional details on these investments, see Note 7 to the Consolidated Financial Statements.
Company-Sponsored Benefit Plans
We sponsor defined benefit pension plans and post-retirement healthcare plans for certain eligible employees. Changes in interest rates affect our liabilities associated with these retirement plans, as well as the amount of expense recognized for these retirement plans. Increased interest rates could result in a lower fair value of plan assets and increased pension expense in the following years. The target plan asset allocations are established based on our liability-driven investment (“LDI”) strategy. An LDI strategy focuses on maintaining a close to fully-funded status over the long-term with minimal funded status risk. This is achieved by investing more of the plan assets in fixed income instruments to more closely match the duration of the plan liability. As of February 3, 2024, our defined benefit pension plans had total investment assets of $2.4 billion. As of January 28. 2023, our defined benefit pension plans had total investment assets of $2.5 billion. Declines in the fair value of plan assets could diminish the funded status of our defined benefit pension plans and potentially increase our requirement to make contributions to these plans. For additional details, see Note 14 to the Consolidated Financial Statements.
50
ITEM 8. | FINANCIAL STATEMENTS AND SUPPLEMENTARY DATA. |
Consolidated Financial Statements of The Kroger Co.
For the Fiscal Year Ended February 3, 2024
Table of Contents
Page | |
52 | |
55 | |
56 | |
57 | |
58 | |
59 | |
60 |
51
Report of Independent Registered Public Accounting Firm
To the Board of Directors and Shareholders of The Kroger Co.
Opinions on the Financial Statements and Internal Control over Financial Reporting
We have audited the accompanying consolidated balance sheets of The Kroger Co. and its subsidiaries (the “Company”) as of February 3, 2024 and January 28, 2023, and the related consolidated statements of operations, of comprehensive income, of shareholders' equity and of cash flows for each of the three years in the period ended February 3, 2024, including the related notes (collectively referred to as the “consolidated financial statements”). We also have audited the Company's internal control over financial reporting as of February 3, 2024, based on criteria established in Internal Control - Integrated Framework (2013) issued by the Committee of Sponsoring Organizations of the Treadway Commission (COSO).
In our opinion, the consolidated financial statements referred to above present fairly, in all material respects, the financial position of the Company as of February 3, 2024 and January 28, 2023, and the results of its operations and its cash flows for each of the three years in the period ended February 3, 2024 in conformity with accounting principles generally accepted in the United States of America. Also in our opinion, the Company maintained, in all material respects, effective internal control over financial reporting as of February 3, 2024, based on criteria established in Internal Control - Integrated Framework (2013) issued by the COSO.
Basis for Opinions
The Company's management is responsible for these consolidated financial statements, for maintaining effective internal control over financial reporting, and for its assessment of the effectiveness of internal control over financial reporting, included in Management’s Report on Internal Control over Financial Reporting appearing under Item 9A. Our responsibility is to express opinions on the Company’s consolidated financial statements and on the Company's internal control over financial reporting based on our audits. We are a public accounting firm registered with the Public Company Accounting Oversight Board (United States) (PCAOB) and are required to be independent with respect to the Company in accordance with the U.S. federal securities laws and the applicable rules and regulations of the Securities and Exchange Commission and the PCAOB.
We conducted our audits in accordance with the standards of the PCAOB. Those standards require that we plan and perform the audits to obtain reasonable assurance about whether the consolidated financial statements are free of material misstatement, whether due to error or fraud, and whether effective internal control over financial reporting was maintained in all material respects.
Our audits of the consolidated financial statements included performing procedures to assess the risks of material misstatement of the consolidated financial statements, whether due to error or fraud, and performing procedures that respond to those risks. Such procedures included examining, on a test basis, evidence regarding the amounts and disclosures in the consolidated financial statements. Our audits also included evaluating the accounting principles used and significant estimates made by management, as well as evaluating the overall presentation of the consolidated financial statements. Our audit of internal control over financial reporting included obtaining an understanding of internal control over financial reporting, assessing the risk that a material weakness exists, and testing and evaluating the design and operating effectiveness of internal control based on the assessed risk. Our audits also included performing such other procedures as we considered necessary in the circumstances. We believe that our audits provide a reasonable basis for our opinions.
52
Definition and Limitations of Internal Control over Financial Reporting
A company’s internal control over financial reporting is a process designed to provide reasonable assurance regarding the reliability of financial reporting and the preparation of financial statements for external purposes in accordance with generally accepted accounting principles. A company’s internal control over financial reporting includes those policies and procedures that (i) pertain to the maintenance of records that, in reasonable detail, accurately and fairly reflect the transactions and dispositions of the assets of the company; (ii) provide reasonable assurance that transactions are recorded as necessary to permit preparation of financial statements in accordance with generally accepted accounting principles, and that receipts and expenditures of the company are being made only in accordance with authorizations of management and directors of the company; and (iii) provide reasonable assurance regarding prevention or timely detection of unauthorized acquisition, use, or disposition of the company’s assets that could have a material effect on the financial statements.
Because of its inherent limitations, internal control over financial reporting may not prevent or detect misstatements. Also, projections of any evaluation of effectiveness to future periods are subject to the risk that controls may become inadequate because of changes in conditions, or that the degree of compliance with the policies or procedures may deteriorate.
Critical Audit Matters
The critical audit matter communicated below is a matter arising from the current period audit of the consolidated financial statements that was communicated or required to be communicated to the audit committee and that (i) relates to accounts or disclosures that are material to the consolidated financial statements and (ii) involved our especially challenging, subjective, or complex judgments. The communication of critical audit matters does not alter in any way our opinion on the consolidated financial statements, taken as a whole, and we are not, by communicating the critical audit matter below, providing a separate opinion on the critical audit matter or on the accounts or disclosures to which it relates.
Goodwill Impairment Assessment – Kroger Specialty Pharmacy (“KSP”) Reporting Unit
As described in Notes 1 and 2 to the consolidated financial statements, the Company’s consolidated goodwill balance was $2.9 billion as of February 3, 2024 and the goodwill associated with the KSP reporting unit was $243 million. Management reviews goodwill annually for impairment in the fourth quarter of each year, and also upon the occurrence of triggering events. The fair value of a reporting unit is compared to its carrying value for purposes of identifying potential impairment. Goodwill impairment is recognized for any excess of the reporting unit’s carrying value over its fair value, not to exceed the total amount of goodwill allocated to the reporting unit. The fair value of the Company's KSP reporting unit was estimated using multiple valuation techniques, a discounted cash flow model (income approach), a market multiple model and comparable mergers and acquisition model (market approaches), with each method weighted in the calculation. The income approach relies on management’s estimates of revenue growth rates, margin assumptions, and discount rate to estimate future cash flows. The market approaches require the determination of an appropriate peer group, which is utilized to derive estimated fair values based on selected market multiples.
The principal considerations for our determination that performing procedures relating to the goodwill impairment assessment of the KSP reporting unit is a critical audit matter are (i) the significant judgment by management when developing the fair value measurement of the reporting unit; (ii) the high degree of auditor judgment, subjectivity, and effort in performing procedures to evaluate management’s cash flow projections and significant assumptions related to revenue growth rates, margin assumptions, discount rate, peer group determination, and market multiple selection; and (iii) the audit effort involved the use of professionals with specialized skill and knowledge.
53
Addressing the matter involved performing procedures and evaluating audit evidence in connection with forming our overall opinion on the consolidated financial statements. These procedures included testing the effectiveness of controls relating to management’s goodwill impairment assessment, including controls over the valuation of the Company’s KSP reporting unit. These procedures also included, among others, testing management’s process for developing the fair value estimate, evaluating the appropriateness of the income and market approach models, testing the completeness, accuracy, and relevance of the underlying data used in the models and evaluating the significant assumptions used by management related to the revenue growth rates, margin assumptions, discount rate, peer group determination, and market multiple selection. Evaluating management’s assumptions relating to revenue growth rates and margin assumptions involved evaluating whether the assumptions used by management were reasonable considering (i) the current and past performance of the reporting unit, (ii) the consistency with external market and industry data, and (iii) whether these assumptions were consistent with evidence obtained in other areas of the audit. Evaluating the Company’s peer group determinations included evaluating the appropriateness of the identified peer companies. Professionals with specialized skill and knowledge were used to assist in the evaluation of the Company’s discounted cash flow and market models, and certain significant assumptions related to the discount rate, peer group determination, and market multiples.
/s/
April 2, 2024
We have served as the Company’s auditor since 1929.
54
THE KROGER CO.
CONSOLIDATED BALANCE SHEETS
| February 3, |
| January 28, |
| |||
(In millions, except par amounts) | 2024 | 2023 |
| ||||
ASSETS | |||||||
Current assets | |||||||
Cash and temporary cash investments | $ | | $ | | |||
Store deposits in-transit |
| |
| | |||
Receivables |
| |
| | |||
FIFO inventory |
| |
| | |||
LIFO reserve |
| ( |
| ( | |||
Prepaid and other current assets | | | |||||
Total current assets |
| |
| | |||
Property, plant and equipment, net |
| |
| | |||
Operating lease assets | | | |||||
Intangibles, net |
| |
| | |||
Goodwill |
| |
| | |||
Other assets |
| |
| | |||
Total Assets | $ | | $ | | |||
LIABILITIES | |||||||
Current liabilities | |||||||
Current portion of long-term debt including obligations under finance leases | $ | | $ | | |||
Current portion of operating lease liabilities | | | |||||
Accounts payable |
| |
| | |||
Accrued salaries and wages |
| |
| | |||
Other current liabilities |
| |
| | |||
Total current liabilities |
| |
| | |||
Long-term debt including obligations under finance leases | | | |||||
Noncurrent operating lease liabilities | | | |||||
Deferred income taxes |
| |
| | |||
Pension and postretirement benefit obligations |
| |
| | |||
Other long-term liabilities |
| |
| | |||
Total Liabilities |
| |
| | |||
Commitments and contingencies see Note 12 | |||||||
SHAREOWNERS’ EQUITY | |||||||
Preferred shares, $ | |||||||
Common shares, $ |
| |
| | |||
Additional paid-in capital |
| |
| | |||
Accumulated other comprehensive loss |
| ( |
| ( | |||
Accumulated earnings |
| |
| | |||
Common shares in treasury, at cost, |
| ( |
| ( | |||
Total Shareowners’ Equity - The Kroger Co. |
| |
| | |||
Noncontrolling interests |
| ( |
| ( | |||
Total Equity |
| |
| | |||
Total Liabilities and Equity | $ | | $ | | |||
The accompanying notes are an integral part of the consolidated financial statements.
55
THE KROGER CO.
CONSOLIDATED STATEMENTS OF OPERATIONS
Years Ended February 3, 2024, January 28, 2023 and January 29, 2022
| |||||||||||
2023 |
| 2022 |
| 2021 | |||||||
(In millions, except per share amounts) |
|
| (53 weeks) | (52 weeks) | (52 weeks) |
| |||||
Sales | $ | | $ | | $ | | |||||
Operating expenses | |||||||||||
Merchandise costs, including advertising, warehousing, and transportation, excluding items shown separately below |
| |
| |
| | |||||
Operating, general and administrative |
| |
| |
| | |||||
Rent |
| |
| |
| | |||||
Depreciation and amortization |
| |
| |
| | |||||
Operating profit |
| |
| |
| | |||||
Other income (expense) | |||||||||||
Interest expense |
| ( |
| ( |
| ( | |||||
Non-service component of company-sponsored pension plan benefits (costs) | | | ( | ||||||||
Gain (loss) on investments | | ( | ( | ||||||||
Net earnings before income tax expense |
| |
| |
| | |||||
Income tax expense |
| |
| |
| | |||||
Net earnings including noncontrolling interests |
| |
| |
| | |||||
Net income attributable to noncontrolling interests |
| |
| |
| | |||||
Net earnings attributable to The Kroger Co. | $ | | $ | | $ | | |||||
Net earnings attributable to The Kroger Co. per basic common share | $ | | $ | | $ | | |||||
Average number of common shares used in basic calculation |
| |
| |
| | |||||
Net earnings attributable to The Kroger Co. per diluted common share | $ | | $ | | $ | | |||||
Average number of common shares used in diluted calculation |
| |
| |
| | |||||
The accompanying notes are an integral part of the consolidated financial statements.
56
THE KROGER CO.
CONSOLIDATED STATEMENTS OF COMPREHENSIVE INCOME
Years Ended February 3, 2024, January 28, 2023 and January 29, 2022
2023 | 2022 |
| 2021 | ||||||
(In millions) |
| (53 weeks) | (52 weeks) | (52 weeks) | |||||
Net earnings including noncontrolling interests | $ | | $ | | $ | | |||
Other comprehensive (loss) income | |||||||||
Change in pension and other postretirement defined benefit plans, net of income tax(1) | ( | ( | | ||||||
Unrealized gains and losses on cash flow hedging activities, net of income tax(2) |
| |
| ( |
| — | |||
Amortization of unrealized gains and losses on cash flow hedging activities, net of income tax(3) | | | | ||||||
Total other comprehensive income (loss) |
| |
| ( |
| | |||
Comprehensive income |
| |
| |
| | |||
Comprehensive income attributable to noncontrolling interests |
| |
| |
| | |||
Comprehensive income attributable to The Kroger Co. | $ | | $ | | $ | | |||
| (1) |
| (2) |
| (3) |
The accompanying notes are an integral part of the consolidated financial statements.
57
THE KROGER CO.
CONSOLIDATED STATEMENTS OF CASH FLOWS
Years Ended February 3, 2024, January 28, 2023 and January 29, 2022
| ||||||||||
2023 |
| 2022 |
| 2021 | ||||||
(In millions) |
| (53 weeks) | (52 weeks) | (52 weeks) |
| |||||
Cash Flows from Operating Activities: | ||||||||||
Net earnings including noncontrolling interests | $ | | $ | | $ | | ||||
Adjustments to reconcile net earnings including noncontrolling interests to net cash provided by operating activities: | ||||||||||
Depreciation and amortization |
| |
| |
| | ||||
Asset impairment charges | | | | |||||||
Goodwill and fixed asset impairment charges related to Vitacost.com | — | | — | |||||||
Operating lease asset amortization | | | | |||||||
LIFO charge |
| |
| |
| | ||||
Share-based employee compensation |
| |
| |
| | ||||
Company-sponsored pension plans (benefit) expense |
| ( |
| ( |
| | ||||
Deferred income taxes |
| ( |
| |
| ( | ||||
Gain on the sale of assets | ( | ( | ( | |||||||
(Gain) loss on investments | ( | | | |||||||
Other |
| |
| ( |
| | ||||
Changes in operating assets and liabilities: | ||||||||||
Store deposits in-transit |
| ( |
| ( |
| | ||||
Receivables |
| |
| ( |
| ( | ||||
Inventories |
| |
| ( |
| | ||||
Prepaid and other current assets |
| |
| ( |
| | ||||
Accounts payable |
| |
| |
| | ||||
Accrued expenses |
| ( |
| ( |
| ( | ||||
Income taxes receivable and payable |
| | ( | | ||||||
Operating lease liabilities | ( | ( | ( | |||||||
Other |
| |
| ( |
| ( | ||||
Net cash provided by operating activities |
| |
| |
| | ||||
Cash Flows from Investing Activities: | ||||||||||
Payments for property and equipment, including payments for lease buyouts |
| ( |
| ( |
| ( | ||||
Proceeds from sale of assets |
| | | | ||||||
Other |
| |
| ( |
| ( | ||||
Net cash used by investing activities |
| ( |
| ( |
| ( | ||||
Cash Flows from Financing Activities: | ||||||||||
Proceeds from issuance of long-term debt |
| |
| — |
| | ||||
Payments on long-term debt including obligations under finance leases |
| ( | ( | ( | ||||||
Dividends paid | ( | ( | ( | |||||||
Financing fees paid | — | ( | ( | |||||||
Proceeds from issuance of capital stock | |
| |
| | |||||
Treasury stock purchases |
| ( |
| ( |
| ( | ||||
Proceeds from financing arrangement | — | — | | |||||||
Other | ( |
| ( |
| ( | |||||
Net cash used by financing activities |
| ( |
| ( |
| ( | ||||
Net increase (decrease) in cash and temporary cash investments |
| |
| ( |
| | ||||
Cash and temporary cash investments: | ||||||||||
Beginning of year |
| |
| |
| | ||||
End of year | $ | | $ | | $ | | ||||
Reconciliation of capital investments: | ||||||||||
Payments for property and equipment, including payments for lease buyouts | $ | ( | $ | ( | $ | ( | ||||
Payments for lease buyouts | — |
| |
| — | |||||
Changes in construction-in-progress payables |
| |
| ( |
| ( | ||||
Total capital investments, excluding lease buyouts | $ | ( | $ | ( | $ | ( | ||||
Disclosure of cash flow information: | ||||||||||
Cash paid during the year for interest | $ | | $ | | $ | | ||||
Cash paid during the year for income taxes | $ | | $ | | $ | | ||||
The accompanying notes are an integral part of the consolidated financial statements.
58
THE KROGER CO.
CONSOLIDATED STATEMENT OF CHANGES IN SHAREHOLDERS’ EQUITY
Years Ended February 3, 2024, January 28, 2023 and January 29, 2022
|
|
|
|
|
|
|
|
|
|
| Accumulated |
|
|
|
|
|
| ||||||||
Additional | Other | ||||||||||||||||||||||||
Common Stock | Paid-In | Treasury Stock | Comprehensive | Accumulated | Noncontrolling | ||||||||||||||||||||
(In millions, except per share amounts) | Shares | Amount | Capital | Shares | Amount | Income (Loss) | Earnings | Interest | Total | ||||||||||||||||
Balances at January 30, 2021 |
| | $ | | $ |
| | $ | ( | $ | ( | $ | | $ | ( | $ | | ||||||||
Issuance of common stock: | |||||||||||||||||||||||||
Stock options exercised |
| — |
| — |
| — |
| ( |
| |
| — |
| — |
| — |
| | |||||||
Restricted stock issued |
| — |
| — |
| ( |
| ( |
| |
| — |
| — |
| — |
| ( | |||||||
Treasury stock activity: |
| ||||||||||||||||||||||||
Treasury stock purchases, at cost |
| — |
| — |
| — |
| |
| ( |
| — |
| — |
| — |
| ( | |||||||
Stock options exchanged |
| — |
| — |
| — |
| |
| ( |
| — |
| — |
| — |
| ( | |||||||
Share-based employee compensation |
| — |
| — |
| |
| — |
| — |
| — |
| — |
| — |
| | |||||||
Other comprehensive income net of tax of $ |
| — |
| — |
| — |
| — |
| — |
| |
| — |
| — |
| | |||||||
Other |
| — |
| — |
| |
| — |
| ( |
| — |
| — |
| ( |
| ( | |||||||
Cash dividends declared ($ |
| — |
| — |
| — |
| — |
| — |
| — |
| ( |
| — | ( | ||||||||
Net earnings including non-controlling interests |
| — |
| — |
| — |
| — |
| — |
| — |
| |
| |
| | |||||||
Balances at January 29, 2022 |
| | $ | | $ | |
| | $ | ( | $ | ( | $ | | $ | ( | $ | | |||||||
Issuance of common stock: | |||||||||||||||||||||||||
Stock options exercised |
| — |
| — |
| — |
| ( |
| |
| — |
| — |
| — |
| | |||||||
Restricted stock issued |
| — |
| — |
| ( |
| ( |
| |
| — |
| — |
| — |
| ( | |||||||
Treasury stock activity: |
| ||||||||||||||||||||||||
Treasury stock purchases, at cost |
| — |
| — |
| — |
| |
| ( |
| — |
| — |
| — |
| ( | |||||||
Stock options exchanged |
| — |
| — |
| — |
| |
| ( |
| — |
| — |
| — |
| ( | |||||||
Share-based employee compensation |
| — |
| — |
| |
| — |
| — |
| — |
| — |
| — |
| | |||||||
Other comprehensive loss net of tax of $( |
| — |
| — |
| — |
| — |
| — |
| ( |
| — |
| — |
| ( | |||||||
Other |
| — |
| — |
| |
| — |
| ( |
| — |
| — |
| ( |
| ( | |||||||
Cash dividends declared ($ | — |
| — |
| — |
| — |
| — |
| — |
| ( |
| — |
| ( | ||||||||
Net earnings including non-controlling interests |
| — |
| — |
| — |
| — |
| — |
| — |
| |
| |
| | |||||||
Balances at January 28, 2023 |
| | $ | | $ | |
| | $ | ( | $ | ( | $ | | $ | ( | $ | | |||||||
Issuance of common stock: | |||||||||||||||||||||||||
Stock options exercised |
| — |
| — |
| — |
| ( |
| |
| — |
| — |
| — |
| | |||||||
Restricted stock issued |
| — |
| — |
| ( |
| ( |
| |
| — |
| — |
| — |
| ( | |||||||
Treasury stock activity: |
| ||||||||||||||||||||||||
Stock options exchanged |
| — |
| — |
| — |
| |
| ( |
| — |
| — |
| — |
| ( | |||||||
Share-based employee compensation |
| — |
| — |
| |
| — |
| — |
| — |
| — |
| — |
| | |||||||
Other comprehensive income net of tax of $ |
| — |
| — |
| — |
| — |
| — |
| |
| — |
| — |
| | |||||||
Other |
| — |
| — |
| |
| — |
| ( |
| — |
| — |
| |
| | |||||||
Cash dividends declared ($ |
| — |
| — |
| — |
| — |
| — |
| — |
| ( |
| — |
| ( | |||||||
Net earnings including non-controlling interests |
| — |
| — |
| — |
| — |
| — |
| — |
| |
| |
| | |||||||
Balances at February 3, 2024 |
| | $ | | $ | |
| | $ | ( | $ | ( | $ | | $ | ( | $ | | |||||||
The accompanying notes are an integral part of the consolidated financial statements.
59
NOTES TO CONSOLIDATED FINANCIAL STATEMENTS
All amounts in the Notes to Consolidated Financial Statements are in millions except per share amounts.
1. | ACCOUNTING POLICIES |
The following is a summary of the significant accounting policies followed in preparing these financial statements.
Description of Business, Basis of Presentation and Principles of Consolidation
The Kroger Co. (the “Company”) was founded in 1883 and incorporated in 1902. The Company is a food and drug retailer that operates
Reclassifications
The Company reclassified $
Fiscal Year
The Company’s fiscal year ends on the Saturday nearest January 31. The last three fiscal years consist of the
Pervasiveness of Estimates
The preparation of financial statements in conformity with generally accepted accounting principles (“GAAP”) requires management to make estimates and assumptions that affect the reported amounts of assets and liabilities. Disclosure of contingent assets and liabilities as of the date of the consolidated financial statements and the reported amounts of consolidated revenues and expenses during the reporting period is also required. Actual results could differ from those estimates.
Cash, Temporary Cash Investments and Book Overdrafts
Cash and temporary cash investments represent store cash and short-term investments with original maturities of less than three months. Book overdrafts are included in “Accounts payable” and “Accrued salaries and wages” in the Consolidated Balance Sheets.
Deposits In-Transit
Deposits in-transit generally represent funds deposited to the Company’s bank accounts at the end of the year related to sales, a majority of which were paid for with debit cards, credit cards and checks, to which the Company does not have immediate access but settle within a few days of the sales transaction.
60
Inventories
Inventories are stated at the lower of cost (principally on a last-in, first-out “LIFO” basis) or market. In total, approximately
The item-cost method of accounting to determine inventory cost before the LIFO adjustment is followed for substantially all store inventories at the Company’s supermarket divisions. This method involves counting each item in inventory, assigning costs to each of these items based on the actual purchase costs (net of vendor allowances and cash discounts) of each item and recording the cost of items sold. The item-cost method of accounting allows for more accurate reporting of periodic inventory balances and enables management to more precisely manage inventory. In addition, substantially all of the Company’s inventory consists of finished goods and is recorded at actual purchase costs (net of vendor allowances and cash discounts).
The Company evaluates inventory shortages throughout the year based on actual physical counts in its facilities. Allowances for inventory shortages are recorded based on the results of these counts to provide for estimated shortages as of the financial statement date.
Property, Plant and Equipment
Property, plant and equipment are recorded at cost or, in the case of assets acquired in a business combination, at fair value. Depreciation and amortization expense, which includes the depreciation of assets recorded under finance leases, is computed principally using the straight-line method over the estimated useful lives of individual assets. Buildings and land improvements are depreciated based on lives varying from
Interest costs on significant projects constructed for the Company’s own use are capitalized as part of the costs of the newly constructed facilities. Upon retirement or disposal of assets, the cost and related accumulated depreciation and amortization are removed from the balance sheet and any gain or loss is reflected in net earnings. Refer to Note 3 for further information regarding the Company’s property, plant and equipment.
Leases
The Company leases certain store real estate, warehouses, distribution centers, fulfillment centers, office space and equipment. The Company determines if an arrangement is a lease at inception. Finance and operating lease assets and liabilities are recognized at the lease commencement date. Finance and operating lease liabilities represent the present value of minimum lease payments not yet paid. Operating lease assets represent the right to use an underlying asset and are based upon the operating lease liabilities adjusted for prepayments, lease incentives and impairment, if any. To determine the present value of lease payments, the Company estimates an incremental borrowing rate which represents the rate used for a secured borrowing of a similar term as the lease.
61
Lease terms generally range from
Goodwill
The Company reviews goodwill for impairment during the fourth quarter of each year, or earlier upon the occurrence of a triggering event. The Company performs reviews of each of its operating divisions and other consolidated entities (collectively, “reporting units”) that have goodwill balances. Generally, fair value is determined using a market multiple model, or discounted projected future cash flows, and is compared to the carrying value of a reporting unit for purposes of identifying potential impairment. Projected future cash flows are based on management’s knowledge of the current operating environment and expectations for the future. Goodwill impairment is recognized for any excess of the reporting unit’s carrying value over its fair value, not to exceed the total amount of goodwill allocated to the reporting unit. Results of the goodwill impairment reviews performed during 2023, 2022 and 2021 are summarized in Note 2.
Impairment of Long-Lived Assets
The Company monitors the carrying value of long-lived assets for potential impairment each quarter based on whether certain triggering events have occurred. These events include current period losses combined with a history of losses or a projection of continuing losses or a significant decrease in the market value of an asset. When a triggering event occurs, an impairment calculation is performed, comparing projected undiscounted future cash flows, utilizing current cash flow information and expected growth rates related to specific stores, to the carrying value for those stores. If the Company identifies impairment for long-lived assets to be held and used, the Company compares the assets’ current carrying value to the assets’ fair value. Fair value is based on current market values or discounted future cash flows. The Company records impairment when the carrying value exceeds fair market value. With respect to owned property and equipment held for disposal, the value of the property and equipment is adjusted to reflect recoverable values based on previous efforts to dispose of similar assets and current economic conditions. Impairment is recognized for the excess of the carrying value over the estimated fair market value, reduced by estimated direct costs of disposal. The Company recorded asset impairments totaling $
Accounts Payable Financing Arrangement
The Company has an agreement with a third party to provide an accounts payable tracking system which facilitates participating suppliers’ ability to finance payment obligations from the Company with designated third-party financial institutions. Participating suppliers may, at their sole discretion, make offers to finance one or more payment obligations of the Company prior to their scheduled due dates at a discounted price to participating financial institutions. The Company’s obligations to its suppliers, including amounts due and scheduled payment dates, are not affected by suppliers’ decisions to finance amounts under this arrangement. As of February 3, 2024, and January 28, 2023, the Company had $
62
Contingent Consideration
The Company’s Home Chef business combination involved potential payment of future consideration that is contingent upon the achievement of certain performance milestones. The Company recorded contingent consideration at fair value at the date of acquisition based on the consideration expected to be transferred, estimated as the probability-weighted future cash flows, discounted back to present value using a discount rate determined in accordance with accepted valuation methods. The liability for contingent consideration is remeasured to fair value at each reporting period using Level 3 inputs, and the change in fair value, including accretion for the passage of time, is recognized in earnings until the contingency is resolved. In 2022, adjustments to increase the contingent consideration liability as of year-end were recorded for $
Store Closing Costs
The Company regularly evaluates the performance of its stores and periodically closes those stores that are underperforming. Related liabilities arise, such as severance, contractual obligations and other accruals associated with store closings. The Company records a liability for costs associated with an exit or disposal activity when the liability is incurred, usually in the period the store closes. Adjustments to closed store liabilities primarily relate to actual exit costs differing from original estimates. Adjustments are made for changes in estimates in the period in which the change becomes known.
Owned stores held for disposal are reduced to their estimated net realizable value. Costs to reduce the carrying values of property, plant, equipment and operating lease assets are accounted for in accordance with the Company’s policy on impairment of long-lived assets. Inventory write-downs, if any, in connection with store closings, are classified in the Consolidated Statements of Operations as “Merchandise costs.” Costs to transfer inventory and equipment from closed stores are expensed as incurred.
Interest Rate Risk Management
The Company uses derivative instruments primarily to manage its exposure to changes in interest rates. The Company’s current program relative to interest rate protection and the methods by which the Company accounts for its derivative instruments are described in Note 6.
Benefit Plans and Multi-Employer Pension Plans
The Company recognizes the funded status of its retirement plans on the Consolidated Balance Sheets. Actuarial gains or losses, prior service costs or credits and transition obligations that have not yet been recognized as part of net periodic benefit cost are required to be recorded as a component of Accumulated Other Comprehensive Income (“AOCI”). The Company has elected to measure defined benefit plan assets and obligations as of January 31, which is the month-end that is closest to its fiscal year-ends.
The determination of the obligation and expense for company-sponsored pension plans and other post-retirement benefits is dependent on the selection of assumptions used by actuaries and the Company in calculating those amounts. Those assumptions are described in Note 14 and include, among others, the discount rate, the expected long-term rate of return on plan assets, mortality and the rates of increase in compensation and health care costs. Actual results that differ from the assumptions are accumulated and amortized over future periods and, therefore, generally affect the recognized expense and recorded obligation in future periods. While the Company believes that the assumptions are appropriate, significant differences in actual experience or significant changes in assumptions may materially affect the pension and other post-retirement obligations and future expense.
The Company also participates in various multi-employer plans for substantially all union employees. Pension expense for these plans is recognized as contributions are funded or when commitments are probable and reasonably estimable, in accordance with GAAP. Refer to Note 15 for additional information regarding the Company’s participation in these various multi-employer pension plans.
63
The Company administers and makes contributions to the employee 401(k) retirement savings accounts. Contributions to the employee 401(k) retirement savings accounts are expensed when contributed or over the service period in the case of automatic contributions. Refer to Note 14 for additional information regarding the Company’s benefit plans.
Share Based Compensation
The Company recognizes compensation expense for all share-based payments granted under fair value recognition provisions. The Company recognizes share-based compensation expense, net of an estimated forfeiture rate, over the requisite service period of the award based on the fair value at the date of the grant. The Company grants options for common shares (“stock options”) to employees under various plans at an option price equal to the fair market value of the underlying shares on the grant date of the award. Stock options typically expire
Deferred Income Taxes
Deferred income taxes are recorded to reflect the tax consequences of differences between the tax basis of assets and liabilities and their financial reporting basis. Refer to Note 4 for the types of differences that give rise to significant portions of deferred income tax assets and liabilities.
Uncertain Tax Positions
The Company reviews the tax positions taken or expected to be taken on tax returns to determine whether and to what extent a benefit can be recognized in its consolidated financial statements. Refer to Note 4 for the amount of unrecognized tax benefits and other related disclosures related to uncertain tax positions.
Various taxing authorities periodically audit the Company’s income tax returns. These audits include questions regarding the Company’s tax filing positions, including the timing and amount of deductions and the allocation of income to various tax jurisdictions. In evaluating the exposures connected with these various tax filing positions, including state and local taxes, the Company records allowances for probable exposures. A number of years may elapse before a particular matter, for which an allowance has been established, is audited and fully resolved. As of February 3, 2024, the years ended February 1, 2020 and forward remain open for review for federal income tax purposes.
The assessment of the Company’s tax position relies on the judgment of management to estimate the exposures associated with the Company’s various filing positions.
Self-Insurance Costs
The Company is primarily self-insured for costs related to workers’ compensation and general liability claims. Liabilities are actuarially determined and are recognized based on claims filed and an estimate of claims incurred but not reported. The liabilities for workers’ compensation claims are accounted for on a present value basis. The Company has purchased stop-loss coverage to limit its exposure to any significant exposure on a per claim basis. The Company is insured for covered costs in excess of these per claim limits.
64
The following table summarizes the changes in the Company’s self-insurance liability through February 3, 2024:
| 2023 |
| 2022 |
| 2021 |
| ||||
Beginning balance | $ | | $ | | $ | | ||||
Expense(1) |
| |
| |
| | ||||
Claim payments |
| ( |
| ( |
| ( | ||||
Ending balance |
| |
| |
| | ||||
Less: Current portion |
| ( |
| ( |
| ( | ||||
Long-term portion | $ | | $ | | $ | | ||||
| (1) | The increase in 2023, compared to 2022 and 2021, was the result of higher claim costs. |
The current portion of the self-insured liability is included in “Other current liabilities,” and the long-term portion is included in “Other long-term liabilities” in the Consolidated Balance Sheets.
The Company maintains surety bonds related to self-insured workers’ compensation claims. These bonds are required by most states in which the Company is self-insured for workers’ compensation and are placed with third-party insurance providers to insure payment of the Company’s obligations in the event the Company is unable to meet its claim payment obligations up to its self-insured retention levels. These bonds do not represent liabilities of the Company, as the Company has recorded reserves for the claim costs.
The Company also maintains insurance coverages for certain risks, including cyber exposure and property-related losses. The Company’s insurance coverage begins for these exposures ranging from $
Revenue Recognition
Sales
The Company recognizes revenues from the retail sale of products, net of sales taxes, at the point of sale. Pharmacy sales are recorded when the product is provided to the customer. Digital channel originated sales are recognized either upon pickup in store or upon delivery to the customer. Amounts billed to a customer related to shipping and delivery represent revenues earned for the goods provided and are classified as sales. When shipping is discounted, it is recorded as an adjustment to sales. Discounts provided to customers by the Company at the time of sale, including those provided in connection with loyalty cards, are recognized as a reduction in sales as the products are sold. Discounts provided by vendors, usually in the form of coupons, are not recognized as a reduction in sales provided the coupons are redeemable at any retailer that accepts coupons. The Company records a receivable from the vendor for the difference in sales price and cash received. For merchandise sold in one of the Company’s stores or online, tender is accepted at the point of sale. The Company acts as principal in certain vendor arrangements where the purchase and sale of inventory are virtually simultaneous. The Company records revenue and related costs on a gross basis for these arrangements. For pharmacy sales, collection of third-party receivables is typically expected within
Gift Cards and Gift Certificates
The Company does not recognize revenue when it sells its own gift cards and gift certificates (collectively “gift cards”). Rather, it records a deferred revenue liability equal to the amount received. A sale is then recognized when the gift cards are redeemed to purchase the Company’s products. The Company’s gift cards do not expire. While gift cards are generally redeemed within
65
Disaggregated Revenues
The following table presents sales revenue by type of product for the year-ended February 3, 2024, January 28, 2023, and January 29, 2022:
2023 | 2022 | 2021 |
| |||||||||||||
| Amount |
| % of total |
| Amount |
| % of total |
| Amount |
| % of total |
| ||||
Non Perishable(1) | $ | |
| | % | $ | |
| | % | $ | |
| | % | |
Fresh(2) |
| |
| | % |
| |
| | % |
| |
| | % | |
Supermarket Fuel |
| |
| | % |
| |
| | % |
| |
| | % | |
Pharmacy |
| |
| | % |
| |
| | % |
| |
| | % | |
Other(3) |
| |
| | % |
| |
| | % |
| |
| | % | |
Total Sales | $ | |
| | % | $ | |
| | % | $ | |
| | % | |
| (1) | Consists primarily of grocery, general merchandise, health and beauty care and natural foods. |
| (2) | Consists primarily of produce, floral, meat, seafood, deli, bakery and fresh prepared. |
| (3) | Consists primarily of sales related to food production plants to outside parties, data analytic services, third-party media revenue, other consolidated entities, specialty pharmacy, in-store health clinics, Kroger Personal Finance, digital coupon services and other online sales not included in the categories above. The decrease in 2022, compared to 2021, is primarily due to discontinued patient therapies at Kroger Specialty Pharmacy. |
Merchandise Costs
The “Merchandise costs” line item of the Consolidated Statements of Operations includes product costs, net of discounts and allowances; advertising costs (see separate discussion below); inbound freight charges; warehousing costs, including receiving and inspection costs; transportation costs; and food production and operational costs. Warehousing, transportation and manufacturing management salaries are also included in the “Merchandise costs” line item; however, purchasing management salaries and administration costs are included in the “OG&A” line item along with most of the Company’s other managerial and administrative costs. Shipping and delivery costs associated with the Company’s digital offerings originating from non-retail store locations are included in the “Merchandise costs” line item. Rent expense and depreciation and amortization expense are shown separately in the Consolidated Statements of Operations.
Warehousing and transportation costs include distribution center direct wages, transportation direct wages, repairs and maintenance, utilities, inbound freight and, where applicable, third-party warehouse management fees. These costs are recognized in the periods the related expenses are incurred.
The Company believes the classification of costs included in merchandise costs could vary widely throughout the industry. The Company’s approach is to include in the “Merchandise costs” line item the direct, net costs of acquiring products and making them available to customers. The Company believes this approach most accurately presents the actual costs of products sold.
The Company recognizes all vendor allowances as a reduction in merchandise costs when the related product is sold. When possible, vendor allowances are applied to the related product cost by item and, therefore, reduce the carrying value of inventory by item. When the items are sold, the vendor allowance is recognized. When it is not possible, due to systems constraints, to allocate vendor allowances to the product by item, vendor allowances are recognized as a reduction in merchandise costs based on inventory turns and, therefore, recognized as the product is sold.
Advertising Costs
The Company’s advertising costs are recognized in the periods the related expenses are incurred and are included in the “Merchandise costs” line item of the Consolidated Statements of Operations. The Company’s advertising costs totaled $
66
Operating, General and Administrative Expenses
OG&A expenses consist primarily of employee-related costs such as wages, healthcare benefit costs, retirement plan costs, utilities, and credit card fees. Shipping and delivery costs associated with the Company's digital offerings originating from retail store locations, including third-party delivery fees, are included in the “OG&A” line item of the Consolidated Statements of Operations. Rent expense, depreciation and amortization expense and interest expense are shown separately in the Consolidated Statement of Operations.
Consolidated Statements of Cash Flows
For purposes of the Consolidated Statements of Cash Flows, the Company considers all highly liquid debt instruments purchased with an original maturity of three months or less to be temporary cash investments.
Segments
The Company operates supermarkets, multi-department stores and fulfillment centers throughout the United States. The Company’s retail operations, which represent
2. | GOODWILL AND INTANGIBLE ASSETS |
The following table summarizes the changes in the Company’s net goodwill balance through February 3, 2024:
| 2023 |
| 2022 |
| |||
Balance beginning of year | |||||||
Goodwill | $ | | $ | | |||
Accumulated impairment losses |
| ( |
| ( | |||
Subtotal |
| |
| | |||
Activity during the year | |||||||
Impairment charge related to Vitacost.com | | ( | |||||
Balance end of year | |||||||
Goodwill |
| |
| | |||
Accumulated impairment losses |
| ( |
| ( | |||
Total Goodwill | $ | | $ | | |||
Testing for impairment is performed annually, or on an interim basis upon the occurrence of a triggering event or a change in circumstances that would more likely than not reduce the fair value of a reporting unit below its carrying amount. The annual evaluation of goodwill and indefinite-lived intangible assets was performed during the fourth quarter of 2023, 2022 and 2021. The evaluation did not result in impairment in 2023 or 2021. The evaluation resulted in an impairment in 2022.
67
Based on the results of the Company’s impairment assessment in the fourth quarter of 2022, Vitacost.com recorded a $
The following table summarizes the Company’s intangible assets balance through February 3, 2024:
2023 | 2022 |
| |||||||||||
| Gross carrying |
| Accumulated |
| Gross carrying |
| Accumulated |
| |||||
amount | amortization(1) | amount | amortization(1) |
| |||||||||
Definite-lived pharmacy prescription files | $ | | $ | ( | $ | | $ | ( | |||||
Definite-lived customer relationships | | ( | | ( | |||||||||
Definite-lived other |
| |
| ( |
| |
| ( | |||||
Indefinite-lived trade name |
| |
| — |
| |
| — | |||||
Indefinite-lived liquor licenses |
| |
| — |
| |
| — | |||||
Total | $ | | $ | ( | $ | | $ | ( | |||||
| (1) | Pharmacy prescription files are amortized to merchandise costs, customer relationships are amortized to depreciation and amortization expense and other intangibles are amortized to OG&A expense and depreciation and amortization expense. |
Amortization expense associated with intangible assets totaled approximately $
2024 |
| $ | |
2025 |
| | |
2026 |
| | |
2027 |
| | |
2028 |
| | |
Thereafter |
| | |
Total future estimated amortization associated with definite-lived intangible assets | $ | |
3. | PROPERTY, PLANT AND EQUIPMENT, NET |
Property, plant and equipment, net consists of:
| 2023 |
| 2022 |
| |||
Land | $ | | $ | | |||
Buildings and land improvements |
| |
| | |||
Equipment |
| |
| | |||
Leasehold improvements |
| |
| | |||
Construction-in-progress |
| |
| | |||
Leased property under finance leases |
| |
| | |||
Total property, plant and equipment |
| |
| | |||
Accumulated depreciation and amortization |
| ( |
| ( | |||
Property, plant and equipment, net | $ | | $ | | |||
Accumulated depreciation and amortization for leased property under finance leases was $
68
Approximately $
Capitalized implementation costs associated with cloud computing arrangements of $
4. | TAXES BASED ON INCOME |
The provision for taxes based on income consists of:
| 2023 |
| 2022 |
| 2021 |
| ||||
Federal | ||||||||||
Current | $ | | $ | | $ | | ||||
Deferred |
| ( |
| |
| ( | ||||
Subtotal federal |
| |
| |
| | ||||
State and local | ||||||||||
Current |
| |
| |
| | ||||
Deferred |
| ( |
| ( |
| | ||||
Subtotal state and local |
| |
| |
| | ||||
Total | $ | | $ | | $ | | ||||
A reconciliation of the statutory federal rate and the effective rate follows:
| 2023 |
| 2022 |
| 2021 |
| |
Statutory rate |
| | % | | % | | % |
State income taxes, net of federal tax benefit |
| | | | |||
Credits |
| ( | ( | ( | |||
Resolution of tax audit examinations |
| — | ( | ( | |||
Excess tax benefits from share-based payments | ( | ( | ( | ||||
Impairment of goodwill related to Vitacost.com | — | | — | ||||
Non-deductible legal settlements | | — | — | ||||
Non-deductible executive compensation | | | | ||||
Other changes, net |
| | | ( | |||
Effective income tax rate |
| | % | | % | | % |
The 2023 tax rate differed from the federal statutory rate due to the effect of state income taxes and the nondeductible portion of opioid settlement charges, partially offset by the benefit from share-based payments and the utilization of tax credits.
The 2022 tax rate differed from the federal statutory rate due to the effect of state income taxes and non-deductible goodwill impairment charges related to Vitacost.com, partially offset by the benefits from share-based payments and the utilization of tax credits.
The 2021 tax rate differed from the federal statutory rate primarily due to a discrete benefit of $
69
The tax effects of significant temporary differences that comprise tax balances were as follows:
| 2023 |
| 2022 |
| |||
Deferred tax assets: | |||||||
Compensation related costs | $ | | $ | | |||
Lease liabilities |
| |
| | |||
Closed store reserves |
| |
| | |||
Unrealized losses on hedging instruments |
| — |
| | |||
Net operating loss and credit carryforwards |
| |
| | |||
Deferred income | | | |||||
Legal settlements | | — | |||||
Allowance for uncollectible receivables | | | |||||
Other | — |
| | ||||
Subtotal |
| |
| | |||
Valuation allowance |
| ( |
| ( | |||
Total deferred tax assets |
| |
| | |||
Deferred tax liabilities: | |||||||
Depreciation and amortization |
| ( |
| ( | |||
Operating lease assets |
| ( | ( | ||||
Insurance related costs | ( | ( | |||||
Inventory related costs | ( | ( | |||||
Equity investments in excess of tax basis | — | ( | |||||
Other | ( | — | |||||
Total deferred tax liabilities |
| ( |
| ( | |||
Deferred income taxes | $ | ( | $ | ( | |||
As of February 3, 2024, deferred tax assets of $
At February 3, 2024, the Company had state credit carryforwards of $
The Company regularly reviews all deferred tax assets on a tax filer and jurisdictional basis to estimate whether these assets are more likely than not to be realized based on all available evidence. This evidence includes historical taxable income, projected future taxable income, the expected timing of the reversal of existing temporary differences and the implementation of tax planning strategies. Projected future taxable income is based on expected results and assumptions as to the jurisdiction in which the income will be earned. The expected timing of the reversals of existing temporary differences is based on current tax law and the Company’s tax methods of accounting. Unless deferred tax assets are more likely than not to be realized, a valuation allowance is established to reduce the carrying value of the deferred tax asset until such time that realization becomes more likely than not. Increases and decreases in these valuation allowances are included in "Income tax expense" in the Consolidated Statements of Operations. As of February 3, 2024, January 28, 2023, and January 29, 2022, the total valuation allowance was $
70
A reconciliation of the beginning and ending amount of unrecognized tax benefits, including positions effecting only the timing of tax benefits, is as follows:
| 2023 |
| 2022 |
| 2021 |
| ||||
Beginning balance | $ | | $ | | $ | | ||||
Additions based on tax positions related to the current year |
| |
| |
| | ||||
Additions for tax positions of prior years |
| |
| |
| | ||||
Reductions for tax positions of prior years |
| ( |
| ( |
| ( | ||||
Settlements | ( |
| ( |
| — | |||||
Lapse of statute | ( | ( | ( | |||||||
Ending balance | $ | | $ | | $ | | ||||
As of February 3, 2024, January 28, 2023, and January 29, 2022 the amount of unrecognized tax benefits that, if recognized, would affect the effective tax rate was $
To the extent interest and penalties would be assessed by taxing authorities on any underpayment of income tax, such amounts have been accrued and classified as a component of income tax expense. During the years ended February 3, 2024, January 28, 2023, and January 29, 2022, the Company recognized approximately $
As of February 3, 2024, the years ended February 1, 2020 and forward remain open for review for federal income tax purposes.
5. | DEBT OBLIGATIONS |
Long-term debt consists of:
February 3, | January 28, | |||||
| 2024 |
| 2023 | |||
$ | | $ | | |||
Other |
| |
| | ||
Total debt, excluding obligations under finance leases |
| |
| | ||
Less current portion |
| ( |
| ( | ||
Total long-term debt, excluding obligations under finance leases | $ | | $ | | ||
In 2023, the Company repaid $
In 2022, the Company repaid $
71
Additionally in 2021, the Company acquired
On July 6, 2021, the Company entered into an amended and restated credit agreement, which credit agreement was further amended on November 9, 2022 (as so amended, the “Credit Agreement”) providing for a $
Borrowings under the Credit Agreement bear interest, at the Company’s option, at either (i) adjusted Term SOFR plus a market spread, based on the Company’s Public Debt Rating or (ii) the base rate, defined as the highest of (a) the
The Credit Agreement contains a covenant, which, among other things, requires the maintenance of a Leverage Ratio of not greater than (i)
On October 13, 2022, the Company entered into a merger agreement with Albertsons Companies, Inc. (“Albertsons”). For additional information about the Company’s unsecured bridge term loan facility and term loan credit agreement associated with the merger agreement, see Note 16 to the Consolidated Financial Statements.
As of February 3, 2024, and January 28, 2023, the Company had
As of February 3, 2024, the Company had outstanding letters of credit in the amount of $
Most of the Company’s outstanding public debt is subject to early redemption at varying times and premiums, at the option of the Company. In addition, subject to certain conditions, some of the Company’s publicly issued debt is subject to redemption, in whole or in part, at the option of the holder upon the occurrence of a redemption event, upon not less than
72
The aggregate annual maturities and scheduled payments of long-term debt, as of year-end 2023, and for the years subsequent to 2023 are:
2024 |
| $ | |
|
2025 |
| | ||
2026 |
| | ||
2027 |
| | ||
2028 |
| | ||
Thereafter |
| | ||
Total debt | $ | |
6. | DERIVATIVE FINANCIAL INSTRUMENTS |
GAAP requires that derivatives be carried at fair value on the balance sheet and provides for hedge accounting when certain conditions are met. The Company’s derivative financial instruments are recognized on the balance sheet at fair value. Changes in the fair value of derivative instruments designated as “cash flow” hedges, to the extent the hedges are highly effective, are recorded in other comprehensive income, net of tax effects. Ineffective cash flow hedges, if any, are recognized in current period earnings. Other comprehensive income or loss is reclassified into current period earnings when the hedged transaction affects earnings. Changes in the fair value of derivative instruments designated as “fair value” hedges, along with corresponding changes in the fair values of the hedged assets or liabilities, are recorded in current period earnings. Ineffective fair value hedges, if any, are recognized in current period earnings. Changes in fair value of derivative instruments not designated as hedges are recognized in current period earnings and included in “Gain (loss) on investments” in the Company’s Consolidated Statements of Operations.
The Company assesses, both at the inception of the hedge and on an ongoing basis, whether derivatives used as hedging instruments are highly effective in offsetting the changes in the fair value or cash flow of the hedged items. If it is determined that a derivative is not highly effective as a hedge or ceases to be highly effective, the Company discontinues hedge accounting prospectively.
Interest Rate Risk Management
The Company is exposed to market risk from fluctuations in interest rates. The Company manages its exposure to interest rate fluctuations through the use of a commercial paper program, interest rate swaps (fair value hedges) and forward-starting interest rate swaps (cash flow hedges). The Company’s current program relative to interest rate protection contemplates hedging the exposure to changes in the fair value of fixed-rate debt attributable to changes in interest rates. To do this, the Company uses the following guidelines: (i) use average daily outstanding borrowings to determine annual debt amounts subject to interest rate exposure, (ii) limit the average annual amount subject to interest rate reset and the amount of floating rate debt to a combined total amount that represents
The Company reviews compliance with these guidelines annually with the Finance Committee of the Board of Directors. These guidelines may change as the Company’s needs dictate.
Fair Value Interest Rate Swaps
The Company did not have any outstanding interest rate derivatives classified as fair value hedges as of February 3, 2024 and January 28, 2023.
73
Cash Flow Forward-Starting Interest Rate Swaps
As of February 3, 2024 and January 28, 2023, the Company had
A notional amount of $
The remainder of the notional amount of $
The following table summarizes the effect of the Company’s derivative instruments designated as cash flow hedges for 2023, 2022 and 2021:
Year-To-Date |
| ||||||||||||||||||||
Amount of Gain/(Loss) in | Amount of Gain/(Loss) |
| |||||||||||||||||||
AOCI on Derivative | Reclassified from AOCI into Income | Location of Gain/(Loss) |
| ||||||||||||||||||
Derivatives in Cash Flow Hedging Relationships |
| 2023 | 2022 |
| 2021 |
| 2023 | 2022 |
| 2021 |
| Reclassified into Income |
| ||||||||
Forward-Starting Interest Rate Swaps, net of tax(1) | $ | | $ | ( | $ | ( | $ | ( | $ | ( | $ | ( |
| Interest expense | |||||||
(1) | The amounts of Gain/(Loss) reclassified from AOCI into income on derivatives include unamortized proceeds and payments from forward-starting interest rate swaps once classified as cash flow hedges that were terminated prior to the end of 2020. |
For the above cash flow interest rate swaps, the Company has entered into International Swaps and Derivatives Association master netting agreements that permit the net settlement of amounts owed under their respective derivative contracts. Under these master netting agreements, net settlement generally permits the Company or the counterparty to determine the net amount payable for contracts due on the same date and in the same currency for similar types of derivative transactions. These master netting agreements generally also provide for net settlement of all outstanding contracts with a counterparty in the case of an event of default or a termination event.
Collateral is generally not required of the counterparties or of the Company under these master netting agreements. As of February 3, 2024,
74
The effect of the net settlement provisions of these master netting agreements on the Company’s derivative balances upon an event of default or termination event is as follows as of February 3, 2024 and January 28, 2023:
Gross Amounts Not Offset in the |
| ||||||||||||||||||
Net Amount | Balance Sheet |
| |||||||||||||||||
| Gross Amount |
| Gross Amounts Offset |
| Presented in the |
| Financial |
|
|
| |||||||||
February 3, 2024 | Recognized | in the Balance Sheet | Balance Sheet | Instruments | Cash Collateral | Net Amount |
| ||||||||||||
Assets | |||||||||||||||||||
Cash Flow Forward-Starting Interest Rate Swaps | $ | | $ | — | $ | | $ | — | $ | | $ | | |||||||
Liabilities | |||||||||||||||||||
Cash Flow Forward-Starting Interest Rate Swaps | $ | | $ | — | $ | | $ | — | $ | | $ | | |||||||
Gross Amounts Not Offset in the |
| ||||||||||||||||||
Net Amount | Balance Sheet |
| |||||||||||||||||
| Gross Amount |
| Gross Amounts Offset |
| Presented in the |
| Financial |
|
|
| |||||||||
January 28, 2023 | Recognized | in the Balance Sheet | Balance Sheet | Instruments | Cash Collateral | Net Amount |
| ||||||||||||
Liabilities | |||||||||||||||||||
Cash Flow Forward-Starting Interest Rate Swaps | $ | | $ | — | $ | | $ | — | $ | — | $ | | |||||||
7. | FAIR VALUE MEASUREMENTS |
GAAP establishes a fair value hierarchy that prioritizes the inputs used to measure fair value. The three levels of the fair value hierarchy defined in the standards are as follows:
Level 1 - Quoted prices are available in active markets for identical assets or liabilities;
Level 2 - Pricing inputs are other than quoted prices in active markets included in Level 1, which are either directly or indirectly observable;
Level 3 - Unobservable pricing inputs in which little or no market activity exists, therefore requiring an entity to develop its own assumptions about the assumptions that market participants would use in pricing an asset or liability.
75
For items carried at (or adjusted to) fair value in the consolidated financial statements, the following tables summarize the fair value of these instruments at February 3, 2024 and January 28, 2023:
February 3, 2024 Fair Value Measurements Using
| Quoted Prices in |
|
|
| ||||||
Active Markets |
| |||||||||
for Identical | Significant Other |
| ||||||||
Assets | Observable Inputs |
| ||||||||
(Level 1) | (Level 2) | Total |
| |||||||
Marketable Securities | $ | | $ | — | $ | | ||||
Forward-Starting Interest Rate Swaps and Commodity Contracts |
|
| — |
| |
| | |||
Total | $ | | $ | | $ | | ||||
January 28, 2023 Fair Value Measurements Using
| Quoted Prices in |
|
|
| ||||||
Active Markets |
| |||||||||
for Identical | Significant Other |
| ||||||||
Assets | Observable Inputs |
| ||||||||
(Level 1) | (Level 2) | Total |
| |||||||
Marketable Securities | $ | | $ | — | $ | | ||||
Forward-Starting Interest Rate Swaps | — |
| ( |
| ( | |||||
Total | $ | | $ | ( | $ | | ||||
The Company values interest rate hedges using observable forward yield curves. These forward yield curves are classified as Level 2 inputs.
Fair value measurements of non-financial assets and non-financial liabilities are primarily used in the impairment analysis of goodwill, other intangible assets, long-lived assets and in the valuation of store lease exit costs. The Company reviews goodwill and indefinite-lived intangible assets for impairment annually, during the fourth quarter of each fiscal year, and as circumstances indicate the possibility of impairment. See Note 2 for further discussion related to the Company’s carrying value of goodwill. Long-lived assets and store lease exit costs were measured at fair value on a nonrecurring basis using Level 3 inputs as defined in the fair value hierarchy. See Note 1 for further discussion of the Company’s policies for impairments of long-lived assets and valuation of store lease exit costs. In 2023, long-lived assets with a carrying amount of $
Fair Value of Other Financial Instruments
Current and Long-term Debt
The fair value of the Company’s long-term debt, including current maturities, was estimated based on the quoted market prices for the same or similar issues adjusted for illiquidity based on available market evidence. If quoted market prices were not available, the fair value was based upon the net present value of the future cash flow using the forward interest rate yield curve in effect at respective year-ends. At February 3, 2024, the fair value of total debt excluding obligations under finance leases was $
76
Contingent Consideration
As a result of the Home Chef merger in 2018, the Company recognized a contingent liability of $
Cash and Temporary Cash Investments, Store Deposits In-Transit, Receivables, Prepaid and Other Current Assets, Accounts Payable, Accrued Salaries and Wages and Other Current Liabilities
The carrying amounts of these items approximated fair value due to their short-term nature.
Other Assets
The fair value of certain financial instruments, measured using Level 1 inputs, was $
The Company held other equity investments without a readily determinable fair value. These investments are measured initially at cost and remeasured for observable price changes to fair value through net earnings. The value of these investments was $
The following table presents the Company’s remaining other assets as of February 3, 2024 and January 28, 2023:
| February 3, 2024 |
| January 28, 2023 | |||
Other Assets | ||||||
Equity method and other long-term investments | $ | | $ | | ||
Notes receivable |
| |
| | ||
Prepaid deposits under certain contractual arrangements |
| |
| | ||
Implementation costs related to cloud computing arrangements | | | ||||
Forward-starting interest rate swaps | | — | ||||
Funded asset status of pension plans | | | ||||
Other | | | ||||
Total | $ | | $ | | ||
77
8. | ACCUMULATED OTHER COMPREHENSIVE INCOME (LOSS) |
The following table represents the changes in AOCI by component for the years ended February 3, 2024 and January 28, 2023:
Pension and | |||||||||
Cash Flow | Postretirement | ||||||||
Hedging | Defined Benefit | ||||||||
| Activities(1) |
| Plans(1) |
| Total(1) | ||||
Balance at January 29, 2022 | $ | ( | $ | ( | $ | ( | |||
OCI before reclassifications(2) | ( | ( |
| ( | |||||
Amounts reclassified out of AOCI(3) | |
| |
| | ||||
Net current-period OCI | ( |
| ( |
| ( | ||||
Balance at January 28, 2023 | $ | ( | $ | ( | $ | ( | |||
Balance at January 28, 2023 | $ | ( | $ | ( | $ | ( | |||
OCI before reclassifications(2) |
| |
| ( |
| | |||
Amounts reclassified out of AOCI(3) |
| |
| ( |
| ( | |||
Net current-period OCI |
| |
| ( |
| | |||
Balance at February 3, 2024 | $ | | $ | ( | $ | ( | |||
| (1) | All amounts are net of tax. |
| (2) | Net of tax of $( |
| (3) | Net of tax of $ |
The following table represents the items reclassified out of AOCI and the related tax effects for the years ended February 3, 2024, January 28, 2023 and January 29, 2022:
| For the year ended | For the year ended | For the year ended | ||||||||
|
| February 3, 2024 |
| January 28, 2023 |
| January 29, 2022 |
| ||||
Cash flow hedging activity items | |||||||||||
Amortization of gains and losses on cash flow hedging activities(1) | $ | | $ | | $ | | |||||
Tax expense |
| ( |
| ( |
| ( | |||||
Net of tax |
| |
| |
| | |||||
Pension and postretirement defined benefit plan items | |||||||||||
Amortization of amounts included in net periodic pension cost(2) |
| ( |
| |
| | |||||
Tax expense |
|
| |
| ( |
| ( | ||||
Net of tax |
|
| ( |
| |
| | ||||
Total reclassifications, net of tax |
| $ | ( | $ | | $ | | ||||
| (1) | Reclassified from AOCI into interest expense. |
| (2) | Reclassified from AOCI into non-service component of company-sponsored pension plan costs. These components are included in the computation of net periodic pension expense. |
78
9. | LEASES AND LEASE-FINANCED TRANSACTIONS |
The Company leases certain store real estate, warehouses, distribution centers, fulfillment centers, office space and equipment. The Company operates in leased facilities in approximately half of its store locations. generally range from to
The following table provides supplemental balance sheet classification information related to leases:
|
| February 3, |
| January 28, | ||||
Classification | 2024 | 2023 | ||||||
Assets | ||||||||
Operating | Operating lease assets | $ | | $ | | |||
Finance | | | ||||||
Total leased assets | $ | | $ | | ||||
Liabilities | ||||||||
Current | ||||||||
Operating | Current portion of operating lease liabilities | $ | | $ | | |||
Finance | | | ||||||
Noncurrent | ||||||||
Operating | Noncurrent operating lease liabilities | | | |||||
Finance | | | ||||||
Total lease liabilities | $ | | $ | | ||||
| (1) | Finance lease assets are recorded net of accumulated amortization of $ |
The following table provides the components of lease cost:
Year-To-Date | Year-To-Date | |||||||
Lease Cost | Classification |
| February 3, 2024 |
| January 28, 2023 | |||
Operating lease cost(1) | Rent Expense | $ | | $ | | |||
Sublease and other rental income | Rent Expense |
| ( |
| ( | |||
Finance lease cost |
|
| ||||||
Amortization of leased assets | Depreciation and Amortization | | | |||||
Interest on lease liabilities | Interest Expense | | | |||||
Net lease cost | $ | | $ | | ||||
| (1) | Includes short-term leases and variable lease costs, which are immaterial. |
79
Maturities of operating and finance lease liabilities are listed below. Amounts in the table include options to extend lease terms that are reasonably certain of being exercised.
Operating | Finance | ||||||||
Leases | Leases | Total | |||||||
2024 | $ | | $ | | $ | | |||
2025 |
| |
| |
| | |||
2026 |
| |
| |
| | |||
2027 |
| |
| |
| | |||
2028 |
| |
| |
| | |||
Thereafter |
| |
| |
| | |||
Total lease payments | | | $ | | |||||
Less amount representing interest |
| | |||||||
$ | | $ | | ||||||
| (1) | Includes the current portion of $ |
Total future minimum rentals under non-cancellable subleases at February 3, 2024 were $
The following table provides the weighted-average lease term and discount rate for operating and finance leases:
February 3, 2024 | January 28, 2023 | |||||
Weighted-average remaining lease term (years) | ||||||
Operating leases | ||||||
Finance leases | ||||||
Weighted-average discount rate | ||||||
Operating leases | % | % | ||||
Finance leases | % | % | ||||
The following table provides supplemental cash flow information related to leases:
Year-To-Date | Year-To-Date | ||||
February 3, 2024 | January 28, 2023 | ||||
Cash paid for amounts included in the measurement of lease liabilities | |||||
Operating cash flows from operating leases | $ | | $ | | |
Operating cash flows from finance leases | $ | | $ | | |
Financing cash flows from finance leases | $ | | $ | | |
Leased assets obtained in exchange for new operating lease liabilities | $ | | $ | | |
Leased assets obtained in exchange for new finance lease liabilities | $ | | $ | | |
Net gain recognized from sale and leaseback transactions(1) | $ | | $ | | |
Impairment of operating lease assets | $ | | $ | | |
Impairment of finance lease assets | $ | — | $ | | |
| (1) | In 2023, the Company entered into sale leaseback transactions related to |
80
On May 17, 2018, the Company entered into a Partnership Framework Agreement with Ocado International Holdings Limited and Ocado Group plc (“Ocado”), which has since been amended. Under this agreement, Ocado will partner exclusively with the Company in the U.S., enhancing the Company’s digital and robotics capabilities in its distribution networks. In 2023, the Company opened
10. | EARNINGS PER COMMON SHARE |
Net earnings attributable to The Kroger Co. per basic common share equals net earnings attributable to The Kroger Co. less income allocated to participating securities divided by the weighted average number of common shares outstanding. Net earnings attributable to The Kroger Co. per diluted common share equals net earnings attributable to The Kroger Co. less income allocated to participating securities divided by the weighted average number of common shares outstanding, after giving effect to dilutive stock options. The following table provides a reconciliation of net earnings attributable to The Kroger Co. and shares used in calculating net earnings attributable to The Kroger Co. per basic common share to those used in calculating net earnings attributable to The Kroger Co. per diluted common share:
For the year ended | For the year ended | For the year ended |
| ||||||||||||||||||||||
February 3, 2024 | January 28, 2023 | January 29, 2022 |
| ||||||||||||||||||||||
|
|
| Per |
|
|
| Per |
|
|
| Per |
| |||||||||||||
Earnings | Shares | Share | Earnings | Shares | Share | Earnings | Shares | Share |
| ||||||||||||||||
(in millions, except per share amounts) | (Numerator) | (Denominator) | Amount | (Numerator) | (Denominator) | Amount | (Numerator) | (Denominator) | Amount |
| |||||||||||||||
Net earnings attributable to The Kroger Co. per basic common share | $ | |
| | $ | | $ | |
| | $ | | $ | |
| | $ | | |||||||
Dilutive effect of stock options |
| |
| |
| | |||||||||||||||||||
Net earnings attributable to The Kroger Co. per diluted common share | $ | |
| | $ | | $ | |
| | $ | | $ | |
| | $ | | |||||||
The Company had combined undistributed and distributed earnings to participating securities totaling $
The Company had stock options outstanding for approximately
11. | STOCK-BASED COMPENSATION |
The Company recognizes compensation expense for all share-based payments granted. The Company recognizes share-based compensation expense, net of an estimated forfeiture rate, over the requisite service period of the award based on the fair value at the date of the grant.
The Company grants options for common shares (“stock options”) to employees under various plans at an option price equal to the fair market value of the underlying shares on the grant date of the award. The Company accounts for stock options under the fair value recognition provisions. Stock options typically expire
81
In addition to the stock options described above, the Company awards restricted stock to employees and incentive shares to nonemployee directors under various plans. The restrictions on the restricted share awards generally lapse between and
At February 3, 2024, approximately
Equity awards granted are based on the aggregate value of the award on the grant date. This can affect the number of shares granted in a given year as equity awards. Excess tax benefits related to equity awards are recognized in the provision for income taxes. Equity awards may be approved
All awards become immediately exercisable upon certain changes of control of the Company.
Stock Options
Changes in options outstanding under the stock option plans are summarized below:
| Shares |
| Weighted- |
| ||
subject | average |
| ||||
to option | exercise |
| ||||
| (in millions) |
| price |
| ||
Outstanding, year-end 2020 |
| | $ | | ||
Granted |
| | $ | | ||
Exercised |
| ( | $ | | ||
Canceled or Forfeited |
| ( | $ | | ||
Outstanding, year-end 2021 |
| | $ | | ||
Granted |
| | $ | | ||
Exercised |
| ( | $ | | ||
Canceled or Forfeited |
| ( | $ | | ||
Outstanding, year-end 2022 |
| | $ | | ||
Granted |
| | $ | | ||
Exercised |
| ( | $ | | ||
Canceled or Forfeited |
| ( | $ | | ||
Outstanding, year-end 2023 |
| | $ | | ||
A summary of options outstanding, exercisable and expected to vest at February 3, 2024 follows:
Weighted-average | Aggregate |
| |||||||||
remaining | Weighted-average | intrinsic |
| ||||||||
| Number of shares |
| contractual life |
| exercise price | value |
| ||||
| (in millions) |
| (in years) | (in millions) | |||||||
Options Outstanding |
| |
| $ | | $ | | ||||
Options Exercisable |
| |
| $ | | $ | | ||||
Options Expected to Vest |
| |
| $ | | $ | | ||||
82
Restricted stock
Changes in restricted stock outstanding under the restricted stock plans are summarized below:
| Restricted |
|
| |||
shares | Weighted-average |
| ||||
outstanding | grant-date |
| ||||
(in millions) | fair value |
| ||||
Outstanding, year-end 2020 |
| | $ | | ||
Granted |
| | $ | | ||
Lapsed |
| ( | $ | | ||
Canceled or Forfeited |
| ( | $ | | ||
Outstanding, year-end 2021 |
| | $ | | ||
Granted |
| | $ | | ||
Lapsed |
| ( | $ | | ||
Canceled or Forfeited |
| ( | $ | | ||
Outstanding, year-end 2022 |
| | $ | | ||
Granted |
| | $ | | ||
Lapsed |
| ( | $ | | ||
Canceled or Forfeited |
| ( | $ | | ||
Outstanding, year-end 2023 |
| | $ | | ||
The weighted-average grant date fair value of stock options granted during 2023, 2022 and 2021 was $
The following table reflects the weighted-average assumptions used for grants awarded to option holders:
| 2023 |
| 2022 |
| 2021 |
| |
Weighted average expected volatility |
| | % | | % | | % |
Weighted average risk-free interest rate |
| | % | | % | | % |
Expected dividend yield |
| | % | | % | | % |
Expected term (based on historical results) |
| years | years | years |
The weighted-average risk-free interest rate was based on the yield of a treasury note as of the grant date, continuously compounded, which matures at a date that approximates the expected term of the options. The dividend yield was based on our history and expectation of dividend payouts. Expected volatility was determined based upon historical stock volatilities; however, implied volatility was also considered. Expected term was determined based upon historical exercise and cancellation experience.
Total stock compensation recognized in 2023, 2022 and 2021 was $
83
The total intrinsic value of stock options exercised was $
Shares issued as a result of stock option exercises may be newly issued shares or reissued treasury shares. Proceeds received from the exercise of options, and the related tax benefit, may be utilized to repurchase the Company’s common shares under a stock repurchase program adopted by the Company’s Board of Directors. During 2023, the Company repurchased approximately
12. | COMMITMENTS AND CONTINGENCIES |
The Company continuously evaluates contingencies based upon the best available evidence.
The Company believes that allowances for loss have been provided to the extent necessary and that its assessment of contingencies is reasonable. To the extent that resolution of contingencies results in amounts that vary from the Company’s estimates, future earnings will be charged or credited.
The principal contingencies are described below:
Insurance — The Company’s workers’ compensation risks are self-insured in most states. In addition, other workers’ compensation risks and certain levels of insured general liability risks are based on retrospective premium plans, deductible plans and self-insured retention plans. The liability for workers’ compensation risks is accounted for on a present value basis. Actual claim settlements and expenses incident thereto may differ from the provisions for loss. Property risks have been underwritten by a subsidiary and are all reinsured with unrelated insurance companies. Operating divisions and subsidiaries have paid premiums, and the insurance subsidiary has provided loss allowances, based upon actuarially determined estimates.
Litigation — Various claims and lawsuits arising in the normal course of business, including personal injury, contract disputes, employment discrimination, wage and hour and other regulatory claims are pending against the Company. Some of these suits purport or have been determined to be class actions and/or seek substantial damages. Although it is not possible at this time to evaluate the merits of all of these claims and lawsuits, nor their likelihood of success, the Company is of the belief that any resulting liability will not have a material effect on the Company’s financial position, results of operations, or cash flows.
The Company continually evaluates its exposure to loss contingencies arising from pending or threatened litigation and believes it has made provisions where it is reasonably possible to estimate and when an adverse outcome is probable. Nonetheless, assessing and predicting the outcomes of these matters involves substantial uncertainties. Management currently believes that the aggregate range of loss for the Company’s exposure is not material to the Company. It remains possible that despite management’s current belief, material differences in actual outcomes or changes in management’s evaluation or predictions could arise that could have a material adverse effect on the Company’s financial condition, results of operations, or cash flows.
The Company is one of dozens of companies that have been named in various lawsuits alleging that defendants contributed to create a public nuisance through the distribution and dispensing of opioids.
On September 8, 2023, the Company announced that it reached an agreement in principle with plaintiffs to settle the majority of opioid claims that have been or could be brought against Kroger by states in which they operate, subdivisions, and Native American tribes. Along with the execution of certain non-monetary conditions that remain under discussion, the Company has agreed to pay up to $
84
As a result, the Company concluded that the agreement in principle for the settlement of opioid claims was probable, and for which the related loss was reasonably estimable. Accordingly, in 2023, the Company recognized opioid settlement charges of $
The agreement in principle described above includes payments of approximately $
Because of the conditions remaining to satisfy, the Company cannot predict if the agreement will become effective, and whether unfavorable developments may occur. The amount of the actual loss may differ materially from the accrual estimate recorded as of February 3, 2024.
Additionally, in 2023, the Company recorded a charge of $
In 2022, the Company recorded a charge of $
The foregoing settlements are not admissions of wrongdoing or liability by the Company and the Company will continue to vigorously defend against any other claims and lawsuits relating to opioids that the settlements do not resolve.
Assignments — The Company is contingently liable for leases that have been assigned to various third parties in connection with facility closings and dispositions. The Company could be required to satisfy the obligations under the leases if any of the assignees is unable to fulfill its lease obligations. Due to the wide distribution of the Company’s assignments among third parties, and various other remedies available, the Company believes the likelihood that it will be required to assume a material amount of these obligations is remote.
85
13. | STOCK |
Preferred Shares
The Company has authorized
Common Shares
The Company has authorized
Common Stock Repurchase Program
The Company maintains stock repurchase programs that comply with Rule 10b5-1 of the Securities Exchange Act of 1934 to allow for the orderly repurchase of The Kroger Co. common shares, from time to time. The Company made
In addition to these repurchase programs, in December 1999, the Company began a program to repurchase common shares to reduce dilution resulting from its employee stock option plans. This program is solely funded by proceeds from stock option exercises and the related tax benefit. The Company repurchased approximately $
14. | COMPANY- SPONSORED BENEFIT PLANS |
The Company administers non-contributory defined benefit retirement plans for some non-union employees and union-represented employees as determined by the terms and conditions of collective bargaining agreements. These include several qualified pension plans (the “Qualified Plans”) and non-qualified pension plans (the “Non-Qualified Plans”). The Non-Qualified Plans pay benefits to any employee that earns in excess of the maximum allowed for the Qualified Plans by Section 415 of the Internal Revenue Code. The Company only funds obligations under the Qualified Plans. Funding for the company-sponsored pension plans is based on a review of the specific requirements and on evaluation of the assets and liabilities of each plan.
In addition to providing pension benefits, the Company provides certain health care benefits for retired employees. Based on an employee’s age, years of service and position with the Company, the employee may be eligible for retiree health care benefits. Funding of retiree health care benefits occurs as claims or premiums are paid.
The Company recognizes the funded status of its retirement plans on the Consolidated Balance Sheets. Actuarial gains or losses and prior service credits that have not yet been recognized as part of net periodic benefit cost are required to be recorded as a component of AOCI. The Company has elected to measure defined benefit plan assets and obligations as of January 31, which is the month-end that is closest to its fiscal year-ends.
86
Amounts recognized in AOCI as of February 3, 2024 and January 28, 2023 consist of the following (pre-tax):
Pension Benefits | Other Benefits | Total |
| ||||||||||||||||
| 2023 |
| 2022 |
| 2023 |
| 2022 |
| 2023 |
| 2022 |
| |||||||
Net actuarial loss (gain) | $ | | $ | | $ | ( | $ | ( | $ | | $ | | |||||||
Prior service credit |
| — |
| — |
| ( |
| ( |
| ( |
| ( | |||||||
Total | $ | | $ | | $ | ( | $ | ( | $ | | $ | | |||||||
Other changes recognized in other comprehensive income (loss) in 2023, 2022 and 2021 were as follows (pre-tax):
Pension Benefits | Other Benefits | Total |
| |||||||||||||||||||||||||
| 2023 |
| 2022 |
| 2021 |
| 2023 |
| 2022 |
| 2021 |
| 2023 |
| 2022 |
| 2021 |
| ||||||||||
Incurred net actuarial loss (gain) | $ | | $ | | $ | ( | $ | | $ | | $ | | $ | | $ | | $ | ( | ||||||||||
Amortization of prior service credit |
| — |
| — |
| — |
| |
| |
| |
| |
| |
| | ||||||||||
Amortization of net actuarial gain (loss) |
| ( |
| ( |
| ( |
| |
| |
| |
| |
| ( |
| ( | ||||||||||
Total recognized in other comprehensive income (loss) | $ | | $ | | $ | ( | $ | | $ | | $ | | $ | | $ | | $ | ( | ||||||||||
Total recognized in net periodic benefit cost and other comprehensive income (loss) | $ | | $ | | $ | ( | $ | | $ | | $ | | $ | | $ | | $ | ( | ||||||||||
Information with respect to change in benefit obligation, change in plan assets, the funded status of the plans recorded in the Consolidated Balance Sheets, net amounts recognized at the end of fiscal years, weighted-average assumptions and components of net periodic benefit cost follow:
Pension Benefits |
| ||||||||||||||||||
Qualified Plans | Non-Qualified Plans | Other Benefits |
| ||||||||||||||||
| 2023 |
| 2022 |
| 2023 |
| 2022 |
| 2023 |
| 2022 |
| |||||||
Change in benefit obligation: | |||||||||||||||||||
Benefit obligation at beginning of fiscal year | $ | | $ | | $ | | $ | | $ | | $ | | |||||||
Service cost |
| |
| |
| — |
| — |
| |
| | |||||||
Interest cost |
| |
| |
| |
| |
| |
| | |||||||
Plan participants’ contributions |
| |
| |
| — |
| — |
| |
| | |||||||
Actuarial (gain) loss |
| ( |
| ( |
| ( |
| ( |
| — |
| | |||||||
Plan settlements | ( | ( | ( | ( | — | — | |||||||||||||
Benefits paid |
| ( |
| ( |
| ( |
| ( |
| ( |
| ( | |||||||
Other |
| ( |
| ( |
| — |
| — |
| |
| | |||||||
Benefit obligation at end of fiscal year | $ | | $ | | $ | | $ | | $ | | $ | | |||||||
Change in plan assets: | |||||||||||||||||||
Fair value of plan assets at beginning of fiscal year | $ | | $ | | $ | — | $ | — | $ | — | $ | — | |||||||
Actual return on plan assets |
| |
| ( |
| — |
| — |
| — |
| — | |||||||
Employer contributions |
| |
| |
| |
| |
| |
| | |||||||
Plan participants’ contributions |
| |
| |
| — |
| — |
| |
| | |||||||
Plan settlements | ( | ( | ( | ( | — | — | |||||||||||||
Benefits paid |
| ( |
| ( |
| ( |
| ( |
| ( |
| ( | |||||||
Other |
| ( |
| ( |
| — |
| — |
| — |
| — | |||||||
Fair value of plan assets at end of fiscal year | $ | | $ | | $ | — | $ | — | $ | — | $ | — | |||||||
Funded (unfunded) status and net asset and liability recognized at end of fiscal year | $ | | $ | | $ | ( | $ | ( | $ | ( | $ | ( | |||||||
87
As of February 3, 2024, other assets and other current liabilities include $
The following table outlines the weighted average assumptions associated with pension and other benefit costs for 2023, 2022 and 2021:
Pension Benefits | Other Benefits |
| |||||||||||
Weighted average assumptions |
| 2023 |
| 2022 |
| 2021 |
| 2023 |
| 2022 |
| 2021 |
|
Discount rate — Benefit obligation |
| | % | | % | | % | | % | | % | | % |
Discount rate — Net periodic benefit cost |
| | % | | % | | % | | % | | % | | % |
Expected long-term rate of return on plan assets |
| | % | | % | | % | ||||||
Rate of compensation increase — Net periodic benefit cost |
| | % | | % | | % | ||||||
Rate of compensation increase — Benefit obligation |
| | % | | % | | % | ||||||
Cash Balance plan interest crediting rate | | % | | % | | % | |||||||
The Company’s discount rate assumptions were intended to reflect the rates at which the pension benefits could be effectively settled. They take into account the timing and amount of benefits that would be available under the plans. The Company’s policy is to match the plan’s cash flows to that of a hypothetical bond portfolio whose cash flow from coupons and maturities match the plan’s projected benefit cash flows. The discount rates are the single rates that produce the same present value of cash flows. The selection of the
The Company’s assumed pension plan investment return rate was
The Company calculates its expected return on plan assets by using the market-related value of plan assets. The market-related value of plan assets is determined by adjusting the actual fair value of plan assets for gains or losses on plan assets. Gains or losses represent the difference between actual and expected returns on plan investments for each plan year. Gains or losses on plan assets are recognized evenly over a
The pension benefit unfunded status decreased in 2023, compared to 2022, due primarily to an increase in discount rates, which lowered the benefit obligation more than the plan’s lower actual rate of return versus expected rate of return on assets. The Company’s Qualified Plans were fully funded as of February 3, 2024 and January 28, 2023.
88
The following table provides the components of the Company’s net periodic benefit costs for 2023, 2022 and 2021:
Pension Benefits |
| |||||||||||||||||||||||||||
Qualified Plans | Non-Qualified Plans | Other Benefits |
| |||||||||||||||||||||||||
| 2023 |
| 2022 |
| 2021 |
| 2023 |
| 2022 |
| 2021 |
| 2023 |
| 2022 |
| 2021 |
| ||||||||||
Components of net periodic benefit cost: | ||||||||||||||||||||||||||||
Service cost | $ | | $ | | $ | | $ | — | $ | — | $ | — | $ | | $ | | $ | | ||||||||||
Interest cost |
| |
| |
| |
| |
| |
| |
| |
| |
| | ||||||||||
Expected return on plan assets |
| ( |
| ( |
| ( |
| — |
| — |
| — |
| — |
| — |
| — | ||||||||||
Amortization of: |
|
|
| |||||||||||||||||||||||||
Prior service credit |
| — |
| — |
| — |
| — |
| — |
| — |
| ( |
| ( |
| ( | ||||||||||
Actuarial (gain) loss |
| |
| |
| |
| |
| |
| |
| ( |
| ( |
| ( | ||||||||||
Settlement loss recognized | | | | — | — | — | — | — | — | |||||||||||||||||||
Other | — |
| — |
| ( |
| ( |
| — |
| |
| ( |
| — |
| — | |||||||||||
Net periodic benefit cost | $ | ( | $ | ( | $ | | $ | | $ | | $ | | $ | ( | $ | ( | $ | ( | ||||||||||
The following table provides the projected benefit obligation (“PBO”) and the fair value of plan assets for those company-sponsored pension plans with projected benefit obligations in excess of plan assets:
Qualified Plans | Non-Qualified Plans |
| |||||||||||
| 2023 |
| 2022 |
| 2023 |
| 2022 |
| |||||
PBO at end of fiscal year | $ | | $ | | $ | | $ | | |||||
Fair value of plan assets at end of year | $ | | $ | | $ | — | $ | — | |||||
The following table provides the accumulated benefit obligation (“ABO”) and the fair value of plan assets for those company-sponsored pension plans with accumulated benefit obligations in excess of plan assets:
Qualified Plans | Non-Qualified Plans | |||||||||||
| 2023 |
| 2022 |
| 2023 |
| 2022 | |||||
ABO at end of fiscal year | $ | | $ | | $ | | $ | | ||||
Fair value of plan assets at end of year | $ | | $ | | $ | — | $ | — | ||||
The following table provides information about the Company’s estimated future benefit payments:
| Pension |
| Other |
| |||
Benefits | Benefits |
| |||||
2024 | $ | | $ | | |||
2025 | $ | | $ | | |||
2026 | $ | | $ | | |||
2027 | $ | | $ | | |||
2028 | $ | | $ | | |||
2029 —2033 | $ | | $ | | |||
89
The following table provides information about the target and actual pension plan asset allocations as of February 3, 2024:
Actual |
| ||||||
Target allocations | Allocations |
| |||||
| 2023 |
| 2023 |
| 2022 |
| |
Pension plan asset allocation | |||||||
Global equity securities |
| | % | | % | | % |
Investment grade debt securities |
| | | | |||
High yield debt securities |
| | | | |||
Private equity |
| | | | |||
Hedge funds |
| | | | |||
Real estate |
| | | | |||
Other |
| — | — | | |||
Total |
| | % | | % | | % |
Investment objectives, policies and strategies are set by the Retirement Benefit Plan Management Committee (the “Committee”). The primary objectives include holding and investing the assets and distributing benefits to participants and beneficiaries of the pension plans. Investment objectives have been established based on a comprehensive review of the capital markets and each underlying plan’s current and projected financial requirements. The time horizon of the investment objectives is long-term in nature and plan assets are managed on a going-concern basis.
Investment objectives and guidelines specifically applicable to each manager of assets are established and reviewed annually. Derivative instruments may be used for specified purposes, including rebalancing exposures to certain asset classes. Any use of derivative instruments for a purpose or in a manner not specifically authorized is prohibited, unless approved in advance by the Committee.
The target allocations shown for 2023 were established at the beginning of 2023 based on the Company’s liability-driven investment (“LDI”) strategy. An LDI strategy focuses on maintaining a close to fully-funded status over the long-term with minimal funded status risk. This is achieved by investing more of the plan assets in fixed income instruments to more closely match the duration of the plan liability.
The Company did not make any significant contributions to its company-sponsored pension plans in 2023, and the Company is not required to make any contributions to these plans in 2024. If the Company does make any contributions in 2024, the Company expects these contributions will decrease its required contributions in future years. Among other things, investment performance of plan assets, the interest rates required to be used to calculate the pension obligations and future changes in legislation, will determine the amounts of any contributions. The Company expects 2024 net periodic benefit costs for company-sponsored pension plans to be approximately $(
Assumed health care cost trend rates have a significant effect on the amounts reported for the health care plans. The Company used a
90
The following tables, set forth by level within the fair value hierarchy, present the Qualified Plans’ assets at fair value as of February 3, 2024 and January 28, 2023:
Assets at Fair Value as of February 3, 2024
Quoted Prices in | Significant |
| ||||||||||||||
Active Markets for | Significant Other | Unobservable | Assets |
| ||||||||||||
Identical Assets | Observable Inputs | Inputs | Measured |
| ||||||||||||
| (Level 1) |
| (Level 2) |
| (Level 3) |
| at NAV |
| Total |
| ||||||
Cash and cash equivalents | $ | | $ | — | $ | — | $ | — | $ | | ||||||
Corporate Stocks |
| |
| — |
| — |
| — |
| | ||||||
Corporate Bonds |
| — |
| |
| — |
| — |
| | ||||||
U.S. Government Securities |
| — |
| |
| — |
| — |
| | ||||||
Mutual Funds |
| |
| — |
| — |
| — |
| | ||||||
Collective Trusts |
| — |
| — |
| — |
| |
| | ||||||
Hedge Funds |
| — |
| — |
| |
| |
| | ||||||
Private Equity |
| — |
| — |
| — |
| |
| | ||||||
Real Estate |
| — |
| — |
| |
| |
| | ||||||
Other |
| — |
| |
| — |
| — |
| | ||||||
Total | $ | | $ | | $ | | $ | | $ | | ||||||
Assets at Fair Value as of January 28, 2023
Quoted Prices in | Significant |
| ||||||||||||||
Active Markets for | Significant Other | Unobservable | Assets |
| ||||||||||||
Identical Assets | Observable Inputs | Inputs | Measured |
| ||||||||||||
| (Level 1) |
| (Level 2) |
| (Level 3) |
| at NAV |
| Total |
| ||||||
Cash and cash equivalents | $ | | $ | — | $ | — | $ | — | $ | | ||||||
Corporate Stocks |
| |
| — |
| — |
| — |
| | ||||||
Corporate Bonds |
| — |
| |
| — |
| — |
| | ||||||
U.S. Government Securities |
| — |
| |
| — |
| — |
| | ||||||
Mutual Funds |
| |
| — |
| — |
| — |
| | ||||||
Collective Trusts |
| — |
| — |
| — |
| |
| | ||||||
Hedge Funds |
| — |
| — |
| |
| |
| | ||||||
Private Equity |
| — |
| — |
| — |
| |
| | ||||||
Real Estate |
| — |
| — |
| |
| |
| | ||||||
Other |
| — |
| |
| — |
| — |
| | ||||||
Total | $ | | $ | | $ | | $ | | $ | | ||||||
Certain investments that are measured at fair value using the NAV per share (or its equivalent) have not been classified in the fair value hierarchy. The fair value amounts presented for these investments in the preceding tables are intended to permit reconciliation of the fair value hierarchies to the total fair value of plan assets.
91
For measurements using significant unobservable inputs (Level 3) during 2023 and 2022, a reconciliation of the beginning and ending balances is as follows:
| Hedge Funds |
| Real Estate | |||
Ending balance, January 29, 2022 | $ | | $ | | ||
Contributions into Fund |
| — |
| | ||
Realized gains |
| — |
| | ||
Unrealized gains |
| ( |
| ( | ||
Distributions |
| ( |
| ( | ||
Ending balance, January 28, 2023 |
| |
| | ||
Contributions into Fund |
| — |
| | ||
Realized gains |
| |
| — | ||
Unrealized gains |
| |
| ( | ||
Distributions |
| ( |
| ( | ||
Ending balance, February 3, 2024 | $ | | $ | | ||
See Note 7 for a discussion of the levels of the fair value hierarchy. The assets’ fair value measurement level above is based on the lowest level of any input that is significant to the fair value measurement.
The following is a description of the valuation methods used for the Qualified Plans’ assets measured at fair value in the above tables:
| ● | Cash and cash equivalents: The carrying value approximates fair value. |
| ● | Corporate Stocks: The fair values of these securities are based on observable market quotations for identical assets and are valued at the closing price reported on the active market on which the individual securities are traded. |
| ● | Corporate Bonds: The fair values of these securities are primarily based on observable market quotations for similar bonds, valued at the closing price reported on the active market on which the individual securities are traded. When such quoted prices are not available, the bonds are valued using a discounted cash flow approach using current yields on similar instruments of issuers with similar credit ratings, including adjustments for certain risks that may not be observable, such as credit and liquidity risks. |
| ● | U.S. Government Securities: Certain U.S. Government securities are valued at the closing price reported in the active market in which the security is traded. Other U.S. government securities are valued based on yields currently available on comparable securities of issuers with similar credit ratings. When quoted prices are not available for similar securities, the security is valued under a discounted cash flow approach that maximizes observable inputs, such as current yields of similar instruments, but includes adjustments for certain risks that may not be observable, such as credit and liquidity risks. |
| ● | Mutual Funds: The fair values of these securities are based on observable market quotations for identical assets and are valued at the closing price reported on the active market on which the individual securities are traded. |
| ● | Collective Trusts: The collective trust funds are public investment vehicles valued using a Net Asset Value (NAV) provided by the manager of each fund. These assets have been valued using NAV as a practical expedient. |
| ● | Hedge Funds: The Hedge funds classified as Level 3 include investments that are not readily tradeable and have valuations that are not based on readily observable data inputs. The fair value of these assets is estimated based on information provided by the fund managers or the general partners. Therefore, these assets are classified as Level 3. Certain other hedge funds are private investment vehicles valued using a NAV provided by the manager of each fund. These assets have been valued using NAV as a practical expedient. |
92
| ● | Private Equity: Private Equity investments are valued based on the fair value of the underlying securities within the fund, which include investments both traded on an active market and not traded on an active market. For those investments that are traded on an active market, the values are based on the closing price reported on the active market on which those individual securities are traded. For investments not traded on an active market, or for which a quoted price is not publicly available, a variety of unobservable valuation methodologies, including discounted cash flow, market multiple and cost valuation approaches, are employed by the fund manager to value investments. Fair values of all investments are adjusted annually, if necessary, based on audits of the private equity fund financial statements; such adjustments are reflected in the fair value of the plan’s assets. |
| ● | Real Estate: Real estate investments include investments in real estate funds managed by a fund manager. These investments are valued using a variety of unobservable valuation methodologies, including discounted cash flow, market multiple and cost valuation approaches. The valuations for these investments are not based on readily observable inputs and are classified as Level 3 investments. Certain other real estate investments are valued using a NAV provided by the manager of each fund. These assets have been valued using NAV as a practical expedient. |
The methods described above may produce a fair value calculation that may not be indicative of net realizable value or reflective of future fair values. Furthermore, while the Company believes its valuation methods are appropriate and consistent with other market participants, the use of different methodologies or assumptions to determine the fair value of certain financial instruments could result in a different fair value measurement.
The Company contributed and expensed $
15. | MULTI-EMPLOYER PENSION PLANS |
The Company contributes to various multi-employer pension plans based on obligations arising from collective bargaining agreements. These multi-employer pension plans provide retirement benefits to participants based on their service to contributing employers. The benefits are paid from assets held in trust for that purpose. Trustees are appointed in equal number by employers and unions. The trustees typically are responsible for determining the level of benefits to be provided to participants as well as for such matters as the investment of the assets and the administration of the plans.
The Company recognizes expense in connection with these plans as contributions are funded or when commitments are probable and reasonably estimable, in accordance with GAAP. The Company made cash contributions to these plans of $
The Company continues to evaluate and address potential exposure to under-funded multi-employer pension plans as it relates to the Company’s associates who are beneficiaries of these plans. These under-fundings are not a liability of the Company. When an opportunity arises that is economically feasible and beneficial to the Company and its associates, the Company may negotiate the restructuring of under-funded multi-employer pension plan obligations to help stabilize associates’ future benefits and become the fiduciary of the restructured multi-employer pension plan. The commitments from these restructurings do not change the Company’s debt profile as it relates to its credit rating since these off-balance sheet commitments are typically considered in the Company’s investment grade debt rating.
93
The Company is currently designated as the named fiduciary of the United Food and Commercial Workers (“UFCW”) Consolidated Pension Plan and the International Brotherhood of Teamsters (“IBT”) Consolidated Pension Fund and has sole investment authority over these assets. Due to opportunities arising, the Company has restructured certain multi-employer pension plans. The significant effects of these restructuring agreements recorded in our Consolidated Financial Statements are:
| ● | In 2022, the Company incurred a $ |
| ● | In 2021, associates within the Fred Meyer and QFC divisions ratified an agreement for the transfer of liabilities from the Sound Retirement Trust to the UFCW Consolidated Pension Plan. The Company transferred $ |
The risks of participating in multi-employer pension plans are different from the risks of participating in single-employer pension plans in the following respects:
| ● | Assets contributed to the multi-employer plan by one employer may be used to provide benefits to employees of other participating employers. |
| ● | If a participating employer stops contributing to the plan, the unfunded obligations of the plan allocable to such withdrawing employer may be borne by the remaining participating employers. |
| ● | If the Company stops participating in some of its multi-employer pension plans, the Company may be required to pay those plans an amount based on its allocable share of the unfunded vested benefits of the plan, referred to as a withdrawal liability. |
The Company’s participation in multi-employer plans is outlined in the following tables. The EIN / Pension Plan Number column provides the Employer Identification Number (“EIN”) and the three-digit pension plan number. The most recent Pension Protection Act Zone Status available in 2023 and 2022 is for the plan’s year-end at December 31, 2022 and December 31, 2021, respectively. Among other factors, generally, plans in the red zone are less than
94
The following table contains information about the Company’s multi-employer pension plans:
|
|
|
|
|
|
| FIP/RP |
|
|
|
|
|
|
|
|
| ||||
Pension Protection | Status |
| ||||||||||||||||||
EIN / Pension | Act Zone Status | Pending/ | Multi-Employer Contributions | Surcharge |
| |||||||||||||||
Pension Fund | Plan Number | 2023 | 2022 | Implemented | 2023 | 2022 | 2021 | Imposed(5) |
| |||||||||||
SO CA UFCW Unions & Food Employers Joint Pension Trust Fund(1)(2) |
| 95-1939092 - 001 |
| Red |
| Red |
| Implemented | $ | | $ | | $ | |
| No | ||||
Desert States Employers & UFCW Unions Pension Plan(1) |
| 84-6277982 - 001 |
| Green |
| Green |
| No |
| |
| |
| |
| No | ||||
Sound Variable Annuity Pension Trust(1)(3) |
| 86-3278029 - 001 |
| Green |
| Green |
| No |
| |
| |
| |
| No | ||||
Rocky Mountain UFCW Unions and Employers Pension Plan(1) |
| 84-6045986 - 001 |
| Green |
| Green |
| No |
| |
| |
| |
| No | ||||
Oregon Retail Employees Pension Plan(1) |
| 93-6074377 - 001 |
| Green |
| Red |
| Implemented |
| |
| |
| |
| No | ||||
Bakery and Confectionary Union & Industry International Pension Fund(1) |
| 52-6118572 - 001 |
| Red |
| Red |
| Implemented |
| |
| |
| |
| No | ||||
Retail Food Employers & UFCW Local 711 Pension(1) |
| 51-6031512 - 001 |
| Red |
| Red |
| Implemented |
| |
| |
| |
| No | ||||
UFCW International Union — Industry Variable Annuity Pension Plan(4) |
| 51-6055922 - 001 |
| Green |
| Green |
| No |
| |
| |
| |
| No | ||||
Western Conference of Teamsters Pension Plan |
| 91-6145047 - 001 |
| Green |
| Green |
| No |
| |
| |
| |
| No | ||||
Central States, Southeast & Southwest Areas Pension Plan |
| 36-6044243 - 001 |
| Red |
| Red |
| Implemented |
| |
| |
| |
| No | ||||
UFCW Consolidated Pension Plan(1) |
| 58-6101602 – 001 |
| Green |
| Green |
| No |
| |
| |
| |
| No | ||||
IBT Consolidated Pension Plan(1)(6) | 82-2153627 - 001 | N/A | N/A | No | | | | No | ||||||||||||
Other |
| |
| |
| | ||||||||||||||
Total Contributions | $ | | $ | | $ | | ||||||||||||||
| (1) | The Company's multi-employer contributions to these respective funds represent more |
| (2) | The information for this fund was obtained from the Form 5500 filed for the plan's year-end at March 31, 2023 and March 31, 2022. |
| (3) | The 2022 information for this fund was obtained from the Form 5500 filed for the plan’s year-end at September 30, 2021. |
| (4) | The information for this fund was obtained from the Form 5500 filed for the plan's year-end at June 30, 2022 and June 30, 2021. |
| (5) | Under the Pension Protection Act, a surcharge may be imposed when employers make contributions under a collective bargaining agreement that is not in compliance with a rehabilitation plan. As of February 3, 2024, the collective bargaining agreements under which the Company was making contributions were in compliance with rehabilitation plans adopted by the applicable pension fund. |
| (6) | The plan was formed after 2006, and therefore is not subject to zone status certifications. |
95
The following table describes (a) the expiration date of the Company’s collective bargaining agreements and (b) the expiration date of the Company’s most significant collective bargaining agreements for each of the material multi-employer funds in which the Company participates:
Expiration Date |
| ||||||
of Collective | Most Significant Collective |
| |||||
Bargaining | Bargaining Agreements(1) |
| |||||
Pension Fund |
| Agreements |
| Count |
| Expiration |
|
SO CA UFCW Unions & Food Employers Joint Pension Trust Fund |
| June 2024 to March 2025 |
|
| March 2025 | ||
UFCW Consolidated Pension Plan |
| February 2024 to August 2027 |
|
| February 2024 to March 2026 | ||
Desert States Employers & UFCW Unions Pension Plan |
| June 2025 to March 2026 |
|
| March 2026 | ||
Sound Variable Annuity Pension Trust |
| January 2024(2) to April 2026 |
|
| May 2025 | ||
Rocky Mountain UFCW Unions and Employers Pension Plan |
| January 2025 |
|
| January 2025 | ||
Oregon Retail Employees Pension Plan |
| August 2024 to March 2026 |
|
| August 2024 to July 2025 | ||
Bakery and Confectionary Union & Industry International Pension Fund |
| April 2024 to September 2025 |
|
| May 2024 to October 2024 | ||
Retail Food Employers & UFCW Local 711 Pension |
| January 2024(2) to April 2026 |
|
| March 2025 | ||
UFCW International Union — Industry Variable Annuity Pension Plan |
| June 2025 |
|
| June 2025 | ||
Western Conference of Teamsters Pension Plan |
| April 2024 to May 2027 |
|
| April 2024 to September 2025 | ||
IBT Consolidated Pension Plan | September 2024 to September 2027 | September 2024 to September 2027 | |||||
| (1) | This column represents the number of significant collective bargaining agreements and their expiration date for each of the Company’s pension funds listed above. For the purposes of this table, the “significant collective bargaining agreements” are the largest based on covered employees that, when aggregated, cover the majority of the employees for which we make multi-employer contributions for the referenced pension fund. |
| (2) | Certain collective bargaining agreements are operating under an extension. |
Based on the most recent information available to it, the Company believes the present value of actuarial accrued liabilities in most of these multi-employer plans exceeds the value of the assets held in trust to pay benefits. Moreover, if the Company were to exit certain markets or otherwise cease making contributions to these funds, the Company could trigger a withdrawal liability. Any adjustment for withdrawal liability will be recorded when it is probable that a liability exists and it can be reasonably estimated.
The Company also contributes to various other multi-employer benefit plans that provide health and welfare benefits to active and retired participants. Total contributions made by the Company to these other multi-employer health and welfare plans were approximately $
16. | PROPOSED MERGER WITH ALBERTSONS COMPANIES, INC. |
As previously disclosed, on October 13, 2022, the Company entered into a merger agreement with Albertsons Companies, Inc. (“Albertsons”) pursuant to which all of the outstanding shares of Albertsons common and preferred stock (on an as converted basis) automatically will be converted into the right to receive $
The per share cash purchase price of $
In connection with obtaining the requisite regulatory clearance necessary to consummate the transaction, the Company and Albertsons expect to make store divestitures. Subject to the outcome of the divestiture process and as described in the merger agreement, Albertsons was prepared to establish an Albertsons subsidiary (“SpinCo”). SpinCo would be spun-off to Albertsons shareholders immediately prior to the closing of the merger and operate as a standalone public company. As described in more detail below, on September 8, 2023, the Company and Albertsons announced that they entered into a comprehensive divestiture plan with C&S Wholesale Grocers, LLC (“C&S”). As a result of the comprehensive divestiture plan announced with C&S, the Company has exercised its right under the merger agreement to sell what would have been the SpinCo business to C&S. Consequently, the spin-off previously contemplated by the Company and Albertsons is no longer a requirement under the merger agreement and will no longer be pursued by the Company and Albertsons.
96
On September 8, 2023, the Company and Albertsons announced they entered into a definitive agreement with C&S for the sale of
In connection with the merger agreement, on October 13, 2022, the Company entered into a commitment letter with certain lenders pursuant to which the lenders have committed to provide a $
On November 9, 2022, the Company executed a term loan credit agreement with certain lenders pursuant to which the lenders committed to provide, contingent upon the completion of the merger with Albertsons and certain other customary conditions to funding, (1) senior unsecured term loans in an aggregate principal amount of $
In accordance with the terms of the agreement, the parties have extended, and may continue to extend the original outside date of January 13, 2024 from time to time in increments for up to
On February 26, 2024, the Federal Trade Commission (“FTC”) instituted an administrative proceeding to prohibit the merger. Simultaneously, the FTC (joined by
97
17. RECENTLY ISSUED ACCOUNTING STANDARDS
In December 2023, the FASB issued ASU No. 2023-09, "Income Taxes (Topic 740): Improvements to Income Tax Disclosures.” This guidance amends existing income tax disclosure guidance, primarily requiring more detailed disclosure for income taxes paid and the effective tax rate reconciliation. The ASU is effective for annual reporting periods beginning after December 15, 2024, with early adoption permitted and can be applied on either a prospective or retroactive basis. The Company is currently assessing the effect that adoption of this guidance will have on its Consolidated Financial Statements.
In November 2023, the FASB issued ASU No. 2023-07, "Segment Reporting (Topic 280): Improvements to Reportable Segment Disclosures". The amendments improve reportable segment disclosure requirements, primarily through enhanced disclosures about significant segment expenses. The ASU is effective for annual reporting periods beginning after December 15, 2023 and interim periods within fiscal years beginning after December 15, 2024 with early adoption permitted and can be applied on either a prospective or retroactive basis. The Company is currently assessing the effect that adoption of this guidance will have on its Consolidated Financial Statements and segment disclosures.
18. SUBSEQUENT EVENTS
In the first quarter of 2024, the Company fully exited its position in a Level 1 equity investment, receiving proceeds totaling approximately $
On March 18, 2024, the Company announced a definitive agreement for the sale of its Kroger Specialty Pharmacy business, subject to customary closing conditions and any regulatory reviews, to CarelonRx, a subsidiary of Elevance Health, for approximately $
98
ITEM 9. | CHANGES IN AND DISAGREEMENTS WITH ACCOUNTANTS ON ACCOUNTING AND FINANCIAL DISCLOSURE. |
None.
ITEM 9A. | EVALUATION OF DISCLOSURE CONTROLS AND PROCEDURES. |
As of February 3, 2024, our Chief Executive Officer and Interim Chief Financial Officer, together with a disclosure review committee appointed by the Chief Executive Officer, evaluated the Company’s disclosure controls and procedures. Based on that evaluation, our Chief Executive Officer and Interim Chief Financial Officer concluded that the Company’s disclosure controls and procedures were effective as of February 3, 2024.
CHANGES IN INTERNAL CONTROL OVER FINANCIAL REPORTING
The Company is in the process of implementing a broad, multi-year, technology transformation project to modernize mainframe, middleware and legacy systems to achieve better process efficiencies across customer service, merchandising, sourcing, payroll and accounting through the use of various solutions. There have been no material additional implementations of modules during the quarter ended February 3, 2024. As the Company’s technology transformation project continues, the Company continues to emphasize the maintenance of effective internal controls and assessment of the design and operating effectiveness of key control activities throughout development and deployment of each phase and will evaluate as additional phases are deployed.
There were no changes in Kroger’s internal control over financial reporting that materially affected, or were reasonably likely to materially affect, Kroger’s internal control over financial reporting during the quarter ended February 3, 2024.
MANAGEMENT’S REPORT ON INTERNAL CONTROL OVER FINANCIAL REPORTING
Management is responsible for establishing and maintaining adequate internal control over financial reporting for the Company. With the participation of the Chief Executive Officer and the Interim Chief Financial Officer, our management conducted an evaluation of the effectiveness of our internal control over financial reporting based on the framework and criteria established in Internal Control — Integrated Framework (2013), issued by the Committee of Sponsoring Organizations of the Treadway Commission. Based on the evaluation, management has concluded that the Company’s internal control over financial reporting was effective as of February 3, 2024.
The effectiveness of the Company’s internal control over financial reporting as of February 3, 2024, has been audited by PricewaterhouseCoopers LLP, an independent registered public accounting firm, as stated in their report, which can be found in Item 8 of this Form 10-K.
ITEM 9B. | OTHER INFORMATION. |
In the fourth quarter of 2023,
ITEM 9C. DISCLOSURE REGARDING FOREIGN JURISDICTIONS THAT PREVENT INSPECTIONS.
Not applicable.
99
PART III
ITEM 10. | DIRECTORS, EXECUTIVE OFFICERS AND CORPORATE GOVERNANCE. |
Our board of directors has adopted The Kroger Co. Policy on Business Ethics, applicable to all officers, employees and directors, including Kroger’s principal executive, financial and accounting officers. The Policy on Business Ethics is available on our website at ir.kroger.com under Investors – Governance – Policy on Business Ethics. A copy of the Code of Ethics is available in print free of charge to any shareholder who requests a copy. Shareholders may make a written request to Kroger’s Secretary at our executive offices at 1014 Vine Street, Cincinnati, Ohio 45202. We intend to satisfy the disclosure requirement regarding any amendment to, or a waiver from, a provision of the Policy on Business Ethics for our principal executive officer, principal financial officer, principal accounting officer or controller, or persons performing similar functions, by posting such information on our website.
The information required by this Item 10 with respect to executive officers is included within Item 1 in Part I of this Annual Report on Form 10-K under the caption “Information about our Executive Officers.” The information required by this Item not otherwise set forth in Part I above or in this Item 10 of Part III is set forth under the headings Election of Directors, Information Concerning the Board of Directors- Committees of the Board, Information Concerning the Board of Directors- Audit Committee and Delinquent 16(a) Reports, if required, in the definitive proxy statement to be filed by the Company with the Securities and Exchange Commission within 120 days after the end of the fiscal year 2023 (the “2024 proxy statement”) and is hereby incorporated by reference into this Form 10-K.
ITEM 11. | EXECUTIVE COMPENSATION. |
The information required by this Item is set forth in the sections entitled Compensation Discussion and Analysis, Compensation Committee Report, and Compensation Tables in the 2024 proxy statement and is hereby incorporated by reference into this Form 10-K.
ITEM 12. | SECURITY OWNERSHIP OF CERTAIN BENEFICIAL OWNERS AND MANAGEMENT AND RELATED STOCKHOLDER MATTERS. |
The following table provides information regarding shares outstanding and available for issuance under our existing equity compensation plans:
Equity Compensation Plan Information
| (a) |
| (b) |
| (c) |
| ||
Number of securities |
| |||||||
remaining available for future |
| |||||||
Number of securities to | Weighted-average | issuance under equity |
| |||||
be issued upon exercise | exercise price of | compensation plans |
| |||||
of outstanding options, | outstanding options, | (excluding securities |
| |||||
Plan Category | warrants and rights(1) | warrants and rights(1) | reflected in column (a)) |
| ||||
Equity compensation plans approved by security holders |
| 18,264,812 | $ | 33.11 |
| 39,807,196 | ||
Equity compensation plans not approved by security holders |
| — | $ | — |
| — | ||
Total |
| 18,264,812 | $ | 33.11 |
| 39,807,196 | ||
| (1) | The total number of securities reported includes the maximum number of common shares, 2,847,266, that may be issued under performance units granted under our long-term incentive plans. The nature of the awards is more particularly described in the Compensation Discussion and Analysis section of the definitive 2024 proxy statement and is hereby incorporated by reference into this Form 10-K. The weighted-average exercise price in column (b) does not take these performance unit awards into account. |
The remainder of the information required by this Item is set forth in the section entitled Beneficial Ownership of Common Stock in the 2024 proxy statement and is hereby incorporated by reference into this Form 10-K.
100
ITEM 13. | CERTAIN RELATIONSHIPS AND RELATED TRANSACTIONS, AND DIRECTOR INDEPENDENCE. |
The information required by this Item is set forth in the sections entitled Related Person Transactions and Information Concerning the Board of Directors-Independence in the 2024 proxy statement and is hereby incorporated by reference into this Form 10-K.
ITEM 14. | PRINCIPAL ACCOUNTING FEES AND SERVICES. |
The information required by this Item is set forth in the section entitled Ratification of the Appointment of Kroger’s Independent Auditor in the 2024 proxy statement and is hereby incorporated by reference into this Form 10-K.
101
PART IV
ITEM 15. | EXHIBITS, FINANCIAL STATEMENT SCHEDULES. |
(a)1.† |
| Financial Statements: |
Report of Independent Registered Public Accounting Firm (PCAOB ID | ||
Consolidated Balance Sheets as of February 3, 2024 and January 28, 2023 | ||
Consolidated Statements of Operations for the years ended February 3, 2024, January 28, 2023 and January 29, 2022 | ||
Consolidated Statements of Comprehensive Income for the years ended February 3, 2024, January 28, 2023 and January 29, 2022 Consolidated Statements of Cash Flows for the years ended February 3, 2024, January 28, 2023 and January 29, 2022 | ||
Consolidated Statement of Changes in Shareholders’ Equity for the years ended February 3, 2024, January 28, 2023 and January 29, 2022 | ||
Notes to Consolidated Financial Statements | ||
(a)2. | Financial Statement Schedules: | |
There are no Financial Statement Schedules included with this filing for the reason that they are not applicable or are not required or the information is included in the financial statements or notes thereto. | ||
(a)3.(b) | Exhibits | |
2.1 | ||
3.1 | ||
3.2 | ||
4.1 | Instruments defining the rights of holders of long-term debt of the Company and its subsidiaries are not filed as Exhibits because the amount of debt under each instrument is less than 10% of the consolidated assets of the Company. The Company undertakes to file these instruments with the SEC upon request. | |
4.2 | ||
10.1* | ||
10.2* | ||
10.3* | ||
10.4* | ||
10.5* | ||
10.6 |
102
10.7 | ||
10.8 | ||
10.9 | ||
10.10 | ||
10.11* | ||
10.12* | ||
10.13* | ||
10.14* | ||
10.15* | ||
10.16* | ||
10.17* | ||
21.1 | ||
23.1 | ||
24.1 | ||
31.1 | ||
31.2 | ||
32.1 | ||
97 | The Kroger Co. Policy on Incentive Based Compensation Recovery | |
101.INS | XBRL Instance Document - the instance document does not appear in the Interactive Data File because its XBRL tags are embedded within the Inline XBRL document. | |
101.SCH | XBRL Taxonomy Extension Schema Document. | |
101.CAL | XBRL Taxonomy Extension Calculation Linkbase Document. |
103
101.DEF | XBRL Taxonomy Extension Definition Linkbase Document. | |
101.LAB | XBRL Taxonomy Extension Label Linkbase Document. | |
101.PRE | XBRL Taxonomy Extension Presentation Linkbase Document. | |
104 | Cover Page Interactive Data File - The cover page interactive data file does not appear in the Interactive Data File because its XBRL tags are embedded within the Inline XBRL document. |
* | Management contract or compensatory plan or arrangement. |
† | Filed herewith. |
ITEM 16. | FORM 10-K SUMMARY. |
Not Applicable.
104
SIGNATURES
Pursuant to the requirements of Section 13 or 15(d) of the Securities Exchange Act of 1934, the Company has duly caused this report to be signed on its behalf by the undersigned, thereunto duly authorized.
THE KROGER CO. | |
Dated: April 2, 2024 | /s/ W. Rodney McMullen |
W. Rodney McMullen | |
Chairman of the Board and Chief Executive Officer | |
(principal executive officer) |
Pursuant to the requirements of the Securities Exchange Act of 1934, this report has been signed below by the following persons on behalf of the Company and in the capacities indicated on the 2nd of April 2024.
/s/ Todd A. Foley | Senior Vice President and Interim Chief Financial Officer | |
Todd A. Foley | (principal financial officer) | |
/s/ Brian W. Nichols |
| Vice President, Corporate Controller and Assistant Treasurer |
Brian W. Nichols | (principal accounting officer) | |
* |
| Director |
Nora A. Aufreiter | ||
* | Director | |
Kevin M. Brown | ||
* | Director | |
Elaine L. Chao | ||
* | Director | |
Anne Gates | ||
* | Director | |
Karen M. Hoguet | ||
* | Chairman of the Board and Chief Executive Officer | |
W. Rodney McMullen | ||
* | Director | |
Clyde R. Moore | ||
* | Director | |
Ronald L. Sargent | ||
* | Director | |
J. Amanda Sourry Knox | ||
* | Director | |
Mark S. Sutton | ||
* | Director | |
Ashok Vemuri | ||
*By: | /s/ Christine S. Wheatley | ||
Christine S. Wheatley | |||
Attorney-in-fact | |||
105