Table of Contents
REGISTRATION STATEMENT PURSUANT TO SECTION 12(b) OR 12(g) OF THE SECURITIES EXCHANGE ACT OF 1934 |
ANNUAL REPORT PURSUANT TO SECTION 13 OR 15(d) OF THE SECURITIES EXCHANGE ACT OF 1934 |
TRANSITION REPORT PURSUANT TO SECTION 13 OR 15(d) OF THE SECURITIES EXCHANGE ACT OF 1934 |
SHELL COMPANY REPORT PURSUANT TO SECTION 13 OR 15(d) OF THE SECURITIES EXCHANGE ACT OF 1934 |
Not applicable |
||
(Translation of Registrant’s name into English) |
(Jurisdiction of incorporation or organization) |
Title of each class |
Trading Symbol(s) |
Name of exchange on which registered | ||
| Large accelerated filer | ☐ | ☒ | ||||
Non-accelerated filer |
☐ | Emerging growth company | ||||
| † | The term “new or revised financial accounting standard” refers to any update issued by the Financial Accounting Standards Board to its Accounting Standards Codification after April 5, 2012. |
| U.S. GAAP | ☐ | Other | ☐ |
Table of Contents
TABLE OF CONTENTS
i
Table of Contents
ii
Table of Contents
Conventions That Apply to This Annual Report on Form 20-F
In this annual report on Form 20-F, unless otherwise designated, the terms “we” “us” “our,” “Lanvin Group,” “the Company” and “our Company” refer to Fosun Fashion Group (Cayman) Limited (“FFG”) and its consolidated subsidiaries, prior to the consummation of the Business Combination and to Lanvin Group Holdings Limited (“LGHL”) and its consolidated subsidiaries following the Business Combination, as the context requires. The term “PCAC” refers to Primavera Capital Acquisition Corporation prior to the consummation of the Business Combination.
Unless we indicate otherwise, references in this annual report to:
“Amended Articles” means the amended and restated memorandum and articles of association of the Company.
“Assignment, Assumption and Amendment Agreement” means certain amendment and restatement of the Existing Warrant Agreement, dated March 23, 2022, by and among PCAC, LGHL, and Continental Stock Transfer & Trust Company.
“Business Combination” or “Transactions” means the Mergers and the other transactions contemplated by the Business Combination Agreement.
“Business Combination Agreement” means the Business Combination Agreement, dated as of March 23, 2022 and as amended October 17, 2022, October 20, 2022, October 28, 2022 and December 2, 2022, by and among PCAC, FFG, LGHL, Lanvin Group Heritage I Limited (“Merger Sub 1”) and Lanvin Group Heritage II Limited (“Merger Sub 2”).
“Cayman Companies Act” means the Companies Act (As Revised) of the Cayman Islands as the same may be amended from time to time.
“China” and the “PRC” means the People’s Republic of China, including the Hong Kong Special Administrative Region and the Macao Special Administrative Region (unless the context otherwise requires) but excluding, for the purposes of this annual report only, Taiwan.
“Convertible Preference Share” means the convertible preference share, par value $0.000001 per share, of the Company, which is convertible into an aggregate number of up to 15,000,000 non-voting ordinary shares and/or Ordinary Shares (subject to adjustment as a result of any share subdivision or consolidation of the shares of LGHL) at the election of Meritz upon the occurrence of certain events. On December 14, 2023, pursuant to the Meritz SBSA (as defined below), the Company repurchased from Meritz one Convertible Preference Share.
“Existing Warrant Agreement” means certain warrant agreement, dated January 21, 2021, by and between PCAC and Continental Stock Transfer & Trust Company.
“Exchange Act” means the Securities Exchange Act of 1934, as amended.
“FFG Collateral Share” means the preferred collateral share, par value EUR0.0001 per share, of FFG purchased by Meritz pursuant to the Meritz Private Placement Subscription Agreement, dated October 16, 2022, entered into by and among FFG, LGHL and Meritz, pursuant to which Meritz agreed to, among other things, subscribe for, and FFG agreed to issue to Meritz 18,569,282 ordinary shares of FFG at a subscription price of $49,999,999 and the FFG Collateral Share at a subscription price of $1, which agreement terminated upon the closing of our Business Combination. The FFG Collateral Share was automatically canceled in exchange for the right to receive one Convertible Preference Share at the Second Merger Effective Time, which means the time when the plan of Second Merger has been registered by the Registrar of Companies of the Cayman Islands or at such later time as may be agreed by FFG and PCAC in writing and specified in the plan of Second Merger (being not later than the 90th day after registration by the Registrar of Companies of the Cayman Islands).
“Fosun Group” means Fosun International and its affiliates.
“Fosun International” or “Fosun” means Fosun International Limited, a company incorporated in Hong Kong with limited liability.
1
Table of Contents
“founder shares” or “PCAC Class B ordinary shares” means Class B ordinary shares of PCAC, par value US$0.0001 per share initially purchased by Primavera Capital Acquisition LLC, or the Sponsor, in a private placement prior to PCAC’s initial public offering.
“Initial Merger Effective Time” means the time when the plan of Initial Merger has been registered by the Registrar of Companies of the Cayman Islands or at such later time as may be agreed by FFG and PCAC in writing and specified in the plan of Initial Merger (being not later than the 90th day after registration by the Registrar of Companies of the Cayman Islands).
“Investor Rights Agreement” means the investor rights agreement in substantially the form attached as an exhibit to the Business Combination Agreement.
“IRS” means the Internal Revenue Service of the United States.
“Mergers” means each of: (i) the merger of PCAC with and into Merger Sub 1, with Merger Sub 1 surviving such merger (the “Initial Merger”); (ii) the merger of Merger Sub 2 with and into FFG, with FFG surviving such merger (FFG is referred to for the periods from and after the Second Merger Effective Time as the “Surviving Company”) (the “Second Merger”); and (iii) the subsequent merger of Merger Sub 1 as the surviving company of the Initial Merger with and into the Surviving Company as the surviving company of the Second Merger, with the Surviving Company surviving such merger (the “Third Merger”). Pursuant to the Mergers, prior unitholders, shareholders and warrant holders of PCAC and FFG received securities of LGHL, and the surviving company became a wholly owned subsidiary of LGHL.
“Meritz” means Meritz Securities Co., Ltd, a Korean incorporated investment fund.
“Amended and Restated Meritz Relationship Agreement” means the relationship agreement, as amended and restated on December 1, 2023, entered into between LGHL and Meritz and setting forth certain rights and obligations of LGHL and Meritz as the holder of Ordinary Shares, which modified the previous relationship agreement dated October 19, 2022.
“Meritz SBSA” means the share buyback and subscription agreement, dated December 1, 2023, pursuant to which Meritz sold and surrendered, and the Company repurchased from Meritz one convertible preference share of the Company and 4,999,999 Ordinary Shares for a price equal to US$54,473,260, and immediately thereafter, Meritz agreed to subscribe for, and the Company issued 19,050,381 Ordinary Shares to Meritz at a total subscription price equal to US$69,473,260.
“Ordinary Shares” means ordinary shares, par value $0.000001 per share, of the Company.
“Private Placement Warrants” means the 11,280,000 warrants originally issued by LGHL on a private placement basis, each exercisable for one Ordinary Share at an exercise price of $11.50 per share, which are substantially identical to Public Warrants, subject to certain limited exceptions.
“Public Warrants” means the 20,699,969 warrants issued by LGHL as part of the Business Combination and listed on NYSE, each of which is exercisable for one Ordinary Share at an exercise price of $11.50 per share, in accordance with its terms.
“SEC” means the United States Securities and Exchange Commission.
2
Table of Contents
“Securities Act” means the Securities Act of 1933, as amended.
“Warrants” means Public Warrants and Private Placement Warrants.
“$,” “USD” and “U. S. dollar” each means the currency in dollars of the United States of America. “U. S.” means the United States of America.
“€,” “EUR” and “Euro” each means the currency introduced at the start of the third stage of European Economic and Monetary Union pursuant to the Treaty on the Functioning of the European Union, as amended.
This annual report includes our audited consolidated financial statements for the years ended December 31, 2021, 2022 and 2023.
Our ordinary shares and warrants are listed on the New York Stock Exchange under the ticker symbols “LANV” and “LANV-WT,” respectively.
3
Table of Contents
FORWARD-LOOKING INFORMATION
This annual report on Form 20-F contains forward-looking statements. Forward-looking statements include all statements that are not historical statements of fact and statements regarding, but not limited to, our expectations, hopes, beliefs, intention or strategies of regarding the future. You can identify these statements by forward-looking words such as “may,” “expect,” “predict,” “potential,” “anticipate,” “contemplate,” “believe,” “estimate,” “intend,” “plan,” “future” “outlook,” “project,” “will” “would” and “continue” or similar words. You should read statements that contain these words carefully because they:
| • | discuss future expectations; |
| • | contain projections of future results of operations or financial condition; or |
| • | state other “forward-looking” information. |
We believe it is important to communicate our expectations to our security holders. However, there may be events in the future that we are not able to predict accurately or over which we have no control. The risk factors and cautionary language discussed in this annual report on Form 20-F provide examples of risks, uncertainties and events that may cause actual results to differ materially from the expectations described by us in such forward-looking statements, including among other things:
| • | changes adversely affecting the business in which we are engaged; |
| • | our projected financial information, anticipated growth rate, profitability and market opportunity may not be an indication of our actual results or our future results; |
| • | management of growth; |
| • | the impact of health epidemics, pandemics and similar outbreaks, including the COVID-19 pandemic on our business; |
| • | our ability to safeguard the value, recognition and reputation of our brands and to identify and respond to new and changing customer preferences; |
| • | the ability and desire of consumers to shop; |
| • | our ability to successfully implement our business strategies and plans; |
| • | our ability to effectively manage our advertising and marketing expenses and achieve desired impact; |
| • | our ability to accurately forecast consumer demand; |
| • | high levels of competition in the personal luxury products market; |
| • | disruptions to our distribution facilities or our distribution partners; |
| • | our ability to negotiate, maintain or renew our license agreements; |
| • | our ability to protect our intellectual property rights; |
| • | our ability to attract and retain qualified employees and preserve craftmanship skills; |
| • | our ability to develop and maintain effective internal controls; |
| • | general economic conditions; |
| • | the result of future financing efforts; and |
4
Table of Contents
| • | other factors discussed elsewhere in this annual report on Form 20-F, including the section entitled “Risk Factors.” |
You are cautioned not to place undue reliance on these forward-looking statements, which speak only as of the date of this annual report on Form 20-F.
The foregoing factors should not be construed as exhaustive and should be read together with the other cautionary statements included in this annual report on Form 20-F. All forward-looking statements included herein are expressly qualified in their entirety by the cautionary statements contained or referred to in this section as well as any other cautionary statements contained herein. Except to the extent required by applicable laws and regulations, we undertake no obligations to update these forward-looking statements to reflect events or circumstances after the date of this annual report on Form 20-F or to reflect the occurrence of unanticipated events. In light of these risks and uncertainties, you should keep in mind that any event described in a forward-looking statement made in this annual report on Form 20-F or elsewhere might not occur.
5
Table of Contents
PART I
| ITEM 1. | IDENTITY OF DIRECTORS, SENIOR MANAGEMENT AND ADVISERS |
Not required.
| ITEM 2. | OFFER STATISTICS AND EXPECTED TIMETABLE |
Not required.
| ITEM 3. | KEY INFORMATION |
We are a Cayman Islands holding company, and our operations are conducted by our subsidiaries organized in various jurisdictions, including China.
PRC Permissions and Approvals
We conduct a portion (approximately 12.5% of our revenues in 2023) of our operations in the Greater China region, and as of the date of this annual report, we have obtained all requisite permissions and approvals that are material to our operations in China. However, there can be no assurance that we will be able to maintain such permissions and approvals in the future. In addition, laws and regulations in China may change quickly with little advance notice, and the Chinese government may intervene or influence our operations in China at any time. As a result, we may be required to obtain additional permissions and approvals in the future. There can be no assurance that such permissions and approvals can be obtained in a timely manner, or at all, and our business, results of operations and financial condition could be materially and adversely affected.
Under the PRC laws, rules and regulations currently in effect, no prior permission or approval from PRC government authority is required for the transactions completed pursuant to the Business Combination Agreement, including but not limited to the listing of our securities on the NYSE. However, the Chinese government has recently indicated that it may exert more control over offerings conducted overseas and foreign investment in China-based issuers. In particular, on February 17, 2023, the China Securities Regulatory Commission, or the CSRC, released the Trial Administrative Measures of Overseas Securities Offering and Listing by Domestic Companies, or the Trial Measures, which came into effect on March 31, 2023. The Trial Measures will apply to overseas securities offerings and/or listings conducted by (i) companies incorporated in the PRC, or PRC domestic companies, directly and (ii) companies incorporated overseas with operations primarily in the PRC and valued on the basis of interests in PRC domestic companies, or indirect offerings. An equity or equity linked securities offering by an overseas company will be deemed an indirect offering if (i) more than 50% of such overseas company’s consolidated revenues, profit, total assets or net assets that are derived from its audited consolidated financial statements for the most recently completed fiscal year are attributable to PRC domestic companies, and (ii) any of the following three circumstances applies: key components of its operations are carried out in the PRC; its principal places of business are located in the PRC; or the majority of the senior management members in charge of operation and management are PRC citizens or residents.
The Trial Measures requires filings with the CSRC within three business days after the submission of an initial public offering or listing application overseas, or three business days after the completion of a follow-on offering in the same overseas market. If a company that should have been subject to the Trial Measures (i) has completed overseas offering and listing prior to the effectiveness of the Trial Measures; or (ii) (a) has its registration statement declared effective by the SEC prior to the effectiveness of the Trial Measures, and (b) while it is not necessary to fulfill any other regulatory procedures requested by the overseas regulators or overseas stock exchanges, will further complete its overseas offering and listing by September 30, 2023, such company is not required to file for such offering immediately, but should file as required if it is involved in follow-on offerings and other matters that require filing.
Our PRC subsidiaries accounted for less than 50% of our consolidated revenues, profit, total assets and net assets in 2021, 2022 and 2023. However, the interpretation, application and enforcement of the Trial Measures are still evolving and it remains uncertain whether the requirements under the Trial Measures are applicable to a securities offering by us.
6
Table of Contents
On December 28, 2021, the Cyberspace Administration of China, together with certain other government authorities, promulgated the Revised Cybersecurity Review Measures that took effect from February 15, 2022, pursuant to which online platform operators holding over one million users’ information must apply for a cybersecurity review before listing abroad, and operators of “critical information infrastructure” that intend to purchase internet products and services that will or may affect national security must apply for a cybersecurity review. Furthermore, the competent government authorities may also initiate a cybersecurity review against the relevant operators where the authorities believe that the network product or service or data processing activities affect or may affect national security. However, the scope of potential operators of “critical information infrastructure” remains unclear. In addition, the scope of network product or service or data processing activities that will or may affect national security is also unclear and subject to regulatory interpretation. As of the date of this annual report (i) we had not been informed by any PRC governmental authority of any requirement to apply for a cybersecurity review; (ii) we did not hold or process personal information of over one million users; and (iii) we had not received any investigation, notice, warning, or sanctions from applicable government authorities in relation to national security. Nonetheless, the interpretation and implementation of the Revised Cybersecurity Review Measures is subject to uncertainties, and the relevant laws and regulations may also change in the future.
As a result of such regulatory development, government authorities in China could conduct a cybersecurity review over our PRC subsidiaries, which may have a material adverse effect on our business, results of operations and financial condition. See “—D. Risk Factors—Risks Relating to Our Business and Industry—If we were to become subject to the oversight, discretion or control of PRC government authorities over overseas offerings of securities and/or foreign investments, it may result in a material adverse change in our operations, significantly limit or completely hinder our ability to offer or continue to offer securities to investors and cause the value of our securities to significantly decline, which would materially affect the interests of the investors.”
We are an offshore holding company and have operations in the PRC conducted by our PRC subsidiaries. We may make loans to our PRC subsidiaries subject to the approval from or registration with the governmental authorities and other limitations in the future. These include foreign exchange loan registrations and maximum statutory limit of the loan amount (which is either the difference between the registered capital and the total investment amount of the concerned company or the upper limit calculated based on the formula prescribed in the prevailing regulations). There can be no assurance that such permissions and approvals can be obtained in a timely manner, or at all, and our business, results of operations and financial condition could be materially and adversely affected.
Permissions and Approvals on Transfer and Repatriation of Cash within Our Group
We transfer cash to our subsidiaries through capital injections and shareholder loans. Subject to the cash needs of the subsidiaries, shareholders’ loans as granted may be capitalized (as equity) or repaid.
Cash in the subsidiaries may also be repatriated to us via dividend distribution. Nevertheless, no cash repatriation by way of distribution/dividends was made to us prior to our Business Combination or to LGHL as of the date of this annual report.
Our principal subsidiaries, being our portfolio brands, are based mainly in the U.S. (Delaware) and Europe including Italy, France and Austria. We are subject to certain restrictions or limitations regarding distribution of earnings from the portfolio brands to us, which may in turn limit the cash available to make distributions to our shareholders. For our operating subsidiaries that are Delaware corporations, to which the Delaware General Corporation Law (DGCL) applies, the power and authority to declare dividends/distributions resides with the board of directors of the corporation. Further, the DGCL permits distributions out of either a surplus or net profits (subject to certain limitations). In addition, specific provisions under credit agreements or the relevant subsidiary’s bylaws may impose specific restrictions or approval requirements regarding dividend payment (including a contingent obligation or otherwise). For our Italian subsidiaries, no distribution may be made unless a reserve fund accumulated from net profits reach at least 20% of the relevant subsidiary’s share capital. Our subsidiaries in Italy also face other general restrictions to the shareholders’ right to an earnings distribution. In Austria, our subsidiaries cannot issue a dividend unless the validly adopted financial statements for a financial year show a balance sheet profit, which represents the maximum amount of capital available for the distribution of profits. Loans by us to our subsidiaries in Austria are considered equity substitution if we are in a crisis, and will only be repaid if we are fully restructured.
7
Table of Contents
For our portfolio brands, the cash needs of the brands’ subsidiaries are provided as necessary in the form of shareholder loans or capital injections from us or the relevant parent brand entity. Payments from local subsidiaries to their parent brands are typically for purchase of inventories from the parent brand, and generally do not face any foreign exchange or capital control limitations. However, dividends and loan repayments may face similar restrictions as mentioned above.
Dividends repatriated or paid from our Chinese subsidiaries must be made from retained earnings as per such subsidiary’s financial statements prepared in accordance with Chinese accounting rules. Additionally, each of our Chinese subsidiaries must set aside a statutory reserve fund of at least 50% of its registered capital before it may pay dividends, and a 10% withholding tax or other reduced rate withholding tax under the China-Hong Kong treaty may be applied to the dividends repatriated from our Chinese subsidiaries. Also, approval from or registration with appropriate Chinese government authorities is required where RMB is to be converted into foreign currency and remitted outside of China to pay capital expenses such as the repayment of loans denominated in foreign currencies. However, we do not expect Chinese subsidiaries to declare any dividends or pay capital expenses to our portfolio brands in the near future.
We made capital injections of EUR50.0 million in 2021, EUR50.0 million in 2022 and EUR27.0 million in 2023 into Lanvin brand portfolio through Arpège SAS, as well as EUR7.9 million in Raffaele Caruso S.p.A. in 2021. We also made an advance payment of EUR1.0million in Raffaele Caruso S.p.A in 2023. Caruso also received a shareholder loan of EUR2.5 million, EUR5.5 million and EUR1.0 million from us in 2021, 2022 and 2023, respectively. We have waived part of the repayment of shareholder loan by Caruso. In 2023, we paid EUR11.78 million for the subscription of Wolford shares. In addition, Wolford AG received shareholder loans of EUR10.0 million, EUR22.5 million, and EUR10.8 million from us in 2021, 2022 and 2023, respectively. In 2021, 2022 and 2023, we issued shareholder loans of $35.8 million, $25.5 million and $12.5 million, respectively, to St. John. After we acquired Sergio Rossi in 2021, Sergio Rossi S.p.A received capital injections of EUR5.0 million, EUR13.0 million and EUR11.0 million in 2021, 2022 and 2023, respectively. In 2023, Sergio Rossi S.p.A received a shareholder loan of EUR3.5million from us. We have also made capital injections and intercompany loans totaling RMB1.1 million, $3.7 million and $2.5 million to our Chinese subsidiaries in 2021, 2022 and 2023, respectively.
Other than the loan repayment of $1.0 million by St. John to us in August 2023, none of our direct subsidiaries made any dividends, distributions, or repayments to us in 2021, 2022 and 2023. We have also not made any transfers, dividends, or distributions to our shareholders as of the date of this annual report other than the cash dividend of $1.0 million and $1.0 million paid to Meritz in 2022 and 2023, respectively. On March 30, 2023, Jeanne Lanvin S.A. (“JLSA”) as the borrower, LGHL as the guarantor and Meritz as the lender entered into a facility agreement, pursuant to which Meritz made available to JLSA a facility in the sum of JPY3,714.4 million (the “Facility”). In 2023, a total of JPY502.3 million under the Facility was repaid to Meritz, including both principal and interest. See “Item 5. Operating and Financial Review and Prospects—B. Liquidity and Capital Resources—Meritz Private Placement” and “Item 7. Major Shareholders and Other Related Party Transactions—B. Related Party Transactions—Other Related Party Transactions—Shareholder Loans.”
The Holding Foreign Companies Accountable Act
We may be subject to the risk of trading prohibitions under the Holding Foreign Companies Accountable Act, or the HFCA Act. Our independent auditor, Grant Thornton Zhitong Certified Public Accountants LLP, is an independent registered accounting firm based in mainland China. Pursuant to the HFCA Act and related regulations, if we have filed an audit report issued by a registered public accounting firm that the PCAOB has determined is unable to inspect and investigate completely for two consecutive years, the SEC will prohibit our securities from being traded on a national securities exchange or in the over-the-counter trading market in the United States. In August 2022, the PCAOB signed a Statement of Protocol with the relevant PRC authorities governing inspections and investigations of audit firms based in China, pursuant to which the PCAOB determined that it was able to secure complete access to inspect and investigate PCAOB-registered public accounting firms headquartered in mainland China or Hong Kong in December 2022 and vacated its December 16, 2021 determinations to the contrary. However, there can be no assurance that the PCAOB will continue to have such access. Should PRC authorities fail to facilitate the PCAOB’s access in the future, the PCAOB may consider the need to issue a new determination, which may affect our ability to maintain the listing of our securities on the U.S. national securities exchanges, including the NYSE, and the trading of them in the over-the-counter trading market. A delisting would substantially impair your ability to sell or purchase our securities when you wish to do so, and the risk and uncertainty associated with a potential delisting would have a negative impact on the price of our securities. For details, see “—D. Risk Factors Risks Related to Our Securities—Our ability to maintain the listing of our securities on the NYSE may be dependent on the PCAOB’s continued access to inspect our independent auditors.”
8
Table of Contents
| A. | [Reserved] |
| B. | Capitalization and Indebtedness |
Not required.
| C. | Reasons for the Offer and Use of Proceeds |
Not required.
| D. | Risk Factors |
Summary of Risk Factors
Investing in our securities involves significant risks. You should carefully consider all of the information in this annual report before making an investment in our securities. Below please find a summary of the principal risks we face, organized under relevant headings:
Risks Relating to Our Business and Industry
| • | We have incurred significant losses in the past and anticipate that we will continue to incur losses for the current year and upcoming future years. |
| • | The re-branding to Lanvin Group is being challenged by the minority shareholders of Arpège SAS. Arpège SAS, one of our subsidiaries, holds our Lanvin brand portfolio including the “Lanvin” brand name. We cannot predict the outcome of such challenge and may have to discontinue the use by us, at the group holding company level, of the Lanvin brand name. |
| • | The success of our luxury fashion businesses depends on the value of our brands and, if the value of any of those brands were to diminish, our business could be adversely affected. |
| • | We face risks related to health epidemics, pandemics and similar outbreaks, such as the COVID-19 pandemic, which has had and may continue to have a material adverse impact on our business, financial condition and results of operations. |
| • | The long-term growth of our business depends on the successful execution of our strategic initiatives and we may not be able to continue to develop and grow our businesses. |
| • | Our growth depends, in part, on our continued retail expansion, and we may not be successful in undertaking such expansion. |
| • | Our business is heavily dependent on the ability and desire of consumers to shop. |
| • | Our inability to effectively execute our e-commerce strategy could materially adversely affect the reputation of our brands and our revenue and our operating results may be harmed. |
| • | We utilize a range of marketing, advertising, and other initiatives to increase existing customers’ spending and to acquire new customers; if the costs of advertising or marketing increase, or if our initiatives fail to achieve their desired impact, we may be unable to grow the business profitably. |
| • | Failure to accurately forecast consumer demand could lead to excess inventories or inventory shortages, which could result in decreased operating margins, reduced cash flows, and harm to our business. |
9
Table of Contents
| • | Counterfeit or ”knock-off” products, as well as products that are “inspired by” our brands may siphon off demand for our brands’ products and may result in customer confusion, harm to our brands, a loss of our market share and/or a decrease in our results of operations. |
| • | We are dependent on suppliers for our products and raw materials, which poses risks to our business operations. |
| • | We face intense competition in the personal luxury goods industry. |
| • | Our customer relationships and sales have been and may be negatively impacted if we do not anticipate and respond to consumer preferences and fashion trends or manage inventory levels appropriately. |
| • | We are subject to certain risks related to the sale of our products through our direct-to-consumer (“DTC”) channel and in particular our directly operated stores. |
| • | A data security or privacy breach could damage our reputation and our relationships with our customers or employees, expose us to litigation risk, and adversely affect our business. |
| • | We are exposed to the risk that personal information of our customers, employees and other parties collected in the course of our operations may be damaged, lost, stolen, divulged or processed for unauthorized purposes. |
| • | Future economic conditions, including volatility in the financial and credit markets, may adversely affect our business. |
| • | Significant inflation could adversely affect our results of operations and financial condition. |
| • | We are dependent on a limited number of distribution facilities operated by us as well as those of our distribution partners. If one or more of our distribution facilities or those of our distribution partners experience operational difficulties or becomes inoperable, it could have a material adverse effect on our business, results of operations and financial condition. |
| • | Our revenues and operating results are affected by the seasonal nature of our business and cyclical trends in consumer spending. |
| • | If our suppliers, licensees, or other business partners, or the suppliers used by our licensees fail to use legal and ethical business practices, our business could suffer. |
| • | Our potential inability to find suitable new targets to drive inorganic business growth and the risk that any acquisitions we do complete may not be successful in achieving intended benefits, cost savings and synergies. |
| • | We could be adversely affected if we are unable to negotiate, maintain or renew our license agreements. |
| • | If our trademarks and intellectual property or other proprietary rights are not adequately protected to prevent use or appropriation by third parties, the value of our brand and other intangible assets may be diminished, and our business may be adversely affected. |
| • | We are subject to certain laws, litigation, regulatory matters and ethical standards, and compliance or our failure to comply with or adequately address developments as they arise could adversely affect our reputation and operations. |
| • | We are subject to legal and regulatory risk. |
| • | Changes to taxation or the interpretation or application of tax laws could have an adverse impact on our results of operations and financial condition. |
| • | We are subject to risks associated with climate change and other environmental impacts and increased focus by stakeholders on environment, social and governance (“ESG”) matters. |
10
Table of Contents
| • | We may lose key employees or may be unable to hire qualified employees. |
| • | We depend on highly specialized craftsmanship and skills. |
| • | We are exposed to fluctuations in currency exchange rates. |
| • | We are subject to risks related to the complexity and uncertainty in interpretation of transfer pricing rules. |
| • | We operate in many countries around the world and, accordingly, we are exposed to various international business, regulatory, social and political risks. |
| • | Changes in global economic, political or social conditions or government policies could have a material adverse effect on our business and operations. |
| • | There are uncertainties regarding the interpretation and enforcement of PRC laws, rules and regulations, and changes in laws, rules and regulations in China could adversely affect us. |
| • | If we were to become subject to the oversight, discretion or control of PRC government authorities over overseas offerings of securities and/or foreign investments, it may result in a material adverse change in our operations, significantly limit or completely hinder our ability to offer or continue to offer securities to investors and cause the value of our securities to significantly decline, which would materially affect the interests of the investors. |
| • | Changes in tax laws, regulations and policies in jurisdictions in which we operate may materially and adversely affect our results of operations and financial condition. |
| • | Because of the costs and difficulties inherent in managing cross-border business operations, our results of operations may be negatively impacted. |
| • | The conflict in Ukraine and sanctions and export controls imposed in response to the conflict, including on Russia and Belarus, may adversely affect our business and other escalating global trade tensions, wars and conflicts, and the adoption or expansion of economic sanctions, export controls, or other trade restrictions could negatively affect us. |
| • | Adverse developments affecting the financial services industry, such as actual events or concerns involving liquidity, defaults or non-performance by financial institutions or transactional counterparties, could adversely affect our business operations, results of operations and financial condition. |
| • | We rely to a significant extent on dividends and other distributions on equity paid by our principal operating subsidiaries to fund offshore cash and financing requirements. Any limitation on the ability of our operating subsidiaries to make payments to us could have a material adverse effect on our ability to conduct our business. |
| • | We expect to incur negative operating cash flows in the next few years and may need to raise substantial additional funding. If we are unable to raise capital or obtain sufficient funding from our shareholders when needed or on attractive terms, we would be forced to delay, scale back or discontinue some of our businesses, operations, investments, acquisitions or other growth initiatives. |
| • | Failure to comply with the terms of our indebtedness could have a material adverse effect on our ability to conduct our business. |
Risks Relating to Our Securities
| • | The trading price of our securities has been and is likely to continue to be volatile, which could result in substantial losses to holders of our securities. |
| • | Sales of a substantial number of our securities in the public market by our existing securityholders could cause the price of our Ordinary Shares and Warrants to fall. |
11
Table of Contents
| • | A certain number of our Warrants will become exercisable for our Ordinary Shares, which would increase the number of shares eligible for future resale in the public market and result in dilution to our shareholders. |
| • | If securities or industry analysts do not publish research, publish inaccurate or unfavorable research or cease publishing research about us, our share price and trading volume could decline significantly. |
| • | Future resales of our Ordinary Shares issued to Fosun and its affiliates may cause the market price of our securities to drop significantly, even if our business is doing well. |
| • | The Existing Warrant Agreement designates the courts of the State of New York or the United States District Court for the Southern District of New York as the sole and exclusive forum for certain types of actions and proceedings that may be initiated by Warrant holders, which could limit the ability of Warrant holders to obtain a favorable judicial forum for disputes with us in connection with such Warrants. |
| • | The requirements of being a public company may strain our resources, divert our management’s attention and affect our ability to attract and retain qualified board members. |
| • | Our ability to maintain the listing of our securities on the NYSE may be dependent on the PCAOB’s continued access to inspect our independent auditors. |
| • | We qualify as a foreign private issuer within the meaning of the rules under the Exchange Act, and as such we are exempt from certain provisions applicable to United States domestic public companies and will follow certain home-country corporate governance practices in lieu of certain NYSE requirements applicable to U.S. issuers. |
| • | As a company incorporated in the Cayman Islands, we are permitted to adopt certain home country practices in relation to corporate governance matters that differ significantly from NYSE corporate governance listing standards applicable to domestic U.S. companies; these practices may afford less protection to shareholders than they would enjoy if we complied fully with NYSE corporate governance listing standards. |
| • | You may face difficulties in protecting your interests, and your ability to protect your rights through U.S. courts may be limited, because we are incorporated under the laws of the Cayman Islands, we conduct substantially all of our operations, and a majority of our directors and executive officers reside, outside of the United States. The ability of U.S. authorities to bring actions for violations of U.S. securities laws and regulations against us and our directors and executive officers may be limited, and accordingly you may not be afforded the same protection as provided to investors in U.S. domestic companies. |
| • | We may be subject to securities litigation, which is expensive and could divert management attention. |
| • | We may not pay cash dividends in the foreseeable future. |
| • | The exercise price of our Warrants can fluctuate under certain circumstances which, if triggered, can potentially result in material dilution of our then existing shareholders. |
| • | Certain rights granted to Meritz in the Amended and Restated Meritz Relationship Agreement could limit the funds available to us or potentially result in dilution of our then existing shareholders. |
| • | We have identified material weaknesses in our internal control over financial reporting. If we are unable to remediate these material weaknesses or otherwise fail to maintain an effective system of disclosure controls and internal control over financial reporting, our ability to produce timely and accurate financial statements or comply with applicable regulations could be impaired. |
| • | We qualify as an “emerging growth company” within the meaning of the Securities Act, and as we intend to take advantage of certain exemptions from disclosure requirements available to emerging growth companies, it could make our securities less attractive to investors and may make it more difficult to compare our performance to the performance of other public companies. |
12
Table of Contents
| • | We are a “controlled company” within the meaning of NYSE listing rules and, as a result, can rely on exemptions from certain corporate governance requirements that provide protection to shareholders of other companies. |
| • | Fosun, being our controlling shareholder, has substantial influence over us and Fosun’s interests may not be aligned with the interests of our other shareholders, and Fosun losing control of us may materially and adversely impact us and our Securities. |
| • | We have granted in the past, and we will also grant in the future, share incentives and economic beneficiary rights scheme, which may result in increased share-based compensation expenses. |
| • | We may be or become a passive foreign investment company (“PFIC”), which could result in adverse U.S. federal income tax consequences to shareholders who are U.S. persons. |
| • | We may be subject to U.S. foreign investment regulations which may limit certain investors’ ability to purchase our securities. Our existing and future investments in U.S. companies may also be subject to U.S. foreign investment regulations. |
Risks Relating to Our Business and Industry
We have incurred significant losses in the past and anticipate that we will continue to incur losses for the current year and upcoming future years.
We have incurred significant losses in the past and anticipate that we will continue to incur losses in the current year and upcoming years. We incurred losses of €76.5 million, €239.8 million and €146.3 million in the years ended December 31, 2021, 2022 and 2023, respectively. We cannot assure you that we will be able to generate profit in the future. We will need to generate and sustain increased revenue levels in future periods to achieve profitability, and even if we achieve profitability, we may not be able to maintain or increase our level of profitability. Our efforts to grow our business may be more costly than we expect or may not result in the returns we anticipate, and we may not be able to increase our revenue enough to offset our higher operating expenses. As a result, there can be no assurance that we will achieve profitability, and we may continue to experience loss in the future.
The re-branding to Lanvin Group is being challenged by the minority shareholders of Arpège SAS. Arpège SAS, one of our subsidiaries, holds our Lanvin brand portfolio including the “Lanvin” brand name. We cannot predict the outcome of such challenge and may have to discontinue the use by us, at the group holding company level, of the Lanvin brand name.
In 2018, we acquired a controlling stake in Arpège SAS and its subsidiary Jeanne Lanvin SA, which in turn owns the brand “Lanvin”. The shareholders’ agreement entered into by and between FIH and certain minority shareholders of Arpège SAS (as subsequently acceded to by FFG Lily (Luxembourg) S.à.r.1 and then by FFG Lucky SAS, the “Lanvin SHA”) provides that certain matters require an affirmative vote of each member of the board of Arpège SAS representing minority shareholders, including the entry into any related party transactions. The minority shareholders currently own, in the aggregate, 4.73% of the equity securities in Arpège SAS.
In October 2021, after rounds of discussion and negotiation with the minority shareholders, we proposed to the members of the board of Arpège SAS representing minority shareholders that an authorization letter permitting the rest of the Lanvin Group to use the “Lanvin” name and brand as part of an international re-branding of Fosun Fashion Group be approved by the board of Arpège SAS. The re-branding was worldwide and well received by our investors and the press. At that time the minority shareholders did not object to the use of the “Lanvin” corporate name and merely suggested some changes to the terms of the authorization letter. We believed such terms were generally reasonable and would be quickly resolved in an amicable fashion. In March through May 2022, the parties continued discussions and negotiations in what appeared to us to be in an amicable and reasonable fashion. In September 2022, we received a letter (the “Minority Shareholder Letter of September 2022”) from one of the minority shareholders (the “Alleging Shareholder”) alleging that we had improperly used the “Lanvin” corporate name in connection with our re-branding initiative and that they had not given formal approval pursuant to the terms of the Lanvin SHA prior to our re-branding. The Alleging Shareholder had also stated in the same letter that other minority shareholders also object to our use of the “Lanvin” name in connection with our re-branding initiative.
13
Table of Contents
We have sought preliminary legal advice and believe we have strong legal defense to such allegations. No formal legal proceedings have been brought by the minority shareholders to date. Any such proceedings or claims can have an adverse impact on us because of defense and settlement costs, diversion of resources and other factors, and there can be no assurance that we will prevail in any legal proceeding that may be brought by the minority shareholders or that we will be able to settle these allegations on a timely basis or on terms that are acceptable to us, or at all. Accordingly, we might have to cease our use, at the group holding company level, of the “Lanvin” brand name, and change to another name (or revert to our previous name as Fosun Fashion Group) should we not prevail or settle these allegations. However, we do not expect that, even if we do not prevail or settle these allegations, the continued use of the Lanvin name by Arpège SAS and its subsidiaries, which constitute our Lanvin brand portfolio, will be affected.
The success of our luxury fashion businesses depends on the value of our brands and, if the value of any of those brands were to diminish, our business could be adversely affected.
Our success depends on our brands and their value. The brand names such as Lanvin, Wolford and Sergio Rossi are integral to the existing businesses, as well as to our strategies for continuing to grow and expand the business. Our sales and our ability to achieve premium pricing depend on the perception, recognition and reputation of our brands, which, in turn, depend on factors such as product design, the distinctive character and the quality of our products and customer service, the image of our stores and those of our wholesale customers, the success of our advertising and communication activities and our general corporate profile.
The recognition, integrity and reputation of our brands are among our most valuable assets, which are influenced by several factors, some of which are outside of our control. Our brands’ values could diminish significantly due to a number of factors, including changing consumer attitudes regarding social issues and consumer perception that we have acted in an irresponsible manner. Negative claims or publicity regarding our brands or products, including licensed products, especially through social media, and increase the potential scope of negative publicity, could adversely affect the reputation of the brands and sales even if the subject of such publicity is unverified or inaccurate. Other factors that may adversely affect our brands’ image include our inability to respond adequately to the needs and expectations of our customers with regard to the quality, style and design of our products, the dissemination by third parties of information that is untrue or defamatory, the commencement of litigation proceedings against us, as well as factors attributable to the parallel distribution and counterfeiting of our products. Each of these factors could harm the recognition, integrity and reputation of our brands, causing us to lose existing customers or fail to attract new customers, or otherwise having a material adverse effect on our business, results of operations and financial condition.
Our reputation may also suffer as a result of the fact that we are dependent on our suppliers. While we closely monitor our suppliers to ensure that they comply with all applicable laws and regulations by, among other things, reviewing any published violations and media reports relating to actual or alleged violations, as well as conducting internal due diligence, there can be no assurance that these measures will always be effective. If suppliers fail to comply with applicable law, including but not limited to those relating to labor, social security, health and safety, or if they deliver products that are defective or differ from our specifications or quality standards or do not comply with applicable law, this could have adverse effects on our production cycle and/or product quality and cause delays in product deliveries to our customers. Any of the foregoing in turn could damage our reputation, with possible adverse effects on our business, results of operations and financial condition.
We face risks related to health epidemics, pandemics and similar outbreaks, such as the COVID-19 pandemic, which has had and may continue to have a material adverse impact on our business, financial condition and results of operations.
Our business has been and may continue to be materially and adversely affected by health epidemics, pandemics and similar outbreaks, such as the COVID-19 pandemic. For example, as a result of the COVID-19 pandemic, governments and authorities across the world implemented restrictive measures to prevent the spread of the virus. These restrictive measures impacted our operations in a number of respects, including cancelations of or capacity restrictions on certain marketing and brand events and limitations on in-person meetings among our sales teams. In addition, the inability or unwillingness of customers to travel had a significant impact on sales driven by tourism. Restrictive measures in certain regions also resulted in store closures which prevented consumers from purchasing goods directly from stores. In places where our retail stores were open, they generally operated on reduced hours and at reduced occupancy levels and were subject to closure due to health protocols or more limited governmental orders during the COVID-19 pandemic. The impact of the COVID-19 pandemic on some of our wholesale customers resulted in them closing some of their stores. The COVID-19 pandemic also impacted our supply chain partners, including third-party manufacturers, logistics providers and other vendors, as well as the supply chains of our wholesale customers, retail stores and licensees, due to factory closures, labor shortages, imposed restrictions on travel and import/export delays. At the same time, the reduced mobility of customers as a result of the pandemic reduced customers desire to shop and incur spending on personal luxury goods.
14
Table of Contents
Store closures, reduced store hours and occupancy levels, travel restrictions and concerns about the health risks of traveling during the COVID-19 pandemic adversely affected traffic in our stores and our wholesale customers’ stores. Consumer spending behavior was and may continue to be negatively impacted by job losses and reduced incomes, changing needs due to remote working, reduced in-person social interaction, vacation time spent at home and other factors. This can be exemplified by the impact on the formalwear segment of each of our brands, as not going to the office means fewer men are wearing dress shirts and ties and by the impact on our shoe business, as women are wearing and purchasing fewer high heeled shoes for the same reasons. All these factors have and may continue to negatively impact our direct sales to consumers and our sales to our wholesale customers, due to lower sales of our products, and those of our licensees, through their sales channels.
In addition, if sales, which are more difficult to predict due to the uncertainties surrounding the pandemic, exceed or fall below our expectations, we may experience a shortage of products required to meet demand or excess inventory levels, respectively. Inventory levels in excess of consumer demand may result in inventory write-downs and the sale of excess inventory at discounted prices, which could have a material adverse effect on the reputation of our brands and our profitability.
The long-term growth of our business depends on the successful execution of our strategic initiatives and we may not be able to continue to develop and grow our businesses.
A significant portion of our business strategy involves growing our current brands, notwithstanding our intention to invest in new business lines and their development. Our achievement of revenue and profitability growth from these brands will depend largely upon our ability to:
| • | continue to maintain and enhance the distinctive brand identities of the brands; and |
| • | continue to strengthen and expand the brands’ businesses. |
As part of our long-term strategy, we intend to grow our market share and revenue through the following:
| • | unleashing brand heritage and refreshing brand images to connect with today’s consumers; |
| • | optimizing product category mixes within our current brands; |
| • | expanding our channels and footprint across the world; |
| • | reinforcing global digital strategies and customer experiences |
| • | harnessing the strength of our global platform to develop our brands; |
| • | leveraging our unique strategic alliances to drive synergies and sustainable growth; and |
| • | identifying new strategic investments that complement our luxury fashion ecosystem. |
We cannot guarantee that we will be able to successfully execute on these strategic initiatives. For example, we may not be able to successfully increase brand engagement due to the impact of the COVID-19 pandemic and/or unsuccessful marketing campaigns, we may not be able to optimize the customer experience if we are unable to react quickly enough to customer needs and/or complains and our investments in technology may not succeed if we are unable to implement certain digitalization efforts or new technologies and systems do not work as expected. If we are unable to execute on our strategic initiatives, including for reasons due to the challenges we face as a result of the COVID-19 pandemic, our business, results of operations and financial condition could be materially adversely affected.
15
Table of Contents
Further, we believe that our success is largely dependent on the images of our brands and ability to anticipate and respond promptly to changing consumer demands and fashion trends in the design, styling, production, merchandising and pricing of products. If we do not correctly gauge consumer needs and fashion trends and respond appropriately, consumers may not purchase our products and our brand names and the images of our brands may be impaired. Even if we react appropriately to changes in fashion trends and consumer preferences, consumers may consider our brands to be outdated or associate our brands with styles that are no longer popular or trend-setting. Any of these outcomes could have a material adverse effect on our brands, business, results of operations and financial condition.
We cannot assure you that we can successfully execute any of these actions or our growth strategy for our businesses, nor can we assure you that the launch of any additional product lines or businesses by us or that the continued offering of existing lines will achieve the degree of consistent success necessary to generate profits or positive cash flow. Our ability to carry out our growth strategy successfully may be affected by, among other things, our ability to enhance our relationships with existing customers, our ability to attract retail customers to our direct-to-consumer or DTC channels, our ability to develop new relationships with retailers, economic and competitive conditions, changes in consumer spending patterns and changes in consumer tastes and style trends. If we fail to continue to develop and grow the brands’ businesses, our financial condition and results of operations may be materially adversely affected.
Our growth depends, in part, on our continued retail expansion, and we may not be successful in undertaking such expansion.
We believe that our future growth depends not only on serving existing customers, but also on continuing to get new customers and expanding our distribution base internationally, including but not limited to opening of new retail stores. When expanding into new locations and markets, we may face challenges that are different from those we currently encounter, including competitive, merchandising, distribution, hiring, legal and regulatory, and other difficulties. Although we continue to evaluate sales and marketing efforts and other strategies to expand our supplier, customer and distribution bases, there is no assurance that we will be successful. If we are not successful, this could have a material adverse effect on our business, financial condition and results of operations.
Our business is heavily dependent on the ability and desire of consumers to shop.
Reduced consumer traffic and purchasing, whether in our own retail stores or in the stores of our wholesale customers, could have a material adverse effect on our financial condition, results of operations and cash flows. Reductions could result from economic conditions, fuel shortages, increased fuel prices and other circumstances, including adverse weather conditions, natural disasters, war, terrorist attacks or the perceived threat of war or terrorist attacks. Disease epidemics and other health-related concerns, also could result in (and, in the case of the COVID-19 pandemic, resulted in) closed stores, reduced consumer traffic and purchasing (including international tourist traffic and spending), as consumers become ill or limit or cease shopping in order to avoid exposure, or governments impose mandatory business closures, travel restrictions or the like to prevent the spread of disease. Additionally, political or civil unrest and demonstrations also could affect consumer traffic and purchasing.
For example, the COVID-19 pandemic affected our business operations, financial position, and cash flows. This included cancellations or capacity restrictions on marketing events, limitations on sales team meetings, and reduced tourism affecting sales. Store closures in some regions hindered direct consumer purchases. Despite these challenges, we are gradually recovering from the pandemic’s effects. Consumers were also affected, resulting in additional adverse impacts on us. Consumers were unable to purchase our products due to the unwillingness to shop in stores out of fear of exposure. Store closures, reduced store hours and occupancy levels, travel restrictions and concerns about the health risks of traveling adversely affected traffic in our stores and our wholesale customers’ stores. Consumer spending behavior was also and may continue to be negatively impacted by job losses and reduced incomes, changing needs due to remote working, reduced in-person social interaction, vacation time spent at home and other factors. In addition to the factors discussed above, international tourism was also reduced, and negatively affected sales from international tourists at our retail stores or the stores of our wholesale customers.
16
Table of Contents
Other factors that could affect the success of our stores include:
| • | the location of the store or mall, including the location of a particular store within the mall; |
| • | the other tenants occupying space at the mall; |
| • | increased competition in areas where the stores are located; |
| • | the amount of advertising and promotional dollars spent on attracting consumers to the store or mall; |
| • | the changing patterns of consumer shopping behavior; |
| • | increased competition from online retailers; and |
| • | the diversion of sales from our retail stores to our digital commerce sites. |
Our inability to effectively execute our e-commerce strategy could materially adversely affect the reputation of our brands and our revenue and our operating results may be harmed.
E-commerce is the one of the fastest growing areas of our business both with respect to our direct-to-consumer businesses and the wholesale business (i.e., sales to pure play and e-commerce businesses of traditional retailers). The success of our e-commerce businesses depends, in part, on third parties and factors over which we have limited control, including changing consumer preferences and buying trends relating to e-commerce usage and promotional or other advertising initiatives employed by our wholesale customers or other third parties on their e-commerce sites. Any failure on our part, or on the part of our third party digital partners, to provide e-commerce platforms that attract consumers, build our brands and drive repeat consumer purchases could result in diminished brand image, relevance and loyalty and lost revenue. Additionally, as consumers shift purchasing preferences to online channels, the failure of our e-commerce channels to attract consumers who previously made purchases in our stores and those operated by our wholesale partners, will adversely affect our financial condition and results of operations.
Our operation of e-commerce sites pose risks and uncertainties including:
| • | changes in required technology interfaces; |
| • | website downtime and other technical failures; |
| • | costs and technical issues from website software upgrades; |
| • | data and system security; |
| • | computer viruses; and |
| • | changes in applicable laws and regulations. |
Keeping current with technology, competitive trends and the like may increase our costs and may not succeed in increasing sales or attracting consumers. Our failure to respond successfully to these risks and uncertainties might adversely affect the reputation of our brands and our revenue and results of operations.
The success of our e-commerce businesses depends, in part, on consumer satisfaction, including timely receipt of orders. Fulfillment of these orders requires comprehensive fulfillment infrastructure and different logistics operations than for our retail store and wholesale customer operations. We need adequate capacity, systems and operations to support the anticipated growth in our e-commerce businesses. If we encounter difficulties with our distribution facilities or in our relationships with the third parties who operate the facilities, or if any such facilities were to shut down or be limited in capacity for any reason, including as a result of fire, natural disasters, systems disruptions (including as a result of attacks on computer systems, such as ransomware attacks), or labor interruptions, including as a result of disease epidemics and health related concerns (such as the COVID-19 pandemic), we could experience longer lead times or disruption or delay in distributing our products to our consumers, which could result in consumer dissatisfaction and lost sales. Additionally, we might need to incur significantly higher costs than anticipated to ensure smooth and timely operation. Any of the foregoing could have an adverse effect on the reputation of our brands and our revenue and results of operations.
17
Table of Contents
We utilize a range of marketing, advertising, and other initiatives to increase existing customers’ spending and to acquire new customers; if the costs of advertising or marketing increase, or if our initiatives fail to achieve their desired impact, we may be unable to grow the business profitably.
We utilize a range of marketing, advertising and other initiatives to drive customers from awareness to consideration to conversion, and promoting awareness of our brands and products is important to our ability to grow our business, drive customer engagement, and attract new customers. We invest significant resources in advertising communication and marketing, which include activities ranging from pure digital and social media marketing initiatives to events like fashion shows, product collaborations and co-marketing projects. We adopt a strategy with a dual-focus on both local and broader international audience. For details, see “Item 4. Information on the Company—B. Business Overview—Marketing and Advertising.”
If our marketing and advertising efforts are not appropriately tailored to and accepted by our target customers, we may fail to attract customers, and our brands and reputation may be harmed. In addition, our marketing initiatives may become increasingly expensive as competition increases, and generating a meaningful return on those initiatives may be difficult. Our future growth and profitability and the success of our brands will depend in part upon the effectiveness and efficiency of these marketing efforts. Additionally, as the channels through which we conduct our marketing and advertising activities continue to rapidly evolve, we must continue to establish relationships with these channels and may be unable to develop or maintain these relationships on acceptable economic and other terms. Furthermore, we currently receive a significant number of visits to our digital platform via search engine results. Search engines frequently change the algorithms that determine the ranking and display of results of a user’s search, which could reduce the number of visits to our digital platform, and, in turn, reduce new customer acquisition and adversely affect our results of operations. If we are unable to cost-effectively drive traffic to our digital platform, our ability to acquire new customers and our financial condition would suffer. Email marketing efforts are also important to our marketing efforts. If we are unable to successfully deliver emails to our customers or if customers do not engage with our emails, whether out of choice, because those emails are marked as low priority or spam, or for other reasons, our business could be adversely affected.
Our marketing initiatives may become increasingly expensive, and generating a meaningful return on those initiatives may be difficult or unpredictable. Even if we successfully increase net revenue as a result of our marketing efforts, it may not offset the additional marketing expenses we incur. If our marketing efforts are not successful in promoting awareness of our brands or products, driving customer engagement, or attracting new customers, or if we are not able to cost-effectively manage our marketing expenses, our results of operations could be adversely affected.
Failure to accurately forecast consumer demand could lead to excess inventories or inventory shortages, which could result in decreased operating margins, reduced cash flows, and harm to our business.
To meet anticipated demand for our products, we must forecast inventory needs and arrange manufacturing activities based on our estimates of future demand for particular products. Our ability to accurately forecast demand for our products could be affected by many factors, including an increase or decrease in customer demand for our products or for products of our competitors, changing consumer preferences, changing product trends, our failure to accurately forecast consumer acceptance of new products, product introductions by competitors, unanticipated changes in general market conditions, store closures (including, for example, due to the COVID-19 pandemic), and weakening of economic conditions or consumer confidence in future economic conditions. If we fail to accurately forecast consumer demand, we may experience excess inventory levels or a shortage of products available for sale in our stores or for delivery to customers.
Inventory levels in excess of customer demand may result in inventory write-offs, donations by us of our unsold products, inventory write-downs, and/or the sale of excess inventory at discounted prices, any of which could cause our gross margin to suffer, impair the strength and exclusivity of our brands, and have an adverse effect on our results of operations, financial condition, and cash flows.
18
Table of Contents
Conversely, if we underestimate customer demand for our products and fail to arrange sufficient manufacturing capacities in advance, then we may not be able to deliver products to meet our requirements and we may experience inventory shortages. Inventory shortages in our stores or third-party distribution centers could result in delayed shipments to customers, lost sales, a negative customer experience, lower brand loyalty, and damage to our reputation and customer relationships, any of which could have an adverse effect on our results of operations, financial condition, and cash flows.
Counterfeit or “knock-off” products, as well as products that are “inspired by” our brands may siphon off demand for our brands’ products and may result in customer confusion, harm to our brands, a loss of our market share and/or a decrease in our results of operations.
We face competition from counterfeit or “knock-off” products manufactured and sold by third parties in violation of our intellectual property rights, as well as from products that are inspired by our brands’ products, including private label offerings by e-commerce retailers. In the past, third parties have targeted users on Facebook or other social media platforms intending to target individuals interested in our products and sell such individuals products that look like our brands’ products, often at steep discounts.
These activities of third parties may result in customer confusion, require us to incur additional administrative costs to manage customer complaints related to counterfeit goods, divert customers from us, cause us to miss out on sales opportunities, and result in a loss of our market share. We could also be required to increase our marketing and advertising spend. If consumers are confused by these other products and believe them to be actual products from our brands, we could be forced to deal with dissatisfied customers who mistakenly blame us for poor service or poor-quality goods.
In addressing these or similar issues in the future, we may also be required to incur substantial expense to protect our brands and enforce our intellectual property rights, including through legal action in the United States and the EU or other countries in which we and our brands operate, which could negatively impact our results of operations and financial condition.
These and similar issues related to these or similar counterfeit products or products “inspired by” our brands could recur and could again result in customer confusion, harm to our brand, a loss of our market share and/or a decrease in our results of operations.
We are dependent on suppliers for our products and raw materials, which poses risks to our business operations.
Although no single supplier is or is expected to become critical to our production needs, any of the following could materially and adversely affect our ability to produce or deliver our products and, as a result, have a material adverse effect on our business, financial condition and results of operations:
| • | political or labor instability or military conflict involving any of the countries in which we, or our suppliers operate, which could cause a delay in the transportation of our products and raw materials to us and an increase in transportation costs; |
| • | heightened terrorism security concerns, which could subject imported or exported goods to additional, more frequent or more thorough inspections, leading to delays in deliveries or impoundments of goods for extended periods or could result in decreased scrutiny by customs officials for counterfeit goods, leading to lost sales, increased costs for our anti-counterfeiting measures and damage to the reputation of our brands; |
| • | a significant decrease in availability or increase in cost of raw materials, including commodities (particularly cotton, wool and cashmere), or the ability to use raw materials produced in a country that is a major provider due to political, human rights, labor, environmental, animal cruelty or other concerns; |
19
Table of Contents
| • | a significant decrease in factory and shipping capacity or increase in demand for such capacity; |
| • | a significant increase in wage and shipping costs; |
| • | natural disasters, which could result in closed factories and scarcity of raw materials; |
| • | disease epidemics and health related concerns, such as the COVID-19 pandemic, which could result in (and in the case of the COVID-19 pandemic, has resulted in certain of the following) closed factories, reduced workforces, scarcity of raw materials and scrutiny or embargoing of goods produced in infected areas; |
| • | the migration and development of manufacturers, which could affect where our products are or are planned to be produced; |
| • | the adoption of regulations, quotas and safeguards relating to imports and our ability to adjust timely to changes in trade regulations, which, among other things, could limit our ability to produce products in cost-effective countries that have the labor and expertise needed; and |
| • | the implementation of new or increased duties, taxes and other charges on imports. |
We face intense competition in the personal luxury goods industry.
Competition is intense in the luxury consumer goods industry. We compete with numerous luxury fashion designers (whether domestically or globally), brand owners, manufacturers and retailers of apparel, accessories and footwear, some of which have greater resources than we do. In addition, in certain instances, we compete directly with our wholesale customers, as they also sell their own private label products in their stores and online. We compete within the personal luxury goods industry primarily on the basis of:
| • | anticipating and responding to changing consumer tastes, demands and shopping preferences in a timely manner and developing distinctive, attractive, quality products; |
| • | maintaining favorable brand recognition and relevance, including through digital brand engagement and online and social media presence; |
| • | appropriately pricing products and creating an attractive value proposition for customers; |
| • | providing strong and effective marketing support; |
| • | ensuring product availability and optimizing supply chain efficiencies with third party suppliers and retailers; and |
| • | obtaining sufficient retail floor space at retail and effective presentation of our products at retail, on e-commerce sites operated by our department store customers and pure play e-commerce retailers, and on our e-commerce sites. |
Our customer relationships and sales have been and may be negatively impacted if we do not anticipate and respond to consumer preferences and fashion trends or manage inventory levels appropriately.
Our ability to predict or respond to constantly changing fashion trends, demographics, consumer preferences and spending patterns significantly impacts our sales and operating results. If we do not identify and respond to emerging trends in consumer spending and preferences quickly enough, identify the right partners that align with our customer strategy, broaden or expand our product portfolio fast enough or in the right areas or develop, evolve, and retain our team’s talent, mindset and technical skills to support changing operating models, we may harm our ability to retain our existing customers or attract new customers. Ensuring we optimize our inventory and improve the planning and management of inventory through the use of data and analytics is critical to serving our customers, driving growth and maximizing profitability. If we maintain too much inventory, we may be forced to sell our merchandise at lower average margins, which could harm our business. Conversely, if we fail to purchase enough merchandise, or inventory does not arrive fast enough or as expected, we may lose opportunities for additional sales and potentially harm relationships with our customers.
20
Table of Contents
We are subject to certain risks related to the sale of our products through our direct-to-consumer (“DTC”) channel and in particular our directly operated stores.
In our distribution model, the DTC channel primarily consists of directly operated stores (“DOSs”) and e-commerce platforms through which we sell directly to our customers. For details, see “Item 4. Information on the Company—B. Business Overview—Sales Channels.” The risks related to managing currently existing DOSs mainly relate to possible difficulties in renewing the existing lease agreements, an increase in rental charges and a decline in sales.
Our DOSs are all located in properties that we lease from third parties. There is significant competition among retail operators in our industry to obtain commercial spaces in prestigious locations in major cities, towns and resort destinations worldwide. Accordingly, to renew our lease agreements, we may have to compete with other operators, including those in our same industry, some of which have greater economic and financial resources than ours or otherwise more bargaining power. If we are unable to renew our lease agreements on economic terms consistent with or more beneficial than those currently applicable, or if we are forced to accept rental charges which are substantially higher than the existing ones, this could have a material adverse effect on our business, results of operations and financial condition.
Our DOSs have a high level of fixed costs, which affect profits from the retail channel. A reduction in sales or a decrease in revenues from the retail channel could, in light of the high level of fixed costs, have a material adverse effect on our business, results of operations and financial condition.
We analyze the performance of each of our DOSs and market trends in order to assess whether to open new DOSs (or move DOSs to a different location), renew existing leases, or close DOSs that are underperforming. If our analysis is inadequate or based on the wrong assumptions, we could select sub-optimal locations for our stores, or keep or open underperforming stores, which could have a material adverse effect on our business, results of operations and financial condition.
In addition, although we have adopted internal policies and training initiatives to ensure that the staff in our DOSs operate in a manner consistent with the image and prestige of our brands, there can be no assurance that such staff will abide by such policies or that inappropriate or illicit behavior by certain employees will not occur. If there is any allegation brought against us as a result of negligence or other impermissible conduct by our DOS staff, we may be exposed to legal or other proceedings or increased public scrutiny, which may result in substantial costs, diversion of resources and management’s attention and potential harm to our reputation.
The operations of our retail channel and DOSs are also subject to risks such as information technology system failure, work stoppage, civil unrest, natural disasters, fire and government imposed shutdowns. Any interruption of activity in our retail channel and DOSs due to these or other similar events out of our control could result in disruption to our operations and a reduction in sales, which could have an adverse effect on our business, results of operations and financial condition.
A data security or privacy breach could damage our reputation and our relationships with our customers or employees, expose us to litigation risk, and adversely affect our business.
We are dependent on information technology systems and networks, including the Internet, for a significant portion of our DTC sales, including our e-commerce operations. We are also responsible for storing data relating to our customers and employees, and rely on third parties for the operation of our e-commerce sites and for the various social media tools and websites that we use as part of our marketing strategy. In our normal course of business, we often collect, transmit, and/or retain certain sensitive and confidential customer information, including credit card information. There is significant concern by consumers, employees, and lawmakers alike over the security of personal information transmitted over the Internet, consumer identity theft, and user privacy, as cyber-criminals are becoming increasingly more sophisticated in their attempts to gain unauthorized access to computer systems and confidential or sensitive data.
21
Table of Contents
We and our suppliers have been and may in the future be subject to cyber-attacks and other attempted security breaches. Despite the security measures we currently have in place, our facilities and systems and those of our suppliers and third-party service providers may be vulnerable to security breaches, acts of vandalism, phishing attacks, computer viruses, malware, ransomware, misplaced or lost data, programming and/or human errors, or other Internet or email events. The increased use of smartphones, tablets, and other wireless devices, as well as the need for a substantial portion of our corporate employees to work remotely during the COVID-19 pandemic, may also heighten these and other operational risks. The retail industry, in particular, continues to be the target of many cyber-attacks, which are becoming increasingly more difficult to anticipate and prevent due to their rapidly evolving nature.
The technology we use to protect our systems from being breached or compromised could become outdated as a result of advances in computer capabilities or other technological developments. Further, measures we implement to protect our computer systems against cyber-attacks may make them harder to use or reduce the speed at which they operate, which in turn could negatively impact our customers’ shopping experience resulting in reduced online traffic, diminished loyalty to our brands, and lost sales.
Any perceived or actual electronic or physical security breaches involving the misappropriation, loss, or other unauthorized disclosure of confidential or personally identifiable information, including penetration of our network security, whether by us or by a third party, could disrupt our business, severely damage our reputation and our relationships with our customers or employees, expose us to risks of litigation, significant fines and penalties, and liability, and result in deterioration in our customers’ and employees’ confidence in us, and adversely affect our business, results of operations, and financial condition. Since we do not control third-party service providers and cannot guarantee that no electronic or physical computer break-ins and security breaches will occur in the future, any perceived or actual unauthorized disclosure of personally identifiable information regarding our employees, customers, or website visitors could harm our reputation and credibility, result in lost sales, impair our ability to attract website visitors, and/or reduce our ability to attract and retain employees and customers. As these threats develop and grow, we may find it necessary to make significant further investments to protect data and our infrastructure, including the implementation of new computer systems or upgrades to existing systems, deployment of additional personnel and protection-related technologies, engagement of third-party consultants, and training of employees.
In addition, the regulatory environment relating to information security and privacy is becoming increasingly more demanding with frequent new requirements surrounding the handling, protection, and use of personal and sensitive information. We may incur significant costs in complying with the various applicable state, federal, and foreign laws regarding protection of, and unauthorized disclosure of, personal information. Additionally, failing to comply with such laws and regulations could damage the reputation of our brands and lead to adverse consumer actions, as well as expose us to government enforcement action and/or private litigation, any of which could adversely affect our business.
Because of our prominence in the luxury sector, we may be an attractive target for cyberattacks. As a response to the paramount importance of maintaining our data integrity, we have implemented a strict and robust cybersecurity program, where we have put in place extensive measures from preventing to detecting and reporting. See “Part II—Item 16K Cybersecurity”.
We are exposed to the risk that personal information of our customers, employees and other parties collected in the course of our operations may be damaged, lost, stolen, divulged or processed for unauthorized purposes.
In carrying out our business, we collect, store and process personal data of our customers, employees and other parties with whom we deal, including data we gather for product development and marketing purposes. Therefore, we are subject to a variety of strict and ever-changing data protection and privacy laws on a global basis, including the EU General Data Protection Regulation and the PRC Personal Information Protection Law.
We collect customer data and personal information such as name, age, address, gender and contact number, in order to process sales and ensure product delivery as well as to register customers as brand members or VIP customers.
22
Table of Contents
We are exposed to the risk that personal data we store and use may be damaged or lost, stolen, divulged or processed for unauthorized purposes by the individuals responsible for data management or by unauthorized individuals (including third parties and our employees). The destruction, damage to or loss of personal data, as well as its theft, unauthorized processing or dissemination, could significantly impair our reputation and impact our operations; it could also lead to governmental investigations and the imposition of fines by competent authorities, with possible adverse effects on our business, results of operations and financial condition.
Future economic conditions, including volatility in the financial and credit markets, may adversely affect our business.
Economic conditions in the past have adversely affected, and in the future may adversely affect, our business, our customers and licensees and their businesses, and our financing and other contractual arrangements, including, for example, as a result of the COVID-19 pandemic. Such conditions, among other things, have resulted, and in the future may result, in financial difficulties leading to restructurings, bankruptcies, liquidations and other unfavorable events for our customers and licensees, may cause such customers to reduce or discontinue orders of our products and licensed products sold by our licensees, and may result in customers being unable to pay us for products they have purchased from us and licensees being unable to pay us for royalties owed to us. Financial difficulties of customers and licensees may also affect the ability of our customers and licensees to access credit markets or lead to higher credit risk relating to receivables from customers and licensees.
Significant inflation could adversely affect our results of operations and financial condition.
Economies around the world have generally seen significant inflationary pressures since 2021, which may persist in 2024. If inflation continues to increase or stays above levels seen in recent years, we could face further increases in costs for raw materials, energy, labor or other production costs, which could adversely affect our business and results of operations if we are not able to pass on the increased costs to our customers, or successfully implement other mitigating actions. While we plan to respond to increases in costs through pricing increases for our brands, the foregoing could reduce our profit margins, with a material adverse effect on our results of operations and financial condition. Additionally, many central banks have increased, or are considering increasing, interest rates as a result of the recent inflation, which in turn may increase our borrowing costs.
In addition, significant increases in the costs of other products required by consumers, as well as a rise in interest rates may affect consumer spending power and result in overall reduced spending. The direct impact of inflation will be reflected in pricing increases for our brands.
We are dependent on a limited number of distribution facilities operated by us as well as those of our distribution partners. If one or more of our distribution facilities or those of our distribution partners experience operational difficulties or becomes inoperable, it could have a material adverse effect on our business, results of operations and financial condition.
We operate a limited number of distribution facilities, and our portfolio brands work with licensees for distribution of specific products, including but not limited to Marchon as Lanvin’s exclusive eyewear licensee and distributor, CWF as Lanvin’s exclusive childrenswear licensee and distributor, and Delta as Wolford’s licensee of lingerie, production and distribution license. Our ability to meet the needs of our own retail stores and e-commerce channels, as well as our wholesale customers, depends on the proper and uninterrupted operation of distribution facilities, such as warehouses and/or distribution centers, operated by us and third parties. If any of these distribution facilities were to shut down or otherwise become inoperable or inaccessible for any reason (including as a result of a government mandate or order due to the COVID-19 pandemic), we could suffer a substantial loss of inventory and/or disruptions of deliveries to our retail and wholesale customers. In addition, we could incur significantly higher costs and longer lead times associated with the distribution of our products during the time it takes to reopen or replace the affected facility. Any of the foregoing factors could result in decreased sales and have a material adverse effect on our business, results of operations and financial condition.
In addition, we continue to look for new and larger facilities as and when needed to further support our efforts to operate with increased efficiency and flexibility. There are risks inherent in operating in new distribution environments and implementing new warehouse management systems, including technological and operational difficulties that may arise with such transitions. We may experience shipping delays should there be any disruptions in our new warehouse management systems or warehouses themselves.
23
Table of Contents
Our revenues and operating results are affected by the seasonal nature of our business and cyclical trends in consumer spending.
The apparel business is subject to seasonal fluctuations and cyclical trends in consumer spending. Our sales are typically higher in the last quarter of the year, driven by the holiday shopping season and in January and February, driven by Chinese New Year celebrations. To provide shareholders a better understanding of management’s expectations surrounding results, we may provide a financial outlook on our expected operating and financial results for future periods comprised of forward-looking statements subject to certain risks and uncertainties. Any factor that negatively impacts these selling seasons could have an adverse and disproportionate effect on our results of operations for the entire year.
Additionally, factors such as results differing from guidance, changes in sales and operating income in the peak seasons, changes in our market valuations, performance results for the general retail industry, announcements by us or our industry peers or changes in analysts’ recommendations may cause volatility in the price of our common stock and our shareholder returns.
If our suppliers, licensees, or other business partners, or the suppliers used by our licensees fail to use legal and ethical business practices, our business could suffer.
We require our suppliers, licensees and other business partners, and the suppliers used by our licensees, to operate in compliance with applicable laws, rules and regulations regarding working conditions, employment practices and environmental compliance. Additionally, we impose upon our business partners operating guidelines that require additional obligations in those areas in order to promote ethical business practices. We audit, or have third parties audit, the operations of these independent parties to determine compliance, through onsite inspections, reviewing certification and sustainability reports, and reviewing whether suppliers are observing compliance standards This process also includes ad hoc on-site visits from our sourcing and product development department, factory tours and on-site due diligence of new suppliers. We also collaborate with factories, suppliers, industry participants and other stakeholders to improve the lives of the workers and others in our sourcing communities. However, we do not control our business partners, or the suppliers used by our licensees, including with respect to their labor, manufacturing and other business practices.
If any of these suppliers or business partners violates labor, environmental, building and fire safety, or other laws or implements labor, manufacturing or other business practices that are generally regarded as unethical, the shipment of finished products to us or our customers could be interrupted, orders could be canceled and relationships could be terminated. Further, we could be prohibited from importing goods by governmental authorities. In addition, we could be the focus of adverse publicity and our reputation and the reputation of our brands could be damaged. Any of these events could have a material adverse effect on our revenue and, consequently, our results of operations.
Our potential inability to find suitable new targets to drive inorganic business growth and the risk that any acquisitions we do complete may not be successful in achieving intended benefits, cost savings and synergies.
Acquisitions have been a consistent part of our growth. Prior to completing any acquisition, our management team identifies expected synergies, cost savings and growth opportunities but, due to legal and business limitations, we may not have access to all necessary information. The integration process may be complex, costly and time-consuming. The potential difficulties of integrating the operations of an acquired business and realizing our expectations for an acquisition, including the benefits that may be realized, include, among other things:
| • | failure to identify appropriate targets or to complete the deal; |
| • | failure to implement our business plan for the combined business; |
| • | delays or difficulties in completing the integration of acquired companies or assets; |
24
Table of Contents
| • | higher than expected costs, lower than expected cost savings or a need to allocate resources to manage unexpected operating difficulties; |
| • | unanticipated issues in integrating systems and operations; |
| • | diversion of the attention and resources of management; |
| • | assumption of liabilities not identified in due diligence; |
| • | operational and regulatory challenges related to the jurisdictions in which an acquired business operates; |
| • | uncertainties associated with potential targets in certain jurisdictions given the current intensified geopolitical environment; |
| • | the impact on our or an acquired business’ internal controls and compliance with the requirements under applicable regulation; and |
| • | other unanticipated issues, expenses and liabilities. |
Any future acquisitions may not be successful, may not benefit our business strategy, may not generate sufficient revenues to offset the associated acquisition costs or may not otherwise result in the intended benefits.
We could be adversely affected if we are unable to negotiate, maintain or renew our license agreements.
We are a party to various strategic alliances. See “Item 4. Information on the Company—A. History and Development of the Company” for details. If we were to fail to comply with our obligations in relation to those strategic alliances (including with respect to required quality standards and timeliness of deliveries), our strategic alliance partners may terminate, fail to renew or amend in a manner adverse to us the existing arrangements, which may have material adverse consequences on our business, results of operations and financial condition. We are also party to certain license agreements, as licensor, whereby we grant, for a certain period of time, the use of our brands to third parties.
If any of these licensees were not to perform their obligations to us (including by failing to ensure the required quality standards and failing to comply with our directions with respect to distribution channels and after sale services), we may be unable in a commercially reasonable time, to replace such licensee with another licensee capable of ensuring equivalent quality and production standards, or procure our services upon the same or substantially the same financial terms. Our inability to maintain a presence in these adjacent luxury sectors or to provide products in these sectors, such as eyewear, childrenswear and lingerie, of a quality comparable to that of our other products may reflect negatively on the reputation and integrity of our brands.
If any of the foregoing licensing agreements or strategic alliances are terminated for any reason, not renewed upon their expiration or renewed but with less favorable terms and conditions, this could have a material adverse effect on our business, results of operations and financial condition.
If our trademarks and intellectual property or other proprietary rights are not adequately protected to prevent use or appropriation by third parties, the value of our brand and other intangible assets may be diminished, and our business may be adversely affected.
Our trademarks and other intellectual property rights are important to our success and our competitive position. We are susceptible to others imitating our products and infringing on our intellectual property rights, especially with respect to our brands, as they enjoy significant worldwide consumer recognition and the generally premium pricing of our brands and products creates additional incentive for counterfeiters and infringers. Imitation or counterfeiting of our products or infringement of our intellectual property rights could diminish the value of our brands, undermine our reputation or otherwise adversely affect our revenue and profitability. We cannot assure you that the actions we take to establish and protect our trademarks and other intellectual property rights will be adequate to prevent imitation of our products by others. We cannot assure you that other third parties will not seek to invalidate our trademarks or block sales of our products as a violation of their own trademarks and intellectual property rights. In addition, we cannot assure you that others will not assert rights in, or ownership of, trademarks and other intellectual property rights of ours or in marks that are similar to ours or marks that we license or market or that we will be able to successfully resolve these types of conflicts to our satisfaction. In some cases, there may be trademark owners who have prior rights to our marks because the laws of certain foreign countries may not protect intellectual property rights to the same extent as do the laws of the United States. In other cases, there may be holders who have prior rights to similar trademarks. Other than certain trademark disputes described below, the management team is not aware of other trademark or IP disputes of sort, we have in the past and may in the future become involved in proceedings relating to a company’s claim of prior rights to some of our trademarks or marks similar to some of our brands, and any future proceeding (whether actual, potential, or threatened) may have an impact on our business and the financial position of the Group. There is an ongoing trademark dispute between Sergio Rossi and Stefano Ricci, which challenges the trademark registrations for “sr,” “sr 1,” “sr Milano,” and “sr twenty,” as well as challenges the use of “SR (rectangle)” and “SR (oval)”. We do not believe this is material to our brands as the use of such logos is minimal.
25
Table of Contents
We are subject to certain laws, litigation, regulatory matters and ethical standards, and compliance or our failure to comply with or adequately address developments as they arise could adversely affect our reputation and operations.
Our policies, procedures and practices and the technology we implement are intended to comply with applicable federal, state, local and foreign laws, tariffs, rules and regulations, including those imposed by jurisdictions that our businesses have presence in, consumer protection and other regulatory agencies, the marketplace, as well as responsible business, social and environmental practices, all of which may change from time to time. Compliance with these requirements and/or changes to them may cause our business to be adversely impacted, or even limit or restrict the activities of our business. In addition, if we fail to comply with applicable laws and regulations or implement responsible business, social, environmental and supply chain practices, we could be subject to damage to our reputation, class action lawsuits, regulatory investigations, legal and settlement costs, charges and payments, civil and criminal liability, increased cost of regulatory compliance, losing our ability to accept credit and debit card payments from our customers, restatements of our financial statements, disruption of our business and loss of customers. New and emerging privacy and data protection laws may increase compliance expenses and limit business opportunities and strategic initiatives, including customer engagement. Any required changes to our employment practices could result in the loss of employees, reduced sales, increased employment costs, potential labor disputes, low employee morale and harm to our business and results of operations. In addition, political and economic factors could lead to unfavorable changes in tax laws, which may affect our tax assets or liabilities and adversely affect our results of operations. We are also regularly involved in various litigation matters that arise in the ordinary course of business. In addition, our directors, officers, employees, affiliates and other third-parties associated with us may be subject to investigations, litigation or other legal proceedings, including those that are unrelated to their relationships and dealings with us.
Any such litigation, legal proceedings or regulatory developments could adversely affect our business, financial condition or reputation.
We are subject to legal and regulatory risk.
We are required to comply with the laws and regulations applying to our products and operations in the various jurisdictions in which we operate, particularly in relation to the protection of intellectual property rights, competition, product safety, packaging and labeling, import and processing of certain raw materials and finished goods, data protection, limits on cash payments, worker health and safety and the environment. New legislation (or amendments to existing legislation) may require us to adopt stricter standards, which could lead to increased costs for production or limit our operations, and this may have a material adverse effect on our business, results of operations and financial condition. We are subject to the U.S. Foreign Corrupt Practices Act of 1977, as amended, and other anti-bribery, anti-corruption and anti-money laundering laws in the countries in which we conduct activities. We and our distribution partners may have direct or indirect interactions with officials and employees of government agencies or state owned or affiliated entities and other third parties where we may be held liable for corrupt or other illegal activities, with or without our explicit authorization. We are also subject to sanctions and export control laws and regulations, which may lead to commercial and economic sanctions and export control, prohibitions and other restrictive measures imposed by the different authorities and governments involved, including the European Union, the United States, the United Nations and other countries and international organizations. From time to time, we may conduct some limited activities in countries subject to sanctions, export control or other restrictive measures. While we believe that our activities are in compliance with the applicable laws and sanctions legislation, including embargoes, we cannot exclude the possibility that we or our distribution partners may violate such laws. Any violation of the foregoing laws could lead to regulatory and/or judicial proceedings and sanctions (including civil penalties, denial of export privileges, injunctions, asset seizures and revocations or restrictions of licenses, as well as criminal fines and imprisonment), which may have a material adverse effect on our reputation, business, results of operations and financial condition.
26
Table of Contents
Changes to taxation or the interpretation or application of tax laws could have an adverse impact on our results of operations and financial condition.
Our business is subject to various taxes in different jurisdictions, which include, among others, value added tax, excise duty, registration tax and other indirect taxes. We are exposed to the risk that our overall tax burden may increase in the future.
Changes in tax laws or regulations, or in the position of the relevant authorities regarding the application, administration or interpretation of these laws or regulations, particularly if applied retrospectively, could have a material adverse effect on our business, results of operations and financial condition. These changes include the introduction of a global minimum tax at a rate of 15% under the Two-Pillar Solution to Address the Tax Challenges of the Digitalisation of the Economy, agreed upon by over 130 jurisdictions under the Organization for Economic Co-operation and Development/G20 Inclusive Framework on Base Erosion and Profit Shifting and implemented from 2024.
In addition, tax laws are complex and subject to subjective valuations and interpretive decisions, and we periodically may be subject to tax audits aimed at assessing our compliance with direct and indirect taxes. The tax authorities may not agree with our interpretations of, or the positions we have taken or intend to take on, tax laws applicable to our ordinary activities and extraordinary transactions. In case of challenges by the tax authorities to our interpretations, we could face long tax proceedings that could result in the payment of additional tax and penalties, with potential material adverse effects on our business, results of operations and financial condition.
We are subject to risks associated with climate change and other environmental impacts and increased focus by stakeholders on environment, social and governance (“ESG”) matters.
Our business is subject to risks associated with climate change, including in particular disruption to our supply chain, which may impact the production and distribution of our products and availability and price of raw materials. Increased frequency and intensity of weather events (including storms and floods) due to climate change could also lead to more frequent store closures and/or lost sales as customers prioritize basic needs.
There is also increased focus from our stakeholders, including consumers, employees and investors, on corporate responsibility (including ESG matters). We plan to announce in the near future our sustainability strategy and ESG goals. There can be no assurance that our stakeholders will agree with our strategy or will be satisfied with our disclosure, or that we will be successful in achieving our goals. If our ESG practices do not meet our stakeholders’ expectations and standards, or if we fail (or are perceived to fail) to implement our strategy or achieve our goals, our reputation could be damaged, causing our investors or consumers to lose confidence in us and our brands, negatively impacting our employee retention and our business, or having a negative effect on our sales and results of operations. In addition, implementing our ESG strategy and pursuing our ESG goals might involve higher than expected costs and investments which might adversely affect our results of operations.
We may lose key employees or may be unable to hire qualified employees.
We depend on the services and management experience of our executive officers, who have substantial experience and expertise in our business. We also depend on other key employees involved in our design, merchandising and marketing operations. Competition for qualified personnel in the apparel industry is intense and competitors may use aggressive tactics to recruit our key employees. The unexpected loss of services of one or more of these individuals could have a material adverse effect on us.
27
Table of Contents
We depend on highly specialized craftsmanship and skills.
One of the distinguishing features of certain of our products is the highly specialized craftsmanship involved in their manufacturing, which is also a result of the experience that our specialized employees have acquired over the course of years.
Although we try to preserve these craftsmanship skills and ensure that they are passed on to the next generations, the number of our specialized employees may decrease in the future and their craftsmanship skills may no longer be readily available. If this were to occur, it could affect our ability to ensure the distinctive quality of certain of our products in the future, which in turn could have a material adverse effect on our business, results of operations and financial condition.
We are exposed to fluctuations in currency exchange rates.
We operate in multiple jurisdictions, which exposes us to the effects of fluctuations in currency exchange rates with respect to both revenues and costs related to the production and supply and material procurement processes. We earn revenue denominated in a number of currencies with the substantial majority of our revenue denominated in U.S. dollar and Euro. Fluctuations in foreign currency exchange rates will affect LGHL’s financial results, which LGHL reports in Euro. In particular, depreciation of the U.S. dollar against the Euro would generally have a negative impact on our results of operations as this would result in a decrease in the results of our U.S. business (which are generally denominated in U.S. dollar) when translated into Euro for financial reporting purposes. On the other hand, the appreciation of U.S. dollar against the Euro would generally have a positive impact on our business given the revenue contribution from our U.S. business.
We cannot assure you that movements in foreign currency exchange rates will not have a material adverse effect on our results of operations in future periods. Furthermore, foreign exchange markets have recently experienced significant volatility, and there can be no assurance that our results of operations will not be adversely affected by such volatility.
We are subject to risks related to the complexity and uncertainty in interpretation of transfer pricing rules.
We operate in multiple countries worldwide with integrated industrial, commercial, design and communication functions, trademarks used in different jurisdictions and are subject to taxation in countries in which our subsidiaries are located. Within our Group, transactions between related parties located in different countries are carried out in the ordinary course of business and are mainly related to the purchase and sale of goods and the provision of services.
These transactions are subject to transfer pricing rules defined globally by the Organization for Economic and Co-operation and Development (“OECD”) and local tax laws. In this respect, our intercompany prices are set up consistently with the guidance provided by the OECD Transfer Pricing Guidelines and we and our subsidiaries prepare specific transfer pricing documentation with respect to such transactions. Although we believe that our transfer pricing is correct, due to the complexity of these rules and the uncertainties in their interpretation, the tax authorities might challenge the prices of certain of our intercompany transactions and propose transfer pricing adjustments. Consequently, such adjustments may increase the related taxes and impose penalties and late payment interests, which may result in a material adverse effect on our business, results of operations and financial condition.
28
Table of Contents
We operate in many countries around the world and, accordingly, we are exposed to various international business, regulatory, social and political risks.
We operate in multiple countries worldwide through a direct and indirect distribution network. Our operations in various international markets expose us to various risks, including those arising from: competition with local competitors (which may have greater resources and/or more favorable market positions); the diversity of consumers’ tastes and preferences and our ability to anticipate or respond to such tastes and preferences; changes in the political and economic environments in the countries where we operate; changes in regulations, including tax regulations, and the imposition of new duties or other protectionist measures; strict regulations affecting the import and processing of certain raw materials and finished goods; the occurrence of acts of terrorism or similar events, conflicts, civil unrest or situations of political instability; parallel imports of goods at terms inconsistent with our guidelines and distribution of our products, in violation of exclusive territorial rights granted to other importers and licensees (the so-called “gray market”). These or other factors may harm our business in international markets or cause us to incur significant costs in these markets, which could have a material adverse effect on our business, results of operations and financial condition.
Changes in global economic, political or social conditions or government policies could have a material adverse effect on our business and operations.
We place significant focus and reliance on developing global consumer markets. Accordingly, our business, financial condition, results of operations and prospects may be influenced to a significant degree by global political, economic and social conditions. While the global economy has experienced significant growth over past decades, growth has been uneven, both geographically and among various sectors of the economies in EMEA, North America, Greater China and Other Asia. In addition, the recent geopolitical tensions and conflicts, including the conflicts in the Middle East and Ukraine, has affected the regional stability and could have a broader economic impact globally. Any adverse changes in economic conditions in our key geographical segments—EMEA, North America, Greater China and Other Asia—and the policies of these governments or in the laws and regulations of these governments could have a material adverse effect on global overall economic growth. Such developments could adversely affect our business and operating results, lead to a reduction in demand for our services and adversely affect our competitive position.
Given our intention to develop global consumer markets including China, we may also be affected significantly by political, regulatory, economic and social conditions in China. The Chinese economy differs from the economies of most developed countries in many respects, including the level of government involvement, development, growth rate, control of foreign exchange and allocation of resources. Although the Chinese government has implemented measures emphasizing the utilization of market forces for economic reform, the reduction of state ownership of productive assets, and the establishment of improved corporate governance in business enterprises, a substantial portion of productive assets in the PRC are still owned by the government. In addition, the Chinese government continues to play a significant role in regulating industry development by imposing industrial policies. The Chinese government also exercises significant discretion over the PRC’s economic growth through allocating resources, controlling payment of foreign currency denominated obligations, setting monetary policy and providing preferential treatment to particular industries or companies. Additionally, the PRC government also has significant authority to exert influence on the ability of China-based companies (as measured by the location of our company headquarters, and the nationality and location of our executive officers and certain of our directors and shareholders) and our PRC subsidiaries, to conduct their businesses. The PRC government may intervene or influence the operations of such subsidiaries at any time, which could result in a material change in such subsidiaries’ operations and/or the value of our securities. In particular, there has been recent legislation and statements by the PRC government indicating an intent to exert more oversight and control over offerings that are conducted overseas by China-based issuers. Any such regulatory oversight or control could significantly limit, or completely hinder, our ability to offer or continue to offer securities to investors and cause the value of our securities to significantly decline.
There are uncertainties regarding the interpretation and enforcement of PRC laws, rules and regulations, and changes in laws, rules and regulations in China could adversely affect us.
A portion of our operations are conducted (through our subsidiaries) in the PRC, and are governed by PRC laws, rules and regulations. The PRC legal system is a civil law system based on written statutes. Unlike the common law system, prior court decisions may be cited for reference but have limited precedential value.
Legislative efforts over the past three decades have significantly enhanced the protections afforded to various forms of foreign investment in China. However, China’s legal system remains evolving, and recently enacted laws, rules and regulations, which involve uncertainties and can be inconsistent and unpredictable, may be subject to significant degrees of interpretation and enforcement by PRC regulatory agencies.
29
Table of Contents
Since PRC administrative and court authorities have significant discretion in interpreting and implementing statutory and contractual terms, it may be more difficult to evaluate the outcome of administrative and court proceedings and the level of legal protection we enjoy as compared to more developed legal systems. These uncertainties may impede our ability to enforce the contracts we have entered into and/or our intellectual property rights.
If we were to become subject to the oversight, discretion or control of PRC government authorities over overseas offerings of securities and/or foreign investments, it may result in a material adverse change in our operations, significantly limit or completely hinder our ability to offer or continue to offer securities to investors and cause the value of our securities to significantly decline, which would materially affect the interests of the investors.
The Regulations on Mergers and Acquisitions of Domestic Companies by Foreign Investors (the “M&A Rules”), adopted by six PRC regulatory agencies in 2006 and amended in 2009, include, among other things, provisions that purport to require any offshore special purpose vehicle that is controlled by PRC companies or individuals and formed for the purpose of seeking a public listing on an overseas stock exchange through acquisition of PRC domestic companies to obtain the approval of the CSRC prior to the listing and trading of its securities on an overseas stock exchange. On September 21, 2006, the CSRC published on its official website procedures specifying documents and materials required to be submitted to it by any such special purpose vehicle seeking CSRC’s approval of overseas listings. We believe that under the PRC laws, regulations and rules currently in effect, the CSRC’s approval under the M&A Rules is not required for the transactions contemplated by the Business Combination Agreement, including but not limited to the listing of our securities on the NYSE, given that our PRC subsidiaries were incorporated as foreign-invested enterprises by means of foreign direct investments rather than by acquisitions of any PRC domestic companies owned by PRC companies or individuals as defined under the M&A Rules. However, substantial uncertainty remains regarding the scope and applicability of the M&A Rules and the CSRC approval requirement. Therefore, it is uncertain whether we will be required to obtain permission from the PRC government to maintain our listing status on U.S. exchanges in the future, and even when such permission is obtained, whether it will be later denied or rescinded. In addition, we may be required to receive approval under anti-monopoly and competition laws for our past and future acquisitions. We cannot guarantee that we will be able to obtain such regulatory approval when needed in a timely manner, or at all, failure of which will subject us to anti-monopoly regulatory actions.
The Opinions on Strictly Cracking Down on Illegal Securities Activities According to Law (the “Opinions”) jointly issued by the General Office of the Central Committee of the Communist Party of China and the General Office of the State Council, which were made available to the public on July 6, 2021, call for strengthened regulation over illegal securities activities and supervision of overseas listings by China-based companies and propose to take effective measures to deal with the risks and incidents faced by China-based overseas-listed companies. The Opinions also provide that the State Council will revise provisions regarding the overseas issuance and listing of shares by companies limited by shares and will clarify the duties of domestic regulatory authorities. On February 17, 2023, the CSRC released the Trial Measures, which came into effect on March 31, 2023. Pursuant to the Trial Measures:
| • | PRC domestic companies that seek to offer or list equity or equity linked securities overseas, both directly and indirectly, should fulfill the filing procedure and report relevant information to the CSRC. If a PRC domestic company fails to complete the filing procedure or conceals any material fact or falsifies any major content in its filing documents, such PRC domestic company may be subject to administrative penalties, such as order to rectify, warnings, fines, and its controlling shareholders, actual controllers, the person directly in charge and other directly liable persons may also be subject to administrative penalties, such as warnings and fines; |
| • | if an overseas company satisfies both of the following conditions, its overseas offering and listing will be deemed an indirect offering by a PRC domestic company: (i) more than 50% of such overseas company’s consolidated revenues, profit, total assets or net assets that are derived from its audited consolidated financial statements for the most recently completed fiscal year are attributable to PRC domestic companies, and (ii) any of the following three circumstances applies: key components of its operations are carried out in the PRC; its principal places of business are located in the PRC; or the majority of the senior management members in charge of operation and management are PRC citizens or residents. The determination will be made on the basis of “substance over form;” and |
30
Table of Contents
| • | where a PRC domestic company seeks to indirectly offer and list securities in an overseas market, such company is required to designate a major domestic operating entity responsible for all filing procedures with the CSRC; where a company makes an application for initial public offerings or listings in an overseas market, such company is required to submit filings with the CSRC within three business days after such application is submitted, and where an issuer conducts follow-on offerings in the same overseas market where it has previously offered and listed securities, the issuer shall submit filings with the CSRC within three business days after the follow-on offering is completed. |
On the same day, the CSRC also held a press conference for the release of the Trial Measures and issued the Notice on Administration for the Filing of Overseas Offering and Listing by Domestic Companies, which, among others, clarifies that: (i) on or prior to the effective date of the Trial Measures, domestic companies that have already submitted valid applications for overseas offering and listing but have not obtained approval from overseas regulatory authorities or stock exchanges may reasonably arrange the timing for submitting their filing applications with the CSRC, and should complete the filing before the completion of their overseas offering and listing; (ii) a six-month transition period will be granted to PRC domestic companies which, prior to the effective date of the Trial Measures, have already obtained the approval from overseas regulatory authorities or stock exchanges (such as the completion of registration in the market of the United States), but have not completed the indirect overseas listing; and follow-on offerings of such companies will need to comply with the Trial Measures.
Furthermore, on April 2, 2022, the CSRC released the Provisions on Strengthening the Confidentiality and Archives Administration Related to the Overseas Securities Offering and Listing by Domestic Enterprises (Drafts for Comments) (the “Confidentiality and Archives Administration Provisions”), which were open for public comments until April 17, 2022. The Confidentiality and Archives Administration Provisions require, among others, that PRC domestic enterprises seeking to offer and list securities in overseas markets, either directly or indirectly, shall establish the confidentiality and archives system, and shall complete approval and filing procedures with competent authorities, if such PRC domestic enterprises or their overseas listing entities provide or publicly disclose documents or materials involving state secrets and work secrets of PRC government agencies to relevant securities companies, securities service institutions, overseas regulatory agencies and other entities and individuals. It further stipulates that providing or publicly disclosing documents and materials which may adversely affect national security or public interests, and accounting files or copies of important preservation value to the state and society shall be subject to corresponding procedures in accordance with relevant laws and regulations. As of the date of this annual report, the Confidentiality and Archives Administration Provisions had been released for public comments only and the final version and effective date of such regulations are subject to change with substantial uncertainty.
Our PRC subsidiaries accounted for less than 50% of our consolidated revenues, profit, total assets and net assets in 2021, 2022 and 2023. However, the interpretation, application and enforcement of the Trial Measures are still evolving and it remains uncertain whether the requirements under the Trial Measures are applicable to a securities offering by us.
Any failure to obtain or delay in obtaining such approval, filing or completing such procedures for the Business Combination, the offering conducted by us under our effective registration statement or any other capital raising activities, or a rescission of any such approval or filing obtained by us, would subject us to sanctions by the CSRC or other PRC regulatory authorities. These regulatory authorities may impose fines and penalties on our operations in China, limit our ability to pay dividends outside of China, limit our operating privileges in China, delay or restrict the repatriation of cash or future capital raising activities into China, or take other actions that could materially and adversely affect our business, financial condition, results of operations and prospects, as well as limit our ability to offer or continue to offer securities to investors and cause the value of such securities to significantly decline.
Corresponding to the proposed new rules on overseas listing, the Special Administrative Measures (Negative List) for Foreign Investment Access (2021 Edition) (the “2021 National Negative List”) and the Special Administrative Measures (Negative List) for Foreign Investment Access in Pilot Free Trade Zones (2021 Edition) (the “2021 FTZ Negative List”) (collectively the “2021 Negative Lists”) promulgated on December 27, 2021 provide that any domestic enterprise engaged in businesses prohibited by the 2021 Negative Lists that intends to issue and list shares overseas shall obtain pre-approval from relevant authorities, the foreign investors shall not participate in the management of the enterprise, and that the shareholding percentage of foreign investors shall comply with the relevant measures applicable to foreign investors’ domestic securities investments by reference. We believe we are not currently engaged in any business that falls into the 2021 Negative Lists.
31
Table of Contents
On December 28, 2021, the Cyberspace Administration of China, together with certain other government authorities, promulgated the Revised Cybersecurity Review Measures that took effect from February 15, 2022, pursuant to which online platform operator holding over one million users’ information must apply for a cybersecurity review before listing abroad, and operators of “critical information infrastructure” that intend to purchase internet products and services that will or may affect national security must apply for a cybersecurity review. Furthermore, the competent government authorities may also initiate a cybersecurity review against the relevant operators where the authorities believe that the network product or service or data processing activities affect or may affect national security. However, the scope of potential operators of “critical information infrastructure” remains unclear. In addition, the scope of network product or service or data processing activities that will or may affect national security is also unclear and subject to regulatory interpretation. As of the date of this annual report (i) we had not been informed by any PRC governmental authority of any requirement that we were required to apply for a cybersecurity review; (ii) we did not hold or process personal information of over one million users; and (iii) we had not received any investigation, notice, warning, or sanctions from applicable government authorities in relation to national security. Nonetheless, the interpretation and implementation of the Revised Cybersecurity Review Measures is subject to uncertainties, and the relevant laws and regulations may also change in the future. As a result of such regulatory development, government authorities in China could conduct a cybersecurity review over our PRC subsidiaries, which may have a material adverse effect on our business, results of operations and financial condition.
Changes in tax laws, regulations and policies in jurisdictions in which we operate may materially and adversely affect our results of operations and financial condition.
We operate our business in multiple jurisdictions across EMEA, North America and Asia, and we are subject to income taxes in these jurisdictions. Changes in tax laws and regulations in the relevant jurisdictions may change our tax obligations. Furthermore, interpretations and enforcement policies with respect to existing tax laws and regulations may also evolve over time. Any of the above developments could have a material and adverse impact on our results of operations and financial condition.
For example, under the PRC Enterprise Income Tax Law and its implementation rules, an enterprise established outside of the PRC with its “de facto management body” within the PRC is considered a “resident enterprise” and will be subject to the enterprise income tax on its global income at the rate of 25%. The implementation rules define the term “de facto management body” as the body that exercises full and substantial control and overall management over the business, productions, personnel, accounts and properties of an enterprise. In 2009, the State Administration of Taxation, or SAT, issued a circular, known as SAT Circular 82, which provides certain specific criteria for determining whether the “de facto management body” of a PRC- controlled enterprise that is incorporated offshore is located in the PRC. Although this circular applies only to offshore enterprises controlled by PRC enterprises or PRC enterprise groups, rather than those controlled by PRC individuals or foreigners, the criteria set forth in the circular may reflect the SAT’s general position on how the “de facto management body” text should be applied in determining the tax resident status of all offshore enterprises. According to SAT Circular 82, an offshore incorporated enterprise controlled by a PRC enterprise or a PRC enterprise group will be regarded as a PRC tax resident by virtue of having its “de facto management body” in the PRC, and will be subject to PRC enterprise income tax on its global income only if all of the following conditions are met: (i) the places where the senior management personnel responsible for the execution of the daily management and operation of production and business of our offshore enterprises and the relevant senior personnel departments performing such duties are mainly located within China; (ii) the decisions of our offshore enterprises over finance (e.g. borrowing, lending, financing, financial risk controls, etc.) and personnel (e.g. appointment, dismissal and remuneration, etc.) matters are made by organization(s) or individual(s) located in China or subject to approval of organization(s) or individual(s) located in China; (iii) the main properties, accounting ledger, corporate seal, minutes of the board meetings and shareholders’ meetings, etc. of our offshore enterprises are situated or kept in China, and (iv) 50% (inclusive) or above of directors with voting rights or senior management personnel of our offshore enterprises ordinarily reside in China.
32
Table of Contents
We believe our company is not a PRC resident enterprise for PRC tax purposes. However, the tax resident status of an enterprise is subject to determination by the PRC tax authorities and uncertainties remain with respect to the interpretation of the term “de facto management body.” If the PRC tax authorities determine that our company is a PRC resident enterprise for enterprise income tax purposes, we would be subject to PRC enterprise income on our worldwide income at the rate of 25%. In the event of such regulatory development, we would seek to claim deductions in other relevant jurisdictions, but there can be no assurance that such efforts would effectively mitigate the incremental tax burdens on us. Furthermore, we would be required to withhold a 10% tax from dividends we pay to our shareholders that are non-resident enterprises. In addition, non-resident enterprise shareholders (including the common stockholders) may be subject to PRC tax on gains realized on the sale or other disposition of the common stock, if such income is treated as sourced from within the PRC Furthermore, if we are deemed a PRC resident enterprise, dividends paid to our non-PRC individual shareholders (including the common stockholders) and any gain realized on the transfer of the common stock or ordinary shares by such shareholders may be subject to PRC tax at a rate of 20% (which, in the case of dividends, may be withheld at source by us). These rates may be reduced by an applicable tax treaty, but it is unclear whether non- PRC shareholders of our company would be able to claim the benefits of any tax treaties between their country of tax residence and the PRC in the event that we are treated as a PRC resident enterprise. Any such tax may reduce the returns on your investment in our common stock.
Costs and difficulties inherent in managing cross-border business operations may negatively affected our results of operations. Because of the costs and difficulties inherent in managing cross-border business operations, our results of operations may be negatively impacted.
Managing a business, operations, personnel or assets in another country is challenging and costly. Any management that we may have may be inexperienced in cross-border business practices and unaware of significant differences in accounting rules, legal regimes and labor practices. Even with a seasoned and experienced management team, the costs and difficulties inherent in managing cross-border business operations, personnel and assets can be significant (and much higher than in a purely domestic business) and may negatively impact our financial and operational performance.
The conflict in Ukraine and sanctions and export controls imposed in response to the conflict, including on Russia and Belarus, may adversely affect our business and other escalating global trade tensions, wars and conflicts, and the adoption or expansion of economic sanctions, export controls, or other trade restrictions could negatively affect us.
Due to ongoing conflict in Ukraine and resulting geopolitical tensions, many governments around the world, including those of the United States, the European Union, the United Kingdom and other jurisdictions, have imposed sanctions on Russia, Belarus, and the Ukrainian regions of Donetsk and Luhansk as well as on certain persons, entities from and industries within those regions, as well as export controls on exports or reexports to Russia or Belarus and involving certain industries and products and the exclusion of certain Russian financial institutions from the SWIFT system. On March 11, 2022, the President of the United States issued an executive order prohibiting exports to Russia and Belarus of luxury goods (including, inter alia, apparel, footwear and certain accessories with a per unit wholesale price of $1,000 or more). Shortly thereafter, on March 15, 2022, the Council of the European Union imposed new sanctions on Russia prohibiting the export of luxury goods having a value in excess of €300 per item (including clothing, footwear, leather and fashion accessories). On April 14, 2022, the United Kingdom implemented a prohibition on the export of luxury goods, which includes specifically defined goods generally in excess of £250 in value, to or for use in Russia. These and any additional sanctions or export controls, as well as any counter responses by the governments of Russia or other countries, are adversely affecting, and will continue to adversely affect, directly or indirectly, our supply chain and customers, as well as the global financial markets and financial services industry.
In light of the current crisis, there is also no assurance that we will be able to collect from our franchisees and distributors in Russia certain outstanding receivable amounts for completed sales of the Spring/Summer 2022 collection; as of the date of this annual report, such amounts were not material. Finally, several of the agreements with our wholesale customers in Russia are due to expire during the course of 2025. It is uncertain whether, when and at what terms and conditions such agreements will be renewed. Any of the foregoing factors could have a material adverse effect on our business, results of operations and financial condition.
In general, the banking, economic and monetary crisis triggered by the conflict may reduce customers’ interest for, and financial ability to buy, luxury products. An expansion of the conflict to other European countries, the United States or other parts of the world, or the worsening of the world economic situation in terms of inflation, energy costs and purchase power, is likely to translate into a lower propensity to spend on luxury good products and potentially impact our business.
33
Table of Contents
Adverse developments affecting the financial services industry, such as actual events or concerns involving liquidity, defaults or non-performance by financial institutions or transactional counterparties, could adversely affect our business operations, results of operations and financial condition.
Events involving limited liquidity, defaults, non-performance or other adverse developments that affect financial institutions, transactional counterparties or other companies in the financial services industry or the financial services industry generally, or concerns or rumors about any events of these kinds or other similar risks, have in the past and may in the future lead to market-wide liquidity problems. For example, on March 10, 2023, Silicon Valley Bank (“ SVB”) was closed by the California Department of Financial Protection and Innovation, which appointed the U.S. Federal Deposit Insurance Corporation (“FDIC”) as receiver. Similarly, on March 12, 2023, Signature Bank was also placed into receivership. Although a statement by the U.S. Department of the Treasury, the Federal Reserve and the FDIC indicated that all depositors of SVB would have access to all of their money after only one business day of closure, including funds held in uninsured deposit accounts, borrowers under credit agreements, letters of credit and certain other financial instruments with SVB, Signature Bank or any other financial institution that is placed into receivership by the FDIC may be unable to access undrawn amounts thereunder. Although currently we do not have any deposits at or credit facilities with either bank, some of our current vendors might be affected. If the failure of Signature Bank or any other financial institution that is placed into receivership causes any of our vendors to face financial difficulties, it could lead to a delay or inability to deliver goods and services to us. On March 20, 2023, UBS Group AG agreed to buy Credit Suisse Group AG in a Swiss government-brokered deal aimed at containing a crisis of confidence that had started to spread across global financial markets. Despite the steps taken by central banks and other regulators to contain the effects of events affecting these financial institutions on the broader global financial system, it is not possible to predict whether other financial institutions would suffer similar problems. In the event of bankruptcy of any of the financial institutions in which the Group has deposits or investment assets, the Group may not be able to recover any such deposits or investment assets in full. Any further developments that might adversely impact financial institutions to which we have exposure in could materially and adversely affect our business operations, results of operations and overall financial condition.
We rely to a significant extent on dividends and other distributions on equity paid by our principal operating subsidiaries to fund offshore cash and financing requirements. Any limitation on the ability of our operating subsidiaries to make payments to us could have a material adverse effect on our ability to conduct our business.
We are a holding company, and to a significant extent, rely on dividends and other distributions on equity paid by our principal operating subsidiaries for the funds necessary to fund inter-company loans, service any debt we may incur, pay our expenses, including our expenses as a publicly traded company, and to pay any dividends and other cash distributions to our shareholders. The earnings from, or other available assets of, our principal operating subsidiaries may not be sufficient to make distributions or pay dividends, pay expenses or satisfy our other financial obligations.
In addition, when our principal operating subsidiaries incur additional debt, the instruments governing the debt may restrict their ability to pay dividends or make other distributions or remittances to us. Further, the laws, rules and regulations applicable to most of our subsidiaries permit payments of dividends only out of their retained earnings, if any, determined in accordance with applicable local accounting standards and regulations. In addition, under the laws and regulations applicable to certain of our subsidiaries, statutory reserves for employees and pensions are required to be maintained. There are also other limitations under applicable local rules and regulations that may limit the portion of the available capital in our operating subsidiaries which may be transferred to shareholders as dividends. Any such limitations on the ability of our operating subsidiaries to make payments to us could have a material adverse effect on our ability to conduct our business.
34
Table of Contents
We expect to incur negative operating cash flows in the next few years and may need to raise substantial additional funding. If we are unable to raise capital or obtain sufficient funding from our shareholders when needed or on attractive terms, we would be forced to delay, scale back or discontinue some of our businesses, operations, investments, acquisitions or other growth initiatives.
We expect to incur negative operating cash flows over the next few years and accordingly may require additional funding in the future to support our operations and growth strategies. There can be no assurance that we will be able to raise sufficient capital from the capital markets or through borrowings, shareholder loans or other fundings sources on acceptable terms or at all. If we are unable to obtain sufficient funding on a timely basis and on acceptable terms and continue as a going concern, we may be required to significantly curtail, delay or discontinue one or more of our product development programs, investments, acquisitions or other growth initiatives or to otherwise reduce or discontinue our operations. In general, we may be unable to expand our operations or otherwise capitalize on business opportunities, and defend against and prosecute litigation necessary to commercialize our product candidates as desired, which could materially affect our business, financial condition and results of operations. If we are ultimately unable to continue as a going concern, we may have to seek the protection of bankruptcy laws or liquidate our assets and may receive less than the value at which those assets are carried on our audited financial statements, and it is likely that our securityholders will lose all or a part of their investment. In particular, various investments in the pipeline, including our incubator project dedicated to minority investments in fast-growing companies with strengths in creativity, digitalization, as well as sustainable and intelligent supply chains may be put on hold.
Failure to comply with the terms of our indebtedness could have a material adverse effect on our ability to conduct our business.
Under the terms of our existing indebtedness and any debt financing arrangement that we may enter into in the future, we are and may be subject to covenants that could, among other things, restrict our business and operations. If we breach any of these covenants, our lenders under our credit facilities will be entitled to accelerate our debt obligations. Any default under our debts could require repayments prior to maturity as well as limit our ability to obtain additional financing, which in turn may have a material adverse effect on our cash flow and liquidity.
Risks Relating to Our Securities
The trading price of our securities has been and is likely to continue to be volatile, which could result in substantial losses to holders of our securities.
The trading price of our securities has been and is likely to continue to be volatile and could fluctuate widely in response to a variety of factors, many of which are beyond our control. Any of the factors listed below could have a material adverse effect on your investment in our securities and our securities may trade at prices significantly below the price you paid for them. In such circumstances, the trading price of our securities may not recover and may experience a further decline. Factors affecting the trading price of our securities may include:
| • | actual or anticipated fluctuations in our quarterly financial results or the quarterly financial results of companies perceived to be similar to us; |
| • | changes in the market’s expectations about our operating results; |
| • | success of competitors; |
| • | our operating results failing to meet the expectation of securities analysts or investors in a particular period; changes in financial estimates and recommendations by securities analysts concerning us or the personal luxury goods market in general; |
| • | operating and share price performance of other companies that investors deem comparable to us; |
| • | our ability to enhance our marketing strategies; |
| • | changes in laws and regulations affecting our business; |
| • | our ability to meet compliance requirements; |
35
Table of Contents
| • | commencement of, or involvement in, litigation involving us; |
| • | changes in our capital structure, such as future issuances of securities or the incurrence of additional debt; |
| • | the volume of our securities available for public sale; |
| • | any major change in our board or management; |
| • | sales of substantial amounts of securities by the our directors, executive officers or significant shareholders or the perception that such sales could occur; and |
| • | general economic and political conditions such as recessions, interest rates, international currency fluctuations, pandemic and acts of war or terrorism. |
Broad market and industry factors may materially harm the market price of our securities irrespective of our operating performance. The stock market in general, and the NYSE in particular, have experienced price and volume fluctuations that have often been unrelated or disproportionate to the operating performance of the particular companies affected. The trading prices and valuations of these stocks, and of our securities, may not be predictable. A loss of investor confidence in the market for retail stocks or the stocks of other companies which investors perceive to be similar to us could depress the trading price of our securities regardless of our business, prospects, financial conditions or results of operations. A decline in the market price of our securities also could adversely affect our ability to issue additional securities and our ability to obtain additional financing in the future.
Sales of a substantial number of our securities in the public market by our existing securityholders could cause the price of our Ordinary Shares and Warrants to fall.
Certain of our existing securityholders, including Fosun and its affiliates, Meritz, the PIPE Investors (as defined below), the Sponsor, Aspex Master Fund, or Aspex, and certain former shareholders of FFG, can resell, under our effective registration statements, a substantial percentage of our issued and outstanding Ordinary Shares and Warrants. The sale of such securities in the public market by our existing securityholders, or the perception that those sales might occur, could depress the market price of our Ordinary Shares and Warrants and could depress the market price of our Ordinary Shares and Warrants and could impair our ability to raise capital through the sale of additional equity securities. We are unable to predict the effect that such sales may have on the prevailing market price of our Ordinary Shares and Warrants. See also “ —Future resales of our Ordinary Shares issued to Fosun and its affiliates may cause the market price of our securities to drop significantly, even if our business is doing well.”
In addition, certain of our existing securityholders acquired the Ordinary Shares at prices ranging from $0.005 per share to $10.00 per share. By comparison, the offering price to public shareholders in PCAC’s initial public offering was $10.00 per unit, which consisted of one share and one-half of one warrant. Consequently, certain of our existing securityholders may realize a positive rate of return on the sale of their shares even if the market price of Ordinary Share is below $10.00 per share, in which case the public shareholders may experience a negative rate of return on their investment.
A certain number of our Warrants have become exercisable for our Ordinary Shares, which would increase the number of shares eligible for future resale in the public market and result in dilution to our shareholders.
Our Warrants to purchase an aggregate of 31,979,969 Ordinary Shares have become exercisable in accordance with the terms of the Assignment, Assumption and Amendment Agreement and the Existing Warrant Agreement governing those securities on January 13, 2023. The exercise price of these Warrants is $11.50 per share. Our Warrants will expire on December 14, 2027 (i.e., five years after the completion of the Business Combination) or earlier upon redemption or liquidation in accordance with their terms. To the extent such Warrants are exercised, additional Ordinary Shares will be issued, which will result in dilution to the holders of our Ordinary Share and increase the number of shares eligible for resale in the public market. Sales of substantial numbers of such shares in the public market or the fact that such Warrants may be exercised could adversely affect the market price of our Ordinary Shares.
36
Table of Contents
Assuming the exercise of all outstanding Warrants for cash, we would receive aggregate proceeds of approximately $367.8 million. However, we will only receive such proceeds if all Warrant holders fully exercise their Warrants. The exercise price of our Warrants is $11.50 per share, subject to adjustment. We believe that the likelihood that Warrant holders determine to exercise their Warrants, and therefore the amount of cash proceeds that we would receive, is dependent upon the market price of our Ordinary Shares. If the market price for our Ordinary Shares is less than the exercise price of the Warrants (on a per share basis), we believe that Warrant holders will be very unlikely to exercise any of their Warrants, and accordingly, we will not receive any such proceeds. There is no assurance that the Warrants will be “in the money” prior to their expiration or that the Warrant holders will exercise their Warrants. Warrant holders have the option to exercise the Warrants on a cashless basis in accordance with the Existing Warrant Agreement. To the extent that any Warrants are exercised on a cashless basis, the amount of cash we would receive from the exercise of the Warrants will decrease.
If securities or industry analysts do not publish research, publish inaccurate or unfavorable research or cease publishing research about us, our share price and trading volume could decline significantly.
The trading market for our securities will depend, in part, on the research and reports that securities or industry analysts publish about us or our business. We may be unable to sustain coverage by well-regarded securities and industry analysts. If either none or only a limited number of securities or industry analysts maintain coverage, or if these securities or industry analysts are not widely respected within the general investment community, the demand for our Ordinary Shares could decrease, which might cause our share price and trading volume to decline significantly. In the event that we obtain securities or industry analyst coverage, if one or more of the analysts who cover us downgrade their assessment or publish inaccurate or unfavorable research about our business, the market price and liquidity for our Ordinary Shares could be negatively impacted.
Future resales of our Ordinary Shares issued to Fosun and its affiliates may cause the market price of our securities to drop significantly, even if our business is doing well.
In connection with the Business Combination, Fosun and its affiliates received, among other things, a significant amount of Ordinary Shares. Fosun and its affiliates have certain registration rights with respect to their Ordinary Shares. The previously lock-up arrangement with Fosun and its affiliates has expired. We have filed a registration statement registering for resale of certain of our securities, including Ordinary Shares held by Fosun and its affiliates, which has become effective.
In addition, Fosun may cause its affiliates to sell Ordinary Shares pursuant to Rule 144 under the Securities Act (“Rule 144”), if available. In such event, the resales must meet the criteria and conform to the requirements of that rule, including, waiting until one year after our filing with the SEC of a shell company report on Form 20-F containing Form 10 type information reflecting the Business Combination on December 20, 2022.
Pursuant to our effective resale registration statement or upon satisfaction of the requirements of Rule 144, or another applicable exemption from registration, Fosun and its affiliates may sell large amounts of Ordinary Shares in the open market or in privately negotiated transactions, which could have the effect of increasing the volatility in our Ordinary Shares price or putting significant downward pressure on the price of our securities.
The Existing Warrant Agreement, which has been assigned to us pursuant to the Assignment, Assumption and Amendment Agreement, designates the courts of the State of New York or the United States District Court for the Southern District of New York as the sole and exclusive forum for certain types of actions and proceedings that may be initiated by Warrant holders, which could limit the ability of Warrant holders to obtain a favorable judicial forum for disputes with us in connection with such Warrants.
Under the terms of the Assignment, Assumption and Amendment Agreement, the Existing Warrant Agreement was assigned by PCAC to us at the closing of our Business Combination. In connection with this assignment, each PCAC warrant was converted into one Warrant of us at such time and all of the terms of the Existing Warrant Agreement not amended by the Assignment, Assumption and Amendment Agreement remain in effect and applicable to each Warrant holder and to us after such Closing.
37
Table of Contents
The Existing Warrant Agreement provides that, subject to applicable law, (i) any action, proceeding or claim against us arising out of or relating in any way to the Existing Warrant Agreement, including under the Securities Act, will be brought and enforced in the courts of the State of New York or the United States District Court for the Southern District of New York, and (ii) that we irrevocably submit to such jurisdiction, which jurisdiction shall be the exclusive forum for any such action, proceeding or claim. We have waived any objection to such exclusive jurisdiction and that such courts represent an inconvenient forum. Notwithstanding the foregoing, these provisions of the Existing Warrant Agreement do not apply to suits brought to enforce any liability or duty created by the Exchange Act or any other claim for which the federal district courts of the United States of America are the sole and exclusive forum. Any person or entity purchasing or otherwise acquiring any interest in any Warrants under the Existing Warrant Agreement shall be deemed to have notice of and to have consented to the forum provisions of the Existing Warrant Agreement. If any action, the subject matter of which is within the scope the forum provisions of the Existing Warrant Agreement, is filed in a court other than a court of the State of New York or the United States District Court for the Southern District of New York (a “foreign action”) in the name of any holder of the Warrants, such holder shall be deemed to have consented to: (x) the personal jurisdiction of the state and federal courts located in the State of New York in connection with any action brought in any such court to enforce the forum provisions (an “enforcement action”), and (y) having service of process made upon such Warrant holder in any such enforcement action by service upon such holder’s counsel in the foreign action as agent for such Warrant holder.
Since the provisions of the Existing Warrant Agreement continue to apply unless amended by the Assignment, Assumption and Amendment Agreement and the conversion of each Warrant from a PCAC warrant into a Warrant, and since the choice-of-forum and related provisions have not been amended by the Assignment, Assumption and Amendment Agreement, the choice-of-forum provision limits a Warrant holder’s ability to bring a claim in a judicial forum that it finds favorable for disputes with us, which may discourage such lawsuits. Alternatively, if a court were to find this provision of the Existing Warrant Agreement inapplicable or unenforceable with respect to one or more of the specified types of actions or proceedings, we may incur additional costs associated with resolving such matters in other jurisdictions, which could materially and adversely affect our business, financial condition and results of operations and result in a diversion of the time and resources of our management and board of directors.
The requirements of being a public company may strain our resources and divert our management’s attention.
We are subject to the reporting requirements of the Exchange Act, the Sarbanes-Oxley Act, the Dodd-Frank Act, NYSE listing requirements and other applicable securities rules and regulations. As such, we incur relevant legal, accounting and other expenses, and these expenses may increase even more if we no longer qualify as an “emerging growth company,” as defined in Section 2(a) of the Securities Act. The Exchange Act requires, among other things, that we file annual and current reports with respect to our business and operating results. The Sarbanes-Oxley Act requires, among other things, that we maintain effective disclosure controls and procedures and internal control over financial reporting. We may need to hire more employees or engage outside consultants to comply with these requirements, which will increase our costs and expenses.
Changing laws, regulations and standards relating to corporate governance and public disclosure are creating uncertainty for public companies, increasing legal and financial compliance costs and making some activities more time-consuming. These laws, regulations and standards are subject to varying interpretations, in many cases due to their lack of specificity, and, as a result, their application in practice may evolve over time as new guidance is provided by regulatory and governing bodies. This could result in continuing uncertainty regarding compliance matters and higher costs necessitated by ongoing revisions to disclosure and governance practices. We expect these laws and regulations to increase our legal and financial compliance costs and to render some activities more time-consuming and costly, although we are currently unable to estimate these costs with any degree of certainty.
The need to establish the corporate infrastructure demanded of a public company may divert the management’s attention from implementing our growth strategy, which could prevent us from improving our business, financial condition and results of operations. Furthermore, we expect these rules and regulations to make it more difficult and more expensive for us to obtain director and officer liability insurance, and consequently we may be required to incur substantial costs to maintain the same or similar coverage. These additional obligations could have a material adverse effect on our business, financial condition, results of operations and prospects.
38
Table of Contents
As a result of disclosure of information in this annual report and in filings required of a public company, our business and financial condition will become more visible, which we believe may result in threatened or actual litigation, including by competitors and other third parties. If such claims are successful, our business and operating results could be adversely affected, and, even if the claims do not result in litigation or are resolved in our favor, these claims, and the time and resources necessary to resolve them, could cause an adverse effect on our business, financial condition, results of operations, prospects and reputation.
Our ability to maintain the listing of our securities on the NYSE may be dependent on the PCAOB’s continued access to inspect our independent auditors.
Pursuant to the HFCA Act, if the SEC determines that we have filed audit reports issued by a registered public accounting firm that has not been subject to inspection by the PCAOB for two consecutive years, the SEC shall prohibit our securities from being traded on a national securities exchange or in the over-the-counter trading market in the U.S. Our independent auditor, Grant Thornton Zhitong Certified Public Accountants LLP, is an independent registered accounting firm based in mainland China.
The SEC and the PCAOB have adopted rules to implement the HFCA Act. Specifically, on November 5, 2021, the SEC announced the approval of the PCAOB’s new rule related to the PCAOB’s responsibilities under the HFCA Act, which provides a framework for the PCAOB to use when determining, as contemplated under the HFCA Act, whether it is unable to inspect or investigate completely registered public accounting firms located in a foreign jurisdiction because of a position taken by one or more authorities in that jurisdiction. On December 2, 2021, the SEC announced the adoption of final amendments to implement the submission and disclosure requirement of the HFCA Act following its interim final amendments announced in March 2021. The adopting release establishes the SEC’s procedures for identifying covered issuers and for prohibiting the trading of covered issuers’ securities. Pursuant to the HFCA Act, the PCAOB issued determinations on December 16, 2021 notifying the SEC that it was unable to inspect or investigate completely accounting firms headquartered in mainland China or Hong Kong, including our auditor as an independent registered public accounting firm. In March 2022, the SEC issued its first “conclusive list of issuers identified under the HFCAA” indicating that those companies are formally subject to the delisting provisions if they remain on the list for the number of consecutive years provided in the HFCA Act, and the SEC subsequently updated such list.
On August 26, 2022, the PCAOB signed a Statement of Protocol with relevant PRC authorities governing inspections and investigations of audit firms based in China, pursuant to which the PCAOB determined that it has secured complete access to inspect and investigate audit firms based in mainland China or Hong Kong in December 2022 and vacated its December 16, 2021, determinations to the contrary. However, there can be no assurance that the PCAOB will continue to have such access. Should PRC authorities fail to facilitate the PCAOB’s access in the future, the PCAOB may consider the need to issue a new determination, which may affect our ability to maintain the listing of our securities on the U.S. national securities exchanges, including the NYSE, and the trading of them in the over-the-counter trading market. A delisting would substantially impair your ability to sell or purchase our securities when you wish to do so, and the risk and uncertainty associated with a potential delisting would have a negative impact on the price of our securities.
39
Table of Contents
We qualify as a foreign private issuer within the meaning of the rules under the Exchange Act, and as such we are exempt from certain provisions applicable to United States domestic public companies and will follow certain home-country corporate governance practices in lieu of certain NYSE requirements applicable to U.S. issuers.
Because we qualify as a foreign private issuer under the Exchange Act, we are exempt from certain provisions of the securities rules and regulations in the United States that are applicable to U.S. domestic issuers, including: (i) the rules under the Exchange Act requiring the filing of quarterly reports on Form 10-Q or current reports on Form 8-K with the SEC; (ii) the sections of the Exchange Act regulating the solicitation of proxies, consents, or authorizations in respect of a security registered under the Exchange Act; (iii) the sections of the Exchange Act requiring insiders to file public reports of their share ownership and trading activities and liability for insiders who profit from trades made in a short period of time; and (iv) the selective disclosure rules by issuers of material nonpublic information under Regulation FD.
We are required to file an annual report on Form 20-F within four months of the end of each fiscal year. In addition, we intend to publish our results on a half-year basis through press releases, distributed pursuant to the rules and regulations of the NYSE. Press releases relating to financial results and material events will also be furnished to the SEC on Form 6-K. However, the information we are required to file with or furnish to the SEC will be less extensive and less timely compared to that required to be filed with the SEC by U.S. domestic issuers. Accordingly, you may receive less or different information about us than you would receive about a U.S. domestic public company.
In addition, as a “foreign private issuer,” we are permitted to follow certain home-country corporate governance practices in lieu of certain NYSE requirements. A foreign private issuer must disclose in its annual reports filed with the SEC each NYSE requirement with which it does not comply followed by a description of its applicable home country practice. We currently intend to follow some, but not all of the corporate governance requirements of NYSE for U.S. domestic issuers. With respect to the corporate governance requirements of the NYSE that we do follow, we cannot make any assurances that we will continue to follow such corporate governance requirements in the future, and may therefore in the future, rely on available NYSE exemptions that would allow us to follow our home country practice. Unlike the requirements of the NYSE for U.S. domestic issuers, we are not required to, under the corporate governance practice and requirements in the Cayman Islands, have a board consisting of a majority of independent directors, nor are we required to have a compensation committee or a nomination or corporate governance committee consisting entirely of independent directors, obtain shareholders’ approval for issuance of securities in certain situations or have regularly scheduled executive sessions with only independent directors each year. Such Cayman home country practices may afford less protection to holders of our Ordinary Shares. For additional information regarding the home country practices we intend to follow in lieu of the NYSE requirements, see the section entitled “Item 6. Directors, Senior Management and Employees—C. Board Practices—Foreign Private Issuer Status.”
We could lose our status as a foreign private issuer under current SEC rules and regulations if more than 50% of our outstanding voting securities become directly or indirectly held of record by U.S. holders and any one of the following is true: (i) the majority of our directors or executive officers are U.S. citizens or residents; (ii) more than 50% of our assets are located in the United States; or (iii) our business is administered principally in the United States. If we lose our status as a foreign private issuer in the future, we will no longer be exempt from the rules described above and, among other things, will be required to file periodic reports and annual and quarterly financial statements as if we were a company incorporated in the United States. If this were to happen, we would likely incur substantial costs in fulfilling these additional regulatory requirements and members of our management would likely have to divert time and resources from other responsibilities to ensuring these additional regulatory requirements are fulfilled. See “Item 6. Directors, Senior Management and Employees—C. Board Practices—Foreign Private Issuer Status.”
As a company incorporated in the Cayman Islands, we are permitted to adopt certain home country practices in relation to corporate governance matters that differ significantly from NYSE corporate governance listing standards applicable to domestic U.S. companies; these practices may afford less protection to shareholders than they would enjoy if we complied fully with NYSE corporate governance listing standards.
We are a company incorporated in the Cayman Islands and are listed on the NYSE. NYSE market rules permit a foreign private issuer like us to follow the corporate governance practices of our home country. Certain corporate governance practices in the Cayman Islands, which is our home country, may differ significantly from NYSE corporate governance listing standards applicable to domestic U.S. companies.
Among other things, we are not required to have: (i) a majority-independent board of directors; (ii) a compensation committee consisting of independent directors; (iii) a nominating and corporate governance committee consisting of independent directors; or (iv) regularly scheduled executive sessions with only independent directors each year.
40
Table of Contents
Although not required and as may be changed from time to time, we have a majority-independent board of directors, a majority-independent compensation committee and a nominating and corporate governance committee. Subject to the foregoing, we rely on the exemptions listed above. As a result, you may not be provided with the benefits of certain corporate governance requirements of the NYSE applicable to U.S. domestic public companies. See “Item 6. Directors, Senior Management and Employees—C. Board Practices—Foreign Private Issuer Status.”
You may face difficulties in protecting your interests, and your ability to protect your rights through U.S. courts may be limited, because we are incorporated under the laws of the Cayman Islands, we conduct substantially all of our operations, and a majority of our directors and executive officers reside, outside of the United States. The ability of U.S. authorities to bring actions for violations of U.S. securities laws and regulations against us and our directors and executive officers may be limited and accordingly you may not be afforded the same protection as provided to investors in U.S. domestic companies.
We are an exempted company limited by shares incorporated under the laws of the Cayman Islands, and conduct a majority of our operations through our subsidiary, FFG, outside the United States. A majority of our assets are located outside the United States. A majority of our officers and directors reside outside the United States and a substantial portion of the assets of those persons are located outside of the United States. As a result, it could be difficult or impossible for you to bring an action against us or against these individuals outside of the United States in the event that you believe that your rights have been infringed upon under the applicable securities laws or otherwise. Even if you are successful in bringing an action of this kind, the laws of the Cayman Islands and jurisdictions of our subsidiaries could render you unable to enforce a judgment against our assets or the assets of our directors and officers.
Our management has been advised that jurisdictions where we are operating such as the PRC, do not have treaties providing for the reciprocal recognition and enforcement of judgments of courts with the United States. Further, it is unclear if extradition treaties now in effect between the United States and these jurisdictions would permit effective enforcement of criminal penalties for violations of U.S. federal securities laws. In addition, our corporate affairs are governed by the Amended Articles, the Cayman Companies Act and the common law of the Cayman Islands. The rights of shareholders to take action against the directors, actions by minority shareholders and the fiduciary duties of our directors to us under Cayman Islands law are to a large extent governed by the common law of the Cayman Islands. The common law of the Cayman Islands is derived in part from comparatively limited judicial precedent in the Cayman Islands as well as from the common law of England, the decisions of whose courts are of persuasive authority, but are not binding, on a court in the Cayman Islands. The rights of our shareholders and the fiduciary duties of our directors under Cayman Islands law may not be as clearly established as they would be under statutes or judicial precedent in some jurisdictions in the United States. In particular, the Cayman Islands has a different body of securities laws than the United States. Some U.S. states, such as Delaware, may have more fully developed and judicially interpreted bodies of corporate law than the Cayman Islands. In addition, Cayman Islands companies may not have standing to initiate a shareholder derivative action in a federal court of the United States.
Shareholders of Cayman Islands exempted companies like us have no general rights under Cayman Islands law to inspect corporate records (other than the memorandum and articles of association, special resolutions and register of mortgages and charges) or to obtain copies of lists of shareholders of these companies. Our directors will have discretion under the Amended Articles to determine whether or not, and under what conditions, our corporate records may be inspected by our shareholders, but we are not obliged to make them available to the shareholders. This may make it more difficult for you to obtain the information needed to establish any facts necessary for a shareholder motion or to solicit proxies from other shareholders in connection with a proxy contest.
The courts of the Cayman Islands are unlikely (i) to recognize or enforce against us judgments of courts of the United States predicated upon the civil liability provisions of the federal securities laws of the United States or any state; and (ii) in original actions brought in the Cayman Islands, to impose liabilities against us predicated upon the civil liability provisions of the federal securities laws of the United States or any state, so far as the liabilities imposed by those provisions are penal in nature. In those circumstances, although there is no statutory enforcement in the Cayman Islands of judgments obtained in the United States, the courts of the Cayman Islands will recognize and enforce a foreign money judgment of a foreign court of competent jurisdiction without retrial on the merits based on the principle that a judgment of a competent foreign court imposes upon the judgment debtor an obligation to pay the sum for which judgment has been given provided certain conditions are met. For a foreign judgment to be enforced in the Cayman Islands, such judgment must be final and conclusive and for a liquidated sum, and must not be in respect of taxes or a fine or penalty, inconsistent with a Cayman Islands judgment in respect of the same matter, impeachable on the grounds of fraud or obtained in a manner, or be of a kind the enforcement of which is, contrary to natural justice or the public policy of the Cayman Islands (awards of punitive or multiple damages may well be held to be contrary to public policy). A Cayman Islands Court may stay enforcement proceedings if concurrent proceedings are being brought elsewhere.
41
Table of Contents
Certain corporate governance practices in the Cayman Islands, which is our home country, differ significantly from requirements for companies incorporated in other jurisdictions such as the United States. To the extent we choose to follow home country practice with respect to corporate governance matters, our shareholders may be afforded less protection than they otherwise would under rules and regulations applicable to U.S. domestic issuers. See “Item 6. Directors, Senior Management and Employees—C. Board Practices—Foreign Private Issuer Status.”
As a result of all of the above, our shareholders may have more difficulty in protecting their interests in the face of actions taken by management, members of the board of directors or controlling shareholders than they would as public shareholders of a company incorporated in the United States.
Additionally, the SEC, the U.S. Department of Justice, or the DOJ, and other U.S. authorities often have substantial difficulties in bringing and enforcing actions against non-U.S. companies and non-U.S. persons. Due to jurisdictional limitations, matters of comity and various other factors, the SEC, the DOJ and other U.S. authorities may be limited in their ability to pursue bad actors, including in instances of fraud, in emerging markets such as China. A portion of our operations and assets are located in China. In addition, a majority of our directors and executive officers reside within China. There will be significant legal and other obstacles for U.S. authorities to obtain information needed for investigations or litigation against us or our directors and executive officers if we or any of these individuals engage in fraud or other wrongdoing. In addition, local authorities in China may be constrained in their ability to assist U.S. authorities and overseas investors in connection with legal proceedings. As a result, if we or our directors or executive officers commit any securities law violation, fraud or other financial misconduct, the U.S. authorities may not be able to conduct effective investigations or bring and enforce actions against such parties. Therefore, you may not be able to enjoy the same protection provided by various U.S. authorities as it is provided to investors in U.S. domestic companies.
We may be subject to securities litigation, which is expensive and could divert management attention.
The market price of our Ordinary Shares and Warrants may be volatile and, in the past, companies that have experienced volatility in the market price of their stock have been subject to securities class action litigation. We may be the target of this type of litigation and investigations. For example, as a result of the historical material weaknesses PCAC identified, we may face potential litigation or other disputes which may include, among others, claims invoking the federal and state securities laws, contractual claims or other claims arising from the material weaknesses in PCAC’s internal control over financial reporting and the preparation of PCAC’s financial statements. Securities litigation against us could result in substantial costs and divert management’s attention from other business concerns, which could seriously harm our business.
We may not pay cash dividends in the foreseeable future.
Any decision to declare and pay dividends in the future will be made at the discretion of our board of directors and will depend on, among other things, applicable law, regulations, restrictions, our results of operations, financial condition, cash requirements, contractual restrictions, our future projects and plans and other factors that the board of directors may deem relevant. In addition, our ability to pay dividends depends significantly on the extent to which we receive dividends from FFG and there can be no assurance that FFG will pay dividends. As a result, capital appreciation, if any, of our Ordinary Shares may be an investor’s sole source of gain for the foreseeable future.
42
Table of Contents
The exercise price of our Warrants can fluctuate under certain circumstances which, if triggered can potentially result in material dilution of our then existing shareholders.
As of the date of this annual report, we have a total of 31,979,969 Warrants outstanding, which are exercisable to purchase up to 31,979,969 Ordinary Shares at an exercise price of $11.50 per share. The price at which such Ordinary Shares may be purchased upon exercise of the Warrants may be adjusted in certain circumstances, including, but not limited to, when (i) we undertake certain share capitalizations, share subdivisions, rights offerings or other similar events, or (ii) we pay certain dividends or makes certain distributions in cash, securities or other assets to the holders of Ordinary Shares on account of such Ordinary Shares. These adjustments are intended to provide the investors in our Warrants with partial protection from the effects of actions that dilute their interests in us on a fully-exercised basis. These provisions could result in substantial dilution to investors in our Ordinary Shares.
Certain rights granted to Meritz in the Amended and Restated Meritz Relationship Agreement could limit the funds available to us or potentially result in dilution of our then existing shareholders.
On December 14, 2023, we consummated the Meritz SBSA and Amended and Restated Meritz Relationship Agreement with Meritz. We repurchased from Meritz one Convertible Preference Share and 4,999,999 Ordinary Shares for a price equal to $54.5 million, and Meritz purchased from us 19,050,381 Ordinary Shares (“Subscription Shares”) at an aggregate subscription price of $69.5 million. In connection with the transaction, we granted certain rights to Meritz, which are governed by the Amended and Restated Meritz Relationship Agreement. We entered into a side letter with Meritz on April 30, 2024, which modified the Amended and Restated Relationship Agreement. Pursuant to the side letter, we agreed to repurchase from Meritz 5,245,648 Ordinary Shares in aggregate for a total purchase price of $20.0 million. Furthermore, in the event that the coverage ratio is below 150% on any date during the period from April 30, 2024 to August 30, 2024 (both inclusive), within three business days after occurrence of such, we will repurchase from Meritz such number of additional Ordinary Shares at a price that would yield a XIRR of 11.5% on Meritz’s original purchase price, such that immediately after each such share purchase, the coverage ratio will be equal to 200%. Meritz has a right to put all Subscription Shares (“Put Option”) at a predetermined price upon the occurrence of any of the predetermined events set out in the Amended and Restated Meritz Relationship Agreement. The Put Option will lapse if (i) Meritz fails to serve the relevant exercise notice within ninety days after the Put Option is triggered; or (ii) Meritz has not exercised the Put Option by the date that falls ninety days after the third anniversary of the closing.
Our obligations to pay the Put Option price and our indemnity obligations under the Meritz SBSA are secured by a charge over certain shares of Fosun Tourism Group (“FTG”) held by Fosun International, subject to a top up adjustment with (a) subject to Meritz’s consent which will not be unreasonably withheld, additional shares of FTG, (b) subject to Meritz’s consent which will not be unreasonably withheld, our Ordinary Shares, and/or (c) additional cash in US dollars to be charged. In the event that a pre-agreed coverage ratio falls below 150%, upon Meritz’s notice, we are obligated, among other things, provide additional security by either (i) depositing additional cash in US dollars by way of cash account charge in favor of Meritz (the “Cash Top Up”); (ii) (a) subject to Meritz’s consent which will not be unreasonably withheld, procuring Fosun International to grant a charge over additional shares of FTG in favor of Meritz, or (b) subject to Meritz’s consent which will not be unreasonably withheld, procuring Fosun International to grant a charge over our shares in favor of Meritz (each of (a) and (b), “Share Top Up”); (iii) subject to Meritz’s consent which will not be unreasonably withheld, making a combination of Cash Top Up and Share Top Up; in each case so that the coverage ratio increases to no lower than 200%; or (iv) acquiring all Subscription Shares then held by Meritz at certain price (“Top Up Obligations”). Furthermore, Meritz is entitled to fixed underwriting fees in cash payable quarterly during a period of three years following the closing of the transaction. As of the date of this report, our obligations were also secured by certain of our Ordinary Shares pledged by Fosun International pursuant to the top up adjustment. In addition, we agreed to procure Fosun International to pledge certain number of shares of Paref SA to secure our obligations to repurchase Ordinary Shares from Meritz pursuant to the aforementioned side letter.
We have agreed to repurchase a portion of Meritz’s shares pursuant to the aforementioned side letter. In addition, if the coverage ratio falls below 150% or when the Put Option is triggered, we may be required to use a substantial portion of our cash to fulfill our Top Up Obligations, indemnify Meritz for losses incurred, provide cash security and/or purchase all Subscription Shares held by Meritz if Meritz exercises its Put Option. Such payments, in addition to our obligation to pay the underwriting fees, will reduce the funds available to us for working capital, capital expenditures, and other corporate purposes, which may in turn limit our ability to implement our business strategy. There can be no assurance that we will generate sufficient cash flows from operations or that future financing will be available to us in amounts sufficient to enable us to make required and timely payments under the Amended and Restated Meritz Relationship Agreement, and to fund its operations. For details of Meritz’s investment, see “Item 5. Operating and Financial Review and Prospects—B. Liquidity and Capital Resources—Meritz Private Placement.”
We granted certain registration rights to Meritz with respect to the Ordinary Shares it purchased, and have filed a registration statement registering for resale of these shares. The registration statement has become effective. In addition, if we default on our obligations, Meritz may sell Ordinary Shares pledged by Fosun International. Sale of a substantial amount of our Ordinary Shares by Meritz in the open market or in privately negotiated transactions, which could have the effect of increasing the volatility in our Ordinary Shares price or putting significant downward pressure on the price of our securities.
43
Table of Contents
We have identified material weaknesses in our internal control over financial reporting. If we are unable to remediate these material weaknesses or otherwise fail to maintain an effective system of disclosure controls and internal control over financial reporting, our ability to produce timely and accurate financial statements or comply with applicable regulations could be impaired.
As a public company, we are subject to the reporting requirements of the Exchange Act, the Sarbanes-Oxley Act, and the rules and regulations of the applicable listing standards of the NYSE. We expect that the requirements of these rules and regulations will continue to increase our legal, accounting and financial compliance costs, make some activities more difficult, time-consuming and costly and place significant strain on our personnel, systems and resources. The Sarbanes-Oxley Act requires, among other things, that we maintain effective disclosure controls and procedures and internal control over financial reporting. In particular, Section 404 of the Sarbanes-Oxley Act (“Section 404”) will require us to perform system and process evaluation and testing of our internal control over financial reporting to allow management to report on, and our independent registered public accounting firm to attest to, the effectiveness of our internal control over financial reporting. We are required to provide an annual management report on the effectiveness of our internal control over financial reporting commencing with our fiscal year ending December 31, 2023. In addition, once we cease to be an “emerging growth company,” our independent registered public accounting firm must attest to and report on the effectiveness of our internal control over financial reporting. Our independent registered public accounting firm may issue a report that is adverse in the event it is not satisfied with the level at which our internal control over financial reporting is documented, designed or operating.
We do not expect that our disclosure controls and procedures will prevent all errors and all instances of fraud. Disclosure controls and procedures, no matter how well conceived and operated, can provide only reasonable, not absolute, assurance that the objectives of the disclosure controls and procedures are met. Further, the design of disclosure controls and procedures must reflect the fact that there are resource constraints, and the benefits must be considered relative to their costs. Because of the inherent limitations in all disclosure controls and procedures, no evaluation of disclosure controls and procedures can provide absolute assurance that we have detected all control deficiencies and instances of fraud, if any. The design of disclosure controls and procedures also is based partly on certain assumptions about the likelihood of future events, and there can be no assurance that any design will succeed in achieving its stated goals under all potential future conditions.
Our management has identified certain material weaknesses in our internal control over financial reporting as of December 31, 2023. Due to these material weaknesses, our management concluded that our internal control over financial reporting was not effective as of December 31, 2023. A material weakness is a deficiency, or a combination of deficiencies, in internal control over financial reporting such that there is a reasonable possibility that a material misstatement of a company’s annual or interim financial statements will not be prevented or detected and corrected on a timely basis. For a summary of the material weaknesses identified and the measures that we have taken and are taking to remediate, see “Item 15. Controls and Procedures—Management’s Annual Report on Internal Control over Financial Reporting.” If we identify any new material weaknesses in the future, any such newly identified material weakness could limit our ability to prevent or detect a misstatement of our accounts or disclosures that could result in a material misstatement of our annual or interim financial statements. And the remediation measures we take may be time consuming and costly and there is no assurance that such initiatives will ultimately have the intended effects. In such case, we may be unable to maintain compliance with securities law requirements regarding timely filing of periodic reports in addition to applicable stock exchange listing requirements, investors may lose confidence in our financial reporting and our stock price may decline as a result. There can be no assurance that the measures we have taken to date, or any measures we may take in the future, will be sufficient to avoid potential future material weaknesses.
44
Table of Contents
We qualify as an “emerging growth company” within the meaning of the Securities Act, and as we intend to take advantage of certain exemptions from disclosure requirements available to emerging growth companies, it could make our securities less attractive to investors and may make it more difficult to compare our performance to the performance of other public companies.
We qualify as an “emerging growth company” as defined in Section 2(a)(19) of the Securities Act, as modified by the JOBS Act. As such, we will be eligible for and intend to take advantage of certain exemptions from various reporting requirements applicable to other public companies that are not emerging growth companies for as long as we continue to be an emerging growth company, including the exemption from the auditor attestation requirements with respect to internal control over financial reporting under Section 404(b) of the Sarbanes-Oxley Act. We will remain an emerging growth company until the earliest of (i) becoming a “large accelerated filer,” with at least $700 million of equity securities held by non-affiliates, (ii) the last day of the fiscal year in which we have total annual gross revenue of $1.07 billion or more during such fiscal year (as indexed for inflation), (iii) the date on which we have issued more than $1 billion in non-convertible debt in the prior three-year period or (iv) the last day of the fiscal year following the fifth anniversary of the closing date of our Business Combination. In addition, Section 107 of the JOBS Act also provides that an emerging growth company can take advantage of the exemption from complying with new or revised accounting standards provided in Section 7(a)(2)(B) of the Securities Act as long as we are an emerging growth company. An emerging growth company can therefore delay the adoption of certain accounting standards until those standards would otherwise apply to private companies. We have elected not to opt out of such extended transition period and, therefore, we may not be subject to the same new or revised accounting standards as other public companies that are not emerging growth companies. Investors may find our Securities less attractive because we rely on these exemptions, which may result in a less active trading market for our Securities and the price of our Securities may be more volatile.
As a foreign private issuer, we also intend to take advantage of certain exemptions from various reporting and corporate governance requirements applicable to U.S. domestic issuers. See “—As a ‘foreign private issuer’ under the rules and regulations of the SEC, we are permitted to, and will, file less or different information with the SEC than a company incorporated in the United States or otherwise subject to these rules, and will follow certain home-country corporate governance practices in lieu of certain NYSE requirements applicable to U.S. issuers.”
We are a “controlled company” within the meaning of NYSE listing rules and, as a result, can rely on exemptions from certain corporate governance requirements that provide protection to shareholders of other companies.
We are a “controlled company” within the meaning of the NYSE listing rules as Fosun International owns more than 50% of our voting power as of the date of this annual report. Under these rules, a listed company of which more than 50% of the voting power is held by an individual, group, or another company is a “controlled company” and will be permitted to elect to not comply with certain corporate governance requirements, including the requirement that a majority of the board of directors consist of independent directors, the requirement that the nominating and corporate governance committee is composed entirely of independent directors, and the requirement that the compensation committee is composed entirely of independent directors. Currently, we do not plan to utilize the exemptions available for controlled companies, but will rely on the exemption available for foreign private issuers to follow our home country governance practices instead. See “—As a ‘foreign private issuer’ under the rules and regulations of the SEC, we are permitted to, and will, file less or different information with the SEC than a company incorporated in the United States or otherwise subject to these rules, and will follow certain home-country corporate governance practices in lieu of certain NYSE requirements applicable to U.S. issuers.” If we cease to be a foreign private issuer or if we cannot rely on the home country governance practice exemption for any reason, we may decide to invoke the exemptions available for a controlled company as long as we remain a controlled company. As a result, you will not have the same protection afforded to shareholders of companies that are subject to all of the NYSE corporate governance requirements.
Fosun, being our controlling shareholder, has substantial influence over us and Fosun’s interests may not be aligned with the interests of our other shareholders, and Fosun losing control of us may materially and adversely impact us and our Securities.
Fosun (through its subsidiaries) holds a significant percentage of our voting equity. As such, Fosun will have substantial influence over our business, including decisions regarding mergers, consolidations, the sale of all or substantially all of our assets, election of directors, declaration of dividends and other significant corporate actions. As the controlling shareholder, Fosun may take actions that are not in the best interests of our other shareholders.
Separately, if, among other things, the current controlling shareholder of Fosun ceases to have control of Fosun or us, Meritz will have the right to put all the Ordinary Shares it holds back to us at a premium, which would negatively impact our liquidity, financial condition and operations. See “—Certain rights granted to Meritz in the Amended and Restated Meritz Relationship Agreement could limit the funds available to us or potentially result in dilution of our then existing shareholders” and “Item 5. Operating and Financial Review and Prospects—B. Liquidity and Capital Resources—Meritz Private Placement” for further details.
45
Table of Contents
Furthermore, pursuant to the Lanvin SHA, if Fosun loses its control over us (i.e., the possession, directly or indirectly, of the ability to direct or cause the direction of our policies and management), we may be obligated to cause the equity interest we hold indirectly in Arpège SAS to be transferred back to Fosun or its controlled affiliates. FFG Lucky SAS, a wholly-owned subsidiary of LGHL, acquired certain equity securities in Arpège SAS in a series of permitted transfers by virtue of being an affiliate of Fosun Industrial Holdings Limited, the original shareholder of such equity securities. In the Minority Shareholder Letter of September 2022, the Alleging Shareholder stated that, if FFG Lucky SAS ceases to be an affiliate of Fosun Industrial Holdings Limited and/or Fosun, FFG Lucky SAS may be obligated to transfer the relevant equity securities in Arpège SAS back to Fosun Industrial Holdings Limited and/or Fosun. Fosun losing control over us will likely result in FFG Lucky SAS ceasing to be an affiliate of Fosun Industrial Holdings Limited and/or Fosun, and may result in FFG Lucky SAS being obligated to transfer the relevant equity securities in Arpège SAS back to Fosun Industrial Holdings Limited and/or Fosun.
We believe that the possibility of Fosun losing control over us in the foreseeable future is remote because: (1) Fosun and its affiliates holds in the aggregate hold approximately 58.7% of our voting power as of the date of this annual report; (2) Fosun has confirmed to us that there is no current commercial intention for Fosun to lose control of us in the foreseeable future; and (3) Fosun has delivered an undertaking to us in which it has undertaken not to take, or permit to be taken, any action that could result in FFG Lucky SAS ceasing to be an affiliate of Fosun or Fosun Industrial Holdings Limited, or any other action that could result in FFG Lucky SAS being obligated under the Lanvin SHA to transfer the relevant equity securities in Arpège SAS to any person who is not us or our subsidiaries. Further, even if Fosun were to cease control of us and, in turn, FFG Lucky SAS, we believe there are valid defenses to the request by the minority shareholders of Arpège SAS that FFG Lucky SAS should transfer the relevant equity securities of Arpège SAS back to Fosun. Nevertheless, we cannot assure you that Arpège SAS will remain as our subsidiary at all times. If the relevant equity securities in Arpège SAS were to be transferred to Fosun or its controlled affiliates other than the Lanvin Group, Lanvin Group will lose a substantial part of its revenue and operations, and we would likely lose all rights to use of the Lanvin name and Lanvin brand. The occurrence of any of the foregoing could result in substantial decline in the trading price of our securities.
We have granted in the past, and we will also grant in the future, share incentives and economic beneficiary rights scheme, which may result in increased share-based compensation expenses.
On September 23, 2020, we adopted a restricted share units scheme (“RSU Scheme”) for the issuance of up to 32,129,493 shares for the purpose of recognizing the contribution of participants including our senior management members and consultants to the growth of the then Fosun Fashion Group. As a result of the restricted share units (“RSUs”) granted under the RSU Scheme, we incurred share-based compensation of €2.7 million, €7.4 million and €7.2 million for the years ended December 31, 2023, 2022 and 2021, respectively. In December 2021, we adopted a share economic beneficial interest right scheme that modifies all RSUs granted under the RSU Scheme into share economic beneficial interest rights under the share economic beneficial interest rights scheme (“SEBIRs scheme” or “BF Plan”) administered by Brilliant Fashion Holdings Limited. For more information on the SEBIRs scheme, see “Item 6. Directors, Senior Management and Employees—B. Compensation—Share Incentive Plan.” We believe the granting of share-based compensation (including the SEBIRs scheme) is of significant importance to our ability to attract and retain key personnel and employees, and as such, we may also grant additional share-based compensation and incur share-based compensation expenses. As a result, expenses associated with share-based compensation may increase, which may have an adverse effect on our business and results of operations.
We may be or become a passive foreign investment company (“PFIC”), which could result in adverse U.S. federal income tax consequences to shareholders who are U.S. persons.
If we are, for U.S. federal income tax purposes, a PFIC for any taxable year, or portion thereof, that is included in the holding period of a beneficial owner of our Ordinary Shares or Public Warrants that is a U.S. Holder (as defined below in the section entitled “Item 10. Additional Information - E. Taxation - United States Federal Income Tax Considerations General”), such U.S. Holder may be subject to certain adverse U.S. federal income tax consequences and may be subject to additional reporting requirements. We do not believe we were a PFIC for our most recently completed taxable year and do not currently expect to be classified as a PFIC for the current taxable year or foreseeable future taxable years. However, this conclusion is a factual determination that must be made annually at the end of our taxable year, and our status will depend among other things upon changes in the composition and relative value of our gross receipts and assets. Accordingly, no assurance can be given that we will not be classified as a PFIC in the current year or in any future taxable year. Please see the section entitled “Item 10. Additional Information—E. Taxation—United States Federal Income Tax Considerations—Passive Foreign Investment Company Status” for a more detailed discussion with respect to our PFIC status and consequences for U.S. Holders. U.S. Holders are urged to consult their tax advisors regarding the possible application of the PFIC rules to holders of our Ordinary Shares and Public Warrants.
46
Table of Contents
We may be subject to U.S. foreign investment regulations which may limit certain investors’ ability to purchase our securities. Our existing and future investments in U.S. companies may also be subject to U.S. foreign investment regulations.
The Committee on Foreign Investment in the United States (“CFIUS”) has authority to review direct or indirect foreign investments in U.S. companies. Among other things, CFIUS is empowered to require certain foreign investors to make mandatory filings, to charge filing fees related to such filings and to self-initiate national security reviews of foreign direct and indirect investments in U.S. companies if the parties to that investment choose not to file voluntarily. In the case that CFIUS determines an investment to be a threat to national security, CFIUS has the power to unwind or place restrictions on the investment. Whether CFIUS has jurisdiction to review an acquisition or investment transaction depends on, among other factors, the nature and structure of the transaction, including the level of beneficial ownership interest and the nature of any information or governance rights involved.
The Sponsor is a “foreign person” pursuant to CFIUS’ rules and regulations. In addition, certain other entities involved in the transaction, including LGHL, Merger Sub 1, Merger Sub 2, Aspex Master Fund (“Aspex”), the PIPE Investors (as defined below) and certain existing shareholders of Lanvin Group, are, or are believed to be, “foreign persons” under such rules and regulations. If CFIUS considers Lanvin Group (or its business in the U.S.) a U.S. business that may affect national security, we could be subject to such foreign ownership restrictions. We do not believe that the Business Combination or the related transactions would be a threat to national security of the United States, or that a mandatory filing with CFIUS is required or a voluntary notice to CFIUS is warranted, for the Business Combination and the related transactions. However, if CFIUS takes a different view, it may order us to divest all or a portion of our U.S. business. In addition, the restrictions on the ability of foreign persons to invest in us or of our ability to invest in U.S. businesses could limit our ability to engage in strategic transactions that could benefit our shareholders, including a change of control of us and our strategic acquisitions and investments, and could also affect the price that an investor may be willing to pay for our securities.
| ITEM 4. | INFORMATION ON THE COMPANY |
| A. | History and Development of the Company |
Lanvin Group Holdings Limited (together with our subsidiaries, currently trading as the “Lanvin Group” (formerly as “Fosun Fashion Group”) after the rebranding in October 2021 as discussed below), an exempted company incorporated with limited liability under the laws of the Cayman Islands, is an affiliate of Fosun International (one of Forbes Global 2000 World’s Largest Public Companies on the 2021 list).
Founded in 1992, Fosun International’s mission is to provide high quality products and services for families around the world in health, happiness, wealth and intelligent manufacturing segments. Through continuous innovation, Fosun International has achieved rapid development by capitalizing on high growth sectors. It has a track record of developing industry champions which have successfully listed on global stock exchanges in different sectors of consumer goods and healthcare.
In 2018, we were founded with the vision of building a leading global luxury group with unparalleled access to Asia. From 2018 to 2021, we successively acquired majority stakes in St. John, Caruso, Lanvin, Wolford and Sergio Rossi. While we were founded in 2018, each of our portfolio brands acquired has a long-standing history with a combined heritage over 390 years. Since incorporation, we have helped our brands to reinforce their organizational infrastructure with the aim to build a global luxury platform. Our near to mid-term growth strategy is centered around diversification through (i) differentiated product categories that allow brands to further expand their customer demographics and (ii) omni-channel distribution with a focus on developing brands’ direct-to-consumer channels including self-operated retail boutiques and e-commerce. From time to time, our growth strategy will also include acquisitions, while the core focus of the growth strategy will continue to be organic.
47
Table of Contents
Potential future acquisitions will help to further diversify our portfolio composition and accelerate growth with a consistent diversified approach on product offerings, demographics and distribution channels.
Since 2019, we have welcomed a group of partners through multiple capital rounds into a comprehensive strategic alliance, which has a shared vision to empower our portfolio brands and drive growth both in Asia and overseas.
The alliance partners include ITOCHU Corporation (TSE Stock Code: 8001), a preeminent Japanese trading conglomerate; K11, a global high-end lifestyle brand and manager of luxury shopping malls under New World Development Company Limited (HKSE Stock Code: 0017); Stella International (HKSE Stock Code: 1836), a leading developer and manufacturer of luxury footwear and leather goods; Baozun (NASDAQ: BZUN and HKSE Stock Code: 9991), a leading global e-commerce business partner of global fashion, luxury and other brands in China; Activation Group (HKSE Stock Code: 9919), a leading interactive data performance marketing group for fashion and luxury brands in Greater China, Neo-Concept Group, a leading apparel manufacturer with over thirty years of experience focusing on innovative and sustainable textiles and fashion; and Handsome Corporation (KRX Stock Code: 020000), a South Korea-headquartered fashion retailer affiliated with South Korean retail conglomerate Hyundai Department Store Group.
In October 2021, we announced our rebranding from Fosun Fashion Group to Lanvin Group. The rebranding to Lanvin Group exemplifies our clear vision to build a global portfolio of iconic luxury fashion brands as we embark on a new phase of growth. Behind the decision to rebrand as Lanvin Group lies a strong belief that the spirit and ethos of Jeanne Lanvin when she started her business—entrepreneurship, creativity, openness and flair for life—which have helped build Lanvin over the past 133 years, remain as strong as ever and will be core to our continued success as we enter the next phase of our global development. The rebranding to Lanvin Group did not entail a change in Fosun Fashion Group’s legal name, which remains Fosun Fashion Group (Cayman) Limited.
Since our incorporation in 2018, we have operated under a two-tier management structure involving both global and local levels, as well as strong localized operational teams in strategic markets like Greater China.
These teams contribute to implementing our global vision with a clear portfolio strategy and effective dual-engine model. With cross-sector resources and the breadth of experience of our founding shareholder, Fosun International, and the combined support from our partners who are industry specialists, we have demonstrated the strength of our global platform. We aim to continue to scale up out business with our unique objective to transform heritage brands, and invest in the future of our brands and talent.
Milestone Events
Below are our milestone events:
| April 2013 | • | First investment in a minority stake of St. John by Fosun Group | ||
| September 2013 | • | First investment in a minority stake of Caruso by Fosun Group | ||
| February 2018 | • | Incorporation of Fosun Fashion Group (Cayman) Limited | ||
| April 2018 | • | Acquisition of a majority stake in Lanvin by Fosun Group | ||
| May 2018 | • | Acquisition of a majority stake in Wolford by Fosun Group | ||
| May 2019 | • | Acquisition of a majority stake in Wolford by Fosun Fashion Group | ||
48
Table of Contents
| September 2019 | • | Acquisition of the majority stakes in Lanvin, St. John and Caruso by Fosun Fashion Group | ||
| October 2019 | • | Closing of Series A capital round | ||
| October 2020 | • | Closing of Series A+ capital round | ||
| May 2021 | • | Closing of Series B capital round | ||
| July 2021 | • | Acquisition of a majority stake in Sergio Rossi by Fosun Fashion Group | ||
| September 2021 | • | Closing of Series B+ capital round | ||
| October 2021 | • | Official rebranding from Fosun Fashion Group to Lanvin Group | ||
| December 2022 | • | Completed the Business Combination and Listed on the NYSE | ||
Principal Offices
Our principal executive office is at 4F, 168 Jiujiang Road, Carlowitz & Co, Huangpu District, Shanghai, 200001, China and our telephone number is +86 (021) 6315 3873. Our registered office in the Cayman Islands is located at the offices of Maples Corporate Services Limited, PO Box 309, Ugland House, Grand Cayman, KY1-1104, Cayman Islands. Investors should submit any inquiries to the address and telephone number of our principal executive office set forth above.
Our website is https://lavvin-group.com. The information contained in, or accessible through, our website does not constitute a part of this annual report.
The SEC maintains an internet site that contains reports, proxy and information statements, and other information regarding issuers, such as we, that file electronically, with the SEC at www.sec.gov.
Our agent for service of process in the United States is Puglisi & Associates, 850 Library Avenue, Suite 204, Newark, Delaware 19711.
| B. | Business Overview |
Overview of the Business
We are a global luxury fashion group with five portfolio brands, namely Lanvin, Wolford, Sergio Rossi, St. John and Caruso.
| • | Founded in 1889, Lanvin is one of the oldest French couture houses still in operation, offering products ranging from apparel to leather goods, footwear, and accessories. |
| • | Wolford, founded in 1950, is one of the largest luxury skinwear brands in the world, offering luxury legwear and bodywear, with a recent successful diversification into leisurewear and athleisure. |
| • | Sergio Rossi is a highly recognized Italian shoemaker brand and has been a household name for luxury shoes since 1951. |
| • | St. John is a classic, timeless and sophisticated American luxury womenswear house founded in 1962. |
| • | Caruso has been a premier menswear manufacturer in Europe since 1958. |
In addition to our current five portfolio brands, we are also actively looking at potential add-on acquisitions as part of our growth strategy.
49
Table of Contents
Our goal is to build a leading global luxury group with unparalleled access to Asia, and to provide customers with excellent products that reflect our brands’ tradition of fine craftsmanship with exclusive design content and a style that preserves the exceptional manufacturing quality for which those brands are known. This is consistently achieved through the sourcing of superior raw materials, the careful finish of each piece, and the way the apparel products are manufactured and delivered to our customers. In 2023, 2022 and 2021, we recorded revenues of €426,178 thousand, €422,312 thousand and €308,822 thousand, respectively, loss for the year of €146,253 thousand, €239,751 thousand and €76,452 thousand, respectively and adjusted EBITDA (non-IFRS measure) of €(64,173) thousand, €(71,958) thousand and €(58,945) thousand, respectively. See “Item 5. Operating and Financial Review and Prospects—A. Operating Results—Non-IFRS Financial Measures.”
Our products are sold through an extensive network of around 1,100 points of sale (“POSs”), including approximately 279 directly operated retail stores (across our five portfolio brands) as of December 31, 2023. We distribute our products worldwide via our retail and outlet stores, our wholesale customers and e-commerce platforms. Taking into account our DTC (including both directly-operated stores and e-commerce sites) and wholesale channels, we are present in more than 80 countries.
The following table sets forth a breakdown of our revenues by geographic areas for the years ended December 31, 2023, 2022 and 2021.
| For the years ended December 31, |
Increase/ (Decrease) | |||||||||||||||||||||||||||
| (Euro thousands, except percentages) |
2023 | 2022 | 2021 | 2023 vs 2022 |
% | 2022 vs 2021 |
% | |||||||||||||||||||||
| EMEA(1) |
201,871 | 205,715 | 148,197 | (3,844 | ) | (1.9 | )% | 57,518 | 38.8 | % | ||||||||||||||||||
| North America(2) |
147,310 | 145,519 | 106,701 | 1,791 | 1.2 | % | 38,818 | 36.4 | % | |||||||||||||||||||
| Greater China(3) |
53,188 | 48,876 | 42,518 | 4,312 | 8.8 | % | 6,358 | 15.0 | % | |||||||||||||||||||
| Other Asia(4) |
23,809 | 22,202 | 11,406 | 1,607 | 7.2 | % | 10,796 | 94.7 | % | |||||||||||||||||||
|
|
|
|
|
|
|
|
|
|
|
|
|
|
|
|||||||||||||||
| Total Revenues |
426,178 | 422,312 | 308,822 | 3,866 | 0.9 | % | 113,490 | 36.7 | % | |||||||||||||||||||
|
|
|
|
|
|
|
|
|
|
|
|
|
|
|
|||||||||||||||
| (1) | EMEA includes EU countries, the United Kingdom, Switzerland, the countries of Balkan Peninsula, Eastern Europe, Scandinavian countries, Kazakhstan, Azerbaijan and Middle East. |
| (2) | North America includes the United States of America and Canada. |
| (3) | Greater China includes Mainland China, Hong Kong Special Administrative Region, Macao Special Administrative Region and Taiwan. |
| (4) | Other Asia includes Japan, South Korea, Thailand, Malaysia, Vietnam, Indonesia, Philippines, Australia, New Zealand, India and other Southeast Asian countries. |
The following table sets forth a breakdown of revenues by sales channel for the years ended December 31, 2023, 2022 and 2021.
| For the years ended December 31, |
Increase/ (Decrease) | |||||||||||||||||||||||||||
| (Euro thousands, except percentages) |
2023 | 2022 | 2021 | 2023 vs 2022 |
% | 2022 vs 2021 |
% | |||||||||||||||||||||
| DTC |
247,013 | 247,460 | 186,813 | (447 | ) | (0.2 | )% | 60,647 | 32.5 | % | ||||||||||||||||||
| Wholesale |
161,516 | 164,359 | 116,417 | (2,843 | ) | (1.7 | )% | 47,942 | 41.2 | % | ||||||||||||||||||
| Other (1) |
17,649 | 10,493 | 5,592 | 7,156 | 68.2 | % | 4,901 | 87.6 | % | |||||||||||||||||||
|
|
|
|
|
|
|
|
|
|
|
|
|
|
|
|||||||||||||||
| Total Revenues |
426,178 | 422,312 | 308,822 | 3,866 | 0.9 | % | 113,490 | 36.7 | % | |||||||||||||||||||
|
|
|
|
|
|
|
|
|
|
|
|
|
|
|
|||||||||||||||
| (1) | Fees for royalties and licenses received from third parties, and clearance. |
50
Table of Contents
The following table sets forth a breakdown of revenues by brand for the years ended December 31, 2023, 2022 and 2021.
| For the years ended December 31, |
Increase/ (Decrease) | |||||||||||||||||||||||||||
| (Euro thousands, except percentages) |
2023 | 2022 | 2021 | 2023 vs 2022 |
% | 2022 vs 2021 |
% | |||||||||||||||||||||
| Lanvin |
111,740 | 119,847 | 72,872 | (8,107 | ) | (6.8 | )% | 46,975 | 64.5 | % | ||||||||||||||||||
| Wolford |
126,280 | 125,514 | 109,332 | 766 | 0.6 | % | 16,182 | 14.8 | % | |||||||||||||||||||
| St. John |
90,398 | 85,884 | 73,094 | 4,514 | 5.3 | % | 12,790 | 17.5 | % | |||||||||||||||||||
| Sergio Rossi(1) |
59,518 | 61,929 | 28,737 | (2,411 | ) | (3.9 | )% | 33,192 | 115.5 | % | ||||||||||||||||||
| Caruso |
40,011 | 30,819 | 24,695 | 9,192 | 29.8 | % | 6,124 | 24.8 | % | |||||||||||||||||||
| Other and holding companies(2) |
10,545 | 10,947 | 6,968 | (402 | ) | (3.7 | )% | 3,979 | 57.1 | % | ||||||||||||||||||
| Eliminations and unallocated |
(12,314 | ) | (12,628 | ) | (6,876 | ) | 314 | (2.5 | )% | (5,752 | ) | 83.7 | % | |||||||||||||||
|
|
|
|
|
|
|
|
|
|
|
|
|
|
|
|||||||||||||||
| Total |
426,178 | 422,312 | 308,822 | 3,866 | 0.9 | % | 113,490 | 36.7 | % | |||||||||||||||||||
|
|
|
|
|
|
|
|
|
|
|
|
|
|
|
|||||||||||||||
| (1) | Sergio Rossi was acquired by the Lanvin Group in July 2021, and was consolidated into Lanvin Group’s consolidated financial statements starting from the acquisition date. |
| (2) | Revenues from other and holding companies mainly refer to the intra–group sales, which have been eliminated for the consolidated results. It mainly includes the brand management fees charged from portfolio brands to Lanvin Group holding company. |
Brands, Collections and Products
We are a holding company operating mainly five portfolio brands, namely Lanvin, Wolford, Sergio Rossi, St. John and Caruso, offering products including apparel, leather goods, footwear, and accessories.
Lanvin
Founded in 1889 by Jeanne Lanvin, Lanvin is an iconic French luxury brand and one of the world’s oldest and longest running luxury French couture houses currently in operation. As of today, Lanvin is a reference for the Parisian industry of luxury for women’s ready-to-wear, men’s ready-to-wear, made-to-measure, leather goods, footwear (including sneakers), costume jewelry, eyewear, and childrenswear. Lanvin continues to evolve to respond to changing consumer preferences. It announced in April 2023 the establishment of Lanvin Lab, which will incubate new ideas and concepts for the house, and a creative team for leather goods and accessories, each to operate alongside Lanvin’s main product lines.
For the years ended December 31, 2023, 2022 and 2021, Lanvin generated revenues of €111,740 thousand, €119,847 thousand and €72,872 thousand, respectively, representing 26.2%, 28.4% and 23.6% of revenues.
Ready-to-wear. Lanvin is a historic couture house, where ready-to-wear is a key category in terms of image and revenue. Widely recognized for formal occasion and red carpet creations, Lanvin has recently developed a casual and chic line to accompany the diverse needs of today’s luxury client. As such, the brand today offers a well-rounded wardrobe for men and women.
Made-to-Measure. Exclusive made-to-measure service for men’s tailoring and women’s eveningwear is offered in selected boutiques, and remains as a key to the brand’s strength and image.
Footwear (including sneakers). The footwear selection includes formal and casual styles made by hand in Italy. Built to address diverse moments ranging from the professional and formal to the casual and off-duty, the objective is for the Lanvin leather shoe category to become a reference in the marketplace. Also, as the one of the first luxury brands to offer chic sneakers, Lanvin has strong and recognizable lines, and is a globally recognized authority in the technical rubber sole category of athletic-inspired footwear.
Leather Goods. With a breadth of styles, function and price range, the leather goods offering is composed of elegant items in premium materials and with the finest Italian manufacturing. A custom order service is available for our top clients allowing them to personalize their favorite styles.
Costume Jewelry. Jewelry has been part of the dress code at Lanvin since its founding. Known for ornate, striking costume jewelry pieces, this category is set to be an important feature of Lanvin’s accessory business in the future.
51
Table of Contents
Small Accessories. Lanvin’s small accessory products include scarves, hats, belts, ties, sleeve cuffs and other items.
Eyewear. Marchon has been Lanvin’s exclusive eyewear licensee since 2020 for the production and worldwide distribution of sunglasses and optical eyewear. Marchon’s standards for quality and ‘Made in Italy’ excellence matched with Lanvin’s unique design approach are fueling the potential of this category.
Childrenswear. Children Worldwide Fashion (CWF) has been Lanvin’s exclusive licensee since 2019 for the production and worldwide distribution of children’s clothes, shoes and accessories. CWF’s knowledge of the childrenswear sector and its distribution power are important to the future growth of this promising business.
Wolford
Established in Austria in 1950, Wolford is a luxury brand, leading skinwear specialist of high-quality legwear, ready-to-wear and lingerie, listed on the Vienna Stock Exchange. Wolford is famous for its exquisite fabrics and top-notch innovations, meeting the highest environmental and sustainability standards in the textile industry. Wolford is one of the first fashion brands to have a dedicated Cradle to Cradle® Collection with more than 20 Gold certified styles in both the biodegradable and technical cycle. In 2020 Wolford added two new pillars, the W line and the W Lab, to its portfolio. The W line has a strong character, follows the rhythm and understands the movements in athleisure, while the W Lab presents limited edition collections in collaboration with the talents around the world.
Wolford’s business model covers the entire value chain - from sourcing of materials through suppliers, design and product development to global omnichannel distribution including proprietary boutiques. That makes Wolford highly autonomous and enables it to react quickly to the latest fashion trends. Wolford is supported by external partners and selected suppliers in legwear, ready-to-wear and lingerie sectors. Tasks relating to product development are centralized at Wolford’s headquarters in Bregenz, Austria while tasks of creative design and marketing are in Milan, Italy.
For the years ended December 31, 2023, 2022 and 2021, Wolford generated revenues of €126,280 thousand, €125,514 thousand and €109,332 thousand, respectively, representing 29.6%, 29.7% and 35.4% of our revenues.
Wolford offers luxury legwear and ready-to-wear, lingerie, and beachwear, with a successful diversification into leisurewear, athleisure (as part of our ready-to-wear offerings) and accessories:
Ready-to-wear. Wolford’s ready-to-wear offerings include bodysuits, tops, trousers, dresses, skirts, jumpsuits, jackets and cardigans. Wolford’s ready-to-wear products are characterized by high-quality and innovative materials in timeless designs. These contemporary and luxurious styles are incredibly comfortable and soft against the skin. Subtle and effective shaping technology accentuates the feminine silhouette without sacrificing comfort. All of the ready-to-wear products are made from high-quality materials with expert craftsmanship and innovative techniques. Wolford’s designers are always searching for the newest materials and methods to improve and advance their shapewear.
Legwear. Wolford is widely recognized for its luxury legwear, including stockings, socks and leggings. Wolford started out in 1950 as a producer of pure silk and rayon stockings on Lake Constance. In 1954, Wolford proudly presented its first seamless nylon stockings to start its compelling story of utmost comfort and finest quality. In 1977, Wolford launched the first transparent support stocking called Miss Wolford. The transparent and glistening tights - Satin Touch - was born and has since become a bestseller in its product category. Besides Satin Touch, Wolford has created a lot of timeless classics of legwear products such as Fatal Tights, Pure 50 Tights and Pure 10 Tights. In 2020, Wolford launched the W line to capture the trend of athleisure. The first W line collection involved collaboration with Adidas and saw strong sales performance, Always open to creative ideas, Wolford has repeatedly worked together with prestigious designers in legwear, including Vivienne Westwood, Vetements and Amina Muaddi.
Lingerie and beachwear. Wolford licenses its brand to a third-party for the manufacturing and distribution of lingerie and beachwear. The licensed products are partly sold by Wolford through the DTC channel and partly through the licensee’s wholesale customers and other prestigious retailers. With respect to the licensed products sold through the DTC channel, Wolford purchases such products from the licensee. The licensee pays fees and royalties to Wolford under the licenses.
52
Table of Contents
Accessories. Wolford’s accessories offerings range from caps, gloves, collar, care masks, jewelry and silk bags.
Sergio Rossi
Sergio Rossi is an Italian brand that focuses on the design, production, distribution, and sale of leather shoes and leather accessories. Since its creation, Sergio Rossi has become a benchmark in the luxury shoemaking sector and is known worldwide for its artisanship and for creating iconic models. Over the past 70 years, the company has fostered its distinctiveness by enhancing the quality of its material, the craftsmanship and elegance of its products, and its luxury allure, which remain the foundations of Sergio Rossi’s unique style. While the showroom and managerial offices are based in Milan, Italy, the heart of Sergio Rossi’s production activity is the San Mauro Pascoli factory, where skillful artisans and technicians have been hand-crafting Sergio Rossi shoes for the past six decades.
We completed the acquisition of a majority stake in Sergio Rossi in July 2021. For the years ended December 31, 2023, 2022 and 2021, Sergio Rossi generated revenues of €59,518 thousand, €61,929 thousand and €28,737 thousand (from the acquisition date to December 31, 2021), respectively, representing 14.0%, 14.7% and 9.3% of our revenues.
Sergio Rossi offers handmade footwear for women and men:
Footwear for women. Traditionally, Sergio Rossi mainly focused on products with seasonless designs, which helped the brand become a symbol of the Italian maestria recognized worldwide. In order to meet the demands of more dynamic lifestyle for the new generation, Sergio Rossi launched several new collections (e.g. SI ROSSI and GRAZIE Sergio) and unleashed the growth potential of the existing collections (e.g., SR1 and SR Twenty) with additional categories and versatile style and designs. Sergio Rossi’s luxury women’s footwear offering includes pumps, sandal heels, booties, ballerinas, flat closed toe, sneakers, slingbacks, wedges, boots, sandal flats and blunts.
Footwear for men. Sergio Rossi believes men’s footwear represents enormous growth potential for the luxury accessory market. Sergio Rossi has taken another step forward and re-introduced the men’s collection, inspired by the modern, sharp and passion driven men of today. The distinctive signs of the brand’s DNA, such as the iconic square plate, the ultra glam details and the urban inspiration are reinterpreted in the luxurious men’s footwear. Sergio Rossi’s luxury men’s footwear offering ranges from sneakers, loafers, derby shoes to lace-ups.
St. John
St. John is a Southern California-based American luxury fashion house founded in 1962, widely recognized for high-quality women’s knitwear. St. John designs, produces, markets and distributes luxury womenswear, footwear and accessories, including handbags, jewelry, and leather goods. The company is vertically integrated with workshops, stores, and offices around the world.
For the years ended December 31, 2023, 2022 and 2021, St. John generated revenues of €90,398 thousand, €85,884 thousand and €73,094 thousand, respectively, representing 21.2%, 20.3% and 23.7% of our revenues.
Each year, St. John produces unique collections organized in four seasons (Spring/Pre-Fall/Fall/Resort), plus a number of capsule collections. Additionally, St. John offers evergreen wardrobe essentials called “Basics,” which are staple pieces designed to anchor women’s year-round wardrobes. Capsule collections are special collections that are inspired by a certain time of year or event (i.e., Classic Cashmere Loungewear, the Chinese New Year collection, the Nordstrom Anniversary Sale).
53
Table of Contents
St. John’s products are categorized into Collection, Evening, and Accessories:
Collection. Seasonal pieces offered in varying fabrics, colors, and silhouettes, including outerwear, dresses, suiting, knits, and bottoms. The collection is designed to create a sophisticated, elegant, and versatile wardrobe for the client’s signature sense of style, reflecting season- specific considerations, trends, and palettes.
Evening. Elegant ensembles suitable for dressier occasions from cocktail to black tie, and even everyday glamor. The evening collection includes a variety of options including standout gowns, elevated suiting, sparkly cocktail dresses, and even special separates.
Accessories. The St. John lifestyle would not be complete without accompanying accessories. Luxurious Nappa leather handbags and footwear are everyday staples, while iconic buttons and a mix of subtle and statement jewelry are welcomed accents.
Caruso
Founded by the renowned tailor Raffaele Caruso in 1958, Caruso is an Italian heritage brand, and the Italian tradition continues in all its products, which are 100% produced in Italy by the company’s approximately 400 skilled seamstresses and master tailors in its factory (Fabbrica Sartoriale Italiana). Over the past 60 years, Caruso has focused on the development and production of men’s luxury full-canvas jackets in a proprietary factory in Soragna and has become the point of reference for stylists and luxury brand designers and a co-creation and production hub for the best high and male fashion brands of the world.
For the years ended December 31, 2023, 2022 and 2021, Caruso generated revenues of €40,011 thousand, €30,819 thousand and €24,695 thousand, respectively, representing 9.4%, 7.3% and 8.0% of our revenues.
Caruso offers luxury leisurewear and formalwear for men:
Luxury leisurewear. In recent years, the market is experiencing a shift towards luxury casualwear for all generations. There is also a wider acceptance of casualwear for different occasions, which is ultimately increasing the demand of streetwear and attracting leading luxury brands into the space. In order to meet new market demands, Caruso has launched a new brand image and attitude identified as “Playful Elegance” and added new product lines and categories including knitwear, outerwear, casual pants and shirts.
Formalwear. Caruso’s Fabbrica Sartoriale Italiana factory has maintained close and long-term partnerships as an outsourced manufacturer for several well-known luxury brands by producing and offering luxury full-canvas formalwear products. For further consolidating market position, Caruso initiated new strategies towards formalwear production including widening its offering (by product categories and quality levels) and service (made-to-measure and reorders) and generating new projects with partners.
Operations
Our primary operations are divided among the locations where our portfolio brands are based, including France, Austria, Italy, the United States, Slovenia (where Wolford’s second manufacturing facility is located) and Mexico (where St. John’s manufacturing facility is located).
Our primary activities consist of creating, manufacturing and marketing of our pre-collections and main collections, organized into two seasons (Fall/Winter and Spring/Summer) for Lanvin, Wolford, Sergio Rossi, Caruso and the four seasonal collections (namely, Spring, Pre-fall, Fall and Resort) for St. John. Generally, each collection within our portfolio brands takes approximately six months from design to delivery of the finished products to our customers.
Our primary activities can be subdivided into the following major stages, overseen by different functions in our organization: (i) design, product development and merchandising; (ii) sales campaign; (iii) procurement; (iv) manufacturing; (v) logistics and inventory management; and (vi) marketing and advertising, as further described below.
54
Table of Contents
Design, Product Development and Merchandising
Each portfolio brand has its own dedicated in-house creative, product development and merchandising teams, complemented by additional design capabilities from shared creative platforms (Creative Lab and BOND on BUND) managed by us, which bring together emerging creative talents and resources from different markets and facilitate collaborations or freelance design projects with the brands. The new collections are therefore created by the designers and merchandisers jointly considering market analysis and seasonal fashion trends while reflecting the brands’ true genuine creative visions.
Our experienced merchandising teams of each portfolio brand work on OTB (Open-to-Buy) for collections of each season and provide guidelines to the manufacturing and procurement functions for the quantity of products based on their assessment. Currently, we adopt a “small order, quick reaction” mode within our own factories, which provides flexibility to increase or decrease the orders according to the latest sales performance/forecast, as well as any recent market trends. We also implement a “monthly drop product calendar” for brands including Lanvin and Wolford to limit the risk of over-/ under-production.
At Lanvin, the development of a collection takes place through a collaboration between the in-house creative studio and ateliers. In the heart of Paris, Lanvin’s ateliers passionately commit themselves each season to the service of a high-end ready-to-wear line. Once the styles of the new collection are drawn and selected, the sketches are presented by the artistic director to the sample makers tasked with bringing them to life, from toiling (the construction of a sketch in a plain fabric that will then be scrutinized and fine-tuned during the fittings), fitting, pattern making, fabric selection, cutting and the final assembling, until a collection is strut down the runway under the spotlight. For leather goods and footwear, a dedicated product development team works hand-in-hand with the creative and merchandise teams from sketch to the first prototype with selected craftsmen and luxury manufacturers in Europe.
At Wolford, when developing a new collection, product management, the design team, and product development all work hand-in-hand. Product management analyzes trends, colors and shapes and identifies the products that will be in demand in the market—these findings then form the basis for the work performed by the design team. The close cooperation between design and product development in-turn results in a stream of new products, often based on new production methods, such as 3D printing or the adhesive technology developed by Wolford and now patented, “Pure Tights,” the world’s first glued tights. Product and merchandise management also handles demand planning for the retail areas of proprietary boutiques and for wholesale customers. This department determines which articles have to be produced in which sizes and colors and for which retail areas. It also controls the flow of goods from the warehouse to retail areas.
At Sergio Rossi, each new collection is created by the design teams working in strong coordination with the merchandising team, allowing for a continuous cross-pollination of ideas and proposals. The new collections are therefore created by the designers and stylists considering market analysis and seasonal fashion trends. The brand and merchandising teams of Sergio Rossi are supported by a unique expert team of product developers, who also work in close cooperation with the modelers of the supply chain team, for a total of approximately 35 people involved in this production stage. The modelers transform the designers’ sketches first into paper or 3D models, and then into prototypes to assess the look, feel and functionality of the product, and allow the design and merchandising team to fine-tune the prototypes and the internal supply chain technicians to anticipate any issues that may arise during the manufacturing process. Once the prototypes are approved, a sample collection is produced based on such prototypes. Modeling and prototyping are completed entirely in-house and the design, brand, merchandising and supply chain teams closely cooperate and share information and suggestions with each other to ensure that the products are manufactured on time and consistent with the delivery plans for our collections. From the launch of “The Living Heritage Project” (a passionate and intensive internal project of Sergio Rossi, which allowed for the creation of a physical historic archive, a digital platform dedicated to product history and brand’s image, and an exhibition space showing the brand history) in January 2017, thousands of vintage models arriving from all over the world have been purchased, restored and digitally filed. Simultaneously, more than 14,000 documents—drawings, look books, advertising and editorial images—have been recovered and digitized. This is an incredible asset, creating the opportunity to link the amazing ideas of the past with future design development.
55
Table of Contents
St. John currently has four collections each year, Spring, Pre-Fall, Fall, and Resort, as well as occasional capsule collections. Each new collection is created by the design team, reflecting the creative genius of the designers, market analysis, and seasonal trends. The designers also take direction from the merchandising team, who provide guidelines on the makeup of the collections, with target numbers of styles and recommended pricing. The design team also works closely with design purchasing and knit design teams to acquire the best yarns and create incredible, exclusive fabrics. The product development team converts designers’ sketches into patterns and then prototypes (either internally or through outsourced production facilities) to assess the look, feel, and quality of the items, allowing the merchandising team to fine-tune the prototypes and the supply chain technicians to anticipate any issues that may arise during the manufacturing process. Once the prototypes are approved, a sample collection is produced for internal review.
At Caruso, the internal creative and design team provide a mood board indicating creative direction/inspiration and color themes. The merchandising team collects the market indications (sales team suggestions), evaluates positives and critiques that emerged from the last sales campaigns, analyzes the macro trends of market evolution, and subsequently elaborates a merchandising plan that is shared with the brand’s creative direction, product and sales teams. This process enables Caruso to develop a collection that takes into account creative needs, but at the same time is the result of internal thinking, as well as clear market indications. The product team researches and develops the products necessary for the implementation of all requests (creative and merchandising), through prototypes that will be reviewed/approved (remade if necessary) until the optimum is reached. At the same time, the product team collaborates with supply chain and control teams, in order to optimize internal production resources and apply the best cost solution to reach the target cost indicated by the merchandising plan. Through intermediate meetings, the whole collection is checked and edited in order to optimize its balance, up to its final approval by the aforementioned committee.
Sales Campaign
The sample collections, once ready, are presented to wholesale customers and retail buyers at each brand’s showrooms. Lanvin has a showroom in Paris. Wolford has showrooms in Milan, New York and Shanghai. Sergio Rossi has a showroom in Milan. St. John has a showroom in Irvine and temporary showrooms in New York and Paris. Caruso has a showroom in Milan.
The sample collections usually highlight styles and themes and occasions for use, and present a breakdown of products by product category, price range and look. In addition, our showrooms for each of the portfolio brands display the full product offerings across all product categories, simulating the effect of giving guidelines on how to display the store the effect of point-of-sale displays. While this process has historically been carried out through in-person meetings, as a result of the COVID-19 pandemic, we adopted tools allowing our wholesale customers and retail buyers to view and submit online orders for the sample collections. Similar tools may continue to be used following the lifting of restrictions related to the pandemic as an enhancement of the traditional sales campaign experience.
During the sales campaign, orders are taken by each brand’s wholesale area managers from wholesale customers (including franchisees) and retail buyers to form an order portfolio. Retail buyers place orders by selecting products in accordance with each brand’s buying guidelines, in particular with respect to DOSs, in order to ensure the consistency of the products’ assortment in various stores.
Sales campaigns usually last approximately two months. During the sales campaign, and based on preliminary orders placed by the retail buyers and wholesale customers, each brand’s merchandising and supply chain teams regularly share information on the evolution of the order portfolio to align the initial forecasts for raw material procurement and production planning.
Procurement
All of our portfolio brands except for Lanvin have vertically-integrated manufacturing facilities, which can fulfill most of their production needs, providing stability and flexibility in our supply chain capabilities. In addition, all of these four brands have relatively stable and long-term relationships with their key raw material suppliers (with generally over 10 years of relationship with the top 10 suppliers in terms of expenditure in 2023). We have over 600 raw material suppliers in total (although sourcing activities are separately carried out for each portfolio brand). To date, none of our portfolio brands sources raw materials from suppliers based in Russia or Ukraine, and accordingly our supply chain has not been exposed to any material risks in light of the ongoing conflict between Russia and Ukraine.
56
Table of Contents
Lanvin works with a portfolio of widely recognized and “best-in-class” manufacturers selected for their know-how in each product type (including ready-to-wear, leather goods and footwear). Productions are managed and followed through to the ‘Finished Product’ (full-package manufacturing) model. Fabrics and raw materials are entirely sourced in Europe, mostly Italy, with the exception of some technical fabrics found in Japan. The quality control department of Lanvin maintains control and validation directly or through external and certified control offices located in Italy, France and Portugal. This process of quality control encompasses fabrics/trims as well as finished products throughout our partners’ facilities. Once industrializing phases and pricing negotiation are completed, orders are placed to suppliers & manufacturers. Buying and production teams monitor delivery planning throughout the season.
Wolford’s procurement consists of mostly raw materials but also includes other items such as accessories. In 2023, Wolford’s supply base included 85 material suppliers, of which approximately 25 suppliers supply yarn for the internal knitting production, and approximately 21 suppliers supply fabrics, and approximately 39 suppliers supply accessories such as zippers, buttons or elastic bands. A majority of the aforementioned suppliers are located in Europe (approximately 88%) including Austria, Italy, Germany, Switzerland, France and other countries in Europe, while the remaining are located in Japan, South Korea, Peru and others. All raw materials procured by Wolford are stored at its headquarters in Bregenz for subsequent production and assembly or in our production plant in Slovenia. Finished products are stored in three warehouses—at the central warehouse in Germany, which also supplies the online business in Europe, and two other warehouses in the U.S. and China. The warehouse in the U.S. supplies the online business for the American market, while the warehouse in China supplies Asia.
Sergio Rossi’s overall procurement volumes comprise purchase of raw materials (leather, plateaus, soles, insoles and heels); other raw materials like ancillary components (glues and solvents) and packaging; finished products (related to external production of finished products); and services (outsourced manufacturing). Sergio Rossi enjoys long-term relationship with its key suppliers. For the year ended December 31, 2023, Sergio Rossi sourced raw materials and finished goods from approximately 147 suppliers, of which around 136 provided raw materials and around 11 provided finished goods. In 2023, the top 10 suppliers of Sergio Rossi accounted for around 55% of annual purchase and the 96% of the procurement of raw materials, products and service came from Italian suppliers, while the remaining 4% came from other countries in the European area. Sergio Rossi has two warehouses, storing most of the raw materials, components including bottoms, leather and accessories, and prototypes. Depending on the categories of products and other factors such as production lead time, production costs, quantity and availability of the relevant know-how, the outsourced products are manufactured using two different approaches: façon manufacturing or “full package” manufacturing. When using the façon manufacturing model, Sergio Rossi only outsources to external manufacturers the confection and assembly stages (including part of the cutting, stitching and component), while Sergio Rossi remains responsible for providing the designs, product specifications, raw materials and coordinating the entire production process throughout the various stages. Conversely, in the full package manufacturing model, Sergio Rossi outsources to external manufacturers the entire production process (excluding design and specifications), including the procurement of raw materials, coordination of the various production stages including the most crucial part of assembly, final packaging and quality control. The full package manufacturing model is employed for selected products, such as sneakers and espadrilles; the quality control is always direct responsibility.
St. John produces 10% of its products in a company-owned factory in Baja, Mexico. Additional products are made via third-party contractors to support a wide array of knit and woven garments from the U.S., Portugal, India and China. St. John sources a wide variety of raw materials and trimmings through a vast network of trusted suppliers. In 2023, St. John had maintained relationships with 168 reputable raw material suppliers and 35 garment manufacturers. 84% of the materials are yarns and fabrics, sourced primarily in Europe, and the remaining 16% are items such as trimmings and hardware. The top 10 suppliers comprise 43.6% of St. John’s yearly spend. With regard to the network of external contractors, 31 are “full package,” whereby they are responsible for the entire manufacturing process, including the purchase of raw materials as specified by the St. John purchasing team from the nominated suppliers. The remaining four contractors are “ façon,” responsible for the garment construction and execution, with the raw materials supplied by St. John. St John’s leather products are mainly sourced from Italy. Regardless of the model, all St. John’s outsourced products are closely managed with stringent quality control.
57
Table of Contents
Caruso’s supplier base consisted of approximately 202 suppliers in 2023, around 72% of which are located in Italy. 10 of the 202 suppliers accounted for 50% of all purchases in 2023. The main raw material suppliers are from Northern Italy and provide supplies mostly in natural materials (wool, cashmere and cotton). Caruso adopts systematic procurement processes: the first process is in relation to raw materials, to which such purchase is generated by needs based on customers’ orders, and the second is through a buying request for all other purchase requirements, an official request is made, which is approved by the area manager before processed. For outsourcing production. depending on product categories and other factors such as production time, production costs, quantity, and the ready availability of related know-how, outsourced products are manufactured using two different approaches: façon manufacturing or “full package” manufacturing. Caruso typically uses the façon production model for its formal garments (such as suits, jackets, blazers, coats, vests and pants, shirts and outerwear). The full-package production model is used for selected Caruso-branded products, such as leisurewear, knitwear, ties and scarves, as well as leather goods.
While we are experiencing higher costs due to increased commodity prices and sourcing materials sourcing costs materials, in line with the entire industry, such cost increases do not apply to all types of raw materials sourced by our businesses. Therefore, all of our portfolio brands have been, and are continuously analyzing the pricing by SKU from time to time and adjusting the pricing by SKU accordingly. To address increased commodity and material prices, the portfolio brands have generally been adjusting retail prices of the products in line with such increase given that the demand for luxury goods generally does not vary with price and the price increases implemented are not expected to have a significant adverse impact on consumers’ demand.
Manufacturing
While the sales campaign is ongoing, we start planning our manufacturing activities. Production quantities are continuously refined based on the results of the sales campaign allowing us to be efficient. Manufacturing planning is based on several factors, including the type of products to be manufactured (e.g. whether they are seasonal, continuative or made-to-measure). The manufacturing phase consists of industrializing the samples based on the outcome of the product developers’ research, and recreating them in various sizes and colors for large production.
While Lanvin does not have its own production facilities, it maintains a diversified pool of suppliers for each category and works closely with its supply chain partners on a daily basis to mitigate the risk of supply chain disruptions. We also leverage production capacities within the portfolio brands (for instance, Sergio Rossi produces shoes for Lanvin) and are continuously building our global sourcing capabilities in Europe, North America and Asia to avoid any supply disruptions in particular region(s).
Having started out in 1950 as a producer of pure silk and rayon stockings on Lake Constance, Wolford is now the go-to legwear and bodywear brand for many women worldwide. This success is based on a round-knitting technology specially developed and constantly refined by Wolford, as well as on its workmanship and quality checks. In combination with the finest yarns, this technology creates the specific comfort and product quality underlying the Wolford brand and its reputation. All products are made in Europe: the tights and bodies are produced in Bregenz on around 220 individually customized round-knitting machines operated in premises with optimized climatic conditions. Alongside the research and development department, Wolford’s headquarters is also home to a doubling mill, steaming facility, dyeing room, and molding workshop, as well as a proprietary color laboratory. The finishing and packaging of products take place in Murska Sobota, Slovenia, where textile manufacturing has a long tradition. In the areas of wrap-knitting, whole garment and intimate apparel, we also source from third-party finished goods suppliers, which are located in Italy, Turkey, Slovenia, Croatia and China.
Within the factory located in San Mauro Pascoli, Sergio Rossi is able to carry out all of the activities of shoe production from style and product development to production and logistics in-house, ensuring high flexibility, quality control and quick lead time on an innovative bulk production basis. The San Mauro Pascoli production plant, which was inaugurated in 2003, today counts a total of 55,600 square-meters: 12,000 square-meters of production and warehouse area and a 4,000 square-meter building housing the offices, the pattern and prototype departments. San Mauro’s industrial platform can develop, industrialize and produce all types of women’s and men’s luxury footwear, from flat styles to high heels. Since January 1, 2020, 100% of Sergio Rossi’s electricity purchase is from renewable source plants. In 2020, a photovoltaic system supplied approximately 20% of the electricity for Sergio Rossi’s San Mauro Pascoli plant and additionally Eon is supplying the green sustainable electricity for the Milan headquarters, the factory in San Mauro Pascoli and all stores in Italy in line with Sergio Rossi’s sustainability efforts implemented since 2016.
58
Table of Contents
St. John is widely recognized for its knit and tweed techniques, refined and evolved over six decades. We carefully manage our production, operations, and value chain, keeping production know-how and industrial capabilities internal for certain categories, while relying on a selected network of external suppliers in Europe, China and other locations for other needs. Our sourcing team is committed to carefully selecting all of our suppliers and managing the supply relationships. In determining whether to manufacture our products, we consider a number of factors such as the source of the materials, product quality, lead time and service levels, safety, and overall cost efficiency.
For internal production, Caruso’s facility is located in Soragna (Parma, Italy) and is spread over three plants: Cutting, Jacket/Coats Tailoring and Pants Tailoring. The facility produces suits, jackets, coats, pants, and vests in series and made to measure; the cutting department serves internal production and outsourcing. We produce high-end garments, combining the best tailoring skills with the most modern technologies of cutting and tailoring, all to ensure a product with very high-quality standards. The core product, the jacket, is fully-canvassed, a production method increasingly scarce and very difficult to replicate that ensures best-in-class comfort, durability, look, and breathability. It is also a very eco-friendly garment as it is made of only natural materials. The production makes use of a structured model office through which we design prototypes, samples, production test garments, “made to measure” garments, other special garments on market requests. Inside the production area, we have a prototype department (both for jacket/coat/vest and pants) in which all the ideas of our customers take shape. The production serves on the same line, in a virtuous mix, all types of products with different production lead times, and everything is monitored so that the production output is constant and respectful of the service.
Logistics and Inventory Management
Lanvin’s logistics department is responsible for organizing and managing the distribution of finished products and preparing the documentation required for global shipments, as well as the management of our warehouses, including the inflow/outflow of product and its inventory. Lanvin has a central warehouse located in France (near Paris) and two regional warehouses in the United States (near New York) and in China (near Shanghai). Transportation is conducted via third-party specialists engaged to transport goods by freight, air or sea, based on factors such as shipment size, distance traveled and urgency. The logistics department oversees after-sales facilities and other expedition-related services for the business across channels (retail/e-commerce/wholesale).
Wolford’s logistics is outsourced to a third-party logistics vendor with the central warehouse located in Munich, Germany, which has started its operations for Wolford in March 2024 after operations had been moved from a party-party service provider in Northern Germany to the new one in Southern Germany. In addition to this warehouse, Wolford has two other warehouses, one in the United States and one in China. With respect to the shipment of products, third-party transportation specialists are engaged to transport goods by road, air or sea, based on factors such as distance to destination and urgency of the shipment.
Sergio Rossi’s logistics department is responsible for organizing and managing the distribution of the finished products and preparing the documentation required for shipment, as well as the management of warehouses and product inventory. The logistics department is responsible for managing primary distribution center and product inventory, the shipment of products, and the logistics of the distribution of the finished products in all regions (included IC subsidiaries). With respect to the shipment of products, third-party transportation specialists are engaged to transport goods by road, air or sea, based on factors such as distance to destination and urgency of the shipment.
St. John ships all finished goods products through a centralized distribution center in Irvine, California. The logistics department also manages e-commerce shipments and returns, as well as drop-ship orders from wholesale partners. With respect to the shipment of products, St. John’s logistics team partners with third-party transportation companies to transport goods by road, air or sea, based on factors such as distance to destination, urgency of the shipment, or adherence to partner routing guides.
59
Table of Contents
The logistics department of Caruso, located in the Soragna plant, deals with the management and distribution of finished products as well as the preparation of the documentation necessary to proceed with shipments. Warehouse and inventory management is entrusted to the logistics department. The distribution of finished products in all regions of Italy is primarily entrusted to the external suppliers. The distribution of finished products in all regions of Europe, USA and China is entrusted to the external suppliers.
Marketing and Advertising
Advertising and promotional support is a crucial tool for luxury companies like us to influence purchase selection, enhance brand recognition and encourage brand loyalty over time. We invest significant resources in advertising communication and marketing, which include a full set of activities ranging from pure digital and social media marketing initiatives to events like fashion shows, product collaborations and co-marketing projects.
We adopt a strategy that has a dual-focus on both local and broader international audiences. We focus on local content, events and story-telling targeting specific groups of customers, and we also organize international campaigns and to ensure a consistent brand image in our marketing plans.
Each brand has its own internal teams dedicated to marketing and advertising activities, following slightly different marketing strategies depending on the brand. To better reach a wide but selected consumer segment, we use various communication tools, from organic institutional and products press coverage to media partnerships, to achieve a varied media-mix including digital marketing, digital media campaign, print, billboards, direct marketing and ad-hoc initiatives in our boutiques where visual merchandising and windows displays are conceived to consistently adhere to the seasonal marketing strategy plan. In addition to seasonal fashion shows, January Fall/Winter and June Spring/Summer collection presentations, specific shows and events are organized globally to strengthen our brands’ profiles and positioning and increase awareness on the most recent collections in local markets worldwide. Besides presenting new products, these events are planned to promote a direct involvement of the customers, media, celebrities, influencers, and industry key opinion leaders through exclusive events, as well as to reinforce the popularity of the brand and enhance its image.
Lanvin presents its seasonal collections in Paris during the Spring/Summer and Fall/Winter fashion weeks through elegant and elevated fashion shows, each carrying a particular creative theme as a tribute to the house’s identity, updated for today’s world. These shows play a significant role in demonstrating the brand’s luxury positioning as one of the oldest French couture houses still in operation, while revealing the conceptual direction of the newest season. They also help generate significant coverage on both editorial and digital publications and attract presence and participations of celebrities, culture influencers and VIPs around the world. The fashion show was also moved online for Fall/Winter 2021 and to Shanghai, China for Spring/Summer 2021 at the well-known Chinese architectural site Yu Garden to capture the new wave of digital audience and create strong local buzz in the brand’s key strategic markets.
Lanvin has partnered with the most prominent stylists, photographers, artists and celebrities in creating its global campaigns and projects. Over the course of 2023, Lanvin continues to pursue the reestablishment of what the founder Jeanne Lanvin called “le chic ultime.” The house announced a new series of brand campaign titled “Character Studies: Modern Heroes and photographed by Steven Meisel, intimate portraits of four male personalities revealed the characteristics of a newly imagined Lanvin protagonist.
To honor the spirit of Jeanne Lanvin, the house has created Lanvin Lab, a space dedicated to projects which take the form of collaborative collections and complement the seasonal ones. For its first edition, Lanvin Lab has invited acclaimed Grammy-winning artist Future to design a collection.
The new Lanvin has been seen on Beyoncé, Elle Fanning, Claire Danes, Andrew Garfield, Drake, Andrew Scott, Amelia Gray, Rita Ora, Sienna Miller and among many other celebrities and individuals of influence. Lanvin also places strong emphasis on creating local content and events to address different audiences and consumer appetites in key markets including Europe, U.S. and Greater China.
60
Table of Contents
Powered by the aforesaid “dual-engine” strategy, special campaigns, contents and merchandise are created for every specific moment in the Greater China market, including “Double 11,” 520, Chinese Valentine’s day and Chinese New Year, leveraging the influence of a wide group of local celebrities and cultural influencers, as well as key opinion leaders (“KOLs”) on various local social platforms, including RED, WeChat and Weibo.
Wolford’s marketing strategy leverages the three brand main pillars: Wolford, The W (Athleisure) and W Lab (Collaborations). For the pillar of Wolford, the brand keeps on working and pushing organic placement to maximize product visibility on social media and press and create desirability towards consumers; Wolford partners with external talent to create bespoke styles for events or performances; they increase visibility and consideration via dedicated digital and media plan to increase the brand community and engagement with consumers. For the pillar of The W, the brand creates a network of international KOLS in the body movement field to create social media visibility and cutting edge offline event; the brand forms the W Club and the influencers have the possibility to try the latest disciplines, best instructors and coolest clubs in key locations. For the pillar of W Lab, they have collaborated with various fashion brands such as Vivienne Westwood, Amina Muaddi, Neiwai, Albert Ferretti, and GCDS.
Sergio Rossi’s marketing strategy is based on an all-round approach with the customer at its center. Sergio Ross manages the relationship with their customers from an omni-channel perspective, enhancing the interaction between the digital and physical dimensions. Customers shop across different channels, and through digital tools that directly and regularly inform them about new campaigns, products, and collaborations using original contents Sergio Ross develops and produces for a specific project or collection. The brand aims to provide tailored content and messages to customers and, through its presence on social media, translates products into a narrative aimed at attracting them through inspiration. All marketing campaigns focus on a global vision and with local content. The brand generates value with pieces that are seen on high-end professionals and influencers with vast spending power. They form a connected international community of decision makers and opinion leaders characterized by their strong personalities, refinement, enhanced intellectuality and a high degree of influential power among their personal and professional peer groups.
As a widely recognized luxury brand, St. John utilizes various marketing tools to strengthen the brand image, influence purchase behavior, and maintain the brand loyalty. Primary marketing channels include digital and social media marketing, collection presentations, and print advertising. The public relations team facilitates relationships with earned media and influencers within entertainment, fashion, and more. St. John also organizes special events to strengthen brand profiles, create deeper connections with customers and the community.
At Caruso, most of the marketing budget is allocated to content production to be mainly used digitally via social media platforms. A seasonal digital advertisement campaign is produced twice a year in addition to the look book which is increasingly styled in a way that allows for it to be utilized also for image building (on top of its main aim which is selling). Other content is produced and utilized throughout the year (still life images, occasion-linked looks, etc.).
Sales Channels
Our sales teams bring our customers into our community, sharing with them our creativity and craft, as well as our story and the journey of each item. These relationships are nurtured in-store and online with respect to our DTC channel and in our showrooms with respect to our wholesale channel, with the aim of delivering a consistent and unique customer experience.
We distribute and sell our products in around 80 countries worldwide through a well-established omni-channel network comprised of our DTC (including e-commerce), and wholesale distribution channels. We are harnessing the power of technology to reinforce our customer database and CRM strategies, in order to quickly react to the evolving demands of today’s consumers.
On top of the brands’ own digital channels, we have also established a North America Digital Platform to amplify the luxury online shopping experience and operational efficiency for our brands in the North American markets.
61
Table of Contents
Lanvin
For the year ended December 31, 2023, approximately 49.5% of our revenues from Lanvin were generated through our DTC channel including both retail DTC channel and e-commerce DTC channel, approximately 35.7% was generated through the points of sale operated by our wholesale distribution channel including online multi-brand stores.
DTC Channel
As of December 31, 2023, Lanvin operated 36 DOSs, of which 18 were in Greater China, 7 were in EMEA, 10 were in North America and 1 was in Other Asia. The latest store openings up to December 31, 2023 include Serravalle (Milan), Bal Harbour (US), Cabazon (US), Sawgrass (US), and Shenzhen Mixc (China). The DTC channel is distributed throughout the main markets in which Lanvin operates. These main markets help Lanvin focus on maintaining a presence in prestigious and strategic locations.
The concepts and aesthetics of the DOSs are carefully planned and designed by Lanvin’s creative team jointly with external design agencies. Boutiques are created in several different concepts based on the regional characteristics and store conditions. Once opened, an internal staff of architects and visual merchandisers who are supported by external professional firms continually maintain and restyle the DOSs as required.
In addition, Lanvin has in place specific training programs dedicated to sales staff, focusing on product knowledge and customer service. To select the range of products sold in DOSs, buyers and merchandisers in regional offices select the best selection of products in terms of models, materials and color variants.
The DTC channel also includes an e-commerce shop operated directly through the website www.lanvin.com, outlets and other e- commerce platforms through which Lanvin sells directly to customers (such as TMall, JD.com, Farfetch and WeChat) and whose sales systems are integrated with Lanvin’s sales and warehouse management systems.
Wholesale Channel
As of December 31, 2023, the wholesale distribution network included 283 points of sale operated by wholesale customers and franchisees, of which 20 were in APAC, 218 were in EMEA, 45 were in North America and five were in other regions. For the year ended December 31, 2023, the wholesale channel generated revenues representing 35.7% of revenues from Lanvin.
The wholesale distribution channel has developed through agreements with different types of wholesale customers, including, in particular:
| • | Department stores and multi-brand specialty stores, which purchase Lanvin products for re-sale in their stores, sometimes in specific Lanvin branded wall units or corners. The contractual arrangements with this type of customer vary based on the retailer’s standard terms. |
| • | Online multi-brand stores. Lanvin branded products are also sold via prestigious online multi-brand stores such as Net- a- Porter, 24 Sevres, Luisa Via Roma and SSENSE. |
| • | Duty Free stores, with specific Lanvin branded spaces, such as DFS Lagardère in Greater China. As with the DTC channel, Lanvin carefully manages and, if necessary, customizes the distribution policies for wholesale customers. |
Wolford
For the year ended December 31, 2023, approximately 69.2% of revenues from Wolford were generated through the DTC channel including retail DTC channel and e-commerce DTC channel, and approximately 30.1% was generated through the points of sale operated by the wholesale distribution channel including online multi-brand stores.
62
Table of Contents
DTC Channel
As of December 31, 2023, Wolford operated 150 DOSs worldwide covering more than 45 countries, of which 10 were in APAC, 116 were in EMEA and 24 were in North America. These DOSs include boutiques, outlets, concession shop-in-shops and pop-up stores.
The Global Retail Division is responsible for the guidelines of aesthetic design and decoration standards. Once opened, an internal staff of architects and visual merchandisers who are supported by external professional firms constantly maintain and restyle the DOSs as required. In June 2021, Wolford opened Hangzhou Tower boutique - the first boutique in China in Hangzhou Tower and new concept of green and sustainability was first applied in Wolford’s store design and decoration.
The DTC channel also includes an e-commerce shop operated directly through the website www.wolfordshop.com and other e- commerce platforms through which Wolford sells directly to customers (such as TMall, Farfetch and WeChat) and whose sales systems are integrated with Wolford’s sales and warehouse management systems.
Wholesale Channel
As of December 31, 2023, the wholesale distribution network included 51 boutiques by Wolford’s partners. Wolford also sells products via approximately 1,800 wholesale partners, such as department stores and specialist retail stores. For the year ended December 31, 2023, the wholesale channel generated revenues representing 30.1% of revenues from Wolford.
The wholesale distribution channel has developed through agreements with different types of wholesale customers, including, in particular:
| • | Franchisees, which operate mono-brand points of sale exclusively under the Wolford brands. The franchising agreements governing these relationships typically have a medium term (providing for an automatic renewal or a renegotiation period prior to the term expiry). The contractual arrangements may also provide for minimum purchase obligations by the franchisee, and for the obligation by Wolford and/or the franchisee to invest certain amounts in marketing activities. |
| • | Department stores and multi-brand specialty stores, which purchase Wolford products for re-sale in their stores, sometimes in specific Wolford branded wall units. The contractual arrangements with this type of customers vary based on the relevant store’s standard terms. |
| • | Online multi-brand stores. Wolford branded products are also sold via prestigious online multi-brand stores such as SSENSE, Luisa via Roma, Shopbop. |
As with the DTC channel, Wolford carefully manages and, if necessary, customizes the distribution policies for wholesale customers.
Sergio Rossi
For the year ended December 31, 2023, approximately 55.4% of revenues from Sergio Rossi were generated through the DTC channel including retail DTC channel and e-commerce DTC channel, and approximately 44.6% were generated through the points of sale operated by the wholesale distribution channel including online multi-brand stores and third-party production activity.
63
Table of Contents
DTC Channel
As of December 31, 2023, Sergio Rossi operated 48 DOSs, of which 36 were in APAC and 12 were in EMEA. For the year ended December 31, 2023, the DTC channel generated revenues representing 55.4% of our revenues from Sergio Rossi. The DTC channel is distributed throughout the main markets in which Sergio Rossi operates. Sergio Rossi focuses on maintaining a presence in prestigious and strategic locations.
The aesthetics and customer experience of Sergio Rossi DOSs are carefully planned and designed by the artistic direction team. Once opened, an internal staff of architects and visual merchandisers who are supported by external professional firms constantly maintain and restyle DOSs as required. In addition, Sergio Rossi has in place specific training programs dedicated to the sales staff, focusing on product knowledge and customer service. To select the range of products sold thought DOSs, we establish guidelines at the group-level based on market potential and the characteristics of the points of sale. Buyers and merchandisers in our regional offices then select the best selection of products in terms of models, materials and color variants.
The DTC channel also includes an e-commerce shop operated through the website www.sergiorossi.com, outlets, concessions within department stores around the world and other e-commerce platforms through which Sergio Rossi sells directly to customers (such as TMall and Farfetch) and whose sales systems are integrated with Sergio Rossi’s sales and warehouse management systems.
Wholesale Channel and Third Parties Production
As of December 31, 2023, the wholesale distribution network included over 241 points of sale operated by wholesale customers and franchisees, of which 51 were in APAC, 175 were in EMEA and 15 were in North America.
For the year ended December 31, 2023, the wholesale channel and third parties production activity generated revenues representing 44.6% of revenues from Sergio Rossi.
The wholesale distribution channel has developed through agreements with different types of wholesale customers, including in particular:
| • | Franchisees, which operate mono-brand points of sale exclusively under the Sergio Rossi brands. The franchising agreements governing these relationships typically have a medium term (providing for an automatic renewal or a renegotiation period prior to the term expiry). The contractual arrangements may also provide for minimum purchase obligations by the franchisee, and for the obligation by Sergio Rossi and/or the franchisee to invest certain amounts in marketing activities. |
| • | Department stores and multi-brand specialty stores, which purchase Sergio Rossi products for re-sale in their stores, sometimes in specific Sergio Rossi branded wall units. The contractual arrangements with this type of customers vary based on the relevant store’s standard terms. |
| • | Online multi-brand stores. Sergio Rossi products are also sold via prestigious online multi-brand stores such as Luisa via Roma and Stylebop. |
As with the DTC channel, Sergio Rossi carefully manages and, if necessary, customizes distribution policies for wholesale customers.
Third parties production is the luxury shoes production for important and upcoming external brands (such as Amina Muaddi). The services offered, in addition to production, can be design, product development, sample development, sourcing, packaging, logistics and distribution.
St John
For the year ended December 31, 2023, approximately 78.5% of revenues from St. John were generated through the DTC channel including retail DTC channel and e-commerce DTC channel, and approximately 21.2% was generated through the points of sale operated by the wholesale distribution channel including online multi-brand stores.
64
Table of Contents
DTC Channel
As of December 31, 2023, St. John operated 45 DOSs, of which 9 were in APAC and 36 were in North America. The DTC channel is distributed throughout the main markets in which St. John operates. St. John focuses on maintaining a presence in prestigious and strategic locations.
The DTC channel also includes an e-commerce shop operated directly through the website www.stjohnknits.com, outlets, and other e-commerce platforms through which St. John sells directly to customers (e.g., Farfetch) and whose sales systems are integrated with St. John’s sales and warehouse management systems.
Wholesale Channel
As of December 31, 2023, the wholesale distribution network included over 60 points of sale operated by wholesale customers and franchisees, of which 9 were in APAC, 12 were in EMEA and 41 were in North America. For the year ended December 31, 2023, the wholesale channel generated revenues representing 21.2% of revenues from St. John. As with the DTC channel, St. John carefully manages and, if necessary, customizes the distribution policies for wholesale customers.
Caruso
For the year ended December 31, 2023, revenues from Caruso were generated through the points of sale operated by the wholesale distribution channel including online multi-brand stores.
Wholesale Channel and Third Parties Production
As of December 31, 2023, the wholesale distribution network included over 183 points of sale operated by wholesale customers and franchisees, of which 27 were in APAC, 145 were in EMEA and 11 were in North America.
Third parties production (or the so called B2B channel), helps Caruso deal with all aspects of luxury menswear projects for top maisons around the world including materials R&D, pattern and prototype development, sample production (also for fashion shows), and mainly ready-to-wear and made-to-measure production, most of the time in the proprietary production facilities in Soragna. Main clients include well-known luxury brands from some of the largest groups in the industry.
Intellectual Property
As of the date of this annual report, and with an overall trademark portfolio including more than 1,000 registrations, the principal owned trademarks or trade names that we use in the business of our portfolio brands business are “Lanvin”, “Wolford,” “Sergio Rossi” and “ St. John,” which we have registered in all of the countries in which we operate and jurisdictions of which our branded products are offered (i.e. all POSs operated by third parties), either in the logo version and in the word/standard characters version or in versions which are adapted to various local alphabets or ideographs. In the case of Caruso, the marks “Caruso 1 Raffaele Caruso” have been registered in all the countries that we operate (except for Iceland). We have also registered certain other marks used in our products and in our main marketing projects. Additionally, we have a portfolio of domain names, including (i) registrations in most the countries in which we operate and in the case of Sergio Rossi and Wolford, jurisdictions of which our branded products are offered (and in the case of St. John, with a primary focus on .com domain names), (ii) some variations of the trademarks, and (iii) early and basic protection for our main business and marketing projects.
Besides trademarks, we invest significant resources in protecting other aspects of our brands’ uniqueness. With more than 22,000 designs (both registered and unregistered) and more than 22,000 copyrights (both registered and unregistered), every season we select the most relevant and original products, patterns and, to the extent necessary, protect our rights, labels, and take action to protect their design and defend them against counterfeiting.
65
Table of Contents
We devote significant resources to the protection and enhancement of our intellectual property assets and actively monitor the market for infringements or abuses of our trademarks and product designs. We are also active in enforcing our rights against third-party infringements. In addition, we monitor third-party applications for registration of trademarks that could be confused with our trademarks, and file oppositions against the applications for, or the registration of such trademarks in accordance with the laws and regulations of the relevant jurisdictions and cooperate with competent authorities worldwide to fight the counterfeiting of our products.
Thanks to the long-standing efforts discussed above, judicial and/or administrative decisions in countries including China have recognized the trademark “Lanvin” as a mark with certain reputation on the goods of clothing and so on and have rejected applications of third parties’ use of the mark on the goods of “lending library services; zoological garden services,” “Beer, water (beverage)” and “Unprocessed wood; natural followers; etc.”
We are involved in a potential dispute with certain minority shareholders of Arpège SAS in relation to the use of the “Lanvin” name and brand by us at the group holding company level. We have sought preliminary legal advice and believe we have defenses to such allegations. Nevertheless, we may need to cease the use of the “Lanvin” name and brand by us at the group holding company level. See “Item 3. Key Information—D. Risk Factors—Risks Relating to Our Business and Industry—The re-branding to Lanvin Group is being challenged by the minority shareholders of Arpège SAS. Arpège SAS, one of our subsidiaries, holds our Lanvin brand portfolio including the ‘Lanvin’ brand name. We cannot predict the outcome of such challenge and may have to discontinue the use by us, at the Group holding company level, of the Lanvin brand name.”
Employees
As of December 31, 2023, 2022 and 2021, respectively, we had the following number of employees, categorized by brand and geographic locations as set forth in the tables below.
| As of December 31, | ||||||||||||
| 2023 | 2022 | 2021 | ||||||||||
| Lanvin Group |
62 | 71 | 30 | |||||||||
| Lanvin |
384 | 380 | 311 | |||||||||
| Wolford |
952 | 1,321 | 1,081 | |||||||||
| Sergio Rossi |
423 | 462 | 440 | |||||||||
| St. John |
357 | 818 | 1,114 | |||||||||
| Caruso |
459 | 435 | 416 | |||||||||
|
|
|
|
|
|
|
|||||||
| Total |
2,637 | 3,487 | 3,392 | |||||||||
|
|
|
|
|
|
|
|||||||
| As of December 31, | ||||||||||||
| 2023 | 2022 | 2021 | ||||||||||
| EMEA |
2,075 | 2,062 | 1,867 | |||||||||
| North America |
136 | 941 | 1,124 | |||||||||
| Greater China |
363 | 407 | 337 | |||||||||
| Japan |
63 | 77 | 64 | |||||||||
|
|
|
|
|
|
|
|||||||
| Total |
2,637 | 3,487 | 3,392 | |||||||||
|
|
|
|
|
|
|
|||||||
| (1) | In July 2021, we acquired 100% equity interest in Sergio Rossi S.p.A. |
Historically, we have had good labor relationships with our employees and we are committed to maintaining a positive and constructive relationship with them. In the past, we have not experienced any material job action or labor stoppage that has had a material impact on our business.
Our production was suspended at our manufacturing and logistics facilities and our stores were temporarily closed in response to the COVID-19 pandemic in 2020. By 2021, a majority of our manufacturing and logistics facilities and stores had re-opened and most of our furloughed employees had returned to work. Consequently, our headcounts gradually increased from 2021 to 2022 at each brand level except for St. John, which reduced its workforce in 2022 in order to de-layer organization, increase efficiency and facilitate accountability. Our headcounts decreased from 2022 to 2023, reflecting the implementation of the agile labor model in offline business, the promotion of online business and optimized manufacturing capacities.
66
Table of Contents
We currently do not expect any labor shortages in the future that would significantly affect our business, except for labor shortages that result from any unforeseen and uncontrollable circumstances including wars, pandemic and natural disasters.
Research and Development
Our competitiveness depends on, among other things, our ability to anticipate trends and to identify and respond to new and changing consumer preferences. We therefore devote significant resources to various research and development activities to design, create and develop new products for our collections.
Our research and development activities mainly relate to the development of new patterns and designs for our fabrics, the research of innovative and technological materials with specific features, the design, modeling and development of new products and the creation of prototypes.
Each of our five existing brands has its own product development team who is responsible for research and development.
Lanvin, as a high fashion luxury brand, invested significantly in creative design and new product development. In recent years, Lanvin’s creative studio team made great efforts in studying the colors, characteristics, patterns of Jeanne Lanvin’s creative archives and interpreting them in a much more modern way, like the Pencil cat bag collection as an example. Lanvin also created two popular styles of sneakers - Bumper and Curb, which earned American NBA players, celebrities and street footwear fans’ recognition.
Innovation is at the heart of Wolford’s product development and is part of Wolford’s DNA. One core R&D topic at Wolford is the project working to develop recyclable products (Cradle to Cradle®) within the “Smart Textiles” sector network. In 2020, Wolford launched “Aurora 70 Tights,” the first technically recyclable tights, in the market and continue to work on developing further recyclable tights. Wolford also supplemented its bestselling “Fatal Dress” with a recyclable alternative - “Aurora Tube Dress”. Wolford reached key milestones enabling it to produce 50% of its existing products in line with the C2C concept by 2025. Wolford’s use of 3D printing, an area in which the company is playing a pioneering role, is also proving highly successful.
The DNA of Sergio Rossi is indeed the inspiration for every new collection and it shows through a constant dialog between past and present, using the brand’s archive as a crucial starting point for the design and development of each collection. From the launch of “The Living Heritage Project” (a passionate and intensive internal project of Sergio Rossi, which allowed for the creation of a physical historic archive, a digital platform dedicated to product history and the brand’s image and an exhibition space showing the brand history.) which archives Sergio Rossi’s designs for shoes, almost 6,000 historical models from all over the world have been collected and restored, representing the history of Sergio Rossi’s creative genius since the foundation of the brand in the 1950s. Simultaneously, more than 14,000 documents - drawings, look books, advertising and editorial images - have been recovered and digitized.
Innovation is a constant at St. John, as the design team is perpetually researching trends throughout the world, finding inspiration from vintage archives, and collaborating with fabric mills and yarn vendors. St. John’s research and development ensures that their knitwear techniques remain innovative and fresh, maintaining their spot as the leader in modern knitwear. Yarns are sourced throughout the world and processed through proprietary in-house machinery and techniques. The knitting machines range from 3.5g to 18g, with seven different types of machine gauges enabling different types of knitted fabrics. Tweeds, for instance, incorporate up to eight different kinds of yarn, resulting in a textured weave with the comfort of a knit. On finer gauge machines, St. John utilizes advanced techniques to create streamlined dresses and gowns with details like pleats, flares, and patterns. These knitted fabrications remain the DNA of the brand.
67
Table of Contents
At Raffaelle Caruso, tailoring quality and industrial technology are symbiotic. Sixty years of history has shaped Caruso’s concept of tailoring, and the company has been able to integrate the most modern technologies (such as the automatic cutting) in its service of work specialization; in this way, the technicians can dedicate sufficient time to the care and craftsmanship of all details, such as the Milan buttonhole, one of the icons that make Caruso’s integrated production unique. The soul of Caruso products is the fully canvassed tailoring. Caruso considers their sartorial jackets to be natural, but, above all, alive: a structure skillfully hand-basted using the finest Mongolian horsehair, cotton and wool, which makes it soft and light but able to maintain its shape like no synthetic material can. The more you wear it, the less you feel it.
Regulatory Environment
We are required to comply with the laws and regulations applying to our products and operations in the various jurisdictions in which we operate, particularly in relation to the protection of intellectual property rights, competition, product safety, packaging and labeling, import and processing of certain raw materials and finished goods, data protection, limits on cash payments, worker health and safety and the environment. Compliance with the applicable laws and regulations is monitored by governmental authorities and the principal objective of such regulations is to ensure that the products we market are safe and duly labeled and imported. Virtually all of our imported products are subject to custom duties and other taxes, which may impact the price of such products. We maintain compliance procedures and policies to assist in managing our import and export activities and ensure compliance with the laws and regulations of the jurisdictions where we operate.
Property, Plant and Equipment
We operate through manufacturing facilities, corporate offices, showrooms, warehouses, stores, land and other buildings around the world, which are in part owned by our portfolio brands and in part leased from third parties.
The following table sets forth information relating to owned real estate assets used in the conduct of our business as of the date of this annual report.
| Location |
Use |
Approximate Square Meters | ||
| Via Stradone 600, San Mauro Pascoli, Italy |
Factory, storage and offices |
55,600 | ||
| Nemčavci 78, 9000 Murska Sobota, Slovenia |
Factory |
27,145 | ||
| No.9891, Pacifico Boulevard, Pacifico Industrial Park Tijuana B.C. Mexico Z.C. 22643 |
Factory |
32,843 |
The total carrying value of our property, plant and equipment as of December 31, 2023 was €43,731 thousand.
Legal Proceedings
We are party to civil and administrative proceedings (including tax audits) and to legal actions in the normal course of our business, including with respect to labor matters and commercial agreements matters. Adverse decisions in one or more of these proceedings could require us to pay substantial damages. Litigation is subject to many uncertainties, and the outcome of individual matters is not predictable with assurance. An accrual is established in connection with pending or threatened litigation if a loss is probable and a reliable estimate can be made.
Lanvin Dispute
In 2018, we acquired a controlling stake in Arpège SAS and its subsidiary Jeanne Lanvin SA, which in turn owns the brand “Lanvin”. The shareholders’ agreement entered into by and between FIH and certain minority shareholders of Arpège SAS (as subsequently acceded to by FFG Lily (Luxembourg) S.à.r.l and then by FFG Lucky SAS, the “Lanvin SHA”) provides that certain matters require an affirmative vote of each member of the board of Arpège SAS representing minority shareholders, including the entry into any related party transactions. The minority shareholders currently own, in the aggregate, 4.73% of the equity securities in Arpège SAS.
68
Table of Contents
In October 2021, after rounds of discussion and negotiation with the minority shareholders, we proposed to the members of the board of Arpège SAS representing minority shareholders that an authorization letter permitting the rest of the Lanvin Group to use the “Lanvin” name and brand as part of an international re-branding of Fosun Fashion Group be approved by the board of Arpège SAS. The re-branding was worldwide and well received by our investors and the press. At that time the minority shareholders did not object to the use of the “Lanvin” corporate name and merely suggested some changes to the terms of the authorization letter. We believed such terms were generally reasonable and would be quickly resolved in an amicable fashion. In March through May 2022, the parties continued discussions and negotiations in what appeared to us to be in an amicable and reasonable fashion.
In September 2022, we received a letter (the “Minority Shareholder Letter of September 2022”) from one of the minority shareholders (the “Alleging Shareholder”) alleging that we had improperly used the “Lanvin” corporate name in connection with our re-branding initiative and that they had not given formal approval pursuant to the terms of the Lanvin SHA prior to our re-branding. The Alleging Shareholder had also stated in the same letter that other minority shareholders also object to our use of the “Lanvin” name in connection with our re-branding initiative.
We have sought preliminary legal advice and believe we have strong legal defense to the foregoing allegations. No formal legal proceedings have been brought by the minority shareholders to date. Any such proceedings or claims can have an adverse impact on us because of defense and settlement costs, diversion of resources and other factors, and there can be no assurance that we will prevail in any legal proceeding that may be brought by the minority shareholders or that we will be able to settle these allegations on a timely basis or on terms that are acceptable to us, or at all. Accordingly, we might have to cease our use, at the group holding company level, of the “Lanvin” brand name, and change to another name (or revert to our previous name as Fosun Fashion Group) should we not prevail or settle these allegations. However, we do not expect that, even if we do not prevail or settle these allegations, the continued use of the Lanvin name by Arpège SAS and its subsidiaries, which constitute our Lanvin brand portfolio, will be affected.
Furthermore, pursuant to the Lanvin SHA, if Fosun loses its control over us, i.e., the possession, directly or indirectly, of the ability to direct or cause the direction of our policies and management, we may be obligated to cause the equity interest we hold indirectly in Arpège SAS to be transferred back to Fosun or its controlled affiliates. FFG Lucky SAS, our wholly-owned subsidiary, acquired certain equity securities in Arpège SAS in a series of permitted transfers by virtue of being an affiliate of Fosun Industrial Holdings Limited, the original shareholder of such equity securities. In the Minority Shareholder Letter of September 2022, the Alleging Shareholder further stated that, if FFG Lucky SAS ceases to be an affiliate of Fosun Industrial Holdings Limited and/or Fosun, FFG Lucky SAS may be obligated to transfer the relevant equity securities in Arpège SAS back to Fosun Industrial Holdings Limited and/or Fosun.
We believe that the possibility of Fosun losing control over us in the foreseeable future is remote. Further, even if Fosun were to cease control of us and, in turn, FFG Lucky SAS, we believe there are valid defenses to the request by the minority shareholders of Arpège SAS that FFG Lucky SAS should transfer the relevant equity securities of Arpège SAS back to Fosun. Nevertheless, we cannot assure you that Arpège SAS will remain as our subsidiary at all times. If the relevant equity securities in Arpège SAS were to be transferred to Fosun or its controlled affiliates other than us, we will lose a substantial part of our revenue and operations, and we would likely lose all rights to use of the Lanvin name and Lanvin brand. The occurrence of any of these can result in substantial decline in the trading price of our Securities.
See “Item 3. Key Information—D. Risk Factors—Risks Relating to Our Business and Industry—The re-branding to Lanvin Group is being challenged by the minority shareholders of Arpège SAS. Arpège SAS, one of our subsidiaries, holds our Lanvin brand portfolio including the ‘Lanvin’ brand name. We cannot predict the outcome of such challenge and may have to discontinue the use by us, at the group holding company level, of the Lanvin brand name.”
69
Table of Contents
Cantor Dispute
In 2023, Cantor Fitzgerald & Co. (“Cantor”) filed an action against us, as well as Fosun Fashion Group (Cayman) Limited and Primavera Capital Acquisition Corporation, in the Supreme Court of the State of New York, County of New York (Index No. 650028/2023), alleging breach of a financial advisor agreement and a private placement agreement (the “Complaint”). The Complaint seeks damages of approximately $5.18 million, plus interest and attorneys’ fees. We (along with the other defendants) filed an answer to the Complaint in which it asserted numerous defenses to Cantor’s claims. The parties have been engaged in fact discovery, which is almost complete as of the date of the report.
| C. | Organizational Structure |
The following diagram depicts an organizational structure of the Company as of the date hereof. Except as otherwise specified, equity interests depicted in this diagram are held as to 100%.
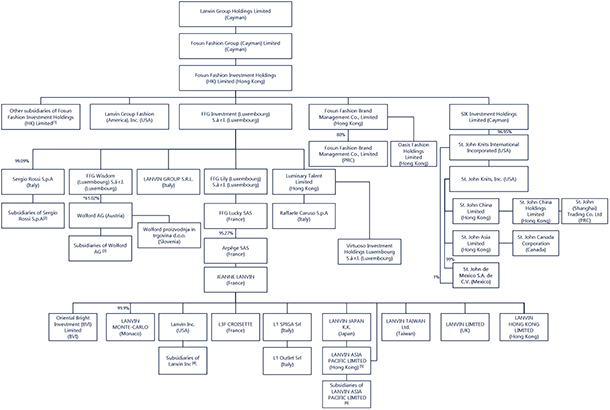
| * | In February 2023, FFG Wisdom participated in Wolford AG’s share offering in the Republic of Austria. Following the completion of the offering, FFG Wisdom’s ownership in Wolford AG increased from 58.45% to 61.02%. |
| (1) | Includes a total of four other wholly-owned subsidiaries incorporated in the PRC: (i) Shanghai Fulang Brand Management (Group) Co., Ltd., (ii) Fosun Fashion (Hainan) Industry Development Co., Ltd. (iii) Fosun Fashion (Shanghai) Consulting Management Co., Ltd., and (iv) Fulang (Zhuhai Hengqin) Fashion Industry Development Co., Ltd., and LANV FASHION PTE. LTD., a wholly-owned subsidiary incorporated in Singapore. Shanghai Fulang Brand Management (Group) Co., Ltd. holds 60% equity interest in Lanvin Group Fabric Development Technology (Haining) Co., Ltd., a company incorporated in the PRC. |
70
Table of Contents
| (2) | Includes a total of six wholly-owned subsidiaries: (i) Sergio Rossi Hong Kong Limited, a company incorporated in Hong Kong, (ii) Sergio Rossi Japan Limited, a company incorporated in Japan, (iii) Sergio Rossi UK Limited, a company incorporated in United Kingdom, (iv) Sergio Rossi USA Inc., a company incorporated in the U.S., (v) Sergio Rossi Retail s.r.1., a company incorporated in Italy and (vi) Sergio Rossi Deutschland GmbH, a company incorporated in Germany. Sergio Rossi Shanghai Trading Limited, a company incorporated in the PRC, is a wholly-owned subsidiary of Sergio Rossi Hong Kong Limited. |
| (3) | Includes a total of 13 wholly-owned subsidiaries: (i) Wolford Deutschland GmbH, a company incorporated in Germany, (ii) Wolford (Schweiz) AG, a company incorporated in Switzerland, (iii) Wolford London Ltd. (UK), a company incorporated in United Kingdom, (iv) Wolford Paris S.A.R.L., a company incorporated in France, (v) Wolford Italia S.r.1., a company incorporated in Italy, (vi) Wolford Espana S.L., a company incorporated in Spain, (vii) Wolford Scandinavia ApS, a company incorporated in Denmark, (viii) Wolford America, Inc., a company incorporated in the U.S., (ix) Wolford Nederland B.V., a company incorporated in Netherlands, (x) Wolford Canada Inc., a company incorporated in Canada, (xi) Wolford Asia Limited, a company incorporated in Hong Kong, (xii) Wolford Belgium N.V., a company incorporated in Belgium, and (xiii) Wolford (Shanghai) Trading Co., Ltd., a company incorporated in the PRC. Wolford Berangere, a company incorporated in France, is a wholly-owned subsidiary of Wolford Paris S.A.R.L. |
| (4) | Includes a total of seven wholly-owned subsidiaries incorporated in the U.S.: (i) L1 Bal Harbour LLC, (ii) L2 Crystals LLC, (iii) L3 Madison LLC, (iv) L4 Rodeo Drive LLC, (v) L5 US ECOM LLC, (vi) L6 MADISON, LLC, and (vii) L8 South Coast Plaza LLC. |
| (5) | Includes a total of two wholly-owned subsidiaries: (i) Lans Atelier (SHANGHAI) Trading Co., Ltd., a company incorporated in the PRC and (ii) LANVIN MACAU LIMITED, a company incorporated in Macao. |
| (6) | One ordinary share of LANVIN ASIA PACIFIC LIMITED is held by LANVIN JAPAN K.K. |
| D. | Property, Plants and Equipment |
Please refer to “—B. Business Overview—Property, Plant and Equipment” for a discussion of our property, plants and equipment.
| ITEM 4A. | UNRESOLVED STAFF COMMENTS |
None.
71
Table of Contents
| ITEM 5. | OPERATING AND FINANCIAL REVIEW AND PROSPECTS |
You should read the following discussion and analysis of our financial position and results of operations in conjunction with our consolidated financial statements and the related notes included elsewhere in this annual report. This discussion contains forward-looking statements that involve risks and uncertainties. Our actual results and the timing of selected events could differ materially from those anticipated in these forward-looking statements as a result of various factors, including those set forth under “Item 3. Key Information—D. Risk Factors” and elsewhere in this annual report.
| A. | Operating Results |
Overview
We are a global luxury fashion group with five portfolio brands, namely Lanvin, Wolford, Sergio Rossi, St. John and Caruso. Founded in 1889, Lanvin is one of the oldest French couture houses still in operation, offering products ranging from apparel to leather goods, footwear, and accessories. Wolford, founded in 1950, is one of the largest luxury skinwear brands in the world, offering luxury legwear and bodywear, with a recent successful diversification into leisurewear and athleisure. Sergio Rossi is a highly recognized Italian shoemaker brand and has been a household name for luxury shoes since 1951. St. John is a classic, timeless and sophisticated American luxury womenswear house founded in 1962 and Caruso has been a premier menswear manufacturer in Europe since 1958. In addition to our current five portfolio brands, we are also actively looking at potential add-on acquisitions as part of our growth strategy.
Our goal is to build a leading global luxury group with unparalleled access to Asia and to provide customers with excellent products that reflect our brands’ tradition of fine craftsmanship with exclusive design content and a style that preserves the exceptional manufacturing quality for which those brands are known. This is consistently achieved through the sourcing of superior raw materials, the careful finish of each piece, and the way the products are manufactured and delivered to our customers in 2023, 2022 and 2021, we recorded revenues of €426.2 million, €422.3 million and €308.8 million, respectively, loss for the year of €146.3 million, €239.8 million and €76.5 million, respectively, and adjusted EBITDA (non-IFRS measure) of €(64.2) million, €(72.0) million and €(58.9) million, respectively. See “—non-IFRS Financial Measures.”
We operate a combination of direct-to-consumer or DTC, and wholesale channels worldwide through our extensive network of around 1,100 points of sale, or POSs, including 279 directly operated retail stores (across our five portfolio brands) as of December 31, 2023. We distribute our products worldwide via retail and outlet stores, wholesale customers and e-commerce platforms. Taking into account the DTC (including both directly-operated stores and e-commerce sites) and wholesale channels, we are present in around 80 countries.
Key Factors Affecting Our Financial Condition and Results of Operations
Our financial condition and results of operations are affected by a number of factors, including those that are outside of our control.
72
Table of Contents
Creating new luxury products within our current brands
We believe there are significant growth opportunities in capitalizing on our brands’ recognition and customer base by rebalancing our current product portfolio and introducing new product categories. Each portfolio brand is fully equipped to optimize its product mix and expand into new categories, such as leather goods and cosmetics, which represent significant growth opportunities on their own. The portfolio brands will continue to tap into new trends including athleisure, and will evolve with the emerging, young client base globally with high spending power. As we expand into new product categories, we expect that these product categories will contribute to revenue growth over time.
DTC network expansion
We intend to grow our global presence through expanding our DTC network, by entering new geographies, opening more stores and executing an omnichannel distribution strategy. While today we have a presence in Europe, North America and Asia, we believe there is significant future runway for growth driven by the accelerated expansion of the global luxury goods market, which is expected to exceed €580 billion by 2030. In addition to increasing the number of physical stores, our omnichannel distribution strategy will involve expansion of our e-commerce offering and development of our digital marketing capabilities. We believe that revenue growth will in part be driven by the pace and success of our DTC network expansion.
Identifying new strategic investment and partnerships that complement our luxury fashion ecosystem
We will continue to seek partners and investments in high-quality assets in diverse markets and product categories that can flourish within our luxury fashion ecosystem. We currently have a strong group of strategic partners that support our brands in production, distribution and sourcing. We plan to find additional strategic partners to further expand our footprint as well as improve our supply chain. Additionally, while our investment focus remains on high-end brands with rich heritage and fine craftsmanship, we have a long-term plan to launch an incubator fund dedicated to minority investments in fast-growing companies with strengths in creativity, supply chain and e-commerce. We believe these will be important future partners who will further help drive the growth of our business and broaden our ecosystem.
Impact of the COVID-19 pandemic and similar health epidemics
Our operations have been affected by the outbreaks of COVID-19. We have undertaken measures to mitigate the impact of the COVID-19 pandemic and to secure our liquidity and financial position, including: (i) expansion of online business and utilization of omnichannel business models (such as livestreaming to boost online product sales); (ii) negotiation with landlords on rental costs; (iii) implementation of cost-saving measures at the headquarters, factories and stores; (iv) accessing government support measures; (v) (in the case of Sergio Rossi) increasing OEM orders for other luxury shoe brands; and (vi) expansion of the retail business generally in less impacted regions. The COVID-19 pandemic has also caused significant disruption to the global economy, consumer spending and behavior, tourism, supply chains and financial markets, leading to a global economic slowdown and a severe recession in several of the markets in which we operate. Although the COVID-19 related restrictions have generally been lifted across the markets in which we operate, our business operations may continue to experience impacts from a resurgence of COVID-19 pandemic or similar health epidemics or pandemics. See “Item 3. Key Information—D. Risk Factors—Risks Relating to Our Business and Industry—We face risks related to health epidemics, pandemics and similar outbreaks, such as the COVID-19 pandemic, which has had and may continue to have a material adverse impact on our business, financial condition and results of operations.”
73
Table of Contents
“Back-to-office” and reopening trends in the fashion industry post-COVID-19 pandemic
The world saw a significant recovery as a result of back-to-office measures implemented by businesses in 2022, which has had a particularly positive impact on our brands with the increased demand of formal wear and office wear. With our focus on heritage and elegance, our five brands have a large concentration in office wear and formal wear, including footwear and accessories, therefore each brand has had the opportunity to benefit from reopening fashion trends.
Fluctuations in exchange rates
A significant portion of our operations are in international markets outside the Eurozone, where we record revenues and expenses in various currencies other than the Euro, mainly the Chinese Renminbi and U.S. dollar, as well as other currencies.
The table below shows the exchange rates of the main foreign currencies used to prepare Lanvin Group’s annual consolidated financial statements compared to the Euro.
| Exchange rate at December 31, 2023 |
2023 Average Exchange rate |
Exchange rate at December 31, 2022 |
2022 Average Exchange rate |
Exchange rate December 31, 2021 |
2021 Average Exchange rate |
|||||||||||||||||||
| U.S. Dollar |
1.1096 | 1.0841 | 1.0658 | 1.0521 | 1.1324 | 1.1835 | ||||||||||||||||||
| Chinese Renminbi |
7.8592 | 7.6352 | 7.4229 | 7.0714 | 7.2197 | 7.6372 | ||||||||||||||||||
| Hong Kong Dollar |
8.6727 | 8.4863 | 8.3095 | 8.2390 | 8.8304 | 9.1986 | ||||||||||||||||||
| British Pound |
0.8693 | 0.8694 | 0.8843 | 0.8519 | 0.8389 | 0.8603 | ||||||||||||||||||
| Japanese Yen |
156.5266 | 151.4929 | 141.7666 | 137.7370 | 130.2725 | 129.8404 | ||||||||||||||||||
The following table shows the sensitivity at the end of the reporting period to a reasonably possible change in the main foreign currencies against the Euro, with all other variables held constant, of our profit before tax due to differences arising on settlement or translation of monetary assets and liabilities and our equity excluding the impact of retained earnings due to the changes of exchange fluctuation reserve of certain overseas subsidiaries of which the functional currencies are currencies other than the Euro.
| As of December 31, | ||||||||||||||||||||||||
| 2023 | 2022 | 2021 | ||||||||||||||||||||||
| Increase / (decrease) in loss before tax if Euro strengthens by 5% |
Increase / (decrease) in loss before tax if Euro weakens by 5% |
Increase / (decrease) in loss before tax if Euro strengthens by 5% |
Increase / (decrease) in loss before tax if Euro weakens by 5% |
Increase / (decrease) in loss before tax if Euro strengthens by 5% |
Increase / (decrease) in loss before tax if Euro weakens by 5% |
|||||||||||||||||||
| U.S. Dollar |
(12,046 | ) | 12,046 | (7,610 | ) | 7,610 | (5,418 | ) | 5,418 | |||||||||||||||
| Chinese Renminbi |
72 | (72 | ) | 138 | (138 | ) | 180 | (180 | ) | |||||||||||||||
| Hong Kong Dollar |
(256 | ) | 256 | 1 | (1 | ) | 123 | (123 | ) | |||||||||||||||
| British Pound |
136 | (136 | ) | 108 | (108 | ) | 78 | (78 | ) | |||||||||||||||
|
|
|
|
|
|
|
|
|
|
|
|
|
|||||||||||||
| Japanese Yen |
(1,094 | ) | 1,094 | 148 | (148 | ) | N.A. | N.A. | ||||||||||||||||
|
|
|
|
|
|
|
|
|
|
|
|
|
|||||||||||||
| Total |
(13,188) | 13,188 | (7,215 | ) | 7,215 | (5,037 | ) | 5,037 | ||||||||||||||||
|
|
|
|
|
|
|
|
|
|
|
|
|
|||||||||||||
74
Table of Contents
General economic conditions and consumers’ confidence
Purchases of our products tend to be discretionary and therefore sales may be volatile, particularly during periods of economic slowdown and are influenced by, among other factors, general economic conditions, consumer confidence and disposable consumer income. In times of economic growth, consumers tend to have more disposable income and travel more frequently, which may increase the demand for our products. Conversely, when economic growth is stagnant or negative, consumers may delay or avoid discretionary spending, which may result in reduced demand for our products.
Global political events and other disruptions
Global political developments, social and geopolitical sources of unrest, export restrictions, sanctions, tariffs, trade barriers, natural disasters, travel restrictions imposed by governments (such as those relating to the COVID-19 pandemic) and other events may also result in a shift in travel patterns or a decline in travel volumes, which have had in the past, and may have in the future, an adverse effect on our business, financial position, results of operations and cash flows. Although (i) the conflict in Ukraine and the resulting U.S. and European Union sanctions on Russia and (ii) the instability in the Middle East manifested through regional power struggles have had minimal impact to our business so far, further spread or extension of the conflict may result in lower sales for our EMEA business due to reduced tourism spending and negative consumer sentiment.
Seasonality
The luxury apparel market in which we operate is subject to seasonal fluctuations in sales. Our sales are usually higher in the months of the year in which wholesale customers concentrate their purchases. For example, deliveries of seasonal goods to wholesale customers tend to concentrate from November to February for the Spring/Summer collection and from June to September for the Fall/Winter collection. With regards to retail sales at our DOSs and e-commerce channels, sales tend to be higher in the last quarter of the year, driven by the holiday shopping season and in January and February, in correspondence of the Chinese New Year celebrations. However, several events may affect retail sales, including adverse weather conditions or other macroeconomic and external events.
Operating costs, in contrast, do not generally experience significant seasonal fluctuations, except for certain increases in the months of November and December due to the variable costs associated with sales commissions and leases.
We expect such seasonal trends to continue.
75
Table of Contents
Inflation
In 2021 and 2022, we have seen significant inflationary pressure from higher logistics costs for shipping of both raw materials and finished goods. Inflation has impacted our costs of goods sold by affecting production costs, raw materials, energy costs, labor costs, and costs of goods sourced from third-party vendors. We are also subject to wage inflation at our retail locations for our sales staff. Despite facing higher costs from inflation, we have generally been able to raise the prices of our products commensurate with our cost inflation in order to mitigate the impact of inflation and believe we can continue to raise prices in the future as appropriate. In addition to raising our prices, we have been able to offset the impact of inflation with cost savings from economies of scale, and increased bargaining power with our suppliers with our production and order volumes increasing. Although inflationary pressure has eased in 2023, we continue to monitor our costs to ensure we can respond quickly when macroeconomic landscape changes again.
Fluctuations in tax obligations and changes in tax laws, estimates, treaties and regulations
We and our portfolio brands are subject to taxation in Europe, the U.S. and China, as well as various other jurisdictions, with the applicable tax rates varying by jurisdiction. As a result, our overall effective tax rate is affected by the proportion of earnings from the various tax jurisdictions and by the ability to generate sufficient and suitable future taxable profits from which the reversal of any deferred tax assets can be deducted. We recognize tax expenses in multiple tax jurisdictions based on i) the estimates of taxable income, ii) the required reserves for uncertain tax positions, iii) deductible temporary differences, tax loss carry-forwards and tax credits to the extent that their future offset is probable, iv) withholdings tax on unremitted earnings, and v) the way in which we intend to recover or settle the carrying amount of deferred tax assets and liabilities. At any time, there are multiple tax years that may be subject to examinations and audits by various tax authorities.
Additionally, we are subject to duties applicable to the importation of our products in various countries, which may impact the cost of such products. In addition, countries to which we ship our products may impose safeguard quotas to limit the quantity of products that may be imported. We rely on free trade agreements and other supply chain initiatives in order to maximize efficiencies relating to the importation of our products.
Factors Affecting the Comparability of Our Results of Operations
Amendments to IFRS 16 (Leases) - COVID-19 Rent Concessions
In May 2020 the IASB issued an amendment to IFRS 16—Leases (“IFRS 16”) for COVID-19-related Rent Concessions. The amendment permits lessees, as a practical expedient, not to assess whether particular rent concessions occurring as a direct consequence of the COVID-19 pandemic are lease modifications and instead to account for those rent concessions as if they are not lease modifications, thus giving the possibility to the lessees to recognize the entire economic benefit of such discounts immediately through profit or loss.
Rent discounts are eligible for the practical expedient if they occur as a direct consequence of the COVID-19 pandemic and if all of the following criteria are met:
| • | the change in lease payments results in revised consideration for the lease that is substantially the same as, or less than, the consideration for the lease immediately preceding the change; |
76
Table of Contents
| • | any rent reduction in lease payments affects only payments originally due on or before June 30, 2022, there is no substantive change to the other terms and conditions of the lease; and |
| • | The application of such amendment is valid for financial statements starting from June 1, 2020, with early adoption allowed for financial years starting from January 1, 2020. We opted for the early adoption thus recognizing the COVID-19 related rent discounts from January 2020, when the health emergency began to significantly affect our activities in China. |
As a result of the above, our Consolidated Statement of Profit or Loss for the year ended December 31, 2021 includes a total of €80 thousand.
Acquisitions
In July 2021, we acquired 100% equity interest in Sergio Rossi S.p.A. for total consideration of €17,250,000. Sergio Rossi is an Italian luxury shoemaker known worldwide for its artisanship and for creating iconic models. Over the past 70 years, we have fostered its distinctiveness by enhancing the quality of its material, the craftsmanship and elegance of its products, and its luxury allure, which remain the foundations of Sergio Rossi’s unique style. This acquisition not only completes a more well-rounded strategic brand ecosystem for us but also creates potential synergies between brands through Sergio Rossi’s fully-owned and state-of-the-art factory. Sergio Rossi was consolidated in Lanvin Group’s consolidated financial statements starting from the acquisition date.
The acquisition resulted in negative goodwill of €7,896,000. We were able to acquire Sergio Rossi at a favorable price due to the following:
| • | The retail and fashion industry was heavily and adversely affected by the outbreak of COVID-19 in 2020, resulting in to a general decline in market valuations of entities engaging in the industry, including Sergio Rossi. |
| • | The seller that held 100% of the shares of Sergio Rossi since 2015 was at the stage of exiting investments at the time of the transaction. As such, deal certainty and the ability to complete the transaction in a timely manner were viewed as top priorities for the seller. |
Financial Information
Overview of Segmental Reporting
We have five operating segments which are described as follows:
| • | Lanvin segment - Includes all activities related to the Lanvin brand. |
| • | Wolford segment - Includes all activities related to the Wolford brand. |
| • | St. John segment - Includes all activities related to the St. John brand. |
| • | Sergio Rossi segment - Includes all activities related to the Sergio Rossi brand. |
| • | Caruso segment - Includes all activities related to the Caruso brand. |
77
Table of Contents
All of the brands deal with the same category of products that use similar production and distribution processes.
Results of Operations
Year ended December 31, 2023 compared with year ended December 31, 2022
The following is a discussion of our results of operations for the year ended December 31, 2023 as compared to the year ended December 31, 2022.
| (Euro thousands, except percentages) |
2023 | Percentage of revenues |
2022 | Percentage of revenues |
||||||||||||
| Revenues |
426,178 | 100.0 | % | 422,312 | 100.0 | % | ||||||||||
| Cost of sales |
(175,236 | ) | (41.1 | )% | (184,368 | ) | (43.7 | )% | ||||||||
|
|
|
|
|
|
|
|
|
|||||||||
| Gross profit |
250,942 | 58.9 | % | 237,944 | 56.3 | % | ||||||||||
| Marketing and selling expenses |
(226,750 | ) | (53.2 | )% | (224,733 | ) | (53.2 | )% | ||||||||
| General and administrative expenses |
(138,215 | ) | (32.4 | )% | (153,138 | ) | (36.3 | )% | ||||||||
| Other operating income and expenses |
(4,534 | ) | (1.1 | )% | (2,340 | ) | (0.6 | )% | ||||||||
|
|
|
|
|
|
|
|
|
|||||||||
| Loss from operations before non–underlying items |
(118,557 | ) | (27.8 | )% | (142,267 | ) | (33.7 | )% | ||||||||
| Non–underlying items |
(3,858 | ) | (0.9 | )% | (83,057 | ) | (19.7 | )% | ||||||||
|
|
|
|
|
|
|
|
|
|||||||||
| Loss from operations |
(122,415 | ) | (28.7 | )% | (225,324 | ) | (53.4 | )% | ||||||||
| Financial cost–net |
(20,431 | ) | (4.8 | )% | (14,556 | ) | (3.4 | )% | ||||||||
|
|
|
|
|
|
|
|
|
|||||||||
| Loss before income tax |
(142,846 | ) | (33.5 | )% | (239,880 | ) | (56.8 | )% | ||||||||
| Income tax benefits / (expenses) |
(3,407 | ) | (0.8 | )% | 129 | (0.0 | )% | |||||||||
|
|
|
|
|
|
|
|
|
|||||||||
| Loss for the year |
(146,253 | ) | (34.3 | )% | (239,751 | ) | (56.8 | )% | ||||||||
|
|
|
|
|
|
|
|
|
|||||||||
| Non–IFRS Financial Measures(1): |
||||||||||||||||
| Contribution profit |
24,192 | 5.7 | % | 13,211 | 3.1 | % | ||||||||||
|
|
|
|
|
|
|
|
|
|||||||||
| Adjusted EBIT |
(115,808 | ) | (27.2 | )% | (134,836 | ) | (31.9 | )% | ||||||||
|
|
|
|
|
|
|
|
|
|||||||||
| Adjusted EBITDA |
(64,173 | ) | (15.1 | )% | (71,958 | ) | (17.0 | )% | ||||||||
|
|
|
|
|
|
|
|
|
|||||||||
| (1) | See “—Non–IFRS Financial Measures.” |
78
Table of Contents
Year ended December 31, 2022 compared with year ended December 31, 2021
The following is a discussion of our results of operations for the year ended December 31, 2022 as compared to the year ended December 31, 2021.
| (Euro thousands, except percentages) |
2022 | Percentage of revenues |
2021 | Percentage of revenues |
||||||||||||
| Revenues |
422,312 | 100.0 | % | 308,822 | 100.0 | % | ||||||||||
| Cost of sales |
(184,368 | ) | (43.7 | )% | (138,920 | ) | (45.0 | )% | ||||||||
|
|
|
|
|
|
|
|
|
|||||||||
| Gross profit |
237,944 | 56.3 | % | 169,902 | 55.0 | % | ||||||||||
| Marketing and selling expenses |
(224,733 | ) | (53.2 | )% | (165,502 | ) | (53.6 | )% | ||||||||
| General and administrative expenses |
(153,138 | ) | (36.3 | )% | (122,497 | ) | (39.7 | )% | ||||||||
| Other operating income and expenses |
(2,340 | ) | (0.6 | )% | 10,083 | 3.3 | % | |||||||||
|
|
|
|
|
|
|
|
|
|||||||||
| Loss from operations before non–underlying items |
(142,267 | ) | (33.7 | )% | (108,014 | ) | (35.0 | )% | ||||||||
| Non–underlying items |
(83,057 | ) | (19.7 | )% | 45,206 | 14.6 | % | |||||||||
|
|
|
|
|
|
|
|
|
|||||||||
| Loss from operations |
(225,324 | ) | (53.4 | )% | (62,808 | ) | (20.3 | )% | ||||||||
| Financial cost–net |
(14,556 | ) | (3.4 | )% | (9,313 | ) | (3.0 | )% | ||||||||
|
|
|
|
|
|
|
|
|
|||||||||
| Loss before income tax |
(239,880 | ) | (56.8 | )% | (72,121 | ) | (23.4 | )% | ||||||||
| Income tax benefits / (expenses) |
129 | (0.0 | )% | (4,331 | ) | (1.4 | )% | |||||||||
| Loss for the year |
(239,751 | ) | (56.8 | )% | (76,452 | ) | (24.8 | )% | ||||||||
|
|
|
|
|
|
|
|
|
|||||||||
| Non–IFRS Financial Measures(1): |
||||||||||||||||
| Contribution profit |
13,211 | 3.1 | % | 4,400 | 1.4 | % | ||||||||||
|
|
|
|
|
|
|
|
|
|||||||||
| Adjusted EBIT |
(134,836 | ) | (31.9 | )% | (100,806 | ) | (32.6 | )% | ||||||||
|
|
|
|
|
|
|
|
|
|||||||||
| Adjusted EBITDA |
(71,958 | ) | (17.0 | )% | (58,945 | ) | (19.1 | )% | ||||||||
|
|
|
|
|
|
|
|
|
|||||||||
| (1) | See “—Non–IFRS Financial Measures.” |
Revenues
We generate revenue primarily through our five brands: Lanvin, Wolford, St. John, Sergio Rossi and Caruso, whose revenues are generated from the sale of their products, manufacturing and services for private labels and other luxury brands, as well as from royalties received from third parties and licensees. Revenue is measured at the transaction price which is based on the amount of consideration that we expect to receive in exchange for transferring the promised goods or services to the customer. For each period presented, revenue is exclusive of sales incentives, rebates and sales discount. As such, the percentage contribution of these sales incentives, rebates and sales discount is zero. Revenues for the year ended December 31, 2023 amounted to €426.2 million, an increase of €3.9 million or 0.9%, compared to €422.3 million for the year ended December 31, 2022. Revenues for the year ended December 31, 2022 amounted to €422.3 million, an increase of €113.5 million or 36.7%, compared to €308.8 million for the year ended December 31, 2021.
79
Table of Contents
The following table sets forth a breakdown of revenues by portfolio brand for the years ended December 31, 2023, 2022 and 2021. Sergio Rossi was consolidated in Lanvin Group’s consolidated financial statements starting from August 2021.
| For the years ended December 31, | Increase/ (Decrease) | |||||||||||||||||||||||||||
| (Euro thousands, except percentages) |
2023 | 2022 | 2021 | 2023 vs 2022 |
% | 2022 vs 2021 |
% | |||||||||||||||||||||
| Lanvin |
111,740 | 119,847 | 72,872 | (8,107 | ) | (6.8 | )% | 46,975 | 64.5 | % | ||||||||||||||||||
| Wolford |
126,280 | 125,514 | 109,332 | 766 | 0.6 | % | 16,182 | 14.8 | % | |||||||||||||||||||
| St. John |
90,398 | 85,884 | 73,094 | 4,514 | 5.3 | % | 12,790 | 17.5 | % | |||||||||||||||||||
| Sergio Rossi |
59,518 | 61,929 | 28,737 | (2,411 | ) | (3.9 | )% | 33,192 | 115.5 | % | ||||||||||||||||||
| Caruso |
40,011 | 30,819 | 24,695 | 9,192 | 29.8 | % | 6,124 | 24.8 | % | |||||||||||||||||||
| Other and holding companies |
10,545 | 10,947 | 6,968 | (402 | ) | (3.7 | )% | 3,979 | 57.1 | % | ||||||||||||||||||
| Eliminations and unallocated |
(12,314 | ) | (12,628 | ) | (6,876 | ) | 314 | (2.5 | )% | (5,752 | ) | 83.7 | % | |||||||||||||||
|
|
|
|
|
|
|
|
|
|
|
|
|
|
|
|||||||||||||||
| Total |
426,178 | 422,312 | 308,822 | 3,866 | 0.9 | % | 113,490 | 36.7 | % | |||||||||||||||||||
|
|
|
|
|
|
|
|
|
|
|
|
|
|
|
|||||||||||||||
The following table sets forth a breakdown of revenues by sales channel for the years ended December 31, 2023, 2022 and 2021. Sergio Rossi was consolidated in Lanvin Group’s consolidated financial statements starting from August 2021.
| For the years ended December 31, | Increase/ (Decrease) | |||||||||||||||||||||||||||
| (Euro thousands, except percentages) |
2023 | 2022 | 2021 | 2023 vs 2022 |
% | 2022 vs 2021 |
% | |||||||||||||||||||||
| DTC |
247,013 | 247,460 | 186,813 | (447 | ) | (0.2 | )% | 60,647 | 32.5 | % | ||||||||||||||||||
| Wholesale |
161,516 | 164,359 | 116,417 | (2,843 | ) | (1.7 | )% | 47,942 | 41.2 | % | ||||||||||||||||||
| Other (1) |
17,649 | 10,493 | 5,592 | 7,156 | 68.2 | % | 4,901 | 87.6 | % | |||||||||||||||||||
|
|
|
|
|
|
|
|
|
|
|
|
|
|
|
|||||||||||||||
| Total Revenues |
426,178 | 422,312 | 308,822 | 3,866 | 0.9 | % | 113,490 | 36.7 | % | |||||||||||||||||||
|
|
|
|
|
|
|
|
|
|
|
|
|
|
|
|||||||||||||||
| (1) | Fees for royalties and licenses received from third parties, and clearance. |
The following table sets forth a breakdown of revenues by geographical area for the years ended December 31, 2023, 2022 and 2021. Sergio Rossi was consolidated in our consolidated financial statements starting from August 2021.
| For the years ended December 31, | Increase/ (Decrease) | |||||||||||||||||||||||||||
| (Euro thousands, except percentages) |
2023 | 2022 | 2021 | 2023 vs 2022 |
% | 2022 vs 2021 |
% | |||||||||||||||||||||
| EMEA(1) |
201,871 | 205,715 | 148,197 | (3,844 | ) | (1.9 | )% | 57,518 | 38.8 | % | ||||||||||||||||||
| North America(2) |
147,310 | 145,519 | 106,701 | 1,791 | 1.2 | % | 38,818 | 36.4 | % | |||||||||||||||||||
| Greater China(3) |
53,188 | 48,876 | 42,518 | 4,312 | 8.8 | % | 6.358 | 15.0 | % | |||||||||||||||||||
| Other Asia(4) |
23,089 | 22,202 | 11,406 | 1,607 | 7.2 | % | 10,796 | 94.7 | % | |||||||||||||||||||
|
|
|
|
|
|
|
|
|
|
|
|
|
|
|
|||||||||||||||
| Total |
426,178 | 422,312 | 308,822 | 3,866 | 0.9 | % | 113,490 | 36.7 | % | |||||||||||||||||||
|
|
|
|
|
|
|
|
|
|
|
|
|
|
|
|||||||||||||||
| (1) | EMEA includes EU countries, the United Kingdom, Switzerland, the countries of Balkan Peninsula, Eastern Europe, Scandinavian countries, Kazakhstan, Azerbaijan and Middle East. |
| (2) | North America includes the United States of America and Canada. |
| (3) | Greater China includes Mainland China, Hong Kong Special Administrative Region, Macao Special Administrative Region and Taiwan. |
| (4) | Other Asia includes Japan, South Korea, Thailand, Malaysia, Vietnam, Indonesia, Philippines, Australia, New Zealand, India and other Southeast Asian countries. |
80
Table of Contents
By segment
Year ended December 31, 2023 compared with year ended December 31, 2022
By segment, the increase in revenues was mainly related to (i) an increase of €9.2 million in sales (or 29.8%) from Caruso segment, (ii) an increase of €4.5 million (or 5.3%) from the St. John segment and (iii) an increase of €0.8 million (or 0.6%) from the Wolford segment, which was partially offset by a decrease of €8.1 million (or (6.8)%) from Lanvin segment and a decrease of €2.4 million (or (3.9)%) from Sergio Rossi segment. Lanvin segment showed lower results compared to the previous period as the brand focused on its creative transition and had comparatively fewer key product and marketing initiatives in 2023.
Year ended December 31, 2022 compared with year ended December 31, 2021
By segment, the increase in revenues was mainly related to (i) an increase of €47.0 million (or 64.5%) in sales from the Lanvin segment, (ii) an increase of €16.2 million in sales (or 14.8%) from Wolford segment, (iii) an increase of €12.8 million (or 17.5%) from the St. John segment, and (iv) an increase of €33.2 million (or 115.5%) from the Sergio Rossi segment, which we acquired in July 2021. In particular, sales of Lanvin branded products were positively impacted by the strong growth of sales in the accessories business in North America and EMEA regions.
By sales channel
Year ended December 31, 2023 compared with year ended December 31, 2022
By sales channel, the increase in revenues was mainly related to an increase of €7.2 million (or 68.2%) in the other channel, partially offset by a decrease of €2.8 million (or (1.7)%) in the wholesale channel and a decrease of €0.4 million (or (0.2)%) in DTC channel.
Other channel growth was mainly driven by the increase of Lanvin’s royalty income and management of inventory.
The decrease in wholesale revenues was mainly due to the decrease of Lanvin and Sergio Rossi’s wholesales business, which was partiallly offset by the increase of Caruso, Wolford and St. John’s wholesale businesses. Lanvin’s wholesales business decreased because of its continued strategic focus on the DTC channel. Caruso’s manufacturing business that books its revenues to B2B clients and wholesale customers exclusively, saw its business grow €9.2 million (or 29.7%) year-over-year, supported by the back-to-elegance trend and increasing orders from existing and new clients. Wolford’s wholesale business contributed a growth of €3.6 million (or 10.6%) year-over-year, driven by products category optimization and price increase. Sales to our five largest customers were 5.4% and 4.6% of our revenues for the years ended December 31, 2023 and 2022, respectively. No single customer accounted for more than 5% of our consolidated revenues for the years ended December 31, 2023 and 2022.
81
Table of Contents
The decrease in the DTC channel was mainly due to the decrease of Lanvin and Wolford, which was partially offset by an increase of St. John and Sergio Rossi. In particular, our St. John saw growth globally, as increased brand awareness and growing popularity of our ready-to-wear products propelled sales in our stores and e-commerce business.
Our e-commerce business saw an increase of €1.4 million (or 2.6%) for the year ended December 31, 2023 and was mainly driven by Sergio Rossi and St. John, whose e-commerce sales increased by 13.8% and 5.2%, respectively, compared to the year ended December 31, 2022.
The following table sets forth a breakdown of store count at the end of the years ended December 31, 2023 and 2022:
| December 31, | ||||||||
| 2023 | 2022 | |||||||
| Number of Stores | ||||||||
| Lanvin |
36 | 31 | ||||||
| Wolford |
150 | 163 | ||||||
| St. John |
45 | 46 | ||||||
| Sergio Rossi |
48 | 50 | ||||||
| Caruso |
— | 1 | ||||||
|
|
|
|
|
|||||
| Total |
279 | 291 | ||||||
|
|
|
|
|
|||||
Year ended December 31, 2022 compared with year ended December 31, 2021
By sales channel, the increase in revenues was mainly related to an increase of €60.6 million (or 32.5%) in the DTC channel and an increase of €47.9 million (or 41.2%) in the wholesale channel.
The increase in the DTC channel was driven by sales growth in our retail stores across all brands and the acquisition of Sergio Rossi. In particular, Lanvin segment saw the largest growth, especially in North America and EMEA regions, as increased brand awareness and growing popularity of our accessories and ready-to-wear products propelled sales per square meter growth in our stores and e-commerce growth globally.
Growth in our e-commerce business was also a key driver for our DTC channel. E-commerce revenue grew €11.9 million (or 27.6%) for the year ended December 31, 2022 and was mainly driven by Lanvin, whose e-commerce sales increased by 53.7% compared to 2021.
Wholesale revenue growth was mainly driven by the increase of Lanvin’s wholesale business and the acquisition of Sergio Rossi. Lanvin’s wholesale business grew €30.7 million (or 145.3%) year-over-year, supported by the popularity of the brand’s accessories business in European and North American markets. Since our acquisition of Sergio Rossi in July 2021, Sergio Rossi’s wholesale business contributed a growth of €15.6 million (or 108.6%) year-over-year in the year ended December 31, 2022. Sales to our five largest customers were 8.5% and 11.0% of our revenue for the years ended December 31, 2022 and 2021, respectively. No single customer accounted for more than 5% of our consolidated revenue for the years ended December 31, 2022 and 2021.
82
Table of Contents
The following table sets forth a breakdown of store count at the end of the years ended December 31, 2022 and 2021:
| December 31, | ||||||||
| 2022 | 2021 | |||||||
| Number of Stores | ||||||||
| Lanvin |
31 | 27 | ||||||
| Wolford |
163 | 167 | ||||||
| St. John |
46 | 48 | ||||||
| Sergio Rossi |
50 | 50 | ||||||
| Caruso |
1 | 1 | ||||||
|
|
|
|
|
|||||
| Total |
291 | 293 | ||||||
|
|
|
|
|
|||||
By geography
Year ended December 31, 2023 compared with year ended December 31, 2022
By geographical region, the increase in revenues was mainly driven by (i) an increase of €4.3 million (or 8.8%) in Greater China, (ii) an increase of €1.6 million (or 7.2%) in other Asia, and (iii) an increase of €1.8 million (or 1.2%) in North America, which was partially offset by a decrease of €3.8 million (or (1.9%)) in EMEA.
The growth in Greater China was driven by the growth from Wolford, St. John and Sergio Rossi. In particular, in the year ended December 31, 2023, Wolford grew its Greater China business by 35.1% to €9.2 million, St. John grew its Greater China business by 39.0% to €7.2 million and Sergio Rossi grew its Greater China business by 9.8% to €11.9 million. The revenue growth in Greater China was mainly driven by stronger consumer demand towards the end of 2023 as well as increased foot traffic compared to a lower base in 2022, which was negatively impacted by COVID-19 pandemic.
The growth in other Asia was driven by the growth of Lanvin. Lanvin’s other Asia business grew €2.8 million (or 62.6%) year-over-year to €7.3 million in the year ended December 31, 2023, which was mainly driven by the increase of royalty income and clearance income.
The growth in North America was driven by the growth from St. John and Sergio Rossi. In particular, in the year ended December 31, 2023, St. John’s North American business grew 3.3% year-over-year to €81.4 million and Sergio Rossi’s North America business grew by €0.8 million or 70.0% to €2.0 million.
The decrease in EMEA was due to the decrease of Lanvin, Sergio Rossi and Wolford, which was partially offset by the increase of Caruso and St. John. Caruso’s EMEA business grew €10.7 million (or 46.4%) year-over-year to €33.7 million in the year ended December 31, 2023. Sergio Rossi’s EMEA business decreased by €3.2 million (or (9.2)%) year-over-year to €31.8 million in the year ended December 31, 2023, mainly attributable to its reduction in wholesale channels (including third-party production), which aligns with our strategic shift towards a greater emphasis on DTC channels.
83
Table of Contents
Lanvin’s decrease in revenues across all regions except for the other Asia region was primarily attributable to its strategic shift in creative direction and relatively fewer key product and marketing initiatives during the year of 2023.
Year ended December 31, 2022 compared with year ended December 31, 2021
By geographical region, the increase in revenues was mainly driven by (i) an increase of €57.5 million (or 38.8%) in EMEA, (ii) an increase of €38.8 million (or 36.4%) in North America, (iii) an increase of €10.8 million (or 94.7%) in other Asia, and (iv) an increase of €6.4 million (or 15.0%) in Greater China. Post -COVID recovery in EMEA and North America regions supported stronger-than-expected growth in the regions, offsetting the lower growth in Greater China due to the COVID-19 pandemic starting from March 2022.
The growth in EMEA was driven by the growth of Lanvin as well as the acquisition of Sergio Rossi. Lanvin’s EMEA business grew €29.4 million (or 92.8%) year-over-year to €61.1 million, including a €30.7 million or 145.3% year-over-year growth in its wholesale business to €51.9 million. Sergio Rossi’s EMEA business grew €18.0 million (or 105.9%) year-over-year to €35.0 million.
The growth in North America was driven by the growth from Lanvin, St. John and Wolford. In particular, Lanvin’s North American business grew 78.7% year-over-year to €28.5 million in 2022. St. John’s revenues in North America grew by €13.2 million or 20.2% to €78.8 million. Wolford’s revenues in North America grew by €9.7 million or 44.5% to €31.5 million. Our brands also benefitted from the appreciation of the U.S. dollar against the Euro in 2022 to an average exchange rate of 1.0521 EUR/USD in 2022 from an average exchange rate of 1.1835 EUR/USD in 2021.
Greater China revenues grew by €6.4 million (or 15.0%) to €48.9 million. Store closures during lockdowns and reduced traffic at our retail locations following lockdowns resulted in a significant reduction in retail sales starting from March to the end of 2022. Despite the COVID-19 pandemic impact, Lanvin Greater China grew its business by 9.3% to €25.7 million in 2022. However, Wolford and St. John Greater China revenues declined to €6.8 million and €5.2 million in 2022, or by 6.8% and 20.3% compared to 2021, respectively. Sergio Rossi Greater China grew its business by 135.3% to €10.8 million in 2022, as we acquired Sergio Rossi in July 2021.
Cost of sales
Cost of sales includes the raw material cost, production labor, assembly overhead including depreciation expense, procurement of the merchandise, and inventory valuation adjustments. In addition, cost of sales also includes customs duties, product packaging cost, and freight charges.
84
Table of Contents
Year ended December 31, 2023 compared with year ended December 31, 2022
The following table sets forth a breakdown of cost of sales by nature for the years ended December 31, 2023 and 2022.
| For the years ended December 31, |
Increase/ (Decrease) |
|||||||||||||||
| (Euro thousands, except percentages) |
2023 | 2022 | 2023 vs 2022 |
% | ||||||||||||
| Purchases of raw materials, finished goods and manufacturing services |
125,923 | 140,273 | (14,350 | ) | (10.2 | )% | ||||||||||
| Change in inventories |
(2,548 | ) | (1,896 | ) | (652 | ) | 34.4 | % | ||||||||
| Labor cost |
32,109 | 34,465 | (2,356 | ) | (6.8 | )% | ||||||||||
| Logistics costs, duties and insurance |
16,428 | 8,677 | 7,751 | 89.3 | % | |||||||||||
| Depreciation and amortization |
856 | 1,209 | (353 | ) | (29.2 | )% | ||||||||||
| Others |
2,468 | 1,640 | 828 | 50.5 | % | |||||||||||
|
|
|
|
|
|
|
|
|
|||||||||
| Total cost of sales by nature |
175,236 | 184,368 | (9,132 | ) | (5.0 | )% | ||||||||||
|
|
|
|
|
|
|
|
|
|||||||||
The following table sets forth a breakdown of cost of sales by portfolio brand for the years ended December 31, 2023 and 2022.
| For the years ended December 31, |
Increase/ (Decrease) |
|||||||||||||||
| (Euro thousands, except percentages) |
2023 | 2022 | 2023 vs 2022 | % | ||||||||||||
| Lanvin |
47,193 | 59,334 | (12,141 | ) | (20.5 | )% | ||||||||||
| Wolford |
42,941 | 39,286 | 3,655 | 9.3 | % | |||||||||||
| St. John |
33,024 | 33,242 | (218 | ) | (0.7 | )% | ||||||||||
| Sergio Rossi |
29,083 | 30,881 | (1,798 | ) | (5.8 | )% | ||||||||||
| Caruso |
28,660 | 23,672 | 4,988 | 21.1 | % | |||||||||||
| Other and holding companies |
414 | 101 | 313 | 309.9 | % | |||||||||||
| Eliminations and unallocated |
(6,079 | ) | (2,148 | ) | (3,931 | ) | 183.0 | % | ||||||||
|
|
|
|
|
|
|
|
|
|||||||||
| Total |
175,236 | 184,368 | (9,132 | ) | (5.0 | )% | ||||||||||
|
|
|
|
|
|
|
|
|
|||||||||
Cost of sales for the year ended December 31, 2023 amounted to €175.2 million, a decrease of 9.1 million, compared to €184.4 million for the year ended December 31, 2022. Cost of sales decrease was attributable to the decrease in levels of old inventory and the realization of economies of scale.
By segment, the decrease in cost of sales was mainly related to the decrease in Lanvin, Sergio Rossi and St. John, most notably in decrease of €12.1 million (or (20.5)%) from Lanvin and €1.8 million (or (5.8)%) from Sergio Rossi, partially offset by an increase of €3.7 million (or 9.3%) from Wolford and an increase of €5.0 million (or 21.1%) from Caruso.
Cost of sales as a percentage of revenue declined to 41.1% for the year ended December 31, 2023 compared to 43.7% for the year ended December 31, 2022. Such decline was primarily due to the decrease in levels of old inventory, the realization of economies of scale and changes in the proportion of each portfolio’s contribution.
85
Table of Contents
Year ended December 31, 2022 compared with year ended December 31, 2021
The following table sets forth a breakdown of cost of sales by nature for the years ended December 31, 2022 and 2021.
| For the years ended December 31, |
Increase/ (Decrease) |
|||||||||||||||
| (Euro thousands, except percentages) |
2022 | 2021 | 2022 vs 2021 |
% | ||||||||||||
| Purchases of raw materials, finished goods and manufacturing services |
140,273 | 115,621 | 24,652 | 21.3 | % | |||||||||||
| Change in inventories |
(1,896 | ) | (6,071 | ) | 4,175 | (68.8 | )% | |||||||||
| Labor cost |
34,465 | 25,926 | 8,539 | 32.9 | % | |||||||||||
| Logistics costs, duties and insurance |
8,677 | 1,829 | 6,848 | 374.4 | % | |||||||||||
| Depreciation and amortization |
1,209 | 876 | 333 | 38.0 | % | |||||||||||
| Others |
1,640 | 739 | 901 | 121.9 | % | |||||||||||
|
|
|
|
|
|
|
|
|
|||||||||
| Total cost of sales by nature |
184,368 | 138,920 | 45,448 | 32.7 | % | |||||||||||
|
|
|
|
|
|
|
|
|
|||||||||
The following table sets forth a breakdown of cost of sales by portfolio brand for the years ended December 31, 2022 and 2021.
| For the years ended December 31, |
Increase/ (Decrease) |
|||||||||||||||
| (Euro thousands, except percentages) |
2022 | 2021 | 2022 vs 2021 | % | ||||||||||||
| Lanvin |
59,334 | 38,844 | 20,490 | 52.7 | % | |||||||||||
| Wolford |
39,286 | 30,262 | 9,024 | 29.8 | % | |||||||||||
| St. John |
33,242 | 34,107 | (865 | ) | (2.5 | )% | ||||||||||
| Sergio Rossi |
30,881 | 15,418 | 15,463 | 100.3 | % | |||||||||||
| Caruso |
23,672 | 20,246 | 3,426 | 16.9 | % | |||||||||||
| Other and holding companies |
101 | 83 | 18 | 21.7 | % | |||||||||||
| Eliminations and unallocated |
(2,148 | ) | (40 | ) | (2,108 | ) | 5270.0 | % | ||||||||
|
|
|
|
|
|
|
|
|
|||||||||
| Total |
184,368 | 138,920 | 45,448 | 32.7 | % | |||||||||||
|
|
|
|
|
|
|
|
|
|||||||||
Cost of sales for the year ended December 31, 2022 amounted to €184.4 million, an increase of €45.4 million or 32.7%, compared to €138.9 million for the year ended December 31, 2021. Cost of sales increase was due to the greater revenue scale, which increased by 36.7% year-over-year.
By segment, the increase in cost of sales was mainly related to the increase in scale and sales for all of our brands, including (i) an increase of € 20.5 million (or 52.7%) in Lanvin cost of sales, (ii) an increase of €15.5 million (or 100.3%) from Sergio Rossi, (iii) an increase of €9.0 million (or 29.8%) from Wolford, and (iv) an increase of €3.4 million (or 16.9%) from Caruso.
Cost of sales as a percentage of revenue declined to 43.7% for the year ended December 31, 2022, compared to 45.0% for the year ended December 31, 2021. Such decline was primarily due to greater economies of scale from production, reduced discounting and improved full price sales at all of our brands. In particular, St. John reduced cost of sales in percentage terms and absolute terms, to 38.7% of revenues or €33.2 million in 2022, from 46.7% of revenues or €34.1 million in 2021. Cost of sales also benefited from a category shift to accessories, as well as a greater emphasis on core and carry-over products, which improved full price selling. Inventory impairment cost in 2022 was €11.4 million, versus €9.0 million in 2021.
86
Table of Contents
Gross profit
Year ended December 31, 2023 compared with year ended December 31, 2022
| For the years ended December 31, |
Increase/ (Decrease) |
|||||||||||||||
| (Euro thousands, except percentages) |
2023 | 2022 | 2023 vs 2022 | % | ||||||||||||
| Lanvin |
64,547 | 60,513 | 4,034 | 6.7 | % | |||||||||||
| Wolford |
83,339 | 86,228 | (2,889 | ) | (3.4 | )% | ||||||||||
| St. John |
57,374 | 52,642 | 4,732 | 9.0 | % | |||||||||||
| Sergio Rossi |
30,435 | 31,048 | (613 | ) | (2.0 | )% | ||||||||||
| Caruso |
11,351 | 7,147 | 4,204 | 58.8 | % | |||||||||||
| Other and holding companies |
10,131 | 10,846 | (715 | ) | (6.6 | )% | ||||||||||
| Eliminations and unallocated |
(6,235 | ) | (10,480 | ) | 4,245 | (40.5 | )% | |||||||||
|
|
|
|
|
|
|
|
|
|||||||||
| Total |
250,942 | 237,944 | 12,998 | 5.5 | % | |||||||||||
|
|
|
|
|
|
|
|
|
|||||||||
Gross profit for the year ended December 31, 2023 amounted to €250.9 million, an increase of €13.0 million or 5.5%, compared to €237.9 million for the year ended December 31, 2022.
The increase in gross profit was mainly related to the increase in revenues scale, excluding eliminations and unallocated, and the decrease in cost of sales as a percentage of revenue. Gross profit margin improved to 58.9% for the year ended December 31, 2023 from 56.3% in 2022.
Year ended December 31, 2022 compared with year ended December 31, 2021
| For the years ended December 31, |
Increase/ (Decrease) |
|||||||||||||||
| (Euro thousands, except percentages) |
2022 | 2021 | 2022 vs 2021 | % | ||||||||||||
| Lanvin |
60,513 | 34,028 | 26,485 | 77.8 | % | |||||||||||
| Wolford |
86,228 | 79,070 | 7,158 | 9.1 | % | |||||||||||
| St. John |
52,642 | 38,987 | 13,655 | 35.0 | % | |||||||||||
| Sergio Rossi |
31,048 | 13,319 | 17,729 | 133.1 | % | |||||||||||
| Caruso |
7,147 | 4,449 | 2,698 | 60.6 | % | |||||||||||
| Other and holding companies |
10,846 | 6,885 | 3,961 | 57.5 | % | |||||||||||
| Eliminations and unallocated |
(10,480 | ) | (6,836 | ) | (3,644 | ) | 53.3 | % | ||||||||
|
|
|
|
|
|
|
|
|
|||||||||
| Total |
237,944 | 169,902 | 68,042 | 40.0 | % | |||||||||||
|
|
|
|
|
|
|
|
|
|||||||||
Gross profit for the year ended December 31, 2022 amounted to €237.9 million, an increase of €68.0 million or 40.0%, compared to €169.9 million for the year ended December 31, 2021.
By segment, the increase in gross profit was mainly related to the increase in sales of all brands, excluding eliminations and unallocated, and improvements in manufacturing efficiencies and sell-through rates to reduce costs. Gross profit margin improved to 56.3% for the year ended December 31, 2022 from 55.0% for the year ended December 31, 2021.
87
Table of Contents
Marketing and selling expenses
Marketing and selling expenses include store employee compensation, occupancy costs, depreciation, supply costs for store equipment, wholesale and retail account administration compensation globally, as well as depreciation and amortization which includes depreciation on right-of-use assets under IFRS 16. These expenses are affected by the number of stores that are open during any fiscal period and store performance, as compensation and rent expenses can vary with sales. Marketing and selling expenses also include advertising and marketing expenses, which consist of media space and production costs, advertising agency fees, public relations and market research expenses. In addition, marketing and selling expenses include distribution and customer service expenses which consist of warehousing, order fulfillment, shipping and handling, customer service, employee compensation and bag repair costs.
Year ended December 31, 2023 compared with year ended December 31, 2022
| For the years ended December 31, |
Increase/ (Decrease) |
|||||||||||||||
| (Euro thousands, except percentages) |
2023 | 2022 | 2023 vs 2022 |
% | ||||||||||||
| Lanvin |
(76,533 | ) | (75,852 | ) | (681 | ) | 0.9 | % | ||||||||
| Wolford |
(79,060 | ) | (81,901 | ) | 2,841 | (3.5 | )% | |||||||||
| St, John |
(46,695 | ) | (42,498 | ) | (4,197 | ) | 9.9 | % | ||||||||
| Sergio Rossi |
(23,097 | ) | (24,502 | ) | 1,405 | (5.7 | )% | |||||||||
| Caruso |
(1,900 | ) | (1,446 | ) | (454 | ) | 31.4 | % | ||||||||
| Other and holding companies |
(4,589 | ) | (684 | ) | (3,905 | ) | 570.9 | % | ||||||||
| Eliminations and unallocated |
5,124 | 2,150 | 2,974 | 138.3 | % | |||||||||||
|
|
|
|
|
|
|
|
|
|||||||||
| Total |
(226,750 | ) | (224,733 | ) | (2,017 | ) | 0.9 | % | ||||||||
|
|
|
|
|
|
|
|
|
|||||||||
Marketing and selling expenses for the year ended December 31, 2023 amounted to €226.8 million, an increase of €2.0 million (or 0.9%), compared to €224.7 million for the year ended December 31, 2022.
By segment, the increase in marketing and selling expenses was mainly related to (i) an increase of €4.2 million (or 9.9%) from St. John, mainly for payment of wholesale commissions, (ii) an increase of €0.7 million (or 0.9%) from Lanvin and (iii) an increase of €0.5 million (or 31.4%) from Caruso, which was partially offset by a decrease of €2.8 million (or (3.5)%) from Wolford and a decrease of €1.4 million (or (5.7)%) from Sergio Rossi. The slight increase in marketing and selling expenses at Lanvin was driven by increased store count and our investment in building the brand awareness in 2023, including the Fall/Winter fashion show at Paris Fashion Week in 2023, which was presented virtually during same period of 2022.
Marketing and selling expenses kept flat as a percentage of revenue due to the changes in the proportion of each brand’s contribution. By segment, Wolford’s marketing and selling expenses as a percentage of revenue improved to 62.6% in the year ended December 31, 2023 from 65.3% in the year ended December 31, 2022 mainly due to cost control and implementation of efficiency measures.
88
Table of Contents
Year ended December 31, 2022 compared with year ended December 31, 2021
The following table sets forth a breakdown of marketing and selling expenses by portfolio brand for the years ended December 31, 2022 and 2021.
| For the years ended December 31, |
Increase/ (Decrease) |
|||||||||||||||
| (Euro thousands, except percentages) |
2022 | 2021 | 2022 vs 2021 |
% | ||||||||||||
| Lanvin |
(75,852 | ) | (58,124 | ) | (17,728 | ) | 30.5 | % | ||||||||
| Wolford |
(81,901 | ) | (59,351 | ) | (22,550 | ) | 38.0 | % | ||||||||
| St, John |
(42,498 | ) | (37,697 | ) | (4,801 | ) | 12.7 | % | ||||||||
| Sergio Rossi |
(24,502 | ) | (9,489 | ) | (15,013 | ) | 158.2 | % | ||||||||
| Caruso |
(1,446 | ) | (1,144 | ) | (302 | ) | 26.4 | % | ||||||||
| Other and holding companies |
(684 | ) | (188 | ) | (496 | ) | 263.8 | % | ||||||||
| Eliminations and unallocated |
2,150 | 491 | 1,659 | 337.9 | % | |||||||||||
|
|
|
|
|
|
|
|
|
|||||||||
| Total |
(224,733 | ) | (165,502 | ) | (59,231 | ) | 35.8 | % | ||||||||
|
|
|
|
|
|
|
|
|
|||||||||
Marketing and selling expenses for the year ended December 31, 2022 amounted to €224.7 million, an increase of €59.2 million (or 35.8%), compared to €165.5 million for the year ended December 31, 2021.
By segment, the increase in marketing and selling expenses was mainly related to (i) an increase of €22.6 million (or 38.0%) from Wolford, (ii) an increase of €17.7 million (or 30.5%) from Lanvin, (iii) an increase of €15.0 million (or 158.2%) from Sergio Rossi, and (iv) an increase of € 4.8 million (or 12.7%) from St. John. The increase in marketing and selling expenses at Lanvin was driven by our investment in building the brand awareness as well as expansion of our retail network in the past year. The increase in marketing and selling expenses at Wolford was driven by the renewed brand strategy and investment in the athleisure (“The W”) and collaboration (“W Lab”) product lines.
Marketing and selling expenses declined as a percentage of revenue due to increased productivity at our DTC retail locations and economies of scale as well as an increased proportion of wholesale revenues that were generally associated with lower marketing costs. By segment, Lanvin’s marketing and selling expenses as a percentage of revenue improved to 63.3% in the year ended December 31, 2022 from 79.8% in the year ended December 31, 2021 due to higher sales performance at its retail locations. We expect marketing and selling expenses to decline significantly as a percentage of revenue as the total sales increase and as we continue to refresh and replace unprofitable locations.
Contribution profit
Contribution profit is defined as net revenues less the cost of sales and selling and marketing expenses, which constitutes the majority of our variable costs. Contribution profit is a non-IFRS financial measure. See “—Non IFRS Financial Measures.”
89
Table of Contents
Year ended December 31, 2023 compared with year ended December 31, 2022
Our consolidated contribution profit increased by €11.0 million (or 83.1%) to €24.2 million for the year ended December 31, 2023 from €13.2 million in 2022. The increase was mainly related to (i) an increase of €3.8 million from Caruso, (ii) an increase of €3.4 million from Lanvin, (iii) an increase of €0.8 million from Sergio Rossi, and (iv) an increase of €0.5 million from St. John, which was partially offset by a decrease of €48 thousand from Wolford due to the drop of margin.
Year ended December 31, 2022 compared with year ended December 31, 2021
Our consolidated contribution profit increased by €8.8 million (or 200.3%) to €13.2 million for the year ended December 31, 2022 from €4.4 million in 2021. The increase was mainly related to (i) an increase of €8.9 million from St. John, (ii) an increase of €8.8 million from Lanvin, (iii) an increase of €2.7 million from Sergio Rossi, (iv) an increase of €2.4 million from Caruso, which was partially offset by a decrease of €15.4 million from Wolford.
General and administrative expenses
General and administrative expenses include administrative and management staff costs, product creation and sample costs, rent, depreciation, and amortization expenses for our administrative staff, as well as IT system development and maintenance expenses.
Year ended December 31, 2023 compared with year ended December 31, 2022
General and administrative expenses decreased to €138.2 million or by (9.7)% for the year ended December 31, 2023, from €153.1 million for the year ended December 31, 2022. General and administrative expenses also declined as a percentage of revenue to 32.4% for the year ended December 31, 2023 from 36.3% for the year ended December 31, 2022, due to cost optimization and economies of scale.
We expect general and administrative expenses to continue to decline as a percentage of revenues as we continue to benefit from economies of scale and leverage synergies across our brands.
Year ended December 31, 2022 compared with year ended December 31, 2021
General and administrative expenses increased to €153.1 million or by 25.0% for the year ended December 31, 2022, from €122.5 million for the year ended December 31, 2021. General and administrative expenses declined as a percentage of revenue to 36.3% for the year ended December 31, 2022 from 39.7% for the year ended December 31, 2021, due to cost optimization and economies of scale. The increase was primarily due to the acquisition of Sergio Rossi in 2021 and additional costs associated with the Business Combination and preparations for becoming a listed company.
Other operating income and expenses
Other operating income and expenses include foreign exchange gains or losses and impairment losses.
90
Table of Contents
Year ended December 31, 2023 compared with year ended December 31, 2022
Other operating income and expenses increased to €4.5 million loss for the year ended December 31, 2023 from €2.3 million loss for the year ended December 31, 2022, mainly due to a foreign exchange loss of €4.6 million, compared to a loss of €0.3 million in 2022.
Year ended December 31, 2022 compared with year ended December 31, 2021
Other operating income and expenses decreased to €2.3 million loss for the year ended December 31, 2022 from €10.1 million gain for the year ended December 31, 2021, mainly due to a foreign exchange loss of €0.3 million in 2022, compared to a gain of €10.5 million for 2021.
Loss from operations before non-underlying items
Year ended December 31, 2023 compared with year ended December 31, 2022
Loss from operations before non-underlying items for the year ended December 31, 2023 decreased by €23.7 million (or (16.7)%) to €118.6 million, compared to €142.3 million for the year ended December 31, 2022. Loss from operations before non-underlying items as a percentage of total revenue decreased to 27.8% from 33.7% in 2022. The decrease in loss from operations before non-underlying items was due to the increase in gross profit, together with the decrease in general and administrative expenses.
Year ended December 31, 2022 compared with year ended December 31, 2021
Loss from operations before non-underlying items for the year ended December 31, 2022 increased by €34.3 million (or 31.7%) to €142.3 million, compared to €108.0 million for the year ended December 31, 2021. Loss from operations before non-underlying items as a percentage of total revenue decreased to 33.7%, from 35.0% in 2021. The increase in loss from operations before non-underlying items was due to an increase in expenses, and partially offset by an increase in gross profit.
Adjusted EBITDA
Year ended December 31, 2023 compared with year ended December 31, 2022
Adjusted EBITDA, which is a non-IFRS financial measure, for the year ended December 31, 2023 increased to €(64.2) million from €(72.0) million for the year ended December 31, 2022. This increase was mainly due to lower loss from operations before non-underlying items in 2023. Adjusted EBITDA as a percentage of total revenue also improved to (15.1)% in 2023 from (17.0)% in 2022. See “—Non-IFRS Financial Measures.”
Year ended December 31, 2022 compared with year ended December 31, 2021
Adjusted EBITDA, which is a non-IFRS financial measure, for the year ended December 31, 2022 decreased to €(72.0) million from €(58.9) million for the year ended December 31, 2021. This decrease was mainly due to the increased operating expenses and adjusted EBITDA loss from the acquisition of Sergio Rossi, and partially offset by the improvement in our gross profit. Adjusted EBITDA as a percentage of total revenue improved to (17.0)% in 2022 from (19.1)% in 2021. See “—Non-IFRS Financial Measures.”
91
Table of Contents
Non-underlying items
Non-underlying items comprise net gains on disposals, negative goodwill from acquisition of a subsidiary, gain on debt restructuring, government grants and others.
Year ended December 31, 2023 compared with year ended December 31, 2022
The non-underlying items were €3.9 million loss or (0.9)% of revenues for the year ended December 31, 2023, versus €83.1 million loss or (19.7)% of revenues for the year ended December 31, 2022. The decrease in the non-underlying items losses by €79.2 million (or (95.4)%) was mainly due to (i) €74.5 million cost related to the excess of the fair value of our Ordinary Shares issued as part of the Reverse Recapitalization and the fair value of PCAC’s identifiable net assets acquired, accounted for in accordance with IFRS 2 and measured based on the closing price of PCAC’s shares of $9.90 per share on December 14, 2022, and (ii) €9.7 million related to listing expenses for the year ended December 31, 2022. The decrease in the non-underlying item losses was partially counterbalanced by the deferred realization of government grants in the second half of 2023.
Year ended December 31, 2022 compared with year ended December 31, 2021
The non-underlying items were €83.1 million loss or 19.7% of revenues for the year ended December 31, 2022, versus €45.2 million gain or 14.6% of revenues for the year ended December 31, 2021. The decrease in the non-underlying items by €128.3 million (or 283.7%) was mainly due to (i) €74.5 million cost related to the excess of the fair value of our Ordinary Shares issued as part of the Reverse Recapitalization and the fair value of PCAC’s identifiable net assets acquired, accounted for in accordance with IFRS 2 and measured based on the closing price of PCAC’s shares of USD9.90 per share on December 14, 2022 and (ii) €9.7 million related to listing expenses for the year ended December 31, 2022.
Operating Loss
Year ended December 31, 2023 compared with year ended December 31, 2022
Operating loss for the year ended December 31, 2023 amounted to €122.4 million, a decrease of €102.9 million or (45.7)%, compared to €225.3 million for the year ended December 31, 2022. The improvement in operating loss was resulted from both an increase in loss from operations before non-underlying items and an increase of non-underlying items.
Year ended December 31, 2022 compared with year ended December 31, 2021
Operating loss for the year ended December 31, 2022 amounted to €225.3 million, an increase of €162.5 million or 258.8%, compared to €62.8 million for the year ended December 31, 2021. The increase in operating loss was due to an increase in loss from operations before non-underlying items and a decrease of non-underlying items.
Finance cost - (net)
Finance costs (net) primarily include income and expenses relating to our interest income and expenses on financial assets and liabilities, including interest expense resulting from IFRS 16 lease liability.
92
Table of Contents
Year ended December 31, 2023 compared with year ended December 31, 2022
Finance costs for the year ended December 31, 2023 amounted to €20.4 million, an increase of €5.9 million or 40.4%, compared to finance costs of €14.6 million for the year ended December 31, 2022. The decrease in finance income for the year ended December 31, 2023 compared to the year ended December 31, 2022 was primarily attributable to the decrease in foreign exchange gain.
Finance expenses for the year ended December 31, 2023 amounted to €20.7 million, an increase of €0.7 million or 3.5%, compared to €20.0 million for the year ended December 31, 2022. The increase in financial expenses for the year ended December 31, 2023 compared to the year ended December 31, 2022 was primarily attributable to an increase of €0.5 million of interest expense on lease liability and an increase of €0.6 million of net foreign exchange losses.
Year ended December 31, 2022 compared with year ended December 31, 2021
Finance costs for the year ended December 31, 2022 amounted to €14.6 million, an increase of €5.2 million or 56.3%, compared to finance costs of €9.3 million for the year ended December 31, 2021. The increase in finance income for the year ended December 31, 2022 compared to the year ended December 31, 2021 was primarily attributable to an increase in net foreign exchange gains of €3.0 million.
Finance expenses for the year ended December 31, 2022 amounted to €20.0 million, an increase of €8.3 million or 71.2%, compared to €11.7 million for the year ended December 31, 2021. The increase in financial expenses for the year ended December 31, 2022 compared to the year ended December 31, 2021 was primarily attributable to increases in interest expenses on borrowings of €12.4 million for the year ended December 31, 2022 versus €5.4 million for the year ended December 31, 2021, and increases in interest expenses on lease liabilities of €6.7 million for the year ended December 31, 2022, compared to €5.6 million for the year ended December 31, 2021.
Loss before income tax
Year ended December 31, 2023 compared with year ended December 31, 2022
Loss before income tax for the year ended December 31, 2023 amounted to €142.8 million, a decrease of €97.0 million or (40.5)%, compared to €239.9 million for the year ended December 31, 2022.
Year ended December 31, 2022 compared with year ended December 31, 2021
Loss before income tax for the year ended December 31, 2022 amounted to €239.9 million, an increase of €167.8 million or 232.6%, compared to €72.1 million for the year ended December 31, 2021.
Income tax benefits / (expenses)
Income taxes include the current taxes on the results of our operations and any changes in deferred income taxes.
93
Table of Contents
Year ended December 31, 2023 compared with year ended December 31, 2022
Income tax expenses for the year ended December 31, 2023 amounted to €3.4 million losses, increased by €3.5 million, compared to €0.1 million gain for the year ended December 31, 2022.
The increase in income tax expenses for the year ended December 31, 2023 compared to the year ended December 31, 2022 was primarily due to €2.3 million deferred income taxes loss in 2023, compared to €0.3 million gain in 2022.
Year ended December 31, 2022 compared with year ended December 31, 2021
Income tax expenses for the year ended December 31, 2022 amounted to €0.1 million gain, decreased by €4.4 million, compared to €4.3 million loss for the year ended December 31, 2021.
The decrease in income tax expenses for the year ended December 31, 2022 compared to the year ended December 31, 2021 was primarily attributable to €0.3 million deferred income taxes impact in 2022, compared to €3.5 million in 2021.
Loss for the year
Year ended December 31, 2023 compared with year ended December 31, 2022
Loss for the year ended December 31, 2023 amounted to €146.2 million, a decrease of €93.5 million or (39)%, compared to €239.8 million for the year ended December 31, 2022.
Year ended December 31, 2022 compared with year ended December 31, 2021
Loss for the year ended December 31, 2022 amounted to €239.8 million, an increase of €163.3 million or 213.6%, compared to €76.5 million for the year ended December 31, 2021.
Results by Segment
Year ended December 31, 2023 compared with year ended December 31, 2022
The following is a discussion of revenues, gross profit and contribution profit for each segment for the year ended December 31, 2023 as compared to the year ended December 31, 2022.
94
Table of Contents
Lanvin Segment
The following table sets forth revenues and gross profit for the Lanvin segment for the years ended December 31, 2023 and 2022:
| For the years ended December 31, |
Increase/ (Decrease) |
|||||||||||||||
| (Euro thousands, except percentages) |
2023 | 2022 | 2023 vs 2022 | % | ||||||||||||
| Revenues |
111,740 | 119,847 | (8,107 | ) | (6.8)% | |||||||||||
| Gross profit |
64,547 | 60,513 | 4,034 | 6.7% | ||||||||||||
| Gross profit margin |
57.8% | 50.5% | 7.3% | — | ||||||||||||
| Marketing and selling expenses |
(76,533 | ) | (75,852 | ) | (681 | ) | 0.9% | |||||||||
| Contribution profit(1)(3) |
(11,986 | ) | (15,339 | ) | 3,353 | (21.9)% | ||||||||||
| Contribution profit margin(2)(3) |
(10.7)% | (12.8)% | 2.1% | — | ||||||||||||
| (1) | Contribution profit equals gross profit less marketing and selling expenses. |
| (2) | Contribution profit margin equals contribution profit divided by revenue. |
| (3) | Contribution profit and contribution profit margin are non-IFRS financial measures. |
Revenues
Revenues for the year ended December 31, 2023 decreased to €111.7 million, a decrease of €8.1 million (or (6.8)%) compared to €119.8 million for the year ended December 31, 2022.
The decrease is attributable to the brand’s focus on executing its creative transition and having comparatively fewer key product and marketing initiatives in 2023 compared to 2022 which featured a higher number of planned marketing campaigns and product launches. The creative transition entailed two key initiatives — the creation of Lanvin Lab and a dedicated team for leather goods and accessories.
DTC revenues decreased by 5.4% from €58.5 million for the year ended December 31, 2022, to €55.4 million for the year ended December 31, 2023. The drop in DTC channels was mainly due to the lower sales from a softer EMEA market, which decreased by €2.4 million (or (14.5)% year-over-year) to €14.4 million in year ended December 31, 2023.
Wholesale revenues decreased by 23.1% from €51.9 million for the year ended December 31, 2022, to €39.9 million for the year ended December 31, 2023, mainly due to some key wholesale marketing initiatives that largely contributed to wholesale revenues in 2022 that were not present in 2023. The wholesale revenues as percentage of Lanvin’s total revenues decreased from 43.3% in 2022 to 35.7% in 2023.
Gross profit
Gross profit for the year ended December 31, 2023 increased to €64.5 million, an increase of €4.0 million (or 6.7%) compared to €60.5 million for the year ended December 31, 2022.
The increase in gross profit was primarily attributable to the increase in gross profit margin, which is mainly driven by channel mix, the increase of leather goods and footwear products, and higher sell-through rates, as well as better inventory management.
Contribution profit
Contribution loss for the year ended December 31, 2023 was €12.0 million (or 10.7% of revenue), an improvement of €3.4 million from the €15.3 million loss (or 12.8% of revenue) for the year ended December 31, 2022.
The improvement in contribution loss was due to a planned increase in investment for marketing and selling expense, together with an increase in gross profit. Going forward, we expect our marketing and selling expenses to continue to decline as a percentage of revenues as we scale and further improve our operational efficiency in stores and directly operated online channels.
95
Table of Contents
Wolford Segment
The following table sets forth revenues and gross profit for the Wolford segment for the years ended December 31, 2023 and 2022:
| For the years ended December 31, |
Increase/ (Decrease) |
|||||||||||||||
| (Euro thousands, except percentages) |
2023 | 2022 | 2023 vs 2022 | % | ||||||||||||
| Revenues |
126,280 | 125,514 | 766 | 0.6% | ||||||||||||
| Gross profit |
83,339 | 86,228 | (2,889 | ) | (3.4)% | |||||||||||
| Gross profit margin |
66.0% | 68.7% | (2.7)% | — | ||||||||||||
| Marketing and selling expenses |
(79,060 | ) | (81,901 | ) | 2,841 | (3.5)% | ||||||||||
| Contribution profit(1)(3) |
4,279 | 4,327 | (48 | ) | (1.1)% | |||||||||||
| Contribution profit margin(2)(3) |
3.4% | 3.4% | 0.0% | — | ||||||||||||
| (1) | Contribution profit equals gross profit less marketing and selling expenses. |
| (2) | Contribution profit margin equals contribution profit divided by revenue. |
| (3) | Contribution profit and contribution profit margin are non-IFRS financial measures. |
Revenues
Revenues for the year ended December 31, 2023 grew to €126.3 million, an increase of €0.8 million (or 0.6%) compared to €125.5 million for the year ended December 31, 2022.
Gross profit
Gross profit margin for the year ended December 31, 2023 decreased to 66.0% from 68.7% for the year ended December 31, 2022. Gross profit decreased by €2.9 million to €83.3 million for the year ended December 31, 2022, compared to €86.2 million for the year ended December 31, 2022.
The decrease in gross profit margin in 2023 versus the previous year was primarily attributable to higher logistic costs as a result of rising costs across our operations.
Contribution profit
Contribution profit for the year ended December 31, 2023 was €4.3 million (or 3.4% of revenue), versus a profit of €4.3 million (or 3.4% of revenue) for the year ended December 31, 2022. Marketing and selling expenses decreased to €79.1 million (or 62.6% of revenues) in the year ended December 31, 2023 from €81.9 million (or 65.3% of revenues) for the year ended December 31, 2022.
The decrease in marketing and selling expenses in 2023 was mainly due to cost control and efficiency improvement measures implemented. As a percentage of revenue, personnel costs rose to 22.3% of revenues in 2023 versus 22.1% in 2022 due to higher social benefit contributions and expenses.
96
Table of Contents
St. John Segment
The following table sets forth revenues and gross profit for the St. John segment for the years ended December 31, 2023 and 2022:
| For the years ended December 31, |
Increase/ (Decrease) |
|||||||||||||||
| (Euro thousands, except percentages) |
2023 | 2022 | 2023 vs 2022 | % | ||||||||||||
| Revenues |
90,398 | 85,884 | 4,514 | 5.3% | ||||||||||||
| Gross profit |
57,374 | 52,642 | 4,732 | 9.0% | ||||||||||||
| Gross profit margin |
63.5% | 61.3% | 2.2% | — | ||||||||||||
| Marketing and selling expenses |
(46,695 | ) | (42,498 | ) | (4,197 | ) | 9.9% | |||||||||
| Contribution profit(1)(3) |
10,679 | 10,144 | 535 | 5.3% | ||||||||||||
| Contribution profit margin(2)(3) |
11.8% | 11.8% | 0.0% | — | ||||||||||||
| (1) | Contribution profit equals gross profit less marketing and selling expenses. |
| (2) | Contribution profit margin equals contribution profit divided by revenue. |
| (3) | Contribution profit and contribution profit margin are non-IFRS financial measures. |
Revenues
Revenues for the year ended December 31, 2023 amounted to €90.4 million, an increase of €4.5 million compared to €85.9 million for the year ended December 31, 2022.
St. John grew its revenues by 5.3% from 2022 due to reduced discounting and an increased proportion of full-price sales at our DTC channels. DTC sales grew by €4.6 million (or 6.9%) to €71.0 million for the year ended December 31, 2023, mainly driven by growth in North America price increases, higher full-price sell-through and Greater China’s recovery from the negative impacts of the COVID-19 pandemic related restrictions.
Gross profit
Gross profit for the year ended December 31, 2023 was €57.4 million, an increase of €4.8 million compared to €52.6 million for the year ended December 31, 2022. Gross profit margin improved to 63.5% in the year ended December 31, 2023 versus 61.3% for the year ended December 31, 2022, primarily due to the launch of a new wholesale model with a large client (under which St. John owns the inventory and pays commissions to the wholesale stores to cover operating expenses) in February 2023 and reports in DTC margins rather than wholesale margins.
Contribution profit
Contribution profit for the year ended December 31, 2023 was €10.7 million (or 11.8% of revenue), versus a contribution profit of €10.1 million (or 11.8% of revenue) for the year ended December 31, 2022, driven by increased gross profit. Marketing and selling expenses increased to €46.7 million (or 51.7% of revenue) in 2023 from €42.5 million (or 49.5% of revenue) for the year ended December 31, 2022.
97
Table of Contents
The increase in marketing and selling expenses was mainly due to the payment of wholesale commissions. The percentage of marketing and selling expenses of revenue increased to 51.7% in 2023 from 49.5% in 2022.
Sergio Rossi Segment
We acquired Sergio Rossi in July 2021. The following table sets forth revenues and gross profit for the Sergio Rossi segment for the years ended December 31, 2023 and 2022:
| For the years ended December 31, |
Increase/ (Decrease) |
|||||||||||||||
| (Euro thousands, except percentages) |
2023 | 2022 | 2023 vs 2022 | % | ||||||||||||
| Revenues |
59,518 | 61,929 | (2,411 | ) | (3.9)% | |||||||||||
| Gross profit |
30,435 | 31,048 | (613 | ) | (2.0)% | |||||||||||
| Gross profit margin |
51.1% | 50.1% | 1.0% | — | ||||||||||||
| Marketing and selling expenses |
(23,097 | ) | (24,502 | ) | 1,405 | (5.7)% | ||||||||||
| Contribution profit(1)(3) |
7,338 | 6,546 | 792 | 12.1% | ||||||||||||
| Contribution profit margin(2)(3) |
12.3% | 10.6% | 1.7% | — | ||||||||||||
| (1) | Contribution profit equals gross profit less marketing and selling expenses. |
| (2) | Contribution profit margin equals contribution profit divided by revenue. |
| (3) | Contribution profit and contribution profit margin are non-IFRS financial measures. |
Revenues
Revenues for the year ended December 31, 2023 amounted to €59.5 million, a decrease of €2.4 million compared to €61.9 million for the year ended December 31, 2022. The decrease was primarily due to the decrease in wholesale channel, including third-party production business, which decreased by €3.5 million to €26.6 million for the year 2023, aligns with our strategic shift towards a greater emphasis on DTC channels.
Gross profit
Gross profit for the year ended December 31, 2023 was €30.4 million, a decrease of €0.6 million compared to €31.0 million for the year ended December 31, 2022. Gross profit margin improved to 51.1% in the year ended December 31, 2023 versus 50.1% for the year ended December 31, 2022. The improvement in the gross profit margin was related to increasing weight of DTC channel business. Excluding third parties production, gross profit margin was 61.0% for the year ended December 31, 2023, compared to 59.8% for the year ended December 31, 2022.
Contribution profit
Contribution profit for the year ended December 31, 2023 was €7.3 million (or 12.3% of revenue), versus a contribution profit of €6.5 million (or 10.6% of revenue) for the year ended December 31, 2022. Marketing and selling expenses decreased to €23.1 million (or 38.8% of revenue) in 2023 from €24.5 million (or 39.6% of revenue) for the year ended December 31, 2022, as a result of enhanced expense efficiency.
98
Table of Contents
Caruso Segment
The following table sets forth revenues and gross profit for the Caruso segment for the years ended December 31, 2023 and 2022:
| For the years ended December 31, |
Increase/ (Decrease) |
|||||||||||||||
| (Euro thousands, except percentages) |
2023 | 2022 | 2023 vs 2022 |
% | ||||||||||||
| Revenues |
40,011 | 30,819 | 9,192 | 29.8% | ||||||||||||
| Gross profit |
11,351 | 7,147 | 4,204 | 58.8% | ||||||||||||
| Gross profit margin |
28.4% | 23.2% | 5.2% | — | ||||||||||||
| Marketing and selling expenses |
(1,900 | ) | (1,446 | ) | (454 | ) | 31.4% | |||||||||
| Contribution profit(1)(3) |
9,451 | 5,701 | 3,750 | 65.8% | ||||||||||||
| Contribution profit margin(2)(3) |
23.6% | 18.5% | 5.1% | — | ||||||||||||
| (1) | Contribution profit equals gross profit less marketing and selling expenses. |
| (2) | Contribution profit margin equals contribution profit divided by revenue. |
| (3) | Contribution profit and contribution profit margin are non-IFRS financial measures. |
Revenues
Revenues for the year ended December 31, 2023 was €40.0 million, an increase of €9.2 million or 29.8% compared to €30.8 million for the year ended December 31, 2022.
The increase in revenues was mainly related to recovery of formal business wear resulting from the post-COVID-19 back-to-office trend, globally.
Gross profit
Gross profit for the year ended December 31, 2023 was €11.4 million, an increase of €4.3 million compared to €7.1 million for the year ended December 31, 2022. Gross profit margin increased to 28.4% for the year ended December 31, 2023 from 23.2% for the year ended December 31, 2022 due to economies of scale and better management of labor costs.
Contribution profit
Contribution profit for the year ended December 31, 2023 was €9.5 million (or 23.6% of revenue), an improvement of €3.8 million or 65.8% from €5.7 million (or 18.5% of revenue) for the year ended December 31, 2022. The improvement in contribution profit was driven by the improvement of gross profit and operating leverage.
Year ended December 31, 2022 compared with year ended December 31, 2021
The following is a discussion of revenues, gross profit and contribution profit for each segment for the year ended December 31, 2022 as compared to the year ended December 31, 2021.
99
Table of Contents
Lanvin Segment
The following table sets forth revenues and gross profit for the Lanvin segment for the years ended December 31, 2022 and 2021:
| For the years ended December 31, |
Increase/ (Decrease) |
|||||||||||||||
| (Euro thousands, except percentages) |
2022 | 2021 | 2022 vs 2021 | % | ||||||||||||
| Revenues |
119,847 | 72,872 | 46,975 | 64.5% | ||||||||||||
| Gross profit |
60,513 | 34,028 | 26,485 | 77.8% | ||||||||||||
| Gross profit margin |
50.5% | 46.7% | 3.8% | — | ||||||||||||
| Marketing and selling expenses |
(75,852 | ) | (58,124 | ) | (17,728 | ) | 30.5% | |||||||||
| Contribution profit(1)(3) |
(15,339 | ) | (24,096 | ) | 8,757 | (36.3)% | ||||||||||
| Contribution profit margin(2)(3) |
(12.8)% | (33.1)% | 20.3% | — | ||||||||||||
| (1) | Contribution profit equals gross profit less marketing and selling expenses. |
| (2) | Contribution profit margin equals contribution profit divided by revenue. |
| (3) | Contribution profit and contribution profit margin are non-IFRS financial measures. |
Revenues
Revenues for the year ended December 31, 2022 grew to €119.8 million, an increase of €47.0 million or 64.5% compared to €72.9 million for the year ended December 31, 2021.
Lanvin benefited from growing consumer awareness and demand for its accessory products, especially the growing leather goods and footwear categories. The increase in revenues was mainly related to the growth of our wholesale business, which grew by €30.7 million or 145.3% year-over-year to €51.9 million.
Revenue through our DTC channels grew by 26.9% from €46.1 million for the year ended December 31, 2021, to €58.5 million for the year ended December 31, 2022. The growth in DTC channels was due to the improving sales from our North American and European regions, driven by optimized product offering, elevated brand marketing activations, and refreshed store concepts. North American and European DTC business grew by €11.3 million or 48.1% to €34.6 million in 2022. In particular, the growing popularity of our accessory categories boosted e-commerce sales in North America and EMEA by €3.5 million or 81.6% to €7.9 million in 2022.
All regions experienced growth. EMEA and North American regions were the key geographic growth drivers, growing by 92.8% to €61.1 million and by 78.7% to €28.5 million for the year ended December 31, 2022, respectively. In Greater China, the business also grew by 9.3% to €25.7 million despite the negative economic impacts of the COVID-19 pandemic.
Gross profit
Gross profit for the year ended December 31, 2022 grew to €60.5 million, an increase of €26.5 million or 77.8% compared to €34.0 million for the year ended December 31, 2021.
100
Table of Contents
The increase in gross profit was primarily attributable to the growth in revenues, and the increase in gross profit margin due to the economies of scale brought by larger order sizes, which reduced our unit cost, and higher sell-through rates for all categories.
Impairment costs decreased by 19.9% to €7.0 million for the year ended December 31, 2022 compared to the year ended December 31, 2021, due to the increasing business share of leather goods and footwear categories which are less seasonal. As a percentage of revenue, impairment costs decreased to 5.8% in 2022 from 12.0% in 2021.
Contribution profit
Contribution loss for the year ended December 31, 2022 was €15.3 million (or 12.8% of revenue), an improvement of €8.8 million from the €24.1 million loss (or 33.1% of revenue) for the year ended December 31, 2021.
The improvement in contribution loss was due to the higher gross profit from the greater scale of our business and improving sales in our retail stores, helping to reduce our marketing and selling expense as a percentage of revenue to 63.3% from 79.8% for the year ended December 31, 2021. We expect our marketing and selling expenses to continue to decline as a percentage of revenues as we scale and further improve our operational efficiency in stores and directly operated online channels.
Wolford Segment
The following table sets forth revenues and gross profit for the Wolford segment for the years ended December 31, 2022 and 2021:
| For the years ended December 31, |
Increase/ (Decrease) |
|||||||||||||||
| (Euro thousands, except percentages) |
2022 | 2021 | 2022 vs 2021 | % | ||||||||||||
| Revenues |
125,514 | 109,332 | 16,182 | 14.8% | ||||||||||||
| Gross profit |
86,228 | 79,070 | 7,158 | 9.1% | ||||||||||||
| Gross profit margin |
68.7% | 72.3% | (3.6)% | — | ||||||||||||
| Marketing and selling expenses |
(81,901 | ) | (59,351 | ) | (22,550 | ) | 38.0% | |||||||||
| Contribution profit(1)(3) |
4,327 | 19,719 | (15,392 | ) | (78.1)% | |||||||||||
| Contribution profit margin(2)(3) |
3.4% | 18.0% | (14.6)% | — | ||||||||||||
| (1) | Contribution profit equals gross profit less marketing and selling expenses. |
| (2) | Contribution profit margin equals contribution profit divided by revenue. |
| (3) | Contribution profit and contribution profit margin are non-IFRS financial measures. |
Revenues
Revenues for the year ended December 31, 2022 grew to €125.5 million, an increase of €16.2 million or 14.8% compared to €109.3 million for the year ended December 31, 2021.
101
Table of Contents
North American and EMEA regions were the key geographic growth drivers for Wolford, growing by 44.5% to €31.5 million and by 9.2% to €86.5 million for the year ended December 31, 2022, respectively. In Greater China, our business declined by 6.8% to €6.8 million, mainly due to the negative economic impacts of the COVID-19 pandemic. The growth in all regions except Greater China was led by our DTC channels, which grew by 21.2% or €15.8 million from the year ended December 31, 2021 to €90.4 million in the year ended December 31, 2022. Revenue growth was also driven by our athleisure collection “The W” (modem, young and sporty) which grew by 36.0% in the year ended December 31, 2022.
Gross profit
Gross profit margin for the year ended December 31, 2022 decreased to 68.7% from 72.3% for the year ended December 31, 2021. Gross profit increased by €7.2 million to €86.2 million for the year ended December 31, 2022, compared to €79.1 million for the year ended December 31, 2021.
The decrease in gross profit margin versus the year ended December 31, 2021 was primarily attributable to increasing labor cost in 2022 compared to 2021. The labor cost as a percentage of revenue accounted for 9.5% of revenues (or €11.9 million) for the year ended December 31, 2022, versus 6.7% of revenues or €7.3 million for the year ended December 31, 2021, respectively.
Contribution profit
Contribution profit for the year ended December 31, 2022 was €4.3 million (or 3.4% of revenue), versus a profit of €19.7 million (or 18.0% of revenue) for the year ended December 31, 2021. Marketing and selling expenses increased to €81.9 million (65.3% of revenues) in the year ended December 31, 2022 from €59.4 million (54.3% of revenues) for the year ended December 31, 2021.
The increase in marketing and selling expenses in 2022 was mainly due to a €6.4 million increase in personnel expense, a €3.0 million increase in freight cost, a €2.9 million increase in advertising and marketing versus 2021 and a €2.1 million increase in rental expenses. As a percentage of revenue, personnel costs rose to 22.1% of revenues in 2022 versus 19.6% in 2021 due to higher social benefit contributions and expenses.
St. John Segment
The following table sets forth revenues and gross profit for the St. John segment for the years ended December 31, 2022 and 2021:
| For the years ended December 31, |
Increase/ (Decrease) |
|||||||||||||||
| (Euro thousands, except percentages) |
2022 | 2021 | 2022 vs 2021 | % | ||||||||||||
| Revenues |
85,884 | 73,094 | 12,790 | 17.5% | ||||||||||||
| Gross profit |
52,642 | 38,987 | 13,655 | 35.0% | ||||||||||||
| Gross profit margin |
61.3% | 53.3% | 8.0% | — | ||||||||||||
| Marketing and selling expenses |
(42,498 | ) | (37,697 | ) | (4,801 | ) | 12.7% | |||||||||
| Contribution profit(1)(3) |
10,144 | 1,290 | 8,854 | 686.4% | ||||||||||||
| Contribution profit margin(2)(3) |
11.8% | 1.8% | 10.0% | — | ||||||||||||
| (1) | Contribution profit equals gross profit less marketing and selling expenses. |
| (2) | (Contribution profit margin equals contribution profit divided by revenue. |
| (3) | Contribution profit and contribution profit margin are non-IFRS financial measures. |
102
Table of Contents
Revenues
Revenues for the year ended December 31, 2022 amounted to €85.9 million, an increase of €12.8 million compared to €73.1 million for the year ended December 31, 2021.
St. John grew its revenues by 17.5% from 2021 while reducing discounting and increasing the proportion of full-price selling at our DTC channels. DTC sales in North America in 2022 grew €35.8% from 2021 to €61.3 million or by 16.1 million, benefiting from higher increased full price selling as well as reopening and resumption of social gatherings in the U.S. However, the COVID-19 pandemic impact in Greater China resulted in a €1.3 million decrease in DTC sales to €5.2 million in the region. St. John also benefited from the U.S. dollar appreciation versus the Euro, which appreciated to an average exchange rate of 1.0521 EUR/USD in 2022 from an average exchange rate of 1.1835 EUR/USD in 2021.
Gross profit
Gross profit for the year ended December 31, 2022 was €52.6 million, an increase of €13.7 million compared to €39.0 million for the year ended December 31, 2021. Gross profit margin improved to 61.3% in the year ended December 31, 2022 versus 53.3% for the year ended December 31, 2021. Gross profit margin improved for the year ended December 31, 2022 due to the higher proportion of full-price sell-through at our DTC channels as well as the continued shift in revenues from wholesale to higher-margin DTC channels.
Contribution profit
Contribution profit for the year ended December 31, 2022 was €10.1 million (or 11.8% of revenue), versus a contribution profit of €1.3 million (or 1.8% of revenue) for the year ended December 31, 2021. Marketing and selling expenses increased to €42.5 million (49.5% of revenue) in 2022 from €37.7 million (51.6% of revenue) for the year ended December 31, 2021.
The increase in marketing and selling expenses was mainly due to U.S. dollar’s appreciation versus the Euro, which appreciated to an average exchange rate of 1.0521 EUR/USD in 2022 from an average exchange rate of 1.1835 EUR/USD in 2021. The percentage of marketing and selling expenses of revenue decreased to 49.5% in 2022 from 51.6% in 2021.
103
Table of Contents
Sergio Rossi Segment
As we acquired Sergio Rossi in July 2021, the Sergio Rossi segment did not contribute to our results in the seven months ended July 31, 2021. The following table sets forth revenues and gross profit for the Sergio Rossi segment for the years ended December 31, 2022 and 2021:
| For the years ended December 31, |
Increase/ (Decrease) |
|||||||||||||||
| (Euro thousands, except percentages) |
2022 | 2021 | 2022 vs 2021 | % | ||||||||||||
| Revenues |
61,929 | 28,737 | 33,192 | 115.5% | ||||||||||||
| Gross profit |
31,048 | 13,319 | 17,729 | 133.1% | ||||||||||||
| Gross profit margin |
50.1% | 46.3% | 3.8% | — | ||||||||||||
| Marketing and selling expenses |
(24,502 | ) | (9,489 | ) | (15,013 | ) | 158.2% | |||||||||
| Contribution profit(1)(3) |
6,546 | 3,830 | 2,716 | 70.9% | ||||||||||||
| Contribution profit margin(2)(3) |
10.6% | 13.3% | (2.7)% | — | ||||||||||||
| (1) | Contribution profit equals gross profit less marketing and selling expenses. |
| (2) | Contribution profit margin equals contribution profit divided by revenue. |
| (3) | Contribution profit and contribution profit margin are non-IFRS financial measures. |
Revenues
Revenues for the year ended December 31, 2022 amounted to €61.9 million, an increase of €33.2 million compared to €28.7 million for the year ended December 31, 2021. The increase was primarily due to the consolidation of Sergio Rossi for the year ended December 31, 2022. Since Sergio Rossi was acquired in July 2021, its revenues were consolidated in our results from August 2021. On pro forma basis, revenue grew 4.6% from €59.2 million in full year 2021. Third-party production contributed to €12.3 million of wholesale for the year ended December 31, 2022 compared to €8.0 million for the year ended December 31, 2021.
Gross profit
Gross profit for the year ended December 31, 2022 was €31.0 million, an increase of €17.7 million compared to €13.3 million for the year ended December 31, 2021. Gross profit margin improved to 50.1% in the year ended December 31, 2022 versus 46.3% for the year ended December 31, 2021. Gross profit margin improved for the year ended December 31, 2022 due to the increase of higher margin DTC business as a percentage of revenues. Excluding third-party production, gross profit margin was 59.8% for the year ended December 31, 2022, compared to 60.0% for the year ended December 31, 2021.
Contribution profit
Contribution profit for the year ended December 31, 2022 was €6.5 million (or 10.6% of revenue), versus a contribution profit of €3.8 million (or 13.3% of revenue) for the year ended December 31, 2021. Marketing and selling expenses increased to €24.5 million (39.6% of revenue) in 2022 from €9.5 million (33.0% of revenue) for the year ended December 31, 2021, as a result of higher investment in brand building and sales channel improvement since integrating Sergio Rossi into the Group.
The increase in marketing and selling expenses was due to a €5.8 million increase in personnel costs and sales commissions resulting from increasing sales, a €4.4 million increase in advertising expenses as well as a €2.2 million increase in rental expenses.
104
Table of Contents
Caruso Segment
The following table sets forth revenues and gross profit for the Caruso segment for the years ended December 31, 2022 and 2021:
| For the years ended December 31, |
Increase/ (Decrease) |
|||||||||||||||
| (Euro thousands, except percentages) |
2022 | 2021 | 2022 vs 2021 |
% | ||||||||||||
| Revenues |
30,819 | 24,695 | 6,124 | 24.8% | ||||||||||||
| Gross profit |
7,147 | 4,449 | 2,698 | 60.6% | ||||||||||||
| Gross profit margin |
23,2% | 18.0% | 5.2% | — | ||||||||||||
| Marketing and selling expenses |
(1,446 | ) | (1,144 | ) | (302 | ) | 26.4% | |||||||||
| Contribution profit(1)(3) |
5,701 | 3,305 | 2,396 | 72.5% | ||||||||||||
| Contribution profit margin(2)(3) |
18.5% | 13.4% | 5.1% | — | ||||||||||||
| (1) | Contribution profit equals gross profit less marketing and selling expenses. |
| (2) | Contribution profit margin equals contribution profit divided by revenue. |
| (3) | Contribution profit and contribution profit margin are non-IFRS financial measures. |
Revenues
Revenues for the year ended December 31, 2022 was €30.8 million, an increase of €6.1 million or 24.8% compared to €24.7 million for the year ended December 31, 2021.
The increase in revenues was mainly related to recovery of formal business wear resulting from the post-CO VID back-to-office trend globally.
Gross profit
Gross profit for the year ended December 31, 2022 was €7.1 million, an increase of €2.7 million compared to €4.4 million for the year ended December 31, 2021. Gross profit margin increased to 23.2% for the year ended December 31, 2022 from 18.0% for the year ended December 31, 2021 due to economies of scale and better management of labor costs.
Contribution profit
Contribution profit for the year ended December 31, 2022 was €5.7 million (or 18.5% of revenue), an improvement of €2.4 million or 72.5% from €3.3 million (or 13.4% of revenue) for the year ended December 31, 2021. The improvement in contribution profit was due to the improvement of gross profit as well as better control of marketing and selling expenses.
Non-IFRS Financial Measures
Our management monitors and evaluates operating and financial performance using several non-IFRS financial measures including: contribution profit, contribution profit margin, adjusted earnings before interest and taxes (“Adjusted EBIT”), adjusted earnings before interest, taxes, depreciation and amortization (“Adjusted EBITDA”). Our management believes that these non-IFRS financial measures provide useful and relevant information regarding our performance and improve their ability to assess financial performance and financial position. They also provide comparable measures that facilitate management’s ability to identify operational trends, as well as make decisions regarding future spending, resource allocations and other operational decisions. While similar measures are widely used in the industry in which we operate, the financial measures that we use may not be comparable to other similarly named measures used by other companies nor are they intended to be substitutes for measures of financial performance or financial position as prepared in accordance with IFRS.
105
Table of Contents
Contribution profit and contribution profit margin
Contribution profit is defined as revenues less the cost of sales and selling and marketing expenses. Contribution profit margin is defined as contribution profit divided by revenues.
Contribution profit subtracts the main variable expenses of selling and marketing expenses from gross profit, and our management believes this measure is an important indicator of profitability at the marginal level.
Below contribution profit, the main expenses are general administrative expenses and other operating expenses (which include foreign exchange gains or losses and impairment losses). As we continue to improve the management of our portfolio brands, we believe we can achieve greater economy of scale across the different brands by maintaining the fixed expenses at a lower level as a proportion of revenue. We therefore use contribution profit margin as a key indicator of profitability at the group level as well as the portfolio brand level.
The table below reconciles revenue to contribution profit and contribution profit margin for the periods indicated.
| (Euro thousands, except percentages) |
For the years ended December 31, | |||||||||||
| 2023 | 2022 | 2021 | ||||||||||
| Revenue |
426,178 | 422,312 | 308,822 | |||||||||
| Cost of Sales |
(175,236 | ) | (184,368 | ) | (138,920 | ) | ||||||
|
|
|
|
|
|
|
|||||||
| Gross profit |
250,942 | 237,944 | 169,902 | |||||||||
| Marketing and selling expenses |
(226,750 | ) | (224,733 | ) | (165,502 | ) | ||||||
|
|
|
|
|
|
|
|||||||
| Contribution profit |
24,192 | 13,211 | 4,400 | |||||||||
|
|
|
|
|
|
|
|||||||
| Contribution profit margin |
5.7 | % | 3.1 | % | 1.4 | % | ||||||
Adjusted EBIT
Adjusted EBIT is defined as profit or loss before income taxes, net finance cost, share based compensation, adjusted for income and costs which are significant in nature and that management considers not reflective of underlying operational activities, mainly including net gains on disposal of long-term assets, negative goodwill from the acquisition of Sergio Rossi, gain on debt restructuring and government grants.
The table below reconciles loss for the year to adjusted EBIT for the periods indicated.
| For the years ended December 31, | ||||||||||||
| (Euro thousands, except percentages) |
2023 | 2022 | 2021 | |||||||||
| Loss for the year |
(146,253 | ) | (239,751 | ) | (76,452 | ) | ||||||
| Add / (Deduct) the impact of: |
||||||||||||
| Income tax benefits / (expenses) |
3,407 | (129 | ) | 4,331 | ||||||||
| Finance cost–net |
20,431 | 14,556 | 9,313 | |||||||||
| Non–underlying items |
3,858 | 83,057 | (45,206 | ) | ||||||||
|
|
|
|
|
|
|
|||||||
| Loss from operations before non–underlying items |
(118,557 | ) | (142,267 | ) | (108,014 | ) | ||||||
| Add / (Deduct) the impact of: |
||||||||||||
| Share based compensation |
2,749 | 7,431 | 7,208 | |||||||||
|
|
|
|
|
|
|
|||||||
| Adjusted EBIT |
(115,808 | ) | (134,836 | ) | (100,806 | ) | ||||||
|
|
|
|
|
|
|
|||||||
106
Table of Contents
Adjusted EBITDA
Adjusted EBITDA is defined as profit or loss before income taxes, net finance cost, exchange gains/(losses), depreciation, amortization, share based compensation and provisions and impairment losses adjusted for income and costs which are significant in nature and that management considers not reflective of underlying operational activities, mainly including net gains on disposal of long-term assets, negative goodwill from acquisition of Sergio Rossi, gain on debt restructuring and government grants.
The table below reconciles loss for the year to adjusted EBITDA for the periods indicated.
| (Euro thousands) |
For the years ended December 31, | |||||||||||
| 2023 | 2022 | 2021 | ||||||||||
| Loss for the year |
(146,253 | ) | (239,751 | ) | (76,452 | ) | ||||||
| Add / (Deduct) the impact of: |
||||||||||||
| Income tax benefits / (expenses) |
3,407 | (129 | ) | 4,331 | ||||||||
| Finance cost–net |
20,431 | 14,556 | 9,313 | |||||||||
| Non–underlying items |
3,858 | 83,057 | (45,206 | ) | ||||||||
|
|
|
|
|
|
|
|||||||
| Loss from operations before non–underlying items |
(118,557 | ) | (142,267 | ) | (108,014 | ) | ||||||
| Add / (Deduct) the impact of: |
||||||||||||
| Share based compensation |
2,749 | 7,431 | 7,208 | |||||||||
| Provisions and impairment losses |
79 | 16,729 | 10,766 | |||||||||
| Net foreign exchange (gains) / losses |
4,610 | 339 | (10,489 | ) | ||||||||
| Depreciation/Amortization |
46,946 | 45,810 | 41,584 | |||||||||
|
|
|
|
|
|
|
|||||||
| Adjusted EBITDA |
(64,173 | ) | (71,958 | ) | (58,945 | ) | ||||||
|
|
|
|
|
|
|
|||||||
107
Table of Contents
| B. | Liquidity and Capital Resources |
Overview
We and our portfolio brands’ principal sources of liquidity have been through issuance of additional Ordinary Shares and preferred shares, loans from our shareholder Fosun International (including its subsidiaries and joint ventures), and bank borrowings, and which have historically been sufficient to meet our working capital and capital expenditure requirements. As of December 31, 2023, 2022 and 2021, we had cash and cash equivalents of €27.9 million, €91.7 million and €88.7 million, respectively.
In October 2019 and October 2020, we raised €137.8 million from Series A and Series A+ capital rounds ordinary shares, of which Fosun International and affiliates invested €46.0 million. In May 2021 and October 2021, we raised €117.1 million from Series B preferred shares, of which Fosun International and affiliates invested €59.7 million. In December 2021, we adopted a share economic beneficial interest right scheme for the purpose of recognizing the contribution of participants including our senior management members and consultants to our growth via Brilliant Fashion Holdings Limited, and as a result of which 32,129,493 treasury shares were issued to Brilliant Fashion Holdings Limited.
In October 2022, we entered into an agreement with Meritz for a $50 million investment with half of the investment funded and the other half to be released upon satisfactions of certain conditions, including having an effective resale registration statement. In April 2023, Meritz subsequently funded the remaining half of the investment. In December 2023, we received from Meritz a net amount of $15 million through a repurchase of shares issued in the initial investment and issuance of new Ordinary Shares pursuant to the Meritz SBSA. Pursuant to the Meritz SBSA and the Amended and Restated Meritz Relationship Agreement, we may be required to use a substantial portion of our cash to fulfill our obligations to Meritz under certain circumstances. See “—B. Liquidity and Capital Resources—Meritz Private Placement” and “Item 3. Key Information—D. Risk Factors—Certain rights granted to Meritz in the Amended and Restated Meritz Relationship Agreement could limit the funds available to us or potentially result in dilution of our then existing shareholders.”
In connection with the completion of the Business Combination, we received cash of approximately $190 million, including proceeds of approximately $153 million from the issuance of PIPE Shares (including the re-investment proceeds funded by our repayment of certain shareholder loans from Fosun International), proceeds of approximately $35 million from Aspex’s forward purchase transaction (net of cash used for transaction expenses) and PCAC’s cash held in trust account of approximately $2 million (net of cash used for PCAC’s share redemptions and transaction expenses in connection with the Business Combination).
Additionally, we have relied on liquidity provided by revenue generated from our operating activities. We require liquidity in order to meet our obligations and fund our business. Short-term liquidity is required to fund ongoing cash requirements, including to purchase inventory and to fund costs for services and other expenses. In addition to our general working capital and operational needs, we use significant amounts of cash for capital expenditures related to the opening of new stores or the renovation of existing stores, as well as for acquisitions. We have taken several measures to preserve our liquidity in response to the COVID-19 pandemic as described above (see “—A. Operating Results—Key Factors Affecting Our Financial Condition and Results of Operations”). Taking into account the source of liquidity discussed above, we have not experienced any material adverse changes in our liquidity position since the completion of the Business Combination.
108
Table of Contents
Assuming the exercise of all outstanding Warrants for cash, we would receive aggregate proceeds of approximately $367.8 million. However, we will only receive such proceeds if all Warrant holders fully exercise their Warrants. The exercise price of our Warrants is $11.50 per share, subject to adjustment. We believe that the likelihood that Warrant holders determine to exercise their Warrants, and therefore the amount of cash proceeds that we would receive, is dependent upon the market price of our Ordinary Shares. If the market price for our Ordinary Shares is less than the exercise price of the Warrants (on a per share basis), we believe that Warrant holders will be very unlikely to exercise any of their Warrants, and accordingly, we will not receive any such proceeds. There is no assurance that the Warrants will be “in the money” prior to their expiration or that the Warrant holders will exercise their Warrants. In addition, Warrant holders have the option to exercise their Warrants on a cashless basis in accordance with the Existing Warrant Agreement and the Assignment, Assumption and Amendment Agreement. To the extent that any Warrants are exercised on a cashless basis, the amount of cash we would receive from the exercise of Warrants will decrease. The resale of Ordinary Shares issuable upon the exercise of Warrants, or the perception of such sales, may cause the market price of our Ordinary Shares to decline.
As a growing business, we may need additional cash resources from time to time to meet our obligations and fund our business and capital expenditures for the foreseeable future, or if we find and wish to pursue opportunities for investments, acquisitions, capital expenditures or similar actions. Our shareholder Fosun International will continue to provide adequate support to us, in order to maintain our continued operation and also strategic growth plan for at least 36 months after December 31, 2023. If we determine that our cash requirements exceed the amount of cash and cash equivalents we have on hand at the time, we may also seek to issue equity or debt securities or obtain credit facilities. A decline in the market price of our Ordinary Shares, resulting from sale of all or substantial amounts of the Ordinary Shares or Warrants being offered pursuant to our effective registration statement, or the perception in the market that our existing securityholders may or intend to sell all or a significant portion of such securities, could adversely affect our ability to issue additional securities and our ability to raise additional capital on acceptable terms at a time that we deem appropriate or at all in the future. See “Item 3. Key Information—D. Risk Factors—We expect to incur negative operating cash flows in the next few years and may need to raise substantial additional funding. If we are unable to raise capital when needed or on attractive terms, we would be forced to delay, scale back or discontinue some of our businesses, operations, investments, acquisitions or other growth initiative” and “Item 3. Key Information—D. Risk Factors—Risks Relating to Our Securities” for more details. In addition, issuance and sale of additional equity would result in further dilution to our shareholders. The incurrence of indebtedness would result in increased fixed obligations and could result in operating covenants that would restrict our operations. We cannot assure you that financing will be available in amounts or on terms acceptable to us, if at all.
109
Table of Contents
Cash Flows
Year ended December 31, 2023 compared to the year ended December 31, 2022
The following table summarizes the cash flows provided by/used in operating, investing and financing activities for each of the years ended December 31, 2023 and 2022. Refer to the consolidated cash flows statement and accompanying notes included elsewhere in this annual report for additional information.
| For the years ended December 31, |
Increase/ (Decrease) |
|||||||||||||||
| (Euro thousands, except percentages) |
2023 | 2022 | 2023 vs 2022 | % | ||||||||||||
| Net cash used in operating activities |
(57,891 | ) | (80,851 | ) | 22,960 | (28.4 | )% | |||||||||
| Net cash used in investing activities |
(38,615 | ) | (21,799 | ) | (16,816 | ) | 77.1 | % | ||||||||
| Net cash generated from financing activities |
34,131 | 104,937 | (70,806 | ) | (67.5 | )% | ||||||||||
|
|
|
|
|
|
|
|
|
|||||||||
| Net change in cash and cash equivalents |
(62,375 | ) | 2,287 | (64,662 | ) | (2,827.4 | )% | |||||||||
| Cash and cash equivalents less bank overdrafts at the beginning of the year |
91,749 | 88,658 | 3,091 | 3.5 | % | |||||||||||
| Effect of foreign exchange differences on cash and cash equivalents |
(1,524 | ) | 804 | (2,328 | ) | (289.6 | )% | |||||||||
|
|
|
|
|
|
|
|
|
|||||||||
| Cash and cash equivalents less bank overdrafts at the end of the year |
27,850 | 91,749 | (63,899 | ) | (69.6 | )% | ||||||||||
|
|
|
|
|
|
|
|
|
|||||||||
Net cash used in operating activities
Net cash used in operating activities decreased by €23.0 million to €(57.9) million for the year ended December 31, 2023 from €(80.9) million for the year ended December 31, 2022. The decrease was primarily attributable to (i) the decrease in inventory level which decreased by €1.9 million (or (1.8)%) to €107.2 million at the end of December, 2023, and (ii) a decrease in trade receivables of €3.2 million (or (6.6)%) to €45.7 million at the end of December, 2023.
Net cash used in investing activities
Net cash used in investing activities increased by €16.8 million from €(21.8) million net cash used for the year ended December 31, 2022 to €(38.6) million net cash used for the year ended December 31, 2023. The increase was primarily attributable to (i) the increase of payment for the purchase of long-term assets from €24.7 million in 2022 to €42.7 million in 2023, and partially offset by (ii) the increase in proceeds from disposal of long-term assets from €2.9 million in 2022 to €4.4 million in 2023.
Net cash flows generated from financing activities
Net cash flows generated from financing activities decreased by €70.8 million from €104.9 million for the year ended December 31, 2022 to €34.1 million for the year ended December 31, 2023. The decrease in cash flows from financing activities was primarily attributable to (i) lack of proceeds from the Reverse Recapitalization compared to 183.4 million in 2022, (ii) lower proceeds from borrowings of €153.3 million, (iii) higher payment of lease liabilities interest of €(7.2) million, and partially offset by lower repayments of borrowings of €(117.6) million, lower repayment of lease liabilities of €(31.4) million and lower payment of borrowings interest of €(5.2) million.
110
Table of Contents
Year ended December 31, 2022 compared to the year ended December 31, 2021
The following table summarizes the cash flows provided by/used in operating, investing and financing activities for each of the years ended December 31, 2022 and 2021. Refer to the consolidated cash flows statement and accompanying notes included elsewhere in this annual report for additional information.
| For the years ended December 31, |
Increase/ (Decrease) |
|||||||||||||||
| (Euro thousands, except percentages) |
2022 | 2021 | 2022 vs 2021 | % | ||||||||||||
| Net cash used in operating activities |
(80,851 | ) | (73,088 | ) | (7,763 | ) | 10.6 | % | ||||||||
| Net cash (used in)/generated from investing activities |
(21,799 | ) | 6,346 | (28,145 | ) | (443.5 | )% | |||||||||
| Net cash generated from financing activities |
104,937 | 110,065 | (5,128 | ) | (4.7 | %) | ||||||||||
|
|
|
|
|
|
|
|
|
|||||||||
| Net change in cash and cash equivalents |
2,287 | 43,323 | (41,036 | ) | (94.7 | )% | ||||||||||
| Cash and cash equivalents less bank overdrafts at the beginning of the year |
88,658 | 44,171 | 44,487 | 100.7 | % | |||||||||||
| Effect of foreign exchange differences on cash and cash equivalents |
804 | 1,164 | (360 | ) | (30.9 | )% | ||||||||||
|
|
|
|
|
|
|
|
|
|||||||||
| Cash and cash equivalents less bank overdrafts at the end of the year |
91,749 | 88,658 | 3,091 | 3.5 | % | |||||||||||
|
|
|
|
|
|
|
|
|
|||||||||
Net cash used in operating activities
Net cash used in operating activities increased by €7.8 million to €(80.9) million for the year ended December 31, 2022 from €(73.1) million for the year ended December 31, 2021. The increase was primarily attributable to higher revenue volumes, especially in our wholesale channel, which resulted in (i) an increase in inventories of €16.8 million or 18.2% to €109.1 million at the end of December, 2022, and (ii) an increase in trade receivables of €9.1 million or 22.8% to €48.9 million at the end of December 2022.
Net cash used in investing activities
Net cash used in investing activities increased by €28.1 million from €6.3 million net cash flows for the year ended December 31, 2021 to €(21.8) million net cash used for the year ended December 31, 2022. The increase was primarily attributable to the increase of payment for the purchase of long-term assets from €9.9 million in the year ended December 31, 2021 to €24.7 million in the year ended December 31, 2022, and the decrease in proceeds from disposal of long-term assets from €25.1 million in the year ended December 31, 2021 to €2.9 million in the year ended December 31, 2022.
Net cash flows generated from financing activities
Net cash flows generated from financing activities decreased by €5.1 million from €110.1 million for the year ended December 31, 2021 to €104.9 million for the year ended December 31, 2022. The decrease in cash flows from financing activities was primarily attributable to (i) higher repayment of borrowings of €(225.0) million, (ii) higher payment of borrowings interest of €(15.8) million, (iii) higher payment of lease liabilities interest of €(6.7) million, (iv) payments of transaction costs related to the reverse recapitalization of €(11.2) million, and offset by proceeds from the reverse recapitalization and proceeds from financing fund of €183.4 million and €24.0 million respectively in the year ended December 31, 2022.
111
Table of Contents
Meritz Private Placement
On December 14, 2023, we consummated the following transactions pursuant to the Meritz SBSA and the Amended and Restated Meritz Relationship Agreement, both dated December 1, 2023: (i) Meritz sold and surrendered, and we repurchased from Meritz one Convertible Preference Share and 4,999,999 Ordinary Shares for a price equal to $54.5 million, or the repurchase price; and (ii) immediately thereafter, we issued 19,050,381 Ordinary Shares (the “Subscription Shares”) to Meritz at a total subscription price equal to $69.5 million (the “Total Subscription Price”). The shares repurchased were issued to Meritz in 2022. The Subscription Shares were structured into two tranches, with the subscription price for the first tranche shares equal to the repurchase price, and the subscription price for the second tranche shares equal to $15.0 million.
The Amended and Restated Relationship Agreement became effective on December 14, 2023, and modified certain rights and obligations in the original Meritz relationship agreement, including the underwriting fees, put option, security, events of default, call option and registration rights described below. We entered into a side letter with Meritz on April 30, 2024, which modified the Amended and Restated Relationship Agreement. Pursuant to the side letter, we agreed to repurchase from Meritz 5,245,648 Ordinary Shares in aggregate for a total purchase price of $20.0 million. Such share repurchase will be based on the following schedule: 1,328,704 Ordinary Shares on April 30, 2024 for $5.0 million, (ii) 1,318,129 Ordinary Shares on June 28, 2024 for $5.0 million, (iii) 1,305,220 on July 31, 2024 for $5.0 million and (iv) 1,293,595 on August 30, 2024 for $5.0 million. Furthermore, in the event that the Coverage Ratio (as defined below) is below 150% on any date during the period from April 30, 2024 to August 30, 2024 (both inclusive), within three business days after occurrence of such, we will repurchase from Meritz such number of additional Ordinary Shares at a price that would yield a XIRR of 11.5% on Meritz’s original purchase price, such that immediately after each such share purchase, the Coverage Ratio will be equal to 200%.
Underwriting Fees
Pursuant to the aforementioned side letter, Meritz is entitled to underwriting fees in cash per each quarter with the first quarterly payment payable on the date that falls three months after the closing and the last quarterly payment payable on the third anniversary of the closing. The underwriting fees are calculated based on an amount of $0.0359 for each first tranche share then held by Meritz at the time of payment and an amount of US$0.0385 for each second tranche share then held by Meritz at the time of payment.
Put Option
Meritz has a right to put all (and not only some) Subscription Shares held by Meritz to us or any (the “Put Option”) at a price equal to the Agreed Return (the “Put Option Price”) upon occurrence of the following events: (a) any Credit Event (as defined below) of us; (b) our failure to provide replacement security within 10 business days after occurrence of any credit event related to Fosun Tourism Group (“FTG”) which results in the Coverage Ratio (as defined below) falling below 150%; (c) the lapse of the Call Option 2 (as defined below); (d) the second anniversary of the closing on December 14, 2023; and (e) the third anniversary of the closing on December 14, 2023.
The Put Option will lapse if (i) Meritz fails to serve the relevant exercise notice within ninety days after the Put Option is triggered; or (ii) Meritz has not exercised the Put Option by the date that falls ninety days after the third anniversary of the closing.
“Agreed Return” means the higher of an amount that: (a) provides Meritz with an eleven and a half per cent (11.5%) XIRR, compounding every 12 months, of: (i) the Total Subscription Price calculated for the period between the closing date and the date of realization; or (b) equals to 1.115 times the sum of the Total Subscription Price, in each case, less an amount that yields a XIRR of 11.5%, compounding every 12 months, on any Interim Return received by Meritz calculated for the period between the date such Interim Return is paid and the date when the Agreed Return is realized.
“Credit Events” means, among other things, insolvency, bankruptcy, liquidation or winding up of, and Mr. Guo Guangchang ceasing to have control of FTG, FFG, Fosun International or us, delisting or suspension of trading of shares of FTG or Fosun International for 15 trading days, delisting or suspension of trading of our shares for 5 trading days, non-payment or events of default by FTG, FFG, Fosun International and us with respect to borrowings over specified amount, and failure to pay Meritz any Underwriting Fee, which Meritz is entitled to in the fixed amount of 4% of the Total Subscription Price per annum for each of the two twelve-month periods following the closing on December 13, 2023.
112
Table of Contents
Security
Our obligations to pay the Put Option Price and our indemnity obligations under the Meritz SBSA are secured by a charge over certain shares of FTG held by Fosun International, subject to a top up adjustment with (a) subject to Meritz’s consent which will not be unreasonably withheld, additional shares of FTG, (b) subject to Meritz’s consent which will not be unreasonably withheld, our Ordinary Shares, and/or (c) additional cash in $ to be charged (the “Fixed Charges”).
In the event that the Coverage Ratio (defined below) falls below 150%, upon Meritz’s notice, we are obligated to, among other things, provide additional security by either (i) depositing additional cash in US dollars by way of cash account charge in favor of Meritz (the “Cash Top Up”); (ii) (a) subject to Meritz’s consent which will not be unreasonably withheld, procuring Fosun International to grant a charge over additional shares of FTG in favor of Meritz, or (b) subject to Meritz’s consent which will not be unreasonably withheld, procuring Fosun International to grant a charge over our shares in favor of Meritz (each of (a) and (b), “Share Top Up”); (iii) subject to Meritz’s consent which will not be unreasonably withheld, making a combination of Cash Top Up and Share Top Up; in each case so that the Coverage Ratio increases to no lower than 200%; or (iv) acquiring all Subscription Shares then held by Meritz at a price equal to the Agreed Return (“Top Up Obligations”). As of the date of this report, our obligations were also secured by 48.5 million Ordinary Shares pledged by Fosun International pursuant to the top up adjustment. Upon completion of our share repurchase under the aforementioned side letter and subject to certain other conditions, our Ordinary Shares pledged by Fosun International will be released.
In addition, we agreed to procure Fosun International to pledge certain number of shares of Paref SA to secure our obligations to repurchase Ordinary Shares from Meritz pursuant to the aforementioned side letter. Shares of Paref SA will be released proportionally as we complete our scheduled share repurchases.
“Coverage Ratio” equals to (i) the aggregate sum of (a) market value of the Subscription Shares held by Meritz; (b) market value of FTG security shares (applicable only if no Credit Event in respect of FTG is subsisting); (c) the amount of cash in the charged cash accounts; and (d) market value of the topped-up Ordinary Shares (if any), divided by (ii) the Total Subscription Price multiplied by a factor equal to the number of the Subscription Shares then held by Meritz divided by the total number of the Subscription Shares.
Events of Default
“Events of Defaults” are deemed to have occurred if we fail to fulfill our obligations with respect to the Put Option or fails to fulfill our Top Up Obligations, as well as our share repurchase obligations and obligations with respect to the pledge of Paref SA shares under the aforementioned side letter.
If an Event of Default occurs, Meritz has the right to enforce the Fixed Charges to recover the amount equal to the Agreed Return, and to the extent there is a shortfall between the gross proceeds that Meritz has realized from enforcement of the Fixed Charges and the Agreed Return, we remain liable to pay such shortfall to Meritz by acquiring all Subscription Shares then held by Meritz at a price equal to such shortfall amount or having a third party investor purchase the Subscription Shares from Meritz. Immediately after Meritz has realized the Agreed Return, Meritz will surrender any remaining Subscription Shares held by it to us at nil consideration.
Call Option
Following the closing on December 14, 2023, we have the right to acquire from Meritz (i) up to 70% of the Subscription Shares then held by Meritz (“Call Option 1”) after the date on which our closing share price has been less than 50% of the Total Subscription Price divided by total number of the Subscription Shares for three consecutive trading days at a purchase price equal to the Agreed Return multiplied by a fraction, the numerator of which is the total number of our Ordinary Shares that is subject to Call Option 1 and the denominator of which is the total number of the Subscription Shares; and (ii) up to 50% of the Subscription Shares then held by Meritz (“Call Option 2,” together with Call Option 1, the “Call Options”) after expiry of the twelvemonth period following the closing at a purchase price equal to the higher of (a) the Agreed Return; multiplied by a fraction, the numerator of which is the total number of our Ordinary Shares that are subject to Call Option 2 and the denominator of which is the total number of the Subscription Shares and (b) the market price of the Subscription Shares multiplied by the number of the Subscription Shares subject to the Call Option 2. We may nominate third party investors to acquire the shares from Meritz in connection with its exercise of the Call Options.
113
Table of Contents
Registration Rights
Under the Amended and Restated Meritz Relationship Agreement, we agreed to file a registration statement with the Securities and Exchange Commission (the “SEC”) covering the resale of the Ordinary Shares to be issued to Meritz as soon as reasonably practicable and within 30 days after the closing and to use commercially reasonable efforts to have the registration statement declared effective as soon as possible thereafter but in no event later than 60 days thereafter, or 120 days thereafter in the event of a “review” by the SEC. We have filed a registration statement with the SEC covering the resale of the Ordinary Shares issued to Meritz, which has been declared effective.
Borrowing
We enter into and manage debt facilities centrally in order to satisfy the short and medium-term needs of each of our subsidiaries based on criteria of efficiency and cost-effectiveness. Our portfolio brands have historically entered into and maintained with a diversified pool of lenders a total amount of committed credit lines that is considered consistent with their needs and suitable to ensure at any time the liquidity needed to satisfy and comply with all of their financial commitments, as well as guaranteeing an adequate level of operational flexibility for any expansion programs.
As of December 31, 2023, borrowings amounted to €8.6 million were guaranteed by a third party SACE S.p.A. As of December 31, 2023, borrowings amounted to €8.3 million were secured by pledges of our assets including property, plant and equipment, inventories and trade receivables.
Our unsecured borrowings are principally used for operations. The borrowings for the year ended December 31, 2023 are at rates ranging from 4.55% to 11.76 % per annum.
For additional information, see Note 24—Borrowings to Lanvin Group’s consolidated financial statements included elsewhere in this annual report.
In addition, Fosun International extends various shareholders loans to us for working capital purposes. See “Item 7. Major Shareholders and Other Related Party Transactions—B. Related Party Transactions—Other Related Party Transactions—Shareholder Loans.”
We are subject to certain covenants, including financial and otherwise, under our financing agreements. As of December 31, 2023, we were in material compliance with all covenants.
114
Table of Contents
Contractual Obligations and Commitments
The following table summarizes our contractual obligations and commitments as of December 31, 2023:
| Payments Due by Period | ||||||||||||||||||||
| (Euro thousands, except percentages) |
On demand |
Less than 1 year |
1 to 3 years |
Over 3 years |
Total | |||||||||||||||
| Trade payables |
20,907 | 57,669 | — | — | 78,576 | |||||||||||||||
| Other current liabilities |
8,758 | 88,527 | — | — | 97,285 | |||||||||||||||
| Lease liabilities |
— | 37,824 | 58,685 | 70,867 | 167,376 | |||||||||||||||
| Bank overdrafts |
280 | — | — | — | 280 | |||||||||||||||
| Borrowings |
— | 35,720 | 21,794 | 10,587 | 68,101 | |||||||||||||||
|
|
|
|
|
|
|
|
|
|
|
|||||||||||
| Total contractual obligations | 29,945 | 219,740 | 80,479 | 81,454 | 411,618 | |||||||||||||||
|
|
|
|
|
|
|
|
|
|
|
|||||||||||
Other non-current liabilities (bonds and other)
As of December 31, 2023, 2022 and 2021, we had bonds and other related to government grants and others of €14.7 million, €0.7 million and €0.7 million, respectively.
Cash and Cash Equivalents
The table below sets forth the breakdown of our cash and cash equivalents as of the dates indicated.
| For the years ended December 31, |
Increase/ (Decrease) | |||||||||||||||||||||||||||
| (Euro thousands, except percentages) |
2023 | 2022 | 2021 | 2023 vs 2022 |
% | 2022 vs 2021 |
% | |||||||||||||||||||||
| Cash on hand |
710 | 391 | 376 | 319 | 81.6 | % | 15 | 4.0 | % | |||||||||||||||||||
| Bank balances |
27,420 | 91,506 | 88,296 | (64,086 | ) | (70.0 | )% | 3,210 | 3.6 | % | ||||||||||||||||||
|
|
|
|
|
|
|
|
|
|
|
|
|
|
|
|||||||||||||||
| Cash and cash equivalents |
28,130 | 91,897 | 88,672 | (63,767 | ) | (69.4 | )% | 3,225 | 3.6 | % | ||||||||||||||||||
| Restricted cash |
— | — | 309 | — | — | (309 | ) | — | ||||||||||||||||||||
|
|
|
|
|
|
|
|
|
|
|
|
|
|
|
|||||||||||||||
| Cash and bank balances |
28,130 | 91,897 | 88,981 | (63,767 | ) | (69.4 | )% | 2,916 | 3.3 | % | ||||||||||||||||||
|
|
|
|
|
|
|
|
|
|
|
|
|
|
|
|||||||||||||||
The cash and cash equivalents (which include cash on hand and bank balances) were offset by bank overdrafts of €0.3 million, €0.1 million and €14 thousand as of December 31, 2023, 2022 and 2021, respectively. Our cash and cash equivalents are held with reputable commercial banks at various jurisdictions including Greater China, France, Italy and U.S. Certain jurisdictions may not have official deposit insurance program or agency similar to the Federal Deposit Insurance Corporation (FDIC) in the U.S. The Group does not foresee substantial credit risk with respect to cash and cash equivalents held at commercial banks in such jurisdictions.
We may be subject to restrictions which limit our ability to use cash. In particular, our cash held at banks in China is subject to certain repatriation restrictions and may only be repatriated as dividends. We do not believe that such transfer restrictions have any adverse impacts on our ability to meet liquidity requirements. As of December 31, 2021, we had cash held at a bank of €309 thousand for a corporate card program, which was not available for general use by the Group and therefore recorded as restricted cash. There was no restricted cash as of December 31, 2023 and 2022.
115
Table of Contents
Other current assets
The table below sets forth the breakdown of our other current assets as of the dates indicated.
| For the years ended December 31, |
Increase/ (Decrease) | |||||||||||||||||||||||||||
| (Euro thousands, except percentages) |
2023 | 2022 | 2021 | 2023 vs 2022 |
% | 2022 vs 2021 |
% | |||||||||||||||||||||
| Tax recoverable |
7,078 | 10,164 | 10,449 | (3,086 | ) | (30.4 | )% | (285 | ) | (2.7 | )% | |||||||||||||||||
| Government grants |
— | — | 9,462 | — | — | (9,462 | ) | — | ||||||||||||||||||||
| Advances and payments on account to vendors |
4,486 | 7,238 | 7,496 | (2,752 | ) | (38.0 | )% | (258 | ) | (3.4 | )% | |||||||||||||||||
| Prepaid expenses |
5,374 | 6,205 | 5,491 | (831 | ) | (13.4 | )% | 714 | 13.0 | % | ||||||||||||||||||
| Deposits of rental, utility and other |
1,859 | 2,055 | 1,766 | (196 | ) | (9.5 | )% | 289 | 16.4 | % | ||||||||||||||||||
| Other receivable of royalties |
4,147 | 751 | 615 | 3,396 | 452.2 | % | (136 | ) | (22.1 | )% | ||||||||||||||||||
| Other |
2,706 | 4,054 | 6,427 | (1,348 | ) | (33.3 | )% | (2,373 | ) | (36.9 | )% | |||||||||||||||||
|
|
|
|
|
|
|
|
|
|
|
|
|
|
|
|||||||||||||||
| Total other current financial assets |
25,650 | 30,467 | 41,706 | (4,817 | ) | (15.8 | )% | (11,239 | ) | (26.9 | )% | |||||||||||||||||
|
|
|
|
|
|
|
|
|
|
|
|
|
|
|
|||||||||||||||
Off–Balance Sheet Arrangements
We did not have during the periods presented, and we do not currently have, any off-balance sheet financing arrangements or any relationships with unconsolidated entities or financial partnerships, including entities sometimes referred to as structured finance or special purpose entities, that were established for the purpose of facilitating off-balance sheet arrangements or other contractually narrow or limited purposes.
| C. | Research and Development, Patents and Licenses, etc. |
See “Item 4. Information on the Company—B. Business Overview—Research and Development” and “Item 4. Information on the Company—B. Business Overview—Intellectual Property.”
| D. | Trend Information |
Other than as disclosed elsewhere in this annual report, we are not aware of any trends, uncertainties, demands, commitments or events since December 31, 2023 that are reasonably likely to have a material and adverse effect on our revenues, income, profitability, liquidity or capital resources, or that would cause the disclosed financial information to be not necessarily indicative of future results of operations or financial conditions.
116
Table of Contents
| E. | Critical Accounting Estimates |
We have selected accounting policies that we believe provide an accurate, true and fair view of our consolidated financial condition and results of operations. These accounting policies are applied in a consistent manner, unless stated otherwise, which will mainly be a result of the application of new accounting pronouncements. For a summary of all of our significant accounting policies, refer to Note 3 - Summary of significant accounting policies to Lanvin Group’s annual consolidated financial statements included elsewhere in this annual report.
The preparation of consolidated financial statements in accordance with IFRS issued by the International Accounting Standards Board requires management to make estimates, judgments and assumptions in order to determine the carrying amounts of certain assets, liabilities, income and expense items, as well as certain amounts disclosed in the explanatory notes to the financial statements relating to contingent assets and liabilities.
The estimates and assumptions used are those deemed by management to be the most pertinent and accurate in view of our circumstances and past experience, based on elements that are known when the financial statements are prepared.
The estimates and underlying assumptions are reviewed periodically and continuously by our management. If the items subject to estimates do not perform as assumed, then the actual results could differ from the estimates, which would require adjustment accordingly.
A description of the critical accounting policies which our management believes have the most significant impact on Lanvin Group’s consolidated financial statements is provided below:
Impairment of non-current assets with definite useful lives
Non-current assets with definite useful lives include property, plant and equipment, investment property and intangible assets. We periodically review the carrying amount of non-current assets with definite useful lives when events and circumstances indicate that an asset may be impaired. Impairment tests are performed by comparing the carrying amount and the recoverable amount of the cash-generating unit (“CGU”). The recoverable amount is the higher of the CGU’s fair value less costs of disposal and its value in use. In assessing the value in use, the estimated future cash flows are discounted to their present value using a pre-tax discount rate that reflects current market assessments of the time value of money and the risks specific to the CGU. For additional information refer to Note 17 - Property, plant and equipment to Lanvin Group’s annual consolidated financial statements included elsewhere in this annual report.
The calculation of value in use for property, plant and equipment and right-of-use assets is most sensitive to the assumptions relating to discount rates, the growth rates used to extrapolate cash flows beyond the forecast period and the revenue CAGR.
117
Table of Contents
Recoverability of goodwill and brands with indefinite useful life
In accordance with IAS 36 Impairment of Assets, goodwill and brands with indefinite useful life are not amortized and are tested for impairment annually or more frequently if facts or circumstances indicate that the asset may be impaired. The impairment test is performed by comparing the carrying amount and the recoverable amount of the CGU. The recoverable amount of the CGU is the higher of its fair value, less costs of disposal and its value in use. For additional information refer to Note 16 - Impairment testing of intangible assets with indefinite useful lives to Lanvin Group’s annual consolidated financial statements included elsewhere in this annual report.
As of the date of the most recent impairment test, the recoverable amount of each CGU exceeded its respective carrying amount. The recoverable amount of goodwill of Lanvin, Wolford and St. John exceeded the carrying amount by 23.20%, 688.07% and 213.64%, respectively. The recoverable amount of each of the Lanvin, Wolford, St. John and Sergio Rossi brands exceeded its carrying amount by 14.91%, 54.06%, 43.69% and 166.99%, respectively. As for Caruso, as of the date of the most recent impairment test, the net carrying value of goodwill and brand of Caruso is zero.
The Company performs its annual impairment assessment of goodwill as well as brand intangibles during the fourth quarter of each fiscal year. The Company determined that there was no impairment in fiscal 2023 as the fair values of the Wolford and St. John cash generating units and indefinite-lived brands and the fair value of Sergio Rossi’s indefinite-lived brands significantly exceeded their carrying values.
Furthermore, the fair value of the Lanvin brand cash generating unit and indefinite-lived brand exceeded their respective carrying values by approximately 23.20% and 14.91%, respectively. Several factors could impact the Lanvin brand’s ability to achieve future cash flows, including the success of international expansion strategies, the optimization of the store fleet productivity, the impact of promotional activity, the simplification of certain corporate overhead structures and other initiatives aimed at expanding higher performing categories of the business.
Given the relatively small excess of fair value over carrying value as noted above, if revenue projections are not met or if profitability of the brand does not improve during fiscal 2024, it is possible that an interim test, or annual impairment test, could result in an impairment of these assets.
Recoverability of deferred tax assets
The deferred tax assets are recognized on the premise that it is more likely than not that we will be able to generate sufficient and suitable future taxable profits from which the reversal of the asset can be deducted. If we are unable to generate sufficient taxable profits in certain jurisdictions, or if there is a significant change in the actual effective tax rates or the time period within which the underlying temporary differences become taxable or deductible, we could be required to write-off any deferred tax assets, resulting in an increase in its effective tax rate and an adverse impact on future operating results.
For additional information refer to Note 3.24 - Income taxes to Lanvin Group’s annual consolidated financial statements included elsewhere in this annual report.
Fair value estimates
Fair value is defined as the price that would be received for sale of an asset or paid for transfer of a liability, in an orderly transaction between market participants at the measurement date. IFRS 13 Fair Value Measurement (“IFRS 13”) establishes a three-tier fair value hierarchy, which prioritizes the inputs used in measuring fair value. The hierarchy gives the highest priority to unadjusted quoted prices in active markets for identical assets or liabilities (Level 1 measurements) and the lowest priority to unobservable inputs (Level 3 measurements). These tiers include:
| • | Level 1, defined as observable inputs such as quoted prices (unadjusted) for identical instruments in active markets; |
118
Table of Contents
| • | Level 2, defined as inputs other than quoted prices in active markets that are either directly or indirectly observable such as quoted prices for similar instruments in active markets or quoted prices for identical or similar instruments in markets that are not active; and |
| • | Level 3, defined as unobservable inputs in which little or no market data exists, therefore requiring an entity to develop its own assumptions, such as valuations derived from valuation techniques in which one or more significant inputs or significant value drivers are unobservable. |
In some circumstances, the inputs used to measure fair value might be categorized within different levels of the fair value hierarchy. In those instances, the fair value measurement is categorized in its entirety in the fair value hierarchy based on the lowest level input that is significant to the fair value measurement.
Provisions for obsolete inventory
Since our products are subject to market trends and changes in fashion trends, product inventories at the end of the season are subject to impairment. Specifically, the provision for obsolete inventory of finished products reflects management’s estimate of the expected impairment losses on the products of the collections of previous seasons, considering the ability to sell them through our various distribution channels.
Generally, impairment assumptions involve percentages of impairment that become greater the older the collections are, so as to reflect the decline in selling prices in secondary channels (mainly outlets), and on the other hand, the decrease in the probability of selling them as time goes by.
The provision for obsolete raw materials reflects management’s estimates of the decline in the probability they will be used based on the calculation of slow-moving raw materials.
Provision for risks
We recognize a liability when facing legal and tax disputes and lawsuits if we believe it is probable that they will require an outflow of financial resources and a reliable estimate can be made of the amount of the potential losses. Given the uncertainty surrounding the outcome of these proceedings, it is hard to reliably estimate the outflow of resources that will be required to settle them, therefore the amount of the provisions for legal and tax disputes may change as a result of future developments in the outstanding proceedings. We monitor the status of ongoing lawsuits and proceedings and consults with our legal advisors as well as legal and tax experts.
119
Table of Contents
Impact of the COVID-19 outbreak
During the years ended December 31, 2022 and 2021, the COVID-19 pandemic led to a significant slow-down of the global economy, temporary closures of our sales network and distribution centers and an almost complete halt in international travel
At the date of these financial statements, the impact and duration of the outbreak and the related measures taken to control it remain uncertain. In preparing these financial statements, these uncertainties have been considered throughout. Inventory provisions have been updated where necessary; given the nature of our inventories, additional provisions were limited. The impact of reduced levels of production has been excluded from the valuation of inventory. In assessing the carrying value of our non-current assets, we have performed our annual impairment testing of CGUs. This testing was based on updated cash flow forecasts which consider current assumptions on the timing and scale of the economic recovery from the COVID-19 pandemic, including that online retail would recover faster than the retail and wholesale channels. Additional impairment testing of our extensive boutique network was performed wherever indicators of impairment were identified. The credit risk arising from trade receivables is not considered to have significantly increased.
Our position remains that, despite a significant short-term impact, long-term market conditions remain unlikely to change. We continue to monitor on a regular basis the evolution of the pandemic and the related responses and to update our expectations when necessary
Business combinations Valuation of the identifiable assets and liabilities through business combination and recognized corresponding goodwill or gain on bargain purchase
We completed certain business combinations, all of which were accounted for using an acquisition method when the acquired activities and assets meets the definition of a business and control is transferred to us.
We measure goodwill at the date of acquisition as:
| i. | The fair value of the consideration transferred; plus |
| ii. | The recognized amount of the consideration transferred; plus |
| iii. | if the business combination is achieved in stages, the fair value of the pre-existing equity interest in the acquiree over the net recognized amount (generally fair value) over the identifiable assets acquired and liabilities assumed. Any goodwill that arises is tested annually for impairment. |
The consideration transferred is generally measured at fair value, as are the identifiable net assets acquired. When the excess is negative, a bargain purchase gain is recognized immediately in profit or loss.
New Standards, Amendments and Interpretations under IFRS
For a description of certain recently adopted, issued or proposed accounting standards which may impact our consolidated financial statements in future reporting periods, refer to the sections “New Standards and Amendments issued by the IASB and applicable to the Lanvin Group from January 1, 2023” and “New standards, amendments and interpretations not yet effective” in Note 3.1—Summary of significant accounting policies to Lanvin Group’s consolidated financial statements included elsewhere in this annual report.
120
Table of Contents
| ITEM 6. | DIRECTORS, SENIOR MANAGEMENT AND EMPLOYEES |
| A. | Directors and Senior Management |
The following table sets forth certain information relating to our directors as of the date of this annual report.
| Name |
Age |
Position | ||
| Zhen Huang |
53 | Chairman and Director | ||
| Tong “Max” Chen |
44 | Director | ||
| Weijin Fang |
40 | Director | ||
| Chao Zou |
42 | Director | ||
| Mitchell Alan Garber |
60 | Independent Director | ||
| Jennifer Fleiss |
41 | Independent Director | ||
| Jurjan Wouda Kuipers |
62 | Independent Director | ||
| Ceci Kurzman |
54 | Independent Director |
Zhen Huang is chairman of our board of directors. He is also an Executive Director and Executive President of Fosun International Limited (HKSE Stock Code: 0656), the chairman of Shanghai Yuyuan Tourist Mart (Group) Co., Ltd. (SSE Stock Code: 600655), the director of Shede Spirits Co., Ltd. (SSE Stock Code: 600702), Shanghai Resource Property Consulting Co., Ltd., Shanghai Bailian Group Co., Ltd. (SSE Stock Code: 600827) and Beijing Sanyuan Foods Co., Ltd. (SSE Stock Code: 600429). Mr. Huang is the non-executive director of Fosun Tourism Group (HKSE Stock Code: 01992), a company within Fosun Group. Mr. Huang was awarded “Top Ten Economic Figures in China’s Circulation Industry” and “National Outstanding Commercial Entrepreneur”. Mr. Huang holds a bachelor’s degree in economics from Shanghai University of Finance and Economics and an MBA degree from Webster University.
Tong “Max” Chen has served as a member of the board of directors and as the Chief Executive Officer of PCAC since its inception, and as the Chief Financial Officer since September 12, 2020. Mr. Chen is a partner and a founding member of Primavera Capital Group, which he joined in 2010. At Primavera, Mr. Chen is responsible for sourcing, executing and exiting a variety of deals in the consumer and technology sectors, including investments in Alibaba Group, Cainiao Smart Logistics, Alibaba Local Services Group, iResearch, Vitaco Health and Love Bonito. Prior to Primavera, Mr. Chen worked at the Investment Banking Division of Goldman Sachs in both Hong Kong and New York from 2003 to 2006. Mr. Chen holds a bachelor’s degree in applied mathematics from Harvard College. He also received his JD and MBA degrees from Harvard Law School and Harvard Business School, respectively.
Weijin Fang has served as a member of our board of directors. She is primarily responsible for human resource strategic planning, organization design and development, talent recruitment, leadership development and mechanism innovation. Ms Fang is currently the Fosun Global Partner, Member of Fosun Ecosystem Committee, Happiness Business Group Partner, Fosun Tourism Group Partner, Senior Vice President and Chief Human Resources Officer (CHO) of Fosun Tourism Group, and Co-CHO of Fosun Happiness Industrial Operation Committee. Ms. Fang served as the Head of Fosun International Talent Development, senior human resources partner, executive principal of Fosun University, general manager of the staff ecology BD department and co-chief human resources officer of the Intelligent Technology Business Group from 2017 to 2020. Prior to joining Fosun, she worked in KPMG China as Senior HR Business Advisor from 2007 to 2017, responsible for general HR management and organization development. Ms. Fang obtained her bachelor’s degree of economics from Shanghai University and bachelor’s degree of commerce from University of Technology Sydney in 2007. She obtained her MBA from Shanghai Jiaotong University and Kedge Business School in France in 2023.
Chao Zou is a member of our board of directors. He also serves as the Executive President, Co-Chief Investment Officer and Board Secretary of Shanghai Yuyuan Tourist Mart (Group) Co., Ltd., the Chairman of Supervisory Board of Tom Tailor GmbH, the Director of Shede Spirits Co., Ltd. and Jinhui Liquor Co., Ltd., and the Director of Shanghai Diamond Exchange. Prior to joining Fosun Group, Mr. Zou served as the Incharge of Innovation Finance Department of Shimao Group, and Assurance Manager in KPMG China. Mr. Zou holds a bachelor’s degree in business administration and a master’s degree in business management from Shanghai University of Finance and Economics.
Mitchell Alan Garber C.M is one of our independent directors. Mr. Garber is a Canadian born lawyer and business executive. He is currently a board member of Shutterfly Inc, Rackspace Technologies, The NHL Seattle Kraken and Aiola Inc. He is a senior advisor to Apollo Global Management and has been CEO of public companies on the NASDAQ, NYSE, and LSE, and has led numerous large M&A transactions. He was awarded the Order of Canada in 2019. Mr. Garber holds a bachelor’s degree from McGill University, a law degree from the University of Ottawa, an honorary doctorate from both the University of Ottawa and the University of Montreal, The McGill/Desautels Business School Achievement award, and The University of Ottawa Order of Merit.
Jennifer Fleiss is one of our independent directors. Ms. Fleiss is a co-founder of Rent the Runway, a former executive within Walmart’s tech incubator, a Partner at Initialized Capital and a board member of Rent the Runway (RENT) and Shutterfly. Ms. Fleiss holds a bachelor’s degree (cum laude) in political science from Yale University and an MBA from Harvard Business School.
121
Table of Contents
Jurjan Wouda Kuipers is one of our independent directors. Before his appointment as an independent director, Mr. Wouda Kuipers spent 22 years at Ernst & Young (EY) in New York. From 2017 to 2020, Mr. Wouda Kuipers was EY’s Senior International Tax Partner heading the Financial Services Offices’ Tax Desks, and his previous work experience includes the following positions as; Associate General Tax Counsel at Unilever and Associate at tax law firm Loyens & Volkmaars. For the past twenty years, Mr. Wouda Kuipers has served on the board of the Netherland-America Foundation (NAF). Mr. Wouda Kuipers holds three master of law degrees (University of Amsterdam, Taxation, 1991; Erasmus University Rotterdam, Corporate Law, Civil Law, 1987).
Ceci Kurzman is one of our independent directors. Ms. Kurzman is a music industry veteran and the founder of Nexus Management Group, Inc., a private investment company dedicated to innovative growth-stage businesses in the consumer, media and technology sectors. Ms. Kurzman currently serves on the board of directors of United Talent Agency and Warner Music Group (NASDAQ: WMG), where she serves on the compensation and nomination and governance committees, as well as other public and private companies including Man Group (LON: EMG) and Hornblower Group. Ms. Kurzman also serves as a senior advisor at Dynasty Equity and Cityrock Funds. Ms. Kurzman is a graduate of Harvard College.
Ms. Yun Cheng was our Chief Executive Officer, chairman and director since our inception until her resignation in December 2023. Ms. Cheng’s resignation did not result from any dispute or disagreement with our Company or our board of directors regarding our practices, policies, or otherwise.
The following individuals comprise our senior management as of the date of this annual report:
| • | Eric Chan as Chief Executive Officer; |
| • | Kat Yu David, Chan as Executive President, Chief Financial Officer and Co-COO; and |
| • | Gong Cheng as Chief Risk Officer. |
Mr. Shang Hsiu Koo was our Chief Financial Officer from October 2021 until his resignation in January 2023. Mr. Koo’s resignation did not result from any dispute or disagreement with our Company or our board of directors regarding our practices, policies, or otherwise. Ms. Xiaojing Grace Zhao was our Executive President and Co-COO since 2020. For personal reasons, Ms. Zhao transferred to a new role within Fosun Group in the function of Business Development in March 2023. Ms. Zhao’s transfer did not result from any dispute or disagreement with our Company or our board of directors regarding our practices, policies, or otherwise.
Summary biographies of members of the senior management are set out below.
Eric Chan, 56, has been our Chief Executive Officer since December 2023. He is also acting as the Co-Chairman at Greater Yuyuan Commercial Development Group. Before joining Fosun Group in 2018, Mr. Chan had held senior roles at other international corporations, including SECOO Group, K11 Concepts under Hong Kong New World Development Group, Wharf Group, CB Richard Ellis, Hong Kong MTR Corporation and Four Seasons Hotels & Resorts Group. As a seasoned executive, Mr. Chan has over 30 years’ experience across a wide spectrum in commercial industry throughout omni-channel shopping platform, luxury commercial real estate projects, as well as offices and high-end hotels & resorts. Mr. Chan holds a bachelor’s degree from The Hong Kong Polytechnic University for hotel management and an MBA degree from The University of Leicester.
Kat Yu David, Chan, 41, has been the Executive President of Lanvin Group since its inception. Mr. Chan is also the Chief Financial Officer of Lanvin Group. He currently serves as a board member for four of Lanvin Group’s brands: Lanvin, Sergio Rossi, St. John Knits and Caruso. At Lanvin Group, Mr. Chan is responsible for leading multiple aspects of Lanvin Group’s activities including mergers and acquisitions, brand operations, key personnel recruitment, and vision and strategy implementation for all of Lanvin Group’s brands. Mr. Chan led the acquisitions of Lanvin, Sergio Rossi, St. John and Oasis Fashion, which had later been rebranded to become Fosun Fashion Brand Management. Prior to joining the Lanvin Group, Mr. Chan served as a board observer of Cirque de Soleil, and Managing Director of the China Momentum Fund, a cross-border private equity fund managed by Fosun International. Prior to joining Fosun International, Mr. Chan was an investment professional at Alcentra, a subsidiary of BNY Mellon. Mr. Chan holds a bachelor’s degree with dual majors in economics and mathematics from Emory University.
122
Table of Contents
Gong Cheng, 34, is our Chief Risk Officer. Mr. Cheng has been with the Lanvin Group since 2018 in various legal roles and was appointed as the Chief Risk Officer of the Group since September 2021. Prior to joining the Lanvin Group, Mr. Cheng served as legal counsel in an offshore private equity fund managed by Fosun. From 2012 to 2017, he was an attorney at Deheng Law Offices and Junhe LLP, where he specialized in capital markets and securities law. Mr. Cheng holds a Bachelor of Law degree from East China University of Political Science and Law. He also received his Master of Laws degree from Boston University, School of Law. Mr. Cheng is also a part-time tutor at East China University of Political Science and Law, Wenbo College.
| B. | Compensation |
In 2023, we paid an aggregate of €2.48 million (using the average exchange rate for the year of 2023) in cash compensation and benefits in kind to our directors and executive officers as a group. Our executive officers receive the awards under the BF Plan. We will pay our independent directors annual cash retainer, along with equity awards. For information regarding share awards granted to our directors and executive officers, see the section entitled “ —Share Incentive Plan.”
Employment Agreements and Indemnification Agreements
Each of our executive officers is party to an employment agreement with our subsidiaries in the PRC. The employment of the executive officers under these employment agreements is for fixed periods of up to three (3) years, but may be extended by mutual agreement between such employer and the officer. The agreements may be terminated by the employer for cause at any time without advance notice or for any other reason by giving prior written notice or by paying certain compensation, and the executive officer may terminate his or her employment at any time by giving the employer prior written notice. The employment agreements with the executive officers also include confidentiality, non-disclosure restrictions that apply during employment and for certain periods following termination of employment. Certain officers’ employment agreements also contain provisions on non-competition and non-solicitation, as well as proprietary information and inventions assignment.
We have entered into indemnification agreements with each of our directors. Under these agreements, we agree to indemnify each director against certain liabilities and expenses incurred by such persons in connection with claims made by reason of their being a director of the Company.
Share Incentive Plan
Brilliant Fashion Incentive Award Plan
In December 2021, we adopted a share economic beneficial interest right scheme that modifies all RSUs granted under the RSU Scheme into share economic beneficial interest rights under the share economic beneficial interest rights scheme (the “SEBIRs scheme” or “BF Plan”) administered by Brilliant Fashion Holdings Limited (“BF”), which has been established for the BF Plan. The BF Plan seeks to modify the RSU scheme originally adopted by FFG in 2020, which demonstrates our intention to attract the best available personnel and to provide additional incentives to employees, directors and consultants to us. The BF Plan provides for the issuance of up to an aggregate of 32,129,493 class B ordinary shares with the par value of $1.00 in BF (“BF Shares”), which corresponds to the economic interests in 8,651,247 Ordinary Shares (the “Awards”), by virtue of BF’s shareholding in our Company. The BF Plan allows us to grant Awards and options to purchase Awards to persons including our employees, non-employee directors and consultants. As of the date of this annual report, Awards and options to purchase Awards that tie to the economic beneficiary interests in relation to 6,344,078 Ordinary Shares are outstanding, of which Awards and options to purchase Awards that tie to the economic beneficiary interests in relation to 1,861,019 Ordinary Shares are held by our current executive officers and directors as a group.
Plan Administration. The BF Plan is administered by the board of directors of BF from time to time.
Eligibility. Employees, directors and consultants of BF and its Related Entities. A “Related Entity” for the purpose of this clause includes any parent or subsidiary of BF and Lanvin Group and any business, corporation, partnership, limited liability company or other entity in which (i) BF, (ii) Lanvin Group or (iii) a parent or subsidiary of BF or Lanvin Group holds a substantial ownership interest, directly or indirectly.
123
Table of Contents
Participation. Participants of the BF Plan will be offered the Awards under an Award Agreement, with such terms and conditions of each Award including, but not limited to, repurchase provisions, termination provisions, form of payment (cash or other consideration) upon settlement of the Award, payment contingencies, and satisfaction of any performance criteria as may be determined by the administrator of the BF Plan.
Transferability. Subject always to applicable laws, Awards shall be transferable (i) by will and by the laws of descent and distribution and (ii) during the lifetime of the participant, to the extent and in the manner as set forth in the Award Agreement or otherwise authorized by the administrator, in accordance with the terms and conditions of the BF Plan and the respective Award Agreement.
Certain transactions. In the event of certain transactions or events affecting our shares, we or our respective successor entities, such as a “Corporate Transaction,” including (as determined by the board of directors of BF acting reasonably) (i) a merger or consolidation in which we are not the surviving entity; (ii) the sale, transfer of other disposition of all or substantially all of our assets; (iii) the completion liquidation or dissolution of us; (iv) certain reserve merger involving us; or (v) certain acquisitions by any person or related group of persons of beneficial ownership of securities possessing more than fifty percent (50%) of the total combined voting power of our outstanding securities, the outstanding Awards may automatically become fully vested and exercisable.
Plan amendment termination. The board of BF may amend, suspend or terminate the BF Plan at any time, subject to shareholders’ approval (if so required under applicable laws). The BF Plan will terminate on the tenth anniversary of the later of: (i) its effective date; and (ii) the date when the board of BF approved the most recent increase in the number of BF Shares subject to the BF Plan.
The following table summarizes, as of the date of this annual report, the number of ordinary shares underlying the outstanding Awards and options to purchase Awards we have granted to our directors and executive officers:
| Ordinary Shares Underlying Awards / Options to Purchase Awards |
Exercise Price (€/Share) |
Date of Grant(l) | Date of Expiration | |||||||||||||
| Executive Officers | ||||||||||||||||
| Kat Yu David, Chan |
* | (1) | 3.71 and 7.58 | December 7, 2021 | September 23, 2029 and 2031 | |||||||||||
| * | (2) | — | December 7, 2021 | — | ||||||||||||
| Tong “Max” Chen |
* | (2) | — | April 1, 2023 | — | |||||||||||
| Jennifer Fleiss |
* | (2) | — | April 1, 2023 | — | |||||||||||
| Jurjan Wouda Kuipers |
* | (2) | — | April 1, 2023 | — | |||||||||||
| Ceci Kurzman |
* | (2) | — | April 1, 2023 | — | |||||||||||
| Gong Cheng |
* | (1) | 3.71 and 7.58 | December 7, 2021 | September 23, 2029 and 2031 | |||||||||||
| * | (2) | — | December 7, 2021 | — | ||||||||||||
| Xiaojing Grace Zhao(3) |
* | (1) | 7.58 | December 7, 2021 | November 26, 2029 | |||||||||||
| Shang Hsiu Koo(4) |
* | (1) | 7.58 | December 7, 2021 | October 8, 2031 | |||||||||||
| Yun Cheng(5) |
2,204,658 | (1) | 3.71 and 7.58 | December 7, 2021 | September 23, 2029 and 2031 | |||||||||||
| * | (2) | — | December 7, 2021 | — | ||||||||||||
| * | Less than 1% of our total outstanding shares. |
| (1) | Represents options to purchase Awards. |
| (2) | Represents Awards. |
| (3) | Ms. Zhao was the Executive President and Co-COO of Lanvin Group since 2020. For personal reasons, she transferred to a new role within Fosun Group in the function of Business Development in March 2023. Ms. Zhao’s transfer did not result from any dispute or disagreement with our Company or our board of directors regarding our practices, policies, or otherwise. Vested Awards as of the date of her transfer were retained by Ms. Zhao, and unvested Awards as of the same date were forfeited and canceled. |
124
Table of Contents
| (4) | Mr. Koo was the Chief Financial Officer of Lanvin Group from October 2021 until his resignation in January 2023. Mr. Koo’s resignation did not result from any dispute or disagreement with our Company or our board of directors regarding our practices, policies, or otherwise. Vested Awards as of the date of his resignation were retained by Mr. Koo, and unvested Awards as of the same date were forfeited and canceled. |
| (5) | Ms. Cheng was the Chief Executive Officer of Lanvin Group since our inception until her resignation in December 2023. Ms. Cheng’s resignation did not result from any dispute or disagreement with our Company or our board of directors regarding our practices, policies, or otherwise. Vested Awards as of the date of her resignation were retained by Ms. Cheng, and unvested Awards as of the same date were forfeited and canceled. |
Clawback Policy
In 2023, we implemented a Clawback Policy to adhere to SEC rules and New York Stock Exchange listing criteria. This policy enables us to reclaim any surplus incentive-based compensation from both current and former executive officers subsequent to an accounting restatement.
| C. | Board Practices |
Board of Directors
Our board of directors consists of eight directors as of the date of this annual report. Of these eight directors, four are independent. These four independent directors were selected and approved by our board of directors through a process that sought to find diversity of experience, expertise and perspectives, as well as deep understandings of different businesses, practices and markets relevant to our operations. We may by a resolution of the directors from time to time fix the maximum and minimum number of directors to be appointed, but unless such numbers are fixed as aforesaid, our board of directors shall consist of not less than one director and there shall be no maximum number of directors. A director may vote in respect of any contract or transaction in which he/she is interested provided that the nature of the interest of any director in any such contract or transaction is disclosed at or prior to its consideration and any vote thereon, and such director may be counted in the quorum at any meeting of directors at which any such contract or transaction is considered. A director who is interested in a contract or proposed contract with us must declare the nature of his interest at a meeting of the directors. No nonemployee director has a service contract with us that provides for benefits upon termination of service.
Duties of Directors
Under Cayman Islands law, our directors owe fiduciary duties us, including a duty of loyalty, a duty to act honestly, and a duty to act in what they consider in good faith to be in the best interests of the Company. Our directors also have a duty to exercise their powers only for a proper purpose, a duty to avoid conflicts of interest and of duty, a duty to disclose personal interest in contracts involving us, a duty not to make secret profits from the directors’ office and a duty to act with skill, care and diligence. It was previously considered that a director need not exhibit in the performance of his or her duties a greater degree of skill than may reasonably be expected from a person of his or her knowledge and experience. However, English and Commonwealth courts have moved towards an objective standard with regard to the required skill and care and these authorities are likely to be followed in the Cayman Islands. In fulfilling their duty of care to us, our directors must ensure compliance with our memorandum and articles of association, as amended and restated from time to time, and the rights vested thereunder in the holders of the shares. We have the right to seek damages if a duty owed by our directors is breached. In certain limited exceptional circumstances, one or more shareholders may have the right to seek damages in our name if a duty owed by our directors is breached.
Terms of Directors and Executive Officers
A director shall hold office until such time as he or she is removed from office by ordinary resolution or in accordance with the Amended Articles.
Our officers are elected by, and serve at the discretion of, the board of directors.
125
Table of Contents
Board Committees
Our board of directors has an audit committee, a compensation committee and a nominating and corporate governance committee. Each committee’s members and functions are described below.
Audit Committee
The audit committee consists of Jurjan Wouda Kuipers, Ceci Kurzman and Mitchell Alan Garber. Mr. Kuipers is the chairperson of the audit committee. Mr. Kuipers satisfies the criteria of an audit committee financial expert as set forth under the applicable rules of the SEC. Each of Mr. Garber, Ms. Kurzman and Mr. Kuipers satisfies the requirements for an “independent director” within the meaning of the NYSE listing rules and the criteria for independence set forth in Rule 10A-3 of the Exchange Act and is financially literate.
The audit committee oversees our accounting and financial reporting processes. The audit committee is responsible for, among other things:
| • | overseeing the relationship with our independent auditors, including: |
| • | appointing, retaining and determining the compensation of our independent auditors; |
| • | approving auditing and pre-approving non-auditing services permitted to be performed by the independent auditors; |
| • | discussing with the independent auditors the overall scope and plans for their audits and other financial reviews; |
| • | reviewing a least annually the qualifications, performance and independence of the independent auditors; |
| • | reviewing reports from the independent auditors regarding all critical accounting policies and practices to be used by us and all other material written communications between the independent auditors and management; |
| • | reviewing and resolving any disagreements between management and the independent auditors regarding financial controls or financial reporting; |
| • | overseeing the internal audit function, including conducting an annual appraisal of the internal audit function, reviewing and discussing with management the appointment of the head of internal audit, at least quarterly meetings between the chairperson of the audit committee and the head of internal audit, reviewing any significant issues raised in reports to management by internal audit and ensuring that there are no unjustified restrictions or limitations on the internal audit function and that it has sufficient resources; |
| • | reviewing and recommending all related party transactions to our board of directors for approval, and reviewing and approving all changes to our related party transactions policy; |
| • | reviewing and discussing with management the annual audited financial statements and the design, implementation, adequacy and effectiveness of our internal controls; |
| • | overseeing risks and exposure associated with financial matters; and |
| • | establishing and overseeing procedures for the receipt, retention and treatment of complaints received from our employees regarding accounting, internal accounting controls or audit matters and the confidential, anonymous submission by our employees of concerns regarding questionable accounting, auditing and internal control matters. |
126
Table of Contents
Compensation Committee
The compensation committee consists of Mitchell Alan Garber, Jennifer Fleiss, Weijin Fang and Tong “Max” Chen. Mr. Garber is the chairperson of the compensation committee. Each of Ms. Fleiss and Mr. Garber satisfies the requirements for an “independent director” within the meaning of the NYSE listing rules.
The compensation committee is responsible for, among other things:
| • | reviewing at least annually the goals and objectives of our executive compensation plans, and amending, or recommending that our board of directors amend, these goals and objectives if the committee deems it appropriate; |
| • | reviewing at least annually our executive compensation plans in light of our goals and objectives with respect to such plans, and, if the committee deems it appropriate, adopting, or recommending to our board of directors the adoption of, new, or the amendment of existing, executive compensation plans; |
| • | evaluating at least annually the performance of our executive officers in light of the goals and objectives of our compensation plans, and determining and approving the compensation of such executive officers; |
| • | evaluating annually the appropriate level of compensation for our board of directors and committee service by non-employee directors; |
| • | reviewing and approving any severance or termination arrangements to be made with any executive officer of us; |
| • | reviewing perquisites or other personal benefits to our executive officers and directors and recommend any changes to our board of directors; and |
| • | administering our equity plans. |
Nomination Committee and Corporate Governance Committee
The nominating and corporate governance committee consists of Zhen Huang, Ceci Kurzman, Jennifer Fleiss and Tong “Max” Chen. Mr. Huang is the chairperson of the nominating and corporate governance committee. Each of Ms. Kurzman and Ms. Fleiss satisfy the requirements for an “independent director” within the meaning of the NYSE listing rules.
The nominating and corporate governance committee assists the board of directors in evaluating nominees other than the existing directors to the board of directors and its committees. In addition, the nominating and corporate governance committee is responsible for, among other things:
| • | reviewing annually with the board of directors the characteristics such as knowledge, skills, qualifications, experience and diversity of directors other than the existing directors; |
| • | overseeing our environmental, social and governance risks, strategies, policies, programs and practices to further our business purpose, strategy, culture, values and reputation; |
| • | overseeing director training and development programs; and |
| • | advising the board of directors periodically with regards to significant developments in the law and practice of corporate governance as well as compliance with applicable laws and regulations, and making recommendations to the board of directors on all matters of corporate governance and on any remedial action to be taken. |
127
Table of Contents
Foreign Private Issuer Status
We are a Cayman Islands exempted company incorporated in 2021 with limited liabilities. We report under the Exchange Act as a non-U.S. company with foreign private issuer status. Under Rule 405 of the Securities Act, the determination of foreign private issuer status is made annually on the last business day of an issuer’s most recently completed second fiscal quarter and, accordingly, the next determination will be made with respect to us on June 30, 2024. For so long as we qualify as a foreign private issuer, we will be exempt from certain provisions of the Exchange Act that are applicable to U.S. domestic public companies, including:
| • | the rules under the Exchange Act requiring the filing of quarterly reports on Form 10-Q or current reports on Form 8-K with the SEC; |
| • | the sections of the Exchange Act regulating the solicitation of proxies, consents, or authorizations in respect of a security registered under the Exchange Act; |
| • | the sections of the Exchange Act requiring insiders to file public reports of their share ownership and trading activities and liability for insiders who profit from trades made in a short period of time; and |
| • | the selective disclosure rules by issuers of material nonpublic information under Regulation Fair Disclosure, or Regulation FD, which regulates selective disclosure of material non-public information by issuers. |
We are required to file an annual report on Form 20-F within four months of the end of each fiscal year. In addition, we intend to publish our results on a half-year basis through press releases, distributed pursuant to the rules and regulations of the NYSE. Press releases relating to financial results and material events will also be furnished to the SEC on Form 6-K. However, the information we are required to file with or furnish to the SEC will be less extensive and less timely compared to that required to be filed with the SEC by U.S. domestic issuers. Accordingly, our shareholders will receive less or different information about us than a shareholder of a U.S. domestic public company would receive.
We are a non-U.S. company with foreign private issuer status and are listed on the NYSE. NYSE market rules permit a foreign private issuer like us to follow the corporate governance practices of our home country. Certain corporate governance practices in the Cayman Islands, our home country, may differ significantly from NYSE corporate governance listing standards Among other things, we are not required to have:
| • | a majority of the board of directors consist of independent directors; |
| • | a compensation committee consisting of independent directors; |
| • | a nominating and corporate governance committee consisting of independent directors; or |
| • | regularly scheduled executive sessions with only independent directors each year. |
We intend to rely on the exemptions listed above. As a result, you may not be provided with the benefits of certain corporate governance requirements of the NYSE applicable to U.S. domestic public companies.
Diversity and Inclusion Policy
We have adopted a Diversity and Inclusion Policy intended to achieve our diversity goals through regular review and monitoring. As an international organization across various continents, we are mindful of the different market practices that apply in the countries in which will operate and recognizes the importance of ethnic and cultural diversity in our management and workforce. We recognize that each individual is unique, and diversity encompasses many dimensions. As such, we recognize all types of diversity under the policy. The policy applies to all directors, officers, employees and extended workforce, including our directors and executive officers.
128
Table of Contents
| D. | Employees |
See “Item 4. Information on the Company—B. Business Overview—Employees.”
| E. | Share Ownership |
The following table sets forth information as of April 21, 2024 with respect to the beneficial ownership of our Ordinary Shares by:
| • | each person who beneficially owns 5.0% or more of the issued and outstanding Ordinary Shares; |
| • | each person who is an executive officer or director; and |
| • | all executive officers and directors as a group. |
Beneficial ownership is determined in accordance with the rules of the SEC and includes voting or investment power with respect to, or the power to receive the economic benefit of ownership of, the securities. In computing the number of shares beneficially owned by a person and the percentage ownership of that person, shares that the person has the right to acquire within 60 days are included, including through the exercise of any option or other right or the conversion of any other security. Such securities, however, are deemed to be outstanding only for the purpose of computing the percentage beneficial ownership of that person but are not deemed to be outstanding for the purpose of computing the percentage beneficial ownership of any other person. Under these rules, more than one person may be deemed to be a beneficial owner of the same securities.
The percentage of our Ordinary Shares beneficially owned is computed on the basis of 145,021,452 Ordinary Shares issued and outstanding as of the date of April 21, 2024, which does not reflect our repurchase of 1,328,704 Ordinary Shares from Meritz on April 30, 2024 pursuant to a side letter between us and Meritz.
Unless otherwise indicated, we believe that all persons named in the table below have sole voting and investment power with respect to all Ordinary Shares beneficially owned by them.
| Name of Beneficial Owner |
Ordinary Shares | % of Total Ordinary Shares / Voting Power |
||||||
| Principal Shareholders |
||||||||
| Fosun International Limited(1) |
85,054,571 | 58.65% | ||||||
| Fosun Fashion Holdings (Cayman) Limited(1) |
22,311,415 | 15.38% | ||||||
| Meritz(2) |
19,050,381 | 13.14% | ||||||
| Primavera Capital Acquisition LLC(3) |
15,280,000 | 10.5% | ||||||
| Brilliant Fashion Holdings Limited(4) |
8,651,247 | 6.0% | ||||||
| Natixis(5) |
7,919,466 | 5.5% | ||||||
| Directors and Executive Officers(6) |
— | — | ||||||
| Zhen Huang |
— | — | ||||||
| Tong “Max” Chen |
— | — | ||||||
| Weijin Fang(4) |
8,651,247 | 6.0% | ||||||
| Chao Zou |
— | — | ||||||
| Mitchell Alan Garber(7) |
* | * | ||||||
| Jennifer Fleiss(8) |
* | * | ||||||
| Juljan Wouda Kuipers(8) |
* | * | ||||||
| Ceci Kurzman(8) |
* | * | ||||||
| Eric Chan |
— | — | ||||||
| Kat Yu David Chan(8) |
* | * | ||||||
| Gong Cheng(8) |
* | * | ||||||
| All directors and executive officers as a group (11 individuals) |
9,073,159 | 6.3% | ||||||
| (1) | Based solely upon information contained in the most recent filed Schedule 13D/A of Fosun International Limited, filed with the SEC on April 9, 2024, reflecting beneficial ownership as of April 5, 2024. According to this Schedule 13D/A, the aggregate amount of 85,054,571 Ordinary Shares beneficially owned by Fosun International Limited included (i) 22,311,415 Ordinary Shares held by Fosun Fashion Holdings (Cayman) Limited and (ii) 6,071,591 Ordinary Shares held by Yujing Fashion (BVI) Limited. Fosun Fashion Holdings (Cayman) Limited is wholly-owned by Fosun International Limited (HKSE Stock Code: 0656). Yujing Fashion (BVI) Limited is wholly-owned by Yu Jing Industrial Limited, which is in turn wholly-owned by Shanghai Yuyuan Tourist Mart (Group) Co., Ltd (SSE Stock Code: 600655). Shanghai Yuyuan Tourist Mart (Group) Co., Ltd (SSE Stock Code: 600655) is majority-owned by Fosun International Limited (HKSE Stock Code: 0656) indirectly through a number of intermediate subsidiaries. The business address of Fosun Fashion Holdings (Cayman) Limited is 4F, 168 Jiujiang Road, Carlowitz & Co, Huangpu District Shanghai, 200001, China. The business address of Yujing Fashion (BVI) Limited is Fuxing Rd East 2, Shanghai, 200010, China. |
129
Table of Contents
| (2) | Based solely upon information contained in the most recent filed Schedule 13G of Meritz Securities Co., Ltd., filed with the SEC on January 3, 2024, reflecting beneficial ownership as of December 31, 2023. According to this Schedule 13G, Meritz had sole dispositive voting power for 19,050,381 Ordinary Shares. The share number does not reflect our repurchase of 1,328,704 Ordinary Shares from Meritz on April 30, 2024 pursuant to a side letter between us and Meritz. |
| (3) | Based solely upon information contained in the most recent filed Schedule 13G of the Primavera Capital Acquisitions LLC, filed with the SEC on February 14, 2023, reflecting beneficial ownership as of December 31, 2022. According to this schedule 13G, it represented the number of Ordinary Shares beneficially owned by Primavera Capital Acquisition LLC (the “Sponsor”), consisting of (i) 5,000,000 Ordinary Shares held by the Sponsor, and (ii) 10,280,000 Ordinary Shares issuable upon the exercise of 10,280,000 Private Placement Warrants. The business address of the Sponsor is 41/F Gloucester Tower, 15 Queen’s Road Central, Hong Kong. Fred Hu is the sole manager of the Sponsor and has voting and investment discretion with respect to the Ordinary Shares held of record by the Sponsor. Accordingly, all of the Ordinary Shares held by the Sponsor may be deemed to be beneficially held by Fred Hu. |
| (4) | Based solely upon information contained in the most recent filed Schedule 13G/A of the Brilliant Fashion Holdings Limited, filed with the SEC on February 14, 2023, reflecting beneficial ownership as of December 31, 2023. According to this Schedule 13G/A, it represented 8,651,247 Ordinary Shares held by Brilliant Fashion Holdings Limited, which is the settlor of our employee incentive award plan trust with Futu Trustee Limited as the trustee. See the section titled “Item 6. Directors, Senior Management and Employees—B. Compensation—Share Incentive Plan.” As the sole director of Brilliant Fashion Holdings Limited, Weijin Fang is the administrator of the Issuer’s employee incentive award plan. Therefore, Weijin Fang has voting power and dispositive power over Ordinary Shares held by Brilliant Fashion Holdings Limited and may be deemed the beneficial owner of such Ordinary Shares. |
| (5) | In respect of the 7,919,466 Ordinary Shares held by Natixis, Fosun International Limited entered into a financing total return swap (“TRS”) with Natixis, as evidenced by a Confirmation dated as of September 16, 2019 and governed by an ISDA Master Agreement dated as of September 12, 2017 between Natixis and Fosun International Limited, as such confirmation or agreement (as the case may be) may be amended and supplemented from time to time, pursuant to which, among other things, Natixis passed through to Fosun International Limited the full economic exposure to LGHL after the Merger Effective Time (as defined within the TRS). |
| (6) | The business address of each of the directors and executive officers of the Company is 4F, 168 Jiujiang Road, Carlowitz & Co, Huangpu District Shanghai, 200001, China. |
| (7) | Represents (i) 421,912 Ordinary Shares held by Stephenson Management Inc., a holding company wholly-owned by Mitchell Alan Garber and his spouse Anne-Marie Boucher, and (ii) certain Ordinary Shares held by Brilliant Fashion Holdings Limited over which Mitchell Alan Garber has dispositive power due to his right to receive within 60 days after April 21, 2024 the economic beneficiary interest corresponding to such number of Ordinary Shares pursuant to our employee incentive award plan. The business address of Stephenson Management Inc. is 2200 Stanley Street, Montreal, Quebec H3A1R6, Canada. |
| (8) | Represents Ordinary Shares held by Brilliant Fashion Holdings Limited over which such person has dispositive power due to such person’s right to receive within 60 days after April 21, 2024 the economic beneficiary interest corresponding to such number of Ordinary Shares pursuant to our employee incentive award plan. |
| * | Less than 1% of the total number of issued and outstanding Ordinary Shares. |
We are not aware of any arrangement that may, at a subsequent date, result in a change of control of our Company.
According to our transfer agent, as of April 21, 2024, there were three record holders in the United States (including Cede & Co., the nominee of the Depositary Trust Company, holding approximately 44.7% of our outstanding Ordinary Shares) holding a total of 64,926,808 Ordinary Shares, representing approximately 44.8% of our total outstanding shares. The number of record holders in the United States is not representative of the number of beneficial holders nor is it representative of where such beneficial holders are resident since some of these Ordinary Shares are held by brokers or other nominees.
| F. | Disclosure of A Registrant’s Action to Recover Erroneously Awarded Compensation |
Not applicable.
130
Table of Contents
| ITEM 7. | MAJOR SHAREHOLDERS AND RELATED PARTY TRANSACTIONS |
| A. | Major Shareholders |
See “Item 6. Directors, Senior Management and Employees—E. Share Ownership.”
| B. | Related Party Transactions |
Founder Shares
In July 2020, PCAC initial shareholders paid $25,000 to cover certain of its offering and formation costs in exchange for 8,625,000 founder shares (after giving effect to a share recapitalization), which founder shares were transferred to the Sponsor on August 24, 2020. On August 24, 2020, the Sponsor then transferred 215,625 founder shares to Chenling Zhang for an aggregate purchase price of $625, or approximately $0.003 per share. On September 21, 2020, PCAC effected a share capitalization, pursuant to which an additional 2,000,000 founder shares were issued for no consideration, resulting in there being 10,625,000 founder shares outstanding. Following a share capitalization on September 21, 2020 and Chenling Zhang’s waiver of her right to receive shares under such capitalization, the Sponsor held an aggregate of 10,409,375 founder shares and then, on January 5, 2021, in connection with entering into certain forward purchase agreements, transferred to Sky Venture Partners L.P. (“Sky Venture”) and Aspex an aggregate of 1,000,000 founder shares for no cash consideration. On December 30, 2020, the Sponsor then transferred including 40,000 founder shares to Muktesh Pant, 40,000 founder Shares to Teresa Teague and 40,000 founder shares to Sonia Cheng, each being a director of PCAC, for an aggregate purchase price of $120, $120 and $120, respectively, or approximately $0.003 per share. On January 21, 2021, PCAC effected a share capitalization pursuant to which 1,725,000 founder shares were issued, resulting in 12,350,000 founder shares outstanding, of which 11,014,375 founder shares are held by the Sponsor.
Sponsor Support Deed
Concurrently with the execution of the Business Combination Agreement, PCAC, the Company, the Sponsor, other holders of founder shares and FFG entered into a sponsor support deed (the “Sponsor Support Deed”), pursuant to which the Sponsor and such other holders of founder shares agreed to, among other things, (i) vote all of their ordinary shares and preferred shares of PCAC held of record or thereafter acquired in favor of the Business Combination Agreement and the transactions contemplated thereby, (ii) be bound by certain covenants and agreements in the Business Combination Agreement, including non-solicitation and (iii) be bound by certain transfer restrictions with respect to their shares of PCAC, in each case, on the terms and subject to the conditions set forth in the Sponsor Support Deed, and pursuant to which the Sponsor also agreed to, immediately prior to the consummation of the Initial Merger, irrevocably forfeit and surrender certain Class B ordinary shares of PCAC to PCAC for nil consideration. On October 28, 2022 and in connection with the execution of Amendment No. 3 to the Business Combination Agreement, parties to the Sponsor Support Deed entered into amendment No. 1 to the Sponsor Support Deed, pursuant to which the Sponsor was no longer required to surrender any Class B ordinary shares of PCAC. On December 2, 2022 and in connection with the execution of Amendment No. 4 to the Business Combination Agreement, the Sponsor entered into a letter agreement with PCAC and us, among other parties, pursuant to which the Sponsor irrevocably surrendered, immediately prior to the closing of the Business Combination, 6,014,375 Class B ordinary shares of PCAC to PCAC for nil consideration, which shares were canceled by PCAC immediately upon the surrender thereof, such that after giving effect to the share surrender, the number of Class B ordinary shares of PCAC held by the Sponsor was reduced to 5,000,000. We issued 5,000,000 Ordinary Shares in exchange for the 5,000,000 founder shares held by the Sponsor.
Sponsor Private Placement Warrants
The Sponsor purchased an aggregate of 10,280,000 private placement warrants of PCAC, each exercisable to purchase one PCAC Class A ordinary share at $11.50 per share, at a price of $1.00 per warrant, or $10,280,000 in the aggregate, in a private placement that closed simultaneously with the closing of PCAC’s initial public offering. Upon the consummation of the Business Combination, each PCAC warrant outstanding immediately prior to the Business Combination was assumed by us and converted into our Warrant.
131
Table of Contents
Forward Purchase Agreements
Prior to its initial public offering, PCAC entered into a forward purchase agreement with each of Sky Venture and Aspex, pursuant to which each of Sky Venture and Aspex committed to subscribe for and purchase 4,000,000 PCAC Class A ordinary shares, plus 1,000,000 PCAC warrants, or the forward purchase units, for an aggregate purchase price equal to $40 million immediately prior to the Initial Merger Effective Time. In connection with these forward purchase agreements, the Sponsor transferred to each of Sky Venture and Aspex 500,000 founder shares for no cash consideration. Sky Venture subsequently defaulted on its obligations under its forward purchase agreement to purchase the forward purchase units at the agreed time and PCAC canceled the 500,000 founder shares held by Sky Venture.
The founder shares transferred to Aspex were subject to similar contractual conditions and restrictions as the founder shares issued to the Sponsor. The forward purchase warrants had the same terms as PCAC’s public warrants. The forward purchase agreement also provides that Aspex is entitled to registration rights with respect to its (A) forward purchase securities and PCAC Class A ordinary shares underlying the forward purchase warrants and founder shares, and (B) any other PCAC Class A ordinary shares or warrants acquired by Aspex, including any time after consummation of the Business Combination.
In connection with the closing of the Business Combination, we issued 4,500,000 Ordinary Shares in exchange for (i) the 4,000,000 PCAC Class A ordinary shares and (ii) 500,000 founder shares held by Aspex.
Working Capital Loan
Since PCAC’s inception, the Sponsor made working capital loans from time to time to PCAC to fund certain of PCAC’s capital requirements. On July 17, 2020, PCAC issued an unsecured and non-interest-bearing promissory note to an affiliate of the Sponsor, which was assigned to the Sponsor on August 24, 2020, pursuant to which PCAC could borrow up to an aggregate principal amount of $250,000. As of September 30, 2022, PCAC borrowed an aggregate of $198,819 pursuant to the promissory note, of which $191,819 was repaid on January 26, 2021, at the closing of PCAC’s initial public offering, and $7,000 was repaid on December 14, 2022.
Additionally, on January 28, 2022, PCAC issued an unsecured and non-interest-bearing promissory note in the amount of up to $500,000 to the Sponsor, pursuant to which, PCAC borrowed an aggregate of $500,000 as of September 30, 2022. Pursuant to a letter agreement dated December 2, 2022, the Sponsor waived the repayment of the principal balance of $500,000 under such promissory note.
Expense Reimbursement and Other Fee Agreements
PCAC has entered into a fee agreement with Ms. Chenling Zhang pursuant to which, in consideration for her efforts as an independent director of PCAC and her expertise to source and/or evaluate potential acquisition targets, PCAC agreed to pay Ms. Zhang a fee in an aggregate amount of $250,000 upon the closing of the Business Combination. As of the date of this annual report, such fee has been paid in full to Ms. Zhang.
In addition, PCAC entered into an administrative services agreement, pursuant to which PCAC was obligated to pay the Sponsor up to $10,000 per month for office space, utilities, secretarial and administrative support services provided to members of its management team, which obligations ceased upon completion of the Business Combination. For the period from January 21, 2021 through December 31, 2021 and the nine months ended September 30, 2022, PCAC incurred $110,000 and $90,000 in fees for these services, respectively. Pursuant to a letter agreement dated September 29, 2022, the Sponsor waived its right to be reimbursed for the foregoing expenses under such administrative services agreement. As of December 31, 2021 and September 30, 2022, the amount of such fees due to the Sponsor were $110,000 and nil, respectively.
132
Table of Contents
Business Combination
On March 23, 2022, we entered into the Business Combination Agreement, by and among LGHL, PCAC, FFG, Merger Sub 1 and Merger Sub 2, which was subsequently amended on October 17, 2022, October 20, 2022, October 28, 2022 and December 2, 2022. Pursuant to the Business Combination Agreement, (i) PCAC merged with and into Merger Sub 1, with Merger Sub 1 surviving and remaining as a wholly-owned subsidiary of LGHL, (ii) following the Initial Merger, Merger Sub 2 merged with and into FFG, with FFG being the surviving entity and becoming a wholly-owned subsidiary of LGHL, and (iii) subsequently, Merger Sub 1 as the surviving company of the Initial Merger merged with and into FFG as the surviving company of the Second Merger, with FFG surviving such merger.
As part of the Business Combination: (i) each of PCAC units (each consisting of one PCAC Class A ordinary share and one-half of one redeemable PCAC warrant) outstanding immediately prior to the Initial Merger Effective Time (to the extent not already separated) was separated into one PCAC Class A ordinary shares and one-half of one PCAC warrant; (ii) immediately following the separation of each PCAC units, each (x) PCAC Class A ordinary share and (y) PCAC Class B ordinary shares, issued and outstanding immediately prior to the Initial Merger Effective Time was canceled in exchange for the right to receive one Ordinary Share; (iii) each PCAC warrant outstanding immediately prior to the Initial Merger Effective Time was assumed by us and converted into one Warrant, subject to substantially the same terms and conditions as were applicable to such PCAC warrant immediately prior to the Initial Merger Effective Time; (iv) each ordinary share, non-voting ordinary share and preferred share in FFG held by the shareholders of FFG issued and outstanding immediately prior to the effective time of the Second Merger (excluding the FFG Collateral Share) was canceled in exchange for the right to receive such number of newly issued Ordinary Shares that is equal to the quotient obtained by dividing $2.6926188 by $10.00 (subject to rounding); and (v) the FFG Collateral Share was canceled in exchange for the right to receive one Convertible Preference Share.
Concurrently with the execution of the Business Combination Agreement, LGHL, PCAC and certain investors (the “Initial PIPE Investors”), including Fosun Fashion Holdings (Cayman) Limited, a majority shareholder of FFG, entered into the initial subscription agreements (as restated and amended from time to time (including the amended and restated subscription agreement entered into on October 28, 2022), the “Initial PIPE Subscription Agreements”), pursuant to which the Initial PIPE Investors committed to subscribe for and purchase, in the aggregate, 5,000,000 Ordinary Shares for $10.00 per share for an aggregate purchase price equal to $50 million. Fosun Fashion Holdings (Cayman) Limited initially agreed to subscribe for and purchase 3,800,000 Ordinary Shares for an aggregate purchase price of $38 million. Subsequently, on October 28, 2022, LGHL, PCAC, Fosun Fashion Holdings (Cayman) Limited, FFG and Fosun International entered into an amended and restated subscription agreement, pursuant to which the number of Ordinary Shares to be purchased by Fosun Fashion Holdings (Cayman) Limited was increased to 13,327,225, upsizing the PIPE subscription investment of Fosun Fashion Holdings (Cayman) Limited to approximately $133 million. The subscription commitment of $125 million from Fosun Fashion Holdings (Cayman) Limited was effected by way of re-investment of all of the repayment proceeds of certain existing shareholder loans that were borrowed by FFG from Fosun International for working capital purposes. On December 5, 2022, LGHL, PCAC and Handsome Corporation (the “Additional PIPE Investor,” and together with the Initial PIPE Investors, the “PIPE Investors”) entered into a subscription agreement (the “Additional PIPE Subscription Agreement,” and together with the Initial PIPE Subscription Agreements, the “PIPE Subscription Agreements”), pursuant to which the Additional PIPE Investor committed to subscribe for and purchase, in the aggregate, 800,000 Ordinary Shares for $10.00 per share for an aggregate purchase price equal to $8 million.
In addition, around the time of PCAC’s initial public offering, PCAC entered into a forward purchase agreement with each of Sky Venture and Aspex, pursuant to which each of Sky Venture and Aspex committed to subscribe for and purchase 4,000,000 PCAC Class A ordinary shares, plus 1,000,000 PCAC warrants, or the forward purchase units, for an aggregate purchase price equal to $40 million immediately prior to the Initial Merger Effective Time. In connection with these forward purchase agreements, the Sponsor transferred to each of Sky Venture and Aspex 500,000 PCAC Class B ordinary shares for no cash consideration. Sky Venture subsequently defaulted on its obligations under its forward purchase agreement to purchase the forward purchase units at the agreed time and PCAC canceled the 500,000 PCAC Class B ordinary shares held by Sky Venture.
The Business Combination was consummated on December 14, 2022. The transaction was unanimously approved by PCAC’s board of directors and was approved at the extraordinary general meeting of PCAC’s shareholders held on December 9, 2022, or the extraordinary general meeting. PCAC’s shareholders also voted to approve all other proposals presented at the extraordinary general meeting. As a result of the Business Combination, PCAC has ceased to exist and the surviving company from the Mergers has become a wholly-owned subsidiary of the Company.
133
Table of Contents
PIPE Subscription Agreements
Concurrently with the execution of the Business Combination Agreement, PCAC, the Company and the Initial PIPE Investors entered into the Initial PIPE Subscription Agreements pursuant to which the Initial PIPE Investors agreed to subscribe for, in the aggregate, 5,000,000 Ordinary Shares for $10.00 per share for an aggregate purchase price equal to $50 million. Pursuant to the Initial PIPE Subscription Agreements, Fosun Fashion Holdings (Cayman) Limited agreed to subscribe for 3,800,000 Ordinary Shares for an aggregate purchase price of $38 million. Subsequently, on October 28, 2022, PCAC, the Company, Fosun Fashion Holdings (Cayman) Limited, FFG and Fosun International entered into an amended and restated subscription agreement, pursuant to which Fosun Fashion Holdings (Cayman) Limited agreed to subscribe for a total of 13,327,225 Ordinary Shares at a price of $10.00 per share, upsizing its PIPE subscription investment by approximately $95 million, from $38 million to approximately $133 million. The subscription commitment of $125 million from Fosun Fashion Holdings (Cayman) Limited was effected by way of re-investment of all of the repayment proceeds of certain existing shareholder loans that were borrowed by us from Fosun International for working capital purposes. See “—Other Related Party Transactions—Shareholder Loans” below.
Lock-Up Agreements
Concurrently with the execution of the Business Combination Agreement, PCAC, the Company, a substantial number of FFG shareholders, the Sponsor and certain PCAC insiders holding founder shares entered into a lock-up agreement. Certain additional FFG shareholders subsequently entered into lock-up agreements with PCAC and FFG, on terms that are substantially the same as those applicable to the minority shareholders of FFG party to the initial lock-up agreement. Pursuant to these lock-up agreements, our securities (other than our Ordinary Shares acquired pursuant to the PIPE Subscription Agreements or in the public market) received by the Sponsor, certain PCAC insiders and such FFG shareholders in the Business Combination (relating to more than 94% of the outstanding shares of FFG prior to the closing of the Business Combination) were locked-up and subject to transfer restrictions for a period of time following the closing of the Business Combination subject to certain exceptions. As of December 14, 2023, all these lock-up agreements have expired.
FFG Shareholder Support Deed
Concurrently with the execution of the Business Combination Agreement, PCAC, the Company, FFG and a substantial number of FFG shareholders entered into a shareholder support deed (the “FFG Shareholder Support Deed”), pursuant to which such existing shareholders of FFG have agreed to, among other things, (i) vote all of their ordinary shares and preferred shares of FFG held of record or thereafter acquired in favor of the Business Combination Agreement and the transactions contemplated thereby, (ii) be bound by certain covenants and agreements in the Business Combination Agreement, including non-solicitation and (iii) be bound by certain transfer restrictions with respect to their shares of FFG, in each case on the terms and subject to the conditions set forth in the FFG Shareholder Support Deed, and pursuant to which Fosun Fashion Holdings (Cayman) Limited also agreed to, immediately prior to the consummation of the Second Merger, irrevocably forfeit and surrender certain ordinary shares of FFG to FFG for nil consideration. Certain additional FFG shareholders subsequently acceded to the deed. On October 28, 2022, PCAC, the Company, FFG and Fosun Fashion Holdings (Cayman) Limited entered into a letter agreement, pursuant to which Fosun Fashion Holdings (Cayman) Limited was no longer obligated to surrender any ordinary shares of FFG, notwithstanding the terms of the FFG Shareholder Support Deed.
Investor Rights Agreement
Concurrently with the execution of the Business Combination Agreement, LGHL, the Sponsor, PCAC, FFG and a substantial number of FFG shareholders entered into the Investor Rights Agreement, pursuant to which, among other things, (i) we agreed to register for resale, pursuant to Rule 415 under the Securities Act, within certain period after the closing date of our Business Combination, certain Ordinary Shares and other equity securities held by certain parties from time to time, (ii) the Sponsor and such existing shareholders of FFG were granted certain registration rights with respect to their respective Ordinary Shares, in each case, on the terms and subject to the conditions set forth in the Investor Rights Agreement, and (iii) we agreed that our board of directors shall initially consist of seven (7) directors, with the Sponsor having the right to appoint and remove one (1) individual to serve as a director and the remaining directors nominated by the nominating and corporate governance committee of our board of directors in consultation with the Sponsor and in accordance with the nominating and corporate governance committee’s policies and procedures. Certain additional existing shareholders of FFG subsequently acceded to the agreement.
134
Table of Contents
Warrant Assignment, Assumption and Amendment Agreement
Concurrently with the execution of the Business Combination Agreement, the Company, PCAC and Continental Stock Transfer & Trust Company entered into an amendment and restatement (the “Assignment, Assumption and Amendment Agreement”) of the Existing Warrant Agreement, pursuant to which, among other things, PCAC assigned all of its right, title and interest in the Existing Warrant Agreement to us effective upon the Closing, and we assumed the warrants provided for under the Existing Warrant Agreement.
Employment Agreements and Indemnification Agreements
See “Item 6. Directors, Senior Management and Employees—B. Compensation—Employment Agreements and Indemnification Agreements.”
Share Incentive Plan
See “Item 6. Directors, Senior Management and Employees—B. Compensation—Share Incentive Plan.”
Other Related Party Transactions
Shareholder Loans
We received certain unsecured shareholder loans for working capital purposes from our shareholder Fosun International and its subsidiaries, being Shanghai Fosun High Technology (Group) Co., Ltd. and Shanghai Fosun High Technology Group Finance Co., Ltd. Most of such shareholder loans have interest rates ranging from 6% to 10% per annum, with terms ranging from one to two years. As of December 31, 2021, 2022 and 2023, we had amounts due to Fosun International and its subsidiaries (excluding accrued interest) of €46.0 million, €14.1 million and €25.9 million.
On March 30, 2023, Jeanne Lanvin S.A. (“JLSA”) as the borrower, LGHL as the guarantor and our shareholder Meritz as the lender entered into a facility agreement, pursuant to which Meritz made available to JLSA a facility in the sum of JPY3,714.4 million (as novated, amended and restated by the novation, amendment and restatement agreement dated August 14, 2023 between Lanvin Hong Kong Limited as the new borrower, JLSA as the original borrower and new guarantor, LGHL as guarantor and Meritz as the lender, the “Facility”). JLSA used the Facility to buy back the Lanvin trademarks owned by ITOCHU Corporation (“Itochu”) according to the buy-back agreement entered into by and between JLSA and Itochu on May 21, 2021. The Facility has a term of three years and bears a fixed interest of 9.10% per annum. As of December 31, 2023, the amount owed to Meritz (excluding accrued interest) was €21.6 million. The Facility is mainly secured by royalties to be paid by Itochu for selling Lanvin-branded licensed products in Japan. Lanvin Hong Kong Limited holds the right to receive such royalties, and its shares were also charged in favor of Meritz.
Lease Agreement
We leased certain property for retail stores from Shanghai Fosun Bund Property Co., Ltd., which is a joint venture of Fosun International. In 2021, 2022 and 2023, we recognized rental expenses of €0.4 million, €1.2 million and €1.1 million to Shanghai Fosun Bund Property Co., Ltd.
Consulting Agreement
We engaged Shanghai Fosun High Technology (Group) Co., Ltd., a subsidiary of Fosun International, as consulting agent in relation to the acquisition of Sergio Rossi. In 2021, we paid consulting expenses of €0.3 million to Shanghai Fosun High Technology (Group) Co., Ltd (“Shanghai Fosun High Technology”), and we did not enter into any consulting agreement with Shanghai Fosun High Technology in 2022 and 2023.
135
Table of Contents
| C. | Interests of Experts and Counsel |
Not applicable.
| ITEM 8. | FINANCIAL INFORMATION |
| A. | Consolidated Statements and Other Financial Information |
The consolidated financial statements are filed as part of this annual report.
Legal Proceedings
See “Item 4. Information on the Company—B. Business Overview—Legal Proceedings and Compliance.”
Dividend Policy
We have never declared or paid any cash dividend on our Ordinary Shares. Pursuant to our original relationship agreement with Meritz, we paid dividend of $1.0 million and $1.0 million in 2022 and 2023, respectively, on the Convertible Preference Share held by Meritz. The Convertible Preference Share had been subsequently redeemed in full in December 2023. We currently intend to retain any future earnings and do not expect to pay any dividends on our Ordinary Shares in the foreseeable future. Any future determination to pay dividends on our Ordinary Shares would be at the discretion of our board of directors, subject to applicable laws, and would depend on our financial condition, results of operations, capital requirements, general business conditions, and other factors that our board of directors may deem relevant.
| B. | Significant Changes |
Except as disclosed elsewhere in this annual report, we have not experienced any significant changes since the date of our audited consolidated financial statements included in this annual report.
| ITEM 9. | THE OFFER AND LISTING |
| A. | Offer and Listing Details |
Our ordinary shares and warrants are listed on the New York Stock Exchange under the ticker symbols “LANV” and “LANV-WT,” respectively.
| B. | Plan of Distribution |
Not required.
| C. | Markets |
Our ordinary shares and warrants are listed on the New York Stock Exchange under the ticker symbols “LANV” and “LANV-WT,” respectively.
| D. | Selling Shareholders |
Not required.
| E. | Dilution |
Not required.
136
Table of Contents
| F. | Expenses of the Issue |
Not required.
| ITEM 10. | ADDITIONAL INFORMATION |
| A. | Share Capital |
Not required.
| B. | Memorandum and Articles of Association |
We incorporate by reference into this annual report the description of our amended and restated memorandum and articles of association contained in our registration statement on Form F-1 (File No. 333-269150), initially filed with the SEC on January 6, 2023. Our shareholders adopted our amended and restated memorandum and articles of association by special resolutions effective on December 14, 2022.
| C. | Material Contracts |
In the past two fiscal years, we have not entered into any material contracts other than in the ordinary course of business or other than those described elsewhere in this annual report. See “Item 5. Operating and Financial Review and Prospects—B. Liquidity and Capital Resources - Borrowing,” “Item 4. Information on the Company—B. Business Overview,” and “Item 7. Major Shareholders and Related Party Transactions—B. Related Party Transactions.”
| D. | Exchange Controls |
There are no governmental laws, decrees, regulations or other legislation in the Cayman Islands that may affect the import or export of capital, including the availability of cash and cash equivalents for use by the Company, or that may affect the remittance of dividends, interest, or other payments by the Company to non-resident holders of its Ordinary Shares. For a discussion of certain restrictions or limitations in certain countries in which we operate, see “Item 4. Information on the Company—B. Business Overview—Permissions and Approvals on Transfer and Repatriation of Cash Within Our Group” and “Item 3. Key Information—D. Risk Factors—We rely to a significant extent on dividends and other distributions on equity paid by our principal operating subsidiaries to fund offshore cash and financing requirements. Any limitation on the ability of our operating subsidiaries to make payments to us could have a material adverse effect on our ability to conduct our business.”
| E. | Taxation |
United States Federal Income Tax Considerations
General
The following is a general discussion of the material U.S. federal income tax consequences of the acquisition, ownership and disposition of our Ordinary Shares and Warrants (the “Securities”). This discussion applies only to U.S. Holders (as defined below). No ruling has been requested or will be obtained from the IRS regarding the U.S. federal income tax consequences of the acquisition, ownership and disposition of our Securities; thus, there can be no assurance that the IRS will not challenge the U.S. federal income tax treatment described below or that, if challenged, such treatment will be sustained by a court.
137
Table of Contents
This summary is limited to U.S. federal income tax considerations relevant to U.S. Holders that hold Securities as “capital assets” within the meaning of section 1221 of the Internal Revenue Code of 1986, as amended (the “Code”) (generally, property held for investment). This discussion does not address all aspects of U.S. federal income taxation that may be important to holders in light of their individual circumstances, including holders subject to special treatment under the U.S. tax laws, such as, for example:
| • | our officers or directors; |
| • | banks, financial institutions or financial services entities; |
| • | insurance companies; |
| • | broker-dealers; |
| • | taxpayers that are subject to the mark-to-market accounting rules; |
| • | tax-exempt entities; |
| • | governments or agencies or instrumentalities thereof, |
| • | real estate investment trusts; |
| • | regulated investment companies; |
| • | partnerships, S corporations or other pass-through entities or their partners, shareholders or other beneficial owners; |
| • | persons required to accelerate the recognition of any item of gross income as a result of such income being recognized on an applicable financial statement; |
| • | expatriates or former long-term residents of the United States; |
| • | persons that actually or constructively own five percent or more of our shares by vote or value; |
| • | persons that hold Securities as part of a straddle, constructive sale, hedging, conversion or other integrated or similar transaction; or |
| • | U.S. Holders (as defined below) whose functional currency is not the U.S. dollar. |
As used in this annual report, the term “U.S. Holder” means a beneficial owner of Securities that is for U.S. federal income tax purposes:
| • | an individual citizen or resident of the United States; |
| • | a corporation (or other entity treated as a corporation for U.S. federal income tax purposes) that is created or organized (or treated as created or organized) in or under the laws of the United States, any state thereof or the District of Columbia; |
| • | an estate the income of which is subject to U.S. federal income taxation regardless of its source; or |
| • | a trust if a court within the United States is able to exercise primary supervision over the administration of the trust and one or more U.S. persons have the authority to control all substantial decisions of the trust. |
The discussion below is based upon the provisions of the Code, the Treasury regulations promulgated thereunder and administrative and judicial interpretations thereof, all as of the date hereof. Those authorities may be repealed, revoked, modified or subject to differing interpretations, possibly on a retroactive basis, so as to result in U.S. federal income tax consequences different from those discussed below. Furthermore, this discussion does not address any aspect of U.S. federal non-income tax laws, such as gift, estate or Medicare contribution tax laws, or state, local or non-U.S. tax laws.
This discussion does not consider the tax treatment of partnerships or other pass-through entities or persons who hold Securities through such entities. If a partnership (or other entity or arrangement classified as a partnership for U.S. federal income tax purposes) is the beneficial owner of Securities, the U.S. federal income tax treatment of a partner in the partnership generally will depend on the status of the partner and the activities of the partner and the partnership. If you are a partner of a partnership holding Securities, we urge you to consult your own tax advisor.
138
Table of Contents
THIS SUMMARY DOES NOT PURPORT TO BE A COMPREHENSIVE ANALYSIS OR DESCRIPTION OF ALL POTENTIAL U.S. FEDERAL INCOME TAX CONSEQUENCES OF ACQUIRING, OWNING AND DISPOSING OF SECURITIES. HOLDERS OF SECURITIES SHOULD CONSULT WITH THEIR TAX ADVISORS REGARDING THE PARTICULAR TAX CONSEQUENCES TO THEM OF THE ACQUISITION, OWNERSHIP AND DISPOSITION OF SECURITIES, INCLUDING THE APPLICABILITY AND EFFECTS OF U.S. FEDERAL, STATE, LOCAL, AND OTHER TAX LAWS.
U. S. Holders
Taxation of Distributions
Subject to the possible applicability of the PFIC rules discussed below, a U.S. Holder generally will be required to include in gross income as a foreign-source dividend the amount of any distribution paid on our Ordinary Shares (including the amount of any tax withheld on such distribution) to the extent the distribution is paid out of our current or accumulated earnings and profits (as determined under U.S. federal income tax principles). Distributions in excess of our earnings and profits generally will be applied against and reduce the U.S. Holder’s basis in our Ordinary Shares (but not below zero) and, to the extent in excess of such basis, will be treated as gain from the sale or exchange of such ordinary shares (see “ —Gain or Loss on Sale, Taxable Exchange or Other Taxable Disposition of Ordinary Shares and Warrants” below). However, because we do not determine our earnings and profits under U.S. federal income tax principles, distributions on our Ordinary Shares generally will be reported to U.S. Holders as dividends taxable at ordinary income tax rates.
Dividends paid by us to a corporate U.S. Holder will not be eligible for the dividends-received deduction. With respect to non-corporate U.S. Holders, subject to certain exceptions (including, but not limited to, dividends treated as investment income for purposes of investment interest deduction limitations), dividends on our Ordinary Shares generally will be qualified dividend income subject to tax at preferential rates applicable to long-term capital gains provided that our Ordinary Shares are readily tradable on an established securities market in the United States, and we are not treated as a PFIC in the year the dividend is paid or in the preceding year and certain holding period and other requirements are met. U.S. Treasury Department guidance indicates that shares listed on NYSE (on which our Ordinary Shares are listed) will be considered readily tradable on an established securities market in the United States. Even if the Ordinary Shares are listed on NYSE, there can be no assurance that our Ordinary Shares will be considered readily tradable on an established securities market in future years. U.S. Holders should consult their tax advisors regarding the availability of such lower rate for any dividends paid with respect to Ordinary Shares.
In the event that we are deemed to be a PRC resident enterprise under the PRC Enterprise Income Tax Law (see “Item 3. Key Information—D. Risk Factors—Changes in tax laws, regulations and policies in jurisdictions in which we operate may materially and adversely affect our results of operations and financial condition”), a U.S. Holder may be subject to PRC withholding taxes on dividends paid on our Ordinary Shares. We may, however, be eligible for the benefits of the US-PRC Tax Treaty (the “Treaty”) if we are considered a PRC resident enterprise. If we are eligible for such benefits, dividends we pay on our Ordinary Shares would be eligible for the reduced rates of taxation. In addition, a U.S. Holder may be entitled, subject to generally applicable limitations and conditions, to claim a foreign tax credit in respect of PRC taxes withheld on dividends received at the applicable Treaty rate. U.S. Holders who do not elect to claim a credit for any foreign income taxes paid or accrued during the taxable year may instead claim a deduction of such taxes. The rules relating to the foreign tax credit are complex, and recently issued Treasury Regulations (the “Foreign Tax Credit Regulations”) have introduced additional requirements and limitations to the foreign tax credit rules. U.S. Holders are urged to consult their own tax advisors regarding the availability of foreign tax credits or deductions with respect to the Ordinary Shares in the event any PRC tax is withheld from our dividends.
Dividends paid in a currency other than U.S. dollars will be includable in income in a U.S. dollar amount based on the exchange rate in effect on the date of receipt whether or not the non-U.S. currency received is converted into U.S. dollars or otherwise disposed of at that time. If dividends paid in a currency other than U.S. dollars are converted into U.S. dollars on the day they are received, the U.S. Holder generally will not be required to recognize foreign currency gain or loss in respect of the dividend income.
139
Table of Contents
Gain or Loss on Sale, Taxable Exchange or Other Taxable Disposition of Ordinary Shares and Warrants
Subject to the PFIC rules discussed below, a U.S. Holder generally will recognize capital gain or loss on the sale or other taxable disposition of our Ordinary Shares or Warrants in an amount equal to the difference between the amount realized on the disposition and such U.S. Holder’s adjusted tax basis in such Ordinary Shares or Warrants. Any such capital gain or loss generally will be long-term capital gain or loss if the U.S. Holder’s holding period for such Ordinary Shares or Warrants exceeds one year. Long-term capital gain realized by a non-corporate U.S. Holder is currently eligible to be taxed at reduced rates. The deduction of capital losses is subject to certain limitations.
In the event that gain from the disposition of our Ordinary Shares is subject to tax in the PRC, such gain may be treated as PRC source gain under the Treaty. However, under the recently issued Foreign Tax Credit Regulations, a U.S. Holder that is not eligible for the benefits of the Treaty or that does not elect to apply the benefits of the Treaty may not be able to claim a foreign tax credit in respect of any PRC tax imposed on the disposition of the Ordinary Shares. U.S. Holders are urged to consult their tax advisors regarding the tax consequences if any PRC tax were to be imposed on a disposition of our Ordinary Shares, including the availability of the foreign tax credit under their particular circumstances and the potential impact of the Foreign Tax Credit Regulations.
Exercise, Lapse or Redemption of a Warrant
Subject to the PFIC rules and except as discussed below with respect to the cashless exercise of a warrant, a U.S. Holder generally will not recognize gain or loss upon the acquisition of an Ordinary Share on the exercise of a Warrant. A U.S. Holder’s tax basis in an Ordinary Share received upon exercise of the Warrant generally will be an amount equal to the sum of the U.S. Holder’s tax basis in the Warrant exchanged therefor and the exercise price. The U.S. Holder’s holding period for an Ordinary Share received upon exercise of the Warrant will begin on the date following the date of exercise (or possibly the date of exercise) of the Warrant and will not include the period during which the U.S. Holder held the Warrant. If a Warrant is allowed to lapse unexercised, a U.S. Holder generally will recognize a capital loss equal to such holder’s tax basis in the Warrant.
The tax consequences of a cashless exercise of a warrant are not clear under current law. Subject to the PFIC rules discussed below, a cashless exercise may not be taxable, either because the exercise is not a realization event or because the exercise is treated as a “recapitalization” for U.S. federal income tax purposes. Although we expect a U.S. Holder’s cashless exercise of our warrants (including after we provide notice of our intent to redeem warrants for cash) to be treated as a recapitalization, a cashless exercise could alternatively be treated as a taxable exchange in which gain or loss would be recognized.
In either tax-free situation, a U.S. Holder’s tax basis in the Ordinary Shares received generally would equal the U.S. Holder’s tax basis in the Warrants. If the cashless exercise is not treated as a realization event, it is unclear whether a U.S. Holder’s holding period for the Ordinary Share will commence on the date of exercise of the warrant or the day following the date of exercise of the warrant. If the cashless exercise is treated as a recapitalization, the holding period of the Ordinary Shares would include the holding period of the warrants.
It is also possible that a cashless exercise may be treated in part as a taxable exchange in which gain or loss would be recognized. In such event, a portion of the Warrants to be exercised on a cashless basis could, for U.S. federal income tax purposes, be deemed to have been surrendered in consideration for the exercise price of the remaining Warrants, which would be deemed to be exercised. For this purpose, a U.S. Holder may be deemed to have surrendered a number of Warrants having an aggregate value equal to the exercise price for the total number of Warrants to be deemed exercised. Subject to the PFIC rules discussed below, the U.S. Holder would recognize capital gain or loss in an amount equal to the difference between the fair market value of the total number of Warrants deemed surrendered and the U.S. Holder’s tax basis in such Warrants. In this case, a U.S. Holder’s tax basis in the Ordinary Shares received would equal the U.S. Holder’s tax basis in the Warrants exercised plus (or minus) the gain (or loss) recognized with respect to the surrendered Warrants. It is unclear whether a U.S. Holder’s holding period for the Ordinary Shares would commence on the date of exercise of the Warrant or the day following the date of exercise of the Warrant.
140
Table of Contents
Because of the absence of authority on the U.S. federal income tax treatment of a cashless exercise, there can be no assurance which, if any, of the alternative tax consequences and holding periods described above would be adopted by the IRS or a court of law. Accordingly, a U. S. Holder should consult its tax advisor regarding the tax consequences of a cashless exercise.
Subject to the PFIC rules described below, if we redeem warrants for cash or purchase warrants in an open market transaction, such redemption or purchase generally will be treated as a taxable disposition to the U.S. Holder, taxed as described above under “ Exercise, Lapse or Redemption of a Warrant.”
Possible Constructive Distributions
The terms of each Warrant provide for an adjustment to the number of Ordinary Shares for which the Warrant may be exercised or to the exercise price of the warrant in certain events, as discussed in the Description of Securities Registered under Section 12 of the Securities Exchange Act of 1934, which is filed as an exhibit to this annual report. An adjustment which has the effect of preventing dilution generally is not taxable. The U.S. Holders of the Warrants would, however, be treated as receiving a constructive distribution from us if, for example, the adjustment increases such U.S. Holders’ proportionate interests in our assets or earnings and profits (e.g. through an increase in the number of Ordinary Shares that would be obtained upon exercise or through a decrease to the exercise price of a Warrant) as a result of a distribution of cash or other property to the holders of Ordinary Shares which is taxable to the U.S. Holders of such Ordinary Shares as described under “ Taxation of Distributions” above. Such constructive distribution would be subject to tax as described under that section in the same manner as if the U.S. Holders of the warrants received a cash distribution from us equal to the fair market value of such increased interest, and would increase a U.S. Holder’s adjusted tax basis in its Warrants to the extent that such distribution is treated as a dividend.
Passive Foreign Investment Company Status
The treatment of U.S. Holders of our Ordinary Shares and Warrants could be materially different from that described above if we are or were treated as a passive foreign investment company (“PFIC”) for U.S. federal income tax purposes for any taxable year during which such U.S. Holders held our Ordinary Shares and/or Warrants.
A non-U.S. corporation will be classified as a PFIC for U.S. federal income tax purposes if either (i) at least 75% of its gross income in a taxable year, including its pro rata share of the gross income of any corporation in which it is considered to own at least 25% of the shares by value, is passive income or (ii) at least 50% of its assets in a taxable year (ordinarily determined based on fair market value and averaged quarterly over the year), including its pro rata share of the assets of any corporation in which it is considered to own at least 25% of the shares by value, are held for the production of, or produce, passive income. Passive income generally includes dividends, interest, rents and royalties (other than rents or royalties derived from the active conduct of a trade or business) and gains from the disposition of passive assets.
We do not believe we were a PFIC for our most recently completed taxable year and, based on the composition of our current gross assets and income and the manner in which we expect to operate our business in future years, do not currently expect to be classified as a PFIC for the current taxable year or foreseeable future taxable years. However, this conclusion is a factual determination that must be made annually at the end of our taxable year, and our status will depend among other things upon changes in the composition and relative value of our gross receipts and assets. Accordingly, no assurance can be given that we will not be classified as a PFIC in the current year or in any future taxable year.
If we are determined to be a PFIC for any taxable year (or portion thereof) that is included in the holding period of a U.S. Holder of Ordinary Shares or Warrants and, in the case of Ordinary Shares, such U.S. Holder generally would be subject to special and adverse rules with respect to (i) any gain recognized by the U.S. Holder on the sale or other disposition of its Ordinary Shares or Warrants and (ii) any “excess distribution” made to the U.S. Holder (generally, any distributions to such U.S. Holder during a taxable year of the U.S. Holder that are greater than 125% of the average annual distributions received by such U.S. Holder in respect of the Ordinary Shares during the three preceding taxable years of such U.S. Holder or, if shorter, such U.S. Holder’s holding period for the Ordinary Shares).
141
Table of Contents
Under these rules:
| • | the U.S. Holder’s gain or excess distribution will be allocated ratably over the U.S. Holder’s holding period for the Ordinary Shares or Warrants; |
| • | the amount allocated to the U.S. Holder’s taxable year in which the U.S. Holder recognized the gain or received the excess distribution, or to the period in the U.S. Holder’s holding period before the first day of our first taxable year in which we were a PFIC, will be taxed as ordinary income; |
| • | the amount allocated to other taxable years (or portions thereof) of the U.S. Holder and included in its holding period will be taxed at the highest tax rate in effect for that year and applicable to the U.S. Holder; and |
| • | an additional tax equal to the interest charge generally applicable to underpayments of tax will be imposed on the U.S. Holder with respect to the tax attributable to each such other taxable year of the U.S. Holder. |
If we are a PFIC and, at any time, have a non-U.S. subsidiary that is classified as a PFIC, a U.S. Holder generally would be deemed to own a portion of the shares of such lower-tier PFIC, and generally could incur liability for the deferred tax and interest charge described above if we (or our subsidiary) receive a distribution from, or disposes of all or part of its interest in, the lower-tier PFIC or the U.S. Holders otherwise were deemed to have disposed of an interest in the lower-tier PFIC. U.S. Holders are urged to consult their tax advisors regarding the tax issues raised by lower-tier PFICs.
A U.S. Holder may avoid some of the adverse PFIC tax consequences described above in respect of the Ordinary Shares (but not the Warrants) by making and maintaining a timely and valid QEF election (if eligible to do so) to include in income its pro rata share of our net capital gains (as long-term capital gain) and other earnings and profits (as ordinary income), on a current basis, in each case whether or not distributed, in the taxable year of the U.S. Holder in which or with which our taxable year ends. In order to comply with the requirements of a QEF election, a U.S. Holder must receive a PFIC Annual Information Statement from us. However, we do not expect to furnish U.S. Holders with the tax information necessary to enable a U.S. Holder to make a QEF election.
Alternatively, if we are a PFIC and our Ordinary Shares constitute “marketable stock,” a U.S. Holder may avoid some of the adverse PFIC tax consequences discussed above if such U.S. Holder, at the close of the first taxable year in which it holds (or is deemed to hold) the Ordinary Shares, makes a mark-to-market election with respect to such shares for such taxable year. Such U.S. Holder generally will include for each of its taxable years as ordinary income the excess, if any, of the fair market value of its Ordinary Shares at the end of such year over its adjusted basis in its Ordinary Shares. The U.S. Holder also will recognize an ordinary loss in respect of the excess, if any, of its adjusted basis of its Ordinary Shares over the fair market value of its Ordinary Shares at the end of its taxable year (but only to the extent of the net amount of previously included income as a result of the mark-to-market election). The U.S. Holder’s basis in its Ordinary Shares will be adjusted to reflect any such income or loss amounts, and any further gain recognized on a sale or other taxable disposition of its Ordinary Shares will be treated as ordinary income. Currently, a mark-to-market election may not be made with respect to Warrants. The mark-to-market election is available only for “marketable stock,” generally, stock that is regularly traded on a national securities exchange that is registered with the SEC, including NYSE (on which the Ordinary Shares are listed), or on a foreign exchange or market that the IRS determines has rules sufficient to ensure that the market price represents a legitimate and sound fair market value.
The rules dealing with PFICs are complex and are affected by various factors in addition to those described above. Accordingly, U.S. Holders of the Ordinary Shares and Warrants should consult their tax advisors concerning the application of the PFIC rules to Securities under their particular circumstances.
142
Table of Contents
Non-U.S. Holders
This section applies to you if you are a “Non-U.S. Holder.” As used herein, the term “Non-U.S. Holder” means a holder who, for U.S. federal income tax purposes, is a beneficial owner of Securities (other than a partnership or other entity or arrangement treated as a partnership for U.S. federal income tax purposes) that is not a U.S. Holder.
Dividends (including constructive dividends) paid or deemed paid to a Non-U.S. Holder in respect of Ordinary Shares generally will not be subject to U.S. federal income tax unless the dividends are effectively connected with the Non-U.S. Holder’s conduct of a trade or business within the United States (and, if required by an applicable income tax treaty, are attributable to a permanent establishment or fixed base that such holder maintains in the United States). In addition, a Non-U.S. Holder generally will not be subject to U.S. federal income tax on any gain attributable to a sale or other disposition of Securities unless such gain is effectively connected with its conduct of a trade or business in the United States (and, if required by an applicable income tax treaty, is attributable to a permanent establishment or fixed base that such holder maintains in the United States), or the Non-U.S. Holder is an individual who is present in the United States for a period or periods aggregating 183 days or more in the taxable year of sale or other disposition and certain other conditions are met (in which case, such gain from the United States sources generally is subject to tax at a 30% rate or a lower applicable treaty rate).
Dividends (including constructive dividends) and gains that are effectively connected with the Non-U.S. Holder’s conduct of a trade or business in the United States (and, if required by an applicable income tax treaty, are attributable to a permanent establishment or fixed base in the United States) generally will be subject to U.S. federal income tax at the same regular U.S. federal income tax rates applicable to a comparable U.S. Holder and, in the case of a Non-U. S. Holder that is a corporation for U.S. federal income tax purposes, also may be subject to an additional branch profits tax at a 30% rate or a lower applicable tax treaty rate.
The U. S. federal income tax treatment of a Non-U. S. Holder’s exercise of a Warrant, or the lapse of a Warrant held by a Non-U.S. Holder, generally will correspond to the U.S. federal income tax treatment of the exercise or lapse of a warrant by a U.S. Holder, as described in “Exercise, Lapse or Redemption of a Warrant” above, although to the extent a cashless exercise results in a taxable exchange, the consequences would be similar to those described in the preceding paragraphs above for a Non-U.S. Holder’s gain on the sale or other disposition of Securities.
Information Reporting and Backup Withholding
Dividend payments (including constructive dividends) with respect to Ordinary Shares and proceeds from the sale, exchange or redemption of Securities may be subject to information reporting to the IRS and possible United States backup withholding. Backup withholding (currently at a rate of 24%) will not apply, however, to a U.S. Holder who furnishes a correct taxpayer identification number (generally on an IRS Form W-9 provided to the paying agent of the U.S. Holder’s broker) and makes other required certifications, or who is otherwise exempt from backup withholding and establishes such exempt status. A Non-U.S. Holder generally will not be subject to the requirement for information reporting and backup withholding by providing certification of its foreign status, under penalties of perjury, on a duly executed applicable IRS Form W-8 or by otherwise establishing an exemption. Backup withholding is not an additional tax. Any amounts withheld under the backup withholding rules may be allowed as a refund or credit against a holder’s U. S. federal income tax liability, if any, provided the required information is timely furnished to the IRS.
Certain U.S. Holders holding specified foreign financial assets with an aggregate value in excess of an applicable dollar threshold are required to report information to the IRS relating to Securities, subject to certain exceptions (including an exception for Securities held in an account maintained with a U.S. financial institution), by attaching a complete IRS Form 8938, Statement of Specified Foreign Financial Assets, with their tax return, for each year in which they hold Securities.
143
Table of Contents
Cayman Islands Tax Considerations
The following summary contains a description of certain Cayman Islands income tax consequences of the acquisition, ownership and disposition of ordinary shares, but it does not purport to be a comprehensive description of all the tax considerations that may be relevant to a decision to purchase ordinary shares. The summary is based upon the tax laws of Cayman Islands and regulations thereunder as of the date hereof, which are subject to change.
Prospective investors should consult their professional advisers on the possible tax consequences of buying, holding or selling any shares under the laws of their country of citizenship, residence or domicile.
The following is a discussion on certain Cayman Islands income tax consequences of an investment in the Securities. The discussion is a general summary of present law, which is subject to prospective and retroactive change. It is not intended as tax advice, does not consider any investor’s particular circumstances, and does not consider tax consequences other than those arising under Cayman Islands law.
Under Existing Cayman Islands Laws:
Payments of dividends and capital in respect of Securities will not be subject to taxation in the Cayman Islands and no withholding will be required on the payment of interest and principal or a dividend or capital to any holder of Ordinary Shares, as the case may be, nor will gains derived from the disposal of the Ordinary Shares be subject to Cayman Islands income or corporation tax. The Cayman Islands currently have no income, corporation or capital gains tax and no estate duty, inheritance tax or gift tax.
No stamp duty is payable in respect of the issue of Securities or on an instrument of transfer in respect of a Security, unless the relevant instruments are executed in, or after execution brought within, the jurisdiction of the Cayman Islands or our Company holds interests in land in the Cayman Islands.
The Tax Concessions Law
We have been incorporated under the laws of the Cayman Islands as an exempted company with limited liability and, as such, pursuant to section 6 of the Tax Concessions Act (As Revised) of the Cayman Islands, we may obtain undertakings from the Financial Secretary of the Cayman Islands:
| (a) | that no law which is thereafter enacted in the Cayman Islands imposing any tax to be levied on profits, income, gains or appreciations shall apply to us or our operations; and |
| (b) | in addition, that no tax to be levied on profits, income, gains or appreciations or which is in the nature of estate duty or inheritance tax shall be payable: |
| (i) | on or in respect of our shares, debentures or other obligations; or |
| (ii) | by way of the withholding in whole or in part of any relevant payment as defined in the Tax Concessions Act. |
The Cayman Islands currently levy no taxes on individuals or corporations based upon profits, income, gains or appreciations and there is no taxation in the nature of inheritance tax or estate duty. There are no other taxes likely to be material to us levied by the Government of the Cayman Islands save certain stamp duties which may be applicable, from time to time, on certain instruments executed in or brought within the jurisdiction of the Cayman Islands.
| F. | Dividends and Paying Agents |
Not required.
| G. | Statement by Experts |
Not required.
144
Table of Contents
| H. | Documents on Display |
We are subject to certain of the informational filing requirements of the Exchange Act. Since we are a “foreign private issuer,” we are exempt from the rules and regulations under the Exchange Act prescribing the furnishing and content of proxy statements, and our officers, directors and principal shareholders are exempt from the reporting and “short-swing” profit recovery provisions contained in Section 16 of the Exchange Act, with respect to their purchase and sale of our shares. In addition, we are not required to file reports and financial statements with the SEC as frequently or as promptly as U.S. companies whose securities are registered under the Exchange Act. However, we are required to file with the SEC an Annual Report on Form 20-F containing financial statements audited by an independent accounting firm. We may, but are not required, to furnish to the SEC, on Form 6-K, unaudited financial information after each of our first three fiscal quarters. The SEC also maintains a website at http://www.sec.gov that contains reports and other information that we file with or furnish electronically with the SEC.
| I. | Subsidiary Information |
Not applicable.
| J. | Annual Report to Security Holders |
Not applicable.
| ITEM 11. | QUANTITATIVE AND QUALITATIVE DISCLOSURES ABOUT MARKET RISK |
We are exposed to market risks in the ordinary course of our business. These risks primarily include foreign exchange risk, interest rate risk, credit risk and liquidity risk. See Note 4.3—Financial risk factors to Lanvin Group’s consolidated financial statements included elsewhere in this annual report for further details.
Our overall risk management program focuses on the unpredictability of financial markets and seeks to minimize potential adverse effects on our financial performance. We did not use any derivative financial instruments to hedge certain risk exposures.
Foreign exchange risk
We have a vast international presence, and therefore is exposed to the risk that changes in currency exchange rates could adversely impact revenue, expenses, margins and profit. Our management manages our foreign exchange risk by performing regular review.
Interest rate risk
We do not have any significant interest bearing financial assets or liabilities except for cash and cash equivalents and borrowings, details of which are disclosed in Notes 23 and 24 to Lanvin Group’s consolidated financial statements, respectively.
Our exposure to the risk of changes in market interest rates relates primarily to our borrowings with floating interest rates. Our policy is to manage our interest cost using a mix of fixed and variable rate debts. As of December 31, 2023, 2022 and 2021, approximately 71%, 42% and 69% of our interest-bearing borrowings bore interest at fixed rates, respectively.
Credit risk
Credit risk is defined as the risk of financial loss caused by the failure of a counterparty to repay amounts owed or meet its contractual obligations. The maximum risk to which an entity is exposed is represented by all the financial assets recognized in the financial statements. Management considers our credit risk to relate primarily to trade receivables generated from the wholesale channel and mitigates the related effects through specific commercial and financial strategies.
With regards to trade receivables, credit risk management is carried out by monitoring the reliability and solvency of customers.
145
Table of Contents
Liquidity risk
Liquidity risk refers to the difficulty we could have in meeting our financial obligations.
According to management, the funds and credit lines currently available, in addition to those that will be generated by operating and financing activities, will enable us to meet our financial requirement arising from investing activities, working capital management and punctual loan repayment as planned.
As of December 31, 2023, 2022 and 2021, we had undrawn cash credit lines of $13 million, $13 million and $13 million available at banks, respectively.
| ITEM 12. | DESCRIPTION OF SECURITIES OTHER THAN EQUITY SECURITIES |
| A. | Debt Securities |
Not applicable.
| B. | Warrants and Rights |
A description of our Warrants is set forth in this annual report, in Exhibit 2.5 “Description of Securities” and is incorporated by reference herein.
| C. | Other Securities |
Not applicable.
| D. | American Depositary Shares |
Not applicable.
146
Table of Contents
PART II
| ITEM 13. | DEFAULTS, DIVIDEND ARREARAGES AND DELINQUENCIES |
None.
| ITEM 14. | MATERIAL MODIFICATIONS TO THE RIGHTS OF SECURITY HOLDERS AND USE OF PROCEEDS |
None.
| ITEM 15. | CONTROLS AND PROCEDURES |
Evaluation of Disclosure Controls and Procedures
As of the end of the period covered by this annual report, an evaluation has been carried out under the supervision and with the participation of our management, including our chief executive officer and our chief financial officer, of the effectiveness of the design and operation of our disclosure controls and procedures, as such term is defined under Rules 13a-15(e) and 15d-15(e) promulgated under the U.S. Exchange Act. Based on that evaluation, our management has concluded that, as of December 31, 2023, our disclosure controls and procedures were not effective as of December 31, 2023 due to the material weaknesses in our internal control over financial reporting as described below in “—Management’s Annual Report on Internal Control over Financial Reporting”.
Management’s Annual Report on Internal Control over Financial Reporting
Our management is responsible for establishing and maintaining adequate internal control over financial reporting, as defined in Rule 13a-15(f) and 15d-15(f) of the Exchange Act. Our management assessed the effectiveness of our internal control over financial reporting based on the criteria outlined by the Committee of Sponsoring Organizations of the Treadway Commission (COSO) in the Internal Control—Integrated Framework (2013). Based on this assessment, our management has concluded that our internal control over financial reporting was not effective as of December 31, 2023, due to the material weaknesses described below.
Material Weaknesses in Internal Control over Financial Reporting
The material weaknesses identified in our internal controls primarily related to: (i) we did not fully design, implement and monitor general information technology controls in the areas of user access, and segregation of duties for systems supporting substantially all of the Group’s internal control processes; and (ii) (a) we did not design and implement, and retain appropriate documentation of formal accounting policies, procedures and controls across substantially all of the Group’s business processes to achieve timely, complete and accurate financial accounting, reporting, and disclosures; and (b) we did not design and implement adequate controls pertaining to the period-end financial reporting, classification of contingent consideration, journal entries, completeness and accuracy of underlying data used in the performance of controls and account reconciliations.
Management’s Remediation Plan for Material Weaknesses in Internal Control over Financial Reporting
The Group and its Board are committed to maintaining a strong internal control environment. We have begun the process of designing and implementing effective internal controls measures to improve our internal control over financial reporting and remediate the material weaknesses. Our internal control remediation efforts include the following:
| • | developing and implementing a comprehensive framework for governance and oversight of in-formation technology controls, specifically targeting user access and segregation of duties; |
| • | enhancing the precision and regular monitoring of user access controls to ensure the integrity and security of the systems supporting critical internal control processes; |
| • | enhancing our policies, procedures, and documentation of period-end closing activities to ensure completeness and accuracy in financial reporting, while also reinforcing transparency and accountability in our financial processes; |
| • | we have designated, and will persist in enhancing, well-defined roles and responsibilities for accounting and financial reporting personnel to tackle accounting and financial reporting challenges; and |
| • | we have engaged a qualified consultant to evaluate Sarbanes-Oxley Act compliance readiness and identify areas for enhancing overall controls over financial reporting, as well as to aid in implementing necessary improvements. |
147
Table of Contents
We cannot give assurance that the measures we are taking to remediate the material weaknesses will be sufficient or that they will prevent future material weaknesses. If we are unable to remediate these material weaknesses, or if we are unable to develop and maintain an effective system of internal controls, we may not be able to produce timely and accurate financial statements or comply with applicable laws and regulations, which may adversely affect our businesses and our securities. Even if we are able to remediate these material weaknesses, internal control over financial reporting, because of its inherent limitations, may not prevent or detect misstatements. Also, projections of any evaluation of effectiveness to future periods are subject to the risks that controls may become inadequate because of changes in conditions, or that the degree of compliance with the policies or procedures may deteriorate.
Changes in Internal Control over Financial Reporting
There were no changes in our internal controls over financial reporting that occurred during the period covered by this annual report on Form 20-F that have materially affected, or are reasonably likely to materially affect, our internal control over financial reporting.
| ITEM 16. | [RESERVED] |
| ITEM 16A. | AUDIT COMMITTEE FINANCIAL EXPERT |
Our board of directors has determined that Mr. Jurjan Wouda Kuipers, who is an independent director, satisfies the criteria of an audit committee financial expert as defined in Item 16A of the instruction to Form 20-F.
| ITEM 16B. | CODE OF ETHICS |
We have adopted a code of business conduct and ethics that applies to our directors, employees and officers, including our Chief Executive Officer and Chief Financial Officer. No changes have been made to the code of business conduct and ethics since its adoption and no waivers have been granted therefrom to our directors or employees. This code of business conduct and ethics is available on our website at https.//lanvin-group.com.
| ITEM 16C. | PRINCIPAL ACCOUNTANT FEES AND SERVICES |
Grant Thornton Zhitong Certified Public Accountants LLP has served as our independent public accountant for each of the fiscal years in the three-year period ended December 31, 2023, for which audited financial statements appear in this annual report.
The following table sets forth the aggregate fees by categories specified below in connection with certain professional services rendered by Grant Thornton Zhitong Certified Public Accountants LLP, the member firms of Grant Thornton International Ltd (“GTIL”) and their respective affiliates (collectively, the “Grant Thornton Entities”), for the years indicated.
| For the Year Ended December 31, | ||||||||||||
| 2021 | 2022 | 2023 | ||||||||||
| (In Euro millions) | ||||||||||||
| Audit Fees (1) |
5 | 2 | 2 | |||||||||
| Audit–Related Fees (2) |
* | * | * | |||||||||
| Other Fees (3) |
* | * | * | |||||||||
|
|
|
|
|
|
|
|||||||
| Total |
5 | 2 | 2 | |||||||||
|
|
|
|
|
|
|
|||||||
Notes:
| * | Amounts less than €1 million. |
| (1) | “Audit Fees” are the aggregate fees charged by the Grant Thornton Entities for the audit of our annual consolidated financial statements, the review of documents filed with the SEC and attestation services that are provided in connection with statutory and regulatory filings or engagements. The “Audit Fees” in 2021 include the PCAOB audit for the years ended December 31, 2021 for the purpose of LGHL’s Registration Statement on Form F-4 Filed in connection with the Business Combination. |
148
Table of Contents
| (2) | “Audit-related Fees” are the aggregate fees charged by the Grant Thornton Entities for assurance and related services that are reasonably related to the performance of the audit or review of our financial statements and are not reported under “Audit Fees.” This category comprises fees for agreed upon procedures engagements and other attestation services subject to regulatory requirements. |
| (3) | “Other Fees” are the aggregate fees charged by the Grant Thornton Entities for non-audit services rendered. |
Pre-Approval Policies and Procedures
Our audit committee is responsible for the oversight of our independent accountants’ work. The policy of our audit committee is to pre-approve all audit and non-audit services provided by Grant Thornton Entities, including audit services, audit-related services, tax services and other services, as described above.
| ITEM 16D. | EXEMPTIONS FROM THE LISTING STANDARDS FOR AUDIT COMMITTEES |
None.
| ITEM 16E. | PURCHASE OF EQUITY SECURITIES BY THE ISSUER AND AFFILIATED PURCHASERS |
On December 14, 2023, pursuant to the Meritz SBSA and the Amended and Restated Meritz Relationship Agreement, we repurchased from Meritz one Convertible Preference Share for a price equal to US$54,473,260.
On April 30, 2024, pursuant to a side letter between us and Meritz to the Amended and Restated Relationship Agreement, we repurchased 1,328,704 Ordinary Shares from Meritz for a purchase price of US$5.0 million. For details of the Meritz SBSA, Amended and Restated Meritz Relationship Agreement and the side letter, see “Item 5. Operating and Financial Review and Prospects—B. Liquidity and Capital Resources—Meritz Private Placement.”
| ITEM 16F. | CHANGE IN REGISTRANT’S CERTIFYING ACCOUNTANT |
Not applicable.
| ITEM 16G. | CORPORATE GOVERNANCE |
We are a “foreign private issuer” (as such term is defined in Rule 3b-4 under the Exchange Act), and are listed on the New York Stock Exchange. Under Section 303A of the New York Stock Exchange Listed Company Manual, New York Stock Exchange listed companies that are foreign private issuers are permitted to follow home country practice in lieu of the corporate governance provisions specified by the New York Stock Exchange with limited exceptions. The following summarizes some significant ways in which our corporate governance practices differ from those followed by domestic companies under the listing standards of the New York Stock Exchange.
Under the New York Stock Exchange Listed Company Manual, or the NYSE Manual, U.S. domestic listed companies are required to have a majority of the board consisting of independent directors and have a compensation committee and a nominating/corporate governance committee, each composed entirely of independent directors, which are not required under the Cayman Companies Act, our home country. Among other things, we are not required to have: (i) a majority-independent board of directors; (ii) a compensation committee consisting of independent directors; (iii) a nominating and corporate governance committee consisting of independent directors; or (iv) regularly scheduled executive sessions with only independent directors each year. Although not required and as may be changed from time to time, we have a majority-independent board of directors, a majority-independent compensation committee and a nominating and corporate governance committee. Subject to the foregoing, we rely on the exemptions listed above. As a result, you may not be provided with the benefits of certain corporate governance requirements of the NYSE applicable to U. S. domestic public companies. In addition, the NYSE Manual requires shareholder approval for certain matters, such as requiring that shareholders must be given the opportunity to vote on all equity compensation plans and material revisions to those plans, which is not required under the Cayman Islands law. We intend to follow the home country practice in determining whether shareholder approval is required.
149
Table of Contents
| ITEM 16H. | MINE SAFETY DISCLOSURE |
Not applicable.
| ITEM 16I. | DISCLOSURE REGARDING FOREIGN JURISDICTIONS THAT PREVENT INSPECTIONS |
Not applicable.
| ITEM 16J. | INSIDER TRADING POLICIES |
Not applicable.
| ITEM 16K. | CYBERSECURITY |
Cybersecurity Implementation
We have established a comprehensive cybersecurity risk management program aimed at safeguarding the confidentiality, integrity, and availability of our critical IT systems and data. This involves utilizing various security tools and techniques, such as penetration test and vulnerability scanning programs conducted by the respective outsourced cybersecurity service provider, to proactively identify, investigate, contain and recover from potential vulnerabilities and security incidents.
Our cybersecurity risk management program is built based on the National Institute of Standards and Technology Cybersecurity Framework integrates with our broader enterprise risk management framework, utilizing consistent methodologies and reporting channels across all risk domains. Oversight of this program falls under the purview of our IT team, which ultimately reports to the Audit Committee.
Our cybersecurity risk management program includes:
| • | an Information Security Policy outlining practices for maintaining confidence in our business and safeguarding information; |
| • | utilization of internal and external resources for security assessments and audits; |
| • | annual external audits and penetration tests for our systems; |
| • | mandatory cybersecurity training for all employees and management; |
| • | a comprehensive incident response plan for assessing, responding to, and resolving cybersecurity incidents; and |
| • | a vendor assessment program to mitigate cybersecurity risks from third-party service providers, including contractual obligations for prompt reporting of security incidents or risks. |
150
Table of Contents
As of the date of this report, the Company is not aware of any risks from cybersecurity threats that have materially affected or are reasonably likely to materially affect the Company, including its business strategy, results of operations, or financial condition. However, there can be no assurance that we will not be materially affected by such risks in the future. For information on the cybersecurity threats and risks we face and the potential impacts on the business related thereto, see “Item 3. Key Information—D. Risk Factors—Risks Relating to Our Business and Industry—A data security or privacy breach could damage our reputation and our relationships with our customers or employees, expose us to litigation risk, and adversely affect our business.”
Cybersecurity Governance
Our board of directors oversees cybersecurity risk and has assigned the Audit Committee to manage our cybersecurity risk management program. The Audit Committee receives regular updates on these programs from management, along with related trends or metrics. Our Chief Risk Officer provides regular updates on program status, key issues, priorities, and challenges to the Audit Committee. For the background of our Chief Risk Officer, see “Item 6. Directors, Senior Management and Employees—A. Directors and Senior Management.” Additionally, management informs our board of directors about significant cybersecurity incidents, while also providing briefings on program components and important risk or compliance matters.
151
Table of Contents
PART III
| ITEM 17. | FINANCIAL STATEMENTS |
The Registrant has elected to provide the financial statements and related information specified in Item 18.
| ITEM 18. | FINANCIAL STATEMENTS |
The consolidated financial statements of Lanvin Group Holdings Limited are included at the end of this annual report.
| ITEM 19. | EXHIBITS |
152
Table of Contents
153
Table of Contents
154
Table of Contents
155
Table of Contents
156
Table of Contents
| Exhibit Number |
Description of Exhibit | |
| 10LINS* | Inline XBRL Instance Document- the instance document does not appear in the Interactive Data File because its XBRL tags are embedded within the Inline XBRL document. | |
| 101.SCH* | Inline XBRL Taxonomy Extension Schema Document. | |
| 101.CAL* | Inline XBRL Taxonomy Extension Calculation Linkbase Document. | |
| 101.DEF* | Inline XBRL Taxonomy Extension Definition Linkbase Document. | |
| 101.LAB* | Inline XBRL Taxonomy Extension Labels Linkbase Document. | |
| 101.PRE* | Inline XBRL Taxonomy Extension Presentation Linkbase Document. | |
| 104* | Cover Page Interactive Data File (formatted as inline XBRL and contained in Exhibit 101) | |
| * | Filed herewith. |
| ** | Furnished herewith |
157
Table of Contents
SIGNATURES
The registrant hereby certifies that it meets all of the requirements for filing on Form 20-F and that it has duly caused and authorized the undersigned to sign this annual report on its behalf.
| Lanvin Group Holding Limited | ||
| By: | /s/ Eric Chan | |
| Name: | Eric Chan | |
| Title: | Chief Executive Officer | |
Date: April 30, 2024
158
Table of Contents
Table of Contents |
Page(s) |
|||
| F-2 | ||||
| F-3 | ||||
| F-4 | ||||
| F-5 | ||||
| F-6 | ||||
| F-7 | ||||
F-8-F-70 |
||||
(Euro thousands except for loss per share) |
For the years ended December 31, |
|||||||||||||||
Notes |
2023 |
2022 |
2021 |
|||||||||||||
| Revenue |
8 | |||||||||||||||
| Cost of sales |
9 | ( |
) | ( |
) | ( |
) | |||||||||
| |
|
|
|
|
|
|||||||||||
| Gross profit |
||||||||||||||||
| Marketing and selling expenses |
9 | ( |
) | ( |
) | ( |
) | |||||||||
| General and administrative expenses |
9 | ( |
) | ( |
) | ( |
) | |||||||||
| Other operating income and expenses |
9 | ( |
) | ( |
) | |||||||||||
| |
|
|
|
|
|
|||||||||||
| Loss from operations before non-underlying items |
( |
) |
( |
) |
( |
) | ||||||||||
| Non-underlying items |
10 | ( |
) | ( |
) | |||||||||||
| |
|
|
|
|
|
|||||||||||
| Loss from operations |
( |
) |
( |
) |
( |
) | ||||||||||
| Finance cost – net |
11 | ( |
) | ( |
) | ( |
) | |||||||||
| |
|
|
|
|
|
|||||||||||
| Loss before income tax |
( |
) |
( |
) |
( |
) | ||||||||||
| Income tax benefits / (expenses) |
12 | ( |
) | ( |
) | |||||||||||
| |
|
|
|
|
|
|||||||||||
| Loss for the year |
( |
) |
( |
) |
( |
) | ||||||||||
| |
|
|
|
|
|
|||||||||||
| Attributable to: |
||||||||||||||||
| - Owners of the Company |
( |
) | ( |
) | ( |
) | ||||||||||
| - Non-controlling interests |
( |
) | ( |
) | ( |
) | ||||||||||
| Loss per share in Euro |
||||||||||||||||
| - Basic and diluted (in Euro per share) |
13 | ( |
) |
( |
) | ( |
) | |||||||||
For the years ended December 31, |
||||||||||||
(Euro thousands) |
2023 |
2022 |
2021 |
|||||||||
| Loss for the year |
( |
) |
( |
) |
( |
) | ||||||
| Other comprehensive loss: |
||||||||||||
| Items that may be subsequently reclassified to profit or loss |
||||||||||||
| - Currency translation differences, net of tax |
( |
) | ( |
) | ||||||||
| Items that will not be subsequently reclassified to profit or loss |
||||||||||||
| - Employee benefit obligations: change in value resulting from actuarial gains/(losses), net of tax |
( |
) | ( |
) | ||||||||
| |
|
|
|
|
|
|||||||
| Total comprehensive loss for the year |
( |
) |
( |
) |
( |
) | ||||||
| |
|
|
|
|
|
|||||||
| Attributable to: |
||||||||||||
| - Owners of the Company |
( |
) | ( |
) | ( |
) | ||||||
| - Non-controlling interests |
( |
) |
( |
) | ( |
) | ||||||
At December 31, |
||||||||||||
(Euro thousands) |
Notes |
2023 |
2022 |
|||||||||
Assets |
||||||||||||
Non-current assets |
||||||||||||
Intangible assets |
14 | |||||||||||
Goodwill |
15 | |||||||||||
Property, plant and equipment |
17 | |||||||||||
Right-of-use assets |
18 | |||||||||||
Deferred income tax assets |
12 | |||||||||||
Other non-current assets |
19 | |||||||||||
Current assets |
||||||||||||
Inventories |
20 | |||||||||||
Trade receivables |
21 | |||||||||||
Other current assets |
22 | |||||||||||
Cash and bank balances |
23 | |||||||||||
Total assets |
||||||||||||
Liabilities |
||||||||||||
Non-current liabilities |
||||||||||||
Non-current borrowings |
24 | |||||||||||
Non-current lease liabilities |
25 | |||||||||||
Non-current provisions |
26 | |||||||||||
Employee benefits |
27 | |||||||||||
Deferred income tax liabilities |
12 | |||||||||||
Other non-current liabilities |
||||||||||||
Current liabilities |
||||||||||||
Trade payables |
||||||||||||
Bank overdrafts |
23 | |||||||||||
Current borrowings |
24 | |||||||||||
Current lease liabilities |
25 | |||||||||||
Current provisions |
26 | |||||||||||
Other current liabilities |
28 | |||||||||||
Total liabilities |
||||||||||||
Net assets |
||||||||||||
Equity |
||||||||||||
Equity attributable to owners of the Company |
||||||||||||
Share capital |
29 | * | * | |||||||||
Treasury shares |
29 | ( |
) | ( |
) | |||||||
Other reserves |
30 | |||||||||||
Accumulated losses |
( |
) |
( |
) | ||||||||
Non- controlling interests |
31 | ( |
) |
|||||||||
Total equity |
||||||||||||
| * | Amount less than € |
For the years ended December 31, |
||||||||||||||||
(Euro thousands) |
Notes |
2023 |
2022 |
2021 |
||||||||||||
Operating activities |
||||||||||||||||
Loss for the year |
( |
) | ( |
) | ( |
) | ||||||||||
Adjustments for: |
||||||||||||||||
Income tax expenses / ( benefits) |
( |
) | ||||||||||||||
Depreciation and amortization |
||||||||||||||||
Provisions and impairment losses |
||||||||||||||||
Employee share-based compensation |
||||||||||||||||
Finance cost – net |
||||||||||||||||
Costs in respect of disputes |
||||||||||||||||
Fair value movement in warrants |
( |
) | ||||||||||||||
Net gains on disposals |
( |
) | ( |
) | ( |
) | ||||||||||
Share listing and associated expenses |
||||||||||||||||
Negative goodwill from acquisition of a subsidiary |
( |
) | ||||||||||||||
Gain on the debt restructuring |
( |
) | ||||||||||||||
Change in inventories |
( |
) | ( |
) | ||||||||||||
Change in trade receivables |
( |
) | ( |
) | ||||||||||||
Change in trade payables |
||||||||||||||||
Change in other operating assets and liabilities |
( |
) | ||||||||||||||
Income tax paid |
( |
) | ( |
) | ( |
) | ||||||||||
Net cash used in operating activities |
( |
) |
( |
) |
( |
) | ||||||||||
Investing activities |
||||||||||||||||
Payment for the purchase of property, plant and equipment, intangible assets and other long-term assets |
( |
) | ( |
) | ( |
) | ||||||||||
Proceeds from disposal of property, plant and equipment, intangible assets and other long-term assets |
34 | |||||||||||||||
Purchase of financial assets at fair value through profit or loss |
( |
) | — | — | ||||||||||||
Acquisition of a subsidiary, net of cash acquired |
( |
) | ||||||||||||||
Net cash (used in) / generated from investing activities |
( |
) |
( |
) |
||||||||||||
Financing activities |
||||||||||||||||
Proceeds from shareholders’ capital injection |
||||||||||||||||
Proceeds from the Reverse Recapitalization |
— | |||||||||||||||
Payments of transaction costs related to the Reverse Recapitalization |
— | ( |
) | |||||||||||||
Proceeds from financing fund |
||||||||||||||||
Proceeds from borrowings |
||||||||||||||||
Repayments of borrowings |
( |
) | ( |
) | ( |
) | ||||||||||
Repayments of lease liabilities |
( |
) | ( |
) | ( |
) | ||||||||||
Payment of borrowings interest |
( |
) | ( |
) | ( |
) | ||||||||||
Payment of lease liabilities interest |
( |
) | ( |
) | ( |
) | ||||||||||
Capital contribution from non-controlling interests |
||||||||||||||||
Changes in ownership interest in a subsidiary without change of control |
( |
) | ( |
) |
( |
) | ||||||||||
Net cash generated from financing activities |
34 |
|||||||||||||||
Net change in cash and cash equivalents |
( |
) |
||||||||||||||
Cash and cash equivalents less bank overdrafts at the beginning of the year |
||||||||||||||||
Effect of foreign exchange differences on cash and cash equivalents |
( |
) |
||||||||||||||
Cash and cash equivalents less bank overdrafts at the end of the year |
||||||||||||||||
Attributable to owners of the Company |
Non-controlling interests |
Total equity |
||||||||||||||||||||||||||||||
(Euro thousands) |
Notes |
Issued capital |
Treasury shares |
Other Reserves |
Accumulated losses |
Total |
||||||||||||||||||||||||||
| Balance at January 1, 2021 |
( |
) |
||||||||||||||||||||||||||||||
| |
|
|
|
|
|
|
|
|
|
|
|
|
|
|||||||||||||||||||
| Comprehensive loss |
||||||||||||||||||||||||||||||||
| Loss for the year |
— | — | — | ( |
) | ( |
) | ( |
) | ( |
) | |||||||||||||||||||||
| Currency translation difference |
— | — | ( |
) | — | ( |
) | ( |
) | ( |
) | |||||||||||||||||||||
| Net actuarial losses from defined benefit plans |
— | — | ( |
) | — | ( |
) | ( |
) | ( |
) | |||||||||||||||||||||
| |
|
|
|
|
|
|
|
|
|
|
|
|
|
|||||||||||||||||||
| Total comprehensive loss |
— |
— |
( |
) |
( |
) |
( |
) |
( |
) |
( |
) | ||||||||||||||||||||
| |
|
|
|
|
|
|
|
|
|
|
|
|
|
|||||||||||||||||||
| Transactions with owners |
||||||||||||||||||||||||||||||||
| Capital injection from shareholders |
29 | — | — | — | ||||||||||||||||||||||||||||
| Employee share-based compensation |
32 | ( |
) | — | — | |||||||||||||||||||||||||||
| Capital contribution from non-controlling interests |
— | — | — | |||||||||||||||||||||||||||||
| Changes in ownership interest in subsidiaries without change of control |
— | — | — | ( |
) | ( |
) | |||||||||||||||||||||||||
| |
|
|
|
|
|
|
|
|
|
|
|
|
|
|||||||||||||||||||
| Total transactions with owners |
( |
) |
— |
( |
) |
|||||||||||||||||||||||||||
| |
|
|
|
|
|
|
|
|
|
|
|
|
|
|||||||||||||||||||
| Balance at December 31, 2021 |
( |
) |
( |
) |
||||||||||||||||||||||||||||
| |
|
|
|
|
|
|
|
|
|
|
|
|
|
|||||||||||||||||||
| Balance at January 1, 2022 |
( |
) |
( |
) |
||||||||||||||||||||||||||||
| |
|
|
|
|
|
|
|
|
|
|
|
|
|
|||||||||||||||||||
| Comprehensive loss |
||||||||||||||||||||||||||||||||
| Loss for the year |
— | — | — | ( |
) | ( |
) | ( |
) | ( |
) | |||||||||||||||||||||
| Currency translation difference |
— | — | ( |
) | — | ( |
) | ( |
) | ( |
) | |||||||||||||||||||||
| Net actuarial gains from defined benefit plans |
— | — | — | |||||||||||||||||||||||||||||
| |
|
|
|
|
|
|
|
|
|
|
|
|
|
|||||||||||||||||||
| Total comprehensive loss |
— |
— |
( |
) |
( |
) |
( |
) |
( |
) | ||||||||||||||||||||||
| |
|
|
|
|
|
|
|
|
|
|
|
|
|
|||||||||||||||||||
| Transactions with owners |
||||||||||||||||||||||||||||||||
| Capital injection from shareholders |
29 | ( |
) | — | — | — | — | |||||||||||||||||||||||||
| Employee share-based compensation |
32 | — | — | — | — | |||||||||||||||||||||||||||
| Capital contribution from non-controlling interests |
— | — | — | — | ||||||||||||||||||||||||||||
| Changes in ownership interest in a subsidiary without change of control |
— | — | ( |
) | — | ( |
) | ( |
) | |||||||||||||||||||||||
| Issuance of ordinary shares upon Reverse Recapitalization (refer to Note 1 for definition), net of issuance costs |
( |
) | — | — | ||||||||||||||||||||||||||||
| |
|
|
|
|
|
|
|
|
|
|
|
|
|
|||||||||||||||||||
| Total transactions with owners |
( |
) |
( |
) |
— |
|||||||||||||||||||||||||||
| |
|
|
|
|
|
|
|
|
|
|
|
|
|
|||||||||||||||||||
| Balance at December 31, 2022 |
* |
( |
) |
( |
) |
|||||||||||||||||||||||||||
| |
|
|
|
|
|
|
|
|
|
|
|
|
|
|||||||||||||||||||
| Balance at January 1, 2023 |
* |
( |
) |
( |
) |
|||||||||||||||||||||||||||
| |
|
|
|
|
|
|
|
|
|
|
|
|
|
|||||||||||||||||||
| Comprehensive loss |
||||||||||||||||||||||||||||||||
| Loss for the year |
— | — | — | ( |
) | ( |
) | ( |
) | ( |
) | |||||||||||||||||||||
| Currency translation difference |
— | — | — | |||||||||||||||||||||||||||||
| Net actuarial losses from defined benefit plans |
— | — | ( |
) | — | ( |
) | ( |
) | ( |
) | |||||||||||||||||||||
| |
|
|
|
|
|
|
|
|
|
|
|
|
|
|||||||||||||||||||
| Total comprehensive loss |
— |
— |
( |
) |
( |
) |
( |
) |
( |
) | ||||||||||||||||||||||
| |
|
|
|
|
|
|
|
|
|
|
|
|
|
|||||||||||||||||||
| Transactions with owners |
||||||||||||||||||||||||||||||||
| Capital injection from shareholders |
29 | * | ( |
) | — | — | — | — | ||||||||||||||||||||||||
| Employee share-based compensation |
32 | — | — | — | — | |||||||||||||||||||||||||||
| Capital contribution from non-controlling interests |
— | — | — | — | — | |||||||||||||||||||||||||||
| Changes in ownership interest in a subsidiary without change of control |
— | — | ( |
) | — | ( |
) | ( |
) | |||||||||||||||||||||||
| |
|
|
|
|
|
|
|
|
|
|
|
|
|
|||||||||||||||||||
| Total transactions with owners |
* |
( |
) |
— |
||||||||||||||||||||||||||||
| |
|
|
|
|
|
|
|
|
|
|
|
|
|
|||||||||||||||||||
| Balance at December 31, 2023 |
* |
( |
) |
( |
) |
( |
) |
|||||||||||||||||||||||||
| |
|
|
|
|
|
|
|
|
|
|
|
|
|
|||||||||||||||||||
| * | Amount less than € |
1. |
General information |
| • | a special purpose acquisition company (“SPAC”) Primavera Capital Acquisition Corporation (“PCAC”), incorporated in the Cayman Islands and listed on the New York Stock Exchange (“NYSE”); and merging on December 14, 2022 (“Closing Date”) with Lanvin Group Heritage I Limited (“Merger Sub 1”), incorporated in the Cayman Islands and a direct wholly owned subsidiary of LGHL; with Merger Sub 1 surviving and remaining as a wholly owned subsidiary of LGHL; |
| • | FFG merging on December 14, 2022 with Lanvin Group Heritage II Limited (“Merger Sub 2”), incorporated in the Cayman Islands and a direct wholly owned subsidiary of LGHL; with FFG surviving and becoming a wholly owned subsidiary of LGHL; |
| • | FFG merging on December 14, 2022 with Merger Sub 1, with FFG surviving and becoming a wholly owned subsidiary of LGHL; |
| • | additional capitalization by way of the issuance of LGHL shares to third party investors on December 14, 2022 pursuant to investment commitments in previously agreed subscription agreements; and |
| • | the Company becoming a publicly traded company on NYSE on December 14, 2022. |
2. |
Basis of preparation |
3. |
Summary of significant accounting policies |
New IFRS Standards and Amendments to existing standards |
Effective date |
|||
| IFRS 17 Insurance Contracts |
||||
| IAS 1 Disclosure of Accounting Policies (Amendments to IAS 1 and IFRS Practice Statement 2) |
||||
| IAS 12 Deferred Tax related to Assets and Liabilities arising from a Single Transaction (Amendments to IAS 12) |
||||
| IAS 8 Definition of Accounting Estimates |
||||
| IAS 12 International Tax Reform- Pillar Two Model Rules (Amendments to IAS 12) |
||||
New IFRS Standards and Amendments to existing standards |
Effective date |
|||
| IAS 1 Non-current Liabilities with Covenants (Amendments to IAS 1) |
||||
| IAS 1 Classification of Liabilities as Current or Non-current (Amendments to IAS 1) |
||||
| IFRS 16 Lease Liability in a Sale and Leaseback (Amendments to IFRS 16) |
||||
| IAS 7 and IFRS 7 Supplier Finance Arrangements (Amendments to IAS 7 and IFRS 7) |
||||
| IAS 21 Lack of Exchangeability (Amendments to IAS 21) |
||||
2023 |
2022 |
2021 |
||||||||||||||||||||||
At December 31 |
Average |
At December 31 |
Average |
At December 31 |
Average |
|||||||||||||||||||
CNY |
||||||||||||||||||||||||
CHF |
||||||||||||||||||||||||
GBP |
||||||||||||||||||||||||
HKD |
||||||||||||||||||||||||
INR |
||||||||||||||||||||||||
JPY |
||||||||||||||||||||||||
MXN |
||||||||||||||||||||||||
SEK |
||||||||||||||||||||||||
SGD |
||||||||||||||||||||||||
USD |
||||||||||||||||||||||||
Company |
Registered office |
Nominal value of registered capital |
% of Group |
|||||||||||
2023 |
2022 |
|||||||||||||
| Euro |
||||||||||||||
| HKD |
||||||||||||||
| USD |
||||||||||||||
| USD |
||||||||||||||
| Euro |
||||||||||||||
| HKD |
||||||||||||||
| HKD |
||||||||||||||
| Euro |
||||||||||||||
| Euro |
||||||||||||||
| CNY |
||||||||||||||
| Euro |
||||||||||||||
| Euro |
||||||||||||||
| USD |
||||||||||||||
| USD |
||||||||||||||
| HKD |
||||||||||||||
| Euro |
||||||||||||||
| SGD |
||||||||||||||
| USD |
||||||||||||||
| CNY |
N.A. | |||||||||||||
| USD |
N.A. | |||||||||||||
| Euro |
||||||||||||||
| Euro |
||||||||||||||
| Euro |
||||||||||||||
| USD |
||||||||||||||
| Euro |
||||||||||||||
| Euro |
||||||||||||||
| Euro |
||||||||||||||
| USD |
||||||||||||||
| Euro |
||||||||||||||
| USD |
||||||||||||||
| USD |
||||||||||||||
| USD |
||||||||||||||
| USD |
||||||||||||||
| USD |
||||||||||||||
| USD |
||||||||||||||
| USD |
N.A. | |||||||||||||
| USD |
||||||||||||||
| Euro |
||||||||||||||
| Euro |
||||||||||||||
| JPY |
||||||||||||||
| HKD |
||||||||||||||
| USD |
||||||||||||||
| MOP |
||||||||||||||
| TWD |
||||||||||||||
| GBP |
||||||||||||||
| Euro |
N.A. | |||||||||||||
| JPY |
N.A. | N.A. | ||||||||||||
| HKD |
N.A. | |||||||||||||
| USD |
N.A. | |||||||||||||
| Euro |
N.A. | |||||||||||||
| Euro |
||||||||||||||
| Euro |
||||||||||||||
| CHF |
||||||||||||||
| GBP |
||||||||||||||
| Euro |
||||||||||||||
| Euro |
||||||||||||||
| Euro |
||||||||||||||
| DKK |
||||||||||||||
| N.A. | ||||||||||||||
Company |
Registered office |
Nominal value of registered capital |
% of Group |
|||||||||||
2023 |
2022 |
|||||||||||||
| |
Amsterdam, Netherlands |
Euro |
||||||||||||
| |
Vancouver, Canada |
CAD |
||||||||||||
| |
HKD |
|||||||||||||
| |
Euro |
|||||||||||||
| |
Euro |
|||||||||||||
| |
Euro |
|||||||||||||
| |
USD |
|||||||||||||
| |
HKD |
|||||||||||||
| |
N.A. | |||||||||||||
| |
HKD |
|||||||||||||
| |
USD |
|||||||||||||
| |
USD |
|||||||||||||
| |
PES |
|||||||||||||
| |
CNY |
N.A. | ||||||||||||
| |
Euro |
|||||||||||||
| |
USD |
|||||||||||||
| |
GBP |
|||||||||||||
| |
JPY |
|||||||||||||
| |
HKD |
|||||||||||||
| |
Euro |
|||||||||||||
| |
Euro |
|||||||||||||
| Buildings |
||||
| Machinery and equipment |
||||
| Leasehold improvements |
||||
| Office equipment |
||||
| Other |
Trademarks and patents |
||||
Software |
||||
Other |
| • | Financial assets at amortized cost; |
| • | Financial assets at fair value through other comprehensive income/(loss), with subsequent recycling of cumulative gains and losses to the statement of profit or loss (“FVOCI”); or |
| • | Financial assets at fair value through profit or loss (“FVPL”). |
| • | including any market performance conditions (for example, an entity’s share price); |
| • | excluding the impact of any service and non-market performance vesting conditions (for example, profitability, sales growth targets and remaining an employee of the entity over a specified time period); and |
| • | including the impact of any non-vesting conditions (for example, the requirement for employees to save or hold shares for a specified period of time). |
4. |
Financial risk management |
At December 31, |
||||||||
(Euro thousands) |
2023 |
2022 |
||||||
| Cash and cash equivalents |
||||||||
| |
|
|
|
|||||
| Non-current borrowings |
( |
) |
( |
) | ||||
| Current borrowings |
( |
) |
( |
) | ||||
| |
|
|
|
|||||
| Borrowings |
( |
) |
( |
) | ||||
| |
|
|
|
|||||
| Bank overdrafts |
( |
) |
( |
) | ||||
| |
|
|
|
|||||
| Cash net of debt |
( |
) |
||||||
| |
|
|
|
|||||
At December 31, |
||||||||
(Euro thousands) |
2023 |
2022 |
||||||
| Cash net of debt |
( |
) | ||||||
| Total equity |
||||||||
| |
|
|
|
|||||
| Total capital |
||||||||
| |
|
|
|
|||||
| Gearing ratio |
% |
( |
%) | |||||
| |
|
|
|
|||||
| • | Quoted prices (unadjusted) in active markets for identical assets or liabilities (level 1). |
| • | Inputs other than quoted prices included within level 1 that are observable for the asset or liability, either directly (that is, as prices) or indirectly (that is, derived from prices) (level 2). |
| • | Inputs for the asset or liability that are not based on observable market data (that is, unobservable inputs) (level 3). |
At December 31, |
||||||||
(Euro thousands) |
2023 |
2022 |
||||||
Assets |
||||||||
Other non-current assets |
||||||||
- Financial assets at fair value through profit or loss |
||||||||
Level 1 |
||||||||
Level 3 |
||||||||
Liabilities |
||||||||
Other current liabilities |
||||||||
- Warrant liabilities |
||||||||
Level 1 |
||||||||
Level 3 |
||||||||
(a) |
Market risk |
At December 31, 2023 |
At December 31, 2022 |
|||||||||||||||
(Euro thousands) |
Increase / (decrease) in loss before tax if Euro strengthens by 5% |
Increase / (decrease) in loss before tax if Euro weakens by 5% |
Increase / (decrease) in loss before tax if Euro strengthens by 5% |
Increase / (decrease) in loss before tax if Euro weakens by 5% |
||||||||||||
USD |
( |
) | ( |
) | ||||||||||||
CNY |
( |
) | ( |
) | ||||||||||||
HKD |
( |
) | ( |
) | ||||||||||||
GBP |
( |
) |
( |
) | ||||||||||||
JPY |
( |
) | ( |
) | ||||||||||||
Total |
( |
) |
( |
) |
||||||||||||
(Euro thousands) |
Increase/(decrease) in basis points |
Increase/(decrease) in loss before tax |
||||||
2023 |
||||||||
| ( |
) | ( |
) | |||||
2022 |
||||||||
| ( |
) | ( |
) | |||||
(b) |
Credit risk |
(Euro thousands) |
Not yet due |
0-90 days overdue |
90-180 days overdue |
>180 days overdue |
Total |
|||||||||||||||
| Trade receivables, gross |
||||||||||||||||||||
| Loss allowance |
( |
) | ( |
) | ( |
) | ( |
) | ||||||||||||
| |
|
|
|
|
|
|
|
|
|
|||||||||||
| Total trade receivables at December 31, 2023 |
||||||||||||||||||||
| |
|
|
|
|
|
|
|
|
|
|||||||||||
| Trade receivables, gross |
||||||||||||||||||||
| Loss allowance |
— | ( |
) | ( |
) | ( |
) | ( |
) | |||||||||||
| |
|
|
|
|
|
|
|
|
|
|||||||||||
| Total trade receivables at December 31, 2022 |
||||||||||||||||||||
| |
|
|
|
|
|
|
|
|
|
|||||||||||
(c) |
Liquidity risk |
As at December 31, 2023 |
||||||||||||||||||||
On demand |
Less than 1 year |
1 to 3 years |
Over 3 years |
Total |
||||||||||||||||
| Trade payables |
||||||||||||||||||||
| Other current liabilities |
||||||||||||||||||||
| Lease liabilities |
||||||||||||||||||||
| Bank overdrafts |
||||||||||||||||||||
| Borrowings |
||||||||||||||||||||
| |
|
|
|
|
|
|
|
|
|
|||||||||||
| |
|
|
|
|
|
|
|
|
|
|||||||||||
As at December 31, 2022 |
||||||||||||||||||||
On demand |
Less than 1 year |
1 to 3 years |
Over 3 years |
Total |
||||||||||||||||
| Trade payables |
— |
— |
||||||||||||||||||
| Other current liabilities |
— |
— |
||||||||||||||||||
| Lease liabilities |
— |
|||||||||||||||||||
| Bank overdrafts |
— |
— |
— |
|||||||||||||||||
| Borrowings |
— |
|||||||||||||||||||
| |
|
|
|
|
|
|
|
|
|
|||||||||||
| |
|
|
|
|
|
|
|
|
|
|||||||||||
5. |
Use of estimates |
6. |
Reverse Recapitalization |
| • | the assets and liabilities of FFG recognized and measured in the LGHL consolidated financial statements at their carrying amounts immediately prior to the Reverse Recapitalization; |
| • | the retained earnings and other equity balances of FFG recognized in the LGHL consolidated financial statements at amounts immediately prior to the Reverse Recapitalization; |
| • | the comparative information presented in the LGHL consolidated financial statements are that of FFG Group. |
| • | FFG’s previous shareholders have the largest voting rights in LGHL; |
| • | FFG’s previous shareholders have the right to nominate, appoint and remove the majority of the members on the LGHL board of directors; |
| • | FFG’s previous key management personnel are the current key management personnel of LGHL; |
| • | the business of LGHL is a continuation of the ongoing operations of FFG; and |
| • | FFG is the larger entity in terms of substantive operations and employee base. |
(Euro thousands) |
||||
Net assets of PCAC |
( |
) | ||
IFRS 2 Expense on the Closing Date |
||||
(Euro thousands) |
||||
Proceeds from the Reverse Recapitalization |
||||
Payments of transaction costs related to the Reverse Recapitalization |
( |
) | ||
Net cash proceeds from the Reverse Recapitalization |
||||
| • | at the Closing Date and immediately prior to the Reverse Recapitalization, LGHL effected a share subdivision and redesignation such that each authorized, issued and unissued share of LGHL of a par value of $ sub-divided on a re-designation of shares such that the authorized share capital of LGHL is $non-voting ordinary shares with a par value of $ |
| • | additional capitalization by way of the issuance of LGHL shares to third party investors on December 14, 2022, pursuant to investment commitments in previously agreed subscription agreements in which the investors committed to subscribe for and purchase 29 ) for an aggregate purchase price of $ |
| • | Costs of approximately € € € € € |
7. |
Segment reporting |
For the year ended December 31, 2023 |
||||||||||||||||||||||||||||||||
(Euro thousands) |
Lanvin |
Wolford |
Caruso |
St. John |
Sergio Rossi |
Other and holding companies |
Eliminations and Unallocated |
Group Consolidated |
||||||||||||||||||||||||
| Segment results |
||||||||||||||||||||||||||||||||
| Sales outside the Group |
||||||||||||||||||||||||||||||||
| Intra-Group sales |
( |
) |
||||||||||||||||||||||||||||||
| |
|
|
|
|
|
|
|
|
|
|
|
|
|
|
|
|||||||||||||||||
| Total revenue |
( |
) | ||||||||||||||||||||||||||||||
| Cost of sales |
( |
) | ( |
) |
( |
) |
( |
) |
( |
) |
( |
) |
( |
) | ||||||||||||||||||
| |
|
|
|
|
|
|
|
|
|
|
|
|
|
|
|
|||||||||||||||||
| Gross profit |
( |
) | ||||||||||||||||||||||||||||||
| |
|
|
|
|
|
|
|
|
|
|
|
|
|
|
|
|||||||||||||||||
| Loss from operations before non-underlying items |
( |
) | ||||||||||||||||||||||||||||||
| Non-underlying items |
( |
) | ||||||||||||||||||||||||||||||
| Finance cost – net |
( |
) | ||||||||||||||||||||||||||||||
| |
|
|||||||||||||||||||||||||||||||
| Loss before income tax |
( |
) | ||||||||||||||||||||||||||||||
| Income tax benefits |
( |
) | ||||||||||||||||||||||||||||||
| |
|
|||||||||||||||||||||||||||||||
| Loss for the year |
( |
) | ||||||||||||||||||||||||||||||
| |
|
|||||||||||||||||||||||||||||||
| Other segment information |
||||||||||||||||||||||||||||||||
| Depreciation and amortization |
||||||||||||||||||||||||||||||||
| Of which: Right-of-use |
||||||||||||||||||||||||||||||||
| Other |
||||||||||||||||||||||||||||||||
| Provisions |
( |
) |
( |
) | ||||||||||||||||||||||||||||
| For the year ended December 31, 2022 | ||||||||||||||||||||||||||||||||
(Euro thousands) |
Lanvin | Wolford | Caruso | St. John | Sergio Rossi |
Other and holding companies |
Eliminations and Unallocated |
Group Consolidated |
||||||||||||||||||||||||
| Segment results |
||||||||||||||||||||||||||||||||
| Sales outside the Group |
||||||||||||||||||||||||||||||||
| Intra-Group sales |
( |
) | ||||||||||||||||||||||||||||||
| |
|
|
|
|
|
|
|
|
|
|
|
|
|
|
|
|||||||||||||||||
| Total revenue |
( |
) | ||||||||||||||||||||||||||||||
| Cost of sales |
( |
) | ( |
) | ( |
) | ( |
) | ( |
) | ( |
) | ( |
) | ||||||||||||||||||
| |
|
|
|
|
|
|
|
|
|
|
|
|
|
|
|
|||||||||||||||||
| Gross profit |
( |
) | ||||||||||||||||||||||||||||||
| |
|
|
|
|
|
|
|
|
|
|
|
|
|
|
|
|||||||||||||||||
| Loss from operations before non-underlying items |
( |
) | ||||||||||||||||||||||||||||||
| Non-underlying items |
( |
) | ||||||||||||||||||||||||||||||
| Finance cost – net |
( |
) | ||||||||||||||||||||||||||||||
| |
|
|||||||||||||||||||||||||||||||
| Loss before income tax |
( |
) | ||||||||||||||||||||||||||||||
| Income tax expenses |
||||||||||||||||||||||||||||||||
| |
|
|||||||||||||||||||||||||||||||
| Loss for the year |
( |
) | ||||||||||||||||||||||||||||||
| |
|
|||||||||||||||||||||||||||||||
| Other segment information |
||||||||||||||||||||||||||||||||
| Depreciation and amortization |
— | |||||||||||||||||||||||||||||||
| Of which: Right-of-use |
— | |||||||||||||||||||||||||||||||
| Other |
— | |||||||||||||||||||||||||||||||
| Provisions |
( |
) | ( |
) | — | |||||||||||||||||||||||||||
| For the year ended December 31, 2021 | ||||||||||||||||||||||||||||||||
(Euro thousands) |
Lanvin | Wolford | Caruso | St. John | Sergio Rossi |
Other and holding companies |
Eliminations and Unallocated |
Group Consolidated |
||||||||||||||||||||||||
| Segment results |
||||||||||||||||||||||||||||||||
| Sales outside the Group |
— | |||||||||||||||||||||||||||||||
| Intra-Group sales |
— | — | — | — | ( |
) | — | |||||||||||||||||||||||||
| |
|
|
|
|
|
|
|
|
|
|
|
|
|
|
|
|||||||||||||||||
| Total revenue |
( |
) | ||||||||||||||||||||||||||||||
| Cost of sales |
( |
) | ( |
) | ( |
) | ( |
) | ( |
) | ( |
) | ( |
) | ||||||||||||||||||
| |
|
|
|
|
|
|
|
|
|
|
|
|
|
|
|
|||||||||||||||||
| Gross profit |
( |
) | ||||||||||||||||||||||||||||||
| |
|
|
|
|
|
|
|
|
|
|
|
|
|
|
|
|||||||||||||||||
| Loss from operations before non-underlying items |
( |
) | ||||||||||||||||||||||||||||||
| Non-underlying items |
||||||||||||||||||||||||||||||||
| Finance cost – net |
( |
) | ||||||||||||||||||||||||||||||
| |
|
|||||||||||||||||||||||||||||||
| Loss before income tax |
( |
) | ||||||||||||||||||||||||||||||
| Income tax benefits |
( |
) | ||||||||||||||||||||||||||||||
| |
|
|||||||||||||||||||||||||||||||
| Loss for the year |
( |
) | ||||||||||||||||||||||||||||||
| |
|
|||||||||||||||||||||||||||||||
| Other segment information |
||||||||||||||||||||||||||||||||
| Depreciation and amortization |
— | |||||||||||||||||||||||||||||||
| Of which: Right-of-use |
— | — | ||||||||||||||||||||||||||||||
| Other |
— | |||||||||||||||||||||||||||||||
| Provisions |
( |
) | ( |
) | ( |
) | — | |||||||||||||||||||||||||
At December 31, |
||||||||
(Euro thousands) |
2023 |
2022 |
||||||
| EMEA (1) |
||||||||
| North America (2) |
||||||||
| Greater China (3) |
||||||||
| Other Asia (4) |
||||||||
| |
|
|
|
|||||
| Total non-current assets (other than deferred tax assets) |
||||||||
| |
|
|
|
|||||
(1) |
EMEA includes EU countries, the United Kingdom, Switzerland, the countries of the Balkan Peninsula, Eastern Europe, Scandinavian, Azerbaijan, Kazakhstan and the Middle East. |
(2) |
North America includes the United States of America and Canada. |
(3) |
Greater China includes Mainland China, Hong Kong, Macao and Taiwan. |
(4) |
Other Asia includes Japan, South Korea, Thailand, Malaysia, Vietnam, Indonesia, Philippines, Australia, New Zealand, India and other Southeast Asian countries. |
8. |
Revenue |
For the years ended December 31, |
||||||||||||
(Euro thousands) |
2023 |
2022 |
2021 |
|||||||||
| Direct To Consumer (DTC) |
||||||||||||
| Wholesale |
||||||||||||
| Other |
||||||||||||
| |
|
|
|
|
|
|||||||
| Total revenue by sales channel |
||||||||||||
| |
|
|
|
|
|
|||||||
For the years ended December 31, |
||||||||||||
(Euro thousands) |
2023 |
2022 |
2021 |
|||||||||
| EMEA |
||||||||||||
| North America |
||||||||||||
| Greater China |
||||||||||||
| Other Asia |
||||||||||||
| |
|
|
|
|
|
|||||||
| Total revenue |
||||||||||||
| |
|
|
|
|
|
|||||||
9. |
Expenses by nature |
For the years ended December 31, |
||||||||||||
(Euro thousands) |
2023 |
2022 |
2021 |
|||||||||
| Personnel costs |
||||||||||||
| Raw materials, consumables and finished goods used |
||||||||||||
| Changes in inventories of finished goods and work in progress |
( |
) |
( |
) | ||||||||
| Freight and selling expenses |
||||||||||||
| Depreciation and amortization |
||||||||||||
| Professional service fees |
||||||||||||
| Advertising and marketing expenses |
||||||||||||
| Lease expenses |
||||||||||||
| Studies and research expenses |
||||||||||||
| Office expenses |
||||||||||||
| Travel expenses |
||||||||||||
| Net foreign exchange (gains) / losses |
( |
) | ||||||||||
| Taxes and surcharges |
||||||||||||
| Provisions and impairment losses |
||||||||||||
| Fair value changes on warrants |
( |
) |
||||||||||
| Other |
||||||||||||
| |
|
|
|
|
|
|||||||
| Total expenses |
||||||||||||
| |
|
|
|
|
|
|||||||
For the years ended December 31, |
||||||||||||
(Euro thousands) |
2023 |
2022 |
2021 |
|||||||||
| Salaries and wages |
||||||||||||
| Social contributions and pension plans |
||||||||||||
| Employee share-based compensation |
||||||||||||
| Severance indemnities |
||||||||||||
| Other benefits |
||||||||||||
| |
|
|
|
|
|
|||||||
| Total personnel costs |
||||||||||||
| |
|
|
|
|
|
|||||||
For the years ended December 31, |
||||||||||||
(Euro thousands) |
2023 |
2022 |
2021 |
|||||||||
| Variable lease payments |
||||||||||||
| Expenses relating to short-term leases |
||||||||||||
| Expenses relating to low-value leases |
||||||||||||
| Rent concessions |
( |
) | ||||||||||
| |
|
|
|
|
|
|||||||
| Total lease expenses |
||||||||||||
| |
|
|
|
|
|
|||||||
For the years ended December 31, |
||||||||||||
(Euro thousands) |
2023 |
2022 |
2021 |
|||||||||
| (Write-off)/allowance of obsolete inventories |
( |
) |
||||||||||
| Provisions for trade and other receivables |
||||||||||||
| Other provisions |
( |
) | ||||||||||
| Impairment/(reversal) of right-of-use |
( |
) | ||||||||||
| Impairment of property, plant and equipment |
||||||||||||
| |
|
|
|
|
|
|||||||
| Total provisions and impairment losses |
||||||||||||
| |
|
|
|
|
|
|||||||
10. |
Non-underlying items |
For the years ended December 31, |
||||||||||||
(Euro thousands) |
2023 |
2022 |
2021 |
|||||||||
| Net gain on disposals |
||||||||||||
| Government grants |
||||||||||||
| Restructuring costs |
( |
) | ||||||||||
| Costs in respect of disputes |
( |
) |
||||||||||
| Cost related to the Reverse Recapitalization |
( |
) | ||||||||||
| Negative goodwill from acquisition of a subsidiary |
||||||||||||
| Gain on debt restructuring |
||||||||||||
| Other |
( |
) | ||||||||||
| |
|
|
|
|
|
|||||||
| Total non-underlying items |
( |
) |
( |
) |
||||||||
| |
|
|
|
|
|
|||||||
11. |
Finance cost – net |
For the years ended December 31, |
||||||||||||
(Euro thousands) |
2023 |
2022 |
2021 |
|||||||||
Finance income |
||||||||||||
- Net foreign exchange gains |
||||||||||||
- Interest income |
||||||||||||
Total finance income |
||||||||||||
Finance expenses |
||||||||||||
- Interest expense on lease liabilities |
( |
) |
( |
) |
( |
) | ||||||
- Interest expense on borrowings |
( |
) |
( |
) |
( |
) | ||||||
- Net foreign exchange losses |
( |
) |
— |
|||||||||
- Other |
( |
) |
( |
) |
( |
) | ||||||
Total finance expenses |
( |
) |
( |
) |
( |
) | ||||||
Total finance cost - net |
( |
) |
( |
) |
( |
) | ||||||
12. |
Income tax benefits / (expenses) |
For the years ended December 31, |
||||||||||||
(Euro thousands) |
2023 |
2022 |
2021 |
|||||||||
Current taxes |
( |
) |
( |
) |
( |
) | ||||||
Deferred taxes |
( |
) |
( |
) | ||||||||
Income tax benefits / (expenses) |
( |
) |
( |
) | ||||||||
For the years ended December 31, |
||||||||||||
(Euro thousands) |
2023 |
2022 |
2021 |
|||||||||
Loss before tax |
( |
) |
( |
) |
( |
) | ||||||
Total income tax benefits / (expenses) |
( |
) |
( |
) | ||||||||
Effective tax rate |
( |
)% |
% |
( |
)% | |||||||
For the years ended December 31, |
||||||||||||
(Euro thousands) |
2023 |
2022 |
2021 |
|||||||||
Loss before tax |
( |
) |
( |
) |
( |
) | ||||||
Group’s weighted theoretical tax (calculated in absolute values on the basis of subsidiaries’ pre-taxable income/loss) |
||||||||||||
Tax effect on: |
||||||||||||
Differences between foreign tax rates and the theoretical applicable tax rate a |
( |
) |
( |
) |
||||||||
Taxes relating to prior years |
( |
) |
||||||||||
Deferred tax assets not recognized |
( |
) |
( |
) |
( |
) | ||||||
Other tax items |
||||||||||||
Total income tax benefits / (expenses) |
( |
) |
( |
) | ||||||||
(Euro thousands) |
At December 31, 2022 |
Increase from business combination |
Recognized in profit or loss |
Recognized in other comprehensive loss |
Exchange difference and other |
At December 31, 2023 |
||||||||||||||||||
Deferred tax assets arising on: |
||||||||||||||||||||||||
Employee benefits |
( |
) | ( |
) | ||||||||||||||||||||
Property plant and equipment |
( |
) | ||||||||||||||||||||||
Deferred tax assets on rental contracts; if any |
( |
) | ( |
) | ||||||||||||||||||||
Intangible assets |
( |
) | ||||||||||||||||||||||
Inventories |
( |
) | ( |
) | ||||||||||||||||||||
Provisions and accrued expenses |
||||||||||||||||||||||||
Receivables and other assets |
||||||||||||||||||||||||
Tax losses |
( |
) | ||||||||||||||||||||||
Other |
||||||||||||||||||||||||
Total deferred tax assets |
( |
) |
( |
) |
||||||||||||||||||||
Deferred tax liabilities arising on: |
||||||||||||||||||||||||
Deferred tax liabilities on rental contracts; if any |
( |
) | ||||||||||||||||||||||
Intangible assets |
( |
) | ||||||||||||||||||||||
Receivables and other assets |
( |
) | ||||||||||||||||||||||
Other |
( |
) | ||||||||||||||||||||||
Total deferred tax liabilities |
( |
) |
( |
) |
||||||||||||||||||||
(Euro thousands) |
At December 31, 2021 |
Increase from business combination |
Recognized in profit or loss |
Recognized in other comprehensive loss |
Exchange difference and other |
At December 31, 2022 |
||||||||||||||||||
Deferred tax assets arising on: |
||||||||||||||||||||||||
Employee benefits |
( |
) | ( |
) | ||||||||||||||||||||
Property plant and equipment |
||||||||||||||||||||||||
Deferred tax assets on rental contracts; if any |
( |
) | ||||||||||||||||||||||
Intangible assets |
( |
) | ||||||||||||||||||||||
Inventories |
||||||||||||||||||||||||
Provisions and accrued expenses |
||||||||||||||||||||||||
Receivables and other assets |
( |
) | ||||||||||||||||||||||
Tax losses |
( |
) | ( |
) | ||||||||||||||||||||
Other |
( |
) | ||||||||||||||||||||||
Total deferred tax assets |
( |
) |
( |
) |
( |
) |
||||||||||||||||||
Deferred tax liabilities arising on: |
||||||||||||||||||||||||
Deferred tax liabilities on rental contracts; if any |
— | ( |
) | — | ||||||||||||||||||||
Intangible assets |
||||||||||||||||||||||||
Receivables and other assets |
( |
) | ||||||||||||||||||||||
Other |
||||||||||||||||||||||||
Total deferred tax liabilities |
( |
) |
||||||||||||||||||||||
At December 31, |
||||||||
(Euro thousands) |
2023 |
2022 |
||||||
Expiry within 5 years |
||||||||
Expiry over 5 years |
||||||||
No expiration |
||||||||
Total tax losses carried forward |
||||||||
13. |
Loss per share |
For the years ended December 31, |
||||||||||||
(Euro thousands) |
2023 |
2022 |
2021 |
|||||||||
Net loss attributable to ordinary shares |
( |
) | ( |
) | ( |
) | ||||||
Weighted-average shares outstanding-basic and diluted (thousand shares) |
||||||||||||
Net loss per share: |
||||||||||||
Basic and diluted (in Euro) |
( |
) |
( |
) |
( |
) | ||||||
At December 31, |
||||||||||||
(Thousand shares) |
2023 |
2022 |
2021 |
|||||||||
Warrants |
||||||||||||
Treasury shares |
||||||||||||
Convertible preference shares |
||||||||||||
Total outstanding shares of potentially dilutive securities |
||||||||||||
14. |
Intangible assets |
(Euro thousands) |
Brands |
Trademarks and patents |
Software |
Intangible assets in progress |
Other |
Total |
||||||||||||||||||
| Historical cost |
||||||||||||||||||||||||
| At January 1, 2022 |
||||||||||||||||||||||||
| Additions |
— | |||||||||||||||||||||||
| Transfer from construction in progress |
— | — | ( |
) | — | — | ||||||||||||||||||
| Disposals |
— | ( |
) | ( |
) | ( |
) | |||||||||||||||||
| Net foreign exchange differences |
— | — | — | |||||||||||||||||||||
| |
|
|
|
|
|
|
|
|
|
|
|
|||||||||||||
| At December 31, 2022 |
||||||||||||||||||||||||
| Additions |
— | |||||||||||||||||||||||
| Transfer from construction in progress |
— | ( |
) | |||||||||||||||||||||
| Disposals |
— | ( |
) | ( |
) | ( |
) | |||||||||||||||||
| Net foreign exchange differences |
— | ( |
) | ( |
) | ( |
) | ( |
) | |||||||||||||||
| |
|
|
|
|
|
|
|
|
|
|
|
|||||||||||||
| At December 31, 2023 |
||||||||||||||||||||||||
| |
|
|
|
|
|
|
|
|
|
|
|
|||||||||||||
| Amortization and impairment |
||||||||||||||||||||||||
| At January 1, 2022 |
( |
) |
( |
) |
( |
) |
( |
) |
( |
) | ||||||||||||||
| Amortization |
— | ( |
) | ( |
) | ( |
) | ( |
) | |||||||||||||||
| Disposals |
— | — | ||||||||||||||||||||||
| Net foreign exchange differences |
— | ( |
) | ( |
) | — | — | ( |
) | |||||||||||||||
| |
|
|
|
|
|
|
|
|
|
|
|
|||||||||||||
| At December 31, 2022 |
( |
) |
( |
) |
( |
) |
( |
) |
( |
) | ||||||||||||||
| Amortization |
— | ( |
) | ( |
) | ( |
) | ( |
) | |||||||||||||||
| Disposals |
— | |||||||||||||||||||||||
| Net foreign exchange differences |
— | |||||||||||||||||||||||
| |
|
|
|
|
|
|
|
|
|
|
|
|||||||||||||
| At December 31, 2023 |
( |
) |
( |
) |
( |
) |
( |
) |
( |
) | ||||||||||||||
| |
|
|
|
|
|
|
|
|
|
|
|
|||||||||||||
| Carrying amount |
||||||||||||||||||||||||
| At January 1, 2022 |
||||||||||||||||||||||||
| |
|
|
|
|
|
|
|
|
|
|
|
|||||||||||||
| At December 31, 2022 |
||||||||||||||||||||||||
| |
|
|
|
|
|
|
|
|
|
|
|
|||||||||||||
| At December 31, 2023 |
||||||||||||||||||||||||
| |
|
|
|
|
|
|
|
|
|
|
|
|||||||||||||
15. |
Goodwill |
At December 31, |
||||||||
(Euro thousands) |
2023 |
2022 |
||||||
| Lanvin |
||||||||
| Wolford |
||||||||
| St. John |
||||||||
| |
|
|
|
|||||
| Total goodwill |
||||||||
| |
|
|
|
|||||
16. |
Impairment testing of intangible assets with indefinite useful lives |
| • | In the first one or two years of the model, free cash flows are based on the Group’s strategic plan as approved by key management. The Group’s strategic plan is prepared per cash-generating unit and is based on external sources in respect of macro-economic assumptions, industry, inflation and foreign exchange rates, past experience and identified initiatives in terms of market share, revenue, cost, capital expenditure and working capital assumptions; |
| • | For the subsequent years of the model, data from the strategic plan is extrapolated generally using simplified assumptions such as macro-economic and industry assumptions as obtained from external sources; |
| • | Cash flows after the first ten-year period are extrapolated generally using expected annual long-term GDP growth rates, based on external sources, in order to calculate the terminal value, considering sensitivities on this metric; and |
| • | Projections are discounted at the unit’s post-tax weighted average cost of capital (“WACC”). The WACC was calculated for each CGU subject to impairment, considering the parameters specific to the geographical area, market risk premium and sovereign bond yield. |
Goodwill |
Brands |
Long-term growth rate (bps) |
||||||||||||||||||||||
| December 31, 2023 (Euro thousands) |
Net carrying amount |
WACC (bps) |
Net carrying amount |
WACC (bps) |
Royalty rate (bps) |
|||||||||||||||||||
| Lanvin |
|
|
||||||||||||||||||||||
| Wolford |
||||||||||||||||||||||||
| St. John |
||||||||||||||||||||||||
| Sergio Rossi |
— | N.A. | ||||||||||||||||||||||
| |
|
|
|
|||||||||||||||||||||
| Total |
||||||||||||||||||||||||
| |
|
|
|
|||||||||||||||||||||
Goodwill |
Brands |
Long-term growth rate (bps) |
||||||||||||||||||||||
| December 31, 2022 (Euro thousands) |
Net carrying amount |
WACC (bps) |
Net carrying amount |
WACC (bps) |
Royalty rate (bps) |
|||||||||||||||||||
| Lanvin |
||||||||||||||||||||||||
| Wolford |
||||||||||||||||||||||||
| St. John |
||||||||||||||||||||||||
| Sergio Rossi |
— | N.A. | ||||||||||||||||||||||
| |
|
|
|
|||||||||||||||||||||
| Total |
||||||||||||||||||||||||
| |
|
|
|
|||||||||||||||||||||
At December 31, 2023 impairment loss due to |
At December 31, 2022 impairment loss due to |
|||||||||||||||||||||||||||||||||||||||
Goodwill |
Brand |
Goodwill |
Brand |
|||||||||||||||||||||||||||||||||||||
(Euro thousands) |
WACC +10 bps |
Long-term growth rate - 10 bps |
WACC +10 bps |
Long-term growth rate - 10 bps |
Royalty Rate -10 bps |
WACC +10 bps |
Long-term growth rate - 10 bps |
WACC +10 bps |
Long-term growth rate - 10 bps |
Royalty Rate -10 bps |
||||||||||||||||||||||||||||||
| Lanvin |
||||||||||||||||||||||||||||||||||||||||
| Wolford |
||||||||||||||||||||||||||||||||||||||||
| St. John |
||||||||||||||||||||||||||||||||||||||||
| Sergio Rossi |
N.A. |
N.A. |
N.A. |
N.A. |
||||||||||||||||||||||||||||||||||||
17. |
Property, plant and equipment |
(Euro thousands) |
Land |
Buildings |
Machinery and equipment |
Leasehold improvements |
Office equipment |
Tangible fixed assets in progress |
Other |
Total |
||||||||||||||||||||||||
| Historical cost |
||||||||||||||||||||||||||||||||
| At January 1, 2022 |
||||||||||||||||||||||||||||||||
| Additions |
— | |||||||||||||||||||||||||||||||
| Disposals |
— | ( |
) | ( |
) | ( |
) | ( |
) | — | ( |
) | ( |
) | ||||||||||||||||||
| Transfer from tangible fixed assets in progress |
— | — | ( |
) | — | — | ||||||||||||||||||||||||||
| Net foreign exchange differences |
||||||||||||||||||||||||||||||||
| |
|
|
|
|
|
|
|
|
|
|
|
|
|
|
|
|||||||||||||||||
| At December 31, 2022 |
||||||||||||||||||||||||||||||||
| Reclassification |
— | ( |
) | — | — | — | — | — | ||||||||||||||||||||||||
| Additions |
— | |||||||||||||||||||||||||||||||
| Disposals |
— | ( |
) | ( |
) | ( |
) | ( |
) | ( |
) | ( |
) | ( |
) | |||||||||||||||||
| Transfer from tangible fixed assets in progress |
— | ( |
) | — | ||||||||||||||||||||||||||||
| Net foreign exchange differences |
( |
) |
( |
) | ( |
) | ( |
) | ( |
) | ( |
) | ( |
) | ( |
) | ||||||||||||||||
| |
|
|
|
|
|
|
|
|
|
|
|
|
|
|
|
|||||||||||||||||
| At December 31, 2023 |
||||||||||||||||||||||||||||||||
| |
|
|
|
|
|
|
|
|
|
|
|
|
|
|
|
|||||||||||||||||
| Depreciation and impairment |
||||||||||||||||||||||||||||||||
| At January 1, 2022 |
— |
( |
) |
( |
) |
( |
) |
( |
) |
— |
( |
) |
( |
) | ||||||||||||||||||
| Depreciation |
— | ( |
) | ( |
) | ( |
) | ( |
) | — | ( |
) | ( |
) | ||||||||||||||||||
| Impairment losses |
— | ( |
) | — | ( |
) | — | — | ( |
) | ||||||||||||||||||||||
| Disposals |
— | — | ||||||||||||||||||||||||||||||
| Net foreign exchange differences |
— | ( |
) | ( |
) | ( |
) | ( |
) | — | ( |
) | ( |
) | ||||||||||||||||||
| |
|
|
|
|
|
|
|
|
|
|
|
|
|
|
|
|||||||||||||||||
| At December 31, 2022 |
— |
( |
) |
( |
) |
( |
) |
( |
) |
— |
( |
) |
( |
) | ||||||||||||||||||
| Reclassification |
— | — | ( |
) | — | — | — | — | ||||||||||||||||||||||||
| Depreciation |
— | ( |
) | ( |
) | ( |
) | ( |
) | — | ( |
) | ( |
) | ||||||||||||||||||
| Impairment losses |
— | ( |
) | ( |
) | ( |
) | ( |
) | — | — | ( |
) | |||||||||||||||||||
| Disposals |
— | — | ||||||||||||||||||||||||||||||
| Net foreign exchange differences |
— | — | ||||||||||||||||||||||||||||||
| |
|
|
|
|
|
|
|
|
|
|
|
|
|
|
|
|||||||||||||||||
| At December 31, 2023 |
— |
( |
) |
( |
) |
( |
) |
( |
) |
— |
( |
) |
( |
) | ||||||||||||||||||
| |
|
|
|
|
|
|
|
|
|
|
|
|
|
|
|
|||||||||||||||||
| Carrying amount |
||||||||||||||||||||||||||||||||
| At January 1, 2022 |
||||||||||||||||||||||||||||||||
| |
|
|
|
|
|
|
|
|
|
|
|
|
|
|
|
|||||||||||||||||
| At December 31, 2022 |
||||||||||||||||||||||||||||||||
| |
|
|
|
|
|
|
|
|
|
|
|
|
|
|
|
|||||||||||||||||
| At December 31, 2023 |
||||||||||||||||||||||||||||||||
| |
|
|
|
|
|
|
|
|
|
|
|
|
|
|
|
|||||||||||||||||
(Euro thousands) |
Real estates |
Other |
Total net carrying amount |
|||||||||
At January 1, 2022 |
||||||||||||
Additions |
||||||||||||
Disposals |
( |
) | ( |
) | ( |
) | ||||||
Depreciation |
( |
) | ( |
) | ( |
) | ||||||
Impairment losses |
( |
) | — | ( |
) | |||||||
Contract modifications |
( |
) | ||||||||||
Net foreign exchange differences |
||||||||||||
At December 31, 2022 |
||||||||||||
Additions |
||||||||||||
Disposals |
( |
) | ( |
) | ( |
) | ||||||
Depreciation |
( |
) | ( |
) | ( |
) | ||||||
Impairment losses |
( |
) | — | ( |
) | |||||||
Contract modifications |
( |
) | ||||||||||
Net foreign exchange differences |
( |
) | ( |
) | ( |
) | ||||||
At December 31, 2023 |
||||||||||||
At December 31, |
||||||||
(Euro thousands) |
2023 |
2022 |
||||||
Deposits of rental, utility and other |
||||||||
Financial assets at fair value through profit or loss |
||||||||
Other |
||||||||
Total other non-current assets |
||||||||
At December 31, |
||||||||
(Euro thousands) |
2023 |
2022 |
||||||
Raw materials, ancillary materials and consumables |
||||||||
Work-in-progress |
||||||||
Finished goods |
||||||||
Other |
||||||||
Total inventories |
||||||||
At December 31, |
||||||||
(Euro thousands) |
2023 |
2022 |
||||||
Trade receivables |
||||||||
Loss allowance |
( |
) |
( |
) | ||||
Total trade receivables |
||||||||
For the years ended December 31, |
||||||||
(Euro thousands) |
2023 |
2022 |
||||||
At January 1, |
||||||||
Provisions |
||||||||
Write off |
( |
) | ( |
) | ||||
Net foreign exchange differences |
( |
) |
||||||
At December 31, |
||||||||
(Euro thousands) |
At December 31, |
|||||||
2023 |
2022 |
|||||||
Tax recoverable |
||||||||
Advances and payments on account to vendors |
||||||||
Prepaid expenses |
||||||||
Other receivable of royalties |
||||||||
Deposits of rental, utility and other |
||||||||
Other |
||||||||
Total other current assets |
||||||||
(Euro thousands) |
At December 31, |
|||||||
2023 |
2022 |
|||||||
Cash on hand |
||||||||
Bank balances |
||||||||
Total cash and bank balances |
||||||||
(Euro thousands) |
At December 31, |
|||||||
2023 |
2022 |
|||||||
Total cash and cash equivalents |
||||||||
Bank overdrafts |
( |
) |
( |
) | ||||
Net cash and cash equivalents per cash flow statement |
||||||||
2023 |
2022 |
|||||||||||||||||||||||||||||||
(Euro thousands) |
Guaranteed |
Secured |
Unsecured |
Total borrowings |
Guaranteed |
Secured |
Unsecured |
Total borrowings |
||||||||||||||||||||||||
At January 1, |
||||||||||||||||||||||||||||||||
Repayments |
( |
) | ( |
) | ( |
) | ( |
) | ( |
) | ( |
) | ( |
) | ( |
) | ||||||||||||||||
Proceeds |
||||||||||||||||||||||||||||||||
Net foreign exchange difference |
— | ( |
) |
( |
) |
( |
) |
— | ||||||||||||||||||||||||
At December 31, |
||||||||||||||||||||||||||||||||
Repayable: |
||||||||||||||||||||||||||||||||
- Within one year |
||||||||||||||||||||||||||||||||
- In the second year |
— | — | — | |||||||||||||||||||||||||||||
- In the third year |
— | — | — | |||||||||||||||||||||||||||||
- Over three years |
— | — | ||||||||||||||||||||||||||||||
Portion classified as current liabilities |
( |
) |
( |
) | ( |
) | ( |
) | ( |
) | ( |
) | ( |
) | ( |
) | ||||||||||||||||
Non-current portion |
— | |||||||||||||||||||||||||||||||
At December 31, |
||||||||
(Euro thousands) |
2023 |
2022 |
||||||
Pledge of assets: |
||||||||
- Inventories |
||||||||
- Property, plant and equipment |
||||||||
- Trade receivables |
||||||||
- Other current assets |
||||||||
At December 31, |
||||||||
At December 31, 2023 |
||||||||||||||||||||
| Borrower |
Interest rate |
Terms |
Expiry date |
Of which current portion |
Of which non- current portion |
|||||||||||||||
(Euro thousands) |
||||||||||||||||||||
Fosun Fashion Group (Cayman) Limited |
Fixed |
— |
||||||||||||||||||
Sergio Rossi S.p.A |
Variable |
— |
||||||||||||||||||
Fosun Fashion Group (Cayman) Limited |
Fixed |
— |
||||||||||||||||||
Fosun Fashion Brand Management Co.,Limited |
Fixed |
— |
||||||||||||||||||
Fosun Fashion Brand Management Co.,Limited |
Fixed |
— |
||||||||||||||||||
Fosun Fashion Brand Management Co.,Limited |
Fixed |
— |
||||||||||||||||||
Fosun Fashion Group (Cayman) Limited |
Fixed |
— |
||||||||||||||||||
Fosun Fashion Group (Cayman) Limited |
Fixed |
— |
||||||||||||||||||
Fosun Fashion Brand Management Co.,Limited |
Fixed |
— |
||||||||||||||||||
Fosun Fashion Group (Cayman) Limited |
Fixed |
— |
||||||||||||||||||
Fosun Fashion Brand Management Co.,Limited |
Fixed |
— |
||||||||||||||||||
Sergio Rossi S.p.A |
Variable |
|||||||||||||||||||
Arpège SAS |
Fixed |
|||||||||||||||||||
St. John Knits, Inc. |
Variable |
— |
||||||||||||||||||
Sergio Rossi S.p.A |
Variable |
|||||||||||||||||||
Fosun Fashion (Shanghai) Consulting Management Co., Ltd. |
Fixed |
— |
||||||||||||||||||
Wolford AG |
|
Variable |
|
— |
||||||||||||||||
Other borrowings |
|
Variable |
|
|
|
— |
||||||||||||||
| |
|
|
|
|||||||||||||||||
| Total |
||||||||||||||||||||
| |
|
|
|
|||||||||||||||||
At December 31, 2022 |
||||||||||||||||||||
| Borrower |
Interest rate |
Terms |
Expiry date |
Of which current portion |
Of which non- current portion |
|||||||||||||||
(Euro thousands) |
||||||||||||||||||||
| Fosun Fashion Brand Management Co.,Limited | Fixed | — | ||||||||||||||||||
| Fosun Fashion Brand Management Co.,Limited | Fixed | — | ||||||||||||||||||
| Fosun Fashion Brand Management Co.,Limited | Fixed | — | ||||||||||||||||||
| St. John Knits, Inc. | Variable | — | ||||||||||||||||||
| Fosun Fashion Brand Management Co.,Limited | Fixed | — | ||||||||||||||||||
| Fosun Fashion Brand Management Co.,Limited | Fixed | — | ||||||||||||||||||
| Fosun Fashion Brand Management Co.,Limited | Fixed | — | ||||||||||||||||||
| Fosun Fashion Brand Management Co.,Limited | Fixed | — | ||||||||||||||||||
| Fosun Fashion Brand Management Co.,Limited | Fixed | — | ||||||||||||||||||
| Fosun Fashion Brand Management Co.,Limited | Fixed | — | ||||||||||||||||||
| Fosun Fashion Brand Management Co.,Limited | Fixed | — | ||||||||||||||||||
| Fosun Fashion Brand Management Co.,Limited | Fixed | — | ||||||||||||||||||
| Fosun Fashion Brand Management Co.,Limited | Fixed | — | ||||||||||||||||||
| Sergio Rossi S.p.A | Variable | |||||||||||||||||||
| Sergio Rossi S.p.A | Variable | |||||||||||||||||||
| Fosun Fashion (Shanghai) Consulting Management Co., Ltd. | Fixed | — | ||||||||||||||||||
| |
|
|
|
|||||||||||||||||
| Total |
||||||||||||||||||||
| |
|
|
|
|||||||||||||||||
(Euro thousands) |
2023 |
2022 |
||||||
| At January 1, |
||||||||
| Additions due to new leases and store renewals |
||||||||
| Interest expense |
||||||||
| Repayment of lease liabilities (including interest expense) |
( |
) | ( |
) | ||||
| Contract modifications |
||||||||
| Disposals |
( |
) |
( |
) | ||||
| Net foreign exchange differences |
( |
) | ||||||
| |
|
|
|
|||||
| At December 31, |
||||||||
| |
|
|
|
|||||
| Of which: |
||||||||
| Non-current |
||||||||
| Current |
||||||||
(Euro thousands) |
Total contractual cash flows of lease liabilities |
Year 1 |
Year 2 |
Year 3 |
Beyond |
|||||||||||||||
| At December 31, 2023 |
||||||||||||||||||||
| At December 31, 2022 |
||||||||||||||||||||
(Euro thousands) |
Provisions for litigation |
Provisions for contingencies and losses |
Other provisions |
Total provisions |
||||||||||||
At January 1, 2022 |
||||||||||||||||
Of which current |
— | |||||||||||||||
Of which non-current |
||||||||||||||||
Provisions |
||||||||||||||||
Releases |
( |
) | ( |
) | ( |
) | ( |
) | ||||||||
Utilizations |
— | ( |
) | ( |
) | ( |
) | |||||||||
Exchange differences |
— | ( |
) | |||||||||||||
At December 31, 2022 |
||||||||||||||||
Of which current |
||||||||||||||||
Of which non-current |
||||||||||||||||
Provisions |
— | |||||||||||||||
Releases |
( |
) | ( |
) | ( |
) | ( |
) | ||||||||
Utilizations |
( |
) | ( |
) | ( |
) | ( |
) | ||||||||
Exchange differences |
( |
) |
( |
) | — | ( |
) | |||||||||
At December 31, 2023 |
||||||||||||||||
Of which current |
||||||||||||||||
Of which non-current |
||||||||||||||||
At December 31, |
||||||||
(Euro thousands) |
2023 |
2022 |
||||||
Post-employee benefits |
||||||||
Other long-term employee benefits |
||||||||
Total long-term employee benefits |
||||||||
(Euro thousands) |
Defined-benefit plan in Italy (TFR) |
Defined-benefit plans in Austria |
Other long-term employee benefits |
Total |
||||||||||||
At January 1, 2022 |
||||||||||||||||
Current service costs |
||||||||||||||||
Interest expenses |
||||||||||||||||
Actuarial losses in other comprehensive loss |
( |
) | ( |
) | ( |
) | ( |
) | ||||||||
Actuarial gains in profit or loss |
— | — | ( |
) | ( |
) | ||||||||||
Benefits paid |
( |
) | ( |
) | ( |
) | ( |
) | ||||||||
Contributions |
— | ( |
) | ( |
) | ( |
) | |||||||||
Exchange differences |
— | — | ||||||||||||||
At December 31, 2022 |
||||||||||||||||
Current service costs |
||||||||||||||||
Interest expenses |
||||||||||||||||
Actuarial gains in other comprehensive loss |
( |
) | ||||||||||||||
Actuarial gains in profit or loss |
— | — | ( |
) |
( |
) | ||||||||||
Benefits paid |
( |
) | ( |
) | ( |
) | ( |
) | ||||||||
Contributions |
— |
( |
) |
|||||||||||||
Exchange differences |
— | — | ||||||||||||||
At December 31, 2023 |
||||||||||||||||
At December 31, |
||||||||
(Euro thousands) |
2023 |
2022 |
||||||
| Defined-benefit plan in Italy |
||||||||
| - Italian leaving indemnities |
||||||||
| |
|
|
|
|||||
| Defined-benefit plans in Austria |
||||||||
| - Severance payments |
||||||||
| - Pensions liability |
||||||||
| |
|
|
|
|||||
| |
|
|
|
|||||
| Total defined-benefit obligations |
||||||||
| |
|
|
|
|||||
At December 31, |
||||||||
(Euro thousands) |
2023 |
2022 |
||||||
| Fair value of plan liabilities |
||||||||
| Fair value of plan assets |
( |
) |
( |
) | ||||
| |
|
|
|
|||||
| Defined-benefit plans in Austria |
||||||||
| |
|
|
|
|||||
At December 31, |
||||||||
(Euro thousands) |
2023 |
2022 |
||||||
| Equity investments |
||||||||
| Real estates |
||||||||
| Bonds |
||||||||
| Alternative investments |
||||||||
| Liquid funds |
||||||||
| |
|
|
|
|||||
| Total plan assets |
||||||||
| |
|
|
|
|||||
At December 31, 2023 |
At December 31, 2022 |
|||||||||||||||
Defined-benefit plan in Italy (TFR) |
Defined-benefit plans in Austria |
Defined-benefit plan in Italy (TFR) |
Defined-benefit plans in Austria |
|||||||||||||
| Average duration of plan (years) |
||||||||||||||||
| Discount rate |
% |
% |
% |
% | ||||||||||||
| Inflation rate |
% |
N.A. |
% |
N.A. |
||||||||||||
| Salary increase rate |
% |
% |
% |
% | ||||||||||||
At December 31, |
||||||||
(Euro thousands) |
2023 |
2022 |
||||||
| Financing fund |
||||||||
| Payroll and employee benefits payables |
||||||||
| Accrued expenses |
||||||||
| Tax payables |
||||||||
| Due to related companies |
||||||||
| Customer advances |
||||||||
| Warrant liabilities |
||||||||
| Rental payable |
||||||||
| Other |
||||||||
| |
|
|
|
|||||
| Total other current liabilities |
||||||||
| |
|
|
|
|||||
• |
Meritz sold and surrendered, and the Company repurchased from Meritz |
• |
Immediately thereafter, Meritz agreed to subscribe for, and the Company issued |
At December 31, |
||||||||
(Euro thousands) |
2023 |
2022 |
||||||
| Public Warrant |
||||||||
| Private Placement Warrant |
||||||||
| |
|
|
|
|||||
| Total warrant liabilities |
||||||||
| |
|
|
|
|||||
| • | € |
| • | € |
| • | at a price of $ $ |
| • | at a price of $ $ |
Number of shares (thousands) |
Nominal value of shares (Euro thousands) |
Share premium (Euro thousands) |
||||||||||
Issued and paid: |
||||||||||||
As at January 1, 2021 |
||||||||||||
Issuance of series B preferred shares of € |
||||||||||||
Issuance of class B non-voting ordinary shares of€ 32 ) |
||||||||||||
As at December 31, 2021 |
||||||||||||
Issuance of ordinary shares of € 28 ) |
||||||||||||
Issuance of a FFG Collateral Share of € 28 ) |
* | * | * | |||||||||
Conversion from FFG Shares to LGHL ordinary shares at |
* | |||||||||||
Exchange of LGHL ordinary shares as part of Reverse Recapitalization |
( |
) | (* | ) | ( |
) | ||||||
As at Closing Date |
||||||||||||
| * | Less than 1,000 shares or €1,000. |
Number of ordinary shares (thousands) |
Nominal value of shares (Euro thousands) |
Share premium (Euro thousands) |
||||||||||
Issued and paid: |
||||||||||||
As at Closing Date |
— |
— |
||||||||||
Issuance of LGHL shares as part of Reverse Recapitalization |
||||||||||||
- Exchange of ordinary shares |
* | |||||||||||
- Exchange of convertible preference share |
* | * | * | |||||||||
- Merger with PCAC |
* | |||||||||||
- Ordinary shares of $0.000001 each to third party investors |
* | |||||||||||
As at December 31, 2022 |
* | |||||||||||
Repurchase of ordinary shares |
( |
) | * | ( |
) | |||||||
Issuance of ordinary shares of $ |
* | |||||||||||
As at December 31, 2023 |
* |
|||||||||||
| * | Less than 1,000 shares or €1,000. |
Share premium |
Other comprehensive income reserve |
Other reserves |
Total |
|||||||||||||||||
(Euro thousands) |
Cumulative translation adjustment |
Re-measurement of defined benefit plans |
||||||||||||||||||
| Balance at January 1, 2021 |
( |
) |
||||||||||||||||||
| Capital injection from shareholders |
||||||||||||||||||||
| Employee share-based compensation |
||||||||||||||||||||
| Capital contribution from non-controlling interests |
||||||||||||||||||||
| Changes in ownership interest in a subsidiary without change of control |
||||||||||||||||||||
| Currency translation differences |
( |
) | ( |
) | ||||||||||||||||
| Actuarial reserve relating to employee benefit |
( |
) | ( |
) | ||||||||||||||||
| |
|
|
|
|
|
|
|
|
|
|||||||||||
| Balance at January 1, 2022 |
( |
) |
||||||||||||||||||
| Capital injection from shareholders |
— | — | — | |||||||||||||||||
| Employee share-based compensation |
— | — | — | |||||||||||||||||
| Changes in ownership interest in a subsidiary without change of control |
— | — | — | ( |
) | ( |
) | |||||||||||||
| Currency translation differences |
— | ( |
) | — | — | ( |
) | |||||||||||||
| Actuarial reserve relating to employee benefit |
— | — | — | |||||||||||||||||
| Issuance of ordinary shares upon Reverse Recapitalization, net of issuance costs |
— | — | — | |||||||||||||||||
| |
|
|
|
|
|
|
|
|
|
|||||||||||
| Balance at December 31, 2022 |
( |
) |
||||||||||||||||||
| Capital injection from shareholders |
||||||||||||||||||||
| Employee share-based compensation |
||||||||||||||||||||
| Changes in ownership interest in a subsidiary without change of control |
( |
) | ( |
) | ||||||||||||||||
| Currency translation differences |
||||||||||||||||||||
| Actuarial reserve relating to employee benefit |
( |
) | ( |
) | ||||||||||||||||
| |
|
|
|
|
|
|
|
|
|
|||||||||||
| Balance at December 31, 2023 |
( |
) |
||||||||||||||||||
| |
|
|
|
|
|
|
|
|
|
|||||||||||
| • | a translation reserve for the translation differences arising from the consolidation of subsidiaries with a functional currency different from the Euro; |
| • | gains and losses on the re-measurement of defined benefit plans for actuarial gains and losses arising during the period which are offset against the related net defined benefit liabilities; |
| (Functional currency thousand) Company |
Group’s percentage interest |
Non- controlling interest percentage |
Functional currency |
Total assets |
Total equity/ (deficits) |
Revenues |
Net loss |
|||||||||||||||||||||
| Arpège SAS |
% | % | ( |
) | ||||||||||||||||||||||||
| Wolford AG |
% | % | ( |
) | ( |
) | ||||||||||||||||||||||
| St. John Knits International, Incorporated |
% | % | ( |
) |
( |
) | ||||||||||||||||||||||
| St. John China Holdings Limited |
% | % | ( |
) | ||||||||||||||||||||||||
| Sergio Rossi S.p.A |
% | % | ( |
) | ||||||||||||||||||||||||
| Fosun Fashion Brands Management Co., Limited |
% | % | ( |
) | ||||||||||||||||||||||||
| • | On September 23, 2020, a restricted share units scheme (“the RSUs Scheme”) was adopted for the purpose of recognizing the contribution of participants including its senior management members and consultants. The RSUs Scheme will remain in force for the period of |
| • | On September 23, 2020, restricted share units (“RSUs”) to subscribe for an aggregate of € € t o one of them. The RSUs included certain performance conditions, which required the senior management members and consultants to complete a service period and still in the same position as when granted. The vesting term of the RSUs includes a |
| • | On September 23, 2021, RSUs to subscribe for an aggregate of € |
| • | In December 2021, a share economic beneficial interest right scheme (the “SEBIRs Scheme”) was adopted that modifies all RSUs originally granted to senior management members and consultants according to the RSUs scheme into share economic beneficial interest rights (“SEBIRs”), in which RSUs that have met the vesting conditions will be converted the same copies of SEBIRs that can be exercised immediately, RSUs that fail to meet the vesting conditions will be converted into the same copies of SEBIRs, vesting period and conditions as those under the original grant agreement. non-voting ordinary shares were issued with the par value of € |
For the years ended December 31, |
||||||||||||||||
2023 |
2022 |
|||||||||||||||
Average exercise price in Euro per share/copy |
SEBIRs/RSUs (thousand) |
Average exercise price in Euro per share/copy |
SEBIRs/RSUs (thousand) |
|||||||||||||
At January 1, |
||||||||||||||||
Granted |
||||||||||||||||
Canceled and forfeited |
( |
) | ||||||||||||||
At December 31, |
||||||||||||||||
Expiry date |
Exercise price in Euro per RSU/ SEBIR |
Shares/Copies (thousand) |
||||||||||
2023 |
2022 |
|||||||||||
September 22, 2029 |
||||||||||||
September 22, 2029 |
||||||||||||
September 22, 2031 |
||||||||||||
March 23, 2033 |
||||||||||||
For the years ended December 31, |
||||||||||||
(Euro thousands) |
2023 |
2022 |
2021 |
|||||||||
| Short-term employee benefits (1) |
||||||||||||
| Employee share-based compensation |
||||||||||||
| |
|
|
|
|
|
|||||||
| Total |
||||||||||||
| |
|
|
|
|
|
|||||||
| (1) | Includes corporate bodies fees, consultancy fees and personnel compensation. |
For the years ended December 31, |
||||||||||||
(Euro thousands) |
2023 |
2022 |
2021 |
|||||||||
| (i) Proceeds of shareholder loan |
||||||||||||
| Meritz Securities Co., Ltd. (1) |
||||||||||||
| Fosun International Limited (1) |
||||||||||||
| FPI (US) I LLC (1) |
||||||||||||
| Fosun JoyGo (HK) Technology Limited (1) |
||||||||||||
| Shanghai Fosun High Technology Group Finance Co., Ltd. (2) |
||||||||||||
| Shanghai Fosun High Technology (Group) Co., Ltd. (2) |
||||||||||||
| |
|
|
|
|
|
|||||||
| Total proceeds of shareholder loan |
||||||||||||
| |
|
|
|
|
|
|||||||
| (ii) Repayments of shareholder loan |
||||||||||||
| Shanghai Fosun High Technology Group Finance Co., Ltd. |
||||||||||||
| Fosun International Limited |
||||||||||||
| Meritz Securities Co., Ltd. |
||||||||||||
| FPI (US) I LLC |
||||||||||||
| Shanghai Fosun High Technology (Group) Co., Ltd. |
||||||||||||
| |
|
|
|
|
|
|||||||
| Total repayments of shareholder loan |
||||||||||||
| |
|
|
|
|
|
|||||||
For the years ended December 31, |
||||||||||||
(Euro thousands) |
2023 |
2022 |
2021 |
|||||||||
| (iii) Interest expenses |
||||||||||||
| Meritz Securities Co., Ltd. |
||||||||||||
| Shanghai Fosun High Technology (Group) Co., Ltd. |
||||||||||||
| Fosun International Limited |
||||||||||||
| Shanghai Fosun High Technology Group Finance Co., Ltd. |
||||||||||||
| FPI (US) I LLC |
||||||||||||
| Fosun JoyGo (HK) Technology Limited |
||||||||||||
| |
|
|
|
|
|
|||||||
| Total interest expenses |
||||||||||||
| |
|
|
|
|
|
|||||||
| (iv) Rental expenses |
||||||||||||
| Shanghai Fosun Bund Property Co., Ltd. (3) |
||||||||||||
| |
|
|
|
|
|
|||||||
| (v) Sales of goods |
||||||||||||
| Handsome Corporation (1) |
||||||||||||
| |
|
|
|
|
|
|||||||
| (vi) Royalty |
||||||||||||
| Handsome Corporation |
||||||||||||
| Itochu Corporation (1) |
||||||||||||
| |
|
|
|
|
|
|||||||
| Total royalty |
||||||||||||
| |
|
|
|
|
|
|||||||
| (vii) Other service expenses |
||||||||||||
| Baozun Hong Kong Investment Limited |
||||||||||||
| Fosun Holdings Limited (2) |
||||||||||||
| |
|
|
|
|
|
|||||||
| Total other service expenses |
||||||||||||
| |
|
|
|
|
|
|||||||
| (viii)Purchase of trademarks |
||||||||||||
| Itochu Corporation (1) |
||||||||||||
| |
|
|
|
|
|
|||||||
| (ix) Received in advance |
||||||||||||
| Itochu Corporation |
||||||||||||
| Shanghai Yu Garden Group and its subsidiaries (2) |
||||||||||||
| |
|
|
|
|
|
|||||||
| Total received in advance |
||||||||||||
| |
|
|
|
|
|
|||||||
At December 31, |
||||||||
(Euro thousands) |
2023 |
2022 |
||||||
| (i) Borrowings |
||||||||
| |
|
|
|
|
|
|
|
|
| Meritz Securities Co., Ltd. |
||||||||
| Fosun International Limited |
||||||||
| Shanghai Fosun High Technology (Group) Co., Ltd. |
||||||||
| Fosun JoyGo (HK) Technology Limited |
||||||||
| Shanghai Fosun High Technology Group Finance Co., Ltd. |
||||||||
| |
|
|
|
|||||
| Total borrowings |
||||||||
| |
|
|
|
|||||
| (ii) Other current liabilities |
||||||||
| |
|
|
|
| ||||
| Meritz Securities Co., Ltd. |
||||||||
| Baozun Hong Kong Investment Limited |
||||||||
| Shanghai Fosun Bund Property Co., Ltd. |
||||||||
| Shanghai Yu Garden Group and its subsidiaries |
||||||||
| Shanghai Fosun Industry Investment Co., Ltd. |
||||||||
| Fosun International Limited |
||||||||
| Shanghai Fosun High Technology (Group) Co., Ltd. |
||||||||
| Fosun Holdings Limited |
||||||||
| Fosun JoyGo (HK) Technology Limited |
||||||||
| Shanghai Fosun High Technology Group Finance Co., Ltd. |
||||||||
| |
|
|
|
|||||
| Total other current liabilities |
||||||||
| |
|
|
|
|||||
| (iii) Other current assets |
||||||||
| |
|
|
|
|
|
|
|
|
| Fosun International Limited |
||||||||
| |
|
|
|
|
|
|
|
|
| (iv) Other non-current liabilities |
|
|
|
|
|
|
|
|
| Itochu Corporation |
||||||||
| Shanghai Fosun High Technology (Group) Co., Ltd. |
||||||||
| |
|
|
|
|
|
|
|
|
| Total other non-current liabilities |
||||||||
| |
|
|
|
|||||
| (1) | A shareholder of the Group. |
| (2) | Subsidiaries of Fosun International Limited . |
| (3) | Joint venture of Fosun International Limited. |
(2022
For the years ended December 31, |
||||||||||||
(Euro thousands) |
2023 |
2022 |
2021 |
|||||||||
Net book value |
||||||||||||
Net gain on disposals (Note 10) |
||||||||||||
Total proceeds from disposal of long-term assets |
||||||||||||
(Euro thousands) |
Borrowings |
Financing fund |
Lease liabilities |
Interest payable |
||||||||||||
As at December 31, 2021 |
||||||||||||||||
Changes from financing cash flows |
( |
) |
( |
) |
||||||||||||
Interest paid |
( |
) | ||||||||||||||
New leases |
||||||||||||||||
Contract modifications |
||||||||||||||||
Disposals |
( |
) |
||||||||||||||
Interest expense |
||||||||||||||||
Foreign exchange movement |
( |
) |
( |
) | ||||||||||||
As at December 31, 2022 |
||||||||||||||||
Changes from financing cash flows |
( |
) | ||||||||||||||
Interest paid |
( |
) |
( |
) | ||||||||||||
Conversion to new debt |
||||||||||||||||
New leases |
||||||||||||||||
Contract modifications |
||||||||||||||||
Disposals |
( |
) |
||||||||||||||
Interest expense |
||||||||||||||||
Foreign exchange movement |
( |
) |
( |
) |
( |
) |
||||||||||
As at December 31, 2023 |
||||||||||||||||
For the years ended December 31, |
||||||||||||
(Euro thousands) |
2023 |
2022 |
2021 |
|||||||||
Within operating activities |
( |
) | ( |
) | ( |
) | ||||||
Within investing activities |
( |
) | ( |
) | ||||||||
Within financing activities |
( |
) | ( |
) | ( |
) | ||||||
Total cash outflow for leases |
( |
) |
( |
) |
( |
) | ||||||