UNITED STATES SECURITIES AND EXCHANGE COMMISSION
WASHINGTON, D.C. 20549
Form 10-K
| ANNUAL REPORT PURSUANT TO SECTION 13 OR 15(d) OF THE SECURITIES EXCHANGE ACT OF 1934 | ||||||||
For the fiscal year ended | ||||||||
OR
| TRANSITION REPORT PURSUANT TO SECTION 13 OR 15(d) OF THE SECURITIES EXCHANGE ACT OF 1934 | |||||
For the transition period from to | |||||
Commission file number 001-35961

(Exact name of Registrant as specified in its charter)
| (State or other jurisdiction of incorporation or organization) | (I.R.S. Employer Identification No.) | |||||||
(Address of Principal Executive Office)
Registrant’s telephone number, including area code: +1 .303 .220.6600
Securities registered pursuant to Section 12(b) of the Act:
| Title of each class | Trading Symbol(s) | Name of each exchange on which registered | ||||||
Securities registered pursuant to Section 12(g) of the Act: none
Indicate by check mark if the Registrant is a well-known seasoned issuer, as defined in Rule 405 of the Securities Act. Yes ☑ No ☐
Indicate by check mark if the Registrant is not required to file reports pursuant to Section 13 or Section 15(d) of the Act. Yes ☐ No ☑
Indicate by check mark whether the Registrant (1) has filed all reports required to be filed by Section 13 or 15(d) of the Securities Exchange Act of 1934 during the preceding 12 months and (2) has been subject to such filing requirements for the past 90 days. Yes ☑ No ☐
Indicate by check mark whether the Registrant has submitted electronically every Interactive Data File required to be submitted pursuant to Rule 405 of Regulation S-T during the preceding 12 months. Yes ☑ No ☐
Indicate by check mark whether the Registrant is a large accelerated filer, an accelerated filer, a non-accelerated filer, a smaller reporting company or emerging growth company. See definitions of “large accelerated filer,” “accelerated filer,” “smaller reporting company” and “emerging growth company” in Rule 12b-2 of the Exchange Act. Check one:
| ☑ | Accelerated Filer | ☐ | Non-Accelerated Filer | ☐ | Smaller Reporting Company | Emerging Growth Company | |||||||||||||||||||||||
If an emerging growth company, indicate by check mark if the Registrant has elected not to use the extended transition period for complying with any new or revised financial accounting standards provided pursuant to Section 13(a) of the Exchange Act ☐
Indicate by check mark whether the registrant has filed a report on and attestation to its management’s assessment of the effectiveness of its internal control over financial reporting under Section 404(b) of the Sarbanes-Oxley Act (15 U.S.C. 7262(b)) by the registered public accounting firm that prepared or issued its audit report. ☑
If securities are registered pursuant to Section 12(b) of the Act, indicate by check mark whether the financial statements of the registrant included in the filing reflect the correction of an error to previously issued financial statements ☐
Indicate by check mark whether any of those error corrections are restatements that required a recovery analysis of incentive-based compensation received by any of the registrant’s executive officers during the relevant recovery period pursuant to §240.10D-1(b) ☐
Indicate by check mark whether the Registrant is a shell company (as defined in Rule 12b-2 of the Exchange Act). Yes ☐ No ☑
State the aggregate market value of the voting and non-voting common equity held by non-affiliates, computed by reference to the price at which the common equity was last sold, or the average bid and ask price of such common equity, as of the last business day of the Registrant’s most recently completed second fiscal quarter: $6.7 billion.
The number of outstanding common shares of Liberty Global Ltd. as of January 31, 2024 was: 171,477,771 shares of class A common shares, 12,988,658 shares of class B common shares and 193,080,198 shares of class C common shares.
DOCUMENTS INCORPORATED BY REFERENCE
Portions of the definitive proxy statement for the Registrant’s 2024 Annual General Meeting of Shareholders are incorporated by reference in Part III of this Form 10-K.
LIBERTY GLOBAL LTD.
2023 ANNUAL REPORT ON FORM 10-K
TABLE OF CONTENTS
| Page Number | ||||||||
| PART I | ||||||||
| Item 1. | Business | I-1 | ||||||
| Item 1A. | Risk Factors | I-29 | ||||||
| Item 1B. | Unresolved Staff Comments | I-43 | ||||||
| Item 1C. | Cybersecurity | I-43 | ||||||
| Item 2. | Properties | I-44 | ||||||
| Item 3. | Legal Proceedings | I-44 | ||||||
| Item 4. | Mine Safety Disclosures | I-44 | ||||||
| PART II | ||||||||
| Item 5. | Market for Registrant’s Common Equity, Related Shareholder Matters and Issuer Purchases of Equity Securities | II-1 | ||||||
| Item 7. | Management’s Discussion and Analysis of Financial Condition and Results of Operations | II-4 | ||||||
| Item 7A. | Quantitative and Qualitative Disclosures About Market Risk | II-33 | ||||||
| Item 8. | Financial Statements and Supplementary Data | II-38 | ||||||
| Item 9. | Changes in and Disagreements with Accountants on Accounting and Financial Disclosure | II-38 | ||||||
| Item 9A. | Controls and Procedures | II-38 | ||||||
| Item 9B. | Other Information | II-38 | ||||||
| Item 9C. | Disclosure Regarding Foreign Jurisdictions that Prevent Inspections | II-38 | ||||||
| PART III | ||||||||
| Item 10. | Directors, Executive Officers and Corporate Governance | III-1 | ||||||
| Item 11. | Executive Compensation | III-1 | ||||||
| Item 12. | Security Ownership of Certain Beneficial Owners and Management and Related Shareholder Matters | III-1 | ||||||
| Item 13. | Certain Relationships and Related Transactions, and Director Independence | III-1 | ||||||
| Item 14. | Principal Accountant Fees and Services | III-1 | ||||||
| PART IV | ||||||||
| Item 15. | Exhibits, Financial Statement Schedules | IV-1 | ||||||
| Item 16. | Form 10-K Summary | IV-7 | ||||||
PART I
Item 1. BUSINESS
Who We Are
We are Liberty Global Ltd. (formerly Liberty Global plc) (Liberty Global), an international fixed-mobile convergence (FMC) communications company, providing world-class connectivity and entertainment services to our residential and business customers. We are focused on building FMC national champions in our core European markets, and we are constantly striving to enhance and simplify our customers’ lives through quality products and services that give them the freedom to connect, converse, work and be entertained anytime, anywhere they choose.
To that end, we deliver market-leading connectivity and entertainment products through next-generation networks and provide over 85 million connections (at December 31, 2023) across Europe. Our primary business operations are listed below, all of which we consolidate, with the exception of the VMO2 JV and the VodafoneZiggo JV (each as defined below). Additionally, our ventures arm, Liberty Global Ventures, has investments in more than 75 companies and funds across the content, technology and infrastructure industries, including stakes in companies such as ITV plc (ITV), Televisa Univision, Inc. (Televisa Univision), Plume Design, Inc. (Plume), AE Group Sàrl (AtlasEdge) and Formula E Holdings Ltd. (Formula E).
Primary Business Operations:
| Brand | Entity | Location | Ownership(1) | |||||||||||||||||
 | Sunrise | Switzerland | 100.0% | |||||||||||||||||
 | Telenet | Belgium | 100.0% | |||||||||||||||||
 | Virgin Media | Ireland | 100.0% | |||||||||||||||||
 | UPC Slovakia | Slovakia | 100.0% | |||||||||||||||||
 | Virgin Media O2 | United Kingdom | 50.0% | |||||||||||||||||
 | VodafoneZiggo | Netherlands | 50.0% | |||||||||||||||||
(1)As of December 31, 2023.
I-1
General Development of Business
As a result of a series of mergers that were completed on June 7, 2013, Liberty Global plc became the publicly-held parent company of the successors by merger of Liberty Global, Inc. (the predecessor to Liberty Global plc) and Virgin Media Inc. (Virgin Media). On November 23, 2023, Liberty Global plc completed a statutory scheme of arrangement, pursuant to which a new Bermudan company, Liberty Global Ltd., became the sole shareholder of Liberty Global plc and the parent entity of the entire group of Liberty Global companies (the Redomiciliation). The Redomiciliation resulted in the Liberty Global group parent company changing its jurisdiction of incorporation from England and Wales to Bermuda. In this Annual Report on Form 10-K, except where context dictates otherwise, the terms “we”, “our”, “our company” and “us” may refer, as the context requires, to Liberty Global (or its predecessors) or collectively to Liberty Global (or its predecessors) and its subsidiaries and any of its joint ventures. Unless otherwise indicated, convenience translations into United States (U.S.) dollars are calculated as of December 31, 2023, and operational data, including subscriber statistics and ownership percentages, are as of December 31, 2023.
Acquisitions and Dispositions
We have completed a number of strategic acquisitions, dispositions and joint ventures over the last several years. We made or entered into these acquisitions, dispositions and joint ventures in order to execute on our strategy to concentrate on markets where we can focus on creating national champion FMC businesses in core markets and unlock significant synergies.
Acquisitions. Our significant acquisitions include:
•On October 13, 2023, we completed the acquisition of all of the shares of Telenet Group Holding N.V. (Telenet) that we did not already hold through an all cash public tender offer (the Telenet Takeover Bid). All shares not acquired through the tender offer process were acquired through a statutory simplified “squeeze-out” procedure under applicable Belgian law. Telenet is now a wholly-owned, indirect subsidiary of Liberty Global.
•On July 1, 2023, pursuant to an agreement dated July 19, 2022, Telenet and Fluvius System Operator CV (Fluvius) created an independent, self-funding infrastructure company (Wyre) within their combined geographic footprint in the Flanders region of Belgium and in parts of Brussels (the Telenet Wyre Transaction). The companies each contributed certain cable infrastructure assets with Telenet and Fluvius initially owning 66.8% and 33.2% of Wyre, respectively. Telenet and Liberty Global began consolidating Wyre’s results upon the closing of the transaction.
Joint Ventures. Our significant joint ventures include:
•On December 15, 2022, we contributed cash to a newly-formed joint venture in the United Kingdom (U.K.) (the nexfibre JV) that is anticipated to roll-out a new fiber network to 5-7 million new homes in the U.K. that are outside the existing footprint of the VMO2 JV (as defined below). We beneficially own 25% of the nexfibre JV, Telefónica (as defined below) beneficially owns 25% and InfraVia Capital Partners (InfraVia) beneficially owns the remaining 50%. We account for our 25% interest in the nexfibre JV as an equity method investment.
•On September 1, 2021, we (i) contributed certain assets and liabilities to a newly-formed 50:50 joint venture (the AtlasEdge JV) that was established for the purpose of acquiring and commercializing European technical real estate for edge colocation and hosting services and (ii) sold certain other assets to the AtlasEdge JV. We account for our interest in the AtlasEdge JV as an equity method investment.
•On June 1, 2021, Liberty Global and Telefónica, S.A. (Telefónica) completed a transaction (the U.K. JV Transaction) whereby (i) we contributed Virgin Media’s U.K. operations and certain other Liberty Global subsidiaries to a 50:50 joint venture (the VMO2 JV) and (ii) Telefónica contributed its U.K. mobile business to the VMO2 JV, creating a nationwide integrated communications provider. We account for our 50% interest in the VMO2 JV as an equity method investment.
Dispositions. Our significant dispositions include:
•On June 1, 2022, Telenet completed the sale of substantially all of its passive infrastructure and tower assets to DigitalBridge Investments LLC (DigitalBridge) (the Telenet Tower Sale). As part of the Telenet Tower Sale, Telenet entered into a master lease agreement to lease back the passive infrastructure and tower assets from DigitalBridge for an initial period of 15 years (the Telenet Tower Lease Agreement). As part of the Telenet Tower Lease Agreement,
I-2
Telenet has also committed to lease back 475 build-to-suit sites over the term of the lease. Telenet will act as an agent over the construction of future towers on the build-to-suit sites.
•On April 1, 2022, we completed the sale of our operations in Poland (UPC Poland) to a subsidiary of iliad S.A. (iliad). In connection with the sale of UPC Poland, we agreed to provide certain transitional services to iliad for a period of up to five years. These services principally comprise network and information technology-related functions.
Other Transactions
•A described above in this section, we completed the Redomiciliation on November 23, 2023. Our shares continue to trade on the Nasdaq Global Select Market under the same ticker symbols as they did prior to the Redomiciliation (LBTYA, LBTYB and LBTYK).
•On August 15, 2023, we announced a new strategic collaboration with Infosys to help scale Liberty Global’s digital entertainment and connectivity platforms. The agreement has an initial five-year term, with an option to extend to eight years. Under this partnership, Liberty Global will license certain of its intellectual property to Infosys, who will then market our entertainment and connectivity platforms to customers outside of Liberty Global’s family of companies. As part of this arrangement, Liberty Global will continue to control the product roadmaps and retain the intellectual property for such platforms.
Equity Transactions
Share repurchases are an important part of our strategy in creating value for our shareholders. Pursuant to our most recent share repurchase program, our board of directors authorized us to repurchase 10% of our outstanding shares (measured at the start of the year) during 2023. Additionally, in July 2023, our board of directors increased our share repurchase authorization to a minimum of 15% of shares outstanding as of December 31, 2022. We achieved this minimum as of October 30, 2023 and announced a further repurchase target of approximately $300.0 million through the end of January 2024. This target was fully achieved on January 26, 2024. The following table provides a summary of our share repurchases during 2023.
| Title of shares | Number of shares | Average price paid per share(1) | Aggregate purchase price(1) | |||||||||||||||||
| in millions | ||||||||||||||||||||
| Class A common shares | 1,444,000 | $ | 18.24 | $ | 26.3 | |||||||||||||||
| Class C common shares | 78,452,085 | $ | 18.86 | 1,479.6 | ||||||||||||||||
| Total | $ | 1,505.9 | ||||||||||||||||||
_______________
(1)Amounts include direct acquisition costs.
For a further description of our share repurchases, see note 14 to our consolidated financial statements included in Part II of this Annual Report on Form 10-K.
I-3
Forward Looking Statements
Certain statements in this Annual Report constitute forward-looking statements within the meaning of the Private Securities Litigation Reform Act of 1995. To the extent that statements in this Annual Report are not recitations of historical fact, such statements constitute forward-looking statements, which, by definition, involve risks and uncertainties that could cause actual results to differ materially from those expressed or implied by such statements. In particular, statements under Item 1. Business, Item 1A. Risk Factors, Item 2. Properties, Item 7. Management’s Discussion and Analysis of Financial Condition and Results of Operations and Item 7A. Quantitative and Qualitative Disclosures About Market Risk may contain forward-looking statements, including statements regarding our business, product, foreign currency, hedging and finance strategies, our property and equipment additions, subscriber growth and retention rates, competitive, regulatory and economic factors, the timing and impacts of proposed transactions, the maturity of our markets, the potential impact of the coronavirus (COVID-19) and other large-scale health crises on our company, the anticipated impacts of new legislation (or changes to existing rules and regulations), anticipated changes in our revenue, costs or growth rates, our liquidity, credit risks, foreign currency risks, interest rate risks, target leverage levels, debt covenants, our future projected contractual commitments and cash flows, our share repurchase programs and other information and statements that are not historical fact. Where, in any forward-looking statement, we express an expectation or belief as to future results or events, such expectation or belief is expressed in good faith and believed to have a reasonable basis, but there can be no assurance that the expectation or belief will result or be achieved or accomplished. In evaluating these statements, you should consider the risks and uncertainties discussed under Item 1A. Risk Factors and Item 7A. Quantitative and Qualitative Disclosures About Market Risk, as well as the following list of some, but not all, of the factors that could cause actual results or events (including with respect to affiliates) to differ materially from anticipated results or events:
•economic and business conditions and industry trends in the countries in which we or our affiliates operate;
•the competitive environment in the industries and in the countries in which we or our affiliates operate, including competitor responses to our products and services;
•fluctuations in currency exchange rates and interest rates;
•instability in global financial markets, including sovereign debt issues, currency instability and related fiscal reforms;
•consumer disposable income and spending levels, including the availability and amount of individual consumer debt, as a result of, among other things, inflationary pressures;
•changes in consumer television viewing, mobile and broadband usage preferences and habits;
•consumer acceptance of our existing service offerings, including our broadband internet, video, fixed-line telephony, mobile and business service offerings, and of new technology, programming alternatives and other products and services that we may offer in the future;
•our ability to manage rapid technological changes, including our ability to adequately manage our legacy technologies and transformation, and the rate at which our current technology becomes obsolete;
•our ability to maintain or increase the number of subscriptions to our broadband internet, video, fixed-line telephony and mobile service offerings and our average revenue per household;
•our ability to provide satisfactory customer service, including support for new and evolving products and services;
•our ability to maintain or increase rates to our subscribers or to pass through increased costs to our subscribers, including with respect to our significant property and equipment additions, as a result of, among other things, inflationary pressures;
•the impact of our future financial performance, or market conditions generally, on the availability, terms and deployment of capital;
•changes in, or failure or inability to comply with, government regulations and legislation in the countries in which we or our affiliates operate and adverse outcomes from regulatory proceedings;
•government intervention that requires opening our broadband distribution networks to competitors, such as certain regulatory obligations imposed in Belgium;
•our ability to maintain and further develop our direct and indirect distribution channels;
•the effect of perceived health risks associated with electromagnetic radiation from base statement and associated equipment;
I-4
•the effect on our businesses of strikes or collective action by certain of our employees that are represented by trade unions;
•our ability to obtain regulatory approval and shareholder approval and satisfy other conditions necessary to close acquisitions, dispositions, combinations or joint ventures and the impact of conditions imposed by competition and other regulatory authorities in connection with acquisitions, combinations and joint ventures;
•our ability to successfully acquire new businesses or form joint ventures and, if acquired or joined, to integrate, realize anticipated efficiencies from, and implement our business plan with respect to, the businesses we have acquired or joined or that we expect to acquire or join;
•changes in laws or treaties relating to taxation, or the interpretation thereof, in the U.K., the U.S. or in other countries in which we or our affiliates operate;
•changes in laws, monetary policies and government regulations that may impact the availability or cost of capital and the derivative instruments that hedge certain of our financial risks;
•our ability to navigate the potential impacts on our business resulting from the U.K.’s departure from the European Union (E.U.);
•the ability of suppliers and vendors (including our third-party wireless network provider, Three (Hutchison), under our mobile virtual network operator (MVNO) arrangement at VM Ireland (as defined below)) to timely deliver quality products, equipment, software, services and access;
•the activities of device manufacturers, and our operating companies’ ability to secure adequate and timely supply of handsets that experience high demand;
•the availability of attractive programming for our video services and the costs associated with such programming, including, but not limited to, production costs, retransmission and copyright fees payable to public and private broadcasters;
•uncertainties inherent in the development and integration of new business lines and business strategies;
•our ability to adequately forecast and plan future network requirements;
•the availability and cost of capital for the acquisition, maintenance and/or development of telecommunications networks, products and services;
•the availability, cost and regulation of spectrum;
•problems we may discover post-closing with the operations, including the internal controls and financial reporting processes, of businesses we acquire;
•successfully integrating businesses or operations that we acquire or partner with on the timelines or within the budgets estimated for such integrations;
•operating costs, customer loss and business disruption, including maintaining relationships with employees, customers, suppliers or vendors, may be greater than expected in connection with our acquisitions, dispositions or joint ventures;
•our ability to realize the expected synergies from our acquisitions and joint ventures in the amounts anticipated or on the anticipated timelines;
•our ability to profit from investments, such as our joint ventures, that we do not solely control;
•our ability to anticipate, protect against, mitigate and contain loss of our and our customers’ data as a result of cyber attacks on us or any of our operating companies;
•the leakage of sensitive customer or company data or the failure to comply with applicable data protection laws, regulations and rules;
•a failure in our network and information systems, whether caused by a natural failure or a security breach, and unauthorized access to our networks;
•the outcome of any pending or threatened litigation;
•the loss of key employees and the availability of qualified personnel;
•changes in the nature of key strategic relationships with partners and joint venturers;
•the risk of default by counterparties to our cash investments, derivative and other financial instruments and undrawn debt facilities;
I-5
•our capital structure and factors related to our debt arrangements; and
•events that are outside of our control, such as political unrest in international markets, terrorist attacks, armed conflicts, malicious human acts, natural disasters, epidemics, pandemics (such as COVID-19) and other similar events, including the ongoing invasion of Ukraine by Russia and the Israeli-Palestinian conflict.
The broadband distribution and mobile service industries are changing rapidly and, therefore, the forward-looking statements of expectations, plans and intents in this Annual Report are subject to a significant degree of risk. These forward-looking statements and the above-described risks, uncertainties and other factors speak only as of the date of this Annual Report, and we expressly disclaim any obligation or undertaking to disseminate any updates or revisions to any forward-looking statement contained herein, to reflect any change in our expectations with regard thereto, or any other change in events, conditions or circumstances on which any such statement is based. Readers are cautioned not to place undue reliance on any forward-looking statement.
Description of Business
We are one of the world’s leading converged broadband, video and communications companies, with a commitment to providing our customers “best in class” connectivity and entertainment services. These services are delivered to our residential and business customers over our networks and include internet, video, telephony and mobile services. We design these services to enable our customers to access the digital world on their own terms, with top quality connectivity at the core of our strategy. Our extensive broadband network enables us to deliver ultra-high-speed internet service across our markets, be it through fiber, cable and mobile technology, and we strive to extend our reach and reinforce our speed leadership. Across our footprint we offer converged fixed and mobile experiences in and out of the home, and it is our ambition to further enhance this proposition through strategic acquisitions and partnerships and through product development to offer our customers a world-class suite of products and services. As part of this strategy, Sunrise GmbH (Sunrise), Telenet, the VMO2 JV and our 50:50 joint venture with Vodafone Group plc (Vodafone) (the VodafoneZiggo JV) deliver mobile services as mobile network operators (MNOs), Virgin Media Ireland (VM Ireland) delivers mobile services as an MVNO through Three (Hutchison)’s network and UPC Slovakia delivers mobile services as a reseller of subscriber identification module (SIM) cards provided by SWAN, a.s.
We provide residential and business telecommunication services in Switzerland through Sunrise, Belgium through Telenet, Ireland through VM Ireland and Slovakia through UPC Slovakia, and we are a leading fixed network provider in each of these countries. We also own 50% of the VMO2 JV and the VodafoneZiggo JV, each of which is a fixed network leader in their respective countries.
A breakdown of our revenue by major category for our consolidated reportable segments appears in note 19 to our consolidated financial statements included in Part II of this Annual Report on Form 10-K.
As a provider of telecommunications services, we strive to ensure that the connections we make today are building for a sustainable future. Our People Planet Progress strategy demonstrates how we work inclusively, sustainably and responsibly as a company and with our partners.
Our People priorities mean that we champion diversity and representation to elevate equitable and inclusive opportunities across every part of our business. We are committed to enhancing inclusive connectivity and digital skills needed for our communities and society today, as well as the workforce of tomorrow, through educational and social programs and volunteering.
As part of our Planet agenda, we work to ensure that we continuously focus on the most significant environmental impacts of our business. We are working across our entire footprint to reduce our Scope 1, 2 and 3 emissions, with long-term ambitions in line with science-based targets. Our commitment to reducing GHG emissions includes purchasing electricity from renewable sources, transitioning our fleet to electric vehicles, improving the efficiency of our networks to meet growing connectivity demands without increasing energy consumption, tackling e-waste by reducing the use of raw materials in our products, limiting our packaging and designing our products for longer lifespans and circularity.
Our Progress priorities mean that we are committed to transparency throughout our business and value chain, supported by our governance structures and human rights, ethics and labor management processes and practices. We also focus on working together with our partners to ensure high standards in our supply chain, as well as taking an active role in cross-industry collaborations. We are a founding member of the European Green Digital Coalition and, in 2023, became a member of the United Nations Global Compact and joined the Joint Alliance for CSR. As such, we champion our industry as a key player in the development of carbon-reducing digital solutions and enabling other sectors to also become more sustainable.
I-6
Operating Data
The following table presents certain operating data as of December 31, 2023 with respect to the networks of our subsidiaries and significant joint ventures. The following tables reflect 100% of the data applicable to each of our subsidiaries and significant joint ventures regardless of our ownership percentage.
Homes Passed(1) | Fixed-Line Customer Relationships(2) | Internet Subscribers(3) | Video Subscribers(4) | Telephony Subscribers(5) | Total RGUs(6) | Mobile Subscribers(7) | ||||||||||||||||||||||||||||||||||||||
| Consolidated Liberty Global: | ||||||||||||||||||||||||||||||||||||||||||||
| Telenet | 3,613,400 | 2,007,500 | 1,730,400 | 1,657,700 | 934,200 | 4,322,300 | 2,910,500 | |||||||||||||||||||||||||||||||||||||
Sunrise(8) | 2,707,700 | 1,468,000 | 1,180,400 | 1,199,700 | 934,200 | 3,314,300 | 2,836,300 | |||||||||||||||||||||||||||||||||||||
| VM Ireland | 982,900 | 402,800 | 368,500 | 227,900 | 205,800 | 802,200 | 134,400 | |||||||||||||||||||||||||||||||||||||
| UPC Slovakia | 642,400 | 177,200 | 144,800 | 161,700 | 87,500 | 394,000 | — | |||||||||||||||||||||||||||||||||||||
| Total | 7,946,400 | 4,055,500 | 3,424,100 | 3,247,000 | 2,161,700 | 8,832,800 | 5,881,200 | |||||||||||||||||||||||||||||||||||||
| VMO2 JV | 16,198,400 | 5,826,800 | 5,717,600 | 12,706,400 | 35,216,300 | |||||||||||||||||||||||||||||||||||||||
VodafoneZiggo JV(9) | 7,516,600 | 3,553,000 | 3,207,100 | 3,524,700 | 1,521,100 | 8,252,900 | 5,642,000 | |||||||||||||||||||||||||||||||||||||
_______________
(1)Homes Passed are homes, residential multiple dwelling units or commercial units that can be connected to our networks without materially extending the distribution plant. Certain of our Homes Passed counts are based on census data that can change based on either revisions to the data or from new census results. Due to the fact that we do not own the partner networks (defined below) used in Switzerland (see note 8 below), we do not report homes passed for Sunrise’s partner networks.
(2)Fixed-Line Customer Relationships are the number of customers who receive at least one of our internet, video or telephony services that we count as Revenue Generating Units (RGUs), without regard to which or to how many services they subscribe. Fixed-Line Customer Relationships generally are counted on a unique premises basis. Accordingly, if an individual receives our services in two premises (e.g., a primary home and a vacation home), that individual generally will count as two Fixed-Line Customer Relationships. We exclude mobile-only customers from Fixed-Line Customer Relationships.
(3)Internet Subscribers are homes, residential multiple dwelling units or commercial units that receive internet services over our networks or that we service through a partner network. At Sunrise, we offer a 10 Mbps internet service to our Video Subscribers without an incremental recurring fee. Our Internet Subscribers at Sunrise include approximately 39,800 subscribers who have requested and received this service.
(4)Video Subscribers are homes, residential multiple dwelling units or commercial units that receive our video services over our broadband network or through a partner network. We have approximately 31,000 “lifeline” customers that are counted on a per connection basis, representing the least expensive regulated tier of video cable service, with only a few channels.
(5)Telephony Subscribers are homes, residential multiple dwelling units or commercial units that receive voice services over our networks or that we service through a partner network. Telephony Subscribers exclude mobile telephony subscribers. At Sunrise, we offer a basic phone service to our Video Subscribers without an incremental recurring fee. Our Telephony Subscribers at Sunrise include approximately 128,400 subscribers who have requested and received this service.
(6)An RGU is, separately, an Internet Subscriber, Video Subscriber or Telephony Subscriber. A home, residential multiple dwelling unit or commercial unit may contain one or more RGUs. For example, if a residential customer subscribed to our broadband internet service, video service and fixed-line telephony service, the customer would constitute three RGUs. Total RGUs is the sum of Internet, Video and Telephony Subscribers. RGUs generally are counted on a unique premises basis such that a given premise does not count as more than one RGU for any given service. However, if an individual receives one of our services in two premises (e.g., a primary home and a vacation home), that individual will count as two RGUs for that service. Each bundled internet, video or telephony service is counted as a separate RGU regardless of the nature of any bundling discount or promotion. Non-paying subscribers are counted as subscribers during their free promotional service period. Some of these subscribers may choose to disconnect after their free service period. Services offered without charge on a long-term basis (e.g., certain preferred subscribers or free service to employees) generally are not counted as RGUs. We do not include subscriptions to mobile services in our externally reported RGU counts. In this regard, our RGU counts exclude our separately reported postpaid and prepaid mobile subscribers.
(7)Our Mobile Subscriber count represents the number of active SIM cards in service rather than services provided. For example, if a mobile subscriber has both a data and voice plan on a smartphone this would equate to one Mobile Subscriber. Alternatively, a subscriber who has a data and voice plan for a mobile handset and a data plan for a laptop would be counted as two Mobile Subscribers. Customers who do not pay a recurring monthly fee are excluded from our Mobile Subscriber count after periods of inactivity ranging from 30 to 90 days, based on industry standards within the respective country. In a number of countries, our Mobile
I-7
Subscribers receive mobile services pursuant to prepaid contracts. As of December 31, 2023, our Mobile Subscriber count included approximately 369,200, 233,200, 7,617,900 and 340,200 prepaid Mobile Subscribers at Sunrise, Telenet, the VMO2 JV and the VodafoneZiggo JV, respectively. Prepaid mobile customers are excluded from the VMO2 JV’s and the VodafoneZiggo JV’s Mobile Subscriber counts after a period of inactivity of three months and nine months, respectively. The Mobile Subscriber count for the VMO2 JV includes internet of things (IoT) connections, which are Machine-to-Machine contract mobile connections, including Smart Metering contract connections. The mobile subscriber count for the VMO2 JV presented in the table above excludes mobile wholesale connections based on their definition.
(8)Pursuant to service agreements, Sunrise offers broadband internet, video and telephony services over networks owned by third-party operators (partner networks), and following the acquisition of Sunrise, also services homes through Sunrise’s existing agreements with Swisscom, Swiss Fibre Net and local utilities. Under these agreements, RGUs are only recognized if there is a direct billing relationship with the customer. Homes passed or serviceable through the above service agreements are not included in Sunrise’s homes passed count as we do not own these networks. Including these arrangements, our operations at Sunrise have the ability to offer fixed services to the national footprint.
(9)Amounts related to the VodafoneZiggo JV’s fixed-line and mobile products include business and multiple dwelling unit subscribers.
Additional General Notes to Table:
Most of our broadband communications subsidiaries provide broadband internet, video, telephony, mobile, data or other business services. Certain of our business service revenue is derived from small or home office (SOHO) subscribers that pay a premium price to receive enhanced service levels along with internet, video or telephony services that are the same or similar to the mass marketed products offered to our residential subscribers. All mass marketed products provided to SOHOs, whether or not accompanied by enhanced service levels and/or premium prices, are included in the respective RGU and customer counts of our broadband communications operations, with only those services provided at premium prices considered to be “SOHO RGUs” or “SOHO customers”. To the extent our existing customers upgrade from a residential product offering to a SOHO product offering, the number of SOHO RGUs or SOHO customers will increase, but there is no impact to our total RGU or customer counts. With the exception of our business SOHO subscribers, we generally do not count customers of business services as customers or RGUs for external reporting purposes.
In Belgium, Telenet leases a portion of its network under a long-term finance lease arrangement. These tables include operating statistics for Telenet’s owned and leased networks.
While we take appropriate steps to ensure that subscriber statistics are presented on a consistent and accurate basis at any given balance sheet date, the variability from country to country in (1) the nature and pricing of products and services, (2) the distribution platform, (3) billing systems, (4) our bad debt collection efforts and (5) other factors add complexity to the subscriber counting process. We periodically review our subscriber counting policies and underlying systems to improve the accuracy and consistency of the data reported on a prospective basis. Accordingly, we may from time to time make appropriate adjustments to our subscriber statistics based on those reviews.
Subscriber information for acquired entities is preliminary and subject to adjustment until we have completed our review of such information and determined that it is presented in accordance with our policies.
I-8
Products and Services
Our main products and services are intelligent WiFi and internet services, video, mobile and telephony services.
Intelligent WiFi and Internet Services
Connectivity is a critical building block for vibrant communities. Following the COVID-19 pandemic, it has become apparent that all aspects of society, including families, businesses, education and healthcare, to name a few, continue to rely heavily on connectivity and the digital services that depend on it. To meet our customers’ expectations of seamless connectivity, we developed a fully digital, cloud-based connectivity ecosystem that we call “ONE Connect”, built on top of our fiber-rich fixed broadband network and expansive mobile network. ONE Connect is orchestrated by a fully cloud-based digital journey, enabling fast and flexible introduction of new hardware and services, as well as cloud-to-cloud open API integration, simplifying the on-boarding of new services and devices. The devices used within our ONE Connect ecosystem are connected and protected through our secure gateway and virtual private network (VPN), both at home and on the go. At home, our customers can benefit from the gigabit speeds enabled by our “Connect Box” (described below), as well as “Intelligent WiFi”, which has optimization functionalities, such as the ability to adapt to the number of people and devices online at any given time in order to improve and extend wireless connectivity speeds. We have completed the rollout of our award-winning Intelligent WiFi across all our markets. Our “Smart Security” services complement these capabilities by offering a layer of security for all customer connected devices. In addition, we offer “Smart Home” bundles in select markets, enabling those customers to take their smart home ambitions to the next level, including enhanced entertainment, home automation and home security. Finally, our “Connect App” is the digital touchpoint that allows customers to access and manage all of our services.
Our Connect Box is a next generation Intelligent WiFi and telephony gateway that enables us to maximize the impact of our ultrafast broadband networks by providing reliable wireless connectivity anywhere in the home. This gateway can be self-installed and allows customers to customize their home WiFi service. Our latest versions of the gigabit Connect Box are based on DOCSIS 3.1 technology and WiFi 6, providing even better in-home WiFi service. Our new DOCSIS 3.1 Connect Box runs our “One Firmware” stack, a middleware software system based on the Reference Design Kit for Broadband (RDK-B). RDK-B is an open source initiative with wide participation from operators, device manufacturers and silicon vendors that standardizes core functions used in broadband devices, set-top boxes and IoT solutions. We have extended the One Firmware stack to support our ONE Connect ecosystem. One Firmware runs on system-on-a-chip (SOC) technology from multiple vendors and can run on any SOC that is RDK-B compliant, enabling greater speed and agility for on-boarding of new customer premises equipment (CPE) platforms and ecosystem features, allowing us to build once and port to many. During 2023, we continued the roll out of One Firmware to our legacy DOCSIS 3.0 WiFi 5 GW and our next generation DOCSIS 3.1 WiFi 6 GW. In addition, we completed the porting activity of One Firmware to our new XGSPON WiFi 6 gateways, which we have now rolled out in the U.K., Switzerland and Ireland. To support the adoption of fiber-to-the-home, cabinet, building or node networks (fiber-to-the-home/-cabinet/-building/-node is referred to herein as FTTx) access in both on-net and off-net scenarios, we introduced XGSPON (an updated standard for passive optical networks that supports higher-speed, 10 Gbps symmetrical data transfers) and Ethernet-based Connect Boxes with WiFi 6, providing speeds up to 10 Gbps that run our One Firmware and support our ONE Connect ecosystem. In 2023, we introduced a new WiFi 6 Mesh device, ONE Connect Mesh, which provides our WiFi Mesh system that is fully orchestrated and optimized via the ONE Connect Platform.
In 2023, we provided the world’s first test of DOCSIS 4 technology on live network infrastructure, capable of 10 Gbps speeds over Hybrid Fiber Coaxial (HFC) Plant with upgraded passive components, emphasizing the re-usability of our existing coaxial cable. The DOCSIS 4 CPE and node was the culmination of joint development activity with our vendors and silicon partners.
In 2023, we added a cybersecurity feature to our ONE Connect Platform, providing our customers with safe browsing and advanced network protection features.
Our Connect Box is available in all our markets, and during 2023, approximately 11 million of our customers had a Connect Box. We also offer our Connect App that, among other things, allows our customers to optimize their WiFi coverage and manage their connected devices. In addition, we provide Intelligent WiFi mesh boosters, which increase speed, reliability and coverage by adapting to the environment at home.
Internet speed is of crucial importance to our customers, as they spend more time streaming video and other bandwidth-heavy services on multiple devices. Our extensive broadband network enables us to deliver ultra-high-speed internet services across our markets. Our residential subscribers access the internet via cable or XGSPON modems connected to their internet capable devices, or wirelessly via WiFi. We offer multiple tiers of broadband internet service, including gigabit or greater speeds across our entire European footprint. The speed of service depends on the customer location and their selected service.
I-9
By leveraging our existing fiber-rich broadband networks, we are in a position to deliver gigabit or greater speeds by deploying the next generation DOCSIS 3.1 technology. DOCSIS 3.1 technology is an international standard that defines the requirements for data transmission over a cable system. Not only does DOCSIS 3.1 technology improve our internet speeds and reliability, it allows for efficient network growth. Currently, our ultra-high-speed internet service is based primarily on DOCSIS 3.1 technology, and we offer this technology in all of our markets. Alongside DOCSIS 3.1, XGSPON technology provides our gigabit services an additional boost, as exemplified by the launch of a 2 Gbps tier of service at VM Ireland during 2023, supported by our XGSPON Wifi 6 gateways.
We offer value-added broadband services in certain of our markets for an incremental charge. These services include Intelligent WiFi features, security (e.g., in-home network protection, anti-virus, firewall and spam protection), Smart Home services and online storage solutions and web spaces. Subscribers to our internet service pay a monthly fee based on the tier of service selected. We determine pricing for each different tier of internet service through an analysis of speed, market conditions and other factors. At the end of 2023, we rolled out a new Smart Security service in the U.K. which helps protect all connected devices, including Smart Home devices, and is anticipated to be rolled out to the rest of our footprint during 2024.
Mobile Services
Mobile services are another key building block for us to provide customers with seamless connectivity. Sunrise, Telenet, the VMO2 JV and the VodafoneZiggo JV offer mobile services as mobile network providers, VM Ireland offers mobile services as an MVNO over a third-party network through Three (Hutchison) and UPC Slovakia delivers mobile services as a reseller of SIM cards provided by SWAN, a.s.
Pursuant to VM Ireland’s agreement with Three (Hutchison) to provide mobile services as an MVNO, Three (Hutchison) leases a third-party’s radio access network and owns the core network, including switching, backbone and interconnections. VM Ireland’s MVNO arrangement with Three (Hutchison) permits VM Ireland to offer its customers mobile services without needing to build and operate a cellular radio tower network.
In each of our markets, we offer a range of mobile related services. The majority of subscribers take a postpaid service plan, which often has an agreed monthly fee for a set duration (typically 1 to 2 years). The monthly fee will vary depending on the country and service package selected. Service packages can have different levels of data allowances, voice minutes and network speed, as well as other differing aspects, such as roaming charges and contract duration. Postpaid services are also offered as a bundle with fixed services, and by taking a “converged” offering, customers typically receive some benefits, such as lower total cost or additional features. Postpaid services are offered to both business and retail consumers. In addition, we offer prepaid mobile services, where the customers pay in advance for a pre-determined amount of airtime or data and which generally have no minimum contract term. In countries where we operate as a mobile service operator, we also offer a number of MVNOs where other mobile providers use our mobile network for their mobile offering.
Video Services
Our video service is, and continues to be, one of the foundations of our product offerings in our markets. Our cable operations offer multiple tiers of digital video programming and audio services, starting with a basic video service. Subscribers to our basic video service pay a fixed monthly fee and receive digital video channels in high definition (HD) and a growing number of ultra-high definition 4K resolution (4K) channels, as well as an electronic programming guide. We tailor our video services in each country of operation based on programming preferences, culture, demographics and local regulatory requirements.
We also offer a variety of premium channel packages to meet the interests of our subscribers. For an additional monthly charge, a subscriber may upgrade to one of our extended digital tier services and receive an increased number of video channels, including the channels in the basic tier service and additional HD and 4K channels. Our channel offerings include general entertainment, sports, movies, series, documentaries, lifestyles, news, adult, children and ethnic and foreign channels.
Discounts to our monthly service fees are available to any subscriber who selects a bundle of two or more of our services (bundled services): internet, video, fixed-line telephony and mobile services. Bundled services consist of double-play for two services, triple-play for three services and quad-play for four services.
To meet customer demands, we have enhanced our video services with additional relevant content services and features, which increases viewing satisfaction and addresses individual user needs. Our latest next generation product suite is called “Horizon 5”, a cloud-based, multi-screen entertainment platform that combines linear television (including recording and
I-10
replay features), premium video-on-demand (“VoD”) offerings, an increasing amount of integrated premium global and local video applications and mobile viewing into one entertainment experience. Horizon 5 comes with a state-of-the-art personal user interface that is intuitively easy to navigate. Content recommendations and favorite channel settings can be customized to individual user profiles. Video playback control, navigation shortcuts and content searches can all be conducted via a voice control button on the remote control, a feature highly appreciated by our customers. Horizon 5 is available in all of our markets on the latest set-top boxes and is capable of delivering 4K video content, including high dynamic range (HDR). The platform also features a ‘Personal Home’ page that automatically aggregates content, both linear and VoD, in a streamlined user interface based on the user’s viewing habits. Horizon 5 is marketed under the name “Sunrise TV” at Sunrise, “Telenet TV-Box” at Telenet, “Virgin TV360” at the VMO2 JV and VM Ireland and “MediaBox Next” at the VodafoneZiggo JV.
In the U.K., the forerunner product of Horizon 5 is based on the TiVo platform and was developed under a strategic partnership agreement with TiVo Inc. The TiVo platform is deployed on a basic set-top box as well as the Virgin Media V6 box. Similar to Horizon 5, the Virgin Media V6 box combines 4K video, including HDR, with improved streaming functionalities and more processing power. The Virgin Media V6 box allows customers to record six channels simultaneously while watching a seventh channel. Customers can also start watching a program on one television and pick up where they left off on other boxes in another room or through an app on their smart phones and tablets. A majority of the VMO2 JV’s customers have the Virgin Media V6 box. The V6 hardware is the same hardware that is used in other markets with Horizon software and over time these V6 boxes will be flashed with the latest Horizon 5 software, bringing our latest and most successful video and entertainment experience to the VMO2 JV’s customers without the need to exchange the installed hardware. Approximately 40% of the VMO2 JV’s customers are on the Horizon 5 platform.
In the summer of 2020, we launched our first IP-only streaming device, which runs the full Horizon 5 product suite, using only a small puck-like device that can be tucked away behind a television screen. This all-IP mini 4K capable set-top box has extremely low power consumption and its casing is made from recycled plastic, proudly winning us the Digital TV Europe’s Video Tech Innovation Sustainability Award in December 2020, as well as the Red Dot Product Design Award in 2021. We have also launched this all-IP 4K capable set-top box at Sunrise, VM Ireland (which launched in 2023), the VMO2 JV and the VodafoneZiggo JV. Most recently, we launched a newer, better performing version of this box at Telenet in November 2023. This box has the same appearance as in the other markets but possesses more memory, improved accessibility features and better sustainability. We intend to roll out this box to our other markets in the coming years.
Underpinned by this new IP-only streaming device, we launched our first subscription VoD-focused proposition in the U.K. called ‘Stream’. In addition to a slimmer channel lineup, this new package allows customers to pick and choose their favorite entertainment packages each month (e.g., Netflix, Disney+ and Prime Video) and get a 10% credit back for each subscription they add via our platform. By bundling their over the top (OTT) subscriptions together, customers also have an easy-to-see overview of what they are paying for and can manage them in a straightforward way, allowing for added flexibility as their viewing habits change.
One of our key video services is “Replay TV”. Through Replay TV, the last seven days of content (subject to blackout-related rights) is made available via the electronic programming guide (EPG) for on demand viewing. Customers can simply open the EPG, scroll back and replay linear programming instantly. This same technical solution also allows our customers to replay a television program from the start even while the live broadcast is in progress. Additionally, customers have the option of recording television programs in the cloud (or onto the hard disk drive that is housed within the “Virgin TV360” set-top box in the U.K. and in Ireland). Replay TV is one of the most used and appreciated features on our platforms.
In most of our markets, we offer transactional VoD giving subscribers access to thousands of movies and television series. In several of our markets, our subscription VoD service is included in certain of our video offerings. This service is tailored to the specific market based on available content, consumer preferences and competitive offers and it includes various programming, such as music, kids, documentaries, adult, sports and television series. In addition, in all of our markets we offer global premium OTT services such as Netflix, YouTube and Prime Video, and we also offer local OTT services via a large portion of our set-top boxes. These types of paid subscription services can be bundled into customers’ packages like in the Stream proposition or, in many cases, added directly to customers’ bills, offering them further convenience.
Most of this content is also available via our online mobile app, “Horizon Go”, which is available on mobile devices (iOS and Android) and, in some markets as well, via Amazon Fire TV, Apple TV and Android TV devices. Thanks to the 360 integration of Horizon 5 across multiple screens, customers can pause a program, series or movie and seamlessly continue watching from where they left off on another device, whether on a television, tablet, smart phone or laptop. Additionally, Horizon Go enables customers to remotely schedule the recording of a television program on their Horizon 5 box at home.
I-11
In 2023, we expanded our collaboration with our technology partner Infosys to evolve and scale our entertainment platform (as well as our connectivity platform). Infosys has taken over the build and operation of our Horizon platform and agreed to provide this service back to us for an initial five-year period, with an option to extend to eight years. By bringing the scale and breadth of Infosys, including cutting-edge technologies such as Infosys TopazTM AI, the expanded collaboration ensures continued operational excellence, a highly scalable development engine for new features and capabilities and cost efficiencies for us. Additionally, we will license this platform to Infosys so that they can offer it to new operators and markets outside our operating companies. This will potentially enable millions of new customers around the world to experience next-generation digital entertainment services through Horizon for the first time. We will continue to control product roadmaps and retain all intellectual property for the Horizon entertainment platform.
Telephony Services
Multi-feature telephony services are available through voice-over-internet-protocol (VoIP) technology in most of our broadband communication markets. In the U.K., the VMO2 JV also provides traditional circuit-switched telephony services. We pay interconnect fees to other telephony and internet providers when calls by our subscribers terminate on another network and receive similar fees from providers when calls by their users terminate on our network through interconnection points.
Our telephony service may be selected in several of our markets on a standalone basis and in all of our markets in combination with one or more of our other services. Our telephony service includes a basic fixed-line telephony product for line rental and various calling plans, which may consist of any of the following: unlimited network, national or international calling, unlimited off-peak calling and minute packages, including calls to fixed and mobile phones. We also offer value-added services, such as a personal call manager, unified messaging and a second or third phone line at an incremental cost.
Multiple Dwelling Units and Partner Networks
Following the closing of the Telenet Wyre Transaction on July 1, 2023, Telenet became a wholesale access client of Wyre, in addition to Orange Belgium N.V. (Orange Belgium), resulting in network penetration of close to 60%. In the coming years, Wyre expects to further roll-out and operate an HFC and fiber-to-the-home (FTTH) network within Belgium, aiming to cover 78% of its footprint with FTTH by 2038. Additionally, in connection with the Telenet Wyre Transaction, the long-term lease that Telenet had with Fluvius to provide fixed services to its customers in Fluvius’ footprint was terminated.
Pursuant to an agreement executed on June 28, 2008 (the 2008 PICs Agreement) with four associations of municipalities in Belgium (the pure intercommunales or “PICs”), Telenet leases the PICs broadband communications network and, accordingly, makes its services available to all of the homes passed by the cable network owned by the PICs. Telenet has a direct customer relationship with the video subscribers on the PICs network. Pursuant to the 2008 PICs Agreement, Telenet has full rights to use substantially all of the PICs network under a long-term finance lease. Unless extended, the 2008 PICs Agreement will expire on September 23, 2046 and cannot be terminated earlier (except in the case of non-payment or bankruptcy of Telenet). For additional information on the 2008 PICs Agreement, see note 18 to our consolidated financial statements included in Part II of this Annual Report on Form 10-K.
For over 70% of Sunrise’s basic video subscribers, Sunrise maintains billing relationships with landlords or housing associations and provides basic video service to tenants. The landlord or housing association administer the billing for the basic video service with their tenants and manage service terminations for their rental units. When tenants select triple-play bundles with or without mobile service from Sunrise, they then migrate to a direct billing relationship with us.
Sunrise offers broadband internet, enhanced video and telephony services directly to the video cable subscribers of those partner networks that enter into service operating contracts with Sunrise. Sunrise has the direct customer billing relationship with these subscribers. By permitting Sunrise to offer some or all of its broadband internet, video and telephony products directly to those partner network subscribers, Sunrise’s service operating contracts have expanded the addressable markets for Sunrise’s digital products. In exchange for the right to provide digital products directly to the partner network subscribers, Sunrise pays to the partner network a share of the revenue generated from those subscribers. Sunrise also provides network maintenance services and engineering and construction services to its partner networks.
In the third quarter of 2023, VM Ireland started offering broadband internet and video products and services to an additional footprint on the SIRO network, opening up new areas where VM Ireland’s own network is not available. In 2024, to continue the expansion into additional homes and business, VM Ireland entered into an agreement with National Broadband Ireland (NBI) to offer broadband internet and video products and services into the footprint served by NBI.
I-12
Business Services
In addition to our residential services, we offer business services in all of our operations. For business and public sector organizations, we provide a complete range of voice, advanced data, video, wireless and cloud-based services, as well as mobile and FMC services. Our business customers include SOHOs (generally up to five employees), small businesses and medium and large enterprises. We also provide business services on a wholesale basis to other operators.
Our business services are designed to meet the specific demands of our business customers with a wide range of services, including increased data transmission speeds and VPNs. These services fall into five broad categories:
•data services for fixed internet access with a 4G connectivity backup, IP VPNs based on SDWAN solutions and high-capacity point-to-point services, including dedicated cloud connections;
•cloud collaboration VoIP solutions and circuit switch telephony, unified communications and conferencing options;
•wireless services for mobile voice and data, as well as managed WiFi networks;
•video programming packages and select channel lineups for targeted industries or full programming packages for SOHO customers; and
•value-added services, including managed security systems, cloud enabled business applications, storage and web hosting.
Our intermediate to long-term strategy is to enhance our capabilities and offerings in the business sector so we become a preferred provider in the business market. To execute this strategy, partnerships, customer experience and strategic marketing play a key role.
Our business services are provided to customers at contractually established prices based on the size of the business, type of services received and the volume and duration of the service agreement. SOHO and small business customers pay business market prices on a monthly subscription basis to receive enhanced service levels and business features that support their needs. For more advanced business services, customers generally enter into a service agreement. For medium to large business customers, we enter into individual agreements that address their needs. These agreements are generally for a period of at least one year.
Customer Premises Equipment
We purchase CPE from a number of different suppliers. CPE includes set-top boxes, modems, WiFi routers and boosters, digital video recorders (DVRs), tuners and similar devices. For each type of equipment, we retain specialists to provide customer support. For our broadband services, we use a variety of suppliers for our network equipment and the various services we offer. Similarly, we use a variety of suppliers for mobile handsets to offer our customers mobile services.
Software Licenses
We license software products, including email and security software, and content, such as news feeds, from several suppliers for our internet services. The agreements for these products typically require us to pay a fee for software licenses and/or a share of advertising revenue for content licenses.
Investments
VMO2 JV
Liberty Global owns 50% of the VMO2 JV, an integrated communications provider of broadband internet, video, fixed-line telephony, mobile and converged services to residential and business customers in the U.K. As part of the U.K. JV Transaction, Liberty Global entered into a shareholders agreement with Telefónica, which previously owned O2 in the U.K. (the U.K. JV Shareholders Agreement), setting forth the corporate governance of the VMO2 JV, as well as, among other things, its dividend policy and non-competition provisions. The U.K. JV Shareholders Agreement mandates that the VMO2 JV distribute to Liberty Global and Telefónica on a quarterly basis a pro rata dividend equaling (unless agreed otherwise) all unrestricted cash, subject to certain minimum thresholds and financing arrangements. Subject to certain exceptions, Liberty Global may not transfer its ownership interest in the VMO2 JV without consent from Telefónica. For additional information on the U.K. JV Shareholders Agreement, see note 7 to our consolidated financial statements included in Part II of this Annual Report on Form 10-K.
I-13
The VMO2 JV offers gigabit internet across its entire serviceable fixed network footprint, reaching 16.2 million homes, combined with a mobile network that offers 99% indoor and outdoor population coverage on 4G, as well as over 50% 5G outdoor population coverage. The VMO2 JV had over 12 million RGUs as of December 31, 2023, comprised of approximately 5.7 million broadband internet subscribers. The VMO2 JV does not report video or telephony subscribers on an individualized basis, although such subscribers are included in its total RGU figure. In addition, the VMO2 JV had approximately 35.2 million mobile subscribers and is the U.K.’s leading mobile operator in terms of connections, with 44.9 million connections across its mobile, IoT and wholesale services.
In addition to gigabit broadband, the VMO2 JV provides fixed-line video and telephony services. The VMO2 JV’s video customers have access to the Horizon 5 minibox and its functionalities (marketed as “Virgin TV 360”), including ‘Catch-up’, ‘Startover’, the Virgin TV Go app, pause live television and VoD, along with access to a range of premium subscription-based and pay-per-view services. The VMO2 JV also offers a flexible entertainment service called ‘Stream’ which combines customers’ subscription packages, such as Netflix, Disney+ and Prime Video, as well as the free television channels under one system while also allowing the customer to transform their television into a voice-activated unit.
The VMO2 JV provides a wide range of mobile telecommunications and associated value-added products and services, such as voice, messaging and data services, handsets and hardware (e.g., wearables and handsets), stand-alone mobile devices and other accessories.
The VMO2 JV’s consumer convergence offering is led by its “Volt” proposition, offering new and existing customers that take Virgin Media broadband and eligible O2 Pay Monthly plans an upgrade to the next fixed broadband speed tier, increased mobile data and more value, including a WiFi guarantee. As of December 31, 2023, Volt had 1.9 million customers, supporting the VMO2 JV’s FMC penetration of approximately 44%.
The VMO2 JV also provides business and wholesale products and services to large enterprises, public sector entities and small and medium business customers, as well as wholesale and MVNO partners.
nexfibre JV
We beneficially own a 25% interest in the nexfibre JV, a joint venture in the U.K. that intends to construct and operate a wholesale FTTH broadband network of 5-7 million premises that does not overlap with the VMO2 JV’s existing network. Telefónica owns 25% of the nexfibre JV and InfraVia owns the remaining 50%. The VMO2 JV will act as the anchor client for the nexfibre JV’s fiber network. The VMO2 JV also entered into a construction agreement and a master services agreement with the nexfibre JV to provide various network construction and operation services to the nexfibre JV. In combination with the VMO2 JV’s existing network and planned FTTH upgrades, the VMO2 JV and the nexfibre JV networks are looking to expand gigabit coverage to approximately 80% of the U.K. once completed.
In connection with the formation of the nexfibre JV, we entered into shareholders agreements with Telefónica and InfraVia, providing for the governance of the nexfibre JV, including, among other things, its dividend policy and non-compete provisions. It also provides for restrictions on transfer of interests in the nexfibre JV and exit arrangements. Under the dividend policy, the nexfibre JV is required to distribute all unrestricted cash to Telefónica, InfraVia and us, subject to minimum cash requirements and financing arrangements.
VodafoneZiggo JV
Liberty Global owns 50% of the VodafoneZiggo JV, a leading Dutch telecommunications company that provides fixed, mobile and integrated communication and entertainment services to consumers and businesses in the Netherlands. In connection with the formation of the VodafoneZiggo JV, we entered into a shareholders agreement with Vodafone providing for the governance of the VodafoneZiggo JV, including, among other things, its dividend policy and non-compete provisions. It also provides for restrictions on the transfer of interests in the VodafoneZiggo JV and exit arrangements. Under the dividend policy, the VodafoneZiggo JV is required to distribute all unrestricted cash to Vodafone and us, subject to minimum cash requirements and financing arrangements. We also entered into a framework agreement with the VodafoneZiggo JV to provide access to each partner’s expertise in the telecommunications industry. For additional information on the above agreements, see note 7 to our consolidated financial statements included in Part II of this Annual Report on Form 10-K.
The fiber-rich broadband network of the VodafoneZiggo JV passes approximately 7.5 million homes. The VodafoneZiggo JV offers gigabit internet speeds for residential and business customers across its entire footprint. The VodafoneZiggo JV also offers nationwide 4G and 5G mobile coverage. At December 31, 2023, the VodafoneZiggo JV had 8.3 million RGUs, of which
I-14
3.2 million were broadband internet, 3.5 million were video and 1.5 million were fixed-line telephony. In addition, the VodafoneZiggo JV had 5.6 million mobile subscribers. Besides its residential services, the VodafoneZiggo JV offers extensive business services throughout the Netherlands. The operations of the VodafoneZiggo JV are subject to various regulations, which are described below under Regulatory Matters—Joint Venture Entities—The Netherlands.
The VodafoneZiggo JV’s customers continue to have access to the Horizon 5 media boxes and their functionalities (marketed as “Ziggo TV”), including Replay TV, the Ziggo Go app, pause live television and VoD, gigabit internet speeds and an extensive WiFi community network. The VodafoneZiggo JV also has its own sports channel, Ziggo Sport, and offers some exclusive programming. The VodafoneZiggo JV’s customers also have access to its nationwide 4G (referred to herein as “LTE”) and 5G wireless services under either a prepaid or postpaid service plan. The VodafoneZiggo JV provides its mobile services under various licenses that have a weighted average useful life of approximately 18 years as of December 31, 2023. With its mobile services, the VodafoneZiggo JV is able to offer quad-play bundles and FMC services to its residential and business customers.
Additional Business Information
Ventures
Liberty Global’s investment arm, Liberty Global Ventures, has amassed a portfolio of investments in more than 75 companies and funds across the world, investing in the fields of content, technology and infrastructure. With its long-term, founder-friendly mindset, Liberty Global Ventures makes meaningful investments in technologies that will change how people live and work tomorrow. Some of the companies in Liberty Global’s portfolio include All3Media Ltd. (All3Media), Plume, ITV, Lions Gate Entertainment Corp. (Lionsgate), Televisa Univision, AtlasEdge, Formula E, Aviatrix Systems, Inc., Pax8 Inc., Lacework Inc. and EdgeConneX Inc., among others. When advantageous, we seek to forge commercial relationships between our operating companies and the companies we invest in, creating an even stronger partnership to help drive growth and efficiencies. The investments identified by company name above are intended to be merely illustrative, do not represent a complete list and are not necessarily the largest of our long-term investments. From time to time, we may make investments in other companies that we choose not to identify by company name for commercial, legal, strategic or other reasons.
Technology
Our broadband internet, video and fixed-line telephony services are primarily transmitted over an HFC network. This network is composed primarily of national and regional fiber networks, which are connected to the home over the last few hundred meters by coaxial cable. Alongside our HFC network, we are increasingly rolling out services based on FTTH and leveraging fixed wireless access (FWA) technologies to service customers not covered by our fixed networks in areas where it may not be cost effective to deploy fixed networks.
We closely monitor our network capacity and customer usage. Where necessary, we increase our capacity incrementally, for instance by splitting nodes in our cable network. We also continue to explore improvements to our services and new technologies that will enhance our customer’s connected entertainment experience. These actions include:
•recapturing bandwidth and optimizing our networks by:
◦increasing the number of nodes in our markets;
◦increasing the bandwidth of our HFC cable network to 1.2 GHz;
◦converting analog channels to digital;
◦moving channels to IP delivery;
◦deploying additional DOCSIS 3.1 channels;
◦replacing copper lines with modern optic fibers; and
◦using digital compression technologies.
•freeing spectrum for high-speed internet, VoD and other services by encouraging customers to move from analog to digital services;
•increasing the efficiency of our networks by moving head-end functions (encoding, transcoding and multiplexing) to cloud storage systems;
•enhancing our network to accommodate business services;
I-15
•using wireless technologies to extend our services outside of the home;
•offering remote access to our video services through laptops, smart phones and tablets;
•expanding the availability of the Horizon 5 minibox and Horizon Go, as well as Horizon 5, and related products and developing and introducing online media sharing and streaming or cloud-based video; and
•testing new technologies.
As stated above, we are expanding our HFC and FTTH footprint. In addition, we are seeking mobile service opportunities where we have established cable networks and expanding our fixed-line networks where we have a strong mobile offering. This will allow us to offer FMC services to our customers.
We deliver high-speed data and fixed-line telephony over our broadband network in our markets. The cable networks of our operations in Europe are connected to our “Aorta” backbone. The Aorta backbone is recognized as a Tier 1 Carrier, which permits us to serve our customers through settlement-free collaboration with other carriers without the cost of using a third-party network.
In support of our connectivity strategy, we are moving our customers into a gigabit society. All of our broadband networks are already capable of supporting the next generation of ultra-high-speed internet service at gigabit speeds. To provide these speeds to our subscribers, we plan to grow our base of DOCSIS 3.1 technology throughout our footprint. The use of DOCSIS 3.1 technology provides us significantly higher efficiencies on our networks and allows us to offer faster speeds, in-home WiFi and better services. The new gateways and the continued upgrades to our network in the coming years will allow us to maximize high-speed connectivity over our broadband networks and deliver gigabit services in a cost-effective manner. It will also allow us to meet the expectations of our customers for high-speed internet access both in cities and rural areas of our footprint. While DOCSIS 3.1 technology will provide up to 2.5 Gbps, in 2023, we introduced XGSPON technology across much of our FTTH footprint, enabling speeds of up to 10 Gbps, with plans for further rollouts in 2024. In addition, we have started prototyping DOCSIS 4.0 technology that is anticipated to equally provide 10 Gbps capabilities across our HFC footprint.
Supply Sources
Content. In our markets, entertainment platforms remain a key part of the telecommunication services bundle. Therefore, in addition to providing services that allow our customers to view programming when and where they want, we are investing in content that customers want. Our content strategy is based on:
•proposition (exceeding our customers’ entertainment desires and expectations);
•product (delivering the best content available);
•procurement (investment in the best brands, movies, shows and sports); and
•partnering (strategic alignment, acquisitions and growth opportunities).
We license almost all of our programming and on-demand offerings from content providers and third-party rights holders, including broadcasters and cable programming networks. Under our channel distribution agreements, we generally pay a monthly fee on a per channel or per subscriber basis, with occasional minimum pay guarantees. For on-demand programming, we generally pay a revenue share for transactional VoD (occasionally with minimum guarantees) and either a flat fee or a monthly fee per subscriber for subscription VoD. In the case of the VMO2 JV and the VodafoneZiggo JV, transactional VoD is primarily sourced via a third party (Vubiquity and Pathé, respectively). For a majority of our agreements, we seek to include the rights to offer the licensed programming to our customers through multiple delivery platforms and through our apps for smart phones and tablets.
In seeking licenses for content, we, including the VMO2 JV and the VodafoneZiggo JV, as applicable, partner with leading international and regional pay television providers, such as Disney, Sony, Paramount Global, AMC, NBCUniversal, RTL, BBC and Warner Bros. Discovery (including HBO). We also seek to carry in each of our markets key public and private broadcasters, and in some markets, we acquire local premium programming through select relationships with companies such as Sky plc (Sky), TNT Sports (a joint venture between BT Sport and Warner Bros. Discovery), Streamz, BlueTV and Canal+. For our VoD services we license a variety of programming, including box sets of television series, movies, music, kids’ programming and documentaries.
I-16
In recent years, OTT apps have become increasingly important in the content space and, as part of our content strategy, we have put in place deals with a number of global and regional app providers. We currently have arrangements with Disney (The Walt Disney Company Limited and The Walt Disney Company Benelux), Netflix International B.V. (Netflix), Amazon Europe Core S.A.R.L. (Amazon), SkyShowtime Limited (SkyShowtime), Apple Inc., HBO Nordic AB and Viaplay Group AB (Viaplay). Pursuant to these arrangements, Disney+, Netflix, Prime Video, SkyShowtime, AppleTV+, HBO Max and Viaplay services, respectively, are available via certain of our set-top boxes to our video customers across many of our markets, each as premium OTT services. The Disney+ app is available to customers at Telenet, the VMO2 JV and the VodafoneZiggo JV. The Netflix app is available to customers at Sunrise, Telenet, VM Ireland, the VMO2 JV and the VodafoneZiggo JV. The Amazon Prime Video app is available to customers at Sunrise, Telenet, VM Ireland, the VMO2 JV and the VodafoneZiggo JV. The SkyShowtime service is available to customers at the VodafoneZiggo JV (launched October 2023). The AppleTV+ app is available to customers at Sunrise and VM Ireland (which both launched December 2023) and the VMO2 JV (launched October 2023). The HBO Max app is available to customers at the VodafoneZiggo JV. Viaplay’s service is available to customers at the VodafoneZiggo JV. In addition, the VodafoneZiggo JV launched the Canal+ app in December 2023 after concluding an agreement with Canal+ Luxembourg S.à.r.l. We also entered into an arrangement with Google Ireland Limited for the YouTube and YouTube Kids services apps which are available via certain of our set-top boxes to customers at Sunrise, Telenet, VM Ireland, the VMO2 JV and the VodafoneZiggo JV. In order to tailor our entertainment offerings to each market, we have added various locally relevant apps such as Play Suisse at Sunrise, VRT Max, VTM Go and GoPlay at Telenet, BBC iPlayer and ITVX at the VMO2 JV and NPO Start and Videoland at the VodafoneZiggo JV.
Exclusive content is another element of our content strategy. To support this approach, we are investing in content assets. We have invested in various content companies, including ITV, All3Media, Lionsgate, Virgin Media TV, Play Media (previously SBS Belgium), Woestijnvis and Caviar Group. We are also investing in sports, both as a broadcaster and as a rights owner. We have our own sports channels under the Play Sports brand in Belgium, which is exclusively available to Telenet customers, and MySports in Switzerland, which Sunrise licenses to other platforms in Switzerland. In Ireland, Virgin Media customers have access to VM More which includes sports programming as well as first look products and premium content. In addition, the VodafoneZiggo JV owns Ziggo Sport and commissions the production of certain shows such as Rondo and Race Cafe. The basic Ziggo Sport service is available exclusively to the VodafoneZiggo JV’s customers, however, the premium service is widely available through license arrangements.
In addition, we have commissioned our own drama series content. Through All3Media, we co-produced a television series, known as The Feed, which was released in 2019 in several of our markets, and co-produced Blood in Ireland, which aired in 2018 and 2020. With Lionsgate, we pre-purchased the spy thriller series The Rook, which premiered in 2019. In addition, we have produced the Swiss sitcom Fassler-Kunz, the Swiss series Im Heimatland and the original Belgian series Chaussée d’Amour and De Dag with local production companies. These television series are primarily available to our customers on an on-demand basis. We also intend to continue commissioning, producing and/or co-producing content for our free-to-air (FTA) assets and VoD platforms at Telenet and VM Ireland, mainly via Streamz, Telenet’s joint venture for subscription VoD with DPG Media.
For mobile services in Ireland provided through an MVNO arrangement with Three (Hutchison), we are dependent on third-party wireless network providers. Our MVNO operation in Ireland has an agreement with Three (Hutchison) to carry the mobile communications traffic of our customers. We seek to enter into medium to long-term arrangements for these services. A termination of this arrangements could significantly impact our MVNO-operated mobile services at VM Ireland.
Competition
All of our businesses operate in highly competitive and rapidly evolving markets. The speed of technological advancements is likely to continue to increase, giving customers more options for telecommunications services and products. Our customers want access to high quality telecommunication products that provide a seamless connectivity experience. Accordingly, our ability to offer FMC services (internet, video and telephony through our fixed and mobile networks) is a key component of our strategy. In many of our markets, we compete with incumbent companies that provide FMC services, as well as companies that are established in one or more communication products. Many of these companies have extensive resources allowing them to offer competitively priced converged services. Consequently, our businesses face significant competition. Our ability to offer high-quality and attractive triple-play or quad-play bundles and FMC bundles in these markets is one of our key strategies to attract and retain customers. We seek to distinguish ourselves through our multimedia gateway services, interactive video products (such as Replay TV and VoD), proprietary sports offerings, extensive content offers (for both in and out of the home) and our high-speed connectivity services backed by intelligent in-home WiFi solutions. In this section, we begin with an overview on the competitive nature of the broadband internet, video, mobile and telephony services in our markets, and then provide information on key competitors in certain of our more material markets.
I-17
Internet
Our businesses face competition in a rapidly evolving broadband marketplace from both incumbent and non-incumbent telecommunications companies, mobile operators and other internet service providers, many of which have substantial resources. The internet services offered by these competitors include both fixed-line broadband internet via cable, digital subscriber lines (DSL) or FTTx and wireless broadband. These competitors have a range of product offerings with varying speeds and pricing, as well as interactive services, data and content services offered to households and businesses. With the demand for mobile internet services increasing, competition from wireless services using various advanced technologies is an important competitive factor. In all of our markets, competitors offer high-speed mobile data via 4G or 5G networks. In this intense competitive environment, internet speed and pricing are the key criteria for customers.
Our broadband strategy is seamless speed leadership. Our focus is on increasing the maximum speed of our connections while providing a reliable customer experience and offering a variety of service tiers, prices, bundled products and a range of value-added services, including intelligent in-home connectivity solutions. We update our bundles and packages on an ongoing basis to meet the needs of our customers and to retain an attractive value-for-money proposition. Ultra-high download speeds of 1 Gbps are available throughout our operational footprints in each of Switzerland, Belgium, Ireland, the U.K. and the Netherlands. We use our competitively priced ultra-high-speed internet services to encourage customers to switch to our services from other providers.
A notable competitive factor for us is overbuilding of our networks with FTTx technology by incumbent companies and other third parties. At the moment, we do not consider our networks to be critically overbuilt, however, certain FTTx providers accelerated the rollout of their networks. We are confident that our HFC networks can be upgraded to higher speeds to match potential FTTx based products. Furthermore, whenever it makes operational and economic sense, we seek to capitalize on opportunities to grow our network capabilities through FTTx technology.
•Telenet. In the Flanders region of Belgium, Telenet is the leading provider of residential broadband internet services. Telenet’s primary competitor is Proximus NV/SA (Proximus). Proximus is a well-established competitor offering quad-play bundles. Proximus’ DSL and very high-speed DSL technology (VDSL) services provide download speeds up to 100 Mbps. Moreover, Proximus offers up to 1 Gbps speed via its fiber network that is available in selected cities and is being actively deployed elsewhere in the country. Similar to its video services, Telenet faces competition in the provision of internet services from other providers who have wholesale access to Wyre’s cable network. Through such access, Orange Belgium currently offers its mobile subscribers a triple-play bundle including fixed broadband internet, enhanced video and mobile services. In June 2023, Orange Belgium completed its acquisition of a 75% stake (minus one share) in VOO, a telecom operator that owns cable networks in the Wallonia region of Belgium. In January 2023, Telenet entered into two 15-year commercial wholesale agreements with Orange Belgium. The agreements provide Telenet and Orange Belgium access to each other’s fixed networks, including both HFC and FTTH, on a commercial basis for a 15-year period and enable Telenet to offer FMC services in Wallonia beginning in 2024.
•Sunrise. In Switzerland, Swisscom is the largest provider of broadband internet services and is Sunrise’s primary competitor. Swisscom offers download speeds ranging from 100 Mbps to up to 10 Gbps, depending on its available network technology. Swisscom continues to expand its FTTx network to Switzerland households in our footprint, as well as in our partner network footprints. Salt, a predominantly mobile player, also competes in this arena, with a focus on FMC services through a combination of FTTx and fixed wireless access technologies offering 10 Gbps internet speeds.
•Significant Joint Ventures.
In the U.K., the VMO2 JV faces numerous competitors for broadband internet services, the largest of which is BT. BT is actively building out its FTTx network through its subsidiary, Openreach, to support its goal of covering 25 million homes by the end of 2026. In support of this mission, BT offers a range of ultrafast consumer packages with speeds of up to 1.6 Gbps. As noted above, the VMO2 JV has reached 1 Gbps connectivity in all 16.2 million premises. Moreover, the VMO2 JV announced its intention to upgrade its fixed network to full fiber-to-the-premise by the end of 2028 and extend its FTTH footprint to up to 23 million premises through its partnership with the nexfibre JV. This plan is expected to fuel connectivity innovation for consumers and businesses, create options to potentially pursue the broadband wholesale market in the U.K. and to protect from growing FTTx competition.
The VodafoneZiggo JV’s primary competitor, Koninklijke KPN N.V. (KPN), offers internet protocol television (IPTV) over its FTTx network and through broadband internet connections using DSL or VDSL. Where KPN has enhanced its VDSL system, it offers broadband internet with download speeds of up to 200 Mbps, and on its FTTx
I-18
networks, it offers download speeds of up to 4 Gbps. A significant part of VodafoneZiggo JV’s network has been overbuilt by KPN’s and other providers’ FTTx networks. In 2021, KPN and pension fund, APG, established a joint venture company called Glaspoort that is targeting fiber rollouts in medium-dense, rural and industrials areas by connecting up to 1.2 million households and businesses by 2026. KPN will also continue to pursue its existing fiber roll-out plans in the coming years, with Glaspoort’s scope expected to accelerate KPN’s goal to reach approximately 80% FTTx coverage by 2026. We expect competitive pressure from the fiber overbuild to intensify in the coming periods. At the end of 2023, all of the VodafoneZiggo JV’s 7.5 million households had access to ultra-fast 1 Gbps connectivity to support our competitive edge and speed advantage.
Video Distribution
Our video services compete primarily with traditional FTA broadcast television services, direct-to-home satellite service providers, OTT and broadcaster VoD providers, as well as other fixed-line and mobile telecommunications carriers and broadband providers offering a similar range of video services. Many of these competitors have a national footprint and offer features, pricing and video services individually and in bundles comparable to what we offer.
OTT video content providers utilizing our or our competitors’ high-speed internet connections are also a significant competitive factor, as are other video service providers that overlap our service areas. The OTT video providers (such as HBO Now, Prime Video, Netflix, Disney+ and AppleTV+) offer VoD services for television series, movies and programming from broadcasters. Generally, the content libraries of such services are offered for a monthly fee. Typically, these services are available on multiple devices in and out of the home. Moreover, broadcasters offer direct to customer content, including VoD, live and catch-up television via their own platforms (such as BBC iPlayer, Discovery and RTL). To retain our competitive position, we provide our subscribers with television everywhere products and premium OTT video services through our online mobile apps, VoD and Replay TV services through our arrangements with Netflix, Amazon, YouTube and others. Our businesses also compete to varying degrees with other sources of information and entertainment, such as online entertainment, newspapers, magazines, books, live entertainment/concerts and sporting events.
Our ability to attract and retain customers depends on our continued ability to acquire appealing content, provide easy to use services on acceptable terms and to deliver content on multiple devices inside and outside the home. Some competitors have obtained long-term exclusive contracts for certain programming, which limits the opportunities for other providers to offer such programs. Our operations have limited access to certain of such programming through select contracts with these companies, including Sky and BT in the U.K. Moreover, telecommunication providers increasingly offer access to OTT platforms through their systems. If exclusive content offerings increase through other providers, programming options could be a deciding factor for subscribers on selecting a video service.
We compete on value by offering advanced digital services with a premier user interface, such as cloud recording and DVR functionality, HD/4K, VoD, voice control, OTT aggregation, Replay TV and multi-screen services via a superior user interface. We also compete by offering attractive content packages, as well as bundled services, at reasonable prices. In each of the countries where we operate, we tailor our packages to include attractive channel offerings and offer recurring discounts for bundled services and loyalty contracts, as well as integrated billing for OTT services. In addition, from time to time, we modify our digital channel offerings to improve the quality of our programming. Where mobile voice and data are available, we focus on our FMC service offerings at attractive prices. In our other operations, we use the triple-play bundle as a means of driving video, as well as other products where convenience and price can be leveraged across the portfolio of services. We also continue to enhance our Horizon platform to meet our customers’ desire to view programming anytime and anywhere, such as new applications and expanding its availability in our markets. Horizon 5 is the latest iteration of our entertainment platform. It enables content aggregation and bundling to help customers navigate the ever-growing libraries of first-class content by pulling in all key streaming apps across television, music, gaming, smart home and social, while delivering a hyper-personal user experience.
•Telenet. Telenet’s principal competitor is Proximus, the incumbent telecommunications operator, which has interactive digital television, replay television, VoD, OTT and HD service as part of its video offer, as well as mobile-only video propositions tailored to the needs of younger market segments. Proximus offers customers a wide range of both individual and bundled services at competitive prices. Also, as a result of regulatory obligations, Telenet and other Belgian cable operators must give alternative providers access to their cable networks. Orange Belgium gained such access in 2016 and currently offers its mobile subscribers a triple-play bundle, including broadband internet, enhanced video and mobile services. Telenet may face increased competition from other providers of video services who take advantage of the wholesale access and may be able to offer triple- and quad-play services. For more information on wholesale access, see Regulatory Matters—Belgium below.
I-19
•Sunrise. Our main competitor in Switzerland is Swisscom, the incumbent telecommunications operator, which provides IPTV services over DSL, VDSL and FTTx networks. Swisscom offers VoD services, DVR and replay functionality, HD channels and has exclusive rights to distribute certain sports programming. Swisscom launched an advanced set-top box in the market with voice control, Smart Home integration and content aggregation beyond video, such as music streaming and gaming services. Although its presence is limited, Salt focuses on value propositions by including television within their bundles and providing access to OTT via Apple TV. In this saturated market, price competition and high promotional intensity are significant factors.
•Significant Joint Ventures.
The VMO2 JV’s principal competitors for digital television services are Sky and FTA television providers. Other significant competitors are BT and TalkTalk Telecom Group plc (TalkTalk), each of which offer triple-play services, IPTV video services and multimedia home gateways. Sky owns the U.K. rights to various entertainment, sports and movie programming. Sky is both a principal competitor and an important supplier of content to the VMO2 JV. Various Sky channels, including Sky Sports, are available over Sky’s satellite system and our cable networks, as well as via Sky’s apps and online players and other television platforms, and some of the channels are available on BT and TalkTalk platforms. The VMO2 JV distributes several basic and premium video channels supplied by Sky. BT is also both a principal competitor and an important supplier of content to the VMO2 JV. In 2023, BT formed a joint venture with Warner Bros. Discovery and launched TNT Sports, which replaced BT Sport and combined the partners’ content portfolios, including Olympic Games, the English Champion’s League, UEFA Europa League and other live sports. TNT Sports is available on the VMO2 JV’s cable network as well as its competitors’ networks. The VMO2 JV is expanding its broadband network and actively promoting its 4K and HDR ready boxes running on its Horizon 5 platform (marketed as “Virgin TV360”) as well as its online streaming service, Virgin TV Go. Customers also have access to an entertainment service, ‘Stream’, which is an all-in-one streaming box, combining television channels and aggregating third-party subscription services such as Sky Sports, Netflix and Disney+. Stream provides personalized viewing recommendations and allows customers to customize their subscription mix, billed through a single account.
The VodafoneZiggo JV primarily competes with KPN with respect to video distribution, which provides IPTV services. KPN offers many of the same interactive video service features as the VodafoneZiggo JV does, including VoD services, DVR, replay functionality and HD channels. KPN also offers its customers bundling packages that include its video products, creating a highly competitive market for the VodafoneZiggo JV’s products and services. Ziggo Sport, the VodafoneZiggo JV’s sports offering, acquired the exclusive 2024/2027 media rights to the UEFA Champions League, the UEFA Europa League and the UEFA Europa Conference League. Starting in the 2024/2025 football season, this will bring the most important European club competitions under one roof for the first time. All the competitions and highlights will be available exclusively on Ziggo Sport.
Mobile and Telephony Services
In Belgium, as a MNO, we are one of the larger mobile providers based on number of SIM cards. The same is true for the VodafoneZiggo JV in the Netherlands. We also substantially expanded our mobile business with the acquisition of Sunrise in Switzerland and through the joint venture with Telefónica’s U.K. brand, O2, in the U.K. In the markets where we are an MNO, we continue to deploy additional bandwidth and look to acquire additional spectrum to deliver our wide range of services to our customers and expand our 4G and 5G services. Competition remains significant across each of our markets. We offer various calling plans, such as unlimited calling, national or international calling and use FMC bundles and benefits to cross-sell mobile to our existing fixed customers. Our ability to offer FMC services is a key driver of growth. Furthermore, in order to address lower segments of the market, we operate with ancillary mobile brands, such as Yallo (Switzerland), Base (Belgium), giffgaff (U.K.) and Hollandsnieuwe (Netherlands).
The market for fixed-line telephony services is saturated in all of our markets. Changes in market share are driven by the combination of price and quality of services provided and the inclusion of telephony services in bundled offerings. Our fixed-line telephony services compete against the incumbent telecommunications operators. In all of our markets, we also compete with other VoIP operators offering service across broadband lines. In addition, our businesses face competition from other FTTx-based providers or other indirect access providers.
In each of our markets, we face competition with a dominant fixed-line telephony provider, most of which also have competitive mobile offers based on 4G or 5G services. In our largest consolidated markets, the key dominant telephony providers are Swisscom (Switzerland) and Proximus (Belgium). These telephony competitors are also the largest mobile operators in these markets based on number of SIM cards. These competitors include their mobile products in bundles with
I-20
fixed-line services. Moreover, there is a fundamental shift in customer preference towards mobile and OTT. As a result, we expect our fixed telephony user base to continue its decline in favor of mobile connectivity and OTT services.
Human Capital Resources
As of December 31, 2023, our consolidated subsidiaries had an aggregate of approximately 9,860 full-time equivalent employees, including approximately 3,770 in Belgium, 3,020 in Switzerland, 1,260 in the U.K., 940 in the Republic of Ireland, 520 in the Netherlands, 250 in Slovakia and 100 in the U.S. With respect to our significant nonconsolidated joint ventures, the VMO2 JV employs approximately 15,020 people and the VodafoneZiggo JV employs approximately 6,260 people. None of the above figures include contractors or temporary employees.
A majority of our European employees are represented by workers councils. We strive to maintain a positive relationship with all of our employees, as well as the workers councils representing them, where applicable. There have been no significant interruptions of our operations in recent years due to labor disputes.
In challenging our employees to achieve their full potential, become purposeful leaders and to Grow With Us, we commit significant resources and make ongoing investments toward the development of our employees’ leadership skills. Our skills development offerings cover key talent communities - from graduates and apprentices, to people managers, emerging leaders and senior leaders. Such programs include our Finance, Technology, CyberSecurity and People graduate schemes that thrust new graduates into our fast-paced and dynamic business model, giving them immediate real-world experience along with structured support from the company, so that each graduate exits their program prepared to be a leader of tomorrow. Liberty Global also aims to prepare its future senior leadership through its Fast Forward program, a year-long program in which high performing individuals are trained and challenged to become Liberty Global’s leaders of tomorrow. We invest significantly in our employees because we recognize that when each employee is supported and given the opportunity to succeed, our company as a whole flourishes.
We are fostering a culture where every individual is valued and respected, contributing to a positive impact on one another and our communities. Through connections formed daily, we strive to create a sense of belonging for all. The importance of diversity, equity and inclusivity extends beyond our employees' experience and performance; it influences talent acquisition and retention and strengthens our ties to the communities where we live and operate. In 2023, our commitment to Diversity, Equity & Inclusion (DE&I) continued to evolve. Our DE&I Council, comprised of our chief executive officer (CEO) and 19 executive representatives, meets regularly to discuss company strategies, initiatives and policies related to DE&I. The council advises on our DE&I strategy, monitors progress against our ambitions and facilitates the exchange of best practices across our organization. The People, Planet, Progress committee of our board of directors provides guidance to our DE&I Council from time to time.
While conducting our annual DE&I survey in 2023, we sought feedback from our employees through listening forums, which informed our strategic plans based on the insights gained. Our DE&I program has progressed through close collaboration across all of our business sectors, resulting in specific goals for gender representation. Central to our efforts is measuring the sentiment of individuals who feel authentic in the workplace daily. Each business unit has identified priorities that contribute to our overarching goal of fostering innovation, collaboration and overall organizational performance. Our commitment to hiring the best candidates remains unwavering, and we continuously optimize roles through natural turnover, tracking progress through employee dashboards and quarterly business review meetings.
Collaboration with our Employee Resource Groups (ERGs), focusing on various aspects of diversity, has been integral to our DE&I efforts. With 22 ERGs globally, we co-create initiatives for strategic cultural change. Working with our ERGs, we have delivered five ‘Empower Hours’, centered around specific days in our diversity calendar, to educate, engage and empower each other to take meaningful action. Additionally, we carried out a global leadership reverse mentoring pilot with our race and ethnicity ERG, in which the members of the ERG led the programming and acted as mentors to the participants. This reverse mentoring pilot took place with senior leaders from across our company and is expected to be implemented more broadly in the coming years. Our involvement in the Valuable 500, a global movement putting disability on the business leadership agenda, and the disability confident scheme in the U.K., emphasizes our commitment to disability inclusion. Inclusive Employers, a leading membership organization, supports our efforts through consultancy, training and thought leadership. Achieving silver status in the Inclusive Employers standard and receiving commendation for our belonging communication campaign demonstrates our progress in this area.
The VMO2 JV and VodafoneZiggo JV, along with Sunrise and VM Ireland, also have their own ERGs to provide support for their local employees and to complement Liberty Global’s broader DE&I strategy and initiatives. In addition, our DE&I
I-21
Council has worked diligently to prepare concrete, implementable initiatives to further our collective DE&I strategy. Such initiatives are measurable, allowing us to more accurately track our progress.
To help eliminate potential bias in our hiring, we implemented inclusive hiring manager training, ensured diverse interview panels and have begun to use artificial intelligence to help eliminate gender-biased language in job descriptions. We broadened our talent pool through a refreshed external proposition, conscious advertising and internal transparency. Our company policy reviews aim to create a more equitable, accessible and inclusive working environment.
In 2023, we launched our “Youth Council”, consisting of 12 Gen Z and under 35 members that serve as an advisory body to our executive leadership team, signifying our commitment to harnessing youth culture and future-proofing our strategy. The council actively contributes across our customer propositions and experiences, sustainability and the future of work.
We also conduct compulsory anti-bullying, anti-discrimination and anti-harassment training for all of our employees in line with our Anti-Discrimination, Harassment and Bullying policy and engage in small-group, impactful conversations, centering on discrimination and harassment in the workplace. Our venture capital arm has committed $13 million to investing in start-up companies, including through our partners, Avesta Capital and Colorado Impact Fund, that make a positive impact on society. These companies, such as Blue Studios, Kiira Health, BoxPower, Harvest Thermal and Sunny Day Fund are specifically focused on socially conscious business practices, such as tackling economic and social inequity, as well as climate change. Liberty Global prides itself on the achievements it has made with respect to DE&I, but it recognizes that there is much work still to be done, and that to grow as a company, we must invest in our people so that they can be themselves at work every day.
Our compensation program is key to our company’s success and incentivizes our management team to execute our financial and operational goals. We concentrate on attracting, retaining and motivating talented executives who can be responsive to new and different opportunities for our company and thereby create value for our customers and shareholders. The primary goals of our executive compensation program are to motivate our executives to maximize their contributions to the company’s success, attract and retain the best leaders for our business and to align our executives’ interests with creating shareholder value.
At Liberty Global, we are committed to the health and safety of our employees and visitors to our sites, and we ensure compliance with all relevant national health and safety regulations. For employees, we currently utilize a hybrid work-from-home/work-from-office work program. We have also made available a series of well-being resources based on a four-pronged strategy focused on the mental, physical, social and financial aspects of health and well-being. Included in this strategy, among other things, is access to group training sessions, private work-out facilities, bicycle reimbursement plans, in-office flu vaccinations and private check-up visits.
We measure employee engagement quarterly against external benchmarks defined by a leading human resources consultant. We perform in line with global industry benchmarks and exceed benchmarks set by high performing organizations in areas such as in inclusion, well-being, manager support and senior leadership communication. The high performing comparison group is comprised of organizations with strong financial performance and superior human resource practices, representing the gold standard for employee engagement. Survey results are owned by managers and executives, who are accountable for formulating action plans. In addition, we gather qualitative and quantitative insights with methods such as shorter-term pulse surveys and narrower focus groups. This approach informs decision making across key employee focus areas, including for example, well-being, work-from-home opportunities and skills development.
Additional information on our workforce and our commitment to our employees is made available in Liberty Global’s Annual Corporate Responsibility Report, which we expect to be published on our website during the second half of 2024. The contents of this report are not incorporated by reference herein.
Regulatory Matters
Overview
Broadband internet, video distribution, fixed-line telephony and mobile businesses are regulated in each of the countries in which we operate. The scope of regulation varies from country to country, although in some significant respects, regulation in E.U. markets is harmonized under the regulatory structure of the E.U.
Of the seven countries in our footprint, five are part of the E.U.: the Republic of Ireland, the Netherlands (nonconsolidated joint venture), Belgium, Luxembourg and Slovakia. Our other operations are in the U.K. (nonconsolidated joint venture) and Switzerland are not in the E.U. but generally enact rules similar to that of the E.U.
I-22
The U.K. formally left the E.U. on January 31, 2020, commonly referred to as “Brexit”. On December 24, 2020, the U.K. and the E.U. reached the “Trade and Cooperation Agreement”, referred to as the “E.U.-U.K. Agreement”. Principles on state aid are also contained in the E.U.-U.K. Agreement to prevent either side from granting unfair subsidies and to provide a dispute settlement mechanism to ensure businesses from the E.U. and the U.K. compete on a level playing field. In relation to the telecommunications sector, the U.K. and the E.U. have agreed to maintain the existing levels of liberalization in their markets, including standard provisions on authorizations, access to and use of telecoms networks, interconnection, fair and transparent regulation and the allocation of scarce resources. The E.U.-U.K. Agreement contains measures to encourage cooperation and promote fair and transparent rates for international mobile roaming. However, the U.K. previously introduced a number of measures aimed at providing safeguards for consumers, which continue to apply. Such measures include limits on the amount that customers can be charged for using mobile data abroad before having to opt in if they wish to use more data and alert warnings as customers reach various milestones in data allowances included within their packages. Additionally, the Northern Irish Protocol regulates the relationship between Northern Ireland and the Republic of Ireland, ensuring that no hard border is placed between the two, as well as keeping Northern Ireland inside the E.U. single market. The Northern Irish Protocol, while not material to our or the VMO2 JV’s operations, affects the movement of CPE and installation personnel between Northern Ireland and the Republic of Ireland. A review of the E.U.-U.K. Agreement is due to take place in May 2026.
In Switzerland, the distribution of radio and television is regulated under the Radio and Television Act. The provision of telecommunications services is regulated by the Telecommunications Act. In addition, the Competition Act, the Data Protection Act and the Act on the Surveillance of Post and Telecommunications are relevant to our business.
Sector Regulations
The European Electronic Communications Code (the Code) is the primary source of regulation governing our E.U. operations. The Code came into effect on December 20, 2018 and has been transposed by all of the Member States in our footprint into their respective national laws. The U.K. has largely transposed the Code into its national laws. Switzerland, while not part of the E.U., has a regulatory system that partially reflects the principles of the E.U. The Telecommunications Act in Switzerland regulates, in general, the transmission of information, including the transmission of radio and television signals.
The Code primarily seeks to develop open markets for communication services within Europe. It harmonizes the rules within the E.U. for the establishment and operation of electronic communication networks, including cable television and traditional telephony networks, and the offer of electronic communication services, such as telephony (including OTT services), internet and, to some degree, television services.
Set forth below are certain key provisions included in the Code that are most applicable to our operations.
•Significant Market Power. Specific obligations imposed by National Regulatory Authorities (NRAs) in E.U. Member States apply only to service providers deemed to have Significant Market Power (SMP) in a relevant market. For purposes of the Code, a service provider has SMP where it enjoys a position of significant economic strength, affording it the power to behave independently of competitors, customers and consumers to an appreciable extent.
If a service provider is found to have SMP in any particular market, the applicable NRA must impose certain conditions on that service provider. We have been found to have SMP in certain markets in which we operate and further findings of SMP are possible, which may negatively impact our business. However, across our footprint, we have noticed an increased tendency of NRAs towards deregulation, with only a small number of markets currently being subject to this type of regulation.
The U.K. has a similar system, with the applicable NRA assessing markets on a forward-looking basis to determine SMP. In Switzerland, there is no such forward-looking system, rather a service provider can be regulated based on general competition law.
•Must-Carry Obligations. Member States may impose reasonable must-carry obligations on certain service providers under their jurisdiction. Such obligations must be based on clearly defined general interest objectives, be proportionate and transparent and be subject to periodic review. The U.K. and Switzerland each have a regulatory system that reflects these principles. We are subject to must-carry regulations in all markets in which we operate, and we do not expect such obligations to be curtailed in the foreseeable future.
NRAs may, in some cases, impose access obligations on service providers, regardless of whether they have SMP. Under the Code and the E.U. Broadband Cost Reduction Directive, service providers may be required to provide access to certain
I-23
elements of their passive network infrastructure upon reasonable request if there are significant economic or physical replicability barriers. Service providers may be required to provide access to their active infrastructure as well but only if a number of additional requirements are met. The E.U. Broadband Cost Reduction Directive is under review, and the repealing regulation (the Gigabit Infrastructure Act) is expected to be adopted in 2024, with most provisions coming into effect six to 12 months after its publication. The U.K. has a similar system in place, while the Telecommunications Act in Switzerland requires operators with a dominant position to grant access to other providers on a non-discriminatory manner at cost-oriented prices.
Net Neutrality, Roaming and Call Termination
In November 2015, the European Parliament adopted the regulation on the first E.U.-wide net neutrality regime. The regulation allows for specialized services, optimized for specific content and subjects service providers like Liberty Global, through its operating companies, to reasonable traffic management requirements. The U.K. transposed net neutrality into its national law following Brexit. In its communication on October 26, 2023, the U.K. Office of Communications (Ofcom) proposed a more lenient interpretation of some aspects of net neutrality, and the effect of some of those may be subject to changes of national law. Legislative changes are, however, a matter for the U.K. Parliament. In Switzerland, the Telecommunications Act introduced more transparent net neutrality regulation that allows for traffic management in limited circumstances (e.g., to fight exceptional network congestion). Customers must be informed if traffic is treated unequally and about the quality of the internet service (for both fixed and mobile internet).
The 2015 regulation mentioned above also prohibits retail roaming tariffs and sets wholesale roaming price caps. In 2019, the E.U. introduced caps on wholesale rates for intra-E.U. calls to bring these in line with the wholesale roaming caps. The Telecommunications Act in Switzerland implemented roaming obligations, including mandatory discounted roaming packages, per second or per kilobyte of roaming charges and capped fees for all roaming services. In relation to the U.K., E.U. operators are now free to raise wholesale charges for U.K. operators (and vice-versa) but may choose not to.
Call termination tariffs for SMP providers are set by NRAs, but for the E.U., the Code includes a system of single maximum, E.U.-wide voice termination rates for fixed and mobile. During 2024, all fixed service providers will be subject to a maximum fixed voice termination rate of €0.07 per minute and all mobile service providers will be subject to a maximum mobile voice termination rate of €0.20 per minute. In the U.K., an SMP provider must provide termination on fair and reasonable terms, conditions and charges, which must be no higher than BT’s regulated charges unless certain conditions are met. Switzerland does not follow the E.U. standard. Call termination rates in Switzerland are unregulated and commercially negotiated by operators. If an agreement cannot be found for fixed termination rates, the parties may initiate proceedings at the Communication Commission, which then sets cost-oriented termination rates. Overall, termination rates in Switzerland are higher than the E.U. average. In each country in which we operate, we have been found to have SMP for call termination.
Broadcasting and Content Law
The Audiovisual Media Services Directive (AVMSD) governs the activities of broadcasters under E.U. law. The E.U. Member States that we operate in have fully transposed the AVMSD into their respective national laws.
Generally, broadcasts originating in and intended for reception within an E.U. Member State must respect the laws of that Member State. Pursuant to the AVMSD, however, E.U. Member States must allow broadcast signals of broadcasters established in another E.U. Member State to be freely transmitted within their territory, so long as the broadcaster complies with the law of their home state. In addition, when we offer third-party VoD services on our network, it is the third-party provider, and not us as the distributor, that is regulated in respect of these services. The U.K. and Switzerland have regulatory systems that also reflect these principles.
The AVMSD established quotas, applicable to both linear and non-linear services, for the transmission of European-produced programming and programs made by European producers who are independent of broadcasters. Such obligations are applicable to our businesses in the E.U. The U.K. and Switzerland have similar principles in their regulatory systems.
E.U. Member States are also allowed to require service providers to contribute financially to the production of European works, including requiring financial contributions from providers of VoD services established in other territories that target audiences in their jurisdiction. Such obligations are applicable to (or are expected to become applicable to) certain of our businesses.
The European Commission published a proposal for the Media Freedom Act in September of 2022. At present, it seems likely that the proposed law will be adopted in 2024, with most provisions coming into effect 15 months after adoption. The new law aims to help ensure media pluralism across the E.U., as well as ownership transparency requirements, especially with
I-24
respect to foreign financing and the introduction of a review mechanism for concentrations of media companies. We expect that the Media Freedom Act will impact our business, however, until the final legislation is adopted, we will not know to what extent.
The European Commission regulations mandate that commercial providers of online content services (including OTT service providers) enable subscribers who are temporarily present in any Member State to access and use online content services in substantially the same manner as in their country of residence. We comply with these content portability requirements.
In the U.K., the VMO2 JV is required to hold individual licenses under the Broadcasting Acts 1990 and 1996 for any television channels (including barker channels) that it owns or operates and to provide certain other services on its cable television platform, such as electronic program guides. These television licensable content service (TLCS) licenses are granted and administered by Ofcom, the U.K.’s NRA. Under these licenses, each covered service must comply with a number of Ofcom codes, including the Broadcasting Code, and with all of Ofcom’s directions. Breach of any of the terms of a TLCS license may result in the imposition of fines and, potentially, license revocation.
As a provider of an on-demand program service (ODPS), the VMO2 JV must comply with numerous statutory obligations related to “editorial content” and notify Ofcom of its intention to provide an ODPS. Failure to notify Ofcom or comply with the relevant statutory obligations may result in the imposition of fines or, ultimately, a prohibition on providing an ODPS.
Technological Regulation
The E.U. legislature is increasingly imposing additional mandatory requirements regarding energy consumption of the telecommunications equipment we provide our customers. We have been working to lower power consumption of our set-top boxes. Legislation in this area may be adopted that could adversely affect the cost and/or the functionality of equipment we deploy to customers.
Pursuant to an E.U. regulation on standby power (the Standby Regulation), many devices are required to have either a low power standby mode or off mode, unless such mode is inappropriate for the intended use of the product. In particular, the Standby Regulation sets, among other things, the maximum power consumption of networked consumer equipment while in the so-called “Networked Standby” or “High Network Availability” modes. All of the devices we purchase and/or develop comply with the requirements of the Standby Regulation.
Also, the E.U.’s Radio Equipment Directive regulates radio equipment held for sale. It sets essential requirements for safety and health, electromagnetic compatibility and the efficient use of the radio spectrum. In 2025, the list of essential requirements under the Radio Equipment Directive is expected to be expanded for certain categories of internet-connected radio equipment, including WiFi-enabled modems and set-top boxes. The devices concerned are expected under this directive to protect the network from harm, protect the personal data and privacy of the user and of the subscriber and offer users and subscribers protection services from fraud.
Due to a Mutual Recognition Agreement established between the E.U. and Switzerland, the Standby Regulation and the Radio Equipment Directive both apply in Switzerland. Prior to Brexit, the U.K. implemented the Standby Regulation and the Radio Equipment Directive into national law.
Through the E.U.’s Radio Spectrum Policy Program, certain spectrum has been approved for mobile broadband use. The terms under which this spectrum becomes available varies among the European countries in which we operate, and certain uses of this spectrum may interfere with services carried on our cable networks.
Privacy Regulation
In January 2017, the European Commission published a proposal for a revised e-Privacy regulation. Negotiations among E.U. Member States are still in process, and we cannot predict the ultimate outcome of these negotiations.
In May 2018, the General Data Protection Regulation (GDPR) became effective in the E.U. The GDPR sets strict standards regarding the handling, use and retention of personal data. Organizations that fail to comply face stiff penalties.
The GDPR applies to the European Economic Area (EEA), which includes the E.U. and a number of other countries, but does not include the U.K. or Switzerland. When personal data is transferred outside the EEA, special safeguards stemming from the GDPR, such as the adoption of adequacy decisions and the use of standard contractual clauses (SCCs), are enforced to
I-25
ensure that data is transferred in a protected manner. Adequacy decisions indicate which third countries have sufficiently similar data protection laws in place to those provided under the GDPR. Transfers to an “adequate” third country is compared to a transmission of data within the E.U.
On June 28, 2021, the European Commission adopted an adequacy decision for the U.K., as the U.K.’s data protection system is based on the same GDPR rules that were applicable when the U.K. was an E.U. Member State. However, the adequacy decision is subject to a “sunset clause”, which establishes the automatic expiration of the decision after four years from its adoption. The adequacy findings may then be renewed if the U.K. continues to ensure an adequate level of data protection.
On July 10, 2023, the European Commission adopted the adequacy decision on the E.U.-U.S. Data Privacy Framework, replacing the Privacy Shield deal which was struck down by the European Court of Justice in July 2020. U.S. companies can join the E.U.-U.S. Data Privacy Framework by committing to comply with a detailed set of privacy obligations. E.U. citizens also have access to a number of redress mechanisms in case their personal data is handled in violation of this framework, including an independent dispute resolution mechanism and a newly created ‘Data Protection Review Court’. The functioning of this framework is anticipated to be jointly periodically reviewed by the European Commission, European data protection authorities and competent U.S. authorities. The first review will take place within a year of the entry into force of the adequacy decision.
When a data transfer involves a third country that has not been granted an adequacy decision, our operations must use SCCs. The European Commission has issued an implementing decision on new SCCs, under which it makes clear that using SCCs does not automatically make an international data transfer GDPR compliant. Instead, the parties must perform “transfer impact assessments” in order to address any possible risks in the data transfer and take supplementary measures. The impact assessment takes into account matters such as the circumstances of the transfer, the nature of the parties, the personal data involved and the laws and practices of the country of destination.
A continued flow of personal data from the EEA to Switzerland is ensured by the revised Swiss Data Protection Act (DPA), which came into force on September 1, 2023. The DPA ensures compatibility with E.U. law and provides for better protection of personal data, more transparency regarding the processing of data and a strengthening of the individual’s information rights (e.g., if such individual’s data is processed in a foreign country).
Other Regulations
In addition to the industry-specific regimes discussed above, our operating companies must comply with a range of both specific and general legislation concerning cybersecurity and consumer protection, among other matters.
With respect to cybersecurity, in 2016, the E.U. adopted a directive on security of network and information systems (NIS Directive), which provides legal measures to boost the overall level of cybersecurity in the E.U. Our operations in the E.U. do not fall under the NIS Directive, but a transposition of the Directive in Ireland, Slovakia and the Netherlands has effectively introduced the NIS Directive concepts into those jurisdictions. The successor to the NIS Directive, a directive on measures for a high common level of cybersecurity across the E.U. (NIS 2 Directive), was adopted by the E.U. legislature and published on December 14, 2022. E.U. Member States will have until October 18, 2024 to transpose the directive into their national legislation. In parallel, the European Commission will work on a number of delegated acts to lay down detailed rules on risk mitigation and notification measures, which are scheduled for publication by the same date.
The E.U. and U.K. have announced restrictions related to so-called “high risk vendors” (HRVs) in the telecommunications sector. The E.U. published a “toolbox” of suggested measures for regulating 5G networks, acknowledging the need for a risk assessment of 5G equipment suppliers and the need to adopt mitigating measures by E.U. governments. Some Member States are addressing security concerns by identifying individual HRVs in advance, whose equipment should be excluded or limited for all network operations in the country. Switzerland has not yet adopted a policy position on the matter, but is studying the matter with a view to the potential adoption of measures in the future.
The U.K.’s recent Telecoms Security Act imposes a new security framework on telecommunication providers and gives the U.K. government new powers to, among other things, direct telecommunication providers to remove HRVs from their networks. Similar legislation has also been adopted in the Netherlands and Belgium.
The Digital Markets Act and the Digital Services Act were adopted in September and October 2022, respectively, and will become effective in 2024. While the Digital Markets Act will have an immaterial impact on our business, under the Digital
I-26
Services Act we will have additional obligations imposed on us, including with respect to periodic reporting, content moderation and the establishment of points of contact with national authorities and customers.
In February 2022, the European Commission introduced the Data Act, which requires companies to share personal and non-personal data generated by IoT products with users and third parties, upon the user’s request. The Data Act also requires companies to share personal and non-personal data with public sector bodies in situations of exceptional need, and imposes switching and interoperability requirements on cloud services. Negotiations between the European Council and the European Parliament concluded on June 28, 2023. The Data Act is now subject to formal approval, with provisions coming into effect 20 months after adoption.
The Corporate Sustainability Reporting Directive (CSRD) came into force on January 5, 2023. The CSRD extends and strengthens the existing rules on non-financial reporting and aims to eventually have the same standards for both sustainability reporting and financial reporting. Companies will have to report on how sustainability issues affect their business, as well as the impact of their activities on people and the environment. The CSRD also aims to simplify the reporting process for companies, providing a single framework for providing information to investors and stakeholders. The first of the reporting requirements relevant to Liberty Global will apply in 2026 (for fiscal year 2025 reporting), with additional reporting requirements coming into effect on a staggered basis until 2029.
Our operating companies are also subject to both national and European level regulations on competition and consumer protection, which are largely regulated under the Code. For example, while our operating companies may offer their services in bundled packages in European markets, they are sometimes not permitted to make a subscription to one service, such as cable television, conditional upon a subscription to another service, such as telephony. They may also face restrictions on the degree to which they may discount certain products included in the bundled packages.
We often undergo close regulatory scrutiny from competition authorities, in particular with respect to proposed business combinations that often require clearance from the European Commission or national competition authorities, which can block, impose conditions on or delay an acquisition, disposition or combination, thus possibly hampering our opportunities for growth. Additional scrutiny is also imposed under the national foreign direct investment screening regimes recently adopted by the U.K. and by some E.U. Member States. Such regimes allow national governments to review and impose conditions on certain transactions involving critical infrastructures such as telecommunications. In the event conditions are imposed and we fail to meet them in a timely manner, the relevant authority or governments may impose fines and, if in connection with a transaction, may require restorative measures, such as a disposition of assets or divestiture of operations.
One such example of potential close regulatory scrutiny is the E.U. Foreign Subsidies Regulation (FSR). Adopted in December 2022 and applicable from July 12, 2023, the FSR aims to prevent foreign subsidies from distorting the E.U. internal market. We may be obligated to file notifications for ex ante review when participating in M&A transactions or in public tenders. This could bring further regulatory complexity to our transactions, and failure to comply with these obligations could lead to sanctions.
Belgium
Telenet has been found to have SMP in the wholesale broadband market, obliging it to (i) provide third-party operators with access to the digital television platform (including basic digital video and analog video) and (ii) make available to third-party operators a bitstream offer of broadband internet access including fixed voice as an option. The Belgian NRA has imposed monthly wholesale cable resale access prices. These rates are expected to evolve over time due to, among other reasons, broadband capacity usage.
The obligations on Telenet may strengthen its competitors by granting them access to Telenet’s fixed network to offer competing products and services notwithstanding Telenet’s substantial investments in developing its high-performing fixed infrastructure. In addition, any access granted to competitors could (i) limit the bandwidth available to Telenet to provide new or expanded products and services to its customers and (ii) adversely impact Telenet’s ability to maintain or increase its revenue and cash flows. The extent of any such adverse impacts ultimately will be dependent on the degree to which competitors take advantage of the access to Telenet’s network, the rates that Telenet receives for such access and other competitive factors or market developments.
I-27
Significant Joint Venture Entities
United Kingdom
End of Contract Notifications and Annual Best Tariff Notifications. Specific obligations regarding end of contract and annual best tariff notifications are imposed by Ofcom on providers. These require the VMO2 JV to (i) alert customers who are approaching the end of a minimum contract term to the fact that their contract period is coming to an end and to set out the best new price that the VMO2 JV can offer them and (ii) once a year, alert customers who are out of contract to that fact and again confirm the best new price the VMO2 JV can offer them. In both cases, the VMO2 JV must also set out the price available to new customers for an equivalent service offering. These requirements have adversely impacted our and the VMO2 JV’s revenue since their implementation.
Broadband Expansion. The U.K.’s Telecommunications Infrastructure (Leasehold Property) Act imposes building regulations that require new housing developments to have gigabit capable access. This new legislation comes as a result of the U.K. government’s push to encourage greater investment in new digital infrastructure and deliver gigabit capable networks to approximately 85% of U.K. premises by 2025 and nationwide by 2030.
Netherlands
On July 10, 2023, the Netherlands’ NRA, the Autoriteit Consument & Markt (ACM), published a draft decision of its analysis of the wholesale fixed access market, concluding that there are five regional markets that are, or tend to be, competitive. On December 12, 2023, the ACM published its final decision to refrain from further regulation of the wholesale local access fixed broadband internet market following review by the European Commission. The ACM found that there is sufficient competition in the telecom market and confirmed its previous position that further regulation of the market is not currently necessary. This decision to deregulate is mainly based on two factors: (i) the approval of KPN’s commercial offer in a formal commitment decision by the ACM, which makes KPN’s fiber network open to various providers of telecom service and allows them to compete effectively at the retail level and (ii) the announcements of fiber roll-out plans by network operators which will likely cover all geographic areas of the Netherlands within the next five years.
The ACM also adopted a final decision rejecting YouCa’s request for symmetric access to non-replicable network assets of VodafoneZiggo's cable network in Amsterdam, as it was deemed not proportionate.
Available Information
All our filings with the U.S. Securities and Exchange Commission (the SEC), including our Annual Reports on Form 10-K, Quarterly Reports on Form 10-Q and Current Reports on Form 8-K, as well as amendments to such filings, are available on our internet website free of charge generally within 24 hours after we file such material with the SEC. Our website address is www.libertyglobal.com. The information on our website is not part of this Annual Report and is not incorporated by reference herein. The SEC also maintains a website address at www.sec.gov that contains reports, proxy and information statements and other information regarding issuers that file electronically with the SEC.
I-28
Item 1A. RISK FACTORS
In addition to the other information contained in this Annual Report, you should consider the following risk factors in evaluating our results of operations, financial condition, business and operations or an investment in the shares of our company.
The risk factors described in this section have been separated into four groups:
•risks that relate to the competition we or our affiliates face and the technology used in our businesses;
•risks that relate to operating in overseas markets and being subject to foreign regulation;
•risks that relate to certain financial matters; and
•other risks, including risks that, among other things, relate to the obstacles that may be faced by anyone who may seek to acquire us.
Although we describe below and elsewhere in this Annual Report the risks we consider to be the most material, there may be other unknown or unpredictable economic, business, competitive, regulatory or other factors that also could have material adverse effects on our results of operations, financial condition, business or operations in the future. In addition, past financial performance may not be a reliable indicator of future performance and historical trends should not be used to anticipate results or trends in future periods.
If any of the events described below, individually or in combination, were to occur, our businesses, prospects, financial condition, results of operations and/or cash flows could be materially adversely affected.
Factors Relating to Competition and Technology
We operate in increasingly competitive markets, and there is a risk that we will not be able to effectively compete with other service providers. The markets for broadband internet, video, telephony and mobile services are highly competitive. In the provision of video services, we face competition from FTA and digital terrestrial television (DTT) broadcasters, video provided via satellite platforms, networks using DSL, VDSL or vectoring technology, multi-channel multi-point distribution system operators, FTTx networks, OTT video service providers and, in some countries where parts of our systems are overbuilt, cable networks, among others. Our operating businesses are facing increasing competition from video services provided by, or over the networks of, incumbent telecommunications operators and other service providers. As the availability and speed of broadband internet increases, we also face competition from OTT video content providers utilizing our or our competitors’ high-speed internet connections. In the provision of telephony and broadband internet services, we are experiencing increasing competition from the incumbent telecommunications operators and other service providers in each country in which we operate, including for both retail and wholesale products and services, as well as providers of mobile voice and data. The incumbent telecommunications operators typically dominate the market for these services and have the advantage of nationwide networks and greater resources than we have to devote to the provision of these services. Many of the incumbent operators offer double-play, triple-play and quad-play bundles of services. In many countries, we also compete with other operators using local loop unbundling to provide these services, other facilities-based operators and wireless providers. Developments in DSL as well as investments into FTTx technology by the incumbent telecommunications operators and alternative providers have improved the attractiveness of our competitors’ products and services and strengthened their competitive position. Developments in wireless technologies, such as 5G and FWA, are creating additional competitive challenges.
In some of our markets, national and local government agencies may seek to become involved, either directly or indirectly, in the establishment of FTTx networks, DTT systems or other communications systems. While we intend to pursue available options to restrict such involvement or to ensure that such involvement is on commercially reasonable terms, there can be no assurance that we will be successful in these pursuits. As a result, we may face competition from entities not requiring a normal commercial return on their investments. In addition, we may face more vigorous competition than would have been the case if there was no government involvement.
We expect the level and intensity of competition to continue to increase from both existing competitors and the influx of new market entrants as a result of changes in the regulatory framework of the industries in which we operate, as well as strategic alliances and cooperative relationships among industry participants. Increased competition could result in increased customer churn, reductions of customer acquisition rates for some products and services and significant price and promotional competition in our markets. In combination with difficult economic environments, these competitive pressures could adversely impact our ability to increase or, in certain cases, maintain the revenue, average revenue per RGU or mobile subscriber, as applicable (ARPU), RGUs, mobile subscribers, Adjusted EBITDA (as defined in note 19 to our consolidated financial
I-29
statements included in Part II of this Annual Report on Form 10-K), Adjusted EBITDA margins, liquidity and other financial and operational metrics of our operating segments.
Changes in technology may limit the competitiveness of and demand for our services. Technology in the video, telecommunications and data services industries is changing rapidly, including advances in current technologies and the emergence of new technologies. New technologies, products and services may impact consumer behavior and therefore demand for our products and services. The ability to anticipate changes in technology and consumer tastes and to develop and introduce new and enhanced products and services on a timely basis will affect our ability to continue to grow, increase our revenue and number of subscribers and remain competitive. New products and services, once marketed, may not meet consumer expectations or demand, can be subject to delays in development or may fail to operate as intended. A lack of market acceptance of new products and services that we may offer, or the development of significant competitive products or services by others, could have a material adverse impact on our financial and operational results.
Our significant property and equipment additions may not generate a positive return. Significant additions to our property and equipment are, or in the future may be, required to add customers to our networks and to upgrade or expand our broadband communications networks and upgrade CPE to enhance our service offerings and improve the customer experience. Additions to our property and equipment require significant capital expenditures for equipment and associated labor costs to build out and/or upgrade our networks, as well as for related CPE. Additionally, significant competition, the introduction of new technologies, the expansion of existing technologies, such as FTTx and advanced DSL technologies, the impact of natural disasters or adverse regulatory developments could cause us to decide to undertake previously unplanned builds or upgrades of our networks and CPE.
No assurance can be given that any newbuilds, rebuilds, acquisitions, upgrades or extensions of our network will increase penetration rates, increase ARPU or otherwise generate positive returns as anticipated, or that we will have adequate capital available to finance such newbuilds, rebuilds, upgrades, acquisitions or extensions. Additionally, costs related to our property and equipment additions could end up being greater than originally anticipated or planned. If this is the case, we may require additional financing sooner than anticipated, we may have to divert funding from other planned projects or we may have to delay or abandon some or all of our development and expansion plans or otherwise forego market opportunities. Additional financing may not be available on favorable terms, if at all, and our ability to incur additional debt on favorable terms or at all will be limited by our debt agreements. If we are unable to, or elect not to, pay for costs associated with adding new customers, expanding, extending or upgrading our networks or making our other planned or unplanned additions to our property and equipment, or are delayed in making such investments, our growth could be limited and our competitive position could be harmed.
We depend almost exclusively on our relationships with third-party programming providers and broadcasters for programming content, and a failure to acquire a wide selection of popular programming on acceptable terms could adversely affect our business. The success of our video subscription business depends, in large part, on our ability to provide a wide selection of popular programming to our subscribers. In general, we do not produce our own content, and we depend on our agreements, relationships and cooperation with public and private broadcasters, global and regional app providers, rights holders and collective rights associations to obtain such content. If we fail to obtain a diverse array of popular programming for our pay video services, including a sufficient selection of non-linear content (such as a selection of attractive VoD content) and rights for ancillary services such as DVR and catch-up or 'Replay' services, on satisfactory terms, we may not be able to offer a compelling video product to our customers at a price they are willing to pay. Additionally, we are frequently negotiating and renegotiating programming agreements and our annual costs for programming can vary. There can be no assurance that we will be able to renegotiate or renew the terms of our programming agreements on acceptable terms, or at all. There has also been a rise in the number of direct-to-consumer offerings from content owners which impacts negotiations and the content, rights available and restrictions imposed on us. Programming and copyright costs represent a significant portion of our operating costs and are subject to price rises in future periods due to various factors, including (i) higher costs associated with the expansion of our digital video content, including rights associated with ancillary product offerings and rights that provide for the broadcast of live sporting events, and (ii) rate increases, including as a result of inflationary pressures.
If we are unable to obtain or retain attractively priced, competitive content, demand for our existing and future video services could decrease, thereby limiting our ability to attract new customers, maintain existing customers and/or migrate customers from lower-tier programming to higher-tier programming, thereby inhibiting our ability to execute our business plans. Furthermore, we may be placed at a competitive disadvantage if certain of our competitors obtain exclusive programming rights, particularly with respect to popular sports and movie programming.
I-30
We depend on third-party suppliers and licensors to supply necessary equipment, software and certain services required for our businesses. We rely on third-party vendors for the equipment, software and services that we require in order to provide services to our customers. Our suppliers often conduct business worldwide and their ability to meet our needs is subject to various risks, including political and economic instability, natural calamities, interruptions in transportation or supply chain systems, terrorism and labor issues. As a result, we may not be able to obtain the equipment, software and services required for our businesses on a timely basis or on satisfactory terms. Any shortfall in CPE could lead to delays in completing extensions or upgrades to our networks and in connecting customers to our services and, accordingly, could adversely impact our ability to maintain or increase our RGUs, revenue and cash flows. Also, if demand exceeds the suppliers’ and licensors’ capacity or if they experience financial difficulties, the ability of our businesses to provide some services may be materially adversely affected, which in turn could affect our businesses’ ability to attract and retain customers. Previously, we have experienced certain business disruptions due to the recent worldwide silicon shortage, which has increased, and may continue to increase, the delivery lead times and pricing of certain of our key components. We cannot predict what future disruptions to our business in relation to any further silicon and related component issues. Although we actively monitor the creditworthiness of our key third-party suppliers and licensors, the financial failure of a key third-party supplier or licensor could disrupt our operations and have an adverse impact on our revenue and cash flows. We rely upon intellectual property that is owned or licensed by us to use various technologies, conduct our operations and sell our products and services. Legal challenges could be made against our use of our or our licensed intellectual property rights (such as trademarks, patents and trade secrets) and we may be required to enter into licensing arrangements on unfavorable terms, incur monetary damages or be enjoined from use of the intellectual property rights in question.
Spectrum cost and availability and regulation may adversely affect our business, financial condition and operating results. As we continue to enhance the quality of our services in certain geographic areas and deploy new technologies, including 5G, we may need to acquire additional spectrum in the future. As a result, we will continue to actively seek to make additional investment in spectrum, which could be significant.
The continued interest in, and acquisition of, spectrum by existing carriers and others may reduce our ability to acquire, and increase the acquisition cost of, spectrum in the secondary market or negatively impact our ability to gain access to spectrum through other means, including government auctions. Our return on investment in spectrum depends on our ability to attract additional customers and to provide additional services and usage to existing customers. Additionally, applicable regulatory bodies may not be able to provide sufficient additional spectrum to auction. We may also be unable to secure the spectrum necessary to maintain or enhance our competitive position in auctions or in the secondary market on favorable terms or at all.
Certain regulatory bodies may impose conditions on the acquisition or use of new wireless broadband mobile spectrum that may negatively impact our ability to obtain spectrum economically or in appropriate configurations or coverage areas.
If we cannot acquire needed spectrum, if competitors acquire spectrum that allows them to provide competitive services or if we cannot deploy services over acquired spectrum on a timely basis without burdensome conditions, at reasonable costs, or while maintaining network quality levels, our ability to attract and retain customers and our business, financial condition and operating results could be materially adversely affected.
Certain of our businesses that offer mobile telephony and data services rely on the radio access networks of third-party wireless network providers to carry our mobile communications traffic. Our services to mobile customers in Ireland rely on the use of an MVNO arrangement, currently with Three (Hutchison), whereby we utilize the radio access networks of a third-party wireless network provider to carry our mobile communications traffic. If our MVNO arrangement is terminated, or if Three (Hutchison) fails to provide the services required under our MVNO arrangement, or if it fails to deploy and maintain its network and we are unable to find a replacement network operator on a timely and commercially reasonable basis, or at all, we could be prevented from continuing the mobile services relying on such MVNO arrangement. Additionally, as our MVNO arrangement comes to term, we may not be able to renegotiate renewal or replacement MVNO arrangements on the same or more favorable terms.
Failure in our or third-party technology or telecommunications systems, leakage of sensitive customer data or security breaches could significantly disrupt our operations, reduce our customer base and result in fines, litigation or lost revenue. Our success depends, in part, on the continued and uninterrupted performance of our information technology and network systems, including internet sites, data hosting and processing facilities and other hardware, software and technical applications and platforms, as well as our customer service centers. Some of these are managed, hosted, provided or used by third-party service providers or their vendors, to assist in conducting our business. In addition, the hardware supporting a large number of critical systems for our cable network in a particular country or geographic region is housed in a relatively small number of locations. Our and our third-party service providers’ systems and equipment (including our routers and set-top boxes) are vulnerable to damage or security breach from a variety of sources, including telecommunications failures, power loss (such as
I-31
blackouts or brownouts), malicious human acts, security flaws and natural disaster or extreme weather events (including heatwaves, large storms and floods, whether or not arising from short-term or long-term changes in weather patterns). Moreover, despite our security measures, unauthorized parties may gain access to or disrupt our or our third-party service providers’ servers, systems and equipment by, among other things, hacking into our servers, systems and equipment or those of our third-party service providers through fraud, computer viruses, worms, phishing, physical or electronic break-ins or burglaries or errors by our or our third-party service providers’ employees. We and our third-party service providers may not be able to anticipate or respond in an adequate and timely manner to attempts to obtain unauthorized access to, disable or degrade our or our third-party service providers’ systems because the techniques for doing so change frequently, are increasingly complex and sophisticated and are difficult to detect for periods of time. In addition, as discussed further below, the security measures and procedures we and our third-party service providers have in place to protect personal data and other information may not be sufficient to counter all data security breaches, cyber-attacks or system failures. In some cases, mitigation efforts may depend on third parties who may not deliver products or services that meet the required contractual standards or whose hardware, software or network services may be subject to error, defect, delay or outage.
Through our operations, sales and marketing activities, we collect and store certain personal information related to our customers. This may include phone numbers, drivers license numbers, contact preferences, personal information stored on electronic devices and payment information, including credit and debit card data. We also gather and retain information about employees in the normal course of business. In certain circumstances, where it is lawful to do so, we may share information about such persons with third-party service providers that assist with certain aspects of our business. Unauthorized parties may attempt to gain access to such data and information directly from us or through those third parties using the same methods described in the prior paragraph. As a result, data and information we gather could be subject to misappropriation, misuse, leakage, falsification or accidental release or loss of information maintained in our information technology systems and networks or those of our third-party service providers, including customer and personnel data. As a result of the increasing awareness concerning the importance of safeguarding personal information, the potential misuse of such information and legislation that has been adopted or is being considered in the U.S. and across some or all of our markets regarding the protection, privacy and security of personal information, information-related risks are increasing, particularly for businesses like ours that handle a large amount of personal data. Failure to comply with these data protection laws may result in, among other consequences, fines, litigation or regulatory actions by applicable authoritative bodies.
Despite the precautions we have taken, unanticipated problems affecting our systems and equipment could cause business disruptions, such as failures in our information technology systems, disruption in the transmission of signals over our networks, unauthorized access to the data and information we gather or similar problems. Further, although we devote significant resources to our cybersecurity programs and have implemented security measures to protect our systems and data, and to prevent, detect and respond to data security incidents, there can be no assurance that our efforts will prevent these threats. Any disruptive situation that causes loss, misappropriation, misuse or leakage of data could damage our reputation and the credibility of our operating companies and could subject us to potential liability, including litigation or other legal actions against us, the imposition of penalties, fines, fees or liabilities, which may not be covered by our insurance policies, and lost customers or revenue. Our cyber liability insurance (including third-party liability and first-party liability) may not be sufficient to protect against all of our businesses’ losses from any future disruptions or breaches of their systems or other events as described above. Also, a cybersecurity breach and the changing cybersecurity landscape could require us to devote significant management resources to address the problems associated with the breach and to expend significant additional resources to upgrade further the security measures we employ to protect customer, employee and other personal information against cyber-attacks and other wrongful attempts to access such information, which could result in a disruption of our operations. This includes additional infrastructure capacity spending to mitigate any system degradation and the reallocation of resources from development activities. To date, other than the non-permitted access of certain legacy Virgin Media databases in February of 2020, we have not been subject to cyberattacks or network disruptions that, individually or in the aggregate, have been material to our operations or financial condition. Although we have not detected another material security breach or cybersecurity incident to date, we have been the target of events of this nature and expect to be subject to similar attacks in the future.
Factors Relating to Operations and Regulation
Our businesses are conducted almost exclusively outside of the U.S., which gives rise to numerous operational risks. Our businesses operate almost exclusively in countries outside of the U.S. and are subject to the following inherent risks:
•fluctuations in foreign currency exchange rates;
•difficulties in staffing and managing international operations;
•potentially adverse tax consequences;
I-32
•export and import restrictions, custom duties, tariffs and other trade barriers;
•increases in taxes and governmental fees;
•economic and political instability; and
•changes in foreign and domestic laws and policies that govern operations of foreign-based companies.
Operational risks that we may experience in certain countries include disruptions of services or loss of property or equipment that are critical to overseas businesses due to expropriation, nationalization, war, insurrection, terrorism or general social or political unrest.
Legislation enacted in Bermuda as to economic substance may affect our operations. Pursuant to the Economic Substance Act 2018 of Bermuda, as amended (the ES Act), a registered entity, other than an entity which is resident for tax purposes in certain jurisdictions outside Bermuda that carries on as a business any one or more of the “relevant activities” referred to in the ES Act, must comply with economic substance requirements. The ES Act may require in-scope Bermuda entities which are engaged in such “relevant activities” to be directed and managed in Bermuda have an adequate level of qualified employees in Bermuda, incur an adequate level of annual expenditure in Bermuda, maintain physical offices and premises in Bermuda or perform core income-generating activities in Bermuda. The list of “relevant activities” includes carrying on any one or more of banking, insurance, fund management, financing, leasing, headquarters, shipping, distribution and service center, intellectual property and holding entities.
To the extent we are conducting a relevant activity, we believe it will be the relevant activity of a “holding entity” within the meaning of the ES Act and we should only be subject to minimum economic substance requirements under the ES Act and related regulations. However, if we are deemed to be carrying on another “relevant activity,” other than that of a holding entity, we may be required to increase our substance in Bermuda in response to requirements imposed by the ES Act and related regulations. This could result in additional costs that could adversely affect our financial condition or results of operations.
We are exposed to foreign currency exchange rate risk. We are exposed to foreign currency exchange rate risk with respect to our consolidated debt in situations where our debt is denominated in a currency other than the functional currency of the operations or assets whose cash flows support our ability to repay or refinance such debt. Although we generally match the denomination of our and our subsidiaries’ borrowings with the functional currency of the operations or assets that are supporting the respective borrowings, market conditions or other factors may cause us to enter into borrowing arrangements that are not denominated in the functional currency of the underlying operations (unmatched debt). In these cases, our policy is to provide for an economic hedge against foreign currency exchange rate movements by using derivative instruments to synthetically convert unmatched debt into the applicable underlying currency. At December 31, 2023, substantially all of our debt was either directly or synthetically matched to the applicable functional currencies of the underlying operations.
We are also exposed to foreign currency exchange rate risk with respect to our cash and cash equivalents and investments held under separately-managed accounts (SMAs). A substantial portion of our cash and cash equivalents is held in U.S. dollars, but we hold balances in other currencies reflecting the operational and strategic needs of the company. The investments held under SMAs are generally in U.S. dollars, and any instruments denominated in a foreign currency are generally hedged back to the U.S. dollar.
In addition, we are exposed to foreign currency risk to the extent that we enter into transactions denominated in currencies other than our or our subsidiaries’ respective functional currencies (non-functional currency risk), such as equipment purchases, programming contracts, notes payable and notes receivable (including intercompany amounts). Changes in exchange rates with respect to amounts recorded on our consolidated balance sheets related to these items will result in unrealized (based upon period-end exchange rates) or realized foreign currency transaction gains or losses upon settlement of the transactions. Moreover, to the extent that our revenue, costs and expenses are denominated in currencies other than our respective functional currencies, we will experience fluctuations in our revenue, costs and expenses solely as a result of changes in foreign currency exchange rates. Generally, we will consider hedging non-functional currency risks when the risks arise from agreements with third parties that involve the future payment or receipt of cash or other monetary items to the extent that we can reasonably predict the timing and amount of such payments or receipts and the payments or receipts are not otherwise hedged. In this regard, we have entered into foreign currency forward contracts to hedge certain of these risks. For additional information concerning our foreign currency forward contracts, see note 8 to our consolidated financial statements included in Part II of this Annual Report on Form 10-K.
We are also exposed to unfavorable and potentially volatile fluctuations of the U.S. dollar (our reporting currency) against the currencies of our operating subsidiaries when their respective financial statements are translated into U.S. dollars for
I-33
inclusion in our consolidated financial statements. Cumulative translation adjustments are recorded in accumulated other comprehensive earnings or loss as a separate component of equity. Any increase (decrease) in the value of the U.S. dollar against any foreign currency that is the functional currency of one of our operating subsidiaries will cause us to experience unrealized foreign currency translation losses (gains) with respect to amounts already invested in such foreign currencies. Accordingly, we may experience a negative impact on our comprehensive earnings or loss and equity with respect to our holdings solely as a result of foreign currency translation. Our primary exposure to foreign currency translation risk during the three months ended December 31, 2023 was to the euro and Swiss franc, as 55.1% and 46.7% of our reported revenue during the period was derived from subsidiaries whose functional currencies are the euro and Swiss franc, respectively. In addition, our reported operating results are impacted by changes in the exchange rates for other local currencies in Europe. We do not hedge against the risk that we may incur non-cash losses upon the translation of the financial statements of our subsidiaries and affiliates into U.S. dollars.
Our businesses are subject to risks of adverse regulation. Our businesses are subject to the unique regulatory regimes of the countries in which they operate. Broadband internet, video distribution, telephony and mobile services are subject to licensing or registration eligibility rules and regulations, which vary by country. Countries in which we operate may adopt laws and regulations regarding electronic commerce, which could dampen the growth of the internet services being offered and developed by our businesses. In a number of countries, our ability to increase prices for or change our services, including the programming packages we offer, is limited by regulation or conditions imposed by competition authorities, is subject to review by regulatory authorities or is subject to termination rights of customers. More significantly, regulatory authorities may require us, particularly if we are deemed to possess SMP or there are significant economic or physical replicability barriers, to grant third parties access to our networks, facilities or services to distribute their own services or resell our services to end customers. Consequently, our businesses must adapt their ownership and organizational structures as well as their pricing and service offerings to satisfy the rules and regulations to which they are subject. A failure to comply with applicable rules and regulations could result in penalties, restrictions on our business, loss of required licenses or other adverse conditions.
Adverse changes in rules and regulations could:
•impair our ability to use our networks in ways that would generate maximum revenue and Adjusted EBITDA;
•create a shortage of capacity on our networks, which could limit the types and variety of services we seek to provide our customers;
•impact our ability to access spectrum for our mobile services;
•strengthen our competitors by granting them access and lowering their costs to enter into our markets; and
•significantly and adversely impact our results of operations.
Businesses, including ours, that offer multiple services, such as video distribution as well as internet, telephony, and/or mobile services, or that are vertically integrated and offer both video distribution and programming content, often face close regulatory scrutiny from competition authorities. This is particularly the case with respect to any proposed business combinations, which often require clearance from the European Commission or national competition authorities, which can block, impose conditions on or delay an acquisition, thus possibly hampering our opportunities for growth. Additional scrutiny is also imposed under the national foreign direct investment screening regimes recently adopted by the U.K. and some E.U. Member States, which allow national governments to review and impose conditions on certain transactions involving critical infrastructures such as telecommunications. In the event conditions are imposed and we fail to meet them in a timely manner, the relevant authority or governments may impose fines and, if in connection with a transaction, may require restorative measures, such as a disposition of assets or divestiture of operations.
For information on certain other regulatory developments that could adversely impact our results of operations in future periods, see Legal and Regulatory Proceedings and Other Contingencies in note 18 to our consolidated financial statements included in Part II of this Annual Report on Form 10-K.
New and existing legislation, and interpretations thereof, may significantly alter the regulatory regimes applicable to us, which could adversely affect our competitive position and profitability, and we may become subject to more extensive regulation, particularly if we are deemed to possess significant market power in any of the markets in which we operate. Significant changes to the existing regulatory regimes applicable to the provision of internet, video, telephony and mobile services have been and are still being introduced. For example, in the E.U., the Code is the primary source of communications regulation affecting our E.U. businesses, including access, user and privacy rights, video must-carry services and our competitive activities. The U.K. and Switzerland have systems that largely reflect the principles of the E.U. In addition, we are
I-34
subject to regular review by national regulatory authorities in the E.U. and the U.K. concerning whether we exhibit SMP. A finding of SMP can result in our company becoming subject to open access, pricing and other requirements that could potentially advantage our competitors. This has resulted, for example, in obligations with respect to call termination for our telephony business in Europe and video and broadband internet access obligations in Belgium.
If any laws, regulations or rules are enacted or reinterpreted so as to expand the regulation of our products and services or our disclosure obligations, they could affect our operations or require significant expenditures. For example, a certain number of our business operations will become subject to corporate responsibility reporting obligations pursuant to the CSRD in the coming years. We cannot predict future developments in these areas, and any changes to the regulatory framework for our products and services or our disclosure obligations could have a negative impact on our business and results of operations. A certain number of our operations will become subject to reporting obligations under the CSRD as of January 1, 2024.
The U.K.’s departure from the E.U. could have a material adverse effect on our business, financial condition, results of operations or liquidity. The U.K. formally exited the E.U. on January 31, 2020, and on December 24, 2020, entered into the E.U.-U.K. Agreement. For more information regarding the E.U.-U.K. Agreement, see the Item 1. Business - Regulatory Matters - Overview discussion above. Examples of the potential impact Brexit has had, and may continue to have, on our business, financial condition or results of operations include:
•changes in foreign currency exchange rates and disruptions in the capital markets. For example, a sustained period of weakness in the British pound sterling or the euro could have an adverse impact on our liquidity, including our ability to fund repurchases of our equity securities and other U.S. dollar-denominated liquidity requirements;
•shortages of labor necessary to conduct our business;
•disruption to our U.K. supply chain and related increased cost of supplies;
•a weakened U.K. economy resulting in decreased consumer demand for our products and services in the U.K.;
•legal uncertainty, increased compliance costs and potentially divergent national laws and regulations as the U.K. determines which E.U. laws and directives to replace or replicate, or where previously implemented by enactment of U.K. laws or regulations, to retain, amend or repeal; and
•various geopolitical forces may impact the global economy and our business, including, for example, other E.U. Member States (in particular those Member States where we have operations) proposing referendums to, or electing to, exit the E.U.
We cannot be certain that we will be successful with respect to acquisitions, dispositions, joint ventures, partnerships or other similar transactions, or that we will achieve the anticipated benefits thereof. Historically, our businesses have grown, in part, through selective acquisitions that enabled them to take advantage of existing networks, local service offerings and region-specific management expertise, and we have also taken advantage of attractive opportunities to sell select businesses and partner with others. We expect to seek to continue improving our company through attractive acquisitions, dispositions, joint ventures, partnerships or other similar transactions in select markets, such as, the sale of UPC Poland in April 2022, the Telenet Tower Sale in June 2022 and the Telenet Takeover Bid in October 2023, as well as the formations of the VMO2 JV in June 2021, the AtlasEdge JV in September 2021 and the nexfibre JV in December 2022 and the creation of Wyre by Telenet and Fluvius in July 2023. Our ability to complete any transaction may be limited by many factors, including government regulation, availability of financing, our or our counterparty’s debt covenants, the prevalence of complex ownership structures among potential targets, acquirers, joint ventures or partners, disapproval by shareholders of potential targets or acquirers, and competition from other potential acquirers, including private equity funds. Even if we are successful in completing such transactions, integration and separation activities may present significant costs and challenges. We cannot be assured that we will be successful with respect to acquisitions, dispositions, joint ventures, partnerships or other similar transactions or realizing the anticipated benefits thereof.
In addition, we anticipate that most companies acquired by us will be located outside the U.S. Foreign companies may not have disclosure controls and procedures or internal controls over financial reporting that are as thorough or effective as those required by U.S. securities laws and applicable accounting rules. While we intend to conduct appropriate due diligence and to implement appropriate controls and procedures as we integrate acquired companies, we may not be able to certify as to the effectiveness of these companies’ disclosure controls and procedures or internal controls over financial reporting until we have fully integrated them.
I-35
The expected synergies and benefits from our acquisitions and joint ventures may not be realized in the amounts anticipated or may not be realized within the expected time frame, and risks associated with the foregoing may also result from the extended delay in the integration of the companies. Our ability to realize the anticipated benefits of our acquisitions and joint ventures will depend, to a large extent, on our ability to integrate our businesses and the acquired or joint venture company’s business in a manner that facilitates growth opportunities and achieves the projected cost savings. In addition, some of the anticipated synergies are not expected to occur for some time following the completion of such acquisitions and joint ventures and will require substantial capital expenditures before realizing some of those synergies.
Public health crises and other geopolitical or macroeconomic events may delay, reduce or eliminate some of our anticipated synergies and other benefits, including a delay in the integration of, or inability to integrate, the business that we acquire or partner with. Even if we are able to integrate successfully, the anticipated benefits of such transactions, including the expected synergies and network benefits, may not be realized fully or at all or may take longer to realize than expected.
We have incurred substantial expenses as a result of completing our various acquisitions and joint ventures. We expect that substantial additional expenses will need to be incurred in order to integrate the businesses, operations, policies, and procedures. While we have assumed that a certain level of transaction-related expenses will be incurred, factors beyond our control could affect the total amount or the timing of these expenses. Many of the expenses that will be incurred, by their nature, are difficult to estimate accurately. These expenses could exceed the costs historically borne by us and offset, in whole or in part, the expected synergies.
Our integration efforts may not be executed successfully, or such integration may be more difficult, time consuming or costly than expected. Operating costs, customer loss and business disruption, including maintaining relationships with employees, customers, suppliers or vendors, may be greater than expected. The combination of independent businesses is complex, costly and time-consuming, and may divert significant management attention and resources. This process may disrupt our business or otherwise impact our ability to compete. The overall combination of our and the businesses of those companies that we acquire or partner with may also result in material unanticipated problems, expenses, liabilities, competitive responses and impacts and loss of customers and other business relationships. The difficulties of combining the operations of the companies include, among others:
•diversion of management attention to integration matters;
•difficulties in integrating operations and systems, including intellectual property and communications systems, administrative and information technology infrastructure, and supplier and vendor arrangements;
•challenges in conforming standards, controls, procedures and accounting and other policies;
•alignment of key performance measurements may result in a greater need to communicate and manage clear expectations while we work to integrate and align policies and practices;
•difficulties in integrating employees;
•the transition of management to the combined company management team, and the need to address possible differences in corporate cultures, management philosophies and compensation structures;
•challenges in retaining existing customers and obtaining new customers;
•compliance with government regulations;
•known or potential unknown liabilities of the acquired businesses that are larger than expected; and
•other potential adverse consequences and unforeseen increased expenses or liabilities associated with the applicable transaction.
Additionally, uncertainties over the integration process could cause customers, suppliers, distributors, dealers, retailers and others to seek to change or cancel our existing business relationships or to refuse to renew existing relationships. Suppliers, distributors and content and application providers may also delay or cease developing new products for us that are necessary for the operations of our business due to uncertainties or lack of available resources. Competitors may also target our existing customers by highlighting potential uncertainties and integration difficulties.
Some of these factors are outside our control, and any one of them could result in lower revenues, higher costs and diversion of management time and energy, which could adversely impact our business, financial condition and operating results. In addition, even if the integration is successful, the full benefits of our acquisitions and partnerships including, among
I-36
others, the synergies, cost savings or sales or growth opportunities may not be realized. As a result, it cannot be assured that we will realize the full benefits expected from such transactions within the anticipated time frames or at all.
Certain operations are conducted by joint ventures that we cannot operate solely for our benefit. Certain of our operations, particularly the VMO2 JV in the U.K. and the VodafoneZiggo JV in the Netherlands, are conducted through joint ventures or partnerships. We share ownership and management of these joint venture with one or more parties who may or may not have the same goals, strategies, priorities or resources as we do. In general, joint ventures are intended to be operated for the benefit of all co-owners, rather than for our exclusive benefit. Operating a business as a joint venture often requires additional organizational formalities as well as time-consuming procedures for sharing information, accounting and making decisions. In certain cases, our joint venture partners must agree in order for the applicable joint venture to take certain actions. Our inability to take unilateral action that we believe is in our best interests may have an adverse effect on the financials or performance of the joint venture and the return on our investment. In joint ventures, we believe our relationship with our co-owners is an important factor to the success of the joint venture, and if a co-owner changes, our relationship may be adversely affected. In addition, the benefits from a successful joint venture are shared among the co-owners, so that we do not receive all the benefits from our successful joint ventures.
Our interests in the VodafoneZiggo JV and the VMO2 JV are held pursuant to Shareholders Agreements that contain provisions relating to governance as well as transfer and exit rights, which, depending on the circumstances, may not be in the best interest of our company. Our noncontrolling interests in the VodafoneZiggo JV and the VMO2 JV are held pursuant to shareholders’ agreements (each a Shareholders Agreement), which provides the terms of the governance of the VodafoneZiggo JV and the VMO2 JV, as applicable, including among others, decision-making processes, information access, dividend policies and non-compete provisions. These provisions may prevent the VodafoneZiggo JV or the VMO2 JV, as applicable, from making decisions or taking actions that would protect or advance the interests of our company, and could even result in the VodafoneZiggo JV or the VMO2 JV, as applicable, making decisions or taking actions that adversely impact our company. Further, our ability to access the cash of the VodafoneZiggo JV or the VMO2 JV, as applicable, pursuant to the dividend policy contained in the Shareholders Agreements may be restricted in certain circumstances. The Shareholders Agreements also provide for restrictions on the transfer of interests in the VodafoneZiggo JV and the VMO2 JV, as applicable, which could adversely affect our ability to sell our interest in the VodafoneZiggo JV or the VMO2 JV, as applicable, and/or the prices at which our interest may be sold, as well as certain exit arrangements, which could force us to sell our interest. For additional information on the VodafoneZiggo JV or the VMO2 JV and their respective Shareholders Agreement, see note 7 to our consolidated financial statements included in Part II of this Annual Report on Form 10-K.
We may have exposure to additional tax liabilities. We are subject to income taxes as well as non-income based taxes, such as value-added taxes (VAT) in the U.K., the U.S. and many other jurisdictions around the world. In addition, most tax jurisdictions that we operate in have complex and subjective rules regarding the valuation of intercompany services, cross-border payments between affiliated companies and the related effects on income tax, VAT and transfer tax. Significant judgment is required in determining our worldwide provision for income taxes and other tax liabilities. In the ordinary course of our business, there are many transactions and calculations where the ultimate tax determination is uncertain. We are regularly under audit by tax authorities in many of the jurisdictions in which we operate. These audits may lead to disputes with tax authorities which may result in litigation. Although we believe that our tax estimates are reasonable, any material differences as a result of final determinations of tax audits or tax disputes could have an adverse effect on our financial position and results of operations in the period or periods for which such determination is made.
We are subject to changing tax laws, treaties and regulations in and between the countries in which we operate, including treaties between and among the U.K., the U.S. and many other jurisdictions in which we have a presence. Also, various income tax proposals in the jurisdictions in which we operate could result in changes to the existing laws on which our deferred taxes are calculated. A change in these tax laws, treaties or regulations, or in the interpretation thereof, could result in a materially higher income or non-income tax expense, and any such material changes could cause a material change in our effective tax rate. In this regard, there have been significant changes or proposed changes to the tax laws in numerous jurisdictions in which we operate, the impacts of which have been reflected accordingly in our financial statements. These changes have resulted in various initiatives that require the sharing of company financial and operating information with taxing authorities on a local or global basis. This may lead to greater audit scrutiny of profits earned in other countries as well as disagreements between jurisdictions associated with the proper allocation of profits between jurisdictions. Broadly, we are subject to tax laws in the jurisdictions where we have operations, a presence and where we are legally incorporated. In considering these factors and others, it is possible that taxing authorities of the jurisdictions we operate in and taxing authorities of other different jurisdictions may claim that we are a tax resident of such other countries, which could result in additional operational and financial complications for us.
I-37
The “Virgin” brand is used by certain of our consolidated subsidiaries and nonconsolidated joint ventures under licenses from Virgin Enterprises Limited and is not under the control of such subsidiaries. The activities of the group of companies utilizing the “Virgin” brand and other licensees could have a material adverse effect on the goodwill of customers towards our business as a licensee, and the licenses from Virgin Enterprises Limited can be terminated in certain circumstances. The “Virgin” brand is integral to the corporate identity of certain of our consolidated subsidiaries and the VMO2 JV that utilize such brand. Such entities are reliant on the general goodwill of consumers towards the “Virgin” brand. Consequently, adverse publicity in relation to the group of companies utilizing the “Virgin” brand or its principals, particularly Sir Richard Branson, who is closely associated with the brand, or in relation to another licensee of the “Virgin” name and logo (particularly in the U.K., where the VMO2 JV does business) could have a material adverse effect on our reputation and our business and results of operations. In addition, the licenses from Virgin Enterprises Limited can be terminated in certain circumstances. For example, Virgin Enterprises Limited can terminate the licenses, after providing our applicable subsidiaries and joint ventures with an opportunity to cure, (i) if they or any of their affiliates commit persistent and material breaches or flagrant and material breaches of the licenses, (ii) if Virgin Enterprises Limited has reasonable grounds to believe that the use (or lack of use) of the licensed trademarks by such subsidiaries has been or is likely to result in a long-term and material diminution in the value of the “Virgin” brand or (iii) if a third-party who is not (or one of whose directors is not) a “fit and proper person”, such as a legally disqualified director or a bankrupt entity, acquires “control” of Liberty Global. Such a termination could have a material adverse effect on our business and results of operations.
Factors Relating to Certain Financial Matters
Our substantial leverage could limit our ability to obtain additional financing and have other adverse effects. We seek to maintain our debt at levels that provide for attractive equity returns without assuming undue risk. In this regard, we generally seek to cause our operating subsidiaries and joint ventures to maintain their debt at levels that result in a consolidated debt balance that is between four and five times our consolidated Adjusted EBITDA (using consistent currency exchange rates for debt and Adjusted EBITDA). As a result, we are highly leveraged. At December 31, 2023, the outstanding principal amount of our consolidated debt, together with our finance lease obligations aggregated $15.9 billion, including $0.8 billion that is classified as current on our consolidated balance sheet and $7.5 billion that is not due until 2029 or thereafter. We believe that we have sufficient resources to repay or refinance the current portion of our debt and finance lease obligations and to fund our foreseeable liquidity requirements during the next 12 months. However, as the amount of debt that is maturing increases in later years, we anticipate that we will seek to refinance or otherwise extend our debt maturities. As a result of unfavorable geopolitical conditions in 2023, credit markets were not offering attractive terms for issuance and thus we did not complete any refinancing transactions on our consolidated businesses. No assurance can be given that we will be able to complete these refinancing transactions or otherwise extend our debt maturities. In this regard, it is not possible to predict how political and economic conditions, sovereign debt concerns or any adverse regulatory developments could impact the credit and equity markets we access and, accordingly, our future liquidity and financial position.
Our ability to service or refinance our debt and to maintain compliance with the leverage covenants in the credit agreements and indentures of our borrowing groups is dependent primarily on our ability to maintain or increase the Adjusted EBITDA of our operating subsidiaries and joint ventures and to achieve adequate returns on our property and equipment additions and acquisitions. In addition, our ability to obtain additional debt financing is limited by the incurrence-based leverage covenants contained in the various debt instruments of our borrowing groups. For example, if the Adjusted EBITDA of one of our borrowing groups were to decline, our ability to obtain additional debt could be limited. Accordingly, if our cash provided by operations declines or we encounter other material liquidity requirements, we may be required to seek additional debt or equity financing in order to meet our debt obligations and other liquidity requirements as they come due. In addition, our current debt levels may limit our ability to incur additional debt financing to fund working capital needs, acquisitions, property and equipment additions or other general corporate requirements. We can give no assurance that any additional debt or equity financing will be available on terms that are as favorable as the terms of our existing debt, or at all. Further, our board of directors may approve a share repurchase program for Liberty Global in 2024. Any cash used by our company in connection with any future repurchases of our common shares would not be available for other purposes, including the repayment of debt. For additional information concerning our share repurchase programs, see note 14 to our consolidated financial statements included in Part II of this Annual Report on Form 10-K.
Certain of our subsidiaries and joint ventures are subject to various debt instruments that contain restrictions on how we finance our operations and operate our businesses, which could impede our ability to engage in beneficial transactions. Certain of our subsidiaries and joint ventures are subject to significant financial and operating restrictions contained in outstanding credit agreements, indentures and similar instruments of indebtedness. These restrictions will affect, and in some cases significantly limit or prohibit, among other things, the ability of those subsidiaries and joint ventures to:
I-38
•incur or guarantee additional indebtedness;
•pay dividends or make other upstream distributions;
•make investments;
•transfer, sell or dispose of certain assets, including subsidiary stock;
•merge or consolidate with other entities;
•engage in transactions with us or other affiliates; or
•create liens on their assets.
As a result of restrictions contained in these debt instruments, the companies party thereto, and their subsidiaries, could be unable to obtain additional capital in the future to:
•fund property and equipment additions or acquisitions that could improve their value;
•meet their loan and capital commitments to their business affiliates;
•invest in companies in which they would otherwise invest;
•fund any operating losses or future development of their business affiliates;
•obtain lower borrowing costs that are available from secured lenders or engage in advantageous transactions that monetize their assets; or
•conduct other necessary or prudent corporate activities.
In addition, most of the credit agreements to which these subsidiaries and joint ventures are parties include financial covenants that require them, in certain circumstances, to maintain certain leverage ratios if the drawings under the applicable revolving credit facility exceed a certain percentage of the commitments under such revolving credit facility. Their ability to meet these financial covenants may be affected by adverse economic, competitive or regulatory developments and other events beyond their control, and we cannot assure you that these financial covenants will be met. In the event of a default under such subsidiaries’ and joint ventures’ credit agreements or indentures, the lenders or bondholders, as applicable, may accelerate the maturity of the indebtedness under those agreements or indentures, which could result in a default under other outstanding credit facilities or indentures. We cannot assure you that any of these subsidiaries or joint ventures will have sufficient assets to repay indebtedness outstanding under their credit agreements and indentures. Any refinancing of this indebtedness is likely to contain similar restrictive covenants.
We are exposed to interest rate risks. Shifts in such rates may adversely affect the debt service obligations of our subsidiaries and joint ventures. We are exposed to the risk of fluctuations in interest rates, primarily through the credit facilities of certain of our subsidiaries and joint ventures, which are indexed to EURIBOR, Secured Overnight Financing Rate (SOFR), Term Secured Overnight Financing Rate (Term SOFR), Sterling Overnight Index Average (SONIA), Swiss Average Rate Overnight (SARON) or other base rates. Although we enter into various derivative transactions to manage exposure to movements in interest rates, there can be no assurance that we will be able to continue to do so at a reasonable cost, or at all. If we are unable to effectively manage our interest rate exposure through derivative transactions, any increase in market interest rates would increase our interest rate exposure and debt service obligations, which would exacerbate the risks associated with our leveraged capital structure.
There have been significant changes in the benchmark interest rates used to set floating rates on our debt and derivative instruments. ICE Benchmark Administration (the entity that administers LIBOR) ceased to publish CHF and GBP LIBOR rates after December 31, 2021, and it ceased to publish USD LIBOR rates after June 30, 2023. The methodology for EURIBOR has been reformed and EURIBOR has been granted regulatory approval to continue to be used.
We have agreed amendments in respect of all of our debt and derivative instruments to replace the ceased rates. For USD, these reference SOFR administered by the Federal Reserve Bank of New York or Term SOFR administered by CME Group Benchmark Administration Limited. For CHF, these reference SARON administered by the SIX Swiss Exchange. For GBP, these reference SONIA administered by the Bank of England.
We are subject to increasing operating costs and inflation risks, which may adversely affect our results of operations. While our operations attempt to increase our subscription rates to offset increases in programming, inputs and operating costs,
I-39
there is no assurance that they will be able to do so. In certain countries in which we operate, our ability to increase subscription rates is subject to regulatory controls. Also, our ability to increase subscription rates may be constrained by competitive pressures. Therefore, programming, inputs and operating costs may rise faster than associated revenue, resulting in a material negative impact on our cash flows and net earnings or loss. We are also impacted by inflationary pressures, which remain elevated, in salaries, wages, benefits, regulatory, energy and other administrative costs in certain of our markets as a result of, among other things, the ongoing invasion of Ukraine by Russia and the Israeli-Palestinian conflict.
Continuing uncertainties and challenging conditions in the global economy and in the countries in which we operate may adversely impact our business, financial condition and results of operations. The current macroeconomic environment is highly volatile, with continued instability in global markets, including ongoing trade negotiations, uncertainty over inflation, energy price fluctuations, rising interest rates, continued escalation in geopolitical tensions and global recession fears having all contributed to a challenging global economic environment. Future developments are dependent upon a number of political and economic factors, including the additional borrowing incurred by countries during the COVID-19 pandemic and the potential for lower growth expectations, higher global interest rates and continued inflationary pressures. As a result, we cannot predict how long challenging conditions will exist or the extent to which the markets in which we operate may deteriorate. Additional risks arising from the ongoing economic challenges in Europe are described below under the Risk Factor titled: We are exposed to sovereign debt and currency instability risks that could have an adverse impact on our liquidity, financial condition and cash flows.
Unfavorable economic conditions, including the current cost-of-living crises in many of the countries in which we operate, may impact a significant number of our subscribers and/or the prices we are able to charge for our products and services and, as a result, it may be (i) more difficult for us to attract new subscribers and maintain current subscribers, (ii) more likely that subscribers will downgrade or disconnect their services and (iii) more difficult for us to maintain ARPUs at existing levels. Countries may also seek new or increased revenue sources due to fiscal deficits. Such actions may further adversely affect our company and our joint ventures. Accordingly, our ability to increase or, in certain cases, maintain, the revenue, ARPUs, RGUs, mobile subscribers, Adjusted EBITDA, margins and liquidity of our operating segments could be adversely affected if the macroeconomic environment remains uncertain or declines further. We are currently unable to predict the extent of any of these potential adverse effects.
We are exposed to sovereign debt and currency instability risks that could have an adverse impact on our liquidity, financial condition and cash flows. Our operations are subject to macroeconomic and political risks that are outside of our control. For example, high levels of sovereign debt in the U.S. and several countries in which we or our affiliates operate, combined with structural changes arising from the COVID-19 pandemic, could potentially lead to additional fiscal reforms (including austerity measures), tax increases, sovereign debt restructurings, high corporate default rates, currency instability, increased counterparty credit risk, high levels of volatility and disruptions in the credit and equity markets, as well as other outcomes that might adversely impact our company. With regard to currency instability issues, concerns exist in the Eurozone with respect to individual macro-fundamentals on a country-by-country basis, as well as with respect to the overall stability of the European monetary union and the suitability of a single currency to appropriately deal with specific fiscal management and sovereign debt issues in individual Eurozone countries. The realization of these concerns could lead to the exit of one or more countries from the European monetary union and the re-introduction of individual currencies in these countries, or, in more extreme circumstances, the possible dissolution of the European monetary union entirely, which could result in the redenomination of a portion or, in the extreme case, all of our euro-denominated assets, liabilities and cash flows to the new currency of the country in which they originated. This could result in a mismatch in the currencies of our assets, liabilities and cash flows. Any such mismatch, together with the capital market disruption that would likely accompany any such redenomination event, could have a material adverse impact on our liquidity and financial condition. Furthermore, any redenomination event would likely be accompanied by significant economic dislocation, particularly within the Eurozone countries, which in turn could have an adverse impact on demand for our products and services, and accordingly, on our revenue and cash flows. Moreover, any changes from euro to non-euro currencies within the countries in which we operate would require us to modify our billing and other financial systems. No assurance can be given that any required modifications could be made within a time frame that would allow us to timely bill our customers or prepare and file required financial reports. In light of the significant exposure that we have to the euro through our euro-denominated borrowings, derivative instruments, cash balances and cash flows, a redenomination event could have a material adverse impact on our company.
We may not freely access the cash of our operating companies. Our operations are conducted through our subsidiaries. Our current sources of corporate liquidity include (i) our cash and cash equivalents, (ii) investments held within SMAs and (iii) interest and dividend income received on our cash and cash equivalents and investments. From time to time, we also receive (a) proceeds in the form of distributions or loan repayments from our subsidiaries or affiliates, (b) proceeds upon the disposition of investments and other assets and (c) proceeds in connection with the incurrence of debt or the issuance of equity securities. The ability of our operating subsidiaries to pay dividends or to make other payments or advances to us depends on their
I-40
individual operating results and any statutory, regulatory or contractual restrictions to which they may be or may become subject and in some cases our receipt of such payments or advances may be limited due to tax considerations or the presence of noncontrolling interests. Most of our operating subsidiaries are subject to credit agreements or indentures that restrict sales of assets and prohibit or limit the payment of dividends or the making of distributions, loans or advances to shareholders and partners, including us. In addition, because these subsidiaries are separate and distinct legal entities they have no obligation to provide us funds for payment obligations, whether by dividends, distributions, loans or other payments.
We are exposed to the risk of default by the counterparties to our cash and short-term investments, derivative and other financial instruments and undrawn debt facilities. Although we seek to manage the credit risks associated with our cash and short-term investments, derivative and other financial instruments and undrawn debt facilities, we are exposed to the risk that our counterparties will default on their obligations to us. While we regularly review our credit exposures and currently have no specific concerns about the creditworthiness of any counterparty for which we have material credit risk exposures, we cannot rule out the possibility that one or more of our counterparties could fail or otherwise be unable to meet its obligations to us. Any such instance of default or failure could have an adverse effect on our cash flows, results of operations, financial condition and/or liquidity. In this regard, (i) we may incur losses to the extent that we are unable to recover debts owed to us, including cash deposited and the value of financial losses, (ii) we may incur significant costs to recover amounts owed to us, and such recovery may take a long period of time or may not be possible at all, (iii) our derivative liabilities may be accelerated by the default of our counterparty, (iv) we may be exposed to financial risks as a result of the termination of affected derivative contracts, and it may be costly or impossible to replace such contracts or otherwise mitigate such risks, (v) amounts available under committed credit facilities may be reduced and (vi) disruption to the credit markets could adversely impact our ability to access debt financing on favorable terms, or at all.
At December 31, 2023, our exposure to counterparty credit risk included (i) aggregate undrawn debt facilities of $1.6 billion, (ii) cash and cash equivalent and restricted cash balances of $1.4 billion and (iii) derivative assets with an aggregate fair value of $232.9 million. For additional information regarding our derivative instruments and debt, see notes 8 and 11, respectively, to our consolidated financial statements included in Part II of this Annual Report on Form 10-K.
We may not report net earnings. We reported earnings (loss) from continuing operations of ($3,873.8 million), $1,105.3 million and $13,527.5 million during 2023, 2022 and 2021, respectively. In light of our historical financial performance, we cannot assure you that we will report net earnings in the near future.
Other Factors
We have not historically paid any cash dividends, and we may not pay dividends consistently or at all on any class of our common shares. We have not historically paid dividends on any class of of our common shares, however, we have the right to pay dividends, effect securities distributions or make bonus issues on Liberty Global shares.
The loss of certain key personnel could harm our business. We have experienced employees at both the corporate and operational levels who possess substantial knowledge of our business and operations. We cannot be assured that we will be successful in retaining their services or that we would be successful in hiring and training suitable replacements without undue costs or delays. As a result, the loss of any of these key employees could cause significant disruptions in our business operations, which could materially adversely affect our results of operations.
John C. Malone has significant voting power with respect to corporate matters considered by our shareholders. Dr. John C. Malone beneficially owns outstanding common shares of Liberty Global representing 30.65% of our aggregate voting power as of February 13, 2024. By virtue of Dr. Malone’s voting power in our company, as well as his position as Chairman of our board of directors, Dr. Malone may have significant influence over the outcome of any corporate transaction or other matters submitted to our shareholders for approval. For example, under our bye-laws, certain matters (including amendments to certain provisions of the bye-laws) require the approval of 75% of the outstanding Class A common shares and Class B common shares, voting together as a single class, and other certain corporate transactions or matters may require the approval of at least 75% of the outstanding Class A common shares and Class B common shares, voting together as a single class. Because Dr. Malone beneficially owns 30.65% of our aggregate voting power, he has the ability to prevent the requisite approval threshold from being met even though the other shareholders may determine that such action or transaction is beneficial for the company. Dr. Malone’s rights to vote or dispose of his equity interests in our company are not subject to any restrictions in favor of us other than as may be required by applicable law and customary transfer restrictions pursuant to equity award agreements.
It may be difficult for a third-party to acquire us, even if doing so may be beneficial to our shareholders. Certain provisions of our bye-laws may discourage, delay or prevent a change in control of our company that a shareholder may consider favorable. These provisions include the following:
I-41
•authorizing a capital structure with multiple classes of common shares, a Class B share class that entitles the holders to 10 votes per share, a Class A share class that entitles the holders to one vote per share and a Class C share class that, except as otherwise required by applicable law, entitles the holders to no voting rights;
•classifying our board of directors with staggered three-year terms, which may lengthen the time required to gain control of our board of directors;
•prohibiting shareholder action by written resolution, thereby requiring all shareholder actions to be taken at a meeting of the shareholders;
•establishing advance notice requirements for nominations of director candidates or for proposing matters that can be acted upon by shareholders at shareholder meetings;
•requiring supermajority shareholder approval with respect to certain extraordinary matters, such as certain mergers, amalgamations or consolidations of the company, or in the case of certain amendments to our bye-laws; and
•the existence of authorized and unissued shares which would allow our board to issue shares to persons friendly to current management, thereby protecting the continuity of its management, or which could be used to dilute the share ownership of persons seeking to obtain control of us.
Change in control provisions in our incentive plans and related award agreements or in executive employment agreements may also discourage, delay or prevent a change in control of our company, even if such change of control would be in the best interests of our shareholders.
The enforcement of civil liabilities against us may be more difficult. Because we are now a Bermuda exempted company limited by shares, investors could experience more difficulty enforcing judgments obtained against us, our directors or officers in U.S. or U.K. courts based on the civil liability provisions of English laws and the U.S. securities laws. We have been advised by our Bermuda counsel that there is no treaty in force between the U.S. and Bermuda providing for the reciprocal recognition and enforcement of judgments in civil and commercial matters. As a result, whether a U.S. judgment would be enforceable in Bermuda against the company or its directors and officers depends on whether the U.S. court that entered the judgment is recognized by a Bermuda court as having jurisdiction over the company or its directors and officers, as determined by reference to Bermuda conflict of law rules. In addition, and irrespective of jurisdictional issues, Bermudan courts will not enforce a U.S. federal securities law that is either penal or contrary to Bermuda public policy. We have been advised that an action brought pursuant to a public or penal law, the purpose of which is the enforcement of a sanction, power or right at the instance of the state in its sovereign capacity, is unlikely to be entertained by a Bermuda court. Certain remedies available under the laws of U.S. jurisdictions, including certain remedies under U.S. federal securities laws, may not be available under Bermudan law or enforceable in a Bermuda court, as they are likely to be contrary to Bermuda public policy. Further, it may not be possible to pursue direct claims in Bermuda against the company or its directors and officers for alleged violations of U.S. federal securities laws because these laws are unlikely to have extraterritorial effect and do not have the force of law in Bermuda. A Bermuda court may, however, impose civil liability on us or our directors and officers if the facts alleged and proved in the Bermudan proceedings constitute or give rise to a cause of action under the applicable governing law, not being a foreign public, penal or revenue law.
Our bye-laws generally restrict shareholders from bringing legal action against our officers and directors. Our bye-laws contain a general waiver by shareholders for any claim or right of action a shareholder might have (whether individually or by or in the right of the company) against any director or officer of the company arising from any action or inaction by such director or officer in the performance of their duties for Liberty Global or any of Liberty Global’s direct or indirect subsidiaries (but excluding any matter involving fraud or dishonesty). Consequently, this waiver limits the right of shareholders to assert claims against our officers and directors unless the act or failure to act involves fraud or dishonesty.
There are potential regulatory limitations on the ownership and transfer of our shares if the our shares are delisted from Nasdaq. Our shares may be offered or sold in Bermuda only in compliance with the provisions of the Bermuda Companies Act and the Investment Business Act 2003 of Bermuda, which regulates the sale of securities in Bermuda. In addition, the Bermuda Monetary Authority (BMA) must approve all issues and transfers of shares of a Bermuda exempted company limited by shares. However, the BMA has, pursuant to its statement of June 1, 2005, given its general permission under the Exchange Control Act 1972 and related regulations for the issue and free transfer of our shares to and among persons who are non-residents of Bermuda for exchange control purposes as long as any class of our shares are listed on an appointed stock exchange, which includes Nasdaq. This general permission would cease to apply if none of our shares were to be listed on Nasdaq or another appointed stock exchange.
I-42
We are exposed to the risks arising from widespread epidemic diseases in the countries in which we operate, such as the outbreak of COVID-19, which could have a material adverse impact on our business, financial condition and results of operations. The COVID-19 pandemic and the emergency measures imposed by governments worldwide, including travel limitations, limits on social activity and the shutdown of non-essential businesses have adversely impacted the global economy, disrupted global supply chains and created significant volatility and disruption of financial markets. While it is not currently possible to estimate the duration and severity of the adverse economic impact resulting from the preventative measures taken to contain or mitigate the spread of COVID-19, a continued period of global economic disruption may continue to have a material adverse impact on our business, financial condition and results of operations in future periods. We may also be adversely impacted by any government mandated regulations on our business that could be implemented in response to the COVID-19 pandemic or other pandemics or epidemics. In addition, countries may seek new or increased revenue sources due to fiscal deficits that resulted from measures taken to mitigate the adverse economic impacts of COVID-19, such as, among other things, imposing new taxes on the products and services we provide. We are currently unable to predict the extent of any of these potential adverse effects as they relate to the COVID-19 pandemic or any future pandemics or epidemics.
Geopolitical conflicts, energy shortages and other adverse incidents beyond our control could adversely affect our revenue and results of operations. Political unrest and global conflicts like the ongoing conflict between Russia and Ukraine and the Israeli-Palestinian conflict have disrupted, and in the future may further continue to disrupt, global supply chains and heighten volatility and disruption of global financial markets. While we do not have direct operations within the conflict areas, the conflicts involving these nations has heightened the disruption to our supply chain, contributing to inflation in our labor and energy costs and may increase our risk of cyberattacks, which could result in significant losses and damage and could damage our reputation with customers and suppliers if their confidential information is compromised. The impact of these global events on our longer-term operational and financial performance will depend on future developments, our and governmental responses to inflation and the duration and severity of these conflicts. Any terrorist attacks or incidents prompted by political unrest, particularly in markets that we serve, and the national and global military, diplomatic and financial response to such attacks or other threats, also may adversely affect our revenue and results of operations.
Item 1B. UNRESOLVED STAFF COMMENTS
None.
Item 1C. CYBERSECURITY
Liberty Global and its subsidiaries are subject to risks from cyber-attacks that have the potential to cause significant interruptions to the operation of their businesses. The frequency of these attempted intrusions has increased in recent years and the sources, motivations and techniques of attack continue to evolve and change rapidly. Liberty Global has developed a cybersecurity program that is designed to scan for, monitor and identify risks to company confidential or non-public information, protect such information, detect threats and events and maintain an appropriate response and recovery capability to help ensure resilience against cyber-attacks and other information security incidents. We have adopted a variety of measures to monitor and address cyber-related risks and continue to implement and explore additional cybersecurity measures.
Our strategy for managing cyber-related risks is risk-based and, where appropriate, integrated within our comprehensive enterprise risk management processes. Liberty Global’s Chief Security Officer (CSO), who reports directly to Liberty Global’s Chief Technology Officer (CTO), leads a dedicated cybersecurity team and is responsible for the design, implementation and execution of our cyber-risk management strategy.
Our CSO and cybersecurity team actively monitor Liberty Global’s systems, regularly review its policies, compliance, regulations and best practices, perform penetration testing, conduct incident response exercises and internal ethical phishing campaigns and provide periodic training and communication across the organization to strengthen secure behavior and foster a culture of digital security. The cybersecurity team also routinely participates in industry-wide programs to further information sharing, intelligence gathering and unity of effort in responding to potential or actual attacks. Liberty Global also periodically reviews its business continuity plan to develop an effective recovery strategy that seeks to decrease incident response times, limit financial impacts and maintain customer confidence during any business interruption. Our cybersecurity team also administers a third-party risk governance program that identifies potential risks introduced through third-party relationships, such as vendors, software and hardware manufacturers or professional service providers. Liberty Global also seeks to obtain certain contractual security guarantees and assurances with these third-party relationships to help ensure the security and safety of its information. The cybersecurity team works closely with a broad range of departments, including legal, regulatory, corporate communications, audit services, information technology and operational technology functions critical to Liberty Global’s operations, as well as engages external vendors to help ensure its cybersecurity program operates effectively.
I-43
Liberty Global’s current CSO has significant experience leading cybersecurity efforts at large enterprises, having held top information security positions at a number of international large- and mega-cap companies during her career. She also holds a master of science in security risk management and is qualified as a certified information security manager with the Information Systems Audit and Control Association. Our CSO has been with the company or its subsidiaries for over five years.
Cybersecurity incidents detected by Liberty Global’s cybersecurity team are evaluated internally based on their severity, with more serious incidents being escalated, as appropriate, to the highest levels of management, including the company’s CTO, General Counsel, and, ultimately, its CEO. These members of the company’s executive leadership team are provided with details of the type and severity of the attack, the company’s planned response to the incident and are briefed on what information was accessed and the impact such incident has had or is expected to have on the company’s operations, as well as any financial or regulatory implications resulting from the incident.
Our Audit Committee is responsible for oversight of our cybersecurity measures, incident response management and risks related to cybersecurity and technology as well as the steps taken by management to mitigate such risks. Liberty Global’s CSO provides periodic updates to the Audit Committee on the state of Liberty Global’s cybersecurity posture, new threats or threat actors that the company is monitoring or developing defenses against and any potential areas of improvement. Our CEO, CTO, CSO and General Counsel will also provide ad hoc updates to the Audit Committee and full board of directors, as appropriate, in the case of a material cybersecurity incident, providing them a full briefing of the type and scope of the incident as well as the company’s current and planned mitigation efforts. The Audit Committee has several members with significant direct and indirect cybersecurity experience, including Anthony Werner, the former CTO of Comcast Cable and the company, Paul Gould and Miranda Curtis CMG. Cybersecurity and the effectiveness of our cybersecurity strategy are regular topics of discussion at meetings of our Audit Committee and board of directors.
Item 2. PROPERTIES
We lease our corporate offices in London, U.K., in Denver, Colorado, U.S. and in Amsterdam, the Netherlands. All of our other real or personal property is owned or leased by our subsidiaries and affiliates.
Our subsidiaries and affiliates own or lease the fixed assets necessary for the operation of their respective businesses, including office space, transponder space, head-end facilities, rights of way, cable television and telecommunications distribution equipment, telecommunications switches, base stations, cell towers, CPE and other property necessary for their operations. The physical components of their broadband networks require maintenance and periodic upgrades to support the new services and products they introduce. Subject to these maintenance and upgrade activities, our management believes that our current facilities are suitable and adequate for our business operations for the foreseeable future.
Item 3. LEGAL PROCEEDINGS
From time to time, our subsidiaries and affiliates have become involved in litigation relating to claims arising out of their operations in the normal course of business. For additional information, see note 18 to our consolidated financial statements included in Part II of this Annual Report on Form 10-K.
Item 4. MINE SAFETY DISCLOSURES
Not applicable.
I-44
PART II
Item 5. MARKET FOR REGISTRANT’S COMMON EQUITY, RELATED SHAREHOLDER MATTERS AND ISSUER PURCHASES OF EQUITY SECURITIES
General
The capitalized terms used in Part II of this Annual Report on Form 10-K are defined in the notes to our consolidated financial statements. In the following text, the terms “we,” “our,” “our company” and “us” may refer, as the context requires, to Liberty Global or collectively to Liberty Global and its subsidiaries.
Market Information
Our share capital comprises Liberty Global Class A, Class B and Class C common shares, which trade on the Nasdaq Global Select Market under the symbols “LBTYA”, “LBTYB” and “LBTYK”, respectively. Share price information for securities traded on the Nasdaq Global Select Market can be found on the Nasdaq’s website at www.nasdaq.com.
The following table sets forth the quarterly range of high and low sales prices of Liberty Global Class B common shares for 2023 and 2022. Although Liberty Global Class B common shares are traded on the Nasdaq Global Select Market, an established public trading market does not exist for the shares, as they are not actively traded.
| Liberty Global Class B common shares | |||||||||||
| High | Low | ||||||||||
2023 | |||||||||||
| First quarter | $ | 22.20 | $ | 18.20 | |||||||
| Second quarter | $ | 19.84 | $ | 16.30 | |||||||
| Third quarter | $ | 19.75 | $ | 16.86 | |||||||
| Fourth quarter | $ | 18.44 | $ | 15.47 | |||||||
2022 | |||||||||||
| First quarter | $ | 30.30 | $ | 23.55 | |||||||
| Second quarter | $ | 26.20 | $ | 21.39 | |||||||
| Third quarter | $ | 23.59 | $ | 16.62 | |||||||
| Fourth quarter | $ | 20.99 | $ | 16.30 | |||||||
Holders
As of January 31, 2024, there were 31,412, 46 and 34,322 record holders of Liberty Global Class A, Class B and Class C common shares, respectively. These amounts do not include the number of shareholders whose shares are nominally held by banks, brokerage houses or other institutions, but include each such institution as one record holder.
Dividends
We have not paid any cash dividends on any of our common shares, and we have no present intention of doing so. Any future payment of cash dividends will be determined by our board of directors in light of our earnings, financial condition and other relevant considerations, including applicable laws in Bermuda.
Recent Sales of Unregistered Securities; Use of Proceeds from Registered Securities
None.
II-1
Issuer Purchase of Equity Securities
The following table sets forth information regarding our company’s purchase of its own equity securities during the three months ended December 31, 2023:
| Period | Total number of shares purchased | Average price paid per share (a) | Total number of shares purchased as part of publicly-announced plans or programs | Value of shares that may yet be repurchased under the plans or programs | ||||||||||||||||||||||
| October 1, 2023 through October 31, 2023: | ||||||||||||||||||||||||||
| Class A | — | — | — | (b) | ||||||||||||||||||||||
| Class C | 9,400,310 | 17.68 | 9,400,310 | (b) | ||||||||||||||||||||||
| November 1, 2023 through November 30, 2023: | ||||||||||||||||||||||||||
| Class A | — | — | — | (b) | ||||||||||||||||||||||
| Class C | 4,491,261 | 17.26 | 4,491,261 | (b) | ||||||||||||||||||||||
| December 1, 2023 through December 31, 2023: | ||||||||||||||||||||||||||
| Class A | — | — | — | (b) | ||||||||||||||||||||||
| Class C | 6,502,630 | 17.39 | 6,502,630 | (b) | ||||||||||||||||||||||
| Total — October 1, 2023 through December 31, 2023: | ||||||||||||||||||||||||||
| Class A | — | — | — | (b) | ||||||||||||||||||||||
| Class C | 20,394,201 | 17.49 | 20,394,201 | (b) | ||||||||||||||||||||||
_______________
(a)Average price paid per share includes direct acquisition costs.
(b)Our original share buyback plan for 2023 authorized the repurchase of 10% of our outstanding shares as of December 31, 2022, and this was increased to a minimum of 15% in July 2023. We achieved this minimum as of October 30, 2023, and announced a further repurchase target of approximately $300.0 million through the end of January 2024. At December 31, 2023, $101.7 million of this target remained and was fully achieved on January 26, 2024.
II-2
Stock Performance Graph
The following graph compares the changes in the cumulative total shareholder return on our Liberty Global Class A, Class B and Class C common shares from January 1, 2019 to December 31, 2023, to the change in the cumulative total returns of the Nasdaq US Benchmark Telecom TR Index and the Nasdaq US Benchmark TR Index (assuming reinvestment of dividends, where applicable). The graph assumes that $100 was invested on January 1, 2019.
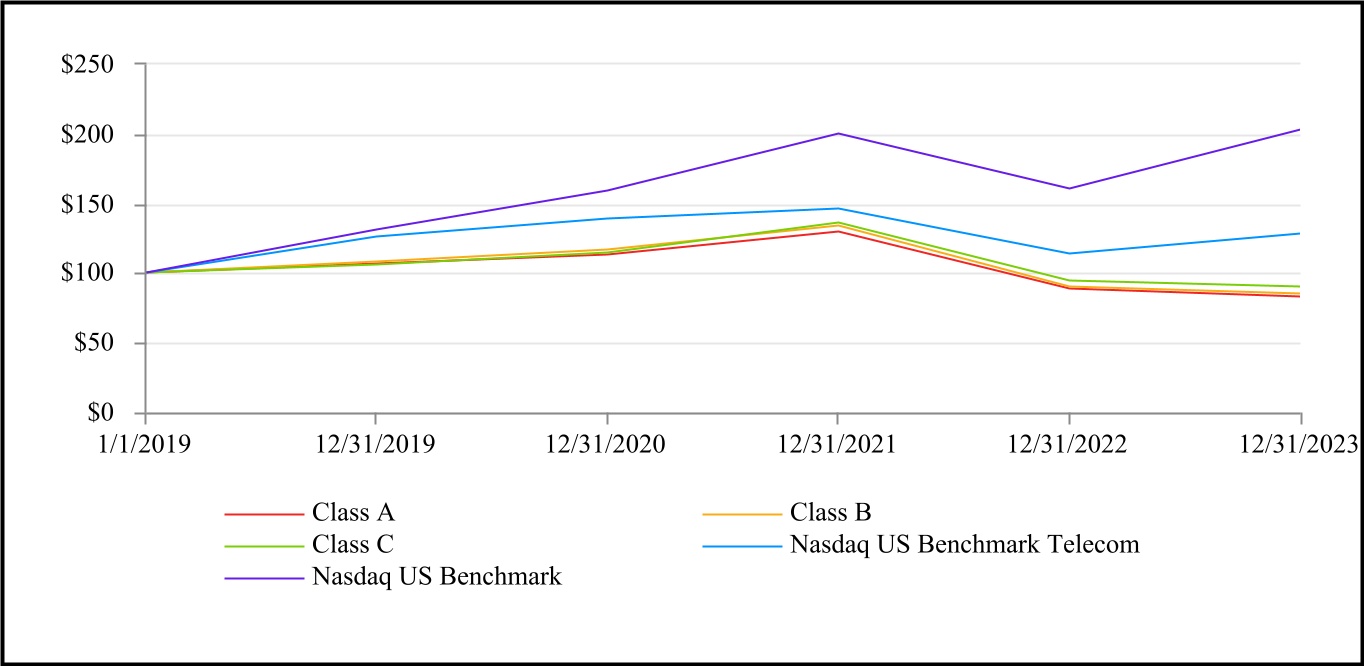
| December 31, | |||||||||||||||||||||||||||||
| 2019 | 2020 | 2021 | 2022 | 2023 | |||||||||||||||||||||||||
Liberty Global - Class A | $ | 106.56 | $ | 113.50 | $ | 129.99 | $ | 88.71 | $ | 83.27 | |||||||||||||||||||
Liberty Global - Class B | $ | 108.29 | $ | 116.76 | $ | 134.10 | $ | 90.48 | $ | 84.81 | |||||||||||||||||||
Liberty Global - Class C | $ | 105.62 | $ | 114.58 | $ | 136.09 | $ | 94.14 | $ | 90.31 | |||||||||||||||||||
| Nasdaq US Benchmark Telecom TR Index | $ | 126.37 | $ | 138.80 | $ | 146.20 | $ | 113.62 | $ | 128.09 | |||||||||||||||||||
Nasdaq US Benchmark TR Index | $ | 131.17 | $ | 159.07 | $ | 200.26 | $ | 160.75 | $ | 203.23 | |||||||||||||||||||
II-3
Item 7. MANAGEMENT’S DISCUSSION AND ANALYSIS OF FINANCIAL CONDITION AND RESULTS OF OPERATIONS
The following discussion and analysis, which should be read in conjunction with our consolidated financial statements, is intended to assist in providing an understanding of our results of operations and financial condition and is organized as follows:
•Overview. This section provides a general description of our business and recent events.
•Results of Operations. This section provides an analysis of our results of operations for the years ended December 31, 2023 and 2022.
•Liquidity and Capital Resources. This section provides an analysis of our corporate and subsidiary liquidity and consolidated statements of cash flows.
•Critical Accounting Policies, Judgments and Estimates. This section discusses those material accounting policies that involve uncertainties and require significant judgment in their application.
•Quantitative and Qualitative Disclosures about Market Risk. This section provides discussion and analysis of the foreign currency, interest rate and other market risk that our company faces.
Included below is an analysis of our results of operations and cash flows for 2023, as compared to 2022. An analysis of our results of operations and cash flows for 2022, as compared to 2021, can be found under Item 7. Management’s Discussion and Analysis of Financial Condition and Results of Operations included in Part II of our Annual Report on Form 10-K, as amended, for the year ended December 31, 2022 (our 2022 10-K), which is available through the Securities and Exchange Commission’s website at www.sec.gov.
Unless otherwise indicated, convenience translations into U.S. dollars are calculated, and operational data is presented, as of December 31, 2023. Certain prior year amounts have been reclassified to conform to the current year presentation.
Overview
General
We are an international provider of broadband internet, video, fixed-line telephony and mobile communications services to residential customers and businesses in Europe. Our operations comprise businesses that provide residential and B2B communications services in (i) Switzerland and Slovakia through Sunrise Holding, (ii) Belgium and Luxembourg through Telenet and (iii) Ireland through VM Ireland. In addition, we own 50% noncontrolling interests in (a) the VMO2 JV, which provides residential and B2B communications services in the U.K., and (b) the VodafoneZiggo JV, which provides residential and B2B communications services in the Netherlands. We also own (1) a 50% noncontrolling voting interest in the AtlasEdge JV, which is a leading European Edge data center platform, and (2) a 25% noncontrolling interest in the nexfibre JV, which is constructing a new fiber network in the U.K. outside of the existing footprint of the VMO2 JV.
In October 2023, we completed the Telenet Takeover Bid (as defined and described in note 14 to our consolidated financial statements), pursuant to which we increased our ownership interest in Telenet to 100%.
Through March 31, 2022, we provided residential and B2B communications services in Poland through Sunrise Holding. On April 1, 2022, we completed the sale of our operations in Poland. Accordingly, our operations in Poland are reflected as discontinued operations for all applicable periods. In the following discussion and analysis, the operating statistics, results of operations, cash flows and financial condition that we present and discuss are those of our continuing operations, unless otherwise indicated. For additional information regarding the sale of UPC Poland, including with respect to our use of proceeds, see note 6 to our consolidated financial statements.
Operations
Our company delivers market-leading products through next-generation networks that connect our customers to broadband internet, video, fixed-line telephony and mobile services. At December 31, 2023, our continuing operations owned and operated networks that passed 7,946,400 homes and served 4,055,500 fixed-line customers and 5,881,200 mobile subscribers.
Broadband internet services. We offer multiple tiers of broadband internet service up to Gigabit speeds depending on location. We continue to invest in new technologies that allow us to increase the internet speeds we offer to our customers.
II-4
Video services. We provide video services, including various enhanced products that enable our customers to control when they watch their programming. These products range from digital video recorders to multimedia home gateway systems capable of distributing video, voice and data content throughout the home and to multiple devices.
Fixed-line telephony services. We offer fixed-line telephony services via either voice-over-internet-protocol or “VoIP” technology or circuit-switched telephony, depending on location.
Mobile services. We offer voice and data mobile services, either over our own networks or as an MVNO over third-party networks, depending on location. In addition, we generate revenue from the sale of mobile handsets.
B2B services. Our B2B services include voice, broadband internet, data, video, wireless and cloud services.
Other. We also have significant investments in ITV, Televisa Univision, Lacework, Plume, the AtlasEdge JV, All3Media, EdgeConneX, Lionsgate, the Formula E racing series and several regional sports networks. The investments identified by company name above are intended to be merely illustrative, do not represent a complete list and are not necessarily the largest of our long-term investments. From time to time, we may make investments in other companies that we choose not to identify by company name for commercial, legal, strategic or other reasons.
For additional information regarding the details of our products and services, see Item 1. Business included in Part I of this Annual Report on Form 10-K.
Strategy and Management Focus
From a strategic perspective, we are seeking to build national fixed-mobile converged communications businesses that have strong prospects for future growth. As discussed further under Liquidity and Capital Resources — Capitalization below, we also seek to maintain our debt at levels that provide for attractive equity returns without assuming undue risk.
We strive to achieve organic revenue and customer growth in our operations by developing and marketing bundled entertainment and information and communications services, and extending and upgrading the quality of our networks where appropriate. As we use the term, organic growth excludes foreign currency translation effects (FX) and the estimated impact of acquisitions and dispositions. While we seek to increase our customer base, we also seek to maximize the average revenue we receive from each household by increasing the penetration of our broadband internet, video, fixed-line telephony and mobile services with existing customers through product bundling and upselling.
Impact of COVID-19
The global COVID-19 pandemic continues to impact the economies of the countries in which we operate. However, during 2023, the impact on our company continued to be relatively minimal as demand for our products and services remained strong. It is not currently possible to predict whether there will be a significant resurgence of the COVID-19 pandemic as a result of new variants or otherwise, or to estimate the duration and severity of the COVID-19 pandemic or the adverse economic impact resulting from the preventative measures taken to contain or mitigate its outbreak. No assurance can be given that an extended period of global economic disruption would not have a material adverse impact on our business, financial condition and results of operations in future periods.
Competition and Other External Factors
We are experiencing competition in all of the markets in which we or our affiliates operate. This competition, together with macroeconomic and regulatory factors, has adversely impacted our revenue, number of customers and/or average monthly subscription revenue per fixed-line customer or mobile subscriber, as applicable (ARPU). For additional information regarding the competition we face, see Item 1. Business — Competition and — Regulatory Matters included in Part I of this Annual Report on Form 10-K. For additional information regarding the revenue impact of changes in the fixed-line customers and ARPU of our consolidated reportable segments, see Discussion and Analysis of our Reportable Segments below.
For information regarding certain other regulatory developments that could adversely impact our results of operations in future periods, see Legal and Regulatory Proceedings and Other Contingencies in note 18 to our consolidated financial statements.
II-5
Results of Operations
We have completed a number of transactions that impact the comparability of our 2023 and 2022 results of operations, the most notable of which are (i) the sale of UPC Poland on April 1, 2022 and (ii) the Telenet Tower Sale on June 1, 2022. For further information regarding our dispositions, see note 6 to our consolidated financial statements.
In the following discussion, we quantify the estimated impact of material acquisitions (the Acquisition Impact) and dispositions on our operating results. The Acquisition Impact represents our estimate of the difference between the operating results of the periods under comparison that is attributable to an acquisition. In general, we base our estimate of the Acquisition Impact on an acquired entity’s operating results during the first three to twelve months following the acquisition date, as adjusted to remove integration costs and any other material unusual or nonoperational items, such that changes from those operating results in subsequent periods are considered to be organic changes. Accordingly, in the following discussion, (i) organic variances attributed to an acquired entity during the first 12 months following the acquisition date represent differences between the Acquisition Impact and the actual results and (ii) the calculation of our organic change percentages includes the organic activity of an acquired entity relative to the Acquisition Impact of such entity. With respect to material dispositions, the organic changes that are discussed below reflect adjustments to exclude the historical prior-year results of any disposed entities to the extent that such entities are not included in the corresponding results for the current-year period.
Changes in foreign currency exchange rates have a significant impact on our reported operating results as all of our operating segments have functional currencies other than the U.S. dollar. Our primary exposure to FX risk during the three months ended December 31, 2023 was to the euro and Swiss franc, as 55.1% and 46.7% of our reported revenue during the period was derived from subsidiaries whose functional currencies are the euro and Swiss franc, respectively. In addition, our reported operating results are impacted by changes in the exchange rates for certain other local currencies in Europe. The portions of the changes in the various components of our results of operations that are attributable to changes in FX are highlighted under Discussion and Analysis of our Reportable Segments and Discussion and Analysis of our Consolidated Operating Results below. For information regarding our foreign currency risks and the applicable foreign currency exchange rates in effect for the periods covered by this Annual Report on Form 10-K, see Quantitative and Qualitative Disclosures about Market Risk — Foreign Currency Risk below.
The amounts presented and discussed below represent 100% of each of our consolidated reportable segment’s results of operations. The noncontrolling owners’ interests in the operating results of Telenet, prior to the Telenet Takeover Bid, and other less significant majority-owned subsidiaries are reflected in net earnings or loss attributable to noncontrolling interests in our consolidated statements of operations. Furthermore, despite only holding a 50% noncontrolling interest in both the VMO2 JV and the VodafoneZiggo JV, we present 100% of the revenue and Adjusted EBITDA of those entities in the tables below.
Discussion and Analysis of our Reportable Segments
General
All of our reportable segments derive their revenue primarily from residential and B2B communications services. For detailed information regarding the composition of our reportable segments and how we define and categorize our revenue components, see note 19 to our consolidated financial statements. For information regarding the results of operations of the VMO2 JV and the VodafoneZiggo JV, refer to Discussion and Analysis of our Consolidated Operating Results — Share of results of affiliates, net below.
The tables presented below in this section provide the details of the revenue and Adjusted EBITDA of our reportable segments for 2023, as compared to 2022. These tables present (i) the amounts reported for the current and comparative periods, (ii) the reported U.S. dollar change and percentage change from period to period and (iii) with respect to our consolidated reportable segments, the organic U.S. dollar change and percentage change from period to period. For our organic comparisons, which exclude the impact of FX, we assume that exchange rates remained constant at the prior-period rate during all periods presented. We also provide a table showing the Adjusted EBITDA margins of our reportable segments for 2023 and 2022 at the end of this section.
Most of our revenue is derived from jurisdictions that administer VAT or similar revenue-based taxes. Any increases in these taxes could have an adverse impact on our ability to maintain or increase our revenue to the extent that we are unable to pass such tax increases on to our customers. In the case of revenue-based taxes for which we are the ultimate taxpayer, we will also experience increases in our operating costs and expenses and corresponding declines in our Adjusted EBITDA and Adjusted EBITDA margins to the extent of any such tax increases.
II-6
We pay interconnection fees to other telephony providers when calls or text messages from our subscribers terminate on another network, and we receive similar fees from such providers when calls or text messages from their customers terminate on our networks or networks that we access through MVNO or other arrangements. The amounts we charge and incur with respect to fixed-line telephony and mobile interconnection fees are subject to regulatory oversight. To the extent that regulatory authorities introduce fixed-line or mobile termination rate changes, we would experience prospective changes and, in very limited cases, we could experience retroactive changes in our interconnect revenue and/or costs. The ultimate impact of any such changes in termination rates on our Adjusted EBITDA would be dependent on the call or text messaging patterns that are subject to the changed termination rates.
We are subject to inflationary pressures with respect to certain costs and foreign currency exchange risk with respect to costs and expenses that are denominated in currencies other than the respective functional currencies of our reportable segments. Any cost increases that we are not able to pass on to our subscribers through rate increases would result in increased pressure on our operating margins. For additional information regarding our foreign currency exchange risks see Quantitative and Qualitative Disclosures about Market Risk — Foreign Currency Risk below.
Consolidated Adjusted EBITDA is a non-GAAP measure, which we believe is a meaningful measure because it represents a transparent view of our recurring operating performance that is unaffected by our capital structure and allows management to readily view operating trends from a consolidated view. Investors should view consolidated Adjusted EBITDA as a supplement to, and not a substitute for, GAAP measures of performance included in our consolidated statements of operations.
The following table provides a reconciliation of earnings (loss) from continuing operations to Adjusted EBITDA:
| Year ended December 31, | |||||||||||||||||
| 2023 | 2022 | 2021 | |||||||||||||||
| in millions | |||||||||||||||||
| Earnings (loss) from continuing operations | $ | (3,873.8) | $ | 1,105.3 | $ | 13,527.5 | |||||||||||
| Income tax expense | 149.6 | 318.9 | 473.3 | ||||||||||||||
| Other income, net | (225.5) | (134.4) | (44.9) | ||||||||||||||
| Gain on AtlasEdge JV Transactions | — | — | (227.5) | ||||||||||||||
| Gain on U.K. JV Transaction | — | — | (10,873.8) | ||||||||||||||
| Gain on Telenet Tower Sale | — | (700.5) | — | ||||||||||||||
| Gain associated with the Telenet Wyre Transaction | (377.8) | — | — | ||||||||||||||
| Share of results of affiliates, net | 2,019.3 | 1,267.8 | 175.4 | ||||||||||||||
| Losses (gains) on debt extinguishment, net | 1.4 | (2.8) | 90.6 | ||||||||||||||
| Realized and unrealized losses (gains) due to changes in fair values of certain investments, net | 557.3 | 323.5 | (820.6) | ||||||||||||||
| Foreign currency transaction losses (gains), net | 70.8 | (1,407.2) | (1,324.5) | ||||||||||||||
| Realized and unrealized losses (gains) on derivative instruments, net | 526.3 | (1,213.1) | (537.3) | ||||||||||||||
| Interest expense | 907.9 | 589.3 | 882.1 | ||||||||||||||
| Operating income (loss) | (244.5) | 146.8 | 1,320.3 | ||||||||||||||
| Impairment, restructuring and other operating items, net | 67.9 | 85.1 | (19.0) | ||||||||||||||
| Depreciation and amortization | 2,315.2 | 2,171.4 | 2,353.7 | ||||||||||||||
| Share-based compensation expense | 231.0 | 192.1 | 308.1 | ||||||||||||||
| Adjusted EBITDA | $ | 2,369.6 | $ | 2,595.4 | $ | 3,963.1 | |||||||||||
II-7
Revenue of our Reportable Segments
General. While not specifically discussed in the below explanations of the changes in the revenue of our reportable segments, we are experiencing competition in all of our markets. This competition has an adverse impact on our ability to increase or maintain our total number of customers and/or our ARPU.
Variances in the subscription revenue that we receive from our customers are a function of (i) changes in the number of our fixed-line customers or mobile subscribers outstanding during the period and (ii) changes in ARPU. Changes in ARPU can be attributable to (a) changes in prices, (b) changes in bundling or promotional discounts, (c) changes in the tier of services selected, (d) variances in subscriber usage patterns and (e) the overall mix of fixed and mobile products within a segment during the period.
| Year ended December 31, | Increase (decrease) | Organic increase (decrease) | |||||||||||||||||||||||||||||||||
| 2023 | 2022 (a) | $ | % | $ | % | ||||||||||||||||||||||||||||||
| in millions, except percentages | |||||||||||||||||||||||||||||||||||
Sunrise | $ | 3,380.4 | $ | 3,180.9 | $ | 199.5 | 6.3 | $ | (10.1) | (0.3) | |||||||||||||||||||||||||
Telenet | 3,089.2 | 2,807.3 | 281.9 | 10.0 | 54.5 | 1.8 | |||||||||||||||||||||||||||||
VM Ireland | 506.1 | 494.7 | 11.4 | 2.3 | (2.0) | (0.4) | |||||||||||||||||||||||||||||
Central and Other | 775.7 | 959.9 | (184.2) | (19.2) | (135.5) | (14.1) | |||||||||||||||||||||||||||||
| Intersegment eliminations | (260.0) | (247.1) | (12.9) | N.M. | (12.9) | N.M. | |||||||||||||||||||||||||||||
| Total | $ | 7,491.4 | $ | 7,195.7 | $ | 295.7 | 4.1 | $ | (106.0) | (1.4) | |||||||||||||||||||||||||
VMO2 JV | $ | 13,574.1 | $ | 12,857.2 | $ | 716.9 | 5.6 | ||||||||||||||||||||||||||||
VodafoneZiggo JV | $ | 4,450.5 | $ | 4,284.6 | $ | 165.9 | 3.9 | ||||||||||||||||||||||||||||
_______________
N.M. — Not Meaningful.
(a)Amounts have been revised, as applicable, to reflect the retrospective impact of the Tech Framework, as further described in note 19 to our consolidated financial statements.
II-8
Sunrise. The details of the increase in Sunrise’s revenue during 2023, as compared to 2022, are set forth below:
| Subscription revenue | Non-subscription revenue | Total | |||||||||||||||
| in millions | |||||||||||||||||
| Decrease in residential fixed subscription revenue due to change in: | |||||||||||||||||
| Average number of customers | $ | (9.0) | $ | — | $ | (9.0) | |||||||||||
ARPU | (37.4) | — | (37.4) | ||||||||||||||
| Increase in residential fixed non-subscription revenue (a) | — | 29.1 | 29.1 | ||||||||||||||
| Total increase (decrease) in residential fixed revenue | (46.4) | 29.1 | (17.3) | ||||||||||||||
| Increase (decrease) in residential mobile revenue (b) | 23.4 | (17.1) | 6.3 | ||||||||||||||
Increase in B2B revenue | 4.4 | 3.3 | 7.7 | ||||||||||||||
| Decrease in other revenue | — | (6.8) | (6.8) | ||||||||||||||
| Total organic increase (decrease) | (18.6) | 8.5 | (10.1) | ||||||||||||||
| Impact of acquisitions | 10.1 | — | 10.1 | ||||||||||||||
Impact of FX | 142.8 | 56.7 | 199.5 | ||||||||||||||
| Total | $ | 134.3 | $ | 65.2 | $ | 199.5 | |||||||||||
(a)The increase in residential fixed non-subscription revenue is primarily attributable to higher revenue from equipment sales.
(b)The increase in residential mobile subscription revenue is primarily due to an increase in the average number of mobile subscribers. The decrease in residential mobile non-subscription revenue is primarily attributable to lower interconnect revenue.
II-9
Telenet. The details of the increase in Telenet’s revenue during 2023, as compared to 2022, are set forth below:
| Subscription revenue | Non-subscription revenue | Total | |||||||||||||||
| in millions | |||||||||||||||||
| Increase (decrease) in residential fixed subscription revenue due to change in: | |||||||||||||||||
| Average number of customers | $ | (35.7) | $ | — | $ | (35.7) | |||||||||||
ARPU | 44.3 | — | 44.3 | ||||||||||||||
| Decrease in residential fixed non-subscription revenue | — | (9.2) | (9.2) | ||||||||||||||
| Total increase (decrease) in residential fixed revenue | 8.6 | (9.2) | (0.6) | ||||||||||||||
| Increase in residential mobile revenue (a) | 16.4 | 0.7 | 17.1 | ||||||||||||||
Increase in B2B revenue (b) | 21.4 | 13.6 | 35.0 | ||||||||||||||
| Increase in other revenue | — | 3.0 | 3.0 | ||||||||||||||
| Total organic increase | 46.4 | 8.1 | 54.5 | ||||||||||||||
| Impact of acquisitions | 24.1 | 122.6 | 146.7 | ||||||||||||||
| Impact of dispositions | (0.1) | (1.5) | (1.6) | ||||||||||||||
Impact of FX | 57.8 | 24.5 | 82.3 | ||||||||||||||
| Total | $ | 128.2 | $ | 153.7 | $ | 281.9 | |||||||||||
_______________
(a)The increase in residential mobile subscription revenue is primarily attributable to higher ARPU.
(b)The increase in B2B subscription revenue is primarily due to an increase in the average number of customers. The increase in B2B non-subscription revenue is primarily attributable to higher revenue from wholesale services.
For information concerning certain regulatory developments that could have an adverse impact on our revenue at Telenet, see Legal and Regulatory Proceedings and Other Contingencies — Belgium Regulatory Developments in note 18 to our consolidated financial statements.
VM Ireland. The details of the increase in VM Ireland’s revenue during 2023, as compared to 2022, are set forth below:
| Subscription revenue | Non-subscription revenue | Total | |||||||||||||||
| in millions | |||||||||||||||||
| Increase (decrease) in residential fixed subscription revenue due to change in: | |||||||||||||||||
| Average number of customers | $ | (11.6) | $ | — | $ | (11.6) | |||||||||||
ARPU | 3.9 | — | 3.9 | ||||||||||||||
| Decrease in residential fixed non-subscription revenue | — | (0.7) | (0.7) | ||||||||||||||
| Total decrease in residential fixed revenue | (7.7) | (0.7) | (8.4) | ||||||||||||||
| Increase (decrease) in residential mobile revenue | 2.6 | (1.5) | 1.1 | ||||||||||||||
Increase (decrease) in B2B revenue | 0.8 | (0.5) | 0.3 | ||||||||||||||
| Increase in other revenue | — | 5.0 | 5.0 | ||||||||||||||
| Total organic increase (decrease) | (4.3) | 2.3 | (2.0) | ||||||||||||||
Impact of FX | 9.4 | 4.0 | 13.4 | ||||||||||||||
| Total | $ | 5.1 | $ | 6.3 | $ | 11.4 | |||||||||||
II-10
Programming and Other Direct Costs of Services, Other Operating Expenses and SG&A Expenses of our Consolidated Reportable Segments
For information regarding the changes in our (i) programming and other direct costs of services, (ii) other operating expenses and (iii) SG&A expenses, see Discussion and Analysis of our Consolidated Operating Results below.
Adjusted EBITDA of our Reportable Segments
Adjusted EBITDA is the primary measure used by our chief operating decision maker to evaluate segment operating performance. As presented below, consolidated Adjusted EBITDA is a non-GAAP measure, which investors should view as a supplement to, and not a substitute for, GAAP measures of performance included in our consolidated statements of operations. The following table sets forth the Adjusted EBITDA of our reportable segments.
| Year ended December 31, | Increase (decrease) | Organic decrease | |||||||||||||||||||||||||||||||||
| 2023 | 2022 (a) | $ | % | $ | % | ||||||||||||||||||||||||||||||
| in millions, except percentages | |||||||||||||||||||||||||||||||||||
Sunrise | $ | 1,148.5 | $ | 1,097.8 | $ | 50.7 | 4.6 | $ | (28.0) | (2.5) | |||||||||||||||||||||||||
Telenet | 1,315.2 | 1,299.6 | 15.6 | 1.2 | (6.1) | (0.5) | |||||||||||||||||||||||||||||
VM Ireland | 181.4 | 183.6 | (2.2) | (1.2) | (6.9) | (3.7) | |||||||||||||||||||||||||||||
Central and Other | (214.7) | 74.7 | (289.4) | N.M. | (238.0) | N.M. | |||||||||||||||||||||||||||||
| Intersegment eliminations | (60.8) | (60.3) | (0.5) | N.M. | (0.5) | N.M. | |||||||||||||||||||||||||||||
| Total | $ | 2,369.6 | $ | 2,595.4 | $ | (225.8) | (8.7) | $ | (279.5) | (10.8) | |||||||||||||||||||||||||
VMO2 JV | $ | 4,531.3 | $ | 4,562.2 | $ | (30.9) | (0.7) | ||||||||||||||||||||||||||||
VodafoneZiggo JV | $ | 1,972.5 | $ | 2,018.0 | $ | (45.5) | (2.3) | ||||||||||||||||||||||||||||
_______________
N.M. — Not Meaningful.
(a)Amounts have been revised, as applicable, to reflect the retrospective impact of the Tech Framework, as further described in note 19 to our consolidated financial statements.
Adjusted EBITDA Margin
The following table sets forth the Adjusted EBITDA margins (Adjusted EBITDA divided by revenue) of each of our reportable segments:
| Year ended December 31, | |||||||||||
| 2023 | 2022 (a) | ||||||||||
Sunrise | 34.0 | % | 34.5 | % | |||||||
Telenet | 42.6 | % | 46.3 | % | |||||||
VM Ireland | 35.8 | % | 37.1 | % | |||||||
VMO2 JV | 33.4 | % | 35.5 | % | |||||||
VodafoneZiggo JV | 44.3 | % | 47.1 | % | |||||||
_______________
(a)Amounts have been revised, as applicable, to reflect the retrospective impact of the Tech Framework, as further described in note 19 to our consolidated financial statements.
II-11
In addition to organic changes in the revenue, operating and SG&A expenses of our reportable segments, the Adjusted EBITDA margins presented above include the impact of acquisitions, as applicable. For discussion of the factors contributing to the changes in the Adjusted EBITDA margins of our consolidated reportable segments, see the analysis of our revenue included in Discussion and Analysis of our Reportable Segments above and the analysis of our expenses included in Discussion and Analysis of our Consolidated Operating Results below. For discussion of the factors contributing to the changes in the Adjusted EBITDA margins of the VMO2 JV and the VodafoneZiggo JV, see Discussion and Analysis of our Consolidated Operating Results — Share of results of affiliates, net below.
Discussion and Analysis of our Consolidated Operating Results
General
For more detailed explanations of the changes in our revenue, see Discussion and Analysis of our Reportable Segments above.
Revenue
Our revenue by major category is set forth below:
| Year ended December 31, | Increase (decrease) | Organic increase (decrease) | |||||||||||||||||||||||||||||||||
| 2023 | 2022 | $ | % | $ | % | ||||||||||||||||||||||||||||||
| in millions, except percentages | |||||||||||||||||||||||||||||||||||
| Residential revenue: | |||||||||||||||||||||||||||||||||||
| Residential fixed revenue (a): | |||||||||||||||||||||||||||||||||||
| Subscription revenue (b): | |||||||||||||||||||||||||||||||||||
| Broadband internet | $ | 1,491.0 | $ | 1,378.2 | $ | 112.8 | 8.2 | $ | 46.6 | 3.4 | |||||||||||||||||||||||||
| Video | 1,091.3 | 1,077.4 | 13.9 | 1.3 | (56.4) | (5.1) | |||||||||||||||||||||||||||||
| Fixed-line telephony | 359.6 | 381.4 | (21.8) | (5.7) | (35.3) | (9.3) | |||||||||||||||||||||||||||||
| Total subscription revenue | 2,941.9 | 2,837.0 | 104.9 | 3.7 | (45.1) | (1.6) | |||||||||||||||||||||||||||||
| Non-subscription revenue | 69.2 | 46.3 | 22.9 | 49.5 | 18.9 | 40.0 | |||||||||||||||||||||||||||||
| Total residential fixed revenue | 3,011.1 | 2,883.3 | 127.8 | 4.4 | (26.2) | (0.9) | |||||||||||||||||||||||||||||
| Residential mobile revenue (c): | |||||||||||||||||||||||||||||||||||
| Subscription revenue (b) | 1,519.3 | 1,401.4 | 117.9 | 8.4 | 42.4 | 3.0 | |||||||||||||||||||||||||||||
| Non-subscription revenue | 550.9 | 543.7 | 7.2 | 1.3 | (19.0) | (3.5) | |||||||||||||||||||||||||||||
| Total residential mobile revenue | 2,070.2 | 1,945.1 | 125.1 | 6.4 | 23.4 | 1.2 | |||||||||||||||||||||||||||||
| Total residential revenue | 5,081.3 | 4,828.4 | 252.9 | 5.2 | (2.8) | (0.1) | |||||||||||||||||||||||||||||
B2B revenue (d): | |||||||||||||||||||||||||||||||||||
| Subscription revenue | 561.7 | 515.1 | 46.6 | 9.0 | 26.7 | 5.2 | |||||||||||||||||||||||||||||
| Non-subscription revenue | 934.9 | 861.7 | 73.2 | 8.5 | 16.8 | 1.9 | |||||||||||||||||||||||||||||
Total B2B revenue | 1,496.6 | 1,376.8 | 119.8 | 8.7 | 43.5 | 3.1 | |||||||||||||||||||||||||||||
| Other revenue (e) | 913.5 | 990.5 | (77.0) | (7.8) | (146.7) | (13.4) | |||||||||||||||||||||||||||||
| Total | $ | 7,491.4 | $ | 7,195.7 | $ | 295.7 | 4.1 | $ | (106.0) | (1.4) | |||||||||||||||||||||||||
_______________
(a)Residential fixed subscription revenue includes amounts received from subscribers for ongoing services and the recognition of deferred installation revenue over the associated contract period. Residential fixed non-subscription revenue includes, among other items, channel carriage fees, late fees and revenue from the sale of equipment.
(b)Residential subscription revenue from subscribers who purchase bundled services at a discounted rate is generally allocated proportionally to each service based on the standalone price for each individual service. As a result, changes in the standalone pricing of our fixed and mobile products or the composition of bundles can contribute to changes in our product revenue categories from period to period.
II-12
(c)Residential mobile subscription revenue includes amounts received from subscribers for ongoing services. Residential mobile non-subscription revenue includes, among other items, interconnect revenue and revenue from sales of mobile handsets and other devices. Residential mobile interconnect revenue was $114.4 million and $140.0 million during 2023 and 2022, respectively.
(d)B2B subscription revenue represents revenue from (i) services provided to SOHO subscribers and (ii) mobile services provided to medium and large enterprises. SOHO subscribers pay a premium price to receive expanded service levels along with broadband internet, video, fixed-line telephony or mobile services that are the same or similar to the mass marketed products offered to our residential subscribers. A portion of the change in our B2B subscription revenue is attributable to the conversion of certain residential subscribers to SOHO subscribers. B2B non-subscription revenue includes (a) revenue from business broadband internet, video, fixed-line telephony and data services offered to medium and large enterprises and, fixed-line and mobile services on a wholesale basis, to other operators and (b) revenue from long-term leases of portions of our network.
(e)Other revenue includes, among other items, (i) broadcasting revenue at Telenet, VM Ireland and Sunrise, (ii) revenue earned from the U.K. JV Services and NL JV Services, (iii) revenue earned from the sale of CPE to the VodafoneZiggo JV and (iv) revenue earned from transitional and other services provided to various third parties.
Total revenue. Our consolidated revenue increased $295.7 million or 4.1% during 2023, as compared to 2022. This increase includes an increase of $156.7 million attributable to the impact of acquisitions. On an organic basis, our consolidated revenue decreased $106.0 million or 1.4%.
Residential revenue. The details of the increase in our consolidated residential revenue during 2023, as compared to 2022, are as follows (in millions):
| Increase (decrease) in residential fixed subscription revenue due to change in: | |||||
| Average number of customers | $ | (59.0) | |||
ARPU | 13.9 | ||||
| Increase in residential fixed non-subscription revenue | 18.9 | ||||
| Total decrease in residential fixed revenue | (26.2) | ||||
| Increase in residential mobile subscription revenue | 42.4 | ||||
| Decrease in residential mobile non-subscription revenue | (19.0) | ||||
| Total decrease in residential revenue | (2.8) | ||||
| Impact of acquisitions and dispositions | 34.9 | ||||
Impact of FX | 220.8 | ||||
| Total increase in residential revenue | $ | 252.9 | |||
On an organic basis, our consolidated residential fixed subscription revenue decreased $45.1 million or 1.6% during 2023, as compared to 2022, primarily attributable to a decrease at Sunrise.
On an organic basis, our consolidated residential fixed non-subscription revenue increased $18.9 million or 40.0% during 2023, as compared to 2022, primarily due to an increase at Sunrise.
On an organic basis, our consolidated residential mobile subscription revenue increased $42.4 million or 3.0% during 2023, as compared to 2022, primarily attributable to increases at Sunrise and Telenet.
On an organic basis, our consolidated residential mobile non-subscription revenue decreased $19.0 million or 3.5% during 2023, as compared to 2022, primarily due to a decrease at Sunrise.
B2B revenue. On an organic basis, our consolidated B2B subscription revenue increased $26.7 million or 5.2% during 2023, as compared to 2022, primarily due to an increase at Telenet.
On an organic basis, our consolidated B2B non-subscription revenue increased $16.8 million or 1.9% during 2023, as compared to 2022, primarily due to an increase at Telenet.
II-13
Other revenue. On an organic basis, our consolidated other revenue decreased $146.7 million or 13.4% during 2023, as compared to 2022, primarily attributable to (i) a decrease in revenue earned from the U.K. JV Services and NL JV Services and (ii) lower revenue earned from the sale of CPE to the VodafoneZiggo JV. For additional information regarding the decrease in revenue earned from the U.K. JV Services and NL JV Services, see note 19 to our consolidated financial statements.
Programming and other direct costs of services
Programming and other direct costs of services include programming and copyright costs, interconnect and access costs, costs of mobile handsets and other devices and other direct costs related to our operations, including costs associated with our transitional service agreements and certain costs related to the development of externally marketed software. Programming and copyright costs represent a significant portion of our operating costs and are subject to rise in future periods due to various factors, including (i) higher costs associated with the expansion of our digital video content, including rights associated with ancillary product offerings and rights that provide for the broadcast of live sporting events and (ii) rate increases.
The details of our programming and other direct costs of services are as follows:
| Year ended December 31, | Increase (decrease) | Organic increase (decrease) | |||||||||||||||||||||||||||||||||
| 2023 | 2022 (a) | $ | % | $ | % | ||||||||||||||||||||||||||||||
| in millions, except percentages | |||||||||||||||||||||||||||||||||||
Sunrise | $ | 1,100.6 | $ | 1,020.1 | $ | 80.5 | 7.9 | $ | 33.5 | 3.3 | |||||||||||||||||||||||||
Telenet | 789.1 | 657.9 | 131.2 | 19.9 | 5.4 | 0.7 | |||||||||||||||||||||||||||||
VM Ireland | 139.0 | 134.2 | 4.8 | 3.6 | 1.4 | 1.0 | |||||||||||||||||||||||||||||
Central and Other | 446.4 | 359.4 | 87.0 | 24.2 | 95.7 | 26.6 | |||||||||||||||||||||||||||||
| Intersegment eliminations | (90.4) | (85.9) | (4.5) | N.M. | (4.5) | N.M. | |||||||||||||||||||||||||||||
| Total | $ | 2,384.7 | $ | 2,085.7 | $ | 299.0 | 14.3 | $ | 131.5 | 6.1 | |||||||||||||||||||||||||
_______________
N.M. — Not Meaningful.
(a)Amounts have been revised, as applicable, to reflect the retrospective impact of the Tech Framework, as further described in note 19 to our consolidated financial statements.
Our programming and other direct costs of services increased $299.0 million or 14.3% during 2023, as compared to 2022. This increase includes an increase of $86.9 million attributable to the impact of acquisitions. On an organic basis, our programming and other direct costs of services increased $131.5 million or 6.1%. This increase includes the following factors:
•An increase of $96.9 million at Central and Other associated with the impact of our determination to market and sell certain of our internally-developed software to third parties, as further described in note 19 to our consolidated financial statements;
•A decrease in interconnect and access costs of $11.1 million or 4.0%, primarily due to the net effect of (i) lower interconnect and mobile roaming costs, primarily at Sunrise and Telenet, and (ii) higher lease and B2B data costs, primarily at Sunrise; and
•A decrease in costs of $10.3 million at Central and Other related to the sale of CPE to the VodafoneZiggo JV.
II-14
Other operating expenses
Other operating expenses include network operations, customer operations, customer care, share-based compensation and other costs related to our operations. We do not include share-based compensation in the following discussion and analysis of the other operating expenses of our consolidated reportable segments as share-based compensation expense is not included in the performance measures of our consolidated reportable segments. Share-based compensation expense is separately discussed further below.
The details of our other operating expenses are as follows:
| Year ended December 31, | Increase (decrease) | Organic increase (decrease) | |||||||||||||||||||||||||||||||||
| 2023 | 2022 (a) | $ | % | $ | % | ||||||||||||||||||||||||||||||
| in millions, except percentages | |||||||||||||||||||||||||||||||||||
Sunrise | $ | 497.6 | $ | 462.5 | $ | 35.1 | 7.6 | $ | 3.7 | 0.8 | |||||||||||||||||||||||||
Telenet | 512.8 | 441.9 | 70.9 | 16.0 | 23.3 | 4.9 | |||||||||||||||||||||||||||||
VM Ireland | 123.4 | 110.5 | 12.9 | 11.7 | 9.7 | 8.8 | |||||||||||||||||||||||||||||
Central and Other | 149.4 | 154.3 | (4.9) | (3.2) | (11.3) | (7.3) | |||||||||||||||||||||||||||||
| Intersegment eliminations | (87.8) | (85.9) | (1.9) | N.M. | (1.9) | N.M. | |||||||||||||||||||||||||||||
| Total other operating expenses excluding share-based compensation expense | 1,195.4 | 1,083.3 | 112.1 | 10.3 | $ | 23.5 | 2.1 | ||||||||||||||||||||||||||||
| Share-based compensation expense | 11.7 | 4.9 | 6.8 | 138.8 | |||||||||||||||||||||||||||||||
| Total | $ | 1,207.1 | $ | 1,088.2 | $ | 118.9 | 10.9 | ||||||||||||||||||||||||||||
_______________
N.M. — Not Meaningful.
(a)Amounts have been revised, as applicable, to reflect the retrospective impact of the Tech Framework, as further described in note 19 to our consolidated financial statements.
Our other operating expenses (exclusive of share-based compensation expense) increased $112.1 million or 10.3% during 2023, as compared to 2022. This increase includes an increase of $16.6 million attributable to the impact of acquisitions. On an organic basis, our other operating expenses increased $23.5 million or 2.1%. This increase includes the following factors:
•An increase in outsourced labor costs of $15.2 million or 17.0%, primarily associated with customer facing activities at Telenet and Sunrise;
•An increase in personnel costs of $14.0 million or 4.4%, primarily due to the net effect of (i) higher average costs per employee, primarily at Central and Other and Telenet, (ii) lower staffing levels, primarily at Central and Other, and (iii) higher costs due to lower capitalizable activities, primarily at Central and Other;
•A $11.2 million decrease in costs at Telenet associated with the one-time benefit from expected settlements of certain operational contingencies during the second quarter of 2023; and
•A decrease in other operating expenses due to $4.5 million recognized at Sunrise associated with the sale of certain handset receivables in the second quarter of 2022. The expense recognized represents the difference between the carrying amount of the associated receivables and the amount received pursuant to the sale.
SG&A expenses
SG&A expenses include human resources, information technology, general services, management, finance, legal, external sales and marketing costs, share-based compensation and other general expenses. We do not include share-based compensation in the following discussion and analysis of the SG&A expenses of our consolidated reportable segments as share-based compensation expense is not included in the performance measures of our consolidated reportable segments. Share-based compensation expense is separately discussed further below.
II-15
The details of our SG&A expenses are as follows:
| Year ended December 31, | Increase (decrease) | Organic increase (decrease) | |||||||||||||||||||||||||||||||||
| 2023 | 2022 (a) | $ | % | $ | % | ||||||||||||||||||||||||||||||
| in millions, except percentages | |||||||||||||||||||||||||||||||||||
Sunrise | $ | 633.7 | $ | 600.5 | $ | 33.2 | 5.5 | $ | (19.3) | (3.1) | |||||||||||||||||||||||||
Telenet | 472.1 | 407.9 | 64.2 | 15.7 | 31.9 | 7.5 | |||||||||||||||||||||||||||||
VM Ireland | 62.3 | 66.4 | (4.1) | (6.2) | (6.2) | (9.3) | |||||||||||||||||||||||||||||
Central and Other | 394.6 | 371.5 | 23.1 | 6.2 | 18.1 | 4.9 | |||||||||||||||||||||||||||||
| Intersegment eliminations | (21.0) | (15.0) | (6.0) | N.M. | (6.0) | N.M. | |||||||||||||||||||||||||||||
| Total SG&A expenses excluding share-based compensation expense | 1,541.7 | 1,431.3 | 110.4 | 7.7 | $ | 18.5 | 1.3 | ||||||||||||||||||||||||||||
| Share-based compensation expense | 219.3 | 187.2 | 32.1 | 17.1 | |||||||||||||||||||||||||||||||
| Total | $ | 1,761.0 | $ | 1,618.5 | $ | 142.5 | 8.8 | ||||||||||||||||||||||||||||
______________
N.M. — Not Meaningful.
(a)Amounts have been revised, as applicable, to reflect the retrospective impact of the Tech Framework, as further described in note 19 to our consolidated financial statements.
Supplemental SG&A expense information
| Year ended December 31, | Increase | Organic increase (decrease) | |||||||||||||||||||||||||||||||||
| 2023 | 2022 | $ | % | $ | % | ||||||||||||||||||||||||||||||
| in millions, except percentages | |||||||||||||||||||||||||||||||||||
| General and administrative (a) | $ | 1,198.1 | $ | 1,102.9 | $ | 95.2 | 8.6 | $ | 29.9 | 2.6 | |||||||||||||||||||||||||
| External sales and marketing | 343.6 | 328.4 | 15.2 | 4.6 | (11.4) | (3.4) | |||||||||||||||||||||||||||||
| Total | $ | 1,541.7 | $ | 1,431.3 | $ | 110.4 | 7.7 | $ | 18.5 | 1.3 | |||||||||||||||||||||||||
______________
(a)General and administrative expenses include all personnel-related costs within our SG&A expenses, including personnel-related costs associated with our sales and marketing function.
Our SG&A expenses (exclusive of share-based compensation expense) increased $110.4 million or 7.7% during 2023, as compared to 2022. This increase includes an increase of $32.1 million attributable to the impact of acquisitions. On an organic basis, our SG&A expenses increased $18.5 million or 1.3%. This increase includes the following factors:
•An increase in personnel costs of $33.6 million or 5.4%, primarily due to (i) higher average costs per employee, primarily at Telenet and Central and Other, and (ii) increases in incentive compensation costs at Sunrise and Central and Other;
•A decrease in external sales and marketing costs of $11.4 million or 3.4%, primarily due to the net effect of (i) lower costs associated with advertising campaigns, primarily at Sunrise and Telenet, and (ii) higher third-party sales commissions at Telenet and Sunrise; and
•An increase in business service costs of $8.9 million or 4.5%, primarily due to higher (i) consulting costs at Sunrise and (ii) travel and entertainment costs at Central and Other.
II-16
Share-based compensation expense
Our share-based compensation expense primarily relates to the share-based incentive awards issued by Liberty Global to its employees and employees of its subsidiaries. A summary of our aggregate share-based compensation expense is set forth below:
| Year ended December 31, | |||||||||||
| 2023 | 2022 | ||||||||||
| in millions | |||||||||||
Liberty Global: | |||||||||||
| Non-performance based incentive awards (a) | $ | 157.4 | $ | 133.5 | |||||||
| Performance-based incentive awards (b) | 6.9 | 7.1 | |||||||||
| Other (c) | 33.5 | 30.8 | |||||||||
Total Liberty Global (d) | 197.8 | 171.4 | |||||||||
| Telenet share-based incentive awards (e) | 27.7 | 10.9 | |||||||||
| Other | 5.5 | 9.8 | |||||||||
| Total | $ | 231.0 | $ | 192.1 | |||||||
| Included in: | |||||||||||
| Other operating expenses | $ | 11.7 | $ | 4.9 | |||||||
Total SG&A expenses | 219.3 | 187.2 | |||||||||
| Total | $ | 231.0 | $ | 192.1 | |||||||
_______________
(a)In April 2023, the compensation committee of our board of directors approved the extension of the expiration dates of outstanding SARs and director options granted in 2016 through 2018 from a seven-year term to a ten-year term (prior to 2019, awards granted under the 2014 Incentive Plans expired seven years after the grant date). Accordingly, the Black-Scholes fair values of the outstanding awards increased, resulting in the recognition of an aggregate incremental share-based compensation expense of $27.1 million during 2023.
(b)The 2023 amount includes share-based compensation expense related to certain Telenet Replacement Awards. The 2022 amount includes share-based compensation expense related to our 2019 Challenge Performance Awards.
(c)Represents annual incentive compensation and defined contribution plan liabilities that have been or are expected to be settled with Liberty Global common shares. In the case of the annual incentive compensation, shares have been or will be issued to senior management and key employees pursuant to a shareholding incentive program. The shareholding incentive program allows these employees to elect to receive up to 100% of their annual incentive compensation in common shares of Liberty Global in lieu of cash. In addition, amounts include compensation expense related to the Ventures Incentive Plans.
(d)In accordance with the terms of the Telenet Takeover Bid, we issued Telenet Replacement Awards to employees and former directors of Telenet in exchange for corresponding Telenet awards. In connection with the Telenet Takeover Bid, the Telenet Replacement Awards were remeasured as of October 13, 2023 in a 1:2 ratio between Liberty Global Class A and Liberty Global Class C shares. No incremental share-based compensation expense was recognized from the remeasurement and modification of the Telenet awards. The Telenet Replacement Awards were re-granted on November 7, 2023, resulting in total share-based compensation expense of $50.0 million, of which $8.5 million was recognized on this date due to the immediate vesting of select Telenet Replacement Awards. The remaining expense of $41.5 million will be amortized over the remaining service periods of the unvested Telenet Replacement Awards, subject to forfeitures and the satisfaction of performance conditions. For further information regarding the Telenet Takeover Bid, see note 14 to our consolidated financial statements.
(e)Represents the share-based compensation expense associated with Telenet’s share-based incentive awards prior to the Telenet Takeover Bid. In addition, €7.6 million ($8.2 million at the applicable rate) was expensed during the fourth quarter of 2023 related to the reimbursement of certain employee income taxes associated with the ESOP 2019 and the ESOP 2020.
II-17
For additional information concerning our share-based compensation, see note 15 to our consolidated financial statements.
Depreciation and amortization expense
Our depreciation and amortization expense was $2,315.2 million and $2,171.4 million during 2023 and 2022, respectively. Excluding the effects of FX, depreciation and amortization expense increased $52.5 million or 2.4% during 2023, as compared to 2022. This increase is primarily due to the net effect of (i) a decrease associated with certain assets becoming fully depreciated, primarily at Central and Other, Sunrise and Telenet, (ii) an increase associated with property and equipment additions related to the installation of CPE, the expansion and upgrade of our networks and other capital initiatives, primarily at Central and Other, Sunrise and Telenet, (iii) an increase associated with changes in the useful life of certain assets, primarily in Central and Other and Telenet, and (iv) an increase associated with acquisitions, primarily at Telenet and Sunrise. For additional information regarding our recent acquisitions, see note 5 to our consolidated financial statements.
Impairment, restructuring and other operating items, net
We recognized impairment, restructuring and other operating items, net, of $67.9 million and $85.1 million during 2023 and 2022, respectively.
The 2023 amount primarily includes (i) restructuring costs of $52.4 million, primarily at Sunrise, Telenet and VM Ireland, (ii) direct acquisition and disposition costs of $29.9 million, primarily at Telenet and Central and Other, (iii) a $21.4 million credit to abandoned lease expense, primarily at Sunrise, and (iv) a provision for legal contingencies of $10.0 million, primarily at Sunrise.
The 2022 amount primarily includes (i) a $39.6 million provision at Central and Other related to a legal contingency, (ii) abandoned lease expense of $20.2 million, primarily at Sunrise, and (iii) direct acquisition and disposition costs of $19.4 million, primarily at Telenet.
If, among other factors, the adverse impacts of economic, competitive, regulatory or other factors were to cause our results of operations or cash flows to be worse than anticipated, we could conclude in future periods that impairment charges are required in order to reduce the carrying values of our goodwill and, to a lesser extent, other long-lived assets. Any such impairment charges could be significant.
For additional information regarding our impairments, see Critical Accounting Policies, Judgments and Estimates — Impairment of Goodwill below.
Interest expense
We recognized interest expense of $907.9 million and $589.3 million during 2023 and 2022, respectively. Excluding the effects of FX, interest expense increased $292.3 million or 49.6% during 2023, as compared to 2022. This increase is primarily attributable to a higher weighted average interest rate and a higher average outstanding debt balance. For additional information regarding our outstanding indebtedness, see note 11 to our consolidated financial statements.
It is possible that the interest rates on (i) any new borrowings could be higher than the current interest rates on our existing indebtedness and (ii) our variable-rate indebtedness could increase in future periods. As further discussed in note 8 to our consolidated financial statements and under Qualitative and Quantitative Disclosures about Market Risk below, we use derivative instruments to manage our interest rate risks.
II-18
Realized and unrealized gains (losses) on derivative instruments, net
Our realized and unrealized gains or losses on derivative instruments include (i) unrealized changes in the fair values of our derivative instruments that are non-cash in nature until such time as the derivative contracts are fully or partially settled and (ii) realized gains or losses upon the full or partial settlement of the derivative contracts. The details of our realized and unrealized gains (losses) on derivative instruments, net, are as follows:
| Year ended December 31, | |||||||||||
| 2023 | 2022 | ||||||||||
| in millions | |||||||||||
| Cross-currency and interest rate derivative contracts (a) | $ | (785.4) | $ | 1,185.5 | |||||||
| Equity-related derivative instruments (b) | 258.5 | — | |||||||||
| Foreign currency forward and option contracts | 0.6 | 28.3 | |||||||||
| Other | — | (0.7) | |||||||||
| Total | $ | (526.3) | $ | 1,213.1 | |||||||
_______________
(a)The loss during 2023 is attributable to net losses associated with changes in (i) the relative value of certain currencies and (ii) certain market interest rates. In addition, the loss during 2023 includes a net gain of $36.9 million resulting from changes in our credit risk valuation adjustments. The gain during 2022 is attributable to net gains associated with changes in (a) certain market interest rates and (b) the relative value of certain currencies. In addition, the gain during 2022 includes a net loss of $16.6 million resulting from changes in our credit risk valuation adjustments.
(b)For information concerning the factors that impact the valuations of our equity-related derivative instruments, see note 9 to our consolidated financial statements.
For additional information concerning our derivative instruments, see note 8 to our consolidated financial statements and Quantitative and Qualitative Disclosures about Market Risk below.
Foreign currency transaction gains (losses), net
Our foreign currency transaction gains or losses primarily result from the remeasurement of monetary assets and liabilities that are denominated in currencies other than the underlying functional currency of the applicable entity. Unrealized foreign currency transaction gains or losses are computed based on period-end exchange rates and are non-cash in nature until such time as the amounts are settled. The details of our foreign currency transaction gains (losses), net, are as follows:
| Year ended December 31, | |||||||||||
| 2023 | 2022 | ||||||||||
| in millions | |||||||||||
| Intercompany balances denominated in a currency other than the entity’s functional currency (a) | $ | (325.1) | $ | 1,806.7 | |||||||
U.S. dollar denominated debt issued by euro functional currency entities | 249.0 | (476.7) | |||||||||
| Cash and restricted cash denominated in a currency other than the entity’s functional currency | 9.2 | 80.9 | |||||||||
| Other | (3.9) | (3.7) | |||||||||
| Total | $ | (70.8) | $ | 1,407.2 | |||||||
_______________
(a)Amounts primarily relate to (i) loans between certain of our non-operating subsidiaries in Europe and (ii) loans between certain of our non-operating and operating subsidiaries in Europe, which generally are denominated in the currency of the applicable operating subsidiary.
For information regarding how we manage our exposure to foreign currency risk, see Quantitative and Qualitative Disclosures about Market Risk — Foreign Currency Risk below.
II-19
Realized and unrealized gains (losses) due to changes in fair values of certain investments, net
Our realized and unrealized gains or losses due to changes in fair values of certain investments include unrealized gains or losses associated with changes in fair values that are non-cash in nature until such time as these gains or losses are realized through cash transactions. For additional information regarding our investments, fair value measurements, see notes 7 and 9, respectively, to our consolidated financial statements. The details of our realized and unrealized gains (losses) due to changes in fair values of certain investments, net, are as follows:
| Year ended December 31, | |||||||||||
| 2023 | 2022 | ||||||||||
| in millions | |||||||||||
Vodafone | $ | (362.4) | $ | — | |||||||
Lacework | (148.6) | (26.3) | |||||||||
EdgeConneX | 122.3 | 43.4 | |||||||||
Plume | (77.8) | (55.4) | |||||||||
ITV | (40.5) | (233.9) | |||||||||
Lionsgate | 32.9 | (69.2) | |||||||||
SMAs | (26.4) | (49.1) | |||||||||
Aviatrix | (22.7) | — | |||||||||
Televisa Univision | (9.9) | 23.1 | |||||||||
Pax8 | 1.3 | 79.3 | |||||||||
Skillz (a) | — | (34.7) | |||||||||
TiBiT (b) | — | 26.4 | |||||||||
| Other, net (c) | (25.5) | (27.1) | |||||||||
| Total | $ | (557.3) | $ | (323.5) | |||||||
_______________
(a)We completed the sale of our investment in Skillz during the first quarter of 2023.
(b)Our investment in TiBiT was sold during the fourth quarter of 2022.
(c)Includes gains of $8.0 million and $15.7 million, respectively, related to investments that were sold during the year.
Gains (losses) on debt extinguishment, net
We recognized net gains (losses) on debt extinguishment of ($1.4 million) and $2.8 million during 2023 and 2022, respectively.
The loss during 2023 is attributable to the write-off of unamortized deferred financing costs and discounts.
The gain during 2022 is attributable to the net effect of (i) a net gain associated with settlement discounts of $9.8 million, (ii) the write-off of $5.5 million of unamortized deferred financing costs and discounts and (iii) the payment of $1.5 million of third-party costs.
For additional information concerning our gains (losses) on debt extinguishment, net, see note 11 to our consolidated financial statements.
II-20
Share of results of affiliates, net
The following table sets forth the details of our share of results of affiliates, net:
| Year ended December 31, | |||||||||||
| 2023 | 2022 | ||||||||||
| in millions | |||||||||||
VMO2 JV (a) | $ | (1,723.1) | $ | (1,396.6) | |||||||
VodafoneZiggo JV (b) | (196.7) | 241.2 | |||||||||
nexfibre JV | (34.7) | 25.2 | |||||||||
AtlasEdge JV | (31.1) | (23.3) | |||||||||
Formula E | (19.4) | (20.2) | |||||||||
Streamz | (6.9) | (35.2) | |||||||||
All3Media | 4.0 | (10.0) | |||||||||
Eltrona | — | (34.2) | |||||||||
| Other | (11.4) | (14.7) | |||||||||
| Total | $ | (2,019.3) | $ | (1,267.8) | |||||||
_______________
(a)Represents (i) our 50% share of the results of operations of the VMO2 JV and (ii) 100% of the share-based compensation expense associated with Liberty Global awards granted to VMO2 JV employees who were formerly employees of Liberty Global prior to the VMO2 JV formation, as these awards remain our responsibility. The summarized results of operations of the VMO2 JV are set forth below:
| Year ended December 31, | |||||||||||
| 2023 | 2022 | ||||||||||
| in millions | |||||||||||
| Revenue | $ | 13,574.1 | $ | 12,857.2 | |||||||
Adjusted EBITDA | $ | 4,531.3 | $ | 4,562.2 | |||||||
| Operating loss (1) | $ | (2,274.5) | $ | (3,461.5) | |||||||
| Non-operating income (expense) (2) | $ | (1,454.3) | $ | 448.7 | |||||||
| Net loss | $ | (3,438.6) | $ | (3,042.0) | |||||||
_______________
(1)Includes depreciation and amortization expense of $3,693.5 million and $4,108.5 million, respectively.
(2)Includes interest expense of $1,505.1 million and $1,016.2 million, respectively. In addition, amounts include charges of £2.3 billion ($2.9 billion at the applicable rate) and £3.1 billion ($3.6 billion at the applicable rate), respectively, related to the VMO2 JV’s goodwill impairments, as described in note 7 to our consolidated financial statements.
The change in the VMO2 JV’s revenue during 2023, as compared to 2022, is primarily due to the net effect of (i) an increase in other revenue of $720 million due to low-margin construction revenue from the nexfibre JV, (ii) a decrease in residential fixed revenue and (iii) a one-time increase of $48 million in other revenue due to a change in the contract terms with a related-party supplier, with each revenue category as defined and reported by the VMO2 JV. The change in the VMO2 JV’s Adjusted EBITDA during 2023, as compared to 2022, is primarily due to the net effect of (a) the realization of synergies, (b) higher energy costs and (c) the net impact of (1) the aforementioned one-time revenue increase, (2) a $35 million benefit in 2022 due to the resolution of a legal matter and (3) a reduction in costs of $19 million in 2023 due to a change in the contract terms of services provided by a related-party. In addition, the reported revenue and Adjusted EBITDA amounts are impacted by FX.
II-21
(b)Represents (i) our 50% share of the results of operations of the VodafoneZiggo JV and (ii) interest income of $55.3 million and $53.8 million, respectively, representing 100% of the interest earned on the VodafoneZiggo JV Receivables. The summarized results of operations of the VodafoneZiggo JV are set forth below:
| Year ended December 31, | |||||||||||
| 2023 | 2022 | ||||||||||
| in millions | |||||||||||
| Revenue | $ | 4,450.5 | $ | 4,284.6 | |||||||
Adjusted EBITDA | $ | 1,972.5 | $ | 2,018.0 | |||||||
| Operating income (1) | $ | 250.5 | $ | 394.1 | |||||||
| Non-operating income (expense) (2) | $ | (865.1) | $ | 214.2 | |||||||
| Net earnings (loss) | $ | (510.0) | $ | 394.7 | |||||||
_______________
(1)Includes depreciation and amortization expense of $1,677.2 million and $1,610.7 million, respectively.
(2)Includes interest expense of $787.8 million and $606.4 million, respectively.
The change in the VodafoneZiggo JV’s revenue during 2023, as compared to 2022, is primarily due to (i) an increase in residential mobile revenue and (ii) higher B2B fixed revenue. The change in the VodafoneZiggo JV’s Adjusted EBITDA during 2023, as compared to 2022, is primarily due to inflation-related increases in energy and staff costs. In addition, the reported revenue and Adjusted EBITDA amounts are impacted by FX.
For additional information regarding our equity method investments, see note 7 to our consolidated financial statements.
Gain associated with the Telenet Wyre Transaction
In connection with the Telenet Wyre Transaction, we recognized a net gain of $377.8 million during 2023. For additional information, see note 5 to our consolidated financial statements.
Gain on Telenet Tower Sale
In connection with the Telenet Tower Sale, we recognized a pre-tax gain of $700.5 million during 2022. For additional information, see note 6 to our consolidated financial statements.
Gain on U.K. JV Transaction
In connection with the U.K. JV Transaction, we recognized a pre-tax gain of $10,873.8 million during 2021, net of the recognition of a cumulative foreign currency translation loss of $1,198.6 million. For additional information, see note 6 to our consolidated financial statements.
Gain on AtlasEdge JV Transactions
In connection with the AtlasEdge JV Transactions, we recognized a pre-tax gain of $227.5 million during 2021, net of the recognition of a cumulative foreign currency translation loss of $1.8 million. For additional information, see note 6 to our consolidated financial statements.
Other income, net
We recognized other income, net, of $225.5 million and $134.4 million during 2023 and 2022, respectively. These amounts include (i) interest and dividend income of $212.7 million and $76.6 million, respectively, and (ii) credits related to the non-service component of our net periodic pension costs of $12.1 million and $33.9 million, respectively.
II-22
Income tax expense
We recognized income tax expense of $149.6 million and $318.9 million during 2023 and 2022, respectively.
The income tax expense during 2023 differs from the expected income tax benefit of $875.2 million (based on the U.K. blended income tax rate of 23.5%), primarily due to the net negative impact of (i) certain permanent differences between the financial and tax accounting treatment of items associated with investments in subsidiaries and affiliates, (ii) a net increase in valuation allowances and (iii) non-deductible or non-taxable foreign currency exchange results.
The income tax expense during 2022 differs from the expected income tax expense of $270.6 million (based on the U.K. statutory income tax rate of 19.0%), primarily due to the net negative impact of (i) statutory rates in certain jurisdictions in which we operate that differ from the U.K. statutory income tax rate, (ii) certain permanent differences between the financial and tax accounting treatment of interest and other expenses and (iii) certain permanent differences between the financial and tax accounting treatment of items associated with investments in subsidiaries and affiliates. The negative impact of these items was partially offset by the net positive impact of non-deductible or non-taxable foreign currency exchange results.
For additional information concerning our income taxes, see note 13 to our consolidated financial statements.
Earnings (loss) from continuing operations
During 2023 and 2022, we reported earnings (loss) from continuing operations of ($3,873.8 million) and $1,105.3 million, respectively, consisting of (i) operating income (loss) of ($244.5 million) and $146.8 million, respectively, (ii) net non-operating income (expense) of ($3,479.7 million) and $1,277.4 million, respectively, and (iii) income tax expense of $149.6 million and $318.9 million, respectively.
Gains or losses associated with (i) changes in the fair values of derivative instruments, (ii) movements in foreign currency exchange rates and (iii) the disposition of assets and changes in ownership are subject to a high degree of volatility and, as such, any gains from these sources do not represent a reliable source of income. In the absence of significant gains in the future from these sources or from other non-operating items, our ability to achieve earnings is largely dependent on our ability to increase our aggregate operating income to a level that more than offsets the aggregate amount of our (a) interest expense, (b) other non-operating expenses and (c) income tax expense.
Due largely to the fact that we seek to maintain our debt at levels that provide for attractive equity returns, as discussed under Material Changes in Financial Condition — Capitalization below, we expect we will continue to report significant levels of interest expense for the foreseeable future. For information concerning our expectations with respect to trends that may affect certain aspects of our operating results in future periods, see the discussion under Overview above. For information concerning the reasons for changes in specific line items in our consolidated statements of operations, see Discussion and Analysis of our Reportable Segments and Discussion and Analysis of our Consolidated Operating Results above.
Earnings from discontinued operations, net of taxes
We reported earnings from discontinued operations, net of taxes, of $34.6 million during 2022 related to the results of UPC Poland. In addition, we recognized a gain on the sale of UPC Poland of $846.4 million during 2022, which includes a cumulative foreign currency translation gain of $10.9 million. For additional information, see note 6 to our consolidated financial statements.
Net earnings attributable to noncontrolling interests
Net earnings attributable to noncontrolling interests was $177.9 million and $513.1 million during 2023 and 2022, respectively, primarily attributable to the results of operations of Telenet prior to the Telenet Takeover Bid.
II-23
Liquidity and Capital Resources
Sources and Uses of Cash
We are a holding company that is dependent on the capital resources of our subsidiaries to satisfy our liquidity requirements at the corporate level. Each of our significant operating subsidiaries is separately financed within one of our three subsidiary “borrowing groups”. These borrowing groups include the respective restricted parent and subsidiary entities within Sunrise Holding, Telenet and VM Ireland. Although our borrowing groups typically generate cash from operating activities, the terms of the instruments governing the indebtedness of these borrowing groups may restrict our ability to access the liquidity of these subsidiaries. In addition, our ability to access the liquidity of these and other subsidiaries may be limited by tax and legal considerations, the presence of noncontrolling interests and other factors.
Cash, cash equivalents and SMAs
The details of the U.S. dollar equivalent balances of our consolidated cash and cash equivalents and investments held under SMAs at December 31, 2023 are set forth in the following table (in millions):
| Cash and cash equivalents held by: | |||||
Liberty Global and unrestricted subsidiaries: | |||||
Liberty Global (a) | $ | — | |||
| Unrestricted subsidiaries (b) | 498.6 | ||||
Total Liberty Global and unrestricted subsidiaries | 498.6 | ||||
| Borrowing groups (c): | |||||
Telenet | 910.0 | ||||
Sunrise Holding | 6.6 | ||||
VM Ireland | 0.7 | ||||
| Total borrowing groups | 917.3 | ||||
| Total cash and cash equivalents (d) | 1,415.9 | ||||
Investments held under SMAs (e) | 2,276.1 | ||||
Total cash and cash equivalents and investments held under SMAs | $ | 3,692.0 | |||
_______________
(a)Represents the amount held by Liberty Global on a standalone basis.
(b)Represents the aggregate amount held by subsidiaries that are outside of our borrowing groups.
(c)Represents the aggregate amounts held by the parent entity and restricted subsidiaries of our borrowing groups.
(d)The total cash and cash equivalents balance includes $960.7 million or 67.9% and $409.4 million or 28.9% denominated in euros and U.S. dollars, respectively.
(e)The balance of our investments held under SMAs is held by unrestricted subsidiaries of Liberty Global and denominated entirely in U.S. dollars.
For additional information regarding our cash and cash equivalents and investments held under SMAs, see the discussion under Quantitative and Qualitative Disclosures about Market Risk — Cash and Investments below.
Liquidity of Liberty Global and its unrestricted subsidiaries
Subject to certain tax and legal considerations, the $498.6 million of aggregate cash and cash equivalents held by unrestricted subsidiaries, together with the $2,276.1 million of investments held under SMAs, represented available liquidity at the corporate level at December 31, 2023. Our remaining cash and cash equivalents of $917.3 million at December 31, 2023 were held by our borrowing groups, as set forth in the table above. As noted above, various factors may limit our ability to access the cash of our borrowing groups. For information regarding certain limitations imposed by our subsidiaries’ debt instruments at December 31, 2023, see note 11 to our consolidated financial statements.
II-24
Our short-term sources of corporate liquidity include (i) cash and cash equivalents held by Liberty Global’s unrestricted subsidiaries, subject to certain tax and legal considerations, (ii) investments held under SMAs, (iii) interest and dividend income received on our and, subject to certain tax and legal considerations, our unrestricted subsidiaries’ cash and cash equivalents and investments, including dividend distributions received from the VMO2 JV or the VodafoneZiggo JV, (iv) cash received with respect to transitional and other services provided to various third parties and (v) interest payments received with respect to the VodafoneZiggo JV Receivables.
From time to time, Liberty Global and its unrestricted subsidiaries may also receive (i) proceeds in the form of dividend distributions or loan repayments from Liberty Global’s borrowing groups or affiliates (including amounts from the VMO2 JV or the VodafoneZiggo JV) upon (a) the completion of recapitalizations, refinancings, asset sales or similar transactions by these entities or (b) the accumulation of excess cash from operations or other means, (ii) proceeds upon the disposition of investments and other assets of Liberty Global and its unrestricted subsidiaries, such as the sale of UPC Poland, and (iii) proceeds in connection with the incurrence of debt by Liberty Global or its unrestricted subsidiaries or the issuance of equity securities by Liberty Global, including equity securities issued to satisfy subsidiary obligations. No assurance can be given that any external funding would be available to Liberty Global or its unrestricted subsidiaries on favorable terms, or at all.
At December 31, 2023, all of our consolidated cash and cash equivalents were held by entities that are domiciled outside of Bermuda. Based on our assessment of our ability to access the liquidity of our subsidiaries on a tax efficient basis and our expectations with respect to our corporate liquidity requirements, we do not anticipate that tax considerations will adversely impact our corporate liquidity over the next 12 months. Our ability to access the liquidity of our subsidiaries on a tax efficient basis is a consideration in assessing the extent of our share repurchase program.
In addition, the amount of cash we receive from our subsidiaries and affiliates to satisfy U.S. dollar-denominated liquidity requirements is impacted by fluctuations in exchange rates, particularly with regard to the translation of euros, British pound sterling and Swiss francs into U.S. dollars. In this regard, the strengthening (weakening) of the U.S. dollar against these currencies will result in decreases (increases) in the U.S. dollars received from the applicable subsidiaries to fund the repurchase of our equity securities and other U.S. dollar-denominated liquidity requirements.
Our short- and long-term liquidity requirements include (i) corporate general and administrative expenses, (ii) interest payments on the Vodafone Collar Loan and (iii) principal payments on the Vodafone Collar Loan to the extent not settled through the delivery of the underlying shares. In addition, Liberty Global and its unrestricted subsidiaries may require cash in connection with (a) the repayment of third-party and intercompany debt, (b) the satisfaction of contingent liabilities, (c) acquisitions, (d) the repurchase of equity and debt securities, (e) other investment opportunities, (f) any funding requirements of our subsidiaries and affiliates or (g) income tax payments.
During 2023, the aggregate amount of our share repurchases, including direct acquisition costs, was $1,505.9 million. For additional information regarding our share repurchase programs, see note 14 to our consolidated financial statements.
Liquidity of borrowing groups
The cash and cash equivalents of our borrowing groups are detailed in the table above. In addition to cash and cash equivalents, the primary sources of liquidity of our borrowing groups are cash provided by operations and borrowing availability under their respective debt instruments. For the details of the borrowing availability of our borrowing groups at December 31, 2023, see note 11 to our consolidated financial statements. The aforementioned sources of liquidity may be supplemented in certain cases by contributions and/or loans from Liberty Global and its unrestricted subsidiaries.
The liquidity of our borrowing groups generally is used to fund (i) property and equipment additions, (ii) debt service requirements and (iii) income tax payments, as well as to settle certain obligations that are not included on our December 31, 2023 consolidated balance sheet. In this regard, we have significant commitments related to (a) certain operating costs associated with our networks, (b) purchase obligations associated with CPE and certain service-related commitments and (c) programming, studio output and sports rights contracts. These obligations are expected to represent a significant liquidity requirement of our borrowing groups, a significant portion of which is due over the next 12 to 24 months. For additional information regarding our commitments, see note 18 to our consolidated financial statements.
From time to time, our borrowing groups may also require liquidity in connection with (i) acquisitions and other investment opportunities, (ii) loans to Liberty Global or its unrestricted subsidiaries, (iii) capital distributions to Liberty Global and other equity owners or (iv) the satisfaction of contingent liabilities. No assurance can be given that any external funding would be available to our borrowing groups on favorable terms, or at all.
II-25
For additional information regarding our consolidated cash flows, see the discussion under Consolidated Statements of Cash Flows below.
Capitalization
We seek to maintain our debt at levels that provide for attractive equity returns without assuming undue risk. In this regard, we generally seek to cause our operating subsidiaries to maintain their debt at levels that result in a consolidated debt balance (excluding the Vodafone Collar Loan and measured using subsidiary debt figures at swapped foreign currency exchange rates, consistent with the covenant calculation requirements of our subsidiary debt agreements) that is between four and five times our consolidated Adjusted EBITDA, although the timing of our acquisitions and financing transactions and the interplay of average and spot foreign currency rates may impact this ratio. Consolidated Adjusted EBITDA is a non-GAAP measure, which investors should view as a supplement to, and not a substitute for, GAAP measures of performance included in our consolidated statements of operations.
Our ability to service or refinance our debt and to maintain compliance with the leverage covenants in the credit agreements and indentures of our borrowing groups is dependent primarily on our ability to maintain or increase the Adjusted EBITDA of our operating subsidiaries and to achieve adequate returns on our property and equipment additions and acquisitions. In addition, our ability to obtain additional debt financing is limited by the incurrence-based leverage covenants contained in the various debt instruments of our borrowing groups. For example, if the Adjusted EBITDA of one of our borrowing groups were to decline, our ability to obtain additional debt could be limited. Under our credit facilities and senior and senior secured notes there is no cross-default risk between subsidiary borrowing groups in the event that one or more of our borrowing groups were to experience significant declines in their Adjusted EBITDA to the extent they were no longer able to service their debt obligations. Any mandatory prepayment events or events of default that may occur would only impact the relevant borrowing group in which these events occur and do not allow for any recourse to other borrowing groups or Liberty Global Ltd. Our credit facilities and senior and senior secured notes require that certain members of the relevant borrowing group guarantee the payment of all sums payable thereunder and such group members are required to grant first-ranking security over their shares or, in certain borrowing groups, over substantially all of their assets to secure the payment of all sums payable thereunder. At December 31, 2023, each of our borrowing groups was in compliance with its debt covenants. In addition, we do not anticipate any instances of non-compliance with respect to the debt covenants of our borrowing groups that would have a material adverse impact on our liquidity during the next 12 months.
At December 31, 2023, the outstanding principal amount of our consolidated debt, together with our finance lease obligations, aggregated $15.9 billion, including $0.8 billion that is classified as current on our consolidated balance sheet and $7.5 billion that is not due until 2029 or thereafter. All of our consolidated debt and finance lease obligations have been borrowed or incurred by our subsidiaries at December 31, 2023.
We believe we have sufficient resources to repay or refinance the current portion of our debt and finance lease obligations and to fund our foreseeable liquidity requirements during the next 12 months. However, as our maturing debt grows in later years, we anticipate we will seek to refinance or otherwise extend our debt maturities. No assurance can be given that we will be able to complete these refinancing transactions or otherwise extend our debt maturities. In this regard, it is not possible to predict how political and economic conditions, sovereign debt concerns or any adverse regulatory developments could impact the credit and equity markets we access and, accordingly, our future liquidity and financial position. Our ability to access debt financing on favorable terms, or at all, could be adversely impacted by (i) the financial failure of any of our counterparties, which could (a) reduce amounts available under committed credit facilities and (b) adversely impact our ability to access cash deposited with any failed financial institution, and (ii) tightening of the credit markets. In addition, any weakness in the equity markets could make it less attractive to use our shares to satisfy contingent or other obligations, and sustained or increased competition, particularly in combination with adverse economic or regulatory developments, could have an unfavorable impact on our cash flows and liquidity.
For additional information concerning our debt and finance lease obligations, see notes 11 and 12, respectively, to our consolidated financial statements.
II-26
Consolidated Statements of Cash Flows
General. Our cash flows are subject to significant variations due to FX. See related discussion under Quantitative and Qualitative Disclosures about Market Risk — Foreign Currency Risk below.
Summary. The 2023 and 2022 consolidated statements of cash flows of our continuing operations are summarized as follows:
| Year ended December 31, | |||||||||||||||||
| 2023 | 2022 | Change | |||||||||||||||
| in millions | |||||||||||||||||
| Net cash provided by operating activities | $ | 2,165.9 | $ | 2,786.7 | $ | (620.8) | |||||||||||
| Net cash provided (used) by investing activities | (1,845.0) | 1,296.6 | (3,141.6) | ||||||||||||||
| Net cash used by financing activities | (692.4) | (3,273.4) | 2,581.0 | ||||||||||||||
| Effect of exchange rate changes on cash and cash equivalents and restricted cash | 62.0 | (27.7) | 89.7 | ||||||||||||||
| Net increase (decrease) in cash and cash equivalents and restricted cash | $ | (309.5) | $ | 782.2 | $ | (1,091.7) | |||||||||||
Operating Activities. The decrease in net cash provided by our operating activities is primarily attributable to the net effect of (i) a decrease in cash provided due to higher payments for taxes, including $315.0 million related to a payment of disputed tax associated with a tax litigation matter (see note 13 to our consolidated financial statements), (ii) a decrease in cash provided due to higher payments of interest, (iii) an increase in cash provided due to higher net cash receipts related to derivative instruments, (iv) a decrease in cash provided by our Adjusted EBITDA and related working capital items, which includes a decrease in cash of $113.7 million (at the applicable rate) in connection with the sale of certain handset receivables in Switzerland during 2022, (v) a decrease in cash provided of $183.4 million due to lower dividend distributions from the VodafoneZiggo JV and the VMO2 JV, (vi) an increase in cash provided due to higher receipts of interest and (vii) an increase due to FX. Consolidated Adjusted EBITDA is a non-GAAP measure, which investors should view as a supplement to, and not a substitute for, GAAP measures of performance included in our consolidated statements of operations.
Investing Activities. The change in net cash provided (used) by our investing activities is primarily attributable to (i) a decrease in cash of $1,553.3 million in connection with the sale of UPC Poland during 2022, (ii) a decrease in cash of $921.8 million associated with higher net cash paid for investments, primarily related to the net effect of our investment in Vodafone and our investments held under SMAs, (iii) a decrease in cash of $779.9 million in connection with the Telenet Tower Sale during 2022, (iv) an increase in cash of $337.3 million due to higher dividend distributions received from the VMO2 JV and (v) a decrease in cash of $117.3 million associated with higher net cash paid for acquisitions.
II-27
The capital expenditures we report in our consolidated statements of cash flows do not include amounts that are financed under capital-related vendor financing or finance lease arrangements. Instead, these amounts are reflected as non-cash additions to our property and equipment when the underlying assets are delivered and as repayments of debt when the principal is repaid. In this discussion, we refer to (i) our capital expenditures as reported in our consolidated statements of cash flows, which exclude amounts financed under capital-related vendor financing or finance lease arrangements, and (ii) our total property and equipment additions, which include our capital expenditures on an accrual basis and amounts financed under capital-related vendor financing or finance lease arrangements. For further details regarding our property and equipment additions, see note 19 to our consolidated financial statements. A reconciliation of our consolidated property and equipment additions to our consolidated capital expenditures, as reported in our consolidated statements of cash flows, is set forth below:
| Year ended December 31, | |||||||||||
| 2023 | 2022 | ||||||||||
| in millions | |||||||||||
| Property and equipment additions | $ | 1,578.0 | $ | 1,588.9 | |||||||
Assets acquired under capital-related vendor financing arrangements | (178.4) | (182.8) | |||||||||
| Assets acquired under finance leases | (20.9) | (34.2) | |||||||||
Changes in current liabilities related to capital expenditures | 7.3 | (68.7) | |||||||||
| Capital expenditures, net | $ | 1,386.0 | $ | 1,303.2 | |||||||
The decrease in our property and equipment additions during 2023, as compared to 2022, is primarily due to the net effect of (i) a decrease in local currency expenditures of our subsidiaries due to the net effect of (a) a decrease in expenditures to support new customer products and operational efficiency initiatives, (b) an increase in expenditures for new build and upgrade projects, (c) a decrease in baseline expenditures, including network improvements and expenditures for property and facilities and information technology systems, and (d) an increase in expenditures for the purchase and installation of CPE and (ii) an increase due to FX. During 2023 and 2022, our property and equipment additions represented 21.1% and 22.1% of revenue, respectively.
We expect our 2024 property and equipment additions to remain relatively stable as compared to our 2023 property and equipment additions. The actual amount of our 2024 property and equipment additions may vary from our expectations for a variety of reasons, including (i) changes in (a) the competitive or regulatory environment, (b) business plans, (c) our expected future operating results or (d) foreign currency exchange rates and (ii) the availability of sufficient capital. Accordingly, no assurance can be given that our actual property and equipment additions will not vary materially from our expectations.
Financing Activities. The decrease in net cash used by our financing activities is primarily attributable to the net effect of (i) a decrease in cash used of $3,137.8 million due to higher net borrowings of debt, including borrowings related to the Vodafone Collar Loan, (ii) an increase in cash used of $985.7 million due to the acquisition of shares in connection with the Telenet Takeover Bid and (iii) a decrease in cash used of $208.7 million due to lower repurchases of Liberty Global common shares.
II-28
Adjusted Free Cash Flow
We define adjusted free cash flow as net cash provided by the operating activities of our continuing operations, plus operating-related vendor financed expenses (which represents an increase in the period to our actual cash available as a result of extending vendor payment terms beyond normal payment terms, which are typically 90 days or less, through non-cash financing activities), less (i) cash payments in the period for capital expenditures, (ii) principal payments on operating- and capital-related amounts financed by vendors and intermediaries (which represents a decrease in the period to our actual cash available as a result of paying amounts to vendors and intermediaries where we previously had extended vendor payments beyond the normal payment terms) and (iii) principal payments on finance leases (which represents a decrease in the period to our actual cash available), each as reported in our consolidated statements of cash flows with each item excluding any cash provided or used by our discontinued operations. Net cash provided by operating activities of our continuing operations includes cash paid for third-party costs directly associated with successful and unsuccessful acquisitions and dispositions of $27.7 million and $36.2 million during 2023 and 2022, respectively.
We believe our presentation of adjusted free cash flow, which is a non-GAAP measure, provides useful information to our investors because this measure can be used to gauge our ability to (i) service debt and (ii) fund new investment opportunities after consideration of all actual cash payments related to our working capital activities and expenses that are capital in nature whether paid inside normal vendor payment terms or paid later outside normal vendor payment terms (in which case we typically pay in less than 365 days). Adjusted free cash flow should not be understood to represent our ability to fund discretionary amounts, as we have various mandatory and contractual obligations, including debt repayments, that are not deducted to arrive at these amounts. Investors should view adjusted free cash flow as a supplement to, and not a substitute for, GAAP measures of liquidity included in our consolidated statements of cash flows. Further, our adjusted free cash flow may differ from how other companies define and apply their definition of adjusted free cash flow.
The following table provides the details of our adjusted free cash flow:
| Year ended December 31, | |||||||||||
| 2023 | 2022 | ||||||||||
| in millions | |||||||||||
| Net cash provided by operating activities of our continuing operations | $ | 2,165.9 | $ | 2,786.7 | |||||||
| Operating-related vendor financing additions (a) | 648.5 | 522.7 | |||||||||
| Cash capital expenditures, net | (1,386.0) | (1,303.2) | |||||||||
| Principal payments on operating-related vendor financing | (568.8) | (616.1) | |||||||||
| Principal payments on capital-related vendor financing | (256.1) | (210.1) | |||||||||
| Principal payments on finance leases | (27.9) | (62.0) | |||||||||
| Adjusted free cash flow | $ | 575.6 | $ | 1,118.0 | |||||||
_______________
(a)For purposes of our consolidated statements of cash flows, operating-related vendor financing additions represent operating-related expenses financed by an intermediary that are treated as constructive operating cash outflows and constructive financing cash inflows when the intermediary settles the liability with the vendor. When we pay the financing intermediary, we record financing cash outflows in our consolidated statements of cash flows. For purposes of our adjusted free cash flow definition, we (i) add in the constructive financing cash inflow when the intermediary settles the liability with the vendor as our actual net cash available at that time is not affected and (ii) subsequently deduct the related financing cash outflow when we actually pay the financing intermediary, reflecting the actual reduction to our cash available to service debt or fund new investment opportunities.
II-29
Critical Accounting Policies, Judgments and Estimates
In connection with the preparation of our consolidated financial statements, we make estimates and assumptions that affect the reported amounts of assets and liabilities, revenue and expenses and related disclosure of contingent assets and liabilities. Critical accounting policies are defined as those policies that are reflective of significant judgments, estimates and uncertainties, which would potentially result in materially different results under different assumptions and conditions. We believe the following accounting policies are critical in the preparation of our consolidated financial statements because of the judgment necessary to account for these matters and the significant estimates involved, which are susceptible to change:
•Impairment of goodwill;
•Costs associated with the capitalization of property and equipment;
•Fair value measurements; and
•Income tax accounting.
We have discussed the selection of the aforementioned critical accounting policies with the audit committee of our board of directors. For additional information concerning our significant accounting policies, see note 3 to our consolidated financial statements.
Impairment of Goodwill
Carrying Value. The aggregate carrying value of our goodwill comprised 24.9% of our total assets at December 31, 2023.
We evaluate goodwill for impairment at least annually on October 1 and whenever facts and circumstances indicate that a reporting unit’s carrying amount may not be recoverable. For impairment evaluations, we first make a qualitative assessment to determine if the goodwill may be impaired. If it is more-likely-than-not that a reporting unit’s fair value is less than its carrying value, we then compare the fair value of the reporting unit to its respective carrying amount. Any excess of the carrying amount over the fair value would be charged to operations as an impairment loss. A reporting unit is an operating segment or one level below an operating segment (referred to as a “component”).
When required, considerable management judgment may be necessary to estimate the fair value of reporting units. We determine fair value using an income-based approach (discounted cash flows) based on assumptions in our long-range business plans or a market-based approach (current multiples of comparable public companies and guideline transactions) and, in some cases, a combination of an income-based approach and a market-based approach. With respect to our discounted cash flow analysis used in the income-based approach, the timing and amount of future cash flows under these business plans require estimates of, among other items, subscriber growth and retention rates, rates charged per product, expected gross margins and Adjusted EBITDA margins and expected property and equipment additions. The development of these cash flows, and the discount rate applied to the cash flows, is subject to inherent uncertainties, and actual results could vary significantly from such estimates. Our determination of the discount rate is based on a weighted average cost of capital approach, which uses a market participant’s cost of equity and after-tax cost of debt and reflects the risks inherent in the cash flows. Based on the results of our 2023 qualitative assessment of our reporting unit carrying values, we determined that it was more-likely-than-not that fair value exceeded carrying value for all of our reporting units.
During the three years ended December 31, 2023, we did not record any significant impairment charges with respect to our goodwill. For additional information regarding our goodwill, see note 10 to our consolidated financial statements.
If, among other factors, the adverse impacts of economic, competitive, regulatory or other factors were to cause our results of operations or cash flows to be worse than anticipated, we could conclude in future periods that impairment charges are required in order to reduce the carrying values of our goodwill. Any such impairment charges could be significant.
Costs Associated with the Capitalization of Property and Equipment
We capitalize costs associated with the construction of new, or upgrades to existing, fixed and mobile transmission and distribution facilities, the installation of new fixed-line services and the development of internal-use software. Installation activities that are capitalized include (i) the initial connection (or drop) from our fixed-line system to a customer location, (ii) the replacement of a drop and (iii) the installation of equipment for new, or upgrades to existing, fixed-line services. The costs of other customer-facing activities, such as reconnecting customer locations where a drop already exists, disconnecting customer locations and repairing or maintaining drops, are expensed as incurred. We capitalize internal and external costs
II-30
directly associated with the development of internal-use software. Costs related to the development of entertainment- and connectivity-related software that we externally market, or plan to externally market, to third parties are expensed as incurred, as the time period between technological feasibility and product launch is generally limited in duration and the associated costs during said time period are not significant.
We make judgments regarding the construction, upgrade and installation activities to be capitalized and the development of internal-use software. In addition to direct external and internal labor and materials, we also capitalize other costs directly attributable to our construction and installation activities, including dispatch costs, quality-control costs, vehicle-related costs and certain warehouse-related costs. The capitalization of these costs is based on time sheets, standard costs, call tracking systems and other verifiable means that directly link the costs incurred with the applicable capitalizable activity. We continuously monitor the appropriateness of our capitalization policies and update the policies when necessary to respond to changes in facts and circumstances, such as the development of new products and services and changes in the manner that installations, construction or upgrade activities or the development of internal-use software are performed.
Fair Value Measurements
GAAP provides guidance with respect to the recurring and nonrecurring fair value measurements and for a fair value hierarchy that prioritizes the inputs to valuation techniques used to measure fair value into three broad levels. Level 1 inputs are quoted market prices in active markets for identical assets or liabilities that the reporting entity has the ability to access at the measurement date. Level 2 inputs are inputs other than quoted market prices included within Level 1 that are observable for the asset or liability, either directly or indirectly. Level 3 inputs are unobservable inputs for the asset or liability.
Recurring Valuations. We perform recurring fair value measurements with respect to our derivative instruments and our fair value method investments. We use (i) cash flow valuation models to determine the fair values of our interest rate and foreign currency derivative instruments and (ii) a Black-Scholes option pricing model to determine the fair values of our equity-related derivative instruments. We use quoted market prices when available and, when not available, we use a combination of an income approach (discounted cash flows) and a market approach (market multiples of similar businesses) to determine the fair value of our fair value method investments. For a detailed discussion of the inputs we use to determine the fair value of our derivative instruments and fair value method investments, see note 9 to our consolidated financial statements. See also notes 7 and 8 to our consolidated financial statements for information concerning our fair value method investments and derivative instruments, respectively.
Changes in the fair values of our derivative instruments and fair value method investments have had, and we believe will continue to have, a significant and volatile impact on our results of operations. During 2023, 2022 and 2021, we recognized net gains (losses) of ($1,083.6 million), $889.6 million and $1,357.9 million, respectively, attributable to changes in the fair values of these items.
As further described in note 9 to our consolidated financial statements, actual amounts received or paid upon the settlement or disposition of these investments and instruments may differ materially from the recorded fair values at December 31, 2023.
For information concerning the sensitivity of the fair value of certain of our more significant derivative instruments to changes in market conditions, see Quantitative and Qualitative Disclosures About Market Risk — Sensitivity Information below.
Nonrecurring Valuations. Our nonrecurring valuations are primarily associated with (i) the application of acquisition accounting, (ii) impairment assessments and (iii) the accounting for our initial investment in significant joint ventures, each of which require that we make fair value determinations as of the applicable valuation date. In making these determinations, we are required to make estimates and assumptions that affect the recorded amounts, including, but not limited to, expected future cash flows, market comparables and discount rates, remaining useful lives of long-lived assets, replacement or reproduction costs of property and equipment and the amounts to be recovered in future periods from acquired net operating losses and other deferred tax assets. To assist us in making these fair value determinations, we may engage third-party valuation specialists. Our estimates in this area impact, among other items, the amount of depreciation and amortization, impairment charges and income tax expense or benefit that we report. Our estimates of fair value are based upon assumptions we believe to be reasonable, but which are inherently uncertain. A significant portion of our long-lived assets were initially recorded through the application of acquisition accounting and all of our long-lived assets are subject to impairment assessments. For additional information, see note 9 to our consolidated financial statements. For information regarding our acquisitions and long-lived assets, see notes 5 and 10 to our consolidated financial statements, respectively.
II-31
Income Tax Accounting
We are required to estimate the amount of tax payable or refundable for the current year and the deferred tax assets and liabilities for the future tax consequences attributable to differences between the financial statement carrying amounts and income tax basis of assets and liabilities and the expected benefits of utilizing net operating loss and tax credit carryforwards, using enacted tax rates in effect for each taxing jurisdiction in which we operate for the year in which those temporary differences are expected to be recovered or settled. This process requires our management to make assessments regarding the timing and probability of the ultimate tax impact of such items.
Net deferred tax assets are reduced by a valuation allowance if we believe that it is more-likely-than-not such net deferred tax assets will not be realized. Establishing or reducing a tax valuation allowance requires us to make assessments about the timing of future events, including the probability of expected future taxable income and available tax planning strategies. At December 31, 2023, the aggregate valuation allowance provided against deferred tax assets was $1,899.6 million. The actual amount of deferred income tax benefits realized in future periods will likely differ from the net deferred tax assets reflected in our December 31, 2023 consolidated balance sheet due to, among other factors, possible future changes in income tax law, or interpretations thereof, in the jurisdictions in which we operate and differences between estimated and actual future taxable income. Any such factors could have a material effect on our current and deferred tax positions as reported in our consolidated financial statements. A high degree of judgment is required to assess the impact of possible future outcomes on our current and deferred tax positions.
Tax laws in jurisdictions in which we have a presence are subject to varied interpretation, and many tax positions we take are subject to significant uncertainty regarding whether the position will be ultimately sustained after review by the relevant tax authority. We recognize the financial statement effects of a tax position when it is more-likely-than-not, based on technical merits, that the position will be sustained upon examination. The determination of whether the tax position meets the more-likely-than-not threshold requires a facts-based judgment using all information available. In a number of cases, we have concluded that the more-likely-than-not threshold is not met and, accordingly, the amount of tax benefit recognized in our consolidated financial statements is different than the amount taken or expected to be taken in our tax returns. As of December 31, 2023, the amount of unrecognized tax benefits for financial reporting purposes, but taken or expected to be taken in our tax returns, was $444.4 million, of which $347.0 million would have a favorable impact on our effective income tax rate if ultimately recognized, after considering amounts that we would expect to be offset by valuation allowances.
We are required to continually assess our tax positions, and the results of tax examinations or changes in judgment can result in substantial changes to our unrecognized tax benefits.
II-32
Item 7A. QUANTITATIVE AND QUALITATIVE DISCLOSURES ABOUT MARKET RISK
We are exposed to market risk in the normal course of our business operations due to our investments in various foreign countries and ongoing investing and financing activities. Market risk refers to the risk of loss arising from adverse changes in foreign currency exchange rates, interest rates and stock prices. The risk of loss can be assessed from the perspective of adverse changes in fair values, cash flows and future earnings. As further described below, we have established policies, procedures and processes governing our management of market risks and the use of derivative instruments to manage our exposure to such risks.
Cash and Investments
We invest our cash in highly liquid instruments that meet high credit quality standards. We are exposed to exchange rate risk to the extent that the denominations of our cash and cash equivalent balances, revolving lines of credit and other short-term sources of liquidity do not correspond to the denominations of our and our subsidiaries’ short-term liquidity requirements. In order to mitigate this risk, we actively manage the denominations of our cash balances in light of our and our subsidiaries’ forecasted liquidity requirements. At December 31, 2023 and 2022, our consolidated cash balances included $960.7 million or 67.9% and $1,307.9 million or 75.8%, respectively, denominated in euros and $409.4 million or 28.9% and $347.2 million or 20.1%, respectively, denominated in U.S. dollars. At December 31, 2023 and 2022, the balances of our consolidated investments held under SMAs of $2,276.1 million and $2,854.6 million, respectively, were denominated entirely in U.S. dollars.
We are exposed to market price fluctuations related to our investment in Vodafone shares, which had an aggregate value of $1,168.1 million at December 31, 2023. All of our Vodafone shares are held through the Vodafone Collar. For information regarding the terms of the Vodafone Collar and Vodafone Collar Loan, see note 8 to our consolidated financial statements. Our exposure to market risk is limited for the shares held through the Vodafone Collar. For additional information regarding our investment in Vodafone shares, see note 7 to our consolidated financials statements.
Foreign Currency Risk
We are exposed to foreign currency exchange rate risk with respect to our consolidated debt in situations where our debt is denominated in a currency other than the functional currency of the operations whose cash flows support our ability to repay or refinance such debt. Although we generally match the denomination of our and our subsidiaries’ borrowings with the functional currency of the operations that are supporting the respective borrowings, market conditions or other factors may cause us to enter into borrowing arrangements that are not denominated in the functional currency of the underlying operations (unmatched debt). In these cases, our policy is to provide for an economic hedge against foreign currency exchange rate movements by using derivative instruments to synthetically convert unmatched debt into the applicable underlying currency. At December 31, 2023, substantially all of our debt was either directly or synthetically matched to the applicable functional currencies of the underlying operations. For additional information concerning the terms of our derivative instruments, see note 8 to our consolidated financial statements.
In addition to the exposure that results from the mismatch of our borrowings and underlying functional currencies, we are exposed to foreign currency risk to the extent that we enter into transactions denominated in currencies other than our or our subsidiaries’ respective functional currencies (non-functional currency risk), such as equipment purchases, programming contracts, notes payable and notes receivable (including intercompany amounts). Changes in exchange rates with respect to amounts recorded on our consolidated balance sheets related to these items will result in unrealized (based upon period-end exchange rates) or realized foreign currency transaction gains and losses upon settlement of the transactions. Moreover, to the extent that our revenue, costs and expenses are denominated in currencies other than our respective functional currencies, we will experience fluctuations in our revenue, costs and expenses solely as a result of changes in foreign currency exchange rates. Generally, we will consider hedging non-functional currency risks when the risks arise from agreements with third parties that involve the future payment or receipt of cash or other monetary items to the extent that we can reasonably predict the timing and amount of such payments or receipts and the payments or receipts are not otherwise hedged. In this regard, we have entered into foreign currency forward and option contracts to hedge certain of these risks. For additional information concerning our foreign currency forward and option contracts, see note 8 to our consolidated financial statements.
We are also exposed to unfavorable and potentially volatile fluctuations of the U.S. dollar (our reporting currency) against the currencies of our operating subsidiaries when their respective financial statements are translated into U.S. dollars for inclusion in our consolidated financial statements. Cumulative translation adjustments are recorded in accumulated other comprehensive earnings or loss as a separate component of equity. Any increase (decrease) in the value of the U.S. dollar against any foreign currency that is the functional currency of one of our operating subsidiaries will cause us to experience
II-33
unrealized foreign currency translation losses (gains) with respect to amounts already invested in such foreign currencies. Accordingly, we may experience a negative impact on our comprehensive earnings or loss and equity with respect to our holdings solely as a result of FX. Our primary exposure to FX risk during the three months ended December 31, 2023 was to the euro and Swiss franc, as 55.1% and 46.7% of our reported revenue during the period was derived from subsidiaries whose functional currencies are the euro and Swiss franc, respectively. In addition, our reported operating results are impacted by changes in the exchange rates for other local currencies in Europe. We do not hedge against the risk that we may incur non-cash losses upon the translation of the financial statements of our subsidiaries and affiliates into U.S. dollars. For additional information regarding certain currency instability risks, see Management’s Discussion and Analysis of Financial Condition and Results of Operations above.
The relationships between the primary currencies of the countries in which we operate and the U.S. dollar, which is our reporting currency, are shown below, per one U.S. dollar:
| December 31, | |||||||||||
| 2023 | 2022 | ||||||||||
| Spot rates: | |||||||||||
| Euro | 0.9038 | 0.9337 | |||||||||
| Swiss franc | 0.8392 | 0.9219 | |||||||||
| British pound sterling | 0.7835 | 0.8265 | |||||||||
| Polish zloty | 3.9272 | 4.3686 | |||||||||
| Year ended December 31, | |||||||||||||||||
| 2023 | 2022 | 2021 | |||||||||||||||
| Average rates: | |||||||||||||||||
| Euro | 0.9247 | 0.9509 | 0.8455 | ||||||||||||||
| Swiss franc | 0.8984 | 0.9548 | 0.9139 | ||||||||||||||
| British pound sterling | 0.8042 | 0.8112 | 0.7269 | ||||||||||||||
| Polish zloty | 4.2004 | 4.4555 | 3.8595 | ||||||||||||||
Inflation and Foreign Investment Risk
We are subject to inflationary pressures, which remain elevated, with respect to labor, programming and other costs. While we attempt to increase our revenue to offset increases in costs, there is no assurance that we will be able to do so. Therefore, costs could rise faster than associated revenue, thereby resulting in a negative impact on our operating results, cash flows and liquidity. The economic environment in the respective countries in which we operate is a function of government, economic, fiscal and monetary policies and various other factors beyond our control that could lead to inflation. We are unable to predict the extent that price levels might be impacted in future periods by the current state of the economies in the countries in which we operate.
Interest Rate Risks
We are exposed to changes in interest rates primarily as a result of our borrowing activities, which include fixed-rate and variable-rate borrowings by our borrowing groups. Our primary exposure to variable-rate debt is through the EURIBOR-indexed and Term SOFR-indexed debt of our borrowing groups and the variable-rate debt of certain of our other subsidiaries.
In general, we enter into derivative instruments to protect against increases in the interest rates on our variable-rate debt. Accordingly, we have entered into various derivative transactions to manage exposure to increases in interest rates. We use interest rate derivative contracts to exchange, at specified intervals, the difference between fixed and variable interest rates calculated by reference to an agreed upon notional principal amount. From time to time, we also use interest rate cap, floor and collar agreements that lock in a maximum interest rate if variable rates rise, but also allow our company to benefit, to a limited extent in the case of collars, from declines in market rates. Under our current guidelines, we use various interest rate derivative instruments to mitigate interest rate risk. The final maturity dates of our various portfolios of interest rate derivative instruments might, in some instances, fall short of the respective maturities of the underlying variable-rate debt. In this regard, we use judgment to determine the appropriate composition and maturity dates of our portfolios of interest rate derivative instruments,
II-34
taking into account the relative costs and benefits of different maturity profiles in light of current and expected future market conditions, liquidity issues and other factors. For additional information concerning the impacts of these interest rate derivative instruments, see note 8 to our consolidated financial statements.
There have been significant changes in the benchmark interest rates used to set floating rates on our debt and derivative instruments. ICE Benchmark Administration (the entity that administers LIBOR) ceased to publish CHF and GBP LIBOR rates after December 31, 2021, and it ceased to publish USD LIBOR rates after June 30, 2023. The methodology for EURIBOR has been reformed and EURIBOR has been granted regulatory approval to continue to be used.
We have agreed amendments in respect of all of our debt and derivative instruments to replace the ceased rates. For USD, these reference the Secured Overnight Financing Rate administered by the Federal Reserve Bank of New York or Term SOFR administered by CME Group Benchmark Administration Limited. For CHF, these reference the Swiss Average Rate Overnight administered by the SIX Swiss Exchange. For GBP, these reference the Sterling Overnight Index Average administered by the Bank of England.
Weighted Average Variable Interest Rate. At December 31, 2023 and 2022, the outstanding principal amount of our variable-rate indebtedness aggregated $11.7 billion and $9.3 billion, respectively, and the weighted average interest rate (including margin) on such variable-rate indebtedness was approximately 6.6% and 5.9%, respectively, excluding the effects of interest rate derivative contracts, deferred financing costs, original issue premiums or discounts and commitment fees, all of which affect our overall cost of borrowing. Assuming no change in the amount outstanding at December 31, 2023, and without giving effect to any interest rate derivative contracts, deferred financing costs, original issue premiums or discounts and commitment fees, a hypothetical 50 basis point (0.50%) increase (decrease) in our weighted average variable interest rate would increase (decrease) our annual consolidated interest expense and cash outflows by $58.5 million. As discussed above and in note 8 to our consolidated financial statements, we use interest rate derivative contracts to manage our exposure to increases in variable interest rates. In this regard, increases in the fair value of these contracts generally would be expected to offset most of the economic impact of increases in the variable interest rates applicable to our indebtedness to the extent and during the period that principal amounts are matched with interest rate derivative contracts.
Counterparty Credit Risk
We are exposed to the risk that the counterparties to the derivative instruments, undrawn debt facilities and cash investments of our subsidiary borrowing groups will default on their obligations to us. We manage these credit risks through the evaluation and monitoring of the creditworthiness of, and concentration of risk with, the respective counterparties. In this regard, credit risk associated with our derivative instruments and undrawn debt facilities is spread across a relatively broad counterparty base of banks and financial institutions, however notwithstanding, given the size of our derivative portfolio, the default of certain counterparties could have a significant impact on our consolidated statements of operations. Collateral is generally not posted by either party under the derivative instruments of our subsidiary borrowing groups. Most of our cash currently is invested in either (i) AAA-rated money market funds, including funds that invest in government obligations, or (ii) overnight deposits with banks having a minimum credit rating of A by Standard & Poor’s or an equivalent rating by Moody’s Investor Service. To date, neither the access to nor the value of our cash and cash equivalent balances have been adversely impacted by liquidity problems of financial institutions.
At December 31, 2023 and 2022, our exposure to counterparty credit risk included (i) aggregate undrawn debt facilities of $1.6 billion and $1.5 billion, respectively, (ii) cash and cash equivalent and restricted cash balances of $1.4 billion and $1.7 billion, respectively, and (iii) derivative assets with an aggregate fair value of $232.9 million and $922.5 million, respectively.
Each of our subsidiary borrowing groups have entered into derivative instruments under master agreements with each counterparty that contain master netting arrangements that are applicable in the event of early termination by either party to such derivative instrument. The master netting arrangements are limited to the derivative instruments governed by the relevant master agreement within each individual borrowing group and are independent of similar arrangements of our other subsidiary borrowing groups.
Under our derivative contracts, it is generally only the non-defaulting party that has a contractual option to exercise early termination rights upon the default of the other counterparty and to set off other liabilities against sums due upon such termination. However, in an insolvency of a derivative counterparty, under the laws of certain jurisdictions, the defaulting counterparty or its insolvency representatives may be able to compel the termination of one or more derivative contracts and trigger early termination payment liabilities payable by us, reflecting any mark-to-market value of the contracts for the counterparty. Alternatively, or in addition, the insolvency laws of certain jurisdictions may require the mandatory set off of amounts due under such derivative contracts against present and future liabilities owed to us under other contracts between us
II-35
and the relevant counterparty. Accordingly, it is possible that we may be subject to obligations to make payments, or may have present or future liabilities owed to us partially or fully discharged by set off as a result of such obligations, in the event of the insolvency of a derivative counterparty, even though it is the counterparty that is in default and not us. To the extent that we are required to make such payments, our ability to do so will depend on our liquidity and capital resources at the time. In an insolvency of a defaulting counterparty, we will be an unsecured creditor in respect of any amount owed to us by the defaulting counterparty, except to the extent of the value of any collateral we have obtained from that counterparty.
In addition, where a counterparty is in financial difficulty, under the laws of certain jurisdictions, the relevant regulators may be able to (i) compel the termination of one or more derivative instruments, determine the settlement amount and/or compel, without any payment, the partial or full discharge of liabilities arising from such early termination that are payable by the relevant counterparty or (ii) transfer the derivative instruments to an alternative counterparty.
While we currently have no specific concerns about the creditworthiness of any counterparty for which we have material credit risk exposures, we cannot rule out the possibility that one or more of our counterparties could fail or otherwise be unable to meet its obligations to us. Any such instance could have an adverse effect on our cash flows, results of operations, financial condition and/or liquidity.
Although we actively monitor the creditworthiness of our key vendors, the financial failure of a key vendor could disrupt our operations and have an adverse impact on our revenue and cash flows.
Sensitivity Information
Information concerning the sensitivity of the fair value of certain of our more significant derivative instruments to changes in market conditions is set forth below. The potential changes in fair value set forth below do not include any amounts associated with the remeasurement of the derivative asset or liability into the applicable functional currency. For additional information, see notes 8 and 9 to our consolidated financial statements.
Sunrise Holding Cross-currency and Interest Rate Derivative Contracts
Holding all other factors constant, at December 31, 2023:
(i)an instantaneous increase (decrease) of 10% in the value of the Swiss franc relative to the U.S. dollar would have decreased (increased) the aggregate fair value of the Sunrise Holding cross-currency and interest rate derivative contracts by approximately €444 million ($491 million);
(ii)an instantaneous increase (decrease) of 10% in the value of the Swiss franc relative to the euro would have decreased (increased) the aggregate fair value of the Sunrise Holding cross-currency and interest rate derivative contracts by approximately €259 million ($287 million); and
(iii)an instantaneous increase (decrease) in the relevant base rate of 50 basis points (0.50%) would have increased (decreased) the aggregate fair value of the Sunrise Holding cross-currency and interest rate derivative contracts by approximately €95 million ($106 million).
Telenet Cross-currency and Interest Rate Derivative Contracts
Holding all other factors constant, at December 31, 2023:
(i)an instantaneous increase (decrease) of 10% in the value of the euro relative to the U.S. dollar would have decreased (increased) the aggregate fair value of the Telenet cross-currency and interest rate derivative contracts by approximately €302 million ($334 million); and
(ii)an instantaneous increase (decrease) in the relevant base rate of 50 basis points (0.50%) would have increased (decreased) the aggregate fair value of the Telenet cross-currency and interest rate derivative contracts by approximately €85 million ($94 million).
II-36
Vodafone Collar
Holding all other factors constant, at December 31, 2023, (i) an instantaneous increase of 10% in the per share market price of Vodafone’s ordinary shares would have decreased the fair value of the Vodafone Collar by approximately €73 million ($81 million) and (ii) an instantaneous decrease of 10% in the per share market price of Vodafone’s ordinary shares would have increased the fair value of the Vodafone Collar by approximately €75 million ($83 million).
Projected Cash Flows Associated with Derivative Instruments
The following table provides information regarding the projected cash flows associated with our derivative instruments. The U.S. dollar equivalents presented below are based on interest rate projections and exchange rates as of December 31, 2023. These amounts are presented for illustrative purposes only and will likely differ from the actual cash payments or receipts required in future periods. For additional information regarding our derivative instruments, see note 8 to our consolidated financial statements. For information concerning the counterparty credit risk associated with our derivative instruments, see the discussion under Counterparty Credit Risk above.
| Payments (receipts) due during: | Total | ||||||||||||||||||||||||||||||||||||||||
| 2024 | 2025 | 2026 | 2027 | 2028 | Thereafter | ||||||||||||||||||||||||||||||||||||
| in millions | |||||||||||||||||||||||||||||||||||||||||
Projected derivative cash payments (receipts), net: | |||||||||||||||||||||||||||||||||||||||||
| Interest-related (a) | $ | (151.3) | $ | (285.2) | $ | (79.1) | $ | (197.4) | $ | (168.1) | $ | (65.3) | $ | (946.4) | |||||||||||||||||||||||||||
| Principal-related (b) | — | 157.7 | 92.6 | — | 35.2 | 430.4 | 715.9 | ||||||||||||||||||||||||||||||||||
| Other (c) | 4.4 | 64.5 | 201.7 | — | — | — | 270.6 | ||||||||||||||||||||||||||||||||||
Total | $ | (146.9) | $ | (63.0) | $ | 215.2 | $ | (197.4) | $ | (132.9) | $ | 365.1 | $ | 40.1 | |||||||||||||||||||||||||||
_______________
(a)Includes (i) the cash flows of our interest rate cap, floor and swap contracts and (ii) the interest-related cash flows of our cross-currency and interest rate swap contracts.
(b)Includes the principal-related cash flows of our cross-currency swap contracts.
(c)Includes amounts related to our equity-related derivative instruments and foreign currency forward contracts. We may elect to use cash or the collective value of the related shares and Vodafone Collar to settle the Vodafone Collar Loan.
II-37
Item 8. FINANCIAL STATEMENTS AND SUPPLEMENTARY DATA
The consolidated financial statements of Liberty Global are filed under this Item, beginning on page II-41. Financial statement schedules are filed under Item 15 of this Annual Report on Form 10-K.
Item 9. CHANGES IN AND DISAGREEMENTS WITH ACCOUNTANTS ON ACCOUNTING AND FINANCIAL DISCLOSURE
None.
Item 9A.CONTROLS AND PROCEDURES
Evaluation of disclosure controls and procedures
In accordance with Exchange Act Rule 13a-15, we carried out an evaluation, under the supervision and with the participation of management, including our chief executive officer and chief financial officer (the Executives), of the effectiveness of our disclosure controls and procedures as of December 31, 2023. In designing and evaluating the disclosure controls and procedures, the Executives recognize that any controls and procedures, no matter how well designed and operated, can provide only reasonable assurance of achieving the desired control objectives, and management is necessarily required to apply judgment in evaluating the cost-benefit relationship of possible controls and objectives. Based on that evaluation, the Executives concluded that our disclosure controls and procedures are effective as of December 31, 2023, to provide reasonable assurance that information required to be disclosed in our reports filed or submitted under the Securities Exchange Act of 1934 is recorded, processed, summarized and reported within the time periods specified in the Securities and Exchange Commission’s rules and forms.
Internal control over financial reporting
(a) Management’s Annual Report on Internal Control over Financial Reporting
Management’s annual report on internal control over financial reporting is included herein on page II-39.
(b) Audit Report of the Independent Registered Public Accounting Firm
The audit report of KPMG LLP is included herein on page II-40.
(c) Changes in Internal Control over Financial Reporting
There have been no changes in our internal controls over financial reporting identified in connection with the evaluation described above that occurred during the fourth fiscal quarter covered by this Annual Report on Form 10-K that have materially affected, or are reasonably likely to materially affect, our internal control over financial reporting.
Item 9B. OTHER INFORMATION
During the quarter ended December 31, 2023, none of the Company’s directors or executive officers adopted terminated
Item 9C. DISCLOSURE REGARDING FOREIGN JURISDICTIONS THAT PREVENT INSPECTIONS
Not applicable.
II-38
Management’s Annual Report on Internal Control over Financial Reporting
Our management is responsible for establishing and maintaining adequate internal control over financial reporting, as such term is defined in Rule 13a-15(f) of the Securities Exchange Act of 1934. Our internal control over financial reporting is designed to provide reasonable assurance regarding the reliability of financial reporting and the preparation of financial statements for external purposes in accordance with accounting principles generally accepted in the United States of America. Because of its inherent limitations, internal control over financial reporting may not prevent or detect misstatements. Projections of any evaluation of effectiveness to future periods are subject to the risk that controls may become inadequate because of changes in conditions, or that the degree of compliance with the policies or procedures may deteriorate.
Our management assessed the effectiveness of internal control over financial reporting as of December 31, 2023, using the criteria in Internal Control - Integrated Framework (2013) issued by the Committee of Sponsoring Organizations of the Treadway Commission. Based on this evaluation, our management believes that our internal control over financial reporting was effective as of December 31, 2023. The effectiveness of our internal control over financial reporting has been audited by KPMG LLP, an independent registered public accounting firm, as stated in their report included herein.
II-39
Report of Independent Registered Public Accounting Firm
To the Shareholders and Board of Directors
Liberty Global Ltd.:
Opinion on Internal Control Over Financial Reporting
We have audited Liberty Global Ltd. and subsidiaries’ (the Company) internal control over financial reporting as of December 31, 2023, based on criteria established in Internal Control – Integrated Framework (2013) issued by the Committee of Sponsoring Organizations of the Treadway Commission. In our opinion, the Company maintained, in all material respects, effective internal control over financial reporting as of December 31, 2023, based on criteria established in Internal Control – Integrated Framework (2013) issued by the Committee of Sponsoring Organizations of the Treadway Commission.
We also have audited, in accordance with the standards of the Public Company Accounting Oversight Board (United States) (PCAOB), the consolidated balance sheets of the Company as of December 31, 2023 and December 31, 2022, the related consolidated statements of operations, comprehensive earnings (loss), equity, and cash flows for each of the years in the three-year period ended December 31, 2023, and the related notes and financial statement schedules I to II (collectively, the consolidated financial statements), and our report dated February 15, 2024 expressed an unqualified opinion on those consolidated financial statements.
Basis for Opinion
The Company’s management is responsible for maintaining effective internal control over financial reporting and for its assessment of the effectiveness of internal control over financial reporting, included in the accompanying Management's Annual Report on Internal Control over Financial Reporting. Our responsibility is to express an opinion on the Company’s internal control over financial reporting based on our audit. We are a public accounting firm registered with the PCAOB and are required to be independent with respect to the Company in accordance with the U.S. federal securities laws and the applicable rules and regulations of the Securities and Exchange Commission and the PCAOB.
We conducted our audit in accordance with the standards of the PCAOB. Those standards require that we plan and perform the audit to obtain reasonable assurance about whether effective internal control over financial reporting was maintained in all material respects. Our audit of internal control over financial reporting included obtaining an understanding of internal control over financial reporting, assessing the risk that a material weakness exists, and testing and evaluating the design and operating effectiveness of internal control based on the assessed risk. Our audit also included performing such other procedures as we considered necessary in the circumstances. We believe that our audit provides a reasonable basis for our opinion.
Definition and Limitations of Internal Control Over Financial Reporting
A company’s internal control over financial reporting is a process designed to provide reasonable assurance regarding the reliability of financial reporting and the preparation of financial statements for external purposes in accordance with generally accepted accounting principles. A company’s internal control over financial reporting includes those policies and procedures that (1) pertain to the maintenance of records that, in reasonable detail, accurately and fairly reflect the transactions and dispositions of the assets of the company; (2) provide reasonable assurance that transactions are recorded as necessary to permit preparation of financial statements in accordance with generally accepted accounting principles, and that receipts and expenditures of the company are being made only in accordance with authorizations of management and directors of the company; and (3) provide reasonable assurance regarding prevention or timely detection of unauthorized acquisition, use, or disposition of the company’s assets that could have a material effect on the financial statements.
Because of its inherent limitations, internal control over financial reporting may not prevent or detect misstatements. Also, projections of any evaluation of effectiveness to future periods are subject to the risk that controls may become inadequate because of changes in conditions, or that the degree of compliance with the policies or procedures may deteriorate.
/s/ KPMG LLP
Denver, Colorado
February 15, 2024
II-40
Report of Independent Registered Public Accounting Firm
To the Shareholders and Board of Directors
Liberty Global Ltd.:
Opinion on the Consolidated Financial Statements
We have audited the accompanying consolidated balance sheets of Liberty Global Ltd. and subsidiaries (the Company) as of December 31, 2023 and December 31, 2022, the related consolidated statements of operations, comprehensive earnings (loss), equity, and cash flows for each of the years in the three-year period ended December 31, 2023, and the related notes and financial statement schedules I to II (collectively, the consolidated financial statements). In our opinion, the consolidated financial statements present fairly, in all material respects, the financial position of the Company as of December 31, 2023 and December 31, 2022, and the results of its operations and its cash flows for each of the years in the three-year period ended December 31, 2023, in conformity with U.S. generally accepted accounting principles.
We also have audited, in accordance with the standards of the Public Company Accounting Oversight Board (United States) (PCAOB), the Company’s internal control over financial reporting as of December 31, 2023, based on criteria established in Internal Control – Integrated Framework (2013) issued by the Committee of Sponsoring Organizations of the Treadway Commission, and our report dated February 15, 2024 expressed an unqualified opinion on the effectiveness of the Company’s internal control over financial reporting.
Basis for Opinion
These consolidated financial statements are the responsibility of the Company’s management. Our responsibility is to express an opinion on these consolidated financial statements based on our audits. We are a public accounting firm registered with the PCAOB and are required to be independent with respect to the Company in accordance with the U.S. federal securities laws and the applicable rules and regulations of the Securities and Exchange Commission and the PCAOB.
We conducted our audits in accordance with the standards of the PCAOB. Those standards require that we plan and perform the audit to obtain reasonable assurance about whether the consolidated financial statements are free of material misstatement, whether due to error or fraud. Our audits included performing procedures to assess the risks of material misstatement of the consolidated financial statements, whether due to error or fraud, and performing procedures that respond to those risks. Such procedures included examining, on a test basis, evidence regarding the amounts and disclosures in the consolidated financial statements. Our audits also included evaluating the accounting principles used and significant estimates made by management, as well as evaluating the overall presentation of the consolidated financial statements. We believe that our audits provide a reasonable basis for our opinion.
Critical Audit Matters
The critical audit matters communicated below are matters arising from the current period audit of the consolidated financial statements that were communicated or required to be communicated to the audit committee and that: (1) relate to accounts or disclosures that are material to the consolidated financial statements and (2) involved our especially challenging, subjective, or complex judgments. The communication of critical audit matters does not alter in any way our opinion on the consolidated financial statements, taken as a whole, and we are not, by communicating the critical audit matters below, providing separate opinions on the critical audit matters or on the accounts or disclosures to which they relate.
Sufficiency of audit evidence over residential and B2B (business-to-business) revenue
As discussed in Note 19 to the consolidated financial statements, the Company recorded $5,081.3 million and $1,496.6 million of residential and B2B revenues, respectively, for the year ended December 31, 2023. The processing and recording of residential and B2B revenue are reliant upon multiple information technology (IT) systems.
We identified the evaluation of the sufficiency of audit evidence over residential and B2B revenue as a critical audit matter. Subjective auditor judgment was required in evaluating the sufficiency of audit evidence over residential and B2B revenue
II-41
due to the large volume of data and the number and complexity of the revenue accounting systems. Specialized skills and knowledge were needed to test the IT systems used for the processing and recording of residential and B2B revenue.
The following are the primary procedures we performed to address this critical audit matter. We applied auditor judgment to determine the nature and extent of procedures to be performed over the processing and recording of residential and B2B revenue, including the IT systems tested. We evaluated the design and tested the operating effectiveness of certain internal controls related to the processing and recording of residential and B2B revenue. This included manual and automated controls over the IT systems used for the processing and recording of residential and B2B revenue. For a sample of transactions, we compared the amount of revenue recorded to a combination of Company internal data, executed contracts, and other relevant third-party data. In addition, we involved IT professionals with specialized skills and knowledge who assisted in the design and performance of audit procedures related to certain IT systems used by the Company for the processing and recording of residential and B2B revenue. We evaluated the sufficiency of audit evidence obtained by assessing the results of procedures performed, including the relevance and reliability of evidence obtained.
Valuation of Certain Level 3 Investments Reported at Fair Value
As described in Note 9 to the consolidated financial statements, the Company classified $1,563.1 million of its investments as fair value investment level 3 within the fair value hierarchy (level 3 investments) as of December 31, 2023. When quoted market prices are unavailable for financial instruments such investments are valued by management using a combination of an income approach and a market approach. The market approach uses transactions with new third-party investors or market multiples of similar businesses. The income approach is a discounted cash flow model based on forecasts that uses valuation techniques.
We identified the evaluation of the valuation of level 3 investments reported at fair value as a critical audit matter. Evaluating the fair value of the Company’s level 3 investments involved a high degree of complex auditor judgment. Changes in the valuation techniques or significant unobservable inputs, specifically the weighted average cost of capital used in the income approach and the market multiples used in the market approach, could have resulted in significant differences in the estimated in fair value measurements. Additionally, specialized skills and knowledge were required to evaluate these fair value assumptions.
The following are the primary procedures we performed to address this critical audit matter. We evaluated the design and tested the operating effectiveness of certain internal controls related to the Company’s level 3 investment valuation process, including controls related to selection of the valuation methodologies and estimates used for unobservable inputs, including the weighted average cost of capital and market multiples. We assessed the weighted average cost of capital used in the income approach and market multiples used in the market approach by comparing them to relevant industry and market indices and comparable public company market capitalization values. We involved valuation professionals with specialized skills and knowledge, who assisted in evaluating the fair value measurement for a selection of level 3 investments by developing an independent estimate of the fair value using independently identified comparable company information and comparing such estimates to the fair values recorded by the Company for the respective investments.
/s/ KPMG LLP
We have served as the Company’s auditor since 2004.
February 15, 2024
II-42
LIBERTY GLOBAL LTD.
CONSOLIDATED BALANCE SHEETS
| December 31, | |||||||||||
| 2023 | 2022 | ||||||||||
| in millions | |||||||||||
| ASSETS | |||||||||||
| Current assets: | |||||||||||
| Cash and cash equivalents | $ | $ | |||||||||
Trade receivables, net (note 3) | |||||||||||
Short-term investments (measured at fair value on a recurring basis) (note 7) | |||||||||||
Derivative instruments (note 8) | |||||||||||
Other current assets (notes 4 and 7) | |||||||||||
| Total current assets | |||||||||||
Investments and related notes receivable (including $ | |||||||||||
Property and equipment, net (notes 10 and 12) | |||||||||||
Goodwill (note 10) | |||||||||||
Intangible assets subject to amortization, net (note 10) | |||||||||||
Other assets, net (notes 4, 8, 12 and 13) | |||||||||||
| Total assets | $ | $ | |||||||||
The accompanying notes are an integral part of these consolidated financial statements.
II-43
LIBERTY GLOBAL LTD.
CONSOLIDATED BALANCE SHEETS — (Continued)
| December 31, | |||||||||||
| 2023 | 2022 | ||||||||||
| in millions | |||||||||||
| LIABILITIES AND EQUITY | |||||||||||
| Current liabilities: | |||||||||||
| Accounts payable | $ | $ | |||||||||
Deferred revenue (note 4) | |||||||||||
Current portion of debt and finance lease obligations (notes 11 and 12) | |||||||||||
| Accrued capital expenditures | |||||||||||
| Accrued income taxes | |||||||||||
Derivative instruments (note 8) | |||||||||||
Other accrued and current liabilities (note 12) | |||||||||||
| Total current liabilities | |||||||||||
Long-term debt and finance lease obligations (notes 11 and 12) | |||||||||||
Long-term operating lease liabilities (notes 6 and 12) | |||||||||||
Other long-term liabilities (notes 4, 8, 13 and 16) | |||||||||||
| Total liabilities | |||||||||||
Commitments and contingencies (notes 8, 11, 12, 13, 16 and 18) | |||||||||||
Equity (note 14): | |||||||||||
| Liberty Global shareholders: | |||||||||||
Class A common shares, $ | |||||||||||
Class B common shares, $ | |||||||||||
Class C common shares, $ | |||||||||||
| Additional paid-in capital | |||||||||||
| Accumulated earnings | |||||||||||
| Accumulated other comprehensive earnings, net of taxes | |||||||||||
| Treasury shares, at cost | ( | ( | |||||||||
| Total Liberty Global shareholders | |||||||||||
| Noncontrolling interests | ( | ||||||||||
| Total equity | |||||||||||
| Total liabilities and equity | $ | $ | |||||||||
The accompanying notes are an integral part of these consolidated financial statements.
II-44
LIBERTY GLOBAL LTD.
CONSOLIDATED STATEMENTS OF OPERATIONS
| Year ended December 31, | |||||||||||||||||
| 2023 | 2022 | 2021 | |||||||||||||||
| in millions, except per share amounts | |||||||||||||||||
Revenue (notes 4, 6, 7 and 19) | $ | $ | $ | ||||||||||||||
Operating costs and expenses (exclusive of depreciation and amortization, shown separately below): | |||||||||||||||||
Programming and other direct costs of services (note 12) | |||||||||||||||||
Other operating (notes 12 and 15) | |||||||||||||||||
Selling, general and administrative (SG&A) (notes 12 and 15) | |||||||||||||||||
Depreciation and amortization (note 10) | |||||||||||||||||
Impairment, restructuring and other operating items, net (notes 12 and 16) | ( | ||||||||||||||||
| Operating income (loss) | ( | ||||||||||||||||
| Non-operating income (expense): | |||||||||||||||||
| Interest expense | ( | ( | ( | ||||||||||||||
Realized and unrealized gains (losses) on derivative instruments, net (note 8) | ( | ||||||||||||||||
| Foreign currency transaction gains (losses), net | ( | ||||||||||||||||
Realized and unrealized gains (losses) due to changes in fair values of certain investments, net (notes 7 and 9) | ( | ( | |||||||||||||||
Gains (losses) on debt extinguishment, net (note 11) | ( | ( | |||||||||||||||
Share of results of affiliates, net (note 7) | ( | ( | ( | ||||||||||||||
Gain associated with the Telenet Wyre Transaction (note 5) | |||||||||||||||||
Gain on Telenet Tower Sale (note 6) | |||||||||||||||||
Gain on U.K. JV Transaction (note 6) | |||||||||||||||||
Gain on AtlasEdge JV Transactions (note 6) | |||||||||||||||||
| Other income, net | |||||||||||||||||
| ( | |||||||||||||||||
| Earnings (loss) from continuing operations before income taxes | ( | ||||||||||||||||
Income tax expense (note 13) | ( | ( | ( | ||||||||||||||
| Earnings (loss) from continuing operations | ( | ||||||||||||||||
Discontinued operations (note 6): | |||||||||||||||||
| Earnings from discontinued operations, net of taxes | |||||||||||||||||
| Gain on disposal of discontinued operations, net of taxes | |||||||||||||||||
| Net earnings (loss) | ( | ||||||||||||||||
| Net earnings attributable to noncontrolling interests | ( | ( | ( | ||||||||||||||
Net earnings (loss) attributable to Liberty Global shareholders | $ | ( | $ | $ | |||||||||||||
Basic earnings (loss) attributable to Liberty Global shareholders per share (note 3): | |||||||||||||||||
| Continuing operations | $ | ( | $ | $ | |||||||||||||
Discontinued operations (note 6) | |||||||||||||||||
| $ | ( | $ | $ | ||||||||||||||
Diluted earnings (loss) attributable to Liberty Global shareholders per share (note 3): | |||||||||||||||||
| Continuing operations | $ | ( | $ | $ | |||||||||||||
Discontinued operations (note 6) | |||||||||||||||||
| $ | ( | $ | $ | ||||||||||||||
The accompanying notes are an integral part of these consolidated financial statements.
II-45
LIBERTY GLOBAL LTD.
CONSOLIDATED STATEMENTS OF COMPREHENSIVE EARNINGS (LOSS)
| Year ended December 31, | |||||||||||||||||
| 2023 | 2022 | 2021 | |||||||||||||||
| in millions | |||||||||||||||||
| Net earnings (loss) | $ | ( | $ | $ | |||||||||||||
Other comprehensive earnings (loss), net of taxes (note 17): | |||||||||||||||||
| Continuing operations: | |||||||||||||||||
| Foreign currency translation adjustments | ( | ( | |||||||||||||||
Reclassification adjustment included in net earnings (loss) (note 6) | ( | ||||||||||||||||
| Pension-related adjustments and other | ( | ( | |||||||||||||||
| Other comprehensive earnings (loss) from continuing operations | ( | ||||||||||||||||
Other comprehensive loss from discontinued operations (note 6) | ( | ( | |||||||||||||||
| Other comprehensive earnings (loss) | ( | ||||||||||||||||
| Comprehensive earnings (loss) | ( | ( | |||||||||||||||
| Comprehensive earnings attributable to noncontrolling interests | ( | ( | ( | ||||||||||||||
Comprehensive earnings (loss) attributable to Liberty Global shareholders | $ | ( | $ | ( | $ | ||||||||||||
The accompanying notes are an integral part of these consolidated financial statements.
II-46
LIBERTY GLOBAL LTD.
CONSOLIDATED STATEMENTS OF EQUITY
| Liberty Global shareholders | Non-controlling interests | Total equity | |||||||||||||||||||||||||||||||||||||||||||||||||||||||||
| Common shares | Additional paid-in capital | Accumulated earnings | Accumulated other comprehensive earnings, net of taxes | Treasury shares, at cost | Total Liberty Global shareholders | ||||||||||||||||||||||||||||||||||||||||||||||||||||||
| Class A | Class B | Class C | |||||||||||||||||||||||||||||||||||||||||||||||||||||||||
| in millions | |||||||||||||||||||||||||||||||||||||||||||||||||||||||||||
Balance at January 1, 2021 | $ | $ | $ | $ | $ | $ | $ | ( | $ | $ | ( | $ | |||||||||||||||||||||||||||||||||||||||||||||||
| Net earnings | — | — | — | — | — | — | |||||||||||||||||||||||||||||||||||||||||||||||||||||
Other comprehensive earnings, net of taxes (note 17) | — | — | — | — | — | — | |||||||||||||||||||||||||||||||||||||||||||||||||||||
Repurchases and cancellations of Liberty Global common shares (note 14) | — | — | ( | ( | — | — | — | ( | — | ( | |||||||||||||||||||||||||||||||||||||||||||||||||
Share-based compensation (note 15) | — | — | — | — | — | — | — | ||||||||||||||||||||||||||||||||||||||||||||||||||||
Dividend distributions by subsidiaries to noncontrolling interest owners (note 14) | — | — | — | — | — | — | — | — | ( | ( | |||||||||||||||||||||||||||||||||||||||||||||||||
Repurchases by Telenet of its outstanding shares | — | — | — | ( | — | — | — | ( | ( | ||||||||||||||||||||||||||||||||||||||||||||||||||
| Adjustments due to changes in subsidiaries’ equity and other, net | — | — | — | ( | — | — | ( | ( | ( | ||||||||||||||||||||||||||||||||||||||||||||||||||
Balance at December 31, 2021 | $ | $ | $ | $ | $ | $ | $ | ( | $ | $ | ( | $ | |||||||||||||||||||||||||||||||||||||||||||||||
The accompanying notes are an integral part of these consolidated financial statements.
II-47
LIBERTY GLOBAL LTD.
CONSOLIDATED STATEMENTS OF EQUITY — (Continued)
| Liberty Global shareholders | Non-controlling interests | Total equity | |||||||||||||||||||||||||||||||||||||||||||||||||||||||||
| Common shares | Additional paid-in capital | Accumulated earnings | Accumulated other comprehensive earnings, net of taxes | Treasury shares, at cost | Total Liberty Global shareholders | ||||||||||||||||||||||||||||||||||||||||||||||||||||||
| Class A | Class B | Class C | |||||||||||||||||||||||||||||||||||||||||||||||||||||||||
| in millions | |||||||||||||||||||||||||||||||||||||||||||||||||||||||||||
Balance at January 1, 2022 | $ | $ | $ | $ | $ | $ | $ | ( | $ | $ | ( | $ | |||||||||||||||||||||||||||||||||||||||||||||||
| Net earnings | — | — | — | — | — | — | |||||||||||||||||||||||||||||||||||||||||||||||||||||
Other comprehensive loss, net of taxes (note 17) | — | — | — | — | — | ( | — | ( | ( | ||||||||||||||||||||||||||||||||||||||||||||||||||
Repurchases and cancellations of Liberty Global common shares (note 14) | — | — | ( | ( | — | — | — | ( | — | ( | |||||||||||||||||||||||||||||||||||||||||||||||||
Share-based compensation (note 15) | — | — | — | — | — | — | — | ||||||||||||||||||||||||||||||||||||||||||||||||||||
Dividend distributions by subsidiaries to noncontrolling interest owners (note 14) | — | — | — | — | — | — | — | — | ( | ( | |||||||||||||||||||||||||||||||||||||||||||||||||
Repurchases by Telenet of its outstanding shares | — | — | — | ( | — | — | — | ( | ( | ||||||||||||||||||||||||||||||||||||||||||||||||||
| Adjustments due to changes in subsidiaries’ equity and other, net | — | — | — | ( | — | — | — | ( | ( | ||||||||||||||||||||||||||||||||||||||||||||||||||
Balance at December 31, 2022 | $ | $ | $ | $ | $ | $ | $ | ( | $ | $ | $ | ||||||||||||||||||||||||||||||||||||||||||||||||
The accompanying notes are an integral part of these consolidated financial statements.
II-48
LIBERTY GLOBAL LTD.
CONSOLIDATED STATEMENTS OF EQUITY — (Continued)
| Liberty Global shareholders | Non-controlling interests | Total equity | |||||||||||||||||||||||||||||||||||||||||||||||||||||||||
| Common shares | Additional paid-in capital | Accumulated earnings | Accumulated other comprehensive earnings, net of taxes | Treasury shares, at cost | Total Liberty Global shareholders | ||||||||||||||||||||||||||||||||||||||||||||||||||||||
| Class A | Class B | Class C | |||||||||||||||||||||||||||||||||||||||||||||||||||||||||
| in millions | |||||||||||||||||||||||||||||||||||||||||||||||||||||||||||
Balance at January 1, 2023 | $ | $ | $ | $ | $ | $ | $ | ( | $ | $ | $ | ||||||||||||||||||||||||||||||||||||||||||||||||
| Net loss | — | — | — | — | ( | — | — | ( | ( | ||||||||||||||||||||||||||||||||||||||||||||||||||
Other comprehensive earnings, net of taxes (note 17) | — | — | — | — | — | — | ( | ||||||||||||||||||||||||||||||||||||||||||||||||||||
Repurchases and cancellations of Liberty Global common shares (note 14) | — | — | ( | ( | — | — | — | ( | — | ( | |||||||||||||||||||||||||||||||||||||||||||||||||
Impact of the Telenet Wyre Transaction (note 5) | — | — | — | — | — | — | |||||||||||||||||||||||||||||||||||||||||||||||||||||
Impact of the Telenet Takeover Bid (note 14) | — | — | — | ( | — | — | — | ( | ( | ( | |||||||||||||||||||||||||||||||||||||||||||||||||
Share-based compensation (note 15) | — | — | — | — | — | — | — | ||||||||||||||||||||||||||||||||||||||||||||||||||||
Dividend distributions by subsidiaries to noncontrolling interest owners (note 14) | — | — | — | — | — | — | — | — | ( | ( | |||||||||||||||||||||||||||||||||||||||||||||||||
Adjustments due to changes in subsidiaries’ equity and other, net | ( | — | — | ( | — | — | — | ( | ( | ||||||||||||||||||||||||||||||||||||||||||||||||||
Balance at December 31, 2023 | $ | $ | $ | $ | $ | $ | $ | ( | $ | $ | ( | $ | |||||||||||||||||||||||||||||||||||||||||||||||
The accompanying notes are an integral part of these consolidated financial statements.
II-49
LIBERTY GLOBAL LTD.
CONSOLIDATED STATEMENTS OF CASH FLOWS
| Year ended December 31, | |||||||||||||||||
| 2023 | 2022 | 2021 | |||||||||||||||
| in millions | |||||||||||||||||
| Cash flows from operating activities: | |||||||||||||||||
| Net earnings (loss) | $ | ( | $ | $ | |||||||||||||
| Earnings from discontinued operations | |||||||||||||||||
| Earnings (loss) from continuing operations | ( | ||||||||||||||||
| Adjustments to reconcile earnings (loss) from continuing operations to net cash provided by operating activities of continuing operations: | |||||||||||||||||
| Share-based compensation expense | |||||||||||||||||
| Depreciation and amortization | |||||||||||||||||
| Impairment, restructuring and other operating items, net | ( | ||||||||||||||||
| Amortization of deferred financing costs and non-cash interest | |||||||||||||||||
| Realized and unrealized losses (gains) on derivative instruments, net | ( | ( | |||||||||||||||
| Foreign currency transaction losses (gains), net | ( | ( | |||||||||||||||
| Realized and unrealized losses (gains) due to changes in fair values of certain investments, net | ( | ||||||||||||||||
| Losses (gains) on debt extinguishment, net | ( | ||||||||||||||||
| Share of results of affiliates, net | |||||||||||||||||
| Deferred income tax expense (benefit) | ( | ||||||||||||||||
Gain associated with the Telenet Wyre Transaction | ( | ||||||||||||||||
Gain on Telenet Tower Sale | ( | ||||||||||||||||
Gain on U.K. JV Transaction | ( | ||||||||||||||||
Gain on AtlasEdge JV Transactions | ( | ||||||||||||||||
| Changes in operating assets and liabilities, net of the effects of acquisitions and dispositions: | |||||||||||||||||
| Receivables and other operating assets | |||||||||||||||||
| Payables and accruals | ( | ( | ( | ||||||||||||||
Dividend distributions received from the VMO2 JV | |||||||||||||||||
Dividend distributions received from the VodafoneZiggo JV | |||||||||||||||||
| Net cash provided by operating activities of continuing operations | |||||||||||||||||
| Net cash provided by operating activities of discontinued operations | |||||||||||||||||
| Net cash provided by operating activities | $ | $ | $ | ||||||||||||||
The accompanying notes are an integral part of these consolidated financial statements.
II-50
LIBERTY GLOBAL LTD.
CONSOLIDATED STATEMENTS OF CASH FLOWS — (Continued)
| Year ended December 31, | |||||||||||||||||
| 2023 | 2022 | 2021 | |||||||||||||||
| in millions | |||||||||||||||||
| Cash flows from investing activities: | |||||||||||||||||
| Cash paid for investments | $ | ( | $ | ( | $ | ( | |||||||||||
| Cash received from the sale of investments | |||||||||||||||||
| Capital expenditures, net | ( | ( | ( | ||||||||||||||
Dividend distributions received from the VMO2 JV | |||||||||||||||||
| Cash received (paid) in connection with acquisitions, net of cash acquired | ( | ( | |||||||||||||||
Cash received in connection with the sale of UPC Poland | |||||||||||||||||
Cash received in connection with the Telenet Tower Sale | |||||||||||||||||
Cash released from the Vodafone Escrow Accounts, net | |||||||||||||||||
Cash and restricted cash contributed to the VMO2 JV in connection with the U.K. JV Transaction | ( | ||||||||||||||||
Net cash received in connection with the AtlasEdge JV Transactions | |||||||||||||||||
Loans to the VodafoneZiggo JV | ( | ||||||||||||||||
Net cash received in connection with the U.K. JV Transaction | |||||||||||||||||
| Other investing activities, net | ( | ( | |||||||||||||||
| Net cash provided (used) by investing activities of continuing operations | ( | ( | |||||||||||||||
| Net cash used by investing activities of discontinued operations | ( | ( | |||||||||||||||
| Net cash provided (used) by investing activities | ( | ( | |||||||||||||||
| Cash flows from financing activities: | |||||||||||||||||
| Borrowings of debt | |||||||||||||||||
| Operating-related vendor financing additions | |||||||||||||||||
| Repayments and repurchases of debt and finance lease obligations: | |||||||||||||||||
| Debt (excluding vendor financing) | ( | ( | ( | ||||||||||||||
| Principal payments on operating-related vendor financing | ( | ( | ( | ||||||||||||||
| Principal payments on capital-related vendor financing | ( | ( | ( | ||||||||||||||
| Principal payments on finance leases | ( | ( | ( | ||||||||||||||
Repurchases of Liberty Global common shares | ( | ( | ( | ||||||||||||||
Acquisition of shares in connection with the Telenet Takeover Bid | ( | ||||||||||||||||
| Net cash received (paid) related to derivative instruments | ( | ( | |||||||||||||||
| Dividend distributions by subsidiaries to noncontrolling interest owners | ( | ( | ( | ||||||||||||||
| Other financing activities, net | ( | ( | ( | ||||||||||||||
| Net cash used by financing activities of continuing operations | ( | ( | ( | ||||||||||||||
| Net cash used by financing activities of discontinued operations | ( | ( | |||||||||||||||
| Net cash used by financing activities | $ | ( | $ | ( | $ | ( | |||||||||||
The accompanying notes are an integral part of these consolidated financial statements.
II-51
LIBERTY GLOBAL LTD.
CONSOLIDATED STATEMENTS OF CASH FLOWS — (Continued)
| Year ended December 31, | |||||||||||||||||
| 2023 | 2022 | 2021 | |||||||||||||||
| in millions | |||||||||||||||||
| Effect of exchange rate changes on cash and cash equivalents and restricted cash: | |||||||||||||||||
| Continuing operations | $ | $ | ( | $ | ( | ||||||||||||
| Discontinued operations | |||||||||||||||||
| Total | ( | ( | |||||||||||||||
| Net increase (decrease) in cash and cash equivalents and restricted cash: | |||||||||||||||||
| Continuing operations | ( | ( | |||||||||||||||
| Discontinued operations | |||||||||||||||||
| Total | ( | ( | |||||||||||||||
| Cash and cash equivalents and restricted cash: | |||||||||||||||||
| Beginning of year | |||||||||||||||||
| Net increase (decrease) | ( | ( | |||||||||||||||
| End of year | $ | $ | $ | ||||||||||||||
| Cash paid for interest: | |||||||||||||||||
| Continuing operations | $ | $ | $ | ||||||||||||||
| Discontinued operations | |||||||||||||||||
| Total | $ | $ | $ | ||||||||||||||
| Net cash paid for taxes: | |||||||||||||||||
| Continuing operations | $ | $ | $ | ||||||||||||||
| Discontinued operations | |||||||||||||||||
| Total | $ | $ | $ | ||||||||||||||
| Details of end of year cash and cash equivalents and restricted cash: | |||||||||||||||||
| Cash and cash equivalents | $ | $ | $ | ||||||||||||||
| Restricted cash included in other current assets and other assets, net | |||||||||||||||||
| Total cash and cash equivalents and restricted cash | $ | $ | $ | ||||||||||||||
The accompanying notes are an integral part of these consolidated financial statements.
II-52
LIBERTY GLOBAL LTD.
Notes to Consolidated Financial Statements
December 31, 2023, 2022 and 2021
(1) Basis of Presentation
Liberty Global Ltd. (Liberty Global) is an international provider of broadband internet, video, fixed-line telephony and mobile communications services to residential customers and businesses in Europe.
As a result of a series of mergers that were completed on June 7, 2013, Liberty Global plc became the publicly-held parent company of the successors by merger of Liberty Global, Inc. (the predecessor to Liberty Global plc) and Virgin Media Inc. (Virgin Media). On November 23, 2023, Liberty Global plc completed a statutory scheme of arrangement, pursuant to which a new Bermudan company, Liberty Global Ltd., became the sole shareholder of Liberty Global plc and the parent entity of the entire group of Liberty Global companies (the Redomiciliation). The Redomiciliation resulted in the Liberty Global group parent company changing its jurisdiction of incorporation from England and Wales to Bermuda. In this Annual Report on Form 10-K, except where context dictates otherwise, the terms “we”, “our”, “our company” and “us” may refer, as the context requires, to Liberty Global (or its predecessors) or collectively to Liberty Global (or its predecessors) and its subsidiaries and any of its joint ventures.
Our continuing operations comprise businesses that provide residential and business-to-business (B2B) communications services in (i) Switzerland, which we refer to as “Sunrise”, and Slovakia through certain wholly-owned subsidiaries that we collectively refer to as “Sunrise Holding” (formerly UPC Holding), (ii) Belgium and Luxembourg through certain wholly-owned subsidiaries that we collectively refer to as “Telenet”, and (iii) Ireland through another wholly-owned subsidiary (VM Ireland). In addition, we own 50 % noncontrolling interests in (a) a 50 :50 joint venture (the VMO2 JV) with Telefónica SA (Telefónica), which provides residential and B2B communication services in the United Kingdom (U.K.), and (b) a 50 :50 joint venture (the VodafoneZiggo JV) with Vodafone Group plc (Vodafone), which provides residential and B2B communication services in the Netherlands. We also own (1) a 50 % noncontrolling voting interest in a joint venture (the AtlasEdge JV), which is a leading European Edge data center platform, and (2) a 25 % noncontrolling interest in a joint venture (the nexfibre JV), which is constructing a new fiber network in the U.K. outside of the existing footprint of the VMO2 JV.
In October 2023, we completed the Telenet Takeover Bid (as defined and described in note 14), pursuant to which we increased our ownership interest in Telenet to 100 %.
Through March 31, 2022, we provided residential and B2B communications services in Poland through Sunrise Holding. On April 1, 2022, we completed the sale of our operations in Poland. Accordingly, in these consolidated financial statements, our operations in Poland are reflected as discontinued operations for all applicable periods. For additional information, see note 6.
Through May 31, 2021, our consolidated operations also included residential and B2B communications services provided to customers in the U.K. through Virgin Media (Virgin Media U.K.). On June 1, 2021, we contributed the U.K. JV Entities (as defined in note 6) to the VMO2 JV and began accounting for our 50 % interest in the VMO2 JV as an equity method investment. For additional information, see note 6.
II-53
LIBERTY GLOBAL LTD.
Notes to Consolidated Financial Statements — (Continued)
December 31, 2023, 2022 and 2021
(2) Accounting Changes and Recent Accounting Pronouncements
Accounting Changes
ASU 2022-04
In September 2022, the Financial Accounting Standards Board (the FASB) issued Accounting Standards Update (ASU) No. 2022-04, Liabilities—Supplier Finance Programs (ASU 2022-04), which requires additional disclosures for buyers participating in supplier financing programs, which we refer to as vendor financing, including (i) the key terms of the arrangement, (ii) the confirmed amount outstanding at the end of the period, (iii) the balance sheet presentation of related amounts and (iv) a reconciliation of the balances from period to period. We adopted ASU 2022-04 on January 1, 2023, and such adoption did not have a significant impact on our consolidated financial statements. For additional information regarding our vendor financing obligations, see note 11.
ASU 2021-08
In October 2021, the FASB issued ASU No. 2021-08, Accounting for Contract Assets and Contract Liabilities from Contracts with Customers (ASU 2021-08), which requires contract assets and contract liabilities acquired in a business combination to be recognized and measured in accordance with Topic 606, Revenue from Contracts with Customers, as if the acquirer had originated the contracts. We adopted ASU 2021-08 on January 1, 2023. The main impact of the adoption of ASU 2021-08 is the recognition of contract assets and contract liabilities in business combinations at amounts generally consistent with the carrying value of such assets and liabilities of the acquiree immediately before the acquisition date.
ASU 2020-04
In March 2020, the FASB issued ASU No. 2020-04, Reference Rate Reform: Facilitation of the Effects of Reference Rate Reform on Financial Reporting (ASU 2020-04), which provides, for a limited time, optional expedients and exceptions for certain contract modifications that reference the London Interbank Offered Rate (LIBOR) or another reference rate expected to be discontinued. In December 2022, the FASB deferred the expiration date of ASU 2020-04 from December 31, 2022 to December 31, 2024. In accordance with the optional expedients in ASU 2020-04, we have modified all applicable debt agreements to replace LIBOR with another reference rate and applied the practical expedient to account for the modification as a continuation of the existing contract. The use of optional expedients in ASU 2020-04 has not had a significant impact on our consolidated financial statements to date. For additional information regarding our debt, see note 11.
Recent Accounting Pronouncements
ASU 2023-09
In December 2023, the FASB issued ASU No. 2023-09, Improvements to Income Tax Disclosures (ASU 2023-09), which is intended to enhance the transparency of income tax matters within financial statements, providing stakeholders with a clearer understanding of tax positions and their associated risks and uncertainties. ASU 2023-09 requires public business entities to disclose, on an annual basis, specific categories in the rate reconciliation and provide additional information for reconciling items that meet a specific quantitative threshold. There is a further requirement that public business entities will need to disclose a tabular reconciliation, using both percentages and reporting currency amounts. ASU 2023-09 is effective for fiscal years beginning after December 15, 2024. We are currently evaluating the impact of ASU 2023-09 on our consolidated financial statements and disclosures.
ASU 2023-07
In November 2023, the FASB issued ASU No. 2023-07, Improvements to Reportable Segment Disclosures (ASU 2023-07), which aims to improve reportable segment disclosure requirements, primarily through enhanced disclosures regarding significant segment expenses. ASU 2023-07 requires public companies to disclose, on an annual and interim basis, significant segment expenses that are regularly provided to the chief operating decision maker and included within each reported measure of segment profit or loss. ASU 2023-07 also requires a public entity to disclose, on an annual and interim basis for each reportable segment, an amount for other segment items and a description of its composition. ASU 2023-07 is
II-54
LIBERTY GLOBAL LTD.
Notes to Consolidated Financial Statements — (Continued)
December 31, 2023, 2022 and 2021
effective for fiscal years beginning after December 15, 2023 and is required to be applied on a retrospective basis. We are currently evaluating the impact of ASU 2023-07 on our consolidated financial statements and disclosures.
ASU 2023-05
In August 2023, the FASB issued ASU No. 2023-05, Business Combinations – Joint Venture Formations: Recognition and Initial Measurement (ASU 2023-05), which outlines updates to the formation of entities that meet the definition of a joint venture as defined by the FASB. ASU 2023-05 requires a joint venture to measure its assets and liabilities at fair value upon formation. ASU 2023-05 is effective prospectively for joint venture formations with a formation date on or after January 1, 2025. We do not expect ASU 2023-05 to have a significant impact on our consolidated financial statements.
(3) Summary of Significant Accounting Policies
Estimates
The preparation of financial statements in conformity with GAAP requires management to make estimates and assumptions that affect the reported amounts of assets and liabilities at the date of the financial statements and the reported amounts of revenue and expenses during the reporting period. Estimates and assumptions are used in accounting for, among other things, the valuation of acquisition-related assets and liabilities, deferred income taxes and related valuation allowances, loss contingencies, fair value measurements, impairment assessments, capitalization of internal costs associated with construction and installation activities and the development of internal-use software, useful lives of long-lived assets, share-based compensation and actuarial liabilities associated with certain benefit plans. Actual results could differ from those estimates.
Reclassifications
Principles of Consolidation
The accompanying consolidated financial statements include our accounts and the accounts of all voting interest entities where we exercise a controlling financial interest through the ownership of a direct or indirect controlling voting interest and variable interest entities for which our company is the primary beneficiary. All significant intercompany accounts and transactions have been eliminated in consolidation.
Cash and Cash Equivalents and Restricted Cash
Cash equivalents consist of money market funds and other investments that are readily convertible into cash and have maturities of three months or less at the time of acquisition. We record money market funds at the net asset value as there are no restrictions on our ability, contractual or otherwise, to redeem our investments at the stated net asset value.
Restricted cash consists of cash held in restricted accounts, including cash held as collateral for debt and other compensating balances. Restricted cash amounts that are required to be used to purchase long-term assets or repay long-term debt are classified as long-term assets. All other cash that is restricted to a specific use is classified as current or long-term based on the expected timing of the disbursement.
Our significant non-cash investing and financing activities are disclosed in our consolidated statements of equity and in notes 6, 10, 11 and 12.
Cash Flow Statement
For purposes of our consolidated statements of cash flows, operating-related expenses financed by an intermediary are treated as constructive operating cash outflows and constructive financing cash inflows when the intermediary settles the liability with the vendor as there is no actual cash outflow until we pay the financing intermediary. When we pay the financing intermediary, we record financing cash outflows in our consolidated statements of cash flows. The capital expenditures we
II-55
LIBERTY GLOBAL LTD.
Notes to Consolidated Financial Statements — (Continued)
December 31, 2023, 2022 and 2021
report in our consolidated statements of cash flows do not include amounts that are financed under capital-related vendor financing or finance lease arrangements. Instead, these amounts are reflected as non-cash additions to our property and equipment when the underlying assets are delivered and as repayments of debt when the principal is repaid.
Trade Receivables
Our trade receivables are reported net of an allowance for doubtful accounts. Such allowance aggregated $58.0 million and $43.1 million at December 31, 2023 and 2022, respectively. The allowance for doubtful accounts is based upon our current estimate of lifetime expected credit losses related to uncollectible accounts receivable. We use a number of factors in determining the allowance, including, among other things, collection trends, prevailing and anticipated economic conditions and specific customer credit risk. The allowance is maintained until either payment is received or the likelihood of collection is considered to be remote.
Concentration of credit risk with respect to trade receivables is limited due to the large number of residential and business customers. We also manage this risk by disconnecting services to customers whose accounts are delinquent.
Investments
We make elections, on an investment-by-investment basis, as to whether we measure our investments at fair value. Such elections are generally irrevocable. With the exception of those investments over which we exercise significant influence, we generally elect the fair value method. For those investments over which we exercise significant influence, we generally elect the equity method. We determine the appropriate classification of our investments in debt securities at the time of purchase based on the underlying nature and characteristics of each security. With the exception of our debt security in a leveraged structured note, all of our debt securities are classified as available for sale and are reported at fair value. Changes in fair value are reported in other comprehensive earnings or loss and, upon sale, are reported in realized and unrealized gains or losses due to changes in fair values of certain investments, net, in our consolidated statements of operations. Our debt security held in a leveraged structured note is accounted for at fair value and any change in fair value is reported in realized and unrealized gains or losses due to changes in fair values of certain investments, net, in our consolidated statements of operations.
Under the fair value method, investments are recorded at fair value and any changes in fair value are reported in realized and unrealized gains or losses due to changes in fair values of certain investments, net, in our consolidated statements of operations. All costs directly associated with the acquisition of an investment to be accounted for using the fair value method are expensed as incurred. In addition, any interest received on our debt securities is reported as interest income in our consolidated statements of operations. Under the equity method, investments are recorded at cost and are subsequently increased or reduced to reflect our share of net earnings or losses of the investee. All costs directly associated with the acquisition of an investment to be accounted for using the equity method are included in the carrying amount of the investment. For additional information regarding our fair value and equity method investments, see notes 7 and 9.
Under the equity method, investments, originally recorded at cost, are adjusted to recognize our share of net earnings or losses of the affiliates as they occur rather than as dividend distributions are received, with our recognition of losses generally limited to the extent of our investment in, and advances and commitments to, the investee. The portion of the difference between our investment and our share of the net assets of the investee that represents goodwill is not amortized, but continues to be considered for impairment. Profits on transactions with equity affiliates for which assets remain on our or our investee’s balance sheet are eliminated to the extent of our ownership in the investee.
Dividend distributions from investees that are not accounted for under the equity method are recognized as dividend income in our consolidated statements of operations when the investee’s shares begin trading on an ex-dividend basis for publicly traded investees or when declared for privately held investees. Dividend distributions from our equity method investees are reflected as reductions in the carrying values of the applicable investments. Dividend distributions that are deemed to be (i) returns on our investments are included in cash flows from operating activities in our consolidated statements of cash flows and (ii) returns of our investments are included in cash flows from investing activities in our consolidated statements of cash flows.
We continually review all of our equity method investments to determine whether a decline in fair value below the cost basis is deemed other-than-temporary. The primary factors we consider in our determination are the extent and length of time
II-56
LIBERTY GLOBAL LTD.
Notes to Consolidated Financial Statements — (Continued)
December 31, 2023, 2022 and 2021
that the fair value of the investment is below our company’s carrying value and the financial condition, operating performance and near-term prospects of the investee, changes in the stock price or valuation subsequent to the balance sheet date, and the impacts of exchange rates, if applicable. If the decline in fair value of an equity method investment is deemed to be other-than-temporary, the cost basis of the security is written down to fair value and the corresponding charge is reported in share of results of affiliates, net, in our consolidated statements of operations.
Realized gains and losses are determined on an average cost basis. Securities transactions are recorded on the trade date.
Financial Instruments
Derivative Instruments
All derivative instruments, whether designated as hedging relationships or not, are recorded on the balance sheet at fair value. We generally do not apply hedge accounting to our derivative instruments, therefore changes in the fair value of derivative instruments are recognized in earnings or loss.
Property and Equipment
Property and equipment are stated at cost less accumulated depreciation. We capitalize costs associated with the construction of new, or upgrades to existing, fixed and mobile transmission and distribution facilities, the installation of new fixed-line services and the development of internal-use software. Capitalized construction and installation costs include materials, labor and other directly attributable costs. Installation activities that are capitalized include (i) the initial connection (or drop) from our fixed-line system to a customer location, (ii) the replacement of a drop and (iii) the installation of equipment for new, or upgrades to existing, fixed-line services. The costs of other customer-facing activities, such as reconnecting and disconnecting customer locations and repairing or maintaining drops, are expensed as incurred. Interest capitalized with respect to construction activities was not material during any of the periods presented.
Capitalized internal-use software is included as a component of property and equipment. We capitalize internal and external costs directly associated with the development of internal-use software. We also capitalize costs associated with the purchase of software licenses. Maintenance and training costs, as well as costs incurred during the preliminary stage of an internal-use software development project, are expensed as incurred. Costs related to the development of entertainment- and connectivity-related software that we externally market, or plan to externally market, to third parties are expensed as incurred, as the time period between technological feasibility and product launch is generally limited in duration and the associated costs during said time period are not significant.
Depreciation is computed using the straight-line method over the estimated useful life of the underlying asset. Equipment under finance leases is amortized on a straight-line basis over the shorter of the lease term or estimated useful life of the asset. Useful lives used to depreciate our property and equipment are assessed periodically and are adjusted when warranted. The useful lives of fixed and mobile distribution systems that are undergoing a rebuild are adjusted such that property and equipment to be retired will be fully depreciated by the time the rebuild is completed. For additional information regarding the useful lives of our property and equipment, see note 10.
Additions, replacements and improvements that extend the asset life are capitalized. Repairs and maintenance are charged to operations.
II-57
LIBERTY GLOBAL LTD.
Notes to Consolidated Financial Statements — (Continued)
December 31, 2023, 2022 and 2021
We recognize a liability for asset retirement obligations in the period in which it is incurred if sufficient information is available to make a reasonable estimate of fair values. Asset retirement obligations may arise from the loss of rights of way that we obtain from local municipalities or other relevant authorities, as well as our obligations under certain lease arrangements to restore the property to its original condition at the end of the lease term. Given the nature of our operations, most of our rights of way and certain leased premises are considered integral to our business. Accordingly, for most of our rights of way and certain lease agreements, the possibility is remote that we will incur significant removal costs in the foreseeable future and, as such, we do not have sufficient information to make a reasonable estimate of fair value for these asset retirement obligations.
As of December 31, 2023 and 2022, the recorded value of our asset retirement obligations was $105.9 million and $93.0 million, respectively.
Intangible Assets
Our primary intangible assets relate to goodwill and customer relationships. Goodwill represents the excess purchase price over the fair value of the identifiable net assets acquired in a business combination. Customer relationships are initially recorded at their fair value in connection with business combinations.
Goodwill and other intangible assets with indefinite useful lives are not amortized, but instead are tested for impairment at least annually. Intangible assets with finite lives are amortized on a straight-line basis over their respective estimated useful lives to their estimated residual values.
For additional information regarding the useful lives of our intangible assets, see note 10.
Impairment of Property and Equipment and Intangible Assets
When circumstances warrant, we review the carrying amounts of our property and equipment and our intangible assets (other than goodwill) to determine whether such carrying amounts continue to be recoverable. Such changes in circumstance may include (i) an expectation of a sale or disposal of a long-lived asset or asset group, (ii) adverse changes in market or competitive conditions, (iii) an adverse change in legal factors or business climate in the markets in which we operate and (iv) operating or cash flow losses. For purposes of impairment testing, long-lived assets are grouped at the lowest level for which cash flows are largely independent of other assets and liabilities, generally at or below the reporting unit level (see below). If the carrying amount of the asset or asset group is greater than the expected undiscounted cash flows to be generated by such asset or asset group, an impairment adjustment is recognized. Such adjustment is measured by the amount that the carrying value of such asset or asset group exceeds its fair value. We generally measure fair value by considering (a) sale prices for similar assets, (b) discounted estimated future cash flows using an appropriate discount rate and/or (c) estimated replacement cost. Assets to be disposed of are recorded at the lower of their carrying amount or fair value less costs to sell.
Leases
For leases with a term greater than 12 months, we recognize on the lease commencement date (i) right-of-use (ROU) assets representing our right to use an underlying asset and (ii) lease liabilities representing our obligation to make lease payments over the lease term. Lease and non-lease components in a contract are generally accounted for separately.
We initially measure lease liabilities at the present value of the remaining lease payments over the lease term. Options to extend or terminate the lease are included only when it is reasonably certain that we will exercise that option. As most of our leases do not provide enough information to determine an implicit interest rate, we generally use a portfolio level incremental borrowing rate in our present value calculation. We initially measure ROU assets at the value of the lease liability, plus any initial direct costs and prepaid lease payments, less any lease incentives received.
II-58
LIBERTY GLOBAL LTD.
Notes to Consolidated Financial Statements — (Continued)
December 31, 2023, 2022 and 2021
Income Taxes
For additional information regarding our income taxes, see note 13.
Foreign Currency Translation and Transactions
The reporting currency of our company is the U.S. dollar. The functional currency of our foreign operations generally is the applicable local currency for each foreign subsidiary and equity method investee. Assets and liabilities of foreign subsidiaries (including intercompany balances for which settlement is not anticipated in the foreseeable future) are translated at the spot rate in effect at the applicable reporting date. With the exception of certain material transactions, the amounts reported in our consolidated statements of operations are translated at the average exchange rates in effect during the applicable period. The resulting unrealized cumulative translation adjustment, net of applicable income taxes, is recorded as a component of accumulated other comprehensive earnings or loss in our consolidated statements of equity. With the exception of certain material transactions, the cash flows from our operations in foreign countries are translated at the average rate for the applicable period in our consolidated statements of cash flows. The impacts of material transactions generally are recorded at the applicable spot rates in our consolidated statements of operations and cash flows. The effect of exchange rates on cash balances held in foreign currencies are separately reported in our consolidated statements of cash flows.
Transactions denominated in currencies other than our or our subsidiaries’ functional currencies are recorded based on exchange rates at the time such transactions arise. Changes in exchange rates with respect to amounts recorded on our consolidated balance sheets related to these non-functional currency transactions result in transaction gains and losses that are reflected in our consolidated statements of operations as unrealized (based on the applicable period end exchange rates) or realized upon settlement of the transactions.
Revenue Recognition
Service Revenue — Fixed Networks. We recognize revenue from the provision of broadband internet, video and fixed-line telephony services over our network to customers in the period the related services are provided, with the exception of revenue recognized pursuant to certain contracts that contain promotional discounts, as described below. Installation fees related to services provided over our network are generally deferred and recognized as revenue over the contractual period, or longer if the upfront fee results in a material renewal right.
II-59
LIBERTY GLOBAL LTD.
Notes to Consolidated Financial Statements — (Continued)
December 31, 2023, 2022 and 2021
Sale of Multiple Products and Services. We sell broadband internet, video, fixed-line telephony and, in most of our markets, mobile services to our customers in bundled packages at a rate lower than if the customer purchased each product on a standalone basis. Revenue from bundled packages generally is allocated proportionally to the individual products or services based on the relative standalone selling price for each respective product or service.
Mobile Revenue — General. Consideration from mobile contracts is allocated to the airtime service component and the handset component based on the relative standalone selling prices of each component. In markets where we offer handsets and airtime services in separate contracts entered into at the same time, we account for these contracts as a single contract.
Mobile Revenue — Airtime Services. We recognize revenue from mobile services in the period in which the related services are provided. Revenue from prepaid customers is deferred prior to the commencement of services and recognized as the services are rendered or usage rights expire.
Mobile Revenue — Handset Revenue. Revenue from the sale of handsets is recognized at the point in which the goods have been transferred to the customer. Some of our mobile handset contracts that permit the customer to take control of the handset upfront and pay for the handset in installments over a contractual period may contain a significant financing component. For contracts with terms of one year or more, we recognize any significant financing component as revenue over the contractual period using the effective interest method. We do not record the effect of a significant financing component if the contractual period is less than one year.
B2B Revenue. We defer upfront installation and certain nonrecurring fees received on B2B contracts where we maintain ownership of the installed equipment. The deferred fees are amortized into revenue on a straight-line basis, generally over the longer of the term of the arrangement or the expected period of performance. From time to time, we also enter into agreements with certain B2B customers pursuant to which they are provided the right to use certain elements of our network. If these agreements are determined to contain a lease that meets the criteria to be considered a sales-type lease, we recognize revenue from the lease component when control of the network element is transferred to the customer.
Other Revenue — Services to Affiliates. We provide certain services to the VMO2 JV and the VodafoneZiggo JV, which consist primarily of (i) technology and other services and (ii) capital-related expenditures for assets that will be used by or will otherwise benefit the VMO2 JV and the VodafoneZiggo JV. We recognize revenue from services to affiliates in the period in which the related services are provided.
Contract Costs. Incremental costs to obtain a contract with a customer, such as incremental sales commissions, are generally recognized as assets and amortized to SG&A expenses over the applicable period benefited, which generally is the contract life. If, however, the amortization period is less than one year, we expense such costs in the period incurred. Contract fulfillment costs, such as costs for installation activities for B2B customers, are recognized as assets and amortized to other operating costs over the applicable period benefited, which is generally the substantive contract term for the related service contract.
Promotional Discounts. For subscriber promotions, such as discounted or free services during an introductory period, revenue is recognized uniformly over the contractual period if the contract has substantive termination penalties. If a contract does not have substantive termination penalties, revenue is recognized only to the extent of the discounted monthly fees charged to the subscriber, if any.
Subscriber Advance Payments. Payments received in advance for the services we provide are deferred and recognized as revenue when the associated services are provided.
Sales, Use and Other Value-Added Taxes. Revenue is recorded net of applicable sales, use and other value-added taxes (VAT).
For additional information regarding our revenue recognition and related costs, see note 4. For additional information regarding services provided to our affiliates, see note 7. For a disaggregation of our revenue by major category and by reportable and geographic segment, see note 19.
II-60
LIBERTY GLOBAL LTD.
Notes to Consolidated Financial Statements — (Continued)
December 31, 2023, 2022 and 2021
Programming Costs
Programming costs include (i) agreements to distribute channels to our customers, (ii) exhibition rights of programming content and (iii) sports rights.
Channel Distribution Agreements. Our channel distribution agreements are generally multi-year contracts for which we are charged either (i) variable rates based upon the number of subscribers or (ii) on a flat fee basis. Certain of our variable rate contracts require minimum guarantees. Programming costs under such arrangements are recorded in operating costs and expenses in our consolidated statement of operations when the programming is available for viewing.
Exhibition Rights. Our agreements for exhibition rights are generally multi-year license agreements for which we are typically charged either (i) a percentage of the revenue earned per program or (ii) a flat fee per program. The current and long-term portions of our exhibition rights acquired under licenses are recorded as other current assets and other assets, net, respectively, on our consolidated balance sheet when the license period begins and the program is available for its first showing. Capitalized exhibition rights are amortized based on the projected future showings of the content using a straight-line or accelerated method of amortization, as appropriate. Exhibition rights are regularly reviewed for impairment and held at the lower of unamortized cost or estimated net realizable value.
Sports Rights. Our sports rights agreements are generally multi-year contracts for which we are typically charged a flat fee per season. We typically pay for sports rights in advance of the respective season. The current and long-term portions of any payments made in advance of the respective season are recorded as other current assets and other assets, net, respectively, on our consolidated balance sheet and are amortized on a straight-line basis over the respective sporting season. Sports rights are regularly reviewed for impairment and held at the lower of unamortized cost or estimated net realizable value.
For additional information regarding our programming costs, see note 18.
Share-based Compensation
We recognize all share-based payments to employees, including grants of employee share-based incentive awards, based on their grant-date fair values and our estimates of forfeitures. We recognize share-based compensation expense as a charge to operations over the vesting period based on the grant-date fair value of outstanding awards, which may differ from the fair value of such awards on any given date. Our share of payroll taxes incurred in connection with the vesting or exercise of our share-based incentive awards is recorded as a component of share-based compensation expense in our consolidated statements of operations.
We use the straight-line method to recognize share-based compensation expense for our outstanding share awards that do not contain a performance condition and the accelerated expense attribution method for our outstanding share awards that contain a performance condition and vest on a graded basis.
The grant date fair values for options, share appreciation rights (SARs) and performance-based share appreciation rights (PSARs) are estimated using the Black-Scholes option pricing model, and the grant date fair values for restricted share units (RSUs), restricted share awards (RSAs) and performance-based restricted share units (PSUs) are based upon the closing share price of Liberty Global common shares on the date of grant. We consider historical exercise trends in our calculation of the expected life of options and SARs granted by Liberty Global to employees. The expected volatility for options and SARs related to our common shares is generally based on a combination of (i) historical volatilities for a period equal to the expected average life of the awards and (ii) volatilities implied from publicly-traded options for our shares.
We generally issue new Liberty Global common shares when Liberty Global options or SARs are exercised, when RSUs and PSUs vest and when RSAs are granted. Our company settles SARs and PSARs on a net basis when exercised by the award holder, whereby the number of shares issued represents the excess value of the award based on the market price of the respective Liberty Global shares at the time of exercise relative to the award’s exercise price. In addition, the number of shares issued is further reduced by the amount of the employee’s required income tax withholding.
Although we repurchase Liberty Global common shares from time to time, the parameters of our share purchase and redemption activities are not established with reference to the dilutive impact of our share-based compensation plans.
II-61
LIBERTY GLOBAL LTD.
Notes to Consolidated Financial Statements — (Continued)
December 31, 2023, 2022 and 2021
For additional information regarding our share-based compensation, see note 15.
Litigation Costs
Legal fees and related litigation costs are expensed as incurred.
Earnings or Loss per Share
The details of our net earnings (loss) from continuing operations attributable to Liberty Global shareholders are set forth below:
| Year ended December 31, | |||||||||||||||||
| 2023 | 2022 | 2021 | |||||||||||||||
| in millions, except share amounts | |||||||||||||||||
| Earnings (loss) from continuing operations | $ | ( | $ | $ | |||||||||||||
| Net earnings from continuing operations attributable to noncontrolling interests | ( | ( | ( | ||||||||||||||
Net earnings (loss) from continuing operations attributable to Liberty Global shareholders | $ | ( | $ | $ | |||||||||||||
Weighted average common shares outstanding (basic EPS computation) | |||||||||||||||||
| Incremental shares attributable to the assumed exercise or release of outstanding share-based incentive awards upon vesting (treasury stock method) | |||||||||||||||||
Weighted average common shares outstanding (diluted EPS computation) | |||||||||||||||||
We reported a net loss from continuing operations attributable to Liberty Global shareholders during 2023. Therefore, the potentially dilutive effect at December 31, 2023 excludes 96.5 million shares issuable pursuant to outstanding share-based incentive awards in the computation of diluted net loss from continuing operations attributable to Liberty Global shareholders per share because their inclusion would have been anti-dilutive to the computation or, in the case of PSUs, because such awards had not yet met the applicable performance criteria.
The calculation of diluted earnings per share excludes aggregate share-based incentive awards of 59.5 million and 47.9 million during 2022 and 2021, respectively, because their effect would have been anti-dilutive.
II-62
LIBERTY GLOBAL LTD.
Notes to Consolidated Financial Statements — (Continued)
December 31, 2023, 2022 and 2021
(4) Revenue Recognition and Related Costs
Contract Balances
If we transfer goods or services to a customer but do not have an unconditional right to payment, we record a contract asset. Contract assets typically arise from the uniform recognition of introductory promotional discounts over the contract period and accrued revenue for handset sales. Our contract assets were $45.8 million and $33.3 million as of December 31, 2023 and 2022, respectively. The current and long-term portions of our contract asset balances are included within other current assets and other assets, net, respectively, on our consolidated balance sheets.
We record deferred revenue when we receive payment prior to transferring goods or services to a customer. We primarily defer revenue for (i) installation and other upfront services and (ii) other services that are invoiced prior to when services are provided. Our deferred revenue balances were $267.6 million and $272.5 million as of December 31, 2023 and 2022, respectively. The decrease in deferred revenue during 2023 is primarily due to the net effect of (a) the recognition of $217.1 million of revenue that was included in our deferred revenue balance at December 31, 2022 and (b) the impact of additions during the period. The long-term portions of our deferred revenue balances are included within other long-term liabilities on our consolidated balance sheets.
Contract Costs
Our aggregate assets associated with incremental costs to obtain and fulfill our contracts were $84.1 million and $69.4 million at December 31, 2023 and 2022, respectively. The current and long-term portions of our assets related to contract costs are included within other current assets and other assets, net, respectively, on our consolidated balance sheets. During 2023, 2022 and 2021, we amortized $80.6 million, $75.2 million and $122.0 million, respectively, to operating costs and expenses related to these assets.
Unsatisfied Performance Obligations
A large portion of our revenue is derived from customers who are not subject to contracts. Revenue from customers who are subject to contracts is generally recognized over the term of such contracts, which is typically 12 months for our residential service contracts, to three years for our mobile service contracts and to five years for our B2B service contracts.
(5) Acquisitions
Telenet Wyre Transaction. On July 1, 2023, pursuant to an agreement dated July 19, 2022, Telenet and Fluvius System Operator CV (Fluvius) created an independent, self-funding infrastructure company (Wyre) within their combined geographic footprint in Belgium (the Telenet Wyre Transaction). The companies each contributed certain cable infrastructure assets with Telenet and Fluvius initially owning 66.8 % and 33.2 % of Wyre, respectively. In exchange for its 66.8 % ownership of Wyre, Telenet contributed net assets with a fair value of €1,851.2 million ($2,021.2 million at the transaction date), together with annual payments to Fluvius of €20.0 million ($22.1 million) over the next six years following the date of the transaction. Telenet and Liberty Global began consolidating Wyre’s results upon the closing of the transaction.
With the closing of the Telenet Wyre Transaction, Telenet early terminated and effectively settled certain pre-existing contractual relationships with Fluvius, principally related to Telenet’s leased network, and began consolidating certain infrastructure cable assets contributed by Fluvius to Wyre, as described above. Primarily due to Telenet’s aforementioned pre-existing network leasing relationship with Fluvius, the Telenet Wyre Transaction does not have a significant impact on our operating income during 2023, 2022 or 2021. Accordingly, the pro forma effect of the Telenet Wyre Transaction is not presented herein.
In connection with the Telenet Wyre Transaction, we recognized a net gain of $377.8 million during 2023, which represents the difference between the fair value and carrying amount of a pre-existing network leasing relationship between Telenet and Fluvius. No income taxes were required to be provided on this gain.
II-63
LIBERTY GLOBAL LTD.
Notes to Consolidated Financial Statements — (Continued)
December 31, 2023, 2022 and 2021
(6) Dispositions
2022 Dispositions
UPC Poland. On April 1, 2022, we completed the sale of 100 % of our operations in Poland (UPC Poland) to a subsidiary of iliad S.A. (iliad). After considering debt and working capital adjustments (including cash disposed), we received net cash proceeds of Polish zloty 6,520.4 million ($1,553.3 million at the transaction date).
In connection with the sale of UPC Poland, we recognized a gain of $846.4 million, which includes a cumulative foreign currency translation gain of $10.9 million. No income taxes were required to be provided on this gain.
In connection with the sale of UPC Poland, we have agreed to provide certain transitional services to iliad for a period of up to five years , depending on the service. These services principally comprise network and information technology-related functions. During 2023 and 2022, we recorded revenue of $24.6 million and $26.6 million, respectively, associated with these transitional services.
UPC Poland is presented as a discontinued operation in our consolidated financial statements for all applicable periods. Effective with the signing of the sale and purchase agreement on September 22, 2021, we ceased to depreciate or amortize the associated long-lived assets. Our operations in Poland were held through Sunrise Holding prior to the disposal date. No debt, interest or derivative instruments of the Sunrise Holding borrowing group have been allocated to discontinued operations.
The operating results of UPC Poland for 2022 and 2021 are summarized in the following table. These amounts exclude intercompany revenue and expenses that are eliminated within our consolidated statements of operations.
| Year ended December 31, | |||||||||||
| 2022 (a) | 2021 | ||||||||||
| in millions | |||||||||||
| Revenue | $ | $ | |||||||||
| Operating income | $ | $ | |||||||||
| Earnings before income taxes | $ | $ | |||||||||
| Income tax expense | ( | ( | |||||||||
| Net earnings attributable to Liberty Global shareholders | $ | $ | |||||||||
_______________
(a)Includes the operating results of UPC Poland from January 1, 2022 to April 1, 2022, the date UPC Poland was sold.
Telenet Tower Sale. On June 1, 2022, Telenet completed the sale of substantially all of their passive infrastructure and tower assets to DigitalBridge Investments LLC (DigitalBridge) (the Telenet Tower Sale). After considering working capital adjustments, we received net cash proceeds of €733.0 million ($779.9 million at the transaction date). Effective with the signing of the sale and purchase agreement on March 25, 2022, we began accounting for the associated assets and liabilities as held for sale and, accordingly, we ceased to depreciate or amortize these long-lived assets.
In connection with the completion of the Telenet Tower Sale, we recognized a gain of $700.5 million. No income taxes were required to be provided on this gain.
As part of the Telenet Tower Sale, Telenet entered into a master lease agreement to lease back the passive infrastructure and tower assets from DigitalBridge for an initial period of 15 years (the Telenet Tower Lease Agreement). In connection with the Telenet Tower Lease Agreement, we recorded non-cash additions to our operating lease ROU assets of $615.1
In addition, as part of the Telenet Tower Lease Agreement, Telenet has also committed to lease back 475 build-to-suit sites over the term of the lease. As of December 31, 2023, the total U.S. dollar equivalent of the estimated future payments for the
II-64
LIBERTY GLOBAL LTD.
Notes to Consolidated Financial Statements — (Continued)
December 31, 2023, 2022 and 2021
build-to-suit sites over the term of the lease was $106.8 million, the majority of which are due after 2028. Telenet will act as an agent over the construction of future towers on the build-to-suit sites.
2021 Dispositions
U.K. JV Transaction. On June 1, 2021, pursuant to a Contribution Agreement dated May 7, 2020 (the Contribution Agreement) with, among others, Telefónica, (i) we contributed Virgin Media U.K. and certain other Liberty Global subsidiaries (together, the U.K. JV Entities) to the VMO2 JV and (ii) Telefónica contributed its U.K. mobile business to the VMO2 JV, creating a nationwide integrated communications provider (herein referred to as the “U.K. JV Transaction”). We account for our 50 % interest in the VMO2 JV as an equity method investment, as further described in note 7.
In connection with the U.K. JV Transaction, we received net cash of $108.6 million, which includes the net impact of (i) equalization payments received from Telefónica, (ii) our share of the proceeds associated with related recapitalization financing transactions completed by the VMO2 JV and (iii) $44.5 million of cash paid by Liberty Global to settle certain centrally-held vendor financing obligations associated with the VMO2 JV.
In connection with the U.K. JV Transaction, we recognized a pre-tax gain of $10,873.8 million, net of the recognition of a cumulative foreign currency translation loss of $1,198.6 million. This gain was calculated by deducting the carrying value of the U.K. JV Entities (including the related foreign currency translation loss) from the sum of (i) the fair value assigned to our 50 % interest in the VMO2 JV and (ii) the net cash received pursuant to the equalization payments and recapitalization transactions described above. For information regarding our approach to the valuation of our interest in the VMO2 JV, see note 9.
A summary of the fair value of the assets and liabilities of the VMO2 JV at the June 1, 2021 transaction date is presented in the following table. The opening balance sheet presented below reflects the final purchase price allocation (in millions):
| Current assets | $ | ||||
| Property and equipment, net | |||||
| Goodwill | |||||
| Intangible assets subject to amortization, net | |||||
| Other assets, net | |||||
| Current portion of debt and finance lease obligations | ( | ||||
| Other accrued and current liabilities | ( | ||||
| Long-term debt and finance lease obligations | ( | ||||
| Other long-term liabilities | ( | ||||
Total fair value of the net assets of the VMO2 JV | $ | ||||
For the period prior to the June 1, 2021 completion of the U.K. JV Transaction, our consolidated statement of operations includes aggregate earnings before income taxes attributable to the U.K. JV Entities of $890.5 million during 2021.
Effective with the signing of the Contribution Agreement, we began accounting for the U.K. JV Entities as held for sale. Accordingly, we ceased to depreciate or amortize the long-lived assets of the U.K. JV Entities. However, the U.K. JV Entities were not presented as discontinued operations as the U.K. JV Transaction did not represent a strategic shift as defined by GAAP.
II-65
LIBERTY GLOBAL LTD.
Notes to Consolidated Financial Statements — (Continued)
December 31, 2023, 2022 and 2021
The June 1, 2021 carrying amounts of the major classes of assets and liabilities associated with the U.K. JV Entities, which were contributed to the VMO2 JV, are summarized below (in millions):
| Assets: | |||||
| Current assets (a) | $ | ||||
| Property and equipment, net | |||||
| Goodwill | |||||
| Other assets, net | |||||
| Total assets (b) | $ | ||||
| Liabilities: | |||||
Current portion of debt and finance lease obligations | $ | ||||
Other accrued and current liabilities | |||||
Long-term debt and finance lease obligations | |||||
Other long-term liabilities | |||||
| Total liabilities (b) | $ | ||||
_______________
(a) Amount includes $3.4 billion of net proceeds from certain financing transactions completed in 2020 that were held in escrow pending the completion of the U.K. JV Transaction.
(b) The carrying amount of the net assets of $1,478.8 million presented above is net of the cumulative foreign currency translation loss of $1,198.6 million.
AtlasEdge JV Transactions. On September 1, 2021, we (i) contributed certain assets and liabilities to a newly-formed 50 :50 joint venture (the AtlasEdge JV) that was established for the purpose of acquiring and commercializing European technical real estate for edge colocation and hosting services and (ii) sold certain other assets to the AtlasEdge JV. In addition, we sold certain additional assets to the AtlasEdge JV during the fourth quarter of 2021. In connection with these transactions, which we collectively refer to as the “AtlasEdge JV Transactions”, we (a) received net cash of $144.5 million and (b) recognized a pre-tax gain of $227.5 million (net of the recognition of a cumulative foreign currency translation loss of $1.8 million), representing the difference between the estimated fair value and the carrying value of the net assets associated with these transactions. We account for our interest in the AtlasEdge JV as an equity method investment.
II-66
LIBERTY GLOBAL LTD.
Notes to Consolidated Financial Statements — (Continued)
December 31, 2023, 2022 and 2021
(7) Investments
The details of our investments are set forth below:
| December 31, | ||||||||||||||||||||
| 2023 | 2022 | Ownership (a) | ||||||||||||||||||
| Accounting Method | in millions | % | ||||||||||||||||||
| Equity (b): | ||||||||||||||||||||
| Long-term: | ||||||||||||||||||||
VMO2 JV | $ | $ | ||||||||||||||||||
VodafoneZiggo JV (c) | ||||||||||||||||||||
AtlasEdge JV | ||||||||||||||||||||
All3Media Group (All3Media) | ||||||||||||||||||||
Formula E Holdings Ltd (Formula E) | ||||||||||||||||||||
nexfibre JV | ||||||||||||||||||||
| Other | ||||||||||||||||||||
| Total — equity | ||||||||||||||||||||
| Fair value: | ||||||||||||||||||||
| Short-term: | ||||||||||||||||||||
Separately-managed accounts (SMAs) (d) | ||||||||||||||||||||
| Long-term: | ||||||||||||||||||||
Vodafone - subject to re-use rights (e) | ||||||||||||||||||||
Televisa Univision, Inc. (Televisa Univision) | ||||||||||||||||||||
ITV plc (ITV) | ||||||||||||||||||||
EdgeConneX, Inc. (EdgeConneX) | ||||||||||||||||||||
SMAs (d) | ||||||||||||||||||||
Plume Design, Inc. (Plume) (f) | ||||||||||||||||||||
Pax8, Inc. (Pax8) | ||||||||||||||||||||
Lacework, Inc. (Lacework) | ||||||||||||||||||||
CANAL+ Polska S.A. (CANAL+ Polska) | ||||||||||||||||||||
Lions Gate Entertainment Corp. (Lionsgate) | ||||||||||||||||||||
Aviatrix Systems, Inc. (Aviatrix) | ||||||||||||||||||||
| Other | ||||||||||||||||||||
| Total — fair value | ||||||||||||||||||||
| Total investments (g) | $ | $ | ||||||||||||||||||
| Short-term investments | $ | $ | ||||||||||||||||||
| Long-term investments | $ | $ | ||||||||||||||||||
_______________
(a)Our ownership percentages are determined based on our legal ownership as of the most recent balance sheet date or are estimated based on the number of shares we own and the most recent publicly-available information.
(b)Our equity method investments are originally recorded at cost and are adjusted to recognize our share of net earnings or losses of the affiliates as they occur rather than as dividend distributions are received, with our recognition of losses generally limited to the extent of our investment in, and loans and commitments to, the investee. Accordingly, the carrying values of our equity method investments may not equal the respective fair values. At December 31, 2023 and 2022, the aggregate carrying amounts of our equity method investments exceeded our proportionate share of the
II-67
LIBERTY GLOBAL LTD.
Notes to Consolidated Financial Statements — (Continued)
December 31, 2023, 2022 and 2021
respective investee’s net assets by $1,234.7 million and $1,196.8 million, respectively, which primarily includes amounts associated with the VodafoneZiggo JV Receivables, as defined below, and amounts we are owed under a long-term note receivable from All3Media.
(c)Amounts include certain notes receivable due from a subsidiary of the VodafoneZiggo JV to a subsidiary of Liberty Global comprising (i) a euro-denominated note receivable with a principal amount of $774.5 million and $749.7 million at December 31, 2023 and 2022, respectively, (the VodafoneZiggo JV Receivable I) and (ii) a euro-denominated note receivable with a principal amount of $230.0 million and $222.7 million at December 31, 2023 and 2022, respectively, (the VodafoneZiggo JV Receivable II and, together with the VodafoneZiggo JV Receivable I, the VodafoneZiggo JV Receivables). The VodafoneZiggo JV Receivables bear interest at 5.55 % and have a final maturity date of December 31, 2030. During 2023, interest accrued on the VodafoneZiggo JV Receivables was $55.3 million, all of which has been cash settled.
(d)Represents investments held under SMAs, which are maintained by investment managers acting as agents on our behalf. We classify, measure and report these investments, the composition of which may change from time to time, based on the underlying nature and characteristics of each security held under the SMAs. With the exception of our SMA in a leveraged structured note, all of our investments held under SMAs were classified as available-for-sale debt securities as of December 31, 2023. At December 31, 2023 and 2022, interest accrued on our debt securities, which is included in on our consolidated balance sheets, was $34.6 million and $18.5 million, respectively.
(e)During the first quarter of 2023, we acquired 1,335 million shares of Vodafone at an average purchase price of £0.9195 ($1.1151 at the transaction date) per share. The aggregate purchase price of £1,227.6 million ($1,488.7 million at the transaction date) was funded with $269.2 million of cash on hand, net of a $0.3 million collar premium, and the remainder through a collar transaction (the Vodafone Collar Transaction). The Vodafone Collar Transaction includes a collar on the full amount of our Vodafone shares (the Vodafone Collar) and a loan (the Vodafone Collar Loan) collateralized by the Vodafone shares. Under the terms of the Vodafone Collar, the counterparty has the right to re-use pledged Vodafone shares. At December 31, 2023, after consideration of the Vodafone Collar Transaction, the net fair value of our investment in Vodafone is $115.5 million. For additional information regarding the Vodafone Collar Transaction, including a description of the related re-use rights and the impact on the dividends we receive on our Vodafone shares, see note 8.
(f)Our investment in Plume includes warrants with a fair value of $61.3 million and $92.2 million at December 31, 2023 and 2022, respectively.
(g)The purchase and sale of investments are presented on a gross basis in our consolidated statements of cash flows, including amounts associated with SMAs.
II-68
LIBERTY GLOBAL LTD.
Notes to Consolidated Financial Statements — (Continued)
December 31, 2023, 2022 and 2021
Equity Method Investments
The following table sets forth the details of our share of results of affiliates, net:
| Year ended December 31, | |||||||||||||||||
| 2023 | 2022 | 2021 | |||||||||||||||
| in millions | |||||||||||||||||
VMO2 JV (a) | $ | ( | $ | ( | $ | ( | |||||||||||
VodafoneZiggo JV (b) | ( | ( | |||||||||||||||
nexfibre JV | ( | ||||||||||||||||
AtlasEdge JV | ( | ( | ( | ||||||||||||||
Formula E | ( | ( | ( | ||||||||||||||
Streamz B.V. (Streamz) (c) | ( | ( | ( | ||||||||||||||
All3Media | ( | ( | |||||||||||||||
Eltrona Interdiffusion S.A. (Eltrona) (d) | ( | ( | |||||||||||||||
| Other | ( | ( | ( | ||||||||||||||
| Total | $ | ( | $ | ( | $ | ( | |||||||||||
_______________
(a)Represents (i) our 50 % share of the results of operations of the VMO2 JV and (ii) 100 % of the share-based compensation expense associated with Liberty Global awards granted to VMO2 JV employees who were formerly employees of Liberty Global prior to the VMO2 JV formation, as these awards remain our responsibility. In addition, the 2023 and 2022 amounts include charges of $1.5 billion and $1.8 billion, respectively, representing our 50 % share of the VMO2 JV’s goodwill impairments, as described below.
(b)Represents (i) our 50 % share of the results of operations of the VodafoneZiggo JV and (ii) 100 % of the interest income earned on the VodafoneZiggo JV Receivables.
(c)The 2022 amount includes a charge of $31.7 million related to a decline in fair value below the cost basis of the investment that was deemed other-than-temporary during the fourth quarter.
(d)The 2022 amount includes a charge of $32.5 million related to a decline in fair value below the cost basis of the investment that was deemed other-than-temporary during the fourth quarter.
VMO2 JV
On June 1, 2021, we completed the U.K. JV Transaction. Each of Liberty Global and Telefónica (each a “U.K. JV Shareholder”) holds 50 50
In connection with the formation of the VMO2 JV, the U.K. JV Shareholders entered into an agreement (the U.K. JV Shareholders Agreement) that contains customary provisions for the governance of a 50 :50 joint venture and provides Liberty Global and Telefónica with joint control over decision making with respect to the VMO2 JV.
The U.K. JV Shareholders Agreement also provides (i) for a dividend distribution policy that requires the VMO2 JV to distribute all unrestricted cash to the U.K. JV Shareholders on a pro rata basis (subject to the VMO2 JV maintaining a minimum amount of cash and complying with the terms of its financing arrangements) and (ii) that the VMO2 JV will be managed with a leverage ratio between 4.0 and 5.0 times EBITDA (as calculated pursuant to its existing financing arrangements), with the VMO2 JV undertaking periodic recapitalizations and/or refinancings accordingly. During 2023 and 2022, we received dividend distributions from the VMO2 JV aggregating $1,242.8 million and $932.5 million, respectively, of which
II-69
LIBERTY GLOBAL LTD.
Notes to Consolidated Financial Statements — (Continued)
December 31, 2023, 2022 and 2021
$815.2 million and $477.9 million, respectively, were accounted for as a return of capital and $427.6 million and $454.6 million, respectively, were accounted for as a return on capital for purposes of our consolidated statements of cash flows. During 2021, we received a dividend distribution from the VMO2 JV of $214.8 million, which was accounted for as a return on capital for purposes of our consolidated statement of cash flows.
Each U.K. JV Shareholder has the right to initiate an initial public offering (IPO) of the VMO2 JV after the third anniversary of the closing, with the opportunity for the other U.K. JV Shareholder to sell shares in the IPO on a pro rata basis. Subject to certain exceptions, the U.K. JV Shareholders Agreement prohibits transfers of interests in the VMO2 JV to third parties until the fifth anniversary of the closing. After the fifth anniversary, each U.K. JV Shareholder will be able to initiate a sale of all of its interest in the VMO2 JV to a third party and, under certain circumstances, initiate a sale of the entire VMO2 JV; subject, in each case, to a right of first offer in favor of the other U.K. JV Shareholder.
Pursuant to an agreement entered into in connection with the closing of the VMO2 JV and amended in December 2023 (the U.K. JV Framework Agreement), Liberty Global provides certain services to the VMO2 JV on a transitional or ongoing basis (collectively, the U.K. JV Services). Pursuant to the terms of the U.K. JV Framework Agreement, the ongoing services, as amended, will be provided through 2029 depending on the type of service, while transitional services will be provided for a period of no less than 12 months, after which both parties shall be entitled to terminate based on specified notice periods. The U.K. JV Services provided by Liberty Global consist primarily of (i) technology and other services and (ii) capital-related expenditures for assets that will be used by or will otherwise benefit the VMO2 JV. Liberty Global charges both fixed and variable fees to the VMO2 JV for the U.K. JV Services it provides during the term of the U.K. JV Framework Agreement. We recorded revenue related to the U.K. JV Services of $190.1 million, $251.2 million and $170.1 million during 2023, 2022 and 2021, respectively. At December 31, 2023 and 2022, $18.6 million and $37.0 million, respectively, was due from the VMO2 JV, primarily related to (a) the U.K. JV Services and (b) amounts incurred by Liberty Global for certain equipment and licenses purchased on behalf of the VMO2 JV. The amounts due from the VMO2 JV, which are periodically cash settled, are included in other current assets on our consolidated balance sheets.
In July 2022, the VMO2 JV entered into a new long-term performance incentive plan (the 2022 VMO2 LTIP) for certain of its employees, dependent on the achievement of specific performance metrics over each of the three years in the period beginning January 1, 2022 and ending on December 31, 2024. Payout may occur in March 2025 and will be settled in Liberty Global Class A and/or Liberty Global Class C common shares and Telefónica ordinary shares, with the settlement split evenly between the U.K. JV Shareholders. Subject to forfeitures, 66.7 % of each participant’s payout will be earned on January 1, 2024 with the remainder earned on December 31, 2024. The 2022 VMO2 LTIP awards are liability classified due to the fact that the final payout will be a fixed monetary amount settled in a variable number of shares. At December 31, 2023, the estimated fair value of Liberty Global’s share of the final payout under the 2022 VMO2 LTIP was $17.4 million. As the VMO2 JV will reimburse the U.K. JV Shareholders in cash for the value of each company’s 50 % payout of the 2022 VMO2 LTIP awards, a receivable from the VMO2 JV equal to the amount of the fair value of our share of the 2022 VMO2 LTIP liability is recorded on our consolidated balance sheet.
During the fourth quarters of 2023 and 2022, the VMO2 JV recorded GAAP goodwill impairments of £2.3 billion ($2.9 billion at the applicable rate) and £3.1 billion ($3.6 billion at the applicable rate), respectively. The impairments recorded primarily related to (i) a decline in projected cash flows resulting from the effects of the broader macroeconomic environment in the U.K., (ii) increases in the weighted average cost of capital (discount rate) under a market participant view and (iii) declines in comparable public company market valuations. Significant judgment was involved in these assessments, including (a) market participant estimates of the discount rates and (b) current earnings multiples of comparable public companies. Our 50
II-70
LIBERTY GLOBAL LTD.
Notes to Consolidated Financial Statements — (Continued)
December 31, 2023, 2022 and 2021
The summarized results of operations of the VMO2 JV are set forth below:
| Year ended December 31, | |||||||||||||||||
| 2023 | 2022 | 2021 (a) | |||||||||||||||
| in millions | |||||||||||||||||
| Revenue | $ | $ | $ | ||||||||||||||
| Loss before income taxes | $ | ( | $ | ( | $ | ( | |||||||||||
| Net loss | $ | ( | $ | ( | $ | ( | |||||||||||
(a)Includes the operating results of the VMO2 JV for the period from June 1, 2021 through December 31, 2021.
The summarized financial position of the VMO2 JV is set forth below:
| December 31, | |||||||||||
| 2023 | 2022 | ||||||||||
| in millions | |||||||||||
| Current assets | $ | $ | |||||||||
| Long-term assets | |||||||||||
| Total assets | $ | $ | |||||||||
| Current liabilities | $ | $ | |||||||||
| Long-term liabilities | |||||||||||
| Owners’ equity | |||||||||||
| Total liabilities and owners’ equity | $ | $ | |||||||||
VodafoneZiggo JV
Each of Liberty Global and Vodafone (each a “NL JV Shareholder”) holds 50 % of the issued share capital of the VodafoneZiggo JV. The NL JV Shareholders intend for the VodafoneZiggo JV to be funded primarily from its net cash flows from operations and third-party financing. We account for our 50 % interest in the VodafoneZiggo JV as an equity method investment and consider the VodafoneZiggo JV to be a related party.
In connection with the formation of the VodafoneZiggo JV, the NL JV Shareholders entered into an agreement (the NL Shareholders Agreement) that contains customary provisions for the governance of a 50 :50 joint venture and provides Liberty Global and Vodafone with joint control over decision making with respect to the VodafoneZiggo JV.
The NL Shareholders Agreement also provides (i) for a dividend distribution policy that requires the VodafoneZiggo JV to distribute all unrestricted cash to the NL JV Shareholders every two months (subject to the VodafoneZiggo JV maintaining a minimum amount of cash and complying with the terms of its financing arrangements) and (ii) that the VodafoneZiggo JV will be managed with a leverage ratio of between 4.5 and 5.0 times EBITDA (as calculated pursuant to its existing financing arrangements), with the VodafoneZiggo JV undertaking periodic recapitalizations and/or refinancings accordingly. During 2023, 2022 and 2021, we received dividend distributions from the VodafoneZiggo JV of $110.2 million, $266.6 million and $311.7 million, respectively, which were accounted for as returns on capital for purposes of our consolidated statements of cash flows.
Each NL JV Shareholder has the right to initiate an IPO of the VodafoneZiggo JV, with the opportunity for the other NL JV Shareholder to sell shares in the IPO on a pro rata basis. As of January 1, 2021, each NL JV Shareholder has the right to initiate a sale of all of its interest in the VodafoneZiggo JV to a third party and, under certain circumstances, initiate a sale of the entire VodafoneZiggo JV, subject, in each case, to a right of first offer in favor of the other NL JV Shareholder.
II-71
LIBERTY GLOBAL LTD.
Notes to Consolidated Financial Statements — (Continued)
December 31, 2023, 2022 and 2021
Pursuant to an agreement (the NL JV Framework Agreement), Liberty Global provides certain services to the VodafoneZiggo JV (collectively, the NL JV Services). The NL JV Services provided by Liberty Global consist primarily of (i) technology and other services and (ii) capital-related expenditures for assets that will be used by, or will otherwise benefit, the VodafoneZiggo JV. Liberty Global charges both fixed and usage-based fees to the VodafoneZiggo JV for the NL JV Services provided during the term of the NL JV Framework Agreement. During 2023, 2022 and 2021, we recorded revenue from the VodafoneZiggo JV of $191.9 million, $263.9 million and $222.0 million, respectively, primarily related to (a) the NL JV Services and (b) the sale of customer premises equipment (CPE) to the VodafoneZiggo JV at a mark-up. At December 31, 2023 and 2022, $24.2 million and $35.0 million, respectively, was due from the VodafoneZiggo JV related to the aforementioned transactions. The amounts due from the VodafoneZiggo JV, which are periodically cash settled, are included in other current assets on our consolidated balance sheets.
The summarized results of operations of the VodafoneZiggo JV are set forth below:
| Year ended December 31, | |||||||||||||||||
| 2023 | 2022 | 2021 | |||||||||||||||
| in millions | |||||||||||||||||
| Revenue | $ | $ | $ | ||||||||||||||
| Earnings (loss) before income taxes | $ | ( | $ | $ | ( | ||||||||||||
| Net earnings (loss) | $ | ( | $ | $ | ( | ||||||||||||
The summarized financial position of the VodafoneZiggo JV is set forth below:
| December 31, | |||||||||||
| 2023 | 2022 | ||||||||||
| in millions | |||||||||||
| Current assets | $ | $ | |||||||||
| Long-term assets | |||||||||||
Total assets | $ | $ | |||||||||
| Current liabilities | $ | $ | |||||||||
| Long-term liabilities | |||||||||||
| Owners’ equity | |||||||||||
Total liabilities and owners’ equity | $ | $ | |||||||||
II-72
LIBERTY GLOBAL LTD.
Notes to Consolidated Financial Statements — (Continued)
December 31, 2023, 2022 and 2021
Fair Value Investments
The following table sets forth the details of our realized and unrealized gains (losses) due to changes in fair values of certain investments, net:
| Year ended December 31, | |||||||||||||||||
| 2023 | 2022 | 2021 | |||||||||||||||
| in millions | |||||||||||||||||
Vodafone | $ | ( | $ | $ | |||||||||||||
Lacework | ( | ( | |||||||||||||||
EdgeConneX | |||||||||||||||||
Plume | ( | ( | |||||||||||||||
ITV | ( | ( | |||||||||||||||
Lionsgate | ( | ||||||||||||||||
SMAs | ( | ( | ( | ||||||||||||||
Aviatrix | ( | ||||||||||||||||
Televisa Univision | ( | ||||||||||||||||
Pax8 | |||||||||||||||||
Skillz Inc. (Skillz) (a) | ( | ( | |||||||||||||||
TiBiT Communications, Inc. (TiBiT) (b) | |||||||||||||||||
| Other, net (c) | ( | ( | |||||||||||||||
| Total | $ | ( | $ | ( | $ | ||||||||||||
_______________
(a)We completed the sale of our investment in Skillz during the first quarter of 2023.
(b)Our investment in TiBiT was sold during the fourth quarter of 2022.
(c)Amounts include gains of $8.0 million, $15.7 million and $12.9 million, in the respective periods shown, related to investments that were sold during the year.
II-73
LIBERTY GLOBAL LTD.
Notes to Consolidated Financial Statements — (Continued)
December 31, 2023, 2022 and 2021
Debt Securities
The following tables set forth a summary of our debt securities at December 31, 2023 and 2022:
| December 31, 2023 | |||||||||||||||||
| Amortized cost basis | Accumulated unrealized gains | Fair value | |||||||||||||||
| in millions | |||||||||||||||||
| Commercial paper | $ | $ | ( | $ | |||||||||||||
| Government bonds | |||||||||||||||||
| Certificates of deposit | |||||||||||||||||
| Corporate debt securities | ( | ||||||||||||||||
| Structured note (a) | (a) | (a) | |||||||||||||||
| Other debt securities | |||||||||||||||||
| Total debt securities | $ | $ | $ | ||||||||||||||
_______________
(a)Amount represents an investment in a leveraged structured note issued by a third party investment bank, which is accounted for at fair value and classified within Level 2 of the fair value hierarchy. For further information regarding our fair value measurements, see note 9. The return on the leveraged structured note is based on changes in the fair value of a proportionate amount of debt issued by various Liberty Global consolidated subsidiaries and affiliates (including the VMO2 JV and the VodafoneZiggo JV). The proportionate amount of debt associated with the return on the leveraged structured note may change from time to time as a result of open market purchases, privately negotiated transactions, tender offers, exchange offers, redemptions or prepayments, in each case, completed by Liberty Global consolidated subsidiaries and affiliates. While the structured note itself contains leverage, our at-risk investment is the estimated fair value as reported. At December 31, 2023, the proportionate amount of debt issued by Liberty Global consolidated subsidiaries and affiliates associated with the return on the leveraged structured note is summarized in the following table:
| Proportion of debt associated with the return on the leveraged structured note | ||||||||
| Subsidiary: | ||||||||
Sunrise Holding | % | |||||||
| Telenet | % | |||||||
| Affiliate: | ||||||||
VMO2 JV | % | |||||||
VodafoneZiggo JV | % | |||||||
| Total | % | |||||||
II-74
LIBERTY GLOBAL LTD.
Notes to Consolidated Financial Statements — (Continued)
December 31, 2023, 2022 and 2021
| December 31, 2022 | |||||||||||||||||
| Amortized cost basis | Accumulated unrealized losses | Fair value | |||||||||||||||
| in millions | |||||||||||||||||
| Commercial paper | $ | $ | $ | ||||||||||||||
| Government bonds | ( | ||||||||||||||||
| Certificates of deposit | ( | ||||||||||||||||
| Corporate debt securities | ( | ||||||||||||||||
| Other debt securities | |||||||||||||||||
| Total debt securities | $ | $ | ( | $ | |||||||||||||
During 2023, 2022 and 2021, we received proceeds from the sale of debt securities of $6.9 billion, $9.1 billion and $6.1 billion, respectively, the majority of which were reinvested in new debt securities held under SMAs. The sale of debt securities during 2023, 2022 and 2021 resulted in realized net losses of $56.3 million, $6.9 million and $2.0 million, respectively.
The fair values of our debt securities as of December 31, 2023 by contractual maturity are shown below (in millions):
| Due in one year or less | $ | ||||
| Due in one to five years | |||||
| Due in five to ten years | |||||
| Total (a) | $ | ||||
_______________
(a)The weighted average life of our total debt securities was 0.6 years as of December 31, 2023.
Our investment portfolio is subject to various macroeconomic pressures and has experienced significant volatility, which affects both our non-public and publicly-traded investments. Changes in the fair values of these investments, including changes with respect to interest rates within our local jurisdictions, are likely to continue and could be significant.
II-75
LIBERTY GLOBAL LTD.
Notes to Consolidated Financial Statements — (Continued)
December 31, 2023, 2022 and 2021
(8) Derivative Instruments
In general, we enter into derivative instruments to protect against (i) increases in the interest rates on our variable-rate debt, (ii) foreign currency movements, particularly with respect to borrowings that are denominated in a currency other than the functional currency of the borrowing entity, and (iii) decreases in the market prices of certain publicly traded securities that we own. In this regard, through our subsidiaries, we have entered into various derivative instruments to manage interest rate exposure and foreign currency exposure, primarily with respect to the U.S. dollar ($), the euro (€), the British pound sterling (£) and the Swiss franc (CHF). Generally, we do not apply hedge accounting to our derivative instruments. Accordingly, changes in the fair values of most of our derivative instruments are recorded in realized and unrealized gains or losses on derivative instruments, net, in our consolidated statements of operations.
The following table provides details of the fair values of our derivative instrument assets and liabilities:
| December 31, 2023 | December 31, 2022 | ||||||||||||||||||||||||||||||||||
| Current | Long-term | Total | Current | Long-term | Total | ||||||||||||||||||||||||||||||
| in millions | |||||||||||||||||||||||||||||||||||
| Assets (a): | |||||||||||||||||||||||||||||||||||
Cross-currency and interest rate derivative contracts (b) | $ | $ | $ | $ | $ | $ | |||||||||||||||||||||||||||||
Equity-related derivative instruments (c) | |||||||||||||||||||||||||||||||||||
Foreign currency forward and option contracts | |||||||||||||||||||||||||||||||||||
| Other | |||||||||||||||||||||||||||||||||||
| Total | $ | $ | $ | $ | $ | $ | |||||||||||||||||||||||||||||
| Liabilities (a): | |||||||||||||||||||||||||||||||||||
Cross-currency and interest rate derivative contracts (b) | $ | $ | $ | $ | $ | $ | |||||||||||||||||||||||||||||
Equity-related derivative instruments (c) | |||||||||||||||||||||||||||||||||||
Foreign currency forward and option contracts | |||||||||||||||||||||||||||||||||||
| Total | $ | $ | $ | $ | $ | $ | |||||||||||||||||||||||||||||
_______________
(a)Our long-term derivative assets and long-term derivative liabilities are included in , and , respectively, on our consolidated balance sheets.
(b)We consider credit risk relating to our and our counterparties’ nonperformance in the fair value assessment of our derivative instruments. In all cases, the adjustments take into account offsetting liability or asset positions within each of our subsidiary borrowing groups (as defined and described in note 11). The changes in the credit risk valuation adjustments associated with our cross-currency and interest rate derivative contracts resulted in net gains (losses) of $36.9 million, ($16.6 million) and ($10.7 million) during 2023, 2022 and 2021, respectively. These amounts are included in realized and unrealized gains (losses) on derivative instruments, net, in our consolidated statements of operations. For further information regarding our fair value measurements, see note 9.
II-76
LIBERTY GLOBAL LTD.
Notes to Consolidated Financial Statements — (Continued)
December 31, 2023, 2022 and 2021
The details of our realized and unrealized gains (losses) on derivative instruments, net, are as follows:
| Year ended December 31, | |||||||||||||||||
| 2023 | 2022 | 2021 | |||||||||||||||
| in millions | |||||||||||||||||
| Cross-currency and interest rate derivative contracts | $ | ( | $ | $ | |||||||||||||
| Equity-related derivative instruments: | |||||||||||||||||
Vodafone Collar | |||||||||||||||||
ITV Collar | ( | ||||||||||||||||
| Total equity-related derivative instruments | ( | ||||||||||||||||
| Foreign currency forward and option contracts | ( | ||||||||||||||||
| Other | ( | ||||||||||||||||
| Total | $ | ( | $ | $ | |||||||||||||
The net cash received or paid related to our derivative instruments is classified as an operating, investing or financing activity in our consolidated statements of cash flows based on the objective of the derivative instrument and the classification of the applicable underlying cash flows. The following table sets forth the classification of the net cash inflows of our derivative instruments:
| Year ended December 31, | |||||||||||||||||
| 2023 | 2022 | 2021 | |||||||||||||||
| in millions | |||||||||||||||||
| Operating activities | $ | $ | $ | ( | |||||||||||||
| Investing activities | ( | ||||||||||||||||
| Financing activities | ( | ( | |||||||||||||||
| Total | $ | $ | $ | ||||||||||||||
Counterparty Credit Risk
We are exposed to the risk that the counterparties to the derivative instruments of our subsidiary borrowing groups will default on their obligations to us. We manage these credit risks through the evaluation and monitoring of the creditworthiness of, and concentration of risk with, the respective counterparties. In this regard, credit risk associated with our derivative instruments is spread across a relatively broad counterparty base of banks and financial institutions, however notwithstanding, given the size of our derivative portfolio, the default of certain counterparties could have a significant impact on our consolidated statements of operations. Collateral is generally not posted by either party under our derivative instruments. At December 31, 2023, our exposure to counterparty credit risk included derivative assets with an aggregate fair value of $232.9 million.
Each of our subsidiary borrowing groups have entered into derivative instruments under master agreements with each counterparty that contain master netting arrangements that are applicable in the event of early termination by either party to such derivative instrument. The master netting arrangements are limited to the derivative instruments governed by the relevant master agreement within each individual borrowing group and are independent of similar arrangements of our other subsidiary borrowing groups.
Under our derivative contracts, it is generally only the non-defaulting party that has a contractual option to exercise early termination rights upon the default of the other counterparty and to set off other liabilities against sums due upon such termination. However, in an insolvency of a derivative counterparty, under the laws of certain jurisdictions, the defaulting counterparty or its insolvency representatives may be able to compel the termination of one or more derivative contracts and trigger early termination payment liabilities payable by us, reflecting any mark-to-market value of the contracts for the counterparty. Alternatively, or in addition, the insolvency laws of certain jurisdictions may require the mandatory set off of
II-77
LIBERTY GLOBAL LTD.
Notes to Consolidated Financial Statements — (Continued)
December 31, 2023, 2022 and 2021
amounts due under such derivative contracts against present and future liabilities owed to us under other contracts between us and the relevant counterparty. Accordingly, it is possible that we may be subject to obligations to make payments, or may have present or future liabilities owed to us partially or fully discharged by set off as a result of such obligations, in the event of the insolvency of a derivative counterparty, even though it is the counterparty that is in default and not us. To the extent that we are required to make such payments, our ability to do so will depend on our liquidity and capital resources at the time. In an insolvency of a defaulting counterparty, we will be an unsecured creditor in respect of any amount owed to us by the defaulting counterparty, except to the extent of the value of any collateral we have obtained from that counterparty.
In addition, where a counterparty is in financial difficulty, under the laws of certain jurisdictions, the relevant regulators may be able to (i) compel the termination of one or more derivative instruments, determine the settlement amount and/or compel, without any payment, the partial or full discharge of liabilities arising from such early termination that are payable by the relevant counterparty, or (ii) transfer the derivative instruments to an alternative counterparty.
Details of our Derivative Instruments
Cross-currency Derivative Contracts
We generally match the denomination of our subsidiaries’ borrowings with the functional currency of the supporting operations or, when it is more cost effective, we provide for an economic hedge against foreign currency exchange rate movements by using derivative instruments to synthetically convert unmatched debt into the applicable underlying currency. At December 31, 2023, substantially all of our debt was either directly or synthetically matched to the applicable functional currencies of the underlying operations. The following table sets forth the total notional amounts and the related weighted average remaining contractual lives of our cross-currency swap contracts at December 31, 2023:
| Notional amount due from counterparty | Notional amount due to counterparty | Weighted average remaining life | |||||||||||||||||||||||||||
| in millions | in years | ||||||||||||||||||||||||||||
Sunrise Holding | $ | € | |||||||||||||||||||||||||||
| $ | CHF | (a) | |||||||||||||||||||||||||||
| € | CHF | ||||||||||||||||||||||||||||
Telenet | $ | € | (a) | ||||||||||||||||||||||||||
| € | $ | (b) | |||||||||||||||||||||||||||
(a)Includes certain derivative instruments that are “forward-starting,” such that the initial exchange occurs at a date subsequent to December 31, 2023. These instruments are typically entered into in order to extend existing hedges without the need to amend existing contracts.
(b)Includes certain derivative instruments that do not involve the exchange of notional amounts at the inception and maturity of the instruments. Accordingly, the only cash flows associated with these derivative instruments are coupon-related payments and receipts.
II-78
LIBERTY GLOBAL LTD.
Notes to Consolidated Financial Statements — (Continued)
December 31, 2023, 2022 and 2021
Interest Rate Swap Contracts
The following table sets forth the total U.S. dollar equivalents of the notional amounts and the related weighted average remaining contractual lives of our interest rate swap contracts at December 31, 2023:
| Pays fixed rate | Receives fixed rate | |||||||||||||||||||||||||||||||
| Notional amount | Weighted average remaining life | Notional amount | Weighted average remaining life | |||||||||||||||||||||||||||||
| in millions | in years | in millions | in years | |||||||||||||||||||||||||||||
Sunrise Holding | $ | (a) | $ | |||||||||||||||||||||||||||||
Telenet | $ | $ | ||||||||||||||||||||||||||||||
| Other (b) | $ | — | $ | |||||||||||||||||||||||||||||
______________
(a)Includes forward-starting derivative instruments.
(b)Represents contracts associated with our investment in a leveraged structured note. For additional information, see note 7.
Basis Swaps
Our basis swaps involve the exchange of attributes used to calculate our floating interest rates, including (i) the benchmark rate, (ii) the underlying currency and/or (iii) the borrowing period. We typically enter into these swaps to optimize our interest rate profile based on our current evaluations of yield curves, our risk management policies and other factors. The following table sets forth the total U.S. dollar equivalents of the notional amounts and related weighted average remaining contractual lives of our basis swap contracts at December 31, 2023:
| Notional amount due from counterparty | Weighted average remaining life | |||||||||||||
| in millions | in years | |||||||||||||
Sunrise Holding | $ | — | ||||||||||||
Telenet | $ | |||||||||||||
VM Ireland | $ | — | ||||||||||||
Interest Rate Caps, Floors and Collars
From time to time, we enter into interest rate cap, floor and collar agreements. Purchased interest rate caps and collars lock in a maximum interest rate if variable rates rise, but also allow our company to benefit, to a limited extent in the case of collars, from declines in market rates. Purchased interest rate floors protect us from interest rates falling below a certain level, generally to match a floating rate floor on a debt instrument. At December 31, 2023, we had no interest rate collar agreements, and the total U.S. dollar equivalents of the notional amounts of our purchased interest rate caps and floors were $1.3 billion and $6.0 billion, respectively.
II-79
LIBERTY GLOBAL LTD.
Notes to Consolidated Financial Statements — (Continued)
December 31, 2023, 2022 and 2021
Impact of Derivative Instruments on Borrowing Costs
The impact of the derivative instruments that mitigate our foreign currency and interest rate risk, as described above, on our borrowing costs is as follows:
Decrease to borrowing costs at December 31, 2023 (a) | |||||||||||
Sunrise Holding | ( | % | |||||||||
| VM Ireland | ( | % | |||||||||
| Telenet | ( | % | |||||||||
| Total decrease to borrowing costs | ( | % | |||||||||
_______________
(a)Represents the effect of derivative instruments in effect at December 31, 2023 and does not include forward-starting derivative instruments.
Foreign Currency Forwards and Options
Certain of our subsidiaries enter into foreign currency forward and option contracts with respect to non-functional currency exposure, including hedges of the proceeds from the sale of UPC Poland. As of December 31, 2023, the total U.S. dollar equivalent of the notional amounts of our foreign currency forward and option contracts was $820.6 million.
Equity-related Derivative Instruments
Vodafone Collar and Vodafone Collar Loan. As part of the Vodafone Collar Transaction, on February 11, 2023, we entered into the Vodafone Collar with respect to all 1,335 million of our Vodafone shares. The Vodafone Collar is comprised of (i) purchase put options that we can exercise and (ii) written call options exercisable by the counterparty. The Vodafone Collar effectively hedges the value of our investment in Vodafone shares from potential losses due to market price decreases below the put option price while retaining a portion of the gains from market price increases up to the call option price. For additional information regarding our investment in Vodafone, see note 7.
(9) Fair Value Measurements
We use the fair value method to account for (i) certain of our investments and (ii) our derivative instruments. The reported fair values of these investments and derivative instruments as of December 31, 2023 are unlikely to represent the value that will be paid or received upon the ultimate settlement or disposition of these assets and liabilities.
GAAP provides for a fair value hierarchy that prioritizes the inputs to valuation techniques used to measure fair value into three broad levels. Level 1 inputs are quoted market prices in active markets for identical assets or liabilities that the reporting entity has the ability to access at the measurement date. Level 2 inputs are inputs other than quoted market prices included
II-80
LIBERTY GLOBAL LTD.
Notes to Consolidated Financial Statements — (Continued)
December 31, 2023, 2022 and 2021
within Level 1 that are observable for the asset or liability, either directly or indirectly. Level 3 inputs are unobservable inputs for the asset or liability. We record transfers of assets or liabilities into or out of Levels 1, 2 or 3 at the beginning of the quarter during which the transfer occurred. During 2023, no material transfers were made.
All of our Level 2 inputs (interest rate futures, swap rates and certain of the inputs for our weighted average cost of capital calculations) and certain of our Level 3 inputs (forecasted volatilities and credit spreads) are obtained from pricing services. These inputs, or interpolations or extrapolations thereof, are used in our internal models to calculate, among other items, yield curves, forward interest and currency rates and weighted average cost of capital rates. In the normal course of business, we receive market value assessments from the counterparties to our derivative contracts. Although we compare these assessments to our internal valuations and investigate unexpected differences, we do not otherwise rely on counterparty quotes to determine the fair values of our derivative instruments. The midpoints of applicable bid and ask ranges generally are used as inputs for our internal valuations.
For our investments in publicly-traded companies, the recurring fair value measurements are based on the quoted closing price of the respective shares at each reporting date. Accordingly, the valuations of these investments fall under Level 1 of the fair value hierarchy. Our other investments that we account for at fair value are privately-held companies, and therefore, quoted market prices are unavailable. For such investments, we generally apply a measurement alternative to record these investments at cost less impairment, adjusted for observable price changes in orderly transactions. For those privately-held investments for which we do not apply the measurement alternative, we apply a combination of an income approach (discounted cash flow model based on forecasts) and a market approach (transactions with new third-party investors or market multiples of similar businesses). With the exception of certain inputs for our weighted average cost of capital calculations that are derived from pricing services, the inputs used to value these investments are based on unobservable inputs derived from our assumptions. Therefore, the valuation of our privately-held investments falls under Level 3 of the fair value hierarchy. Any reasonably foreseeable changes in assumed levels of unobservable inputs for the valuations of our Level 3 investments would not be expected to have a material impact on our financial position or results of operations.
The recurring fair value measurements of our equity-related derivative instruments are based on standard option pricing models, which require the input of observable and unobservable variables such as exchange-traded equity prices, risk-free interest rates, dividend forecasts and forecasted volatilities of the underlying equity securities. The valuations of our equity-related derivative instruments are based on a combination of Level 1 inputs (exchange-traded equity prices), Level 2 inputs (interest rate futures and swap rates) and Level 3 inputs (forecasted volatilities). As changes in volatilities could have a significant impact on the overall valuations over the terms of the derivative instruments, we have determined that these valuations fall under Level 3 of the fair value hierarchy. For the December 31, 2023 valuation of the Vodafone Collar, we used estimated volatilities based predominantly on market observations.
In order to manage our interest rate and foreign currency exchange risk, we have entered into various derivative instruments, as further described in note 8. The recurring fair value measurements of these instruments are determined using discounted cash flow models. Most of the inputs to these discounted cash flow models consist of, or are derived from, observable Level 2 data for substantially the full term of these instruments. This observable data mostly includes currency rates, interest rate futures and swap rates, which are retrieved or derived from available market data. Although we may extrapolate or interpolate this data, we do not otherwise alter this data in performing our valuations. We classify deal-contingent hedges under Level 3 of the fair value hierarchy, as we adjust the valuations to reflect an internal judgement of the probability of the completion of the deal, which is unobservable. We use a Monte Carlo based approach to incorporate a credit risk valuation adjustment in our fair value measurements to estimate the impact of both our own nonperformance risk and the nonperformance risk of our counterparties. The inputs used for our credit risk valuations, including our and our counterparties’ credit spreads, represent our most significant Level 3 inputs, and these inputs are used to derive the credit risk valuation adjustments with respect to these instruments. As we would not expect these parameters to have a significant impact on the valuations of these instruments, we have determined that these valuations fall under Level 2 of the fair value hierarchy. Our credit risk valuation adjustments with respect to our cross-currency and interest rate swap contracts are quantified and further explained in note 8.
Fair value measurements are also used for nonrecurring valuations performed in connection with acquisition accounting and impairment assessments. These nonrecurring valuations include the valuation of reporting units, customer relationships and other intangible assets, property and equipment and the implied value of goodwill. The valuation of reporting units is based on an income-based approach (discounted cash flows) based on assumptions in our long-range business plans or a market-based approach (current multiples of comparable public companies and guideline transactions) and, in some cases, a combination of
II-81
LIBERTY GLOBAL LTD.
Notes to Consolidated Financial Statements — (Continued)
December 31, 2023, 2022 and 2021
an income-based approach and a market-based approach. With the exception of certain inputs for our weighted average cost of capital and discount rate calculations that are derived from pricing services, the inputs used in our discounted cash flow analyses, such as forecasts of future cash flows, including inputs with respect to revenue growth and Adjusted EBITDA margin (as defined in note 19), and terminal growth rates, are based on our assumptions. The valuation of customer relationships is primarily based on an excess earnings methodology, which is a form of a discounted cash flow analysis. The excess earnings methodology requires us to estimate the specific cash flows expected from the customer relationship, considering such factors as estimated customer life, the revenue expected to be generated over the life of the customer relationship, contributory asset charges and other factors. Tangible assets are typically valued using a replacement or reproduction cost approach, considering factors such as current prices of the same or similar equipment, the age of the equipment and economic obsolescence. The implied value of goodwill is determined by allocating the fair value of a reporting unit to all of the assets and liabilities of that unit as if the reporting unit had been acquired in a business combination, with the residual amount allocated to goodwill. Most of our nonrecurring valuations use significant unobservable inputs and therefore fall under Level 3 of the fair value hierarchy. During 2023, we performed a nonrecurring valuation in association with the Telenet Wyre Transaction. The tangible asset value of the cable infrastructure contributed by Fluvius was based on the depreciated replacement cost method with a range of estimated useful lives up to 19 years. During 2022, we did not perform any significant nonrecurring fair value measurements.
A summary of our assets and liabilities that are measured at fair value on a recurring basis is as follows:
Fair value measurements at December 31, 2023 using: | ||||||||||||||||||||||||||
| Description | December 31, 2023 | Quoted prices in active markets for identical assets (Level 1) | Significant other observable inputs (Level 2) | Significant unobservable inputs (Level 3) | ||||||||||||||||||||||
| in millions | ||||||||||||||||||||||||||
| Assets: | ||||||||||||||||||||||||||
| Derivative instruments: | ||||||||||||||||||||||||||
| Cross-currency and interest rate derivative contracts | $ | $ | $ | $ | ||||||||||||||||||||||
| Equity-related derivative instruments | ||||||||||||||||||||||||||
| Foreign currency forward and option contracts | ||||||||||||||||||||||||||
| Other | ||||||||||||||||||||||||||
| Total derivative instruments | ||||||||||||||||||||||||||
| Investments: | ||||||||||||||||||||||||||
SMAs | ||||||||||||||||||||||||||
| Other investments | ||||||||||||||||||||||||||
| Total investments | ||||||||||||||||||||||||||
| Total assets | $ | $ | $ | $ | ||||||||||||||||||||||
| Liabilities: | ||||||||||||||||||||||||||
| Derivative instruments: | ||||||||||||||||||||||||||
| Cross-currency and interest rate derivative contracts | $ | $ | $ | $ | ||||||||||||||||||||||
| Equity-related derivative instruments | ||||||||||||||||||||||||||
| Foreign currency forward and option contracts | ||||||||||||||||||||||||||
| Total liabilities | $ | $ | $ | $ | ||||||||||||||||||||||
II-82
LIBERTY GLOBAL LTD.
Notes to Consolidated Financial Statements — (Continued)
December 31, 2023, 2022 and 2021
Fair value measurements at December 31, 2022 using: | ||||||||||||||||||||||||||
| Description | December 31, 2022 | Quoted prices in active markets for identical assets (Level 1) | Significant other observable inputs (Level 2) | Significant unobservable inputs (Level 3) | ||||||||||||||||||||||
| in millions | ||||||||||||||||||||||||||
| Assets: | ||||||||||||||||||||||||||
| Derivative instruments: | ||||||||||||||||||||||||||
| Cross-currency and interest rate derivative contracts | $ | $ | $ | $ | ||||||||||||||||||||||
| Foreign currency forward and option contracts | ||||||||||||||||||||||||||
| Other | ||||||||||||||||||||||||||
| Total derivative instruments | ||||||||||||||||||||||||||
| Investments: | ||||||||||||||||||||||||||
SMAs | ||||||||||||||||||||||||||
| Other investments | ||||||||||||||||||||||||||
| Total investments | ||||||||||||||||||||||||||
| Total assets | $ | $ | $ | $ | ||||||||||||||||||||||
| Liabilities: | ||||||||||||||||||||||||||
| Derivative instruments: | ||||||||||||||||||||||||||
| Cross-currency and interest rate derivative contracts | $ | $ | $ | $ | ||||||||||||||||||||||
| Foreign currency forward and option contracts | ||||||||||||||||||||||||||
| Total liabilities | $ | $ | $ | $ | ||||||||||||||||||||||
A reconciliation of the beginning and ending balances of our assets and liabilities measured at fair value on a recurring basis using significant unobservable, or Level 3, inputs is as follows:
| Investments | Equity-related derivative instruments | Total | |||||||||||||||
| in millions | |||||||||||||||||
Balance of net assets at January 1, 2023 | $ | $ | $ | ||||||||||||||
| Gains (losses) included in earnings from continuing operations (a): | |||||||||||||||||
| ( | ( | ||||||||||||||||
| Additions | |||||||||||||||||
| Dispositions | ( | ( | |||||||||||||||
| Foreign currency translation adjustments and other, net | |||||||||||||||||
Balance of net assets at December 31, 2023 (b) | $ | $ | $ | ||||||||||||||
_______________
(a)Amounts primarily relate to assets and liabilities that we continue to carry on our consolidated balance sheet as of December 31, 2023.
(b)As of December 31, 2023, $361.8 million of our Level 3 investments were accounted for under the measurement alternative at cost less impairment, adjusted for observable price changes.
II-83
LIBERTY GLOBAL LTD.
Notes to Consolidated Financial Statements — (Continued)
December 31, 2023, 2022 and 2021
(10) Long-lived Assets
Property and Equipment, Net
The details of our property and equipment and the related accumulated depreciation are set forth below:
Estimated useful life at December 31, 2023 | December 31, | ||||||||||||||||
| 2023 | 2022 | ||||||||||||||||
| in millions | |||||||||||||||||
Distribution systems | $ | $ | |||||||||||||||
Support equipment, buildings and land | |||||||||||||||||
| Customer premises equipment | |||||||||||||||||
Total property and equipment, gross | |||||||||||||||||
Accumulated depreciation | ( | ( | |||||||||||||||
Total property and equipment, net | $ | $ | |||||||||||||||
Depreciation expense related to our property and equipment was $1,856.9 million, $1,727.7 million and $1,883.2 million during 2023, 2022 and 2021, respectively.
During 2023, 2022 and 2021, we recorded non-cash increases to our property and equipment related to vendor financing arrangements (including amounts related to the U.K. JV Entities through the closing of the U.K. JV Transaction) of $178.4 million, $182.8 million and $661.1 million, respectively, which exclude related VAT of $18.4 million, $21.2 million and $84.7 million, respectively, that were also financed under these arrangements.
Goodwill
Changes in the carrying amount of our goodwill during 2023 are set forth below:
January 1, 2023 | Acquisitions and related adjustments | Foreign currency translation adjustments and other | December 31, 2023 | ||||||||||||||||||||
| in millions | |||||||||||||||||||||||
| Sunrise | $ | $ | $ | $ | |||||||||||||||||||
| Telenet | ( | ||||||||||||||||||||||
| VM Ireland | |||||||||||||||||||||||
| Central and Other | |||||||||||||||||||||||
| Total | $ | $ | $ | $ | |||||||||||||||||||
If, among other factors, the adverse impacts of economic, competitive, regulatory or other factors were to cause our results of operations or cash flows to be worse than anticipated, we could conclude in future periods that impairment charges are required in order to reduce the carrying values of our goodwill and, to a lesser extent, other long-lived assets. Any such impairment charges could be significant.
II-84
LIBERTY GLOBAL LTD.
Notes to Consolidated Financial Statements — (Continued)
December 31, 2023, 2022 and 2021
Changes in the carrying amount of our goodwill during 2022 are set forth below:
January 1, 2022 | Acquisitions and related adjustments | Foreign currency translation adjustments and other | December 31, 2022 | ||||||||||||||||||||
| in millions | |||||||||||||||||||||||
| Sunrise | $ | $ | $ | ( | $ | ||||||||||||||||||
| Telenet | ( | ||||||||||||||||||||||
| VM Ireland | ( | ||||||||||||||||||||||
Central and Other | ( | ||||||||||||||||||||||
| Total | $ | $ | $ | ( | $ | ||||||||||||||||||
Intangible Assets Subject to Amortization, Net
The details of our intangible assets subject to amortization are set forth below:
| Estimated useful life at December 31, 2023 | December 31, 2023 | December 31, 2022 | |||||||||||||||||||||||||||||||||||||||
| Gross carrying amount | Accumulated amortization | Net carrying amount | Gross carrying amount | Accumulated amortization | Net carrying amount | ||||||||||||||||||||||||||||||||||||
| in millions | |||||||||||||||||||||||||||||||||||||||||
Customer relationships | $ | $ | ( | $ | $ | $ | ( | $ | |||||||||||||||||||||||||||||||||
| Other | ( | ( | |||||||||||||||||||||||||||||||||||||||
| Total | $ | $ | ( | $ | $ | $ | ( | $ | |||||||||||||||||||||||||||||||||
During the third quarter of 2022, Telenet acquired certain mobile spectrum licenses. In connection with this transaction, we recorded a non-cash increase of $384.1 million to our intangible assets subject to amortization.
Amortization expense related to intangible assets with finite useful lives was $458.3 million, $443.7 million and $470.5 million during 2023, 2022 and 2021, respectively. Based on our amortizable intangible asset balance at December 31, 2023, we expect that amortization expense will be as follows for the next five years and thereafter (in millions):
| 2024 | $ | ||||
| 2025 | |||||
| 2026 | |||||
| 2027 | |||||
| 2028 | |||||
| Thereafter | |||||
| Total | $ | ||||
II-85
LIBERTY GLOBAL LTD.
Notes to Consolidated Financial Statements — (Continued)
December 31, 2023, 2022 and 2021
(11) Debt
The U.S. dollar equivalents of the components of our debt are as follows:
| December 31, 2023 | Principal amount | ||||||||||||||||||||||||||||
| Weighted average interest rate (a) | Unused borrowing capacity (b) | ||||||||||||||||||||||||||||
| Borrowing currency | U.S. $ equivalent | December 31, | |||||||||||||||||||||||||||
| 2023 | 2022 | ||||||||||||||||||||||||||||
| in millions | |||||||||||||||||||||||||||||
Sunrise Holding Bank Facility (c) | % | € | $ | $ | $ | ||||||||||||||||||||||||
Sunrise Holding SPE Notes | % | — | — | ||||||||||||||||||||||||||
| Sunrise Holding Senior Notes | % | — | — | ||||||||||||||||||||||||||
Telenet Credit Facility (d) | % | € | |||||||||||||||||||||||||||
Telenet Senior Secured Notes | % | — | — | ||||||||||||||||||||||||||
VM Ireland Credit Facility (e) | % | € | |||||||||||||||||||||||||||
| Vodafone Collar Loan (f) | % | — | — | ||||||||||||||||||||||||||
| Vendor financing (g) | % | — | — | ||||||||||||||||||||||||||
| Other (h) | % | — | — | ||||||||||||||||||||||||||
| Total debt before deferred financing costs, discounts and premiums (i) | % | $ | $ | $ | |||||||||||||||||||||||||
The following table provides a reconciliation of total debt before deferred financing costs, discounts and premiums to total debt and finance lease obligations:
| December 31, | |||||||||||
| 2023 | 2022 | ||||||||||
| in millions | |||||||||||
Total debt before deferred financing costs, discounts and premiums | $ | $ | |||||||||
Deferred financing costs, discounts and premiums, net | ( | ( | |||||||||
Total carrying amount of debt | |||||||||||
Finance lease obligations (note 12) | |||||||||||
Total debt and finance lease obligations | |||||||||||
| Current portion of debt and finance lease obligations | ( | ( | |||||||||
Long-term debt and finance lease obligations | $ | $ | |||||||||
_______________
(a)Represents the weighted average interest rate in effect at December 31, 2023 for all borrowings outstanding pursuant to each debt instrument, including any applicable margin. The interest rates presented represent stated rates and do not include the impact of derivative instruments, deferred financing costs, original issue premiums or discounts and commitment fees, all of which affect our overall cost of borrowing. Including the effects of derivative instruments, original issue premiums or discounts and commitment fees, but excluding the impact of deferred financing costs and certain other obligations that we assumed in connection with certain acquisitions, the weighted average interest rate on our aggregate variable- and fixed-rate indebtedness was 3.45 % at December 31, 2023. The weighted average interest rate calculation includes principal amounts outstanding associated with all of our secured and unsecured borrowings. For information regarding our derivative instruments, see note 8.
(b)Unused borrowing capacity represents the maximum availability under the applicable facility at December 31, 2023 without regard to covenant compliance calculations or other conditions precedent to borrowing. The following table
II-86
LIBERTY GLOBAL LTD.
Notes to Consolidated Financial Statements — (Continued)
December 31, 2023, 2022 and 2021
provides our borrowing availability and amounts available to loan or distribute in accordance with the terms of the respective subsidiary facilities, (i) at December 31, 2023 and (ii) upon completion of the relevant December 31, 2023 compliance reporting requirements. These amounts do not consider any actual or potential changes to our borrowing levels or any amounts loaned or distributed subsequent to December 31, 2023, or the full impact of additional amounts that may be available to borrow, loan or distribute under certain defined baskets within each respective facility.
| Availability | |||||||||||||||||||||||
December 31, 2023 | Upon completion of the relevant December 31, 2023 compliance reporting requirements | ||||||||||||||||||||||
| Borrowing currency | U.S. $ equivalent | Borrowing currency | U.S. $ equivalent | ||||||||||||||||||||
| in millions | |||||||||||||||||||||||
| Available to borrow: | |||||||||||||||||||||||
Sunrise Holding Bank Facility | € | $ | € | $ | |||||||||||||||||||
Telenet Credit Facility | € | $ | € | $ | |||||||||||||||||||
VM Ireland Credit Facility | € | $ | € | $ | |||||||||||||||||||
| Available to loan or distribute: | |||||||||||||||||||||||
Sunrise Holding Bank Facility | € | $ | € | $ | |||||||||||||||||||
Telenet Credit Facility | € | $ | € | $ | |||||||||||||||||||
VM Ireland Credit Facility | € | $ | € | $ | |||||||||||||||||||
(c)Unused borrowing capacity under the Sunrise Holding Bank Facility relates to an equivalent €725.0 million ($802.2 million) under the Sunrise Holding Revolving Facility, comprising (i) €660.0 million ($730.3 million) under Sunrise Holding Revolving Facility B (as defined below) and (ii) €65.0 million ($71.9 million) under Sunrise Holding Revolving Facility A (as defined below). The Sunrise Holding Revolving Facility provides for maximum borrowing capacity of €748.0 million ($827.6 million), including €23.0 million ($25.4 million) under the related ancillary facility. With the exception of €23.0 million of borrowings under the ancillary facility, the Sunrise Holding Revolving Facility was undrawn at December 31, 2023. During 2023, the Sunrise Holding Bank Facility was amended to replace LIBOR with the Term Secured Overnight Financing Rate (Term SOFR) as the reference rate for U.S. dollar-denominated loans. In addition, the Sunrise Holding Revolving Facility was amended to provide for an additional €11.6 million ($12.8 million) of borrowing capacity and was split into two revolving facilities. Sunrise Holding Revolving Facility A has a maximum borrowing capacity of €88.0 million ($97.3 million), including €23.0 million under the ancillary facility, and a final maturity date of May 31, 2026 and Sunrise Holding Revolving Facility B has a maximum borrowing capacity of €660.0 million and a final maturity date of September 30, 2029. All other terms from the previously existing Sunrise Holding Revolving Facility continue to apply to the new revolving facilities.
(d)Unused borrowing capacity under the Telenet Credit Facility comprises (i) €570.0 million ($630.7 million) under Telenet Revolving Facility B (as defined below), (ii) €30.0 million ($33.2 million) under Telenet Revolving Facility A (as defined below), (iii) €25.0 million ($27.7 million) under the Telenet Overdraft Facility and (iv) €20.0 million ($22.1 million) under the Telenet Revolving Facility, each of which were undrawn at December 31, 2023. During 2023, the Telenet Credit Facility was amended to replace LIBOR with Term SOFR as the reference rate for U.S. dollar-denominated loans. In addition, Telenet Revolving Facility I was amended to provide for an additional €90.0 million ($99.6 million) of borrowing capacity and was split into two revolving facilities. Telenet Revolving Facility A has a maximum borrowing capacity of €30.0 million and a final maturity date of May 31, 2026 and Telenet Revolving Facility B has a maximum borrowing capacity of €570.0 million and a final maturity date of May 31, 2029. All other terms from the previously existing Telenet Revolving Facility I continue to apply to the new revolving facilities.
(e)Unused borrowing capacity under the VM Ireland Credit Facility relates to €100.0 million ($110.6 million) under the VM Ireland Revolving Facility, which was undrawn at December 31, 2023.
II-87
LIBERTY GLOBAL LTD.
Notes to Consolidated Financial Statements — (Continued)
December 31, 2023, 2022 and 2021
(f)For information regarding the Vodafone Collar Loan, see notes 7 and 8.
(g)Represents amounts owed to various creditors pursuant to interest-bearing vendor financing arrangements that are used to finance certain of our property and equipment additions and operating expenses. These arrangements extend our repayment terms beyond a vendor’s original due dates (e.g., extension beyond a vendor’s customary payment terms, which are generally 90 days or less) and as such are classified outside of accounts payable as debt on our consolidated balance sheets. These obligations are generally due within one year and include VAT that was also financed under these arrangements. For purposes of our consolidated statements of cash flows, operating-related expenses financed by an intermediary are treated as constructive operating cash outflows and constructive financing cash inflows when the intermediary settles the liability with the vendor as there is no actual cash outflow until we pay the financing intermediary. During 2023 and 2022, the constructive cash outflow included in cash flows from operating activities and the corresponding constructive cash inflow included in cash flows from financing activities related to these operating expenses were $648.5 million and $522.7 million, respectively. Repayments of vendor financing obligations at the time we pay the financing intermediary are included in repayments and repurchases of debt and finance lease obligations in our consolidated statements of cash flows.
(h)Amounts include $430.8 million and $428.1 million at December 31, 2023 and 2022, respectively, of liabilities related to Telenet’s acquisition of mobile spectrum licenses. Telenet will make annual payments for the license fees over the terms of the respective licenses. For additional information regarding Telenet’s acquisition of mobile spectrum licenses, see note 10.
(i)As of December 31, 2023 and 2022, our debt had an estimated fair value of $15.5 billion and $12.6 billion, respectively. The estimated fair values of our debt instruments are generally determined using the average of applicable bid and ask prices (mostly Level 1 of the fair value hierarchy). For additional information regarding fair value hierarchies, see note 9.
General Information
At December 31, 2023, most of our outstanding debt had been incurred by one of our three subsidiary “borrowing groups.” References to these borrowing groups, which comprise Sunrise Holding, Telenet and VM Ireland, include their respective restricted parent and subsidiary entities.
Credit Facilities. Each of our borrowing groups has entered into one or more credit facility agreements with certain financial and other institutions. Certain of our credit facilities provide for adjustments to our borrowing rates based on the achievement, or otherwise, of certain sustainability-linked metrics. Each of these credit facilities contain certain covenants, the more notable of which are as follows:
•Our credit facilities contain certain consolidated net leverage ratios, as specified in the relevant credit facility, which are required to be complied with (i) on an incurrence basis and/or (ii) when the associated revolving credit facilities have been drawn beyond a specified percentage of the total available revolving credit commitments on a maintenance basis;
•Subject to certain customary and agreed exceptions, our credit facilities contain certain restrictions which, among other things, restrict the ability of the members of the relevant borrowing group to (i) incur or guarantee certain financial indebtedness, (ii) make certain disposals and acquisitions, (iii) create certain security interests over their assets and (iv) make certain restricted payments to their direct and/or indirect parent companies (and indirectly to Liberty Global) through dividends, loans or other distributions;
•Our credit facilities require that certain members of the relevant borrowing group guarantee the payment of all sums payable under the relevant credit facility and such group members are required to grant first-ranking security over their shares and, in certain borrowing groups, over substantially all of their assets to secure the payment of all sums payable thereunder;
•In addition to certain mandatory prepayment events, our credit facilities provide that the instructing group of lenders under the relevant credit facility, under certain circumstances, may cancel the group’s commitments thereunder and
II-88
LIBERTY GLOBAL LTD.
Notes to Consolidated Financial Statements — (Continued)
December 31, 2023, 2022 and 2021
declare the loan(s) thereunder due and payable after the applicable notice period following the occurrence of a change of control (as specified in the relevant credit facility);
•Our credit facilities contain certain customary events of default, the occurrence of which, subject to certain exceptions, materiality qualifications and cure rights, would allow the instructing group of lenders to (i) cancel the total commitments, (ii) declare that all or part of the loans be payable on demand and/or (iii) accelerate all outstanding loans and terminate their commitments thereunder;
•Our credit facilities require members of the relevant borrowing group to observe certain affirmative and negative undertakings and covenants, which are subject to certain materiality qualifications and other customary and agreed exceptions; and
•In addition to customary default provisions, our credit facilities generally include certain cross-default or cross-acceleration provisions with respect to other indebtedness of members of the relevant borrowing group, subject to agreed minimum thresholds and other customary and agreed exceptions.
Senior and Senior Secured Notes. Certain of our borrowing groups have issued senior and/or senior secured notes. In general, our senior and senior secured notes (i) are senior obligations of each respective issuer within the relevant borrowing group that rank equally with all of the existing and future senior debt of such issuer and are senior to all existing and future subordinated debt of such issuer within the relevant borrowing group, (ii) contain, in most instances, certain guarantees from other members of the relevant borrowing group (as specified in the applicable indenture) and (iii) with respect to our senior secured notes, are secured by certain pledges or liens over the shares of certain members of the relevant borrowing group and, in certain borrowing groups, over substantially all of their assets. In addition, the indentures governing our senior and senior secured notes contain certain covenants, the more notable of which are as follows:
•Our notes contain certain customary incurrence-based covenants. In addition, our notes provide that any failure to pay principal at its stated maturity (after giving effect to any applicable grace period) of, or any acceleration with respect to, other indebtedness of the issuer or certain subsidiaries over agreed minimum thresholds (as specified under the applicable indenture) is an event of default under the respective notes;
•Subject to certain customary and agreed exceptions, our notes contain certain restrictions that, among other things, restrict the ability of the members of the relevant borrowing group to (i) incur or guarantee certain financial indebtedness, (ii) make certain disposals and acquisitions, (iii) create certain security interests over their assets and (iv) make certain restricted payments to its direct and/or indirect parent companies (and indirectly to Liberty Global) through dividends, loans or other distributions;
•If the relevant issuer or certain of its subsidiaries (as specified in the applicable indenture) sell certain assets, such issuer must, subject to certain customary and agreed exceptions, offer to repurchase the applicable notes at par, or if a change of control (as specified in the applicable indenture) occurs, such issuer must offer to repurchase all of the relevant notes at a redemption price of 101 %;
•Our senior secured notes contain certain early redemption provisions including the ability to, during each 12 -month period commencing on the issue date for such notes until the applicable call date, redeem up to 10 % of the principal amount of the notes at a redemption price equal to 103 % of the principal amount of the notes to be redeemed plus accrued and unpaid interest; and
•Our notes are non-callable prior to their respective call date (as specified under the applicable indenture). At any time prior to the applicable call date, we may redeem some or all of the applicable notes by paying a “make-whole” premium, which is the present value of all remaining scheduled interest payments to the applicable call date using the discount rate as of the redemption date plus a premium (as specified in the applicable indenture). On or after the applicable call date, we may redeem some or all of these notes at various redemption prices plus accrued interest and additional amounts (as specified in the applicable indenture), if any, to the applicable redemption date.
II-89
LIBERTY GLOBAL LTD.
Notes to Consolidated Financial Statements — (Continued)
December 31, 2023, 2022 and 2021
SPE Notes. From time to time, we create special purpose financing entities (SPEs), some of which are owned by the relevant borrowing group and some of which are owned by third parties (Third-Party SPEs). These SPEs are created for the primary purpose of facilitating the offering of senior secured notes, which we collectively refer to as “SPE Notes”.
The SPEs use the proceeds from the issuance of SPE Notes to fund term loan facilities under the credit facilities made available to their respective borrowing group, each a “Funded Facility” and collectively the “Funded Facilities.” Each SPE is dependent on payments from the relevant borrowing entity under the applicable Funded Facility in order to service its payment obligations under each respective SPE Note. Each of the Funded Facility term loans creates a variable interest in the respective Third-Party SPE for which the relevant borrowing entity is the primary beneficiary. Accordingly, such Third-Party SPEs are consolidated by the relevant parent entities, including Liberty Global. As a result, the amounts outstanding under the Funded Facilities of the SPEs owned by the relevant borrowing group and the Third-Party SPEs are eliminated in the consolidated financial statements of the respective borrowing group and Liberty Global. At December 31, 2023, we had outstanding SPE Notes issued by a Third-Party SPE consolidated by Sunrise Holding (the Sunrise Holding SPE).
Pursuant to the respective indentures for the SPE Notes (the SPE Indentures) and the respective accession agreements for the Funded Facilities, the call provisions, maturity dates and applicable interest rates for each Funded Facility are the same as those of the related SPE Notes. The SPEs, as lenders under the relevant Funded Facility for the relevant borrowing group, are treated the same as the other lenders under the respective credit facility, with benefits, rights and protections similar to those afforded to the other lenders. Through the covenants in the applicable SPE Indentures and the applicable security interests over the relevant SPE’s rights under the applicable Funded Facility granted to secure the relevant SPE’s obligations under the relevant SPE Notes, the holders of the SPE Notes are provided indirectly with the benefits, rights, protections and covenants granted to the SPEs as lenders under the applicable Funded Facility. The SPEs are prohibited from incurring any additional indebtedness, subject to certain exceptions under the SPE Indentures.
The SPE Notes are non-callable prior to their respective call date (as specified under the applicable SPE Indenture). If, however, at any time prior to the applicable call date, all or a portion of the loans under the related Funded Facility are voluntarily prepaid (a SPE Early Redemption Event), then the SPE will be required to redeem an aggregate principal amount of its respective SPE Notes equal to the aggregate principal amount of the loans prepaid under the relevant Funded Facility. In general, the redemption price payable will equal 100 % of the principal amount of the applicable SPE Notes to be redeemed and a “make-whole” premium, which is the present value of all remaining scheduled interest payments to the applicable call date using the discount rate as of the redemption date plus a premium (as specified in the applicable SPE Indenture).
Upon the occurrence of a SPE Early Redemption Event on or after the applicable call date, the SPE will redeem an aggregate principal amount of its respective SPE Notes equal to the principal amount prepaid under the related Funded Facility at a redemption price (expressed as a percentage of the principal amount) plus accrued and unpaid interest and additional amounts (as specified in the applicable SPE Indenture), if any, to the applicable redemption date.
Financing Transactions
Below we provide summary descriptions of certain financing transactions completed during 2023, 2022 and 2021. A portion of our financing transactions may include non-cash borrowings and repayments. During 2023, 2022 and 2021, non-cash borrowings and repayments aggregated nil , nil and $2.9 billion, respectively.
Telenet - 2023 Financing Transactions
In November 2023, Telenet entered into a €890.0 million ($984.7 million) sustainability-linked term loan facility (Telenet Facility AT1). Telenet Facility AT1 was issued at par, matures on November 10, 2028 and bears interest at a rate of EURIBOR + 3.0 %, subject to a EURIBOR floor of 0.0 %. The interest rate on Telenet Facility AT1 is subject to adjustment based on the achievement or otherwise of certain Environmental, Social and Governance (ESG) metrics. The proceeds from Telenet Facility AT1 were used to fund a dividend distribution to Liberty Global Belgium Holding B.V. (LGBH), an indirect wholly-owned subsidiary of Liberty Global.
II-90
LIBERTY GLOBAL LTD.
Notes to Consolidated Financial Statements — (Continued)
December 31, 2023, 2022 and 2021
Other 2023 Financing Transactions
In connection with the Telenet Takeover Bid (as defined and described in note 14), LGBH entered into a €1.0 billion ($1.1 billion) term loan facility (LGBH Facility B). LGBH Facility B was issued at par, matures on July 25, 2026 and bears interest at a rate of EURIBOR plus (i) 4.0 % per annum through July 24, 2024, (ii) 4.5 % per annum from July 25, 2024 through July 24, 2025 and (iii) 5.25 % per annum from July 25, 2025 through maturity, in each case subject to a EURIBOR floor of 0.0 %. Under LGBH Facility B, LGBH drew (a) €745.0 million ($824.3 million) in July 2023 and (b) €67.5 million ($74.7 million) in September 2023, the proceeds of which were used to fund the Offer (as defined and described in note 14).
In October 2023, LGBH drew an additional €77.5 million ($85.7 million) under LGBH Facility B, the proceeds of which were used to further fund the Offer. The remaining €110.0 million ($121.7 million) of undrawn commitments under LGBH Facility B were subsequently cancelled.
In November 2023, LGBH prepaid in full the €890.0 million outstanding principal amount under LGBH Facility B. In connection with this transaction, LGBH recognized a loss on debt extinguishment of $1.4 million related to the write-off of unamortized deferred financing costs and discounts.
Sunrise Holding - 2022 and 2021 Financing Transactions
During 2022 and 2021, Sunrise Holding completed a number of financing transactions that generally resulted in lower interest rates and extended maturities. In connection with these transactions, Sunrise Holding recognized gains (losses) on debt extinguishment of $2.8 million and ($90.6 million) during 2022 and 2021, respectively. The gain during 2022 is attributable to the net effect of (i) a net gain associated with settlement discounts of $9.8 million, (ii) the write-off of $5.5 million of unamortized deferred financing costs and discounts and (iii) the payment of $1.5 million of third-party costs. The loss during 2021 is attributable to (a) the write-off of $77.7 million of unamortized deferred financing costs and discounts and (b) the payment of $12.9 million of redemption premiums.
Maturities of Debt
Maturities of our debt as of December 31, 2023 are presented below for the named entity and its subsidiaries, unless otherwise noted, and represent U.S. dollar equivalents based on December 31, 2023 exchange rates.
| Sunrise Holding (a) | Telenet | VM Ireland | Other (b) | Total | |||||||||||||||||||||||||
| in millions | |||||||||||||||||||||||||||||
Year ending December 31: | |||||||||||||||||||||||||||||
| 2024 | $ | $ | $ | $ | $ | ||||||||||||||||||||||||
| 2025 | |||||||||||||||||||||||||||||
| 2026 | |||||||||||||||||||||||||||||
| 2027 | |||||||||||||||||||||||||||||
| 2028 | |||||||||||||||||||||||||||||
| Thereafter | |||||||||||||||||||||||||||||
| Total debt maturities (c) | |||||||||||||||||||||||||||||
| Deferred financing costs, discounts and premiums, net | ( | ( | ( | ( | ( | ||||||||||||||||||||||||
| Total debt | $ | $ | $ | $ | $ | ||||||||||||||||||||||||
Current portion | $ | $ | $ | $ | $ | ||||||||||||||||||||||||
| Long-term portion | $ | $ | $ | $ | $ | ||||||||||||||||||||||||
(a)Amounts include SPE Notes issued by the Sunrise Holding SPE which, as described above, is consolidated by Sunrise Holding and Liberty Global.
II-91
LIBERTY GLOBAL LTD.
Notes to Consolidated Financial Statements — (Continued)
December 31, 2023, 2022 and 2021
(b)Includes $1,391.9 million related to the Vodafone Collar Loan, which has settlement dates in 2025 and 2026 consistent with the Vodafone Collar. We may elect to use cash or the collective value of the related shares and Vodafone Collar to settle amounts under the Vodafone Collar Loan.
(c)Amounts include vendor financing obligations of $768.7 million, as set forth below:
| Sunrise Holding | Telenet | Other | Total | ||||||||||||||||||||
| in millions | |||||||||||||||||||||||
Year ending December 31: | |||||||||||||||||||||||
| 2024 | $ | $ | $ | $ | |||||||||||||||||||
| 2025 | |||||||||||||||||||||||
| Total vendor financing maturities | $ | $ | $ | $ | |||||||||||||||||||
Current portion | $ | $ | $ | $ | |||||||||||||||||||
| Long-term portion | $ | $ | $ | $ | |||||||||||||||||||
Vendor Financing Obligations
A reconciliation of the beginning and ending balances of our vendor financing obligations for the indicated periods is set forth below:
| 2023 | 2022 | ||||||||||
| in millions | |||||||||||
| Balance at January 1 | $ | $ | |||||||||
| Operating-related vendor financing additions | |||||||||||
| Capital-related vendor financing additions | |||||||||||
| Principal payments on operating-related vendor financing | ( | ( | |||||||||
| Principal payments on capital-related vendor financing | ( | ( | |||||||||
| Foreign currency and other | ( | ||||||||||
| Balance at December 31 | $ | $ | |||||||||
II-92
LIBERTY GLOBAL LTD.
Notes to Consolidated Financial Statements — (Continued)
December 31, 2023, 2022 and 2021
(12) Leases
General
We enter into operating and finance leases for network equipment, real estate, mobile site sharing and vehicles. We provide residual value guarantees on certain of our vehicle leases.
Lease Balances
A summary of our ROU assets and lease liabilities is set forth below:
| December 31, | |||||||||||
| 2023 | 2022 | ||||||||||
| in millions | |||||||||||
ROU assets: | |||||||||||
| $ | $ | ||||||||||
Total ROU assets | $ | $ | |||||||||
| Lease liabilities: | |||||||||||
| $ | $ | ||||||||||
| Total lease liabilities | $ | $ | |||||||||
_______________
(a)Our finance lease ROU assets are included in property and equipment, net, on our consolidated balance sheets. At December 31, 2023, the weighted average remaining lease term for finance leases was 10.8 years and the weighted average discount rate was 4.9 %. During 2023, 2022 and 2021, we recorded non-cash additions to our finance lease ROU assets (including amounts related to the U.K. JV Entities through the June 1, 2021 closing of the U.K. JV Transaction) of $20.9 million, $34.2 million and $42.6 million, respectively. The decrease in our finance lease ROU assets is primarily related to the Telenet Wyre Transaction. For additional information, see note 5.
(b)Our operating lease ROU assets are included in other assets, net, on our consolidated balance sheets. At December 31, 2023, the weighted average remaining lease term for operating leases was 12.2 years and the weighted average discount rate was 5.8 %. During 2023, 2022 and 2021, we recorded non-cash additions to our operating lease ROU assets (including amounts related to the U.K. JV Entities through the June 1, 2021 closing of the U.K. JV Transaction) of $68.3 million, $678.6 million and $169.8 million, respectively. For additional information regarding the non-cash additions to our operating lease ROU assets during 2022 related to the Telenet Tower Lease Agreement, see note 6.
(c)The current and long-term portions of our finance lease liabilities are included within current portion of debt and finance lease obligations and long-term debt and finance lease obligations, respectively, on our consolidated balance sheets. The decrease in our finance lease liabilities is primarily related to the Telenet Wyre Transaction. For additional information, see note 5.
(d)The current portions of our operating lease liabilities are included within other accrued and current liabilities on our consolidated balance sheets. For additional information regarding the increase in our operating lease liabilities during 2022 related to the Telenet Tower Lease Agreement, see note 6.
II-93
LIBERTY GLOBAL LTD.
Notes to Consolidated Financial Statements — (Continued)
December 31, 2023, 2022 and 2021
A summary of our aggregate lease expense is set forth below:
| Year ended December 31, | |||||||||||||||||
| 2023 | 2022 | 2021 | |||||||||||||||
| in millions | |||||||||||||||||
| Finance lease expense: | |||||||||||||||||
| Depreciation and amortization | $ | $ | $ | ||||||||||||||
| Interest expense | |||||||||||||||||
Total finance lease expense | |||||||||||||||||
| Operating lease expense (a) | |||||||||||||||||
| Short-term lease expense (a) | |||||||||||||||||
| Variable lease expense (b) | |||||||||||||||||
Total lease expense | $ | $ | $ | ||||||||||||||
_______________
(a)Our operating lease expense and short-term lease expense are included in programming and other direct costs of services, other operating expenses, SG&A expenses and impairment, restructuring and other operating items, net, in our consolidated statements of operations.
(b)Variable lease expense represents payments made to a lessor during the lease term that vary because of a change in circumstance that occurred after the lease commencement date. Variable lease payments are expensed as incurred and are included in other operating expenses in our consolidated statements of operations.
A summary of our cash outflows from operating and finance leases is set forth below:
| Year ended December 31, | |||||||||||||||||
| 2023 | 2022 | 2021 | |||||||||||||||
| in millions | |||||||||||||||||
| Cash paid for amounts included in the measurement of lease liabilities: | |||||||||||||||||
| Operating cash outflows from operating leases | $ | $ | $ | ||||||||||||||
| Operating cash outflows from finance leases (interest component) | |||||||||||||||||
| Financing cash outflows from finance leases (principal component) | |||||||||||||||||
| Total cash outflows from operating and finance leases | $ | $ | $ | ||||||||||||||
II-94
LIBERTY GLOBAL LTD.
Notes to Consolidated Financial Statements — (Continued)
December 31, 2023, 2022 and 2021
Maturities of our operating and finance lease liabilities as of December 31, 2023 are presented below. Amounts represent U.S. dollar equivalents based on December 31, 2023 exchange rates:
| Operating leases | Finance leases | ||||||||||
| in millions | |||||||||||
Year ending December 31: | |||||||||||
2024 | $ | $ | |||||||||
| 2025 | |||||||||||
| 2026 | |||||||||||
| 2027 | |||||||||||
| 2028 | |||||||||||
| Thereafter | |||||||||||
Total payments | |||||||||||
Less: present value discount | ( | ( | |||||||||
| Present value of lease payments | $ | $ | |||||||||
| Current portion | $ | $ | |||||||||
| Long-term portion | $ | $ | |||||||||
(13) Income Taxes
Liberty Global is a Bermuda exempted company limited by shares and is not considered to be a tax resident in any other jurisdiction or country. At the present time, there is no Bermuda income or profits tax, withholding tax, capital gains tax, capital transfer tax, estate duty or inheritance tax payable by Liberty Global. On December 27, 2023, Bermuda enacted the Corporate Income Tax Act 2023 (the CIT Act) which provides for the taxation of the Bermuda constituent entities of certain large multi-national groups beginning on or after January 1, 2025. We do not currently anticipate that the CIT Act will have a material impact on our consolidated financial statements, although we will continue to monitor guidance as it is issued.
Our non-Bermuda subsidiaries are subject to tax in their respective jurisdictions. Our subsidiaries file income tax returns in the U.S., the U.K. and a number of other European jurisdictions. The income taxes of Liberty Global and our subsidiaries are presented on a separate return basis for each tax-paying entity or group.
The components of our earnings (loss) from continuing operations before income taxes are as follows:
| Year ended December 31, | |||||||||||||||||
| 2023 | 2022 | 2021 | |||||||||||||||
| in millions | |||||||||||||||||
| U.K. | $ | ( | $ | ( | $ | ||||||||||||
| The Netherlands | ( | ||||||||||||||||
| Belgium | |||||||||||||||||
| Switzerland | ( | ( | ( | ||||||||||||||
| Luxembourg | ( | ||||||||||||||||
| Ireland | ( | ||||||||||||||||
U.S. | ( | ( | |||||||||||||||
| Intercompany activity with discontinued operations | ( | ( | |||||||||||||||
| Other | ( | ( | ( | ||||||||||||||
| Earnings (loss) from continuing operations before income taxes | $ | ( | $ | $ | |||||||||||||
II-95
LIBERTY GLOBAL LTD.
Notes to Consolidated Financial Statements — (Continued)
December 31, 2023, 2022 and 2021
Our income tax expense consists of:
| Current | Deferred | Total | |||||||||||||||
| in millions | |||||||||||||||||
| Year ended December 31, 2023: | |||||||||||||||||
| Belgium | $ | ( | $ | ( | $ | ( | |||||||||||
U.S. (a) | ( | ( | ( | ||||||||||||||
| Switzerland | ( | ||||||||||||||||
| Luxembourg | |||||||||||||||||
| The Netherlands | ( | ( | |||||||||||||||
| Ireland | |||||||||||||||||
| U.K. | ( | ||||||||||||||||
| Other | ( | ( | |||||||||||||||
| Total income tax expense | $ | ( | $ | $ | ( | ||||||||||||
| Year ended December 31, 2022: | |||||||||||||||||
U.S. (a) | $ | ( | $ | ( | $ | ( | |||||||||||
| Luxembourg | ( | ( | ( | ||||||||||||||
| Switzerland | |||||||||||||||||
| Belgium | ( | ( | |||||||||||||||
| Ireland | ( | ||||||||||||||||
| The Netherlands | ( | ( | ( | ||||||||||||||
U.K. | ( | ||||||||||||||||
| Other | ( | ( | ( | ||||||||||||||
| Total income tax expense | $ | ( | $ | ( | $ | ( | |||||||||||
| Year ended December 31, 2021: | |||||||||||||||||
U.K. | $ | ( | $ | ( | $ | ( | |||||||||||
| Belgium | ( | ( | |||||||||||||||
U.S. (a) | ( | ( | ( | ||||||||||||||
| Switzerland | ( | ||||||||||||||||
| Luxembourg | ( | ( | ( | ||||||||||||||
| The Netherlands | ( | ( | ( | ||||||||||||||
| Ireland | ( | ( | |||||||||||||||
| Other | ( | ( | |||||||||||||||
| Total income tax expense | $ | ( | $ | ( | $ | ( | |||||||||||
_______________
II-96
LIBERTY GLOBAL LTD.
Notes to Consolidated Financial Statements — (Continued)
December 31, 2023, 2022 and 2021
Income tax expense attributable to our earnings (loss) from continuing operations before income taxes differs from the amounts computed using the applicable income tax rates as a result of the following factors:
| Year ended December 31, | |||||||||||||||||
| 2023 | 2022 | 2021 | |||||||||||||||
| in millions | |||||||||||||||||
| Computed “expected” tax benefit (expense) (a) | $ | $ | ( | $ | ( | ||||||||||||
| Basis and other differences in the treatment of items associated with investments in subsidiaries and affiliates (b) | ( | ( | |||||||||||||||
| Change in valuation allowances | ( | ( | ( | ||||||||||||||
| Non-deductible or non-taxable foreign exchange results | ( | ||||||||||||||||
| Non-deductible or non-taxable interest and other expenses | ( | ( | ( | ||||||||||||||
| International rate differences (c) | ( | ( | ( | ||||||||||||||
| Tax benefit associated with technologies innovation (d) | |||||||||||||||||
Non-taxable gain on the U.K. JV Transaction | |||||||||||||||||
| Recognition of previously unrecognized tax benefits | |||||||||||||||||
| Other, net | ( | ||||||||||||||||
| Total income tax expense | $ | ( | $ | ( | $ | ( | |||||||||||
_______________
(a)The statutory or “expected” tax rates are the U.K. rates of 23.5% for 2023 and 19.0% for 2022 and 2021. The 2023 statutory rate represents that blended rate in effect for the year ended December 31, 2023 based on the 19.0% statutory rate that was in effect for the first quarter of 2023 and the 25.0% statutory rate that was in effect for the remainder of 2023. Although we are domiciled in Bermuda, we have used the U.K. statutory rate as management believes it is more meaningful.
(b)Amounts reflect the net impact of differences in the treatment of income and loss items between financial reporting and tax accounting related to investments in subsidiaries and affiliates, including the effects of foreign earnings.
(c)Amounts reflect adjustments (either a benefit or expense) to the “expected” tax benefit (expense) for statutory rates in jurisdictions in which we operate outside of the U.K.
(d)Amounts reflect the recognition of the innovation income tax deduction in Belgium.
The components of our net deferred tax liabilities are as follows:
| December 31, | |||||||||||
| 2023 | 2022 | ||||||||||
| in millions | |||||||||||
| Deferred tax assets (a) | $ | $ | |||||||||
| Deferred tax liabilities (a) | ( | ( | |||||||||
| Net deferred tax liabilities | $ | ( | $ | ( | |||||||
_______________
(a)Our deferred tax assets and deferred tax liabilities are included within other assets, net, and other long-term liabilities, respectively, on our consolidated balance sheets.
II-97
LIBERTY GLOBAL LTD.
Notes to Consolidated Financial Statements — (Continued)
December 31, 2023, 2022 and 2021
The tax effects of temporary differences that give rise to significant portions of our deferred tax assets and deferred tax liabilities are presented below:
| December 31, | |||||||||||
| 2023 | 2022 | ||||||||||
| in millions | |||||||||||
| Deferred tax assets: | |||||||||||
| Net operating loss and other carryforwards | $ | $ | |||||||||
| Investments | |||||||||||
| Lease liabilities | |||||||||||
| Debt and interest | |||||||||||
| Property and equipment, net | |||||||||||
| Derivative instruments | |||||||||||
| Share-based compensation | |||||||||||
| Other future deductible amounts | |||||||||||
| Deferred tax assets | |||||||||||
| Valuation allowance | ( | ( | |||||||||
| Deferred tax assets, net of valuation allowance | |||||||||||
| Deferred tax liabilities: | |||||||||||
| Intangible assets | ( | ( | |||||||||
| Property and equipment, net | ( | ( | |||||||||
| Debt and interest | ( | ( | |||||||||
| ROU assets | ( | ( | |||||||||
| Derivative instruments | ( | ( | |||||||||
| Other future taxable amounts | ( | ( | |||||||||
| Deferred tax liabilities | ( | ( | |||||||||
| Net deferred tax liabilities | $ | ( | $ | ( | |||||||
Our deferred income tax valuation allowance increased $313.1 million in 2023. This increase reflects the net effect of (i) net tax expense of $275.1 million, (ii) foreign currency translation adjustments and (iii) other individually insignificant items.
The significant components of our tax loss carryforwards and related tax assets at December 31, 2023 are as follows:
| Tax loss carryforward | Related tax asset | Expiration date | ||||||||||||||||||
| Country | in millions | |||||||||||||||||||
| The Netherlands | $ | $ | Indefinite | |||||||||||||||||
| Belgium | Indefinite | |||||||||||||||||||
| U.K. | Indefinite | |||||||||||||||||||
| Luxembourg | Various | |||||||||||||||||||
| Ireland | Indefinite | |||||||||||||||||||
| Switzerland | 7 years | |||||||||||||||||||
| Other | Various | |||||||||||||||||||
| Total | $ | $ | ||||||||||||||||||
II-98
LIBERTY GLOBAL LTD.
Notes to Consolidated Financial Statements — (Continued)
December 31, 2023, 2022 and 2021
Our tax loss carryforwards within each jurisdiction combine all companies’ tax losses (both capital and ordinary losses) in that jurisdiction, however, certain tax jurisdictions limit the ability to offset taxable income of a separate company or different tax group with the tax losses associated with another separate company or group. Further, tax jurisdictions restrict the type of taxable income that the above losses are able to offset. The majority of the tax losses shown in the above table are not expected to be realized, including certain losses that are limited in use due to change in control or same business tests.
We have taxable outside basis differences on certain investments in non-U.S. subsidiaries. No additional income taxes have been provided for any undistributed foreign earnings, or any additional outside basis difference inherent in these entities, as these amounts continue to be reinvested in foreign operations. At December 31, 2023, we have not provided deferred tax liabilities on an estimated $1.4 billion of cumulative temporary differences on the outside bases of our non-U.S. subsidiaries.
Through our subsidiaries, we maintain a presence in many countries. Many of these countries maintain highly complex tax regimes that differ significantly from the system of income taxation used in the U.K. and the U.S. We have accounted for the effect of these taxes based on what we believe is reasonably expected to apply to us and our subsidiaries based on tax laws currently in effect and reasonable interpretations of these laws.
On August 16, 2022, the Inflation Reduction Act was signed into law in the U.S. Although this legislation does not increase the U.S. corporate income tax rate, it includes, among other provisions, a new corporate alternative minimum tax (CAMT) on “adjusted financial statement income” that is effective for tax years beginning after December 31, 2022. CAMT did not have an impact on our consolidated financial statements for the year ended December 31, 2023; we will continue to monitor additional guidance as it is issued to assess the impact to our tax position. We will disregard our CAMT status when evaluating our deferred tax assets under the regular U.S. tax system.
In December 2021, the Organization for Economic Co-Operation and Development (OECD)/G20 Inclusive Framework on Base Erosion and Profit Shifting (BEPS) released Model Global Anti-Base Erosion (GLoBE) rules under Pillar Two. These rules provide for the taxation of certain large multinational corporations at a minimum rate of 15%, calculated on a jurisdictional basis. Numerous countries in which we operate, including the U.K. and certain E.U. member states, have enacted or are expected to enact legislation to implement many aspects of the Pillar Two rules beginning on January 1, 2024, with certain remaining impacts to be effective from January 1, 2025. We do not currently anticipate that Pillar Two legislation will have a material impact on our consolidated financial statements, but we will continue to monitor future legislation and any additional guidance that is issued.
We and our subsidiaries file consolidated and standalone income tax returns in various jurisdictions. In the normal course of business, our income tax filings are subject to review by various taxing authorities. In connection with such reviews, disputes could arise with the taxing authorities over the interpretation or application of certain income tax rules related to our business in that tax jurisdiction. Such disputes may result in future tax and interest and penalty assessments by these taxing authorities. The ultimate resolution of tax contingencies will take place upon the earlier of (i) the settlement date with the applicable taxing authorities in either cash or agreement of income tax positions or (ii) the date when the tax authorities are statutorily prohibited from adjusting the company’s tax computations.
In general, tax returns filed by our company or our subsidiaries for years prior to 2016 are no longer subject to examination by tax authorities. Certain of our subsidiaries are currently involved in income tax examinations in various jurisdictions in which we operate, including Switzerland, Ireland and Luxembourg. While we do not expect adjustments from the foregoing examinations to have a material impact on our consolidated financial position, results of operations or cash flows, no assurance can be given that this will be the case given the amounts involved and the complex nature of the related issues.
II-99
LIBERTY GLOBAL LTD.
Notes to Consolidated Financial Statements — (Continued)
December 31, 2023, 2022 and 2021
The changes in our unrecognized tax benefits for the indicated periods are summarized below:
| 2023 | 2022 | 2021 | |||||||||||||||
| in millions | |||||||||||||||||
| Balance at January 1 | $ | $ | $ | ||||||||||||||
| Additions for tax positions of prior years | |||||||||||||||||
| Effects of business acquisitions | |||||||||||||||||
| Reductions for tax positions of prior years | ( | ( | ( | ||||||||||||||
| Settlements with tax authorities | ( | ||||||||||||||||
| Additions based on tax positions related to the current year | |||||||||||||||||
| Foreign currency translation | ( | ( | |||||||||||||||
| Lapse of statute of limitations | ( | ( | |||||||||||||||
| Balance at December 31 | $ | $ | $ | ||||||||||||||
No assurance can be given that any of these tax benefits will be recognized or realized.
As of December 31, 2023, 2022 and 2021, there were $347.0 million, $337.9 million, and $378.7 million, respectively, of unrecognized tax benefits that would have a favorable impact on our effective income tax rate if ultimately recognized, after considering amounts that we would expect to be offset by valuation allowances and other factors.
During 2024, it is reasonably possible that the resolution of ongoing tax controversies, as well as the expiration of statutes of limitations and other items, could result in reductions to our unrecognized tax benefits related to tax positions taken as of December 31, 2023. The amount of such reductions could range up to $345 million. No assurance can be given as to the nature or impact of any changes in our unrecognized tax positions during 2024.
During 2023, 2022 and 2021, the income tax expense of our continuing operations included $59.6 million, $38.4 million and $25.7 million, respectively, representing the net accrual of interest and penalties during the period. At December 31, 2023, accrued interest and penalties associated with our uncertain tax benefits totaled $262.9 million.
On October 7, 2022, the U.S. Department of Justice filed suit against Liberty Global, Inc. (LGI), a wholly owned U.S. subsidiary of Liberty Global, in the U.S. District Court of Colorado for unpaid federal income taxes and penalties for the 2018 tax year of approximately $284 million. This action by the U.S. Department of Justice is related to the November 2020 complaint filed by LGI in the District Court of Colorado seeking a refund of approximately $110 million of taxes, penalties and interest associated with the application of certain temporary Treasury regulations issued in June 2019. In October 2023, the U.S. District Court of Colorado entered judgement against LGI with respect to the refund claim and we appealed this decision to the U.S. Court of Appeals for the Tenth Circuit (Court of Appeals) in December 2023. No amounts have been accrued by LGI with respect to this matter. We will vigorously defend this matter and continue to actively pursue our claim for refund.
In January 2021, we petitioned the U.S. Tax Court with respect to unresolved issues related to our 2010 tax year for which we had already recognized an accrued liability for an uncertain tax position. In November 2023, we received an unfavorable decision which we will appeal to the Court of Appeals. In December 2023, we made a payment of the disputed tax in the amount of $315.0 million, which reduced our accrued liability for uncertain tax benefits on our consolidated balance sheet but has not been reflected in the uncertain tax benefit schedule above as the position is not yet settled. We will continue to vigorously defend our position, however, due to the inherent uncertainty involved in the litigation process, there can be no assurance that the Court of Appeals will rule in our favor.
II-100
LIBERTY GLOBAL LTD.
Notes to Consolidated Financial Statements — (Continued)
December 31, 2023, 2022 and 2021
(14) Equity
Capitalization
At December 31, 2023, our authorized share capital consisted of an aggregate nominal amount of $20.0 million, consisting of any of the following: (i) common shares (Class A, B or C), each with a nominal value of $0.01 one or more classes or series of which may be authorized by the board of directors, and (iii) any other shares of one or more classes as may be determined by the board of directors or by the shareholders of Liberty Global.
Under Liberty Global’s Articles of Association, effective July 1, 2015, holders of Liberty Global Class A common shares are entitled to one vote for each such share held, and holders of Liberty Global Class B common shares are entitled to 10 votes for each such share held, on all matters submitted to a vote of Liberty Global shareholders at any general meeting (annual or special). Holders of Liberty Global Class C common shares are not entitled to any voting powers except as required by law.
At the option of the holder, each Liberty Global Class B common share is convertible into one Liberty Global Class A common share. One Liberty Global Class A common share is reserved for issuance for each Liberty Global Class B common share that is issued (12,988,658 shares issued as of December 31, 2023). Additionally, at December 31, 2023, we have reserved the following common shares for the issuance of outstanding share-based incentive awards:
| Class A | Class C | ||||||||||
| Options | |||||||||||
SARs | |||||||||||
RSUs | |||||||||||
PSUs and PSARs | |||||||||||
Subject to any preferential rights of any outstanding class of our preference shares, the holders of our common shares are entitled to dividends as may be declared from time to time by our board of directors from funds available therefore. Except with respect to share distributions, whenever a dividend is paid in cash to the holder of one class of our common shares, we shall also pay to the holders of the other classes of our common shares an equal per share dividend. There are currently no contractual restrictions on our ability to pay dividends in cash or shares.
In the event of our liquidation, dissolution or winding up, after payment or provision for payment of our debts and liabilities and subject to the prior payment in full of any preferential amounts to which our preference shareholders, if any, may be entitled, the holders of our common shares will be entitled to receive their proportionate interests, expressed in liquidation units, in any assets available for distribution to our common shares.
Share Repurchase Programs
Our board of directors has approved various share repurchase programs for our Liberty Global common shares. Under our repurchase programs, we may acquire from time to time our Class A common shares, Class C common shares or any combination of Class A and Class C common shares. Our repurchase programs may be effected through open market transactions and/or privately negotiated transactions, which may include derivative transactions. The timing of the repurchase of shares pursuant to these programs will depend on a variety of factors, including market conditions and applicable law, and these programs may be implemented in conjunction with brokers for the company and other financial institutions with whom the company has relationships within certain preset parameters and purchases may continue during closed periods in accordance with applicable restrictions. Our share repurchase programs may be suspended or discontinued at any time. Our original share buyback plan for 2023 authorized the repurchase of 10 % of our outstanding shares as of December 31, 2022, and this was increased to a minimum of 15 % in July 2023. We achieved this minimum as of October 30, 2023, and announced a further repurchase target of approximately $300.0 million through the end of January 2024. At December 31, 2023, $101.7 million of this target remained and was fully achieved on January 26, 2024.
II-101
LIBERTY GLOBAL LTD.
Notes to Consolidated Financial Statements — (Continued)
December 31, 2023, 2022 and 2021
The following table provides details of our share repurchases during 2023, 2022 and 2021:
| Class A common shares | Class C common shares | ||||||||||||||||||||||||||||
| Shares repurchased | Average price paid per share (a) | Shares repurchased | Average price paid per share (a) | Total cost (a) | |||||||||||||||||||||||||
| in millions | |||||||||||||||||||||||||||||
2023 | $ | $ | $ | ||||||||||||||||||||||||||
2022 | $ | $ | $ | ||||||||||||||||||||||||||
2021 | $ | $ | $ | ||||||||||||||||||||||||||
_______________
(a)Includes direct acquisition costs, where applicable.
Telenet Takeover Bid
On June 8, 2023, following approval by the Belgian Financial Services and Markets Authority, LGBH launched a voluntary and conditional public takeover bid (the Offer) for all of the shares of Telenet that we did not already own or that were not held by Telenet (the Telenet Bid Shares) (the Telenet Takeover Bid). The Offer consisted of per share cash consideration for the tendered Telenet Bid Shares of €22 per share, which after deducting the €1 gross dividend paid on May 5, 2023, resulted in an offer price of €21 per share.
After the conclusion of both the initial acceptance period and the subsequent mandatory reopening period, LGBH acquired 38,210,285 of the Telenet Bid Shares, including 380,691 shares subject to lock-up provisions, increasing our ownership interest in Telenet’s issued and outstanding shares to 96.26 %. On September 22, 2023, we initiated a simplified “squeeze-out” procedure according to applicable Belgium law, pursuant to which LGBH acquired the remaining Telenet Bid Shares that it or Telenet did not already own. The simplified squeeze-out procedure concluded on October 13, 2023 and, on that date, any shares of Telenet that were not tendered during the simplified squeeze-out procedure were automatically transferred to LGBH by operation of law and Telenet shares were delisted from Euronext Brussels. The Telenet Bid Shares that were acquired as a result of the simplified squeeze-out procedure were settled on October 19, 2023 and, from that date, Telenet is owned 100 % by LGBH.
The Telenet Takeover Bid was funded through (i) available borrowings under LGBH Facility B and (ii) existing liquidity of Liberty Global. As of December 31, 2023, the consideration associated with the Telenet Takeover Bid, including certain fees and expenses, totaled €904.2 million ($993.7 million at the applicable transaction dates).
Subsidiary Distributions
From time to time, Telenet and certain other of our subsidiaries make cash distributions to their respective shareholders. Our share of these distributions is eliminated in consolidation and the noncontrolling interest owners’ share of these distributions is reflected as a charge against noncontrolling interests in our consolidated statements of equity. In this regard, Telenet, prior to the Telenet Takeover Bid, paid aggregate dividends to its shareholders during 2023, 2022 and 2021 of €108.6 million, €149.0 million and €306.2 million, respectively. Our share of these dividends was €66.3 million ($73.2 million at the applicable rate), €91.2 million ($96.2 million at the applicable rate) and €182.4 million ($214.0 million at the applicable rate), respectively.
Restricted Net Assets
The ability of certain of our subsidiaries to distribute or loan all or a portion of their net assets to our company is limited by the terms of applicable debt facilities. At December 31, 2023, a significant portion of our net assets represented net assets of our subsidiaries that were subject to such limitations.
II-102
LIBERTY GLOBAL LTD.
Notes to Consolidated Financial Statements — (Continued)
December 31, 2023, 2022 and 2021
(15) Share-based Compensation
Our share-based compensation expense primarily relates to the share-based incentive awards issued by Liberty Global to its employees and employees of its subsidiaries. A summary of our aggregate share-based compensation expense is set forth below:
| Year ended December 31, | |||||||||||||||||
| 2023 | 2022 | 2021 | |||||||||||||||
| in millions | |||||||||||||||||
Liberty Global: | |||||||||||||||||
| Non-performance based incentive awards (a) | $ | $ | $ | ||||||||||||||
| Performance-based incentive awards (b) | |||||||||||||||||
| Other (c) | |||||||||||||||||
Total Liberty Global (d) | |||||||||||||||||
| Telenet share-based incentive awards (e) | |||||||||||||||||
| Other | |||||||||||||||||
| Total | $ | $ | $ | ||||||||||||||
| Included in: | |||||||||||||||||
| Other operating expenses | $ | $ | $ | ||||||||||||||
SG&A expenses | |||||||||||||||||
Total | $ | $ | $ | ||||||||||||||
_______________
(a)In April 2023, with respect to 2016 through 2018 grants, and in April 2021, with respect to 2014 and 2015 grants, the compensation committee of our board of directors approved the extension of the expiration dates of outstanding SARs and director options from a seven-year term to a ten-year term (prior to 2019, awards granted under the 2014 Incentive Plans, as defined and described below, expired seven years after the grant date). Accordingly, the Black-Scholes fair values of the respective outstanding awards increased, resulting in the recognition of an aggregate incremental share-based compensation expense of $27.1 million and $22.7 million during 2023 and 2021, respectively.
(b)Includes share-based compensation expense related to (i) for 2023, certain Telenet Replacement Awards, as defined and described below, (ii) for 2022 and 2021, our 2019 Challenge Performance Awards and (iii) for 2021, the 2019 PSUs and our 2019 CEO Performance Award, each as defined and described below.
(c)Represents annual incentive compensation and defined contribution plan liabilities that have been or are expected to be settled with Liberty Global common shares. In the case of the annual incentive compensation, shares have been or will be issued to senior management and key employees pursuant to a shareholding incentive program. The shareholding incentive program allows these employees to elect to receive up to 100 % of their annual incentive compensation in common shares of Liberty Global in lieu of cash. In addition, amounts include compensation expense related to the Ventures Incentive Plans as defined and described below.
(d)In accordance with the terms of the Telenet Takeover Bid, we issued Liberty Global share-based incentive awards (Telenet Replacement Awards) to employees and former directors of Telenet in exchange for corresponding Telenet awards. In connection with the Telenet Takeover Bid, the Telenet Replacement Awards were remeasured as of October 13, 2023 in a 1:2 ratio between Liberty Global Class A and Liberty Global Class C shares. No incremental share-based compensation expense was recognized from the remeasurement and modification of the Telenet awards. The Telenet Replacement Awards were re-granted on November 7, 2023, resulting in total share-based compensation expense of $50.0 million, of which $8.5 million was recognized on this date due to the immediate vesting of select Telenet Replacement Awards. The remaining expense of $41.5 million will be amortized over the remaining service periods of the unvested Telenet Replacement Awards, subject to forfeitures and the satisfaction of performance conditions as further described below. For further information regarding the Telenet Takeover Bid, see note 14.
II-103
LIBERTY GLOBAL LTD.
Notes to Consolidated Financial Statements — (Continued)
December 31, 2023, 2022 and 2021
As of December 31, 2023, $165.8 million of total unrecognized compensation cost related to our Liberty Global share-based incentive awards is expected to be recognized by our company over a weighted-average period of approximately 1.9 years.
The following table summarizes certain information related to the share-based incentive awards granted and exercised with respect to Liberty Global common shares (includes amounts related to awards held by employees of our discontinued operations, unless otherwise noted):
| Year ended December 31, | |||||||||||||||||
| 2023 | 2022 | 2021 | |||||||||||||||
Assumptions used to estimate fair value of options and SARs granted: | |||||||||||||||||
| Risk-free interest rate | |||||||||||||||||
| Expected life | |||||||||||||||||
| Expected volatility | |||||||||||||||||
| Expected dividend yield | |||||||||||||||||
| Weighted average grant-date fair value per share of awards granted: | |||||||||||||||||
| Options | $ | $ | $ | ||||||||||||||
SARs | $ | $ | $ | ||||||||||||||
RSUs | $ | $ | $ | ||||||||||||||
PSUs | $ | (a) | (a) | ||||||||||||||
| Total intrinsic value of awards exercised (in millions): | |||||||||||||||||
| Options | (b) | $ | $ | ||||||||||||||
SARs | $ | $ | $ | ||||||||||||||
PSARs | (b) | $ | $ | ||||||||||||||
| Cash received from exercise of options (in millions) | $ | $ | $ | ||||||||||||||
Income tax benefit related to share-based compensation of our continuing operations (in millions) | $ | $ | $ | ||||||||||||||
_______________
(a)There were no grants of PSUs made during the indicated period.
(b)There were no exercises of this award type during the year ended December 31, 2023.
Share Incentive Plans — Liberty Global Common Shares
2023 Incentive Plan
As of December 31, 2023, we are authorized to grant incentive awards under the “Liberty Global 2023 Incentive Plan”, which was approved by our shareholders on June 14, 2023. Generally, we may grant options, SARs, RSAs, RSUs, performance awards or cash awards or any combination of the foregoing under this incentive plan (collectively, “awards”). The maximum number of Liberty Global shares with respect to which awards may be issued under the Liberty Global 2023 Incentive Plan is 43,284,342 which represents the number of common shares available for grant under the previous “Liberty Global 2014 Incentive Plan” and the “Liberty Global 2014 Nonemployee Director Incentive Plan” (collectively, the 2014 Incentive Plans) immediately prior to the 2023 Annual General Meeting of Shareholders of Liberty Global plc, plus any common shares subject to outstanding awards under the 2014 Incentive Plans that become available for issuance under the Liberty Global 2023
II-104
LIBERTY GLOBAL LTD.
Notes to Consolidated Financial Statements — (Continued)
December 31, 2023, 2022 and 2021
Incentive Plan pursuant to its terms. The maximum number of common shares reserved for issuance under the Liberty Global 2023 Incentive Plan is also subject to anti-dilution and other adjustment provisions of the Liberty Global 2023 Incentive Plan. Outstanding awards granted under the 2014 Incentive Plans will continue to be governed by the terms of that plan until exercised, expired, paid or otherwise terminated. No further awards will be granted under the 2014 Incentive Plans. As of December 31, 2023, the Liberty Global 2023 Incentive Plan had 40,245,318 common shares available for grant.
Awards (other than performance-based awards) under the Liberty Global 2023 Incentive Plan and the Liberty Global 2014 Incentive Plan generally (i) vest annually over a three-year 10 three equal annual installments, provided the director continues to serve as director immediately prior to the vesting date, and expire ten years after the grant date. RSUs vest on the date of the first annual general meeting of shareholders following the grant date. These awards may be granted at or above fair value in any class of common shares.
In connection with the Telenet Takeover Bid, the compensation committee of our board of directors approved the issuance of Telenet Replacement Awards as part of the Liberty Global 2023 Incentive Plan in exchange for corresponding Telenet awards. Prior to the Telenet Takeover Bid, Telenet had several outstanding equity award plans including the 2019 Employee Stock Option Plan (ESOP 2019), the 2020 Employee Stock Option Plan (ESOP 2020), the 2021 Performance Share Plan (PSP 2021), the 2021 CEO Performance Share Plan (CEO PSP 2021) and the 2022 Restricted Share Plan (RSP 2022). Liberty Global proposed to rollover any Telenet equity awards into equivalent awards in Liberty Global shares, excluding the ESOP 2019 and ESOP 2020 which were out-of-the-money at the time of the Telenet Takeover Bid. Additionally, due to regulatory constraints associated with the Telenet Takeover Bid, Telenet was unable to issue equity awards from the 2020 Performance Share Plan (PSP 2020), the 2022 Performance Share Plan (PSP 2022), the 2023 Performance Share Plan (PSP 2023), the 2022 CEO Performance Share Plan (CEO PSP 2022), the 2023 Restricted Share Plan (RSP 2023), the 2023 CEO Performance Share Plan (CEO PSP 2023) and the 2023 Dividend Share Plan (Dividend Plan 2023). Liberty Global has also granted equivalent awards under these Telenet plans. The Telenet Replacement Awards were issued as either RSUs or PSUs, depending on the presence of a performance factor. Generally, (i) awards issued under the CEO PSP 2021, CEO PSP 2022 and CEO PSP 2023 are subject to certain performance metrics and vest at the end of a three-year 40 60 two-year two-year holding restriction, (v) awards issued under the PSP 2021 and PSP 2023 are subject to certain performance metrics and vest at the end of a three-year 40 % after year one and 60 % after year two and are subject to a two-year holding restriction.
Ventures Incentive Plans
Annually, beginning in April 2021, the compensation committee of our board of directors has approved grants under the “Ventures Incentive Plans”. The Ventures Incentive Plans are provided to executive officers and other key employees based on the performance of the Liberty Global Ventures Portfolio (the “Portfolio”), or a specific portion of the Portfolio in the instance of the “Tech Ventures Incentive Plan.” A fair value assessment is performed for the Portfolio as of December 31st by an independent third-party valuation specialist and the Portfolio performance is measured by assessing the fair value of the Portfolio over a three-year period beginning on December 31st of the year preceding each annual grant. Payout will be denominated in cash and will be assessed at the end of each three-year period using eligible participants’ initial contributions which are between 10 % and 50 % of their annual target equity value (10 % and 100 % for the 2021 Ventures Incentive Plan) and the contributed amount is in lieu of their normal annual equity grant. The compensation committee has the discretion to settle the final payout amount in (i) cash or (ii) Liberty Global Class A and Class C common shares based on the change in the Portfolio’s value. Subject to forfeitures, 100 % of each participant’s payout will vest on or around March of the year subsequent to the conclusion of the three-year performance period. In order to receive the payout, participants are required to remain employed through the final vesting date. Awards under the Ventures Incentive Plans are liability classified due to the fact that the final payout under these plans will be denominated in cash and may be settled in a variable number of shares. The estimated fair value of the final payouts under our Ventures Incentive Plans as of December 31, 2023 are shown below:
II-105
LIBERTY GLOBAL LTD.
Notes to Consolidated Financial Statements — (Continued)
December 31, 2023, 2022 and 2021
| Performance period | Vesting date | Estimated fair value of final payout | |||||||||||||||
| in millions | |||||||||||||||||
| 2021 Ventures Incentive Plan | 12/31/2020 - 12/31/2023 | March 31, 2024 | $ | ||||||||||||||
2022 Ventures Incentive Plan | 12/31/2021 - 12/31/2024 | March 15, 2025 | |||||||||||||||
| 2023 Ventures Incentive Plan | 12/31/2022 - 12/31/2025 | March 15, 2026 | |||||||||||||||
| 2023 Tech Ventures Incentive Plan | 12/31/2022 - 12/31/2025 | March 15, 2026 | |||||||||||||||
| Total | $ | ||||||||||||||||
Performance Awards
The following is a summary of the material terms and conditions with respect to our performance-based awards for certain executive officers and key employees.
2019 CEO Performance Award
In April 2019, the compensation committee of our board of directors approved the grant of RSAs and PSUs to our Chief Executive Officer (CEO) (the 2019 CEO Performance Award), comprising 670,000 RSAs and 1,330,000 PSUs, each with respect to Liberty Global Class B common shares. The RSAs vested on December 31, 2019, 670,000 PSUs vested on May 15, 2020, and the remaining 660,000 PSUs vested on May 15, 2021. The performance criteria for the 2019 CEO Performance Award PSUs was based on the achievement of our CEO’s performance conditions, as established by the compensation committee.
2019 Challenge Performance Awards
In March 2019, the compensation committee of our board of directors approved a challenge performance award for executive officers and certain employees (the 2019 Challenge Performance Awards), which consists of a combination of PSARs and PSUs, in each case divided on a 1:2 ratio based on Liberty Global Class A common shares and Liberty Global Class C common shares. Each PSU represents the right to receive one Liberty Global Class A common share or one Liberty Global Class C common share, as applicable. The performance criteria for the 2019 Challenge Performance Awards is based on the participant’s performance and achievement of individual goals during the three-year period ended December 31, 2021. Subject to forfeitures, the satisfaction of performance conditions and certain other terms, 100 % of each participant’s 2019 Challenge Performance Awards were earned and vested on March 7, 2022. The PSARs have a term of ten years and base prices equal to the respective market closing prices of the applicable class on the grant date.
Liberty Global PSUs
In April 2019, the compensation committee of our board of directors approved the grant of PSUs to executive officers and key employees (the 2019 PSUs). The performance plan for the 2019 PSUs covered the two-year period ended December 31, 2020 and included a performance target based on the achievement of a specified compound annual growth rate (CAGR) in a consolidated Adjusted EBITDA metric (as defined in note 19). The performance target was adjusted for events such as acquisitions, dispositions and changes in foreign currency exchange rates that affect comparability (Adjusted EBITDA CAGR). The 2019 PSUs required delivery of an Adjusted EBITDA CAGR of 1.38 % and included over- and under-performance payout opportunities should the Adjusted EBITDA CAGR exceed or fail to meet the target, as applicable. Participants earned 65 % of their targeted awards under the 2019 PSUs which vested 50 % on each of April 1, 2021 and October 1, 2021.
II-106
LIBERTY GLOBAL LTD.
Notes to Consolidated Financial Statements — (Continued)
December 31, 2023, 2022 and 2021
Share-based Award Activity — Liberty Global Common Shares
The following tables summarize the share-based award activity during 2023 with respect to awards issued by Liberty Global. Our company settles SARs and PSARs on a net basis when exercised by the award holder, whereby the number of shares issued represents the excess value of the award based on the market price of the respective Liberty Global shares at the time of exercise relative to the award’s exercise price. In addition, with respect to share-based awards held by Liberty Global employees, the number of shares to be issued upon vesting or exercise is reduced by the amount of the employee’s required income tax withholding.
Options — Class A common shares | Number of awards | Weighted average exercise price | Weighted average remaining contractual term | Aggregate intrinsic value | ||||||||||||||||||||||
| in years | in millions | |||||||||||||||||||||||||
Outstanding at January 1, 2023 | $ | |||||||||||||||||||||||||
| Granted | ||||||||||||||||||||||||||
| Forfeited | ( | |||||||||||||||||||||||||
Outstanding at December 31, 2023 | $ | $ | ||||||||||||||||||||||||
Exercisable at December 31, 2023 | $ | $ | ||||||||||||||||||||||||
| Options — Class C common shares | Number of awards | Weighted average exercise price | Weighted average remaining contractual term | Aggregate intrinsic value | ||||||||||||||||||||||
| in years | in millions | |||||||||||||||||||||||||
Outstanding at January 1, 2023 | $ | |||||||||||||||||||||||||
| Granted | ||||||||||||||||||||||||||
| Forfeited | ( | |||||||||||||||||||||||||
Outstanding at December 31, 2023 | $ | $ | ||||||||||||||||||||||||
Exercisable at December 31, 2023 | $ | $ | ||||||||||||||||||||||||
SARs — Class A common shares | Number of awards | Weighted average base price | Weighted average remaining contractual term | Aggregate intrinsic value | ||||||||||||||||||||||
| in years | in millions | |||||||||||||||||||||||||
Outstanding at January 1, 2023 | $ | |||||||||||||||||||||||||
| Granted | ||||||||||||||||||||||||||
| Forfeited | ( | |||||||||||||||||||||||||
| Exercised | ( | |||||||||||||||||||||||||
Outstanding at December 31, 2023 | $ | $ | ||||||||||||||||||||||||
Exercisable at December 31, 2023 | $ | $ | ||||||||||||||||||||||||
II-107
LIBERTY GLOBAL LTD.
Notes to Consolidated Financial Statements — (Continued)
December 31, 2023, 2022 and 2021
SARs — Class C common shares | Number of awards | Weighted average base price | Weighted average remaining contractual term | Aggregate intrinsic value | ||||||||||||||||||||||
| in years | in millions | |||||||||||||||||||||||||
Outstanding at January 1, 2023 | $ | |||||||||||||||||||||||||
| Granted | ||||||||||||||||||||||||||
| Forfeited | ( | |||||||||||||||||||||||||
| Exercised | ( | |||||||||||||||||||||||||
Outstanding at December 31, 2023 | $ | $ | ||||||||||||||||||||||||
Exercisable at December 31, 2023 | $ | $ | ||||||||||||||||||||||||
PSARs — Class A common shares | Number of awards | Weighted average base price | Weighted average remaining contractual term | Aggregate intrinsic value | ||||||||||||||||||||||
| in years | in millions | |||||||||||||||||||||||||
Outstanding at January 1, 2023 | $ | |||||||||||||||||||||||||
| Forfeited | ( | |||||||||||||||||||||||||
Outstanding at December 31, 2023 | $ | $ | ||||||||||||||||||||||||
Exercisable at December 31, 2023 | $ | $ | ||||||||||||||||||||||||
PSARs — Class C common shares | Number of awards | Weighted average base price | Weighted average remaining contractual term | Aggregate intrinsic value | ||||||||||||||||||||||
| in years | in millions | |||||||||||||||||||||||||
Outstanding at January 1, 2023 | $ | |||||||||||||||||||||||||
| Forfeited | ( | |||||||||||||||||||||||||
Outstanding at December 31, 2023 | $ | $ | ||||||||||||||||||||||||
Exercisable at December 31, 2023 | $ | $ | ||||||||||||||||||||||||
RSUs — Class A common shares | Number of awards | Weighted average grant-date fair value per share | Weighted average remaining contractual term | |||||||||||||||||
| in years | ||||||||||||||||||||
Outstanding at January 1, 2023 | $ | |||||||||||||||||||
| Granted | ||||||||||||||||||||
| Forfeited | ( | |||||||||||||||||||
| Released from restrictions | ( | |||||||||||||||||||
Outstanding at December 31, 2023 | $ | |||||||||||||||||||
II-108
LIBERTY GLOBAL LTD.
Notes to Consolidated Financial Statements — (Continued)
December 31, 2023, 2022 and 2021
RSUs — Class B common shares | Number of awards | Weighted average grant-date fair value per share | Weighted average remaining contractual term | |||||||||||||||||
| in years | ||||||||||||||||||||
Outstanding at January 1, 2023 | $ | |||||||||||||||||||
| Forfeited | ( | |||||||||||||||||||
Outstanding at December 31, 2023 | $ | — | ||||||||||||||||||
| RSUs — Class C common shares | Number of awards | Weighted average grant-date fair value per share | Weighted average remaining contractual term | |||||||||||||||||
| in years | ||||||||||||||||||||
Outstanding at January 1, 2023 | $ | |||||||||||||||||||
| Granted | ||||||||||||||||||||
| Forfeited | ( | |||||||||||||||||||
| Released from restrictions | ( | |||||||||||||||||||
Outstanding at December 31, 2023 | $ | |||||||||||||||||||
PSUs — Class A common shares | Number of awards | Weighted average grant-date fair value per share | Weighted average remaining contractual term | |||||||||||||||||
| in years | ||||||||||||||||||||
Outstanding at January 1, 2023 | $ | |||||||||||||||||||
| Granted | ||||||||||||||||||||
| Forfeited | ( | |||||||||||||||||||
| Released from restrictions | ( | |||||||||||||||||||
Outstanding at December 31, 2023 | $ | |||||||||||||||||||
PSUs — Class C common shares | Number of awards | Weighted average grant-date fair value per share | Weighted average remaining contractual term | |||||||||||||||||
| in years | ||||||||||||||||||||
Outstanding at January 1, 2023 | $ | |||||||||||||||||||
| Granted | ||||||||||||||||||||
| Forfeited | ( | |||||||||||||||||||
| Released from restrictions | ( | |||||||||||||||||||
Outstanding at December 31, 2023 | $ | |||||||||||||||||||
II-109
LIBERTY GLOBAL LTD.
Notes to Consolidated Financial Statements — (Continued)
December 31, 2023, 2022 and 2021
Share-based Award Activity — Liberty Global Common Shares held by former Liberty Global employees
The following tables summarize the share-based awards held by former employees of Liberty Global subsequent to certain split-off or disposal transactions. Any future exercises of SARs or PSARs, or vesting of RSUs will increase the number of our outstanding common shares.
| Number of awards | Weighted average exercise or base price | Weighted average remaining contractual term | Aggregate intrinsic value | |||||||||||||||||||||||
| in years | in millions | |||||||||||||||||||||||||
Options, SARs and PSARs: | ||||||||||||||||||||||||||
Class A: | ||||||||||||||||||||||||||
Outstanding | $ | $ | ||||||||||||||||||||||||
Exercisable | $ | $ | ||||||||||||||||||||||||
Class C: | ||||||||||||||||||||||||||
Outstanding | $ | $ | ||||||||||||||||||||||||
Exercisable | $ | $ | ||||||||||||||||||||||||
| Number of awards | Weighted average grant-date fair value per share | Weighted average remaining contractual term | ||||||||||||||||||
| in years | ||||||||||||||||||||
Outstanding RSUs: | ||||||||||||||||||||
| Class A | $ | |||||||||||||||||||
| Class C | $ | |||||||||||||||||||
II-110
LIBERTY GLOBAL LTD.
Notes to Consolidated Financial Statements — (Continued)
December 31, 2023, 2022 and 2021
(16) Defined Benefit Plans
Certain of our subsidiaries maintain various funded and unfunded defined benefit plans for their employees. The table below provides summary information on our defined benefit plans:
| December 31, | |||||||||||||||||
| 2023 | 2022 | 2021 | |||||||||||||||
| in millions | |||||||||||||||||
| Fair value of plan assets (a) | $ | $ | $ | ||||||||||||||
| Projected benefit obligation | $ | $ | $ | ||||||||||||||
| Net asset (liability) | $ | ( | $ | $ | ( | ||||||||||||
_______________
(a)The fair value of plan assets at December 31, 2023 includes $969.5 million and $233.1 million of assets that are valued based on Level 1 and Level 2 inputs, respectively, of the fair value hierarchy (as further described in note 9). Our plan assets comprise investments in debt securities, equity securities, hedge funds, insurance contracts and certain other assets.
Our net periodic pension cost was $25.6 million, $1.8 million and $10.9 million during 2023, 2022 and 2021, respectively, including $38.6 million, $39.6 million and $57.4 million, respectively, representing the service cost component. These amounts exclude aggregate curtailment gains of nil , $4.0 million and $7.5 million, respectively, which are included in impairment, restructuring and other operating items, net, in our consolidated statements of operations.
During 2023, our subsidiaries’ contributions to their respective defined benefit plans aggregated $49.2 million. Based on December 31, 2023 exchange rates and information available as of that date, we expect this amount to be $49.7 million in 2024.
(17) Accumulated Other Comprehensive Earnings
Accumulated other comprehensive earnings included on our consolidated balance sheets and statements of equity reflect the aggregate impact of foreign currency translation adjustments and pension-related adjustments and other. The changes in the components of accumulated other comprehensive earnings, net of taxes, are summarized as follows:
Liberty Global shareholders | Total accumulated other comprehensive earnings | ||||||||||||||||||||||||||||
| Foreign currency translation adjustments | Pension-related adjustments and other | Accumulated other comprehensive earnings | Noncontrolling interests | ||||||||||||||||||||||||||
| in millions | |||||||||||||||||||||||||||||
| Balance at January 1, 2021 | $ | $ | ( | $ | $ | ( | $ | ||||||||||||||||||||||
| Other comprehensive earnings | |||||||||||||||||||||||||||||
| Balance at December 31, 2021 | ( | ||||||||||||||||||||||||||||
| Other comprehensive loss | ( | ( | ( | ( | |||||||||||||||||||||||||
| Balance at December 31, 2022 | ( | ||||||||||||||||||||||||||||
| Other comprehensive earnings | ( | ( | |||||||||||||||||||||||||||
| Balance at December 31, 2023 | $ | $ | ( | $ | $ | $ | |||||||||||||||||||||||
II-111
LIBERTY GLOBAL LTD.
Notes to Consolidated Financial Statements — (Continued)
December 31, 2023, 2022 and 2021
The components of other comprehensive earnings (loss), net of taxes, are reflected in our consolidated statements of comprehensive earnings (loss). The following table summarizes the tax effects related to each component of other comprehensive earnings (loss), net of amounts reclassified to our consolidated statements of operations:
| Pre-tax amount | Tax benefit (expense) | Net-of-tax amount | |||||||||||||||
| in millions | |||||||||||||||||
| Year ended December 31, 2023: | |||||||||||||||||
| Foreign currency translation adjustments | $ | $ | ( | $ | |||||||||||||
| Pension-related adjustments and other | ( | ( | |||||||||||||||
| Other comprehensive earnings | |||||||||||||||||
| Other comprehensive loss attributable to noncontrolling interests (a) | ( | ||||||||||||||||
Other comprehensive earnings attributable to Liberty Global shareholders | $ | $ | $ | ||||||||||||||
| Year ended December 31, 2022: | |||||||||||||||||
| Foreign currency translation adjustments | $ | ( | $ | $ | ( | ||||||||||||
| Pension-related adjustments and other | ( | ( | ( | ||||||||||||||
| Other comprehensive loss from continuing operations | ( | ( | ( | ||||||||||||||
| Other comprehensive loss from discontinued operations (b) | ( | ( | |||||||||||||||
| Other comprehensive loss | ( | ( | ( | ||||||||||||||
| Other comprehensive earnings attributable to noncontrolling interests (a) | ( | ( | |||||||||||||||
Other comprehensive loss attributable to Liberty Global shareholders | $ | ( | $ | ( | $ | ( | |||||||||||
| Year ended December 31, 2021: | |||||||||||||||||
| Foreign currency translation adjustments (b) | $ | $ | $ | ||||||||||||||
| Pension-related adjustments and other | ( | ||||||||||||||||
| Other comprehensive earnings from continuing operations | ( | ||||||||||||||||
| Other comprehensive loss from discontinued operations | ( | ( | |||||||||||||||
| Other comprehensive earnings | ( | ||||||||||||||||
| Other comprehensive earnings attributable to noncontrolling interests (a) | ( | ( | |||||||||||||||
Other comprehensive earnings attributable to Liberty Global shareholders | $ | $ | ( | $ | |||||||||||||
_______________
(a)Amounts represent the noncontrolling interest owners’ share of our pension-related adjustments.
(b)For additional information regarding the reclassification of foreign currency translation adjustments included in net earnings, see note 6.
II-112
LIBERTY GLOBAL LTD.
Notes to Consolidated Financial Statements — (Continued)
December 31, 2023, 2022 and 2021
(18) Commitments and Contingencies
Commitments
In the normal course of business, we enter into agreements that commit our company to make cash payments in future periods with respect to purchases of CPE and other equipment and services, network and connectivity commitments, programming contracts and other items. The following table sets forth the U.S. dollar equivalents of such commitments as of December 31, 2023. The commitments included in this table do not reflect any liabilities that are included on our December 31, 2023 consolidated balance sheet.
| Payments due during: | |||||||||||||||||||||||||||||||||||||||||
| 2024 | 2025 | 2026 | 2027 | 2028 | Thereafter | Total | |||||||||||||||||||||||||||||||||||
| in millions | |||||||||||||||||||||||||||||||||||||||||
| Purchase commitments | $ | $ | $ | $ | $ | $ | $ | ||||||||||||||||||||||||||||||||||
| Network and connectivity commitments | |||||||||||||||||||||||||||||||||||||||||
| Programming commitments | |||||||||||||||||||||||||||||||||||||||||
| Other commitments | |||||||||||||||||||||||||||||||||||||||||
Total | $ | $ | $ | $ | $ | $ | $ | ||||||||||||||||||||||||||||||||||
Purchase commitments include unconditional and legally binding obligations related to (i) certain service-related commitments, including software development, information technology, maintenance and call center services and (ii) the purchase of network and other equipment and CPE.
Network and connectivity commitments include (i) certain network capacity arrangements at Sunrise and (ii) certain equipment and service-related commitments at Telenet. As a result of the Telenet Wyre Transaction, as described in note 5, Telenet’s commitments associated with its leased network terminated.
Programming commitments consist of obligations associated with certain of our programming, studio output and sports rights contracts that are enforceable and legally binding on us as we have agreed to pay minimum fees without regard to (i) the actual number of subscribers to the programming services, (ii) whether we terminate service to a portion of our subscribers or dispose of a portion of our distribution systems or (iii) whether we discontinue our premium sports services. Programming commitments do not include increases in future periods associated with contractual inflation or other price adjustments that are not fixed. Accordingly, the amounts reflected in the above table with respect to these contracts are significantly less than the amounts we expect to pay in these periods under these contracts. Historically, payments to programming vendors have represented a significant portion of our operating costs, and we expect this will continue to be the case in future periods. In this regard, our total programming and copyright costs aggregated $558.0 million, $511.3 million and $1,123.2 million (including amounts related to the U.K. JV Entities through the June 1, 2021 closing of the U.K. JV Transaction) during 2023, 2022 and 2021, respectively.
Other commitments include (i) our share of the funding commitment associated with the nexfibre JV and (ii) various sports sponsorships.
In addition to the commitments set forth in the table above, we have significant commitments under (i) derivative instruments and (ii) defined benefit plans and similar agreements, pursuant to which we expect to make payments in future periods. For information regarding our derivative instruments, including the net cash paid or received in connection with these instruments, see note 8. For information regarding our defined benefit plans, see note 16.
We also have commitments pursuant to agreements with, and obligations imposed by, franchise authorities and municipalities, which may include obligations in certain markets to move aerial cable to underground ducts or to upgrade, rebuild or extend portions of our broadband communication systems. Such amounts are not included in the above table because they are not fixed or determinable.
II-113
LIBERTY GLOBAL LTD.
Notes to Consolidated Financial Statements — (Continued)
December 31, 2023, 2022 and 2021
We have established various defined contribution benefit plans for our and our subsidiaries’ employees. Our aggregate expense for matching contributions under the various defined contribution employee benefit plans was $24.9 million, $22.2 million and $30.1 million (including amounts related to the U.K. JV Entities through the June 1, 2021 closing of the U.K. JV Transaction) during 2023, 2022 and 2021, respectively.
Guarantees and Other Credit Enhancements
In the ordinary course of business, we may provide (i) indemnifications to our lenders, our vendors and certain other parties and (ii) performance and/or financial guarantees to local municipalities, our customers and vendors. Historically, these arrangements have not resulted in our company making any material payments and we do not believe that they will result in material payments in the future.
Legal and Regulatory Proceedings and Other Contingencies
Interkabel Acquisition. On November 26, 2007, Telenet and four associations of municipalities in Belgium, which we refer to as the pure intercommunales or the “PICs,” announced a non-binding agreement-in-principle to transfer the analog and digital television activities of the PICs, including all existing subscribers, to Telenet. Subsequently, Telenet and the PICs entered into a binding agreement (the 2008 PICs Agreement), which closed effective October 1, 2008. Beginning in December 2007, Proximus NV/SA (Proximus), the incumbent telecommunications operator in Belgium, instituted several proceedings seeking to block implementation of these agreements. Proximus lodged summary proceedings with the President of the Court of First Instance of Antwerp to obtain a provisional injunction preventing the PICs from effecting the agreement-in-principle and initiated a civil procedure on the merits claiming the annulment of the agreement-in-principle. In March 2008, the President of the Court of First Instance of Antwerp ruled in favor of Proximus in the summary proceedings, which ruling was overturned by the Court of Appeal of Antwerp in June 2008. Proximus brought an appeal judgment before the Belgian Supreme Court, which confirmed the appeal judgment in September 2010. On April 6, 2009, the Court of First Instance of Antwerp ruled in favor of the PICs and Telenet in the civil procedure on the merits, dismissing Proximus’ request for the rescission of the agreement-in-principle and the 2008 PICs Agreement. On June 12, 2009, Proximus appealed this judgment to the Court of Appeal of Antwerp. In this appeal, Proximus also sought compensation for damages. While these proceedings were suspended indefinitely, other proceedings were initiated, which resulted in a ruling by the Belgian Council of State in May 2014 annulling (i) the decision of the PICs not to organize a public market consultation and (ii) the decision from the PICs’ board of directors to approve the 2008 PICs Agreement. In December 2015, Proximus resumed the civil proceedings pending with the Court of Appeal of Antwerp seeking to have the 2008 PICs Agreement annulled and claiming damages of €1.4 billion ($1.5 billion). On December 18, 2017, the Court of Appeal of Antwerp rejected Proximus’ claim in its entirety. On June 28, 2019, Proximus brought this appeal judgment before the Belgian Supreme Court. On January 22, 2021, the Belgian Supreme Court partially annulled the judgment of the Court of Appeal of Antwerp. The case was referred to the Court of Appeal of Brussels and is currently pending with this Court which will need to make a new decision on the matter within the boundaries of the annulment by the Belgian Supreme Court. It is likely that it will take the Court of Appeal of Brussels several years to decide on the matter.
No assurance can be given as to the outcome of these or other proceedings. However, an unfavorable outcome of existing or future proceedings could potentially lead to the annulment of the 2008 PICs Agreement. We do not expect the ultimate resolution of this matter to have a material impact on our results of operations, cash flows or financial position. No amounts have been accrued by us with respect to this matter as the likelihood of loss is not considered to be probable.
Telekom Deutschland Litigation. On December 28, 2012, Unitymedia filed a lawsuit against Telekom Deutschland GmbH (Telekom Deutschland) in which Unitymedia asserted that it pays excessive prices for the co-use of Telekom Deutschland’s cable ducts in Unitymedia’s footprint. The Federal Network Agency approved rates for the co-use of certain ducts of Telekom Deutschland in March 2011. Based in part on these approved rates, Unitymedia sought a reduction of the annual lease fees by approximately five-sixths. In addition, Unitymedia sought the return of similarly calculated overpayments from 2009 through the ultimate settlement date, plus accrued interest. In October 2016, the first instance court dismissed this action, and in March 2018, the court of appeal dismissed Unitymedia’s appeal of the first instance court’s decision. Unitymedia has since successfully appealed the case to the Federal Court of Justice, and proceedings continue before the German courts. The resolution of this matter may take several years and no assurance can be given that Unitymedia’s claims will be successful. In connection with our sale of our former operations in Germany, Romania, Hungary and the Czech Republic to Vodafone (the Vodafone Disposal Group) in 2019, we will only share in 50 % of any amounts recovered, plus 50 % of the net present value of certain cost savings in future periods that are attributable to the favorable resolution of this matter, less 50 % of associated legal
II-114
LIBERTY GLOBAL LTD.
Notes to Consolidated Financial Statements — (Continued)
December 31, 2023, 2022 and 2021
or other third-party fees paid post-completion of the sale of the Vodafone Disposal Group. Any amount we may recover related to this matter will not be reflected in our consolidated financial statements until such time as the final disposition of this matter has been reached.
Swisscom MVNO Matter. On December 8, 2017, one of our subsidiaries, Sunrise GmbH, formerly known as UPC Schweiz GmbH, entered into a mobile virtual network operator (MVNO) agreement with Swisscom (Schweiz) AG (Swisscom), as subsequently amended (the Swisscom MVNO), for the provision of mobile network services to certain of Sunrise GmbH’s end customers. In January 2023, Swisscom filed a formal lawsuit against Sunrise GmbH, asserting that it is in breach of the Swisscom MVNO and claiming approximately CHF 90 million ($107 million) in damages. No amounts have been accrued by us with respect to this matter, as the likelihood of loss is not considered to be probable at this stage. We believe the assertions in this claim are unsupported and/or exaggerated and intend to vigorously defend this matter.
Other Contingency Matters. In connection with the dispositions of certain of our operations, we provided tax indemnities to the counterparties for certain tax liabilities that could arise from the period we owned the respective operations, the amounts of which could be significant, subject to certain thresholds. No amounts have been accrued by our company related to unasserted claims for indemnification, as the likelihood of any loss is not considered to be probable. Further, Liberty Global may be entitled to certain amounts that our disposed operations may recover from taxing authorities. Any such amounts will not be reflected in our consolidated financial statements until such time as the final disposition of such matters has been reached.
Other Regulatory Matters. Broadband internet, video distribution, fixed-line telephony, mobile and content businesses are regulated in each of the countries in which we or our affiliates operate. The scope of regulation varies from country to country, although in some significant respects regulation in European markets is harmonized under the regulatory structure of the European Union (E.U.). Adverse regulatory developments could subject our businesses to a number of risks. Regulation, including conditions imposed on us by competition or other authorities as a requirement to close acquisitions or dispositions, could limit growth, revenue and the number and types of services offered and could lead to increased operating costs and property and equipment additions. Regulation may also restrict our operations and subject them to further competitive pressure, including pricing restrictions, interconnect and other access obligations and restrictions or controls on content, including content provided by third parties. Failure to comply with current or future regulation could expose our businesses to various penalties.
In addition to the foregoing items, we have contingent liabilities related to matters arising in the ordinary course of business, including (i) legal proceedings, (ii) issues involving VAT and wage, property, withholding and other tax issues and (iii) disputes over interconnection, programming, copyright and channel carriage fees. While we generally expect that the amounts required to satisfy these contingencies will not materially differ from any estimated amounts we have accrued, no assurance can be given that the resolution of one or more of these contingencies will not result in a material impact on our results of operations, cash flows or financial position in any given period. Due, in general, to the complexity of the issues involved and, in certain cases, the lack of a clear basis for predicting outcomes, we cannot provide a meaningful range of potential losses or cash outflows that might result from any unfavorable outcomes.
II-115
LIBERTY GLOBAL LTD.
Notes to Consolidated Financial Statements — (Continued)
December 31, 2023, 2022 and 2021
(19) Segment Reporting
We generally identify our reportable segments as (i) those consolidated subsidiaries that represent 10% or more of our revenue, Adjusted EBITDA (as defined below) or total assets or (ii) those equity method affiliates where our investment or share of revenue or Adjusted EBITDA represents 10% or more of our total assets, revenue or Adjusted EBITDA, respectively. In certain cases, we may elect to include an operating segment in our segment disclosure that does not meet the above-described criteria for a reportable segment. We evaluate performance and make decisions about allocating resources to our operating segments based on financial measures such as revenue and Adjusted EBITDA. In addition, we review non-financial measures such as customer growth, as appropriate.
Adjusted EBITDA is the primary measure used by our chief operating decision maker to evaluate segment operating performance and is also a key factor that is used by our internal decision makers to (i) determine how to allocate resources to segments and (ii) evaluate the effectiveness of our management for purposes of annual and other incentive compensation plans. As we use the term, “Adjusted EBITDA” is defined as earnings (loss) from continuing operations before net income tax benefit (expense), other non-operating income or expenses, net share of results of affiliates, net gains (losses) on extinguishment of debt, net realized and unrealized gains (losses) due to changes in fair values of certain investments, net foreign currency gains (losses), net gains (losses) on derivative instruments, net interest expense, depreciation and amortization, share-based compensation, provisions and provision releases related to significant litigation and impairment, restructuring and other operating items. Other operating items include (a) gains and losses on the disposition of long-lived assets, (b) third-party costs directly associated with successful and unsuccessful acquisitions and dispositions, including legal, advisory and due diligence fees, as applicable, and (c) other acquisition-related items, such as gains and losses on the settlement of contingent consideration. Our internal decision makers believe Adjusted EBITDA is a meaningful measure because it represents a transparent view of our recurring operating performance that is unaffected by our capital structure and allows management to (1) readily view operating trends, (2) perform analytical comparisons and benchmarking between segments and (3) identify strategies to improve operating performance in the different countries in which we operate. A reconciliation of earnings or loss from continuing operations to Adjusted EBITDA is presented below.
As of December 31, 2023, our reportable segments are as follows:
Consolidated:
•Sunrise
•Telenet
•VM Ireland
Nonconsolidated:
•VMO2 JV
•VodafoneZiggo JV
On June 1, 2021, we completed the U.K. JV Transaction, whereby we contributed the U.K. JV Entities to the VMO2 JV. Prior to the completion of the U.K. JV Transaction, we presented Virgin Media U.K., together with VM Ireland, as a single reportable segment, “U.K./Ireland”. In connection with the completion of the U.K. JV Transaction, we restated our segment presentation for all periods to separately present (i) Virgin Media U.K. and (ii) VM Ireland. In addition, certain other less significant entities previously included in the U.K./Ireland segment are now included within Central and Other (as defined below). Following the closing of the U.K. JV Transaction, we identified the VMO2 JV as a nonconsolidated reportable segment. For additional information regarding the U.K. JV Transaction, see note 6.
All of our reportable segments derive their revenue primarily from residential and B2B communications services, including broadband internet, video, fixed-line telephony and mobile services.
Our “Central and Other” category primarily includes (i) services provided to the VMO2 JV, the VodafoneZiggo JV and various third parties related to transitional service agreements, (ii) sales of CPE to the VodafoneZiggo JV, (iii) certain centralized functions, including billing systems, network operations, technology, marketing, facilities, finance and other administrative functions and (iv) our operations in Slovakia.
II-116
LIBERTY GLOBAL LTD.
Notes to Consolidated Financial Statements — (Continued)
December 31, 2023, 2022 and 2021
We present only the reportable segments of our continuing operations in the tables below.
During the first quarter of 2023, we changed the terms related to, and approach to how we reflect the allocation of, charges for certain products and services that our centrally-managed technology and innovation function (our T&I Function) provide to our consolidated reportable segments (the Tech Framework). These products and services include CPE hardware and related essential software, maintenance, hosting and other services. As a result of these changes, our consolidated reportable segments now capitalize the combined cost of the CPE hardware and essential software as property and equipment additions. The other services, including maintenance and hosting, continue to be reported as operating costs in the period incurred (included in our Adjusted EBITDA). The corresponding amounts charged by our T&I Function are reflected as revenue when earned. The new Tech Framework resulted in a change to the way in which our chief operating decision maker evaluates the revenue, Adjusted EBITDA and property and equipment additions of our consolidated reportable segments. Segment information has been revised, as applicable, to reflect these changes. The following table provides a summary of the impact on the revenue, Adjusted EBITDA and property and equipment additions of our consolidated reportable segments and Central and Other.
| Year ended December 31, | |||||||||||||||||
| 2023 | 2022 | 2021 | |||||||||||||||
| in millions | |||||||||||||||||
Increase (decrease) to revenue (a): | |||||||||||||||||
Central and Other | $ | $ | $ | ||||||||||||||
| Intersegment eliminations | ( | ( | ( | ||||||||||||||
| Total | $ | $ | $ | ||||||||||||||
Increase (decrease) to Adjusted EBITDA (b): | |||||||||||||||||
Sunrise | $ | ( | $ | ( | $ | ( | |||||||||||
Telenet | ( | ( | ( | ||||||||||||||
VM Ireland | ( | ( | ( | ||||||||||||||
Central and Other | |||||||||||||||||
| Intersegment eliminations | ( | ( | ( | ||||||||||||||
| Total | $ | $ | $ | ||||||||||||||
Increase (decrease) to property and equipment additions (c): | |||||||||||||||||
Sunrise | $ | $ | $ | ||||||||||||||
Telenet | |||||||||||||||||
VM Ireland | |||||||||||||||||
Central and Other | |||||||||||||||||
| Intersegment eliminations | ( | ( | ( | ||||||||||||||
| Total | $ | $ | $ | ||||||||||||||
_______________
(a)Amounts reflect the revenue recognized within our T&I Function, as well as any applicable markup, related to the Tech Framework.
(b)Amounts reflect the charge to each respective consolidated reportable segment related to the service and maintenance component of the Tech Framework and, additionally for Central and Other, the Adjusted EBITDA impact of the value attributed to centrally-held internally developed technology that is embedded within our various CPE, as well as any applicable markup.
(c)Amounts reflect the charge to each respective consolidated reportable segment related to the value attributed to centrally-held internally developed technology that is embedded within our various CPE, as well as any applicable markup.
II-117
LIBERTY GLOBAL LTD.
Notes to Consolidated Financial Statements — (Continued)
December 31, 2023, 2022 and 2021
During the second quarter of 2023, we determined to market and sell certain of our internally-developed software to third parties. As a result of these strategic and operational changes, from May 2023, proceeds from the licensing and related sale of products from this internally-developed software (including proceeds generated from our arrangements with the VMO2 JV and the VodafoneZiggo JV) have been applied against the net book value of our existing internally-developed capitalized software until that balance is reduced to zero, after which time we will resume recognizing revenue for such licensing and related sale of products. Further, we now expense the costs of development of such software due to the fact that it is now externally marketed to third parties. During the year ended December 31, 2023, revenue within our Central and Other category was reduced by $127.7 million as a result of this change and the associated accounting treatment, including $69.3 million and $41.0 million from the VMO2 JV and the VodafoneZiggo JV, respectively. As of December 31, 2023, the net book value of our existing internally-developed software was reduced to zero.
Performance Measures of Our Reportable Segments
The amounts presented below represent 100% of each of our reportable segment’s revenue and Adjusted EBITDA. The noncontrolling owners’ interests in the operating results of Telenet, prior to the Telenet Takeover Bid, and other less significant majority-owned subsidiaries are reflected in net earnings or loss attributable to noncontrolling interests in our consolidated statements of operations. Furthermore, despite only holding a 50 % noncontrolling interest in both the VMO2 JV and the VodafoneZiggo JV, we present 100 % of the revenue and Adjusted EBITDA of those entities in the tables below. Our share of the operating results of the VMO2 JV and the VodafoneZiggo JV is included in share of results of affiliates, net, in our consolidated statements of operations.
| Year ended December 31, | |||||||||||||||||||||||||||||||||||
| 2023 | 2022 (a) | 2021 (a) | |||||||||||||||||||||||||||||||||
| Revenue | Adjusted EBITDA | Revenue | Adjusted EBITDA | Revenue | Adjusted EBITDA | ||||||||||||||||||||||||||||||
| in millions | |||||||||||||||||||||||||||||||||||
Sunrise | $ | $ | $ | $ | $ | $ | |||||||||||||||||||||||||||||
Telenet | |||||||||||||||||||||||||||||||||||
| VM Ireland | |||||||||||||||||||||||||||||||||||
Virgin Media U.K. (b) | |||||||||||||||||||||||||||||||||||
Central and Other | ( | ||||||||||||||||||||||||||||||||||
| Intersegment eliminations (c) | ( | ( | ( | ( | ( | ( | |||||||||||||||||||||||||||||
| Total | $ | $ | $ | $ | $ | $ | |||||||||||||||||||||||||||||
VMO2 JV (d) | $ | $ | $ | $ | $ | $ | |||||||||||||||||||||||||||||
VodafoneZiggo JV | $ | $ | $ | $ | $ | $ | |||||||||||||||||||||||||||||
_______________
(a)Amounts have been revised, as applicable, to reflect the retrospective impact of the Tech Framework, as described above.
(b)Amounts represent the revenue and Adjusted EBITDA of the U.K. JV Entities through the June 1, 2021 closing of the U.K. JV Transaction.
(c)Amounts primarily relate to (i) the revenue recognized within our T&I Function related to the Tech Framework, (ii) the Adjusted EBITDA impact to Central and Other of the value attributed to centrally-held internally developed technology that is embedded within our various CPE, as well as any applicable markup, and (iii) for 2022 and 2021, transactions between our continuing and discontinued operations.
(d)The 2021 amounts represent the revenue and Adjusted EBITDA of the VMO2 JV for the period beginning June 1, 2021.
II-118
LIBERTY GLOBAL LTD.
Notes to Consolidated Financial Statements — (Continued)
December 31, 2023, 2022 and 2021
The following table provides a reconciliation of earnings (loss) from continuing operations to Adjusted EBITDA:
| Year ended December 31, | |||||||||||||||||
| 2023 | 2022 | 2021 | |||||||||||||||
| in millions | |||||||||||||||||
| Earnings (loss) from continuing operations | $ | ( | $ | $ | |||||||||||||
| Income tax expense | |||||||||||||||||
| Other income, net | ( | ( | ( | ||||||||||||||
Gain on AtlasEdge JV Transactions | ( | ||||||||||||||||
Gain on U.K. JV Transaction | ( | ||||||||||||||||
Gain on Telenet Tower Sale | ( | ||||||||||||||||
Gain associated with the Telenet Wyre Transaction | ( | ||||||||||||||||
| Share of results of affiliates, net | |||||||||||||||||
| Losses (gains) on debt extinguishment, net | ( | ||||||||||||||||
| Realized and unrealized losses (gains) due to changes in fair values of certain investments, net | ( | ||||||||||||||||
| Foreign currency transaction losses (gains), net | ( | ( | |||||||||||||||
| Realized and unrealized losses (gains) on derivative instruments, net | ( | ( | |||||||||||||||
| Interest expense | |||||||||||||||||
| Operating income (loss) | ( | ||||||||||||||||
| Impairment, restructuring and other operating items, net | ( | ||||||||||||||||
| Depreciation and amortization | |||||||||||||||||
| Share-based compensation expense | |||||||||||||||||
Adjusted EBITDA | $ | $ | $ | ||||||||||||||
Balance Sheet Data of our Reportable Segments
Selected balance sheet data of our reportable segments is set forth below:
| Long-lived assets | Total assets | ||||||||||||||||||||||
| December 31, | December 31, | ||||||||||||||||||||||
| 2023 | 2022 (a) | 2023 | 2022 (a) | ||||||||||||||||||||
| in millions | |||||||||||||||||||||||
Sunrise | $ | $ | $ | $ | |||||||||||||||||||
Telenet | |||||||||||||||||||||||
VM Ireland | |||||||||||||||||||||||
Central and Other | |||||||||||||||||||||||
| Intersegment eliminations | ( | ( | ( | ( | |||||||||||||||||||
| Total | $ | $ | $ | $ | |||||||||||||||||||
VMO2 JV | $ | $ | $ | $ | |||||||||||||||||||
VodafoneZiggo JV | $ | $ | $ | $ | |||||||||||||||||||
_______________
(a)Amounts have been revised, as applicable, to reflect the retrospective impact of the Tech Framework, as described above.
II-119
LIBERTY GLOBAL LTD.
Notes to Consolidated Financial Statements — (Continued)
December 31, 2023, 2022 and 2021
Property and Equipment Additions of our Reportable Segments
The property and equipment additions of our reportable segments (including capital additions financed under capital-related vendor financing or finance lease arrangements) are presented below and reconciled to the capital expenditure amounts included in our consolidated statements of cash flows. For additional information concerning capital additions financed under vendor financing and finance lease arrangements, see notes 10 and 12, respectively.
| Year ended December 31, | |||||||||||||||||
| 2023 | 2022 (a) | 2021 (a) | |||||||||||||||
| in millions | |||||||||||||||||
Sunrise | $ | $ | $ | ||||||||||||||
Telenet | |||||||||||||||||
| VM Ireland | |||||||||||||||||
Virgin Media U.K. (b) | |||||||||||||||||
Central and Other (c) | |||||||||||||||||
| Intersegment eliminations (d) | ( | ( | ( | ||||||||||||||
| Total property and equipment additions | |||||||||||||||||
| Assets acquired under capital-related vendor financing arrangements | ( | ( | ( | ||||||||||||||
| Assets acquired under finance leases | ( | ( | ( | ||||||||||||||
| Changes in current liabilities related to capital expenditures | ( | ( | |||||||||||||||
| Total capital expenditures, net | $ | $ | $ | ||||||||||||||
| Property and equipment additions: | |||||||||||||||||
VMO2 JV (e) | $ | $ | $ | ||||||||||||||
VodafoneZiggo JV | $ | $ | $ | ||||||||||||||
_______________
(a)Amounts have been revised, as applicable, to reflect the retrospective impact of the Tech Framework, as described above.
(b)Amount represents the property and equipment additions of the U.K. JV Entities through the June 1, 2021 closing of the U.K. JV Transaction.
(c)Includes (i) property and equipment additions representing centrally-owned assets that benefit our operating segments, including development costs related to our internally-developed software prior to our decision to externally market such software, (ii) the net impact of certain centrally-procured network equipment that is ultimately transferred to our operating segments and (iii) property and equipment additions of our operations in Slovakia.
(d)Amounts reflect the charge under the Tech Framework to each respective consolidated reportable segment related to the value attributed to centrally-held internally developed technology that is embedded within our various CPE, as well as any applicable markup.
(e)The 2021 amount represents the property and equipment additions of the VMO2 JV for the period beginning June 1, 2021.
II-120
LIBERTY GLOBAL LTD.
Notes to Consolidated Financial Statements — (Continued)
December 31, 2023, 2022 and 2021
Revenue by Major Category
Our revenue by major category for our consolidated reportable segments is set forth below:
| Year ended December 31, | |||||||||||||||||
| 2023 | 2022 | 2021 | |||||||||||||||
| in millions | |||||||||||||||||
| Residential revenue: | |||||||||||||||||
| Residential fixed revenue (a): | |||||||||||||||||
| Subscription revenue (b): | |||||||||||||||||
| Broadband internet | $ | $ | $ | ||||||||||||||
| Video | |||||||||||||||||
| Fixed-line telephony | |||||||||||||||||
| Total subscription revenue | |||||||||||||||||
| Non-subscription revenue | |||||||||||||||||
| Total residential fixed revenue | |||||||||||||||||
| Residential mobile revenue (c): | |||||||||||||||||
| Subscription revenue (b) | |||||||||||||||||
| Non-subscription revenue | |||||||||||||||||
| Total residential mobile revenue | |||||||||||||||||
| Total residential revenue | |||||||||||||||||
B2B revenue (d): | |||||||||||||||||
| Subscription revenue | |||||||||||||||||
| Non-subscription revenue | |||||||||||||||||
Total B2B revenue | |||||||||||||||||
| Other revenue (e) | |||||||||||||||||
| Total | $ | $ | $ | ||||||||||||||
_______________
(a) Residential fixed subscription revenue includes amounts received from subscribers for ongoing services and the recognition of deferred installation revenue over the associated contract period. Residential fixed non-subscription revenue includes, among other items, channel carriage fees, late fees and revenue from the sale of equipment.
(b) Residential subscription revenue from subscribers who purchase bundled services at a discounted rate is generally allocated proportionally to each service based on the standalone price for each individual service. As a result, changes in the standalone pricing of our fixed and mobile products or the composition of bundles can contribute to changes in our product revenue categories from period to period.
(c) Residential mobile subscription revenue includes amounts received from subscribers for ongoing services. Residential mobile non-subscription revenue includes, among other items, interconnect revenue and revenue from sales of mobile handsets and other devices.
(d) B2B subscription revenue represents revenue from (i) services provided to small or home office (SOHO) subscribers and (ii) mobile services provided to medium and large enterprises. SOHO subscribers pay a premium price to receive expanded service levels along with broadband internet, video, fixed-line telephony or mobile services that are the same or similar to the mass marketed products offered to our residential subscribers. B2B non-subscription revenue includes (a) revenue from business broadband internet, video, fixed-line telephony and data services offered to medium and large enterprises and, fixed-line and mobile services on a wholesale basis, to other operators and (b) revenue from long-term leases of portions of our network.
II-121
LIBERTY GLOBAL LTD.
Notes to Consolidated Financial Statements — (Continued)
December 31, 2023, 2022 and 2021
Geographic Segments
The revenue of our geographic segments is set forth below:
| Year ended December 31, | |||||||||||||||||
| 2023 | 2022 | 2021 | |||||||||||||||
| in millions | |||||||||||||||||
| Switzerland | $ | $ | $ | ||||||||||||||
| Belgium | |||||||||||||||||
| Ireland | |||||||||||||||||
| U.K. (a) | |||||||||||||||||
| Slovakia | |||||||||||||||||
| Other, including intersegment eliminations (b) | |||||||||||||||||
| Total | $ | $ | $ | ||||||||||||||
VMO2 JV (U.K.) (c) | $ | $ | $ | ||||||||||||||
VodafoneZiggo JV (Netherlands) | $ | $ | $ | ||||||||||||||
_______________
(a) Amount represents the revenue of the U.K. JV Entities through the June 1, 2021 closing of the U.K. JV Transaction.
(b) Revenue from our other geographic segments relates to (i) our Central functions, most of which are located in the Netherlands and the U.K., and (ii) certain other operations at Telenet, primarily in the U.S. and Luxembourg.
(c) The 2021 amount represents the revenue of the VMO2 JV for the period beginning June 1, 2021.
The long-lived assets of our geographic segments are set forth below:
| December 31, | |||||||||||
| 2023 | 2022 (a) | ||||||||||
| in millions | |||||||||||
| Switzerland | $ | $ | |||||||||
| Belgium | |||||||||||
| Ireland | |||||||||||
| Slovakia | |||||||||||
| Other (b) | |||||||||||
| Intersegment eliminations | ( | $ | ( | ||||||||
| Total | $ | $ | |||||||||
VMO2 JV (U.K.) | $ | $ | |||||||||
VodafoneZiggo JV (Netherlands) | $ | $ | |||||||||
_______________
(a)Amounts have been revised, as applicable, to reflect the retrospective impact of the Tech Framework, as described above.
II-122
LIBERTY GLOBAL LTD.
Notes to Consolidated Financial Statements — (Continued)
December 31, 2023, 2022 and 2021
II-123
PART III
The capitalized terms used in Part III of this Annual Report on Form 10-K are defined in the notes to our consolidated financial statements. In the following text, the terms, “we,” “our,” “our company” and “us” may refer, as the context requires, to Liberty Global or collectively to Liberty Global and its subsidiaries.
Except as indicated below, the following required information is incorporated by reference to our definitive proxy statement for our 2024 Annual Meeting of Shareholders, which we intend to hold during the second quarter of 2024.
| Item 10. | DIRECTORS, EXECUTIVE OFFICERS AND CORPORATE GOVERNANCE | ||||
| Item 11. | EXECUTIVE COMPENSATION | ||||
| Item 12. | SECURITY OWNERSHIP OF CERTAIN BENEFICIAL OWNERS AND MANAGEMENT AND RELATED STOCKHOLDER MATTERS | ||||
The information required by Item 201(d) of Regulation S-K is included below and accordingly will not be incorporated by reference to our definitive proxy statement. | |||||
| Item 13. | CERTAIN RELATIONSHIPS AND RELATED TRANSACTIONS, AND DIRECTOR INDEPENDENCE | ||||
| Item 14. | PRINCIPAL ACCOUNTANT FEES AND SERVICES | ||||
Our independent registered public accounting firm is KPMG LLP, Denver, CO Auditor Firm ID: | |||||
We intend to file our definitive proxy statement for our 2024 Annual Meeting of Shareholders with the Securities and Exchange Commission on or before April 28, 2024.
III-1
Item 12. SECURITY OWNERSHIP OF CERTAIN BENEFICIAL OWNERS AND MANAGEMENT AND RELATED SHAREHOLDER MATTERS
Securities Authorized for Issuance Under Equity Compensation Plans
The following table sets forth information as of December 31, 2023 with respect to our common shares that are authorized for issuance under our equity compensation plans.
Equity Compensation Plan Information
| Plan Category | Number of securities to be issued upon exercise of outstanding options, warrants and rights (1)(2) | Weighted average exercise price of outstanding options, warrants and rights (1)(2) | Number of securities available for future issuance under equity compensation plans (excluding securities reflected in the first column) | |||||||||||||||||
Equity compensation plans approved by security holders: | ||||||||||||||||||||
Liberty Global 2023 Incentive Plan (3): | 40,245,318 | |||||||||||||||||||
| Liberty Global Class A common shares | 37,018 | $ | 19.03 | |||||||||||||||||
| Liberty Global Class C common shares | 74,036 | $ | 20.13 | |||||||||||||||||
Liberty Global 2014 Incentive Plan (4): | ||||||||||||||||||||
| Liberty Global Class A common shares | 24,754,389 | $ | 26.22 | |||||||||||||||||
| Liberty Global Class C common shares | 56,013,129 | $ | 25.53 | |||||||||||||||||
Liberty Global 2014 Nonemployee Director Incentive Plan (4): | ||||||||||||||||||||
| Liberty Global Class A common shares | 622,177 | $ | 28.87 | |||||||||||||||||
| Liberty Global Class C common shares | 2,704,039 | $ | 24.79 | |||||||||||||||||
VM Incentive Plan (5): | ||||||||||||||||||||
| Liberty Global Class A common shares | — | $ | — | |||||||||||||||||
| Liberty Global Class C common shares | 4,127 | $ | 24.18 | |||||||||||||||||
Equity compensation plans not approved by security holders: | ||||||||||||||||||||
| None | — | — | ||||||||||||||||||
| Totals: | ||||||||||||||||||||
| Total common shares available for issuance | 40,245,318 | |||||||||||||||||||
| Liberty Global Class A common shares | 25,413,584 | |||||||||||||||||||
| Liberty Global Class C common shares | 58,795,331 | |||||||||||||||||||
(1)This table includes (i) SARs and PSARs with respect to 21,453,431 and 3,337,976 Liberty Global Class A shares, respectively, and 49,552,860 and 6,534,305 Liberty Global Class C common shares, respectively. Upon exercise, the appreciation of a SAR, which is the difference between the base price of the SAR and the then-market value of the respective underlying class of common shares or in certain cases, if lower, a specified price, may be paid in shares of the applicable class of common shares. Based upon the respective market prices of Liberty Global Class A and Class C common shares at December 31, 2023 and excluding any related tax effects, 312,707 and 1,200,892 Liberty Global Class A and Liberty Global Class C common shares, respectively, would have been issued if all outstanding and in-the-money SARs had been exercised on December 31, 2023. For further information, see note 15 to our consolidated financial statements.
(2)In addition to the option, SAR and PSAR information included in this table, there are outstanding RSU and PSU awards under the various incentive plans with respect to an aggregate of 2,905,627 and 6,232,097, Liberty Global Class A and Liberty Global Class C common shares, respectively.
(3)The Liberty Global 2023 Incentive Plan permits grants of, or with respect to, Liberty Global Class A, Class B, or Class C common shares subject to a single aggregate limit of 43,284,342 shares, subject to anti-dilution adjustments. As of
III-2
December 31, 2023, an aggregate of 40,245,318 common shares were available for issuance pursuant to the incentive plan. For further information, see note 15 to our consolidated financial statements.
(4)On June 14, 2023, our shareholders approved the Liberty Global 2023 Incentive Plan and, accordingly, no further awards will be granted under the Liberty Global 2014 Incentive Plan or the Liberty Global 2014 Nonemployee Director Incentive Plan.
(5)On January 30, 2014, our shareholders approved the 2014 Incentive Plans and, accordingly, no further awards were granted under the VM Incentive Plan. The outstanding options under the VM Incentive Plan expired on January 1, 2024.
III-3
PART IV
Item 15. EXHIBITS, FINANCIAL STATEMENT SCHEDULES
(a) (1) FINANCIAL STATEMENTS
The financial statements required under this Item begin on page II-42 of this Annual Report on Form 10-K.
(a) (2) FINANCIAL STATEMENT SCHEDULES
The financial statement schedules required under this Item are as follows:
| Schedule I - Condensed Financial Information of Registrant (Parent Company Information): | |||||
Liberty Global Ltd. Condensed Balance Sheet as of December 31, 2023 (Parent Company Only) | |||||
| Liberty Global Ltd. Condensed Statement of Operations for the period from November 23, 2023 to December 31, 2023 (Parent Company Only) | |||||
| Liberty Global Ltd. Condensed Statement of Cash Flows for the period from November 23, 2023 to December 31, 2023 (Parent Company Only) | |||||
| Liberty Global plc Condensed Balance Sheet as of December 31, 2022 (Parent Company Only) | IV-12 | ||||
| Liberty Global plc Condensed Statements of Operations for the period from January 1, 2023 to November 22, 2023 and the years ended December 31, 2022 and 2021 (Parent Company Only) | IV-13 | ||||
| Liberty Global plc Condensed Statements of Cash Flows for the period from January 1, 2023 to November 22, 2023 and the years ended December 31, 2022 and 2021 (Parent Company Only) | IV-14 | ||||
| Schedule II - Valuation and Qualifying Accounts | IV-15 | ||||
(a) (3) EXHIBITS
Listed below are the exhibits filed as part of this Annual Report on Form 10-K (according to the number assigned to them in Item 601 of Regulation S-K). Each reference to the Registrant includes the Registrant’s predecessors, as applicable.
| 2 -- Plan of Acquisition, Reorganization, Arrangement, Liquidation or Succession: | |||||
| 2.1 | |||||
| 2.2 | |||||
| 2.3 | |||||
| 2.4 | |||||
| 3 -- Articles of Incorporation and Bylaws: | |||||
| 3.1 | |||||
| 4 -- Instruments Defining the Rights of Securities Holders, including Indentures: | |||||
| 4.1 | |||||
| Borrowing Obligations of UPC group | |||||
| 4.2 | |||||
IV-1
| 4.3 | |||||
| 4.4 | |||||
| 4.5 | |||||
| 4.6 | |||||
| 4.7 | |||||
| 4.8 | |||||
| 4.9 | |||||
| 4.10 | |||||
| 4.11 | |||||
| 4.12 | |||||
| 4.13 | |||||
| 4.14 | |||||
| Borrowing Obligations of Telenet Group | |||||
| 4.15 | |||||
| 4.16 | |||||
IV-2
| 4.17 | |||||
| 4.18 | |||||
| 4.19 | |||||
| 4.20 | |||||
| 4.21 | |||||
| 4.22 | |||||
| Borrowing Obligations of Virgin Media group | |||||
| 4.23 | |||||
| 4.24 | |||||
| 4.25 | |||||
| 4.26 | |||||
| 4.27 | |||||
| 4.28 | |||||
| 4.29 | |||||
| 4.30 | Additional Facility Q Accession Deed dated September 11, 2020 and entered into between Virgin Media Investment Holdings Limited as the Company, Virgin Media Bristol LLC as Borrower, The Bank of Nova Scotia as the Facility Agent and the Additional Facility Q Lenders (as defined therein) (incorporated by reference to Exhibit 4.1 to the Registrant’s Current Report on Form 8-K filed September 16, 2020 (the September 16, 2020 8-K)). | ||||
IV-3
| 4.31 | |||||
| 4.32 | |||||
| 4.33 | |||||
| 4.34 | |||||
| The Registrant undertakes to furnish to the Securities and Exchange Commission, upon request, a copy of all instruments with respect to long-term debt not filed herewith. | |||||
| 10 -- Material Contracts: | |||||
| Compensatory Plans or Arrangements | |||||
| 10.1 | |||||
| 10.2+ | |||||
| 10.3+ | |||||
| 10.4+ | |||||
| 10.5+ | |||||
| 10.6+ | |||||
| 10.7+ | |||||
| 10.8+ | |||||
| 10.9+ | |||||
| 10.10+ | |||||
| 10.11+ | |||||
| 10.12+ | |||||
| 10.13+ | |||||
IV-4
| 10.14+ | |||||
| 10.15+ | |||||
| 10.16+ | |||||
| 10.17+ | |||||
| 10.18+ | |||||
| 10.19+ | |||||
| 10.20+ | |||||
| 10.21+ | |||||
| 10.22+ | |||||
| 10.23+ | |||||
| 10.24+ | |||||
| 10.25+ | |||||
| 10.26+ | |||||
| 10.27+ | |||||
| 10.28+ | |||||
| 10.29+ | |||||
| 10.30+ | |||||
| Employment Agreements | |||||
| 10.31+ | |||||
| 10.32+ | |||||
IV-5
| 10.33+ | |||||
| 10.34+ | |||||
| 10.35+ | |||||
| Shareholder Agreements | |||||
| 10.36 | |||||
| 10.37 | |||||
| Other Agreements and Policies | |||||
| 10.38+ | |||||
| 10.39+ | |||||
| 10.40+ | |||||
| 23 -- Consent of Experts and Counsel: | |||||
| 23.1 | |||||
| 31 -- Rule 13a-14(a)/15d-14(a) Certification: | |||||
| 31.1 | |||||
| 31.2 | |||||
| 97 -- Policy relating to recovery of erroneously awarded compensation, as required by applicable listing standards adopted pursuant to 17 CFR 240.10D-1: | |||||
| 97.1 | |||||
| 101.SCH | Inline XBRL Taxonomy Extension Schema Document* | ||||
| 101.CAL | Inline XBRL Taxonomy Extension Calculation Linkbase Document* | ||||
| 101.DEF | Inline XBRL Taxonomy Extension Definition Linkbase* | ||||
| 101.LAB | Inline XBRL Taxonomy Extension Label Linkbase Document* | ||||
| 101.PRE | Inline XBRL Taxonomy Extension Presentation Linkbase Document* | ||||
| 104 | Cover Page Interactive Data File (formatted as Inline XBRL and contained in Exhibit 101)* | ||||
_______________
* Filed herewith
** Furnished herewith
*** Schedules and similar attachments to the agreement have been omitted pursuant to Item 601(a)(5) of Regulation S‑K. The Registrant hereby undertakes to furnish supplemental copies of any of the omitted schedules and similar attachments upon request by the United States Securities and Exchange Commission
+ This document has been identified as a management contract or compensatory plan or arrangement.
IV-6
Item 16. FORM 10-K SUMMARY
None.
IV-7
SIGNATURES
Pursuant to the requirements of Section 13 or 15(d) of the Securities Exchange Act of 1934, the Registrant has duly caused this report to be signed on its behalf by the undersigned, thereunto duly authorized.
| LIBERTY GLOBAL LTD. | |||||||||||
| Dated: | February 15, 2024 | /s/ BRYAN H. HALL | |||||||||
Bryan H. Hall Executive Vice President, General Counsel and Secretary | |||||||||||
Pursuant to the requirements of the Securities Exchange Act of 1934, this report has been signed below by the following persons on behalf of the Registrant and in the capacities and on the date indicated.
| Signature | Title | Date | ||||||||||||
| /s/ JOHN C. MALONE | Chairman of the Board | February 15, 2024 | ||||||||||||
| John C. Malone | ||||||||||||||
| /s/ MICHAEL T. FRIES | President, Chief Executive Officer and Director | February 15, 2024 | ||||||||||||
| Michael T. Fries | ||||||||||||||
| /s/ ANDREW J. COLE | Director | February 15, 2024 | ||||||||||||
| Andrew J. Cole | ||||||||||||||
| /s/ MIRANDA CURTIS | Director | February 15, 2024 | ||||||||||||
| Miranda Curtis | ||||||||||||||
| /s/ MARISA D. DREW | Director | February 15, 2024 | ||||||||||||
| Marisa D. Drew | ||||||||||||||
| /s/ PAUL A. GOULD | Director | February 15, 2024 | ||||||||||||
| Paul A. Gould | ||||||||||||||
| /s/ RICHARD R. GREEN | Director | February 15, 2024 | ||||||||||||
| Richard R. Green | ||||||||||||||
| /s/ LARRY E. ROMRELL | Director | February 15, 2024 | ||||||||||||
| Larry E. Romrell | ||||||||||||||
| /s/ DANIEL E. SANCHEZ | Director | February 15, 2024 | ||||||||||||
| Daniel E. Sanchez | ||||||||||||||
| /s/ J. DAVID WARGO | Director | February 15, 2024 | ||||||||||||
| J. David Wargo | ||||||||||||||
| /s/ ANTHONY G. WERNER | Director | February 15, 2024 | ||||||||||||
| Anthony G. Werner | ||||||||||||||
| /s/ CHARLES H.R. BRACKEN | Executive Vice President and Chief Financial Officer | February 15, 2024 | ||||||||||||
| Charles H.R. Bracken | ||||||||||||||
| /s/ JASON WALDRON | Senior Vice President and Chief Accounting Officer | February 15, 2024 | ||||||||||||
| Jason Waldron | ||||||||||||||
IV-8
LIBERTY GLOBAL LTD.
SCHEDULE I
(Parent Company Information - See Notes to Consolidated Financial Statements)
CONDENSED BALANCE SHEET
(Parent Company Only)
| December 31, 2023 | |||||
| in millions | |||||
| ASSETS | |||||
| Current assets: | |||||
| Other receivables — related-party | $ | ||||
| Total current assets | |||||
Investments in consolidated subsidiaries, including intercompany balances | |||||
| Other assets, net | |||||
| Total assets | $ | ||||
| LIABILITIES AND SHAREHOLDERS’ EQUITY | |||||
| Current liabilities: | |||||
| Other current liabilities — related-party | $ | ||||
| Other accrued and current liabilities | |||||
| Total current liabilities | |||||
| Other long-term liabilities | |||||
| Total liabilities | |||||
| Commitments and contingencies | |||||
| Shareholders’ equity: | |||||
Class A common shares, $ | |||||
Class B common shares, $ | |||||
Class C common shares, $ | |||||
| Additional paid-in capital | |||||
| Accumulated earnings | |||||
| Accumulated other comprehensive earnings, net of taxes | |||||
| Treasury shares, at cost | ( | ||||
| Total shareholders’ equity | |||||
| Total liabilities and shareholders’ equity | $ | ||||
IV-9
LIBERTY GLOBAL LTD.
SCHEDULE I
(Parent Company Information - See Notes to Consolidated Financial Statements)
CONDENSED STATEMENT OF OPERATIONS
(Parent Company Only)
| Period from November 23, 2023 to December 31, 2023 | |||||
| in millions | |||||
| Operating costs and expenses: | |||||
| Selling, general and administrative | $ | ||||
| Operating loss | ( | ||||
| Non-operating expense: | |||||
| Interest expense — related-party | ( | ||||
| ( | |||||
Loss before income taxes and equity in loss of consolidated subsidiaries, net | ( | ||||
Equity in loss of consolidated subsidiaries, net | ( | ||||
| Net loss | $ | ( | |||
IV-10
LIBERTY GLOBAL LTD.
SCHEDULE I
(Parent Company Information - See Notes to Consolidated Financial Statements)
CONDENSED STATEMENT OF CASH FLOWS
(Parent Company Only)
| Period from November 23, 2023 to December 31, 2023 | |||||
| in millions | |||||
| Cash flows from operating activities: | |||||
| Net loss | $ | ( | |||
Adjustments to reconcile net loss to net cash provided (used) by operating activities: | |||||
| Equity in loss of consolidated subsidiaries, net | |||||
| Changes in operating assets and liabilities: | |||||
| Payables and accruals | |||||
| Net cash provided (used) by operating activities | |||||
| Cash flows from investing activities: | |||||
| Net cash provided (used) by investing activities | |||||
| Cash flows from financing activities: | |||||
| Capital contributions from consolidated subsidiaries | |||||
Repurchases of Liberty Global common shares | ( | ||||
| Net cash provided (used) by financing activities | |||||
Net increase (decrease) in cash and cash equivalents and restricted cash | |||||
| Cash and cash equivalents and restricted cash: | |||||
| Beginning of period | |||||
| End of period | $ | ||||
IV-11
LIBERTY GLOBAL PLC
SCHEDULE I
(Parent Company Information - See Notes to Consolidated Financial Statements)
CONDENSED BALANCE SHEET
(Parent Company Only)
| December 31, 2022 | |||||
| in millions | |||||
| ASSETS | |||||
| Current assets: | |||||
| Cash and cash equivalents | $ | ||||
| Other receivables — related-party | |||||
| Current notes receivable — related-party | |||||
| Other current assets | |||||
| Total current assets | |||||
Long-term notes receivable — related-party | |||||
Investments in consolidated subsidiaries, including intercompany balances | |||||
| Other assets, net | |||||
| Total assets | $ | ||||
| LIABILITIES AND SHAREHOLDERS’ EQUITY | |||||
| Current liabilities: | |||||
| Accounts payable | $ | ||||
| Other payables — related-party | |||||
| Other current liabilities — related-party | |||||
| Current portion of notes payable — related-party | |||||
| Other accrued and current liabilities | |||||
| Total current liabilities | |||||
| Long-term notes payable — related-party | |||||
| Other long-term liabilities | |||||
| Total liabilities | |||||
| Commitments and contingencies | |||||
| Shareholders’ equity: | |||||
Class A common shares, $ | |||||
Class B common shares, $ | |||||
Class C common shares, $ | |||||
| Additional paid-in capital | |||||
| Accumulated earnings | |||||
| Accumulated other comprehensive earnings, net of taxes | |||||
| Treasury shares, at cost | ( | ||||
| Total shareholders’ equity | |||||
| Total liabilities and shareholders’ equity | $ | ||||
IV-12
LIBERTY GLOBAL PLC
SCHEDULE I
(Parent Company Information - See Notes to Consolidated Financial Statements)
CONDENSED STATEMENTS OF OPERATIONS
(Parent Company Only)
| Period from January 1, 2023 to November 22, 2023 | Year ended December 31, | ||||||||||||||||
| 2022 | 2021 | ||||||||||||||||
| in millions | |||||||||||||||||
| Operating costs and expenses: | |||||||||||||||||
Selling, general and administrative (including share-based compensation) | $ | $ | $ | ||||||||||||||
| Related-party fees and allocations | |||||||||||||||||
| Depreciation and amortization | |||||||||||||||||
| Operating loss | ( | ( | ( | ||||||||||||||
| Non-operating income (expense): | |||||||||||||||||
| Interest expense — related-party | ( | ( | ( | ||||||||||||||
| Interest income — related-party | |||||||||||||||||
| Foreign currency transaction gains, net | |||||||||||||||||
| Realized and unrealized gains on derivative instruments, net | |||||||||||||||||
| Other income, net | |||||||||||||||||
| ( | ( | ( | |||||||||||||||
| Loss before income taxes and equity in earnings of consolidated subsidiaries, net | ( | ( | ( | ||||||||||||||
| Equity in earnings of consolidated subsidiaries, net | |||||||||||||||||
| Income tax benefit (expense) | ( | ||||||||||||||||
| Net earnings (loss) | $ | ( | $ | $ | |||||||||||||
IV-13
LIBERTY GLOBAL PLC
SCHEDULE I
(Parent Company Information - See Notes to Consolidated Financial Statements)
CONDENSED STATEMENTS OF CASH FLOWS
(Parent Company Only)
| Period from January 1, 2023 to November 22, 2023 | Year ended December 31, | ||||||||||||||||
| 2022 | 2021 | ||||||||||||||||
| in millions | |||||||||||||||||
| Cash flows from operating activities: | |||||||||||||||||
| Net earnings (loss) | $ | ( | $ | $ | |||||||||||||
| Adjustments to reconcile net earnings (loss) to net cash used by operating activities: | |||||||||||||||||
| Equity in earnings of consolidated subsidiaries, net | ( | ( | ( | ||||||||||||||
| Share-based compensation expense | |||||||||||||||||
| Related-party fees and allocations | |||||||||||||||||
| Depreciation and amortization | |||||||||||||||||
| Realized and unrealized gains on derivative instruments, net | ( | ( | ( | ||||||||||||||
| Foreign currency transaction gains, net | ( | ( | ( | ||||||||||||||
| Deferred income tax expense (benefit) | ( | ||||||||||||||||
| Changes in operating assets and liabilities: | |||||||||||||||||
| Receivables and other operating assets | ( | ||||||||||||||||
| Payables and accruals | |||||||||||||||||
| Net cash used by operating activities | ( | ( | ( | ||||||||||||||
| Cash flows from investing activities: | |||||||||||||||||
| Distributions and repayments from (investments in and advances to) consolidated subsidiaries, net | ( | ( | |||||||||||||||
| Net cash received related to derivative instruments | |||||||||||||||||
Cash released from the Vodafone Escrow Accounts, net | |||||||||||||||||
| Other investing activities, net | ( | ||||||||||||||||
| Net cash provided (used) by investing activities | ( | ( | |||||||||||||||
| Cash flows from financing activities: | |||||||||||||||||
| Borrowings of related-party debt | |||||||||||||||||
| Repayments of related-party debt | ( | ( | ( | ||||||||||||||
Repurchases of Liberty Global common shares | ( | ( | ( | ||||||||||||||
Proceeds from the issuance of Liberty Global shares upon exercise of options | |||||||||||||||||
| Other financing activities, net | ( | ( | ( | ||||||||||||||
| Net cash provided by financing activities | |||||||||||||||||
| Effect of exchange rate changes on cash and cash equivalents and restricted cash | ( | ( | |||||||||||||||
| Net increase (decrease) in cash and cash equivalents and restricted cash | ( | ( | |||||||||||||||
| Cash and cash equivalents and restricted cash: | |||||||||||||||||
| Beginning of period | |||||||||||||||||
| End of period | $ | $ | $ | ||||||||||||||
| Details of end of period cash and cash equivalents and restricted cash: | |||||||||||||||||
| Cash and cash equivalents | $ | $ | $ | ||||||||||||||
| Restricted cash included in other current assets | |||||||||||||||||
| Total cash and cash equivalents and restricted cash | $ | $ | $ | ||||||||||||||
IV-14
LIBERTY GLOBAL LTD.
SCHEDULE II
VALUATION AND QUALIFYING ACCOUNTS
| Allowance for doubtful accounts — Trade receivables | |||||||||||||||||||||||||||||||||||
| Balance at beginning of period | Additions to costs and expenses | Acquisitions | Deductions or write-offs | Foreign currency translation adjustments | Balance at end of period | ||||||||||||||||||||||||||||||
| in millions | |||||||||||||||||||||||||||||||||||
| Year ended December 31: | |||||||||||||||||||||||||||||||||||
2021 | $ | ( | ( | ( | $ | ||||||||||||||||||||||||||||||
2022 | $ | ( | ( | $ | |||||||||||||||||||||||||||||||
2023 | $ | ( | $ | ||||||||||||||||||||||||||||||||
| Allowance for doubtful accounts — Loans to affiliates | |||||||||||||||||||||||
| Balance at beginning of period | Additions to costs and expenses | Foreign currency translation adjustments | Balance at end of period | ||||||||||||||||||||
| in millions | |||||||||||||||||||||||
| Year ended December 31: | |||||||||||||||||||||||
2021 | $ | ( | $ | ||||||||||||||||||||
2022 | $ | ( | ( | $ | |||||||||||||||||||
2023 | $ | ( | $ | ||||||||||||||||||||
IV-15