UNITED STATES
SECURITIES AND EXCHANGE COMMISSION
Washington, D.C. 20549
FORM
For the fiscal year ended
-OR-
For the transition period from to .
Commission File Number:
(Exact name of registrant as specified in its charter)
|
||
(State or other jurisdiction of incorporation of organization) |
|
(I.R.S. Employer Identification No.) |
|
|
|
|
||
(Address of principal executive offices) |
|
(Zip Code) |
(
(Registrant’s telephone number, including area code)
Securities registered under Section 12(b) of the Exchange Act:
Title of each class |
Trading Symbol(s) |
Name of each exchange on which registered |
The |
Securities registered under Section 12(g) of the Exchange Act: None
Indicate by check mark if the registrant is a well-known seasoned issuer, as defined in Rule 405 of the Securities Act. Yes ☐
Indicate by check mark if the registrant is not required to file reports pursuant to Section 13 or 15(d) of the Exchange Act. Yes ☐
Indicate by check mark whether the registrant (1) has filed all reports required to be filed by Section 13 or 15(d) of the Securities Exchange Act of 1934 during the preceding 12 months (or for such shorter period that the registrant was required to file such reports), and (2) has been subject to such filing requirements for the past 90 days.
Indicate by check mark whether the registrant has submitted electronically every Interactive Data File required to be submitted pursuant to Rule 405 of Regulation S-T (§ 232.405 of this chapter) during the preceding 12 months (or for such shorter period that the registrant was required to submit such files).
Indicate by check mark whether the registrant is a large accelerated filer, an accelerated filer, a non-accelerated filer, a smaller reporting company, or an emerging growth company. See definition of “large accelerated filer”, “accelerated filer”, “smaller reporting company”, and “emerging growth company” in Rule 12b-2 of the Exchange Act.
Large accelerated filer |
☐ |
☒ |
|
|
|
|
|
Non-accelerated filer |
☐ |
Smaller reporting company |
|
|
|
|
|
|
|
Emerging growth company |
If an emerging growth company, indicate by check mark if the registrant has elected not to use the extended transition period for complying with any new or revised financial accounting standards provided pursuant to Section 13(a) of the Exchange Act. ☐
Indicate by check mark whether the registrant has filed a report on and attestation to its management’s assessment of the effectiveness of its internal control over financial reporting under Section 404(b) of the Sarbanes-Oxley Act (15 U.S.C. 7262(b)) by the registered public accounting firm that prepared or issued its audit report.
If securities are registered pursuant to Section 12(b) of the Act, indicate by check mark whether the financial statements of the registrant included in the filing reflect the correction of an error to previously issued financial statements.
Indicate by check mark whether any of those error corrections are restatements that required a recovery analysis of incentive-based compensation received by any of the registrant’s executive officers during the relevant recovery period pursuant to §240.10D-1(b). ☐
Indicate by check mark whether the registrant is a shell company (as defined in Rule 12b-2 of the Act). Yes ☐ No
The aggregate market value (based on the closing price of the registrant’s common stock quoted on the Nasdaq Stock Market) of the registrant’s common stock owned by non-affiliates, as of July 28, 2023, the last business day of the registrant’s most recently completed second fiscal quarter, was approximately $
As of April 1, 2024, the registrant had
DOCUMENTS INCORPORATED BY REFERENCE
Portions of the registrant’s Proxy Statement relating to the registrant’s 2024 Annual Meeting of Stockholders (the “Proxy Statement”), to be held on May 9, 2024, are incorporated by reference into Part III of this Annual Report on Form 10-K where indicated. The Proxy Statement will be filed with the U.S. Securities and Exchange Commission within 120 days after the end of the fiscal year to which this report relates.
Auditor Firm Id: |
Auditor Name: |
Auditor Location: |
|||
Auditor Firm Id: |
34 |
Auditor Name: |
Deloitte & Touche LLP |
Auditor Location: |
Chicago, IL, United States |
LANDS’ END, INC.
INDEX TO ANNUAL REPORT ON FORM 10-K
Table of Contents
|
|
|
|
Page |
|
|
|
|
|
|
|
|
|
|
|
|
|
|
|
Item 1. |
|
|
2 |
|
|
|
|
|
|
Item 1A. |
|
|
12 |
|
|
|
|
|
|
Item 1B. |
|
|
24 |
|
|
|
|
|
|
Item 1C. |
|
|
24 |
|
|
|
|
|
|
Item 2. |
|
|
26 |
|
|
|
|
|
|
Item 3. |
|
|
26 |
|
|
|
|
|
|
Item 4. |
|
|
27 |
|
|
|
|
|
|
|
|
|
|
|
|
|
|
|
|
Item 5. |
|
|
28 |
|
|
|
|
|
|
Item 6. |
|
|
29 |
|
|
|
|
|
|
Item 7. |
|
Management’s Discussion and Analysis of Financial Condition and Results of Operations |
|
30 |
|
|
|
|
|
Item 7A. |
|
|
45 |
|
|
|
|
|
|
Item 8. |
|
|
46 |
|
|
|
|
|
|
Item 9. |
|
Changes in and Disagreements with Accountants on Accounting and Financial Disclosure |
|
82 |
|
|
|
|
|
Item 9A. |
|
|
82 |
|
|
|
|
|
|
Item 9B. |
|
|
84 |
|
|
|
|
|
|
Item 9C. |
|
Disclosure Regarding Foreign Jurisdictions that Prevent Inspections |
|
84 |
|
|
|
|
|
|
|
|
|
|
|
|
|
|
|
Item 10. |
|
|
85 |
|
|
|
|
|
|
Item 11. |
|
|
86 |
|
|
|
|
|
|
Item 12. |
|
Security Ownership of Certain Beneficial Owners and Management and Related Stockholder Matters |
|
87 |
|
|
|
|
|
Item 13. |
|
Certain Relationships and Related Transactions, and Director Independence |
|
88 |
|
|
|
|
|
Item 14. |
|
|
89 |
|
|
|
|
|
|
|
|
|
|
|
|
|
|
|
|
Item 15. |
|
|
90 |
|
|
|
|
|
|
Item 16. |
|
|
93 |
|
|
|
|
|
|
|
|
|
94 |
|
1
PART I
ITEM 1. BUSINESS
As used in this Annual Report on Form 10-K, references to the “Company”, “Lands’ End”, “we”, “us”, “our” and similar terms refer to Lands’ End, Inc. and its subsidiaries. Our fiscal year ends on the Friday preceding the Saturday closest to January 31. Other terms commonly used in this Annual Report on Form 10-K are defined as follows:
2
Lands’ End, Inc. is a leading digital retailer of solution-based apparel, swimwear, outerwear, accessories, footwear, home products and uniforms. We offer products online at www.landsend.com, through third-party distribution channels and our own Company Operated stores. We also offer products to businesses and schools, for their employees and students, through the Outfitters distribution channel. We are a classic American lifestyle brand that creates solutions for life’s every journey.
Lands’ End was founded in 1963 by Gary Comer and his partners to sell sailboat hardware and equipment by catalog. While our product focus has shifted significantly over the years, we have continued to adhere to our founder’s motto as one of our guiding principles: “Take care of the customer, take care of the employee and the rest will take care of itself.”
We have one external reportable segment and identify our operating segments according to how our business activities are managed and evaluated. During Fiscal 2023, our operating segments consisted of: U.S. eCommerce, Europe eCommerce, Outfitters, Third Party and Retail. During Fiscal 2022, our operating segments also included Japan eCommerce (See Note 8, Lands’ End Japan Closure). We have determined that each of our operating segments share similar economic and other qualitative characteristics, and therefore, the results of our operating segments are aggregated into one external reportable segment.
Distribution Channels
Lands’ End identifies five separate distribution channels for revenue reporting purposes.
In Fiscal 2023, we generated Net revenue of approximately $1.47 billion. Net revenue was generated worldwide with operations based in the United States, United Kingdom, and Germany. This network reinforces and supports sales across the distribution channels in which we do business. Net revenue is presented by distribution channel in the following table:
(in thousands) |
|
Fiscal 2023 |
|
% of Net Revenue |
|
Fiscal 2022 |
|
% of Net Revenue |
|
Fiscal 2021 |
|
% of Net Revenue |
|||
U.S. eCommerce |
|
$ |
930,314 |
|
63.2% |
|
$ |
955,752 |
|
61.4% |
|
$ |
1,027,138 |
|
62.8% |
International (1) |
|
|
112,855 |
|
7.7% |
|
|
166,627 |
|
10.7% |
|
|
220,997 |
|
13.5% |
Outfitters |
|
|
269,943 |
|
18.3% |
|
|
265,898 |
|
17.1% |
|
|
254,191 |
|
15.5% |
Third Party |
|
|
111,826 |
|
7.6% |
|
|
118,996 |
|
7.7% |
|
|
86,517 |
|
5.3% |
Retail |
|
|
47,570 |
|
3.2% |
|
|
48,156 |
|
3.1% |
|
|
47,781 |
|
2.9% |
Total Net revenue |
|
$ |
1,472,508 |
|
|
|
$ |
1,555,429 |
|
|
|
$ |
1,636,624 |
|
|
3
In Fiscal 2023, we fulfilled orders to customers in approximately 135 countries outside the United States, totaling approximately 9% of Net revenue.
Net revenue by the geographical location where the product is shipped is as follows:
(in thousands) |
|
Fiscal 2023 |
|
% of Net Revenue |
|
Fiscal 2022 |
|
% of Net Revenue |
|
Fiscal 2021 |
|
% of Net Revenue |
|||
United States |
|
$ |
1,342,366 |
|
91.2% |
|
$ |
1,368,518 |
|
88.0% |
|
$ |
1,393,402 |
|
85.1% |
Europe |
|
|
114,778 |
|
7.8% |
|
|
135,878 |
|
8.7% |
|
|
179,302 |
|
11.0% |
Asia (1) |
|
|
569 |
|
0.0% |
|
|
33,451 |
|
2.2% |
|
|
44,383 |
|
2.7% |
Other |
|
|
14,795 |
|
1.0% |
|
|
17,582 |
|
1.1% |
|
|
19,537 |
|
1.2% |
Total Net revenue |
|
$ |
1,472,508 |
|
|
|
$ |
1,555,429 |
|
|
|
$ |
1,636,624 |
|
|
Long-lived assets by geographical location, which includes Property and equipment, net, are as follows:
(in thousands) |
|
Fiscal 2023 |
|
|
Fiscal 2022 |
|
|
Fiscal 2021 |
|
|||
United States |
|
$ |
111,254 |
|
|
$ |
120,311 |
|
|
$ |
121,259 |
|
Europe |
|
|
6,588 |
|
|
|
7,051 |
|
|
|
7,879 |
|
Asia |
|
|
191 |
|
|
|
276 |
|
|
|
653 |
|
Total long-lived assets |
|
$ |
118,033 |
|
|
$ |
127,638 |
|
|
$ |
129,791 |
|
Strategy
We continue to leverage our iconic American brand, which was founded on the principles of delivering great quality, uncompromising service and exceptional value to our customers. We are a vertically integrated digital retailer that manages most aspects of our design, marketing and distribution in-house. In Fiscal 2024, we plan to focus on the following five strategic pillars:
Customer Obsessed. At Lands’ End, we are customer obsessed and strive to bring our customer what they want, when they want it and where they want it, regardless of the product category or means they use to shop our brand. We are focused on further penetrating our existing customer base and seek to build their loyalty through cross-category shopping, as well as introducing new customers to our brand. Additionally, we are focused on creating more personal and compelling journeys geared toward our targeted key customer cohorts to drive higher quality sales with more productive inventories. We strive to operate with lower inventory levels to provide flexibility to refresh our assortment with new styles and fabrics on an ongoing basis.
Product to Solve Life’s Issues. We plan to continue our solutions-focused merchandising strategy which drove higher quality sales resulting in enhanced gross margins and improved cash flow in Fiscal 2023 across key items, categories and franchises including swimwear, outerwear, bottoms, and school and business uniforms.
Digitally Native. Lands’ End maintains a leading digital presence in both our business-to-consumer and business-to-business digital markets. With over 90% of our business being done online, we seek to leverage data and analytics to drive higher quality sales with improved gross margins and increased gross profit. Digital operations is a core competency and our conversion rate is consistently greater than two times apparel industry norms.
Innovation. Lands’ End has long been an innovator, epitomized as being an early adopter of eCommerce for apparel retail, through our embrace of data analytics to better organize our business and service our customers. We strive to be innovative throughout our business to drive stronger results. We are focused on advancing our technologies, challenging ourselves to think and operate differently, embracing change, testing and learning, and applying our learning to best serve evolving customer needs.
Stakeholder Responsibility. Lands’ End is committed to serving all of our stakeholders – our customers, our shareholders, our hard working and dedicated employees and the supportive communities in which we operate. Our goal is to drive deep and meaningful engagement with all stakeholders to achieve our collective goals.
4
History
We were founded in 1963, incorporated in Delaware in 1986, and our common stock was listed on the New York Stock Exchange from 1986 to 2002. On June 17, 2002, we became a wholly-owned subsidiary of Sears Roebuck and Co., a wholly-owned subsidiary of Sears Holdings Corporation and its consolidated subsidiaries (“Sears Holdings”). On April 4, 2014, Sears Holdings distributed 100 percent of the outstanding common stock of Lands’ End to its stockholders and our common stock was listed on the Nasdaq Stock Market.
Competition
We operate primarily in the apparel industry which is highly competitive. We compete with a diverse group of direct-to-consumer companies and retailers, including national department store chains, women’s and men’s specialty apparel chains, outdoor specialty stores, apparel catalog businesses, sportswear marketers and online apparel businesses that sell similar lines of merchandise. We compete principally on the basis of providing solutions for our customer’s needs through merchandise value (quality and price), product attributes and innovation, our established customer file and award-winning customer service.
Seasonality
We experience seasonal fluctuations in our net revenue and operating results and historically have realized a significant portion of our yearly net revenue and earnings during our fourth fiscal quarter. We generated approximately 34.0% of our yearly net revenue in the fourth quarters of Fiscal 2023, Fiscal 2022 and Fiscal 2021. Lower than expected fourth quarter net revenue could have an adverse impact on our annual operating results. See also Item 1A, Risk Factors, in this Annual Report on Form 10-K.
Working capital requirements typically increase during the second and third quarters of the fiscal year as inventory builds to support peak selling periods and, accordingly, working capital requirements typically decrease during the fourth quarter of the fiscal year as inventory is sold. Cash provided by operating activities is typically higher in the fourth quarter of the fiscal year due to reduced working capital requirements during that period.
Intellectual Property
Lands’ End owns or has rights to use certain word and design trademarks, service marks, and trade names that are registered or exist under common law in the United States and other jurisdictions. The Lands’ End® trade name and trademark are used both in the United States and internationally and are material to our business. Trademarks that we commonly use to identify and distinguish our products and services are Lands’ End Lighthouse®, Squall®, Tugless Tank®, Drifter™, Outrigger®, Marinac®, and Beach Living®, all of which are owned by us, as well as the licensed marks Supima®, No-Gape®, and others. Other recognized trademarks owned by Lands’ End includes Starfish™, Little Black Suit™, Iron Knees®, Hyde Park®, Year’Rounder®, ClassMate®, Willis & Geiger® and ThermaCheck®. Lands’ End’s rights to some of these trademarks are limited to select markets.
During Fiscal 2023, we entered into licensing agreements for the Costco distribution channel, and all footwear products and all kids categories, excluding school uniforms. We expect to begin generating income from these licenses starting in Fiscal 2024. In line with our asset-light strategy, we will continue to explore additional licensing relationships.
Product Design and Merchandising
We seek to develop new, innovative products that provide solutions for our customers’ needs by utilizing modern fabrics and quality construction to create timeless, affordable styles with excellent fit. We also seek to present our products in an engaging and inspiring way. We devote significant time and resources to quality assurance, fit testing and product compliance.
Our product teams seek to determine optimal inventory levels that align with merchandising and marketing plans and initiatives. The product team also supports efforts to optimize product margin through active management
5
of in-season promotions and post-season clearance activities. In addition, the product teams partner with our global sourcing team through long range planning efforts designed to better manage global supply chain costs.
Consistent with our merchandising strategy, we make inventory investments intended to support the growth of key products. In addition, we strive to improve assortment efficiency to increase seasonal sell through. We continue to leverage technology solutions to assist us in these strategic initiatives.
Sourcing and Vendors
Our products are produced globally by independent manufacturers who are selected, monitored and coordinated by our sourcing team and external sourcing experts. In Fiscal 2023, the top five countries where our vendors are located accounted for approximately 70% of our merchandise purchases in dollars. Our products are manufactured in approximately 20 countries and the majority are imported from Asia and South America.
In Fiscal 2023, our top 10 vendors accounted for approximately 48% of our merchandise purchases in dollars and we worked with approximately 120 vendors that manufactured substantially all of our products. We generally do not enter into long-term merchandise supply contracts. We continue to take advantage of opportunities to more efficiently source our products worldwide, consistent with our high standards of quality and value. Significant areas of non-product spend include logistics, information systems, marketing, packaging and catalog paper and print. We use third-party shipping companies to transport the product to our facilities. Our reliance on imported products has certain risks related to disruptions in countries of manufacture, port congestion, transportation delays and heightened security measures that have affected, and could in the future affect, timely deliveries of product to our points of distribution.
It is important to us that our partners share the same core values as we do. Therefore, we require that all vendors comply with applicable legal requirements, agree to our global compliance requirements and meet our product quality standards. Our vendors are required to provide us with full access to their facilities and to relevant records relating to their employment practices, such as, but not limited to, child labor, wages and benefits, forced labor, discrimination, freedom of association, unlawful inducements, safe and healthy working conditions and other business practices so that we may monitor their compliance with ethical and legal requirements relating to the conduct of their business. See also Item 1A, Risk Factors, in this Annual Report on Form 10-K.
Corporate Citizenship
Lands’ End is working towards improving its sustainable footprint through key practices like waste reduction, purchasing recycled consumables and corporate partnerships. Lands’ End hopes to inspire customers and other corporations to increase sustainability awareness and initiatives.
We have a focus on raising awareness and educating our employees on reducing our internal use of consumables and natural resources. In addition, we have a broad range of recycling and waste management initiatives at our corporate office and distribution centers. For example, we are reducing our use of office paper products and plastics, we recycle aluminum cans and glass and work with partners to reuse electronic equipment before recycling, as well as disposal of non-recyclables with an on-campus composting site. We also focus on efficient water and energy management programs.
Lands’ End has formed strategic relationships to support habitats and watersheds throughout the United States and in our local area of Wisconsin. The Natural Forest Foundation and Lands’ End have made an impact in the last ten years, planting over 1.5 million trees in national forests. Since 2010, Lands’ End has been a founding and corporate partner of the Clean Lakes Alliance, which helps with education and protecting and improving the quality of local parks and lakes in Wisconsin.
6
Marketing
We believe that our most important asset is our brand. Lands’ End is well-recognized and has a deeply rooted tradition of excellent quality, value and service. Lands’ End is an iconic American brand with a large and loyal customer base.
We invest significantly in brand development through our focus on providing excellent customer service, emphasis on digital and innovative product development. We believe that this commitment to our brand has helped to generate our large and loyal customer base for over sixty years.
We attempt to build on our brand recognition through multi-channel marketing campaigns including through our eCommerce website, www.landsend.com, catalog distribution, digital marketing and social media. Creative designs for these marketing platforms are developed in-house by our creative team with supplemental work by external agencies on a project basis.
Customer Service
We are committed to building on Lands’ End’s legacy of strong customer service. We believe we have a strong track record of improving the customer service experience through innovation. Lands’ End is focused on using our extensive customer data to make the shopping experience as effortless and personalized as possible. Customer service agents are available on the phone, via chat, email and social media, and we maintain a digital self-service platform. These all have contributed to our award-winning customer service, which we believe is one of our core strengths and a key point of differentiation from our competitors.
We have received many accolades over the years and most recently Lands’ End was included in the Newsweek list of America’s Best Customer Service in 2023, 2022 and 2021, ranking No. 2 for 2023 and 2022 and No.1 for 2021 for best customer service in the Online Retailers: Clothing in the Apparel category.
Distribution
We own and operate three distribution centers in Wisconsin. Our Dodgeville facility is approximately 1.3 million square feet, our Reedsburg facility is approximately 550,000 square feet and our Stevens Point facility is approximately 150,000 square feet. Our customer orders are shipped via third-party carriers.
We own and operate a distribution center in the United Kingdom based in Oakham, a community north of London. Our Oakham facility is approximately 185,000 square feet.
Information Technology
Lands’ End employs a variety of third-party and internally-developed systems to enhance our customer experience and support efficient, cost-effective operations. In support of our business strategies, we implement new solutions and upgrade existing ones to offer, sell and fulfill our products through Lands’ End distribution channels and with wholesale partners, licensees and external marketplaces. See also Item 1A, Risk Factors, in this Annual Report on Form 10-K.
Human Capital Management
Philosophy and Approach
Since our founding in 1963, Lands’ End has recognized that our people are a critical asset. People, the individuals we employ, the customers we serve, and their families, are the heart of our company. We are committed to creating an inspiring culture that is welcoming, safe and inclusive for all who work and shop with us. Our founder, Gary Comer set the foundation with this quote: “The really important thing that makes Lands’ End what it has become is people. You, me, everyone around us. It is what we do as people that makes this a great place to come to work”.
We employ approximately 4,900 employees: approximately 4,400 employees in the United States and approximately 500 employees outside the United States. The U.S. workforce consists of approximately 50% part-time
7
employees, 32% hourly employees and 18% salaried employees. With the seasonal nature of the fourth quarter holiday shopping season in the retail industry, approximately 1,500 additional, flexible, part-time employees are hired in the U.S. to support our customer service and distribution centers.
Recruitment and Retention
Lands’ End leverages a multifaceted recruitment approach to source and hire top talent aligned with our corporate priorities. We maintain a strong digital presence to represent our brand and proactively target talent, in addition to a meaningful employee referral bonus program. We have annual talent reviews to evaluate and align on high potential talent with development actions that prepare employees for internal promotion and career growth opportunities, including succession planning for management positions.
Lands’ End has an open-door philosophy. We regularly seek employee feedback through both formal and informal methods from all employment classifications on a variety of topics, including confidence in company leadership, competitiveness of our compensation and benefits package, career growth opportunities and feedback on how we could improve our efforts to be an even greater place to work. Survey outcomes are utilized to drive meaningful improvements. Our efforts to retain talent and maintain strong employee engagement have been very effective, as evidenced by approximately 37% of our full time U.S. employee base having a tenure of 10 years or more.
Turnover within our workforce is closely monitored to alert management of potential issues aside from our normal and desired turnover. Our three-year average global salaried turnover rate is approximately 12%, and the turnover rate for our U.S. hourly full-time staff is approximately 11%. We maintain a strong focus on employee retention through regular and consistent communication, periodic pulse surveys and continued emphasis on employee personal health and safety.
Diversity, Equity and Inclusion
As we strive to be a great place to work, we continue to focus on key initiatives to educate and support diversity and inclusion in the workplace. We believe our strength in work and life comes from the combination of our unique experiences, backgrounds and talents.
We maintain a Diversity, Equity and Inclusion Council (“DEI Council”) consisting of employees who come from diverse backgrounds, with Lands’ End’s Chief Executive Officer serving as the executive sponsor. The DEI Council oversees programming designed to celebrate diversity and foster awareness of all perspectives. To that end, the DEI Council maintains training modules, which are required of all employees, and hosts relevant speakers throughout the year to further employee education. The DEI Council maintains a prominent online presence within the Company’s intranet through which it communicates with all employees across a wide range of subjects, including the recognition of important days within various cultures and educational materials in support of building greater awareness and appreciation of our individual stories, experiences and lives. Each month, a Diversity Newsletter is sent company wide, which serves to further celebrate differences among us.
We maintain Business Resource Groups (“BRGs”) to provide support for our employees. The BRGs are employee-led and consist of individuals with common interests, backgrounds or demographic factors such as gender, sexual orientation, race, ethnicity or life experience. We currently have seven groups: Lands’ End PRIDE (LGTBQ+), Lands’ End Working Parents, LEEDA (Lands’ End Employees with Disabilities and Allies), Lands’ End Veterans, Lands’ End Multicultural, Lands’ End UpLift (multi-generation), and the Lands’ End Women Group. The groups are open to all employees, including our international employees and allies who want to be supportive and involved. It is our belief that by encouraging and supporting BRGs, we are reinforcing our message of inclusion and hope to further empower our employees to utilize their voice to make Lands’ End welcoming, understanding and stronger.
The Human Resource team continually benchmarks and evolves our benefit offerings to provide more inclusive options. We extended our paid parental leave in 2022 to be more inclusive and expanded domestic partner benefits.
8
We have also enhanced our recruitment process to support more diverse and inclusive hiring practices. Our strategies extend our reach by targeting areas of the country and industry groups that have top diverse talent and align with diverse business organizations that are reflective of our overall brand strategy. In addition, we are committed to recruitment that is free from bias and actively educate our interview panels and monitor to identify areas of improvement.
Compensation and Benefits
We are committed to fostering an environment where contributions are recognized, valued, and rewarded. Our Total Rewards Philosophy is rooted in the fundamental principle that our employees are the driving force behind our success, and we are committed to offering a competitive rewards program that includes compensation, benefits, and opportunities. We align our total rewards programs, core values, and strategic business objectives to attract, retain, and engage top talent, while fostering a culture of collaboration, growth, and excellence.
We believe in upholding pay equity and fairness and are committed to providing equal pay for equal work, ensuring that compensation decisions are based on objective criteria such as skills, experience, and performance. Our compensation practices are designed to foster an inclusive and diverse workforce, where everyone has equal opportunities to thrive and succeed. When making compensation decisions, Lands’ End considers compensation market data primarily focused on apparel retail companies and other related industries.
In addition to paying competitive salaries and wages, Lands’ End has various compensation awards and programs in place for all employees based on their position, such as annual incentive plans, long-term (cash and/or equity) incentive awards, sales incentive plans, peak incentives, and discretionary bonuses based on company performance.
We are committed to offering a variety of benefits that support the well-being and diverse needs of our employees and their families. In the U.S. these include the following, among other benefits:
Outside of the U.S., we provide competitive benefits which align with market specific needs and regulations, including comprehensive health, dental and vision coverage, pension plans, employer-provided life insurance and paid time off benefits such as paid leave, vacation, and holidays.
Training and Development
Lands’ End partners with employees to discover and develop their talents and abilities through various programs. Development opportunities are available throughout the employee lifecycle, including internships, on-boarding, Early in Career networking, mentorship programs, workshops, self-paced learning and leader coaching. Programs cover a variety of relevant topics, including diversity and inclusion, cybersecurity, harassment free workplace, product updates, deployment of new technology, interpersonal skills, and leadership development. Senior management
9
regularly reviews organizational talent to identify employees who possess the potential for advancement and to identify, recommend and address developmental needs. We provide development experiences for all levels of the organization and are committed to performance management, offering annual reviews, goal setting, 360 feedback and formal coaching support and mentorship programs for employees.
Corporate Information
Our principal executive offices are located at 1 Lands’ End Lane, Dodgeville, Wisconsin 53595. Our telephone number is (608) 935-9341.
Available Information, Internet Address and Internet Access to Current and Periodic Reports and Other Information
Our website address is www.landsend.com. References to www.landsend.com do not constitute incorporation by reference of the information at www.landsend.com, and such information is not part of this Annual Report on Form 10-K or any other filings with the SEC, unless otherwise explicitly stated. We file our Annual Report on Form 10-K, Quarterly Reports on Form 10-Q and Current Reports on Form 8-K, and all amendments to those reports, as well as proxy and information statements, electronically with the SEC, and they are available on the SEC’s website (www.sec.gov), which contains reports, proxy and information statements, and other information regarding issuers that file electronically with the SEC. We also make our Annual Reports on Form 10-K, Quarterly Reports on Form 10-Q, current reports on Form 8-K and amendments to those reports available through the Investor Relations section of our website, free of charge, as soon as reasonably practicable after we file such material with, or furnish it to, the SEC.
Our Corporate Governance Guidelines, the charters of the Audit Committee, the Compensation Committee and the Nominating and Corporate Governance Committee of the Board of Directors, our Related Party Transactions Policy, our Director Compensation Policy, our Code of Conduct, and our Board of Directors Code of Conduct are available at the “Corporate Governance” page in the “Investor Relations” section of www.landsend.com.
Information about our Executive Officers
The following table sets forth information regarding our executive officers, including their positions.
Name |
|
Position |
|
Age |
Andrew J. McLean |
|
Chief Executive Officer |
|
55 |
Bernard McCracken |
|
Chief Financial Officer |
|
62 |
Peter L. Gray |
|
Chief Commercial Officer, Chief Administrative Officer and General Counsel |
|
56 |
Angela Rieger |
|
Executive Vice President, Chief Transformation Officer |
|
56 |
Andrew J. McLean has served as the Chief Executive Officer since January 28, 2023. He joined Lands’ End as Chief Executive Officer-Designate and member of the Board of Directors in November 2022. Prior to joining the Company, he served at American Eagle Outfitters, Inc., the parent of the American Eagle and Aerie brands, from October 2016 to September 2022, in the roles of President, International from August 2022 to September 2022, Executive Vice President, Chief Commercial Officer from April 2017 to August 2022, and Executive Vice President, International from October 2016 to April 2017. Mr. McLean served Urban Outfitters, Inc. as Chief Operating Officer and Head of International from 2014 to October 2016, and as Chief Operating Officer from 2008 to 2014. Mr. McLean held various positions at Liz Claiborne, Inc., including President, Outlet Division, from 2003 to 2008, as well as, various positions at Gap, Inc. from 2000 to 2003. Mr. McLean began his career as a strategy consultant with AT Kearney. Outside of his professional commitments, Mr. McLean has been an active supporter of the New York Fashion Tech Lab, an organization committed to supporting retail innovation among female entrepreneurs. Mr.
10
McLean received his Bachelor’s degree in Engineering from the University of Manchester, a Master’s degree in Engineering Management from the University of Cambridge and an MBA from Harvard Business School. Mr. McLean brings extensive operational and strategic expertise and over 20 years of retail experience leading organizational growth for several Fortune 500 and start-up companies. Mr. McLean has a proven track record in the areas of global brand delivery and international strategy, marketing and customer experience.
Bernard McCracken was appointed Chief Financial Officer in September 2023 after serving as Interim Chief Financial Officer since January 2023. Mr. McCracken served as the Vice President, Controller and Chief Accounting Officer of Lands’ End from April 2014 until his appointment as Chief Financial Officer. Mr. McCracken previously served as Vice President Corporate Controller/Business Transformation Office, Senior Director of Special Projects and Senior Director of Accounting at The Children’s Place, Inc. Mr. McCracken also served in the roles of Vice President of Finance (divisional CFO), Meldisco Division, and Assistant Controller at Footstar, Inc. from 1998 to 2003. Mr. McCracken also served as a Consultant/Manager, Enterprise Risk Services-Retail Internal Audit Group at Deloitte & Touche LLP from 1997 to 1998, served as Divisional Controller at The Leslie Fay Companies, Inc. from 1994 to 1997, and Assistant Controller at Loehmann’s Inc. from 1987 to 1994.
Peter L. Gray has served as Chief Commercial Officer of Lands’ End since January 2023. He joined Lands’ End as Executive Vice President, Chief Administrative Officer and General Counsel in May 2017. Mr. Gray served as Executive Vice President, General Counsel and Secretary of Tumi Holdings, Inc., a manufacturer and retailer of consumer goods including business bags, luggage, apparel and other travel-related goods, from December 2013 until November 2016. He was employed by ModusLink Global Solutions, Inc. (formerly CMGI, Inc.), a supply chain business process management company, from June 1999 to October 2013, most recently as Executive Vice President, Chief Administrative Officer and General Counsel. Earlier in his career, he was a junior partner at Hale and Dorr LLP. He also serves as Chairman of the Board of Directors of the Tufts University Hillel Foundation.
Angela Rieger has served as Executive Vice President, Chief Transformation Officer since January 2023. She served in several roles of increasing responsibility at Lands’ End, including Divisional President, Lands’ End Outfitters from August 2022 to January 2023, Senior Vice President, Wholesale and Head of Sourcing from July 2022 to August 2022, Senior Vice President, International and Wholesale from January 2020 to July 2022, Senior Vice President, International from July 2019 to January 2020, Senior Vice President, Planning and Head of International from March 2019 to July 2019, Senior Vice President, Planning and US Direct from June 2016 to March 2019, Senior Vice President, Inventory Planning from January 2013 to March 2019, Vice President, Planning and Inventory from October 2011 to January 2013 and Sr. Director, U.S. Planning and Inventory from May 2010 to October 2011. She served as Merchandising Manager of Douglas Stuart Company from May 2007 to April 2010. She was also previously employed by Lands’ End from July 1991 to May 2007. She has served as a member of the Board of Directors of Thrivent Financial since February 2020, as well as MGE Energy, Inc. (MGE Energy) and Madison Gas and Electric Company (MGE) since March 2024, and serves on the Board of Directors of American Family Children’s Hospital Development Advisory Board, Clean Lakes Alliance, and Women in Retail Leadership Circle.
11
ITEM 1A. RISK FACTORS
You should carefully consider the following risks and other information in this Annual Report on Form 10-K in evaluating our company and our common stock. Any of the following risks could materially and adversely affect our business, results of operations or financial condition.
RISKS RELATED TO MACROECONOMIC CONDITIONS
The impact of economic conditions on consumer discretionary spending and customers has in the past and could, in the future, adversely affect our financial performance.
Apparel purchases are discretionary expenditures that historically have been influenced by domestic and global economic conditions. Higher prices for consumer goods may result in less discretionary spending for consumers. Changes in consumer spending have resulted and may continue to result in reduced demand for our products, increased inventories, lower revenues, higher discounts, pricing pressures and lower gross margins.
Global and domestic conditions that have an effect on consumer discretionary spending include but may not be limited to: unemployment, general and industry-specific inflation, consumer confidence, consumer purchasing and saving habits, credit conditions, stock market performance, home values, population growth, household incomes and tax policies. Material changes to governmental policies related to domestic and international fiscal concerns, and/or changes in central bank policies with respect to monetary policy also could affect consumer discretionary spending. Any of these additional factors affecting consumer discretionary spending may further influence our customers’ purchasing preferences, potentially having a further material impact on our financial performance.
Global economic conditions have had and could, in the future, adversely affect our business, operating results and financial condition.
Global economic conditions have impacted, and will likely continue to impact, businesses around the world. Macroeconomic pressures in the U.S. and the global economy such as rising interest rates, raw material costs and energy prices have created and may continue to create a challenging economic environment. The following factors attributable to uncertain economic and financial market conditions could have a material adverse effect on our business, operating results and financial condition:
In the current uncertain economic environment, we cannot predict whether or when such circumstances may improve or worsen, or what impact, if any, such circumstances could have on our business, results of operations, cash flows and financial position.
Our business, results of operations and information technology systems could be negatively impacted by natural disasters, extreme weather conditions, public health emergencies, including pandemics, or political crises or other catastrophic events.
Our vendors and operations are located throughout the world including locations subject to natural disasters or extreme weather conditions, public health emergencies, including pandemics, or terrorist attacks, political or military conflicts as well as other potential catastrophic events. The occurrence of any of these events could disrupt our
12
operations and/or technology and therefore negatively impact sales of our products and may also heighten other risks described in this section, including but not limited to those related to consumer behavior and expectations, competition, brand reputation, implementation of strategic initiatives, cybersecurity threats, payment-related risks, technology systems disruption, global supply chain disruptions, labor availability and cost, litigation, operational risk as a result of remote work arrangements and regulatory requirements.
Climate change, unseasonal or severe weather conditions or significant weather events caused by climate change may adversely affect our merchandise sales.
Our business is adversely affected by unseasonal weather conditions and may be affected by significant weather events due to climate change. Sales of our spring and summer products, which traditionally consist of lighter clothing and swimwear, are adversely affected by cool or wet weather. Similarly, sales of our fall and winter products, which are traditionally weighted toward outerwear, are adversely affected by mild, dry or warm weather. In addition, severe weather events typically result in reduced traffic at Company Operated store locations which could lead to reduced sales of our merchandise. Severe weather events may impact our ability to deliver orders to customers in a timely manner, supply our Company Operated stores and adequately staff our distribution centers and Company Operated stores, which could have an adverse effect on our business and results of operations.
RISKS RELATED TO MICROECONOMIC CONDITIONS
Our business is seasonal in nature and any decrease in our sales or margins, especially during the fourth quarter of our fiscal year, could have an adverse effect on our business and results of operations.
Our business is seasonal, with the highest levels of sales typically occurring during the fourth quarter of our fiscal year. Our fourth quarter results in the future may fluctuate based upon factors such as the timing of holiday season dates, inventory positions, global supply chain challenges, promotions, level of markdowns, competitive factors, weather and general economic conditions. Any decrease in sales or margins, for example, as a result of increased promotional activity, increased costs, economic conditions, poor weather or other factors, could have an adverse effect on our business and results of operations. In addition, seasonal fluctuations also affect our inventory levels since we usually order merchandise in advance of peak selling periods. To manage customer demand, we need to maintain an appropriate, but large amount of inventory, especially increasing it before the fourth quarter peak selling periods. If we are not successful in selling inventory during these periods, we may have to sell the inventory after the peak selling period at significantly reduced prices, which could adversely affect our business and results of operations. Furthermore, with the seasonal nature of our business, over 1,500 flexible part-time employees join us each year to support our fourth quarter holiday shopping season. An inability to attract qualified flexible part-time personnel could interrupt our sales during such peak seasons.
Fluctuations and anticipated increases in the cost and availability of catalog paper, printing services, distribution, and postage have had and could continue to have an adverse effect on our business and results of operations.
Catalog mailings are an important aspect of our marketing efforts. Increases in costs relating to postage, paper, and printing have increased and may continue to increase the cost of our catalog mailings and could reduce our profitability to the extent that we are unable to offset such increases by raising retail prices, or by implementing more efficient printing, mailing, delivery, and order fulfillment systems, or by using alternative direct-mail formats.
Paper for catalogs and promotional mailings is an essential resource in the success of our business. The continuous changes to the global paper market have resulted in plant closures and equipment conversion and lower available volume of specialty paper grades. The market price for paper has fluctuated significantly and may continue to fluctuate in the future. In addition, future pricing and supply availability of catalog paper may be impacted in the United States and Europe. The multi-year price of paper may be subject to fluctuation under our contracts for the supply of paper and we are not guaranteed access to, or reasonable prices for, the amounts required for the operation of our business over the long term.
13
We also depend upon external vendors to print and mail our catalogs. Partially due to the consolidation of printing companies, there are a limited number of printers that can handle such needs which subjects us to risks if any printer fails to perform as required. The cost to print catalogs may also fluctuate based on several factors beyond our control, including commodity prices for ink and solvents, changes in supply and demand, labor costs, and energy. Also, during Fiscal 2023, there was continued capacity reduction in the market which will continue to pressure pricing as contracts expire.
We currently use national mail carriers for distribution of substantially all our catalogs and a fluctuating quantity of our outbound customer deliveries. Therefore, we are vulnerable to postal rate increases, changes in discounts for bulk mailings and sorting by zip code and carrier routes which we currently leverage for cost savings.
Our approach to merchandise promotions and markdowns to encourage consumer purchases could adversely affect our gross margins and results of operations.
The apparel industry is dominated by large brands and national/mass retailers, where price competition, promotion, and branded product assortment drive differentiation between competitors. In order to be competitive, we must offer customers compelling products at attractive prices. In recent periods, the use of promotions and markdowns, as appropriate, is a strategy we have employed to offer attractive prices. Heavy reliance on promotions and markdowns to encourage customers to purchase our merchandise could have a negative impact on our gross margins and results of operations.
We may need additional financing in the future for our general corporate purposes or growth strategies and such financing may not be available on favorable terms, or at all, and may be dilutive to existing stockholders.
We may need to seek additional financing for our general corporate purposes or growth strategies. We may be unable to obtain any desired additional financing on terms favorable to us, or at all, depending on macroeconomic or other market conditions which are outside of our control. The ability to raise additional financing depends on numerous factors, including general economic and market conditions, the health of financial institutions, our credit ratings and lenders’ assessments of our prospects and the prospects of the retail industry in general, which are impacted by current macroeconomic conditions. The lenders, under our existing or any future credit facilities, may not be able to meet their commitments if they experience shortages of capital and liquidity. With negative changes in market conditions, we may be subject to limitations on our operations due to restrictive covenants in current Debt Facilities. If adequate funds required through debt issuance are not available on acceptable terms, we may be unable to fund our capital needs required to successfully develop or enhance our products, or respond to competitive pressures, any of which could negatively affect our business. If we are not able to fulfill our liquidity needs through operating cash flows and/or borrowings under credit facilities or otherwise in the capital markets, our business and financial condition would be adversely affected.
Our total debt and the underlying debt agreements, which contain terms and conditions which impose restrictions on us, may affect our ability to operate our business, placing us at a competitive disadvantage in our industry.
Our debt and debt service requirements could adversely affect our ability to operate our business and may limit our ability to take advantage of potential business opportunities. Our level of debt presents the following risks, among others:
14
We have incurred and could continue to incur non-cash charges due to impairment of intangible assets and long-lived assets.
As of February 2, 2024, our intangible asset consists of our trade name totaling $257.0 million, which is subject to testing for impairment annually or more frequently if events or changes in circumstances indicate that the asset might be impaired. Any event that impacts our reputation could result in impairment charges for our trade name. Long-lived assets, primarily property and equipment, are also subject to testing for impairment if events or changes in circumstances indicate that the asset might be impaired. A significant amount of judgment is involved in our impairment assessment. If actual results fall short of our estimates and assumptions used in estimating revenue growth, future cash flows and asset fair values, we could incur further impairment charges for intangible assets or long-lived assets, which could have an adverse effect on our results of operations.
RISKS RELATED TO BRAND AND BRAND EXECUTION
If customer preference for our branded merchandise and services change or we cannot compete effectively in the apparel industry, our business and results of operations may be adversely affected.
Our products and services must satisfy the desires of customers, whose preferences change over time. Sales of branded merchandise account for substantially all our total revenues and the Lands’ End brand is a critical differentiating factor for our business. Our inability to develop products that resonate with our existing customers and attract new customers, our inability to maintain our strict quality standards or to develop, produce and deliver innovative products in a timely manner, or any unfavorable publicity with respect to the foregoing or otherwise could negatively impact the image of our brand with our customers and could result in diminished appeal of our brand. As customer preferences change, our failure to anticipate, identify and react in a timely manner to emerging trends and appropriately provide attractive high-quality products that maintain or enhance the appeal of our brand through our websites, catalogs and Company Operated stores could have an adverse effect on our sales, operating margins and results of operations.
The apparel industry is highly competitive. We compete with a diverse group of direct-to-consumer companies and retailers, including national department store chains, women’s and men’s specialty apparel chains, apparel catalog businesses, sportswear marketers and online apparel businesses that sell similar lines of merchandise. Brand image, marketing, design, price, service, quality, image presentation, fulfillment and customer service are all competitive factors. Our competitors may be able to adopt more aggressive pricing policies, adapt to changes in customer preferences or requirements more quickly, devote greater resources to the design, sourcing, distribution, marketing and sale of their products, or generate greater national brand recognition than we can. An inability to overcome these potential competitive disadvantages or effectively market our products relative to our competitors could have an adverse effect on our business and results of operations.
15
The success of our business depends on our overall marketing strategies for digital marketing and direct mail catalogs and customers’ use of our digital platform, including our eCommerce websites.
The success of our business depends on customers’ use of our eCommerce websites and their response to our digital marketing and direct mail catalogs. The level of customer traffic and volume of customer purchases on our eCommerce website is substantially dependent on the ability to provide attractive and accessible websites, maintain a robust customer list, provide a high-quality customer experience and reliable delivery of our merchandise. If we are unable to maintain and increase customer traffic to our eCommerce website and the volume of goods they purchase, including, as a result of changes to the level and types of marketing or amount of spend allocated to each type of marketing, or through the failure to otherwise successfully promote and maintain websites and their associated services, our revenue and results of operations could be adversely affected. In addition, any future privacy rules or other regulations could adversely impact our business to the extent we need to limit or change our digital marketing efforts.
We have been increasing our investment in digital marketing, social media and optimizing our catalog productivity. Digital marketing costs now exceed direct mail catalog costs and this shift in marketing strategy could have a negative impact if customers that previously relied on the direct mail catalog do not respond as favorably through the digital marketing channel.
If we are unable to protect or preserve the image of our brands, our reputation and our intellectual property rights, our business may be adversely affected.
We regard our copyrights, service marks, trademarks, trade dress, trade secrets and similar intellectual property as critical to our success. As such, we rely on trademark and copyright law, trade secret protection and confidentiality agreements with our associates, consultants, vendors and others to protect our proprietary rights. Nevertheless, the steps we take to protect our proprietary rights may be inadequate and we may have trouble in effectively limiting unauthorized use of our trademarks and other intellectual property worldwide. Unauthorized use of our trademarks, copyrights, trade secrets or other proprietary rights may cause significant damage to our brands and our ability to effectively represent ourselves to agents, suppliers, vendors, licensees and/or customers.
Additionally, our efforts to pursue licensing and wholesaling relationships with third parties increases risk of brand damage. If third parties do not adhere to our standards or if we fail to maintain the image of our brands due to merchandise and service quality issues, adverse publicity, governmental investigations or litigation, or other reasons, our brands and reputation could be damaged, and our business may be adversely affected.
Third parties may sue us for alleged infringement of their proprietary rights. The party claiming infringement might have greater resources than we do to pursue its claims, and we could be forced to incur substantial costs and devote significant management resources to defend against such litigation. If the party claiming infringement were to prevail, we could be forced to discontinue the use of the related trademark or design, pay significant damages, or enter into expensive royalty or licensing arrangements with the prevailing party, assuming these royalty or licensing arrangements are economically feasible, which they may not be.
We rely on vendors to provide us with services in connection with certain aspects of our business, and any failure by these vendors to perform their obligations could have an adverse effect on our business and results of operations.
We have entered into agreements with vendors for logistics services, information technology systems (including website hosting), credit card processing, onshore and offshore software development and support, catalog production, distribution and packaging and employee benefits. Services provided by any of our vendors could be interrupted as a result of many factors, such as acts of nature or contract disputes. Any failure by a vendor to provide us with contracted-for services on a timely basis or within service level expectations and performance standards could result in a disruption of our business and have an adverse effect on our business and results of operations.
16
Our Company Operated stores may not be successful, and as a result our business and results of operations could be adversely affected.
Our Company Operated stores are dependent on our ability to operate all locations effectively and attract customers with a compelling assortment. Our Company Operated store operations include managing the store and recruiting and hiring store management and associates. In addition, we are required to implement retail-specific marketing plans, and enhance inventory management skills specific to retail, such as those related to allocation and replenishment of product. If customers are not receptive of our store locations and concept, customer traffic, projected store sales and profitability may suffer.
RISKS RELATED TO SUPPLY CHAIN AND GLOBAL OPERATIONS
If we fail to timely and effectively obtain shipments of products from our vendors and deliver merchandise to our customers, our business and operating results could be adversely affected.
We do not own or operate any manufacturing facilities and therefore depend upon independent merchandise suppliers and vendors for the manufacture of our merchandise. We cannot control all of the various factors that might affect timely and effective procurement of supplies of product from our vendors, including labor issues and other disruptions. From time to time, some of our factories that produce our product have experienced temporary suspension of operations due to labor issues and other disruptions.
The products that we purchase are shipped to our distribution centers in Wisconsin and the United Kingdom. Our reliance on a limited number of distribution centers makes us more vulnerable to unforeseen events that could delay or impair our ability to fulfill customer orders and/or ship merchandise to our Company Operated stores. Our ability to mitigate the adverse impacts of these events depends in part upon the effectiveness of our disaster preparedness and response planning, as well as business continuity planning which may not be adequate or perform as intended.
Our utilization of imports also makes us vulnerable to risks associated with products manufactured abroad, including, among other things, transportation and other delays in ocean shipments, including delays experienced with the Red Sea crisis, unexpected or significant port congestion, lack of freight availability, increased cost to secure freight availability, freight cost increases, risks of damage, destruction or confiscation of products while in transit to a distribution center, organized labor strikes and work stoppages, heightened security screening and inspection processes or other port-of-entry limitations or restrictions in the United States and the United Kingdom.
We rely upon third-party land-based and air freight carriers for merchandise shipments from our distribution centers to customers. Accordingly, we are subject to the risks, including labor disputes, union organizing activity, trucking shortages, inclement weather and increased logistics costs, associated with such carriers’ ability to provide delivery services to meet outbound shipping needs. The changing mix of our outbound freight carriers may result in higher costs and customer delays. In addition, if the cost of fuel rises or surcharges increase, the cost to deliver merchandise from distribution centers to customers may rise, and, although some of these costs are paid by our customers, such costs could have an adverse impact on our profitability. Any increase in shipping costs and surcharges may have an adverse effect on our profitability and future financial performance.
Fluctuations and increases in the cost, availability, and quality of raw materials as well as fluctuations in other production and distribution related costs could adversely affect our business and results of operations.
Our products are manufactured using several key raw materials, including wool, cotton and down, which are subject to fluctuations in price and availability and many of which are produced in emerging markets in Asia and South America. The prices of these raw materials may also fluctuate based on a number of other factors beyond our control, including commodity prices such as prices for oil, changes in supply and demand, labor costs, competition, import duties, tariffs, anti-dumping duties, currency exchange rates and government regulation. Recent inflationary pressures have increased the cost of oil and raw materials. These fluctuations in cost, availability and quality of raw
17
materials used to manufacture our merchandise may result in an increase in our costs to purchase products from our vendors and could have an adverse effect on our cost of goods. Increases in raw material cost may cause us to increase our prices, which may not be acceptable to our customers.
If we do not accurately forecast our inventory needs, efficiently manage inventory levels and have proper controls to protect our inventory, our results of operations could be adversely affected.
We must maintain sufficient inventory levels to operate our business successfully. Sufficient inventory levels are maintained by our ability to accurately forecast the product needs for each distribution channel, our ability to accurately report our inventory levels and our ability to protect those assets.
If we do not accurately anticipate the future customer demand for a particular product, report the current inventory level for a particular product, protect the physical inventory or project the time it will take to obtain new inventory, inventory levels will not be appropriate, and our results of operations could be adversely affected. We must also avoid accumulating excess inventory, which increases working capital needs, increases carrying costs of the inventory, including an increase in interest expense on variable rate debt, and could lower gross margins. On the other hand, if we underestimate demand for a particular product, we may experience inventory shortages resulting in lost revenues.
We obtain substantially all our inventory from vendors located outside the United States. Some of these vendors require lengthy advance notice of order requirements in order to be able to supply products in the quantities requested. This usually requires us to order merchandise and enter into commitments for the purchase of such merchandise well in advance of the time these products will be offered for sale, which makes responding to changing markets challenging.
Our own websites, third-party suppliers and third-party marketplaces rely on our ability to report and exchange accurate inventories by style, color and size to support customer orders. If we are not able to accurately report inventory information our results of operations could be negatively impacted.
We store high volumes of inventory and are subject to the attendant risks of inventory loss, spoilage, shrink, scrap and theft (which we collectively refer to as “shrinkage”). Although some level of inventory shrinkage is unavoidable, if we were to experience higher than expected rates of inventory shrinkage, be unable to accurately record inventory transactions or incur increased security costs to combat inventory theft, it could have a material adverse effect on our business.
Deterioration of relationships with our vendors and/or the failure of our new merchandise sourcing initiatives could have an adverse effect on our competitive position and operational results.
We have long standing relationships with the vendors that supply a significant portion of our merchandise but do not operate under long-term agreements. Therefore, our success relies on maintaining good relations with these vendors. Our growth strategy depends to a significant extent on the willingness and ability of our vendors to efficiently supply merchandise that is consistent with our standards for quality and value. In the event we engage new vendors, it may cause us to encounter delays in production and added costs as a result of the time it takes to guide and educate our vendors in producing our products and adhering to our standards. If we cannot obtain a sufficient amount and variety of quality product at acceptable prices, it could have a negative impact on our competitive position. This could result in lower revenues and decreased customer interest in our product offerings, which, in turn, could adversely affect our business and results of operations.
Our arrangements with our vendors are generally not exclusive. As a result, our vendors might be able to sell similar products to our competitors, some of which purchase products in significantly greater volume. Our competitors may enter into arrangements with suppliers that could impair our ability to sell those suppliers’ products, including by requiring suppliers to enter into exclusive arrangements, which could limit our access to such arrangements or products.
18
Our merchandising sourcing strategies are designed to increase the efficiency and responsiveness of our supply chain and include both vendor rationalization, vendor productivity and third-party sourcing assistance. In the event these strategies are unsuccessful, our business could be adversely affected.
Our reputation and customers’ willingness to purchase our products depend in part on our independent vendors and licensing partners compliance with ethical employment practices, such as with respect to child labor, wages and benefits, forced labor, discrimination, freedom of association, unlawful inducements, safe and healthy working conditions, and with all legal and regulatory requirements relating to the conduct of their business and safety standards of materials. While we operate compliance and monitoring programs to promote ethical and lawful business practices and verify compliance with safety standards, we do not exercise ultimate control over our independent vendors and licensing partners or their business practices and cannot guarantee their compliance with ethical and lawful business practices and safety standards. Violation of ethical, labor, safety, or other standards by independent vendors and licensing partners, or the divergence of an independent vendor’s or licensing partner’s labor practices from those generally accepted as ethical in the United States could hurt our reputation or materially impact our ability to import products manufactured by these vendors or from the regions in which they operate, which could have an adverse effect on our business and results of operations.
We conduct business in and rely on sources for merchandise located in foreign markets and our business may therefore be adversely affected by legal, regulatory, economic and political risks associated with international trade in those markets.
The majority of our merchandise is manufactured in Asia and South America, depending on the nature of the product mix. These products are either imported directly by us or indirectly by distributors who, in turn, sell products to us. Any increase in the cost of merchandise purchased from these vendors or restrictions on the merchandise made available by these vendors could have an adverse effect on our business and results of operations.
We also sell our products globally. Our reliance on vendors in foreign markets and the marketing of products to customers in foreign markets creates risks inherent in doing business in foreign jurisdictions, including:
19
Any inability on our part to successfully operate in foreign jurisdictions and rely on our foreign sources of production, due to any of the factors listed above, could have an adverse effect on our business, results of operations and financial condition.
Our efforts to expand our distribution channels and geographic reach may not be successful.
Our strategy includes initiatives to further our reach in the United States and in several countries throughout the world through various distribution channels and brands, including through relationships with third-party eCommerce marketplaces. We have limited experience operating in many of these locations and with third parties and face major, established competitors. We may also experience barriers to entry. We may seek additional business partners or licensees to assist us in these efforts, however we may not be successful in establishing such relationships. Moreover, consumer tastes and trends may differ in many of these locations from those in our existing locations, and as a result, the sales of our products may not be successful or profitable. If our expansion efforts are not successful or do not deliver an appropriate return on our investments, our business could be adversely affected.
RISKS RELATED TO INFORMATION TECHNOLOGY, CYBERSECURITY AND DATA PRIVACY
If we fail to maintain or implement new information technology systems, we could experience significant disruptions to our operations.
We employ a variety of third-party and internally-developed systems including web sites, point of sale, telecommunications, email, design and merchandising, production management, inventory management, warehouse management, financial, and human resources systems to maintain our business. Some of these systems are aged and difficult to maintain. All systems are subject to damage or interruption from power outages, computer and telecommunications failures, computer viruses, security breaches, catastrophic events such as fires, tornadoes and hurricanes, and usage errors by our employees or vendors. Such damage or interruption, if pervasive or prolonged, may have a material adverse impact on our business or results of operation.
In support of our business strategies, we implement new solutions and upgrade existing ones to offer, sell and fulfill our products through Lands’ End distribution channels and with wholesale partners, licensees and external marketplaces. As we deploy such changes, we must maintain effective internal controls and operational processes. Any difficulties encountered in completing these activities, as well as problems in technical resources, system performance or system adequacy, including loss or corruption of data, could have an adverse impact on our business.
If we do not adequately protect against cyber security threats, maintain customer privacy, or secure employee and company information, we could experience significant business interruption and become subject to litigation.
Our information technology systems are potentially vulnerable to malicious intrusion and targeted or random cyber-attacks. Although we have invested in the protection and monitoring of our information technology network, proprietary and customer data and systems, there can be no assurance that these efforts will prevent breaches in our information technology systems that could adversely affect our business.
The regulatory environment related to information security and privacy is increasingly rigorous with new and rapidly changing requirements applicable to our business. Compliance with the European Union General Data Protection Regulation (GDPR), the California Consumer Privacy Act (CCPA), the California Privacy Rights Act
20
(CPRA) and other privacy laws requires and will continue to require significant management and financial resources. We could be held liable to government agencies, our customers or other parties or be subject to significant fines, regulatory or other actions for breaching privacy and information security laws and regulations, and our business and reputation could be adversely affected by any resulting loss of customer confidence, litigation, civil or criminal penalties or adverse publicity.
Any significant compromise or breach of customer, employee or company data security, could significantly damage our reputation and result in additional costs, lost sales, fines and lawsuits. There can be no assurance that the procedures that we or our third-party providers have implemented to protect against unauthorized access to secured data are adequate to safeguard against all data security breaches.
Our operations are highly dependent upon our information technology systems and failures or interruptions of service or security breaches in our systems may interrupt our operations and harm our business.
Our operations are dependent upon the successful and uninterrupted functioning of our computer and information technology systems. We rely heavily on information technology systems across our operations, including those we use for finance and accounting functions, supply chain management, point-of-sale processing, online and mobile platforms, mobile payment processing, and various other processes and functions. Many of these systems are interdependent on one another for their functionality. Additionally, the success of several of our initiatives to drive growth, including our priority to expand digital engagement with our customers, is highly dependent on the reliability, availability, integrity, scalability and capacity of our information technology systems. We also rely on third-party providers and platforms for some of these information technology systems and support.
Our operational safeguards may not be effective in preventing the failure of these systems to operate effectively and be continuously available to run our business. Such failures may be caused by various factors, including fire, natural disaster, power loss, telecommunications failure, problems with transitioning to upgraded or replacement systems, physical break-ins, programming errors, flaws in third-party software or services, disruptions or service failures of technology infrastructure facilities, such as storage servers, provided by third parties, errors or malfeasance by our employees or third-party service providers or breaches in the security of these systems or platforms, including unauthorized entry and computer viruses. We cannot assure you that we will resolve these system failures and restore our systems and operations in an effective and timely manner. Such system failures and any delayed restore process could result in:
RISKS RELATED TO MAJORITY OWNERSHIP
Edward Lampert and his investment affiliates, whose interests may be different from the interests of other stockholders, may be able to exert substantial influence over Lands’ End.
According to an amendment to Schedule 13D filed with the SEC on March 16, 2022, Edward S. Lampert beneficially owned 51.9% of our outstanding shares of common stock as of March 16, 2022. Accordingly, Mr. Lampert could have substantial influence over many, if not all, actions to be taken or approved by our stockholders, including in the election of directors and any transactions involving a change of control. The interests of Mr. Lampert,
21
who has direct and indirect investments in other companies, including ESL Investments, Inc., may from time to time diverge from the interests of our other stockholders.
Our common stock price may decline if Mr. Lampert decides to sell a portion of his holdings of our common stock.
Mr. Lampert is not subject to any contractual obligation to maintain his ownership position in Lands’ End, and we cannot assure you that he will. Any sale by Mr. Lampert of our common stock, or any announcement by Mr. Lampert that he has decided to sell shares of our common stock, could have an adverse impact on the price of our common stock.
GENERAL RISKS
Failure to retain our existing workforce and to attract qualified new personnel in the current labor market and remote and hybrid work models could adversely affect our business and results of operations.
Due to the seasonal nature of our business, we rely heavily on flexible part-time employees to staff our distribution and customer service centers to support our peak seasons, including back-to-school shopping season and fourth quarter holiday shopping season. A potential labor shortage may impact our ability to hire and retain qualified personnel and impact our ability to operate our business effectively. Depending on their position, our employees either work 100% on-site or remotely from home or in hybrid work models which allows employees to work both remotely from home and in the office. While we have developed a work model that we believe is best for operating our business, we may not be able to attract, hire or retain qualified personnel if competing companies offer a more desirable work model.
Failure to retain our executive management team and to attract qualified new personnel could adversely affect our business and results of operations.
We depend on the talents and continued efforts of our executive management team. The loss of members of our executive management may disrupt our business and adversely affect our results of operations. Furthermore, our ability to manage further expansion will require us to continue to train, motivate and manage employees and to attract, motivate and retain additional qualified personnel. Competition for these types of personnel is intense, and we may not be successful in attracting, assimilating and retaining the personnel required to grow and operate our business profitably.
Other factors may have an adverse effect on our business, results of operations and financial condition.
Many other factors may affect our profitability and financial condition, including:
22
Our share price may be volatile.
The market price of our common stock may fluctuate significantly due to several factors, some of which may be beyond our control, including:
Further, when the market price of a company’s common stock drops significantly, stockholders often initiate securities class action lawsuits against the company. A lawsuit against us could cause us to incur substantial costs and could divert the time and attention of our senior management and other resources.
Your percentage ownership in Lands’ End may be diluted in the future.
In the future, your percentage ownership in Lands’ End may be diluted because of equity issuances for acquisitions, strategic investments, capital market transactions or otherwise, including equity awards that we may grant to our directors, officers and employees.
Exposure to periodic litigation and other regulatory proceedings, including with respect to product liability claims. These proceedings may be affected by changes in laws and government regulations or changes in their enforcement.
From time to time, we may be involved in lawsuits and regulatory actions relating to our business or products we sell or have sold. These proceedings may be in jurisdictions with reputations for aggressive application of laws and procedures against corporate defendants. We are impacted by trends in litigation, including class-action allegations brought under various consumer protection and employment laws, including wage and hour laws, privacy laws, and laws relating to eCommerce. Due to the inherent uncertainties of litigation and regulatory proceedings, we cannot accurately predict the ultimate outcome of any such proceedings. An unfavorable outcome could have an adverse effect on our business and results of operations.
Potential assessments for additional state taxes, which could adversely affect our business.
In accordance with current law, we pay, collect and/or remit taxes for Federal, State and local and foreign jurisdictions where we are required by law. While we believe that we have appropriately remitted all taxes based on our interpretation of applicable law, tax laws are complex, and their application differs by taxing jurisdiction.
An increasing number of taxing jurisdictions may attempt to assess additional taxes and penalties on us or assert an error in our calculation. These include new obligations to collect sales, consumption, value added, or other taxes on online marketplaces and remote sellers, or other requirements that may result in liability for third-party obligations. A change in the application of law, or an interpretation of the law that differs from our own may, if successful, adversely affect our business and results of operations.
23
ITEM 1B. UNRESOLVED STAFF COMMENTS
Not applicable.
ITEM 1C. CYBERSECURITY
We have developed and implemented a cybersecurity risk management program intended to protect the confidentiality, integrity, and availability of our critical systems and information. Our cybersecurity risk management program includes a data security incident response policy and a security incident response plan, which were first developed in 2017 and are periodically reviewed and updated.
We have designed and assessed our program based on the National Institute of Standards and Technology Cybersecurity Framework (“NIST CSF”). This does not imply that we meet any particular technical standards, specifications, or requirements, rather only that we use the NIST CSF as a guide to help us identify, assess, and manage cybersecurity risks relevant to our business.
Our cybersecurity risk management program is integrated into our overall enterprise risk management program, and shares common methodologies, reporting channels and governance processes that apply across the enterprise risk management program to our legal, compliance, strategic, operational, and financial risk areas.
Our cybersecurity risk management program includes:
There can be no assurance that our cybersecurity risk management program and processes, including our policies, controls or procedures, will be adequate, fully complied with or effective in protecting our systems and information.
We have not identified risks from known cybersecurity threats, including as a result of any prior cybersecurity incidents, that have materially affected us, including our operations, business strategy, results of operations, or financial condition. We face risks from cybersecurity threats that, if realized, are reasonably likely to materially affect us, including our operations, business strategy, results of operations, or financial condition. See “Risk Factors – RISKS RELATED TO INFORMATION TECHNOLOGY, CYBERSECURITY AND DATA PRIVACY.”
24
Cybersecurity Governance
Our Board considers cybersecurity risk as part of its risk oversight function and has delegated to the Audit Committee oversight of data protection and cybersecurity risks as part of the Audit Committee’s oversight of the Company’s enterprise risk management framework. The Audit Committee regularly reports to the full Board regarding its activities, including those related to cybersecurity.
The Audit Committee receives regular reports from management on our cybersecurity risks, which include updates on trends and threats, the Company’s backup and response systems, internal and external risk assessments, results of PCI and other security audits, and planned updates and upgrades. The Audit Committee also receives regular enterprise risk management updates, which include management of cybersecurity risks.
In accordance with our data security incident response plan, management is required to promptly update and discuss with the Audit Committee any material or potentially material cybersecurity incidents and provide an update to the Board upon determination. Management regularly updates the Audit Committee regarding incidents with lesser impact potential.
Our management team, including our Chief Financial Officer, Chief Technology Officer and General Counsel (the cybersecurity disclosure committee), is responsible for assessing material risks from cybersecurity threats and our General Counsel oversees any required reporting obligations and notifications. Our Chief Technology Officer has primary responsibility for overseeing our security incident response plan, including identification and initial assessment of threat levels and escalations. Critical incidents are escalated to a cross functional data security incident management team for review, which then escalates potentially material incidents and threats to the cybersecurity disclosure committee for determinations of materiality and Audit Committee and Board communications. Our Chief Technology Officer has 20 years of experience with cybersecurity management response, and multiple direct reports who have 10 or more years of experience leading technology infrastructure and security incident response. Our General Counsel has over seven years of experience leading our incident response management team.
Our Chief Technology Officer is the primary point of responsibility for cybersecurity risk management program and supervises both our internal cybersecurity personnel and our retained external cybersecurity consultants. Our management team supervises efforts to prevent, detect, mitigate, and remediate cybersecurity risks and incidents through various means, which may include briefings from internal security personnel; threat intelligence and other information obtained from governmental, public or private sources, including external consultants engaged by us; and alerts and reports produced by security tools deployed in the information technology environment.
25
ITEM 2. PROPERTIES
Facilities and Store Locations
We own or lease domestic and international properties used as offices, customer service centers, distribution centers and Company Operated stores. We believe that our existing facilities are well maintained and are sufficient to meet our current needs. We review all leases with upcoming expiration dates in the short term to determine the appropriate action to take with respect to them, including exercising an option to renew, if any, moving or closing facilities or entering into new leases.
Domestic Headquarters, Customer Service and Distribution Properties
The headquarters for our business is located on an approximately 200 acre campus in Dodgeville, Wisconsin. The Dodgeville campus includes approximately 1.8 million square feet of building space between multiple different buildings that are all owned by the Company. The primary functions of these buildings are customer service, distribution center and corporate headquarters. We also own customer service and distribution centers in Reedsburg and Stevens Point, Wisconsin.
International Offices, Customer Service and Distribution Properties
We own a distribution center and customer service center in Oakham, United Kingdom that supports our European business. We lease two buildings in Mettlach, Germany for offices and a customer service center supporting our European Union business. We also lease office space for our global sourcing office located in Kwun Tong, Hong Kong.
Lands’ End Retail Properties
As of February 2, 2024, our U.S. retail footprint consists of 26 Company Operated stores. The U.S. Company Operated stores are leased and average approximately 7,900 square feet. Additionally, we have one smaller school uniform showroom that is used for fittings.
ITEM 3. LEGAL PROCEEDINGS
The Company is party to various claims, legal proceedings and investigations arising in the ordinary course of business. Some of these actions involve complex factual and legal issues and are subject to uncertainties. At this time, the Company is not able to either predict the outcome of these legal proceedings or reasonably estimate a potential range of loss with respect to the proceedings. While it is not feasible to predict the outcome of pending claims, proceedings and investigations with certainty, management is of the opinion that their ultimate resolution should not have a material adverse effect on our results of operations, cash flows or financial position taken as a whole.
Lands’ End is the defendant in three separate lawsuits, each of which allege adverse health events and personal property damage as a result of wearing uniforms manufactured by Lands’ End: (1) Gilbert et al. v. Lands’ End, Inc., United States District Court for the Western District of Wisconsin, Civil Action No. 3:19-cv-00823-JDP, complaint filed October 3, 2019; (2) Andrews et al. v. Lands’ End, Inc., United States District Court for the Western District of Wisconsin, Civil Action No. 3:19-cv-01066-JDP, complaint filed on December 31, 2019, on behalf of 521 named plaintiffs, later amended to include 1,089 named plaintiffs; and (3) Davis et al. v. Lands’ End, Inc. and Lands’ End Business Outfitters, Inc., United States District Court for the Western District of Wisconsin, Case No. 3:20-cv-00195, complaint filed on March 4, 2020. Plaintiffs in Gilbert, Andrews, and Davis seek nationwide class certification on behalf of similarly situated Delta employees.
By order dated April 20, 2020, the Court consolidated the Gilbert and Andrews cases (the “Consolidated Wisconsin Action”) and stayed the Davis case. Plaintiffs in the Consolidated Wisconsin Action and Davis each assert that the damages sustained by the members of the proposed class exceed $5,000,000. Plaintiffs in each case seek damages for personal injuries, pain and suffering, severe emotional distress, financial or economic loss, including
26
medical services and expenses, lost income and other compensable injuries. Plaintiffs in the Consolidated Wisconsin Action seek class certification with respect to performance of the uniforms and warranty claims and maintain individual claims for personal injury by numerous named plaintiffs.
On August 18, 2021, the Court ruled on several pending motions in the Consolidated Wisconsin Action. The Court denied Plaintiffs’ motion for class certification with respect to performance of the uniforms and warranty claims. The Court denied Plaintiffs’ motion for partial summary judgment regarding crocking claims and granted Lands’ End’s motion for partial summary judgment related to certain warranty claims. In addition, giving effect to both the addition and voluntary dismissal of individual plaintiffs over the course of the litigation, the number of individual plaintiffs had been reduced from 1,089 to 603 as of August 18, 2021. On September 1, 2021, Plaintiffs filed a Rule 23(f) petition, seeking interlocutory review of the Court’s decision denying class certification. On September 22, 2021, the U.S. Court of Appeals for the Seventh Circuit denied plaintiffs’ petition.
On July 8, 2022, the Court issued an Opinion and Order in the Consolidated Wisconsin Action (the “July 8 Opinion”), ruling in the Company’s favor on several additional pending motions. The Court granted the Company’s motion to exclude Plaintiffs’ expert opinions because the opinions were not based on reliably applied and scientifically valid methods. Accordingly, because Plaintiffs failed to submit evidence sufficient to show that the uniforms were defective or that a defect in the uniforms caused Plaintiffs’ alleged health problems, the Court granted the Company’s motion for summary judgement on Plaintiffs’ personal injury claims.
After giving effect to the July 8 Opinion, the remaining claims under the Consolidated Wisconsin Action related to claims for property damage and breach of warranty. Following these rulings and an order of the court dated December 1, 2022, 277 named Plaintiffs remained in the case who claim they have suffered personal property damage as a result of dye transferring to personal items, with aggregate claims of approximately $110,000 in damages. The Court set a deadline for the parties to voluntarily resolve these remaining outstanding claims, and on July 19, 2023 the parties reported to the Court that they had reached a settlement in principle of the matter, and subsequently entered into a Confidential Settlement, fully resolving the outstanding property damage claims, which were the only remaining claims in the action.
Following the entry of the Final Order by the Court on October 12, 2023, Plaintiffs filed an appeal to the Seventh Circuit. On November 13, 2023, the Court of Appeals for the Seventh Circuit issued an Order suspending the briefing schedule pending a remand to the district court for the limited purpose of issuing a revised final judgement order. On February 15, 2024, the Court of Appeals for the Seventh District remanded the case to the District Court for entry of a final judgement. On February 20, 2024, the District Court entered final judgement in favor of Lands’ End. The Court of Appeals for the Seventh Circuit has issued a briefing schedule. Lands’ End continues its vigorous defense of this case and believes the claims are without merit.
ITEM 4. MINE SAFETY DISCLOSURES
Not applicable.
27
PART II
ITEM 5. MARKET FOR REGISTRANT’S COMMON EQUITY, RELATED STOCKHOLDER MATTERS AND ISSUER PURCHASES OF EQUITY SECURITIES
Market Information
Lands’ End’s common stock is traded on the Nasdaq Stock Market under the ticker symbol LE. There were 5,779 stockholders of record as of April 1, 2024.
Issuer Purchases of Equity Securities
The following table presents a month-to-month summary of information with respect to purchases of common stock made during the fourth quarter of Fiscal 2023 pursuant to the Share Repurchase Program announced on June 28, 2022:
Period |
|
Total Number of Shares Purchased (1) |
|
|
Average Price Paid per Share (2) |
|
|
Total Number of Shares Purchased as Part of Publicly Announced Plans or Programs (3) |
|
|
Approximate Dollar Value (in thousands) of Shares that May Yet Be Purchased Under the Plans or Programs (3) |
|
||||
October 28 - November 24 |
|
|
239,273 |
|
|
$ |
6.72 |
|
|
|
239,273 |
|
|
$ |
30,180 |
|
November 25 - December 29 |
|
|
56,197 |
|
|
$ |
6.97 |
|
|
|
56,197 |
|
|
$ |
29,789 |
|
December 30 - February 2 |
|
|
12,890 |
|
|
$ |
8.40 |
|
|
|
12,890 |
|
|
$ |
29,680 |
|
Total |
|
|
308,360 |
|
|
$ |
6.84 |
|
|
|
308,360 |
|
|
$ |
29,680 |
|
28
Stock Performance Graph
The following graph compares the cumulative total return to stockholders on Lands’ End common stock from February 1, 2019 through February 2, 2024 with the return on the Nasdaq Composite Index and S&P 600 Apparel Retail Index for the same period.
The graph assumes an initial investment of $100 on February 1, 2019 in each of our common stock, the Nasdaq Composite Index, and the S&P 600 Apparel Retail Index.
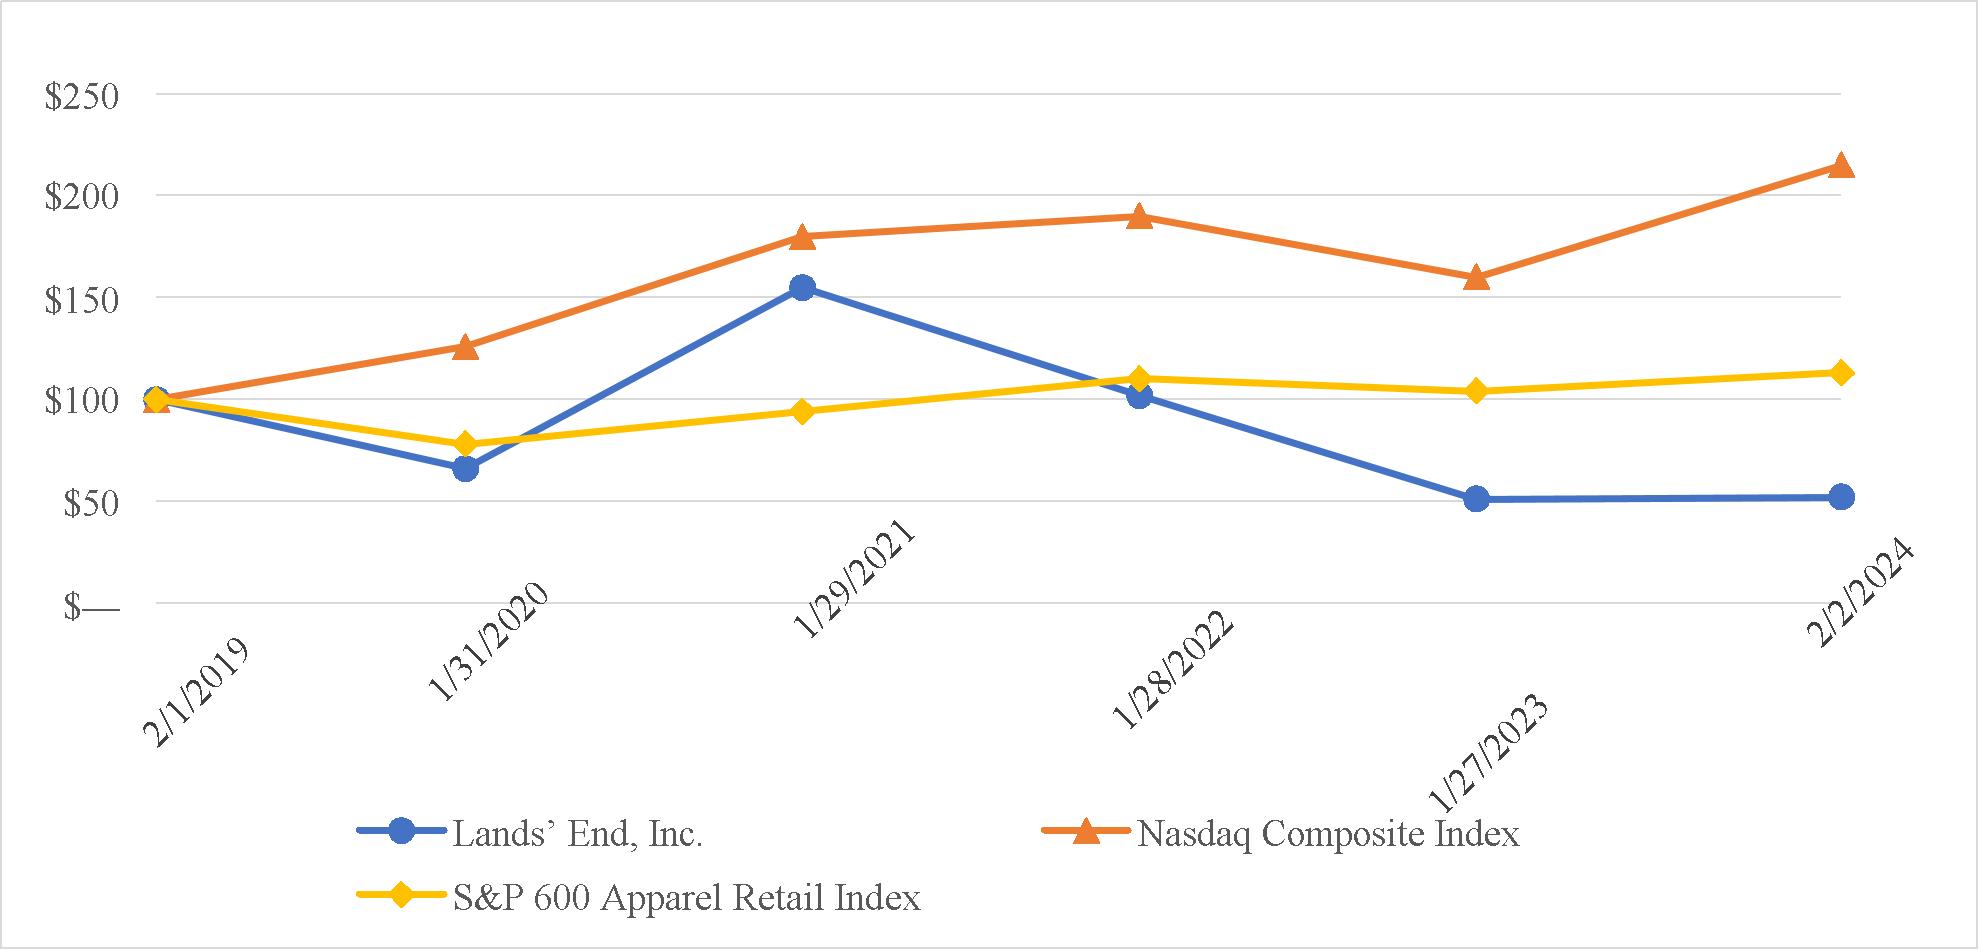
|
|
2/1/2019 |
|
|
1/31/2020 |
|
|
1/29/2021 |
|
|
1/28/2022 |
|
|
1/27/2023 |
|
|
2/2/2024 |
|
||||||
Lands’ End, Inc. |
|
$ |
100 |
|
|
$ |
66 |
|
|
$ |
155 |
|
|
$ |
102 |
|
|
$ |
51 |
|
|
$ |
52 |
|
Nasdaq Composite Index |
|
$ |
100 |
|
|
$ |
126 |
|
|
$ |
180 |
|
|
$ |
190 |
|
|
$ |
160 |
|
|
$ |
215 |
|
S&P 600 Apparel Retail Index |
|
$ |
100 |
|
|
$ |
78 |
|
|
$ |
94 |
|
|
$ |
110 |
|
|
$ |
104 |
|
|
$ |
113 |
|
This performance graph shall not be deemed “filed” for purposes of Section 18 of the Securities Exchange Act or incorporated by reference into any of our filings, as amended, with the SEC, except as shall be expressly set forth by specific reference in such filing.
Dividends
We have not paid and we do not expect to pay in the foreseeable future, dividends on our common stock. Any payment of dividends will be at the discretion of our Board of Directors and will depend upon various factors then existing, including earnings, financial condition, results of operations, capital requirements, level of indebtedness, any contractual restrictions with respect to payment of dividends, restrictions imposed by applicable law, general business conditions and other factors that our Board of Directors may deem relevant. Additionally, the Debt Facilities contain various representations and warranties and restrictive covenants that, among other things, and subject to specified exceptions, restrict the ability of Lands’ End and its subsidiaries to make dividends or distributions with respect to capital stock.
ITEM 6. [Reserved]
29
ITEM 7. MANAGEMENT’S DISCUSSION AND ANALYSIS OF FINANCIAL CONDITION AND RESULTS OF OPERATIONS
You should read the following discussion in conjunction with the Consolidated Financial Statements and accompanying notes included elsewhere in this Annual Report on Form 10-K. Management’s Discussion and Analysis of Financial Condition and Results of Operations contains forward-looking statements. The matters discussed in these forward-looking statements are subject to risks, uncertainties, and other factors that could cause actual results to differ materially from those made, projected or implied in the forward-looking statements. See “Cautionary Statement Concerning Forward-Looking Statements” below and Item 1A, Risk Factors, in this Annual Report on Form 10-K for a discussion of the uncertainties, risks and assumptions associated with these statements.
This section discusses our results of operations for the year ended February 2, 2024 as compared to the year ended January 27, 2023. For a discussion and analysis of the year ended January 27, 2023 compared to January 28, 2022, please refer to “Management’s Discussion and Analysis of Financial Condition and Results of Operations” included in Item 7 of our Annual Report on Form 10-K for the year ended January 27, 2023, filed with the SEC on April 10, 2023.
As used in this Annual Report on Form 10-K, references to the “Company”, “Lands’ End”, “we”, “us”, “our” and similar terms refer to Lands’ End, Inc. and its subsidiaries. Our fiscal year ends on the Friday preceding the Saturday closest to January 31.
Executive Overview
Description of the Company
Lands’ End, Inc. is a leading digital retailer of solution-based apparel, swimwear, outerwear, accessories, footwear, home products and uniforms. We offer products online at www.landsend.com, through third-party distribution channels and our own Company Operated stores. We also offer products to businesses and schools, for their employees and students, through the Outfitters distribution channel. We are a classic American lifestyle brand that creates solutions for life’s every journey.
Lands’ End was founded in 1963 by Gary Comer and his partners to sell sailboat hardware and equipment by catalog. While our product focus has shifted significantly over the years, we have continued to adhere to our founder’s motto as one of our guiding principles: “Take care of the customer, take care of the employee and the rest will take care of itself.”
We have one external reportable segment and identify our operating segments according to how our business activities are managed and evaluated. During Fiscal 2023, our operating segments consisted of: U.S. eCommerce, Europe eCommerce, Outfitters, Third Party and Retail. Our operating segments included Japan eCommerce during Fiscal 2022. See Note 8, Lands’ End Japan Closure.
We have determined that each of our operating segments share similar economic and other qualitative characteristics, and therefore, the results of our operating segments are aggregated into one external reportable segment.
Distribution Channels
We identify five separate distribution channels for revenue reporting purposes:
30
Macroeconomic Challenges
Macroeconomic issues, such as high interest rates and inflationary pressures have continued to have an impact on our business. Since apparel purchases are discretionary expenditures that historically have been influenced by domestic and global economic conditions, higher prices of consumer goods due to inflation may result in less discretionary spending for consumers which may negatively impact customer demand and require higher levels of promotion in order to attract and retain customers. Additionally, interest expense could be negatively affected by any rate increases due to the variable interest rates associated with our Debt Facilities. These macroeconomic challenges have led to increased cost of raw materials, packaging materials, labor, energy, fuel and other inputs necessary for the production and distribution of our products.
Corporate Restructuring
We reduced approximately 10% of positions in the corporate offices and the Hong Kong sourcing office during Fiscal 2023. We incurred $7.3 million of total corporate restructuring costs, which includes $6.2 million of employee severance and benefit costs and $1.1 million of other related costs, which was recorded in Other operating expense, net in the Consolidated Statements of Operations. As of February 2, 2024, approximately $2.9 million of the employee severance and benefit costs and $1.1 million of the other related costs had yet to be paid and are included in Accrued expenses and other current liabilities in the Consolidated Balance Sheets.
Lands’ End Japan Closure
During Second Quarter 2022, the Board of Directors approved a plan to wind down and cease operations of Lands’ End Japan KK. Lands’ End Japan KK represents the Japan eCommerce operating segment. For a discussion on this operating segment, see Note 13, Segment Reporting. During Fiscal 2023 and Fiscal 2022 we incurred closing costs of approximately $0.3 million and $3.0 million, respectively, recorded in Other operating expense, net in the Consolidated Statements of Operations. See Note 8, Lands’ End Japan Closure. The final liquidation occurred in First Quarter 2024.
Global Supply Chain Challenges
Like many industries, we experienced global supply chain challenges that impacted our distribution process, third-party manufacturing partners and logistics partners, including shipping delays due to port congestion and closure of certain third-party manufacturing facilities and production lines. These global supply chain challenges caused manufacturing, transport and receipt of inbound product delays that increased our logistics costs during the first half of Fiscal 2022. These global supply chain challenges began to normalize in the second half of Fiscal 2022 and throughout Fiscal 2023.
Basis of Presentation
The Consolidated Financial Statements have been prepared in accordance with GAAP and include the accounts of Lands’ End, Inc. and its subsidiaries. All intercompany transactions and balances have been eliminated.
Seasonality
We experience seasonal fluctuations in our Net revenue and operating results and historically have realized a significant portion of our yearly net revenue and earnings during our fourth fiscal quarter. We generated approximately 34.0% of our yearly net revenue in the fourth quarters of Fiscal 2023 and Fiscal 2022. Thus, lower than expected fourth quarter net revenue may have an adverse impact on our annual operating results.
31
Working capital requirements typically increase during the second and third quarters of the fiscal year as inventory builds to support peak selling periods, and accordingly, and typically decrease during the fourth quarter of the fiscal year as inventory is sold. Cash provided by operating activities is typically higher in the fourth quarter of the fiscal year due to reduced working capital requirements during that period.
Results of Operations
Fiscal Year. Our fiscal year end is on the Friday preceding the Saturday closest to January 31 each year. The fiscal periods in this report are presented as follows, unless the context otherwise requires:
Fiscal Year |
|
Ended |
|
Weeks |
2023 |
|
February 2, 2024 |
|
53 |
2022 |
|
January 27, 2023 |
|
52 |
The following table sets forth, for the periods indicated, selected income statement data:
|
|
Fiscal 2023 |
|
|
Fiscal 2022 |
|
||||||||||
(in thousands) |
|
$’s |
|
|
% of Net |
|
|
$’s |
|
|
% of Net |
|
||||
Net revenue |
|
$ |
1,472,508 |
|
|
|
100.0 |
% |
|
$ |
1,555,429 |
|
|
|
100.0 |
% |
Cost of sales (excluding depreciation |
|
|
846,981 |
|
|
|
57.5 |
% |
|
|
961,663 |
|
|
|
61.8 |
% |
Gross profit |
|
|
625,527 |
|
|
|
42.5 |
% |
|
|
593,766 |
|
|
|
38.2 |
% |
Selling and administrative |
|
|
550,211 |
|
|
|
37.4 |
% |
|
|
527,374 |
|
|
|
33.9 |
% |
Depreciation and amortization |
|
|
38,465 |
|
|
|
2.6 |
% |
|
|
38,741 |
|
|
|
2.5 |
% |
Goodwill impairment |
|
|
106,700 |
|
|
|
7.2 |
% |
|
|
— |
|
|
|
0.0 |
% |
Other operating expense, net |
|
|
7,666 |
|
|
|
0.5 |
% |
|
|
2,926 |
|
|
|
0.2 |
% |
Operating (loss) income |
|
|
(77,515 |
) |
|
|
(5.3 |
)% |
|
|
24,725 |
|
|
|
1.6 |
% |
Interest expense |
|
|
48,291 |
|
|
|
3.3 |
% |
|
|
39,768 |
|
|
|
2.6 |
% |
Loss on extinguishment of debt |
|
|
6,666 |
|
|
|
0.5 |
% |
|
|
— |
|
|
|
0.0 |
% |
Other income, net |
|
|
(655 |
) |
|
|
(0.0 |
)% |
|
|
(364 |
) |
|
|
(0.0 |
)% |
Loss before income taxes |
|
|
(131,817 |
) |
|
|
(9.0 |
)% |
|
|
(14,679 |
) |
|
|
(0.9 |
)% |
Income tax benefit |
|
|
(1,133 |
) |
|
|
(0.1 |
)% |
|
|
(2,149 |
) |
|
|
(0.1 |
)% |
Net loss |
|
$ |
(130,684 |
) |
|
|
(8.9 |
)% |
|
$ |
(12,530 |
) |
|
|
(0.8 |
)% |
Depreciation and amortization are not included in our cost of sales because we are a reseller of inventory and do not believe that including depreciation and amortization is meaningful. As a result, our gross margins may not be comparable to other entities that include depreciation and amortization related to the sale of their product in their gross margin measure.
Definitions, Reconciliations and Uses of Non-GAAP Financial Measures
In addition to our Net income (loss) determined in accordance with GAAP, for purposes of evaluating operating performance, we report the following non-GAAP measures: Adjusted net income (loss) and Adjusted EBITDA. Adjusted net income (loss) is also expressed on a diluted per share basis.
We believe presenting non-GAAP financial measures provides useful information to investors, allowing them to assess how the business performed excluding the effects of significant non-recurring or non-operational amounts. We believe the use of the non-GAAP financial measures facilitates comparing the results being reported against past and future results by eliminating amounts that we believe are not comparable between periods and assists investors in evaluating the effectiveness of our operations and underlying business trends in a manner that is consistent with management’s own methods for evaluating business performance.
Our management uses Adjusted net income (loss) and Adjusted EBITDA to evaluate the operating performance of our business for comparable periods and to discuss our business with our Board of Directors, institutional investors
32
and other market participants. Adjusted EBITDA is also used as the basis for a performance measure used in executive incentive compensation.
The methods we use to calculate our non-GAAP financial measures may differ significantly from methods other companies use to compute similar measures. As a result, any non-GAAP financial measures presented herein may not be comparable to similar measures provided by other companies. Adjusted net income (loss) and Adjusted EBITDA should not be used by investors or other third parties as the sole basis for formulating investment decisions as these measures may exclude a number of important cash and non-cash recurring items.
Adjusted net income (loss) is defined as net income (loss) excluding significant non-recurring or non-operational items as set forth below. Adjusted net income (loss) is also presented on a diluted per share basis. While Adjusted net income (loss) is a non-GAAP measurement, management believes that it is an important indicator of operating performance and useful to investors.
The following table sets forth, for the periods indicated, a reconciliation of Net loss to Adjusted net loss and Adjusted diluted net loss per share:
(in thousands, except per share amounts) |
|
Fiscal 2023 |
|
|
Fiscal 2022 |
|
||
Net loss |
|
$ |
(130,684 |
) |
|
$ |
(12,530 |
) |
Goodwill and long-lived asset impairment |
|
|
106,700 |
|
|
|
468 |
|
Exit costs |
|
|
9,279 |
|
|
|
— |
|
Corporate restructuring |
|
|
7,305 |
|
|
|
— |
|
Loss on extinguishment of debt |
|
|
6,666 |
|
|
|
— |
|
Landsʼ End Japan closure |
|
|
(215 |
) |
|
|
6,133 |
|
Tax effects on adjustments (1) |
|
|
(3,834 |
) |
|
|
(1,723 |
) |
ADJUSTED NET LOSS |
|
$ |
(4,783 |
) |
|
$ |
(7,652 |
) |
ADJUSTED DILUTED NET LOSS PER SHARE |
|
$ |
(0.15 |
) |
|
$ |
(0.23 |
) |
|
|
|
|
|
|
|
||
Diluted weighted average common shares outstanding |
|
|
31,970 |
|
|
|
33,108 |
|
33
While Adjusted EBITDA is a non-GAAP measurement, management believes that it is an important indicator of operating performance, and useful to investors because EBITDA excludes the effects of financings, investing activities and tax structure by eliminating the effects of interest, depreciation and income tax.
The following table sets forth, for the periods indicated, selected income statement data, both in dollars and as a percentage of Net revenue and a reconciliation of Net loss to Adjusted EBITDA:
(in thousands) |
|
Fiscal 2023 |
|
|
Fiscal 2022 |
|
||||||||||
Net loss |
|
$ |
(130,684 |
) |
|
|
(8.9 |
)% |
|
$ |
(12,530 |
) |
|
|
(0.8 |
)% |
Income tax benefit |
|
|
(1,133 |
) |
|
|
(0.1 |
)% |
|
|
(2,149 |
) |
|
|
(0.1 |
)% |
Interest expense |
|
|
48,291 |
|
|
|
3.3 |
% |
|
|
39,768 |
|
|
|
2.6 |
% |
Loss on extinguishment of debt |
|
|
6,666 |
|
|
|
0.5 |
% |
|
|
— |
|
|
|
— |
|
Other income, net |
|
|
(655 |
) |
|
|
(0.0 |
)% |
|
|
(364 |
) |
|
|
(0.0 |
)% |
Operating (loss) income |
|
|
(77,515 |
) |
|
|
(5.3 |
)% |
|
|
24,725 |
|
|
|
1.6 |
% |
Depreciation and amortization |
|
|
38,465 |
|
|
|
2.6 |
% |
|
|
38,741 |
|
|
|
2.5 |
% |
Goodwill and long-lived asset impairment |
|
|
106,700 |
|
|
|
7.2 |
% |
|
|
468 |
|
|
|
0.0 |
% |
Exit costs |
|
|
9,279 |
|
|
|
0.6 |
% |
|
|
— |
|
|
|
— |
|
Corporate restructuring |
|
|
7,305 |
|
|
|
0.5 |
% |
|
|
— |
|
|
|
— |
|
Landsʼ End Japan closure |
|
|
(215 |
) |
|
|
(0.0 |
)% |
|
|
6,133 |
|
|
|
0.4 |
% |
Loss (gain) on disposal of property and equipment |
|
|
93 |
|
|
|
0.0 |
% |
|
|
(530 |
) |
|
|
(0.0 |
)% |
Other |
|
|
189 |
|
|
|
0.0 |
% |
|
|
960 |
|
|
|
0.1 |
% |
Adjusted EBITDA |
|
$ |
84,301 |
|
|
|
5.7 |
% |
|
$ |
70,497 |
|
|
|
4.5 |
% |
In assessing the operational performance of our business, we consider a variety of financial measures. We operate in five separate distribution channels for revenue reporting purposes: U.S. eCommerce, International, Outfitters, Third Party and Retail. A key measure in the evaluation of our business is revenue performance by distribution channel. We also consider Gross margin and Selling and administrative expenses in evaluating the performance of our business.
We use Net revenue to evaluate revenue performance for the U.S. eCommerce, International, Outfitters and Third Party distribution channels. For our Retail distribution channel, we use Same Store Sales as a key measure in
34
evaluating performance. A Company Operated store is included in U.S. Same Store Sales calculations when it has been open for at least 14 months. Online sales and sales generated through our in-store web portal are considered revenue in our U.S. eCommerce and are excluded from U.S. Same Store Sales.
Discussion and Analysis
Fiscal 2023 Compared to Fiscal 2022
Net Revenue
Total Net revenue was $1.47 billion in Fiscal 2023, a decrease of $82.9 million or 5.3% from $1.56 billion in Fiscal 2022.
Net revenue is presented by distribution channel in the following table:
(in thousands) |
|
Fiscal 2023 |
|
% of Net Revenue |
|
Fiscal 2022 |
|
% of Net Revenue |
||
U.S. eCommerce |
|
$ |
930,314 |
|
63.2% |
|
$ |
955,752 |
|
61.4% |
International |
|
|
112,855 |
|
7.7% |
|
|
166,627 |
|
10.7% |
Outfitters |
|
|
269,943 |
|
18.3% |
|
|
265,898 |
|
17.1% |
Third Party |
|
|
111,826 |
|
7.6% |
|
|
118,996 |
|
7.7% |
Retail |
|
|
47,570 |
|
3.2% |
|
|
48,156 |
|
3.1% |
Total Net revenue |
|
$ |
1,472,508 |
|
|
|
$ |
1,555,429 |
|
|
U.S. eCommerce Net revenue was $930.3 million in Fiscal 2023, a decrease of $25.5 million or 2.7% from $955.8 million in Fiscal 2022. The decrease in U.S. eCommerce was primarily driven by lower promotional activity within swimwear, outerwear and newness in adjacent product categories and improved inventory management resulting in higher margins with less clearance inventory sales.
International Net revenue was $112.9 million in Fiscal 2023, a decrease of $53.7 million or 32.3% from $166.6 million in Fiscal 2022. Excluding the $32.7 million from the closing of Lands’ End Japan at the end of Fiscal 2022, Net revenue for International eCommerce decreased 15.7%. The decrease in International eCommerce was due to continued assortment editing with a focus on key product solutions resulting in higher margins and reduced clearance inventory sales in Europe.
Outfitters Net revenue was $269.9 million in Fiscal 2023, an increase of $4.0 million or 1.5% from $265.9 million in Fiscal 2022. Compared to the Fiscal 2022, the increase was primarily driven by inventory sales to Delta Air Lines at the conclusion of their five-year contract in the First Quarter 2023 offset by Delta Air Lines sales in the remaining three quarters of Fiscal 2022.
Third Party Net revenue was $111.8 million in Fiscal 2023, a decrease of $7.2 million or 6.0% from $119.0 million in Fiscal 2022. The decrease was primarily driven by a decline in demand with one wholesale partner partially offset by growth in online sales through other existing marketplaces.
Retail Net revenue was $47.6 million in Fiscal 2023, a decrease of $0.6 million or 1.2% from $48.2 million in Fiscal 2022. Our U.S. Company Operated Stores experienced an increase of 3.1% in Same Store Sales as compared to Fiscal 2022. On February 2, 2024, there were 26 U.S. Company Operated stores compared to 28 U.S. Company Operated stores on January 27, 2023.
Gross Profit
In Fiscal 2023, total Gross profit increased 5.3% to $625.5 million compared to $593.8 million for Fiscal 2022. Gross margin increased 430 basis points to 42.5% of total Net revenue in Fiscal 2023 from 38.2% of total Net revenue in Fiscal 2022. The basis point improvement in Gross margin was predominantly driven by leveraging the strength in product solutions and newness across the channels, reduction in clearance inventory and improvements in supply chain costs for Fiscal 2023 compared to prior year.
35
Selling and Administrative Expenses
Selling and administrative expenses were $550.2 million, or 37.4% of total Net revenue in Fiscal 2023 compared to $527.4 million, or 33.9% of total Net revenue in Fiscal 2022. The approximately 350 basis points increase was driven by deleveraging from lower revenues and higher incentive-related personnel costs, partially offset by lower digital marketing spend and continued cost controls.
Depreciation and Amortization
Depreciation and amortization were $38.5 million in Fiscal 2023, a decrease of $0.2 million or 0.5%, compared to $38.7 million in Fiscal 2022.
Goodwill Impairment
Goodwill impairment was $106.7 million in Fiscal 2023, compared to none in Fiscal 2022. We recorded full impairment of the $70.4 million and $36.3 million of goodwill allocated to our U.S. eCommerce and Outfitters reporting units, respectively, in Fiscal 2023, due to the decline in stock price and market capitalization, as well as current market conditions and macroeconomic conditions. See Note 2, Summary of Significant Accounting Policies and Note 10, Goodwill and Indefinite-Lived Intangible Asset.
Other Operating Expense, Net
Other operating expense, net was $7.7 million in Fiscal 2023 compared to $2.9 million in Fiscal 2022. The $4.8 million increase was primarily attributed to $7.3 million of corporate restructuring costs, primarily severance and benefit costs, related to reduction in corporate positions in our corporate offices and Hong Kong sourcing office, compared to $3.0 million of Lands’ End Japan closing costs recorded in Fiscal 2022.
Operating (Loss) Income
Operating loss was $77.5 million in Fiscal 2023, compared to Operating income of $24.8 million in Fiscal 2022. The decrease of $102.3 million was a result of the $106.7 million non-cash goodwill impairment charge recorded in Third Quarter 2023.
Interest Expense
Interest expense was $48.3 million in Fiscal 2023, compared to $39.8 million in Fiscal 2022. The $8.5 million increase was driven by higher applicable interest rates under the Debt Facilities and Former Term Loan Facility and outstanding balances on the revolving ABL Facility.
Loss on Extinguishment of Debt
Loss on extinguishment of debt was $6.7 million in Fiscal 2023, compared to none in Fiscal 2022. We incurred a 1% prepayment premium and recorded the write-off of unamortized original issue discount and debt issuance costs related to the repayment of our Former Term Loan Facility before the scheduled maturity date.
Other (Income) Expense
Other income was $0.7 million in Fiscal 2023 compared to $0.4 million in Fiscal 2022.
36
Income Tax (Benefit) Expense
Income tax benefit of $1.1 million was recorded for Fiscal 2023 which resulted in an effective tax rate of 0.9%. This compared to Income tax benefit of $2.1 million in Fiscal 2022 which resulted in an effective tax rate of 14.6%. The Fiscal 2023 tax rate was lower than Fiscal 2022 due to an impairment of goodwill recorded in Fiscal 2023 that is not deductible for tax purposes.
Net (Loss) Income
As a result of the above factors, Net loss was $130.7 million, or diluted loss per share of $4.09 in Fiscal 2023 compared to $12.5 million, or diluted loss per share of $0.38 in Fiscal 2022.
Adjusted Net Income (Loss)
As a result of the above factors, Adjusted net loss was $4.8 million and Adjusted diluted net loss per share was $0.15 in Fiscal 2023 compared to Adjusted net loss of $7.7 million and Adjusted diluted net loss per share of $0.23 in Fiscal 2022.
Adjusted EBITDA
As a result of the above factors, Adjusted EBITDA was $84.3 million in Fiscal 2023, compared to $70.5 million in Fiscal 2022.
Liquidity and Capital Resources
Our primary need for liquidity is to fund working capital requirements of our business, capital expenditures, debt service and for general corporate purposes. Our cash and cash equivalents and the ABL Facility serve as sources of liquidity for short-term working capital needs and general corporate purposes. The ABL Facility had no balance outstanding as of February 2, 2024, other than letters of credit. Cash generated from our net revenue and profitability, and to a lesser extent our changes in working capital, are driven by the seasonality of our business, with a significant amount of net revenue and operating cash flows generally occurring in the fourth fiscal quarter of each year. We expect that our cash on hand and cash flows from operations, along with revolving on the ABL Facility, will be adequate to meet our capital requirements and operational needs for at least the next 12 months.
Description of Material Indebtedness
Debt Arrangements
Our $275.0 million committed revolving ABL Facility includes a $70.0 million sublimit for letters of credit and is available for working capital and other general corporate liquidity needs. The amount available to borrow is the lesser of (1) the Aggregate Commitments of $275.0 million (“ABL Facility Limit”) or (2) the Borrowing Base or Loan Cap which is calculated from Eligible Inventory, Trade Receivables and Credit Card Receivables, all foregoing capitalized terms not defined herein are as defined in the ABL Facility. There was no balance outstanding as of February 2, 2024. The balance outstanding as of January 27, 2023 was $100.0 million. The balance of outstanding letters of credit was $9.1 million and $10.6 million as of February 2, 2024 and January 27, 2023, respectively.
On December 29, 2023, we entered into the Current Term Loan Facility which provides borrowings of $260.0 million, the proceeds of which were used to repay all of the indebtedness under the Former Term Loan Facility and to pay fees and expenses in connection with the financing. Origination costs, including a 3% original issue discount of $7.8 million and debt origination fees of $2.9 million, were incurred in connection with entering into the Current Term Loan Facility.
As a result of the Former Term Loan Facility repayment before the scheduled maturity date, the transaction was subject to a 1% prepayment premium of $2.3 million. Additionally, we recorded $4.4 million for the write off of unamortized original issue discount and debt issuance costs of the Former Term Loan Facility. These charges resulted in a loss on extinguishment of debt of $6.7 million in Fourth Quarter 2023.
37
Interest; Fees - ABL Facility
Effective May 12, 2023, we executed the Fourth Amendment (the “Fourth Amendment”) to the ABL Facility which replaced the interest rate benchmark based on LIBOR with an interest rate benchmark based on SOFR plus an adjustment of 0.10% for all loans (“ABL Adjusted SOFR”). During Second Quarter 2023, we adopted ASU 2020-04, the optional practical expedient for Reference Rate Reform related to its ABL Facility and as such, these amendments are treated as a continuation of the existing debt agreement and no gain or loss on these modifications were recorded in the Consolidated Statement of Operations. The ABL Adjusted SOFR rate is now available for all new loans after the effective date of the Fourth Amendment.
Effective with the Fourth Amendment, the ABL Facility interest rate, selected at the borrower’s election, is either (1) ABL Adjusted SOFR, or (2) a base rate which is the greater of (a) the federal funds rate plus 0.50%, (b) the one-month ABL Adjusted SOFR rate plus 1.00%, or (c) the Wells Fargo “prime rate”. The borrowing margin for ABL Adjusted SOFR loans is (i) less than $95.0 million, 1.25%, (ii) equal to or greater than $95.0 million but less than $180.0 million, 1.50%, and (iii) greater than or equal to $180.0 million, 1.75%. For base rate loans, the borrowing margin is (i) less than $95.0 million, 0.50%, (ii) equal to or greater than $95.0 million but less than $180.0 million, 0.75%, and (iii) greater than or equal to $180.0 million, 1.00% (“Applicable Borrowing Margin”). The Applicable Borrowing Margin for all loans is based upon the average daily total loans outstanding for the previous quarter. The Fourth Amendment had no material interest rate impact.
Prior to the Fourth Amendment to the ABL Facility, the interest rate, selected at the borrower’s election, was either (1) LIBOR (plus the Applicable Borrowing Margin), or (2) a base rate (plus the Applicable Borrowing Margin) which was the greater of (a) the federal funds rate plus 0.50%, (b) the one-month LIBOR rate plus 1.00%, or (c) the Wells Fargo “prime rate”.
The ABL Facility fees include (i) commitment fees of 0.25% based upon the average daily unused commitment (aggregate commitment less loans and letter of credit outstanding) under the ABL Facility for the preceding fiscal quarter, (ii) customary letter of credit fees and (iii) customary annual agent fees. As of February 2, 2024, we had no borrowings outstanding under the ABL Facility.
Interest; Fees - Current Term Loan Facility
The interest rates per annum applicable to the loans under the Current Term Loan Facility are based on a fluctuating rate of interest equal to, at the Company’s election, either (1) Term Loan Adjusted SOFR loan (subject to a 2% floor) plus an applicable margin, or (2) an alternative base rate loan plus an applicable margin. The applicable margin is based on the Company’s net leverage and will be, (i) Term Loan Adjusted SOFR loans, 8.25% per annum if the total leverage ratio is greater than or equal to 2.75:1.00, 8.00% per annum if the total leverage ratio is less than 2.75:1.00 but greater than or equal to 2.25:1.00, and 7.75% per annum if the total leverage ratio is less than 2.25:1.00 and (ii) for base rate loans, 7.25% per annum if the total leverage ratio is greater than or equal to 2.75:1.00, 7.00% per annum if the total leverage ratio is less than 2.75:1.00 but greater than or equal to 2.25:1.00, and 6.75% per annum if the total leverage ratio is less than 2.25:1.00. In each case, the net leverage is determined as of the last day of each applicable measurement period.
Customary agency fees are payable annually for the Current Term Loan Facility.
Interest; Fees - Former Term Loan Facility
Effective June 22, 2023, we entered into Amendment No. 1 (the “First Amendment”) to the Former Term Loan Facility which (subject to a 1% floor) replaced the interest rate benchmark based upon LIBOR with Term Loan Adjusted SOFR. This transition resulted in no material interest rate impact. During Second Quarter 2023, the Company adopted ASU 2020-04, the optional practical expedient for Reference Rate and as such, this amendment was treated as a continuation of the existing agreement and no gain or loss on this modification was recorded in the Consolidated Statement of Operations.
38
Effective with the First Amendment to the Former Term Loan Facility, the interest rate per annum applicable to the loans under the Former Term Loan Facility was based on a fluctuating rate of interest measured by reference to, at the borrower’s election, either (1) a Term Adjusted Loan SOFR rate plus 9.75% or (2) an alternative base rate (which is the greater of (i) the prime rate published in the Wall Street Journal, (ii) the federal funds rate, which shall be no lower than 0.00% plus ½ of 1.00%, or (iii) the one month Term Loan Adjusted SOFR rate plus 1.00% per annum) plus 8.75%.
Prior to the First Amendment to the Former Term Loan Facility, the interest rate per annum applicable to the loans under the Former Term Loan Facility was based on a fluctuating rate of interest measured by reference to, at the borrower’s election, either (1) a LIBOR rate (with a minimum rate of 1.00%) plus 9.75% or (2) an alternative base rate (which was the greater of (i) the prime rate published in the Wall Street Journal, (ii) the federal funds rate, which was to be no lower than 0.00% plus ½ of 1.00%, or (iii) the one month LIBOR rate plus 1.00% per annum) plus 8.75%.
Customary agency fees were paid annually for the Former Term Loan Facility.
Maturity; Amortization and Prepayments
The ABL Facility maturity date is July 29, 2026.
The Current Term Loan Facility will mature on December 29, 2028, will amortize at a rate equal to 1.25% per quarter. Depending upon the Company’s Total Leverage Ratio, as defined in the Current Term Loan Facility, mandatory prepayments in an amount equal to a percentage of the Company’s excess cash flows in each fiscal year, ranging from 0% to 75% are required. The Current Term Loan Facility also has typical prepayment requirements for the proceeds of certain asset sales, casualty events and extraordinary receipts. Voluntary prepayment and certain mandatory prepayments made (i) on or before December 29, 2024 would result in a prepayment premium equal to 3% of the principal amount of the loan prepaid plus a yield maintenance fee, (ii) between December 30, 2024 and December 29, 2025 would result in a prepayment premium equal to 2% of the principal amount of the loan prepaid, (iii) between December 30, 2025 and December 29, 2026, would result in a prepayment premium equal to 1% of the principal amount of the loan prepaid, (iv) between December 30, 2026 and December 29, 2027, would result in a prepayment premium equal to 0.5% of the principal amount of the loan prepaid and (v) thereafter no prepayment premium is due.
Guarantees; Security
All obligations under the Debt Facilities are unconditionally guaranteed by Lands’ End, Inc. and, subject to certain exceptions, each of its existing and future direct and indirect subsidiaries. The ABL Facility is secured by a first priority security interest in certain working capital of the borrowers and guarantors consisting primarily of accounts receivable and inventory. The Current Term Loan Facility is secured by a second priority security interest in the same collateral, with certain exceptions.
The Current Term Loan Facility is secured by a first priority security interest in certain property, including certain fixed assets such as real estate, stock of subsidiaries and intellectual property, in each case, subject to certain exceptions. The ABL Facility is secured by a second priority interest in the same collateral, with certain exceptions.
Representations and Warranties; Covenants
Subject to specified exceptions, the Debt Facilities contain various representations and warranties and restrictive covenants that, among other things, restrict Lands’ End, Inc.’s and its subsidiaries’ ability to incur indebtedness (including guarantees), grant liens, make investments, make dividends or distributions with respect to capital stock, make prepayments on other indebtedness, engage in mergers or change the nature of their business.
The Current Term Loan Facility contains financial covenants, including a quarterly maximum total leverage ratio test and a monthly minimum liquidity test.
39
Under the ABL Facility, if excess availability falls below the greater of 10% of the Loan Cap amount or $15.0 million, we will be required to comply with a minimum fixed charge coverage ratio of 1.0 to 1.0.
The Debt Facilities contain certain affirmative covenants, including reporting requirements such as delivery of financial statements, certificates and notices of certain events, maintaining insurance and providing additional guarantees and collateral in certain circumstances.
As of February 2, 2024, we were in compliance with our financial covenants in the Debt Facilities.
Events of Default
The Debt Facilities include customary events of default including non-payment of principal, interest or fees, violation of covenants, inaccuracy of representations or warranties, cross defaults related to certain other material indebtedness, bankruptcy and insolvency events, invalidity or impairment of guarantees or security interests, material judgments and change of control.
Cash Flows from Operating Activities
Operating activities generated net cash of $130.6 million and used net cash of $36.4 million in Fiscal 2023 and Fiscal 2022, respectively. In Fiscal 2023, net cash generated by operating activities increased $167.0 million compared to Fiscal 2022 primarily due to the year-over-year improvement in inventory flow and productivity.
Cash Flows from Investing Activities
Net cash used in investing activities was $34.9 million and $29.8 million during Fiscal 2023 and Fiscal 2022, respectively. Cash used in investing activities for both years was primarily used for investments to update our digital information technology infrastructure.
For Fiscal 2024, we plan to invest approximately $30.0 million in capital expenditures for strategic investments and infrastructure, primarily in technology and general corporate needs.
Cash Flows from Financing Activities
Net cash used in financing activities was $110.1 million during Fiscal 2023 compared to net cash provided by financing activities of $73.5 million during Fiscal 2022. The decrease in net cash provided by financing activities is primarily due to lower inventory levels.
Contractual Obligations and Off-Balance-Sheet Arrangements
We have no material off-balance-sheet arrangements other than the guarantees and contractual obligations that are discussed below.
40
Information concerning our obligations and commitments to make future payments under contracts such as lease agreements and other contingent commitments, as of February 2, 2024, is aggregated in the following table:
|
|
Payments Due by Period |
|
|||||||||||||||||
(in thousands) |
|
Total |
|
|
1 Year |
|
|
2-3 |
|
|
3-4 |
|
|
After 5 |
|
|||||
Operating leases (1) |
|
$ |
34,951 |
|
|
$ |
7,682 |
|
|
$ |
11,043 |
|
|
$ |
9,674 |
|
|
$ |
6,552 |
|
Principal payments on |
|
|
260,000 |
|
|
|
13,000 |
|
|
|
26,000 |
|
|
|
221,000 |
|
|
|
— |
|
Interest on Term Loan Facility |
|
|
154,378 |
|
|
|
34,893 |
|
|
|
64,383 |
|
|
|
55,102 |
|
|
|
— |
|
Purchase obligations (2) |
|
|
152,280 |
|
|
|
152,280 |
|
|
|
— |
|
|
|
— |
|
|
|
— |
|
Total contractual obligations |
|
$ |
601,609 |
|
|
$ |
207,855 |
|
|
$ |
101,426 |
|
|
$ |
285,776 |
|
|
$ |
6,552 |
|
Financial Instruments with Off-Balance-Sheet Risk
The $275.0 million committed revolving ABL Facility includes a $70.0 million sublimit for letters of credit and has a maturity date of July 29, 2026. The ABL Facility is available for working capital and other general corporate liquidity needs. There was no balance outstanding as of February 2, 2024. The balance outstanding as of January 27, 2023 was $100.0 million. The balance of outstanding letters of credit was $9.1 million and $10.6 million as of February 2, 2024 and January 27, 2023, respectively.
Application of Critical Accounting Estimates
Our Consolidated Financial Statements have been prepared in accordance with GAAP, which requires management to make estimates and judgments that affect amounts reported in the Consolidated Financial Statements and accompanying notes. While our estimates and assumptions are based on our knowledge of current events and actions we may undertake in the future, actual results may ultimately differ from our estimates and assumptions. Our estimation processes contain uncertainties because they require management to make assumptions and apply judgment to make these estimates. Should actual results be different than our estimates, we could be exposed to gains or losses from differences that may be material.
Inventory Valuation
Our inventories consist of merchandise purchased for resale and are recorded at the lower of cost or net realizable value. The nature of our business requires that we make a significant amount of our merchandising decisions and corresponding inventory purchase commitments with vendors several months in advance of the time in which a particular merchandise item is intended to be included in the merchandise offerings. These decisions and commitments are based upon, among other possible considerations, historical sales with identical or similar merchandise, our understanding of then-prevailing trends and influences, and an assessment of likely economic conditions and various competitive factors.
For financial reporting and tax purposes, our United States inventory, primarily merchandise held for sale, is stated at last-in, first-out (“LIFO”) cost, which is adjusted to the lower of cost or market. We account for our non-United States inventory on the first-in, first-out (“FIFO”) method. The United States inventory accounted for using the LIFO method as of percentage of the total inventory was 93% at February 2, 2024 and 92% at January 27, 2023.
We continually make assessments as to whether the carrying cost of inventory exceeds its market value and, if so, by what dollar amount. Excess inventories may be disposed of through our normal course of business. Based on historical results experienced through various methods of disposition, we will write down the carrying value of inventories that are not expected to be sold at or above cost. The excess and obsolete reserve balances were $18.1
41
million and $13.9 million as of February 2, 2024, and January 27, 2023, respectively. For the inventory marked down to net realizable value, a one percentage point increase in our assumed recovery rates at February 2, 2024, would have had an immaterial impact on our Consolidated Financial Statements.
Goodwill and Trade Name Impairment Analysis
Goodwill and the trade name indefinite-lived intangible asset are tested separately for impairment annually or are evaluated for impairment whenever events or changes in circumstances indicate that the carrying amount may not be recoverable.
Our impairment loss calculations contain multiple uncertainties because the calculation requires management to make assumptions and to apply judgment to estimate future cash flows and asset fair values. We perform goodwill and indefinite-lived intangible asset impairment tests on an annual basis and update these annual impairment tests mid-year if events or circumstances occur that would more likely than not reduce the fair value of a reporting unit or indefinite-lived intangible asset below its carrying amount. If actual results fall short of our estimates and assumptions used in estimating future cash flows and asset fair values, we may incur future impairment charges that could be material.
Goodwill impairment assessments
We test goodwill for impairment using a one-step quantitative test. The quantitative test compares the reporting unit’s fair value to its carrying value. An impairment is recorded for any excess carrying value above the reporting unit’s fair value, not to exceed the amount of goodwill. We estimate fair value of our reporting units using a discounted cash flow model, commonly referred to as the income approach. The income approach uses a reporting unit’s projection of estimated operating results and cash flows that is discounted using a weighted-average cost of capital that reflects current market conditions appropriate to our reporting unit. Estimated discount rates were determined using the weighted average cost of capital for each reporting unit at the time of the analysis, taking into consideration the risks inherent within each reporting unit individually. The discounted cash flow model uses projections based on management’s best estimates of economic and market conditions over the projected period using the best information available, including growth rates in revenues, costs and estimates of future expected changes in operating margins and cash expenditures. Other significant estimates and assumptions include terminal value growth rates, weighted average cost of capital and changes in future working capital requirements.
In connection with the preparation of the financial statements in our Third Quarter 2023 Form 10-Q, we considered the decline in our stock price and market capitalization, as well as current market and macroeconomic conditions, to be a triggering event for the U.S. eCommerce and Outfitters reporting units and therefore completed a test for impairment of goodwill for these reporting units as of October 27, 2023.
The impairment test resulted in full impairment of $70.4 million and $36.3 million of goodwill allocated to our U.S. eCommerce and Outfitters reporting units, respectively, recorded in Third Quarter 2023.
Indefinite-lived intangible asset impairment assessments
Our indefinite-lived intangible asset is the Lands’ End trade name. We review the trade name for impairment on an annual basis during the fourth fiscal quarter, or whenever events or changes in circumstances indicate the carrying value may not be recoverable. The fair value of the trade name indefinite-lived intangible asset is estimated using the relief from royalty method. The relief from royalty method is based on the assumption that, in lieu of ownership, a firm would be willing to pay a royalty in order to exploit the related benefits of this asset class. The relief from royalty method involves two steps: (1) estimation of reasonable royalty rates for the assets and (2) the application of these royalty rates to a forecasted net revenue stream and discounting the resulting cash flows to determine a present value. We multiply the selected royalty rate by the forecasted net revenue stream to calculate the cost savings (relief from royalty payment) associated with the asset. The cash flows are then discounted to present value using the selected discount rate and compared to the carrying value of the asset.
42
In connection with the preparation of the financial statements in our Third Quarter 2023 Form 10-Q, the Company considered the decline in the Company’s stock price and market capitalization, as well as current market and macroeconomic conditions, to be a triggering event for the Lands’ End trade name. The fair value of the trade name indefinite-lived intangible asset was estimated using the relief from royalty method and the testing resulted in no impairment to the Lands’ End trade name.
In Fiscal 2023 and Fiscal 2022 we performed the annual testing of the indefinite-lived intangible asset, the Lands’ End trade name. The fair value exceeded the carrying value by 6.1% and 13.3% in Fiscal 2023 and Fiscal 2022, respectively, and as such, no trade name impairment charges were recorded. If actual results fall short of our estimates and assumptions used in estimating future cash flows, we may incur future impairment charges.
See Note 2, Summary of Significant Accounting Policies, and Note 10, Goodwill and Indefinite-Lived Intangible Asset, of the Notes to Consolidated Financial Statements in this Annual Report on Form 10-K for more information about these assets and the related impairment charges.
Long-lived Asset Impairment Analysis
Property and equipment are subject to a review for impairment if events or changes in circumstances indicate that the carrying amount of the asset may not be recoverable. In accordance with ASC 360, Property, Plant and Equipment (“ASC 360”) the Company reviewed the long-lived asset groups for impairment in connection with the preparation of the financial statements.
The Company Operated store long-lived asset group, including Operating right-of-use assets, are regularly reviewed for impairment indicators when the Company Operated store reaches Same Store Sales status. A Company Operated store is included in U.S. Same Store Sales calculations when it has been open for at least 14 months. Impairment is assessed at the individual store level which is the lowest level of identifiable cash flows and considers the estimated undiscounted cash flows over the asset’s remaining life. If estimated undiscounted cash flows are insufficient to recover the investment, an impairment loss is recognized equal to the difference between the estimated fair value of the asset and its carrying value, net of salvage, and any costs of disposition. The fair value estimate is generally the discounted amount of estimated store-specific cash flows. The Company recognized long-lived asset impairment for Operating lease right-of-use assets and property and equipment, net for individual identified Company Operated stores in the amount of no impairment and $0.5 million as of February 2, 2024, and January 27, 2023, respectively, recorded in Other operating expense, net in the Consolidated Statement of Operations.
In connection with the preparation of the financial statements in the Company’s Third Quarter 2023 Form 10-Q, the Company tested its long-lived asset groups for impairment as of October 27, 2023. The Company assessed the recoverability of our long-lived asset groups by comparing their projected undiscounted cash flows associated over remaining estimated useful lives of the primary asset in the long-lived asset group against their respective carrying amounts. Impairment, if any, is based on the excess of the carrying amount over the fair value of those assets. Fair value is generally determined using the asset’s expected future discounted cash flows or market value, if readily determinable. If long-lived assets are determined to be recoverable, but the newly determined remaining estimated useful lives are shorter than originally estimated, the net book values of the long-lived assets are depreciated over the newly determined remaining estimated useful lives. As a result of the testing the undiscounted cash flows of the remaining asset groups exceeded their respective carrying amount resulting in no impairment.
See Note 2, Summary of Significant Accounting Policies, in this Annual Report on Form 10-K for more information about long-lived assets and related impairment charges.
Revenue Recognition
We record an allowance for estimated returns based on our historical return patterns and various other assumptions that management believes to be reasonable. We do not believe there is a reasonable likelihood that there will be a material change in the future estimates or assumptions we use to calculate our sales return allowance.
43
However, if the actual rate of sales returns increases significantly, our operating results could be adversely affected. We have not made any material changes in the accounting methodology used to estimate future sales returns in the past three fiscal years.
Provision for Income Taxes
We record a valuation allowance against our deferred tax assets when it is more likely than not that some portion or all of such deferred tax assets will not be realized. In determining the need for a valuation allowance, management is required to make assumptions and to apply judgment, including forecasting future income, taxable income and the mix of income or losses in the jurisdictions in which we operate. Our effective tax rate in a given financial statement period may also be materially impacted by changes in the mix and level of income or losses, changes in the expected outcome of audits, or changes in the deferred tax valuation allowance.
At any point in time, many tax years are subject to or in the process of being audited by various taxing authorities. To the extent our estimates of settlements change, or the final tax outcome of these matters is different from the amounts recorded, such differences will impact the income tax provision in the period in which such determinations are made. Our income tax expense includes changes in our estimated liability for exposures associated with our various tax filing positions. Determining the income tax expense for these potential assessments requires management to make assumptions that are subject to factors such as proposed assessments by tax authorities, changes in facts and circumstances, issuance of new regulations, and resolution of tax audits. We performed an evaluation over our deferred tax assets and determined that a valuation allowance is considered necessary. See Note 11, Income Taxes, for further details on the valuation allowance.
We believe the judgments and estimates discussed above are reasonable. However, if actual results fall short of our estimates or assumptions, we may be exposed to losses or gains that could be material.
CAUTIONARY STATEMENT REGARDING FORWARD-LOOKING INFORMATION
This document contains forward-looking statements. Forward-looking statements reflect our current views with respect to, among other things, future events and performance. These statements may discuss, among other things, our net sales, gross margin, operating expenses, operating income, net income, cash flow, financial condition, financings, impairments, expenditures, growth, strategies, plans, achievements, dividends, capital structure, organizational structure, future store openings, market opportunities and general market and industry conditions. We generally identify forward-looking statements by words such as “anticipate,” “estimate,” “expect,” “intend,” “project,” “plan,” “predict,” “believe,” “seek,” “continue,” “outlook,” “may,” “might,” “will,” “should,” “can have,” “likely,” “targeting” or the negative version of these words or comparable words. Forward-looking statements are based on beliefs and assumptions made by management using currently available information. These statements are only predictions and are not guarantees of future performance, actions or events. Forward-looking statements are subject to risks and uncertainties. If one or more of these risks or uncertainties materialize, or if management’s underlying beliefs and assumptions prove to be incorrect, actual results may differ materially from those contemplated by a forward-looking statement. These risks and uncertainties include those set forth under Item 1A, Risk Factors, in this Annual Report on Form 10-K. Forward-looking statements speak only as of the date on which they are made. We expressly disclaim any obligation to update or revise any forward-looking statement, whether as a result of new information, future events or otherwise, except as required by applicable securities laws and regulations.
44
ITEM 7A. QUANTITATIVE AND QUALITATIVE DISCLOSURES ABOUT MARKET RISK
Foreign Currency Exchange Risk
The Company’s international subsidiaries operate with functional currencies other than the U.S. dollar. Since the Company’s Consolidated Financial Statements are presented in U.S. dollars, the Company must translate all components of these financial statements from the functional currencies into U.S. dollars at exchange rates in effect during or at the end of the reporting period. Net revenue generated from the International distribution channel represented 8% of our total net revenue in Fiscal 2023. The fluctuation in the value of the U.S. dollar against other currencies affects the reported amounts of net revenues, expenses, assets and liabilities. Assuming a 10% change in foreign currency exchange rates, Fiscal 2023 net revenue would have increased or decreased by approximately $11.3 million. Translation gains or losses, which are recorded in other comprehensive income or loss, result from translation of the assets and liabilities of our international subsidiaries into U.S. dollars. Foreign currency translation gains, net, for Fiscal 2023 totaled approximately $1.0 million related to our international subsidiaries in United Kingdom, Germany and Japan. Additionally, the Company has foreign currency denominated intercompany receivables and payables that when settled result in a transaction gain or loss. A 10% change in foreign currency exchanges rates would not result in a significant transaction gain or loss in earnings. The Company does not utilize financial instruments for trading purposes or hedging and have not used any derivative financial instruments to limit foreign currency exchange rate exposures. The Company does not consider our foreign earnings to be permanently reinvested.
As of February 2, 2024, the Company had $6.7 million of cash and cash equivalents denominated in foreign currency, principally in British pound sterling, Hong Kong dollar, euro and Japanese yen.
Interest Rate Risk
The Company is subject to interest rate risk with the Current Term Loan Facility and the ABL Facility, as both require the Company to pay interest on outstanding borrowings at variable rates. Each one percentage point change in interest rates (above the 2% SOFR floor) associated with the Current Term Loan Facility would result in a $2.5 million change in our annual cash interest expenses. Assuming our ABL Facility was fully drawn to a principal amount equal to $275.0 million, each one percentage point change in interest rates would result in a $2.8 million change in our annual cash interest expense.
45
ITEM 8. FINANCIAL STATEMENTS AND SUPPLEMENTARY DATA
|
47 |
|
|
|
50 |
|
|
|
51 |
|
|
Consolidated Balance Sheets at February 2, 2024 and January 27, 2023 |
|
52 |
|
|
53 |
|
|
|
54 |
|
|
|
55 |
|
46
REPORT OF INDEPENDENT REGISTERED PUBLIC ACCOUNTING FIRM
Shareholders and Board of Directors
Lands’ End, Inc.
Dodgeville, Wisconsin
Opinion on the Consolidated Financial Statements
We have audited the accompanying consolidated balance sheets of Lands’ End, Inc. (the “Company”) as of February 2, 2024 and January 27, 2023, the related consolidated statements of operations, comprehensive operations, changes in stockholders’ equity, and cash flows for each of the years then ended, and the related notes (collectively referred to as the “consolidated financial statements”). In our opinion, the consolidated financial statements present fairly, in all material respects, the financial position of the Company at February 2, 2024 and January 27, 2023, and the results of its operations and its cash flows for each of the years then ended, in conformity with accounting principles generally accepted in the United States of America.
We also have audited, in accordance with the standards of the Public Company Accounting Oversight Board (United States) (“PCAOB”), the Company’s internal control over financial reporting as of February 2, 2024, based on criteria established in Internal Control – Integrated Framework (2013) issued by the Committee of Sponsoring Organizations of the Treadway Commission (“COSO”) and our report dated April 3, 2024 expressed an unqualified opinion thereon.
Basis for Opinion
These consolidated financial statements are the responsibility of the Company’s management. Our responsibility is to express an opinion on the Company’s consolidated financial statements based on our audits. We are a public accounting firm registered with the PCAOB and are required to be independent with respect to the Company in accordance with the U.S. federal securities laws and the applicable rules and regulations of the Securities and Exchange Commission and the PCAOB.
We conducted our audits in accordance with the standards of the PCAOB. Those standards require that we plan and perform the audit to obtain reasonable assurance about whether the consolidated financial statements are free of material misstatement, whether due to error or fraud.
Our audits included performing procedures to assess the risks of material misstatement of the consolidated financial statements, whether due to error or fraud, and performing procedures that respond to those risks. Such procedures included examining, on a test basis, evidence regarding the amounts and disclosures in the consolidated financial statements. Our audits also included evaluating the accounting principles used and significant estimates made by management, as well as evaluating the overall presentation of the consolidated financial statements. We believe that our audits provide a reasonable basis for our opinion.
Critical Audit Matter
The critical audit matter communicated below is a matter arising from the current period audit of the consolidated financial statements that was communicated or required to be communicated to the audit committee and that: (1) relates to accounts or disclosures that are material to the consolidated financial statements and (2) involved especially challenging, subjective, or complex judgments. The communication of the critical audit matter does not alter in any way our opinion on the consolidated financial statements, taken as a whole, and we are not, by communicating the critical audit matter below, providing separate opinions on the critical audit matter or on the accounts or disclosures to which it relates.
47
Goodwill and Indefinite-Lived Intangible Asset Valuation
As described in Notes 2 and 10 of the consolidated financial statements, the Company’s intangible assets consist of goodwill and an indefinite-lived trade name with carrying values of $0 and $257 million as of February 2, 2024, respectively. The Company tests goodwill and the trade name separately for impairment on an annual basis during the fourth fiscal quarter, or more frequently as required by Accounting Standards Codification Topic 350.
During the third fiscal quarter, the Company identified a triggering event that necessitated an interim test of impairment for goodwill within the U.S. eCommerce and Outfitters reporting units and the trade name. The impairment test resulted in full impairment of $70.4 million and $36.3 million of goodwill allocated to the Company’s U.S. eCommerce and Outfitters reporting units, respectively, and no impairment of the trade name.
The Company’s evaluation of goodwill for impairment involves comparison of the fair values of the reporting units to their respective carrying values. The Company estimates fair value of its reporting units using a discounted cash flow model, commonly referred to as the income approach, that requires management to make significant estimates and assumptions related to the weighted average cost of capital and forecasted revenue growth rates.
The Company’s evaluation of the trade name for impairment involves comparison of the fair value of the trade name to its carrying value. The Company estimates fair value of the trade name using the relief from royalty method, that requires management to make significant estimates and assumptions related to the weighted average cost of capital, royalty rate and forecasted revenue growth rates.
We identified the valuation of goodwill and the trade name as a critical audit matter. The principal consideration for our determination is the significant management judgment related to: (a) the weighted average cost of capital and forecasted revenue growth rate assumptions involved in estimating the fair value of the U.S. eCommerce and Outfitters reporting units, and (b) the weighted average cost of capital, royalty rate and forecasted revenue growth rate assumptions involved in estimating the fair value of the trade name. Auditing these elements involved subjective and complex auditor judgement, including the use of professionals with specialized skills and knowledge in valuation.
The primary procedures we performed to address this critical audit matter included:
/s/ BDO USA, P.C.
We have served as the Company’s auditor since 2022.
Madison, Wisconsin
April 3, 2024
48
REPORT OF INDEPENDENT REGISTERED PUBLIC ACCOUNTING FIRM
To the stockholders and the Board of Directors of Lands’ End, Inc.
Opinion on the Financial Statements
We have audited the accompanying consolidated statements of operations, comprehensive operations, cash flows, and changes in stockholders’ equity of Lands’ End, Inc. and subsidiaries (the “Company”) for the year ended January 28, 2022, and the related notes (collectively referred to as the “financial statements”).
In our opinion, the financial statements present fairly, in all material respects, the results of its operations and its cash flows for the year ended January 28, 2022, in conformity with accounting principles generally accepted in the United States of America.
Basis for Opinion
These financial statements are the responsibility of the Company’s management. Our responsibility is to express an opinion on the Company’s financial statements based on our audit. We are a public accounting firm registered with the Public Company Accounting Oversight Board (United States) (PCAOB) and are required to be independent with respect to the Company in accordance with the U.S. federal securities laws and the applicable rules and regulations of the Securities and Exchange Commission and the PCAOB.
We conducted our audit in accordance with the standards of the PCAOB. Those standards require that we plan and perform the audit to obtain reasonable assurance about whether the financial statements are free of material misstatement, whether due to error or fraud.
Our audit included performing procedures to assess the risks of material misstatement of the financial statements, whether due to error or fraud, and performing procedures that respond to those risks. Such procedures included examining, on a test basis, evidence regarding the amounts and disclosures in the financial statements. Our audit also included evaluating the accounting principles used and significant estimates made by management, as well as evaluating the overall presentation of the financial statements. We believe that our audit provides a reasonable basis for our opinion.
/s/ Deloitte & Touche LLP
Chicago, Illinois
March 24, 2022
We began serving as the Company’s auditor in 2012. In 2022 we became the predecessor auditor.
49
LANDS’ END, INC.
Consolidated Statements of Operations
for Fiscal Years Ended February 2, 2024, January 27, 2023 and January 28, 2022
(in thousands except per share data) |
|
2023 |
|
|
2022 |
|
|
2021 |
|
|||
REVENUES |
|
|
|
|
|
|
|
|
|
|||
Net revenue |
|
$ |
|
|
$ |
|
|
$ |
|
|||
Cost of sales (excluding depreciation and amortization) |
|
|
|
|
|
|
|
|
|
|||
Gross profit |
|
|
|
|
|
|
|
|
|
|||
|
|
|
|
|
|
|
|
|
|
|||
Selling and administrative |
|
|
|
|
|
|
|
|
|
|||
Depreciation and amortization |
|
|
|
|
|
|
|
|
|
|||
Goodwill impairment |
|
|
|
|
|
— |
|
|
|
— |
|
|
Other operating expense, net |
|
|
|
|
|
|
|
|
|
|||
Total costs and expenses |
|
|
|
|
|
|
|
|
|
|||
Operating (loss) income |
|
|
( |
) |
|
|
|
|
|
|
||
Interest expense |
|
|
|
|
|
|
|
|
|
|||
Loss on extinguishment of debt |
|
|
|
|
|
— |
|
|
|
— |
|
|
Other income, net |
|
|
( |
) |
|
|
( |
) |
|
|
( |
) |
(Loss) income before income taxes |
|
|
( |
) |
|
|
( |
) |
|
|
|
|
Income tax (benefit) expense |
|
|
( |
) |
|
|
( |
) |
|
|
|
|
NET (LOSS) INCOME |
|
$ |
( |
) |
|
$ |
( |
) |
|
$ |
|
|
|
|
|
|
|
|
|
|
|
|
|||
NET (LOSS) INCOME PER COMMON SHARE |
|
|
|
|
|
|
|
|
|
|||
Basic: |
|
$ |
( |
) |
|
$ |
( |
) |
|
$ |
|
|
Diluted: |
|
$ |
( |
) |
|
$ |
( |
) |
|
$ |
|
|
|
|
|
|
|
|
|
|
|
|
|||
Basic weighted average common shares outstanding |
|
|
|
|
|
|
|
|
|
|||
Diluted weighted average common shares outstanding |
|
|
|
|
|
|
|
|
|
|||
See accompanying Notes to Consolidated Financial Statements.
50
LANDS’ END, INC.
Consolidated Statements of Comprehensive Operations
for Fiscal Years Ended February 2, 2024, January 27, 2023 and January 28, 2022
(in thousands) |
|
2023 |
|
|
2022 |
|
|
2021 |
|
|||
NET (LOSS) INCOME |
|
$ |
( |
) |
|
$ |
( |
) |
|
$ |
|
|
Other comprehensive (loss) income, net of tax |
|
|
|
|
|
|
|
|
|
|||
Foreign currency translation gain (loss) |
|
|
|
|
|
( |
) |
|
|
( |
) |
|
Reclassification of foreign currency translation gain to income |
|
|
( |
) |
|
|
— |
|
|
|
— |
|
COMPREHENSIVE (LOSS) INCOME |
|
$ |
( |
) |
|
$ |
( |
) |
|
$ |
|
|
See accompanying Notes to Consolidated Financial Statements.
51
LANDS’ END, INC.
Consolidated Balance Sheets
(in thousands except per share data) |
|
February 2, 2024 |
|
|
January 27, 2023 |
|
||
ASSETS |
|
|
|
|
|
|
||
Current assets |
|
|
|
|
|
|
||
Cash and cash equivalents |
|
$ |
|
|
$ |
|
||
Restricted cash |
|
|
|
|
|
|
||
Accounts receivable, net |
|
|
|
|
|
|
||
Inventories, net |
|
|
|
|
|
|
||
Prepaid expenses and other current assets |
|
|
|
|
|
|
||
Total current assets |
|
|
|
|
|
|
||
Property and equipment, net |
|
|
|
|
|
|
||
Operating lease right-of-use asset |
|
|
|
|
|
|
||
Goodwill |
|
|
— |
|
|
|
|
|
Intangible asset, net |
|
|
|
|
|
|
||
Other assets |
|
|
|
|
|
|
||
TOTAL ASSETS |
|
$ |
|
|
$ |
|
||
LIABILITIES AND STOCKHOLDERS’ EQUITY |
|
|
|
|
|
|
||
Current liabilities |
|
|
|
|
|
|
||
Current portion of long-term debt |
|
$ |
|
|
$ |
|
||
Accounts payable |
|
|
|
|
|
|
||
Lease liability – current |
|
|
|
|
|
|
||
Accrued expenses and other current liabilities |
|
|
|
|
|
|
||
Total current liabilities |
|
|
|
|
|
|
||
Long-term borrowings on ABL Facility |
|
|
— |
|
|
|
|
|
Long-term debt, net |
|
|
|
|
|
|
||
Lease liability – long-term |
|
|
|
|
|
|
||
Deferred tax liabilities |
|
|
|
|
|
|
||
Other liabilities |
|
|
|
|
|
|
||
TOTAL LIABILITIES |
|
|
|
|
|
|
||
|
|
|
|
|
|
|||
STOCKHOLDERS’ EQUITY |
|
|
|
|
|
|
||
Common stock, par value $ |
|
|
|
|
|
|
||
Additional paid-in capital |
|
|
|
|
|
|
||
(Accumulated deficit) Retained earnings |
|
|
( |
) |
|
|
|
|
Accumulated other comprehensive loss |
|
|
( |
) |
|
|
( |
) |
TOTAL STOCKHOLDERS’ EQUITY |
|
|
|
|
|
|
||
TOTAL LIABILITIES AND STOCKHOLDERS’ EQUITY |
|
$ |
|
|
$ |
|
||
See accompanying Notes to Consolidated Financial Statements.
52
LANDS’ END, INC.
Consolidated Statements of Cash Flows
for Fiscal Years Ended February 2, 2024, January 27, 2023 and January 28, 2022
|
|
|
|
|||||||||
(in thousands) |
|
2023 |
|
|
2022 |
|
|
2021 |
|
|||
CASH FLOWS FROM OPERATING ACTIVITIES |
|
|
|
|
|
|
|
|
|
|||
Net (loss) income |
|
$ |
( |
) |
|
$ |
( |
) |
|
$ |
|
|
Adjustments to reconcile net (loss) income to net cash provided by (used in) operating activities: |
|
|
|
|
|
|
|
|
|
|||
Depreciation and amortization |
|
|
|
|
|
|
|
|
|
|||
Amortization of debt issuance costs |
|
|
|
|
|
|
|
|
|
|||
Loss (gain) on disposal of property and equipment |
|
|
|
|
|
( |
) |
|
|
|
||
Stock-based compensation |
|
|
|
|
|
|
|
|
|
|||
Deferred income taxes |
|
|
|
|
|
|
|
|
( |
) |
||
Goodwill and long-lived asset impairment |
|
|
|
|
|
|
|
|
— |
|
||
Loss on extinguishment of debt |
|
|
|
|
|
— |
|
|
|
— |
|
|
Other |
|
|
( |
) |
|
|
( |
) |
|
|
( |
) |
Change in operating assets and liabilities: |
|
|
|
|
|
|
|
|
|
|||
Accounts receivable, net |
|
|
|
|
|
|
|
|
( |
) |
||
Inventories, net |
|
|
|
|
|
( |
) |
|
|
( |
) |
|
Accounts payable |
|
|
( |
) |
|
|
|
|
|
|
||
Other operating assets |
|
|
( |
) |
|
|
( |
) |
|
|
|
|
Other operating liabilities |
|
|
|
|
|
( |
) |
|
|
( |
) |
|
Net cash provided by (used in) operating activities |
|
|
|
|
|
( |
) |
|
|
|
||
CASH FLOWS FROM INVESTING ACTIVITIES |
|
|
|
|
|
|
|
|
|
|||
Sales of property and equipment |
|
|
|
|
|
|
|
|
— |
|
||
Purchases of property and equipment |
|
|
( |
) |
|
|
( |
) |
|
|
( |
) |
Net cash used in investing activities |
|
|
( |
) |
|
|
( |
) |
|
|
( |
) |
CASH FLOWS FROM FINANCING ACTIVITIES |
|
|
|
|
|
|
|
|
|
|||
Proceeds from borrowings under ABL Facility |
|
|
|
|
|
|
|
|
|
|||
Payments of borrowings under ABL Facility |
|
|
( |
) |
|
|
( |
) |
|
|
( |
) |
Proceeds from issuance on long-term debt, net of discount |
|
|
|
|
|
— |
|
|
|
— |
|
|
Payments on term loan |
|
|
( |
) |
|
|
( |
) |
|
|
( |
) |
Payments of debt extinguishment costs |
|
|
( |
) |
|
|
— |
|
|
|
— |
|
Payments of debt issuance costs |
|
|
( |
) |
|
|
— |
|
|
|
( |
) |
Payments for taxes related to net share settlement of equity awards |
|
|
( |
) |
|
|
( |
) |
|
|
( |
) |
Purchases and retirement of common stock |
|
|
( |
) |
|
|
( |
) |
|
|
|
|
Net cash (used in) provided by financing activities |
|
|
( |
) |
|
|
|
|
|
( |
) |
|
Effects of exchange rate changes on cash, cash equivalents |
|
|
|
|
|
( |
) |
|
|
|
||
NET (DECREASE) INCREASE IN CASH, CASH |
|
|
( |
) |
|
|
|
|
|
|
||
CASH, CASH EQUIVALENTS AND RESTRICTED CASH, |
|
|
|
|
|
|
|
|
|
|||
CASH, CASH EQUIVALENTS AND RESTRICTED CASH, |
|
$ |
|
|
$ |
|
|
$ |
|
|||
SUPPLEMENTAL CASH FLOW DATA |
|
|
|
|
|
|
|
|
|
|||
Unpaid liability to acquire property and equipment |
|
$ |
|
|
$ |
|
|
$ |
|
|||
Income taxes paid, net of refunds |
|
$ |
|
|
$ |
|
|
$ |
|
|||
Interest paid |
|
$ |
|
|
$ |
|
|
$ |
|
|||
See accompanying Notes to Consolidated Financial Statements.
53
LANDS’ END, INC.
Consolidated Statements of Changes in Stockholders’ Equity
|
|
|
|
|
|
|
|
(Accumulated |
|
|
Accumulated |
|
|
|
|
|||||||||
|
|
|
|
|
Additional |
|
|
Deficit) |
|
|
Other |
|
|
Total |
|
|||||||||
|
|
Common Stock Issued |
|
|
Paid-in |
|
|
Retained |
|
|
Comprehensive |
|
|
Stockholders’ |
|
|||||||||
(in thousands) |
|
Shares |
|
|
Amount |
|
|
Capital |
|
|
Earnings |
|
|
Loss |
|
|
Equity |
|
||||||
Balance at January 29, 2021 |
|
|
|
|
$ |
|
|
$ |
|
|
$ |
|
|
$ |
( |
) |
|
$ |
|
|||||
Net income |
|
|
— |
|
|
|
— |
|
|
|
— |
|
|
|
|
|
|
— |
|
|
|
|
||
Cumulative translation adjustment, |
|
|
— |
|
|
|
— |
|
|
|
— |
|
|
|
— |
|
|
|
( |
) |
|
|
( |
) |
Stock-based compensation expense |
|
|
— |
|
|
|
— |
|
|
|
|
|
|
— |
|
|
|
— |
|
|
|
|
||
Vesting of restricted shares |
|
|
|
|
|
|
|
|
( |
) |
|
|
— |
|
|
|
— |
|
|
|
— |
|
||
Common stock withheld related to net |
|
|
( |
) |
|
|
— |
|
|
|
( |
) |
|
|
— |
|
|
|
— |
|
|
|
( |
) |
Balance at January 28, 2022 |
|
|
|
|
|
|
|
|
|
|
|
|
|
|
( |
) |
|
|
|
|||||
Net loss |
|
|
— |
|
|
|
— |
|
|
|
— |
|
|
|
( |
) |
|
|
— |
|
|
|
( |
) |
Cumulative translation adjustment, |
|
|
— |
|
|
|
— |
|
|
|
— |
|
|
|
— |
|
|
|
( |
) |
|
|
( |
) |
Stock-based compensation expense |
|
|
— |
|
|
|
— |
|
|
|
|
|
|
— |
|
|
|
— |
|
|
|
|
||
Vesting of restricted shares |
|
|
|
|
|
|
|
|
( |
) |
|
|
— |
|
|
|
— |
|
|
|
— |
|
||
Common stock withheld related to net |
|
|
( |
) |
|
|
— |
|
|
|
( |
) |
|
|
— |
|
|
|
— |
|
|
|
( |
) |
Purchases and retirement of common stock |
|
|
( |
) |
|
|
( |
) |
|
|
( |
) |
|
|
( |
) |
|
|
— |
|
|
|
( |
) |
Balance at January 27, 2023 |
|
|
|
|
|
|
|
|
|
|
|
|
|
|
( |
) |
|
|
|
|||||
Net loss |
|
|
— |
|
|
|
— |
|
|
|
— |
|
|
|
( |
) |
|
|
— |
|
|
|
( |
) |
Cumulative translation adjustment, |
|
|
— |
|
|
|
— |
|
|
|
|
|
|
— |
|
|
|
|
|
|
|
|||
Stock-based compensation expense |
|
|
— |
|
|
|
— |
|
|
|
|
|
|
— |
|
|
|
— |
|
|
|
|
||
Vesting of restricted shares |
|
|
|
|
|
|
|
|
( |
) |
|
|
— |
|
|
|
— |
|
|
|
— |
|
||
Common stock withheld related to net |
|
|
( |
) |
|
|
— |
|
|
|
( |
) |
|
|
— |
|
|
|
— |
|
|
|
( |
) |
Purchases and retirement of common stock |
|
|
( |
) |
|
|
( |
) |
|
|
( |
) |
|
|
— |
|
|
|
— |
|
|
|
( |
) |
Balance at February 2, 2024 |
|
|
|
|
$ |
|
|
$ |
|
|
$ |
( |
) |
|
$ |
( |
) |
|
$ |
|
||||
See accompanying Notes to Consolidated Financial Statements.
54
LANDS’ END, INC.
NOTES TO CONSOLIDATED FINANCIAL STATEMENTS
NOTE 1. BACKGROUND AND BASIS OF PRESENTATION
Description of Business
Lands’ End, Inc. (“Lands’ End” or the “Company”) is a leading digital retailer of solution-based apparel, swimwear, outerwear, accessories, footwear, home products and uniforms. We offer products online at www.landsend.com, through third-party distribution channels and our own Company Operated stores. We also offer products to businesses and schools, for their employees and students, through the Outfitters distribution channel.
Terms that are commonly used in the Company’s Notes to the Consolidated Financial Statements are defined as follows:
55
Basis of Presentation
The Consolidated Financial Statements include the accounts of Lands’ End, Inc. and its subsidiaries. All intercompany transactions and balances have been eliminated.
The accompanying Consolidated Financial Statements have been prepared in accordance with GAAP. In the opinion of management, all material adjustments are of a normal and recurring nature necessary for a fair presentation of the results have been reflected for the periods presented. Dollar amounts are reported in thousands, except per share data, unless otherwise noted.
Macroeconomic Challenges
Macroeconomic issues, such as high interest rates and inflationary pressures, have continued to have an impact on the Company’s business. Since apparel purchases are discretionary expenditures that historically have been influenced by domestic and global economic conditions, higher prices of consumer goods due to inflation may result in less discretionary spending for consumers which may negatively impact customer demand and require higher levels of promotion in order to attract and retain customers. Additionally, interest expense could be negatively affected by any continued rate increases due to the variable interest rates associated with the Company’s Debt Facilities. These macroeconomic challenges have led to increased cost of raw materials, packaging materials, labor, energy, fuel and other inputs necessary for the production and distribution of the Company’s products.
Global Supply Chain Challenges
Like many industries, we experienced global supply chain challenges that impacted our distribution process, third-party manufacturing partners and logistics partners, including shipping delays due to port congestion and closure of certain third-party manufacturing facilities and production lines. These global supply chain challenges caused manufacturing, transport and receipt of inbound product delays that increased our logistics costs during the first half of Fiscal 2022. These global supply chain challenges began to normalize in the second half of Fiscal 2022 and throughout Fiscal 2023.
Corporate Restructuring
The Company reduced approximately
56
$
Lands’ End Japan Closure
During Second Quarter 2022, the Board of Directors approved a plan to wind down and cease operations of Lands’ End Japan KK. Lands’ End Japan KK represents the Japan eCommerce operating segment. For a discussion on this operating segment, see Note 13, Segment Reporting. The Company incurred closing costs of approximately $
NOTE 2. SUMMARY OF SIGNIFICANT ACCOUNTING POLICIES
Fiscal Year
The Company’s fiscal year end is on the Friday preceding the Saturday closest to January 31 each year. The fiscal periods in this report are presented as follows, unless the context otherwise requires:
Fiscal Year |
|
Ended |
|
Weeks |
2023 |
|
February 2, 2024 |
|
53 |
2022 |
|
January 27, 2023 |
|
52 |
2021 |
|
January 28, 2022 |
|
52 |
Seasonality
The Company’s operations have historically been seasonal, with a disproportionate amount of net revenue occurring in the fourth fiscal quarter, reflecting increased customer demand during the year-end holiday selling season. The impact of seasonality on results of operations is more pronounced since the level of certain fixed costs, such as occupancy and overhead expenses, do not vary with sales. The Company’s results of operations also may fluctuate based upon such factors as the timing of certain holiday season dates and promotions, the amount of net revenue contributed by new and existing stores, the timing and level of markdowns, competitive factors, weather and general economic conditions.
Working capital requirements typically increase during the second and third quarters of the fiscal year as inventory builds to support peak selling periods and, accordingly, typically decrease during the fourth quarter of the fiscal year as inventory is sold. Cash provided by operating activities is typically higher in the fourth quarter of the fiscal year due to reduced working capital requirements during that period.
Use of Estimates
The preparation of financial statements in conformity with GAAP requires management to make estimates and assumptions that affect the reportable amounts of assets and liabilities and disclosure of contingent assets and liabilities at the date of the financial statements as well as the reported amounts of revenue and expenses during the reporting period. Significant accounting estimates inherent in the preparation of the consolidated financial statements include revenue recognition, including gift card breakage and estimated merchandise returns, inventory valuation, impairment assessments for goodwill, indefinite intangible assets and long-lived assets and income taxes. Actual results could differ from those estimates made by management, which could have a material impact on the Company’s financial position or results of operations.
Cash and cash equivalents
Cash and cash equivalents consist of highly liquid temporary instruments purchased with original maturities of three months or less. It also includes deposits in-transit from banks for payments related to third-party credit card and debit card transactions. The Company maintains a portion of its cash in Federal Deposit Insurance Corporation
57
(“FDIC”) insured bank deposit accounts which, at times, may exceed federally insured limits. To date, the Company has not experienced any losses in such accounts. The Company does not believe, based on the size and strength of the banking institutions used, it is exposed to any significant credit risks in cash.
Restricted cash
The Company classifies cash balances pledged as collateral as Restricted cash on the Consolidated Balance Sheets.
Allowance for Credit Losses
The Company provides an allowance for credit losses based on historical loss experience, collection experience, delinquency trends, economic conditions and specific identification. The Accounts receivable balance on the Consolidated Balance Sheets is presented net of the Company’s allowance for credit losses and is comprised of various customer-related accounts receivable.
Changes in the balance of the allowance for credit losses are as follows:
(in thousands) |
|
Fiscal 2023 |
|
|
Fiscal 2022 |
|
||
Beginning balance |
|
$ |
|
|
$ |
|
||
Provision |
|
|
|
|
|
|
||
Write-offs |
|
|
( |
) |
|
|
( |
) |
Ending balance |
|
$ |
|
|
$ |
|
||
Inventory
Inventories primarily consist of merchandise purchased for resale. For financial reporting and tax purposes, the Company’s United States inventory, primarily merchandise held for sale, is stated at last-in, first-out (“LIFO”) cost, which is lower than net realizable value. The Company accounts for its non-United States inventory on the first-in, first-out (“FIFO”) method. The United States inventory accounted for using the LIFO method was
The Company maintains a reserve for excess and obsolete inventory. The reserve is calculated based on historical experience related to liquidation and disposal of identified inventory. The excess and obsolescence reserve balances were $
Deferred Catalog Costs and Marketing
Costs incurred for direct response marketing consist primarily of catalog production and mailing costs that are generally amortized within two months from the date catalogs are mailed. Unamortized marketing costs reported as prepaid assets were $
Property and Equipment
Property and equipment are recorded at cost, less accumulated depreciation. Additions and substantial improvements are capitalized and include expenditures that materially extend the useful lives of existing facilities and
58
equipment. Maintenance and repairs that do not materially improve or extend the lives of the respective assets are expensed as incurred.
(in thousands) |
|
Asset Lives (years) |
|
February 2, |
|
|
January 27, |
|
||
Land |
|
— |
|
$ |
|
|
$ |
|
||
Buildings and improvements |
|
|
|
|
|
|
|
|||
Furniture, fixtures and equipment |
|
|
|
|
|
|
|
|||
Computer hardware and software |
|
|
|
|
|
|
|
|||
Leasehold improvements |
|
|
|
|
|
|
|
|||
Construction in progress |
|
|
|
|
|
|
|
|
||
Gross property and equipment |
|
|
|
|
|
|
|
|
||
Less: Accumulated depreciation |
|
|
|
|
( |
) |
|
|
( |
) |
Total property and equipment, net |
|
|
|
$ |
|
|
$ |
|
||
As of both February 2, 2024 and January 27, 2023, construction in progress relates primarily to technological investments.
Depreciation expense is recorded over the estimated useful lives of the respective assets using the straight-line method. Leasehold improvements are depreciated over the shorter of the associated lease term or the estimated useful life of the asset. Depreciation expense was $
Leases
The Company is a lessee under various lease agreements for its Company Operated store locations and certain international distribution and office facilities. All leases are classified as operating leases. The Company’s leases have remaining lease terms ranging from less than
The determination of whether an arrangement contains a lease and the classification of a lease, if applicable, is made at lease inception. Lease commencement is the date in which the lessor provides the Company access to, and the right to control, the identified asset. At lease commencement, the Company recognizes a right-of-use asset and a corresponding lease liability measured at the present value of the future minimum lease payments. Minimum lease payments include the fixed lease component of the agreement, as well as any variable rate payments that depend on an index, initially measured using the index at the lease commencement date. The right-of-use asset is recorded at the amount of the lease liability, increased for prepaid lease and initial direct costs paid and reduced by any lease incentives.
The Company has elected the practical expedient of not recognizing a right-of-use asset or lease liability for short-term leases, which are leases with a term of twelve months or less. Lease payments on short-term leases are expensed as incurred. The Company has lease agreements with lease and non-lease components. The Company has elected the practical expedient to combine lease and non-lease components. The Company does not have any leases with residual value guarantees or restrictions or covenants imposed by the lease.
Due to the absence of an implicit rate in the Company’s lease agreements, the Company estimates its incremental borrowing rate at lease commencement in determining the present value of lease payments for each lease based on the lease term, lease currency and the Company’s credit spread. The yield curve selected at the lease commencement date represents one notch above the Company’s unsecured credit rating, and therefore is considered a close proxy for the incremental borrowing rate the Company would incur for secured debt.
In addition to rent payments, the lease agreements contain payments for real estate taxes, insurance, common area maintenance and utilities that are not fixed. The Company accounts for these costs as variable payments and does not include such costs as a lease component.
59
The Company’s leases are classified as operating leases, which are included in the Operating lease right-of-use asset, Lease liability – current and Lease liability – long-term on the Company’s Consolidated Balance Sheets. Lease expense is recognized on a straight-line basis over the lease term and is included in Selling and administrative expense in the Consolidated Statements of Operations. See Note 4, Leases.
Impairment of Property and Equipment
Property and equipment are subject to a review for impairment if events or changes in circumstances indicate that the carrying amount of the asset may not be recoverable. Company Operated store long-lived assets, including right-of-use assets, are regularly reviewed for impairment indicators when the Company Operated store meets Same Store Sales status. A Company Operated store is included in U.S. Same Store Sales calculations when it has been open for at least
In connection with the preparation of the Company’s financial statements in the Third Quarter 2023 Form 10-Q, the Company tested its long-lived asset groups for impairment as of October 27, 2023. The Company assessed the recoverability of its long-lived asset groups by comparing their projected undiscounted cash flows associated over the remaining estimated useful lives of the primary asset in the long-lived asset group against their respective carrying amounts. Impairment, if any, is based on the excess of the carrying amount over the fair value of those assets. Fair value is generally determined using the asset’s expected future discounted cash flows or market value, if readily determinable. If long-lived assets are determined to be recoverable, but the newly determined remaining estimated useful lives are shorter than originally estimated, the net book values of the long-lived assets are depreciated over the newly determined remaining estimated useful lives. As a result of the testing, the undiscounted cash flows of the remaining asset groups exceeded their respective carrying amount resulting in no impairment.
Goodwill and Indefinite-lived Intangible Asset Impairment Assessments
Goodwill and the indefinite-lived trade name intangible asset are tested separately for impairment on an annual basis or whenever events or changes in circumstances indicate that the carrying amount may not be recoverable. Impairment assessments contain multiple uncertainties because the calculation requires management to make assumptions and to apply judgment to estimate future cash flows and asset fair values. If actual results fall short of our estimates and assumptions used in estimating future cash flows and asset fair values, we may incur future impairment charges that could be material.
Goodwill impairment assessments
In connection with the preparation of the financial statements included in the Company’s Third Quarter Form 10-Q, the Company considered the decline in the Company’s stock price and market capitalization, as well as current market and macroeconomic conditions, to be a triggering event for the U.S. eCommerce and Outfitters reporting units and therefore completed a test for impairment of goodwill for these reporting units as of October 27, 2023. The Company tested goodwill for impairment using a one-step quantitative test. The quantitative test compares the reporting unit’s fair value to its carrying value. An impairment is recorded for any excess carrying value above the reporting unit’s fair value, not to exceed the amount of goodwill. The Company estimates fair value of its reporting units using a discounted cash flow model, commonly referred to as the income approach. The income approach uses a reporting unit’s projection of estimated operating results and cash flows that is discounted using a weighted-average cost of capital that reflects current market conditions appropriate to the Company’s reporting unit. The discounted cash flow model uses management’s best estimates of economic and market conditions over the projected period using
60
the best information available, including growth rates in revenues, costs and estimates of future expected changes in operating margins and cash expenditures. Other significant estimates and assumptions include terminal value growth rates, weighted average cost of capital and changes in future working capital requirements.
The impairment test resulted in full impairment of $
Indefinite-lived intangible asset impairment assessments
The Company’s indefinite-lived intangible asset is the Lands’ End trade name. The Company reviews the trade name for impairment on an annual basis or whenever events or changes in circumstances indicate the carrying value may not be recoverable. The fair value of the trade name indefinite-lived intangible asset is estimated using the relief from royalty method. The relief from royalty method is based on the assumption that, in lieu of ownership, a firm would be willing to pay a royalty in order to exploit the related benefits of this asset class. The relief from royalty method involves two steps: (1) estimation of reasonable royalty rates for the assets and (2) the application of these royalty rates to a forecasted net revenue stream and discounting the resulting cash flows to determine a present value. The Company multiplied the selected royalty rate by the forecasted net revenue stream to calculate the cost savings (relief from royalty payment) associated with the asset. The cash flows are then discounted to present value using the selected discount rate and compared to the carrying value of the asset.
In connection with the preparation of the financial statements in the Company’s Third Quarter 2023 Form 10-Q, the Company considered the decline in the Company’s stock price and market capitalization, as well as current market and macroeconomic conditions, to be a triggering event for the Lands’ End trade name. The fair value of the trade name indefinite-lived intangible asset was estimated using the relief from royalty method and the testing resulted in no impairment to the Lands’ End trade name.
Financial Instruments with Off-Balance-Sheet Risk
The $
Fair Value of Financial Instruments
The Company determines the fair value of financial instruments in accordance with accounting standards pertaining to fair value measurements. Such standards define fair value and establish a framework for measuring fair value in accordance with GAAP. Under fair value measurement accounting standards, fair value is considered to be the exchange price in an orderly transaction between market participants to sell an asset or transfer a liability at the measurement date. The Company reports or discloses the fair value of financial assets and liabilities based on the fair value hierarchy prescribed by accounting standards for fair value measurements, which prioritizes the inputs to valuation techniques used to measure fair value into three levels.
Financial instruments that potentially subject the Company to concentration of credit risk consist principally of accounts receivable. Total accounts receivable, net was $
Cash and cash equivalents, accounts receivable, net, accounts payable, accrued expenses and other current liabilities and revolving long-term borrowings on ABL Facility are reflected in the Consolidated Balance Sheets at cost, which approximates fair value due to the short-term nature of these instruments.
61
Long-term debt, net is reflected in the Consolidated Balance Sheets at amortized cost. The fair value of debt was determined utilizing Level 3 valuation techniques as of February 2, 2024 and January 27, 2023. See Note 9, Fair Value of Financial Assets and Liabilities.
Foreign Currency Translations and Transactions
The Company translates the assets and liabilities of foreign subsidiaries from their respective functional currencies to United States dollars at the appropriate spot rates as of the balance sheet date. Revenue and expenses of operations are translated to United States dollars using weighted average exchange rates during the year. The foreign subsidiaries use the local currency as their functional currency. The effects of foreign currency translation adjustments are included as a component of Accumulated other comprehensive loss in the accompanying Consolidated Statements of Changes in Stockholders’ Equity. Foreign currency translation gains, net, for Fiscal 2023 totaled approximately $
Revenue Recognition
Revenue includes sales of merchandise and delivery revenue related to merchandise sold. Substantially all of the Company’s revenue is recognized when control of product passes to customers, which for the U.S. eCommerce, International, Outfitters and Third Party distribution channels is when the merchandise is expected to be received by the customer and for the Retail distribution channel is at the time of sale in the store. The Company recognizes revenue, including shipping and handling fees billed to customers, in the amount expected to be received when control of the Company’s products transfers to customers, and is presented net of various forms of promotions, which range from contractually-fixed percentage price reductions to sales returns, discounts, and other incentives that may vary in amount. Variable amounts are estimated based on an analysis of historical experience and adjusted as better estimates become available. The Company’s revenue is disaggregated by distribution channel and geographic location.
The Company excludes from revenue, taxes assessed by governmental authorities, including value-added and other sales-related taxes, that are imposed on and concurrent with revenue-producing activities.
Contract Liabilities
Contract liabilities consist of payments received in advance of the transfer of control to the customer. As products are delivered and control transfers, the Company recognizes the deferred revenue in Net revenue in the Consolidated Statements of Operations.
(in thousands) |
|
Fiscal 2023 |
|
|
Fiscal 2022 |
|
||
Deferred revenue beginning of period |
|
$ |
|
|
$ |
|
||
Deferred revenue recognized in period |
|
|
( |
) |
|
|
( |
) |
Revenue deferred in period |
|
|
|
|
|
|
||
Deferred revenue end of period |
|
$ |
|
|
$ |
|
||
Revenue from gift cards is recognized when (i) the gift card is redeemed by the customer for merchandise, or (ii) as gift card breakage, an estimate of gift cards which will not be redeemed where the Company does not have a legal obligation to remit the value of the unredeemed gift cards to the relevant jurisdictions. Gift card breakage is
62
recorded within Net revenue in the Consolidated Statements of Operations. Prior to their redemption, gift cards are recorded as a liability, included within Accrued expenses and other current liabilities in the Consolidated Balance Sheets. The liability is estimated based on expected breakage that considers historical patterns of redemption.
(in thousands) |
|
Fiscal 2023 |
|
|
Fiscal 2022 |
|
||
Balance as of beginning of period |
|
$ |
|
|
$ |
|
||
Gift cards sold |
|
|
|
|
|
|
||
Gift cards redeemed |
|
|
( |
) |
|
|
( |
) |
Gift card breakage |
|
|
( |
) |
|
|
( |
) |
Balance as of end of period |
|
$ |
|
|
$ |
|
||
Refund Liabilities
Refund liabilities, primarily associated with product sales returns and retrospective volume rebates, represent variable consideration and are estimated and recorded as a reduction to Net revenue based on historical experience. As of February 2, 2024 and January 27, 2023, $
Cost of Sales
Cost of sales are comprised principally of the costs of merchandise sold, inbound shipping and handling, duty, warehousing and distribution (including receiving, picking, packing, store delivery and value-added costs), customer shipping and handling costs and physical inventory losses. Depreciation and amortization are not included in the Company’s Cost of sales.
Selling and Administrative Expenses
Selling and administrative expenses are comprised principally of payroll and benefits costs, marketing, information technology expenses, third-party services, occupancy costs of Company Operated stores and corporate facilities, and other administrative expenses. All stock-based compensation is recorded in Selling and administrative expenses. See Note 5, Stock-Based Compensation.
Income Taxes
Deferred income tax assets and liabilities are based on the estimated future tax effects of differences between the financial and tax basis of assets and liabilities based on currently enacted tax laws. The tax balances and income tax expense recognized are based on management’s interpretation of the tax laws of multiple jurisdictions. Income tax expense also reflects best estimates and assumptions regarding, among other things, the level of future taxable income and tax planning. Future changes in tax laws, changes in projected levels of taxable income, tax planning and adoption and implementation of new accounting standards could impact the effective tax rate and tax balances recorded.
Tax positions are recognized when they are more likely than not to be sustained upon examination. The amount recognized is measured as the largest amount of benefit that is more likely than not to be realized upon settlement. The Company is subject to periodic audits by the United States Internal Revenue Service and other state and local taxing authorities. These audits may challenge certain of the Company’s tax positions such as the timing and amount of income and deductions and the allocation of taxable income to various tax jurisdictions. The Company evaluates its tax positions and establishes liabilities in accordance with the applicable accounting guidance on uncertainty in income taxes. These tax uncertainties are reviewed as facts and circumstances change and are adjusted accordingly. This requires significant management judgment in estimating final outcomes. Interest and penalties are classified as Income tax expense in the Consolidated Statements of Operations. See Note 11, Income Taxes, for further details.
63
The Company performed an evaluation over its deferred tax assets and determined that a valuation allowance is considered necessary for certain jurisdictions. See Note 11, Income Taxes, for further details on the valuation allowance.
Self-Insurance
The Company has a self-insured plan for health and welfare benefits and provides an accrual to cover the obligation. The accrual for the self-insured liability is based on claims filed and an estimate of claims incurred but not yet reported. The Company considers a number of factors, including historical claims information, when determining the amount of the accrual. Costs related to the administration of the plan and related claims are expensed as incurred. Total expenses, net of employee contributions, were $
The Company also has a self-insured plan for certain costs related to workers’ compensation. The Company obtains third-party insurance coverage to limit exposure to this workers’ compensation self-insured risk.
Retirement Benefit Plan
The Company has a 401(k) retirement plan, which covers most regular employees and allows them to make contributions. The Company also provides a matching contribution on a portion of the employee contributions. Total expenses incurred under this plan were $
Other Comprehensive Income (Loss)
Other comprehensive income (loss) encompasses all changes in equity other than those arising from transactions with stockholders and is comprised solely of foreign currency translation adjustments. Our foreign subsidiaries use their foreign currency as their functional currency. Functional currency assets and liabilities are translated into U.S. Dollars using exchange rates in effect at the balance sheet date, and revenues and expenses are translated at average exchange rates during the period. Resulting translation gains and losses are reported in other comprehensive income (loss), until the substantial liquidation of a subsidiary, at which time accumulated transactions gains or losses are reclassified into net income. During Fiscal 2023, the Company recognized a net gain of $
|
|
Fiscal 2023 |
|
|
Fiscal 2022 |
|
|
Fiscal 2021 |
|
|||
Beginning balance: Accumulated other comprehensive loss (net of tax of $ |
|
$ |
( |
) |
|
$ |
( |
) |
|
$ |
( |
) |
Other comprehensive (loss) income |
|
|
|
|
|
|
|
|
|
|||
Foreign currency translation adjustments (net of tax of $( |
|
|
|
|
|
( |
) |
|
|
( |
) |
|
Reclassification of foreign currency translation gain to income (net of tax of $ |
|
|
( |
) |
|
|
— |
|
|
|
— |
|
Ending balance: Accumulated other comprehensive loss (net of tax of $ |
|
$ |
( |
) |
|
$ |
( |
) |
|
$ |
( |
) |
64
Stock-Based Compensation
Stock-based compensation expense for restricted stock units, comprised of both Deferred Awards and Performance Awards, is determined based on the grant date fair value. The fair value of Deferred Awards and of Performance Awards granted before Fiscal 2023 are based on the closing price of the Company’s common stock on the grant date. For Performance Awards granted in Fiscal 2023 which include market conditions to determine, in part, vesting, the grant date fair value is based on the Monte Carlo simulation model. Performance Awards have, in addition to a service requirement, performance criteria that must be achieved for the awards to be earned. Option Awards provide the recipient with the option to purchase a set number of shares at a stated exercise price over the term of the contract, which is
The Company recognizes stock-based compensation cost net of estimated forfeitures and revises the estimated forfeitures in subsequent periods if actual forfeitures differ from the estimates. The Company estimates the forfeiture rate based on historical data as well as expected future behavior. Stock-based compensation is recorded in Selling and administrative expense in the Consolidated Statements of Operations over the period in which the employee is required to provide service in exchange for the Deferred Awards and Option awards and over the applicable performance period for Performance Awards.
Earnings (Loss) per Share
The numerator for both basic and diluted EPS is net income (loss) attributable to the Company. The denominator for basic EPS is based upon the number of weighted average shares of the Company’s common stock outstanding during the reporting periods. The denominator for diluted EPS is based upon the number of weighted average shares of the Company’s common stock and common stock equivalents outstanding during the reporting periods using the treasury stock method in accordance with ASC 260, Earnings Per Share.
The following table summarizes the components of basic and diluted EPS:
(in thousands) |
|
Fiscal 2023 |
|
|
Fiscal 2022 |
|
|
Fiscal 2021 |
|
|||
Net (loss) income |
|
$ |
( |
) |
|
$ |
( |
) |
|
$ |
|
|
Basic weighted average shares outstanding |
|
|
|
|
|
|
|
|
|
|||
Dilutive impact of stock awards |
|
|
|
|
|
|
|
|
|
|||
Diluted weighted average shares outstanding |
|
$ |
|
|
$ |
|
|
$ |
|
|||
(Loss) earnings per share |
|
|
|
|
|
|
|
|
|
|||
Basic |
|
$ |
( |
) |
|
$ |
( |
) |
|
$ |
|
|
Diluted |
|
$ |
( |
) |
|
$ |
( |
) |
|
$ |
|
|
|
|
|
|
|
|
|
|
|
|
|||
Anti-dilutive shares excluded from diluted earnings (loss) per common share calculation |
|
|
|
|
|
|
|
|
|
|||
Stock awards are considered anti-dilutive based on the application of the treasury stock method or in the event of a net loss.
Repurchases of Common Stock
Shares of the Company’s common stock may be repurchased by the Company through open market transactions. The par value of the shares retired is charged against Common stock and the remaining purchase price is allocated between Additional paid-in capital and (Accumulated deficit) Retained earnings. The portion charged against Additional paid-in capital is determined based on the Additional paid-in capital per share amount recorded in the initial issuance of the shares with the remaining portion charged to (Accumulated deficit) Retained earnings. For transactions in which the purchase price is less than the price at initial issuance, the full amount is charged against Additional
65
paid-in capital. The total cost of the broker commissions is charged directly to (Accumulated deficit) Retained earnings. All shares repurchased under the 2022 Share Repurchase Program have been retired. See Note 6, Stockholders’ Equity.
Recently Adopted Accounting Pronouncements
In March 2020, the FASB issued ASU 2020-04, Reference Rate Reform (Topic 848): Facilitation of the Effects of Reference Rate Reform on Financial Reporting (“ASU 2020-04”) which provides temporary optional guidance to ease the potential burden in accounting for reference rate reform. The guidance provides optional expedients and exceptions for applying generally accepted accounting principles to transactions affected by reference rate reform if certain criteria are met. These transactions include contract modifications, hedge relationships and sale or transfer of debt securities classified as held-to-maturity. This ASU, which was effective upon issuance and modified by ASU 2022-06, Reference Rate Reform (Topic 848): Deferral of Sunset Date of Topic 848, may be applied through December 31, 2024, is applicable to all contracts and hedging relationships that reference the LIBOR or any other reference rate expected to be discontinued. The guidance in ASU 2020-04 may be implemented over time as reference rate reform activities occur.
As part of the response to the reference rate reform, during Second Quarter 2023, the Company amended the ABL Facility and Former Term Loan Facility to replace the interest rate based upon the LIBOR benchmark to the SOFR benchmark. See Note 5, Debt for additional details regarding these changes. Concurrent with the amendments, the Company adopted ASU 2020-04. The Company utilized optional practical expedients for contract modifications under ASC 848-20-358 Contracts within the Scope of Topic 470 and the adoption of ASU 2020-04 did not have a material impact on the Company’s Consolidated Financial Statements.
Recently Issued Accounting Pronouncements Not Yet Adopted
In November 2023, the FASB issued ASU 2023-07, Segment Reporting (Topic 280): Improvements to Reportable Segment Disclosures (“ASU 2023-07”), which requires public entities to disclose information about their reportable segments’ significant expenses and other segment items on an interim and annual basis. Public entities with a single reportable segment are required to apply the disclosure requirements in ASU 2023-07, as well as all existing segment disclosures and reconciliation requirements in ASC 280 on an interim and annual basis. ASU 2023-07 is effective for fiscal years beginning after December 15, 2023, and for interim periods within fiscal years beginning after December 15, 2024. The Company is currently assessing the impact of ASU 2023-07 on the Company’s Consolidated Financial Statement disclosures.
In December 2023, the FASB issued ASU 2023-09, Improvements to Income Tax Disclosures (“ASU 2023-09”), which includes requirements that an entity disclose specific categories in the rate reconciliation and provide additional information for reconciling items that are greater than five percent of the amount computed by multiplying pretax income (or loss) by the applicable statutory income rate. The standard also requires that entities disclose income (or loss) from continuing operations before income tax expense (or benefit) and income tax expense (or benefit) each disaggregated between domestic and foreign. ASU 2023-09 is effective for the annual periods beginning after December 15, 2024. The Company is currently assessing the impact of ASU 2023-09 on the Company’s Consolidated Financial Statement disclosures.
NOTE 3. DEBT
ABL Facility
The Company’s $
66
Base or Loan Cap which is calculated from Eligible Inventory, Trade Receivables and Credit Card Receivables, all foregoing capitalized terms not defined herein are as defined in the ABL Facility.
The following table summarizes the Company’s ABL Facility borrowing availability:
|
|
February 2, 2024 |
|
January 27, 2023 |
|
|||||||||
(in thousands) |
|
Amount |
|
|
Interest Rate |
|
Amount |
|
|
Interest Rate |
|
|||
ABL Facility limit |
|
$ |
|
|
|
|
$ |
|
|
|
|
|||
Borrowing Base |
|
|
|
|
|
|
|
|
|
|
|
|||
|
|
|
|
|
|
|
|
|
|
|
|
|||
Outstanding borrowings |
|
|
— |
|
|
|
|
|
|
|
|
% |
||
Outstanding letters of credit |
|
|
|
|
|
|
|
|
|
|
|
|||
ABL Facility utilization at end of period |
|
|
|
|
|
|
|
|
|
|
|
|||
|
|
|
|
|
|
|
|
|
|
|
|
|||
ABL Facility borrowing availability |
|
$ |
|
|
|
|
$ |
|
|
|
|
|||
Long-Term Debt
On December 29, 2023, the Company entered into the Current Term Loan Facility which provides borrowings of $
As a result of the Former Term Loan Facility repayment before the scheduled maturity date, the transaction was subject to a
The Company’s long-term debt consisted of the following:
|
|
February 2, 2024 |
|
|
January 27, 2023 |
|
||||||||||
(in thousands) |
|
Amount |
|
|
Interest Rate |
|
|
Amount |
|
|
Interest Rate |
|
||||
Former Term Loan Facility |
|
$ |
— |
|
|
|
— |
% |
|
$ |
|
|
|
% |
||
Current Term Loan Facility |
|
$ |
|
|
|
% |
|
|
— |
|
|
|
— |
% |
||
Less: Current portion of long-term debt |
|
|
|
|
|
|
|
|
|
|
|
|
||||
Less: Unamortized debt issuance costs |
|
|
|
|
|
|
|
|
|
|
|
|
||||
Long-term debt, net |
|
$ |
|
|
|
|
|
$ |
|
|
|
|
||||
Interest; Fees
ABL Facility
Effective May 12, 2023, the Company executed the Fourth Amendment (the “Fourth Amendment”) to the ABL Facility which replaced the interest rate benchmark based on LIBOR with an interest rate benchmark based on SOFR plus an adjustment of
Effective with the Fourth Amendment, the ABL Facility interest rate, selected at the borrower’s election, is either (1) ABL Adjusted SOFR, or (2) a base rate which is the greater of (a) the federal funds rate plus
67
Adjusted SOFR loans is (i) less than $95.0 million,
Prior to the Fourth Amendment to the ABL Facility, the interest rate, selected at the borrower’s election, was either (1) LIBOR (plus the Applicable Borrowing Margin), or (2) a base rate (plus the Applicable Borrowing Margin) which was the greater of (a) the federal funds rate plus
The ABL Facility fees include (i) commitment fees of
Current Term Loan Facility
The interest rates per annum applicable to the loans under the Current Term Loan Facility are based on a fluctuating rate of interest equal to, at the Company’s election, either (1) Term Loan Adjusted SOFR loan (subject to a
Customary agency fees are payable annually for the Current Term Loan Facility.
Former Term Loan Facility
Effective June 22, 2023, the Company entered into Amendment No. 1 (the “First Amendment”) to the Former Term Loan Facility which (subject to a
Prior to the First Amendment to the Former Term Loan Facility, the interest rate per annum applicable to the loans under the Former Term Loan Facility was based on a fluctuating rate of interest measured by reference to, at the borrower’s election, either (1) a LIBOR rate (with a minimum rate of
Effective with the First Amendment to the Former Term Loan Facility, the interest rate per annum applicable to the loans under the Former Term Loan Facility was based on a fluctuating rate of interest measured by reference to, at the borrower’s election, either (1) a Term Adjusted Loan SOFR rate plus
68
Customary agency fees were paid annually for the Former Term Loan Facility.
Maturity; Amortization and Prepayments
The ABL Facility maturity date is
The Current Term Loan Facility will mature on
The Company’s aggregate scheduled maturities of the Debt Facilities as of February 2, 2024 are as follows:
Scheduled maturities |
|
|
|
|
|
|
|
|
|
(in thousands) |
|
|
|
|
|
|
|
|
|
2024 |
|
$ |
|
|
2025 |
|
|
|
|
2026 |
|
|
|
|
2027 |
|
|
|
|
2028 |
|
|
|
|
Total |
|
$ |
|
|
Guarantees; Security
All obligations under the Debt Facilities are unconditionally guaranteed by Lands’ End, Inc. and, subject to certain exceptions, each of its existing and future direct and indirect subsidiaries. The ABL Facility is secured by a first priority security interest in certain working capital of the borrowers and guarantors consisting primarily of accounts receivable and inventory. The Current Term Loan Facility is secured by a second priority security interest in the same collateral, with certain exceptions.
The Current Term Loan Facility is secured by a first priority security interest in certain property and assets including certain fixed assets such as real estate, stock of subsidiaries and intellectual property, in each case, subject to certain exceptions. The ABL Facility is secured by a second priority interest in the same collateral, with certain exceptions.
Representations and Warranties; Covenants
Subject to specified exceptions, the Debt Facilities contain various representations and warranties and restrictive covenants that, among other things, restrict Lands’ End, Inc.’s and its subsidiaries’ ability to incur indebtedness (including guarantees), grant liens, make investments, make dividends or distributions with respect to capital stock, make prepayments on other indebtedness, engage in mergers or change the nature of their business.
The Current Term Loan Facility contains financial covenants, including a quarterly maximum total leverage ratio test and a monthly minimum liquidity test.
Under the ABL Facility, if excess availability falls below the greater of
69
The Debt Facilities contain certain affirmative covenants, including reporting requirements such as delivery of financial statements, certificates and notices of certain events, maintaining insurance and providing additional guarantees and collateral in certain circumstances.
As of February 2, 2024, the Company was in compliance with its financial covenants in the Debt Facilities.
Events of Default
The Debt Facilities include customary events of default including non-payment of principal, interest or fees, violation of covenants, inaccuracy of representations or warranties, cross defaults related to certain other material indebtedness, bankruptcy and insolvency events, invalidity or impairment of guarantees or security interests, material judgments and change of control.
NOTE 4. LEASES
The following table summarizes the Company’s components of lease expense, primarily related to Company Operated stores, which is included in Selling and administrative expense in the Consolidated Statements of Operations:
(in thousands) |
|
Fiscal 2023 |
|
|
Fiscal 2022 |
|
|
Fiscal 2021 |
|
|||
Operating lease expense |
|
$ |
|
|
$ |
|
|
$ |
|
|||
Variable lease expense |
|
|
|
|
|
|
|
|
|
|||
Total lease expense |
|
$ |
|
|
$ |
|
|
$ |
|
|||
Short-term lease cost was not material for Fiscal 2023, Fiscal 2022 or Fiscal 2021.
Supplemental balance sheet information related to operating leases are as follows:
(in thousands) |
|
Fiscal 2023 |
|
|
Fiscal 2022 |
|
||
Operating lease right-of-use asset |
|
$ |
|
|
$ |
|
||
Lease liability – current |
|
|
|
|
|
|
||
Lease liability – long-term |
|
|
|
|
|
|
||
Weighted average remaining lease term in years |
|
|
|
|
|
|
||
Weighted average discount rate |
|
|
% |
|
|
% |
||
Supplemental cash flow information related to operating leases are as follows:
(in thousands) |
|
Fiscal 2023 |
|
|
Fiscal 2022 |
|
|
Fiscal 2021 |
|
|||
Operating cash outflows from operating leases |
|
$ |
|
|
$ |
|
|
$ |
|
|||
Operating lease right-of-use-assets (reversal) obtained in exchange for lease liabilities |
|
|
( |
) |
|
|
|
|
|
|
||
Maturities of operating lease liabilities as of February 2, 2024 are as follows:
(in thousands) |
|
|
|
|
2024 |
|
$ |
|
|
2025 |
|
|
|
|
2026 |
|
|
|
|
2027 |
|
|
|
|
2028 |
|
|
|
|
Thereafter |
|
|
|
|
Total operating lease payments |
|
$ |
|
|
Less imputed interest |
|
|
|
|
Present value of lease liabilities |
|
$ |
|
|
70
NOTE 5. STOCK-BASED COMPENSATION
The Company expenses the fair value of all stock awards over the requisite service period, ensuring that the amount of cumulative stock-based compensation expense recognized at any date is at least equal to the portion of the grant-date fair value of the award that is vested at that date. The Company has elected to adjust stock-based compensation expense for an estimated forfeiture rate for those shares not expected to vest and to recognize stock-based compensation expense on a straight-line basis for awards that only have a service requirement with multiple vest dates.
The Company has granted the following types of stock awards to employees at management levels and above, each of which are granted under the Company’s stockholder approved stock plans, other than inducement grants outside of the Company’s stockholder approved stock plans in accordance with Nasdaq Listing Rule 5635(c)(4):
71
The following table provides a summary of the Company’s stock-based compensation expense, which is included in Selling and administrative expense in the Consolidated Statements of Operations:
(in thousands) |
|
Fiscal 2023 |
|
|
Fiscal 2022 |
|
|
Fiscal 2021 |
|
|||
Deferred awards |
|
$ |
|
|
$ |
|
|
$ |
|
|||
Performance awards (1) |
|
|
( |
) |
|
|
( |
) |
|
|
|
|
Option awards |
|
|
|
|
|
|
|
|
|
|||
Total stock-based compensation expense |
|
$ |
|
|
$ |
|
|
$ |
|
|||
Deferred Awards
The following table provides a summary of the Deferred Awards activity for Fiscal 2023, Fiscal 2022 and Fiscal 2021.
|
|
Fiscal Year Ended |
|
|||||||||||||||||||||
|
|
February 2, 2024 |
|
|
January 27, 2023 |
|
|
January 28, 2022 |
|
|||||||||||||||
(in thousands, except per share amounts) |
|
Number |
|
|
Weighted |
|
|
Number |
|
|
Weighted |
|
|
Number |
|
|
Weighted |
|
||||||
Deferred Awards at beginning |
|
|
|
|
$ |
|
|
|
|
|
$ |
|
|
|
|
|
$ |
|
||||||
Granted |
|
|
|
|
|
|
|
|
|
|
|
|
|
|
|
|
|
|
||||||
Vested |
|
|
( |
) |
|
|
|
|
|
( |
) |
|
|
|
|
|
( |
) |
|
|
|
|||
Forfeited |
|
|
( |
) |
|
|
|
|
|
( |
) |
|
|
|
|
|
( |
) |
|
|
|
|||
Deferred Awards at end |
|
|
|
|
$ |
|
|
|
|
|
$ |
|
|
|
|
|
$ |
|
||||||
Total unrecognized stock-based compensation expense related to unvested Deferred Awards was approximately $
Performance Awards
The following table provides a summary of the Performance Awards activity for Fiscal 2023, Fiscal 2022 and Fiscal 2021:
|
|
Fiscal Year Ended |
|
|||||||||||||||||||||
|
|
February 2, 2024 |
|
|
January 27, 2023 |
|
|
January 28, 2022 |
|
|||||||||||||||
(in thousands, except per share amounts) |
|
Number |
|
|
Weighted |
|
|
Number |
|
|
Weighted |
|
|
Number |
|
|
Weighted |
|
||||||
Performance Awards at |
|
|
|
|
$ |
|
|
|
|
|
$ |
|
|
|
|
|
$ |
|
||||||
Granted |
|
|
|
|
|
|
|
|
|
|
|
|
|
|
|
|
|
|
||||||
Change in estimate - performance |
|
|
|
|
|
|
|
|
|
|
|
|
|
|
|
|
|
|
||||||
Vested |
|
|
— |
|
|
|
— |
|
|
|
( |
) |
|
|
|
|
|
( |
) |
|
|
|
||
Forfeited |
|
|
( |
) |
|
|
|
|
|
( |
) |
|
|
|
|
|
— |
|
|
|
— |
|
||
Performance Awards at |
|
|
|
|
$ |
|
|
|
|
|
$ |
|
|
|
|
|
$ |
|
||||||
72
Total unrecognized stock-based compensation expense related to unvested Performance Awards was approximately $
Monte Carlo Simulation Assumptions |
|
|
|
|
|
|
Risk-free interest rate (1) |
|
|
|
|
% |
|
Expected dividend yield |
|
|
|
|
% |
|
Expected volatility (2) |
|
|
|
|
% |
|
Expected term (in years) (3) |
|
|
|
|
|
|
Grant date fair value per share |
|
|
|
$ |
|
|
Options Awards
The following table provides a summary of the changes in outstanding Options Awards for Fiscal 2023 and Fiscal 2022.
|
|
Fiscal Year Ended |
|
|||||||||||||
|
|
February 2, 2024 |
|
|
January 27, 2023 |
|
||||||||||
|
|
Option Awards |
|
|
Weighted |
|
|
Option Awards |
|
|
Weighted |
|
||||
(in thousands, except per share amounts) |
|
|
|
|
|
|
|
|
|
|
|
|
||||
Option Awards outstanding at beginning of year |
|
|
|
|
$ |
|
|
|
|
|
$ |
|
||||
Granted |
|
|
|
|
|
|
|
|
|
|
|
|
||||
Vested |
|
|
|
|
|
|
|
|
— |
|
|
|
— |
|
||
Exercised |
|
|
|
|
|
|
|
|
— |
|
|
|
— |
|
||
Forfeited |
|
|
|
|
|
|
|
|
— |
|
|
|
— |
|
||
Option Awards outstanding at end of year |
|
|
|
|
$ |
|
|
|
|
|
$ |
|
||||
The following table provides a summary of information about the Option Awards vested and expected to vest during the contractual term, as well as Option Awards exercisable as of February 2, 2024:
|
|
Option Awards |
|
|
Weighted |
|
|
Weighted |
|
|
Aggregate Intrinsic Value |
|
||||
(in thousands, except per share and contractual life amounts) |
|
|
|
|
|
|
|
|
|
|
|
|
||||
Option Awards vested and expected to vest |
|
|
|
|
|
|
|
$ |
|
|
|
— |
|
|||
Option Awards exercisable |
|
|
|
|
|
|
|
$ |
|
|
|
— |
|
|||
Total unrecognized stock-based compensation expense related to Option Awards was approximately $
The grant date fair value of the Option Award granted during Fiscal 2022 was estimated at the grant date using the Black Scholes option pricing model with the following assumptions:
73
Risk-free interest rate (1) |
|
|
|
|
|
|
|
|
% |
|
Expected dividend yield |
|
|
|
|
|
|
|
|
% |
|
Expected volatility (2) |
|
|
|
|
|
|
|
|
% |
|
Expected term (in years) (3) |
|
|
|
|
|
|
|
|
|
|
Grant date fair value per share |
|
|
|
|
|
|
|
$ |
|
NOTE 6. STOCKHOLDERS’ EQUITY
Share Repurchase Program
On June 28, 2022, the Company announced that its Board of Directors authorized the Company to repurchase up to $
The following table summarizes the Company’s share repurchases during Fiscal 2023 and Fiscal 2022:
(Shares and $ in thousands except average per share cost) |
|
February 2, 2024 |
|
|
January 27, 2023 |
|
||
Number of shares repurchased |
|
|
|
|
|
|
||
Total cost |
|
$ |
|
|
$ |
|
||
Average per share cost |
|
$ |
|
|
$ |
|
||
The Company retired all shares that were repurchased through the 2022 Share Repurchase Program through February 2, 2024. In accordance with the FASB ASC 505—Equity, the par value of the shares retired was charged against Common stock and the remaining purchase price was allocated between Additional paid-in capital and (Accumulated deficit) Retained earnings. The portion charged against Additional paid-in capital is determined based on the Additional paid-in capital per share amount recorded in the initial issuance of the shares with the remaining to (Accumulated deficit) Retained earnings. Shares purchased at a price less than that of initial issuance is charged only against Additional paid-in capital. For all shares retired during Fiscal 2023 and Fiscal 2022,
On March 15, 2024, the Company announced that its Board of Directors authorized the Company to repurchase up to $
74
NOTE 7. ACCRUED EXPENSES AND OTHER CURRENT LIABILITIES
Accrued expenses and other current liabilities consisted of the following:
(in thousands) |
|
February 2, |
|
|
January 27, |
|
||
Deferred gift card revenue |
|
$ |
|
|
$ |
|
||
Accrued employee compensation and benefits |
|
|
|
|
|
|
||
Reserve for sales returns and allowances |
|
|
|
|
|
|
||
Accrued property, sales and other taxes |
|
|
|
|
|
|
||
Deferred revenue |
|
|
|
|
|
|
||
Accrued interest |
|
|
|
|
|
|
||
Other |
|
|
|
|
|
|
||
Total Accrued expenses and other current liabilities |
|
$ |
|
|
$ |
|
||
NOTE 8. LANDS’ END JAPAN CLOSURE
In July 2022, the Board of Directors approved a plan to cease operations of Lands’ End Japan KK, a subsidiary of Lands’ End, Inc. (“Lands’ End Japan”) by the end of Fiscal 2022. Lands’ End Japan comprises the Japan eCommerce operating segment. For a discussion of this operating segment, see Note 13, Segment Reporting. The closing and subsequent disposal of the assets does not represent a strategic shift with a major effect on the consolidated financial condition. Accordingly, the closing of Lands’ End Japan was not presented in the Consolidated Financial Statements as discontinued operations.
In August 2022, the Company notified all employees of the closure and commenced closing activities. Liquidation sales commenced in the month of September 2022 through the end of Fiscal 2022. The dissolution of Lands’ End Japan was authorized and approved on January 31, 2023. The Company recorded closing costs for employee severance and benefit costs, early termination and restoration costs of lease facilities and contract cancellation and other costs. The final liquidation occurred in First Quarter 2024.
The following table summarizes the closing costs of Lands’ End Japan recognized in Other operating expense, net in the Consolidated Statement of Operations for Fiscal 2023 and Fiscal 2022.
(in thousands) |
|
February 2, 2024 |
|
|
January 27, 2023 |
|
||
Employee severance and benefit costs (1) |
|
$ |
|
|
$ |
|
||
Early termination and restoration costs of leased facilities |
|
|
( |
) |
|
|
|
|
Contract cancellation and other costs |
|
|
|
|
|
|
||
Total closing costs |
|
$ |
|
|
$ |
|
||
75
The following table summarizes the accrued closing cost activity related to Lands’ End Japan included in Accrued expenses and other current liabilities in the Consolidated Balance Sheets:
(in thousands) |
|
Employee Severance and Benefit Costs |
|
|
Leased Facilities Costs |
|
|
Other Closing Costs |
|
|
Total |
|
||||
Balance as of January 28, 2022 |
|
$ |
— |
|
|
$ |
— |
|
|
$ |
— |
|
|
$ |
— |
|
Estimated costs payable in cash |
|
|
|
|
|
|
|
|
|
|
|
|
||||
Cash payments |
|
|
( |
) |
|
|
( |
) |
|
|
( |
) |
|
|
( |
) |
Foreign currency translation |
|
|
|
|
|
|
|
|
|
|
|
|
||||
Balance as of January 27, 2023 |
|
$ |
|
|
$ |
|
|
$ |
|
|
$ |
|
||||
Estimated costs payable in cash |
|
|
|
|
|
( |
) |
|
|
|
|
|
|
|||
Cash payments |
|
|
( |
) |
|
|
( |
) |
|
|
( |
) |
|
|
( |
) |
Foreign currency translation |
|
|
( |
) |
|
|
( |
) |
|
|
( |
) |
|
|
( |
) |
Balance as of February 2, 2024 |
|
$ |
|
|
$ |
— |
|
|
$ |
|
|
$ |
|
|||
NOTE 9. FAIR VALUE MEASUREMENTS OF FINANCIAL ASSETS AND LIABILITIES
Cash and cash equivalents and restricted cash is reflected on the Consolidated Balance Sheets at fair value based on Level 1 inputs. Cash and cash equivalents and restricted cash amounts are valued based upon statements received from financial institutions. The fair value of restricted cash was $
Carrying amounts and fair values of long-term debt, including current portion, in the Consolidated Balance Sheets are as follows:
|
|
February 2, 2024 |
|
|
January 27, 2023 |
|
||||||||||
(in thousands) |
|
Carrying |
|
|
Fair |
|
|
Carrying |
|
|
Fair |
|
||||
Long-term debt, including current portion |
|
$ |
|
|
$ |
|
|
$ |
|
|
$ |
|
||||
The Company’s valuation of long-term debt, including current portion, at fair value is considered a Level 3 instrument under the fair value hierarchy. The Company’s valuation techniques include the Black-Derman-Toy (“BDT”) model as well as market inputs from management. The BDT modeling approach is particularly relevant given the Current Term Loan Facility’s features, including the optional redemption provision. There were
76
NOTE 10. GOODWILL AND INDEFINITE-LIVED INTANGIBLE ASSET
The Company’s intangible assets, consisting of a goodwill and trade name, were originally valued in connection with a business combination accounted for under the purchase accounting method. Goodwill represents the excess of the purchase price over the fair value of the net assets acquired.
The following table summarizes the activity of the Company’s Goodwill:
(in thousands) |
|
Goodwill |
|
|
Balance January 28, 2022 |
|
|
|
|
Gross amount |
|
$ |
|
|
Accumulated impairment losses |
|
|
( |
) |
Carrying Value |
|
|
|
|
Impairment loss booked in Fiscal 2022 |
|
|
|
|
Balance January 27, 2023 |
|
|
|
|
Gross amount |
|
|
|
|
Accumulated impairment losses |
|
|
( |
) |
Carrying Value |
|
|
|
|
Impairment loss booked in Fiscal 2023 |
|
|
|
|
Balance February 2, 2024 |
|
|
|
|
Gross amount |
|
|
|
|
Accumulated impairment losses |
|
|
( |
) |
Carrying Value |
|
$ |
|
|
The carrying value of Intangible asset, net was $
ASC 350, Intangibles - Goodwill and Other, requires companies to test goodwill and indefinite-lived intangible assets for impairment annually, or more often if an event or circumstance indicates that the carrying amount may not be recoverable. In connection with the preparation of the financial statements included in the Company’s Third Quarter 2023 Form 10-Q, the Company considered the decline in the Company’s stock price and market capitalization, as well as current market and macroeconomic conditions, to be a triggering event for the U.S. eCommerce and Outfitters reporting units and therefore completed a test for impairment of goodwill for these reporting units as of October 27, 2023. The Company tested goodwill for impairment using a one-step quantitative test. The quantitative test compares the reporting unit’s fair value to its carrying value. An impairment is recorded for any excess carrying value above the reporting unit’s fair value, not to exceed the amount of goodwill. The Company estimates fair value of its reporting units using a discounted cash flow model, commonly referred to as the income approach. The income approach uses a reporting unit’s projection of estimated operating results and cash flows that is discounted using a weighted-average cost of capital that reflects current market conditions appropriate to the Company’s reporting unit. The discounted cash flow model uses management’s best estimates of economic and market conditions over the projected period using the best information available, including growth rates in revenues, costs and estimates of future expected changes in operating margins and cash expenditures. Other significant estimates and assumptions include terminal value growth rates, weighted average cost of capital and changes in future working capital requirements.
The impairment test resulted in full impairment of $
In connection with the preparation of the financial statements in the Company’s Third Quarter 2023 Form 10-Q, the Company considered the decline in the Company’s stock price and market capitalization, as well as current market and macroeconomic conditions, to be a triggering event for the Lands’ End trade name. The fair value of the trade name indefinite-lived intangible asset was estimated using the relief from royalty method and the testing resulted in
There was
77
NOTE 11. INCOME TAXES
The Company’s income (loss) before income taxes in the United States and in foreign jurisdictions is as follows:
(in thousands) |
|
Fiscal 2023 |
|
|
Fiscal 2022 |
|
|
Fiscal 2021 |
|
|||
(Loss) income before income taxes |
|
|
|
|
|
|
|
|
|
|||
United States |
|
$ |
( |
) |
|
$ |
|
|
$ |
|
||
Foreign |
|
|
( |
) |
|
|
( |
) |
|
|
( |
) |
Total (loss) income before income taxes |
|
$ |
( |
) |
|
$ |
( |
) |
|
$ |
|
|
Certain foreign operations are branches of Lands’ End and are subject to U.S. as well as foreign income tax. The pretax income (loss) by location and the analysis of the income tax provision by taxing jurisdiction are not directly related.
The components of the provision for (benefit from) income taxes are as follows:
(in thousands) |
|
Fiscal 2023 |
|
|
Fiscal 2022 |
|
|
Fiscal 2021 |
|
|||
United States |
|
$ |
( |
) |
|
$ |
( |
) |
|
$ |
|
|
Foreign |
|
|
|
|
|
|
|
|
|
|||
Total (benefit) provision |
|
$ |
( |
) |
|
$ |
( |
) |
|
$ |
|
|
(in thousands) |
|
Fiscal 2023 |
|
|
Fiscal 2022 |
|
|
Fiscal 2021 |
|
|||
Current: |
|
|
|
|
|
|
|
|
|
|||
Federal |
|
$ |
( |
) |
|
$ |
( |
) |
|
$ |
|
|
State |
|
|
( |
) |
|
|
( |
) |
|
|
|
|
Foreign |
|
|
|
|
|
|
|
|
|
|||
Total current |
|
|
( |
) |
|
|
( |
) |
|
|
|
|
Deferred: |
|
|
|
|
|
|
|
|
|
|||
Federal |
|
|
( |
) |
|
|
|
|
|
( |
) |
|
State |
|
|
|
|
|
|
|
|
|
|||
Foreign |
|
|
|
|
|
( |
) |
|
|
|
||
Total deferred |
|
|
|
|
|
|
|
|
( |
) |
||
Total (benefit) provision |
|
$ |
( |
) |
|
$ |
( |
) |
|
$ |
|
|
A reconciliation of the statutory federal income tax rate to the effective income tax rate is as follows:
|
|
Fiscal 2023 |
|
|
Fiscal 2022 |
|
|
Fiscal 2021 |
|
|||
Tax at statutory federal tax rate |
|
|
% |
|
|
% |
|
|
% |
|||
State income taxes, net of federal tax benefit |
|
|
( |
)% |
|
|
% |
|
|
% |
||
Foreign differential |
|
|
% |
|
|
% |
|
|
( |
)% |
||
Permanent differences |
|
|
( |
)% |
|
|
( |
)% |
|
|
% |
|
Uncertain tax benefits |
|
|
% |
|
|
% |
|
|
% |
|||
Change in foreign valuation allowance |
|
|
( |
)% |
|
|
( |
)% |
|
|
% |
|
Goodwill impairment |
|
|
( |
)% |
|
|
% |
|
|
% |
||
Other, net |
|
|
( |
)% |
|
|
% |
|
|
( |
)% |
|
Total |
|
|
% |
|
|
% |
|
|
% |
|||
78
Deferred tax assets and liabilities consisted of the following:
(in thousands) |
|
February 2, |
|
|
January 27, |
|
|
January 28, |
|
|||
Deferred tax assets |
|
|
|
|
|
|
|
|
|
|||
Deferred revenue |
|
$ |
|
|
$ |
|
|
$ |
|
|||
Legal accruals |
|
|
|
|
|
|
|
|
|
|||
Deferred compensation |
|
|
|
|
|
|
|
|
|
|||
Deferred interest |
|
|
|
|
|
|
|
|
|
|||
Reserve for returns |
|
|
|
|
|
|
|
|
|
|||
Inventory |
|
|
|
|
|
|
|
|
|
|||
CTA investment in foreign subsidiaries |
|
|
|
|
|
|
|
|
|
|||
Operating lease liabilities |
|
|
|
|
|
|
|
|
|
|||
Other |
|
|
|
|
|
|
|
|
|
|||
Net operating loss carryforward |
|
|
|
|
|
|
|
|
|
|||
Total deferred tax assets |
|
|
|
|
|
|
|
|
|
|||
Less valuation allowance |
|
|
( |
) |
|
|
( |
) |
|
|
( |
) |
Net deferred tax assets |
|
$ |
|
|
$ |
|
|
$ |
|
|||
|
|
|
|
|
|
|
|
|
|
|||
Deferred tax liabilities |
|
|
|
|
|
|
|
|
|
|||
Intangible assets |
|
$ |
|
|
$ |
|
|
$ |
|
|||
LIFO reserve |
|
|
|
|
|
|
|
|
|
|||
Property and equipment |
|
|
|
|
|
|
|
|
|
|||
Operating lease right-of-use assets |
|
|
|
|
|
|
|
|
|
|||
Catalog advertising |
|
|
|
|
|
|
|
|
|
|||
Total deferred tax liabilities |
|
|
|
|
|
|
|
|
|
|||
Net deferred tax liability |
|
$ |
|
|
$ |
|
|
$ |
|
|||
As of February 2, 2024, the Company had $
A reconciliation of the beginning and ending gross amount of unrecognized tax benefits (“UTBs”) is as follows:
|
|
Fiscal 2023 |
|
|
Fiscal 2022 |
|
|
Fiscal 2021 |
|
|||
Gross UTBs balance at beginning of period |
|
$ |
|
|
$ |
|
|
$ |
|
|||
Tax positions related to the prior periods - gross |
|
|
( |
) |
|
|
( |
) |
|
|
|
|
Settlements |
|
|
|
|
|
|
|
|
( |
) |
||
Gross UTBs balance at end of period |
|
$ |
|
|
$ |
|
|
$ |
|
|||
As of February 2, 2024, the Company had gross UTBs of $
The Company classifies interest expense and penalties related to UTBs and interest income on tax overpayments as components of income tax expense. As of February 2, 2024, the total amount of interest expense and penalties recognized on the balance sheet was $
79
benefit). The total amount of net interest expense recognized in the Consolidated Statements of Operations was insignificant for all periods presented. The Company files income tax returns in both the United States and various foreign jurisdictions.
NOTE 12. COMMITMENTS AND CONTINGENCIES
Legal Proceedings
The Company is party to various claims, legal proceedings and investigations arising in the ordinary course of business. Some of these actions involve complex factual and legal issues and are subject to uncertainties. At this time, the Company is not able to either predict the outcome of these legal proceedings or reasonably estimate a potential range of loss with respect to the proceedings. While it is not feasible to predict the outcome of such pending claims, proceedings and investigations with certainty, management is of the opinion that their ultimate resolution should not have a material adverse effect on results of operations, cash flows or financial position taken as a whole.
NOTE 13. SEGMENT REPORTING
During Fiscal 2023, the Company’s operating segments consisted of: U.S. eCommerce, Europe eCommerce, Outfitters, Third Party and Retail. During Fiscal 2022, the Company’s operating segments included Japan eCommerce. See Note 8, Lands’ End Japan Closure.
The Company determined that each of the operating segments have similar economic and other qualitative characteristics, thus the results of the operating segments are aggregated into
Landsʼ End identifies
Net revenue is presented by distribution channel in the following tables:
(in thousands) |
|
Fiscal 2023 |
|
% of Net Revenue |
|
Fiscal 2022 |
|
% of Net Revenue |
|
Fiscal 2021 |
|
% of Net Revenue |
|||
U.S. eCommerce |
|
$ |
|
|
$ |
|
|
$ |
|
||||||
International (1) |
|
|
|
|
|
|
|
|
|
||||||
Outfitters |
|
|
|
|
|
|
|
|
|
||||||
Third Party |
|
|
|
|
|
|
|
|
|
||||||
Retail |
|
|
|
|
|
|
|
|
|
||||||
Total Net revenue |
|
$ |
|
|
|
$ |
|
|
|
$ |
|
|
|||
80
The geographical allocation of Net revenue is based upon where the product is shipped. The following presents summarized geographical information:
(in thousands) |
|
Fiscal 2023 |
|
% of Net Revenue |
|
Fiscal 2022 |
|
% of Net Revenue |
|
Fiscal 2021 |
|
% of Net Revenue |
|||
United States |
|
$ |
|
|
$ |
|
|
$ |
|
||||||
Europe |
|
|
|
|
|
|
|
|
|
||||||
Asia (1) |
|
|
|
|
|
|
|
|
|
||||||
Other |
|
|
|
|
|
|
|
|
|
||||||
Total Net revenue |
|
$ |
|
|
|
$ |
|
|
|
$ |
|
|
|||
Other than the United States and Europe,
Property and equipment, net by geographical location are as follows:
(in thousands) |
|
Fiscal 2023 |
|
|
Fiscal 2022 |
|
|
Fiscal 2021 |
|
|||
United States |
|
$ |
|
|
$ |
|
|
$ |
|
|||
Europe |
|
|
|
|
|
|
|
|
|
|||
Asia |
|
|
|
|
|
|
|
|
|
|||
Total long-lived assets |
|
$ |
|
|
$ |
|
|
$ |
|
|||
Other than the United States,
81
ITEM 9. CHANGES IN AND DISAGREEMENTS WITH ACCOUNTANTS ON ACCOUNTING AND FINANCIAL DISCLOSURE
None.
ITEM 9A. CONTROLS AND PROCEDURES
Evaluation of Disclosure Controls and Procedures
We have established disclosure controls and procedures to ensure that the information required to be disclosed by the Company in the reports that it files or submits under the Securities Exchange Act of 1934 is recorded, processed, summarized and reported within the time periods specified in the rules and forms of the Securities and Exchange Commission and that such information is accumulated and communicated to the officers who certify the Company’s financial reports and to other members of senior management and the Board of Directors as appropriate to allow timely decisions regarding required disclosure.
Based on their evaluation, the Chief Executive Officer and the Chief Financial Officer have concluded that our disclosure controls and procedures (as defined in Rule 13a-15(e) and 15-d-15(e) under the Securities Exchange Act of 1934, as amended) are effective as of February 2, 2024.
Management’s Annual Report on Internal Control over Financial Reporting
Our management is responsible for establishing and maintaining adequate internal control over financial reporting, as defined in Rule 13a-15(f) under the Securities Exchange Act of 1934. Our internal control over financial reporting is a process designed under the supervision of the Chief Executive Officer and the Chief Financial Officer to provide reasonable assurance regarding the reliability of our financial reporting and the preparation of financial statements for external purposes in accordance with generally accepted accounting principles. Because of its inherent limitations, internal control over financial reporting is not intended to provide absolute assurance that a misstatement of our financial statements would be prevented or detected on a timely basis.
Management, including our Chief Executive Officer and our Chief Financial Officer conducted an evaluation of the design and effectiveness of our internal control over financial reporting based on the criteria set forth in Internal Control-Integrated Framework (2013) issued by the Committee of Sponsoring Organizations of the Treadway Commission. Based on this evaluation our management concluded that our internal control over financial reporting was effective as of February 2, 2024.
Item 9A includes the audit report of BDO USA, P.C. on the Company’s internal control over financial reporting as of February 2, 2024.
Changes in Internal Control over Financial Reporting
Regulations under the Exchange Act require public companies including our Company, to evaluate any change in our “internal control over financial reporting” as such term is defined in Rule 13a-15(f) and Rule 15d-15(f) of the Exchange Act. There have not been any changes in our internal control over financial reporting that occurred during the fourth fiscal quarter ended February 2, 2024 that have materially impacted, or are reasonably likely to materially affect, our internal control over financial reporting.
82
REPORT OF INDEPENDENT REGISTERED PUBLIC ACCOUNTING FIRM
Shareholders and Board of Directors
Lands’ End, Inc.
Dodgeville, Wisconsin
Opinion on Internal Control over Financial Reporting
We have audited Lands’ End, Inc.’s (the “Company’s”) internal control over financial reporting as of February 2, 2024, based on criteria established in Internal Control – Integrated Framework (2013) issued by the Committee of Sponsoring Organizations of the Treadway Commission (the “COSO criteria”). In our opinion, the Company maintained, in all material respects, effective internal control over financial reporting as of February 2, 2024, based on the COSO criteria.
We also have audited, in accordance with the standards of the Public Company Accounting Oversight Board (United States) (“PCAOB”), the consolidated balance sheets as of February 2, 2024 and January 27, 2023, the related consolidated statements of operations, comprehensive operations, changes in stockholders’ equity, and cash flows for each of the years then ended, and the related notes, and our report dated April 3, 2024 expressed an unqualified opinion thereon.
Basis for Opinion
The Company’s management is responsible for maintaining effective internal control over financial reporting and for its assessment of the effectiveness of internal control over financial reporting, included in the accompanying Item 9A, Controls and Procedures. Our responsibility is to express an opinion on the Company’s internal control over financial reporting based on our audit. We are a public accounting firm registered with the PCAOB and are required to be independent with respect to the Company in accordance with U.S. federal securities laws and the applicable rules and regulations of the Securities and Exchange Commission and the PCAOB.
We conducted our audit of internal control over financial reporting in accordance with the standards of the PCAOB. Those standards require that we plan and perform the audit to obtain reasonable assurance about whether effective internal control over financial reporting was maintained in all material respects. Our audit included obtaining an understanding of internal control over financial reporting, assessing the risk that a material weakness exists, and testing and evaluating the design and operating effectiveness of internal control based on the assessed risk. Our audit also included performing such other procedures as we considered necessary in the circumstances. We believe that our audit provides a reasonable basis for our opinion.
Definition and Limitations of Internal Control over Financial Reporting
A company’s internal control over financial reporting is a process designed to provide reasonable assurance regarding the reliability of financial reporting and the preparation of financial statements for external purposes in accordance with generally accepted accounting principles. A company’s internal control over financial reporting includes those policies and procedures that (1) pertain to the maintenance of records that, in reasonable detail, accurately and fairly reflect the transactions and dispositions of the assets of the company; (2) provide reasonable assurance that transactions are recorded as necessary to permit preparation of financial statements in accordance with generally accepted accounting principles, and that receipts and expenditures of the company are being made only in accordance with authorizations of management and directors of the company; and (3) provide reasonable assurance regarding prevention or timely detection of unauthorized acquisition, use, or disposition of the company’s assets that could have a material effect on the financial statements.
83
Because of its inherent limitations, internal control over financial reporting may not prevent or detect misstatements. Also, projections of any evaluation of effectiveness to future periods are subject to the risk that controls may become inadequate because of changes in conditions, or that the degree of compliance with the policies or procedures may deteriorate.
/s/ BDO USA, P.C.
Madison, Wisconsin
April 3, 2024
ITEM 9B. OTHER INFORMATION
During the fiscal quarter ended February 2, 2024, none of the Company’s
ITEM 9C. DISCLOSURE REGARDING FOREIGN JURISDICTIONS THAT PREVENT INSPECTIONS
Not applicable.
84
PART III
ITEM 10. DIRECTORS, EXECUTIVE OFFICERS AND CORPORATE GOVERNANCE
Information required by Item 10 with respect to directors, the audit committee, audit committee financial experts and Section 16(a) beneficial ownership reporting compliance is included under the headings “Item 1. Election of Directors - Committees of the Board,” “Corporate Governance - Director Independence” and in the biographies of the directors contained in “Item 1. Election of Directors,” in our definitive proxy statement for our annual meeting of stockholders to be held on May 9, 2024 (the “2024 Proxy Statement”) which are incorporated herein by reference. With regard to the information required by this item regarding compliance with Section 16(a) of the Exchange Act, we will provide disclosure of delinquent Section 16(a) reports, if any, in our 2024 Proxy Statement under the heading “Other Information - Delinquent Section 16(a) Reports”, and such disclosure, if any, is incorporated herein by reference. The 2024 Proxy Statement will be filed within 120 days after the end of our fiscal year.
The information required by this Item 10 regarding the Company’s executive officers is set forth under the heading “Information about our Executive Officers” in Part I of this Form 10-K and is incorporated herein by reference.
Lands’ End has adopted a Code of Conduct, which applies to all employees, including our principal executive officer, principal financial officer and principal accounting officer, and a Code of Conduct for its Board of Directors. Directors who are also officers of Lands’ End are subject to both codes of conduct. Each code of conduct is a code of ethics as defined in Item 406 of SEC Regulation S-K. The codes of conduct are available on the Corporate Governance section under Investor Relations on our website at www.landsend.com. Any amendment to, or waiver from, a provision of either code of conduct will be posted to the above-referenced website.
There were no changes to the process by which stockholders may recommend nominees to the Board of Directors during the last year.
85
ITEM 11. EXECUTIVE COMPENSATION
The information required by this item is set forth in our 2024 Proxy Statement under Item 1. Election of Directors (i) under the heading “Compensation of Directors,” and (ii) under the heading “Executive Compensation,” under the subheadings “Compensation Discussion and Analysis,” “Compensation Committee Report,” and “Compensation Committee Interlocks and Insider Participation,” “Summary Compensation Table,” “Grants of Plan-Based Awards,” “Outstanding Equity Awards at 2023 Fiscal Year End,” “Option Exercises and Stock Vested,” “Employment Arrangements,” “Potential Payments upon Termination of Employment,” and “Chief Executive Officer Pay Ratio” and is incorporated herein by reference. The material incorporated herein by reference to the information set forth under the heading “Executive Compensation - Compensation Committee Report” of the 2024 Proxy Statement shall be deemed furnished, and not filed, in this Annual Report on Form 10-K and shall not be deemed incorporated by reference in any filing under the Securities Act of 1933, as amended, or the Securities Exchange Act of 1934, as amended, as a result of this furnishing except to the extent that it is specifically incorporated by reference by the Company.
86
ITEM 12. SECURITY OWNERSHIP OF CERTAIN BENEFICIAL OWNERS AND MANAGEMENT AND RELATED STOCKHOLDER MATTERS
Information regarding security ownership of certain beneficial owners and management is incorporated herein by reference to the material under the heading “Item 1. Election of Directors - Beneficial Ownership of the Company’s Common Stock” of the 2024 Proxy Statement.
Equity Compensation Plan Information
The following table sets forth certain information regarding the Company’s equity compensation plans as of February 2, 2024:
|
|
Number of securities to be issued upon exercise of outstanding options, warrants and rights (in thousands) |
|
|
Weighted-average exercise price of outstanding options, warrants and rights* |
|
|
Number of securities remaining available for future issuance under equity compensation plans (excluding securities reflected in column (a))** (in thousands) |
|
|||
Plan Category |
|
(a) |
|
|
(b) |
|
|
(c) |
|
|||
Equity compensation plans approved by |
|
|
1,528 |
|
|
|
22.00 |
|
|
|
2,447 |
|
Equity compensation plans not approved |
|
|
549 |
|
|
|
15.45 |
|
|
|
— |
|
Total |
|
|
2,077 |
|
|
|
16.08 |
|
|
|
2,447 |
|
* The weighted-average exercise price does not take into account the shares issuable upon vesting of outstanding awards of RSUs, which have no exercise price.
** Represents shares of common stock that may be issued pursuant to the Lands’ End, Inc. Amended and Restated 2017 Stock Plan (the “2017 Stock Plan”). Awards under the 2017 Stock Plan may be restricted stock, stock unit awards, incentive stock options, nonqualified stock options, stock appreciation rights, or certain other stock-based awards.
*** In connection with commencing employment, our current CEO was granted options on November 1, 2022 to purchase 168,081 shares of the Company’s common stock of which 126,061 shares were unvested as of February 2, 2024, and 115,633 restricted stock units of which 86,725 restricted stock units were unvested as of February 2, 2024. Our former CEO was granted options on March 6, 2017 to purchase 294,118 shares of the Company’s common stock all of which were outstanding and exercisable as of February 2, 2024. These awards were made as inducement grants outside of our stockholder approved stock plans in accordance with Nasdaq Listing Rule 5635(c)(4).
87
Information regarding certain relationships and related transactions and director independence is incorporated herein by reference to the material under the headings “Certain Relationships and Transactions” and “Corporate Governance” of the 2024 Proxy Statement.
88
ITEM 14. PRINCIPAL ACCOUNTING FEES AND SERVICES
Information regarding principal accountant fees and services is incorporated herein by reference to the material under the heading “Item 4. Ratification of Appointment of Independent Registered Public Accounting Firm - Independent Registered Public Accounting Firm Fees” of the 2024 Proxy Statement.
89
PART IV
ITEM 15. EXHIBIT AND FINANCIAL STATEMENT SCHEDULES
The following information required under this item is filed as part of this report:
See the listing of Financial Statements included as a part of this Form 10-K in Item 8 of Part II on page 46 of this report.
All financial statement schedules have been omitted, since the required information is not applicable or is not present in amounts sufficient to require submission of the schedule, or because the information required is included in the Consolidated Financial Statements and accompanying notes included in this Form 10-K.
The following documents are filed (or furnished, where indicated) as exhibits hereto:
Exhibit Number |
|
Exhibit Description |
|
|
|
|
Separation and Distribution Agreement, dated as of April 4, 2014, by and between Sears Holdings Corporation and Lands’ End, Inc. (incorporated by reference to Exhibit 2.1 to the Company’s Current Report on Form 8-K filed on April 8, 2014 (File No. 001-09769)). |
|
|
|
|
|
Amended and Restated Certificate of Incorporation of Lands’ End, Inc. (incorporated by reference to Exhibit 3.1 of the Annual Report on Form 10-K filed by Lands’ End, Inc. on March 24, 2022 (File No. 001-09769)) |
|
|
|
|
|
Amended and Restated Bylaws of Lands’ End, Inc. (incorporated by reference to Exhibit 3.1 to the Company’s Current Report on Form 8-K filed on April 8, 2014 (File No. 001-09769)). |
|
|
|
|
|
ABL Credit Agreement, dated as of November 16, 2017, by and between Lands’ End, Inc. (as the Lead Borrower), Wells Fargo Bank, N.A. (as Agent, L/C Issuer and Swing Line Lender), the Other Lenders party thereto, Wells Fargo Bank, N.A. (as Sole Lead Arranger and Sole Bookrunner) and BMO Harris Bank, N.A. (as Syndication Agent), and SunTrust Bank (as Documentation Agent) (incorporated by reference to Exhibit 4.2 to the Company’s Annual Report on Form 10-K for the fiscal year ended February 2, 2018 (File No. 001-09769)). |
|
|
|
|
|
First Amendment to ABL Credit Agreement, dated December 3, 2019, by and between Lands’ End, Inc. (as the Lead Borrower), Wells Fargo Bank, N.A. (as Agent, L/C Issuer and Swing Line Lender), the Other Lenders party thereto, Citizens Bank, N.A. (as Lender) and Suntrust Bank (as Lender), BMO Harris Bank N.A. (as Lender), and JPMorgan Chase Bank N.A. (as Lender) (incorporated by reference to Exhibit 4.2 to the Company’s Annual Report on Form 10-K for the fiscal year ended January 30, 2020 (File No. 001-09769)). |
|
|
|
|
|
Second Amendment to ABL Credit Agreement, dated August 12, 2020, by and among Lands’ End, Inc. (as the Lead Borrower), the guarantors party thereto, the lenders party thereto and Wells Fargo Bank, National Association (as Agent, L/C Issuer and Swing Line Lender) (incorporated by reference to Exhibit 4.1 to the Company’s Quarterly Report on Form 10-Q for the fiscal quarter ended July 31, 2020 (File No. 001-09769)). |
|
|
|
|
90
|
Third Amendment to ABL Credit Agreement, dated July 29, 2021, by and among Lands’ End, Inc. (as the Lead Borrower), the guarantors party thereto, the lenders party thereto and Wells Fargo Bank, National Association (as administrative agent and collateral agent) (incorporated by reference to Exhibit 4.1 of the Company’s Current Report on Form 8-K filed on August 4, 2021 (File No. 001-09769)). |
|
Fourth Amendment to Credit Agreement, dated May 12, 2023, by and among Lands’ End, Inc. (as the Lead Borrower), the guarantors party thereto, the lenders party thereto and Wells Fargo Bank, National Association (as administrative agent and collateral agent) (incorporated by reference to Exhibit 4.1 of the Company’s Current Report on Form 8-K filed on May 17, 2023 (File No. 001-09769)). |
|
|
|
|
|
Term Loan Credit Agreement, dated December 29, 2023, by and among Lands’ End, Inc. (as the borrower), the guarantors party thereto, the lenders party thereto, and Blue Torch Finance LLC (as administrative agent and collateral agent) (incorporated by reference to Exhibit 4.1 of the Company’s Form 8-K filed on January 3, 2024 (File No. 001-09769)). |
|
|
|
|
|
Guaranty and Security Agreement, dated December 29, 2023, by and among Lands’ End, Inc., as the Borrower, and the other grantors party thereto and Blue Torch Finance LLC, as Agent (incorporated by reference to Exhibit 4.2 of the Company’s Form 8-K filed on January 3, 2024 (File No. 001-09769)). |
|
|
|
|
|
Description of Securities Registered Under Section 12 of the Exchange Act. |
|
|
|
|
|
Lands’ End, Inc. Amended and Restated 2017 Stock Plan (incorporated by reference to Exhibit 10.1 of the Current Report on Form 8-K filed by Lands’ End, Inc. on May 13, 2019 (File No. 001-09769)).** |
|
|
|
|
|
Amendment No. 1 to the Lands’ End, Inc. Amended and Restated 2017 Stock Plan (incorporated by reference to Exhibit 10.1 of the Current Report on Form 8-K filed by Lands’ End, Inc. on June 13, 2023 (File No. 001-09769)).** |
|
|
|
|
|
Director Compensation Policy effective as of March 19, 2019 (incorporated by reference to Exhibit 10.21 to the Company’s Annual Report on Form 10-K for the fiscal year ended February 1, 2019 (File No. 001-09769)).** |
|
|
|
|
|
Lands’ End, Inc. Umbrella Incentive Program (As Amended and Restated) (incorporated by reference to Exhibit 10.12 to the Company’s Annual Report on Form 10-K for the fiscal year ended January 30, 2015 (File No. 001-09769)).** |
|
|
|
|
|
Lands’ End, Inc. 2014 Stock Plan (As Amended and Restated) (incorporated by reference to Exhibit 10.11 to the Company’s Annual Report on Form 10-K for the fiscal year ended January 30, 2015 (File No. 001-09769)).** |
|
|
|
|
|
Form of Time-Based Restricted Stock Unit Agreement (incorporated by reference to Exhibit 10.5 to the Company’s Annual Report on Form 10-K for the fiscal year ended January 27, 2023 (File No. 001-09769)).** |
|
|
|
|
|
Form of Performance-Based Restricted Stock Unit Agreement (incorporated by reference to Exhibit 10.6 to the Company’s Annual Report on Form 10-K for the fiscal year ended January 27, 2023 (File No. 001-09769)).** |
|
|
|
|
|
Form of Nonqualified Stock Option Agreement (incorporated by reference to Exhibit 10.7 to the Company’s Annual Report on Form 10-K for the fiscal year ended January 27, 2023 (File No. 001-09769)).** |
|
|
|
|
|
Lands’ End, Inc. Annual Incentive Plan (As Amended and Restated) (incorporated by reference to Exhibit 10.16 to the Company’s Annual Report on Form 10-K for the fiscal year ended January 30, 2015 (File No. 001-09769)).** |
|
|
|
|
91
|
Lands’ End, Inc. Long-Term Incentive Program (As Amended and Restated) (incorporated by reference to Exhibit 10.14 to the Company’s Annual Report on Form 10-K for the fiscal year ended January 30, 2015 (File No. 001-09769)).** |
|
|
|
|
|
Lands’ End, Inc. Cash Long-Term Incentive Plan (As Amended and Restated) (incorporated by reference to Exhibit 10.15 to the Company’s Annual Report on Form 10-K for the fiscal year ended January 30, 2015 (File No. 001-09769)).** |
|
|
|
|
|
Letter from Lands’ End, Inc. to Andrew J. McLean relating to employment, dated September 6, 2022 (incorporated by reference to Exhibit 10.1 to the Company’s Quarterly Report on Form 10-Q for the fiscal quarter ended October 28, 2022 (File No. 001-09769)).** |
|
|
|
|
|
Executive Severance Agreement by and between Lands’ End, Inc. and Andrew J. McLean, dated September 6, 2022 (incorporated by reference to Exhibit 10.2 to the Company’s Quarterly Report on Form 10-Q for the fiscal quarter ended October 22, 2022 (File No. 001-09769)).** |
|
|
|
|
|
Sign-On Nonqualified Stock Option Agreement dated November 1, 2022, by and between Lands’ End, Inc. and Andrew J. McLean (incorporated by reference to Exhibit 99.2 to the Form S-8 filed by Lands’ End, Inc. on November 4, 2022 (File No. 333-268170)).** |
|
|
|
|
|
Sign-On Restricted Stock Unit Agreement dated November 1, 2022, by and between Lands’ End, Inc. and Andrew J. McLean (incorporated by reference to Exhibit 99.3 to the Form S-8 filed by Lands’ End, Inc. on November 4, 2022 (File No. 333-268170)).** |
|
|
|
|
|
Letter from Lands’ End, Inc. to Peter L. Gray relating to employment, dated April 21, 2017 (incorporated by reference to Exhibit 10.1 to the Company’s Quarterly Report on Form 10-Q for the fiscal quarter ended April 28, 2017 (File No. 001-09769)).** |
|
|
|
|
|
Executive Severance Agreement by and between Lands’ End, Inc. and Peter L. Gray, dated April 21, 2017 (incorporated by reference to Exhibit 10.3 to the Company’s Quarterly Report on Form 10-Q for the fiscal quarter ended July 30, 2021 (File No. 001-09769)).** |
|
|
|
|
|
Letter from Lands’ End, Inc. to Peter L. Gray relating to employment, dated January 16, 2023 (incorporated by reference to Exhibit 10.27 to the Company’s Annual Report on Form 10-K for the fiscal year ended January 27, 2023 (File No. 001-09769)).** |
|
|
|
|
|
Letter from Lands’ End, Inc. to Sarah Rasmusen relating to employment, dated October 16, 2017 (incorporated by reference to Exhibit 10.24 to the Company’s Annual Report on Form 10-K for the fiscal year ended January 29, 2021 (File No. 001-09769)).** |
|
|
|
|
|
Letter from Lands’ End, Inc. to Sarah Rasmusen relating to employment, dated September 4, 2019 (incorporated by reference to Exhibit 10.25 to the Company’s Annual Report on Form 10-K for the fiscal year ended January 29, 2021 (File No. 001-09769)).** |
|
|
|
|
|
Executive Severance Agreement dated October 16, 2017 between Lands’ End, Inc. and Sarah Rasmusen (incorporated by reference to Exhibit 10.26 to the Company’s Annual Report on Form 10-K for the fiscal year ended January 29, 2021 (File No. 001-9769)).** |
|
|
|
|
|
Letter from Lands’ End, Inc. to Bernard McCracken relating to employment, dated September 14, 2023 (incorporated by reference to Exhibit 10.1 to the Company’s Quarterly Report on Form 10-Q for the fiscal quarter ended October 27, 2023 (File No. 001-09769)).** |
|
|
|
|
|
Executive Severance Agreement dated September 14, 2023, between Lands’ End, Inc. and Bernard McCracken (incorporated by reference to Exhibit 10.2 to the Company’s Quarterly Report on Form 10-Q for the fiscal quarter ended October 27, 2023 (File No. 001-09769)).** |
|
|
|
|
92
|
Letter from Lands’ End, Inc. to Angela Rieger relating to employment, dated January 16, 2023 (incorporated by reference to Exhibit 10.2 to the Company’s Quarterly Report on Form 10-Q for the fiscal quarter ended July 28, 2023 (File No. 001-09769)).** |
|
|
|
|
|
Executive Severance Agreement by and between Lands’ End, Inc. and Angela Rieger, dated March 10, 2016 (incorporated by reference to Exhibit 10.3 to the Company’s Quarterly Report on Form 10-Q for the fiscal quarter ended July 28, 2023 (File No. 001-09769)).** |
|
|
|
|
|
Letter from Lands’ End, Inc. to Angela Rieger relating to employment, effective January 22, 2024. ** |
|
|
|
|
|
Acknowledgement Agreement Pertaining to the Lands’ End, Inc. Clawback Policy. ** |
|
|
|
|
|
Subsidiaries of Lands’ End, Inc. |
|
|
|
|
|
Consent of BDO USA, P.C. |
|
|
|
|
|
Consent of Deloitte & Touche LLP. |
|
|
|
|
|
Certification of Chief Executive Officer Required Under Rule 13a-14(a) and 15d-14(a) of the Securities Exchange Act of 1934, as amended. |
|
|
|
|
|
Certification of Chief Financial Officer Required Under Rule 13a-14(a) and 15d-14(a) of the Securities Exchange Act of 1934, as amended. |
|
|
|
|
|
Certification of Chief Executive Officer and Chief Financial Officer Pursuant to 18 U.S.C. Section 1350, as adopted pursuant to Section 906 of the Sarbanes-Oxley Act of 2002. |
|
|
|
|
|
Lands’ End, Inc. Clawback Policy. |
*101.INS |
|
Inline XBRL Instance Document – the instance document does not appear in the Interactive Data File because its XBRL tags are embedded within the Inline XBRL document |
*101.SCH |
|
Inline XBRL Taxonomy Extension Schema Document |
*101.CAL |
|
Inline XBRL Taxonomy Extension Calculation Linkbase Document |
*101.DEF |
|
Inline XBRL Taxonomy Extension Definition Document |
*101.LAB |
|
Inline XBRL Taxonomy Extension Label Linkbase Document |
*101.PRE |
|
Inline XBRL Taxonomy Extension Presentation Linkbase Document |
*104 |
|
Cover Page Interactive Data File (Embedded within the Inline XBRL document and included in Exhibit 101) |
|
|
|
* |
|
Filed herewith. |
** |
|
A management contract or compensatory plan or arrangement. |
*** |
|
Furnished herewith. |
|
|
|
|
|
|
Certain of the agreements incorporated by reference into this report contain representations and warranties and other agreements and undertakings by us and third parties. These representations and warranties, agreements and undertakings have been made as of specific dates, may be subject to important qualifications and limitations agreed to by the parties to the agreement in connection with negotiating the terms of the agreement, and have been included in the agreement for the purpose of allocating risk between the parties to the agreement rather than to establish matters as facts. Any such representations and warranties, agreements, and undertakings have been made solely for the benefit of the parties to the agreement and should not be relied upon by any other person.
ITEM 16. FORM 10-K SUMMARY
None.
93
SIGNATURES
Pursuant to the requirements of Section 13 or 15(d) of the Securities Exchange Act of 1934, the registrant has duly caused this report to be signed on its behalf by the undersigned, thereunto duly authorized.
LANDS’ END, INC. (Registrant) |
|
By: |
/s/ Bernard McCracken |
Name: |
Bernard McCracken |
Title: |
Chief Financial Officer and Treasurer |
Date: |
April 3, 2024 |
Pursuant to the requirements of the Securities Exchange Act of 1934, this report has been signed below by the following persons on behalf of the registrant and in the capacities and on the dates indicated.
Signature: |
|
Date: |
||
/s/ Andrew J. McLean |
|
Director and Chief Executive Officer (Principal Executive Officer) |
|
April 3, 2024 |
Andrew J. McLean |
|
|
||
|
|
|
|
|
/s/ Bernard McCracken |
|
Chief Financial Officer and Treasurer (Principal Financial Officer and Principal Accounting Officer) |
|
April 3, 2024 |
Bernard McCracken |
|
|
||
|
|
|
|
|
/s/ Josephine Linden |
|
Chair of the Board of Directors |
|
April 3, 2024 |
Josephine Linden |
|
|
||
|
|
|
|
|
/s/ Robert Galvin |
|
Director |
|
April 3, 2024 |
Robert Galvin |
|
|
||
|
|
|
|
|
/s/ Elizabeth Leykum |
|
Director |
|
April 3, 2024 |
Elizabeth Leykum |
|
|
||
|
|
|
|
|
/s/ John T. McClain |
|
Director |
|
April 3, 2024 |
John T. McClain |
|
|
||
|
|
|
|
|
/s/ Jignesh Patel |
|
Director |
|
April 3, 2024 |
Jignesh Patel |
|
|
||
|
|
|
|
|
/s/ Jonah Staw |
|
Director |
|
April 3, 2024 |
Jonah Staw |
|
|
||
94