UNITED STATES
SECURITIES AND EXCHANGE COMMISSION
WASHINGTON, DC 20549
FORM
| | ANNUAL REPORT PURSUANT TO SECTION 13 OR 15(d) OF THE SECURITIES EXCHANGE ACT OF 1934 |
For the fiscal year ended:
OR
| | TRANSITION REPORT PURSUANT TO SECTION 13 OR 15(d) OF THE SECURITIES EXCHANGE ACT OF 1934 |
For the transition period from _________________ to ______________________
Commission file number:
![]()
The LGL Group, Inc.
(Exact name of Registrant as Specified in Its Charter)
| | |
| (State or Other Jurisdiction of Incorporation or Organization) | (I.R.S. Employer Identification No.) |
| | |
| (Address of Principal Executive Offices) | (Zip Code) |
Registrant's telephone number, including area code: (
Securities registered pursuant to Section 12(b) of the Act:
| Title of each class | Trading Symbol(s) | Name of each exchange on which registered | ||
| | | | ||
| | | |
Securities registered pursuant to Section 12(g) of the Act: None
Indicate by check mark if the registrant is a well-known seasoned issuer, as defined in Rule 405 of the Securities Act. Yes ☐
Indicate by check mark if the registrant is not required to file reports pursuant to Section 13 or Section 15(d) of the Act. Yes ☐
Indicate by check mark whether the registrant: (1) has filed all reports required to be filed by Section 13 or 15(d) of the Securities Exchange Act of 1934 during the preceding 12 months (or for such shorter period that the registrant was required to file such reports), and (2) has been subject to such filing requirements for the past 90 days.
Indicate by check mark whether the registrant has submitted electronically every Interactive Data File required to be submitted pursuant to Rule 405 of Regulation S-T (§232.405 of this chapter) during the preceding 12 months (or for such shorter period that the registrant was required to submit such files).
Indicate by check mark whether the registrant is a large accelerated filer, an accelerated filer, a non-accelerated filer, a smaller reporting company, or an emerging growth company. See the definitions of "large accelerated filer," "accelerated filer," "smaller reporting company" and "emerging growth company" in Rule 12b-2 of the Exchange Act.:
| Large accelerated filer | ☐ | Accelerated filer | ☐ |
| | ☒ | Smaller reporting company | |
|
|
| Emerging growth company |
If an emerging growth company, indicate by check mark if the registrant has elected not to use the extended transition period for complying with any new or revised financial accounting standards provided pursuant to Section 13(a) of the Exchange Act. ☐
Indicate by check mark whether the registrant has filed a report on and attestation to its management’s assessment of the effectiveness of its internal control over financial reporting under Section 404(b) of the Sarbanes-Oxley Act (15 U.S.C. 7262(b)) by the registered public accounting firm that prepared or issued its audit report.
If securities are registered pursuant to Section 12(b) of the Act, indicate by check mark whether the financial statements of the registrant included in the filing reflect the correction of an error to previously issued financial statements.
Indicate by check mark whether any of those error corrections are restatements that required a recovery analysis of incentive-based compensation received by any of the registrant’s executive officers during the relevant recovery period pursuant to §240.10D-1(b). ☐
Indicate by check mark whether the registrant is a shell company (as defined in Rule 12b-2 of the Act). Yes
The aggregate market value of the registrant's voting and non-voting common equity held by non-affiliates of the registrant, based upon the $4.76 per share closing price of the registrant's common stock on June 30, 2023, the last business day of the registrant's most recently completed second fiscal quarter, was $
The number of outstanding shares of the registrant's common stock was
DOCUMENTS INCORPORATED BY REFERENCE
None.
Form 10-K for the year ended December 31, 2023
Table of Contents
| Page |
||||
| Item 1. |
1 | |||
| Item 1A. |
7 | |||
| Item 1B. |
20 | |||
| Item 1C. | Cybersecurity | 21 | ||
| Item 2. |
21 | |||
| Item 3. |
21 | |||
| Item 4. |
21 | |||
| Item 5. |
22 | |||
| Item 6. |
22 | |||
| Item 7. |
Management's Discussion and Analysis of Financial Condition and Results of Operations |
23 | ||
| Item 7A. |
28 | |||
| Item 8. |
28 | |||
| Item 9. |
Changes in and Disagreements with Accountants on Accounting and Financial Disclosure |
29 | ||
| Item 9A. |
29 | |||
| Item 9B. |
29 | |||
| Item 9C. |
Disclosure Regarding Foreign Jurisdictions that Prevent Inspections |
29 | ||
| Item 10. |
30 | |||
| Item 11. |
35 | |||
| Item 12. |
Security Ownership of Certain Beneficial Owners and Management and Related Stockholder Matters |
39 | ||
| Item 13. |
Certain Relationships and Related Transactions, and Director Independence |
40 | ||
| Item 14. |
41 | |||
| Item 15. |
42 | |||
| Item 16. |
43 | |||
| Signatures | 44 | |||
| Consolidated Financial Information - The LGL Group, Inc. | 45 |
Cautionary Statement Concerning Forward-Looking Statements
This annual report on Form 10-K (this "Report") and the Company's (as defined below) other communications and statements may contain "forward-looking statements" within the meaning of Section 27A of the Securities Act of 1933, as amended, and Section 21E of the Securities Exchange Act of 1934, as amended, including statements about the Company's beliefs, plans, objectives, goals, expectations, estimates, projections and intentions. These statements are subject to significant risks and uncertainties and are subject to change based on various factors, many of which are beyond the Company's control. The words "may," "could," "should," "would," "believe," "anticipate," "estimate," "expect," "intend," "plan," "target," "goal," and similar expressions are intended to identify forward-looking statements. All forward-looking statements, by their nature, are subject to risks and uncertainties. The Company's actual future results may differ materially from those set forth in the Company's forward-looking statements. For information concerning these factors and related matters, see "Risk Factors" in Part I, Item 1A in this Report, and "Management's Discussion and Analysis of Financial Condition and Results of Operations" in Part II, Item 7 in this Report. However, other factors besides those referenced could adversely affect the Company's results, and you should not consider any such list of factors to be a complete set of all potential risks or uncertainties. Any forward-looking statements made by the Company herein speak as of the date of this Report. The Company does not undertake to revise or update any forward-looking statement to reflect subsequent events or circumstances, except as required by applicable law. As a result, you should not place undue reliance on these forward-looking statements.
| Item 1. | Business |
For the purposes of this discussion, the terms "LGL," "LGL Group," the "Company," "we," "our," and "us" refer collectively to The LGL Group, Inc. and its subsidiaries. Unless otherwise stated, all dollar amounts are in thousands.
General
The LGL Group, Inc. is a holding company engaged in services, merchant investment and manufacturing business activities. Since 1985, the Company has acquired 32 businesses, sold 11, and spun off 3, culminating with the spin-off of M-tron Industries, Inc. in October 2022. The Company was incorporated in 1928 under the laws of the State of Indiana, and in 2007, the Company was reincorporated under the laws of the State of Delaware as The LGL Group, Inc. We maintain our executive offices at 2525 Shader Road, Orlando, Florida 32804. Our telephone number is (407) 298-2000. Our Internet address is www.lglgroup.com. Our common stock and warrants are traded on the NYSE American ("NYSE") under the symbols "LGL" and "LGL WS," respectively.
LGL’s business strategy is primarily focused on growth through expanding new and existing operations across diversified industries. The LGL Group Inc.'s engineering and design origins date back to the early part of the last century. In 1917, Lynch Glass Machinery Company, the predecessor of LGL, was formed, and emerged in the late 1920s as a successful manufacturer of glass-forming machinery. The Company was then renamed Lynch Corporation ("Lynch") and was incorporated in 1928 under the laws of the State of Indiana. In 1946, Lynch was listed on the 'New York Curb Exchange,' the predecessor to the NYSE American. The Company has had a long history of owning and operating various businesses in the precision engineering, manufacturing and services sectors.
As a holding company, we believe that the cash flow and asset coverage from our subsidiaries will allow us to maintain a strong balance sheet and ample liquidity over time. We seek to invest available cash and cash equivalents and marketable securities in liquid investments with a view to enhancing returns as we continue to assess further acquisitions of, or investments in, operating businesses. As of December 31, 2023, we had Cash and cash equivalents and Marketable securities with a fair market value of approximately $40,733.
Our approach is to establish long term partnerships utilizing the resources of our organization to facilitate a full cycle of advice and investment to augment investments in conjunction with broader capital syndication. This approach allows for LGL Group to be creative and nimble with no pre-determined exit time table. We focus on businesses with existing growth potential which through helping improve their capabilities, teaming up portfolio companies for strategic expansions and transforming the businesses through merger and acquisition opportunities.
The Company’s objective is to deliver long-term investment growth to our shareholders, maximizing shareholder value. This includes developing businesses and positioning them as independent entities to enhance shareholder value and alignment.
We provide our products and services through our Electronic Instruments and Merchant Investment businesses. Activities not related to our business segments such as our corporate operations, corporate-level assets and financial obligations are included in Corporate.
Our Electronic Instruments segment derives revenues principally from net sales of various products. Our Merchant Investment business derives revenues from investment income and gains and losses from investment transactions as well as fee income on any syndicated investments.
On October 7, 2022, we completed the spin-off of M-tron Industries, Inc. ("MtronPTI") (the "Spin-off" or the "Separation"). The Separation is described further below under Our Strategy - MtronPTI Separation.
Business Strategy
Across all of our businesses, our success is based on a simple formula: we seek to find undervalued companies in the Graham & Dodd tradition, a methodology for valuing companies that primarily looks for deeply depressed prices. Today, we are a holding company owning subsidiaries engaged in manufacturing and investments. Several of our former operating businesses started out as investment positions in debt or equity securities, held directly by us. Those positions ultimately resulted in control or complete ownership of the target company. For example, in 2004, we acquired a controlling interest in Piezo Technology, Inc. ("PTI"), which started out as an investment position and ultimately became an operating subsidiary before the Separation. The acquisition of PTI, like our other operating subsidiaries, reflects our opportunistic approach to value creation, through which returns may be obtained by, among other things, promoting change through minority positions at targeted companies in our Merchant Investment segment or by acquiring control of those target companies that we believe we could run more profitably ourselves.
In appropriate circumstances, we or our subsidiaries may become the buyer of target companies, adding them to our portfolio of operating subsidiaries, thereby expanding our operations through such opportunistic acquisitions.
It is our belief that our strategy will continue to produce strong results into the future.
An anthology of the Company’s activities underscores the path ahead:
| 1917 |
Lynch Glass Machinery, predecessor of Lynch Corporation, was organized, which became a successful manufacturer of glass-forming machinery in the late 1920s. |
| 1928 |
Lynch Corporation was incorporated in the State of Indiana |
| 1946 |
Lynch was listed on the 'New York Curb Exchange'. |
| 1964 |
Curtiss-Wright Corporation purchased a controlling interest in Lynch. |
| 1976 |
M-tron Industries, Inc., a manufacturer of quartz crystals, was acquired. |
| 1985 |
Companies affiliated with Gabelli Funds, Inc. acquired a majority interest in Lynch's common stock, including the entire interest of Curtiss-Wright Corporation. |
| 1986 |
Lynch issued $23 million of 8% convertible subordinated debentures as the first step in an acquisition program designated to broaden Lynch's business base. |
| 1987 |
• | Lynch expanded the scope of its operations into the financial services and entertainment industries with the start-up of Lynch Capital Corporation, a securities broker dealer, and Lynch Entertainment Corporation, a joint venture partner with a 20% interest in WHBF-TV, the CBS television network affiliate in Rock Island, Illinois. |
|
|
• | The Company acquired Tremont Partners, Inc., a Connecticut-based investment management consulting firm. |
|
|
• | Lynch acquired an 83% interest in Safety Railway Service Corporation. |
| 1988 |
Lynch entered the service sector with the acquisition of Morgan Drive Away, Inc., a portable shelter and commodity transportation company. |
| 1989 |
Lynch entered into the telecommunications industry with the acquisition of Western New Mexico Telephone Company. |
| 1991 |
• | Lynch completed its second telecommunications acquisition by acquiring Inter-Community Telephone Company, based in Nome, North Dakota. |
|
|
• | Lynch acquired Cuba City Telephone Exchange Company and Belmont Telephone Company, telecommunication companies based in Wisconsin. |
| 1992 |
• | Lynch acquired Bretton Woods Telephone Company, based in New Hampshire. |
|
|
• | Lynch completed a rights offering to its shareholders, which resulted in Tremont Advisors, Inc. (formerly Tremont Partners, Inc.) becoming a publicly traded company. |
| 1993 |
• | The Morgan Group, Inc. ("Morgan"), newly formed parent company of Morgan Drive Away, Inc., was launched via a public company with an initial public offering of 1.1 million Class A common shares. |
|
|
• | Lynch acquired J.B.N. Telephone Company, based in Kansas, from GTE Corporation. |
| 1994 |
• | Safety Railway Service Corporation was reborn as Spinnaker Industries, Inc. ("Spinnaker"). |
|
|
• | Lynch acquired a 50% interest in WOI-TV, the ABC television network affiliate in Ames, Iowa. |
| 1995 |
Lynch partnered with CLR Video LLC, a cable operator in Kansas, to buy 340 telephone lines from Sprint and commercialized DirectTV. |
| 1996 |
• | Inter-Community Telephone Company acquired 1,400 access lines in North Dakota from U.S. West Communications, Inc. |
|
|
• | Lynch acquired the stock of Dunkirk & Fredonia Telephone Company, located in Fredonia, New York, from the Maytum family. |
|
|
• | Morgan acquired Transit Homes of America, Inc., a national outsourcing company located in Boise, Idaho. |
|
|
• | Lynch organized and bid on personal communications services ("PCS") licenses in the Federal Communications Commission's ("FCC") C-block and F-block auctions. |
| 1997 |
• | Lynch acquired Upper Peninsula Telephone Company, a telecommunications company based in Michigan's Upper Peninsula. |
|
|
• | Lynch completed the spin-off of East/West Communications, an F-block PCS licensee with 20 million points of presence ("POPs"). |
| 1999 |
• | Lynch acquired Central Scott Telephone Company, a 6,000 incumbent local exchange carrier ("ILEC") in Iowa, an area the Company sought to grow significantly. Central Scott Telephone Company later became part of the Lynch Interactive Corporation spin-off (see below). |
|
|
• | Spinnaker refocused its efforts in the adhesive-backed paper industry and sold its industrial tape operations while also deleveraging itself. |
|
|
• | Lynch Interactive Corporation ("Lynch Interactive") was born via a tax-free spin-off from Lynch. Lynch Interactive owned all of Lynch's cable, telecommunications, PCS, and broadcasting operations as well as a 55% interest in The Morgan Group, Inc. |
|
|
• | Spinnaker continued deleveraging itself by buying back a significant amount of its senior debt at a gain. |
| 2000 |
M-tron Industries, Inc. was preparing for an IPO, but was held back due to changing market conditions. |
| 2001 |
Lynch spins off The Morgan Group, Inc. and Tremont Advisors to shareholders. Tremont later acquired by Oppenheimer. |
| 2002 |
• | The Company sold its remaining stake in Spinnaker. |
|
|
• | M-tron Industries, Inc. acquired the assets of Champion Technologies, Inc. (spun-off from Motorola in the mid-1980s), expanding its product line to include voltage-controlled crystal oscillators ("VCXO"), temperature compensated crystal oscillators ("TCXO"), and timing solutions. |
| 2004 |
Venator Merchant Fund LLC, an affiliate of Marc Gabelli, LGL Group Chairman, financed the acquisition of Piezo Technology, Inc., based in Orlando, Florida, to re-direct M-tron Industries, Inc.'s strategic direction. This acquisition set the stage for the development of M-tron Industries, Inc.'s orientation toward the avionics, space, and defense industries. |
| 2007 |
The Company sold the assets of Lynch Systems, Inc. to Olivotto Glass Technologies, S.P.A., a glassware machinery manufacturer based in Milan, Italy. |
| 2014 |
M-tron Industries, Inc. purchased filter product line assets from Trilithic, Inc. |
| 2016 |
The Company acquired the assets of Precise Time and Frequency, LLC. |
| 2019 |
The direct investing business was launched (renamed the Merchant Investment segment in 2023) |
| 2021 |
LGL Systems Acquisition Corporation completed its business combination with IronNet Cybersecurity, Inc. |
| 2022 |
The Company completed the tax-free spin-off M-tron Industries, Inc. to shareholders. |
| 2023 |
The Company launched Lynch Capital International, LLC to facilitate the Merchant Investment business. |
MtronPTI Separation
On October 7, 2022, the separation of MtronPTI was completed and MtronPTI became an independent, publicly traded company trading on the NYSE American under the stock symbol "MPTI."
The Separation was achieved through LGL’s distribution (the "Distribution") of 100% of the shares of MtronPTI's common stock to holders of LGL's common stock as of the close of business on the record date of September 30, 2022. LGL's stockholders of record received one-half share of MtronPTI's common stock for every share of LGL's common stock. LGL retained no ownership interest in the MtronPTI business following the Separation. The historical financial results of the MtronPTI business for periods prior to the distribution date are reflected in the Company's consolidated financial statements as discontinued operations.
For further information on the Separation, refer to Note 3 – Discontinued Operations in the accompanying notes to the Consolidated Financial Statements included in Item 8. Financial Statements and Supplementary Data of this Report.
Our Segments
We report our financial results in two segments: Electronic Instruments and Merchant Investment.
Electronic Instruments
The Electronic Instruments segment is operated through our wholly owned subsidiary, PTF, a globally positioned producer of industrial electronic instruments and commercial products and services. Founded in 2002, PTF operates from our design and manufacturing facility in Wakefield, Massachusetts. PTF is focused on the design and manufacture of high-performance Frequency and Time reference standards that form the basis for timing and synchronization in various applications including satellite communication, time transfer systems, network synchronization, electricity distribution and metrology. PTF offers customers frequency reference and time standard synchronization solutions tailored to meeting performance requirements. PTF has developed a comprehensive portfolio of time and frequency instrumentation including frequency standards, time standards, and time code generators, complemented by a wide range of ancillary products such as RF distribution amplifiers, Digital distribution amplifiers, Time Code distribution amplifiers, and redundancy switches. Thousands of instruments have been delivered to a broad range of applications worldwide, from simple network time servers to synchronize local computers and instruments, to fully redundant and highly sophisticated Satellite Communications and Broadcast systems. Military applications include synchronization of mobile Satcom terminals, high performance sources for calibration, and test equipment providing the ultimate in frequency stability and phase noise performance.
Merchant Investment
Our Businesses
Electronic Instruments Segment
Overview
Our Electronics Instruments segment is comprised of PTF, which designs, manufactures, and markets for sale time and frequency instruments. The industries PTF serves include computer networking, satellite ground stations, electric utilities, broadcasting, telecommunication systems, and metrology. LGL Group PTF's assets in September 2016 through a business acquisition, reinforcing our position as a broad-based supplier of highly engineered products for the generation of time and frequency references for synchronization and control. Since its inception, PTF has developed a comprehensive portfolio of time and frequency instruments complemented by a wide range of ancillary products such as distribution amplifiers and redundancy auto switches. PTF is housed in a well-equipped, modern, facility and staffed by a highly dedicated and experienced team of time and frequency professionals.
Products
PTF's products range from simple, low-cost time and frequency solutions to premium products designed to deliver maximum performance for the most demanding applications. PTF's products include Frequency and Time Reference Standards; radio frequency ("RF"), digital, and optical time code distribution amplifiers; redundancy auto switches; and network time protocol ("NTP") servers, all of which are used in a wide range of applications worldwide.
PTF's Frequency and Time Reference Standards include quartz Frequency Standards, global positioning system ("GPS") / global navigation system ("GNS") Frequency and Time Standards and rubidium atomic Frequency Standards. The de facto standard for many highly demanding applications, such as satellite communications, is PTF's range of GPS/GNS disciplined quartz frequency and time standards. The MtronPTI high-quality quartz oscillators utilized within the PTF instruments deliver outstanding phase noise and short-term stability performance for applications where low noise is paramount. This outstanding short-term performance, coupled with the long-term stability and accuracy of the external GNS reference signals, which can be from GPS, Galileo, Glonass or QZSS, provides the user excellent all-around performance that is highly cost-effective.
When two or more computers are involved, accurate time keeping is a challenge especially when the computers are in different locations. PTF's range of GNS Time and Frequency References and Network Time Servers deliver a high level of performance that allows customers to synchronize to Coordinated Universal Time ("UTC"), in several cost-effective forms to meet a multitude of time and frequency reference requirements. Applications range from low phase noise, highly stable and accurate system frequency references for satellite communications ("SATCOM") and Digital Broadcasting applications, to computer networks, shipboard time code references and e-commerce time stamping applications. With respect to UTC, the Company has developed long-term real time synchronization capability of less than 10 nanoseconds of which to date multiple systems have been delivered.
PTF's portfolio of distribution amplifiers covers multiple signal types including high frequency ("HF"), RF, digital, time code, optical, and custom configured units. The distribution range is designed to complement the high quality of the frequency and time references and provide the most effective cost/performance solution for the application, including options for full remote monitoring/control (including RF analog signal monitoring) and optional level control.
The distribution product range includes standard units with either 12 or 16 channels together with more flexible units that allow the user to define specific configurations including different types of input/output signals combined into a convenient 1U or 2U package with up to 36 output channels.
PTF's series of redundancy auto switches range from simple level detection to highly sophisticated sensing capability, extremely fast switching options and full Ethernet connectivity, to provide remote monitoring/control, and including integration with simple network management protocol ("SNMP") management systems. The most recent model includes multi-channel input capability as well as the ability to switch up to three input types of signals.
Customers
PTF primarily works directly with original equipment manufacturers ("OEMs") to define the right solutions for their unique applications, including the design of custom parts with unique part numbers. Sales of products may be directly to the OEM, through franchised representatives or distributors, or direct to end customers. Our franchised representatives/distributors have highly skilled sales engineers who work directly with designers and program managers providing a high-level of engineering support at all points within the process.
The table below presents the concentration of the Company's customers for the year ended December 31, 2023:
| Revenue |
||||||||
| (in thousands) |
$ |
% |
||||||
| Customer 1 |
$ | 399 | 23.1 | % | ||||
| Customer 2 |
236 | 13.7 | % | |||||
| Customer 3 |
128 | 7.4 | % | |||||
| Customer 4 |
103 | 6.0 | % | |||||
| Top 4 largest customers |
866 | 50.2 | % | |||||
| All other (a) |
862 | 49.8 | % | |||||
| Total sales |
$ | 1,728 | 100.0 | % | ||||
| (a) |
Comprised of approximately 36 customers |
This spread of revenue over a broad customer base reduces the vulnerability of the company to any customer suffering from a market downturn, or other debilitating issue including insolvency.
Competition
We design, manufacture and market products for the generation, synchronization and control of time and frequency in many cases insuring optimal utilization of allocated spectrum. There are a number of domestic and international manufacturers who are capable of providing custom-designed products comparable in quality and performance to our products. Our competitive strategy begins with our focus on niche markets where precise specification, the ability to provide custom configurations, and reliability are the major requirements.
Product Development
For new products, the company focuses on developing products targeted at relatively new, albeit established, markets, minimizing the need for market pioneering and education. The latest product developments target the new but rapidly growing Precision Time Protocol ("PTP") market utilizing ethernet networks for transmission of highly accurate time and frequency reference signals.
Marketing and Sales
Marketing efforts are supported by outsourcing to independent contractors and include the company web site, targeted monthly marketing emails, and exhibiting at relevant shows and conferences. We have a highly skilled team of domestic sales representatives and international distributors who market and sell our products. Where possible, the sales team endeavors to gain qualification of specific products from Systems Integrators, confirming suitability for use in a specific system design. Through direct contact with our clients and through our representative network, we are able to understand the needs of the customers, and then provide custom configurations to meet those requirements in a highly cost-efficient solution.
International Revenues
In 2023, our international revenues were $675, or 39.1%, of total sales compared to $460, or 27.8%, of total sales in 2022. In both 2023 and 2022, these revenues were derived primarily from customers in Europe and Canada. We avoid significant currency exchange risk by transacting and settling substantially all of our international sales in United States dollars.
Seasonality
Our business is not seasonal, although shipment schedules may be affected by the production schedules of our customers, or their contract manufacturers based on regional practices or customs.
Order Backlog
Our order backlog was $143 and $360 as of December 31, 2023 and 2022, respectively. The backlog of unfilled orders includes amounts based on purchase orders. Although backlog represents only firm orders that are considered likely to be fulfilled primarily within the 12 months following receipt of the order, cancellations or scope adjustments may and do occur.
Order backlog is adjusted quarterly to reflect project cancellations, deferrals, revised project scope and cost. We expect to fill substantially all of our 2023 order backlog in 2024, but cannot provide assurances as to what portion of the order backlog will be fulfilled in a given year.
Raw Materials
Generally, most raw materials used in the production of our products are available in adequate supply from a number of sources and the prices of these raw materials are relatively stable. However, some raw materials, including printed circuit boards, integrated circuits and certain metals including steel and aluminum are subject to greater supply fluctuations and price volatility, as experienced in recent years. In general, we have been able to include some cost increases in our pricing, but in some cases our margins were adversely impacted.
Changes in global economic and geopolitical conditions has caused disrupted supply chains and the ability to obtain components and raw materials around the world for most companies, including us. On occasion, one or more of the components used in our products have become unavailable resulting in unanticipated redesign and/or delays in shipments. Continued identification of alternative supply sources or other mitigations are important in minimizing disruption to our supply chain.
Intellectual Property
We have no patents, trademarks or licenses that are considered to be significant to our business or operations. Rather, we believe that our technological position depends primarily on the technical competence and creative ability of our engineering and technical staff in areas of product design and manufacturing processes, including our staff’s ability to customize products to meet difficult specifications, as well as proprietary know-how and information.
Merchant Investment Segment
Overview
The Merchant Investment segment is comprised of various investment vehicles in which we have a shareholder, partner, or general partner interest, and through which LGL Group invests its capital.
We conduct and plan to continue to conduct our activities in such a manner as not to be deemed an investment company under the Investment Company Act of 1940, as amended (the "Investment Company Act"). Therefore, no more than 40% of our total assets can be invested in investment securities, as such term is defined in the Investment Company Act. In addition, we do not invest or intend to invest in securities as our primary business.
Special Purpose Vehicles
In 2019, LGL management began pursuing the development of special purpose vehicles ("SPV") to pursue acquisitions of varying scale with emphasis on the manufacturing sector of the economy, which currently provides fertile opportunities for growing the intrinsic value of the enterprise.
During June 2023, LGL Group transferred approximately $21.0 million of cash and cash equivalents to its wholly owned subsidiary, Lynch Capital International, LLC ("Lynch Capital"), for its use within the Merchant Investment business. During June 2023, Lynch Capital was appointed as sole managing member of LGL Systems Nevada Management Partners, LLC ("LGL Nevada") and invested approximately $4 thousand into LGL Nevada, representing its 1% general partnership interest. In conjunction with this transaction, Lynch Capital also invested $1.0 million into LGL Systems, which is controlled by LGL Nevada. As a result of these transactions, the Company determined it was the primary beneficiary of LGL Systems and was therefore required to consolidate LGL Systems. As of June 2023, the Company recorded $1.9 million of non-controlling interests in LGL Systems on its consolidated balance sheets.
Government Regulations
As a supplier to certain U.S. Government defense contractors, we must comply with certain procurement regulations and other requirements. Maintaining registration under the System for Award Management ("SAM") is critical in order to receive U.S. Government contracts. As a small business we obtain preferential treatment for awards from tier one Government contractors however to maintain this position we are required to submit annually "Representation and Certification" documents attesting to our size, revenue, and internal controls for anti-discrimination, avoidance of counterfeit components, and a number of other federally mandated issues.
From time to time, we may also be subject to U.S. Government investigations relating to our or our customers' operations. In particular, for international business, we are required to submit a request for Automated Export System ("AES") validation used by U.S. Government agencies to measure the compliance of U.S. exports with U.S. export control laws.
Human Capital Management
As of December 31, 2023, the Company’s executives were based in Orlando, Florida; Greenwich, Connecticut; and Chicago, Illinois. We employed seven full-time manufacturing and engineering employees located in Wakefield, Massachusetts, two corporate and investment employees located in Greenwich, Connecticut, and one corporate and investment employee in Chicago, Ilinois. The Company’s Chief Accounting Officer and Controller are employed through certain service level agreements in place. None of the Company's employees are represented by a labor union and the Company considers its relationships with employees to be good.
We believe the Company's success depends on its ability to attract, develop, and retain key personnel. The skills, experience and industry knowledge of key members of our Board of Directors, employees, and contractors significantly benefit our operations and performance. The Company's Board of Directors and management oversee various employee and contractor initiatives.
Availability of Financial Information
Our Annual Report on Form 10-K, Quarterly Reports on Form 10-Q, Current Reports on Form 8-K and all amendments to those reports filed with or furnished to the SEC pursuant to Section 13(a) or 15(d) of the Securities Exchange Act are available free of charge on our website, www.lglgroup.com, under the "Investors - SEC Filings" caption, as soon as reasonable practicable after we electronically file them with, or furnish them to, the SEC.
| Risk Factors |
Investing in our securities involves risks. Before making an investment decision, you should carefully consider the risks described below. Any of these risks could result in a material adverse effect on our business, financial condition, results of operations, or prospects, and could cause the trading price of our securities to decline, resulting in a loss of all or part of your investment. The risks and uncertainties described below are not the only ones we face but represent those risks and uncertainties that we believe are material to our business, operating results, prospects and financial condition. Additional risks and uncertainties not presently known to us or that we currently deem immaterial may also harm our business.
Unless otherwise stated, all dollar amounts are in thousands.
Summary Risk Factors
Risks Relating to Our Structure
| • |
We have engaged, and in the future may engage, in transactions with our affiliates. |
| • |
We are subject to the risk of becoming an investment company under the Investment Company Act. |
| • |
We may structure transactions in a less advantageous manner to avoid becoming subject to the Investment Company Act. |
Risks Relating to Liquidity and Capital Requirements
| • |
We are a holding company and depend on the businesses of our subsidiaries to satisfy our obligations. |
| • |
We have made significant investments and negative performance of those investments may result in a significant decline in the value and could impact our cash flows. |
Risks Relating to Our Merchant Investment Business
| • |
The Company has made and may make material investments in special purpose vehicles that may not be successful. |
| • |
Our investments may be subject to significant uncertainties. |
| • |
The historical financial information for the Merchant Investment business is not necessarily indicative of its future performance. |
| • |
The Merchant Investment business’s investment strategy involves numerous and significant risks, including the risk that we may lose some or all of our investments in the Merchant Investment business. This risk may be magnified due to concentration of investments and investments in undervalued securities. |
| • |
We may not be able to identify suitable investments, and our investments may not result in favorable returns or may result in losses. |
| • |
The Merchant Investment business may make investments in companies we do not control. |
| • |
The use of leverage in investments by the Merchant Investment business may pose a significant degree of risk and may enhance the possibility of significant loss in the value of the investments in the Merchant Investment business. |
| • |
The possibility of increased regulation could result in additional burdens on our Merchant Investment business. |
| • |
The ability to hedge investments successfully is subject to numerous risks. |
| • |
The Merchant Investment business may invest in distressed securities, as well as bank loans, asset backed securities and mortgage-backed securities. |
| • |
The Merchant Investment business may invest in companies that are based outside of the United States, which may expose the Merchant Investment business to additional risks not typically associated with investing in companies that are based in the United States. |
| • |
The Merchant Investment business' investments are subject to numerous additional risks. |
Risks Related to Our Business and Industry
| • |
Macroeconomic fluctuations may harm our business, results of operations and stock price. |
| • |
Inflation and changing interest rates may adversely affect our financial condition and results of operations. |
| • |
We are currently dependent on a single line of manufacturing business. |
| • |
Our financial results vary significantly from period to period. |
| • |
Our order backlog may not be indicative of future revenues. |
| • |
Our future rate of growth and profitability are highly dependent on the development and growth of the communications, networking, aerospace, defense, instrumentation and industrial markets, which are cyclical. |
| • |
The market share of our customers in the communications, networking, aerospace, defense, instrumentation and industrial markets may change over time, reducing the potential value of our relationships with our existing customer base. |
| • |
The loss or decrease in sales among one of our top customers, or a material change in the terms on which they are willing to buy from us, could have a substantial negative impact on our sales and operating results. |
| • |
We may make acquisitions that are not successful, or we may fail to integrate acquired businesses into our operations properly. |
| • |
If we are unable to introduce innovative products, demand for our products may decrease. |
| • |
Our markets are highly competitive, and we may lose business to larger and better-financed competitors. |
| • |
Our success depends on our ability to retain key management and technical personnel and attracting, retaining, and training new technical personnel. |
| • |
We purchase certain key components and raw materials from single or limited sources and could lose sales if these sources fail to fulfill our needs for any reason. |
| • |
As a supplier to U.S. Government defense contractors, we are subject to a number of procurement regulations and other requirements and could be adversely affected by changes in regulations or any negative findings from a U.S. Government audit or investigation. |
| • |
Our products are complex and may contain errors or design flaws, which could be costly to correct. |
| • |
Communications and network infrastructure equipment manufacturers increasingly rely upon contract manufacturers, thereby diminishing our ability to sell our products directly to those equipment manufacturers. |
| • |
Future changes in our environmental liability and compliance obligations may increase costs and decrease profitability. |
| • |
We rely on information technology systems to conduct our business, and disruption, failure or security breaches of these systems could adversely affect our business and results of operations. |
| • |
Cybersecurity risks and cyber incidents may adversely affect our business by causing a disruption to our operations, a compromise or corruption of our confidential information, and/or damage to our business relationships, all of which could negatively impact our financial results. |
| • |
Significant legal proceedings may adversely affect our business, results of operations, or financial condition. |
Risks Related to Our Securities
| • |
The price of our common stock has fluctuated considerably and is likely to remain volatile, in part due to the limited market for our common stock. |
| • |
Our officers, directors and 10% or greater stockholders have significant voting power and may vote their shares in a manner that is not in the best interest of other stockholders. |
| • |
The warrants to purchase shares of our common stock may not have any value. |
| • |
An active trading market for the warrants to purchase shares of our common stock may not be sustained. |
| • |
Holders of the warrants to purchase shares of our common stock will have no rights as a common stockholder until such holders exercise their warrants and acquire shares of our common stock. |
| • |
Adjustments to the exercise price of the warrants, or the number of shares of common stock for which the warrants are exercisable, following certain corporate events may not fully compensate warrant holders for the value they would have received if they held the common stock underlying the warrants at the time of such events. |
| • |
As a smaller reporting company, we are subject to scaled disclosure requirements that may make it more challenging for investors to analyze our results of operations and financial prospects. |
Risks Related to the Separation
| • |
We may be unable to achieve some or all of the expected benefits of the Separation, and the Separation may adversely affect our business. |
| • |
The Separation could result in substantial tax liability to us and our stockholders. |
| • |
The distribution of MtronPTI common stock may not qualify for tax-free treatment. |
| • |
As a result of the Separation, certain of our directors and officers may have actual or potential conflicts of interest because of their positions or relationships with MtronPTI. |
Risks Related to Our Structure
We have engaged, and in the future may engage, in transactions with our affiliates.
We have engaged, and in the future may engage, in transactions with our affiliates. Certain cash equivalents and marketable securities held and invested in various mutual funds are managed or advised by GAMCO Investors, Inc. or one of its subsidiaries (collectively, "GAMCO" or the "Fund Manager"), which is related to the Company through certain of our shareholders, who is also a greater than 10% stockholders and serves as an executive officer of the Fund Manager. In addition, we may in the future invest in entities in which the Fund Manager also invests. We also have purchased and may in the future purchase entities or investments from the Fund Manager or its affiliates.
All investments, including those in related party mutual funds, are overseen by the independent Investment Committee of the Board of Directors (the "Investment Committee"). The Investment Committee meets regularly to review the alternatives and has determined the current investments most reflect the Company's objective of lower cost, market return and adherence to having a larger proportion of underlying investments directly in United States Treasuries.
We are subject to the risk of becoming an investment company under the Investment Company Act.
Because we are a holding company and a significant portion of our assets may, from time to time, consist of investments in companies in which we own less than a 50% interest, we run the risk of inadvertently becoming an investment company that is required to register under the Investment Company Act. Events beyond our control, including significant appreciation or depreciation in the market value of certain of our publicly traded holdings or adverse developments with respect to our ownership of certain of our subsidiaries, could result in our inadvertently becoming an investment company that is required to register under the Investment Company Act. Transactions involving the sale of certain assets could result in our being considered an investment company. Following such events or transactions, an exemption under the Investment Company Act would provide us up to one year to take steps to avoid becoming classified as an investment company. We expect to take steps to avoid becoming classified as an investment company, but no assurance can be made that we will successfully be able to take the steps necessary to avoid becoming classified as an investment company.
If we are unsuccessful, then we will be required to register as a registered investment company and will be subject to extensive, restrictive and potentially adverse regulations relating to, among other things, operating methods, management, capital structure, dividends and transactions with affiliates. Registered investment companies are not permitted to operate their business in the manner in which we currently operate our business, nor are registered investment companies permitted to have many of the relationships that we have with our affiliated companies.
If it were established that we were an investment company and did not register as an investment company when required to do so, there would be a risk, among other material adverse consequences, that we could become subject to monetary penalties or injunctive relief, or both, in an action brought by the SEC, that we would be unable to enforce contracts with third parties or that third parties could seek to obtain rescission of transactions with us undertaken during the period it was established that we were an unregistered investment company.
We may structure transactions in a less advantageous manner to avoid becoming subject to the Investment Company Act.
In order not to become an investment company required to register under the Investment Company Act, we monitor the value of our investments and structure our operations and transactions to qualify for exemptions under the Investment Company Act. As a result, we may structure transactions in a less advantageous manner than if we did not have Investment Company Act concerns, or we may avoid otherwise economically desirable transactions due to those concerns.
Risks Relating to Liquidity and Capital Requirements
We are a holding company and depend on the businesses of our subsidiaries to satisfy our obligations.
We are a holding company and we conduct substantially all of our business activities through our subsidiaries. In addition to cash and cash equivalents, U.S. government and agency obligations, marketable equity and debt securities and other short-term investments, our assets consist primarily of investments in our subsidiaries. Moreover, if we make significant investments in new operating businesses, it is likely that we will reduce our liquid assets in order to fund those investments and the ongoing operations of our subsidiaries. Consequently, our cash flow and our ability to meet our contractual obligations likely will depend on the cash flow of our subsidiaries and the payment of funds to us by our subsidiaries in the form of dividends, distributions, loans or otherwise.
The operating results of our subsidiaries may not be sufficient to make distributions to us. In addition, our subsidiaries are not obligated to make funds available to us and distributions and intercompany transfers from our subsidiaries to us may be restricted by applicable law or covenants contained in debt agreements and other agreements to which these subsidiaries may be subject or enter into in the future.
We have made significant investments and negative performance of those investments may result in a significant decline in the value and could impact our cash flows.
As of December 31, 2023, we had investments in Cash and cash equivalents and Marketable securities with a fair market value of $40,733, which may be accessed on short notice to satisfy our liquidity needs. However, if the investments experience negative performance, the value of these investments will be negatively impacted, which could have a material adverse effect on our operating results, cash flows and financial position.
Risks Relating to Our Merchant Investment Business
The Company has made and may make material investments in special purpose vehicles that may not be successful.
The Company invested $6.1 million in LGL Systems, the sponsor of LGL I, a NYSE-listed SPAC trading under the symbol "DFNS" which later completed a business combination with IronNet Cybersecurity, Inc. and began trading on the NYSE under the symbol "IRNT."
The Company may form additional SPVs to facilitate the acquisition of companies in the future, which may be material to the Company. There is no assurance that such activity may occur, that the Company will have appropriate insurance for such an occurrence, or that its Board will endorse such activity. There is no assurance that any SPAC will be successful with IPO, that any SPAC or SPV will complete a business combination, or that any business combination will be successful. If invested, the Company can lose its entire investment in the SPAC if a business combination is not completed within 24 months of the SPAC’s IPO or if the business combination is not successful, which may adversely impact the Company’s stockholder value. If an investment is made through an SPV, the investment may not be successful, which could also impact the Company's stockholder value.
Our investments may be subject to significant uncertainties.
Our investments may not be successful for many reasons, including, but not limited to:
| • |
fluctuations of or sustained increases in interest rates; |
| • |
lack of control in minority investments; |
| • |
worsening of general economic and market conditions; |
| • |
lack of diversification; |
| • |
lack of success of the Merchant Investment business’s strategies; |
| • |
inflationary conditions; |
| • |
fluctuations of U.S. dollar exchange rates; and |
| • |
adverse legal and regulatory developments that may affect particular businesses. |
The historical financial information for our Merchant Investment business is not necessarily indicative of our future performance.
Our Merchant Investment business’s financial information is driven by the amount of funds allocated to the Merchant Investment business and the performance of the underlying investments. Future funds allocated to the Merchant Investment business may increase or decrease based on the contributions and redemptions by our holding company. Additionally, historical performance results of the Merchant Investment business are not indicative of future results as past market conditions, investment opportunities and investment decisions may not occur in the future. Changes in general market conditions coupled with changes in exposure to short and long positions have significant impact on our Merchant Investment business results of operations and the comparability of results of operations year over year and as such, future results of operations will be impacted by our future exposures and future market conditions, which may not be consistent with prior trends. Additionally, future returns may be affected by additional risks, including risks of the industries and businesses in which a particular fund invests.
The Merchant Investment business’s investment strategy involves numerous and significant risks, including the risk that we may lose some or all of our investments in the Merchant Investment business. This risk may be magnified due to concentration of investments and investments in undervalued securities.
Our Merchant Investment business’s revenue depends on the investments made by the Merchant Investment business. There are numerous and significant risks associated with these investments, certain of which are described in this risk factor and in other risk factors set forth herein. Certain investment positions held by the Merchant Investment business may be illiquid. The Merchant Investment business may own restricted or non-publicly traded securities and securities traded on foreign exchanges. We may also have significant influence with respect to certain companies owned by the Merchant Investment business, including representation on the board of directors of certain companies, and may be subject to trading restrictions with respect to specific positions in the Merchant Investment business at any particular time. These investments and trading restrictions could prevent the Merchant Investment business from liquidating unfavorable positions promptly and subject the Merchant Investment business to substantial losses.
At any given time, the Merchant Investment business’s assets may become highly concentrated within a particular company, industry, asset category, trading style or financial or economic market. In that event, the Merchant Investment business’s investment portfolio will be more susceptible to fluctuations in value resulting from adverse events, developments or economic conditions affecting the performance of that particular company, industry, asset category, trading style or economic market than a less concentrated portfolio would be. As a result, the Merchant Investment business’s investment portfolio’s aggregate returns may be volatile and may be affected substantially by the performance of only one or a few holdings.
The Merchant Investment business seeks to invest in securities that are undervalued. The identification of investment opportunities in undervalued securities is challenging, and there are no assurances that such opportunities will be successfully recognized or acquired. While investments in undervalued securities offer the opportunity for above-average capital appreciation, these investments involve a high degree of financial risk and can result in substantial losses. Returns generated from the Merchant Investment business’s investments may not adequately compensate for the business and financial risks assumed.
From time to time, the Merchant Investment business may invest in bonds or other fixed income securities, such as commercial paper and higher yielding (and, therefore, higher risk) debt securities. It is likely that a major economic recession could severely disrupt the market for such securities and may have a material adverse impact on the value of such securities. In addition, it is likely that any such economic downturn could adversely affect the ability of the issuers of such securities to repay principal and pay interest thereon and increase the incidence of default for such securities.
For reasons not necessarily attributable to any of the risks set forth in this Report (e.g., supply/demand imbalances or other market forces), the prices of the securities in which the Merchant Investment business invest may decline substantially. In particular, purchasing assets at what may appear to be undervalued levels is no guarantee that these assets will not be trading at even more undervalued or otherwise lower levels at a future time of valuation or at the time of sale.
The prices of financial instruments in which the Merchant Investment business may invest can be highly volatile. Price movements of forward and other derivative contracts in which the Merchant Investment business’s assets may be invested are influenced by, among other things, interest rates, changing supply and demand relationships, trade, fiscal, monetary and exchange control programs and policies of governments, and national and international political and economic events and policies. The Merchant Investment business is subject to the risk of failure of any of the exchanges on which their positions trade or of their clearinghouses.
We may not be able to identify suitable investments, and our investments may not result in favorable returns or may result in losses.
The equity securities in which we may invest may include common stock, preferred stock and securities convertible into common stock, as well as warrants to purchase these securities. The debt securities in which we may invest may include bonds, debentures, notes or non-rated mortgage-related securities, municipal obligations, bank debt and mezzanine loans. Certain of these securities may include lower rated or non-rated securities, which may provide the potential for higher yields and therefore may entail higher risk and may include the securities of bankrupt or distressed companies. In addition, we may engage in various investment techniques, including derivatives, options and futures transactions, foreign currency transactions, "short" sales and leveraging for either hedging or other purposes. We may concentrate our activities by owning significant or controlling interests in certain investments. We may not be successful in finding suitable opportunities to invest our cash and our strategy of investing in undervalued assets may expose us to numerous risks.
The Merchant Investment business may make investments in companies we do not control.
Investments by the Merchant Investment business may include investments in debt or equity securities of publicly traded companies or private companies that we do not control. Such investments may be acquired by the Merchant Investment business through open market trading activities or through purchases of securities from the issuer. These investments will be subject to the risk that the company in which the investment is made may make business, financial or management decisions with which our Merchant Investment business disagree or that the majority of stakeholders or the management of the company may take risks or otherwise act in a manner that does not serve the best interests of the Merchant Investment business. In addition, the Merchant Investment business may make investments in which it shares control over the investment with co-investors, which may make it more difficult for it to implement its investment approach or exit the investment when it otherwise would. If any of the foregoing were to occur, the values of the investments by the Merchant Investment business could decrease and our Merchant Investment business revenues could suffer as a result.
The use of leverage in investments by the Merchant Investment business may pose a significant degree of risk and may enhance the possibility of significant loss in the value of the investments in the Merchant Investment business.
The Merchant Investment business may leverage its capital if management believes that the use of leverage may enable the Merchant Investment business to achieve a higher rate of return. Accordingly, the Merchant Investment business may pledge their securities in order to borrow additional funds for investment purposes. The Merchant Investment business may also leverage their investment return with options, short sales, swaps, forwards and other derivative instruments. The amount of borrowings that the Merchant Investment business may have outstanding at any time may be substantial in relation to their capital. While leverage may present opportunities for increasing the Merchant Investment business’s total return, leverage may increase losses as well. Accordingly, any event that adversely affects the value of an investment by the Merchant Investment business would be magnified to the extent such fund is leveraged. The cumulative effect of the use of leverage by the Merchant Investment business in a market that moves adversely to the Merchant Investment business’s investments could result in a substantial loss to the Merchant Investment business that would be greater than if the Merchant Investment business were not leveraged. There is no assurance that leverage will be available on acceptable terms, if at all.
In general, the use of short-term margin borrowings results in certain additional risks to the Merchant Investment business. For example, should the securities pledged to brokers to secure any Merchant Investment business’s margin accounts decline in value, the Merchant Investment business could be subject to a "margin call," pursuant to which it must either deposit additional funds or securities with the broker, or suffer mandatory liquidation of the pledged securities to compensate for the decline in value. In the event of a sudden drop in the value of any of the Merchant Investment business’s assets, the Merchant Investment business might not be able to liquidate assets quickly enough to satisfy its margin requirements.
The Merchant Investment business may enter into repurchase and reverse repurchase agreements. When the Merchant Investment business enters into a repurchase agreement, it "sells" securities issued by the U.S. or a non-U.S. government, or agencies thereof, to a broker-dealer or financial institution, and agrees to repurchase such securities for the price paid by the broker-dealer or financial institution, plus interest at a negotiated rate. In a reverse repurchase transaction, the Merchant Investment business "buys" securities issued by the U.S. or a non-U.S. government, or agencies thereof, from a broker-dealer or financial institution, subject to the obligation of the broker-dealer or financial institution to repurchase such securities at the price paid by the Merchant Investment business, plus interest at a negotiated rate. The use of repurchase and reverse repurchase agreements by any of the Merchant Investment business involves certain risks. For example, if the seller of securities to the Merchant Investment business under a reverse repurchase agreement defaults on its obligation to repurchase the underlying securities, as a result of its bankruptcy or otherwise, the Merchant Investment business will seek to dispose of such securities, which action could involve costs or delays. If the seller becomes insolvent and subject to liquidation or reorganization under applicable bankruptcy or other laws, the Merchant Investment business’s ability to dispose of the underlying securities may be restricted. Finally, if a seller defaults on its obligation to repurchase securities under a reverse repurchase agreement, the Merchant Investment business may suffer a loss to the extent it is forced to liquidate its position in the market, and proceeds from the sale of the underlying securities are less than the repurchase price agreed to by the defaulting seller.
The financing used by the Merchant Investment business to leverage its portfolio will be extended by securities brokers and dealers in the marketplace in which the Merchant Investment business invest. While the Merchant Investment business will attempt to negotiate the terms of these financing arrangements with such brokers and dealers, its ability to do so will be limited. The Merchant Investment business is therefore subject to changes in the value that the broker-dealer ascribes to a given security or position, the amount of margin required to support such security or position, the borrowing rate to finance such security or position and/or such broker-dealer’s willingness to continue to provide any such credit to the Merchant Investment business. Because the Merchant Investment business currently have no alternative credit facility which could be used to finance its portfolio in the absence of financing from broker-dealers, it could be forced to liquidate its portfolio on short notice to meet its financing obligations. The forced liquidation of all or a portion of the Merchant Investment business’s portfolios at distressed prices could result in significant losses to the Merchant Investment business.
The possibility of increased regulation could result in additional burdens on our Merchant Investment business.
The Dodd-Frank Wall Street Reform and Consumer Protection Act (the "Reform Act"), enacted into law in July 2010, resulted in regulations affecting almost every part of the financial services industry.
The regulatory environment in which our Merchant Investment business operates is subject to further regulation in addition to the rules already promulgated, including the Reform Act. Our Merchant Investment business may be adversely affected by the enactment of new or revised regulations, or changes in the interpretation or enforcement of rules and regulations imposed by the SEC, other U.S. or foreign governmental regulatory authorities or self-regulatory organizations that supervise the financial markets. Such changes may limit the scope of investment activities that may be undertaken by the Merchant Investment business’s managers. Any such changes could increase the cost of our Merchant Investment business doing business and/or materially adversely impact its profitability. Additionally, the securities and futures markets are subject to comprehensive statutes, regulations and margin requirements. The SEC, other regulators and self-regulatory organizations and exchanges have taken and are authorized to take extraordinary actions in the event of market emergencies. The regulation of derivatives transactions and funds that engage in such transactions is an evolving area of law and is subject to modification by government and judicial action. The effect of any future regulatory change on the Merchant Investment business and the Merchant Investment business could be substantial and adverse.
The ability to hedge investments successfully is subject to numerous risks.
The Merchant Investment business may utilize financial instruments, both for investment purposes and for risk management purposes in order to (i) protect against possible changes in the market value of the Merchant Investment business’s investment portfolios resulting from fluctuations in the securities markets and changes in interest rates; (ii) protect the Merchant Investment business’s unrealized gains in the value of its investment portfolios; (iii) facilitate the sale of any such investments; (iv) enhance or preserve returns, spreads or gains on any investment in the Merchant Investment business’s portfolio; (v) hedge the interest rate or currency exchange rate on any of the Merchant Investment business’s liabilities or assets; (vi) protect against any increase in the price of any securities our Merchant Investment business anticipate purchasing at a later date; or (vii) for any other reason that our Merchant Investment business deems appropriate.
The success of any hedging activities will depend, in part, upon the degree of correlation between the performance of the instruments used in the hedging strategy and the performance of the portfolio investments being hedged. However, hedging techniques may not always be possible or effective in limiting potential risks of loss. Since the characteristics of many securities change as markets change or time passes, the success of our Merchant Investment business’s hedging strategy will also be subject to the ability of our Merchant Investment business to continually recalculate, readjust and execute hedges in an efficient and timely manner. While the Merchant Investment business may enter into hedging transactions to seek to reduce risk, such transactions may result in a poorer overall performance for the Merchant Investment business than if it had not engaged in such hedging transactions. For a variety of reasons, the Merchant Investment business may not seek to establish a perfect correlation between the hedging instruments utilized and the portfolio holdings being hedged. Such an imperfect correlation may prevent the Merchant Investment business from achieving the intended hedge or expose the Merchant Investment business to risk of loss. The Merchant Investment business does not intend to seek to hedge every position and may determine not to hedge against a particular risk for various reasons, including, but not limited to, because they do not regard the probability of the risk occurring to be sufficiently high as to justify the cost of the hedge. Our Merchant Investment business may not foresee the occurrence of the risk and therefore may not hedge against all risks.
The Merchant Investment business may invest in distressed securities, as well as bank loans, asset backed securities and mortgage- backed securities.
The Merchant Investment business may invest in securities of U.S. and non-U.S. issuers in weak financial condition, experiencing poor operating results, having substantial capital needs or negative net worth, facing special competitive or product obsolescence problems, or that are involved in bankruptcy or reorganization proceedings. Investments of this type may involve substantial financial, legal and business risks that can result in substantial, or at times even total, losses. The market prices of such securities are subject to abrupt and erratic market movements and above-average price volatility. It may take a number of years for the market price of such securities to reflect their intrinsic value. In liquidation (both in and out of bankruptcy) and other forms of corporate insolvency and reorganization, there exists the risk that the reorganization either will be unsuccessful (due to, for example, failure to obtain requisite approvals), will be delayed (for example, until various liabilities, actual or contingent, have been satisfied) or will result in a distribution of cash, assets or a new security the value of which will be less than the purchase price to the Merchant Investment business of the security in respect to which such distribution was made and the terms of which may render such security illiquid.
The Merchant Investment business may invest in companies that are based outside of the United States, which may expose the Merchant Investment business to additional risks not typically associated with investing in companies that are based in the United States.
Investments in securities of non-U.S. issuers (including non-U.S. governments) and securities denominated or whose prices are quoted in non-U.S. currencies pose, to the extent not successfully hedged, currency exchange risks (including blockage, devaluation and non-exchangeability), as well as a range of other potential risks, which could include expropriation, confiscatory taxation, imposition of withholding or other taxes on dividends, interest, capital gains or other income, political or social instability, illiquidity, price volatility and market manipulation. In addition, less information may be available regarding securities of non-U.S. issuers, and non-U.S. issuers may not be subject to accounting, auditing and financial reporting standards and requirements comparable to, or as uniform as, those of U.S. issuers. Transaction costs of investing in non-U.S. securities markets are generally higher than in the United States. There is generally less government supervision and regulation of exchanges, brokers and issuers than there is in the United States. The Merchant Investment business may have greater difficulty taking appropriate legal action in non-U.S. courts. Non-U.S. markets also have different clearance and settlement procedures which in some markets have at times failed to keep pace with the volume of transactions, thereby creating substantial delays and settlement failures that could adversely affect the Merchant Investment business’s performance. Investments in non-U.S. markets may result in imposition of non-U.S. taxes or withholding on income and gains recognized with respect to such securities. There can be no assurance that adverse developments with respect to such risks will not materially adversely affect the Merchant Investment business’s investments that are held in certain countries or the returns from these investments.
The Merchant Investment business’s investments are subject to numerous additional risks including those described below.
| • | Generally, there are few limitations set forth in the governing documents of the Merchant Investment business on the execution of its investment activities, which are subject to the sole discretion of our management and the Investment Committee of the Board of Directors. |
| • | The Merchant Investment business may buy or sell (or write) both call options and put options, and when it writes options, it may do so on a covered or an uncovered basis. When the Merchant Investment business sell (or write) an option, the risk can be substantially greater than when it buys an option. The seller of an uncovered call option bears the risk of an increase in the market price of the underlying security above the exercise price. The risk is theoretically unlimited unless the option is covered. If it is covered, the Merchant Investment business would forego the opportunity for profit on the underlying security should the market price of the security rise above the exercise price. Swaps and certain options and other custom instruments are subject to the risk of non-performance by the swap counterparty, including risks relating to the creditworthiness of the swap counterparty, market risk, liquidity risk and operations risk. |
| • | The Merchant Investment business may engage in short-selling, which is subject to a theoretically unlimited risk of loss because there is no limit on how much the price of a security may appreciate before the short position is closed out. The Merchant Investment business may be subject to losses if a security lender demands return of the borrowed securities and an alternative lending source cannot be found or if the Merchant Investment business are otherwise unable to borrow securities that are necessary to hedge its positions. There can be no assurance that the Merchant Investment business will be able to maintain the ability to borrow securities sold short. There also can be no assurance that the securities necessary to cover a short position will be available for purchase at or near prices quoted in the market. |
| • | The ability of the Merchant Investment business to execute a short selling strategy may be materially adversely impacted by temporary and/or new permanent rules, interpretations, prohibitions and restrictions adopted in response to adverse market events. Regulatory authorities may from time-to-time impose restrictions that adversely affect the Merchant Investment business’s ability to borrow certain securities in connection with short sale transactions. In addition, traditional lenders of securities might be less likely to lend securities under certain market conditions. As a result, the Merchant Investment business may not be able to effectively pursue a short selling strategy due to a limited supply of securities available for borrowing. |
| • | The Merchant Investment business may affect transactions through over-the-counter or inter-dealer markets. The participants in such markets are typically not subject to credit evaluation and regulatory oversight as are members of exchange-based markets. This exposes the Merchant Investment business to the risk that a counterparty will not settle a transaction in accordance with its terms and conditions because of a dispute over the terms of the contract (whether or not bona fide) or because of a credit or liquidity problem, thus causing the Merchant Investment business to suffer a loss. Such "counterparty risk" is accentuated for contracts with longer maturities where events may intervene to prevent settlement, or where the Merchant Investment business have concentrated its transactions with a single or small group of its counterparties. The Merchant Investment business is not restricted from dealing with any particular counterparty or from concentrating any or all of the Merchant Investment business’s transactions with one counterparty. |
| • | Credit risk may arise through a default by one of several large institutions that are dependent on one another to meet their liquidity or operational needs, so that a default by one institution causes a series of defaults by other institutions. This systemic risk may materially adversely affect the financial intermediaries (such as prime brokers, clearing agencies, clearing houses, banks, securities firms and exchanges) with which the Merchant Investment business interact on a daily basis. |
| • | The efficacy of investment and trading strategies depends largely on the ability to establish and maintain an overall market position in a combination of financial instruments. The Merchant Investment business’s trading orders may not be executed in a timely and efficient manner due to various circumstances, including systems failures or human error. In such event, the Merchant Investment business might only be able to acquire some but not all of the components of the position, or if the overall positions were to need adjustment, the Merchant Investment business might not be able to make such adjustment. As a result, the Merchant Investment business may not be able to achieve the market position selected by our Merchant Investment business and might incur a loss in liquidating their position. |
| • | The Merchant Investment business assets may be held in one or more accounts maintained for the Merchant Investment business by its prime brokers or at other brokers or custodian banks, which may be located in various jurisdictions. The prime broker, other brokers (including those acting as sub-custodians) and custodian banks are subject to various laws and regulations in the relevant jurisdictions in the event of their insolvency. Accordingly, the practical effect of these laws and their application to the Merchant Investment business’s assets may be subject to substantial variations, limitations and uncertainties. The insolvency of any of the prime brokers, local brokers, custodian banks or clearing corporations may result in the loss of all or a substantial portion of the Merchant Investment business’s assets or in a significant delay in the Merchant Investment business having access to those assets. |
| • | The Merchant Investment business may invest in synthetic instruments with various counterparties. In the event of the insolvency of any counterparty, the Merchant Investment business’s recourse will be limited to the collateral, if any, posted by the counterparty and, in the absence of collateral, the Merchant Investment business will be treated as a general creditor of the counterparty. While the Merchant Investment business expect that returns on a synthetic financial instrument may reflect those of each related reference security, as a result of the terms of the synthetic financial instrument and the assumption of the credit risk of the counterparty, a synthetic financial instrument may have a different expected return. The Merchant Investment business may also invest in credit default swaps. |
Risks Related to Our Business and Industry
Macroeconomic fluctuations may harm our business, results of operations and stock price.
Our business, financial condition, operating results and cash flows may be adversely affected by changes in global economic conditions and geopolitical risks, including credit market conditions, trade policies, levels of consumer and business confidence, commodity prices and availability, inflationary pressure, exchange rates, levels of government spending and deficits, political conditions, global pandemics, and other challenges that could affect the global economy including impacts associated with the continuing developments in the Russian war against Ukraine, sanctions which have been announced by the United States and other countries against Russia, conflicts in Israel and the Middle East, and attacks on cargo ships in the Red Sea, which have caused significant uncertainty, adding to continuing concerns about global trade flows, supply chain disruptions, higher transportation costs, higher inflation and increases in interest rates in the markets in which we operate. These economic and geopolitical conditions could affect businesses such as ours in a number of ways. Such conditions could have an adverse impact on our flexibility to react to changing economic and business conditions and on our ability to fund our operations. In addition, restrictions on credit availability could adversely affect the ability of our customers to make payments. Similarly, credit restrictions may adversely affect our supplier base and increase the potential for one or more of our suppliers to experience financial distress.
Inflation and changing interest rates may adversely affect our financial condition and results of operations.
Inflation in the United States decreased from 6.5% as of December 31, 2022 to 3.4% as of December 31, 2023, which is still above the U.S. Federal Reserve's long-term target of 2.0%. Although inflation is expected to continue to decrease in 2024, the continued higher inflation may have an adverse impact on our manufacturing cost of sales along with engineering, selling and administrative expenses, as these costs could increase at a rate higher than our revenue. The U.S. Federal Reserve raised the federal funds rate a total of four times throughout 2023, resulting in a range from 5.25% to 5.50% as of December 31, 2023. However, it is expected that the U.S. Federal Reserve will hold the federal funds rate steady or start to decrease it during 2024 to, among other things, control inflation. If interest rates start to decline, the returns generated by our investments in U.S. Treasuries could be adversely impacted.
We are currently dependent on a single line of manufacturing business.
As a result of the Separation of MtronPTI on October 7, 2022, we are engaged only in the design, manufacture and marketing of our electronic instruments product line that includes highly engineered products for the generation of time and frequency references for synchronization and control.
Given our reliance on this single line of business, any decline in demand for this product line or failure to achieve continued market acceptance of existing and new versions of this product line may harm our business and our financial condition. Additionally, unfavorable market conditions affecting this line of business would likely have a disproportionate impact on us in comparison with certain competitors, who have more diversified operations and multiple lines of business. Should this line of business fail to generate sufficient sales to support ongoing operations, there can be no assurance that we will be able to develop alternate business lines.
Our financial results vary significantly from period to period.
We experience fluctuations in our financial results. Some of the principal factors that contribute to these fluctuations include changes in demand for our products; our effectiveness in managing manufacturing processes, costs and inventory; our effectiveness in engineering and qualifying new product designs with our OEM customers and in managing the risks associated with offering those new products into production; changes in the cost and availability of raw materials, which often occur in the electronics manufacturing industry and which affect our margins and our ability to meet delivery schedules; macroeconomic and served industry conditions; and events that may affect our production capabilities, such as labor conditions and political instability. In addition, due to the prevailing economic climate and competitive differences between the various market segments which we serve, the mix of sales between our communications, networking, aerospace, defense, industrial and instrumentation market segments may affect our operating results from period to period.
For the years ended December 31, 2023 and 2022, we had a net income of approximately $269 and a net loss of $2,992, respectively. This fluctuation was a result of the sales of our investment in IronNet, Inc. in 2022, which resulted in significant net losses. Our operating income was derived from PTF, whose future rate of growth and profitability are highly dependent on the development and growth of demand for our products in the communications, networking, aerospace, defense, instrumentation and industrial markets, which are cyclical, as well as net investment income from investments held by the Company. We cannot be certain whether we will generate sufficient revenues or sufficiently manage expenses to sustain profitability. Further, our returns on our cash and investments may not be sufficient to cover operating losses from PTF.
Our order backlog may not be indicative of future revenues.
Our order backlog is comprised of orders that are subject to specific production release, orders under written contracts, oral and written orders from customers with which we have had long-standing relationships and written purchase orders from sales representatives. Our customers may order products from multiple sources to ensure timely delivery when backlog is particularly long and may cancel or defer orders without significant penalty. They also may cancel orders when business is weak, and inventories are excessive. As a result, we cannot provide assurances as to the portion of backlog orders to be filled in a given year, and our order backlog as of any particular date may not be representative of actual revenues for any subsequent period.
Our future rate of growth and profitability are highly dependent on the development and growth of the communications, networking, aerospace, defense, instrumentation and industrial markets, which are cyclical.
In 2023 and 2022, the majority of our revenues were derived from sales to manufacturers of equipment for the defense, aerospace, instrumentation and industrial markets for frequency and timing synchronization instruments and peripheral equipment, including indirect sales through distributors. During 2024, we expect a significant portion of our revenues to continue to be derived from sales to these manufacturers. Often OEMs and other service providers within these markets have experienced periods of capacity shortage and periods of excess capacity, as well as periods of either high or low demand for their products. In periods of excess capacity or low demand, purchases of capital equipment may be curtailed, including equipment that incorporates our products. A reduction in demand for the manufacture and purchase of equipment for these markets, whether due to cyclical, macroeconomic or other factors, or due to our reduced ability to compete based on cost or technical factors, could substantially reduce our net sales and operating results and adversely affect our financial condition. Moreover, if these markets fail to grow as expected, we may be unable to maintain or grow our revenues. The multiple variables which affect the communications, networking, aerospace, defense, instrumentation and industrial markets for our products, as well as the number of parties involved in the supply chain and manufacturing process, can impact inventory levels and lead to supply chain inefficiencies. As a result of these complexities, we have limited visibility to forecast revenue projections accurately for the near and medium-term timeframes.
The market share of our customers in the communications, networking, aerospace, defense, instrumentation and industrial markets may change over time, reducing the potential value of our relationships with our existing customer base.
We have developed long-term relationships with our existing customers, including pricing contracts, custom designs and approved vendor status. If these customers lose market share to other equipment manufacturers in the communications, networking, aerospace, defense, instrumentation and industrial markets with whom we do not have similar relationships, our ability to maintain revenue, margin or operating performance may be adversely affected.
The loss or decrease in sales among one of our top customers, or a material change in the terms on which they are willing to buy from us, could have a substantial negative impact on our sales and operating results.
A significant percentage of our sales has been, and is expected to be, concentrated among a relatively small number of customers. In 2023, the Company’s largest and second largest customers accounted for $399, or 23.1%, and $236, or 13.7%, respectively, of the Company’s net sales. In 2022, the Company’s largest and second largest customers accounted for $312, or 18.9%, and $195, or 11.8%, respectively, of the Company’s net sales. We anticipate that this concentration of sales among these customers will continue in the future. The loss of a significant customer, changes in customer buying behaviors or a substantial decrease in sales to such a customer could have a material adverse effect on our sales and operating results. In addition, any consolidation among our key customers may further increase our customer concentration risk.
Because our sales are concentrated, and the industry in which we operate is very competitive, we are under ongoing pressure from our customers to offer lower prices, extend payment terms, increase marketing and transportation allowances, provide enhanced rebates, discounts, rights of return and credits and offer other terms more favorable to these customers. These customer demands have put continued pressure on our operating margins and profitability and in the future could have a material adverse effect on our business, financial condition and results of operations.
We may make acquisitions that are not successful, or we may fail to integrate acquired businesses into our operations properly.
We intend to continue exploring opportunities to buy other businesses or technologies that could complement, enhance, or expand our current business or product line, or that might otherwise offer us growth opportunities. We may have difficulty finding such opportunities or, if such opportunities are identified, we may not be able to complete such transactions for reasons including a failure to secure necessary financing.
Any transactions that we are able to identify and complete may involve a number of risks, including:
| ‒ |
The diversion of our management’s attention from the management of our existing business to the integration of the operations and personnel of the acquired or combined business or joint venture; |
| ‒ |
Material business risks not identified in due diligence; |
| ‒ |
Possible adverse effects on our operating results during the integration process; |
| ‒ |
Substantial acquisition-related expenses, which would reduce our net income, if any, in future years; |
| ‒ |
The loss of key employees and customers as a result of changes in management; and |
| ‒ |
Our possible inability to achieve the intended objectives of the transaction. |
In addition, we may not be able to integrate, operate, maintain or manage, successfully or profitably, our newly acquired operations or employees. We may not be able to maintain uniform standards, controls, policies and procedures, and this may lead to operational inefficiencies.
Any of these difficulties could have a material adverse effect on our business, financial condition, results of operations and cash flows.
If we are unable to introduce innovative products, demand for our products may decrease.
Our future operating results are dependent on our ability to develop, introduce and market innovative products continually, to modify existing products, to respond to technological change and to customize some of our products to meet customer requirements. There are numerous risks inherent in this process, including the risks that we will be unable to anticipate the direction of technological change or that we will be unable to develop and market new products and applications in a timely or cost-effective manner to satisfy customer demand.
Our markets are highly competitive, and we may lose business to larger and better-financed competitors.
Our markets are highly competitive worldwide, with low transportation costs and few import barriers. We compete principally on the basis of product quality and reliability, availability, customer service, technological innovation, timely delivery and price. Within the industries in which we compete, competition has become increasingly concentrated and global in recent years.
Many of our major competitors, some of which are larger than us, and potential competitors have substantially greater financial resources and more extensive engineering, manufacturing, marketing and customer support capabilities. If we are unable to successfully compete against current and future competitors, our operating results will be adversely affected.
Our success depends on our ability to retain key management and technical personnel and attracting, retaining, and training new technical personnel.
Our future growth and success will depend in large part upon our ability to recruit highly-skilled technical personnel, including engineers, and to retain our existing management and technical personnel. There is a labor shortage in the markets in which we operate which are highly competitive, and some of our operations are not located in highly populated areas. As a result, we may not be able to recruit and retain key personnel. Our failure to hire, retain or adequately train key personnel could have a negative impact on our performance.
We purchase certain key components and raw materials from single or limited sources and could lose sales if these sources fail to fulfill our needs for any reason.
If single-source components or key raw materials were to become unavailable on satisfactory terms, and we could not obtain comparable replacement components or raw materials from other sources in a timely manner, our business, results of operations and financial condition could be harmed. On occasion, one or more of the components used in our products have become unavailable, resulting in unanticipated redesign and related delays in shipments. Changes in global economic and geopolitical conditions have disrupted supply chains and the ability to obtain components and raw materials around the world for all companies, including us. We cannot give assurance that we will be able to obtain the necessary components and raw materials necessary to conduct our business. In addition, our suppliers may be impacted by compliance with environmental regulations including RoHS and Waste Electrical and Electronic Equipment ("WEEE"), which could disrupt the supply of components or raw materials or cause additional costs for us to implement new components or raw materials into our manufacturing processes.
As a supplier to U.S. Government defense contractors, we are subject to a number of procurement regulations and other requirements and could be adversely affected by changes in regulations or any negative findings from a U.S. Government audit or investigation.
As a supplier to certain U.S. Government defense contractors, we must comply with certain procurement regulations and other requirements. Maintaining registration under the SAM is critical in order to receive U.S. Government contracts. As a small business we obtain preferential treatment for awards from tier one Government contractors however to maintain this position we are required to submit annually "Representation and Certification" documents attesting to our size, revenue, and internal controls for anti-discrimination, avoidance of counterfeit components, and a number of other federally mandated issues.
From time to time, we may also be subject to U.S. Government investigations relating to our or our customers’ operations. In particular, for international business, we are required to submit a request for AES validation used by U.S. Government agencies to measure the compliance of U.S. exports with U.S. export control laws. The cost of cooperating or complying with such audits or investigations may adversely affect our financial results.
Our products are complex and may contain errors or design flaws, which could be costly to correct.
When we release new products, or new versions of existing products, they may contain undetected or unresolved errors or defects. The vast majority of our products are custom designed for requirements of specific OEM systems. The expected business life of these products ranges from less than one year to more than 10 years depending on the application. Some of the customizations are modest changes to existing product designs while others are major product redesigns or new product platforms.
Despite testing, errors or defects may be found in new products or upgrades after the commencement of commercial shipments. Undetected errors and design flaws have occurred in the past and could occur in the future. These errors could result in delays, loss of market acceptance and sales, diversion of development resources, damage to the Company’s reputation, product liability claims and legal action by its customers and third parties, failure to attract new customers and increased service costs.
Communications and network infrastructure equipment manufacturers increasingly rely upon contract manufacturers, thereby diminishing our ability to sell our products directly to those equipment manufacturers.
There is a continuing trend among communications and network infrastructure equipment manufacturers to outsource the manufacturing of their equipment or components. As a result, our ability to persuade these OEMs to utilize our products in customer designs could be reduced and, in the absence of a manufacturer’s specification of our products, the prices that we can charge for them may be subject to greater competition.
Future changes in our environmental liability and compliance obligations may increase costs and decrease profitability.
Our present and past manufacturing operations, products, and/or product packaging are subject to environmental laws and regulations governing air emissions, wastewater discharges, and the handling, disposal and remediation of hazardous substances, wastes and other chemicals. In addition, more stringent environmental regulations may be enacted in the future, and we cannot presently determine the modifications, if any, in our operations that any future regulations might require, or the cost of compliance that would be associated with such regulations.
Environmental laws and regulations may cause us to change our manufacturing processes, redesign some of our products, and change components to eliminate some substances in our products in order to be able to continue to offer them for sale.
We rely on information technology systems to conduct our business, and disruption, failure or security breaches of these systems could adversely affect our business and results of operations.
We rely on information technology ("IT") systems in order to achieve our business objectives. We also rely upon industry accepted security measures and technology to securely maintain confidential information maintained on our IT systems. However, our portfolio of hardware and software products, solutions and services and our enterprise IT systems may be vulnerable to damage or disruption caused by circumstances beyond our control such as catastrophic events, power outages, natural disasters, computer system or network failures, computer viruses, cyber-attacks or other malicious software programs. The failure or disruption of our IT systems to perform as anticipated for any reason could disrupt our business and result in decreased performance, significant remediation costs, transaction errors, loss of data, processing inefficiencies, downtime, litigation and the loss of suppliers or customers. A significant disruption or failure could have a material adverse effect on our business operations, financial performance and financial condition.
Cybersecurity risks and cyber incidents may adversely affect our business by causing a disruption to our operations, a compromise or corruption of our confidential information, and/or damage to our business relationships, all of which could negatively impact our financial results.
A cyber incident is considered to be any adverse event that threatens the confidentiality, integrity or availability of our information resources. These incidents may be an intentional attack or an unintentional event and could involve gaining unauthorized access to our information systems for purposes of misappropriating assets, stealing confidential information, corrupting data or causing operational disruption. The result of these incidents may include disrupted operations, misstated or unreliable financial data, liability for stolen assets or information, increased cybersecurity protection and insurance costs, litigation and damage to our investor relationships. As our reliance on technology increases, so will the risks posed to our information systems, both internal and those we outsource. There is no guarantee that any processes, procedures and internal controls we have implemented or will implement will prevent cyber intrusions, which could have a negative impact on our financial results, operations, business relationships or confidential information.
Significant legal proceedings may adversely affect our business, results of operations, or financial condition.
LGL Group, our subsidiaries, and their respective officers and directors may be subject to legal action in the ordinary course of our manufacturing and investment operations brought by holders of LGL Group securities, customers, employees, partners, investors, or others. Some of these legal proceedings may be brought on behalf of a class. Plaintiffs may seek large or indeterminate amounts of damage, including compensatory, liquidated, treble and/or punitive damages. Our reserves for litigation may be inadequate and insurance coverage may not be available or may be declined for certain matters. It is therefore inherently difficult to predict the size or scope of potential future losses arising from them, and developments in these matters could have a material adverse impact on our consolidated financial condition or our consolidated results of operations.
Risks Related to Our Securities
The price of our common stock has fluctuated considerably and is likely to remain volatile, in part due to the limited market for our common stock.
From January 1, 2023 through December 31, 2023, the high and low closing prices for our common stock were $6.14 and $3.96, respectively. There is a limited public market for our common stock, and we cannot provide assurances that a more active trading market will develop or be sustained. As a result of limited trading volume in our common stock, the purchase or sale of a relatively small number of shares could result in significant price fluctuations and it may be difficult for holders to sell their shares without depressing the market price for our common stock.
Additionally, the market price of our common stock may continue to fluctuate significantly in response to a number of factors, some of which are beyond our control, including the following:
| ‒ |
General economic conditions affecting the availability of long-term or short-term credit facilities, the purchasing and payment patterns of our customers, or the requirements imposed by our suppliers; |
| ‒ |
Economic conditions in our industry and in the industries of our customers and suppliers; |
| ‒ |
Changes in financial estimates or investment recommendations by securities analysts relating to our common stock; |
| ‒ |
Market reaction to our reported financial results; |
| ‒ |
Loss of a major customer; |
| ‒ |
Announcements by us or our competitors of significant contracts, acquisitions, strategic partnerships, joint ventures or capital commitments; and |
| ‒ |
Changes in key personnel. |
Our officers, directors and 10% or greater stockholders have significant voting power and may vote their shares in a manner that is not in the best interest of other stockholders.
The warrants to purchase shares of our common stock may not have any value.
The warrants to purchase shares of our common stock are "modified European style warrants". Before the Separation, the warrants had an exercise price of $12.50 per share and only become exercisable on the earlier of (i) the expiration date, November 16, 2025, and (ii) such date that the 30-day volume weighted average price per share ("VWAP") of our common stock was greater than or equal to $17.50. Subsequent to the Separation, the warrant exercise price of $12.50 was adjusted to $4.75, and the warrant trigger price for potential acceleration of the exercise date of $17.50 was adjusted to $6.65. The previously announced distribution of MtronPTI shares under the Separation was a qualifying dilutive event that required an adjustment under Section 10 of the warrant agreement, with the exercise price of the warrants and the trigger price for the potential acceleration of the exercise date for its warrants adjusted using the calculation provided within the warrant agreement.
Once the warrants become exercisable, they may be exercised in accordance with the terms of the warrant agreement until their expiration.
This exercise price does not necessarily bear any relationship to established criteria for valuation of our common stock, such as book value per share, cash flows, or earnings; and the holder of such warrant should not consider this exercise price as an indication of the current or future market price of our common stock. There can be no assurance that the market price of our common stock will exceed $4.75 per share at any time, on the expiration date of the warrants, November 16, 2025, or at any other time the warrants may be exercised. If the warrants only become exercisable on the expiration date and the market price of our common stock on such date does not exceed $4.75 per share, the warrants will be of no value.
There can be no assurance that the 30-day VWAP of our common stock will be greater than or equal to $6.65 at any time prior to the expiration date of the warrants, November 16, 2025. As a result, the warrants may become exercisable only on the expiration date. If the warrants may be exercised only on the expiration date and the holder thereof does not exercise its warrants on that date, such warrants will expire and be of no value.
An active trading market for the warrants to purchase shares of our common stock may not be sustained.
If an active market for the warrants to purchase shares of our common stock is not sustained, it may be difficult for the holders thereof to sell such warrants without depressing the market price for such securities.
Holders of the warrants to purchase shares of our common stock will have no rights as a common stockholder until such holders exercise their warrants and acquire shares of our common stock.
Until warrant holders acquire shares of our common stock upon exercise of the warrants, warrant holders will have no rights with respect to the shares of our common stock underlying such warrants. Upon the acquisition of shares of our common stock upon exercise of the warrants, the holders thereof will be entitled to exercise the rights of a common stockholder only as to matters for which the record date for the matter occurs after the exercise date of the warrants.
Adjustments to the exercise price of the warrants, or the number of shares of common stock for which the warrants are exercisable, following certain corporate events may not fully compensate warrant holders for the value they would have received if they held the common stock underlying the warrants at the time of such events.
The warrants provide for adjustments to the exercise price of the warrants following a number of corporate events, including (i) our issuance of a stock dividend or the subdivision or combination of our common stock, (ii) our issuance of rights, options or warrants to purchase our common stock at a price below the 10-day VWAP of our common stock, (iii) a distribution of capital stock of the Company or any subsidiary other than our common stock, rights to acquire such capital stock, evidences of indebtedness or assets, (iv) our issuance of a cash dividend on our common stock, and (v) certain tender offers for our common stock by the Company or one or more of our wholly-owned subsidiaries. The warrants also provide for adjustments to the number of shares of common stock for which the warrants are exercisable following our issuance of a stock dividend or the subdivision or combination of our common stock. Any adjustment made to the exercise price of the warrants or the number of shares of common stock for which the warrants are exercisable following a corporate event in accordance with these provisions may not fully compensate warrant holders for the value they would have received if they held the common stock underlying the warrants at the time of the event.
As a smaller reporting company, we are subject to scaled disclosure requirements that may make it more challenging for investors to analyze our results of operations and financial prospects.
Currently, we are a "smaller reporting company," meaning that our outstanding common stock held by non-affiliates had a market value of less than $250 million as of June 30, 2023. As a "smaller reporting company," we are able to provide simplified executive compensation disclosures in our filings; are exempt from the provisions of Section 404(b) of the Sarbanes-Oxley Act requiring that independent registered public accounting firms provide an attestation report on the effectiveness of internal control over financial reporting; and have certain other decreased disclosure obligations in our SEC filings, including, being required to provide only two years of audited financial statements in annual reports. Consequently, it may be more challenging for investors to analyze our results of operations and financial prospects.
Risks Related to the Separation
We may be unable to achieve some or all of the expected benefits of the Separation, and the Separation may adversely affect our business.
Although we believe that separating MtronPTI into a stand-alone, publicly traded company has provided financial, operational and other benefits to us and our stockholders, we cannot provide assurance that we will achieve the full strategic and financial benefits expected from the Separation. If we do not realize the intended benefits of the Separation, we could suffer a material adverse effect on our business, financial conditions, results of operations and cash flows.
The Separation could result in substantial tax liability to us and our stockholders.
We received an opinion of a tax expert to the effect that, for U.S. federal income tax purposes, the Separation qualifies for tax-free treatment under certain sections of the Internal Revenue Code. However, the opinion relies on certain assumptions, representations and undertakings, including those relating to the past and future conduct of our business, and the opinion would not be valid if such assumptions, representations and undertakings were incorrect. Furthermore, the opinion is not binding on the Internal Revenue Service ("IRS") or the courts. If, notwithstanding receipt of the opinion, the Separation or certain related transactions are determined to be taxable, we would be subject to a substantial tax liability. In addition, if the Separation is taxable, each holder of our common stock who received shares of M-tron Industries, Inc. in connection with the Separation would generally be treated as receiving a taxable dividend in an amount equal to the fair value of the shares received.
Even if the Separation otherwise qualifies as a tax-free transaction, the distribution would be taxable to us (but not to our stockholders) in certain circumstances if future significant acquisitions of our stock or the stock of M-tron Industries, Inc. are determined to be part of a plan or series of related transactions that included the Separation. In this event, the resulting tax liability could be substantial. In connection with the Separation, we entered into a Tax Sharing and Indemnification Agreement with M-tron Industries, Inc., pursuant to which M-tron Industries, Inc. agreed to not enter into any transaction that could cause the Separation or any related transactions to be taxable to us without our consent and to indemnify us for any tax liability resulting from any such transaction. In addition, these potential tax liabilities may discourage, delay or prevent a change of control of us.
The distribution of MtronPTI common stock may not qualify for tax-free treatment.
There is a risk that the Distribution may not qualify for tax-free treatment and, accordingly, will be a taxable transaction to the Company’s stockholders. While the Distribution is intended to be tax-free under Section 355 of the Internal Revenue Code of 1986, as amended (the "Code"), and while we believe that the Company’s stockholders should not recognize gain or loss as a result of the Distribution and that no amount should be included in their income as a result of the Distribution for U.S. federal income tax purposes, the Company nor MtronPTI has applied or will apply for a private letter ruling from the IRS with respect to the tax consequences of the Distribution. Accordingly, there can be no assurance that the IRS or another taxing authority will not assert that the Distribution is taxable to the Company, MtronPTI or the Company’s stockholders. If the Distribution is determined to be taxable for U.S. federal income tax purposes, the receipt of MtronPTI common stock in the Separation is expected to be treated as a distribution of property in an amount equal to the fair market value of the stock received. We believe that a reasonable approach to determine the fair market value of the shares of MtronPTI common stock received would be to use the volume weighted average price of MtronPTI common stock on the first full trading day following the Distribution. In such circumstances, the Distribution of MtronPTI common stock in the Separation would be treated as ordinary dividend income to the extent considered paid out of the Company’s current or accumulated earnings and profits (as determined under U.S. federal income tax principles). Distributions in excess of the Company’s current year and accumulated earnings and profits will be treated as a non-taxable return of capital, which reduces basis, to the extent of the holder’s basis in its shares of the Company’s common stock, as applicable, and thereafter as capital gain. The amount of those earnings and profits is not determinable at this time because it will depend on the Company’s income for the entire tax year in which the distribution occurs.
In connection with the Distribution, MtronPTI and LGL entered into a Tax Indemnity and Sharing Agreement pursuant to which MtronPTI and LGL will be responsible for certain liabilities and obligations following the Distribution. In general, under the terms of the tax matters agreement, if the Distribution, together with certain related transactions, were to fail to qualify as a tax-free transaction under Sections 355 and 368(a)(1)(D) of the Code (including as a result of Section 355I of the Code) if such failure were the result of actions taken after the Distribution by the LGL or MtronPTI, then the party responsible for such failure will be responsible for all taxes imposed on LGL to the extent such taxes result from such actions.
As a result of the Separation, certain of our directors and officers may have actual or potential conflicts of interest because of their positions or relationships with MtronPTI.
As a result of the Separation, Marc Gabelli serves as special advisor to the Chairman of the Board of Directors of MtronPTI and serves as Chairman of the Board of Directors and co-Chief Executive Officer of the Company and Michael J. Ferrantino serves as Chief Executive Officer and as a director of MtronPTI and also as a director of the Company. Such dual roles could create, or appear to create, potential conflicts of interest when the Company and MtronPTI’s officers and directors face decisions that could have different implications for the two companies.
In addition, potential conflicts of interest could arise in connection with the resolution of any dispute that may arise between the Company and MtronPTI regarding the terms of the agreements governing the separation and the relationship thereafter between the companies.
| Unresolved Staff Comments |
None.
| Cybersecurity |
Cybersecurity risk management is an integral part of our overall risk management efforts. The Company has chosen the National Institute of Standards ("NIST") for its base framework. Controls in the NIST SP 800-53 catalog have been tailored based on inheritance from MtronPTI controls, internally determined information technology ("IT") general controls and industry best practices to create a balance approach to protecting the confidentiality, integrity, and availability of our systems. We also seek to mitigate risk and manage any residual financail risk through a robust cyber insurance policy.
The Board of Directors has ultimate oversight of the Company's risk management. Pursuant to its charter, the Audit Committee of the Board of Directors has primary responsibility for the oversight of cybersecurity and information technology risks, and the Company's preparedness for these risks. The Audit Committee receives regular updates from our senior management and MtronPTI personnel ((pursuant to the Transitional Administrative and Management Services Agreement between us and MtronPTI) on cybersecurity risk resulting from risk assessments and reviews any information on relevant internal and industry cybersecurity incidents and is notified between such updates relative to any incidents which could materially affect us. These regular updates include topics related to cybersecurity practices, cyber risks, and risk management processes, such as updates to our cybersecurity programs and mitigation strategies, and other cybersecurity developments. Based on this information, our Audit Committee monitors the Company’s cybersecurity program, including potential threats, weaknesses and vulnerabilities, and reviews the policies and procedures in place to prevent, detect and respond to cybersecurity threats and unauthorized access to our information security systems. Significant findings related to cybersecurity, data and technology risks or incidents are regularly reported to and discussed at the Board level.
Our senior management and MtronPTI (pursuant to the Transitional Administrative and Management Services Agreement between us and MtronPTI) are responsible for assessing the risk of cybersecurity threats and engaging appropriate personnel to oversee the cybersecurity program. Specifically, the Company's cybersecurity incident response is overseen by MtronPTI's Director of IT, who is a member of MtronPTI's enterprise management team. The MtronPTI Director of IT also reports to the LGL Group Co-CEOs for all matters concerning LGL Group and its cybersecurity.
MtronPTI's internal IT team participates in several industry information sharing groups, including the Defense Industrial Base Cybersecurity Program and The Society of Industrial Security Professionals and has also fostered local contacts with the Federal Bureau of Investigations ("FBI") and local industry peers. The IT team monitors industry news daily and response to threat feeds from multiple sources. To further its cybersecurity efforts, MtronPTI partners with several external entities including:
| • |
A strategic customer who provides a network sensor monitored by their 24/7 security operations center; |
| • |
A commercial threat feed integrated with its perimeter security devices in partnership with the Defense Cyber Crime Center; |
| • |
A commercial Domain Name System ("DNS") security service integrated with perimeter security devices; and |
| • |
A commercial email threat detection service including detonation chamber services. |
All users with email access are provided quarterly and annual cyber security training and participate in bi-weekly phishing tests to maintain continuous awareness of threats. Access to the Company's ERP system is limited by a second layer of access approval and authorization.
Based on the information available as of the date of this Annual Report on Form 10-K, we did not identify any cybersecurity threats that have materially affected or are reasonably likely to materially affect our business strategy, financial condition or results of operations. However, despite our security measures, we cannot eliminate all risks from cybersecurity threats, or provide assurances that we will not experience a cybersecurity incident in the future that will materially affect us. Additional information on cybersecurity-related risk is discussed under the heading "Cybersecurity risks and cyber incidents may adversely affect our business by causing a disruption to our operations, a compromise or corruption of our confidential information, and/or damage to our business relationships, all of which could negatively impact our financial results." in Part I, Item 1A. of this Annual Report on Form 10-K.
| Properties |
The Company’s principal executive offices are located in Orlando, Florida and services are provided to LGL by MtronPTI staff under the Amended and Restated Transitional Administrative and Management Services Agreement with MtronPTI. PTF’s operations, which comprise our Electronic Instruments segment, are located in Wakefield, Massachusetts.
PTF leases approximately 3,600 square feet of office and manufacturing space in Wakefield, Massachusetts.
| Legal Proceedings |
From time to time, we may be involved in various claims and legal proceedings related to claims arising out of our operations. We are not currently a party to any material legal proceedings, including any such proceedings that are pending or threatened, of which we are aware.
| Mine Safety Disclosures |
Not applicable.
| Market for the Registrant’s Common Equity, Related Stockholder Matters and Issuer Purchases of Equity Securities |
Unless otherwise stated, all dollar amounts are in thousands.
Market for Common Equity
Our common stock and warrants are traded on the NYSE, under the symbols "LGL" and "LGL WS," respectively.
Holders of Common Stock and Warrants
As of March 15, 2023, we had approximately 1,300 holders of record of our common stock and approximately 800 holders of record of our warrants. The actual number of holders of common stock and warrants is greater than this number of record holders, and includes holders who are beneficial owners, but whose shares or warrants are held in street name by brokers and other nominees. This number of holders of record also does not include holders whose shares or warrants may be held in trust by other entities.
Recent Sales of Unregistered Securities
The Company did not sell any equity securities during the three months and year ended December 31, 2023 that were not registered under the Securities Act.
Purchases of Equity Securities by the Issuer or Affiliated Purchaser
The following table sets forth information with respective to shares of common equity purchased by the Company during the three months ended December 31, 2023:
| Total Number of Shares Purchased (1) |
Weighted Average Price Paid per Share |
Total Number of Shares Purchased as Part of Publicly Announced Plans or Program (1) |
Maximum Number (or Approximate Dollar Value) of Shares that May Yet to be Purchased Under the Plan or Programs |
|||||||||||||
| October 1, 2023 - October 31, 2023 |
— | $ | — | — | 458,416 | |||||||||||
| November 1, 2023 - November 30, 2023 |
— | — | — | 458,416 | ||||||||||||
| December 1, 2023 - December 31, 2023 |
— | — | — | 458,416 | ||||||||||||
| Total |
— | — | ||||||||||||||
| (1) |
On August 29, 2011, our Board authorized an expansion of its previously announced share repurchase program. This authorization increased the total number of shares authorized and available for repurchase under the Company’s existing share repurchase program to 540,000 shares, at such times, amounts and prices as the Company shall deem appropriate. Subject to certain safe harbor rules, the timing, amounts, and manner in which the Company can repurchase shares is tied to prevailing trading volumes and other limitations, which includes a general limitation to 25% of the average daily trading volume based on the most recent prior four weeks. The share repurchase program has no time limits and may be suspended or discontinued at any time. To date, the Company has repurchased a total of 81,584 shares of common stock under this program at a cost of $580, which shares are currently held in treasury. |
Cash Dividend Policy
Our Board has adhered to a practice of not paying cash dividends. This policy takes into account our long-term growth objectives, including our anticipated investments for organic growth, potential technology acquisitions or other strategic ventures and stockholders’ desire for capital appreciation of their holdings. No cash dividends have been paid to our stockholders since January 30, 1989, and none are expected to be paid for the foreseeable future.
Warrants
LGL has approximately 5.25 million "European Style" warrants outstanding, exercisable at a 5 for 1 ratio into LGL shares only at the earlier of (i) the expiration of the warrant term, which is November 16, 2025, or (ii) subject to a date acceleration if triggered only after the average volume weighted average price ("VWAP") of LGL common stock for 30 consecutive trading days is greater than or equal to the acceleration trigger price.
The distribution of MtronPTI shares was a qualifying dilutive event that required an adjustment, with the exercise price of the warrants and the trigger price for the potential acceleration of the exercise date for its warrants adjusted using the calculation provided within the warrant agreement. The exercise price was adjusted from $12.50 to $4.75 and the trigger price was adjusted from $17.50 to $6.65. Assuming that all warrants are exercised, the net proceeds from the exercise of the warrants will be $4,995. The Company intends to use the net proceeds from the exercise of the warrants for general corporate purposes, which may include working capital, general and administrative expenses, capital expenditures and implementation of our strategic priorities. Pending the application of the net proceeds, we may invest the proceeds in short-term, interest bearing, investment-grade marketable securities or money market obligations.
| Reserved |
| Management’s Discussion and Analysis of Financial Condition and Results of Operations |
You should read the following discussion and analysis together with our audited consolidated financial statements and the accompanying notes. This discussion contains forward-looking statements, including statements regarding our expected financial position, business and financing plans. These statements involve risks and uncertainties. Our actual results could differ materially from the results described in or implied by these forward-looking statements as a result of various factors, including those discussed below and elsewhere in this Report, particularly under the headings "Cautionary Statement Concerning Forward-Looking Statements" and "Risk Factors."
Unless otherwise stated, all dollar amounts are in thousands.
Overview
The Company is a holding company engaged in services, merchant investment and manufacturing business activities. The Company, through its manufacturing business subsidiary, is engaged in the designing, manufacturing and marketing of high-performance Frequency and Time Reference Standards that form the basis for timing and synchronization in various applications. The Company’s primary markets are communications, networking, aerospace, defense, instrumentation and industrial markets.
The accompanying consolidated financial statements include the accounts of The LGL Group, Inc., its majority-owned subsidiaries, and variable interest entities ("VIEs") of which we are the primary beneficiary.
Discontinued Operations
In accordance with FASB ASC Topic 205, Presentation of Financial Statements ("ASC 205"), Subtopic 20 - Discontinued Operations, the Company determined that MtronPTI met the conditions for a discontinued operation and was recorded as such in the consolidated financial statements. The Company reports financial results for discontinued operations separately from continuing operations in order to distinguish the financial impact of the potential disposal transaction from ongoing operations. Prior financial information has been updated to reflect the required presentation for discontinued operations under ASC 205-20.
Refer to Note 3 – Discontinued Operations in the accompanying Notes to the Consolidated Financial Statements included in Item 8. Financial Statements and Supplementary Data of this Report for further details.
Trends and Uncertainties
We are not aware of any material trends or uncertainties, other than the global economic conditions affecting our industry generally, that may reasonably be expected to have a material impact, favorable or unfavorable, on our revenues or income other than those listed in Part I, Item 1A, Risk Factors, of this Annual Report on Form 10-K.
Inflation and Changing Interest Rates
Inflation in the United States decreased from 6.5% as of December 31, 2022 to 3.4% as of December 31, 2023, which is still above the U.S. Federal Reserve's long-term target of 2.0%. Although inflation is expected to continue to decrease in 2024, the continued higher inflationary conditions may have an adverse impact on our manufacturing cost of sales along with engineering, selling and administrative expenses, as these costs could increase at a rate higher than our revenue. The U.S. Federal Reserve raised the federal funds rate a total of four times throughout 2023, resulting in a range from 5.25% to 5.50% as of December 31, 2023. However, it is expected that the U.S. Federal Reserve will hold the federal funds rate steady or start to decrease it during 2024 to, among other things, control inflation. As a result, we have increased the prices we charge our customers.
Results of Operations - Consolidated
The following table presents our Consolidated Statements of Operations for the periods indicated:
| Year Ended December 31, |
||||||||||||||||
| (in thousands, except share data) |
2023 |
2022 |
$ Change |
% Change |
||||||||||||
| Revenues: |
||||||||||||||||
| Net sales |
$ | 1,728 | $ | 1,655 | $ | 73 | 4.4 | % | ||||||||
| Net investment income |
1,566 | 413 | 1,153 | 279.0 | % | |||||||||||
| Net gains (losses) |
384 | (4,747 | ) | 5,131 | 108.1 | % | ||||||||||
| Total revenues |
3,678 | (2,679 | ) | 6,357 | 237.3 | % | ||||||||||
| Expenses: |
||||||||||||||||
| Manufacturing cost of sales |
796 | 837 | (41 | ) | -4.9 | % | ||||||||||
| Engineering, selling and administrative |
2,236 | 2,890 | (654 | ) | -22.6 | % | ||||||||||
| Total expenses |
3,032 | 3,727 | (695 | ) | -18.6 | % | ||||||||||
| Income (loss) from continuing operations before income tax expense |
646 | (6,406 | ) | 7,052 | 110.1 | % | ||||||||||
| Income tax expense (benefit) |
301 | (1,529 | ) | 1,830 | 119.7 | % | ||||||||||
| Net income (loss) from continuing operations |
345 | (4,877 | ) | 5,222 | 107.1 | % | ||||||||||
| (Loss) income from discontinued operations, net of tax |
(28 | ) | 1,885 | (1,913 | ) | -101.5 | % | |||||||||
| Net income (loss) |
317 | (2,992 | ) | 3,309 | 110.6 | % | ||||||||||
| Less: Net income attributable to non-controlling interests |
48 | — | 48 | n/m | ||||||||||||
| Net income (loss) attributable to LGL Group common stockholders |
$ | 269 | $ | (2,992 | ) | $ | 3,357 | 112.2 | % | |||||||
2023 Compared to 2022
Total Revenues
Total revenues increased $6,357, or 237.3%, from ($2,679) in 2022 to $3,678 in 2023. The following items contributed to the overall increase:
| • |
a $73, or 4.4%, increase in Net sales from $1,655 in 2022 to $1,728 in 2023 primarily due to additional contracts won within the Electronic Instruments segment; |
| • |
a $1,153, or 279.0%, increase in Net investment income from $413 in 2022 to $1,566 in 2023 primarily due to the redeployment of capital from investments in mutual funds into higher yielding U.S. Treasury money market funds within the Merchant Investment and Corporate segments; and |
| • |
a $5,131, or 108.1%, increase in Net gains (losses) from ($4,747) in 2022 to $384 in 2023 primarily due to realized gains on the related sales of mutual fund investments in 2023 versus realized losses on the sale of IronNet, Inc. in 2022 within the Corporate segment. |
Total Expenses
Total expenses decreased $695, or 18.6%, from $3,727 in 2022 to $3,032 in 2023. The following items contributed to the overall decrease:
| • |
a $41, or 4.9%, decrease in Manufacturing cost of sales from $837 in 2022 to $796 in 2023 primarily due to several contracts for lower cost distribution products within the Electronic Instruments segment; and |
| • |
a $654, or 22.6%, decrease in Engineering, selling and administrative from $2,890 in 2022 to $2,236 in 2023 primarily due to lower salaries and wages, share-based compensation expenses, and professional services and other consulting fees within the Corporate segment in 2023 compared to 2022. |
Gross Margin
Gross margin (Net sales less Manufacturing cost of sales as a percentage of Net sales) increased 450 basis points from 49.4% in 2022 to 53.9% in 2023 primarily due to shift in product mix within the Electronic Instruments segment that had lower costs (and higher margins).
Backlog
As of December 31, 2023, our order backlog was $143, a decrease of $217, compared to $360 as of December 31, 2022 primarily due a large contract received in Q4 2022 that did not recur in Q4 2023. The backlog of unfilled orders includes amounts based on purchase orders, which we have determined are firm orders likely to be fulfilled primarily in the next 12 months.
Order backlog is adjusted quarterly to reflect project cancellations, deferrals, revised project scope and cost, and sales of subsidiaries, if any. We expect to fill a substantial portion of our order backlog as of December 31, 2023 in 2024, but cannot provide assurances as to what portion of the order backlog will be fulfilled in a given year.
Income Tax Expense (Benefit)
Income tax expense (benefit) increased $1,830, or 119.7%, from ($1,529) in 2022 to $301 in 2023 primarily due to the increase in Net gains in 2023 compared Net losses in 2022.
Income from Discontinued Operations, Net of Tax
Income from discontinued operations decreased $1,913, or 101.5%, from $1,885 in 2022 to $28 in 2023 primarily due to the Separation of MtronPTI in October 2022 while remaining Separation costs were included in 2023.
Net Income Attributable to Non-Controlling Interests
Net income attributable to non-controlling interests increased $48 from $0 in 2022 to $48 in 2023 primarily due to the consolidation of LGL Systems in June 2023, which has minority shareholders.
Results of Operations - Operating Segments
Electronic Instruments
The following table presents income from continuing operations of our Electronic Instruments segment for the periods indicated:
| Year Ended December 31, |
||||||||
| (in thousands) |
2023 |
2022 |
||||||
| Revenues: |
||||||||
| Net sales |
$ | 1,728 | $ | 1,655 | ||||
| Total revenues |
1,728 | 1,655 | ||||||
| Expenses: |
||||||||
| Manufacturing cost of sales |
796 | 837 | ||||||
| Engineering, selling and administrative |
780 | 715 | ||||||
| Total expenses |
1,576 | 1,552 | ||||||
| Income from continuing operations before income taxes |
$ | 152 | $ | 103 | ||||
2023 Compared to 2022
Income from Continuing Operations Before Income Taxes
Income from continuing operations before income taxes increased $49, or 47.6%, from $103 in 2022 to $152 in 2023. The following items contributed to the overall increase:
| • |
a $73, or 4.4%, increase in Net sales from $1,655 in 2022 to $1,728 in 2023 primarily due to additional contracts won in 2023; and |
| • |
a $41, or 4.9%, decrease in Manufacturing cost of sales from $837 in 2022 to $796 in 2023 primarily due to several contracts for lower cost distribution products. |
The increase was partially offset by:
| • |
a $65, or 9.1%, increase in Engineering, selling and administrative from $715 in 2022 to $780 in 2023 primarily due to salary increases and bonuses accruals in 2023 partially offset by a temporary staff reduction. |
Merchant Investment
The following table presents income from continuing operations of our Merchant Investment segment for the periods indicated:
| Year Ended December 31, |
||||||||
| (in thousands) |
2023 |
2022 |
||||||
| Revenues: |
||||||||
| Net investment income |
$ | 869 | $ | — | ||||
| Total revenues |
869 | — | ||||||
| Expenses: |
||||||||
| Engineering, selling and administrative |
216 | — | ||||||
| Total expenses |
216 | — | ||||||
| Income from continuing operations before income taxes |
$ | 653 | $ | — | ||||
2023 Compared to 2022
Income from Continuing Operations Before Income Taxes
Income from continuing operations increased $653 from $0 in 2022 to $653 in 2023 due to the commencement of operations of Lynch Capital International, LLC in June 2023.
Corporate
The following table presents income from continuing operations of Corporate for the periods indicated:
| Year Ended December 31, |
||||||||
| (in thousands) |
2023 |
2022 |
||||||
| Revenues: |
||||||||
| Net investment income |
$ | 697 | $ | 413 | ||||
| Net gains (losses) |
384 | (4,747 | ) | |||||
| Total revenues |
1,081 | (4,334 | ) | |||||
| Expenses: |
||||||||
| Engineering, selling and administrative |
1,240 | 2,175 | ||||||
| Total expenses |
1,240 | 2,175 | ||||||
| Loss from continuing operations before income taxes |
$ | (159 | ) | $ | (6,509 | ) | ||
2023 Compared to 2022
Loss from Continuing Operations Before Income Taxes
Loss from continuing operations before income taxes decreased $6,350, or 97.6%, from $6,509 in 2022 to $159 in 2023. The following items contributed to the overall decrease:
| • |
a $284, or 68.7%, increase in Net investment income from $413 in 2022 to $697 in 2023 primarily due to the redeployment of capital from investments in mutual funds into money market mutual funds invested in U.S. Treasuries with higher yields; and |
| • |
a $5,131, or 108.1%, increase in Net gains (losses) from ($4,747) in 2022 to $384 in 2023 primarily due to realized gains on the sales of related party mutual fund investments in 2023 versus realized losses on the sales of IronNet, Inc. in 2022. |
| • |
a $935, or 43.0%, decrease in Engineering, selling and administrative from $2,175 in 2022 to $1,240 in 2023 primarily due to lower salaries and wages, share-based compensation expenses, and professional services and other consulting fees in 2023 compared to 2022. |
Liquidity and Capital Resources
Overview
Liquidity refers to our ability to access sufficient sources of cash to meet the requirements of our operating, investing and financing activities.
Capital refers to our long-term financial resources available to support business operations and future growth.
Our ability to generate and maintain sufficient liquidity and capital depends on the profitability of the businesses, timing of cash flows, general economic conditions and access to the capital markets and the other sources of liquidity and capital described herein.
As of December 31, 2023 and 2022, Cash and cash equivalents were $40,711 and $21,507, respectively.
Cash Flow Activity
The following table presents the cash flow activity for the periods indicated:
| As of December 31, |
||||||||
| (in thousands) |
2023 |
2022 |
||||||
| Cash and cash equivalents, beginning of year |
$ | 21,507 | $ | 29,016 | ||||
| Cash provided by (used in) operating activities |
385 | (817 | ) | |||||
| Cash provided by (used in) investing activities |
18,819 | (5,833 | ) | |||||
| Cash used in financing activities |
— | (859 | ) | |||||
| Net change in cash and cash equivalents |
19,204 | (7,509 | ) | |||||
| Cash and cash equivalents, end of year |
$ | 40,711 | $ | 21,507 | ||||
Operating Activities
Cash provided by operating activities was $385 in 2023 compared to cash used in operating activities of $817 in 2022, an increase of $1,202 primarily due to the following:
| • |
Net income (loss) increased $3,309 from ($2,992) in 2022 to $317 in 2023; |
| • |
Net gains (losses) increased $5,131 from ($4,747) in 2022 to $384 in 2023 related to the sale of IronNet, Inc. at a loss in 2022 and the sales of related party mutual fund investments in 2023; and |
| • |
Net change in operating assets and liabilities increased $2,347 from ($2,002) in 2022 to $345 in 2023. |
The increase was partially offset by:
| • |
Deferred income tax expense (benefit) decreased $1,598 from ($1,516) in 2022 to $82 in 2023. |
Our working capital metrics and ratios were as follows:
| As of December 31, |
||||||||
| (in thousands) |
2023 |
2022 |
||||||
| Current assets |
$ | 41,566 | $ | 39,340 | ||||
| Less: Current liabilities |
474 | 587 | ||||||
| Working capital |
$ | 41,092 | $ | 38,753 | ||||
| Current ratio |
87.7 | 67.0 | ||||||
Management continues to focus on efficiently managing working capital requirements to match operating activity levels and will seek to deploy the Company’s working capital where it will generate the greatest returns.
Investing Activities
Cash provided by investing activities was $18,819 in 2023 compared to cash used in investing activities of $5,833 in 2022, an increase of $24,652 primarily due to the sale of the Company's investments in marketable securities, including IrontNet, Inc. and mutual fund investments during Q1 and Q2 2023 at a gain as well as the consolidation of non-controlling interests related to LGL Systems Acquisition Holding Company, LLC.
Financing Activities
Cash provided by financing activities was $0 in 2023 compared to cash used in financing activities of $859 in 2022, an increase of $859 primarily due to the Separation of MtronPTI and the payment of taxes related to the net share settlement of equity awards partially offset by the exercise of stock options during 2022, which did not occur in 2023.
Capital Resources
We believe that existing cash and cash equivalents, marketable securities and cash generated from operations will provide sufficient liquidity to meet our ongoing working capital and capital expenditure requirements for the next 12 months and for the foreseeable future. The Company’s management continues to strive for profitability both internally and through acquisition.
Our Board has adhered to a practice of not paying cash dividends. This policy takes into account our long-term growth objectives, including our anticipated investments for organic growth, potential acquisitions or other strategic ventures and stockholders’ desire for capital appreciation of their holdings. No cash dividends have been paid to the Company’s stockholders since January 30, 1989, and none are expected to be paid for the foreseeable future.
Contractual Obligations
The following table summarizes contractual obligations in total, and by remaining maturity:
| Payments due by Period |
||||||||||||
| (in thousands) |
Total Payments |
2024 |
2025 |
|||||||||
| Leases |
$ | 79 | $ | 64 | $ | 15 | ||||||
| Total |
$ | 79 | $ | 64 | $ | 15 | ||||||
Leases
Leases relate to our Electronic Instruments business and represent the future minimum lease payments under our operating leases. We believe that the Electronic Instruments business maintain adequate financial resources to meet the actual required payments under these obligations.
Completion of Spin-Off of MtronPTI from LGL
On October 7, 2022 (the "Distribution Date"), at 12:01 a.m. Eastern Time, the spin-off of MtronPTI was completed (the "Spin-off" or the "Separation"). The Separation of MtronPTI was achieved through LGL’s distribution of 100% of the shares of MtronPTI common stock to holders of LGL common stock as of the close of business on the record date of September 30, 2022. LGL stockholders of record received one-half share of Mtron common stock for every share of LGL common stock. Following the Distribution, MtronPTI became an independent, publicly traded company with its common stock listed under the symbol "MPTI" on the NYSE American, and LGL retained no ownership interest in MtronPTI.
In connection with the Separation, MtronPTI entered into several agreements with LGL that, among other things, effect the Separation and provide a framework for its relationship with LGL after the Separation, including (i) an Amended and Restated Separation and Distribution Agreement which provides for, among other things, the mechanics for effecting the Distribution as well as certain ongoing responsibilities of MtronPTI and LGL subsequent to the Distribution, (ii) an Amended and Restated Transitional Administrative and Management Services Agreement with MtronPTI, which, among other things, specifies that LGL will provide MtronPTI, and MtronPTI will provide LGL, with certain administrative and management services for up to a twelve-month period after the Distribution, and (iii) an Amended and Restated Tax Indemnity and Sharing Agreement, which, among other things, contains certain agreements and covenants related to tax matters involving LGL and MtronPTI and covers time periods before and after the Distribution. For more information regarding the agreements entered into in connection with the Distribution, please refer to MtronPTI's registration statement on Form 10, as amended, and filed on August 19, 2022 with the SEC, and the Information Statement contained therein.
The foregoing description of the Amended and Restated Separation and Distribution Agreement, Amended and Restated Transitional Administrative and Management Services Agreement, and Amended and Restated Tax Indemnity and Sharing Agreement does not purport to be complete and is qualified in its entirety. Please see the full text of the Agreements, filed as Exhibits 2.1, 10.3, and 10.4, respectively, to this Report on Form 10-K.
See Note 3 – Discontinued Operations in the accompanying Notes to the Consolidated Financial Statements included in Item 8. Financial Statements and Supplementary Data of this Report. for further details of the transaction.
Critical Accounting Estimates
Our consolidated financial statements are prepared in accordance with accounting principles generally accepted in the United States. Our significant accounting policies are more fully described Note 2 – Summary of Significant Accounting Policies in the accompanying Notes to the Consolidated Financial Statements. Certain accounting policies require us to make estimates and assumptions that affect the reported amounts of assets and liabilities at the date of the financial statements and the reported amounts of revenue and expense during the reporting period. On an ongoing basis, we evaluate our estimates and assumptions, and the effects of revisions are reflected in the financial statements in the period in which they are determined to be necessary. The accounting policies described below are those that most frequently require us to make estimates and judgments and, therefore, are critical to understanding our results of operations.
Income Taxes
We account for income taxes in accordance with ASC Topic 740, Income Taxes ("ASC 740"), which requires an asset and liability approach for the financial accounting and reporting of income taxes. Under this method, deferred income taxes are recognized for the expected future tax consequences of differences between the tax bases of assets and liabilities and their reported amounts in the financial statements. These balances are measured using the enacted tax rates expected to apply in the year(s) in which these temporary differences are expected to reverse. The effect of a change in tax rates on deferred income taxes is recognized in income in the period when the change is enacted.
Based on consideration of all available evidence regarding their utilization, we record net deferred tax assets to the extent that it is more likely than not that they will be realized. Where, based on the weight of all available evidence, it is more likely than not that some amount of a deferred tax asset will not be realized, we establish a valuation allowance for the amount that, in our judgment, is sufficient to reduce the deferred tax asset to an amount that is more likely than not to be realized. In reaching such conclusions, we consider available positive and negative evidence including past operating results, projections of future taxable income, the feasibility of ongoing tax planning strategies and the realizability of tax loss carryforwards. Our projections of future taxable income include estimates and assumptions regarding our income and costs, as well as the timing and amount of reversals of taxable temporary differences.
The Company follows a two-step approach to recognize and measure uncertain tax positions. The first step is to evaluate the tax position for recognition by determining if the available evidence indicates it is more likely than not that the position will be sustained on audit, including resolution of related appeals or litigation processes, if any. The second step is to measure the tax benefit as the largest amount which is more than 50% likely of being realized upon ultimate settlement. The Company considers many factors when evaluating and estimating its tax positions and tax benefits, which may require periodic adjustments and for which actual outcomes may differ from forecasted outcomes. The Company's policy is to include interest and penalties related to uncertain tax positions in income tax expense.
Variable Interest Entities
In accordance with the provisions of the FASB ASC Topic 810, Consolidation ("ASC 810"), we evaluate entities for which control is achieved through means other than voting rights to determine if we are the primary beneficiary of a variable interest entity ("VIE"). An entity is a VIE if it has any of the following characteristics: (1) the entity has insufficient equity to permit it to finance its activities without additional subordinated financial support; (2) equity holders, as a group, lack the characteristics of a controlling financial interest; or (3) the entity is structured with non-substantive voting rights. The primary beneficiary of a VIE is generally the entity that has (a) the power to direct the activities of the VIE that most significantly impact the VIE’s economic performance and (b) the obligation to absorb losses or the right to receive benefits that could potentially be significant to the VIE. We consolidate our investment in a VIE when we determine that we are the primary beneficiary of such entity.
In determining whether we are the primary beneficiary of a VIE, we consider qualitative and quantitative factors, including, but not limited to, which activities most significantly impact the VIE’s economic performance and which party controls such activities and the significance of our investment and other means of participation in the VIE’s expected profits/losses. Significant judgments related to these determinations include estimates about the current and future fair values and performance of assets held by these VIEs and general market conditions.
We may change our original assessment of a VIE upon subsequent events such as the modification of contractual arrangements that affect the characteristics or adequacy of the entity’s equity investments at risk and the disposition of all or a portion of an interest held by the primary beneficiary. We perform this analysis on an ongoing basis.
Recently Issued Accounting Pronouncements
For additional information on recently issued accounting pronouncements, refer to Note 2 - Summary of Significant Accounting Policies in the accompanying Notes to the Consolidated Financial Statements.
| Quantitative and Qualitative Disclosures About Market Risk |
Not applicable.
| Financial Statements and Supplementary Data |
See the financial statements included at the end of this Report beginning on page 45.
| Changes in and Disagreements with Accountants on Accounting and Financial Disclosure |
None.
| Controls and Procedures |
Evaluation of Disclosure Controls and Procedures
We maintain disclosure controls and procedures that are designed to ensure that information required to be disclosed in reports filed or submitted under the Securities Exchange Act of 1934, as amended (the "Exchange Act") is recorded, processed, summarized and reported within the time periods specified in SEC rules and forms, and that such information is accumulated and communicated to management, including our Chief Executive Officer and Chief Accounting Officer, as appropriate, to allow timely decisions regarding required disclosure.
As required by Rules 13a-15(b) and 15d-15(b) of the Exchange Act, an evaluation was conducted under the supervision and with the participation of our management, including our Chief Executive Officer and Chief Accounting Officer, of the effectiveness of our disclosure controls and procedures (as defined in Rules 13a-15(e) and 15d-15(e) under the Exchange Act) as of December 31, 2023. Based on this evaluation, LGL Group's Chief Executive Officer and Chief Accounting Officer concluded that our disclosure controls and procedures, as of December 31, 2023, were effective.
Management’s Annual Report on Internal Control Over Financial Reporting
LGL Group management is responsible for establishing and maintaining adequate internal control over financial reporting, as such term is defined in Rules 13a-15(f) and 15d-15(f) of the Exchange Act. LGL Group's internal control over financial reporting is a process, under the supervision of the Chief Executive Officer and Chief Accounting Officer, and with the participation of our management designed to provide reasonable assurance regarding the reliability of financial reporting and preparation of LGL Group's financial statements for external purposes in accordance with U.S. GAAP. Internal control over financial reporting includes those policies and procedures that (i) pertain to the maintenance of records that, in reasonable detail, accurately and fairly reflect the transactions and dispositions of assets of the Company; (ii) provide reasonable assurance that transactions are recorded as necessary to permit preparation of financial statements in accordance with generally accepted accounting principles, and that receipts and expenditures of the Company are being made only in accordance with authorizations of our management and directors; and (iii) provide reasonable assurance regarding prevention or timely detection of unauthorized acquisition, use or disposition of assets of the Company that could have a material effect on the financial statements.
Because of its inherent limitations, internal control over financial reporting may not prevent or detect misstatements. Also, projections of any evaluation of effectiveness to future periods are subject to the risk that controls may become inadequate because of changes in conditions, or that the degree of compliance with the policies or procedures may deteriorate.
Under the supervision and with the participation of our Chief Executive Officer and Chief Accounting Officer, our management conducted an evaluation of the effectiveness of our internal control over financial reporting based on the framework in Internal Control — Integrated Framework (2013) issued by the Committee of Sponsoring Organizations of the Treadway Commission ("COSO"). Based on the results of our evaluation, our management has concluded that our internal controls over financial reporting were effective as of December 31, 2023.
Changes in Internal Control Over Financial Reporting
There were no changes in the Company’s internal control over financial reporting during the quarter ended December 31, 2023 that materially affected, or are reasonably likely to materially affect, the Company’s internal control over financial reporting.
| Other Information |
Insider Trading Arrangements
During the three months ended December 31, 2023, of the Company's directors or executive officers adopted or terminated a "Rule 10b5-1 trading arrangement" or a "non-Rule 10b5-1 trading arrangement", as each term is defined in Item 408(a) of Regulation S-K.
| Disclosure Regarding Foreign Jurisdictions that Prevent Inspections |
Not applicable.
| Directors, Executive Officers and Corporate Governance |
The LGL Group, Inc. Board of Directors
Board Overview
Our Board is currently comprised of 7 individuals selected based on numerous criteria such as high professional ethics, relevant management and/or manufacturing experience and a commitment to enhancing stockholder value.
Directors
The following table sets forth information regarding our directors as of December 31, 2023, including their business experience for the past five years (and, in some instances, for prior years) and their specific experience, qualifications, attributes or skills that led to the conclusion that they should serve as directors. All such information has been furnished to us by our directors.
| Name |
Age |
Director Since |
Offices and Positions Held with the Company, Business Experience and Principal Occupation for the Last Five Years, and Directorships in Public Corporations and Investment Companies |
|||
| Marc J. Gabelli |
55 |
2004 |
Mr. Gabelli currently serves as Chairman of the Board and Co-Chief Executive Officer for The LGL Group, Inc. (December 2017 to present, and October 2022 to present); President and Managing Partner, GGCP, Inc. (1999 to present) and holds various executive and directorship roles at GGCP financial services subsidiaries including GAMCO Investors, Inc., Associated Capital Group, Inc. and Teton Advisors, Inc.; He formerly served as Chairman and Chief Executive Officer, LGL Systems Acquisition Corp. (NYSE: DFNS) from September 2019 to August 2021; Chairman of Gabelli Merger Plus Trust (GMP-LSE) since July 2017. Mr. Gabelli brings to the Board his extensive knowledge of the Company’s business and industry due to his longstanding service on the Board, as well as his financial expertise and leadership experience as an executive of various investment firms. |
|||
| Timothy Foufas |
55 |
2007 |
Mr. Foufas currently serves as Co-Chief Executive Officer for The LGL Group, Inc. (August 2023 to present); Co-President at PMV Consumer Acquisition Corp, Inc. (OTC Pink: PMVC) (August 2021 to present) and as Managing Partner, Plato Foufas & Co. LLC (2005 to present), a financial services company. He previously served as Vice President and Chief Operating Officer, LGL Systems Acquisition Corp. (NYSE: DFNS) from September 2019 to August 2021; Chief Executive Officer of LGL Systems Acquisition Corp. from inception to September 2019; President, Levalon Properties LLC (2007 to 2018), a real estate property management company; Senior Vice President, Bayshore Management Co. LLC (2005 to 2006), a real estate property management company; Director of Investments, Liam Ventures Inc. (2000 to 2005), a private equity investment firm; and Director, ICTC Group, Inc. (2010 to 2013), a rural local exchange carrier headquartered in Nome, ND. Mr. Foufas brings to the Board his management skills and expertise in financial, investment and real estate matters. |
|||
| Manjit Kalha |
48 |
2011 |
Mr. Kalha has served as a Vice President at Teton Advisors, Inc. (OTC Pink: TETAA) (January 2022 to present); Executive Officer at Gabelli Merger Plus Trust Plc (GMP: LN) (October 2023 to present); Executive Vice President (Finance) at PMV Consumer Acquisition Corp, Inc. (OTC Pink: PMVC) (September 2020 to present); Managing Director, Horizon Research (August 2012 to present), a firm that provides investment management and research services; Chief Executive Officer, Horizon AMC (June 2008 to present), a firm that provides investment management and consulting services; Chief Executive Officer and Director, Jeet Associates Private Limited (December 2006 to January 2024), a consulting firm based in New Delhi that provides business strategy, finance, and taxation advisory services. Mr. Kalha began his career at Arthur Andersen’s New Delhi office. Mr. Kalha brings to the Board his experience in management and manufacturing operations, and an extensive knowledge of global financial markets. |
|||
| Michael J. Ferrantino, Jr. | 52 | 2019 | Mr. Ferrantino currently holds the position of Chief Executive Officer for M-tron Industries, Inc. and is on the Boards of The Gabelli Equity Trust, Inc., The Gabelli Utility Trust, and The Gabelli ETFs Trust. Mr. Ferrantino was formerly the Chief and Co-Chief Executive Officer for The LGL Group, Inc. (April 2021 to August 2023), a Director of LGL Systems Acquisition Corp, Inc. (September 2019 to August 2021), and Chief Executive Officer & Director at Valpey-Fisher Corp. Mr. Ferrantino received an undergraduate degree from Rensselaer Polytechnic Institute and an MBA from Loyola University Maryland, Inc. Mr. Ferrantino brings to the Board his experience in management and manufacturing operations, and an extensive knowledge of global financial markets. | |||
| Kaan Aslansan |
50 |
2022 |
Mr. Aslansan currently serves as Senior Advisor and Managing Director, Alvarez and Marsal Corporate Performance Improvement (November 2021 to present, and February 2018 to October 2021) a restructuring, advisory and consulting company; Co-President, SOL Investment Group (December 2021 to present), a software services investment management services provider; Co-founder and Managing Director, Optimity Advisors (2009 to 2018), a global consulting company servicing the Media & Entertainment, Financial Services, Insurance and Healthcare sectors. Mr. Aslansan brings to the Board his extensive knowledge of corporate finance and technology, due-diligence, mergers and acquisitions and digital transformation. |
| Name | Age | Director Since | Offices and Positions Held with the Company, Business Experience and Principal Occupation for the Last Five Years, and Directorships in Public Corporations and Investment Companies | |||
| Herve Francois | 55 | 2023 | Mr. Francois currently serves as Partner and Acquisition Manager at DeRosa Group, a real estate investment firm. Mr. Francois has held positions as a Financial Analyst and Institutional Equity Sales Manager at Citigroup, Credit Suisse First Boston, and several other investment banking firms over a 23-year career on Wall Street. As a Financial Analyst, Mr. Francois covered a broad number of Technology stocks and ranked 3rd place in the stock picking category in Wall Street Journal's "Best Analysts on The Street" for 2002. Mr. Francois also led U.S. Equity Sales at Mizuho Securities. Mr. Francois holds an MBA from Georgetown University and a BA in Economics from Boston College. Mr. Francois brings to the Board an extensive financial services experience in research and sales, including specializations in technology investing. | |||
| Darlene DeRemer | 68 | 2023 | Ms. Deremer currently serves as the Chairwoman and Trustee of ARK ETF Trust and Trustee of VALIC Trust Company, Inc. Previously, Ms. DeRemer was a Managing Partner at Grail Partners LLC, a financial services merchant bank from 2005 to 2019 and remains an Advisory Partner today. She served on the Board of Directors for United Capital Wealth Advisors (2008 to 2019) and the Board of Directors for Confluence Technologies, Inc. (2018 to 2021). Earlier in her career, Ms. DeRemer was Vice President and Director in the Asset Management Division of State Street Bank and Vice President at T. Rowe Price & Associates. Ms. DeRemer also serves on the Board of Trustees of Syracuse University from which she holds an MBA and BS. Ms. DeRemer brings to the Board a career in investment banking, new product development and governance positions of leadership. |
Director Nominations
In evaluating and determining whether to nominate a candidate for a position on the Board, the Nominating Committee utilizes a variety of methods and considers criteria such as high professional ethics and values, relevant management and/or manufacturing experience and a commitment to enhancing stockholder value. Candidate may be brought to the attention of the Nominating Committee by current Board members, stockholders, officers or other persons. the Nominating Committee will review all candidate in the same manner regardless of the source of the recommendation.
The Company does not have a formal policy with regard to the consideration of diversity in identifying director nominees, but the Nominating Committee strives to nominate director candidates with a variety of complementary skills so that, as a group, the Board will possess the appropriate talent, skills and expertise to oversee the Company's businesses.
The Nominating Committee also considers stockholder recommendations for director nominees that are properly received in accordance with the Company's By-Laws and applicable rules and regulations of the SEC. In order to validly nominate a candidate for election or reelection as a director, stockholders must give timely notice of such nomination in writing to the Corporate secretary and included, as to each person whom the stockholder proposes to nominate, all information relating to such person that is required to be disclosed in solicitations of proxies for election of directors in an election contents, or is otherwise required, in each case pursuant to Regulation 14A under the Exchange Act, and the other results and regulations under the Exchange Act (including such person's written consent to being named in the proxy statement as a nominee and to serving as a director if elected).
Board Structure and Responsibilities
The Board is currently comprised of four independent directors and three directors who are not independent under the NYSE American listing rules. During 2023, there were eleven meetings of the Board and all of our directors attended at least 75 percent of the total number of meetings of the Board and committees on which he or she served. Although there is no formal policy, all directors are encouraged to attend each annual meeting stockholders. All directors then standing for election attended the 2023 Annual Meeting.
Board Leadership Structure
LGL Group's governing documents provide the Board with flexibility to select the appropriate leadership structure of the Company. The Board does not have a policy about whether the roles of Chairman of the Board and CEO should be separate or combined. Until October 7, 2022, the Chairman of the Board and CEO were separate. Since then, the Chairman of the Board and Co-CEO has been Mr. Gabelli. Mr. Foufas was appointed Co-CEO on August 11, 2023.
Board Committees
The Board currently has 3 standing committees: an Audit Committee, a Compensation Committee, and a Nominating Committee. The Board also has an Investment Committee. Each standing committee has a written charter and all such charters, as well as the Company's By-Laws and Corporate Governance Guidelines, are available on the Company's website, www.lglgroup.com/investor-relations. Each charter is reviewed annually by the respective committee. Under those charters, each committee has the authority to retain independent advisors to assist in the performance of their respective responsibilities.
The tables below reflect the current membership and the number of meetings held in 2023 for each committee. Messrs. Ferrantino and Gabelli did not serve on any committee during 2023. Mr. Foufas served on the Audit, Compensation, and Nominating Committees prior to his appointment has Co-Chief Executive Officer on August 11, 2023.
Audit Committee
| Members | Roles and Responsibilities | |||
| Manjit Kalha, Chair | The Audit Committee provides assistance to the Board in fulfilling its legal and fiduciary obligations with respect to: | |||
| Kaan Aslansan | • | Matters involving the Company's accounting, auditing, financial reporting, and internal controls; | ||
| Darlene DeRemer | • | Overseeing the Company's financial policies and activities; | ||
| Herve Francois | • | Matters involving information security (including risks related to cybersecurity) and data protection; | ||
| • | Oversight of the qualifications, independence and performance of LGL Group's independent registered public accounting firm, including responsibility for the appointment, compensation, retention and oversight of the firm's work; and | |||
| • | Oversight of the performance of LGL Group's internal audit function. | |||
| Meetings in 2023 | ||||
| 10 | ||||
The Board has determined that (i) each member of the Audit Committee meets all independence and financial literacy requirements applicable to audit committees under the NYSE American listing standards and applicable regulations adopted by the SEC and (ii) Messrs. Aslansan, Francois, and Kalha and Ms. DeRemer are "audit committee financial experts" as that term is defined in the SEC's rules.
Compensation Committee
| Members | Roles and Responsibilities | |||
| Manjit Kalha, Chair | The Compensation Committee discharges the Board's responsibilities regarding executive compensation, and its duties include the following: | |||
| Kaan Aslansan | ||||
| Darlene DeRemer | • | Evaluating the performance of the Co-CEOs; | ||
| Herve Francois | • | Reviewing and approving the compensation of the Co-CEOs and recommending, for approval by the independent directors, the compensation of the Co-CEOs; | ||
| • | Reviewing the job performance of other senior executives officers with the Co-CEOs annually and recommending the compensation of the other senior executive officers; | |||
| • | Granting equity incentive awards under the 2021 Incentive Plan; | |||
| • | Assisting the Board in establishing and implementing an executive compensation policy that supports the Company's overall strategy and objectives, attracts and retains talent, and links total compensation to defined performance; and | |||
| • | Making recommendations to the Board regarding the compensation of directors. | |||
| Meetings in 2023 | ||||
| 3 | ||||
The Board has determined that each member of the Compensation Committee meets all independence requirements applicable to compensation committees under the NYSE American listing standards.
Nominating Committee
| Members | Roles and Responsibilities | |||
| Manjit Kalha, Chair | The Nominating Committee sets the tone for corporate governance, and its duties include the following: | |||
| Kaan Aslansan | • | Establishing criteria and qualifications for Board membership, including standards for assessing independence; | ||
| Darlene DeRemer | • | Continuing to identify individuals qualified to become Board members and make recommendations to the Board regarding proposed changes; and | ||
| Herve Francois | ||||
| • | Overseeing the orientation of new directors and continuing education of directors. | |||
| Meetings in 2023 | ||||
| 2 | ||||
The Board has determined that each member of the Nominating Committee meets all independence requirements applicable to nominating committees under the NYSE American listing standards.
Investment Committee
| Members | Roles and Responsibilities | |||
| Manjit Kalha, Chair | The Investment Committee's duties include the following: | |||
| Kaan Aslansan | • | Reviewing the Company's investments including investments with related parties; and | ||
| Darlene DeRemer | • | Reviewing potential acquisitions and making recommendations to the Board whether to proceed. | ||
| Herve Francois | ||||
| Meetings in 2023 | ||||
| 2 | ||||
The Board's Role in Risk Oversight
Senior management is responsible for assessing and managing the Company's various exposures to risk on a day-to-day basis, including the creation of appropriate risk management programs and policies. We have developed a consistent, systemic and integrated approach to risk management to help determine how best to identify, manage and mitigate significant risks throughout the Company, which includes our system of internal controls over financial reporting, annual reviews conducted by our directors and officers, monitoring compliance with our Business Conduct Policy and general liability insurance coverage. The Board is responsible for overseeing management in the execution of its responsibilities and for assessing the Company's approach to risk management. The Board exercises these responsibilities periodically as part of its meetings and also through the Board's three principal committees, each of which examines various components of enterprise risk as part of its responsibilities. In addition, an overall review of risk is inherent in the Board's consideration of the Company's long-term strategies and in the transactions and other matters presented to the Board, including capital expenditures, acquisitions and divestitures, and financial matters.
Stockholder Communications
Stockholders may communicate with the Board, including the non-management directors, by sending an e-email to info@lglgroup.com or by sending a letter to The LGL Group, Inc., 2525 Shader Road, Orlando, Florida 32804, Attention: Investor Relations. All such correspondence will be submitted to any specific director to whom the correspondence is directed.
Director Compensation
2023 Compensation Structure
The following table describes the compensation structure for LGL Group's directors for the year ending December 31, 2023:
| ($) |
||||
| Base Annual Retainer |
||||
| Cash Retainer |
10,000 | |||
| Per Meeting Cash Compensation |
||||
| Board Meeting (in person) |
2,000 | |||
| Board Meeting (telephonic) |
750 | |||
| Committee Meetings |
750 | |||
| Annual Committee Chair Cash Retainers |
||||
| Audit Committee |
2,000 | |||
| Compensation Committee |
1,000 | |||
| Nominating Committee |
1,000 | |||
The following table sets forth information with respect to compensation earned by or awarded to each non-employee director who served on the Board during the fiscal year ended December 31, 2023:
| Name |
Fees Earned or Paid in Cash ($) |
Stock Awards (1) ($) |
Total ($) |
|||||||||
| Timothy Foufas (2) |
20,625 | — | 20,625 | |||||||||
| Manjit Kalha |
34,875 | 15,002 | 49,877 | |||||||||
| Michael J. Ferrantino, Jr. (3) |
12,250 | 15,002 | 27,252 | |||||||||
| Kaan Aslansan |
24,750 | 15,002 | 39,752 | |||||||||
| Herve Francois (4) |
11,000 | 15,002 | 26,002 | |||||||||
| Darlene DeRemer (4) |
11,000 | 15,002 | 26,002 | |||||||||
| (1) |
These shares were granted under the 2021 Incentive Plan. |
| (2) |
Reflects Mr. Foufas’s compensation earned as a non-employee director through August 11, 2023. |
| (3) |
Reflects Mr. Ferrantino’s compensation earned as a non-employee director subsequent to August 11, 2023, the date he transitioned from co-Chief Executive Officer to a non-employee director. |
| (4) |
Mr. Francois and Ms. DeRemer joined the Board of Directors on August 11, 2023. |
2024 Compensation Structure
In December 2023, the Compensation Committee recommended to, and the Board of Directors approved, a revised compensation structure for LGL Group's directors for the year ending December 31, 2024.
The following table describes the revised compensation structure for LGL Group's directors:
| ($) |
||||
| Base Annual Retainer |
||||
| Cash Retainer |
10,000 | |||
| Restricted Stock Awards |
15,000 | |||
| Per Meeting Cash Compensation |
||||
| Board Meeting (in person) |
2,000 | |||
| Board Meeting (telephonic) |
750 | |||
| Committee Meetings |
750 | |||
| Chairman Cash Retainer |
2,500 | |||
| Annual Committee Chair Cash Retainers |
||||
| Audit Committee |
2,000 | |||
| Compensation Committee |
1,000 | |||
| Nominating Committee |
1,000 | |||
Executive Officers
The following table sets forth information regarding our executive officers as of December 31, 2023, including their business experience for the past five years and prior years.
| Name |
Age |
Offices and Positions Held with the Company, Business Experience and Principal Occupation for the Last Five Years |
||
| Marc J. Gabelli |
55 |
Mr. Gabelli’s biographical information can be found under the section for Directors, above. |
||
| Timothy Foufas |
55 |
Mr. Foufas' biographical information can be found under the section for Directors, above. |
||
| James W. Tivy |
56 |
Chief Accounting Officer, The LGL Group, Inc. (October 2022 to present); Chief Financial Officer, M-tron Industries Inc. (October 2022 to present); Chief Financial Officer, The LGL Group, Inc. (January 2018 to October 2022); SVP, Finance for INTL FCStone Securities Inc. (November 2012 to January 2017); Group Controller, INTL FCStone Inc. (January 2008 to November 2012). |
||
| Linda Biles |
62 |
Vice President, Controller, The LGL Group, Inc. (June 2020 to present); Vice President and Controller for MtronPTI (2007 to present). |
||
| Patrick Huvane |
56 |
Executive Vice President - Finance and Business Development, The LGL Group, Inc. (December 2022 to present); Senior Vice President - Business Development, The LGL Group, Inc. (April 2019 to December 2022); Vice President - Finance and Accounting, LGL Systems Acquisition Corp. (NYSE: DFNS) (September 2019 to August, 2021); Vice President - Product Development, Associated Capital Group, Inc. (NYSE: AC) (December 2023 to present); Co-Chief Financial Officer, Associated Capital Group, Inc. (July 2022 to November 2023); Chief Financial Officer, Teton Advisors, Inc. (OTC: TETAA) (April 2019 to present). From 2007 to 2018, Mr. Huvane was employed by Tiptree Inc. (NASD: TIPT) as Chief Accounting Officer. |
Delinquent Section 16(a) Reports
Section 16(a) of the Exchange Act requires our officers and directors, and persons who beneficially own more than 10% of our equity securities registered pursuant to Section 12 of the Exchange Act, to file reports of ownership and changes in ownership with the SEC. Based solely upon a review of the reports filed during 2023 and/or written representations from the reporting persons, we believe that, during our fiscal year ended December 31, 2023, all required Section 16(a) filings were timely and correctly made by reporting persons for 2023.
Hedging or Pledging of Stock
Although we have not adopted any practices or policies prohibiting hedging or pledging, we discourage our directors, executive officers, and employees from entering into hedging or pledging arrangements with respect to the Company's securities.
Insider Trading Policy
We have adopted an insider trading policy that governs the purchase, sale, and/or other dispositions of the Company's common stock or warrants by directors, officers, and employees.
Corporate Governance Information
We adopted a code of ethics as part of our Business Conduct Policy, which applies to all of our employees, including our principal executive, financial and accounting officers.
LGL Group's By-Laws, Certificate of Incorporation, Corporate Governance Guidelines, the charters for each standing Board committee, and the Business Conduct Policy (and any amendments to and waivers from the code) are available on LGL Group's website at www.lglgroup.com/investor-relations.
| Executive Compensation |
Compensation Discussion and Analysis
Overview
The Compensation Committee is responsible for the design and administration of the Company’s compensation policy and plans. The plans are designed to successfully implement the Company’s business strategy and create stockholder value. As a matter of policy, the Compensation Committee submits its recommendations to the full Board for approval.
Compensation Philosophy and Objectives
The Company’s compensation program emphasizes performance-based compensation promoting the achievement of short-term and long-term business objectives. This aligns our executives' compensation with stockholder interests, while providing competitive compensation to attract, motivate and retain executives with superior skills and abilities.
Determination of Compensation Awards
The Compensation Committee recommends to the Board the compensation awards for the named executive officers based on (i) Company performance versus annual budgeted financial targets, and (ii) individual performance.
The Compensation Committee conducts an annual review of the Chief Executive Officer’s performance prior to making its recommendation to the Board regarding the Chief Executive Officer’s compensation. Our Chief Executive Officer reviews the performance of our Chief Accounting Officer with the Compensation Committee and makes a recommendation to the Compensation Committee regarding the Chief Accounting Officer’s compensation. During these reviews, the Compensation Committee considers the Company’s performance in the following categories: (i) improvement in the Company’s market value; (ii) the achievement of agreed upon short and long-term objectives; and (iii) predetermined individual goals.
Elements of Compensation
Base Salary
Base salary levels for the Company’s named executive officers are designed to be competitive with those of employees with similar responsibilities working for companies of comparable size, capitalization and complexity. In determining base salaries, the Compensation Committee takes into account a variety of factors, including experience, performance, and benchmarking.
Incentive Compensation
The Company provides annual and long-term incentive compensation to its executives and managers under the Company’s 2021 Incentive Plan, approved by stockholders on December 28, 2021. The 2021 Incentive Plan is designed to provide annual and long-term incentives for executive performance by rewarding participating executives for their contributions to profitability and stockholder value based on achieving short-term Company and individual performance goals for a given year, as well as by aligning a significant portion of compensation with the long-term interests of stockholders. Short-term Company performance goals include revenue growth, EBITDA, earnings per share and return on equity. Long-term Company performance goals include increasing the Company’s total market value. The Compensation Committee may recommend that other corporate performance measures be substituted or added (including but not limited to operating income after tax, return on capital employed and stockholder return) in order to achieve the Company’s business strategy. Individual performance goals for the Chief Executive Officer are established by the Compensation Committee and recommended to the Board for approval, while individual performance goals for our other employees are established by the Chief Executive Officer and reviewed by the Compensation Committee.
The LGL Group, Inc. 401(k) Savings Plan
The LGL Group, Inc. 401(k) Savings Plan (the "401(k) Plan"), which is subject to limitations imposed by the Internal Revenue Code of 1986, as amended (the "Code"), permits the Company’s employees to defer a portion of their compensation by making contributions to the 401(k) Plan and thereby obtain certain tax benefits. Participating employees also benefit from the 401(k) Plan by sharing in discretionary contributions made by the Company to the 401(k) Plan based on each employee’s contribution made in a particular year. A participant’s interest in his or her individual contributions, the Company’s contributions and earnings thereon is fully vested at all times. The 401(k) Plan’s proceeds are invested in guaranteed investment contracts or certain mutual funds, subject to the discretion of the participants.
The named executive officers and all other employees of the Company and certain of its subsidiaries are eligible to participate in the 401(k) Plan after having completed three months of service and reached the age of 18.
Other Benefits
The Company makes available to the named executive officers the same medical insurance, life insurance and disability benefits that are generally made available to the Company’s employees to ensure that the Company’s employees have access to basic healthcare and income protection for themselves and their family members.
Employment Agreements
None.
Executive Compensation Tables
The following table sets forth information with respect to compensation earned by the named executive officers:
| Name and Principal Position (as of December 31, 2023) |
Year |
Salary ($) |
Bonus ($) |
Stock Awards (1) ($) |
Total ($) |
||||||||||||
| Marc J. Gabelli (2) |
2023 |
— | — | — | — | ||||||||||||
| Co-Chief Executive Officer |
2022 |
— | — | — | — | ||||||||||||
| Timothy Foufas (3) |
2023 |
75,750 | 55,000 | — | 130,750 | ||||||||||||
| Co-Chief Executive Officer |
|||||||||||||||||
| Patrick Huvane |
2023 |
50,000 | — | — | 50,000 | ||||||||||||
| Executive Vice President |
2022 |
50,000 | — | — | 50,000 | ||||||||||||
| Michael J. Ferrantino, Jr. (4) * |
2023 |
16,000 | — | — | 16,000 | ||||||||||||
| Former President and Chief Executive Officer |
2022 |
176,538 | — | — | 176,538 | ||||||||||||
| Ivan Arteaga (4) |
2022 |
6,250 | — | — | 6,250 | ||||||||||||
| Former Interim Chief Executive Officer |
|||||||||||||||||
| James W. Tivy (5) (6) * |
2023 |
— | — | — | — | ||||||||||||
| Chief Accounting Officer / Former Chief Financial Officer |
2022 |
83,846 | 25,000 | 313,800 | 422,646 | ||||||||||||
| Linda Biles * |
2023 |
— | — | — | — | ||||||||||||
| Vice President, Controller |
2022 |
105,024 | 27,000 | — | 132,024 | ||||||||||||
| * | The above amounts include amounts earned through the spin-off date, October 6, 2022. Subsequent to the spin-off consulting services were provided and are covered under the Transitional Administrative and Management Services Agreement. |
| (1) |
Reflects the aggregate grant date fair value of stock awards or option awards granted in the applicable year, computed in accordance with FASB ASC Topic 718, Compensation - Stock Compensation ("ASC 718"). For a discussion of the assumptions and methodologies used to calculate these amounts, please see Note 10 - Stock-Based Compensation in the accompanying Notes to the Consolidated Financial Statements. |
| (2) |
Mr. Gabelli did not receive any compensation while serving as an officer of the Company in either 2022 or 2023. Mr. Gabelli earned $35,252 in fees, including $15,002 of restricted stock awards, as a director in 2023 (not included above). |
| (3) |
Includes compensation earned subsequent to Mr. Foufas' appointment as co-Chief Executive Officer on August 11, 2023. Refer to the Non-Employee Director Compensation table on page 33 for Mr. Foufas' remuneration as a non-employee director prior to his appointment as an officer. Mr. Foufas earned $15,002 in fees, including $15,002 of restricted stock awards, as a director of the Company from August 11, 2023 to December 31, 2023 (not included above). |
|
| (4) |
While serving as an officer of the Company, compensation is not provided for services as a director. See Non-Employee Director Compensation table on page 33 for (i) Mr. Ferrantino’s remuneration as a director prior to his appointment as an officer; and (ii) Mr. Arteaga’s remuneration as a director following the completion of his assignment as Interim Chief Executive Officer and prior to his appointment as CFO. |
| (5) |
Mr. Tivy served as Chief Financial Officer until October 7, 2022, and currently serves as the Company's Chief Accounting Officer. |
| (6) |
On April 30, 2022, the Company awarded Mr. Tivy 30,000 restricted shares of common stock with a grant date fair value of $313,800. The 30,000 restricted shares were canceled on October 6, 2022 as a result of the Spin-Off when MtronPTI was spun off and became a public company. |
Outstanding Equity Awards at Fiscal Year-End
The following table sets forth the information with respect to outstanding equity awards held by our named executive officers as of December 31, 2023:
| Stock Awards (1) |
||||||||
| Name |
Number of Shares or Units of Stock that Have Not Vested |
Market Value of Shares or Units of Stock that Have Not Vested (2) ($) |
||||||
| Marc J. Gabelli |
2,874 | 17,416 | ||||||
| Timothy Foufas |
2,874 | 17,416 | ||||||
| Manjit Kalha |
2,874 | 17,416 | ||||||
| Michael J. Ferrantino, Jr. |
2,874 | 17,416 | ||||||
| Kaan Aslansan |
2,874 | 17,416 | ||||||
| Herve Francois |
2,874 | 17,416 | ||||||
| Darlene DeRemer |
2,874 | 17,416 | ||||||
| (1) |
There are no LGL stock options held by any named executive officers. |
| (2) |
Market value is based on the closing price of our common stock on December 31, 2023 of $6.06 per share. |
Pay versus Performance
This disclosure has been prepared in accordance with Section 953(a) of the Dodd-Frank Wall Street Reform and Consumer Protection Act and Item 402(v) of Regulation S-K and does not necessarily reflect how the Compensation Committee evaluates compensation decisions when contemplating Company or individual performance. The Compensation Committee did not consider the pay versus performance disclosure in making its pay decisions for any of the years shown. For further information concerning the Company’s pay-for-performance philosophy and how the Company aligns executive compensation with the Company’s performance, refer to the Compensation Discussion and Analysis section above.
Timothy Foufas has been our principal executive officer ("PEO") since August 2023. Prior to August 2023, Michael J. Ferrantino, Jr. was the PEO. The individuals comprising the Non-PEO Named Executive Officers ("NEOs") for each year are presented are listed below:
| 2023 | 2022 |
| Patrick Huvane | Patrick Huvane |
| James W. Tivy | Ivan Arteaga |
| Linda Biles | James W. Tivy |
| Linda Biles |
Pay versus Performance Table
The following table sets forth information concerning the compensation of our PEO(s) and NEOs for each of the fiscal years ending December 31, 2023 and 2022:
| Year |
Summary Compensation Table Total for PEO (1) ($) |
Compensation Actually Paid to PEO (2) ($) |
Average Summary Compensation Table Total for Non-PEO NEOs (3) ($) |
Average Compensation Actually Paid to Non-PEO NEOs (2) ($) |
Value of Initial Fixed $100 Investment Based on Total Shareholder Return (5) ($) |
Net Income (Loss) ($ in 000s) |
||||||||||||||||||
| 2023 |
146,750 | 146,750 | 16,667 | 16,667 | 104.91 | 317 | ||||||||||||||||||
| 2022 |
176,538 | (19,812 | ) | 128,584 | 65,824 | 69.20 | (2,992 | ) | ||||||||||||||||
| (1) |
The amounts shown for Summary Compensation Table Total for PEO are the amounts of total compensation reported for Mr. Foufas and Mr. Ferrantino for each corresponding year in the "Total" column of the Summary Compensation Table. Refer to the Summary Compensation Table on page 36 above. |
| (2) |
The amounts shown for Compensation Actually Paid ("CAP") do not reflect the actual amount of compensation earned or paid to our executive officers during the applicable fiscal year and it is reported solely pursuant to the new SEC rules. Additionally, it does not represent amounts that have actually been earned or realized, including with respect to certain equity awards, for which performance conditions for these equity awards have not yet been realized. |
| (3) |
The amounts shown for Average Summary Compensation Table Total for Non-PEO NEOs are the average amounts of total compensation reported for the Non-PEO Named Executive Officers for each corresponding year in the "Total" column of the Summary Compensation Table. Refer to the Summary Compensation Table on page 36 a bove. |
| (4) |
Compensation Actually Paid reflects the exclusions and inclusions of certain amounts for the PEO and the Non-PEO NEOs as set forth below. Equity values are calculated in accordance with FASB ASC Topic 718. Amounts in the Exclusion of Stock Awards column are the totals from the "Stock Awards" column of the Summary Compensation Table. Refer to the Summary Compensation Table on page 36 above. |
| PEO |
Summary Compensation Table Total |
Exclusion of Stock Awards |
Inclusion of Equity Values |
Compensation Actually Paid |
||||||||||||
| 2023 |
146,750 | — | — | 146,750 | ||||||||||||
| 2022 |
176,538 | — | (196,350 | ) | (19,812 | ) | ||||||||||
| NEOs |
Average Summary Compensation Table Total for Non-PEO NEOs |
Average Exclusion of Stock Awards for Non-PEO NEOs |
Inclusion of Equity Values for Non-PEO NEOs |
Compensation Actually Paid to Non-PEO NEOs |
||||||||||||
| 2023 |
16,667 | — | — | 16,667 | ||||||||||||
| 2022 |
128,584 | (62,760 | ) | — | 65,824 | |||||||||||
The amounts in the Inclusion of Equity Values in the tables above are derived from the amounts set forth in the following tables:
| PEO |
Year-End Fair Value of Equity Awards Granted During Year That Remained Unvested as of Last Day of Year |
Change in Fair Value from Last Day of Prior Year to Last Day of Year of Unvested Equity Awards |
Vesting-Date Fair Value of Equity Awards Granted During Year that Vested During Year |
Change in Fair Value from Last Day of Prior Year to Vesting Date of Unvested Equity Awards that Vested During Year |
Fair Value at Last Day of Prior Year of Equity Awards Forfeited During Year |
Total - Inclusion of Equity Values |
||||||||||||||||||
| 2023 |
— | — | — | — | — | — | ||||||||||||||||||
| 2022 |
— | — | — | (13,350 | ) | (183,000 | ) | (196,350 | ) | |||||||||||||||
| NEOs |
Average Year-End Fair Value of Equity Awards Granted During Year That Remained Unvested as of Last Day of Year for Non-PEO NEOs |
Average Change in Fair Value from Last Day of Prior Year to Last Day of Year of Unvested Equity Awards for Non-PEO NEOs |
Average Vesting-Date Fair Value of Equity Awards Granted During Year that Vested During Year for Non-PEO NEOs |
Average Change in Fair Value from Last Day of Prior Year to Vesting Date of Unvested Equity Awards that Vested During Year for Non-PEO NEOs |
Average Fair Value at Last Day of Prior Year of Equity Awards Forfeited During Year for Non-PEO NEOs |
Total - Average Inclusion of Equity Values for Non-PEO NEOs |
||||||||||||||||||
| 2023 |
— | — | — | — | — | — | ||||||||||||||||||
| 2022 |
— | (313,800 | ) | — | (313,800 | ) | (627,600 | ) | (941,400 | ) | ||||||||||||||
| (5) |
The amounts shown for Value of Initial Fixed $100 Investment Based on Total Shareholder Return ("TSR") was set on December 31, 2020 and was adjusted for the impact of the spin-off of M-tron Industries, Inc. using the example allocation from the IRS Form 8937 which is posted on the Company's website. |
Relationship between PEO and Non-PEO Compensation Actually Paid and Net Income
In accordance with SEC rules, the following chart sets forth the relationship between Compensation Actually Paid to our PEO, the average of Compensation Actually Paid to our Non-PEO NEOs, and the Company's Net Income during the two most recently completed fiscal years.
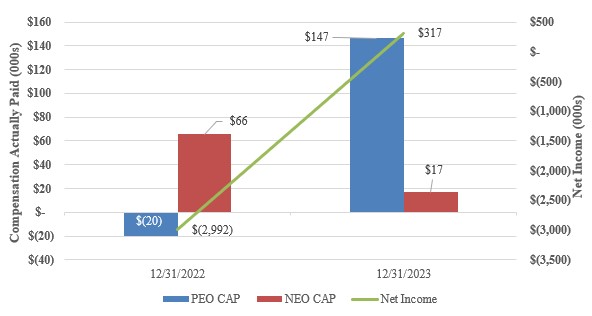
Relationship Between PEO and Non-PEO NEO Compensation Actually Paid and Total Shareholder Return
In accordance with SEC rules, the following chart sets forth the relationship between Compensation Actually Paid to our PEO, the average of Compensation Actually Paid to our Non-PEO NEOs, and the Company's cumulative TSR during the two most recently completed fiscal years.
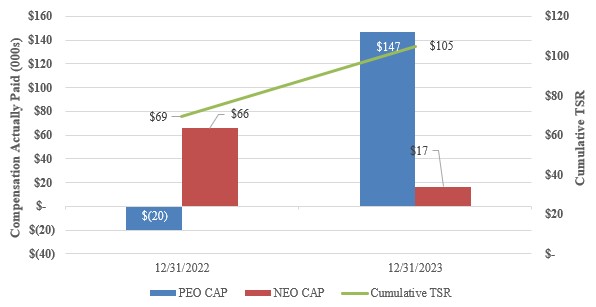
| Security Ownership of Certain Beneficial Owners and Management and Related Stockholder Matters |
The following table sets forth information regarding the number of shares of our common stock beneficially owned on March 15, 2024, by:
| • |
Each person who is known to us to beneficially own more than 5% of our common stock; |
| • |
Each of our directors, nominees and named executive officers; and |
| • |
All of our directors and executive officers, as a group. |
The amounts and percentages of common stock beneficially owned are reported on the basis of regulations of the SEC governing the determination of beneficial ownership of securities. Under the rules of the SEC, a person is deemed to be a "beneficial owner" of a security if that person has or shares voting power, which includes the power to vote or direct the voting of a security, or investment power, which includes the power to dispose of or to direct the disposition of a security. A person is also deemed to be a beneficial owner of any securities of which that person has a right to acquire beneficial ownership within 60 days. Under these rules, more than one person may be deemed a beneficial owner of the same securities and a person may be deemed to be a beneficial owner of securities as to which such person has no economic interest. Except as otherwise indicated in the footnotes below, each of the beneficial owners listed has, to our knowledge, sole voting and investment power with respect to the indicated shares of common stock.
Except as otherwise set forth below, the address of each of the persons listed below is: The LGL Group, Inc., 2525 Shader Road, Orlando, Florida 32804.
| Common Stock Beneficially Owned (1) |
||||||||
| Name and Address of Beneficial Owner |
Shares |
% | ||||||
| 5% Stockholders: |
||||||||
| Mario J. Gabelli |
1,042,612 | (2) | 19.4 | |||||
| Bard Associates, Inc. |
418,041 | (3) | 7.8 | |||||
| Directors and Named Executive Officers: |
||||||||
| Marc J. Gabelli |
847,757 | (4) | 15.8 | |||||
| Timothy Foufas |
41,416 | * | ||||||
| Michael J. Ferrantino, Jr. |
29,595 | * | ||||||
| Manjit Kalha |
27,625 | * | ||||||
| Linda Biles |
8,820 | * | ||||||
| James W. Tivy |
3,000 | * | ||||||
| Kaan Aslansan |
2,874 | * | ||||||
| Herve Francois |
2,874 | * | ||||||
| Darlene DeRemer |
2,874 | * | ||||||
| Patrick Huvane |
— | * | ||||||
| All executive officers and directors as a group (10 persons) |
966,835 | 18.1 | ||||||
| * |
Less than 1% of outstanding shares. |
| (1) |
The applicable percentage of ownership for each beneficial owner is based on 5,352,937 shares of common stock outstanding as of March 15, 2024. Shares of common stock issuable upon exercise of options, warrants or other rights beneficially owned that are exercisable within 60 days are deemed outstanding for the purpose of computing the percentage ownership of the person holding such securities and rights and all executive officers and directors as a group. |
| (2) |
Includes (i) 500,675 shares of common stock owned directly by Mario J. Gabelli; (ii) 476,937 shares owned by GGCP Inc., of which Mario J. Gabelli is the chief executive officer, a director and controlling shareholder; (iii) 64,500 shares held by the Gabelli Foundation, Inc. and (iv) 500 shares owned by GAMCO Asset Management, Inc. Mario J. Gabelli disclaims beneficial ownership of the shares owned by MJG-IV Limited Partnership, and GGCP, Inc. except to the extent of his pecuniary interest therein. Mario J. Gabelli's business address is 401 Theodore Fremd Avenue, Rye, New York 10580-1430. |
| (3) |
Based on information disclosed in a Schedule 13G/A filed with the SEC on January 4, 2024, by Bard Associates, Inc. ("Bard") reporting beneficial ownership as of December 31, 2023. Item 4 to this Schedule 13G/A provides details as to the voting and investment power of Bard as well as the right to acquire LGL common stock within 60 days. All information provided with respect to this entity is based solely on information set forth in the Schedule 13G/A. LGL Group takes no responsibility therefor and makes no representation as to its accuracy or completeness as of the date hereof or any subsequent date. Bard's business address is 135 South LaSalle Street, Suite 3700, Chicago, Illinois 60603. |
| (4) |
Includes (i) 83,454 shares of common stock owned directly by Marc Gabelli; and (ii) 764,303 shares held by Venator Merchant Fund, L.P. ("Venator Fund"). Venator Global, LLC ("Venator Global"), which is the sole general partner of Venator Fund, may be deemed to beneficially own the securities owned by Venator Fund. Marc Gabelli, who is the President and Sole Member of Venator Global, may be deemed to beneficially own the securities owned by Venator Fund. Marc Gabelli disclaims beneficial ownership of the securities owned by Venator Fund, except to the extent of his pecuniary interest therein. |
Equity Compensation Plan Information
The following table provides information about our common stock that may be issued upon the exercise of options, warrants and rights under all of our existing equity compensation plans (including individual arrangements) as of December 31, 2023:
| Number of securities to be issued upon exercise of outstanding options, warrants and rights |
Weighted-average exercise price of outstanding options, warrants and rights |
Number of securities remaining available for future issuance under equity compensation plans (excluding securities reflected in column (a)) |
||||||||||
| Plan Category |
(a) |
(b) |
(c) |
|||||||||
| Equity compensation plans approved by security holders (1) |
— | $ | — | 955,070 | ||||||||
| Equity compensation plans not approved by security holders |
— | — | — | |||||||||
| Total |
— | $ | — | 955,070 | ||||||||
| (1) |
The 2021 Incentive Plan was approved by our stockholders on December 28, 2021. 1,000,000 shares of common stock are authorized for issuance under the 2021 Incentive Plan. As of December 31, 2023, there were 20,118 restricted stock awards outstanding that were issued under the 2021 Incentive Plan. |
| Certain Relationships and Related Transactions, and Director Independence |
Transactions with Related Persons, Promoters and Certain Control Persons
All transactions between us and any of our officers, directors, director nominees, principal stockholders or their immediate family members are to be approved by the Audit Committee and are to be on terms no less favorable to us than we could obtain from unaffiliated third parties. Such policy and procedures are set forth in a resolution of the Board.
Investment Activity with GAMCO Investors, Inc.
Certain cash equivalents and marketable securities held and invested in various mutual funds are managed or advised by GAMCO Investors, Inc. or one of its subsidiaries (collectively, "GAMCO" or the "Fund Manager"), which is related to the Company through certain of our stockholders. As of December 31, 2023 and 2022, the balance with the Fund Manager totaled $32,568 and $26,811, respectively. Fund management fees earned by the Fund Manager are anticipated to be approximately 17 bps of the asset balances under management on an annual basis. The brokerage and fund transactions in 2023 and 2022 were directed solely at the discretion of the Investment Committee and management.
All transactions between us and any of our officers, directors, director nominees, principal stockholders or their immediate family members are to be approved by the Audit Committee and are to be on terms no less favorable to us than we could obtain from unaffiliated third parties. Such policy and procedures are set forth in a resolution of the Board.
Transactions with M-tron Industries, Inc.
Transitional Administrative and Management Services Agreement
LGL Group and MtronPTI entered into an Amended and Restated Transitional Administrative and Management Services Agreement ("MtronPTI TSA"), which sets out the terms for services to be provided between the two companies post-separation. The current terms result in a net monthly payment of $4 per month to MtronPTI.
Tax Indemnity and Sharing Agreement
LGL Group and MtronPTI entered into a Tax Indemnity and Sharing Agreement ("MtronPTI Tax Agreement"), which sets out the terms for which party would be responsible for taxes imposed on the Company if the Distribution, together with certain related transactions, were to fail to qualify as a tax-free transaction under Internal Revenue Code ("IRC") Sections 355 and 368(a)(1)(D) if such failure were the result of actions taken after the Distribution by the Company or MtronPTI.
Other Transactions
Director Independence
Pursuant to New York Stock Exchange ("NYSE") rules, in order for a director to qualify as "independent", the Board of Directors must affirmatively determine that the director has no material relationship with the Company that would impact the director's independence. Additionally, NYSE rules require that a majority of the members of a listed company's board of directors must qualify as "independent."
The Board has determined that Messrs. Kalha, Aslansan, and Francois and Ms. DeRemer, comprising a majority of the members of the Board, are independent within the meaning of NYSE rules.
Messers. Ferrantino, Foufas, and Gabelli were not independent pursuant to NYSE rules because they were employed by the Company during fiscal year 2023.
| Principal Accountant Fees and Services |
Fees Billed During 2023 and 2022
The following tables provide information about fees billed by PKF O'Connor Davies, LLP and RSM US LLP during 2023 and 2022:
| 2023 |
||||||||||||||||||||
| Audit Fees (1) |
Audit-Related Fees (2) |
Tax Fees |
All Other Fees |
Total |
||||||||||||||||
| PKF O'Connor Davies, LLP |
$ | 86,750 | $ | — | $ | — | $ | — | $ | 86,750 | ||||||||||
| RSM US LLP |
162,750 | — | — | — | 162,750 | |||||||||||||||
| Total |
$ | 249,500 | $ | — | $ | — | $ | — | $ | 249,500 | ||||||||||
| 2022 |
||||||||||||||||||||
| Audit Fees (1) |
Audit-Related Fees (2) |
Tax Fees |
All Other Fees |
Total |
||||||||||||||||
| PKF O'Connor Davies, LLP |
$ | — | $ | — | $ | — | $ | — | $ | — | ||||||||||
| RSM US LLP |
285,000 | 258,850 | — | — | 543,850 | |||||||||||||||
| Total |
$ | 285,000 | $ | 258,850 | $ | — | $ | — | $ | 543,850 | ||||||||||
| (1) |
Audit Fees. Audit fees consisted of fees for the audit of LGL Group's financial statements in the Company's annual report on Form 10-K and reviews of the Company's financial statements in the Company's quarterly reports on Form 10-Q. |
| (2) |
Audited-Related Fees. Audit-related fees include assurance and related services that are traditionally performed by independent accountants. During 2022, RSM rendered audit-related services totaling $258,850 in connection with stand-alone MtronPTI audits for 2019 and 2020, quarterly reviews for the first and second quarters of 2021 and 2022, multiple Form 10 filings, and the Company’s Proxy Statement on Schedule 14A related to obtaining stockholder approval for the Spin-Off of MtronPTI. |
Pre-Approval Policies and Procedures
The Audit Committee policy and procedures for the pre-approval of audit and non-audit services rendered by our independent registered public accounting firm are reflected in the Audit Committee Charter. The Audit Committee Charter provides that the Audit Committee shall pre-approve all audit and non-audit services provided by the independent registered public accounting firm and shall not engage the independent registered public accounting firm to perform the specific non-audit services proscribed by law or regulation. The Audit Committee may delegate pre-approval authority to a member of the Audit Committee. The decisions of any Audit Committee member to whom pre-approval authority is delegated must be presented to the full Audit Committee at its next scheduled meeting.
If any services other than audit services are rendered by our independent registered public accounting firm, the Audit Committee determines whether such services are compatible with maintaining our independent registered public accounting firm's independence.
All services performed by our independent registered public accounting firm were pre-approved by the Audit Committee.
Change of Independent Registered Public Accounting Firm
As previously reported on the Company’s Current Report on Form 8-K, dated May 2, 2023, on April 26, 2023, the Audit Committee dismissed RSM US LLP as the Company’s independent registered public accounting firm, effective immediately in anticipation of the appointment of PKF O'Connor Davies, LLP as the Company’s new independent registered public accounting firm. The decision to change the Company’s independent registered public accounting firm from RSM US LLP to PKF O'Connor Davies, LLP was unanimously approved by the Audit Committee. PKF O'Connor Davies, LLP was appointed as the Company’s new independent registered public accounting firm effective as of April 26, 2023.
The reports of RSM US LLP on the consolidated financial statements of the Company for the fiscal years ended December 31, 2022 and December 31, 2021 did not contain an adverse opinion or a disclaimer of opinion and were not qualified or modified as to uncertainty, audit scope or accounting principles.
During the fiscal years ended December 31, 2022 and December 31, 2021, there were no "disagreements" (as defined in Item 304(a)(1)(iv) of Regulation S-K and the related instructions) between the Company and RSM US LLP on any matter of accounting principles or practices, financial statement disclosure or auditing scope or procedure, which disagreements, if not resolved to RSM US LLP’s satisfaction, would have caused RSM US LLP to make reference to the subject matter of the disagreements in its reports on the consolidated financial statements for such years. During the fiscal years ended December 31, 2022 and December 31, 2021 and the subsequent interim period through April 26, 2023, there were no reportable events of the type described in Item 304(a)(1)(v) of Regulation S-K.
| Exhibits and Financial Statement Schedules |
| (a) | List of documents filed as part of this report: |
| 1. | Financial Statements: |
| 2. | Financial Statement Schedules: |
None.
| 3. | Exhibit Index |
The following is a list of exhibits filed as part of this Form 10-K:
| * | Filed herewith |
| ** | Furnished herewith. In accordance with Item 601(b)(32) of Regulation S-K, this Exhibit is not deemed "filed" for purposes of Section 18 of the Exchange Act or otherwise subject to the liabilities of that section. Such certifications will not be deemed incorporated by reference into any filing under the Securities Act of 1933, as amended, or the Securities Exchange Act of 1934, as amended, except to the extent that the registrant specifically incorporates it by reference. |
| + | Indicates management or compensatory plan. |
The exhibits listed above have been filed separately with the SEC in conjunction with this Annual Report on Form 10-K or have been incorporated by reference into this Annual Report on Form 10-K. Upon request, the Company will furnish to each of its stockholders a copy of any such exhibit. Requests should be addressed to the Corporate Secretary, The LGL Group, Inc., 2525 Shader Road, Orlando, Florida 32804.
| Form 10-K Summary |
None.
Pursuant to the requirements of the Securities Exchange Act of 1934, the Registrant has duly caused this report to be signed on its behalf by the undersigned thereunto duly authorized.
| THE LGL GROUP, INC. | |||
| April 1, 2024 | By: | /s/ Timothy Foufas | |
| TIMOTHY FOUFAS | |||
| Co-Chief Executive Officer (Principal Executive Officer) | |||
Pursuant to the requirements of the Securities Exchange Act of 1934, this report has been signed below by the following persons on behalf of the Registrant and in the capacities and on the dates indicated:
| SIGNATURE | CAPACITY | DATE | ||
| /s/ Timothy Foufas | Co-Chief Executive Officer and Director | April 1, 2024 | ||
| TIMOTHY FOUFAS | (Principal Executive Officer) | |||
| /s/ James W. Tivy | Chief Accounting Officer | April 1, 2024 | ||
| JAMES W. TIVY | (Principal Financial Officer) | |||
|
| Co-Chief Executive Officer, Director, Chairman of the Board | April 1, 2024 | ||
| MARC J. GABELLI | ||||
| /s/ Manjit Kalha | Director | April 1, 2024 | ||
| MANJIT KALHA | ||||
| /s/ Michael J. Ferrantino, Jr. | Director | April 1, 2024 | ||
| MICHAEL J. FERRANTINO, JR. | ||||
| /s/ Kaan Aslansan | Director | April 1, 2024 | ||
| KAAN ASLANSAN | ||||
| /s/ Herve Francois | Director | April 1, 2024 | ||
| HERVE FRANCOIS | ||||
| /s/ Darlene DeRemer | Director | April 1, 2024 | ||
| DARLENE DEREMER | ||||
Index to Financial Statements
Report of Independent Registered Public Accounting Firm
To the Stockholders and the Board of Directors of The LGL Group, Inc.
Opinion on the Financial Statements
We have audited the accompanying consolidated balance sheet of The LGL Group, Inc. and its subsidiaries (the "Company") as of December 31, 2023, the related consolidated statement of operations, stockholders’ equity and cash flows for the year then ended, and the related notes (collectively referred to as the "financial statements"). In our opinion, the financial statements present fairly, in all material respects, the financial position of the Company as of December 31, 2023, and the results of its operations and its cash flows for the year then ended, in conformity with accounting principles generally accepted in the United States of America.
As discussed in Note 4 to the financial statements, the Company changed the composition of its segment information in 2023. We have also audited the adjustments necessary to retrospectively apply the change in the 2022 segment information as provided in Note 4 and the resulting adjustments to the Company’s 2022 consolidated statement of operations which are discussed in Note 2 and Note 5. In our opinion, such adjustments are appropriate and have been properly applied. We were not engaged to audit, review, or apply any procedures to the Company’s 2022 financial statements other than with respect to the reclassifications and, accordingly, we do not express an opinion or any other form of assurance on the 2022 financial statements as whole.
Change in Accounting Principle
As discussed in Note 4 to the financial statements, the Company changed the manner in which its chief operating decision maker reviews the business to assess performance and allocate resources, resulting in a change in which the Company presents its operating segments. Also, as a result of the change in segment reporting and related information and, as discussed in Note 2 and Note 5 to the financial statements, the Company elected to change its method of accounting to classify interest income and investment (loss) income within revenue as part of the Company’s ongoing major operations in the consolidated statements of operations.
Basis for Opinion
These financial statements are the responsibility of the Company’s management. Our responsibility is to express an opinion on the Company’s financial statements based on our audit. We are a public accounting firm registered with the Public Company Accounting Oversight Board (United States) ("PCAOB") and are required to be independent with respect to the Company in accordance with U.S. federal securities laws and the applicable rules and regulations of the Securities and Exchange Commission and the PCAOB.
We conducted our audit in accordance with the standards of the PCAOB. Those standards require that we plan and perform the audit to obtain reasonable assurance about whether the financial statements are free of material misstatement, whether due to error or fraud. The Company is not required to have, nor were we engaged to perform, an audit of its internal control over financial reporting. As part of our audit, we are required to obtain an understanding of internal control over financial reporting but not for the purpose of expressing an opinion on the effectiveness of the Company’s internal control over financial reporting. Accordingly, we express no such opinion.
Our audit included performing procedures to assess the risks of material misstatement of the financial statements, whether due to error or fraud, and performing procedures that respond to those risks. Such procedures included examining, on a test basis, evidence regarding the amounts and disclosures in the financial statements. Our audit also included evaluating the accounting principles used and significant estimates made by management, as well as evaluating the overall presentation of the financial statements. We believe that our audit provides a reasonable basis for our opinion.
Critical Audit Matter
The critical audit matter communicated below is a matter arising from the current period audit of the financial statements that was communicated or required to be communicated to the audit committee and that: (1) relates to accounts or disclosures that are material to the financial statements and (2) involved our especially challenging, subjective or complex judgments. The communication of critical audit matters does not alter in any way our opinion on the financial statements, taken as a whole, and we are not, by communicating the critical audit matter below, providing separate opinions on the critical audit matter or on the accounts or disclosures to which it relates.
Investment in LGL Systems Acquisition Holding Company, LLC ("LGL Systems") - Refer to Notes 2 and 7 to the Financial Statements
During June 2023, Lynch Capital International, LLC ("Lynch Capital"), a wholly owned subsidiary of the Company, was appointed as sole managing member of LGL Systems Nevada Management Partners LLC ("LGL Nevada"). Concurrently, Lynch Capital invested $1.0 million into LGL Systems, representing 34.8% of the membership interests in LGL Systems, which is controlled by LGL Nevada.
The Company performed a Variable Interest Entity ("VIE") and a Voting Interest Entity ("VOE") analysis for the entities in the organizational structure of the Lynch Capital transaction and concluded LGL Systems was a VIE. Through its detailed analysis of the various decision-making rights and powers that each party possesses, management concluded the Company was the primary beneficiary of LGL Systems and was therefore required to consolidated LGL Systems.
We identified the consolidation analysis as a critical audit matter because the consolidation analysis, specifically the determination of control, involved an interpretation of especially complex accounting principles generally accepted in the United States of America. The evaluation of management's determination of control required an increased extent of effort.
Our audit procedures related to the accounting treatment of the investment in LGL Systems included, among other things, the following:
| • | We evaluated the design and implementation of controls over management's accounting for significant and unusual transactions, specifically, the determination of control over LGL Systems. |
| • | We read transaction agreements, traced and agreed the facts included in the Company's accounting treatment analysis to the agreements and evaluated the assumptions used to arrive at the determined conclusion. |
| • | We evaluated whether the assumptions were consistent with evidence obtained in other areas of the audit. |
| • | We consulted with our subject matter expert within our Firm to assess the reasonableness of the Company's accounting conclusions. |
| • | Assessed the adequacy of the disclosures related to the VIE in the financial statements. |
/s/
We have served as the Company’s auditor since April 26, 2023.
April 1, 2024
PCAOB ID No.
Report of Independent Registered Public Accounting Firm
To the Stockholders and the Board of Directors of The LGL Group, Inc.
Opinion on the Financial Statements
We have audited, before the effects of the adjustments to retrospectively apply the changes in the Company's disclosures about segments and related information in Note 4 and the change in accounting principle and related information in Note 2 and Note 5, the accompanying consolidated balance sheet of The LGL Group, Inc. and subsidiaries (the Company) as of December 31, 2022, the related consolidated statements of operations, stockholders' equity and cash flows for the year ended December 31, 2022, and the related notes to the consolidated financial statements (collectively, the financial statements). The 2022 financial statements before the effects of the adjustments described in Note 2 are not presented herein. In our opinion, before the effects of the adjustments to retrospectively apply the changes in the Company's disclosures about segments and related information in Note 4 and the change in accounting principle and related information in Note 2 and Note 5, the financial statements present fairly, in all material respects, the financial position of the Company as of December 31, 2022, and the results of their operations and their cash flows for each of the two years in the period ended December 31, 2022, in conformity with accounting principles generally accepted in the United States of America.
We were not engaged to audit, review, or apply any procedures to retrospectively apply the changes in the Company's disclosures about segments and related information in Note 4 and the change in accounting principle and related information in Note 2 and Note 5 and, accordingly we do not express an opinion or any other form of assurance about whether such adjustments are appropriate and have been properly applied. Those adjustments were audited by other auditors.
Basis for Opinion
These financial statements are the responsibility of the Company’s management. Our responsibility is to express an opinion on the Company’s financial statements based on our audits. We are a public accounting firm registered with the Public Company Accounting Oversight Board (United States) (PCAOB) and are required to be independent with respect to the Company in accordance with U.S. federal securities laws and the applicable rules and regulations of the Securities and Exchange Commission and the PCAOB.
We conducted our audits in accordance with the standards of the PCAOB. Those standards require that we plan and perform the audit to obtain reasonable assurance about whether the financial statements are free of material misstatement, whether due to error or fraud. Our audits included performing procedures to assess the risks of material misstatement of the financial statements, whether due to error or fraud, and performing procedures that respond to those risks. Such procedures included examining, on a test basis, evidence regarding the amounts and disclosures in the financial statements. Our audits also included evaluating the accounting principles used and significant estimates made by management, as well as evaluating the overall presentation of the financial statements. We believe that our audits provide a reasonable basis for our opinion.
Emphasis of Matter
As discussed in Note 3 to the consolidated financial statements, on October 7, 2022, the Company completed the separation of its M-tron Industries, Inc. (“MtronPTI”) business into an independent, publicly traded company. As such, MtronPTI’s business line is presented as discontinued operations to distinguish the financial impact of the disposal transaction from ongoing operations. Our opinion is not modified with respect to this matter.
/s/ RSM US LLP
We served as the Company’s auditor from 2011 to 2023.
Orlando, Florida
April 17, 2023
Consolidated Balance Sheets
| December 31, | ||||||||
| (in thousands, except share data) | 2023 | 2022 | ||||||
| Assets: | ||||||||
| Current assets: | ||||||||
| Cash and cash equivalents | $ | $ | ||||||
| Marketable securities | ||||||||
| Accounts receivable, net of allowance of $ and $, respectively | ||||||||
| Inventories, net | ||||||||
| Prepaid expenses and other current assets | ||||||||
| Total current assets | ||||||||
| Property, plant and equipment, net | ||||||||
| Right-of-use lease asset | ||||||||
| Intangible assets, net | ||||||||
| Deferred income tax asset, net | ||||||||
| Total assets | $ | $ | ||||||
| Liabilities: | ||||||||
| Current liabilities: | ||||||||
| Accounts payable | $ | $ | ||||||
| Accrued compensation and commissions expense | ||||||||
| Income taxes payable | ||||||||
| Other accrued expenses and liabilities | ||||||||
| Total current liabilities | ||||||||
| Other liabilities | ||||||||
| Total liabilities | ||||||||
| Contingencies (Note 14) | ||||||||
| Stockholders' equity: | ||||||||
| Common stock ($ par value; shares authorized; and shares issued as of 2023 and 2022, respectively; and shares outstanding as of 2023 and 2022, respectively) | ||||||||
| Treasury stock, at cost ( shares as of 2023 and 2022, respectively) | ( | ) | ( | ) | ||||
| Additional paid-in capital | ||||||||
| Accumulated deficit | ( | ) | ( | ) | ||||
| Total LGL Group stockholders' equity | ||||||||
| Non-controlling interests | ||||||||
| Total stockholders' equity | ||||||||
| Total liabilities and stockholders' equity | $ | $ | ||||||
See accompanying Notes to the Consolidated Financial Statements.
Consolidated Statements of Operations
| Year Ended December 31, | ||||||||
| (in thousands, except share data) | 2023 | 2022 | ||||||
| Revenues: | ||||||||
| Net sales | $ | $ | ||||||
| Net investment income | ||||||||
| Net gains (losses) | ( | ) | ||||||
| Total revenues | ( | ) | ||||||
| Expenses: | ||||||||
| Manufacturing cost of sales | ||||||||
| Engineering, selling and administrative | ||||||||
| Total expenses | ||||||||
| Income (loss) from continuing operations before income tax expense | ( | ) | ||||||
| Income tax expense (benefit) | ( | ) | ||||||
| Net income (loss) from continuing operations | ( | ) | ||||||
| (Loss) income from discontinued operations, net of tax | ( | ) | ||||||
| Net income (loss) | ( | ) | ||||||
| Less: Net income attributable to non-controlling interests | ||||||||
| Net income (loss) attributable to LGL Group common stockholders | $ | $ | ( | ) | ||||
| Income (loss) per common share attributable to LGL Group common stockholders: | ||||||||
| Basic: | ||||||||
| Income (loss) from continuing operations | $ | $ | ( | ) | ||||
| (Loss) income from discontinued operations | ( | ) | ||||||
| Net income (loss) attributable to LGL Group common stockholders | $ | $ | ( | ) | ||||
| Diluted: | ||||||||
| Income (loss) from continuing operations | $ | $ | ( | ) | ||||
| (Loss) income from discontinued operations | ( | ) | ||||||
| Net income (loss) attributable to LGL Group common stockholders | $ | $ | ( | ) | ||||
| Weighted average shares outstanding: | ||||||||
| Basic | ||||||||
| Diluted | ||||||||
See accompanying Notes to the Consolidated Financial Statements.
CONSOLIDATED STATEMENTS of STOCKHOLDERS' EQUITY
| (in thousands, except share data) | Shares of Common Stock Outstanding | Common Stock | Treasury Stock | Additional Paid-In Capital | Retained Earnings (Accumulated Deficit) | Total LGL Group Stockholders' Equity | Non-Controlling Interests | Total Equity | ||||||||||||||||||||||||
| Balance, December 31, 2021 | $ | $ | ( | ) | $ | $ | $ | $ | $ | |||||||||||||||||||||||
| Net loss attributable to LGL Group or non-controlling interests | — | ( | ) | ( | ) | ( | ) | |||||||||||||||||||||||||
| Consolidation of non-controlling interests | ||||||||||||||||||||||||||||||||
| MtronPTI Spin-off | — | ( | ) | ( | ) | ( | ) | |||||||||||||||||||||||||
| Exercise of stock options | ||||||||||||||||||||||||||||||||
| Repurchase of shares exercised | ( | ) | ( | ) | ( | ) | ( | ) | ||||||||||||||||||||||||
| Stock-based compensation | ||||||||||||||||||||||||||||||||
| Balance, December 31, 2022 | ( | ) | ( | ) | ||||||||||||||||||||||||||||
| Net income attributable to LGL Group or non-controlling interests | — | |||||||||||||||||||||||||||||||
| Consolidation of non-controlling interests | ||||||||||||||||||||||||||||||||
| MtronPTI Spin-off | — | |||||||||||||||||||||||||||||||
| Exercise of stock options | — | |||||||||||||||||||||||||||||||
| Repurchase of shares exercised | — | |||||||||||||||||||||||||||||||
| Stock-based compensation | ||||||||||||||||||||||||||||||||
| Balance, December 31, 2023 | $ | $ | ( | ) | $ | $ | ( | ) | $ | $ | $ | |||||||||||||||||||||
See accompanying Notes to the Consolidated Financial Statements.
CONSOLIDATED STATEMENTS OF CASH FLOWS (a)
| Year Ended December 31, | ||||||||
| (in thousands) | 2023 | 2022 | ||||||
| Cash flows from operating activities: | ||||||||
| Net income (loss) | $ | $ | ( | ) | ||||
| Adjustments to reconcile net (loss) income to net cash (used in) provided by operating activities: | ||||||||
| Noncash revenues, expenses, gains and losses included in income (loss): | ||||||||
| Depreciation | ||||||||
| Amortization of finite-lived intangible assets | ||||||||
| Stock-based compensation | ||||||||
| Realized loss on sale of marketable securities | ||||||||
| Unrealized gain on marketable securities | ( | ) | ( | ) | ||||
| Deferred income tax expense (benefit) | ( | ) | ||||||
| Changes in operating assets and liabilities: | ||||||||
| Decrease (increase) in accounts receivable, net | ( | ) | ||||||
| Decrease (increase) in inventories, net | ( | ) | ||||||
| Decrease (increase) in prepaid expenses and other assets | ( | ) | ||||||
| Decrease in income taxes payable | ( | ) | ||||||
| (Decrease) increase in accounts payable, accrued compensation and commissions expense and other | ( | ) | ||||||
| Total adjustments | ||||||||
| Net cash provided by (used in) operating activities | ( | ) | ||||||
| Cash flows from investing activities: | ||||||||
| Capital expenditures | ( | ) | ||||||
| Proceeds from sale of marketable securities | ||||||||
| Purchase of marketable securities | ( | ) | ||||||
| Consolidation of noncontrolling interests | ||||||||
| Net cash provided by (used in) investing activities | ( | ) | ||||||
| Cash flows from financing activities: | ||||||||
| Transfer to M-tron Industries, Inc. related to Separation | ( | ) | ||||||
| Exercise of stock options | ||||||||
| Payment for taxes related to net share settlement of equity awards | ( | ) | ||||||
| Net cash (used in) financing activities | ( | ) | ||||||
| Increase (decrease) in cash and cash equivalents | ( | ) | ||||||
| Cash and cash equivalents at beginning of year | ||||||||
| Cash and cash equivalents at end of year | $ | $ | ||||||
| Noncash Financing Activity: | ||||||||
| Distribution of M-tron Industries, Inc. related to Separation | $ | $ | ( | ) | ||||
| Supplemental Disclosure: | ||||||||
| Income taxes paid | $ | $ | ||||||
| (a) |
The cash flows related to discontinued operations have not been segregated. Accordingly, the Consolidated Statements of Cash Flows include the results of continuing and discontinued operations. Refer to Note 3 - Discontinued Operations for further information. |
See accompanying Notes to the Consolidated Financial Statements.
The LGL Group, Inc. is a holding company engaged in services, merchant investment, and manufacturing business activities. LGL Group was incorporated in 1928 under the laws of the State of Indiana and reincorporated under the laws of the State of Delaware in 2007. Unless the context indicates otherwise, the terms "LGL Group," "LGL," "we," "us," "our," or the "Company" mean The LGL Group, Inc. and its consolidated subsidiaries.
The Company’s manufacturing business is operated through its subsidiary Precise Time and Frequency, LLC ("PTF"), which has operations in Wakefield, Massachusetts. PTF is engaged in the design of high-performance Frequency and Time Reference Standards that form the basis for timing and synchronization in various applications.
As part of our ongoing efforts developing our Merchant Investment segment, the Company took additional steps and solidified its role as the Managing Partner of a syndicated investment partnership. We have pursued opportunities for direct investing for control, direct investing as a minority with the ability to influence such as through board representation and direct investing to build an industry platform to acquire and build along an industry vertical.
The consolidated financial statements include the accounts of The LGL Group, Inc., its majority-owned subsidiaries, and variable interest entities ("VIEs") of which we are the primary beneficiary.
These consolidated financial statements and accompanying notes have been prepared in accordance with accounting principles generally accepted in the United States of America ("U.S. GAAP"). Intercompany accounts and transactions have been eliminated in consolidation.
Certain prior period balances within the Notes to the Consolidated Financial Statements were reclassified to conform with the current period presentation, including:
| • | Note 5 - Investments: within the Marketable Securities table, Equity fund and other securities was separated into two line items: Equity securities and Mutual funds. IronNet was reclassified to be included within Equity securities. |
| • | Note 15 - Other Financial Statement Information: |
| ◦ | Inventories, Net table: the components of Inventory, net are shown gross of Reserve for excess and obsolete inventory |
| ◦ | Intangible Assets, Net: the components of Intangible assets, net are shown gross of Accumulated amortization |
Spin-Off of M-tron Industries, Inc.
On October 7, 2022, the tax-free spin-off of the M-tron Industries, Inc. ("MtronPTI") business into an independent, publicly traded company was completed (the "Separation" or "Spin-Off") and MtronPTI became an independent, publicly traded company trading on the NYSE American under the stock symbol "MPTI."
The Separation was achieved through LGL’s distribution (the "Distribution") of
The historical financial results of the MtronPTI business for periods prior to the distribution date along with the related direct costs of the Separation ("Separation Costs") are reflected in the Company’s consolidated financial statements as discontinued operations. Unless otherwise noted, discussion in these Notes to the Consolidated Financial Statements refers to our continuing operations. Refer to Note 3 - Discontinued Operations for additional information.
2. Summary of Significant Accounting Policies
Principles of Consolidation
In the normal course of business, the Company invests in or has transactions with limited membership entities or other entities. These entities are considered to be either VIEs or voting interest entities ("VOEs"). The consolidation guidance requires an assessment involving judgments and analysis to determine (a) whether an entity in which the Company holds a variable interest is a VIE and (b) whether the Company's involvement, through holding interests directly or indirectly in the entity or contractually through other variable interests, would give it a controlling financial interest.
The Company consolidates entities in which it, directly or indirectly, is determined to have a controlling financial interest.
| • | VIEs: The Company consolidates VIEs for which it is the primary beneficiary. An entity is a VIE if its equity investors, as a group, lack the characteristics of a controlling financial interest or it does not have sufficient equity at risk to finance its expected activities without additional subordinated financial support from other parties. The primary beneficiary (a) has the power to direct the activities of the entity that most significantly impact the entity's economic performance and (b) has the obligation to absorb losses or the right to receive benefits from the entity that could be significant to the entity. |
| • | VOEs: For entities determined not to be VIEs, the Company consolidates entities in which it holds greater than 50% of the voting interest. |
The Company reviews its evaluation of whether an entity is a VIE as well as its consolidation conclusions quarterly to identify whether any reconsideration events have occurred. During June 2023, the Company determined it was the primary beneficiary of LGL Systems Acquisition Holding Company, LLC ("LGL Systems").
As of December 31, 2023, the Company has the following subsidiaries, including consolidated and unconsolidated VIEs:
| Subsidiary Name | State or Country of Organization | LGL Group Investment | |||
| Precise Time and Frequency, LLC | Delaware | | % | ||
| P3 Logistic Solutions LLC | Delaware | | |||
| Lynch Capital International, LLC | Delaware | | |||
| LGL Systems Acquisition Holding Company, LLC (a) | Delaware | | |||
| Lynch Systems Acquisition Holding Company, LLC | Delaware | | |||
| LGL Systems Nevada Management Partners LLC (b) | Nevada | | |||
| (a) | Entity is a consolidated VIE |
| (b) | Entity is an unconsolidated VIE |
Refer to Note 7 - Variable Interest Entities for further information.
Equity Method Investments
When the Company does not have a controlling financial interest in an entity but can exert significant influence over the entity’s operating and financial policies, the investment is accounted for either (i) under the equity method of accounting or (ii) at fair value by electing the fair value option available under U.S. GAAP. Significant influence generally exists when the Company owns 20% to 50% of the entity’s common stock or in-substance common stock. In applying the equity method, we record the investment at cost and subsequently increase or decrease the carrying amount of the investment by our proportionate share of earnings or losses of the investee. We record dividends or other equity distributions as reductions in the carrying value of the investment.
Non-Controlling Interests
Non-controlling interests represent the interests of shareholders, other than the Company, in consolidated entities. Net income (loss) attributable to non-controlling interests represents such shareholders' interests in the earnings and loss of those entities, or the attribution of results from consolidated VIEs to which the Company is not economically entitled.
The portion of the equity interest in LGL Systems the Company does not own is reflected as non-controlling interest in LGL Group's Consolidated Financial Statements.
Uses of Estimates
The preparation of the consolidated financial statements in conformity with U.S. GAAP requires management to make estimates and assumptions that affect the amounts reported in the financial statements and accompanying notes. Actual results could differ from those estimates.
Cash and Cash Equivalents
Cash and cash equivalents consist of cash on hand and highly liquid investments with no maturity or with a maturity of less than three months when purchased.
Marketable Securities
The Company accounts for equity securities under Financial Accounting Standards Board ("FASB") Accounting Standards Codification ("ASC") Topic 321, Investments - Equity Securities ("ASC 321"). Marketable equity securities are reported at fair value with the change in fair value from acquisition being recorded as gains and losses in the Consolidated Statements of Operations. Realized gains and losses are reported on securities sold during the period. Unrealized gains and losses include changes in fair value on securities held at the end of the period as well as the reversal of unrealized gains and losses at the time an investment is realized.
Realized and unrealized gains and losses on investments in Marketable securities are recorded in Net gains (losses) on the Consolidated Statement of Operations.
Refer to Note 5 – Investments for further information.
Accounts Receivable
Accounts receivable consists principally of amounts due from both domestic and foreign customers. Credit is extended based on an evaluation of the customer's financial condition and collateral is not required. Certain credit sales are made to industries that are subject to cyclical economic changes.
The Company maintains an allowance for credit losses for estimated uncollectible accounts receivable. Our reserves for estimated credit losses are based upon historical experience, specific customer collection issues, current conditions and reasonable and supportable forecasts that affect the collectability of the remaining cash flows over the contract terms of our receivables. Accounts are written off against the allowance account they are determined to no longer be collectible.
Inventories
Inventories are valued at the lower of cost or net realizable value using the first-in, first-out ("FIFO") method.
The Company maintains a reserve for inventory based on estimated losses that result from inventory that becomes obsolete or for which the Company has excess inventory levels. In determining these estimates, the Company performs an analysis on current demand and usage for each inventory item over historical time periods. Based on that analysis, the Company reserves a percentage of the inventory amount within each time period based on historical demand and usage patterns of specific items in inventory.
Refer to Note 15 – Other Financial Statement Information for further information.
Intangible Assets
Intangible assets are recorded at cost less accumulated amortization. Amortization is computed for financial reporting purposes using the straight-line method over the estimated useful lives of the assets, which range up to
The estimated aggregate amortization expense for intangible assets for each of the remaining years of the estimated useful life is as follows:
| Year | Amount | |||
| 2024 | ||||
| 2025 | ||||
| 2026 | ||||
| Total | $ | |||
Warranties
The Company offers a standard one-year warranty. The Company tests its products prior to shipment in order to ensure that they meet each customer's requirements based upon specifications received from each customer at the time its order is received and accepted. The Company's customers may request to return products for various reasons, including, but not limited to, the customers' belief that the products are not performing to specification. The Company's return policy states that it will accept product returns only with prior authorization and if the product does not meet customer specifications, in which case the product would be replaced or repaired. To accommodate the Company's customers, each request for return is reviewed; and if and when it is approved, a return materials authorization ("RMA") is issued to the customer.
Each month, the Company records a specific warranty reserve for approved RMAs covering products that have not yet been returned. The Company does not maintain a general warranty reserve because, historically, valid warranty returns resulting from a product not meeting specifications or being non-functional have been de minimis.
Revenue Recognition for Sales to Customers
The Company recognizes revenue from the sale of its products in accordance with the criteria in ASC Topic 606, Revenue from Contracts with Customers ("ASC 606"), which are:
Step 1: Identify the contract(s) with a customer.
Step 2: Identify the performance obligations in the contract.
Step 3: Determine the transaction price.
Step 4: Allocate the transaction price to the performance obligations in the contract.
Step 5: Recognize revenue when (or as) the entity satisfies a performance obligation.
The Company meets these conditions upon the Company’s satisfaction of the performance obligation, usually at the time of shipment to the customer, because control passes to the customer at that time. Our standard payment terms for customers are net due within 30 days, with a few exceptions, none regularly exceeding 60 days.
The Company provides disaggregated revenue details by geographic markets in Note 16 – Domestic and Foreign Revenues.
The Company offers a limited right of return and/or authorized price protection provisions in its agreements with certain electronic component distributors who resell the Company's products to original equipment manufacturers or electronic manufacturing services companies. As a result, the Company estimates and records a reserve for future returns and other charges against revenue at the time of shipment consistent with the terms of sale. The reserve is estimated based on historical experience with each respective distributor. These reserves and charges are immaterial as the Company does not have a history of significant price protection adjustments or returns. The Company provides a standard assurance warranty that does not create a performance obligation.
Practical Expedients
The Company applies the following practical expedients:
| - | The Company applies the practical expedient for shipping and handling as fulfillment costs. |
| - | The Company expenses sales commissions as sales and marketing expenses in the period they are incurred. |
Shipping Costs
Earnings (Loss) Per Share
The Company computes earnings (loss) per share in accordance with ASC Topic 260, Earnings Per Share ("ASC 260"). Basic earnings (loss) per share is computed by dividing net earnings by the weighted average number of common shares outstanding during the period. Diluted earnings (loss) per share adjusts basic earnings (loss) per share for the effects of warrants, stock options and other potentially dilutive financial instruments using the treasury stock method, only in the periods in which the effects are dilutive. Under the treasury stock method, the Company utilizes the average market price to determine the amount of cash that would be available to repurchase shares if the common shares vested. The net incremental share count issued represents the potential dilutive or anti-dilutive securities.
Refer to Note 12 – Earnings per Common Share for further information.
Treasury Stock
All amounts paid to repurchase common stock are recorded as Treasury Stock on the Consolidated Balance Sheets. When Treasury Stock is retired and the purchase price is greater than par, an excess of purchase price over par is allocated between additional paid-in capital and retained earnings (deficit). Share that are retired are determined on a FIFO basis.
Income Taxes
The Company's deferred income tax assets represent temporary differences between the financial statement carrying amount and the income tax basis of existing assets and liabilities that will result in deductible amounts in future years.
The Company periodically undertakes a review of its valuation allowance, and it evaluates all positive and negative factors that may affect whether it is more likely than not that the Company would realize its future tax benefits from its deferred tax balances. Pursuant to ASC Topic 740, Income Taxes ("ASC 740"), the Company follows a two-step approach to recognize and measure uncertain tax positions. The first step is to evaluate the tax position for recognition by determining if the available evidence indicates it is more likely than not that the position will be sustained on audit, including resolution of related appeals or litigation processes, if any. The second step is to measure the tax benefit as the largest amount which is more than 50% likely of being realized upon ultimate settlement. The Company considers many factors when evaluating and estimating its tax positions and tax benefits, which may require periodic adjustments and for which actual outcomes may differ from forecasted outcomes. The Company's policy is to include interest and penalties related to uncertain tax positions in income tax expense.
Impairments of Long-Lived Assets
Long-lived assets, including intangible assets subject to amortization, are reviewed for impairment whenever events or changes in circumstances indicate that the carrying amount of the asset may not be recoverable. Long-lived assets are grouped with other assets to the lowest level to which identifiable cash flows are largely independent of the cash flows of other groups of assets and liabilities. Management assesses the recoverability of the carrying cost of the assets based on a review of projected undiscounted cash flows. If an asset is held for sale, management reviews its estimated fair value less cost to sell. Fair value is determined using pertinent market information, including appraisals or broker's estimates, and/or projected discounted cash flows. In the event an impairment loss is identified, it is recognized based on the amount by which the carrying value exceeds the estimated fair value of the long-lived asset.
We performed an assessment to determine if there were any indicators of impairment quarterly, including as of December 31, 2023. We concluded that, while there were events and circumstances in the macro-environment that did impact us, we did not experience any entity-specific indicators of asset impairment and no triggering events occurred.
Financial Instruments
Cash and cash equivalents, trade accounts receivable, trade accounts payable and accrued expenses are carried at cost which approximates fair value due to the short-term maturity of these instruments.
Concentration Risks
In 2023, the Company's largest and second largest customers accounted for $
A significant portion of the Company's accounts receivable is concentrated with a relatively small number of customers. As of December 31, 2023, the Company's largest customers accounted for approximately $
At various times throughout the year ended and as of December 31, 2023 and 2022, some deposits held at financial institutions were in excess of federally insured limits. The Company has not experienced any losses related to these balances.
Segment Information
The Company reports segment information in accordance with ASC Topic 280, Segment Information ("ASC 280"). ASC 280 requires companies to report financial and descriptive information for each identified operating segment based on management's internal organizational decision-making structure. During 2023, our chief operating decision makers modified their view of our businesses and how they allocate resources. As such, the Company has identified 2 reportable business segments: Electronic Instruments and Merchant Investment.
Refer to Note 4 – Segment Information for further information.
Accounting Standards Adopted
Financial Instruments - Credit Losses
In June 2016, the FASB issued ASU 2016-13, "Financial Instruments-Credit Losses: Measurement of Credit Losses on Financial Instruments" ("ASU 2016-13"), which changes the impairment model for most financial assets. The standard replaces the incurred loss model with the current expected credit loss ("CECL") model to estimate credit losses for financial assets. The provisions of the standard are effective for the Company on January 1, 2023. The Company adopted the provisions of this standard on January 1, 2023, with minimal effect on its financial statements.
Future Application of Accounting Standards
Segment Reporting
In November 2023, the FASB issued ASU 2023-07, "Segment Reporting (Topic 280) - Improvements to Reportable Segment Disclosures" ("ASU 2023-07"), to address improvements to reportable segment disclosures. The standard primarily requires the following disclosure on an annual and interim basis: (i) significant segment expenses that are regularly provided to the chief operating decision maker ("CODM") and included within each reported measure of segment profit or loss; and (ii) other segment items and description of its composition. The standard also requires current annual disclosures about a reportable segment's profits or losses and assets to be disclosed in interim periods and the title and position of the CODM with an explanation of how the CODM uses the reported measure(s) of segment profits or losses in assessing segment performance. The provisions of the standard are effective for public companies for fiscal years beginning after December 15, 2023, and interim periods within fiscal years beginning after December 15, 2024, with early adoption permitted. The amendment is applied retrospectively to all prior periods presented. We are assessing the impact of this standard.
Income Taxes
In December 2023, the FASB issued ASU 2023-09, "Income Taxes (Topic 740) - Improvements to Income Tax Disclosures" ("ASU 2023-09"). The standard requires disaggregated information about a company's effective tax rate reconciliation as well as information on income taxes paid. The provisions of the standard are effective for public companies for fiscal years beginning after December 15, 2024, with early adoption permitted. This accounting standards update applies prospectively; however, retrospective application is permitted. We are assessing the impact of this standard.
Change in Accounting Principle
During 2023, our chief operating decision makers modified their view of our business and how they allocate resources and assess performance. The Company has now identified two reportable business segments: Electronic Instruments and Merchant Investment. In connection with the re-segmentation, we revised the presentation of Interest income, Realized gains (losses) on marketable securities, and Unrealized gains (losses) on marketable securities on the Consolidated Statements of Operations to be included in Revenues rather than be included in Other income (loss). Moreover, Interest income was reclassified to be presented within Net investment income (loss) and Realized gains (losses) on marketable securities and Unrealized gains (losses) on marketable securities were combined and reclassified to be presented within Net gains (losses). This change in applying current accounting guidance is preferable as it more accurately aligns the presentation of the Consolidated Financial Statements to the Company's operating segments by reporting all revenues and expenses associated with the Company's ordinary business activities, which include both PTF and the Merchant investment business, within Income from continuing operations. This change in accounting principle was applied retrospectively to all periods presented and did not have any impact on equity, net income, or basis or diluted earnings per share.
As noted in Note 1 - Basis of Presentation, on October 7, 2022, the Company completed the Separation of MPTI. In accordance with ASC Topic 205, Presentation of Financial Statements ("ASC 205"), Subtopic 20 - Discontinued Operations, the Company determined that MtronPTI’s business line met the conditions for a discontinued operation and is recorded as such in the Consolidated Financial Statements. The Company reports financial results for discontinued operations separately from continuing operations in order to distinguish the financial impact of the disposal transaction from ongoing operations.
The following table summarizes the significant line items included in (Loss) income from discontinued operations, net of tax in the Consolidated Statements of Operations for the periods indicated:
| Year Ended December 31, | ||||||||
| 2023 | 2022 | |||||||
| Revenues: | ||||||||
| Net sales | $ | $ | ||||||
| Total revenues | ||||||||
| Expenses: | ||||||||
| Manufacturing cost of sales | ||||||||
| Engineering, selling and administrative | ||||||||
| Total expenses | ||||||||
| Operating (loss) income | ( | ) | ||||||
| Interest expense, net | ( | ) | ||||||
| Other expense, net | ( | ) | ||||||
| (Loss) income from discontinued operations before income taxes | ( | ) | ||||||
| Income tax provision | ||||||||
| (Loss) income from discontinued operations, net of tax | $ | ( | ) | $ | ||||
The cash flows related to discontinued operations have not been segregated and are included in the Consolidated Statements of Cash Flows for the year ended December 31, 2022. The following table summarizes depreciation and other significant operating non-cash items, capital expenditures and financing activities of discontinued operations for the period through October 6, 2022:
| Period through October 6, 2022 | ||||
| Depreciation | $ | |||
| Amortization of finite-lived intangible assets | ||||
| Stock-based compensation expense | ||||
| Capital expenditures | ( | ) | ||
We report our results of operations consistent with the manner in which our chief operating decision makers review the business to assess performance and allocate resources.
Prior to 2023, we reported our results as a single reporting segment.
During 2023, our chief operating decision makers modified their view of our business and how they allocate resources and assess performance. Prior period presentation has been revised to conform to our new structure.
The Company has now identified two reportable business segments: Electronic Instruments and Merchant Investment. A brief description of each segment is below:
The Electronic Instruments segment includes all products manufactured and sold by PTF.
The Merchant Investment segment includes all activity produced by Lynch Capital International, LLC ("Lynch Capital").
The Company includes in Corporate the following corporate and business activities:
| • | corporate level assets and financial obligations such as cash and equivalents invested in highly liquid U.S. Treasury money market funds and other marketable securities; |
| • | other items not allocated to or directly related to the Company's operating segments, including items such as deferred tax balances; and |
| • | intercompany eliminations. |
Beginning in 2023, the Electronic Instruments and Merchant Investment segments are allocated overhead expenses based on total assets.
The following tables present LGL Group's continuing operations by segment:
| Year Ended December 31, 2023 | ||||||||||||||||
| Electronic Instruments | Merchant Investment | Corporate | Consolidated | |||||||||||||
| Revenues: | ||||||||||||||||
| Net sales | $ | $ | $ | $ | ||||||||||||
| Net investment income | ||||||||||||||||
| Net gains | ||||||||||||||||
| Total revenues | ||||||||||||||||
| Expenses: | ||||||||||||||||
| Manufacturing cost of sales | ||||||||||||||||
| Engineering, selling and administrative | ||||||||||||||||
| Total expenses | ||||||||||||||||
| Income (loss) from continuing operations before income taxes | ( | ) | ||||||||||||||
| Income tax expense (benefit) | ||||||||||||||||
| Income (loss) from continuing operations | ( | ) | ||||||||||||||
| Income (loss) from discontinued operations | ( | ) | ( | ) | ||||||||||||
| Net income (loss) | ( | ) | ||||||||||||||
| Less: Net income attributable to non-controlling interests | ||||||||||||||||
| Net income (loss) attributable to LGL Group common stockholders | $ | $ | $ | ( | ) | $ | ||||||||||
| Year Ended December 31, 2022 | ||||||||||||||||
| Electronic Instruments | Merchant Investment | Corporate | Consolidated | |||||||||||||
| Revenues: | ||||||||||||||||
| Net sales | $ | $ | $ | $ | ||||||||||||
| Net investment income | ||||||||||||||||
| Net losses | ( | ) | ( | ) | ||||||||||||
| Total revenues | ( | ) | ( | ) | ||||||||||||
| Expenses: | ||||||||||||||||
| Manufacturing cost of sales | ||||||||||||||||
| Engineering, selling and administrative | ||||||||||||||||
| Total expenses | ||||||||||||||||
| Income (loss) from continuing operations before income taxes | ( | ) | ( | ) | ||||||||||||
| Income tax benefit | ( | ) | ( | ) | ||||||||||||
| Income (loss) from continuing operations | ( | ) | ( | ) | ||||||||||||
| Income from discontinued operations | ||||||||||||||||
| Net income (loss) | ( | ) | ( | ) | ||||||||||||
| Less: Net income attributable to non-controlling interests | ||||||||||||||||
| Net income (loss) attributable to LGL Group common stockholders | $ | $ | $ | ( | ) | $ | ( | ) | ||||||||
The following table presents LGL Group's year-end identifiable assets and capital expenditures by segment:
| Year-End Identifiable Assets | Capital Expenditures | |||||||||||||||
| 2023 | 2022 | 2023 | 2022 | |||||||||||||
| Electronic Instruments | $ | $ | $ | $ | ||||||||||||
| Merchant Investment | ||||||||||||||||
| Corporate | ||||||||||||||||
| Total | $ | $ | $ | $ | ||||||||||||
Marketable Securities
Details of marketable securities held as of December 31, 2023 and 2022 are as follows:
| December 31, 2023 | ||||||||||||
| Cumulative | ||||||||||||
| Unrealized | ||||||||||||
| Fair Value | Basis | (Loss) Gain | ||||||||||
| Equity securities (a) | $ | $ | $ | ( | ) | |||||||
| Mutual funds (b) | ||||||||||||
| Total | $ | $ | $ | ( | ) | |||||||
| December 31, 2022 | ||||||||||||
| Cumulative | ||||||||||||
| Unrealized | ||||||||||||
| Fair Value | Basis | (Loss) Gain | ||||||||||
| Equity securities (a) | $ | $ | $ | ( | ) | |||||||
| Mutual funds (b) | ( | ) | ||||||||||
| Total | $ | $ | $ | ( | ) | |||||||
| (a) | As of December 31, 2022, included the Company's investment in IronNet, Inc., which had a fair value of $ |
| (b) | As of December 31, 2023, the Company did have any investments in mutual funds managed or advised by GAMCO Investors, Inc. or one of its subsidiaries included in Marketable securities. As of December 31, 2022, the Company had investments in |
Net Investment Income
Net investment income represents income primarily from the following sources:
| • | Income earned from investments in money market funds (recorded in Cash and cash equivalents) |
| • | Dividends received from marketable securities |
| • | Income from unconsolidated or equity method investments |
The following table presents the components of Net investment income:
| Year Ended December 31, | ||||||||
| 2023 | 2022 | |||||||
| Interest on cash and cash equivalents | $ | $ | ||||||
| Dividends on marketable securities | ||||||||
| Net investment income | $ | $ | ||||||
Net Gains (Losses)
Net gains and losses are determined by specific identification. The net realized gains and losses are generated primarily from the following sources:
| • | Realized and losses from investments in Marketable securities |
| • | Changes in the fair value of investments in Marketable securities |
| • | Changes in the fair value of derivatives |
The following table presents the components of Net gains (losses):
| Year Ended December 31, | ||||||||
| 2023 | 2022 | |||||||
| Marketable securities (a) | $ | $ | ( | ) | ||||
| Net gains (losses) | $ | $ | ( | ) | ||||
| (a) | During 2023, the Company sold its investments in mutual funds managed by GAMCO Investors, Inc. as well as |
Sales of Affiliated Mutual Funds
Fair value is defined as the price that would be received to sell an asset or paid to transfer a liability in an orderly transaction between market participants at the measurement date. Fair value guidance identifies three primary valuation techniques: the market approach, the income approach and the cost approach. The market approach uses prices and other relevant information generated by market transactions involving identical or comparable assets or liabilities. The income approach uses valuation techniques to convert future amounts, such as cash flows or earnings, to a single present amount. The measurement is based on the value indicated by current market expectations about those future amounts. The cost approach is based on the amount that currently would be required to replace the service capacity of an asset.
Fair Value Hierarchy
The fair value hierarchy prioritizes the inputs to valuation techniques used to measure fair value into three broad levels. The fair value hierarchy gives the highest priority to observable inputs such as quoted prices in active markets for identical assets or liabilities (Level 1) and the lowest priority to unobservable inputs (Level 3). The maximization of observable inputs and the minimization of the use of unobservable inputs are required.
Classification within the fair value hierarchy is based upon the objectivity of the inputs that are significant to the valuation of an asset or liability as of the measurement date. The three levels within the fair value hierarchy are characterized as follows:
Level 1 - Quoted prices (unadjusted) in active markets for identical assets or liabilities that the Company has the ability to access at the measurement date.
Level 2 - Inputs other than quoted prices included within Level 1 that are observable for the asset or liability, either directly or indirectly. Level 2 inputs include: quoted prices for similar assets or liabilities in active markets, quoted prices for identical or similar assets or liabilities in markets that are not active, inputs other than quoted prices that are observable for the asset or liability and inputs that are derived principally from or corroborated by observable market data by correlation or other means.
Level 3 - Unobservable inputs for the asset or liability for which there is little, if any, market activity for the asset or liability at the measurement date. Unobservable inputs reflect the Company's own assumptions about what market participants would use to price the asset or liability. These inputs may include internally developed pricing models, discounted cash flow methodologies as well as instruments for which the fair value determination requires significant management judgment.
Valuation Methodologies of Financial Instruments Measured at Fair Value
Cash and cash equivalents - Money market instruments are measured at cost, which approximates fair values because of the relatively short time to maturity.
Equity Securities - Whenever available, we obtained quoted priced in active markets for identical assets as of the balance sheet date to measure equity securities. Market price data is generally obtained from exchange or dealer markets.
Mutual funds - We estimate the fair value of mutual funds primarily using the net asset value ("NAV") published at the end of the last trading day of the quarter.
Assets and Liabilities Measured at Fair Value on a Recurring Basis
The following table presents information about assets measured at fair value on a recurring basis and indicates the level of the fair value measurement based on the observability of inputs used:
| December 31, 2023 | ||||||||||||||||
| Level 1 | Level 2 | Level 3 | Total | |||||||||||||
| Cash and cash equivalents (a) | $ | $ | $ | $ | ||||||||||||
| Marketable securities: | ||||||||||||||||
| Equity securities | ||||||||||||||||
| Mutual funds | ||||||||||||||||
| Total marketable securities | ||||||||||||||||
| Total | $ | $ | $ | $ | ||||||||||||
| December 31, 2022 | ||||||||||||||||
| Level 1 | Level 2 | Level 3 | Total | |||||||||||||
| Cash and cash equivalents (a) | $ | $ | $ | $ | ||||||||||||
| Marketable securities: | ||||||||||||||||
| Equity securities | ||||||||||||||||
| Mutual funds | ||||||||||||||||
| Total marketable securities | ||||||||||||||||
| Total | $ | $ | $ | $ | ||||||||||||
| (a) | As of December 31, 2023 and 2022, included investments in money market mutual funds managed by GAMCO Investors, Inc. |
There were
Fair Value Measurements on a Non-Recurring Basis
The Company has other assets that may be subject to measurement at fair value on a non-recurring basis including goodwill and intangible assets and other long-lived assets. The Company reviews goodwill annually and the carrying value of long-lived assets whenever events and circumstances indicate that the carrying amounts of the assets may not be recoverable. If it is determined that the assets are impaired, the carrying value would be reduced to an estimated recoverable value. The Company’s Common Stock Warrants (as defined below) were measured at fair value as disclosed in Note 11 - Stockholders’ Equity.
As of December 31, 2023 and 2022, the Company did write down any assets to fair value.
Fair Value Information about Financial Instruments Not Measured at Fair Value
As of December 31, 2023 and 2022, the Company did have any assets or liabilities classified as financial instruments that are not measured at fair value.
The Company holds variable interests in certain entities in the form of equity investments. The Company consolidates an entity under the VIE guidance when it is determined the Company is the primary beneficiary.
The Company has no right to the benefits from, nor does it bear the risks associated with VIEs beyond the Company's direct equity investments in these entities. If the Company were to liquidate, the assets held by VIEs would not be available to the general creditors of the Company as a result of the liquidation.
During June 2023, Lynch Capital, a wholly owned subsidiary, was appointed as sole managing member of LGL Systems Nevada Management Partners LLC ("LGL Nevada") and invested approximately $
Consolidated VIEs
The Company's only consolidated VIE is LGL Systems.
The following table summarizes the assets and liabilities of LGL Systems included in the Consolidated Balance Sheets:
| December 31, | ||||||||
| 2023 | 2022 | |||||||
| Assets: | ||||||||
| Current assets | ||||||||
| Cash and cash equivalents | $ | $ | — | |||||
| Accounts receivable | — | |||||||
| Total current assets | — | |||||||
| Total assets | $ | $ | — | |||||
| Total liabilities | $ | $ | — | |||||
As of December 31, 2023, the non-controlling interests in LGL Systems was $
Unconsolidated VIEs
The Company's only unconsolidated VIE is LGL Nevada.
We calculate our maximum exposure to loss to be (i) the amount invested in the debt or equity of the VIE and (ii) other commitments and guarantees to the VIE.
The following table presents the total assets of LGL Nevada as well as the Company's maximum exposure to loss:
| December 31, | ||||||||
| 2023 | 2022 | |||||||
| Total assets | $ | $ | ||||||
| Maximum exposure to loss | ||||||||
| On-balance sheet (a) | ||||||||
| Off-balance sheet (b) | ||||||||
| Total | $ | $ | ||||||
| (a) | As of December 31, 2023, our investment in LGL Nevada was recorded in Other assets on the Consolidated Balance Sheets. |
| (b) | This amount represents our remaining unfunded commitments to LGL Nevada. |
LGL Systems Nevada Management Partners LLC
LGL Nevada was formed in October 2019 for the purpose of performing key management and control decisions of LGL Systems. The remaining
In the normal course of business, the Company enters into various transactions with affiliated companies. Parties are considered to be related if one party has the ability to control or exercise significant influence over the other party in making financial or operating decisions.
The material agreements whereby the Company generated revenues and expenses with affiliated entities are discussed below:
Investment Activity with GAMCO Investors, Inc.
Certain balances held and invested in various mutual funds are managed or advised by GAMCO Investors, Inc. or one of its subsidiaries (collectively, "GAMCO" or the "Fund Manager"), which is related to the Company through certain of our shareholders. All investments, including those in related party mutual funds, are overseen by the independent Investment Committee of the Board of Directors (the "Investment Committee"). The Investment Committee meets regularly to review the alternatives and has determined the current investments most reflect the Company's objective of lower cost, market return and adherence to having a larger proportion of underlying investments directly in United States Treasuries. For the years ended December 31, 2023 and 2022, the Company paid the Fund Manager a fund management fee of approximately
As of December 31, 2023, the balance with the Fund Manager totaled $
For the year ended December 31, 2023, the Company earned income on its investments with the Fund Manager totaling $
Transactions with M-tron Industries, Inc.
Transitional Administrative and Management Services Agreement
LGL Group and MtronPTI entered into an Amended and Restated Transitional Administrative and Management Services Agreement ("MtronPTI TSA"), which sets out the terms for services to be provided between the two companies post-separation. The current terms result in a net monthly payment of $
Tax Indemnity and Sharing Agreement
LGL Group and MtronPTI entered into a Tax Indemnity and Sharing Agreement ("MtronPTI Tax Agreement"), which sets out the terms for which party would be responsible for taxes imposed on the Company if the Distribution, together with certain related transactions, were to fail to qualify as a tax-free transaction under Internal Revenue Code ("IRC") Sections 355 and 368(a)(1)(D) if such failure were the result of actions taken after the Distribution by the Company or MtronPTI.
For the years ended December 31, 2023 and 2022,
Other Transactions
Income tax provision (benefit) for the years ended December 31, 2023 and 2022 is as follows:
| Year Ended December 31, | ||||||||
| 2023 | 2022 | |||||||
| Current tax expense (benefit): | ||||||||
| Federal | $ | $ | ( | ) | ||||
| State and local | ||||||||
| Total current tax expense | ||||||||
| Deferred tax expense (benefit): | ||||||||
| Federal | ( | ) | ||||||
| State and local | ( | ) | ( | ) | ||||
| Total before change in valuation allowance | ( | ) | ||||||
| Change in valuation allowance | ||||||||
| Net deferred tax expense (benefit) | ( | ) | ||||||
| Total income tax expense (benefit) | $ | $ | ( | ) | ||||
Effective Tax Rate
A reconciliation of the provision (benefit) for income taxes and the amount computed by applying the statutory federal income tax rate to Income (loss) before income taxes is detailed below:
| Year Ended December 31, | ||||||||
| 2023 | 2022 | |||||||
| Income (loss) before income taxes | $ | $ | ( | ) | ||||
| Tax rate | % | % | ||||||
| Income tax expense (benefit) at federal statutory rate | ( | ) | ||||||
| Tax effect of: | ||||||||
| State taxes, net of federal benefit | ( | ) | ||||||
| Permanent differences | ||||||||
| Noncontrolling interests | ( | ) | ||||||
| Change in rate | ( | ) | ( | ) | ||||
| Change in uncertain tax positions | ||||||||
| Other | ( | ) | ||||||
| Income tax provision (benefit) | $ | $ | ( | ) | ||||
| Effective tax rate | % | % | ||||||
Deferred Tax Assets
Deferred income taxes for 2023 and 2022 were provided for the temporary differences between the financial reporting basis and the income tax basis of the Company's assets and liabilities. Tax effects of temporary differences and carryforwards as of December 31, 2023 and 2022 were as follows:
| December 31, | ||||||||
| 2023 | 2022 | |||||||
| Deferred tax assets: | ||||||||
| Inventory reserve | $ | $ | ||||||
| Allowance for doubtful accounts | ||||||||
| Lease liability | ||||||||
| Unrealized gains on marketable securities | ||||||||
| Stock-based compensation | ||||||||
| Depreciation and amortization | ||||||||
| Federal tax loss carryforwards | — | |||||||
| Other reserves and accruals | ||||||||
| Total deferred tax assets | $ | $ | ||||||
| Deferred tax liabilities: | ||||||||
| Right-of-use asset | ||||||||
| Total deferred tax liabilities | ||||||||
| Net deferred tax assets before valuation allowance | ||||||||
| Valuation allowance | — | — | ||||||
| Net deferred tax assets (liabilities) | $ | $ | ||||||
The evaluation of the recoverability of our deferred tax asset and the need for a valuation allowance requires us to weigh all positive and negative evidence to reach a conclusion that is more likely than not that all or some of the deferred tax asset will not be realized. The weight given to the evidence is commensurate with the extent to which it can be objectively verified. The more negative evidence that exists, the more positive evidence is necessary and the more difficult it is to support a conclusion that a valuation allowance is not needed. The ultimate realization of deferred tax assets is dependent upon the generation of future taxable income during the periods in which those temporary differences become realizable.
As of December 31, 2023 and 2022, the Company did record a valuation allowance against its deferred tax assets.
Uncertain Tax Benefits
Significant judgment is required in determining our provision for income taxes. In the ordinary course of business, there are many transactions for which the ultimate tax outcome is uncertain. We review our tax contingencies on a regular basis and make appropriate accruals as necessary.
As of December 31, 2023, our unrecognized tax benefits totaled $
| Year Ended December 31, | ||||||||
| 2023 | 2022 | |||||||
| Balance, beginning of year | $ | $ | ||||||
| Additions for tax positions of prior years | ( | ) | ||||||
| Additions based on tax positions related to the current year | ||||||||
| Balance, end of year | $ | $ | ||||||
The Company will recognize any interest and penalties related to unrecognized tax positions in income tax expense. Net adjustments to accruals for interest and penalties associated with uncertain tax positions were immaterial as of December 31, 2023. The total amount of unrecognized tax benefits that, if recognized, would affect the effective tax rate is $
Tax Regulatory Matters
The Company files a consolidated U.S. federal income tax return with our eligible subsidiaries. The Company also files income tax returns in various state and local jurisdictions including California, Florida, Massachusetts, New York, and Texas.
The statute of limitations for assessment by the Internal Revenue Service ("IRS") and state tax authorities is open for tax returns for years ended December 31, 2019, and although carryforward attributes that were generated prior to tax year 2019, including NOL carryforwards and tax credits, may still be adjusted upon examination by the IRS or state tax authorities, if they either have been or will be used in a future period. The Company is generally subject to examinations by foreign tax authorities from to the present.
On December 28, 2021, the Company’s stockholders approved the 2021 Incentive Plan (the "Plan"), including the authority to issue
| Year Ended December 31, | ||||||||
| 2023 | 2022 | |||||||
| Restricted stock awards | $ | $ | ||||||
| Stock options | ||||||||
| Total | $ | $ | ||||||
Restricted Stock Awards
A summary of the Company's restricted stock awards for the year ended December 31, 2023 follows:
| (in thousands, except share data) | Number of Shares | Weighted Average Grant Date Fair Value | Aggregate Grant Date Fair value | |||||||||
| Balance as of December 31, 2022 | $ | $ | ||||||||||
| Granted | ||||||||||||
| Vested | ( | ) | ( | ) | ||||||||
| Canceled | ||||||||||||
| Balance as of December 31, 2023 | $ | $ | ||||||||||
Shares Authorized
On December 28, 2021, the Company’s stockholders approved an amendment to the Company’s certificate of incorporation to increase the number of authorized shares of our common stock to
Common Stock Warrants
On November 16, 2020, the Company issued
Pursuant to the warrant agreement, the Distribution was a qualifying dilutive event that required an adjustment to the exercise price and the trigger price for potential acceleration of the exercise date. Effective October 18, 2022, the warrant exercise price was adjusted to $
Share Repurchase Program
On August 29, 2011, the Board authorized an expansion of its previously announced share repurchase program in accordance with applicable securities laws. This authorization increased the total number of shares authorized and available for repurchase under the Company's existing share repurchase program to
The following table presents a reconciliation of Net income (loss) and shares used in calculating basic and diluted net income (loss) per common share for the periods indicated:
| Year Ended December 31, | ||||||||
| (in thousands, except for share data) | 2023 | 2022 | ||||||
| Numerator for EPS: | ||||||||
| Income (loss) from continuing operations | $ | $ | ( | ) | ||||
| Less: Net income from continuing operations attributable to non-controlling interests | ||||||||
| Income (loss) attributable to LGL Group common stockholders from continuing operations | ( | ) | ||||||
| (Loss) income from discontinued operations, net of tax | ( | ) | ||||||
| Net income (loss) attributable to LGL Group common stockholders | $ | $ | ( | ) | ||||
| Denominator for EPS: | ||||||||
| Weighted average common shares outstanding - basic | ||||||||
| Dilutive effects (a): | ||||||||
| Stock options | ||||||||
| Weighted average common shares outstanding - diluted | ||||||||
| Income (loss) per common share attributable to LGL Group common stockholders: | ||||||||
| Basic: | ||||||||
| Income (loss) from continuing operations | $ | $ | ( | ) | ||||
| (Loss) income from discontinued operations | ( | ) | ||||||
| Net income (loss) attributable to LGL Group common stockholders | $ | $ | ( | ) | ||||
| Diluted: | ||||||||
| Income (loss) from continuing operations | $ | $ | ( | ) | ||||
| (Loss) income from discontinued operations | ( | ) | ||||||
| Net income (loss) attributable to LGL Group common stockholders | $ | $ | ( | ) | ||||
| (a) | For the year ended December 31, 2023, weighted average shares used for calculating earnings per share excludes warrants to purchase |
The Company leases certain manufacturing and office space and equipment. We determine if an arrangement is a lease at inception. A contract is or contains a lease if the contract conveys the right to control the use of identified property, plant or equipment (an identified asset) for a period of time in exchange for consideration. Amounts associated with operating leases, which are not short-term, are included in right-of-use lease assets. Current lease liabilities are included in other accrued expenses and long-term lease liabilities are included in other liabilities in our consolidated balance sheets. Right-of-use lease assets represent our right to use an underlying asset for the lease term and lease liabilities represent our obligation to make lease payments arising from the lease. Right-of-use lease assets and liabilities are recognized at the lease commencement date based on the estimated present value of lease payments over the lease term. We use our incremental borrowing rate at the lease commencement date in determining the present value of lease payments. Short-term leases, leases with an initial term of 12 months or less, are not recorded in the Consolidated Balance Sheets; we recognize lease expense for these short-term leases on a straight-line basis over the lease term.
The Company leases certain property and equipment under operating leases with terms that range from to years. Our lease agreements do not contain any material residual value guarantees or material restrictive covenants.
Total operating lease costs amounted to $
As of December 31, 2023 and 2022, our total lease obligation was $
Future minimum lease payment obligations under operating leases are as follows:
| 2024 | ||||
| 2025 | ||||
| Total lease payments | ||||
| Less: interest | ( | ) | ||
| Net lease payments | $ |
In the normal course of business, the Company and its subsidiaries may become defendants in certain product liability, patent infringement, worker claims and other litigation. The Company records a liability when it is probable that a loss has been incurred and the amount is reasonably estimable. The Company is not involved in any legal proceedings other than routine litigation arising in the normal course of business, none of which the Company believes will have a material adverse effect on the Company’s business, financial condition or results of operations.
15. Other Financial Statement Information
Inventories, Net
The Company reduces the value of its inventories to net realizable value when the net realizable value is believed to be less than the cost of the item.
The components of inventory as of December 31, 2023 and 2022 are summarized below:
| December 31, | ||||||||
| 2023 | 2022 | |||||||
| Raw materials | $ | $ | ||||||
| Work in process | ||||||||
| Total gross inventory | ||||||||
| Reserve for excess and obsolete inventory | ( | ) | ( | ) | ||||
| Inventories, net | $ | $ | ||||||
Property, Plant and Equipment, Net
The components of property, plant and equipment as of December 31, 2023 and 2022 are summarized below:
| December 31, | ||||||||
| 2023 | 2022 | |||||||
| Machinery and equipment | $ | $ | ||||||
| Gross property, plant and equipment | ||||||||
| Less: Accumulated depreciation | ( | ) | ( | ) | ||||
| Property, plant and equipment, net | $ | $ | ||||||
Intangible Assets, Net
The components of intangible assets as of December 31, 2023 and 2022 are summarized below:
| December 31, | ||||||||
| 2023 | 2022 | |||||||
| Intellectual property | $ | $ | ||||||
| Gross intangible assets | ||||||||
| Less: Accumulated amortization | ( | ) | ( | ) | ||||
| Intangible assets, net | $ | $ | ||||||
16. Domestic and Foreign Revenues
Significant foreign revenues from operations (10% or more of foreign sales) were as follows:
| Year Ended December 31, | ||||||||
| 2023 | 2022 | |||||||
| Spain | $ | $ | ||||||
| Canada | ||||||||
| France | ||||||||
| Romania | ||||||||
| All other foreign countries | ||||||||
| Total foreign revenues | $ | $ | ||||||
| Total domestic revenues | $ | $ | ||||||
The Company allocates its foreign revenue based on the customer’s ship-to location.
17. Quarterly Financial Data (Unaudited)
The following table provides summarized quarterly financial data for the year ended December 31, 2023:
| Three months ended | ||||||||||||||||
| (in thousands, except share data) | March 31, 2023 | June 30, 2023 | September 30, 2023 | December 31, 2023 | ||||||||||||
| Revenues: | ||||||||||||||||
| Net sales | $ | $ | $ | $ | ||||||||||||
| Net investment income | ||||||||||||||||
| Net gains (losses) (a) | ( | ) | ||||||||||||||
| Total revenues | ||||||||||||||||
| Expenses: | ||||||||||||||||
| Manufacturing cost of sales | ||||||||||||||||
| Engineering, selling and administrative | ||||||||||||||||
| Total expenses | ||||||||||||||||
| Income (loss) from continuing operations before income taxes | ( | ) | ||||||||||||||
| Income tax expense (benefit) | ( | ) | ||||||||||||||
| Net income (loss) from continuing operations | ( | ) | ||||||||||||||
| Loss from discontinued operations, net of tax | ( | ) | ||||||||||||||
| Net income (loss) | ( | ) | ||||||||||||||
| Less: Net income attributable to non-controlling interests | ||||||||||||||||
| Net income (loss) attributable to LGL Group common stockholders | $ | $ | ( | ) | $ | $ | ||||||||||
| Income (loss) per common share attributable to LGL Group common stockholders: | ||||||||||||||||
| Basic (b): | ||||||||||||||||
| Income (loss) from continuing operations | $ | $ | ( | ) | $ | $ | ||||||||||
| Loss from discontinued operations | ( | ) | ||||||||||||||
| Net income (loss) attributable to LGL Group common stockholders | $ | $ | ( | ) | $ | $ | ||||||||||
| Diluted (b): | ||||||||||||||||
| Income (loss) from continuing operations | $ | $ | ( | ) | $ | $ | ||||||||||
| Loss from discontinued operations | ( | ) | ||||||||||||||
| Net income (loss) attributable to LGL Group common stockholders | $ | $ | ( | ) | $ | $ | ||||||||||
| Weighted average shares outstanding: | ||||||||||||||||
| Basic | ||||||||||||||||
| Diluted | ||||||||||||||||
| (a) | During Q1 and Q2 2023, the net gains primarily relate to the sale of our investments in mutual funds managed by GAMCO Investors, Inc. |
| (b) | Basic and diluted earnings per share are calculated using actual, unrounded amounts. Therefore, (i) the components of earnings per share may not sum to its corresponding total or (ii) the quarterly earnings per share may not sum to the earnings per share on the Consolidated Statements of Operations. |
The following table provides summarized quarterly financial data for the year ended December 31, 2022:
| Three months ended | ||||||||||||||||
| (in thousands, except share data) | March 31, 2022 | June 30, 2022 | September 30, 2022 | December 31, 2022 | ||||||||||||
| Revenues: | ||||||||||||||||
| Net sales | $ | $ | $ | $ | ||||||||||||
| Net investment (loss) income | ( | ) | ||||||||||||||
| Net gains (losses) (a) | ( | ) | ( | ) | ( | ) | ||||||||||
| Total revenues | ( | ) | ( | ) | ||||||||||||
| Expenses: | ||||||||||||||||
| Manufacturing cost of sales | ||||||||||||||||
| Engineering, selling and administrative | ||||||||||||||||
| Total expenses | ||||||||||||||||
| Loss from continuing operations before income taxes | ( | ) | ( | ) | ( | ) | ( | ) | ||||||||
| Income tax benefit | ( | ) | ( | ) | ( | ) | ( | ) | ||||||||
| (Loss) income from continuing operations | ( | ) | ( | ) | ( | ) | ||||||||||
| Income from discontinued operations, net of tax | ||||||||||||||||
| Net income (loss) | ( | ) | ( | ) | ||||||||||||
| Less: Net income attributable to non-controlling interests | ||||||||||||||||
| Net income (loss) attributable to LGL Group common stockholders | $ | $ | ( | ) | $ | ( | ) | $ | ||||||||
| Income (loss) per common share attributable to LGL Group common shareholders: | ||||||||||||||||
| Basic (b): | ||||||||||||||||
| (Loss) income from continuing operations | $ | ( | ) | $ | ( | ) | $ | ( | ) | $ | ||||||
| Income from discontinued operations | ||||||||||||||||
| Net income (loss) attributable to LGL Group common stockholders | $ | $ | ( | ) | $ | ( | ) | $ | ||||||||
| Diluted (b): | ||||||||||||||||
| (Loss) income from continuing operations | $ | ( | ) | $ | ( | ) | $ | ( | ) | $ | ||||||
| Income from discontinued operations | ||||||||||||||||
| Net income (loss) attributable to LGL Group common stockholders | $ | $ | ( | ) | $ | ( | ) | $ | ||||||||
| Weighted average shares outstanding: | ||||||||||||||||
| Basic | ||||||||||||||||
| Diluted | ||||||||||||||||
| (a) | During Q2 and Q3, the net losses primarily related to our equity position in IronNet, Inc. |
| (b) | Basic and diluted earnings per share are calculated using actual, unrounded amounts. Therefore, (i) the components of earnings per share may not sum to its corresponding total or (ii) the quarterly earnings per share may not sum to the earnings per share on the Consolidated Statements of Operations. |
The Company has evaluated events and transactions that occurred after the balance sheet date through the date that the consolidated financial statements were issued. Based upon this review, the Company did not identify any subsequent events that would have required adjustment or disclosure in the consolidated financial statements.