UNITED STATES
SECURITIES AND EXCHANGE COMMISSION
Washington, D.C. 20549
____________________________________
FORM 20-F
(Mark One)
| REGISTRATION STATEMENT PURSUANT TO SECTION 12(b) OR (g) OF THE SECURITIES EXCHANGE ACT OF 1934 | |||||
OR
| ANNUAL REPORT PURSUANT TO SECTION 13 OR 15(d) OF THE SECURITIES EXCHANGE ACT OF 1934 | |||||
For the fiscal year ended June 30, 2023
OR
| TRANSITION REPORT PURSUANT TO SECTION 13 OR 15(d) OF THE SECURITIES EXCHANGE ACT OF 1934 | |||||
OR
| SHELL COMPANY REPORT PURSUANT TO SECTION 13 OR 15(d) OF THE SECURITIES EXCHANGE ACT OF 1934 | |||||
Date of event requiring this shell company report:
Commission File Number: 001-41635
(Exact name of Registrant as specified in its charter)
Not Applicable | |||||
(Translation of Registrant’s name into English) | (Jurisdiction of incorporation or organization) | ||||
(Address of principal executive offices)
Tel: +55 (11) 4280-0709
(Name, Telephone, E-mail and/or Facsimile number and Address of Company Contact Person)
Securities registered or to be registered pursuant to Section 12(b) of the Act:
| Title of each class | Trading Symbols | Name of each exchange on which registered | ||||||||||||
Securities registered or to be registered pursuant to Section 12(g) of the Act: None
Securities for which there is a reporting obligation pursuant to Section 15(d) of the Act: None
Indicate the number of outstanding shares of each of the issuer’s classes of capital or common stock as of the close of the period covered by the annual report: As of June 30, 2023, the issuer had 116,608,329 Class A ordinary shares and 10,083,592 warrants to purchase Class A ordinary shares outstanding.
Indicate by check mark if the registrant is a well-known seasoned issuer, as defined in Rule 405 of the Securities Act. Yes o No x
If this report is an annual or transition report, indicate by check mark if the registrant is not required to file reports pursuant to Section 13 or 15(d) of the Securities Exchange Act of 1934. Yes ¨ No x
Indicate by check mark whether the registrant (1) has filed all reports required to be filed by Section 13 or 15(d) of the Securities Exchange Act of 1934 during the preceding 12 months (or for such shorter period that the registrant was required to file such reports), and (2) has been subject to such filing requirements for the past 90 days. Yes x No ¨
Indicate by check mark whether the registrant has submitted electronically every Interactive Data File required to be submitted pursuant to Rule 405 of Regulation S-T (§232.405 of this chapter) during the preceding 12 months (or for such shorter period that the registrant was required to submit and post such files). Yes x No ¨
Indicate by check mark whether the registrant is a large accelerated filer, an accelerated filer, a non-accelerated filer, or an emerging growth company. See the definitions of “large accelerated filer,” “accelerated filer,” and “emerging growth company” in Rule 12b-2 of the Exchange Act.
| Large accelerated filer | ¨ | Accelerated filer | ¨ | |||||||||||||||||
x | Emerging growth company | |||||||||||||||||||
If an emerging growth company that prepares its financial statements in accordance with U.S. GAAP, indicate by check mark if the registrant has elected not to use the extended transition period for complying with any new or revised financial accounting standards† provided pursuant to Section 13(a) of the Exchange Act. ¨
† The term “new or revised financial accounting standard” refers to any update issued by the Financial Accounting Standards Board to its Accounting Standards Codification after April 5, 2012.
Indicate by check mark whether the registrant has filed a report on and attestation to its management’s assessment of the effectiveness of its internal control over financial reporting under Section 404(b) of the Sarbanes-Oxley Act (15 U.S.C. 7262(b)) by the registered public accounting firm that prepared or issued its audit report. ¨
If securities are registered pursuant to Section 12(b) of the Act, indicate by check mark whether the financial statements of the registrant included in the filing reflect the correction of an error to previously issued financial statements. ¨
Indicate by check mark whether any of those error corrections are restatements that required a recovery analysis of incentive-based compensation received by any of the registrant’s executive officers during the relevant recovery period pursuant to §240.10D-1(b). ¨
Indicate by check mark which basis of accounting the registrant has used to prepare the financial statements included in this filing:
¨ U.S. GAAP
x International Financial Reporting Standards as issued by the International Accounting Standards Board
¨ Other
If “Other” has been checked in response to the previous question, indicate by check mark which financial statement item the registrant has elected to follow. Item 17 ¨ Item 18 ¨
If this is an annual report, indicate by check mark whether the registrant is a shell company (as defined in Rule 12b-2 of the Exchange Act).
Yes ¨ No x
TABLE OF CONTENTS
____________________________________
Page | |||||
i
FREQUENTLY USED TERMS
Throughout this annual report, unless otherwise stated or unless the context otherwise requires, the terms “New Lavoro” and “the Registrant” refer to Lavoro Limited, a Cayman Islands exempted company, and the terms “we,” “us,” “our,” “the Company,” “our company,” “Lavoro” or “Lavoro Group” refer to: (i) the combined group of Lavoro Agro Holding S.A., or Lavoro Brazil, and its subsidiaries, Crop Care Holding S.A., or Crop Care, and its subsidiaries, and Lavoro Colombia S.A.S., or Lavoro Colombia, and its subsidiaries, prior to the contribution of the shares of Lavoro Brazil, Crop Care and Lavoro Colombia to an entity controlled by Lavoro Agro Limited, an exempted company incorporated with limited liability in the Cayman Islands, or Lavoro Agro Limited, which was completed in mid-2022; (ii) Lavoro Agro Limited, together with its consolidated subsidiaries, following the contribution of the shares of Lavoro Brazil, Crop Care and Lavoro Colombia to an entity controlled by Lavoro Agro Limited; and (iii) New Lavoro, together with its consolidated subsidiaries, following the completion of our corporate reorganization in January 2023 and the consummation of the Business Combination (as defined below). Unless the context requires otherwise, all references to “our financial statements” mean the financial statements of the Registrant included herein.
In addition, in this document, unless otherwise stated or unless the context otherwise requires:
“A&R Registration Rights Agreement” means the Amended and Restated Registration Rights Agreement, entered into by New Lavoro and the Sponsor on the Closing Date, pursuant to which that certain Registration Rights Agreement, dated as of August 13, 2021, was amended and restated in its entirety as of the Closing Date.
“bag” means a unit of measurement equal to: (i) 60 kilograms or 2.36 bushels of grains, i.e., the products that our farmer clients produce; (ii) 40 kilograms of seeds, i.e., an input that we sell.
“Brazil” means the Federative Republic of Brazil.
“Brazilian government” means the federal government of Brazil.
“Business Combination” means the Mergers and the other transactions contemplated by the Business Combination Agreement, collectively, including the PIPE Investment.
“Business Combination Agreement” means the Business Combination Agreement, dated as of September 14, 2022, as may be amended, supplemented, or otherwise modified from time to time, by and among TPB SPAC, New Lavoro, First Merger Sub, Second Merger Sub, Third Merger Sub and Lavoro Agro Limited.
“CDI Rate” means the Brazilian interbank deposit (certificado de depósito interbancário) rate, which is an average of interbank overnight deposit interest rates in Brazil.
“Central Bank” means the Brazilian Central Bank (Banco Central do Brasil).
“Closing” means the closing of the transactions contemplated by the Business Combination Agreement.
“Closing Date” means February 28, 2023, the date of the Closing.
“Code” means the Internal Revenue Code of 1986, as amended.
“Companies Act” means the Companies Act (As Revised) of the Cayman Islands.
“Conab” refers to the Brazilian National Food Supply Company (Companhia Nacional de Abastecimento).
“Continental” refers to Continental Stock Transfer & Trust Company, the Company’s transfer agent.
“COPOM” means the Brazilian Monetary Policy Committee (Comitê de Política Monetária do Banco Central).
“COVID-19” or the “COVID-19 pandemic” means SARS-CoV-2 or COVID-19, and any evolutions or mutations thereof or other epidemics, pandemics or disease outbreaks.
ii
“CPI” means the Colombia Consumer Price Index (Índice de Precios al Consumidor).
“DTF Rate” means the Colombian investment rate (certificado de depósito a término), which is an average of interbank and financial corporation loan rates.
“Exchange Act” means the Securities Exchange Act of 1934, as amended.
“FGV” means the Getulio Vargas Foundation (Fundação Getulio Vargas).
“First Effective Time” means the time at which the First Merger became effective.
“First Merger” means the merger of First Merger Sub with and into TPB SPAC pursuant to the Business Combination Agreement, with TPB SPAC surviving as a directly wholly owned subsidiary of New Lavoro.
“First Merger Sub” means Lavoro Merger Sub I Limited, a Cayman Islands exempted company and a direct, wholly owned subsidiary of New Lavoro prior to the consummation of the Business Combination.
“Forward Purchase Agreements” means the separate forward share purchase agreements entered into on February 21, 2023 by TPB SPAC and certain equity holders of TPB SPAC, pursuant to which TPB SPAC (or Second Merger Sub, as successor-in-interest to TPB SPAC following the Closing) agreed to purchase in the aggregate, on the date that is 24 months after the Closing Date, i.e. on February 28, 2025, 2,830,750 Ordinary Shares then held by the referred to equity holders of TPB SPAC. See “Item 7. Major Shareholders and Related Party Transactions—B. Related Party Transactions—Transactions Related to the Business Combination—Forward Purchase Agreements.”
Our “governing documents” refers to our memorandum and articles of association, as amended and restated from time to time.
A “hectare” is a unit of measurement equal to 2.471 acres.
“IASB” means the International Accounting Standards Board.
“IBGE” means the Brazilian Institute for Geography and Statistics (Instituto Brasileiro de Geografia e Estatística).
“IBR Rate” means the Colombia banking reference rate (Indicador Bancario de Referencia).
“ICMS” means the Brazilian tax on the circulation of goods and services (imposto sobre a circulação de mercadorias e serviços).
“IFRS” means International Financial Reporting Standards, as issued by the International Accounting Standards Board, or IASB.
“IGP-M” means the General Market Price Index (Índice Geral de Preços – Mercado), which is published by FGV.
“Investment Company Act” means the Investment Company Act of 1940, as amended.
“Investment Funds” means a group of Cayman Islands, Delaware and Ontario entities, which are the record holders of certain of our Ordinary Shares. The Investment Funds are ultimately controlled by Patria, which may be deemed to beneficially own the Investment Funds. See “Item 7. Major Shareholders and Related Party Transactions—A. Major Shareholders.”
“IPCA” means the National Consumer Price Index (Índice Nacional de Preços ao Consumidor Amplo), which is published by the IBGE.
“JOBS Act” means the Jumpstart Our Business Startups Act of 2012, as amended.
iii
“Lavoro Agro Limited” means Lavoro Agro Limited, an exempted company incorporated with limited liability in the Cayman Islands.
“Lavoro Agro Limited Shares” means the common shares, par value US$1.00 per share, of Lavoro Agro Limited.
“Lavoro Original Shareholders” means the Investment Funds and Patria Finance, collectively.
“Lavoro Share Plan” means the Lavoro Agro Holding S.A. Long-Term Incentive Policy (Política de Incentivo de Longo Prazo da Lavoro Agro Holding S.A.).
“management” or our “management team” means the officers of the Company.
“Mergers” means the First Merger, Second Merger and Third Merger, collectively.
“Minimum viable product,” or “MVP,” is a development technique in which a version of a new product is developed with sufficient features to be usable by early customers who can then provide feedback for future product development. The concept will be used to validate a market need for the product and for incremental developments.
“Nasdaq” means The Nasdaq Stock Market LLC.
“New Lavoro” means Lavoro Limited, a Cayman Islands exempted company with limited liability.
“Ordinary Shares” means the Class A ordinary shares, par value US$0.001 per share, of the Company.
“Patria” means Patria Investments Limited, a Cayman Islands exempted company with limited liability, and its affiliates (including Patria Finance).
“Patria Finance” means Patria Finance Limited, a Cayman Islands exempted company with limited liability.
“PCAOB” means the Public Company Accounting Oversight Board.
“Private Warrants” means the 4,071,507 warrants issued by the Company, each exercisable at US$11.50 per one Ordinary Share, all of which are held by the Sponsor.
“Public Warrants” means the 6,012,085 warrants issued by the Company, each exercisable at US$11.50 per one Ordinary Share, and which are traded on Nasdaq under the symbol “LVROW.”
“RTVs” refer to Lavoro’s technical sales representatives (Representante Técnico de Vendas), who are linked to its retail stores, and who develop commercial relationships with farmers.
“SEC” means the U.S. Securities and Exchange Commission.
“SELIC rate” means the Brazilian interest rate established by the Brazilian Special Clearance and Custody System (Sistema Especial de Liquidação e Custódia).
“Second Effective Time” means the time at which the Second Merger became effective.
“Second Merger” means the merger of TPB SPAC with and into Second Merger Sub pursuant to the Business Combination Agreement, with Second Merger Sub surviving as our directly wholly owned subsidiary.
“Second Merger Sub” means Lavoro Merger Sub II Limited, a Cayman Islands exempted company and our direct, wholly owned subsidiary prior to the consummation of the Business Combination.
“Securities Act” means the Securities Act of 1933, as amended.
“SPAC Class A Ordinary Shares” means the Class A ordinary shares, par value US$0.0001 per share, of TPB SPAC.
iv
“SPAC Class B Ordinary Shares” means the Class B ordinary shares, par value US$0.0001 per share, of TPB SPAC.
“SPAC Mergers” means the First Merger and Second Merger.
“SPAC Ordinary Shares” means the SPAC Class A Ordinary Shares and SPAC Class B Ordinary Shares, collectively.
“SPAC Private Warrants” means the 4,071,507 private placement warrants issued by TPB SPAC and held by the Sponsor to acquire SPAC Class A Ordinary Shares that were outstanding immediately prior to the First Effective Time.
“SPAC Public Warrants” means the 6,012,085 public warrants issued by TPB SPAC to acquire SPAC Class A Ordinary Shares that were outstanding immediately prior to the First Effective Time.
“Sponsor” means TPB Acquisition Sponsor I, LLC, a Delaware limited liability company.
“Sponsor Letter Agreement” means that certain Sponsor Letter Agreement, dated August 13, 2021, by and among Sponsor, TPB SPAC and TPB SPAC’s directors and officers (as amended on September 14, 2022 and February 28, 2023 by and among the Sponsor, TPB SPAC, TPB SPAC’s directors and officers, Lavoro Agro Limited and New Lavoro, and as further amended on March 22, 2023 by and among the Sponsor, Second Merger Sub (as successor to TPB SPAC), The Production Board, Lavoro Agro Limited and New Lavoro).
“The Production Board” means The Production Board, LLC, a Delaware limited liability company.
“TIB Rate” means the Colombian interbank deposit rate (Tasa Interbancaria).
“tonne” is a unit of measurement equal to 1,000 kilograms, 1.10 short tons or 0.98 long tons.
“TPB PIPE Investment” means the entry by us and TPB SPAC into a subscription agreement with The Production Board, pursuant to which The Production Board agreed to subscribe for and purchase, and TPB SPAC agreed to issue an aggregate of 10,000,000 SPAC Class A Ordinary Shares at a price of US$10.00 per share.
“TPB SPAC” means TPB Acquisition Corporation I, a Cayman Islands exempted company with limited liability.
“Third Effective Time” means the time at which the Third Merger became effective.
“Third Merger” means the merger of Third Merger Sub with and into Lavoro Agro Limited pursuant to the Business Combination Agreement, with Lavoro Agro Limited surviving as a directly wholly owned subsidiary of New Lavoro.
“Third Merger Sub” means Lavoro Merger Sub III Limited, a Cayman Islands exempted company and a direct, wholly owned subsidiary of New Lavoro prior to the consummation of the Business Combination.
“Trust Account” means that certain trust account that held certain funds maintained and invested pursuant to that certain Investment Management Trust Account Agreement dated August 13, 2021, by and between TPB SPAC and Continental.
“U.S. GAAP” means United States generally accepted accounting principles.
“Warrant Agreement” means the warrant agreement covering the Warrants, which is filed as an exhibit hereto and is incorporated by reference herein.
“Warrants” means the 10,083,592 warrants issued by us, consisting of 6,012,085 Public Warrants and 4,071,507 Private Warrants.
v
PRESENTATION OF FINANCIAL AND OTHER INFORMATION
Overview
New Lavoro was incorporated to become the holding entity of the Lavoro Group to effect the Business Combination. Prior to the consummation of the Business Combination on February 28, 2023, New Lavoro had only nominal assets and liabilities and no material contingent liabilities or commitments and did not conduct any material activities other than those incident to its formation and certain matters related to the Business Combination, such as the making of certain required securities law filings. New Lavoro continues not to have any assets other than its direct equity interests in its wholly-owned subsidiaries, Lavoro Merger Sub II Limited and Lavoro Agro Limited.
The Business Combination was accounted for as a capital reorganization. Under this method of accounting, TPB SPAC was treated as the “acquired” company for financial reporting purposes, and New Lavoro was the accounting “acquirer.” The net assets of TPB SPAC were stated at historical cost, with no goodwill or other intangible assets recorded. The Business Combination, which is not within the scope of IFRS 3—Business Combinations, or IFRS 3, since TPB SPAC does not meet the definition of a “business” pursuant to IFRS 3, is accounted for within the scope of IFRS 2—Share-Based Payments, or IFRS 2. Any excess of fair value of New Lavoro’s Ordinary Shares issued over the fair value of TPB SPAC identifiable net assets acquired represents compensation for the service of a stock exchange listing for its shares and is expensed as incurred.
The corporate reorganizations undertaken in connection with the Business Combination were accounted for using the predecessor method of accounting, and, as a result, our consolidated financial statements are presented “as if” the historical combined consolidated operations of Lavoro Brazil, Crop Care and Lavoro Colombia were the predecessor operations of New Lavoro. Under the predecessor method, the historical operations of the Lavoro Group prior to our corporate reorganizations are deemed to be those of New Lavoro. Thus, our consolidated financial statements reflect:
•the historical operating results and financial position of Lavoro Brazil, Crop Care and Lavoro Colombia on a combined basis prior to our corporate reorganizations
•the assets and liabilities of Lavoro Brazil, Crop Care and Lavoro Colombia at their historical cost; and
•New Lavoro’s earnings per share for all years presented. The number of Ordinary Shares issued by New Lavoro, as a result of our corporate reorganizations, is reflected retroactively, for purposes of calculating earnings per share in all prior years presented.
Our Financial Statements
We maintain our books and records in Brazilian reais, the presentation currency of our financial statements and also the functional currency of the Registrant. The functional currency for the majority of our subsidiaries is also the Brazilian real, except that companies located in Colombia have the Colombian peso (“COP”) as their reporting currency. The financial statements of our Colombian subsidiaries are translated into Brazilian reais as follows:
i.assets and liabilities for each statement of financial position presented are translated at the closing exchange rate at the date of that statement of financial position;
ii.income and expenses for each statement of profit or loss are translated at the respective average monthly exchange rate; and
iii.exchange rate differences arising from this translation are recognized in other comprehensive income.
Our financial statements presented in this annual report are the consolidated financial statements of New Lavoro. Our audited consolidated financial statements were prepared in accordance with International Financial Reporting Standards, or IFRS, as issued by the International Accounting Standards Board, or IASB. IFRS differs from the United States generally accepted accounting principles, or U.S. GAAP, in certain material respects and thus may not be comparable to financial information presented by U.S. companies.
1
Our audited consolidated financial statements as of June 30, 2023 and 2022 and for the years ended June 30, 2023, 2022 and 2021, together with the notes thereto, included elsewhere in this annual report, are referred to herein as our audited consolidated financial statements or simply as our financial statements. Our financial information should be read in conjunction with “Item 5. Operating and Financial Review and Prospects,” and our audited consolidated financial statements, including the notes thereto, included elsewhere in this annual report.
Our fiscal year ends on June 30. References in this annual report to a fiscal year, such as “fiscal year 2023,” or “FY23” relate to our fiscal year, the year ended June 30, 2023.
Reportable Segments
We have three reportable segments: the Brazil Cluster, which comprises companies dedicated to the distribution of agricultural inputs such as crop protection, seeds, fertilizers and specialty products, in Brazil; the LATAM Cluster, which includes companies dedicated to the distribution of agricultural inputs outside Brazil (primarily in Colombia); and the Crop Care Cluster, which includes companies that produce and import our own portfolio of private label products including off-patent crop protection and specialty products (e.g., biologicals and specialty fertilizers). The table below sets forth the entities that comprised each of our three reportable segments as of June 30, 2023:
| Brazil Cluster | ||
Facirolli Comércio e Representações S.A. | ||
Cultivar Agrícola – Comércio, Importação e Exportação S.A. | ||
Produtec Comércio e Representações S.A. | ||
Produtiva Agronegócios Comércio e Representação Ltda. | ||
Qualiciclo Agrícola S.A. | ||
Lavoro Agrocomercial S.A. | ||
Agrocontato Comércio e Representações de Produtos Agropecuários S.A. | ||
PCO – Comércio, Importação, Exportação e Agropecuária Ltda. | ||
Agrovenci – Comércio, Importação, Exportação e Agropecuária Ltda. | ||
Agrovenci Distribuidora de Insumos Agrícolas Ltda. | ||
Central Agricola Rural Distribuidora de Defensivos Ltda. | ||
Denorpi Distribuidora de Insumos Agrícolas Ltda. | ||
Deragro Distribuidora de Insumos Agrícolas Ltda. | ||
Desempar Participações Ltda. | ||
Desempar Tecnologia Ltda. | ||
Futuragro Distribuidora de Insumos Agrícolas Ltda. | ||
Distribuidora Pitangueiras de Produtos Agropecuários S.A. | ||
Plenafértil Distribuidora de Insumos Agrícolas Ltda. | ||
Realce Distribuidora de Insumos Agrícolas Ltda. | ||
Nova Geração Comércio de Produtos Agrícolas Ltda. | ||
Lavoro Agro Holding S.A. | ||
Floema Soluções Nutricionais de Cultivos Ltda. | ||
Sollo Sul Insumos Agrícolas Ltda. | ||
Dissul Insumos Agrícolas Ltda. | ||
Casa Trevo Comercial Agrícola Ltda. | ||
Casa Trevo Participações S.A. | ||
CATR Comercial Agrícola Ltda. | ||
Lavoro Agro Fundo de Investimento nas Cadeias Produtivas Agroindustriais (FIAGRO) - Direitos Creditórios | ||
2
| LATAM Cluster | ||
Agrointegral Andina S.A.S. | ||
Agroquímicos para la Agricultura Colombiana S.A.S. | ||
Agricultura y Servicios S.A.S. | ||
Cenagral S.A.S. | ||
Grupo Cenagro S.A.S. | ||
Servigral Praderas S.A.S. | ||
Lavoro Colombia S.A.S. | ||
Grupo Gral S.A.S. | ||
Provecampo S.A.S. | ||
Crop Care Colombia S.A.S. | ||
| Crop Care Cluster | ||
Agrobiológica Sustentabilidade S.A. | ||
Agrobiológica Soluções Naturais Ltda. | ||
Perterra Insumos Agropecuários S.A. | ||
Perterra Trading S.A. | ||
Union Agro S.A. | ||
Crop Care Holding S.A. (Brasil) | ||
Araci Administradora de Bens S.A. | ||
Cromo Indústria Química Ltda. | ||
Acquisitions
As of the date of this annual report, we have completed the acquisition of the 26 following groups or companies since our inception: (1) Grupo Gral (comprising Agrointegral Andina S.A.S., Agroquímicos para la Agricultura Colombiana S.A.S., and Servigral Praderas S.A.S.); (2) Lavoro Agrocomercial; (3) Distribuidora Pitangueiras de Produtos Agropecuários S.A., or Pitangueiras; (4) Impacto Insumos Agrícola Ltda. (later merged into Lavoro Agrocomercial); (5) Agrovenci – Comércio, Importação, Exportação e Agropecuária Ltda., or Agrovenci; (6) Agrocontato Comércio e Representações de Produtos Agropecuários S.A. and PCO – Comércio, Importação, Exportação e Agropecuária Ltda., or Agrovale (which, together with Agrovenci, is referred to as the AGP Group); (7) Agricultura y Servicios S.A.S., or AgSe, and Fertilizantes Líquidos y Servicios S.A.S., or Fertilyser (which, together, are referred to as the AgSe Group); (8) Produtec Comércio e Representações S.A., or Produtec; (9) Agrobiológica Soluções; (10) Central Agricola Rural Distribuidora de Defensivos Ltda., or Central Agrícola; (11) Integra (as defined below); (12) Qualicitrus (as defined below); (13) América (as defined below); (14) Desempar (as defined below); (15) Cultivar (as defined below); (16) Cenagro/Cenagral (as defined below); (17) Produttiva (as defined below); (18) Union Agro (as defined below); (19) AgroZap (as defined below); (20) Nova Geração (as defined below); (21) Floema (as defined below); (22) Provecampo (as defined below); (23) Casa Trevo and CATR (as defined below); (24) Sollo Sul and Dissul (both as defined below), (25) Cromo Química (as defined below), and (26) Referência Agro (as defined below).
The following is a description of acquisitions completed in the fiscal years ended June 30, 2023, 2022 and 2021, and thereafter. For more information, see notes 21 and 33 to our audited consolidated financial statements included elsewhere in this annual report.
Acquisitions Completed in the Fiscal Year Ended June 30, 2021
On June 18, 2020, we entered into an agreement to acquire 100.0% of Integra Soluções Agrícolas Ltda., or Integra, a company specializing in the sale of crop protection products, fertilizers, seeds, and other agricultural inputs. Part of the payment was made through the exchange of shares of Integra. The transaction closed on September 1, 2020.
3
On July 17, 2020, we entered into an agreement to acquire 70.8% of Qualiciclo Agrícola S.A., or Qualicitrus, a company specializing in the sale of crop protection products, fertilizers, seeds, specialties and machinery, and related services such as soil testing and fertility maps. The transaction closed on November 17, 2020.
On July 21, 2020, we entered into an agreement to acquire 100.0% of Agrobiológica Soluções, a company specializing in the development, production and sale of biological agricultural products. Part of the payment was made through a share exchange with Agrobiológica Sustentabilidade. The transaction closed on August 28, 2020.
On September 11, 2020, we entered into an agreement to acquire 100.0% of América Insumos Agrícolas Ltda., or América, a company specializing in the sale of agricultural inputs, including crop protection products and fertilizers. The transaction closed on December 30, 2020.
On November 12, 2020, we entered into an agreement to acquire 60.7% of Cultivar Agrícola – Comércio, Importação e Exportação S.A., or Cultivar, a company specializing in the sale of agricultural inputs, including crop protection products and fertilizers. The contract provides for the payment of an installment in the event of the successful collection of receivables past due at the acquisition date in the amount of R$5.8 million. The transaction closed on April 1, 2021.
On December 4, 2020, we entered into an agreement to acquire 100.0% of Desempar Participações Ltda. (including its subsidiaries Denorpi Distribuidora de Insumos Agrícolas Ltda., Deragro Distribuidora de Insumos Agrícolas Ltda., Plenafértil Distribuidora de Insumos Agrícolas Ltda., Futuragro Distribuidora de Insumos Agrícolas Ltda., Realce Distribuidora de Insumos Agrícolas Ltda. and Desempar Tecnologia Ltda.), or Desempar, a group of companies specializing in the sale of crop protection products, fertilizer, specialties, and seeds, and related services. The transaction closed on March 31, 2021.
Acquisitions Completed in the Fiscal Year Ended June 30, 2022
On June 23, 2021, we entered into an agreement to acquire 100.0% of Produtiva Agronegócios Comércio e Representações S.A., or Produttiva, a company specializing in the sale of pesticides, seeds and foliar fertilizers as well as providing technical assistance to farmers in choosing products for planting. The total purchase price of R$86.9 million was divided as follows: (i) R$36.4 million was paid in cash on the closing date; (ii) R$22.5 million was paid in shares issued by Produtec to the selling shareholders on the closing date; and (iii) R$28.0 million was paid on the first anniversary of the closing date. The transaction closed on September 2, 2021.
On July 26, 2021, we entered into an agreement to acquire 73.0% of Union Agro, a company specializing in the production and distribution of special fertilizer. The total purchase price of R$124.0 million was divided as follows: (i) R$103.8 million was paid in cash on the closing date; and (ii) R$20.2 million was paid in cash within 12 months of the closing date. The transaction closed on October 28, 2021.
On July 28, 2021, we entered into an agreement to acquire 100.0% of each of Grupo Cenagro S.A.S., or Cenagro, and Cenagral S.A.S., or Cenagral, companies specializing in the sale of crop protection products, fertilizer, specialties, and seeds, and related services. The purchase price was the equivalent in Colombian pesos to R$44.2 million, of which: (i) the equivalent in Colombian pesos to R$32.1 million was paid in cash on the closing date; and (ii) the equivalent in Colombian pesos to R$12.1 million was paid in cash on the first anniversary of the closing date. The transaction closed on August 31, 2021.
On August 5, 2021, we entered into an agreement to acquire 75.0% of Facirolli Comércio e Representações Ltda., or AgroZap, a company specializing in the sale of agricultural inputs and related services. The total purchase price of R$41.0 million was divided as follows: (i) R$18.8 million was paid in cash on the closing date; and (ii) R$22.1 million was paid in cash within 12 months of the closing date. The transaction closed on January 7, 2022.
On December 24, 2021, we entered into an agreement to acquire 70.0% of Nova Geração Comércio de Produtos Agrícolas Ltda., or Nova Geração, a company specializing in the sale of agricultural inputs and related services. The total purchase price of R$30.7 million was divided as follows: (i) R$15.6 million was paid in cash on the closing date; (ii) R$7.8 million was paid in shares issued by Nova Geração to the selling shareholders on the closing date; and (iii) R$7.3 million was paid in cash within 12 months of the closing date. The transaction closed on April 6, 2022.
4
Acquisitions Completed in the Fiscal Year Ended June 30, 2023
On March 22, 2022, we entered into an agreement to acquire 100.0% of Floema Soluções Nutricionais de Cultivos Ltda., or Floema, a company specializing in the sale of agricultural inputs and related services. The purchase price for 70% of Floema’s ownership interests is equivalent to R$27.6 million, of which: (i) R$20.7 million was payable in cash on the closing date, remaining subject to a preliminary price adjustment (which when calculated, was equivalent to a negative amount of R$9.5 million, resulting in a net payment in cash on the closing date amounting to R$11.2 million); and (ii) R$6.9 million was paid in cash on the first anniversary of the closing date (i.e. August 4, 2023), subject to a final price adjustment (to be calculated in the future). The purchase price for the remaining 30% of Floema’s ownership interests was paid in shares issued by AgroZap to the selling shareholders on the closing date, valued at R$11.8 million. The selling shareholders were also entitled to an earn-out of up to R$28.8 million, which was determined on the closing date to amount to R$18.8 million, of which: (i) R$14.1 million was paid in cash on the closing date; and (ii) R$4.7 million was paid in cash on the first anniversary of the closing date. Accordingly, on the closing date: (i) R$25.3 million was paid in cash; and (ii) R$12.3 million was paid in shares issued by AgroZap to the selling shareholders. The remaining R$11.6 million is subject to a final price adjustment and monetary adjustment and is payable in cash on the first anniversary of the closing date. The transaction closed on August 4, 2022.
On May 5, 2022, we entered into an agreement to acquire 85.0% of Casa Trevo Participações S.A. (including its subsidiary Casa Trevo Comercial Agrícola Ltda.), or Casa Trevo, and CATR Comercial Agrícola Ltda., or CATR, a Brazilian-based group of companies specializing in the sale of crop protection products, fertilizers, seeds, and other agricultural inputs. The total purchase price of R$42.5 million was divided as follows: (i) R$23.6 million was paid in cash on the closing date; and (ii) R$18.9 million is payable in cash in one annual installment within 12 months of the closing date. The transaction closed on August 31, 2022.
On June 16, 2022, we entered into an agreement to acquire 100% of Provecampo S.A.S., or Provecampo, a Colombian-based company specializing in the wholesale trade of basic chemical products, rubber and plastics in primary forms and chemical products for agricultural use. The total purchase price of R$21.7 million was divided as follows: (i) R$14.2 million was paid in cash on the closing date; and (ii) R$7.5 million is payable in cash in two equal annual installments within 24 months of the closing date. The transaction closed on July 29, 2022.
On July 22, 2022, we entered into an agreement to acquire 100% of Sollo Sul Insumos Agrícolas Ltda., or Sollo Sul, and Dissul Insumos Agrícolas Ltda., or Dissul, Brazilian-based companies specializing in the sale of crop protection products, fertilizers, seeds, and other agricultural inputs. The total purchase price of R$105.9 million was divided as follows: (i) R$53.0 million was paid in cash on the closing date; and (ii) R$53.0 million is payable in cash in two equal annual installments within 24 months of the closing date. The transaction closed on November 30, 2022.
On January 13, 2023, our subsidiary Crop Care entered into an agreement for the acquisition of a 70% interest in Cromo Indústria Química Ltda., or Cromo Química, a company specialized in the production of high-performance adjuvants. The purchase price of the acquisition totaled R$21.7 million, and is expected to be paid in cash in three installments: R$8.1 million on the closing date, R$10.8 million a year after the closing date and R$5.4 million two years after the closing date, all as adjusted by the IPCA. The transaction closed on May 31, 2023.
Acquisitions Completed Subsequent to the Fiscal Year Ended June 30, 2023
On February 28, 2023, we entered into an agreement to acquire a 70% equity interest in Referência Agroinsumos Ltda., or Referência Agro, an agricultural inputs distributor doing business in the south of Brazil. The purchase price for this transaction (as adjusted) is R$102.1 million, of which R$67.1 million was paid on the closing date and R$35.0 million is expected to be paid one year after the closing date. The transaction closed on July 31, 2023. Because we acquired Referência Agro through our subsidiary Pitangueiras, we currently beneficially own 66.6% of Referência Agro
Special Note Regarding Non-IFRS Financial Measures
This annual report presents our Adjusted EBITDA, Adjusted EBITDA Margin, Net Debt (Net Cash), and Net Debt (Net Cash)/Adjusted EBITDA Ratio, and their respective reconciliations for the convenience of investors,
5
which are non-IFRS financial measures. A non-IFRS financial measure is generally defined as a numerical measure of historical or future financial performance, financial position, or cash flow that purports to measure financial performance but excludes or includes amounts that would not be so adjusted in the most comparable IFRS measure. We present non-IFRS financial measures to aid the reader to evaluate our business, financial condition, results of operations and prospects.
Adjusted EBITDA and Adjusted EBITDA Margin
Adjusted EBITDA is defined as profit (loss) for the year, adjusted for finance income (costs), net, income taxes, depreciation and amortization and excluding the impact of certain revenues or expenses that we believe are isolated in nature incurred as part of our expansion, namely: (i) fair value on inventories sold from acquired companies, (ii) M&A adjustments that in management’s judgment do not necessarily occur on a regular basis, (iii) gains on bargain purchases, (iv) listing and other expenses recognized in connection with the Business Combination, (v) share-based compensation expenses, (vi) bonuses paid out to our employees as a result of the closing of the Business Combination, and (vii) expenses paid to Patria in connection with management consultancy services. Adjusted EBITDA Margin is calculated as Adjusted EBITDA as a percentage of revenue for the period/year. We believe that our Adjusted EBITDA and Adjusted EBITDA Margin metrics are useful metrics used by analysts and investors because it provides additional information about trends in our operating performance prior to considering the impact of capital structure, depreciation, amortization and taxation on our results, as well as the effects of certain items or events that vary widely among similar companies, and therefore may hamper comparability across periods, although these measures are not explicitly defined under IFRS. Our calculation of Adjusted EBITDA and Adjusted EBITDA Margin may be different from the calculation used by other companies, including our competitors in the industry, and therefore, our measures may not be comparable to those of other companies.
Net Debt (Net Cash) and Net Debt (Net Cash)/Adjusted EBITDA Ratio
Net Debt (Net Cash) is calculated as borrowings (current and non-current) plus payables for the acquisition of subsidiaries (current and non-current), obligations to FIAGRO quota holders, warrant liabilities and liability for FPA shares, less cash equivalents and restricted cash. Net Debt (Net Cash)/Adjusted EBITDA Ratio, also a non-IFRS financial measure, is calculated as Net Debt (Net Cash) divided by Adjusted EBITDA. We believe that Net Debt (Net Cash)/Adjusted EBITDA Ratio is an important measure to monitor leverage and evaluate our financial position. With respect to Net Debt (Net Cash), cash and equivalents are subtracted from the IFRS measure of borrowings because they could be used to reduce our borrowings. A limitation associated with using Net Debt (Net Cash) is that it subtracts cash and equivalents and therefore may imply that there is less Company debt than the comparable IFRS measures indicate. We believe that investors may find it useful to monitor leverage and evaluate our financial position using Net Debt (Net Cash) and Net Debt (Net Cash)/Adjusted EBITDA Ratio, although these measures are not explicitly defined under IFRS.
The non-IFRS financial measures described in this annual report should not be viewed in isolation and are not a substitute for the IFRS measures of earnings. Additionally, our calculation of Adjusted EBITDA, Adjusted EBITDA Margin, Net Debt (Net Cash), and Net Debt (Net Cash)/Adjusted EBITDA Ratio may be different from the calculation used by other companies, including our competitors in the agricultural industry, and therefore, our measures may not be comparable to those of other companies. See “Item 5. Operating and Financial Review and Prospects—A. Operating Results—Non-IFRS Financial Measures and Reconciliations” for a reconciliation of our Adjusted EBITDA, Adjusted EBITDA Margin, Net Debt (Net Cash), and Net Debt (Net Cash)/Adjusted EBITDA Ratio to our profit (loss) for the year for the period.
Financial Information in U.S. Dollars
Solely for the convenience of the reader, we have translated some of the amounts included in this annual report from reais into U.S. dollars. You should not construe these translations as representations by us that the amounts actually represent these U.S. dollar amounts or could be converted into U.S. dollars at the rates indicated. Unless otherwise indicated, we have translated real amounts into U.S. dollars using a rate of R$4.8192 to US$1.00, the commercial selling rate for U.S. dollars as of June 30, 2023, as reported by the Central Bank. See “Item 3. Key Information—D. Risk Factors—Risks Relating to Latin America—Exchange rate instability may impact our ability to hedge exchange rate risk, which may lead to interest rate volatility and have a material adverse effect on the price of our Ordinary Shares.”
6
Rounding
Rounding adjustments have been made to some of the figures included in this annual report. Accordingly, numerical figures shown as totals in some tables may not be an arithmetic aggregation of the figures that preceded them; consequently, certain figures may add up to be more or less than the total amount and certain percentages may add up to be more or less than 100%. In particular and without limitation, amounts expressed in millions contained in this annual report have been rounded to a single decimal place for the convenience of readers.
JOBS Act
We ceased to be an “emerging growth company,” as defined in the JOBS Act, on June 30, 2022 as our annual gross revenue exceeded the US$1.235 billion threshold for the fiscal year ended June 30, 2022. As such, we are no longer eligible to take, and have not taken, advantage of certain exemptions that allow emerging growth companies to comply with certain reduced disclosure obligations, which are not available to non-emerging growth companies.
Industry and Market Data
This annual report contains data related to economic conditions in the market in which we operate. The information contained in this annual report concerning economic conditions is based on publicly available information from third-party sources that we believe to be reasonable. Market data and certain industry forecast data used in this annual report were obtained from internal reports and studies, where appropriate, as well as estimates, market research, publicly available information (including information available from the SEC’s website) and industry publications. We obtained the information included in this annual report relating to the industry in which we operate, as well as the estimates concerning market shares, through internal research, public information and publications on the industry prepared by official public sources, such as the IBGE, the FAO and the USDA, among others, as well as private sources, such as consulting and research companies in the Brazilian agricultural industry, among others.
Market data used throughout this annual report is based on management’s knowledge of the industry and the good faith estimates of management. All of management’s estimates presented are based on industry sources, including analyst reports and management’s knowledge. We also relied, to the extent available, upon management’s review of independent industry surveys and publications prepared by a number of sources and other publicly available information. We are responsible for all of the disclosure in this annual report and we believe that each of the publications, studies and surveys used throughout this annual report are prepared by reputable sources and are generally reliable, though we have not independently verified market and industry data from third-party sources. None of the publications, reports or other published industry sources referred to in this annual report were commissioned by us or prepared at our request. We have not sought or obtained the consent of any of these sources to include such market data in this annual report. All of the market data used in this annual report involves a number of assumptions and limitations and therefore is inherently uncertain and imprecise, and you are cautioned not to give undue weight to such estimates. Projections, assumptions and estimates of our future performance and the future performance of the industry in which we operate are necessarily subject to a high degree of uncertainty and risk due to a variety of factors, including those described in “Item 3. Key Information—D. Risk Factors” in this annual report. These and other factors could cause results to differ materially from those expressed in our estimates and beliefs and in the estimates prepared by independent parties.
7
FORWARD-LOOKING STATEMENTS
This annual report contains a number of forward-looking statements that involve substantial risks and uncertainties. All statements other than statements of historical facts contained in this annual report, including statements regarding our future financial position, results of operations, business strategy and plans and objectives of management for future operations, are forward-looking statements. Any statements that refer to projections, forecasts or other characterizations of future events or circumstances, including any underlying assumptions, are also forward-looking statements. In some cases, you can identify forward-looking statements by words such as “estimate,” “plan,” “project,” “forecast,” “intend,” “expect,” “anticipate,” “believe,” “seek,” “strategy,” “future,” “opportunity,” “may,” “target,” “should,” “will,” “would,” “will be,” “will continue,” “will likely result,” or similar expressions that predict or indicate future events or trends or that are not statements of historical matters.
Forward-looking statements include, without limitation, our expectations concerning the outlook for our business, productivity, plans and goals for future operational improvements and capital investments, operational performance, future market conditions or economic performance and developments in the capital and credit markets and expected future financial performance, as well as any information concerning possible or assumed future results of our operations as set forth in the sections of this annual report.
The forward-looking statements are based on the current expectations of our management and are inherently subject to uncertainties and changes in circumstance and their potential effects and speak only as of the date of such statement. There can be no assurance that future developments will be those that have been anticipated. These forward-looking statements involve a number of risks, uncertainties or other assumptions that may cause actual results or performance to be materially different from those expressed or implied by these forward-looking statements. These risks and uncertainties include, but are not limited to, those factors described in “Item 3. Key Information—D. Risk Factors,” those discussed and identified in public filings made with the SEC by us and the following important factors:
•general economic, financial, political, demographic and business conditions in Brazil, as well as any other countries we may serve in the future and their impact on our business;
•geopolitical risk, including the political environment in Brazil and impacts of the ongoing conflict between Russia and Ukraine;
•the possibility that we may be adversely affected by other economic factors, particularly in Brazil;
•fluctuations in interest, inflation and exchange rates in Brazil and any other countries we may serve in the future;
•public health crises, such as the ongoing COVID-19 pandemic;
•competition in the agricultural industry;
•our ability to implement its business strategy;
•our ability to adapt to the rapid pace of technological changes in the agricultural industry;
•the reliability, performance, functionality and quality of our products and services;
•our ability to obtain certain licenses, grants, registrations and authorizations issued by government authorities for certain aspects of its operations;
•our ability to continue attracting and retaining new appropriately-skilled employees;
•our capitalization and level of indebtedness;
•the interests of our controlling shareholder;
•changes in government regulations applicable to the agricultural industry in Brazil and elsewhere;
8
•our ability to compete and conduct its business in the future;
•the success of operating initiatives, including advertising and promotional efforts and new product, service and concept development by us and our competitors;
•changes in consumer demand regarding agricultural products, customer experience and technological advances, and our ability to innovate to respond to such changes;
•changes in labor, distribution and other operating costs;
•our compliance with, and changes to, government laws, regulations and tax matters that currently apply to us;
•our ability to implement business plans, growth strategy and other expectations in the future;
•litigation and regulatory enforcement risks, including the diversion of management time and attention and the additional costs and demands on our resources, including potential litigation regarding the Business Combination; and
•other factors that may affect our financial condition, liquidity and results of operations.
Should one or more of these risks or uncertainties materialize, or should any of the assumptions made by our management prove incorrect, actual results may vary in material respects from those projected in these forward-looking statements.
We caution you against placing undue reliance on forward-looking statements, which reflect current beliefs and are based on information currently available as of the date a forward-looking statement is made. Forward-looking statements set forth herein speak only as of the date of this annual report. We do not undertake any obligation to revise forward-looking statements to reflect future events, changes in circumstances, or changes in beliefs. In the event that any forward-looking statement is updated, no inference should be made that we will make additional updates with respect to that statement, related matters, or any other forward-looking statements. Any corrections or revisions and other important assumptions and factors that could cause actual results to differ materially from forward-looking statements, including discussions of significant risk factors, may appear in our public filings with the SEC, which are or will be (as appropriate) accessible at www.sec.gov, and which you are advised to consult.
Market, ranking and industry data used throughout this annual report, including statements regarding market size and technology/data adoption rates, is based on the good faith estimates of our management, which in turn are based upon our management’s review of internal surveys, independent industry surveys and publications and other third-party research and publicly available information, as indicated. Industry reports, publications, research, studies and forecasts generally state that the information they contain has been obtained from sources believed to be reliable, but that the accuracy and completeness of such information is not guaranteed. These data involve a number of assumptions and limitations, and you are cautioned not to give undue weight to such estimates.
In some cases, we do not expressly refer to the sources from which this data is derived. While we have compiled, extracted, and reproduced industry data from these sources and are not aware of any misstatements regarding the industry data presented herein, we have not independently verified the data. Forecasts and other forward-looking information obtained from these sources are subject to the same qualifications and uncertainties as the other forward-looking statements. Moreover, estimates involve risks and uncertainties and are subject to change based on various factors, including those discussed under the heading “Item 3. Key Information—D. Risk Factors” of this annual report.
9
PART I
Item 1. Identity of Directors, Senior Management and Advisers
Not applicable.
Item 2. Offer Statistics and Expected Timetable
Not applicable.
Item 3. Key Information
A.[Reserved]
B.Capitalization and Indebtedness
Not applicable.
C.Reasons for the Offer and Use of Proceeds
Not applicable.
D.Risk Factors
Summary Risk Factors
The following summarizes the principal factors that make an investment in our company speculative or risky, all of which are more fully described in the risk factors below. This summary should be read in conjunction with the risk factors below and should not be relied upon as an exhaustive summary of the material risks facing our business. The following factors could result in harm to our business, reputation, revenue, financial results, and prospects, among other impacts:
Risks Relating to Our Business and Industry
•We may be adversely affected by global market and economic conditions.
•Our operating results are highly dependent upon and fluctuate based upon business and economic conditions and governmental policies affecting the agricultural industry in which we or our customers operate. These factors are outside of our control and may significantly affect our profitability.
•Our business is highly seasonal and affected by adverse weather conditions and other factors beyond our control, which may cause our sales and operating results to fluctuate significantly.
•Climate change may have an adverse effect on agribusiness in Latin America and us.
•We do not control the activities of our customers, and facts or circumstances that may occur as a result of their actions or omissions could harm our reputation and sales.
•We operate in a competitive market. If we are unable to compete effectively, our financial results will suffer.
•We may not be successful in selling or marketing the agricultural products that we offer in the markets in which we operate.
•If we are unable to retain our existing customers or attract new customers, including through opening new stores and geographic expansion, our business, financial condition and results of operations will be adversely affected.
10
•Our business depends on a well-regarded and widely known brand, and any failure to maintain, protect and enhance our brand would harm our business, financial condition and results of operations.
•If we fail to manage our growth effectively, our business could be harmed.
•Our continued international expansion efforts may not be successful, or may subject our business to increased risks.
•Our results of operations and operating metrics may fluctuate and we may continue to generate losses, which may cause the market price of our Ordinary Shares to decline.
Risks Relating to Acquisitions and Financial Information
•Any acquisition, partnership or joint venture we make or enter into could disrupt our business and harm our financial condition.
•Our recent acquisitions and the comparability of our results may make it difficult for investors to evaluate our business, financial condition, results of operations and prospects.
Risks Relating to Legal and Regulatory Matters, Privacy, Litigation and Cybersecurity
•Our business and the commercialization of our products are subject to various government regulations and agricultural, environmental, health and safety authorities and industry standards, and we or our collaborators may be unable to obtain, or may face delays in obtaining, necessary regulatory approvals.
•Our operations are subject to various health and environmental risks associated with our production, handling, transportation, storage and commercialization.
•Environmental, health and safety and food and agricultural input laws and regulations to which we are subject may become more stringent over time. This could increase the effects on us of these laws and regulations, and the increased effects could be materially adverse to our business, operations, liquidity and/or results of operations.
Risks Relating to Latin America
•We are subject to risks relating to our significant presence in Latin American countries.
•Latin America has experienced, and may continue to experience, adverse economic or political conditions that may impact our business, financial condition and results of operations.
•The Brazilian federal government has exercised, and continues to exercise, significant influence over the Brazilian economy. This influence, as well as Brazil’s political and economic conditions, could harm us and the price of our Ordinary Shares.
Risks Relating to Our Ordinary Shares and Warrants
•We incur increased costs as a result of operating as a public company.
•We may be required to take write-downs or write-offs, restructuring and impairment or other charges that could have a significant negative effect on our financial condition, results of operations and share price, which could cause you to lose some or all of your investment.
•The Lavoro Original Shareholders beneficially own approximately 84.7% of the outstanding Ordinary Shares, and control certain matters requiring shareholder approval. This concentration of ownership and voting power will limit your ability to influence corporate matters.
•As a foreign private issuer, we have different disclosure, Nasdaq corporate governance standards and other requirements than U.S. domestic registrants.
11
•The exercise of our Warrants for our Ordinary Shares would increase the number of shares eligible for resale in the public market and result in dilution to our shareholders.
•The sale of a substantial percentage of our outstanding Ordinary Shares could cause the market price of our Ordinary Shares to decline significantly.
•We are a Cayman Islands exempted company with limited liability. The rights of our shareholders, including with respect to fiduciary duties and corporate opportunities, may be different from the rights of shareholders governed by the laws of U.S. jurisdictions.
•We may redeem your unexpired Warrants prior to their exercise at a time that is disadvantageous to you, thereby making your Warrants worthless.
Risks Relating to Our Business and Industry
We may be adversely affected by global market and economic conditions.
Our ability to continue to develop and grow our business, build proprietary distribution channels and generate revenues from product sales may be adversely affected by global economic conditions in the future, including instability in financial and credit markets, declining consumer and business confidence, fluctuating commodity prices and interest rates, volatile exchange rates and other challenges that could affect the global economy such as the changing financial regulatory environment. For example, our customers may experience deterioration of their businesses, cash flow shortages or difficulties obtaining financing, which could adversely affect the demand for our agricultural products and services. Changes in the prices of certain commodity products could result in higher overall costs along the agricultural supply chain, which may negatively affect our ability to commercialize our products due to a reduction of demand by our clients. Additionally, negative fluctuations in commodity prices could have an impact on growers’ purchasing decisions and negatively affect their ability and decisions to purchase our agricultural input products and services. We cannot anticipate all of the ways in which the current economic climate and financial market conditions could adversely impact our business and may not be able to anticipate or react to changing costs by adjusting our practices, which could cause our operating results to deteriorate. Any downturn in the global market or general economic conditions could have a material adverse effect on our results of operations, financial condition and business. See also “—Risks Relating to Latin America—Disruption or volatility in global financial and credit markets could have a material adverse effect on us.”
Our operating results are highly dependent upon and fluctuate based upon business and economic conditions and governmental policies affecting the agricultural industry in which we or our customers operate. These factors are outside of our control and may significantly affect our profitability.
Our operating results in particular, and agricultural production and trade flows more generally, are subject to factors outside our control that could adversely affect our operations and profitability. Therefore, the sale of our products may be adversely affected by circumstances beyond our control. The most important of these factors are:
•weather, climatic variations and field conditions (particularly during periods of traditionally high agricultural and planting activity);
•quantities of crop nutrients imported and exported;
•cost increases by our suppliers and service providers for the agricultural inputs and services required in our activities, which may lead to decreased customer demand;
•current and expected agricultural commodity inventories and prices (such as soybean and corn), which are heavily influenced by worldwide markets, with the United States, China, Brazil, Argentina and the European Union being the largest producers and consumers of these commodities; and
•governmental policies and approvals of technologies affecting the agricultural industry, such as farm and biofuel policies, taxes, tariffs, duties, subsidies, incentives and import and export restrictions on agricultural commodities and commodity products, which may directly or indirectly influence the location or number of
12
hectares planted, the level of inventories, the mix of crops planted or crop prices and the volume and types of imports and exports or otherwise negatively affect our operating results.
International market conditions, which are outside of our control, may significantly influence our operating results. The international market for agricultural inputs is influenced by such factors as the relative value of the U.S. dollar and its impact upon the cost of importing agricultural inputs; foreign agricultural policies, including subsidy policies; the existence of, or changes in, import or foreign currency exchange barriers in certain foreign markets; changes in the hard currency demands of certain countries; and other regulatory policies of foreign governments; as well as the laws and policies affecting foreign trade and investment, including use of tariffs.
Moreover, our private label products use some basic raw materials, most of them mineral commodities, such as yellow phosphorus, acetic acid, CCMP (2-chloro-5-chloromethylpyridine), DMPAT (Dimethyl thiophosphoramidate), and manganese. These raw materials may suffer price increases in amounts higher than those expected by us, including changes to tax rates or the creation of new taxes, which can cause a decrease in the profitability of our products and, consequently, adversely affect our financial condition. Additionally, some of our raw materials are purchased in the foreign market and, therefore, their prices are linked to the variation of the dollar. If there is an increase in the price of the main raw materials that we or our suppliers use in the production process, our and/or their results of operations could be negatively impacted.
Our business is highly seasonal and affected by adverse weather conditions and other factors beyond our control, which may cause our sales and operating results to fluctuate significantly.
The sale of our products is dependent upon planting and growing seasons, which vary from year to year, and are expected to result in both highly seasonal patterns and substantial fluctuations in quarterly sales and profitability. Demand for our products is typically strongest between October and December, with a second period of strong demand between January and March. The seasonality of agricultural inputs demand results in our sales volumes and net sales typically being the highest during the South American spring and summer seasons (in particular, between December and February) and our working capital requirements typically being the highest just after the end of the spring season.
Weather conditions and natural disasters, such as heavy rains, hail, floods, frost, windstorms, drought or fire, as well as other factors beyond our control, such as demand conditions, availability of supply, food safety concerns, product recalls and government regulations also affect decisions by our distributors, direct customers and end users about the types and amounts of products to use and the timing of harvesting and planting. Disruptions may lead to delays in harvesting or planting by growers which can result in pushing orders to a future quarter, which could negatively affect results for the quarter in question and cause fluctuations in our operating results.
Moreover, we are exposed to the risk and significant cost of maintaining inventory if, due to the aforementioned reasons, the activities of our customers decrease. We cannot assure you that we will be able to distribute sufficient products during the year to meet the demand of our customers in peak seasons, nor that our customers will rapidly react to unexpected climate changes, which may adversely affect the demand for our products. Climate changes directly affect the planting schedule and demand of our customers and their crop yield and, as a result, adversely affect their financial condition and their ability to meet their obligations with us.
The overall level of seasonality in our business is difficult to evaluate as a result of our expansion into new geographical territories, the introduction of new products and the timing of introductions of new products. It is possible that our business may be more seasonal or experience seasonality in different periods than anticipated. Other factors may also contribute to the unpredictability of our operating results, including the size and timing of significant transactions. For example, as mentioned above, our most profitable months tend to be October, November and December in a given calendar year. If we acquire a large target between January and June of a given year, we would be missing its best performing months, and, therefore, our annual accounting statements for the fiscal year ended June 30 would not fully reflect the positive impact of the acquisition. Additionally, the delay or deferral of use of our agricultural products and services and the fiscal or quarterly budget cycles of our direct customers and end users may also impact the seasonality of our results. Customers may purchase large quantities of our products in a particular quarter to store and use over long periods of time or time their purchases to manage their inventories, which may cause significant fluctuations in our operating results for a particular quarter or year.
13
If seasonal demand exceeds our expectations, we will not have enough product volumes and our customers may acquire products from our competitors, which would negatively impact our profitability. If seasonal demand is less than we expect, we will be left with excess inventory and higher working capital and liquidity requirements. The degree of the seasonality of our business can change significantly from year to year due to conditions in the agricultural industry and other factors.
Climate change may have an adverse effect on agribusiness in Latin America and us.
We are subject to risks related to climate change which are commonly grouped into physical risk and transition risk categories.
Physical risks include the impact that climate change could have on our operations, the operations of our customers, and our supply chain. The impact of climate change is uncertain and may be harmful due to changes in rainfall patterns and intensity, shortage of water, changes in sea levels, and changes in global temperature, among others. These physical impacts may vary depending on the location and intensity of climate events, comprising acute risks, including increased severity of extreme climate events, and chronic risks, deriving from long-term changes in climate patterns. These acute or recurrent physical impacts can cause significant losses to rural producers in Latin America. It can increase the non-payment risk by current and future customers. Similarly, they may limit geographic expansion strategies in certain regions, and consequently require significant changes in our business strategy. We cannot assure you that any losses caused by climate change effects on the crops of our customers will be recovered, even in following seasons, considering current productivity standards. As a result, we may be materially adversely affected and our financial results may significantly vary each year. Physical risks from climate change may also result in operational or supply chain delays, depending on the nature of the event. These events may impact the demand for our products, availability and/or cost of resource inputs, materials or insurance or increase the costs to our operations.
Transition risks relate to the risk inherent in changing strategies, policies or investments as society and industry work to reduce the reliance on carbon and impact on the climate, and depend on political, regulatory, legal, technological, and market responses. Impacts of transition risks include, among other things, policy constraints on carbon emissions, imposition of carbon pricing mechanisms and carbon taxes, enhanced reporting obligations, risks associated with investments in new technologies, costs to transition to lower emissions technologies, stranded assets, diminished access to capital and financing, water restrictions, land use restrictions or incentives, changing consumer behavior and preferences, and market demand and supply shifts. There are also reputational risks associated with climate change including our stakeholders’ perception of our role in the transition to a lower- carbon economy.
Climate change laws could also increase our costs and have an impact on our financial condition and the results of operations. The adoption of a national or international policy to limit greenhouse gas emissions for some industries may require significant investments for implementation. Several countries, including Brazil, may adopt a carbon pricing regime through a regulated market or by creating an emission tax, or by combining these two factors. This could result in a regulated carbon market, which may impose limits on greenhouse gas emissions for various industries and businesses, including their suppliers and customers (i.e., in line with an extended value chain concept).
There can be no assurance that our efforts to anticipate the costs associated with mitigating the physical risks of climate change and ability to work with governments and industry on potential regulatory requirements associated with climate change will be effective or that climate change or related governmental policy action in response to climate change will not have an adverse impact on our business and negatively impact our strategy, financial condition, results of operations, and/or cash flows, and our reputation and stakeholders’ support.
We do not control the activities of our customers, and facts or circumstances that may occur as a result of their actions or omissions could harm our reputation and sales.
Environmental concerns worldwide are continuing to rise. Tracts of land cleared for the harvesting of crops cause deforestation. To this effect, we do not control our customers or their environmental or other practices. A violation of environmental, health, agricultural or other laws by our customers or business partners, or an environmental or public health incident at customer locations, including acts of deforestation, or any failure of these third parties to follow generally accepted ethical business practices, could create negative publicity and harm our
14
reputation. In addition, we may be required to seek alternative customers if these violations or failures were to occur. Although we conduct periodic due diligence of our customers’ compliance with environmental, health, agricultural laws or practices, we may be unable to detect related violations and our due diligence practices may not be sufficient to ensure our customers’ compliance with environmental laws or practices. Any conduct or actions that our customers could take could reduce demand for our products, harm our ability to meet demand or harm our reputation, brand image, business, financial condition or results of operations.
We operate in a competitive market. If we are unable to compete effectively, our financial results will suffer.
We currently face competition in the markets in which we operate. The market for agricultural inputs is competitive and evolving. The influence of the agricultural sector in Brazil and in other Latin American markets has been increasing, including in the Brazilian retail market of agricultural inputs, due to the creation of groups resulting from mergers and acquisitions, the entry of international players in Brazil and Latin America, and competition among farmer cooperatives. Additionally, agricultural inputs suppliers may intensify their strategy of making direct sales to rural producers or even decide to progress in the value chain, becoming retailers of agricultural inputs. If we are unable to adapt to changes in the competitive landscape in the markets in which we operate, or intend to operate in the future, and this leads to loss of markets and/or difficulties in the operation of our business, our results of operations and business may be adversely affected.
Moreover, the advancement and adoption of technology and digital innovations in agriculture and across the value chain have increased and are expected to further accelerate as grower demographics shift and pressures from consumer preferences, governments, and climate change initiatives evolve. Some emerging trends include the development of seeds that require less crop nutrients, development of full or partial substitutes for our products, or developments in the application of crop nutrients such as improved nutrient use or efficiency through use of precision agriculture. If we are unable to provide new products and services to satisfy emerging trends, it may adversely affect our financial condition, results of operations, and cash flows. Further, digital innovations and use of new technology in the agriculture market, among other things, by new or existing competitors could alter the competitive environment, resulting in existing business models being disrupted, which may adversely impact our operations and financial performance.
Our ability to compete effectively and to achieve commercial success depends, in part, on our ability to control inventory and other supply-related costs; marketing costs and go to market strategy through our distribution channels; effectively price and market our products; successfully develop an effective marketing program and an efficient supply chain; obtain and commercialize new products and maintain an attractive product portfolio; among other factors. We may not be successful in achieving these factors and any such failure may adversely affect our business, results of operations and financial condition.
We may not be successful in selling or marketing the agricultural products that we offer in the markets in which we operate.
Our success depends on our ability to continue to identify, obtain and commercialize the agricultural products we offer in the markets in which we operate, including agricultural inputs with attractive and high-value characteristics and technologies. We commit substantial efforts and resources to locate and source products that we seek to bring to the markets in which we operate, and we may not be successful in obtaining or commercializing such products at the same pricing or market conditions. Also, if the agricultural products we sell are unsuccessful in achieving their desired effect or no longer perform according to our customers’ expectations, our customers’ demand for our products may be affected, which could materially and adversely affect our business, financial condition, results of operations and growth strategy.
Therefore, our success depends on our ability to (i) develop and distribute new products and technologies that are attractive to farmers, our final consumers, (ii) control expenses without affecting sales, (iii) predict and effectively respond to the products, prices and marketing sold by our competitors, (iv) develop marketing programs that meet the needs and desires of farmers and (v) maintain an efficient marketing and distribution system. There can be no assurances that our sales or marketing strategies will continue to be effective or that the amount we invest in RTV training and marketing activities will result in a corresponding increase in sales of our products. If our sales
15
and marketing initiatives are not successful, including our ability to leverage new digital channels, we will have incurred significant expenses without the benefit of higher revenues.
If we are unable to retain our existing customers or attract new customers, including through opening new stores and geographic expansion, our business, financial condition and results of operations will be adversely affected.
The growth of our business depends on existing customers increasing their use of our agricultural products and services, attracting new customers, and our ability to continue expanding geographically and opening new stores. If we are unable to expand our sales footprint and encourage customers to increase their purchases of our products and use of our services, our growth may slow or stop, and our business may be materially and adversely affected. The growth of our business also depends on our ability to attract new customers and introduce new agricultural products and services. We have invested and will continue to invest in opening new stores and in improving our portfolio of products and services and our e-commerce digital platform in order to offer better or new features, products and services, but if those features, products and services fail to attract new customers or encourage existing customers to expand their use of our products and services, our growth may slow or decline.
Our customers have no obligation to continue to use our products and services, and we can make no assurances that our customers will continue to do so. We generally do not have long-term contracts with our customers. Our sales may decrease for a variety of reasons, including our customers’ level of satisfaction with our products and services, our pricing and the pricing and quality of competing products and services, the effects of global economic conditions or reductions in our customers’ spending levels.
Our business depends on a well-regarded and widely known brand, and any failure to maintain, protect and enhance our brand would harm our business, financial condition and results of operations.
Maintaining, protecting and enhancing our brand is critical to expanding our customer base. This will depend largely on our ability to remain – or, in markets into which we expand, become – widely known, gain and maintain our customers’ trust, be a technology leader and provide reliable, high-quality and secure products and services that continue to meet the needs of our customers at competitive prices, as well as the effectiveness of our marketing efforts and our ability to differentiate our services and platform capabilities from competitive products and services.
We believe that maintaining and promoting our brand in a cost-effective manner is critical to achieving widespread acceptance of our products and services and expanding our customer base. Maintaining and promoting our brand will depend largely on our ability to continue to provide useful, reliable and innovative agricultural products and services, which we may not do successfully. Our brand promotion activities may not generate customer awareness or increase revenue, and even if they do, any increase in revenue may not offset the expenses we incur in building our brand. If we fail to successfully promote and maintain our brand or if we incur excessive expenses in this effort, we could lose significant market share and our business could be materially and adversely affected.
Even if we are able to promote our brand in a cost-effective manner, our reputation and, consequently, our brand may suffer as a result of internal and external factors, including any failure by us or our partners to satisfy expectations of service and quality, inadequate protection of personal and sensitive information, compliance failures and claims, unethical behavior or business practices, employee misconduct or misconduct by our associated partners, service providers or other counterparties, litigation and significant fluctuations in our share price, or rumors of any of the foregoing. Our reputation and brand may also be harmed by statements made by current or former employees, customers, vendors, competitors or other third parties, regardless of the veracity of such statements. Any negative publicity about any of the foregoing, or our industry, our company, customer experience, customer service, the quality and reliability of or changes to our agricultural products and services, our privacy and security practices or any regulatory activity, would amplify the harm to our reputation and brand, and could consequently adversely affect customers’ or potential customers’ confidence in and purchasing and use of our agricultural products and services. This, in turn, would adversely affect our business, financial condition and results of operations.
If we fail to manage our growth effectively, our business could be harmed.
We have experienced and expect in the near term to continue to experience rapid growth. Our revenue increased to R$9,347.4 million for the fiscal year ended June 30, 2023, from R$7,746.5 million for the fiscal year ended June
16
30, 2022 and R$5,098.5 million for the fiscal year ended June 30, 2021. Our growth has placed and will continue to place significant demands on our administrative, operational and financial resources.
Our ability to effectively manage our growth will depend on a number of factors, including our ability to:
•expand our sales and marketing, technology, finance and administration teams;
•grow our facilities and infrastructure;
•adapt and scale our information technology systems;
•refine our operational, financial and risk management controls and reporting systems and procedures;
•recruit, integrate, train and retain a growing employee base and maintain our corporate culture;
•secure an adequate supply and quality of raw materials and agricultural input products sold, as well as available sources of financing to implement our growth strategy;
•maintain and grow our customer base and provide quality customer service;
•obtain and maintain our environmental and other governmental licenses; and
•obtain, maintain, protect and develop our product portfolio, including our intellectual property and other proprietary rights.
Executing on these factors will require significant capital for working capital and investments and the allocation of valuable management and employee resources. We may be unable to effectively manage any future growth in an efficient, cost-effective or timely manner, or at all. Any failure to successfully implement accounting and other systems enhancements and improvements will likely negatively impact our ability to manage our expected growth, ensure uninterrupted operation of key business systems and comply with the rules and regulations that are applicable to public reporting companies. Moreover, if we do not effectively manage the growth of our business and operations, the quality of our agricultural inputs and services distribution platform could suffer, which could negatively affect our reputation, results of operations and overall business. Furthermore, as we grow, we may not be able to execute as quickly as smaller, more efficient organizations.
Our continued international expansion efforts may not be successful, or may subject our business to increased risks.
We currently have distribution operations in Brazil and Colombia, and have an emergent trading company in Uruguay. As part of our growth strategy, we intend to expand our operations by offering our services in additional international jurisdictions, including in Peru, Chile, Paraguay, Uruguay and other countries in South and Central America. We may not be successful in expanding our operations into these or other markets outside of Brazil, Colombia and Uruguay in a cost-effective or timely manner, if at all, and our products and services may not experience the same market adoption in such jurisdictions as we have enjoyed in the countries where we operate. In particular, the expansion of our business into new geographies may, depending on the local regulatory environment, require a commercial relationship with one or more local logistics providers or other intermediaries, which may prevent, delay or limit the introductions of our products and services in such countries.
Further, our international expansion efforts have and will continue to place a significant strain on our personnel (including management), technical, operational and financial resources, and our current resources may not be adequate to support our planned geographical expansion. Further, we may not be able to recoup our investments in new geographies in a timely manner, if at all. If our expansion efforts are unsuccessful, our ability to grow our business and revenue may be adversely affected.
Even if our international expansion efforts are successful, international operations will subject our business to increased risks, including:
•increased licensing and regulatory requirements;
17
•competition from service providers or other entrenched market participants that have greater experience in the local markets than we do;
•a lack of acceptance of our agricultural products and services;
•increased costs associated with and difficulty in obtaining, maintaining, processing, transmitting, storing, handling and protecting sensitive data and proprietary rights;
•changes to the way we do business as compared with our current operations;
•the ability to find and use local third-party selling agents, intermediaries and other service providers;
•difficulties in staffing and managing foreign operations in an environment of diverse culture, language, laws and customs;
•difficulties in recruiting and retaining qualified employees and maintaining our company culture;
•increased travel, infrastructure and legal and compliance costs;
•compliance with complex and potentially conflicting and changing tax regimes;
•potential tariffs, sanctions, fines or other trade restrictions;
•exchange rate exposure;
•increased exposure to public health issues such as the COVID-19 pandemic, and related industry and governmental actions to address these issues; and
•regional economic and political instability.
As a result of these risks, our international expansion efforts may not be successful or may be hampered, which could limit our ability to grow our business.
Our results of operations and operating metrics may fluctuate and continue to generate losses, which may cause the market price of our Ordinary Shares to decline.
While we generated revenue of R$9,347.4 million, R$7,746.5 million and R$5,098.5 million for the fiscal years ended June 30, 2023, 2022 and 2021, respectively, we generated a loss of R$218.7 million for the fiscal year ended June 30, 2023, and a profit of R$107.8 million and R$21.5 million for the fiscal years ended June 30, 2022 and 2021, respectively. We intend to continue investing in our business, including with respect to acquisitions, our employee base, expanding our network of stores, sales and marketing, and development of the Lavoro Connected Farm digital solution; and general administration, including legal, finance and other compliance expenses related to being a public company. If these costs materially rise in the future, our expenses may rise significantly. If we are unable to generate adequate revenue growth and manage our expenses, we may continue to incur losses and fail to maintain profitability.
In addition, we intend to expand our customer base, and continue to invest in developing products and services that we believe will be attractive to our customers and therefore improve our long-term results of operations. However, customer acquisition could cause us to continue to incur losses in the short term because costs associated with acquiring new customers are generally incurred up front, while revenue is recognized thereafter as customers make payments and purchase our products and utilize our services. Both could cause our results of operations and operating metrics to fluctuate.
Further, from time to time, we have made and may make decisions that will have a negative effect on our short-term operating results if we believe those decisions will improve our operating results over the long term. These decisions may not produce the long-term benefits that we expect, or they may be inconsistent with the expectations of investors and research analysts, either of which could cause the price of our Ordinary Shares to decline.
18
Our results of operations may be adversely affected if our customers are unable to repay trade receivables from us.
We extend commercial credit to our customers in Brazil and Colombia, in some cases for extended periods of time, by permitting customers to pay for agricultural inputs through installments or deferred payments. Although this receivable is typically guaranteed, as our exposure to longer trade credit extended to our customers increases, we are increasingly exposed to the risk that our guarantees may not suffice to cover the outstanding balance on these receivables should some of our customers fail to pay us. Additionally, we become increasingly exposed to risk due to weather and agricultural input conditions, fluctuations in agricultural input prices, commodity prices or foreign currencies, and other factors that influence the price, supply and demand for agricultural commodities, to the extent such factors affect the sufficiency of our guarantees to cover our loss if our customers fail to repay us.
We may incur significant losses if our customers do not meet their obligations under the barter transactions entered into with trading companies.
Under barter transactions, we carry out term sales of agricultural inputs (e.g., seeds, crop protection products, fertilizers, and specialty products) in exchange for the future delivery of commodities, primarily soybean and corn, at the time of their harvest.
Most of these barter transactions involve contracts between three different parties: us, our customers and commodity trading companies. A first contract (grain purchase agreement) is entered into with our customers, pursuant to which we and our customer agree on an amount of commodity, to be delivered at harvest, which is equal to the total sales price based on the future commodity price on the date in which the contract with the customer is entered into. Our customers’ main obligation under this contract is to deliver the agreed upon volume of commodities as payment at a future date. Contemporaneously, we enter into a future grain sale agreement with a commodity trading company, pursuant to which we assume the obligation to deliver the commodities received as payment from our client to the trading company. This agreement is signed for the same quantity and on the same terms as set forth in our contract with our customers. While this physical sale of the grains is not concluded with trading companies, we may enter into a derivative contract on commodity and futures exchanges such as CBOT, ICE, or B3, in an equivalent term associated with the physical grain purchases. This aims to mitigate our exposure to price fluctuations. Consequently, we maintain these derivative contracts to naturally hedge against market volatility. As soon as the physical sale of the grains is concluded, the derivative contracts are promptly liquidated to realize the hedging gains or losses.
Although barter transactions operate as a hedge against commodity price depreciation, we might be subject to other materially adverse effects from commodity price volatility. The prices of inputs and, primarily, the prices of soybean and corn are also subject to the volatility resulting from weather conditions, crop yield, transportation costs, storage costs, the Brazilian government agricultural policy, exchange rates and the prices of these commodities in the international market, among other factors.
In the event of a significant appreciation of the price of the commodity provided for in the barter agreement, at the time of settlement of such agreement, producers may consider diverting their production to other trading companies or customers, hence failing to deliver grains to us. In this case, we are required to purchase the commodity in the spot market and deliver it to the commodity trading company, or pay compensation to the commodity trading company in an amount equal to the difference between the commodity price between the time of delivery and the time of closing of the agreement (the so-called “washout risk”). Pursuant to the contractual arrangements governing these transactions, we may charge our customers for any losses we might incur in the case of such events.
Moreover, even though these agreements are settled physically (grains purchase and sale), we adopt IFRS 9 to designate, at initial recognition, such forward contracts as measured at fair value through profit and losses. The fair value of commodity forward contracts entered into with our customers and with commodity trading companies is estimated based on information available in the market and specific valuation methodologies, and discounted to present value, considering the contractual terms and the current market prices for such commodities. Such contracts are disclosed on a gross basis in our statement of financial position.
19
For more information on the accounting policy underlying our barter transactions, see notes 8(g) and 11 to our audited consolidated financial statements included elsewhere in this annual report. See also “Item 11. Quantitative and Qualitative Disclosures about Market Risk—Commodity Price Risk in Barter Transactions.”
If we fail to identify, develop and maintain relationships with a sufficient number of qualified suppliers, our ability to timely and efficiently access products that meet our standards for quality could be adversely affected, or we may experience an increase in the costs of our products that could reduce our overall profitability.
We buy the majority of the products we commercialize. Our ability to continue to identify and develop relationships with qualified suppliers and enter into exclusive or restrictive distribution rights agreements with suppliers who can satisfy our standards for quality and our need to access products and supplies in a timely and efficient manner may be a challenge in the future. In the fiscal years ended June 30, 2023 and 2022, 9.1% and 11.6% of our distribution sales derived from products purchased from our top supplier, respectively. Our top ten largest suppliers accounted for approximately 45% and 57%, respectively, in the fiscal years ended June 30, 2023 and 2022.
Any failure to maintain our relationship with any of our top ten largest suppliers, or a failure to replace any such supplier that is lost, could have a material adverse effect on our business, financial position, results of operations and cash flows.
Shortfalls or disruptions in the supply of agricultural inputs by our current suppliers may adversely affect us until we are able to procure a replacement supplier for certain categories of the agricultural products we sell.
The crop protection (including crop protection solutions through chemistry, or ag-chemicals) and crop productivity market is a consolidated market. A relatively small number of large companies (the so-called “Big Four” companies: BASF, Bayer, Corteva and Syngenta) hold a significant stake of this market, while other smaller companies (the so-called “tier two and three” companies) hold a growing and majority, albeit fragmented, share of this market. Due to the small number of large players in our market, we have maintained relationships with and purchase certain categories of crop protection products from both larger and smaller suppliers. If we fail to develop or maintain our relationships with our current suppliers, that could impact our relationships with other suppliers or lead us to rely on other smaller suppliers that may not be able to provide products in the same standards or pricing conditions. The loss or disruption of our supply arrangements for any reason, including for issues such as COVID-19 or other health epidemics or pandemics, labor disputes, loss or impairment of key manufacturing sites, inability to procure sufficient raw materials, quality control issues, ethical sourcing issues, a supplier’s financial distress, natural disasters, looting, vandalism or acts of war or terrorism, trade sanctions or other external factors over which we have no control, could interrupt product supply and, if not effectively managed and remedied, have a material adverse impact on our business operations, financial condition and results of operations.
In addition, even though other product categories are more fragmented (such as specialty fertilizers, biological products, and seeds), smaller players may not be able to immediately meet our volume demands and this could harm our sales and the relationship with our customers until we are able to procure additional supply chains with other large and/or small companies. While we seek to expand our portfolio of products in the future and to commercialize new agricultural input product candidates, we may need to obtain new relationships with crop protection companies to purchase such products from them. If we are unable to maintain or obtain such relationships, we may face challenges in expanding our commercial products portfolio and distribution networks, or other adverse impacts, which could have a material adverse effect on our business prospects.
We may be adversely affected by the ongoing armed conflict between Russia and Ukraine.
As a result of the current geopolitical tensions and armed conflict between Russia and Ukraine, and the recent recognition by Russia of the independence of the self-proclaimed republics of Donetsk and Luhansk in the Donbas region of Ukraine, the governments of the United States, the European Union, Japan and other jurisdictions have recently announced the imposition of sanctions on certain industry sectors and parties in Russia, Belarus and the regions of Donetsk and Luhansk, as well as enhanced export controls on certain products and industries. These and any additional sanctions and export controls, as well as any counter responses by the governments of Russia or other jurisdictions, could adversely affect, directly or indirectly, the global supply chain, with negative implications on the availability and prices of agricultural commodities and raw materials (including petrol, which would affect the price of agricultural inputs), energy prices, and our customers, as well as the global financial markets and financial
20
services industry and the global supply chain in general, which has also been impacted by the ongoing COVID-19 pandemic.
As a result, in particular, the availability and pricing of fertilizers for the 2022/2023 soy harvest is subject to significant continuing uncertainty in Brazil. From a supply point of view, Brazil is highly dependent on fertilizers imports, and Russia and Belarus hold a market share in Brazilian soil fertilizer imports of approximately 26% to 30%, respectively (a share which is higher for potash-based products), according to the Brazilian Ministry of Industry, Foreign Trade and Services. We currently buy all of our fertilizers from suppliers based in Brazil, but most of our fertilizer suppliers conduct or have conducted imports, to some degree, from sources in Russia and Belarus. Fertilizers represented approximately 21% of our revenues in the fiscal year ended June 30, 2023, compared to 20% of our revenues in the fiscal year ended June 30, 2022. In addition, fertilizer prices, which had already risen before the conflict, have continued to rise and have led producers to delay purchase negotiations. As a result of such supply risk and the slow pace of the market at present, we experienced a reduction in the total volume of fertilizers used in Brazil in the 2022/2023 harvest when compared to the 2021/2022 harvest; though we believe that this trend has since subsided and do not currently expect material shortages of fertilizers to continue in the future, no assurance can be provided in this respect.
Furthermore, in connection with the Russian war against Ukraine, we have limited the acquisition of NPK of Russian origin to one-off purchases, a volume that represented between 15% and 20% of the total sold in the 2022/2023 harvest. NPK is an essential input for large-scale agriculture and we are focused on avoiding shortages as much as possible, seeking supply alternatives whenever necessary. This did not have a material adverse effect on our business during the 2021/2022 harvest year, given that we had delivered substantially all soy and corn fertilizer for the harvest year, or during the 2022/2023 harvest year. However, given current market conditions and the continuing military conflict between Russia and Ukraine, the volume of fertilizers sold by us may be adversely affected in the future, which may adversely affect our results of operations, in particular if we are unable to mitigate any relevant reduction in fertilizer sales volumes through measures such as price increases of other products. In addition, we may also be unsuccessful in finding alternative direct imports from non-sanctioned regions or in increasing our prices to reflect increased supply costs in the future.
Disruptions of the supply or reliability of transportation services and/or changes in transportation service costs can affect our sales volumes and selling prices.
As of June 30, 2023, we transported 100% of our products to our customers via highways. Grains are also transported from our silos or from our clients’ sites to trading companies’ warehouses via highways. Considering the distance from the main agricultural regions in the locations where we operate, our operations primarily depend on the availability and reliability of logistics infrastructure in Latin America, especially truck transportation, to ensure that our agricultural inputs are delivered to our customers on time. Logistics bottlenecks as a result of poor highway conditions, which are aggravated during certain key planting periods, or resulting from adverse weather conditions or other causes, may delay or prevent the delivery of these products, adversely affecting the planting season of our customers and our relationship with them, which may adversely affect us.
Infrastructure deficiencies and the low development of transport services in the locations where we operate, increase the cost of the agricultural inputs we sell to our customers. The transportation of our products by trucks, for example, is significantly costlier than transportation by rail, which is not yet developed enough in the markets in which we operate to serve as a viable alternative, increasing the final cost of our products.
Therefore, our activities and those of our main service providers, including, but not limited to, resellers, suppliers and associated logistics, are subject to risks resulting from partial or total, as well as temporary or permanent transportation-related interruptions or stoppages. Disruption to the timely supply of these services or availability of associated infrastructure, or dramatic increases in the cost of these services for any reason including the availability of fuel for such services, labor disputes, governmental regulation, or governmental restrictions limiting specific forms of transportation could have an adverse effect on our ability to serve our customers and consumers and could have an adverse effect on our business and financial performance. Brazil and Colombia, for example, have faced significant social movements affecting their logistics infrastructure, such as the 2018 truck driver’s strike in Brazil or the political turmoil and protests in Colombia in 2021, which have in the past and may in the future negatively disrupt our operating schedule and result in increased transportation costs.
21
The cost of delivery adds to the total agricultural input cost to customers and farmers. As a result, changes in transportation costs, or in customer expectations about them, can affect our sales volumes and prices. We cannot assure you that transportation of our products via highways will not be subject to blockades, invasions or occupations by social movements or other protestors, which may lead to increased transportation costs and adversely affect the delivery of products to our customers and our relationship with them. Additionally, we rely on third-party carriers for the transportation of our products. Such carriers may be less efficient and more costly and may delay deliveries, adversely affecting our image.
In addition, one of our storage and handling locations is located in an environmentally sensitive area and, should an accident or other problem occur in such location, such as toxic substance leaks, our operations may be adversely affected and may result in financial losses. These risks can also result in the loss of life, significant damage to our or third-party property, contamination and environmental damage, which may require us to interrupt our operations, which, in turn, may result in financial losses and significant reputational losses. The transportation and movement of waste, such as water and toxic substances, involve a variety of inherent hazards and operational risks, such as spills, accidents and natural disasters, which could cause significant financial losses for us. The proximity of storage sites to populated areas, including residential, commercial and industrial facilities, could increase the damage resulting from these hazards. Moreover, business with controlled chemical or flammable products can lead to fires and explosions or the intoxication of employees or third parties. Fatal work accidents will result in investigations as to compliance with applicable occupational health and safety rules and as to potential criminal liability.
Interruptions in the production or transportation of certain agricultural inputs we sell could adversely affect our operations and profitability.
We rely on agricultural inputs manufacturers to produce and supply agricultural inputs sold by us. Poor execution, failure to follow required agronomic practices, protocols or regulatory requirements, or mishandling of agricultural inputs by these producers could adversely affect our availability of products. Such delays could adversely affect our ability to deliver agricultural inputs to farmers to meet their planting window. In addition, our production and transportation may be adversely affected in the event of customs delays. Our dependency upon timely agricultural input deliveries means that interruptions or stoppages in such deliveries, or delays or limitations with respect to seed production, could adversely affect our operations until alternative arrangements could be made. Such a delay would adversely affect our reputation and revenues. If we were unable to obtain the necessary agricultural inputs for an extended period for any reason, our business, customer relations, and operating results could suffer.
We may not be able to enter into cost-effective agreements with suitable agricultural input producers on acceptable terms. If any agricultural inputs producers whom we engage fail to perform their obligations as expected or breach or terminate their agreements with us, or if we are unable to secure the services of such third parties when and as needed, it may adversely affect our business.
Our failure to accurately forecast and manage inventory could result in an unexpected shortfall or surplus of products which could harm our business.
We are required to maintain inventories of certain of our agricultural inputs products and we monitor our inventory levels based on our own projections of future demand. Because of the significant time it takes to acquire commercial quantities of agricultural inputs, purchasing decisions must be made well in advance of sales. An inaccurate forecast of demand can result in the unavailability of agricultural inputs in high demand. Such unavailability may depress sales volumes and adversely affect customer relationships. Conversely, an inaccurate forecast could also result in an over-supply of agricultural inputs which may increase costs, negatively impact cash flow, reduce the quality of inventory and ultimately create write-offs of inventory, which could have a material adverse effect on our business, results of operations and financial condition.
We cannot guarantee that our suppliers will not engage in improper practices, including inappropriate labor or manufacturing practices.
We cannot guarantee that our suppliers’ business operations comply with all applicable laws and regulations relating to working conditions, sustainability, production chain assurance and appropriate safety conditions, or that they will not carry out improper practices relating to such matters to reduce the cost of the products they sell to us.
22
In the event that our suppliers engage in such improper business practices, our customers’ perception of our business may be adversely affected, which may adversely affect our business, results of operations and our reputation.
Moreover, considering Brazilian law and judicial precedent, we may be involved in litigation concerning our suppliers’ inappropriate labor practices, as labor authorities may argue that we failed to adequately supervise our supply chain. This risk is particularly relevant if these suppliers are involved in sensitive labor issues, such as child labor and direct or indirect use of forced labor or modern slavery. Any such litigation could impact our customers’ perception of our business, and adverse decisions may compel us to disburse material amounts in connection therewith, which may adversely affect our business, results of operations and our reputation.
If we are unable to effectively develop the Lavoro Connected Farm platform, our operating results may be affected.
We sell certain products and services over the Internet through the Lavoro Connected Farm platform and through our Minha Lavoro smartphone application, which represents a small but growing percentage of our overall net sales. The success of our Lavoro Connected Farm platform depends on our investment in this platform, consumer preferences and buying trends relating to e-commerce, and our ability to both maintain the continuous operation of our online store and our fulfillment operations and provide a shopping experience that will generate orders and return visits to our online store.
We are also vulnerable to certain additional risks and uncertainties associated with our e-commerce business, including: changes in required technology interfaces; website downtime; increased costs and technical issues; data and system security; and changes in and compliance with applicable federal and state regulations. Our failure to successfully respond to these risks and uncertainties may adversely affect the sales of our Lavoro Connected Farm platform.
Additionally, the success of our Lavoro Connected Farm platform and the satisfaction of our consumers depend on their timely receipt of our products and services. The efficient delivery of our products and services to our consumers requires that our distribution centers have adequate capacity to support the current level of e-commerce operations and any anticipated increased levels that may occur as a result of the growth of our e-commerce business. If we encounter difficulties with our distribution centers, we could face shortages of inventory, resulting in out-of-stock conditions in our online store, which could have a material adverse effect on our business.
We are dependent on third-party service providers in our Lavoro Connected Farm platform.
We utilize numerous third-party service providers in our Lavoro Connected Farm platform, including credit card transaction processing, back office and business process support, information technology production and support, internet connections, network access and cloud computing. A failure by a third-party service provider could expose us to an inability to provide contractual services to our customers in a timely manner. Additionally, if a third-party service provider is unable to provide services, we may incur significant costs to either internalize some of these services or find a suitable alternative. In some cases, certain third-party vendors may be the sole source or one of a limited number of sources of the services they provide for us. It would be difficult and disruptive for us to replace some of our third-party vendors in a timely manner if they were unwilling or unable to provide us with these services in the future (as a result of their financial or business conditions or otherwise), and our business and operations likely would be materially adversely affected. Further, any failure in the performance of our due diligence processes and controls related to the supervision and oversight of these third parties in detecting and addressing conflicts of interest, fraudulent activity, data breaches and cyber-attacks, non-compliance with relevant laws could cause us to suffer financial loss, regulatory sanctions or damage to our reputation.
In addition, we sell certain third-party products or services for commission on the Lavoro Connected Farm platform, such as insurance or credit services. Sellers are responsible for the conditions of sale and delivery of products or services to buyers according to their respective offers. However, if sellers do not comply with their obligations toward buyers, we may be held jointly and severally liable, which could compromise our service indicators, lead to sanctions from regulatory agencies, increase our exposure to litigation, and cause to us to bear certain costs of such products or services to buyers. These events may adversely affect our financial results and our image, as well as the trading price of our Ordinary Shares or cause reputational damage if these events have public repercussion at any level.
23
We may require additional capital in the future, which may not be available on acceptable terms or at all.
In the future, we may need to raise additional capital to fund our expansion (organically or through strategic acquisitions), to obtain new licenses or develop new or enhanced products or services or to respond to competitive pressures. Our ability to raise additional funds will depend on financial, economic and other factors, many of which are beyond our control. For example, financial markets have been negatively impacted by the COVID-19 pandemic and current macroeconomic trends, including high interest rates, rising inflation, and more recently, the government closures of Silicon Valley Bank and Signature Bank and liquidity concerns at other financial institutions, and concerns regarding the potential for local and/or global economic recession. Adequate funding may not be available on terms favorable to us or at all, particularly in light of these conditions. If adequate funds are not available or are not available on acceptable terms, we may not be able to fund our expansion, take advantage of acquisition opportunities, develop or enhance our portfolio of agricultural products and services or respond to competitive pressures, which could have a material adverse effect on our business, results of operations and financial condition.
In addition, if we raise additional funds through the issuance of equity or convertible debt securities, our shareholders will experience dilution and the securities that we issue may have rights, preferences and privileges senior to those of our shares. Any additional funds raised through debt financing will likely require our compliance with restrictive covenants that impose operating and financial restrictions on us, including restrictions on our ability to incur additional indebtedness, create liens, make acquisitions, dispose of assets and make restricted payments, among others. In addition, such indebtedness may require us to maintain certain financial ratios. These restrictions may limit our ability to obtain future financings, to withstand a future downturn in our business or the economy in general, or to otherwise conduct necessary corporate activities. A breach of any such covenant would likely result in a default under the applicable agreement, which, if not waived, could result in acceleration of the indebtedness outstanding. See also “—Risks Relating to Latin America—Disruption or volatility in global financial and credit markets could have a material adverse effect on us.”
Finally, because of the likelihood that our Warrants will expire worthless or may be exercised on a “cashless” basis, we do not intend to rely on the receipt of proceeds from the exercise of Warrants to fund our liquidity and capital resource requirements. See “Item 5. Operating and Financial Review and Prospects—B. Liquidity and Capital Resources.”
We may not be successful in developing biological agricultural products that we offer in the markets in which we operate.
The activities of Agrobiológica, which are part of Crop Care, depend on the research and development of advanced technologies to be used in our biological products. As part of our research and development process, we require a highly qualified and experienced team, laboratories equipped to support basic research tests and the development of efficient industrial processes, investments in partnerships with research and development institutions, third-party service providers to support our efficacy and toxicological tests, storage equipment for our microorganism bank, and support from our agronomic team to carry out field tests with producers. In addition, we must bear the costs of the regulatory process and launch and train our RTVs on the correct way to use our product.
The process of creating new products and technologies is time-consuming, and only a small percentage of our research projects reach the final sales stage. Additionally, launching new products and technologies in the market presents several marketing challenges, as well as risks associated with customer acceptance, since we analyze and make certain assumptions about a given product that may, throughout the development process, not come to fruition. As a consequence, selling new products and technology and implementing sales and distribution strategies may prove ineffective or inadequate. Furthermore, if our competitors are able to develop and execute marketing efforts that are more efficient than ours, our sales could be adversely affected.
The complexity of the approval processes for in the production of our private label products may negatively affect our business and results of operations.
The production process of our private label products must be extensively tested for safety, effectiveness and environmental impact before they can be registered for use or sale in a given market, in accordance with the processes provided for in the applicable regulation. The regulatory approval process is long and complex. Any
24
negative or delayed approval processes for our industrial business could have an adverse effect on our business, financial condition and results of operations.
The COVID-19 pandemic could impact our business, key metrics and results of operations in volatile and unpredictable ways.
Occurrences of epidemics or pandemics, depending on their scale, may cause different degrees of disruption to the regional, state and local economies in which we offer our products and services. While the COVID-19 pandemic in Brazil, Colombia, Uruguay, and worldwide will likely continue to adversely impact national and global economies, the full extent of the impact of the pandemic on our business, key metrics and results of operations depends on future developments that are uncertain and unpredictable, including the duration, severity and spread of the pandemic, its impact on capital and financial markets and any new information that may emerge concerning the virus, vaccines or other efforts to control the virus.
In response to the COVID-19 pandemic, we have implemented additional measures intended to both protect the health and safety of our employees and maintain our ability to provide products to our customers, including (i) requiring a significant part of our workforce to work from home, (ii) monitoring our employees for COVID-19 symptoms, (iii) making additional personal protective equipment available to our operations team, (iv) modifying work methods and schedules of our office and field employees to create distance or add barriers between employees, consumers and others, (v) expanding cleaning efforts at our stores and operation centers, and (vi) modifying attendance policies so that employees may elect to stay home if they have symptoms. While we believe that these efforts should enable us to maintain our operations during the COVID-19 pandemic, we can provide no assurance that we will be able to do so as a result of the unpredictability of the ultimate impact of the COVID-19 pandemic, including the responses of local, state, federal and foreign governmental authorities to the pandemic.
As of the date of this annual report, we believe we have implemented adequate operational measures in order to avoid relevant disruptions to our business. However, we cannot assure you if, and to what extent, our business, results of operations, financial condition and liquidity will be impacted by the COVID-19 pandemic in the future, including regional or global outbreaks, or by national or international aftershocks of the pandemic once controlled, including a recession, slowdown of the economy or increase in unemployment levels. Further, if the COVID-19 pandemic adversely affects our business, results of operations, financial condition and liquidity in the future, many of the other risks described in this “Item 3. Key Information—D. Risk Factors” section may be heightened.
Consumer and government resistance to genetically modified organisms may negatively affect our public image and reduce sales of the genetically modified seeds that we commercialize.
We are active in the commercialization of seeds, and a portion of our seeds product offering includes genetically modified seeds, or GM seeds. These GM seeds are used by farmers to produce GM grains that are generally sold for animal consumption. However, some of these GM grains may be diverted for human consumption. Foods made from such seeds are not accepted by many consumers and in certain countries production of certain GM crops is effectively prohibited for human consumption, including throughout the European Union, due to concerns over such products’ effects on food safety and the environment. The high public profile of biotechnology in food production and lack of consumer acceptance could negatively affect our results of operations.
The prohibition on the production of certain GM crops in select countries, and the current resistance from consumer groups, particularly in Europe, to GM crops, has the potential to spread to and influence the acceptance of products developed through biotechnology in other regions of the world. This may also influence regulators in other countries and lead them to limit or ban the production of GM crops, which could limit the commercial opportunities through biotechnology.
GM crops are grown principally in the United States, Brazil and Argentina where there are fewer restrictions on their production. If any of the countries in which we operate where GM crops are grown enact laws or regulations that ban the production of such crops or make regulations more stringent, we could have to abandon the commercialization of certain seeds or in certain geographies and focus solely on increasing our non-GM seed production, both of which would negatively affect our business and results of operations if we were unable to fully offset this loss with non-GM seed sales. Furthermore, any changes in such laws and regulations or end customers’
25
acceptance of GM crops could negatively impact farmers, who in turn might terminate or reduce their demand for products from us.
If our products become adulterated, misbranded, or mislabeled, we might need to recall those items and may experience product liability claims; food safety and food-borne illness concerns could materially and adversely affect us.
We sell agricultural inputs, including seeds, fertilizers, and crop protection products, among others, for the agricultural industry. Selling products and additives that will be used in products sold for human and animal consumption involves inherent legal and other risks, including product contamination, spoilage, product tampering, allergens, or other adulteration. We could decide to, or be required to, recall the products we sell due to suspected or confirmed product contamination, adulteration, misbranding, mislabeling, tampering, or other deficiencies in our suppliers’ operations. A widespread product recall could result in significant losses due to the costs of a recall, the destruction of product inventory, and lost sales due to the unavailability of a product for a period of time.
We may suffer losses if our products or operations are deemed to violate applicable laws or regulations, or if the products we sold caused injury, illness, or death. Depending on the issue at hand, we may be able to bring suit alleging damages or otherwise seek contribution from third-party product manufacturers, but it may take several years until we receive a definitive judgment on such third-party claim. The availability and price of insurance to cover claims for damages are subject to market forces that we do not control, and such insurance may not cover all the costs of such claims and would not cover damage to our reputation. Moreover, even if a product liability or fraud claim is unsuccessful, has no merit, or is not pursued, the negative publicity surrounding assertions against our products or processes could materially and adversely affect our business, financial condition and results of operations.
The incorrect or off-label use of our private label products may damage our reputation or negatively impact our results.
Our private label products (including liquid fertilizers, biological products and off-patent crop protection products) have been approved for use in agriculture in accordance with the instructions on their respective labels. If farmers, RTVs, other agronomists, or other individuals try to use our products incorrectly and/or as contraindicated, unwanted results and even harm related to the use of our products may arise, which may lead to possible claims against us and, consequently, adversely affect our reputation and results. In addition, the use of our products for indications other than those for which they have been approved could be harmful (including to the fauna, flora and to humans) or inefficient, which could negatively affect our reputation and increase the risk of litigation. Furthermore, the improper use of certain of our products may cause harmful effects to human beings and the environment, including health problems, diseases and contaminations.
If we are deemed to be involved, by any governmental, regulatory or judicial agency, in the promotion of any of our products for off-label uses, such agency may eventually require a change in our training procedures or promotional materials and practices, and we may further be subject to significant fines and penalties at the administrative and judicial level. The imposition of such sanctions could negatively affect our reputation and position in the market, and therefore, could adversely affect our results of operations and financial condition.
Our insurance policies may not be sufficient to cover all claims.
Our insurance policies may not cover all risks to which we are exposed. Courts have levied substantial damages in the United States and elsewhere against a number of companies in the agriculture industry in past years based upon claims for injuries allegedly caused by the use of their products. A significant claim may result in significant expenditures by us.
We depend on key management, as well as our experienced and capable employees, and any failure to attract, motivate and retain our employees could harm our ability to maintain and grow our business.
Our business functions at the intersection of rapidly changing technological, economic and regulatory developments that require a wide-ranging set of expertise and intellectual capital. Our future success is significantly dependent upon the continued service of our executives and other key employees, including our sellers. If we lose
26
the services of any member of management or any key employee, we may not be able to locate a suitable or qualified replacement, and we may incur additional expenses to recruit and train a replacement, which could severely disrupt our business and growth.
To maintain and grow our business, we will need to identify, attract, hire, develop, motivate and retain highly skilled employees, which requires significant time, expense and effort. We may need to invest significant amounts of cash and equity to attract and retain new employees, and we may never realize returns on these investments. In addition, from time to time, there may be changes in our management team that may be disruptive to our business. If our management team, including any new hires that we make, fails to work together effectively and to execute our plans and strategies on a timely basis, our business could be harmed.
Our ability to maintain a competitive position depends on the organizational culture spread by us and the ability to control and keep working with us a sufficient number of professionals who are aligned with our organizational culture and available to assist our clients through proximity and knowledge of the demand for each producer. In addition, our salespeople may take some of all of their respective customer portfolios with them if they leave us, which could harm our business.
Our holding company structure makes us dependent on the operations of our subsidiaries.
As a holding company, our corporate purpose is to invest, as a partner or shareholder, in other companies, consortia or joint ventures in Brazil, where most of our operations are located, and outside of Brazil. Accordingly, our material assets are our direct and indirect equity interests in our subsidiaries, and we are therefore dependent upon the results of operations of and, in turn, the payments, dividends and distributions from, our subsidiaries for funds to pay our operating and other expenses and to pay future cash dividends or distributions, if any, to holders of our shares. In addition, the payments, dividends and distributions from our subsidiaries to us for funds to pay future cash dividends or distributions, if any, to holders of our shares could be restricted under financing arrangements that we or our subsidiaries may enter into in the future, and such subsidiaries may be required to obtain the approval of lenders to make such payments to us. Furthermore, we may be adversely affected if the Brazilian government imposes legal restrictions on dividend distributions by our Brazilian subsidiaries, and exchange rate fluctuations will affect the U.S. dollar value of any distributions our subsidiaries make with respect to our equity interests in those subsidiaries. For further information, see “—Risks Relating to Latin America—Exchange rate instability may impact our ability to hedge exchange rate risk, which may lead to interest rate volatility and have a material adverse effect on the price of our Ordinary Shares,” and “—Risks Relating to Latin America—The Brazilian federal government has exercised, and continues to exercise, significant influence over the Brazilian economy. This influence, as well as Brazil’s political and economic conditions, could harm us and the price of our Ordinary Shares.”
We have a limited operating history as a consolidated company with financial results that may not be indicative of future performance, and our revenue growth rate is likely to slow as our business matures.
Our operations began in 2017, when the Lavoro Group was created. As a result of our limited operating history as a single, consolidated company, which is comprised of a number of pre-existing businesses that were acquired in recent years, our ability to accurately forecast our future results of operations is limited and subject to a number of uncertainties. Our historical revenue growth and other historical results should not be considered indicative of our future performance. In particular, over the long-term, we expect that our revenue growth will slow as our business matures. It is also possible that our revenue growth could decline for a number of reasons, including slowing demand for our products, increasing competition, changes in technology, a decrease in the growth of our overall market, increased regulation or our failure, for any reason, to take advantage of growth opportunities. If our assumptions regarding our future revenue growth and other operating and financial results are incorrect or change, our operating and financial results could differ materially from our expectations.
We and our independent registered public accounting firm have identified material weaknesses in our internal control over financial reporting and, if we fail to implement and maintain effective internal controls over financial reporting, we may be unable to accurately report our results of operations, meet our reporting obligations or prevent fraud.
Prior to the Business Combination, we were a private company with limited accounting personnel and other resources to address our internal control over financial reporting and procedures. Our management has not
27
completed an assessment of the effectiveness of our internal control over financial reporting and our independent registered public accounting firm has not conducted an audit of our internal control over financial reporting.. In connection with the preparation and audit of our consolidated financial statements for the year ended June 30, 2023 we and our independent registered public accounting firm identified a number of material weaknesses in our internal controls over financial reporting as of June 30, 2023. Specifically, (i) inadequate controls around the monthly closing process which resulted in the need to make adjustments to the financial statements; (ii) controls on accounting procedures over revenue recognition, including cutoff procedures and revenue measurement; (iii) controls over the calculation of inventory impairment provisions and (iv) inadequate design of information technology general controls related to management and logical access to prevent the information system from providing complete and accurate information consistent with financial reporting objectives and current needs. Consequently, our business is exposed to risk from potential non-compliance with policies, employee misconduct, negligence and fraud, which could result in regulatory sanctions, civil claims and serious reputational or financial harm. Accordingly, because of the inherent limitations in the control system, misstatements due to error or fraud may occur and not be detected.
We are working on a remediation plan with respect to the material weaknesses identified above, adopting actions such as striving to implement a centralized ERP SAP S/4 Hana and SAP Business One for all subsidiaries, including new subsidiaries as a result of new investments. The implementation of new processes and procedures, include additional levels of review to improve our internal controls procedures, additional training for our staff, changing our internal organizational structure, and enhancing our documentation. There can be no assurance that we will achieve that target or that our remediation efforts and actions we may take in the future will be sufficient to remediate the control deficiencies that led to our material weaknesses in our internal control over financial reporting or that they will prevent or avoid potential future material weaknesses. Any failure to maintain effective internal control over financial reporting could severely inhibit our ability to accurately report our consolidated financial condition or results of operations, which could cause investors to lose confidence in our financial statements, and the trading price of our Ordinary Shares to decline. See “Item 5. Operating and Financial Review and Prospects—A. Operating Results—Material Weakness in Internal Controls and Remediation.”
Under Section 404 of the Sarbanes-Oxley Act of 2002, our management is not required to assess or report on the effectiveness of our internal control over financial reporting in our annual report on Form 20-F for the year ended June 30, 2023. We are only required to provide such a report for the year ended June 30, 2024. At that time, our management may conclude that our internal control over financial reporting is not effective. In addition, we expect our independent registered public accounting firm will be required to attest to and report on the effectiveness of our internal control over financial reporting commencing with our annual report on Form 20-F for the year ended June 30, 2024. Even if our management concludes that our internal control over financial reporting is effective, our independent registered public accounting firm, after conducting its own independent testing, may disagree with our assessment or may issue a report that is qualified if it is not satisfied with our internal controls or the level at which our controls are documented, designed, operated or reviewed, or if it interprets the relevant requirements differently from us. In addition, as a newly-public company, our reporting obligations may place a significant strain on our management, operational and financial resources and systems for the foreseeable future. We may be unable to timely complete our evaluation testing and any required remediation.
During the course of documenting and testing our internal control procedures, in order to satisfy the requirements of Section 404 of the Sarbanes-Oxley Act of 2002, we may identify other deficiencies in our internal control over financial reporting. In addition, if we fail to maintain the adequacy of our internal control over financial reporting, as these standards are modified, supplemented or amended from time to time, we may not be able to conclude on an ongoing basis that we have effective internal control over financial reporting in accordance with Section 404 of the Sarbanes-Oxley Act of 2002. If we fail to achieve and maintain an effective internal control environment, we could suffer material misstatements in our financial statements, fail to meet our reporting obligations or fail to prevent fraud, which would likely cause investors to lose confidence in our reported financial information. This could, in turn, limit our access to capital markets, harm our results of operations, and lead to a decline in the trading price of our Ordinary Shares. Additionally, ineffective internal control over financial reporting could expose us to increased risk of fraud or misuse of corporate assets and subject us to potential delisting from Nasdaq, regulatory investigations and civil or criminal sanctions.
28
Disclosure controls and procedures over financial reporting may not prevent or detect all errors or acts of fraud.
Disclosure controls and procedures, including internal controls over financial reporting, are designed to provide reasonable assurance that information required to be disclosed by the company in reports filed or submitted under the Exchange Act is accumulated and communicated to management, and recorded, processed, summarized and reported within the time periods specified in the SEC’s rules and forms.
These disclosure controls and procedures have inherent limitations, which include the possibility that judgments in decision-making can be faulty and result in errors or mistakes. Additionally, controls can be circumvented by any unauthorized override of the controls. Consequently, our business is exposed to risk from potential non-compliance with policies, employee misconduct, negligence and fraud, which could result in regulatory sanctions, civil claims and serious reputational or financial harm. In particular, is not always possible to deter employee misconduct, and any precautions we take to prevent and detect this activity may not always be effective. Accordingly, because of the inherent limitations in the control system, misstatements due to error or fraud may occur and not be detected. See “—We and our independent registered public accounting firm have identified material weaknesses in our internal control over financial reporting and, if we fail to implement and maintain effective internal controls over financial reporting, we may be unable to accurately report our results of operations, meet our reporting obligations or prevent fraud.”
We may also acquire businesses with unknown liabilities, contingent liabilities, internal control deficiencies or other risks. We have plans and procedures to review potential acquisition candidates for a variety of due diligence matters, including compliance with applicable regulations and laws prior to acquisition. Despite these efforts, realization of any of these liabilities or deficiencies may increase our expenses, adversely affect our financial position or cause us to fail to meet our public financial reporting obligations (including as a result of difficulties in integrating different internal control systems with our existing internal control systems). For more information, see “—Risks Relating to Acquisitions and Financial Information—Any acquisition, partnership or joint venture we make or enter into could disrupt our business and harm our financial condition.”
We may not be able to renew or maintain all our stores and facilities’ leases.
Substantially all of the properties where our stores and certain of our facilities are located are subject to lease agreements. Our lease agreements in Brazil are governed by Law No. 8,245/1991, which establishes that tenants have the right to compulsory renewal of the agreement provided that: (1) the agreement is in writing and has a fixed term; (2) the term of the agreement is no less than five uninterrupted years, including taking into consideration contractual amendments; (3) the lessee engages in activity in the same branch, for the minimum and uninterrupted term of three years; and (4) the lessee files a proceeding requesting renewal within the one year to six months prior to the maturity of the lease. We may be adversely affected if: (1) we are unable to successfully negotiate current or future leases on acceptable terms; (2) we are unable to file proceedings requesting renewals within the statutory period or if we fail to satisfy the conditions listed above; or (3) we are unable to renew leases for properties having material locations or we renewed our leases on less favorable terms than those currently in effect.
We may be forced to vacate the property, or properties, if we fail to reach an agreement on renewal, or if our lessor decides to sell the property and we cannot reach an agreement with the new owner, or if we are unable to negotiate lease agreements on favorable conditions. Even though we do not rely on strategic locations for the success of our operations, and there are alternative lease locations in the markets where we operate, the loss of any of our locations, including by our not renewing or maintaining the leases of our stores or certain of our facilities, may adversely affect our operations, financial results and may impact our activities.
Risks Relating to Acquisitions and Financial Information
Any acquisition, partnership or joint venture we make or enter into could disrupt our business and harm our financial condition.
As part of our growth strategy, we intend to continue to acquire, or form partnerships or joint ventures with, businesses, technologies, services and products as appropriate opportunities arise. Any such transactions involve risks and uncertainties. We must fit them into our long-term growth strategies to generate sufficient value to justify
29
their cost. We may not, however, be able to identify appropriate acquisition, partnership or joint venture targets in the future, and our efforts to identify such targets may result in a loss of time and financial resources. In addition, we may not be able to successfully negotiate or finance such future acquisitions, partnerships or joint ventures successfully or on favorable terms, or to effectively integrate acquisitions into our current business, and we may lose clients or personnel as a result of any such strategic transaction (in particular the clients and personnel of an acquired business).
The process of integrating an acquired business, technology, service or product into our business may divert management’s attention from our core business, and may result in unforeseen operating difficulties and expenditures and generate unforeseen pressures and strains on our organizational culture. Therefore, we may face significant challenges in the process of integrating the operations of any acquired companies with our existing business, such as the inability to manage a greater number of geographically dispersed employees and create and implement efficient uniform controls, procedures and policies, in addition to the incurrence of high or unexpected integration costs. We may acquire companies at various levels of maturity and managed by different internal controls, which could expose us to significant integration risks and increased organizational complexity in order for us to maintain a uniform control environment, including more complex and costly accounting processes and internal controls. Moreover, we may be unable to realize the expected benefits, synergies or developments that we initially anticipate from such a strategic transaction.
Financing an acquisition or other strategic transaction could result in dilution to existing shareholders from issuing equity securities or a weaker balance sheet from using cash or incurring debt, and equity or debt financing may not be available to us on favorable terms, if at all. In addition, in connection with an acquisition, it is possible that the goodwill that has been attributed, or may be attributed, to the target may have to be written down if the valuation assumptions are required to be reassessed as a result of any deterioration in the underlying profitability, asset quality and other relevant matters. There can be no assurances that we will not have to write down the value attributed to goodwill in the future, which would adversely affect our results of operations and net assets.
In addition, risks arising with respect to the historic business and operations of companies we acquire may be different than we anticipate. In particular, we may face contingent liabilities in connection with our acquisitions and joint ventures, including, among others, (1) judicial or administrative proceeding or contingencies relating to the company, asset or business acquired, including civil, regulatory, tax, labor, social security, environmental and intellectual property proceedings or contingencies; and (2) financial, reputational and technical issues, including with respect to accounting practices, financial statement disclosures and internal controls, as well as other regulatory or compliance matters. We may not have identified these risks as part of our due diligence process or may not have appreciated, understood or fully anticipated the extent of the risks associated with the business of these companies and of our acquisitions and integrations. Moreover, although we have the benefit of the indemnification provisions of these agreements, subject to the conditions and limitations set forth therein, our exercise of due diligence and risk mitigation strategies may not anticipate or mitigate the full risks of the acquisitions and the associated costs, including costs and expenses associated with previously unidentified contingencies. We may not be able to contain or control the costs associated with unanticipated risks or liabilities, some of which may not be sufficiently indemnifiable under the relevant acquisition or joint venture agreement, and which could materially and adversely affect our business, liquidity, capital resources or results of operations.
Furthermore, certain proposed acquisitions or other transactions may be subject to the approval of or requirements or conditions imposed by relevant antitrust authorities in the countries in which we currently operate or may operate in the future. For example, Brazilian legislation provides that acquisitions meeting certain requirements must be approved by Brazil’s Administrative Council for Economic Defense (Conselho Administrativo de Defesa Econômica), or CADE, prior to the completion of the acquisition if one of the companies or group of companies involved has gross annual revenues in Brazil of at least R$750.0 million in the year immediately prior to the acquisition and any other party or group of companies involved has gross income of at least R$75.0 million in that same period. As part of this process, CADE must determine whether the specific transaction affects the competitiveness of the market in question or the consumers in such markets. CADE may not approve our future acquisitions or may condition approval of our acquisitions on our disposition of certain of the acquisition target’s operations, or impose restrictions on the operations and commercial activities of the target. In Colombia, the Superintendence of Industry and Commerce (Superintendencia de Industria y Comercio) is responsible for approving economic mergers, acquisitions and integrations between and among enterprises and has the power to
30
impose corresponding sanctions for antitrust violations. Similar entities, rules and sanctions may exist in other Latin American countries into which we plan on expanding. Failure to obtain any required approvals for future acquisitions or to satisfy any relevant conditions or requirements imposed by relevant authorities may result in unforeseen or additional costs and expenses, or may prevent us from consummating potential acquisitions and successfully executing our growth strategy, which could adversely affect our business, growth prospects, results of operations and financial condition.
Finally, the competition for acquisition targets may increase and the terms of the transactions with available targets could become less favorable to us. Our competitors may be willing to pay more than us for acquisitions or investments, which may cause us to lose certain opportunities that we would otherwise desire to complete. Attractive transactions could also become scarcer for other reasons, such as economic or industry sector downturns, geopolitical tensions, or increases in the cost of additional capital needed. This could increase the cost of, delay or otherwise complicate or frustrate our ability to find and consummate an acquisition, and may result in our inability to consummate an acquisition on terms favorable to us. We cannot assure you that any acquisition, partnership or joint venture we make will not have a material adverse effect on our business, financial condition and results of operations.
Our recent acquisitions and the comparability of our results may make it difficult for investors to evaluate our business, financial condition, results of operations and prospects.
Our recent acquisitions may make it difficult for you to evaluate our business, financial condition, results of operations and prospects. Because the historical financial information included elsewhere in this annual report may not be representative of our results as a consolidated company, investors may have limited financial information on which to evaluate us, their investment decision and our prior performance. Our historical results of operations for the fiscal year ended June 30, 2023 are not directly comparable to our results of operations for the fiscal years ended June 30, 2022 and 2021 due to the effects of the acquisitions.
Our ability to forecast our future operating results, including revenue, cash flows and profitability, as well as the operational inefficiencies that we may face as we continue to integrate the companies acquired pursuant to these transactions, is limited and subject to a number of uncertainties. Moreover, past performance is no assurance of future returns.
Risks Relating to Legal and Regulatory Matters, Privacy, Litigation and Cybersecurity
Our business and the commercialization of our products are subject to various government regulations and agricultural, environmental, health and safety authorities and industry standards, and we or our collaborators may be unable to obtain, or may face delays in obtaining, necessary regulatory approvals.
We are subject to extensive federal, state and municipal laws, including agricultural, environmental, health and safety laws and regulations in Brazil and in other countries in which we operate. These laws and regulations govern a wide range of matters, including protection of human health, environmental and agricultural controls, land reclamation, the safety of our employees, discharges to air and water, and remediation of hazardous substance releases, among others. We are also required to obtain certain licenses, grants, registrations and authorizations issued by government authorities for certain aspects of our operations.
We are responsible for applying for and maintaining the regulatory approvals and registrations before agricultural and health agencies required for the commercialization of our agricultural products, in particular agrochemicals, fertilizers, and seeds. Additionally, we are responsible for hiring and maintaining responsible technicians in each of our facilities, who are responsible for the facility’s activities relating to agricultural products. We are also required to maintain annotations and certificates that prove the regularity of the responsible technician before the relevant work councils, and the legal relationship between the responsible technician and its respective facility. We may face difficulties in obtaining regulatory approvals in jurisdictions in which we have not previously operated or in which we have limited experience, or as a result of other specificities of the jurisdiction in which the approval is issued. In addition, for the granting and/or renewal of certain licenses, the competent authorities may determine that we make changes in our operations and facilities, causing us to incur additional costs. We may also struggle to hire and maintain responsible technicians for each of our facilities that handle agricultural products. Failure to comply with agricultural and health laws can lead to civil, criminal, and administrative liability, which
31
may include penalties such as the apprehension or destruction of products, a ban on advertisement, the suspension or cancellation of licenses and authorizations, the temporary or definitive embargo of our facilities, and fines of up to R$3.0 million, which could adversely affect our operations.
Moreover, in some jurisdictions, environmental laws change frequently and it may be difficult for us to determine if we are in compliance with all material environmental laws at any given time. If we are not in compliance, we may be subject to enforcement or third-party claims, and may require new investment in our business. In those circumstances, our financial condition and results of operations may be materially adversely affected. Failure to comply with environmental laws can subject us to civil, criminal and administrative liability. Specifically, in the civil sphere, Brazilian environmental laws provides for strict and joint civil liability, which means that we can be held fully responsible for environmental damages that have been caused within our chain of activities, regardless of whether we acted with fault. Courts have concluded that statutes of limitation are not applicable in those instances. In the administrative sphere, environmental fines can reach up to R$50.0 million, and may be accompanied by other administrative sanctions such as a ban on distributing products, a suspension on product manufacturing and sale, a suspension of our activities, a suspension of tax benefits and the cancellation or interruption of governmental credit facilities. Moreover, we may be subject to criminal liability under the applicable environmental law for any criminal action or omission, which may lead to (i) the interruption of our activities in whole or in part, (ii) a temporary shutdown of our facilities, of construction work or of our activity, and (iii) a ban on contracting with governmental authorities and obtaining governmental subsides, incentives or donations. More serious cases can lead to the arrest of officers and managers, impacting both our management capacity and our image. In addition to the application of environmental laws in Brazil, we are subject to several obligations, such as obtaining and maintaining different types of licenses and authorizations issued by regulatory bodies, as well as observing various technical specifications regarding their products and services. Failure to comply with or comply with these laws, regulations, licenses or authorizations may result in penalties, for example, fines and an obligation to compensate for environmental damage or even suspend our activities, which could adversely affect our results of operations, and result in the cancellation of the environmental license.
With respect to human health and worker safety, new laws and regulations may increase expenses to comply with health and safety regulations resulting in additional costs, which may have an adverse effect on our operating and financial results. In addition, we depend on positive perceptions of the safety and quality of our products, in general, from our customers and final consumers, and the lack of such perceptions regarding the handling of our agricultural input products could harm the marketing of our products and our reputation. These issues and the losses related to them may adversely affect our results of operations and financial condition.
Our operations are subject to various health and environmental risks associated with our production, handling, transportation, storage and commercialization.
We are subject to restrict federal, state, municipal and foreign environmental, health and safety laws and regulations, including those governing laboratory procedures, the handling, use, storage, treatment, manufacture and disposal of hazardous materials and wastes, discharge of pollutants into the environment and human health and safety matters, mainly for our agrichemical portfolio. Considering that part of our portfolio involves chemical-related products, we are required to comply with regulations enacted by the Brazilian Institute of the Environment and Renewable Natural Resources (Instituto Brasileiro do Meio Ambiente e dos Recursos Naturais Renováveis), by state and local environmental agencies, by the Brazilian Health Surveillance Agency (Agência Nacional de Vigilância Sanitária), ANVISA, and by the Brazilian Ministry of Agriculture (Ministério da Agricultura, Pecuária e Abastecimento), MAPA, and with state and municipal regulations and authorities and official agencies, which are responsible for approving the products themselves, as well as the wording for warnings and procedure for use on ours labels and leaflet.
Furthermore, as chemical and flammable materials are used in our agricultural input products, we are subject to operational risks, including the risk of environmental contamination or even death and bodily harm to employees and service providers, which could result in administrative, civil and criminal liability for us, as well as criminal liability for our officers and employees.
Brazilian legislation is generally in accordance with internationally recognized agencies such as the European Food Safety Authority and the Food and Agriculture Organization, or the FAO. Our sales and use recommendation
32
are restricted to those established on labels and leaflets approved by authorities. If we fail to comply with the approved labels and leaflets, we could incur substantial costs and liabilities, including civil or criminal fines and penalties.
Environmental, health and safety and food and agricultural input laws and regulations to which we are subject may become more stringent over time. This could increase the effects on us of these laws and regulations, and the increased effects could be materially adverse to our business, operations, liquidity and/or results of operations.
Heightened regulation on food and agricultural inputs and environmental, health and safety issues in Brazil, Colombia and other Latin American countries where we may operate can be expected to result in requirements that apply to us and our operations that may be more stringent than those described elsewhere in this annual report. These requirements may include:
•increased levels of future investments and expenditures for environmental controls at ongoing operations, which will be charged against income from future operations;
•increased efforts or costs to obtain permits or denial of permits;
•new interpretations of existing statutes or regulations that impose new or more stringent standards; and
•other matters that could increase our expenses, capital requirements or liabilities, or adversely affect our business, liquidity or financial condition.
Trade agreements, foreign trade or environmental, health and safety, and food and agricultural inputs laws of countries importing Latin American agricultural production, especially Brazil, may, in the short and medium term, impose measures restricting access to such countries’ markets as a result of an actual or perceived non-conformity with matters relating to socio-environmental norms, rules or regulations, such as deforestation and increased greenhouse gas emissions associated with certain crops. The potential emergence of international barriers to Brazilian commodities exports because of an actual or perceived lack of deforestation control in Brazil may limit our ability to expand our business and our barter operations, e.g., in the event we are unable to adequately demonstrate traceability of grains (in particular soybeans and corn) and other products’ origination or their compliance with environmental requirements.
We may be liable for labor charges and disbursements if our sales representatives are considered to be our employees.
We and our subsidiaries, with the exception of Produtec Comércio e Representações S.A., Integra Soluções Agrícolas Ltda., and Qualiciclo Agrícola S.A., or Qualicitrus, engage all of our employees pursuant to employment relationships under Brazilian law. However, these three subsidiaries currently engage a minority of employees as third-party contractors or commercial representatives, particularly in the case of our RTVs. There is a risk, depending on how services are rendered in practice by each representative, that such RTVs or other governmental authorities could claim that an employment relationship between such subsidiaries and our RTVs exists, on a case-by-case basis, and thereby seek reclassification of such persons as employees—especially if they render services exclusively to us and under our exclusive control. Reclassification would mean that we would be liable for a series of labor charges and disbursements that we currently do not pay to our RTVs. Even if no such employment relationship is asserted, we may be deemed vicariously liable to pay the employees or agents of our RTVs if the latter become insolvent. In either event, any such disbursements may adversely affect our business, results of operations and our reputation.
Changes in tax laws, incentives, benefits and regulations may adversely affect us.
Changes in tax laws, regulations, related interpretations and tax accounting standards in Brazil, Colombia, the Cayman Islands or the United States may result in a higher tax rate on our earnings, which may significantly reduce our profits and cash flows from operations. For example, in 2015 the Brazilian government increased the rate of the social integration program contribution (Programa Integração Social), or PIS, and the social security program contribution (Contribuição para o Financiamento da Seguridade Social), or COFINS (both social contributions on
33
gross revenues) from 0% to approximately 4.65% on financial income realized by Brazilian companies that are taxed under the non-cumulative regime (which is the tax regime that applies to us). However, it is not possible to precisely predict if and how potential changes may affect our business, but one or more states, municipalities, the federal government or other countries may seek to challenge the taxation or procedures applied to our transactions, and could impose taxes or additional reporting, record-keeping or indirect tax collection obligations on our business. New taxes could also require us to incur substantial costs to collect and remit taxes. If such obligations were imposed, the additional costs associated with tax collection, remittance and audit requirements could have a material adverse effect on our business and financial results. In addition, our profits may decline if certain tax incentives are not retained or renewed.
Further, Brazilian government authorities at the federal, state and local levels may consider changes in tax laws to cover budgetary shortfalls resulting from the recent economic downturn in Brazil, including the impact of COVID-19. If enacted, such changes may harm our profitability by increasing our tax burden, increasing our tax compliance costs or otherwise affecting our financial condition, results of operations and cash flows. The Brazilian government regularly enacts reforms to the tax and other assessment regimes to which we and our customers are subject. Such reforms include changes in tax rates and, occasionally, enactment of temporary levies, the proceeds of which are earmarked for designated governmental purposes. The effects of these changes and any other changes that result from the enactment of additional tax reforms cannot be quantified and there can be no assurance that any such reforms would not have an adverse effect upon our business. Furthermore, such changes may produce uncertainty in the financial system, increasing the cost of borrowing and contributing to an increase in our non-performing credit portfolio.
Recently, Brazilian government initiatives have proposed changes to the Brazilian tax regime—in particular, the reform of consumption and income taxes—that, if enacted, could impact our business. Ongoing discussions include replacing certain existing taxes, imposing withholding tax on the distribution of dividends (which are currently exempt from income taxation), increasing certain taxes levied on financial revenues, among other provisions. Nonetheless, it is not clear when or whether such a tax reform may ultimately be enacted. On July 6, 2023, the Brazilian Congress approved a constitutional amendment that would replace (i) PIS and COFINS with a single federal contribution over goods and services (contribuição sobre bens e serviços), (ii) ICMS and the municipal tax on services (imposto sobre serviços) with a single state tax (imposto sobre bens e serviços, and (iii) would replace the federal tax on industrialized goods (imposto sobre produtos industrializados) with an excise tax (imposto seletivo). This amendment is now expected to be reviewed and voted on by the Brazilian Senate in the coming months. In addition, proposed Bill No. 2,337/2021 would comprehensively reform income taxation rules primarily by revoking the income tax exemption on the distribution of dividends by Brazilian companies while also introducing new anti-avoidance provisions for a broad variety of transactions among related parties, ending the deductibility of interest on equity expenses, extending the minimum term for the amortization of intangibles, and changing the income tax rules related to Brazilian investment funds, among other changes. More specifically, ending the deductibility of interest on equity would impact the net amount to be received by our shareholders in the form of dividends. Although these laws have not yet been enacted and it is not possible to determine at this time the exact changes that will eventually pass into law, any such changes could have adverse effects on our results and operations.
In addition, establishing a provision for income tax expense and filing returns requires us to make judgments and interpretations about the application of inherently complex tax laws, and in particular Brazilian income tax laws, which are subject to different interpretations by the taxpayer and relevant governmental tax authorities. If the judgments, estimates and assumptions we use in preparing our tax returns are subsequently found to be incorrect, we could become involved in a dispute with the relevant authority, which in Brazil can involve prolonged evaluation periods and litigation before a final resolution is reached, and which introduces further uncertainty and risk with respect to our tax and related liabilities.
Finally, Colombian tax authorities have imposed additional taxes in a variety of areas, such as taxes on financial transactions, to fund Colombia’s war against terrorism and taxes created in order to fund post-conflict programs related to the peace negotiations with guerrilla forces. The Colombian government is also obliged by Law No. 1,473/2011, also known as the Law of Fiscal Rule, to significantly reduce its fiscal deficit over the following years. This, in addition to pressure from rating agencies, could lead to higher taxation rates on our business and that of our borrowers. Changes in tax-related laws and regulations, and interpretations thereof, can impact tax burdens by
34
increasing tax rates and fees, creating new taxes, limiting tax deductions, and eliminating tax-based incentives and non-taxed income. In addition, tax authorities or courts may interpret tax regulations differently than we do, which could result in tax litigation and associated costs and penalties.
We are subject to anti-corruption, anti-bribery and anti-money laundering laws and regulations.
We operate in jurisdictions that have a high risk for corruption and we are subject to various anti-corruption, anti-bribery and anti-money laundering laws and regulations, including the Brazilian Federal Law No. 12,846/2013, also known as the Clean Company Act (and Decree No. 11,129/2022 that regulates the Clean Company Act), Brazilian Federal Law No. 9,613/1998, as amended by Brazilian Federal Law No. 12,683/2012, and Brazilian Federal Law No. 8,429/1992, as amended by Brazilian Federal Law No. 14,230/2022, in addition to the United States Foreign Corrupt Practices Act of 1977, as amended, or the FCPA. Both the Clean Company Act and the FCPA impose liability against companies who engage in bribery of government officials, either directly or through intermediaries.
Anti-corruption laws are interpreted broadly and prohibit us and our collaborators from authorizing, offering, or directly or indirectly providing improper payments or benefits to recipients in the public or private sector. We or our collaborators may have direct and indirect interactions with government agencies and state-affiliated entities and universities in the course of our business. We use third-party collaborators, and strategic partners, law firms, and other representatives for regulatory compliance, patent registration, deregulation advocacy, field testing, and other purposes in countries that are known to present a high corruption risk such as Brazil and Colombia. We can be held liable for the corrupt or other illegal activities of these third-party collaborators, our employees, representatives, contractors, partners, and agents, even if we do not explicitly authorize such activities.
Anti-money laundering, anti-bribery, anti-corruption and sanctions laws and regulations to which we are subject require us, among other things, to conduct full customer due diligence (including sanctions and politically exposed person screening) and keep our customer, account and transaction information up to date. We have implemented and are in the process of reviewing our policies and procedures detailing what is required from those responsible, but all such policies may not be completed or may not be fully in effect as of the date of this annual report (in particular, our policies relating to sanctions laws and regulations). In addition, we rely heavily on our employees to assist us by spotting such illegal and improper activities and reporting them, and our employees have varying degrees of experience in recognizing criminal tactics and understanding the level of sophistication of criminal organizations. In addition, we rely upon our relevant counterparties to a large degree to maintain and appropriately apply their own appropriate compliance measures, procedures and internal policies. Accordingly, there can be no assurance that all of our employees, representatives, contractors, partners, or agents will comply with these laws at all times. If we are unable to apply the necessary scrutiny and oversight of employees, third parties to whom we outsource certain tasks and processes or counterparties, we increase the risk of regulatory breach.
Violations of – or even accusations of or associations with violations of – anti-corruption, anti-bribery and anti-money laundering laws and regulations could result in criminal liability, administrative and civil lawsuits, significant fines and penalties (including being added to “blacklists” that would prohibit certain parties from engaging in transactions with us), forfeiture of significant assets and reputational harm. Non-compliance with these laws could subject us to whistleblower complaints, investigations, sanctions, settlements, prosecution, injunctions, suspension and debarment from contracting with certain governments or other persons, the loss of export privileges, reputational harm, adverse media coverage, and other collateral consequences. If any subpoenas or investigations are launched, or governmental or other sanctions are imposed, or if we do not prevail in any possible civil or criminal litigation, our business, results of operations, and financial condition could be materially harmed. In addition, responding to any action will likely result in a materially significant diversion of management’s attention and resources and significant defense costs and other professional fees. Enforcement actions and sanctions could further harm our reputation, business, results of operations, and financial condition.
If any person in the Cayman Islands knows or suspects, or has reasonable grounds for knowing or suspecting that another person is engaged in criminal conduct or money laundering, or is involved with terrorism or terrorist financing and property, and the information for that knowledge or suspicion came to their attention in the course of business in the regulated section, or other trade, profession, business or employment, the person will be required to report such knowledge or suspicion to (i) the Financial Reporting Authority of the Cayman Islands, or the FRA,
35
pursuant to the Proceeds of Crime Act (As Revised) of the Cayman Islands, if the disclosure relates to criminal conduct or money laundering, or (ii) a police officer of the rank of constable or higher, or the FRA, pursuant to the Terrorism Act (As Revised) of the Cayman Islands, if the disclosure related to involvement with terrorism or terrorist financing and property. Such report shall not be treated as a breach of confidence or of any restriction upon the disclosure of information imposed by any enactment or otherwise.
Adverse outcomes in legal proceedings could subject us to substantial damages and adversely affect our results of operations and profitability.
The agricultural inputs industry faces substantial regulatory risks and litigation. From time to time, we may be involved in major lawsuits concerning regulatory, intellectual property, biotechnology, torts, contracts, antitrust allegations, civil and tax claims and other matters, as well as governmental inquiries and investigations, including in connection with a criminal case involving our subsidiary Agrobiológica Soluções. See “Item 8. Financial Information—Consolidated Statements and Other Financial Information—Legal Proceedings.” Pending and future lawsuits and governmental inquiries and investigations may have outcomes that may be significant to our results of operations in the period recognized or limit our ability to engage in our business activities. We have recorded reserves for potential liabilities where we believe the liability to be probable and reasonably estimable, in accordance with accounting requirements under IFRS. However, our actual costs may be materially different from this estimate. The degree to which we may ultimately be responsible for the particular matters reflected in the reserve is uncertain. We had provisions for civil, tax and labor contingencies amounting to R$8.8 million and R$3.0 million as of June 30, 2023 and 2022, respectively.
If our suppliers or outsourced service providers do not comply with their respective civil, administrative, labor and social security obligations, we may be jointly or severally liable for any non-compliance, resulting in fines, payment of these amounts and other sanctions, in accordance with labor and agricultural law. In addition, we may be liable for possible bodily injury and even the death of employees of our suppliers or outsourced service providers, in cases where such service providers do not observe or do not inspect the fulfillment of obligations related to the personal protection of their employees, which may adversely affect our results of operations and our reputation.
We are subject to costs and risks associated with increased or changing laws and regulations affecting our business, including those relating to data privacy, security and protection.
We operate in a complex regulatory and legal environment that exposes us to compliance and litigation risks that could materially affect our business, financial condition or results of operations. These laws may change, sometimes significantly, as a result of political, economic or social events. Responding to these changes and meeting existing and new requirements may be costly and burdensome. Changes in laws and regulations may occur that could:
•discourage us and other collaborators from offering, and end-markets from purchasing, our products;
•increase our export and import duties and costs or intensify controls and restrictions on our imports;
•restrict or increase the costs of making payments and distributions;
•render our technology less profitable or less attractive compared to that of competing products;
•require significant product redesign or redevelopment;
•increase our compliance and other costs of doing business through increases in the cost to protect our intellectual property, including know-how, trade secrets and regulatory data, or increases in the cost to obtain the necessary regulatory approvals to commercialize and market the products we develop directly or jointly; and
•impair or eliminate our ability to source technology and develop our products, including validating our products through field trials and passing biosafety evaluations.
36
Any of these events could have a material adverse effect on our business, results of operations and financial condition.
In addition to the laws and regulations governing our operations in the agricultural inputs industry, some of the federal, state or local laws and regulations that affect us include those relating to consumer products, product liability or consumer protection; those relating to the manner in which we advertise, market or sell products; labor and employment laws, including wage and hour laws; tax laws or interpretations thereof; data protection and privacy laws and regulations; and other health and safety laws and regulations. See “Item 4. Information on the Company—B. Business Overview—Regulatory Overview” for more information. We face significant compliance costs and risk of non-compliance with respect to these existing laws and regulations, which costs and risks could be heightened by changes and developments with respect to such laws and regulations. There can be no guarantee that we will be able to adapt our business, or have sufficient financial resources, to comply with any new regulations, or that we will be able to successfully compete in the context of a shifting regulatory environment.
In particular, data protection and privacy laws are developing rapidly to take into account the changes in cultural and consumer attitudes towards the protection of personal data. In operating our e-commerce business and selling our products and solutions to customers, we collect, use, store, transmit and otherwise process employee and customer data, including sensitive personal data, in and across multiple jurisdictions. As a result, we are subject to a variety of laws and regulations in Brazil, Colombia and other applicable countries, as well as contractual obligations, regarding data privacy, security and protection. In many cases, these laws and regulations apply not only to third-party transactions, but also to transfers of information between or among us, our subsidiaries and other parties with which we have commercial relationships.
Privacy, information security, and data protection are significant issues globally. The regulatory framework governing the collection, processing, storage, use and sharing of certain information, particularly financial and other personal data, is rapidly evolving and is likely to continue to be subject to uncertainty and varying interpretations. The occurrence of unanticipated events and the development of evolving technologies often rapidly drive the adoption of legislation or regulation affecting the use, collection or other processing of data and the manner in which we conduct our business. Any failure or perceived failure by us to comply with our privacy policies or any applicable privacy, security or data protection, information security or consumer-protection related laws, regulations, orders or industry standards in one or more jurisdictions could expose us to costly litigation, significant awards, fines or judgments, civil and criminal penalties or negative publicity, and could materially and adversely affect our business, financial condition and results of operations.
In particular, on August 14, 2018, the President of Brazil approved Law No. 13,709 the Brazilian General Data Protection Law (Lei Geral de Proteção de Dados), or the LGPD, which came completely into force on August 1, 2021. The LGPD is a comprehensive data protection law establishing general principles and obligations that apply across multiple economic sectors and contractual relationships. The LGPD applies to individuals or legal entities, private or government entities, who process personal data in Brazil or collect personal data in Brazil or, further, when the processing activities have the purpose of offering or supplying goods or services to data subjects located in Brazil. The LGPD establishes detailed rules for the collection, use, processing, storage and any operation carried out with personal data (including personal data of clients, suppliers and employees), and affects all economic sectors, including the relationship between customers and suppliers of goods and services, employees and employers and other relationships in which personal data is collected, whether in a digital or physical environment.
Specifically, the LGPD establishes, among other things, data subjects’ rights, the legal basis for personal data protection, requirements for obtaining consent from data owners, obligations and requirements related to security incidents, data leaks and international data transfers, as well as the creation of the National Data Protection Authority (Autoridade Nacional de Proteção de Dados, “ANPD”), for the purposes of monitoring, implementing and supervising compliance with the LGPD in Brazil. In the event of non-compliance with the LGPD, we may be subject to penalties, including (1) warnings, with the impositions of a deadline for the adoption of corrective measures; (2) a one-time fine of up to 2% (subject to an upper limit of R$50,000,000) of our revenue; (3) a daily fine (subject to an upper limit of R$50,000,000); (4) public disclosure of the violation; (5) the restriction of access to the personal data to which the violation relates, until corrective measures are implemented; (6) deletion of the personal data to which the violation relates; (7) partial suspension of the databases to which the violation relates for up to six months, which can be extended for an equal period until corrective measures are implemented; (8) suspension of the
37
personal data processing activities to which the violation relates for up to 12 months; and (9) partial or full prohibition on personal data processing activities. In addition, the LGPD creates a private cause of action, which means we are subject to both class-based and individual claims for violations of the LGPD.
While we are in the process of putting in place systems and processes to comply with the LGPD, we cannot assure you that our LGPD compliance efforts will be deemed appropriate or sufficient by regulatory authorities, in particular ANPD or by courts, such as the Brazilian Public Prosecution Office (Ministério Público). Moreover, as the LGPD requires further regulation from the ANPD regarding several aspects of the law, which are yet unknown, and we may have difficulty adapting our systems and processes to the new legislation due to the legislation’s complexity. The changes have impacted, and could further adversely impact, our business by increasing our operational and compliance costs.
In December 2022, we performed a maturity review based on US National Institute of Standards and Technology, or NIST, frameworks and we achieved an overall score of 3.65 (Policy), 3.32 (Practice) for Cyber Security (CSF) and 3.21 (Policy), 3.02 (Practice) for Privacy. The recommended target score is 3 (Defined), signifying that processes have become formal, standardized, and defined. We believe this helps create consistency across our organization. This review was conducted by BoxGroup, an independent firm.
Any additional privacy laws, rules or regulations enacted or approved in Brazil or in other jurisdictions in which we operate could cause us to incur costs to correct the breaches or failures, expose us to uninsured liability, increase our risk of regulatory scrutiny, subject us to lawsuits and administrative procedures, and result in the imposition of material penalties and fines under state and federal laws or regulations, which could seriously harm our business, financial condition or results of operations. Any failure, real or perceived, by us to comply with our privacy policies or with any regulatory requirements or orders or other local, state, federal or international privacy or consumer protection-related laws and regulations could cause customers to reduce their purchases of our agricultural products and services and could materially and adversely affect our business.
For more information, see “Item 4. Information on the Company—B. Business Overview—Regulatory Overview—Brazil—Data Protection and Privacy.”
We may face restrictions and penalties under Brazilian and Colombian consumer protection laws.
Brazil has a series of strict consumer protection statutes, collectively known as the Consumer Protection Code (Código de Defesa do Consumidor) and Civil Code, that are intended to safeguard consumer interests and that apply to all companies in Brazil that supply products or services to Brazilian consumers. The Consumer Protection Code may apply to business customers if they are considered the “end user” of the products provided. Regardless, courts may understand that the rules of the Consumer Protection Code should exceptionally apply to instances where the company acquiring the products as input to its supply chain are considered to be technically, legally and/or financially vulnerable towards us. Similar protections exist in Colombia, where we are subject to laws that regulate competition and consumer protection, and which include the Consumer Protection Law (Ley de Protección al Consumidor), which is enforced by the Superintendence of Industry and Commerce (Superintendencia de Industria y Comercio). These consumer protection provisions include protection against misleading and deceptive advertising, protection against coercive or unfair business practices and protection in the formation and interpretation of contracts, usually in the form of civil liabilities and administrative penalties for violations. In addition, the Consumer Protection Code provides for a series of contractual clauses that are held null and void by operation of law, whenever they reduce or limit its liability towards consumers; entail a waiver or disposal of rights; transfer liability to third parties; establish obligations considered inequitable or abusive that place the consumer at an unreasonable disadvantage; or that are incompatible with good faith or equitable practices; among others.
In Brazil, penalties are often levied by the Brazilian Consumer Protection Agencies (Fundação de Proteção e Defesa do Consumidor, or PROCONs) and Public Prosecutors Office, which oversee consumer issues on a district-by-district basis. Companies that operate across Brazil may face penalties from multiple PROCONs, as well as the National Secretariat for Consumers (Secretaria Nacional do Consumidor, or SENACON). Companies may settle claims made by consumers via PROCONs and Judiciary by paying compensation for violations directly to consumers and through a mechanism that allows them to adjust their conduct, called a conduct adjustment agreement (Termo de Ajustamento de Conduta, or TAC). Brazilian Public Prosecutor Offices may also commence
38
investigations related to consumer rights violations and this TAC mechanism is also available for them. Companies that violate TACs face potential automatic fines. Brazilian Public Prosecutor Offices may also file public civil actions against companies in violation of consumer rights, seeking strict observation to the consumer protection law provisions and compensation for the damages consumers may have suffered.
As of June 30, 2023, we had 15 active proceedings with ordinary civil courts in Brazil relating to consumer rights and clients’ rights. To the extent consumers in Brazil or Colombia file such claims against us in the future, we may face reduced revenue due to refunds and fines for non-compliance that could negatively impact our results of operations.
Unauthorized disclosure of sensitive or confidential customer information or our failure or the perception by our customers that we failed to comply with privacy laws or properly address privacy concerns could harm our business and standing with our customers.
We collect, store, handle, transmit, use and otherwise process certain personal data and other user data in our business, especially as a result of our e-commerce digital distribution platform. A significant risk associated with our operations is the secure transmission of confidential information over public networks. The perception of privacy concerns, whether or not valid, may harm our business and results of operations. We must ensure that all collection, use, storage, dissemination, transfer, disposal and any other processing activity involving personal data for which we are responsible comply with relevant data protection and privacy laws. The protection of our customer, employee and company data is critical to us. We rely on commercially available systems, software, tools and monitoring to provide secure processing, transmission and storage of confidential customer information, such as credit card and other personal data. Despite the security measures we have in place, our facilities and systems, and those of our third-party service providers, may be vulnerable to security breaches, acts of vandalism, computer viruses, misplaced or lost data, programming or human errors or other similar events. Any security breach, or any perceived failure involving the misappropriation, loss or other unauthorized disclosure of confidential information, as well as any failure or perceived failure to comply with laws, policies, legal obligations or industry standards regarding data privacy and protection, whether by us or our vendors, could damage our reputation, expose us to administrative procedures and litigation risk and liability, subject us to negative publicity, disrupt our operations and harm our business. Our security measures may fail to prevent security breaches, which could harm our business, financial condition and results of operations.
Unauthorized disclosure of, improper access to, or destruction or modification of data, through cybersecurity breaches, computer viruses or otherwise, or disruptions to our systems or services could expose us to liability, protracted and costly litigation and damage our reputation.
Our Lavoro Connected Farm platform involves the collection, storage, transmission and other processing activities involving customers’ personal data, including names, addresses, identification numbers and bank account numbers. We also have arrangements in place with certain third-party service providers that require us to share certain consumer information. Our and such third parties’ ability to protect such personal data and consumer information is dependent on our ability to prevent cybersecurity breaches and unauthorized access and disclosure.
An increasing number of organizations, including large clients and businesses, large technology companies, financial institutions and government institutions have disclosed breaches of their information security systems, some of which have involved sophisticated and highly targeted attacks, including on portions of their websites, networks or infrastructure, or those of third parties who provide services to them. Information security risks for companies with e-commerce operations such as ours in particular have significantly increased recently, in part because of new technologies, the use of the Internet and telecommunications technologies (including mobile devices) to conduct business transactions and the increased sophistication and activities of organized crime, hackers, terrorists and other external parties. Because of our position in the payments value chain, we believe that we are likely to continue to be a target of such threats and attacks. In addition, due to the growing size and complexity of our digital platform and services, the amount of personal data and other data that we store and the number of customers, employees and third-party providers with access to personal data and other data, we are potentially vulnerable to a variety of intentional and inadvertent cybersecurity attacks and other security-related incidents and threats, which could result in a material adverse effect on our business, financial condition and results of operation.
39
The techniques used to obtain unauthorized, improper or illegal access to our systems, our data or our customers’ data, to disable or degrade service, or to sabotage systems are constantly evolving may be difficult to detect quickly and often are not recognized until launched against a target. Unauthorized parties may attempt to gain access to our systems or facilities through various means, including, among others, hacking into our systems or those of our customers, partners or vendors, attempting to fraudulently induce our employees, customers, partners, vendors or other users of our systems into disclosing user names, passwords, payment card information or other sensitive information, which may in turn be used to access our information technology systems, or installing malicious software. Certain efforts may be supported by significant financial and technological resources, making them even more sophisticated and difficult to detect.
Although we have developed systems and processes that are designed to protect our networks, applications, bank accounts and the confidentiality, integrity and availability of data and customer data and our information technology systems and to prevent data loss and other security breaches, and expect to continue to expend significant additional resources to bolster these protections, these security measures cannot provide absolute security and there can be no assurance that our safety and security measures (and those of our third-party providers) will prevent damage to, or interruption or breach of, our information systems and operations. Our information technology and infrastructure may be vulnerable to cyberattacks or security breaches, and third parties may be able to access our customers’ personal or proprietary information and card data that are stored on or accessible through those systems. In addition to traditional computer “hackers,” malicious code (such as viruses and worms), phishing, ransomware, social engineering attacks, unauthorized access or misuse and denial-of-service attacks, sophisticated criminal networks as well as nation-state and nation-state supported actors now engage in attacks, including advanced persistent threat intrusions. Our security measures may also be breached due to human error, malfeasance, fraud or malice on the part of employees, accidental technological failures, system errors or vulnerabilities, or other irregularities.
Any actual or perceived cybersecurity attacks, security breaches, phishing attacks, ransomware attacks, computer malware, computer viruses, computer hacking attacks, unauthorized access, coding or configuration errors or similar incidents experienced by us or our third-party service providers could interrupt our operations, result in our systems or services being unavailable, result in the loss, compromise corruption or improper disclosure of data or personal data, subject us to regulatory or administrative investigations and orders, litigation, disputes, sanctions, indemnity obligations, damages for contract breach or penalties for violation of applicable laws or regulations, impair our ability to provide our solutions and meet our customers’ requirements, materially harm our reputation and brand, result in significant legal and financial exposure (including customer claims), lead to loss of customer confidence in, or decreased use of, our products and services, and adversely affect our business, financial condition and results of operations. In addition, any breaches of network or data security at our customers, partners or third-party service provides (including data center and cloud computing providers) could have similar negative effects. We could be forced to expend significant financial and operational resources in response to a security breach, including repairing system damage, increasing security protection costs by deploying additional personnel and modifying or enhancing our protection technologies, investigating and remediating any information security vulnerabilities and defending against and resolving legal and regulatory claims, all of which could divert resources and the attention of our management and key personnel and materially and adversely affect our business, financial condition and results of operations.
Specifically, because we leverage third-party providers, including cloud, software, data center and other critical technology vendors to deliver our solutions to our customers, we rely heavily on the data security technology practices and policies adopted by these third-party providers. Such third-party providers have access to personal data and other data about our customers and employees, and some of these providers in turn may subcontract with other third-party providers. Our ability to monitor our third-party providers’ data security is limited. A vulnerability in a third-party provider’s software or systems, a failure of our third-party providers’ safeguards, policies or procedures, or a breach of a third-party provider’s software or systems could result in the compromise of the confidentiality, integrity or availability of our systems or the data housed in our third-party solutions.
Many jurisdictions have enacted laws requiring companies to notify individuals, regulatory authorities and others of security breaches involving certain types of data or information technology systems. Security compromises experienced by others in our industry, our customers, our third-party service providers or us may lead to public disclosures and widespread negative publicity. Any security compromise in our industry, whether actual or
40
perceived, could erode customer confidence in the effectiveness of our security measures, negatively impact our ability to attract new customers, cause existing customers to elect not to renew or expand their use of our platform, services and products or subject us to third-party lawsuits, regulatory fines or other actions or liabilities, which could materially and adversely affect our business, financial condition and results of operations.
Additionally, while we maintain insurance policies, we do not maintain insurance policies specifically for cyber-attacks and our current insurance policies may not be adequate to reimburse us for losses caused by security breaches, and we may not be able to collect fully, if at all, under these insurance policies. The successful assertion of one or more large claims against us that exceed available insurance coverage, or the occurrence of changes in our insurance policies, including premium increases in or the imposition of large deductible or co-insurance requirements, could adversely affect our business, financial condition and results of operations.
For information on the data protection and privacy laws and regulations to which we are subject and the risks associated therewith, see the section titled “—We are subject to costs and risks associated with increased or changing laws and regulations affecting our business, including those relating to data privacy, security and protection.”
Interruption or failure of our infrastructure, information technology and communications systems could impair our operations, which could also damage our reputation and harm our results of operations.
Our operations are dependent on our ability to protect the continuity of our infrastructure against damage from catastrophe or natural disaster, breach of security, cyber-attack, loss of power, telecommunications failure or other natural or man-made events. A catastrophic event could have a direct negative impact on us by adversely affecting our customers, partners, third-party service providers, employees or facilities, or an indirect impact on us by adversely affecting the agricultural market, payment processing services or the overall economy. In the event of a catastrophe, we could experience a material adverse interruption of our operations.
We serve our customers using third-party data centers and cloud services. While we have electronic access to the infrastructure and components of our platform that are hosted by third parties, we do not control the operation of these facilities. Consequently, we may be subject to service disruptions as well as failures to provide adequate support for reasons that are outside of our direct control. These data centers and cloud services are vulnerable to damage or interruption from a variety of sources, including earthquakes, floods, fires, power loss, system failures, cyber-attacks, physical or electronic break-ins, human error or interference (including by employees, former employees or contractors), and other catastrophic events. Our data centers may also be subject to local administrative actions, changes to legal or permitting requirements and litigation to stop, limit or delay operations. Despite precautions taken at these facilities, such as disaster recovery and business continuity arrangements, the occurrence of a natural disaster or an act of terrorism, a decision to close the facilities without adequate notice or other unanticipated problems at these facilities could result in interruptions or delays in our services, impede our ability to scale our operations or have other adverse impacts upon our business. See “—We depend on data centers operated by third parties and third-party Internet hosting providers, and any disruption in the operation of these facilities or access to the Internet could adversely affect our business.”
We depend on data centers operated by third parties and third-party Internet hosting providers, and any disruption in the operation of these facilities or access to the Internet could adversely affect our business.
Our business requires the ongoing availability and uninterrupted operation of internal and external transaction processing systems and services. While we maintain oversight of our third-party providers of transaction processing and IT-related functions, such third parties are ultimately responsible for maintaining their own network security, disaster recovery and system management procedures. We primarily serve our customers from third-party data center hosting facilities, and we rely on cloud infrastructure to operate certain aspects of our solutions. Any disruption of or interference with our use of our ERP and other core systems could impair our ability to deliver our solutions to our customers, resulting in customer dissatisfaction, damage to our reputation, loss of customers and harm to our business.
Moreover, we have architected our solutions and computer systems to use data processing, storage capabilities and other services provided by specific providers. Given this, we cannot easily switch our ERP and other core systems operations to another cloud provider, so any disruption of or interference with our use of cloud/hosting
41
services could increase our operating costs and materially and adversely affect our business, financial condition and results of operations, and we might not be able to secure service from an alternative provider on similar terms or at all.
The owners and operators of our current hosting facilities have a contract guaranteeing 99% availability and qualified professionals to keep the systems operating. However, such third-party providers may experience website disruptions, outages and other performance problems. These problems may be caused by a variety of factors, including infrastructure changes, human or software errors, viruses, security attacks, fraud, spikes in customer usage and denial of service issues. In some instances, we may not be able to identify the cause or causes of these performance problems within an acceptable period of time. We do not control the operation of these data center facilities, and such facilities are vulnerable to damage or interruption from human error, intentional bad acts, power loss, hardware failures, telecommunications failures, improper operation, unauthorized entry, data loss, power loss, cyberattacks, fires, wars, terrorist attacks, floods, earthquakes, hurricanes, tornadoes, natural disasters or similar catastrophic events. They also could be subject to break-ins, computer viruses, sabotage, intentional acts of vandalism and other misconduct. The occurrence of a natural disaster or an act of terrorism, a decision to close the facilities without adequate notice or terminate our hosting arrangement or other unanticipated problems could result in lengthy interruptions in the delivery of our solutions, cause system interruptions, prevent our customers from accessing their accounts online, reputational harm and loss of critical data, prevent us from supporting our solutions or cause us to incur additional expense in arranging for new facilities and support.
We also depend on third-party Internet-hosting providers and continuous and uninterrupted access to the Internet through third-party bandwidth providers to operate our business. If we lose the services of one or more of our Internet-hosting or bandwidth providers for any reason or if their services are disrupted, for example, due to viruses or denial of service or other attacks on their systems, or due to human error, intentional bad acts, power loss, hardware failures, telecommunications failures, fires, wars, terrorist attacks, floods, earthquakes, hurricanes, tornadoes or similar catastrophic events, we could experience disruption in our ability to offer our solutions and adverse perception of our solutions’ reliability, or we could be required to retain the services of replacement providers, which could increase our operating costs and materially and adversely affect our business, financial condition and results of operations.
Furthermore, prolonged interruption in the availability, or reduction in the speed or other functionality, of our products or services could materially harm our reputation and business. Frequent or persistent interruptions in our products and services could cause customers to believe that our products and services are unreliable, leading them to switch to our competitors or to avoid our products and services, and could permanently harm our reputation and business.
Risks Relating to Latin America
We are subject to risks relating to our significant presence in Latin American countries, which have experienced, and may continue to experience, adverse economic or political conditions that may impact our business, financial condition and results of operations.
Our operations are based in Latin America. For the years ended June 30, 2023 and 2022, 87.3% and 84.9%, respectively, of our revenues were attributable to our Brazilian operations. We expect to increase our sales in Brazil and other countries in South and Central America. As a result, Our business is dependent to a significant extent upon the economic conditions prevalent in Brazil, as well as the other Latin American countries in which we currently operate, including Colombia and Uruguay, and in which we may seek to expand operations in the future, such as Peru, Chile, Paraguay and other countries in South and Central America.
Fluctuations in the economy of Brazil and Latin American countries have historically experienced uneven periods of economic growth, recessions, periods of high inflation and economic instability, including as a result of actions adopted by the governments of Latin American countries have had and may continue to have a significant impact on our subsidiaries operating in those countries. Recently, the economic growth rates of the economies of many Latin American countries have slowed and some have entered mild recessions. Additionally, economic and political developments in Latin America, including future economic changes or crises (such as inflation, currency devaluation or recession), government deadlock, political instability, terrorism, civil strife, changes in laws and
42
regulations, restrictions on the repatriation of dividends or profits, expropriation or nationalization of property, restrictions on currency convertibility, volatility of the foreign exchange market and exchange controls could impact our operations and/or the market value of our Ordinary Shares and have a material adverse effect on our business, financial condition and results of operations.
In addition, we may encounter the following difficulties, among others, related to the foreign markets in which we currently operate or will operate in the future:
•unforeseen regulatory changes;
•our inability to attract personnel and generate business outside of the Latin American countries in which we currently operate;
•changes in tax law;
•changes in trade and investment policies and regulations;
•difficulties in registering and protecting trademarks and software;
•nationalization, expropriation, price controls and other restrictive governmental actions;
•adoption of governmental measures that protect, subsidize or otherwise favor competitors native to such
•markets; and
•cultural and linguistic barriers.
If one or more of these risks materialize, and we are not able to overcome these difficulties, our business, results of operations and financial condition may be adversely affected.
Developments and the perceptions of risks in other countries, including other emerging markets, the United States and Europe, may harm the Brazilian economy and the price of our Ordinary Shares.
The market for securities offered by companies such as ours is influenced by economic and market conditions in Brazil and emerging markets, as well as the United States, Europe and other countries. To the extent the conditions of the global markets or economy deteriorate, our business may be adversely affected. The weakness in the global economy has been marked by, among other adverse factors, lower levels of consumer and corporate confidence, decreased business investment and consumer spending, increased unemployment, reduced income and asset values in many areas, reduction of China’s growth rate, currency volatility and limited availability of credit and access to capital. Developments or economic conditions in other emerging countries have at times significantly affected the availability of credit to companies with significant operations in Brazil and resulted in considerable outflows of funds from Brazil, decreasing the amount of foreign investments in Brazil, impacting overall growth expectations for the Brazilian economy.
Crises and political instability in other emerging market countries, the United States, Europe or other countries, including increased international trade tensions and protectionist policies, could decrease investor demand for securities offered by companies with significant operations in Brazil, such as our Ordinary Shares. These developments, as well as potential crises and forms of political instability arising therefrom or any other as of yet unforeseen development, may harm our business and the price of our Ordinary Shares. These developments, as well as potential crises and forms of political instability arising therefrom or any other as of yet unforeseen development, may adversely affect the United States and global economies and capital markets, which may, in turn, materially adversely affect the trading price of our Ordinary Shares.
43
The Brazilian federal government has exercised, and continues to exercise, significant influence over the Brazilian economy. This influence, as well as Brazil’s political and economic conditions, could harm us and the price of our Ordinary Shares.
The Brazilian federal government frequently exercises significant influence over the Brazilian economy and occasionally makes significant changes in policy and regulations. The Brazilian government’s actions to control inflation and other policies and regulations have often involved, among other measures, increases or decreases in interest rates, changes in fiscal policies, wage and price controls, foreign exchange rate controls, blocking access to bank accounts, currency devaluations, capital controls and import and export restrictions. We have no control over and cannot predict what measures or policies the Brazilian government may take in the future. Our business and the market price of our Ordinary Shares may be harmed by changes in Brazilian government policies, as well as general economic factors, including, without limitation:
•growth or downturn of the Brazilian economy;
•interest rates and monetary policies;
•exchange rates and currency fluctuations;
•inflation;
•liquidity of the domestic capital and lending markets;
•import and export controls;
•exchange controls and restrictions on remittances abroad and payments of dividends;
•modifications to laws and regulations according to political, social and economic interests;
•fiscal policy, monetary policy and changes in tax laws and related interpretations by tax authorities;
•economic, political and social instability, including general strikes and mass demonstrations;
•labor and social security regulations;
•energy and water shortages and rationing;
•public health crises, such as the ongoing COVID-19 pandemic;
•commodity prices; and
•other political, diplomatic, social and economic developments in or affecting Brazil.
Uncertainty over whether the Brazilian federal government will implement reforms or changes in policy or regulation affecting these or other factors in the future may affect economic performance and contribute to economic uncertainty in Brazil, which may have an adverse effect on our activities and consequently our results of operations, and may also adversely affect the trading price of our Ordinary Shares. This scenario is further aggravated when analyzed together with the impacts of the COVID-19 pandemic, which may adversely affect our business, operations, results and share price.
Further, Brazil’s political environment has historically influenced, and continues to influence, the performance of the country’s economy. The recent economic instability in Brazil has contributed to a decline in market confidence in the Brazilian economy as well as to a deteriorating political environment. In addition, various investigations into allegations of money laundering and corruption being conducted by the Office of the Brazilian Federal Prosecutor, including the largest such investigation, known as “Operação Lava Jato,” have negatively impacted the Brazilian economy and political environment. The potential outcome of these investigations is uncertain, but they have already had an adverse impact on the image and reputation of the implicated companies, and on the general market perception of the Brazilian economy. In addition, the Brazilian Supreme Court is
44
currently investigating Brazil’s current President in connection with allegations made by the former Minister of Justice. We cannot predict whether the ongoing investigations will result in further political and economic instability, or if new allegations against government officials or executives of private companies will arise in the future or will result in additional investigations.
As has been true in the past, the current political and economic environment in Brazil has and is continuing to affect the confidence of investors and the general public, which has historically resulted in economic deceleration and heightened volatility in the securities offered by companies with significant operations in Brazil, which may adversely affect us and our Ordinary Shares.
Any further downgrading of Brazil’s credit rating could reduce the trading price of our Ordinary Shares.
We may be harmed by investors’ perceptions of risks related to Brazil’s sovereign debt credit rating. Rating agencies regularly evaluate Brazil and its sovereign ratings, which evaluations consider a number of factors including macroeconomic trends, fiscal and budgetary conditions, indebtedness metrics and the potential for changes in any of these factors. The rating agencies began to review Brazil’s sovereign credit rating in September 2015. Subsequently, the three major rating agencies downgraded Brazil’s investment-grade status:
•In 2015, Standard & Poor’s initially downgraded Brazil’s credit rating from BBB-negative to BB-positive and subsequently downgraded it again from BB-positive to BB, maintaining its negative outlook, citing a worse credit situation since the first downgrade. On January 11, 2018, Standard & Poor’s further downgraded Brazil’s credit rating from BB to BB-negative, and on December 11, 2019, the agency affirmed the rating at BB- and revised the outlook on Brazil to positive. On April 7, 2020, the rating was reaffirmed as BB- with stable outlook, reflecting uncertainties stemming from the coronavirus pandemic, along with how extraordinary government spending will adversely affect the fiscal performance in 2020. On June 14, 2023, Standard & Poor’s reaffirmed Brazil’s rating at BB- while changing the outlook to positive citing positive fiscal and monetary policies.
•In December 2015, Moody’s placed Brazil’s Baa3’s issue and bond ratings under review for downgrade and subsequently downgraded the issue and bond ratings to below investment grade, at Ba2 with a negative outlook, citing the prospect of a further deterioration in Brazil’s debt indicators, taking into account the low growth environment and the challenging political scenario. On April 9, 2018, Moody’s revised the outlook to stable, reaffirming the Ba2 rating. In September 2020, Moody’s maintained Brazil’s credit rating at Ba2 and with a stable outlook. In May 2020, Moody’s confirmed Brazil’s long-term foreign currency sovereign credit rating at Ba2 maintaining the stable outlook. On May 25, 2021 and April 12, 2022, Moody’s further reaffirmed Brazil’s rating at Ba2 with stable outlook.
•Fitch downgraded Brazil’s sovereign credit rating to BB-positive with a negative outlook, citing the rapid expansion of the country’s budget deficit and the worse-than-expected recession. In February 2018, Fitch downgraded Brazil’s sovereign credit rating again to BB-negative, citing, among other reasons, fiscal deficits, the increasing burden of public debt and an inability to implement reforms that would structurally improve Brazil’s public finances. In November 2020, Fitch Ratings affirmed Brazil’s long-term foreign currency sovereign credit rating at BB- with a negative outlook. On December 14, 2021, Fitch further reaffirmed Brazil’s credit rating at BB-negative with a negative outlook. On July 14, 2022, while reaffirming Brazil’s credit rating at BB-negative, Fitch changed its outlook on Brazil’s credit rating to a positive outlook.
Brazil’s sovereign credit rating is still rated below investment grade by the three main credit rating agencies. Consequently, the prices of securities offered by companies with significant operations in Brazil have been negatively affected. A continuation or deterioration of sluggish macroeconomic conditions in the Brazilian economy and continued political uncertainty, among other factors, could lead to further ratings downgrades. Any further downgrade of Brazil’s sovereign credit ratings could heighten investors’ perception of risk and, as a result, cause the trading price of our Ordinary Shares to decline.
45
Inflation and certain measures by the Brazilian government to curb inflation have historically harmed the Brazilian economy and Brazilian capital markets, and high levels of inflation in the future could harm our business and the price of our Ordinary Shares.
In the past, Brazil has experienced extremely high rates of inflation. Inflation and some of the measures taken by the Brazilian government in an attempt to curb inflation have had significant negative effects on the Brazilian economy generally. Inflation, policies adopted to curb inflationary pressures and uncertainties regarding possible future government intervention have contributed to economic uncertainty and heightened volatility in the Brazilian economy and capital markets.
According to the IPCA, Brazilian inflation rates were 5.8%, 10.1% and 4.6%, respectively, as of December 31, 2022, 2021 and 2020. Brazil may continue to experience high levels of inflation in the future and inflationary pressures may continue to lead to the Brazilian government intervening in the economy and introducing policies that could harm our business and the trading price of our Ordinary Shares. In the past, the Brazilian government’s interventions included the maintenance of a restrictive monetary policy with high interest rates that restricted credit availability and reduced economic growth, causing volatility in interest rates. For example, the official interest rate in Brazil decreased from 14.25% as of December 31, 2015 to 4.50% as of December 31, 2018, as established by the COPOM. On February 7, 2018, the COPOM reduced the SELIC rate to 6.75% and further reduced the SELIC rate to 6.50% on March 21, 2018. The COPOM reconfirmed the SELIC rate of 6.50% on May 16, 2018 and subsequently on June 20, 2018. As of December 31, 2018, the SELIC rate was 6.50%. The COPOM reconfirmed the SELIC rate of 6.50% on February 6, 2019, but reduced the SELIC rate to 6.00% on August 1, 2019 and further reduced the rate to 4.50% on December 12, 2019. On February 5, 2020, the COPOM reduced the SELIC rate to 4.25% and further reduced the rate to 3.75% on March 18, 2020, to 3.00% on June 5, 2020, to 2.25% on June 17, 2020 and to 2.00% on August 5, 2020. On March 17, 2021, the COPOM raised the SELIC rate to 2.75% and further raised the SELIC rate to 3.50% on May 5, 2021, to 4.25% on June 16, 2021, to 5.25% on August 4, 2021, to 6.25% on September 22, 2021, to 7.75% on October 27, 2021, to 9.25% on December 8, 2021, to 10.75% on February 2, 2022, to 11.75% on March 16, 2022, to 12.75% on May 4, 2022, to 13.25% on June 15, 2022 and to 13.75% on August 3, 2022. On August 2, 2023, the Central Bank lowered the SELIC rate to 13.25%, and as of the date of this annual report, the SELIC rate remains at 13.25%.Conversely, more lenient government and Central Bank policies and interest rate decreases have triggered and may continue to trigger increases in inflation, and, consequently, growth volatility and the need for sudden and significant interest rate increases, which could negatively affect us, increase our indebtedness and, consequently, adversely affect the trading price of our Ordinary Shares.
Exchange rate instability may impact our ability to hedge exchange rate risk, which may lead to interest rate volatility and have a material adverse effect on the price of our Ordinary Shares.
The Brazilian currency has experienced frequent and substantial variations in relation to the U.S. dollar and other foreign currencies. The Brazilian government has implemented various economic plans and used various exchange rate policies to stabilize the real, including sudden devaluations, periodic mini-devaluations (during which the frequency of adjustments has ranged from daily to monthly), exchange controls, dual exchange rate markets and a floating exchange rate system, which plans and policies have had varying degrees of success. Exchange rate volatility could make our foreign-currency-linked obligations, purchases and funding more expensive in the event of depreciation of the real and, resulting in exchange rate exposure that may lead to losses in the event we fail to adequately manage exchange rate risk.
Although long-term depreciation of the real is generally linked to the rate of inflation in Brazil, depreciation of the real occurring over shorter periods of time has resulted in significant variations in the exchange rate among the real, the U.S. dollar and other currencies. During 2015, due to the poor economic conditions in Brazil, including as a result of political instability, the real devalued at a much higher rate than in previous years. Overall, in 2015, the real depreciated 47.0%, reaching R$3.9048 per US$1.00 on December 31, 2015. In 2016, the real fluctuated significantly, appreciating 16.5% to R$3.2591 per US$1.00 on December 31, 2016. In 2017, the real depreciated 1.5% against the U.S. dollar, ending the year at an exchange rate of R$3.3080 per US$1.00. In 2018, the real depreciated 17.1% against the U.S. dollar, ending the year at an exchange rate of R$3.8742 per US$1.00 mainly due to lower interest rates in Brazil as well as uncertainty regarding the results of the Brazilian presidential elections, which were held in October 2018. In 2019, the real depreciated 4.0% against the U.S. dollar. The real/U.S. dollar exchange rate reported by the Central Bank of Brazil was R$5.1967 per US$1.00 on December 31, 2020, which
46
reflected a 22.4% depreciation in the real against the U.S. dollar during 2020. The real/U.S. dollar exchange rate reported by the Central Bank of Brazil was R$5.5805 per US$1.00 on December 31, 2021, which reflected a 7.4% depreciation in the real against the U.S. dollar since December 31, 2020. The real/U.S. dollar exchange rate reported by the Central Bank of Brazil was R$5.2177 per US$1.00 on December 31, 2022, which reflected a 6.5% appreciation in the real against the U.S. dollar since December 31, 2021. The real/U.S. dollar exchange rate reported by the Central Bank of Brazil was R$4.8192 per US$1.00 on June 30, 2023, which reflected a 7.6% depreciation in the real against the U.S. dollar since December 31, 2022. There can be no assurance that the real will not depreciate or appreciate further against the U.S. dollar.
Depreciation of the real relative to the U.S. dollar has created additional inflationary pressures in Brazil, which has led to increases in interest rates, limited Brazilian companies’ access to financial markets and negatively affect the price of our Ordinary Shares. Conversely, appreciation of the real relative to the U.S. dollar and other foreign currencies could lead to a deterioration of the Brazilian balance of payments, as well as dampen export-driven growth, and affect our farmer client economics. Depending on the circumstances, either depreciation or appreciation of the real could materially and adversely affect our business, financial condition and results of operations.
Disruption or volatility in global financial and credit markets could have a material adverse effect on us.
The global financial and credit markets are currently, and have from time to time experienced extreme volatility and disruptions, including severely diminished liquidity and credit availability, rising interest and inflation rates, declines in consumer confidence, declines in economic growth, increases in unemployment rates and uncertainty about economic stability. Such volatility and uncertainty in global financial and credit markets have also generally led to an increase in the cost of funding for Brazilian and international issuers and borrowers. More recently, the closures of Silicon Valley Bank and Signature Bank and their placement into receivership with the Federal Deposit Insurance Corporation created bank-specific and broader financial institution liquidity risk and concerns. We do not hold cash deposits or securities at Silicon Valley Bank or Signature Bank and have not experienced any adverse impact to our liquidity or to our current and projected business operations, financial condition or results of operations. However, uncertainty remains over liquidity concerns in the financial services industry and potential impacts on the broader economy, and our business, our business partners, and/or industry as a whole may be adversely impacted in ways that we cannot predict at this time.
Such conditions may adversely affect our ability to access capital and liquidity on financial terms acceptable, if at all. If we are unable to access capital and liquidity on financial terms acceptable to us or at all, our financial condition and results of operations may be adversely affected. In addition, the economic and market conditions of other countries, including the United States, countries in the European Union and emerging markets, may affect the volume of foreign investments in Brazil. If the level of foreign investment declines, our access to capital may likewise decline, which could negatively affect our business, ability to take advantage of strategic opportunities and, ultimately, the trading price of our Ordinary Shares.
Further, the demand for agricultural products and services is directly impacted by macroeconomic variables, such as economic growth, income, unemployment rate, inflation and fluctuations in interest and foreign exchange rates. Disruptions and volatility in the global financial markets may have significant consequences in the countries in which we operate, such as volatility in the prices of securities, interest rates and foreign exchange rates. Higher uncertainty and volatility may result in a slowdown in the credit market and the economy, which, in turn, could lead to higher unemployment rates and a reduction in the purchasing power of consumers. In addition, such events may significantly impair our customers’ ability to perform their obligations and increase overdue accounts payable, resulting in an increase in the risk associated with our business.
Infrastructure and workforce deficiency in Brazil may impact economic growth and have a material adverse effect on us.
Brazilian GDP growth has fluctuated over the past few years, with a contraction of 3.5% in 2015, a contraction of 3.3% in 2016, growth of 1.3% in 2017, growth of 1.8% in 2018, growth of 1.2% in 2019, a contraction of 3.3% in 2020 and growth of 5.0% and 2.9% in 2021 and 2022, respectively. Growth is limited by inadequate infrastructure, including potential energy shortages and deficient transportation, logistics and telecommunication sectors, general strikes, the lack of a qualified labor force and the lack of private and public investments in these areas, which limit
47
productivity and efficiency. Any of these factors could lead to labor market volatility, which could limit growth and ultimately have a material adverse effect on us.
Risks Relating to Our Ordinary Shares and Warrants
The listing of our securities on Nasdaq did not benefit from the process customarily undertaken in connection with an underwritten initial public offering, which could result in diminished investor demand, inefficiencies in pricing and a more volatile public price for our securities.
Unlike an underwritten initial public offering of our securities, the initial listing of our securities as a result of the Business Combination did not benefit from the following:
•the book-building process undertaken by underwriters that helps to inform efficient price discovery with respect to opening trades of newly listed securities;
•underwriter support to help stabilize, maintain or affect the public price of the new issue immediately after listing; and
•underwriter due diligence review of the offering and potential liability for material misstatements or omissions of fact in a prospectus used in connection with the securities being offered or for statements made by its securities analysts or other personnel.
The lack of such a process in connection with the listing of our securities could result in diminished investor demand, inefficiencies in pricing and a more volatile public price for our securities during the period immediately following the listing than in connection with an underwritten initial public offering.
We incur increased costs as a result of operating as a public company.
We are a public company and incur significant legal, accounting and other expenses that we did not incur as a private company. As a public company, we are subject to the reporting requirements of the Exchange Act, the Sarbanes-Oxley Act, the Dodd-Frank Wall Street Reform and Consumer Protection Act, as well as rules adopted, and to be adopted, by the SEC and Nasdaq. Our management and other personnel need to devote a substantial amount of time to these compliance initiatives and may not effectively or efficiently manage the transition into a public company. Moreover, we expect these rules and regulations to substantially increase our legal and financial compliance costs and to make some activities more time-consuming and costly. For example, we expect these rules and regulations to make it more difficult and more expensive for us to obtain director and officer liability insurance and we may be forced to accept reduced policy limits or incur substantially higher costs to maintain the same or similar coverage. We cannot predict or estimate the amount or timing of additional costs it may incur to respond to these requirements. The impact of these requirements could also make it more difficult for us to attract and retain qualified persons to serve on our board of directors, its board committees or as executive officers.
Most members of our management team have limited experience managing a publicly traded company, interacting with public company investors and complying with the increasingly complex laws pertaining to public companies in the United States. The additional demands associated with being a public company may disrupt regular operations of our business by diverting the attention of some of our senior management team away from revenue producing activities to management and administrative oversight, adversely affecting our ability to attract and complete business opportunities and increasing the difficulty in both retaining professionals and managing and growing our businesses. Our management team may not successfully or efficiently manage our transition to being a public company subject to significant regulatory oversight and reporting obligations under the U.S. federal securities laws and the continuous scrutiny of securities analysts and investors.
In addition, the public reporting obligations associated with being a public company in the United States may subject us to litigation as a result of increased scrutiny of our financial reporting. If we are involved in litigation regarding our public reporting obligations, this could subject us to substantial costs, divert resources and management attention from our business and seriously undermine our business.
Any of these effects could harm our business, financial condition and results of operations.
48
We may be required to take write-downs or write-offs, restructuring and impairment or other charges that could have a significant negative effect on our financial condition, results of operations and share price, which could cause you to lose some or all of your investment.
We may be forced to write-down or write-off assets, restructure our operations, or incur impairment or other charges that could result in us reporting losses. Even though these charges may be non-cash items and not have an immediate impact on our liquidity, the fact that charges of this nature are reported could contribute to negative market perceptions about us or our securities. In addition, charges of this nature may cause us to violate covenants to which we may be subject. Accordingly, any of our shareholders could suffer a reduction in the value of their Ordinary Shares as a result of the foregoing factors and would be unlikely to have a remedy for such reduction in value.
The Lavoro Original Shareholders beneficially own approximately 84.7% of the outstanding Ordinary Shares, and control certain matters requiring shareholder approval. This concentration of ownership and voting power will limit your ability to influence corporate matters.
The Lavoro Original Shareholders control us through their beneficial ownership of approximately 84.7% of our outstanding Ordinary Shares (including 2,951,436 Vesting Founder Shares outstanding as of June 30, 2023). As a result, the Lavoro Original Shareholders are able to effectively control our decisions and are able to elect a majority of the members of our board of directors. The Lavoro Original Shareholders are also able to direct our actions in areas such as business strategy, financing, distributions, acquisitions and dispositions of assets or businesses, and may cause us to make acquisitions that increase the amount of our indebtedness or outstanding ordinary shares, sell revenue-generating assets or inhibit change of control transactions that may benefit other shareholders. The decisions of the Lavoro Original Shareholders on these matters may be contrary to your expectations or preferences, and they may take actions that could be contrary to your interests.
We may not be able to timely and effectively implement controls and procedures required by Section 404(a) of the Sarbanes-Oxley Act that apply to us following the consummation of the Business Combination.
As a result of the consummation of the Business Combination on February 28, 2023 and the transactions related thereto, we will be required to provide management’s attestation on internal controls in connection with our second annual report on Form 20-F following consummation of the Business Combination, i.e., our annual report on Form 20-F for the fiscal year ended June 30, 2024. The standards required for a public company under Section 404(a) of the Sarbanes-Oxley Act are significantly more stringent than those that were required of us as a privately-held company. Our management may not be able to effectively and timely implement controls and procedures that adequately respond to the increased regulatory compliance and reporting requirements that apply following the Business Combination. If we are not able to implement the additional requirements of Section 404(a) in a timely manner or with adequate compliance, we may not be able to assess whether our internal controls over financial reporting are effective, which may subject us to adverse regulatory consequences and could harm investor confidence and the market price of our Ordinary Shares.
As a foreign private issuer, we have different disclosure, Nasdaq corporate governance standards and other requirements than U.S. domestic registrants.
As a foreign private issuer, we are subject to different disclosure and other requirements than domestic U.S. registrants. For example, as a foreign private issuer, in the United States, we are not subject to the same disclosure requirements as a domestic U.S. registrant under the Exchange Act, including the requirements to prepare and issue quarterly reports on Form 10-Q or to file current reports on Form 8-K upon the occurrence of specified significant events, the proxy rules applicable to domestic U.S. registrants under Section 14 of the Exchange Act or the insider reporting and short-swing profit rules applicable to domestic U.S. registrants under Section 16 of the Exchange Act. In addition, we rely on exemptions from certain U.S. corporate governance-related rules that permit us to follow Cayman Islands legal requirements rather than certain of the requirements that are applicable to U.S. domestic registrants. See “Item 6. Directors, Senior Management and Employees—C. Board Practices—Foreign Private Issuer Status” and “Item 10. Additional Information—B. Memorandum and Articles of Association—Principal Differences between Cayman Islands and U.S. Corporate Law” for more information.
49
We follow certain Cayman Islands laws and regulations that are applicable to Cayman Islands companies. However, such laws and regulations may not contain any provisions comparable to the U.S. rules relating to the filing of reports on Form 10-Q or 8-K, the U.S. proxy rules, or the U.S. rules relating to liability for insiders who profit from trades made in a short period of time, as referred to above.
Furthermore, foreign private issuers are required to file their annual report on Form 20-F within 120 days after the end of each fiscal year, while U.S. domestic issuers that are accelerated filers are required to file their annual report on Form 10-K within 75 days after the end of each fiscal year. Foreign private issuers are also exempt from Regulation Fair Disclosure, aimed at preventing issuers from making selective disclosures of material information, although we are subject to Cayman Islands laws and regulations having substantially the same effect as Regulation Fair Disclosure. As a result of the above, even though we are required to file reports on Form 6-K disclosing the limited information that we have made or are required to make public pursuant to Cayman Islands law, or are required to distribute to shareholders generally, and that are material to us, you may not receive information of the same type or amount that is required to be disclosed to shareholders of a U.S. company.
Moreover, we are not required to file periodic reports and financial statements with the SEC as frequently or within the same time frames as U.S. companies with securities registered under the Exchange Act. We currently prepare our financial statements in accordance with IFRS. We will not be required to file financial statements prepared in accordance with or reconciled to U.S. GAAP so long as our financial statements are prepared in accordance with IFRS, as issued by the IASB.
We cannot predict if investors will find our Ordinary Shares less attractive because we rely on these exemptions. If some investors find our Ordinary Shares less attractive as a result, there may be a less active trading market for our Ordinary Shares and our share price may be more volatile.
We may lose our foreign private issuer status which would then require us to comply with the Exchange Act’s domestic reporting regime and cause us to incur significant legal, accounting and other expenses.
In order to maintain our current status as a foreign private issuer, either (a) more than 50% of the voting power of all our outstanding classes of voting securities (on a combined basis) must be either directly or indirectly owned of record by non-residents of the United States or (b)(1) a majority of our executive officers or directors must not be U.S. citizens or residents; (2) more than 50% of our assets cannot be located in the United States; and (3) our business must be administered principally outside the United States. We intend to monitor the composition of our shareholder base to determine whether we meet these criteria. If we lose this status, we would be required to comply with the Exchange Act reporting and other requirements applicable to U.S. domestic issuers, which are more detailed and extensive than the requirements for foreign private issuers. We may also be required to make changes in our corporate governance practices in accordance with various SEC and Nasdaq rules, and report our financial statements in accordance with U.S. GAAP, which may differ materially from IFRS, all of which may involve time, effort and additional costs to implement. The regulatory and compliance costs to us under U.S. securities laws if we are required to comply with the reporting requirements applicable to a U.S. domestic issuer may be significantly higher than the costs we incur as a foreign private issuer.
As a foreign private issuer, we rely on exemptions from certain Nasdaq corporate governance standards applicable to U.S. issuers, including the requirement that a majority of an issuer’s directors consist of independent directors. This may afford less protection to holders of our Ordinary Shares.
Section 5605 of Nasdaq equity rules requires listed companies to have, among other things, a majority of their board members be independent, and to have independent director oversight of executive compensation, nomination of directors and corporate governance matters. As a foreign private issuer, however, we are permitted to follow, and we do follow, home country practice in lieu of the above requirements. See “Item 6. Directors, Senior Management and Employees—C. Board Practices—Foreign Private Issuer Status” and “Item 10. Additional Information—B. Memorandum and Articles of Association—Principal Differences between Cayman Islands and U.S. Corporate Law” for more information.
50
If securities or industry analysts do not publish research, or publish inaccurate or unfavorable research, about our business, the price of our Ordinary Shares and our trading volume could decline.
The trading market for our Ordinary Shares depends in part on the research and reports that securities or industry analysts publish about us or our business. If one or more of the analysts who cover us downgrade our Ordinary Shares or publish inaccurate or unfavorable research about our business, the price of our Ordinary Shares would likely decline. If one or more of these analysts cease coverage of our company or fail to publish reports on us regularly, demand for our Ordinary Shares could decrease, which might cause the price of our Ordinary Shares and trading volume to decline. Moreover, if our financial results fail to meet, or significantly exceed, our announced guidance or the expectations of analysts or public investors, analysts could downgrade our securities or publish unfavorable research about it. If one or more of these analysts cease coverage of us or fail to publish reports on us regularly, our visibility in the financial markets could decrease, which in turn could cause our share price or trading volume to decline.
The Ordinary Shares registered for resale represent a substantial percentage of our outstanding Ordinary Shares and the sale of such securities could cause the market price of our Ordinary Shares to decline significantly.
On March 23, 2023, we filed a registration statement on Form F-1, which registration statement, as amended, was declared effective by the SEC on May 25, 2023, or the Resale Registration Statement. The Resale Registration Statement relates, among other things, to the offer and sale from time to time by certain selling securityholders named therein, or the Selling Securityholders, of (i) up to 10,000,000 Ordinary Shares purchased by The Production Board in a private placement under the TPB PIPE Investment consummated in connection with the Business Combination at a purchase price of US$10.00 per Ordinary Share; (ii) up to 2,830,750 Ordinary Shares issued to certain Selling Securityholders in exchange for 2,830,750 SPAC Class A Ordinary Shares that were held by such Selling Securityholders pursuant to the Forward Purchase Agreements entered into in connection with the Business Combination at a purchase price of approximately US$10.00 per Ordinary Share; and (iii) up to 98,726,401 Ordinary Shares issued to the Lavoro Original Shareholders in exchange for securities of Lavoro Agro Limited based on a value of US$10.00 per Ordinary Share, however, these shares were issued in exchange for securities of Lavoro Agro Limited that were acquired by the Lavoro Original Shareholders at prices that equate to purchase prices of less than US$10.00 per share. In addition, the Resale Registration Statement relates to the issuance by us of up to 10,083,592 Ordinary Shares that are issuable by us upon the exercise of Warrants (including Warrants issued in exchange for SPAC Private Warrants and Warrants issued in exchange for SPAC Public Warrants).
Due to the significant number of SPAC Class A Ordinary Shares that were redeemed in connection with the Business Combination, the number of Ordinary Shares that the Selling Securityholders can sell into the public markets pursuant to the Resale Registration Statement may exceed our public float. Furthermore, the 121,640,757 Ordinary Shares registered for sale in the Resale Registration Statement (including Ordinary Shares underlying Warrants) exceed the total number of outstanding Ordinary Shares (116,608,329 outstanding Ordinary Shares as of June 30, 2023, prior to any exercise of the Warrants). In addition, the Ordinary Shares beneficially owned by the Lavoro Original Shareholders represent 84.7% of our total outstanding Ordinary Shares (including 2,951,436 Vesting Founder Shares outstanding as of June 30, 2023) and, subject to the lock-up restrictions described herein, these holders have the ability to sell all of their Ordinary Shares pursuant to the Resale Registration Statement so long as it is available for use. Given the substantial number of Ordinary Shares registered for potential resale by Selling Securityholders pursuant to the Resale Registration Statement (and the concentration of such Ordinary Shares among the Lavoro Original Shareholders in particular), the sale of Ordinary Shares by the Selling Securityholders, or the perception in the market that the Selling Securityholders of a large number of Ordinary Shares intend to sell Ordinary Shares, particularly the Lavoro Original Shareholders, could increase the volatility of the market price of our Ordinary Shares or result in a significant decline in the public trading price of our Ordinary Shares.
In addition, some of the Ordinary Shares that have been registered for resale were acquired by the Selling Securityholders for prices considerably below the current market price of the Ordinary Shares. On June 30, 2023, the closing price of our Ordinary Shares on Nasdaq was US$5.96, 2023 per share. Even if the current market price is significantly below the price at the time of the initial public offering of TPB SPAC, certain Selling Securityholders may have an incentive to sell because they have purchased their Ordinary Shares at prices significantly lower than
51
our public investors or the current trading price of the Ordinary Shares and may profit significantly so even under circumstances in which our public shareholders or certain other Selling Securityholders would experience losses in connection with their investment. For example, the Lavoro Original Shareholders were issued 98,726,401 Ordinary Shares in exchange for securities of Lavoro Agro Limited based on a value of US$10.00 per Ordinary Share, however, these Ordinary Shares were issued in exchange for Lavoro Agro Limited Shares that were acquired by the Lavoro Original Shareholders in various rounds of capital increases at purchase prices as low as approximately US$3.47 per share. As a result, the Lavoro Original Shareholders may experience a positive rate of return on the securities they purchased due to the differences in their purchase price of Lavoro Agro Limited shares. Based on the closing price of our Ordinary Shares referenced above, the Lavoro Original Shareholders may experience a potential profit of up to US$2.49 per share. While the Lavoro Original Shareholders may experience a positive rate of return based on the current trading price of our Ordinary Shares, other Selling Securityholders may not. For example, The Production Board (in respect of their TPB PIPE Investment shares) and the FPA Investors (in respect of their Forward Purchase Agreement Shares) acquired our Ordinary Shares at an original purchase price of US$10.00 per Ordinary Share, or approximately US$4.04 greater than the closing price of our Ordinary Shares as of June 30, 2023. Similarly, the public holders of our securities may not experience a positive rate of return on the securities they purchase due to differences in the applicable purchase price and the trading price. Accordingly, as of the date of this annual report and based on the closing price of our Ordinary Shares referenced above, The Production Board (in respect of their TPB PIPE Investment shares), FPA Investors (in respect of their Forward Purchase Agreement Shares) and public holders of Warrants would not experience a profit if they decided to sell their Ordinary Shares (including Ordinary Shares issued upon the exercise of Warrants).
As such, public shareholders of the Ordinary Shares have likely paid significantly more than certain of the Selling Securityholders, in particular the Lavoro Original Shareholders, for their Ordinary Shares, and should not expect to see a positive return unless the price of the Ordinary Shares appreciates above the price at which such shareholders purchased their Ordinary Shares. For example, investors who purchased SPAC Shares or SPAC Warrants in the initial public offering of TPB SPAC at a price of US$10.00 per unit, or investors who purchase the Ordinary Shares on Nasdaq following the Business Combination at prices above US$5.96 per Ordinary Share would not, as of June 30, 2023, have experienced a similar rate of return on the Ordinary Shares they purchased due to differences in the purchase prices and the current trading price. In addition, sales by the Selling Securityholders may cause the trading prices of our securities to experience a decline. As a result, the Selling Securityholders may effect sales of Ordinary Shares at prices significantly below the current market price, which could cause market prices to decline further.
The restrictions on selling, limited public float and trading volume for our Ordinary Shares may make it difficult to sell your shares and may cause volatility in the price of our securities.
Historically, ownership of a significant portion of our outstanding Ordinary Shares has been concentrated in a small number of shareholders. The Ordinary Shares beneficially owned by the Lavoro Original Shareholders represent 84.7% of our total outstanding Ordinary Shares (including 2,951,436 Vesting Founder Shares outstanding as of June 30, 2023) and, are subject to lock-up restrictions as described herein. Consequently, our Ordinary Shares have a relatively small float and low average daily trading volume, which could affect a shareholder’s ability to sell our Ordinary Shares or the price at which it can be sold.
As of the effectiveness date of the Resale Registration Statement, the Lavoro Original Shareholders have the ability to sell all of their Ordinary Shares so long as it is available for use, subject to the lock-up restrictions described in “Item 7. Major Shareholders and Related Party Transactions—B. Related Party Transactions—Transactions Related to the Business Combination—Lock-Up Agreement.” Given the substantial number of Ordinary Shares registered for potential resale by Selling Securityholders pursuant to the Resale Registration Statement (and the concentration of such Ordinary Shares among the Lavoro Original Shareholders in particular), the sale of Ordinary Shares by the Selling Securityholders, or the perception in the market that the Selling Securityholders of a large number of Ordinary Shares intend to sell Ordinary Shares, particularly the Lavoro Original Shareholders, may adversely impact the market price of our Ordinary Shares and result in increased volatility in the trading price of our Ordinary Shares.
52
Sales of our Ordinary Shares or the perception of such sales, by the Selling Securityholders, in the public market or otherwise, could cause the market price for our securities to decline, even if our business is doing well.
We filed the Resale Registration Statement in order to register the resale under the Securities Act of the Ordinary Shares (including Ordinary Shares exercisable upon the issuance of Warrants) by the Selling Securityholders set forth herein. All of our issued and outstanding Ordinary Shares are eligible for resale for so long as the Resale Registration Statement is in effect, subject to any applicable lock-up restrictions that affect the Selling Securityholders, and such Selling Securityholders hold a disproportionately large portion of our outstanding Ordinary Shares. We will not receive any of the proceeds from such sales, and, based on the current trading price of our Ordinary Shares, we do not currently expect to receive any proceeds from the exercise of Warrants. The market price of our Ordinary Shares could decline as a result of substantial sales of our Ordinary Shares, particularly sales by the Selling Securityholders. These sales, or the possibility that these sales may occur, also might make it more difficult for us to sell equity securities in the future at a time and at a price that we deem appropriate and cause the market price of our securities to drop significantly, even if our business is doing well.
Sales of a substantial number of our Ordinary Shares, including as a result of the effectiveness of the Resale Registration Statement or upon expiration of the lock-up agreements, the perception that such sales may occur, or early release of these lock-up periods, could cause the trading price of our Ordinary Shares to fall or make it more difficult for you to sell your our Ordinary Shares at a time and price that you deem appropriate. For more information, see “—The Ordinary Shares registered for resale represent a substantial percentage of our outstanding Ordinary Shares and the sale of such securities could cause the market price of our Ordinary Shares to decline significantly.”
In addition, one of the Investment Funds has pledged 64,239,660 of our Ordinary Shares to secure certain financial and other obligations in connection with the Loan Documents, which Ordinary Shares represent 55.1% of our outstanding share capital. If enforcement action is taken by or on behalf of the entities that have the benefit of the share pledges, or if shares of common stock are otherwise transferred in satisfaction of debt obligations, such enforcement action or transfers could result in transfer of such shares to the lender and one or more third parties and could result in a change of control with respect to us. A change of control may trigger a default under certain of our debt instruments and other material agreements, which may cause a material adverse effect on our business, operations, financial condition, liquidity and results of operations.
We may be required to repurchase up to 2,830,750 Ordinary Shares from the investors with whom we entered into Forward Purchase Agreements in connection with the closing of the Business Combination, which would reduce the amount of cash available to us to fund our growth plan.
On February 21, 2023, TPB SPAC entered into separate Forward Purchase Agreements with certain equity holders of TPB SPAC (together, the “FPA Investors”), pursuant to which TPB SPAC (or Second Merger Sub, as successor-in-interest to TPB SPAC following the Closing) agreed to purchase in the aggregate, on the date that is 24 months after the Closing Date (the “Maturity Date”), i.e. on February 28, 2025, up to 2,830,750 Ordinary Shares then held by the FPA Investors (subject to certain conditions and purchase limits set forth in the Forward Purchase Agreements). Pursuant to the terms of the Forward Purchase Agreements, each FPA Investor further agreed not to redeem, in connection with the Extraordinary General Meeting, of any of the SPAC Class A Ordinary Shares owned by it at such time. The per Ordinary Share price at which the FPA Investors have the right to sell the Ordinary Shares to us on the Maturity Date is (i) the total amount of the Escrowed Property in the Escrow Account (in each case, as defined in “Item 7. Major Shareholders and Related Party Transactions—B. Related Party Transactions—Transactions Related to the Business Combination—Forward Purchase Agreements”), divided by (ii) the total number of Ordinary Shares held by the FPA Investors as of the Maturity Date. The Forward Purchase Agreements may also be terminated, subject to certain conditions, if the trading price of our Ordinary Shares is less than US$5.00 per share (as adjusted for stock splits, stock dividends, cash dividends, reorganizations, combinations, recapitalizations and the like) on any 20 trading days within any consecutive 30 trading day period occurring following the six month anniversary of the date on which the Ordinary Shares are registered for resale. In this event, we would be required to deliver to the FPA Investors, for the FPA Investors’ use without restriction, an amount equal to (i) the Escrowed Property, divided by (ii) the total number of Ordinary Shares then held by the FPA Investors, multiplied by (iii) the number of Ordinary Shares then held by the FPA Investors.
53
If the FPA Investors hold some or all of the 2,830,750 Forward Purchase Agreement Shares on the Maturity Date, and the per share trading price of our Ordinary Shares is less than the per Ordinary Share price at which the FPA Investors have the right to sell the Ordinary Shares to us on the Maturity Date, we would expect that the FPA Investors will exercise this repurchase right with respect to such shares. We have placed an amount equal to the Escrowed Property to secure our purchase obligation to the FPA Investors under the Forward Purchase Agreements. Nonetheless, in the event that we are required to repurchase these Forward Purchase Agreement Shares, or in the event that the Forward Purchase Agreements are terminated under the conditions described above, the amount of Escrowed Property to which we could be entitled to as of the Maturity Date may be reduced to zero, which would accordingly reduce the amount of cash arising from the Business Combination that would ultimately be available to fund our liquidity and capital resource requirements, which would adversely affect our ability to fund our growth plan in the manner we had contemplated when entering into the Forward Purchase Agreements.
For more information, see “Item 7. Major Shareholders and Related Party Transactions—B. Related Party Transactions—Transactions Related to the Business Combination—Forward Purchase Agreements.”
An active trading market for our securities may not be sustained, and investors may not be able to resell their Ordinary Shares and Warrants at or above the price for which they purchased such securities.
An active trading market for the Ordinary Shares and Warrants may not be sustained. In the absence of an active trading market for our Ordinary Shares and/or Warrants, investors may not be able to sell their Ordinary Shares or Warrants, respectively, at or above the price they paid at the time that they would like to sell. If either none or only a limited number of securities or industry analysts maintain coverage, or if these securities or industry analysts are not widely respected within the general investment community, the demand for our Ordinary Shares could decrease, which might cause our share price and trading volume to decline significantly. In addition, an inactive market may impair our ability to raise capital by selling shares or equity securities and may impair our ability to acquire business partners by using Ordinary Shares as consideration, which, in turn, could harm our business.
You may face difficulties in protecting your interests, and your ability to protect your rights through U.S. courts may be limited, because we are incorporated under the laws of the Cayman Islands, we conduct substantially all of our operations, and a majority of our directors and executive officers reside, outside of the United States.
We are an exempted company limited by shares incorporated under the laws of the Cayman Islands, and we conduct a majority of our operations through our subsidiary, Lavoro Agro Limited, outside the United States. Substantially all of our assets are located outside the United States, primarily in Brazil. A majority of our officers and directors reside outside the United States and a substantial portion of the assets of those persons are located outside of the United States. As a result, it could be difficult or impossible for you to bring an action against us or against these individuals outside of the United States in the event that you believe that your rights have been infringed upon under the applicable securities laws or otherwise. Even if you are successful in bringing an action of this kind, the laws of the Cayman Islands and of the jurisdictions that comprise the Latin American region could render you unable to enforce a judgment against our assets or the assets of our directors and officers.
Our corporate affairs are governed by our governing documents, the Companies Act and the common law of the Cayman Islands. The rights of shareholders to take action against our directors, actions by minority shareholders and the fiduciary responsibilities of our directors to us under Cayman Islands law are to a large extent governed by the common law of the Cayman Islands. The common law of the Cayman Islands is derived in part from comparatively limited judicial precedent in the Cayman Islands as well as that from English common law, which has persuasive, but not binding, authority on a court in the Cayman Islands. The rights of our shareholders and the fiduciary responsibilities of our directors under Cayman Islands law are not as clearly established as they would be under statutes or judicial precedent in some jurisdictions in the United States. In particular, the Cayman Islands has a less exhaustive body of securities laws than the United States. In addition, some U.S. states, such as Delaware, have more fulsome and judicially interpreted bodies of corporate law than the Cayman Islands.
As a result of all of the above, our shareholders may have more difficulty in protecting their interests in the face of actions taken by management, members of the board of directors or controlling shareholders than they would as shareholders of a corporation incorporated in a jurisdiction in the United States.
54
While Cayman Islands law allows a dissenting shareholder to express the shareholder’s view that a court sanctioned reorganization of a Cayman Islands company would not provide fair value for the shareholder’s shares, Cayman Islands statutory law does not specifically provide for shareholder appraisal rights in connection with a court sanctioned reorganization (by way of a scheme of arrangement). This may make it more difficult for you to assess the value of any consideration you may receive in a merger or consolidation (by way of a scheme of arrangement) or to require that the acquirer gives you additional consideration if you believe the consideration offered is insufficient. However, Cayman Islands statutory law provides a mechanism for a dissenting shareholder in a merger or consolidation that does not take place by way of a scheme of arrangement to apply to the Grand Court of the Cayman Islands for a determination of the fair value of the dissenter’s shares if it is not possible for the company and the dissenter to agree on a fair price within the time limits prescribed.
Shareholders of Cayman Islands exempted companies (such as the Company) have no general rights under Cayman Islands law to inspect corporate records and accounts or to obtain copies of lists of shareholders. Our directors have discretion under our governing documents to determine whether or not, and under what conditions, our corporate records may be inspected by our shareholders, but are not obliged to make them available to our shareholders. This may make it more difficult for you to obtain information needed to establish any facts necessary for a shareholder motion or to solicit proxies from other shareholders in connection with a proxy contest.
Subject to limited exceptions, under Cayman Islands law, a minority shareholder may not bring a derivative action against the board of directors. Class actions are not recognized in the Cayman Islands, but groups of shareholders with identical interests may bring representative proceedings, which are similar.
We do not anticipate paying dividends in the foreseeable future.
It is expected that we will retain most, if not all, of our available funds and any future earnings to fund the development and growth of our business. As a result, it is not expected that we will pay any cash dividends in the foreseeable future for Lavoro Limited shareholders.
Our board of directors has complete discretion as to whether to distribute dividends. Even if the board of directors decides to declare and pay dividends, the timing, amount and form of future dividends, if any, will depend on the future results of operations and cash flow, capital requirements and surplus, the amount of distributions, if any, received by us from subsidiaries, our financial condition, contractual restrictions and other factors deemed relevant by the board of directors. There is no guarantee that our Ordinary Shares will appreciate in value or that the trading price of the Ordinary Shares will not decline.
Our governing documents contain anti-takeover provisions that may discourage a third party from acquiring us and adversely affect the rights of holders of our Ordinary Shares.
Our governing documents contain certain provisions that could limit the ability of others to acquire control of our company, including provisions that:
•authorize our board of directors to issue, without further action by our shareholders, undesignated preferred shares with terms, rights and preferences determined by its board of directors that may be senior to our Ordinary Shares;
•impose advance notice requirements for shareholder proposals;
•limit our shareholders’ ability to call special meetings; and
•require approval from the holders of at least two-thirds in voting power of all outstanding shares who attend and voted at a general meeting of our shareholders to amend certain provisions of our governing documents.
These anti-takeover defenses could discourage, delay or prevent a transaction involving a change in our control. These provisions could also make it more difficult for you and our other shareholders to elect directors of your choosing and cause us to take other corporate actions than you desire.
55
We have granted in the past, and intend to grant in the future, share incentives, which may result in increased share-based compensation expenses.
On the Closing Date, our board of directors adopted, and our shareholders approved the assumption of the Lavoro Share Plan. As a result, we reserved for issuance the number of Ordinary Shares equal to the number of Lavoro Share Plan Shares under the Lavoro Share Plan, as adjusted in accordance with the Business Combination Agreement. In addition, on August 16, 2023 and September 27, 2023 our board of directors approved and adopted the New Lavoro Equity Plan, which provides for the grant of restricted stock units to participants identified by our board. We believe the granting of share-based compensation is of significant importance to our ability to attract and retain key personnel and employees, and as such, we can also grant share-based compensation and incur share-based compensation expenses. As a result, expenses associated with share-based compensation may increase, which may have an adverse effect on our business and results of operations. See “Item 6. Directors, Senior Management and Employees—B. Compensation—Share-Based Compensation.”
We are a “controlled company” within the meaning of Nasdaq listing standards and, as a result, qualify for, and intend to rely on, exemptions from certain corporate governance requirements. You will not have the same protections afforded to shareholders of companies that are subject to such requirements.
The Lavoro Original Shareholders control a majority of the voting power of our Ordinary Shares. As a result, we are a “controlled company” within the meaning of Nasdaq listing standards. Under these rules, a company of which more than 50% of the voting power is held by an individual, a group or another company is a “controlled company” and may elect not to comply with certain corporate governance requirements of Nasdaq, including (1) the requirement that a majority of the board of directors consist of independent directors, (2) the requirement that we have a nominating and corporate governance committee that is composed entirely of independent directors with a written charter addressing the committee’s purpose and responsibilities and (3) the requirement that we have a compensation committee that is composed entirely of independent directors with a written charter addressing the committee’s purpose and responsibilities. We rely on some or all of these exemptions. As a result, we currently do not have a majority of independent directors, we do not have a nominating or a corporate governance committee, and our compensation committee is not composed entirely of independent directors. Accordingly, our shareholders do not have the same protections afforded to shareholders of companies that are subject to all of the corporate governance requirements of Nasdaq.
We are a Cayman Islands exempted company with limited liability. The rights of our shareholders, including with respect to fiduciary duties and corporate opportunities, may be different from the rights of shareholders governed by the laws of U.S. jurisdictions.
We are a Cayman Islands exempted company with limited liability. Our corporate affairs are governed, by our governing documents and by the laws of the Cayman Islands. The rights of shareholders and the responsibilities of members of our board of directors may be different from the rights of shareholders and responsibilities of directors in companies governed by the laws of U.S. jurisdictions. In particular, as a matter of Cayman Islands law, directors of a Cayman Islands company owe fiduciary duties to the company and separately a duty of care, diligence and skill to the company. Under Cayman Islands law, directors and officers owe the following fiduciary duties: (1) duty to act in good faith in what the director or officer believes to be in the best interests of the company as a whole; (2) duty to exercise powers for the purposes for which those powers were conferred and not for a collateral purpose; (3) directors should not properly fetter the exercise of future discretion; (4) duty to exercise powers fairly as between different sections of shareholders; (5) duty to exercise independent judgment; and (6) duty not to put themselves in a position in which there is a conflict between their duty to the company and their personal interests. Our governing documents have varied this last obligation by providing that a director must disclose the nature and extent of his or her interest in any contract or arrangement, and following such disclosure and subject to any separate requirement under applicable law or the listing rules of Nasdaq, and unless disqualified by the chairman of the relevant meeting, such director may vote in respect of any transaction or arrangement in which he or she is interested and may be counted in the quorum at the meeting. Conversely, under Delaware corporate law, a director has a fiduciary duty to the corporation and its shareholders (made up of two components) and the director’s duties prohibit self-dealing by a director and mandate that the best interest of the corporation and its shareholders take precedence over any interest possessed by a director, officer or controlling shareholder and not shared by the shareholders generally. See “Item
56
10. Additional Information—B. Memorandum and Articles of Association—Principal Differences between Cayman Islands and U.S. Corporate Law.”
United States civil liabilities and certain judgments obtained against us by our shareholders may not be enforceable.
We are a Cayman Islands exempted company and substantially all of our assets are located outside of the United States. In addition, the majority of our directors and officers are nationals and residents of countries other than the United States, and a substantial portion of the assets of these persons is located outside of the United States. As a result, it may be difficult to effect service of process within the United States upon these persons. It may also be difficult to enforce in U.S. courts judgments obtained in U.S. courts based on the civil liability provisions of the U.S. federal securities laws against us and our officers and directors who are not resident in the United States and the substantial majority of whose assets are located outside of the United States.
Further, it is unclear if original actions predicated on civil liabilities based solely upon U.S. federal securities laws are enforceable in courts outside the United States, including in the Cayman Islands and Brazil. Courts of the Cayman Islands may not, in an original action in the Cayman Islands, recognize or enforce judgments of U.S. courts predicated upon the civil liability provisions of the securities laws of the United States or any state of the United States on the grounds that such provisions are penal in nature. Although there is no statutory enforcement in the Cayman Islands of judgments obtained in the United States, courts of the Cayman Islands will recognize and enforce a foreign judgment of a court of competent jurisdiction if such judgment is final, for a liquidated sum, provided it is not in respect of taxes or a fine or penalty, is not inconsistent with a Cayman Islands’ judgment in respect of the same matters, and was not obtained in a manner which is contrary to the public policy of the Cayman Islands. In addition, a Cayman Islands court may stay proceedings if concurrent proceedings are being brought elsewhere.
Judgments of Brazilian courts to enforce our obligations with respect to our Ordinary Shares will be payable only in reais.
Most of our assets are located in Brazil. If proceedings are brought in the courts of Brazil seeking to enforce our obligations in respect of our Ordinary Shares, we will not be required to discharge our obligations in a currency other than the real. Under Brazilian exchange control laws, an obligation in Brazil to pay amounts denominated in a currency other than the real will only be satisfied in Brazilian currency at the exchange rate, typically as determined by the Central Bank, in effect on the date (i) of actual payment, (ii) on which such judgment is rendered, or (iii) on which collection or enforcement proceedings are started against us, and such amounts are then adjusted to reflect exchange rate variations through the effective payment date. The then-prevailing exchange rate may not afford non-Brazilian investors with full compensation for any claim arising out of or related to our obligations under our Ordinary Shares.
We may be unable to satisfy listing requirements in the future, which could limit investors’ ability to effect transactions in our securities and subject us to additional trading restrictions.
If we fail to satisfy the continued listing requirements of Nasdaq such as any applicable corporate governance requirements or the minimum closing bid price requirement, Nasdaq may take steps to delist our securities. Such a delisting would likely have a negative effect on the price of our securities and would impair your ability to sell or purchase the securities when you wish to do so. In the event of a delisting, we can provide no assurance that any action taken by us to restore compliance with listing requirements would allow our securities to become listed again, stabilize the market price or improve the liquidity of our securities, prevent our securities from dropping below Nasdaq’s minimum bid price requirement or prevent future non-compliance with Nasdaq’s listing requirements. If we are delisted, there could be significant material adverse consequences, including:
•a limited availability of market quotations for our securities;
•a limited amount of news and analyst coverage for us; and
•a decreased ability to obtain capital or pursue acquisitions by issuing additional equity or convertible securities.
57
Additionally, if our securities are not listed on, or become delisted from, Nasdaq for any reason, and are quoted on the OTC Bulletin Board, an inter-dealer automated quotation system for equity securities that is not a national securities exchange, the liquidity and price of our securities may be more limited than if our securities were quoted or listed on Nasdaq or another national securities exchange. You may be unable to sell your securities unless a market can be established or sustained. We may be unable to maintain the listing of our securities in the future.
The market price of our equity securities may be volatile, and your investment could suffer or decline in value.
The stock exchanges, including Nasdaq, on which certain of our securities are listed as described elsewhere herein, may from time to time experienced significant price and volume fluctuations. Even if an active, liquid and orderly trading market is sustained for our Ordinary Shares and Warrants, the market price of our Ordinary Shares and Warrants may be volatile and could decline significantly. Given the recent price volatility of our Ordinary Shares and relative lack of liquidity therein, there is no certainty that warrantholders will exercise their Warrants and, accordingly, we may not receive any proceeds in relation to our outstanding Warrants. In addition, the trading volume in our Ordinary Shares and Warrants may fluctuate and cause significant price variations to continue to occur. We cannot assure you that the market price of our Ordinary Shares and Warrants will not continue to fluctuate widely or decline significantly in the future in response to a number of factors, including, among others, the following:
•certain of the Selling Securityholders purchased the securities registered for resale under the Resale Registration Statement at prices that are lower than the current market prices for such securities and, accordingly, may be or are incentivized to sell them under the Resale Registration Statement (for example, the Sponsor acquired its SPAC Private Warrants for US$1.50 per warrant, and each Warrant is exercisable for one Ordinary Share at an exercise price of US$11.50 per share);
•the Ordinary Shares (including Ordinary Shares underlying Warrants) offered under the Resale Registration Statement exceeded the total number of outstanding Ordinary Shares as of June 30, 2023, and sales of a significant number of such Ordinary Shares could materially adversely affect the trading prices of our securities;
•failure to comply with the requirements of Nasdaq;
•failure to comply with the Sarbanes-Oxley Act or other laws or regulations; and
•failure of securities analysts to initiate or maintain coverage of us, changes in financial estimates by any securities analysts who follow us or our failure to meet these estimates or the expectations of investors.
In addition, if our performance does not meet market expectations, the price of our securities may decline. Fluctuations in the price of our securities could contribute to the loss of all or part of your investment. Factors affecting the trading price of our Ordinary Shares and Warrants may also include:
•actual or anticipated fluctuations in our quarterly financial results or the quarterly financial results of companies perceived to be similar to us;
•changes in the market’s expectations about operating results;
•our operating results failing to meet market expectations in a particular period;
•operating and stock price performance of other companies that investors deem comparable to us;
•changes in laws and regulations affecting our business;
•commencement of, or involvement in, litigation involving us;
•changes in our capital structure, such as future issuances of securities or the incurrence of debt;
•any significant change in our board or management;
58
•sales of substantial amounts of our Ordinary Shares by our directors, executive officers or significant shareholders or the perception that such sales could occur; and
•general economic and political conditions such as recessions, interest rates, fuel prices, international currency fluctuations and acts of war or terrorism.
Broad market and industry factors may depress the market price of our Ordinary Shares and Warrants irrespective of our operating performance. The stock market in general has experienced price and volume fluctuations that have often been unrelated or disproportionate to the operating performance of the particular companies affected. The trading prices and valuations of these stocks, and of our securities, may not be predictable. A loss of investor confidence in the market for companies engaging in the agricultural industry or the stocks of other companies which investors perceive to be similar to us could depress the price of our Ordinary Shares regardless of our business, prospects, financial conditions or results of operations. A decline in the market price of our Ordinary Shares and Warrants also could adversely affect our ability to issue additional securities and our ability to obtain additional financing in the future.
Moreover, in the past, following periods of volatility in the trading price of a company’s securities, securities class action litigation has often been instituted against that company. If we were to be involved in any similar litigation, we could incur substantial costs and our management’s attention and resources could be diverted, which would have a material adverse effect on us.
The exercise of our Warrants for our Ordinary Shares would increase the number of shares eligible for future resale in the public market and result in dilution to our shareholders.
Our Warrants to purchase our Ordinary Shares became exercisable in accordance with the terms of the Warrant Agreement on March 30, 2023, which was 30 days after the completion of the Business Combination. The exercise price of our Warrants is US$11.50 per share. Therefore, as from when our Warrants became exercisable, if and when the trading price of the Ordinary Shares is less than US$11.50, we expect that warrantholders would not exercise their Warrants. To the extent such warrants are exercised, additional Ordinary Shares will be issued, which will result in dilution to the holders of our Ordinary Shares and increase the number of shares eligible for resale in the public market. Sales of substantial numbers of such shares in the public market or the fact that such warrants may be exercised could adversely affect the market price of our Ordinary Shares. However, there is no guarantee that our Warrants will ever be in the money prior to their expiration, and as such, the Warrants may expire worthless.
We may redeem your unexpired Warrants prior to their exercise at a time that is disadvantageous to you, thereby making your Warrants worthless.
We have the ability to redeem our outstanding Public Warrants at any time prior to their expiration at a price of US$0.01 per warrant, provided that the last reported sales price of our Ordinary Shares is equal to or exceeds US$18.00 per share (as adjusted for share sub divisions, share capitalizations, rights issuances, subdivisions, reorganizations, recapitalizations and the like) for any 20 trading days within a 30 trading-day period ending on the third trading day prior to the date they send the notice of redemption to the warrantholders (the price for such period, the “Reference Value”). If and when the Public Warrants become redeemable by us, we may not exercise our redemption right if the issuance of shares upon exercise of the Public Warrants is not exempt from registration or qualification under applicable state blue sky laws or if we are unable to effect such registration or qualification. We will use our best efforts to register or qualify such shares under the blue sky laws of the state of residence in those states in which the Warrants were offered by us. Redemption of the outstanding Public Warrants could force you (i) to exercise your Public Warrants and pay the exercise price therefor at a time when it may be disadvantageous for you to do so, (ii) to sell your Public Warrants at the then-current market price when you might otherwise wish to hold your Public Warrants or (iii) to accept the nominal redemption price which, at the time the outstanding Public Warrants are called for redemption, is likely to be substantially less than the market value of your Public Warrants.
In addition, we may redeem your Public Warrants at any time prior to their expiration at a price of US$0.10 per warrant if, among other things, the Reference Value equals or exceeds US$10.00 per share (as adjusted for share sub-divisions, share capitalizations, reorganizations, recapitalizations and the like). The value received upon exercise of the Public Warrants (1) may be less than the value the holders would have received if they had exercised their Public Warrants at a later time where the underlying share price is higher and (2) may not compensate the
59
holders for the value of the Public Warrants, including because the number of shares received is capped at 0.361 of our Ordinary Shares per warrant (subject to adjustment) irrespective of the remaining life of the Public Warrants.
In the event that we elect to redeem all of the outstanding Public Warrants, we would only be required to have the notice of redemption mailed by first class mail, postage prepaid by us not less than 30 days prior to the redemption date to registered holders of the outstanding Public Warrants to be redeemed at their last address as they shall appear on the registration books.
Our management has the ability to require holders of our Warrants to exercise such Warrants on a cashless basis, which will cause holders to receive fewer Ordinary Shares upon their exercise of the Warrants than they would have received had they been able to exercise their Warrants for cash.
If we call our Warrants for redemption after the redemption criteria have been satisfied, our management will have the option to require any holder that wishes to exercise their Warrant (including any Warrants held by the Sponsor or its permitted transferees) to do so on a “cashless basis.” If our management chooses to require holders to exercise their Warrants on a cashless basis, the number of Ordinary Shares received by a holder upon exercise will be fewer than it would have been had such holder exercised his Warrant for cash. This will have the effect of reducing the potential “upside” of the holder’s investment in us.
The Warrant Agreement designates the courts of the State of New York or the United States District Court for the Southern District of New York as the sole and exclusive forum for certain types of actions and proceedings that may be initiated by holders of our warrants, which could limit the ability of warrant holders to obtain a favorable judicial forum for disputes with our company.
The Warrant Agreement provides that, subject to applicable law, (i) any action, proceeding or claim against us arising out of or relating in any way to the each such agreement will be brought and enforced in the courts of the State of New York or the United States District Court for the Southern District of New York, and (ii) that the parties thereto irrevocably submit to such jurisdiction, which jurisdiction shall be the exclusive forum for any such action, proceeding or claim. The parties also agreed to waive any objection to such exclusive jurisdiction or that such courts represent an inconvenient forum.
Notwithstanding the foregoing, these provisions of the Warrant Agreement will not apply to suits brought to enforce any liability or duty created by the Exchange Act or any other claim for which the federal district courts of the United States are the sole and exclusive forum. Any person or entity purchasing or otherwise acquiring any interest in our warrants will be deemed to have notice of and to have consented to the forum provisions in the applicable agreement. If any action, the subject matter of which is within the scope the forum provisions of the Warrant Agreement, is filed in a court other than a court of the State of New York or the United States District Court for the Southern District of New York (a “foreign action”) in the name of any holder of our warrants, such holder shall be deemed to have consented to: (x) the personal jurisdiction of the state and federal courts located in the State of New York in connection with any action brought in any such court to enforce the forum provisions (an “enforcement action”), and (y) having service of process made upon such warrant holder in any such enforcement action by service upon such warrant holder’s counsel in the foreign action as agent for such warrant holder.
This choice-of-forum provision may limit a warrant holder’s ability to bring a claim in a judicial forum that it finds favorable for disputes with us, which may discourage such lawsuits. Alternatively, if a court were to find this provision of the Warrant Agreement inapplicable or unenforceable with respect to one or more actions or proceedings, we may incur additional costs associated with resolving such matters in other jurisdictions, which could materially and adversely affect our business, financial condition and results of operations.
Risks Relating to Taxation
New Lavoro may be or become a PFIC, which could result in adverse U.S. federal income tax consequences to U.S. Holders of Ordinary Shares or Warrants.
In general, a non-U.S. corporation is a PFIC for U.S. federal income tax purposes for any taxable year in which (i) 50% or more of the value of its assets (generally determined on the basis of a quarterly average) consists of assets that produce, or are held for the production of, passive income, or (ii) 75% or more of its gross income consists of
60
passive income. Passive income generally includes dividends, interest, certain royalties and rents, and gains from the disposition of passive assets. Cash and cash equivalents are passive assets.
Based on the expected composition of New Lavoro’s income and assets and the estimated value of New Lavoro’s assets, New Lavoro does not believe they were a PFIC for the taxable year ending June 30, 2023. However, because New Lavoro’s PFIC status for any taxable year is an annual determination that can be made only after the end of that year and will depend on the composition of New Lavoro’s income and assets and the value of its assets from time to time (including the value of its goodwill, which may be determined in large part by reference to the market price of the Ordinary Shares from time to time, which could be volatile), there can be no assurances New Lavoro will not be a PFIC for its taxable year ending June 30, 2023, or any future taxable year.
If New Lavoro is a PFIC for any taxable year during which a U.S. Holder owns Ordinary Shares,
the U.S. Holder generally will be subject to adverse U.S. federal income tax consequences, including increased tax liability on disposition gains and certain “excess distributions” and additional reporting requirements. Prospective holders of Ordinary Shares and Warrants should consult their tax advisers regarding the application of the PFIC rules to New Lavoro and the risks of owning equity securities in a company that may be a PFIC. See “Item 10. Additional Information—E. Taxation—U.S. Federal Income Tax Considerations—Passive Foreign Investment Company Rules.”
Item 4. Information on the Company
A.History and Development of the Company
New Lavoro is an exempted company incorporated with limited liability in the Cayman Islands on August 25, 2022. New Lavoro owns no material assets other than its direct equity interests in its wholly-owned subsidiaries, Second Merger Sub and Lavoro Agro Limited. In addition, New Lavoro does not operate any business other than through its subsidiaries.
Business Combination
On the Closing Date, we consummated the previously announced Business Combination pursuant to the Business Combination Agreement, by and among us, TPB SPAC, First Merger Sub, Second Merger Sub, Third Merger Sub and Lavoro Agro Limited.
Pursuant to the Business Combination Agreement, on the terms and subject to the conditions set forth therein, on the date immediately prior to the date on which the Third Merger took place, substantially concurrently with and immediately after the closing of the TPB PIPE Investment, (i) First Merger Sub merged with and into TPB SPAC, with TPB SPAC surviving as a direct wholly owned subsidiary of New Lavoro, and (ii) immediately following the First Merger, TPB SPAC, as successor in the First Merger, merged with and into Second Merger Sub, with Second Merger Sub surviving as a direct wholly owned subsidiary of New Lavoro. On the Closing Date, Third Merger Sub merged with and into Lavoro Agro Limited, with Lavoro Agro Limited surviving as a direct wholly owned subsidiary of New Lavoro.
The Business Combination was unanimously approved by TPB SPAC’s board of directors and at the extraordinary general meeting of TPB SPAC’s shareholders held on February 22, 2023 (the “Extraordinary General Meeting”). TPB SPAC’s shareholders also voted to approve all other proposals presented at the Extraordinary General Meeting. Prior to the Closing Date, TPB SPAC public shareholders exercised their redemption rights in respect of 14,663,445 SPAC Class A Ordinary Shares. As a result, immediately prior to the Closing Date, there were 3,372,854 SPAC Class A Ordinary Shares outstanding.
As a result of the SPAC Mergers, (i) each SPAC Class A Ordinary Shares and SPAC Class B Ordinary Share, other than SPAC Ordinary Shares that were owned by TPB SPAC, First Merger Sub or any wholly owned subsidiary of TPB SPAC, were exchanged for Ordinary Shares, at a one-to-one ratio, and (ii) each SPAC Public Warrant and SPAC Private Warrant, each exercisable at US$11.50 per one SPAC Class A Ordinary Share, became a Public Warrant and Private Warrant, respectively, at a one-to-one ratio, on the same terms and conditions prior to such conversion.
61
As a result of the Third Merger, among other things, (i) each Lavoro Agro Limited Share owned by Lavoro Agro Limited, Third Merger Sub or any wholly owned subsidiary of Lavoro Agro Limited immediately prior to the Third Merger was automatically cancelled, and (ii) each Lavoro Agro Limited Share that was issued and outstanding immediately prior to the Third Effective Time (as defined in the Business Combination Agreement) was exchanged into and for all purposes represented only the right to receive a number of validly issued, fully paid and nonassessable Ordinary Shares equal to the Per Share Stock Consideration (as defined in the Business Combination Agreement).
Concurrently with the execution and delivery of the Business Combination Agreement, The Production Board entered into a subscription agreement pursuant to which The Production Board subscribed for and purchased 10,000,000 SPAC Class A Ordinary Shares at US$10.00 per share, for an aggregate purchase price of US$100,000,000. Moreover, certain other related agreements were executed in connection with the Business Combination, including the Voting and Support Agreement, the Lock-up Agreement, the Subscription Agreement, the Sponsor Letter Agreement and the A&R Registration Rights Agreement, each as described in “Item 7. Major Shareholders and Related Party Transactions—B. Related Party Transactions—Transactions Related to the Business Combination” included elsewhere in this annual report.
As a result of the Business Combination, Lavoro Agro Limited has become a wholly owned direct subsidiary of New Lavoro. On March 1, 2023, our Ordinary Shares and Public Warrants commenced trading on Nasdaq under the symbols “LVRO” and “LVROW,” respectively.
Due to the significant number of SPAC Class A Ordinary Shares that were redeemed in connection with the Business Combination, the number of Ordinary Shares that the Selling Securityholders can sell into the public markets pursuant to the Resale Registration Statement may exceed our public float. Furthermore, the 121,640,757 Ordinary Shares registered for sale in the Resale Registration Statement (including Ordinary Shares underlying Warrants) exceed the total number of outstanding Ordinary Shares (116,608,329 outstanding Ordinary Shares as of June 30, 2023, prior to any exercise of the Warrants). In addition, the Ordinary Shares beneficially owned by the Lavoro Original Shareholders represent 84.7% of our total outstanding Ordinary Shares (including 2,951,436 Vesting Founder Shares outstanding as of June 30, 2023) and, subject to the lock-up restrictions described herein, these holders have the ability to sell all of their Ordinary Shares pursuant to the Resale Registration Statement so long as it is available for use. Given the substantial number of Ordinary Shares registered for potential resale by Selling Securityholders pursuant to the Resale Registration Statement (and the concentration of such Ordinary Shares among the Lavoro Original Shareholders in particular), the sale of Ordinary Shares by the Selling Securityholders, or the perception in the market that the Selling Securityholders of a large number of Ordinary Shares intend to sell Ordinary Shares, particularly the Lavoro Original Shareholders, could increase the volatility of the market price of our Ordinary Shares or result in a significant decline in the public trading price of our Ordinary Shares.
In addition, some of the Ordinary Shares being registered for resale were acquired by the Selling Securityholders for prices considerably below the current market price of the Ordinary Shares. Even if the current market price is significantly below the price at the time of the initial public offering of TPB SPAC (as defined herein), certain Selling Securityholders may have an incentive to sell because they have purchased their Ordinary Shares at prices significantly lower than our public investors or the current trading price of the Ordinary Shares and may profit significantly so even under circumstances in which our public shareholders or certain other Selling Securityholders would experience losses in connection with their investment. For additional information, see “Selling Securityholders” and “Item 3. Key Information—D. Risk Factors—Risks Relating to Our Ordinary Shares and Warrants—The Ordinary Shares being registered for resale in this annual report represent a substantial percentage of our outstanding Ordinary Shares and the sale of such securities could cause the market price of our Ordinary Shares to decline significantly.”
Corporate Information
New Lavoro’s registered office is c/o Maples Corporate Services Limited, PO Box 309, Ugland House, Grand Cayman, KY1-1104, Cayman Islands, and New Lavoro’s principal executive office is Av. Dr. Cardoso de Melo, 1450, 4th floor, office 401, São Paulo, SP, 04548-005, Brazil. New Lavoro’s principal website address is www.lavoroagro.com/en/. We do not incorporate the information contained on, or accessible through, New Lavoro’s
62
websites into this annual report, and you should not consider it a part of this annual report. The SEC maintains an Internet site that contains reports, proxy and information statements, and other information regarding issuers that file electronically with the SEC. The SEC’s website is http://www.sec.gov.
Recent Developments
New Financing Transactions
Subsequent to June 30, 2023, through the date of this annual report, certain of our Brazilian and Colombian subsidiaries entered into a number of financing agreements totaling an aggregate principal amount of R$1,250.7 million, with interest rates ranging from CDI Rate plus 1.80% to 3.04% and maturities ranging from October 2023 to September 2024, and COP$24,244.1 million, with interest rates ranging from IBR Rate plus 3.20% to 5.60% and up to 16.60% at a fixed rate and maturities ranging from July 2024 to August 2028. These new financing transactions are in line with our business plan and reflect the seasonality of our business as the last quarter usually demands additional working capital. Our principal new financing agreements are described below:
New Bank Credit Notes and Related Term Loan Facilities
On July 20, 2023, our subsidiary Agrovenci issued a Finame (Financiamento de Máquinas e Equipamentos) Bank Credit Note (Cédula de Crédito Bancário, or “CCB”) to Banco Santander S.A. in an aggregate principal amount of R$100.0 million, with interest accruing at a rate per annum equal to the CDI Rate plus 1.80 % p.a. and maturing on March 15, 2024. This loan is guaranteed by our subsidiaries Pitangueiras and Lavoro Agro Holding S.A..
On July 21, 2023, our subsidiary Produtec issued a Finame CCB to Banco Santander S.A. in an aggregate principal amount of R$100.0 million, with interest accruing at a rate per annum equal to the CDI Rate plus 1.80 % p.a. and maturing on March 15, 2024. This loan is guaranteed by our subsidiaries Pitangueiras and Lavoro Agro Holding S.A..
On July 27, 2023, our subsidiary Agricultura y Servicios S.A.S issued an inversíon note to Banco de Bogotá S.A. in an aggregate principal amount of COP$2,774.1 million, with interest accruing at a rate per annum equal to the IBR Rate plus 5.60 % p.a. and maturing on July 25, 2028.
On July 26, 2023, our subsidiary Agrointegral Andina S.A.S issued a tesorería note to Bancolombia S.A. in an aggregate principal amount of COP$7,500.0 million, with interest accruing at a rate per annum equal to the IBR Rate plus 4.20 % p.a. and maturing on July 25, 2024.
On July 26, 2023, our subsidiary Agrointegral Andina S.A.S issued a tesorería note to Banco de Bogotá S.A in aggregate principal amount of COP$7,500.0 million, with interest accruing at a rate per annum equal to 16.60 % p.a. and maturing on July 25, 2024.
On August 2, 2023, our subsidiary Lavoro Agrocomercial issued a Finame CCB to Banco ABC S.A. in an aggregate principal amount of R$60.0 million, with interest accruing at a rate per annum equal to the CDI Rate plus 2.30% p.a. and maturing on August 15, 2024.
On August 28, 2023, our subsidiary Central Agrícola issued a financial rural products note (cédulo de produto rural financeira), or a CPR-F, to Banco Itaú S.A. in an aggregate principal amount of R$60.0 million, with interest accruing at a rate per annum equal to the CDI Rate plus 2.75% and maturing on March 28, 2024.
On August 29, 2023, our subsidiary Pitangueiras issued a Finame CCB to Banco Alfa S.A. in an aggregate principal amount of R$50.0 million, with interest accruing at a rate per annum equal to the CDI Rate plus 2.40% p.a. and maturing on April 15, 2024.
On August 29, 2023, our subsidiary Produtec issued a Finame CCB to Banco Alfa S.A. in an aggregate principal amount of R$50.0 million, with interest accruing at a rate per annum equal to the CDI Rate plus 2.40% p.a. and maturing on April 15, 2024.
63
On August 30, 2023, our subsidiary Cenagro issued an inversíon note to Banco de Bogotá S.A. in an aggregate principal amount of COP$5,900.0 million, with interest accruing at a rate per annum equal to the IBR Rate plus 5.35% p.a. and maturing on August 30, 2028.
On August 31, 2023, our subsidiary Lavoro Agrocomercial issued a CPR-F to Banco Safra S.A. in an aggregate principal amount of R$50.0 million, with interest accruing at a rate per annum equal to the CDI Rate plus 2.65% and maturing on August 31, 2024.
On September 8, 2023, our subsidiary Floema issued a Finame CCB to Banco Itaú S.A. in an aggregate principal amount of R$60.0 million, with interest accruing at a rate per annum equal to the CDI Rate plus 2.50 % p.a. and maturing on May 15, 2024.
On September 19, 2023, our subsidiary Produtec issued a CPR-F to Banco Safra S.A. in an aggregate principal amount of R$100.0 million, with interest accruing at a rate per annum equal to the CDI Rate plus 2.80% and maturing on October 24, 2024
On September 26, 2023, our subsidiary Agrointegral Andina S.A. issued a tesorería note to Banco de Bogotá S.A. in an aggregate principal amount of COP$4,700.0 million, with interest accruing at a rate per annum equal to the IBR Rate plus 3.20% p.a. and maturing on September 25, 2024.
On September 27, 2023, our subsidiary Lavoro Agrocomercial issued a CPR-F to Banco Daycoval S.A. in an aggregate principal amount of R$50.0 million, with interest accruing at a rate per annum equal to the CDI Rate plus 3.04% and maturing on January 31, 2024.
New Export Credit Notes and Related Term Loan Facilities
On July 5, 2023, our subsidiary Lavoro Agrocomercial issued Export Credit Notes (Nota de Crédito à Exportação, or an NCE) to Banco Citi S.A. in an aggregate principal amount of R$79.7 million, with interest accruing at a rate per annum equal to the CDI Rate plus 2.85% p.a. and maturing on June 28, 2024. This NCE is guaranteed by our subsidiary Lavoro Agro Holding S.A..
On July 5, 2023, our subsidiary Lavoro Agrocomercial issued a 4131 Swap note to Banco Citi S.A. in an aggregate principal amount of R$161.8 million, with interest accruing at a rate per annum equal to the CDI Rate plus 2.98% p.a. and maturing on June 28, 2024. This NCE is guaranteed by our subsidiary Lavoro Agro Holding S.A.
On August 31, 2023, our subsidiary Crop Care Holding issued a 4131 Swap note to Banco Santander S.A. in an aggregate principal amount of R$49.9 million, with interest accruing at a rate per annum equal to the CDI Rate plus 3.40% p.a. and maturing on June 28, 2024.
On September 6, 2023, our subsidiary Pitangueiras issued an NCE to Banco do Brasil in an aggregate principal amount of R$50.0 million, with interest accruing at a rate per annum equal to the CDI Rate plus 2.98% p.a. and maturing on September 7, 2024.
On September 6, 2023, our subsidiary Lavoro Agrocomercial issued an NCE to Banco do Brasil in an aggregate principal amount of R$50.0 million, with interest accruing at a rate per annum equal to the CDI Rate plus 2.86% p.a. and maturing on August 25, 2024. This NCE is guaranteed by our subsidiary Lavoro Agro Holding S.A.
On September 18, 2023, our subsidiary Lavoro Agrocomercial issued a 4131 Swap note to Banco Santander S.A. in an aggregate principal amount of R$28.0 million, with interest accruing at a rate per annum equal to the CDI Rate plus 2.10% p.a. and maturing on October 10, 2024.
On September 28, 2023, our subsidiary Produtec issued a 4131 Swap note to Banco Itaú S.A. in an aggregate principal amount of R$50.0 million, with interest accruing at a rate per annum equal to the CDI Rate plus 2.75% p.a. and maturing on March 28, 2024.
64
On October 11, 2023, our subsidiary Lavoro Agrocomercial issued a 4131 Swap note to Banco Itaú Unibanco S.A. in an aggregate principal amount of R$40.0 million, with interest accruing at a rate per annum equal to the CDI Rate plus 2.60% p.a. and maturing on January 16, 2024.
On October 16, 2023, our subsidiary Lavoro Agrocomercial issued a 4131 Swap note to Banco Santander S.A. in an aggregate principal amount of R$35.0 million, with interest accruing at a rate per annum equal to the CDI Rate plus 2.10% p.a. and maturing on May 16, 2024. This NCE is guaranteed by our subsidiary Lavoro Agro Holding S.A.
Acquisition of Referência Agroinsumos Ltda.
On February 28, 2023, we entered into an agreement to acquire a 70% equity interest in Referência Agroinsumos Ltda., or Referência Agro, an agricultural inputs distributor doing business in the south of Brazil. The purchase price for this transaction (as adjusted) is R$102.1 million, of which R$67.1 million was paid on the closing date and R$35.0 million is expected to be paid one year after the closing date. The transaction closed on July 31, 2023. Because we acquired Referência Agro through our subsidiary Pitangueiras, we currently beneficially own 66.6% of Referência Agro.
B.Business Overview
Overview
We are a leading player in the Latin America agricultural inputs retail market, with operations spread across Brazil and Colombia, and an emergent agricultural input trading company in Uruguay.
We have three reportable segments: (1) the Brazil Cluster, which comprises companies dedicated to the distribution of agricultural inputs such as crop protection, seeds, fertilizers and specialty products, in Brazil; (2) the LATAM Cluster, which includes companies dedicated to the distribution of agricultural inputs outside Brazil (primarily in Colombia); and (3) the Crop Care Cluster, which includes companies that produce and import our own portfolio of private label products including off-patent crop protection and specialty products (e.g., biologicals and specialty fertilizers).
As a result of our scale, differentiated business model, private label specialty products and digital strategy, we offer farmers a comprehensive portfolio of products and services. Our goal is to help our farmer clients succeed by providing omnichannel support throughout the crop cycle via our RTVs (Representante Técnico de Vendas), which are our technical sales representatives, our e-commerce platform and our Minha Lavoro smartphone application. We have a highly skilled and technical salesforce that provides high quality agronomic advisory services, generating value for farmers and, in turn, gaining their trust. With our proprietary database analysis, which is internally known as the Control Tower, we seek to acquire an intimate understanding of our farmer clients and to offer products and services tailored to their specific needs. We have also recently signed a multi-year agreement with Pattern Ag, Inc., or “Pattern Ag,” to deliver new services to farmers that use DNA sequencing and software-based tools to help improve farm productivity, aiming to increase crop yields and reduce farmers’ costs, land and water usage, and carbon footprint. Pattern Ag was founded with an initial investment from an affiliate of the Sponsor and is one of The Production Board’s portfolio companies. This project is still in pilot mode, and the first set of analyses began in June 2023, with orders spanning nearly 80,000 acres in four Brazilian states.
Moreover, we recently partnered with Brasilseg, an insurance company and affiliate of the BB Seguros group, to offer agricultural insurance solutions to Brazilian farmers. Agrotech, an insurance broker company, and Agristamp, an insurance platform, will be responsible for facilitating negotiations between Lavoro and its customers. The partnership reflects our expansion strategy, which seeks to implement integrated services aimed at farmers in a market that is still largely unexplored in Brazil. The type of insurance to be offered is called Agrícola Flex, which provides productivity coverage for soybean, corn and wheat crops. Commercial operations with Agrotech began in the first half of 2023 at all our retail stores in Brazil.
In addition, in June 2023, we announced our partnership with Stenon, a growing German agriculture innovator that has gained the support of The Production Board, an agriculture focused investment holding company based in San Francisco, United States. We believe Stenon’s FarmLab is an innovative tool that utilizes its sensor technology
65
to generate cost efficient on-demand soil analysis in real time, a first-of-a-kind service in Latin America. In partnership with Stenon, Lavoro expects to offer soil analyses to its customers, enabling the precise identification of levels of chemical elements necessary for plant growth and yield optimization, such as nitrogen, phosphorus and magnesium, in addition to measuring other soil parameters such as temperature, pH and moisture in seconds.. Stenon services in partnership with Lavoro were officially launched in South of Brazil in early October 2023, where we deployed 25 real-time soil analysis devices in the state of Paraná and trained more than 100 RTVs.
We occupy a central role in the agribusiness chain: providing small and medium-sized farmers the most suitable agricultural inputs and services to grow their crops at higher yields, which in turn improves their profitability. These small and medium-sized farmers ranging between 100 and 10,000 hectares in planted acreage are typically not serviced directly by agricultural input producers. In Brazil, this segment of the market represents 65% of the cultivated land, whereas large farmers (owning more than 10,000 hectares) and micro farmers (owning less than 100 hectares) represent 15% and 20%, respectively, according to a 2017 census by IBGE. We do not focus on large farmers, who given their sizeable purchase volumes are typically directly serviced by agricultural inputs suppliers.
We have a broad geographical footprint in the countries where we operate. In Brazil, we are present in several states, with meaningful positions in the States of Mato Grosso, Paraná, Minas Gerais, Mato Grosso do Sul, Rio Grande do Sul, and São Paulo, key agriculture centers in the country. In Colombia, we are present in 30 states and are an important agricultural input distributor as well. Our future growth plans include entry into other countries in South and Central America, such as Peru, Chile, Paraguay and Ecuador. Our geographic diversification across the continent provides us with an important risk mitigant to our operations, in particular with respect to potential adverse weather events and the seasonality of specific crop types.
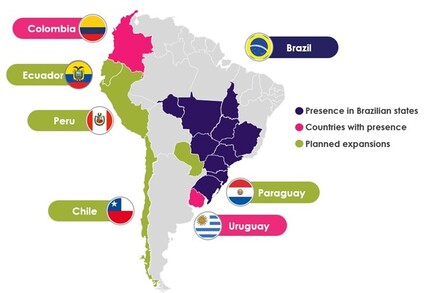
_____________
Source: Company.
As of June 30, 2023, we have 220 physical stores, of which 181 are in Brazil and 39 are in Colombia. On average, it generally costs us approximately US$100,000 to open a new store, and our CAPEX-to-sales ratio has averaged under approximately 1% of sales. Our retail stores represent a footprint covering approximately 150,000,000 acres in Latin America. Our 1,080 RTVs monitor the day-to-day needs of farmers and the evolution of each crop through regular visits. Our technical visits provide a wide range of advisory assistance, including crop-planning, planting and harvest advice, agricultural input selection advice, product application recommendations, among others, which Lavoro believes are important for sales conversion and client loyalty.
66
Understanding our customer needs and providing first rate agronomic and other services is a critical element to our strategy. Building loyalty and trust with small and medium-size farmers is what we believe enables us to gain market share over time. As such, we regularly monitor our performance by conducting an annual survey with our customers to evaluate our Net Promoter Score, or our NPS. For our latest survey in June 2023, we contacted 16,000 customers across 151 stores and 24 subsidiaries. This survey showed an overall NPS of 66 out of 100 for 2022, which was consistent and within the margin of error relative to our NPS of 67 in 2022. In this 2023 survey, on a scale from 1 to 10 (10 being the highest), 73% of our clients responded with a 9 or 10 as their likelihood of recommending us to a friend or colleague, and we further decreased the number of detractors by 1%, a relative improvement as compared to 2022. These results suggest strong and improving satisfaction and brand awareness among our customer base and are a testament to our relentless efforts in optimizing our commercial organization. Our goal is to reach and/or consistently remain a leader in client satisfaction and market share in the regions that we operate. To achieve this will require us to (1) continue to recruit and retain high performing RTVs, and continuously train them to operate at the highest level in terms of their technical and agronomic knowledge, (2) provide our RTVs with the requisite Customer Relationship Management (CRM) and business intelligence tools to improve their productivity and effectiveness of their client interactions, (3) retain our reputation as a reliable distributor of the most in-demand agricultural inputs at competitive prices, even in times of short supply (as was the case in the fiscal year ended June 30, 2022). In addition, our plans of adding new differentiated services and distributing value-add agricultural technology to small and medium-sized farmers, which are particularly underserved at present, will further bolster our reputation as a “one-stop-shop” go-to retailer and improve our wallet share over time.
Maintaining a strong relationship with input suppliers is critical to the success of any agricultural inputs retailers in Latin America. In that respect, we have developed long-lasting relationships with the major agricultural inputs suppliers in the region. Our present scale and high growth relative to the rest of the agricultural retail landscape makes us a vital partner to our suppliers. In addition to distributing third-party products, we also offer our portfolio of private label specialty products and private label products under our Crop Care Cluster. Our Crop Care product portfolio is complementary to the third-party branded products from key suppliers that we also distribute, as we are mindful to not compete and disrupt our close relationships with them. Overall, as a result of our comprehensive portfolio of products, we can offer a customized approach to our farmer clients, and better meet their needs regardless of size, crop type or climate characteristics.
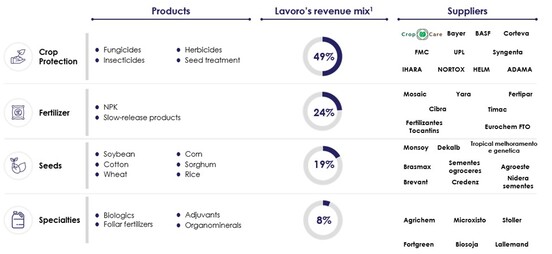
_____________
Source: Company analysis for the fiscal year ended June 30, 2023.
(1)Other revenues represent the remaining 2.0% of input retail revenues.
In addition to the personalized agronomic advisory assistance and agricultural inputs we provide to our clients, we also offer them different methods of payment for our products. For certain contracts with customers, we sell agricultural inputs at term (e.g., seeds, crop protection products, fertilizers, and specialty products) in exchange for the future delivery of grains and oilseeds, mainly soybeans and corn, at the time of their harvest. We call these
67
contracts barter transactions. Barter transactions are important to our clients as a form of supplier financing, as it allows them to use their future production output as currency to purchase agricultural inputs at planting. This barter contract method of financing is a particular feature of the Latin American agricultural industry, especially in row crop farming, and has been common in the region in the past two decades.
The mechanics for these barter transactions are as follows. A contract (grain purchase agreement) is signed prior to the start of the crop planting season between us and our client. The contract stipulates the volume of the commodity to be delivered at harvest in exchange for Lavoro delivery of our input products during the planting period (the credit term is typically 7-9 months). The volume in this contract is determined such as to be equivalent to the negotiated value of the input products to be delivered by Lavoro, and is calculated based on the prevailing future price of that commodity on the signing date of that contract. The client’s main obligation is to deliver the agreed upon volume of commodities as a payment at a future date, and this obligation becomes our collateral in this transaction. Contemporaneously, we enter into a future commodity sale agreement with a commodity trading company, pursuant to which we agree to deliver the commodity to be received from our farmer client under the inputs sale transaction. This agreement is entered into for the same quantity and under the same terms as the contract between us and our client. Since we swap out the liability in-kind with trading houses, our exposure to commodity prices is limited. We also simultaneously fully hedge our foreign exchange exposure via futures and other derivative positions. While this physical sale of the grains is not concluded with trading companies, we may enter into a derivative contract on commodity and futures exchanges such as CBOT, ICE, or B3, in an equivalent term associated with the physical grain purchases. This aims to mitigate our exposure to price fluctuations. Consequently, we maintain these derivative contracts to naturally hedge against market volatility. As soon as the physical sale of the grains is concluded, the derivative contracts are promptly liquidated to realize the hedging gains or losses.
Barter transactions reduce the risk of customer default by guaranteeing our direct access to the farmer client’s harvest. Barter transactions are also an important commercial tool for us; they have the potential to increase client loyalty and allow us to sell farmers a wider and higher-quality range of products. In the fiscal year ended June 30, 2023, 6.8% of our revenue was derived from barter transactions (9.0% in the fiscal year ended June 30, 2022).
We may incur losses if our farmer clients do not meet their obligations under the barter transactions entered into with trading companies, in which case we would need to purchase certain grains in the open market at our expense to close outstanding obligations with trading companies. Moreover, we may incur losses if our farmer clients default on their obligations. In addition to the future grain/oilseed harvest serving as a collateral in these barter contracts, we have an internal credit team leveraging our proprietary credit scoring systems to help us manage and mitigate our credit risk.
The prices of agricultural inputs and crop prices (such as soybean and corn) are subject to volatility resulting from weather conditions, crop yield, transportation costs, storage costs, the Brazilian government agricultural policy, exchange rates and demand for these commodities in the international market, among other factors. If we are unable to pass rising costs onto our farmer clients, or the farmer barter exchange ratios for our clients worsen over time, the demand for our products and our margins may be affected, and we may face significant losses in our operations. See “Item 3. Key Information—D. Risk Factors—Risks Relating to Our Business and Industry—Our operating results are highly dependent upon and fluctuate based upon business and economic conditions and governmental policies affecting the agricultural industry in which we or our customers operate. These factors are outside of our control and may significantly affect our profitability” and “—We may be adversely affected by the ongoing armed conflict between Russia and Ukraine.”
Our History
We first began operations in August 2017 with the acquisition of the Gral Group based in Colombia, which positioned us as a leading retailer of agricultural inputs in the country. In December of the same year, we entered the market in Brazil, with the acquisition of Lavoro Agrocomercial, a prominent player in the agricultural inputs sales industry located in Mato Grosso. Since then, as of the date of this annual report, we have completed a total of 24 M&A transactions in the agricultural inputs market in Colombia and Brazil. The market continues to be fragmented, with several opportunities already mapped by our internal and experienced M&A team. Additionally, since 2019, we began our verticalization strategy of developing and purchasing input suppliers that sell both to Lavoro’s agricultural retail channel, as well as to third-party agricultural retailers. Collectively, this business is called Crop Care Cluster. It
68
began in 2019 when we internally developed Perterra, our own line of off-patent crop protection products. We further strengthened our vertical integration strategy by acquiring Agrobiológica Soluções Naturais Ltda., or Agrobiológica, an agricultural biological player, in 2020; Union Agro, a special fertilizer manufacturer and supplier, in 2021; and Cromo Química, a company specialized in the production of high-performance adjuvants, in 2023. As a result of these acquisitions, we have become one of the leading agricultural inputs players in Brazil in a short period of time, and we continue to consolidate this position by developing our own line of products. The Crop Care Cluster currently operates only in Brazil, with plans to expand to the rest of our footprint.

_____________
Source: Company analysis.
Note: Number of product registrations data as of June 2023; Agrobiológica gross margins data for fiscal year 2023.
Our M&A Strategy
Despite our limited operating history as a consolidated company, we have a proven track record of successfully acquiring and integrating companies. Our expertise allows us to integrate targets within our platform in less than 12 months. Our centralized management model enables us to extract synergies from every transaction, including economies of scale in procurement of agricultural input products, inventory management, logistics and other general and administrative operations. Lavoro also leverages its proprietary credit scoring system to mitigate financial risk for revenue booked via short-term credit to its clients. In addition, with our central structure, we are able to provide centralized services, such as legal, accounting, information technology and human resources, to better integrate each company and bring efficiencies and improve our standard of service.
Moreover, we have successfully executed our synergy plan for the companies we have acquired and accelerated their organic growth. The market in which we operate is still very fragmented and we believe we are one of the best positioned players to lead the consolidation. We have already completed 26 acquisitions since the start of our operations in 2017 and we have a fully dedicated M&A team with 10 professionals with deep expertise in private equity and agribusiness. The revenue of these companies grew considerably in the years following the closing of their acquisitions and at a faster pace compared to their growth before they were acquired. Our leadership and track
69
record uniquely position us to continue consolidating the market and creating value from each acquisition, for our farmer clients, and for our shareholders.
Lavoro’s Management Model
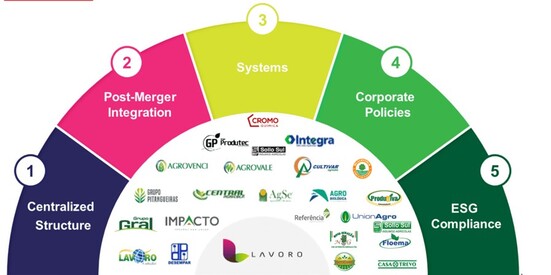 ______
Source: Company.
ESG Agenda: Execution Highlights
Our sustainability policy outlines the shared responsibilities and commitments of our senior leadership, employees, customers, investors, partners, suppliers, and other stakeholders. This policy serves as a guiding document for managing risks and opportunities related to social, environmental, and governance aspects inherent in our corporate, economic, operational, and marketing activities.
Our primary ESG focus areas include food security, climate change, promoting sustainable agriculture, controlling deforestation, and upholding human rights within our value chain, including client operations in rural areas. As a signatory of the United Nations Global Compact (UNGC) in Brazil, we are committed to contributing significantly to achieving UN Sustainable Development Goals 2 (zero hunger), 8 (decent work and economic growth), 12 (responsible consumption and production), and 15 (life on land) through our operations. These priorities drive our dedication to offering innovative biological solutions, low carbon inputs, and specialty fertilizers, such as foliar products and organominerals.
In 2022, we established 20 ESG corporate goals aimed at enhancing our environmental, social, and governance impact on processes and projects related to sustainable agriculture, deforestation prevention, safer and innovative portfolio offerings, occupational health and safety (OHS), human capital development, equal opportunities, and recognition of good socio-environmental practices. We have set a target to achieve these goals by 2025 and will track our progress using key performance indicators that will be regularly reported to our board by our management.
Annually, we conduct a greenhouse gas emissions inventory of our operations, and publish a sustainability report following the Global Reporting Initiative (GRI) protocol, using data from the fiscal year. The governance of sustainability-related matters and ESG performance is under the management of the Strategic Planning department, with a direct reporting line to the CEO and periodic oversight by the Board of Directors.
70
Main Operating and Financial Information
We have delivered rapid growth and profitability. Between July 1, 2021 and June 30, 2023, our number of stores grew at a CAGR of 20% while our historical revenue grew at a CAGR of 36% during the same period.
Key Financial Metrics
The following table presents certain key financial performance metrics as of the dates and for the periods indicated:
| As of and For the Fiscal Year Ended June 30, | |||||||||||||||||||||||
| 2023 | 2023 | 2022 | 2021 | ||||||||||||||||||||
| (in US$)(1) | (in R$) | ||||||||||||||||||||||
| (in millions, except as otherwise indicated) | |||||||||||||||||||||||
Revenue | 1,939.6 | 9,347.4 | 7,746.5 | 5,098.5 | |||||||||||||||||||
Gross margin(2) | 18.5% | 18.5% | 17.1% | 14.4% | |||||||||||||||||||
Profit (loss) for the period/year | (45.4) | (218.7) | 107.8 | 21.5 | |||||||||||||||||||
Adjusted EBITDA(3) | 163.5 | 787.9 | 505.4 | 265.1 | |||||||||||||||||||
Adjusted EBITDA Margin(3) | 8.4% | 8.4% | 6.5% | 5.2% | |||||||||||||||||||
Net Debt(4) | 179.0 | 862.8 | 619.2 | n/a | |||||||||||||||||||
Net Debt/Adjusted EBITDA Ratio(4) | 1.1x | 1.1x | 1.2x | n/a | |||||||||||||||||||
Working capital/revenue(5) | 0.2x | 0.2x | 0.2x | n/a | |||||||||||||||||||
_____________
N/A = Not Applicable.
(1)For convenience purposes only, amounts in reais have been translated to U.S. dollars using an exchange rate of R$4.8192 to US$1.00, the commercial selling rate for U.S. dollars as of June 30, 2023, as reported by the Central Bank. These translations should not be considered representations that any such amounts have been, could have been or could be converted at that or any other exchange rate. See “Item 3. Key Information—D. Risk Factors—Risks Relating to Latin America—Exchange rate instability may impact our ability to hedge exchange rate risk, which may lead to interest rate volatility and have a material adverse effect on the price of our Ordinary Shares.”
(2)Gross margin is calculated as gross profit as a percentage of revenue for the period.
(3)Adjusted EBITDA is defined as profit (loss) for the year, adjusted for finance income (costs), net, income taxes, depreciation and amortization and excluding the impact of certain revenues or expenses that we believe are isolated in nature incurred as part of our expansion, namely: (i) fair value on inventories sold from acquired companies; (ii) M&A adjustments that in management’s judgment do not necessarily occur on a regular basis; (iii) gains on bargain purchases; (iv) listing and other expenses recognized in connection with the Business Combination; (v) share-based compensation expenses; (vi) bonuses paid out to our employees as a result of the closing of the Business Combination; and (vii) expenses paid to Patria in connection with management consultancy services. Adjusted EBITDA Margin is calculated as Adjusted EBITDA as a percentage of revenue for the period. For further information on Adjusted EBITDA and Adjusted EBITDA Margin, see “Presentation of Financial and Other Information—Special Note Regarding Non-IFRS Financial Measures—Adjusted EBITDA and Adjusted EBITDA Margin.” In addition, see “Item 5. Operating and Financial Review and Prospects—A. Operating Results—Non-IFRS Financial Measures and Reconciliations” for a reconciliation of our Adjusted EBITDA and Adjusted EBITDA Margin to our profit (loss) for the year for the period.
(4)Net Debt (Net Cash) is calculated as borrowings (current and non-current) plus payables for the acquisition of subsidiaries (current and non-current), obligations to FIAGRO quota holders, warrant liabilities and liability for FPA shares, less cash equivalents and restricted cash. Net Debt (Net Cash)/Adjusted EBITDA Ratio, also a non-IFRS financial measure, is calculated as Net Debt (Net Cash) divided by Adjusted EBITDA. For further information on Net Debt (Net Cash) and Net Debt (Net Cash)/Adjusted EBITDA Ratio, see “Presentation of Financial and Other Information—Special Note Regarding Non-IFRS Financial Measures—Net Debt (Net Cash) and Net Debt (Net Cash)/Adjusted EBITDA Ratio.” In addition, see “Item 5. Operating and Financial Review and Prospects—A. Operating Results—Non-IFRS Financial Measures and Reconciliations” for a reconciliation of our Net Debt (Net Cash) and Net Debt (Net Cash)/Adjusted EBITDA Ratio to our borrowings.
(5)Working capital/revenue is calculated as working capital as a percentage of revenue for the period/year. Working capital is calculated as the sum of the balance (current and non-current) of trade receivables, inventories, advances to suppliers, taxes recoverable, and other assets less the sum of the balance (current and non-current) of trade payables, advances from customers, salaries and social charges, taxes payable and other liabilities.
71
Operational Data
The tables below show our main operating indicators as of the dates indicated:
| As of June 30, | 2023-2022 Variation (%) | 2022-2021 Variation (%) | |||||||||||||||||||||||||||
| 2023 | 2022 | 2021 | |||||||||||||||||||||||||||
Number of stores | 220 | 193 | 152 | 14.0% | 27.0% | ||||||||||||||||||||||||
Number of RTVs(1) | 1,080 | 924 | 744 | 16.9% | 24.2% | ||||||||||||||||||||||||
Number of employees(2) | 3,778 | 3,379 | 2,375 | 11.8% | 42.3% | ||||||||||||||||||||||||
Number of clients(3) | 74,789 | 60,839 | 47,567 | 22.9% | 27.9% | ||||||||||||||||||||||||
_____________
(1)RTVs (Representante Técnico de Vendas) refer to our technical sales representatives for each of our retail stores, and who develop commercial relationships with farmers.
(2)Includes number of RTVs.
(3)Number of clients refers to the total number of small and medium-sized farmers that purchased products from us in the preceding 12 months.
Our Strategy
Execute our strong M&A pipeline to boost growth
Despite recent M&A activity in the agricultural input market, especially in Brazil, the market remains very fragmented. In Brazil, 89% of independent agricultural input distributors are controlled by their founders, and approximately three-quarters of such distributors mentioned they would be open to M&A discussions according to a 2019 survey by ANDAV. Our dedicated and specialized M&A team constantly monitors our industry, analyzing strategic opportunities to acquire businesses that complement ours and generate shareholder value. We pursue acquisitions of businesses with potential for growth and synergy, as well as businesses that enable our digital transformation. However, we may not be able to identify appropriate acquisition, partnership or joint venture targets in the future, and our efforts to identify such targets may result in a loss of time and financial resources. In addition, we may not be able to successfully negotiate or finance such future acquisitions, partnerships or joint ventures successfully or on favorable terms, or to effectively integrate acquisitions into our current business, and we may lose clients or personnel as a result of any such strategic transaction.
We are increasingly seeking to consolidate our leadership position in the agricultural inputs sales sector in Latin America. Currently, we have mapped over 200 companies in our planned acquisition pipeline. These potential new acquisitions are located largely in the Brazilian states of Minas Gerais, Goiás, Santa Catarina, and Rio Grande do Sul, as well as in Colombia, Chile, Peru, Paraguay, Uruguay and other countries in South and Central America. We also have a number of non-disclosure agreements signed and plan to expand our business into new markets such as in Paraguay as well as in Uruguay, where we currently have an emergent company. The following graphic reflects our acquisition pipeline characteristics:
72
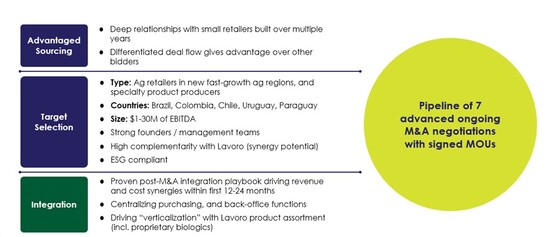
_____________
Source: Company (as of June 30, 2023).
Our inorganic growth strategy, however, may require us to raise additional capital in the future, which may not be available on acceptable terms or at all. If adequate funds are not available or are not available on acceptable terms, we may not be able to fund our expansion, take advantage of acquisition opportunities, develop or enhance our portfolio of agricultural products and services or respond to competitive pressures, which could have a material adverse effect on our business, results of operations and financial condition.
As of June 30, 2023, the aggregate amount of payables for the acquisition of subsidiaries consideration payments we are currently required to make within the next six fiscal years pursuant to our existing acquisitions amounts to R$221.5 million, all of which is required to be paid within the next 12 months.
Continue our organic growth strategy
We intend to continue expanding our network of stores to increase our physical presence in the regions where we operate. To open a new store, we study the regional agricultural production potential, our current store reach, the competitive dynamics in each region, and where we can add value. We expect to continue opening new physical stores in the coming years, in addition to adding new stores from potential M&A targets.
Our broad network of highly trained RTVs is an important strategic asset for us to expand our reach and connect small to medium-sized farmers with the products and services they need. We hire and train as new RTVs both recent graduates from universities and experienced professionals from the industry. This provides us with the right mix of experience and innovative thinking. We have an in-house training program to further develop our RTVs’ technical knowledge and sales management capabilities, at all levels of experience. In general, new hires take two to three years to develop and attain the same level of sales productivity as mature RTV. Thus, we also expect organic growth and margin improvement from recently hired RTVs gaining experience and traction with clients.
Our well-trained RTVs strive to educate our clients on the benefits advanced crop protection, seeds, fertilizers and specialty products have on their crop yields and financial results. Through our incentive compensation structure, we ensure that our RTVs’ interests and those of our farmer clients are well aligned, and that the high-end products that they recommend generate good outcomes for our farmer clients, improve loyalty, and improve our gross margins as well.
Vertically integrate via private label to further expand margins
Our Crop Care Cluster was created in 2019 and is quickly ramping up, with significant revenue growth between 2021 and 2023 (from R$46.8 million in the fiscal year ended June 30, 2021 to R$632.8 million in the fiscal year ended June 30, 2023).
73
Our Crop Care Cluster is comprised of: (1) the import and production of selected off-patent crop protection products via Perterra; (2) the production of biological products via Agrobiológica; and (3) the production of specialty fertilizers via Union Agro and Cromo Química.
We see great potential in our Crop Care Cluster, and especially in our biological products, as Brazil’s tropical weather and particular soil characteristics subject farmers to a high proliferation of pests that need to be controlled. Additionally, Brazil and various other regions of Latin America have two to three crop cycles per year, a low crop rotation, and the repetitive use of the same crop protection products, such that pests there are becoming more resistant to traditional agrochemical products. This situation is unique to Brazil and various other regions of Latin America. It’s worth noting that these dynamics are different than those in the Northern Hemisphere where the winter snow tends to sterilize the soil, fewer crops are grown in a year, and there is greater prevalence of crop rotation. As such, there is a particular need in the Latin American market, especially in Brazil, for new and more effective crop protection products. In that regard, a key benefit of biological products is that they do not have the same loss in efficacy in eliminating pests as is the case with traditional agrochemical crop protection products.
An additional key benefit and driver of biological products demand is the reduction in environmental toxicity and chemical waste, as compared to traditional agrochemicals. Biological products are more ESG-friendly and provide a “win-win-win” solution, as they are more effective for farmers, better at protecting the environment, and generate better margins for Lavoro. With Crop Care, we are at the forefront of product innovation in the industry, and due to the growing adoption of biological products in the countries in which we operate, we expect demand for these products to increase with a resulting positive effect on our consolidated margins as a result of higher margins than our other product categories.
Our Crop Care Cluster products have a higher margin than our traditional agricultural inputs products for two reasons. First, biological products and specialty fertilizers are differentiated products (“specialty products”), and command a higher average price due to their improved results for farmers. Second, given our vertical integration in the specialty products market (where we produce these products in our owned manufacturing sites), we believe we are able to capture the manufacturer margin in addition to the distribution margin, which are additive for us.
We intend to further expand our Crop Care Cluster product portfolio by developing new biological products through R&D, continuing to apply and obtain new product registrations with Brazilian regulators which allows us to import additional off-patent crop protection products, and acquiring other specialty fertilizer and biological companies.
Crop Care Cluster products are sold both to our owned agricultural inputs retail distribution channel, as well as to third-party agricultural retail distributors.
However, we may not be successful in developing new biological products, producing additional off-patent crop protection products or acquiring other special fertilizer and biological companies. The process of creating and producing new products, including the complexity of the approval processes for the production of our private label products, is time-consuming, and only a small percentage of such products may reach the final sales stage. Moreover, selling new products and technology and the sales and distribution strategies we implement may prove ineffective or inadequate. Finally, the incorrect or off-label use of our private label products may damage our reputation or negatively impact our results, and if our products become adulterated, misbranded, or mislabeled, we might need to recall those items and may experience product liability claims. Accordingly, such factors may negatively affect our business and results of operations.
In addition, on May 31, 2023, we completed the successful acquisition of a majority stake of Cromo Química. Cromo Química. Cromo Química specializes in the production of high-performance adjuvants and enhancers for agriculture, focusing on soybean, corn, cotton, and winter crops. The company has a strong presence in the South and Midwest regions of Brazil. We believe that this acquisition will enhance our vertically integrated Crop Care portfolio, which includes biological inputs, specialty fertilizers, and off-patent crop protection products.
74
Further develop planning operations, operational efficiency, and effective distribution
Our focus is on constantly improving our operations, pursuing greater efficiency, and providing better services to our clients. Over the last four years, we have invested in processes, systems and in our team to enable us to manage a sizeable operation while capturing the benefits of scale.
When it comes to processes and structure, our strategy is to centralize and consolidate activities at the corporate level that are fundamental to capturing synergies (e.g., supply and operations planning and purchasing) and retain operational activities that require greater agility and response time (e.g., logistics) decentralized at the regional level. For example, our operations planning team is responsible for ensuring the efficiency of our supply chain. We have a demand planning tool called Plannera that enables collaborative planning between our sales, marketing and operational teams.
Since 2020, we have centralized our negotiations in a professional purchasing structure. This structure is staffed by department managers with deep industry expertise in our main agricultural input product categories. Our department managers use a concerted and systematic approach to consolidate our purchasing needs, and plan for the right moment to place purchasing orders. Our growing scale and centralized purchasing process enables us to capture economies of scale, particularly in commoditized and off-patent products, and to establish strategies to optimize our results in patented, branded and higher end products.
To improve our commercial sales operations and supply chain management, we have implemented Salesforce’s Customer Relationship Management (CRM) tools. We expect the CRM tools to contribute to greater RTV productivity by improving the effectiveness of their client interactions, and by capturing and leveraging data on past RTV-client interactions to help optimize various parts of their sales processes.
We are also striving to attract, train and retain the best RTVs in the regions that we operate. We structure career management plans to ensure RTVs’ success and long-term alignment with Lavoro. We have also created our own proprietary recruitment channel via a trainee program which takes fresh graduates from college agronomy programs and trains them to become successful RTVs. Moreover, in October 2020, we launched Lavoro University, an online platform, to empower our staff with the tools they need to succeed, provide excellent service to our clients, and strive for continuous improvement. Courses at Lavoro University are available to all employees, and are free of charge.
We expect that all of the strategies mentioned will help us improve our operational leverage and margins going forward while making us more effective at serving our farmer clients.
Lead the digital transformation in the Latin American agricultural inputs market
Lavoro Connected Farm is our hub of products and services that digitally integrates our farmer with clients with us and our partners.
75
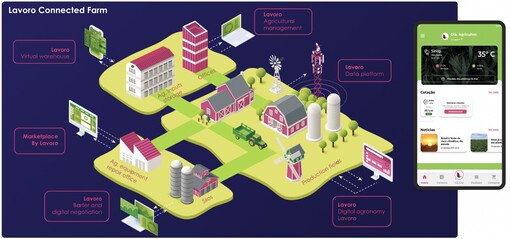
_____________
Source: Company.
The Lavoro Connected Farm has four pillars, which we describe below:
(1)Unified Sales Platform: In the fiscal year ended June 30, 2023, we achieved a total of R$4.0 billion in digitized sales (compared to R$425.0 million in the fiscal year ended June 30, 2022) through the process of implementing SalesForce / SAP across our group's companies. We believe that this digitized sales approach enables us to enhance sales efficiency, standardize data, and expedite decision-making. Our e-commerce platform, which was launched in May 2020, has continued to grow by acquiring new customers and allowing existing customers to request quotes, view products, and complete orders using various payment methods, which we believe bring ease and convenience to our clients. In the fiscal year ended June 30, 2023, our e-commerce platform received over 220,000 online accesses and was responsible for acquiring 1,200 potential clients for Lavoro.
(2)Convenient Mobile Tools: Our smartphone application Minha Lavoro, was developed to create a user-friendly digital interface for our farmer clients to communicate with our RTVs, ask technical questions, place and monitor their purchase orders and delivery schedules, and review our extensive list of products and services. Additionally, our application provides farmers with useful information such as local weather forecasts, commodity prices, request quotes and send them directly to RTVs, among other topics of interest. It also enables them to manage their accounts with Lavoro online, such as their credit usage, purchasing history, status of pending orders, and expected delivery dates. The most recent achievement of our Minha Lavoro smartphone application is enabling our clients to negotiate their grains. In the fiscal year ended June 30, 2023, our Super App was downloaded approximately 14,000 times, and farmers traded R$7.1 million worth of grains through the grain trading feature available on the app. Our application is available on the Apple App Store and on Google Play for users located in Brazil, and we plan to expand services to Colombia in the not-too-distant future.
76

(3)Consolidated Data: We have an extensive internal database, internally known as the Control Tower, which covers a customer’s entire planting and harvest cycle and consolidates data that was previously only available across different systems. We believe that data analysis on this database helps bring us closer to our farmer clients, enabling us to offer the right services at the right time. As of the date of this annual report, we continue to develop this tool.
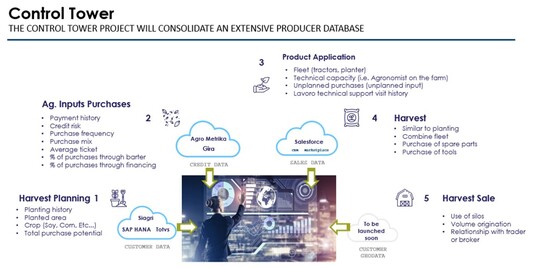
_____________
Source: Company.
(4)Digital services: Going forward, we intend to become the leading digital advisor to our farmer clients. We are actively seeking partnerships with technology solutions that we believe will increase our clients’ productivity, add significant value to their operations, and generate meaningful high-margin service revenue, or market share growth, for Lavoro. These opportunities might include digital agronomy tools,
77
financial services, soil testing services, among others. We are early in this development process and have already started several early-stage experiments with vendors.
With the Lavoro Connected Farm, we seek to transform the way we interact with clients by offering all of the products and services they need in a more convenient and efficient manner. Such integration will mean our farmer clients will no longer have to coordinate with multiple vendors, increasing their productivity and enabling us to increase our wallet share. We expect our model will set us apart from our competitors and make us the “one-stop-shop” retailer for all of farmers’ needs. We utilize numerous third-party service providers in our Lavoro Connected Farm platform, including back office and business process support, information technology production and support, network access and cloud computing, among others. A failure by a third-party service provider could expose us to the risk of being unable to offer Lavoro Connected Farm services to our customers, compromise the quality of our services, and consequently, deteriorate our relationship and reputation with our clients. If we are unable to effectively develop the Lavoro Connected Farm platform, our business and operating results may be adversely affected. See “Item 3. Key Information—D. Risk Factors—Risks Relating to Our Business and Industry.”
Developing our Soil Testing Analysis Activities
On October 21, 2022, Lavoro announced a multi-year partnership with soil metagenomics and digital agronomy leader Pattern Ag to offer farmers in Brazil a service that will help them assess crop risks and nutrient deficiencies and offer specific product recommendations through personalized software experience. Pattern Ag was founded with an initial investment from an affiliate of the Sponsor and is one of The Production Board’s portfolio companies. Given Lavoro’s scale and store footprint, we believe Lavoro is positioned to help bring this advantaged technology service offering to farmers across the country. This strategic partnership expands Lavoro’s portfolio of digital tools and services available to Brazilian farmers. With Pattern Ag, Lavoro plans to offer clients a digital agronomy platform that will help them map their fields, analyze their agronomy data, leverage applied metagenomics sequencing and soil chemistry analysis, and provide specific production application recommendations to clients, helping farmers improve productivity and aiming to increase crop yields and reduce farmers’ costs, land and water usage, and carbon footprint. This project is still in pilot mode, and the first set of analyses began in June 2023, with orders spanning nearly 80,000 acres in four Brazilian states.
In addition, in June 2023, we announced our partnership with Stenon, a growing German agriculture innovator that has gained the support of The Production Board, an agriculture focused investment holding company based in San Francisco, United States. We believe Stenon’s FarmLab is an innovative tool that utilizes its sensor technology to generate cost efficient on-demand soil analysis in real time, a first-of-a-kind service in Latin America. In partnership with Stenon, Lavoro expects to offer soil analyses to its customers, enabling the precise identification of levels of chemical elements necessary for plant growth and yield optimization, such as nitrogen, phosphorus and magnesium, in addition to measuring other soil parameters such as temperature, pH and moisture in seconds. Stenon services in partnership with Lavoro were officially launched in South of Brazil in early October 2023, where we deployed 25 real-time soil analysis devices in the state of Paraná and trained more than 100 RTVs.
Our Competitive Advantages
Our goal is to transform the Latin American agricultural inputs market with our scale, unique business model and execution of our digital strategy. We believe that the following competitive advantages set us apart from our competitors, contributing to our success.
78
We expect to be able to continue delivering strong growth, driven by a proven M&A integration strategy and organic expansion capabilities.
We have a clear track record of acquiring quality assets at an attractive valuation. Since the beginning of our operations in 2017, we have completed 26 acquisitions, as shown in the following figure.
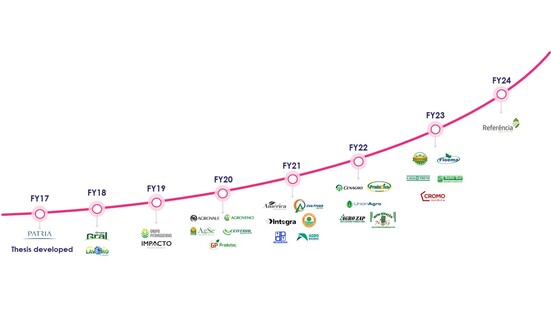
_____________
Source: Company. For a description of our acquisitions, see “Presentation of Financial and Other Information—Our Financial Statements—Acquisitions.”
(*)As of the date of this annual report.
Besides purchasing other companies, we also have the unique ability to significantly accelerate our newly acquired assets’ growth post-acquisition. Between fiscal year 2018 and fiscal year 2023, the revenue CAGR of our acquired companies was on average over two times greater than their respective revenue CAGR for years preceding the transaction’s closing.
Our M&A team is made up of 10 qualified and experienced professionals who are well versed in the intricacies of the agribusiness industry. This allows us to have our own proprietary “deal flow,” avoid competitive bidding processes, and negotiate acquisitions at attractive valuation multiples. Given our experience integrating over 25 acquisitions since 2017, we have developed and continue to create value creation levers and internal management improvements, to generate further operational efficiencies and organic expansion.
We have a prominent leadership position in the Latin American agricultural input retail market.
We are the largest agricultural inputs retailer in Brazil as of the end of the crop year 2023 ending in June according to our internal analysis based on third-party research, and excluding fertilizers as an input (for which third-party data was not available). We are also the top customer of four of the five largest crop protection and seeds suppliers in Brazil. Our scale brings with it competitive advantages that are especially relevant in a market characterized by high fragmentation and a large prevalence of small local resellers. Our back-office operations are located in Curitiba, Brazil, where we consolidate integrated planning, logistics and storage services activities for our entire regional network of stores are consolidated.
79
Brazil Market Size and Lavoro Ranking by State
(in R$ millions)
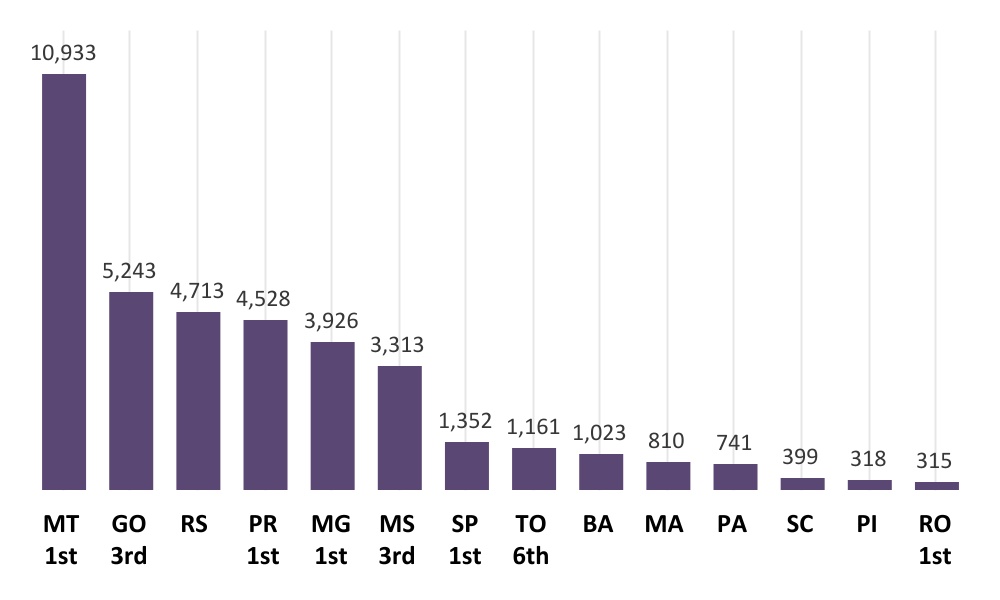
_____________
Source: Kynetec (as to market size) and Company analysis (as to ranking). Chart includes only Brazilian states and considers corn and soybeans crop and crop protection and seeds market in Brazil in 2021/22 harvest.
However, we are subject to risks relating to our significant presence in Latin American countries. Latin America has experienced, and may continue to experience, adverse economic or political conditions that may impact our business, financial condition and results of operations (in particular due to governmental intervention, inflation, exchange rate instability, and disruption or volatility in global financial and credit markets). In addition, as part of our growth strategy, we intend to expand our operations by offering our services in additional international jurisdictions, including in Peru, Chile, Paraguay, Uruguay and other countries in South and Central America. We may not be successful in expanding our operations into these or other markets outside of Brazil, Colombia and Uruguay in a cost-effective or timely manner, if at all, and our products and services may not experience the same market adoption in such jurisdictions as we have enjoyed in the countries where we operate. See “Item 3. Key Information—D. Risk Factors—Risks Relating to Our Business and Industry.”
We are highly diversified across geographies, clients, suppliers and crops.
Our stores and RTVs are located across Brazil and Colombia and we intend to expand our stores and RTVs to cover most of Latin America. We have a multi-product and multi-brand approach, which enables us to cater to numerous small and medium-sized farmers across many regions and have exposure to a wide variety of crops, including soybean, corn, potato, and rice. This wide-ranging sales network is reflected in our customer segmentation: our top 100 clients represented only 19% of our sales in the fiscal year ended June 30, 2023 (16% in the fiscal year ended June 30, 2022).
80
| Geographic diversification | ||
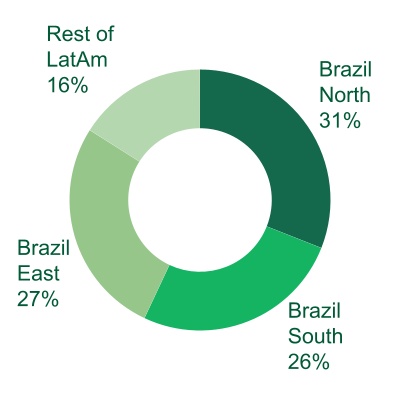
| Client diversification | ||
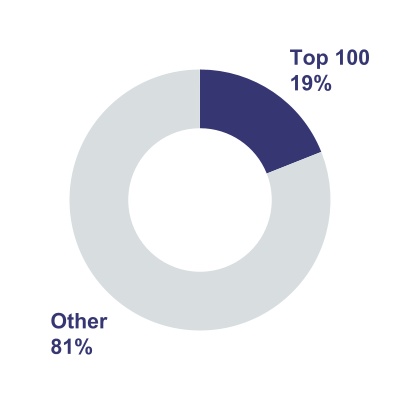
| Supplier diversification | ||
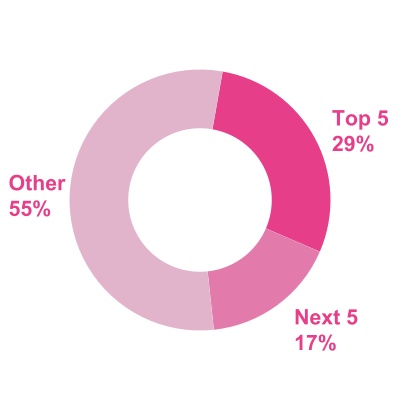
_____________
Source: Company.
Note: Charts consider the breakdown in the fiscal year ended June 30, 2023 of agricultural input revenue, but excludes private label revenues.
Nevertheless, our business is subject to significant risks on the supply side. We cannot guarantee that our suppliers will not engage in improper practices, including inappropriate labor or manufacturing practices, and in the event that our suppliers engage in such improper business practices, our customers’ perception of our business may be adversely affected, which may adversely affect our business, results of operations and our reputation. Moreover, disruptions of the supply or reliability of transportation services and/or changes in transportation service costs, including as a result of infrastructure deficiencies, can affect our sales volumes and selling prices, and interruptions in the production or transportation of certain agricultural inputs we sell could adversely affect our operations and profitability. See “Item 3. Key Information—D. Risk Factors—Risks Relating to Our Business and Industry.”
We are the partner of choice of our farmer clients through our highly trained and engaged sales team.
Our highly skilled RTVs play an important role in developing and building close and long-lasting relationships with our farmer clients. Our RTVs are responsible for providing tailored agronomic recommendations to our clients, helping them select the right products given their specific needs throughout the planting and harvest process.
Our RTVs undergo thorough sales training which covers all aspects of the sales process, and are taught by specialists in sales management. Mandatory training also includes modules on credit policies, integrity, compliance, and data protection. Additionally, training can be complemented through our Lavoro University platform, on which our RTVs and employees can complete elective courses on topics such as leadership, innovation, and time management, among others. Moreover, RTVs occasionally receive training from suppliers covering specific product characteristics or product application techniques.
Our training aims to develop the best RTVs in the market, which translates into satisfied and repeat customers. These long-term relationships are fully reflected in our NPS score. In June 2023, we conducted an NPS survey where we contacted 16,000 customers across 151 stores and 24 subsidiaries. Our overall NPS score was 66 out of 100 for 2022, and on a scale from 1 to 10 (10 being the highest), 73% of our clients responded with a 9 or 10 as their likelihood of recommending us to a friend or colleague. These results are a testament to our client satisfaction and strong brand.
We would not have received such results without our dedicated and engaged team of employees. In our latest employee survey, approximately 2,250 respondents, or approximately 78% of our employees, helped us receive a Great Place to Work ® (GPTW) certification in 2023 (valid through June 2024).
We are a protagonist in the digital transformation of agriculture.
We believe we are in a unique position to lead digital advances in the agricultural sector. Our digital strategy was launched over two years ago with the ambition of connecting farmers to an extensive list of products and
81
services. Our digital and marketing teams extensively studied the primary needs and pain points of farmers along their entire trajectory to create the best solutions for each step of the way through a combination of digital and physical services. The result is an omnichannel experience that offers the convenience and effectiveness of digital tools with the physical support from our team and store network when our farmer clients need it most.
We launched our online platform in May 2020, which consists of a digital marketplace that provides farmers with an online range of products suitable for their needs. In November 2021, we launched an updated version of our e-commerce platform as well as our Minha Lavoro smartphone application, recognizing that farmers need a convenient way to interact with us at any time.
We believe that digital agronomy enables the capture and analysis of valuable actionable data which can be leveraged to drive the next step change in agricultural productivity gains. Farmers in Latin America are at the earliest stages of incorporating and utilizing digital tools to track, analyze, and manage their operations. We intend to bring our clients emerging digital services through an integrated offering, in partnership with select third-parties.
We believe that our digital strategy differentiates us from our competitors and allows us to better connect with our farmer clients. We offer them the products and services they need in one place, right when they need them, avoiding the need to coordinate with multiple vendors. By facilitating their production planning and execution we aim to improve client loyalty.
Our digital transformation will put us at an increased risk, however, that interruption or failure of our infrastructure, information technology and communications systems could impair our operations, which could also damage our reputation and harm our results of operations. For instance, we depend on data centers operated by third parties and third-party Internet hosting providers, and any disruption in the operation of these facilities or access to the Internet, including as a result of cyberattacks, could adversely affect our business. See “Item 3. Key Information—D. Risk Factors—Risks Relating to Our Business and Industry.”
Regulatory Overview
Brazil
Data Protection and Privacy
On August 1, 2021, Brazilian Federal Law No. 13,709/2018, the Brazilian General Data Protection Law (Lei Geral de Proteção de Dados Pessoais), or LGPD, came completely into effect to regulate the processing of personal data in Brazil. The LGPD establishes general principles, obligations and detailed rules to be observed by individuals or public or private companies in operations involving the processing of personal data in Brazil, including the collection, use, processing, storage and any operation carried out with personal data, which affects all economic sectors, including the relationship between customers and suppliers of goods and services, employees and employers and other relationships in which personal data is processed, whether in a digital or physical environment. The LGPD provides for, among others, the rights of data subjects, the legal bases applicable to the processing of personal data, the requisites to obtain consent, the obligations and requisites related to security incidents and leakages and transfers of data, either Brazilian or international, as well as the creation of the National Authority for Data Protection (Autoridade Nacional de Proteção de Dados), or ANPD, responsible for the inspection, promotion, disclosure, regulation, the establishment of guidelines and application of the LGPD.
In case of non-compliance with the LGPD, we can be subject to administrative sanctions applicable by the ANPD on an isolated or cumulative basis, that can range from a warning, obligation to disclose incidents, temporary blocking and/or elimination of personal data related to the infraction, a simple fine of up to 2.0% of our revenue, or revenue of the company or group of companies in Brazil for the last fiscal year, excluding taxes, up to the global amount of R$50,000 thousand per violation, a daily fine, up to the aforesaid global limit, suspension of the operation of the database related to the infraction for a maximum period of six months, which can be extended for an equal period, up to the regularization of the processing by the controlling shareholder, suspension of activities related to processing of personal data related to the infraction for a period of six months, which can be extended for an equal period, and partial or total prohibition to exercise activities related to data processing.
82
The administrative sanctions that are set forth in the LGPD do not prevent the imposition of administrative sanctions set forth by other laws that address issues related to data privacy and protection, such as the Brazilian Code of Consumer Defense and the Brazilian Civil Rights Framework for the Internet. We can also be subject to civil liabilities for violation of these laws.
In addition to the administrative sanctions due to the non-compliance with the obligations established by the LGPD, we can be held liable for individual or collective material damages, and non-material damages caused to data subjects, including when caused by service providers, including SaaS partners, that serve as processors of personal data on our behalf.
Although we do not believe that compliance with these laws and regulations will have a material adverse effect on our business, financial condition or results of operations, the enactment of new data protection and privacy laws and regulations may increasingly affect the operation of our business, directly and indirectly, which could result in substantial regulatory compliance costs, litigation expense, adverse publicity, the loss of revenue and decreased profitability. To this end, we took key steps towards compliance with the LGPD through the calendar year ended December 31, 2021, such as approving information security, privacy and cybersecurity policies, creating an online channel for communications with personal data subjects, and training certain of our personnel on the requirements of the LGPD. We have been taking complimentary actions toward fully complying with the LGPD. Our LGPD adequacy action plan is based on six pillars: governance, data compliance, risk analysis and management, culture and communication, privacy by design and cybersecurity. Our governance, data compliance, risk analysis and management, culture and communication and privacy by design action plans have already been implemented, while our risk cybersecurity action plan is still in the process of being completed. In particular, in order to be fully compliant with the LGPD, we are required to test and prove the effectiveness of our backup and data recovery plan. As a result, we will only be fully compliant with the LGPD once this pending step of our action plan has been completed.
For more information, see “Item 3. Key Information—D. Risk Factors—Risks Relating to Our Business and Industry—We are subject to costs and risks associated with increased or changing laws and regulations affecting our business, including those relating to data privacy, security and protection.”
Anti-Corruption and Sanctions
We are subject to anti-corruption, anti-bribery, anti-money laundering and sanction laws and regulations, including the Brazilian Federal Law No. 12,846/2013, also known as the Clean Company Act. The Clean Company Act prohibits entities from engaging in improper activities to obtain or retain business or to influence a person working in an official capacity. Also prohibits, among other things, providing, directly or indirectly, anything of value to any foreign government official, or any political party or official thereof, or candidate for political influence to improperly influence such a person.
Fertilizers, Agrochemical and Seeds Regulations
Our activities are subject to specific legislation and regulation issued primarily by the Brazilian government, at the federal and local levels, as well as by MAPA, in relation to fertilizers and seeds, and by ANVISA. MAPA and IBAMA for agrochemicals.
Fertilizers, Inoculants, Correctives and Biofertilizers: Companies that perform activities with fertilizers are subject to the requirements provided in Law No. 6,894/1980, Decree No. 4,954/2004 and Normative Instruction No. 53/2013. Establishments that produce, sell, export and/or import fertilizer, inoculant, corrective and biofertilizer products must be registered with MAPA (or its local secretariats) and have a technician duly enrolled with the relevant professional council in charge of its activities. In addition, fertilizers, inoculants, correctives and biofertilizers can only be produced, bought or sold in Brazil upon prior registration with MAPA.
Agrochemicals and Pesticides: Companies that perform activities with agrochemicals are subject to the requirements provided in Law No. 7,802/1989 and Decree No. 4,074/2002. Establishments that produce, formulate, manipulate, export, import, sell, or provide services in connection with the application of agrochemicals and pesticides must register with the relevant local (state or municipal) agricultural office and must have a technician duly enrolled with the relevant professional council in charge of its activities. In addition, agrochemicals and
83
pesticides can only be produced, manipulated, imported, exported, bought or sold in Brazil upon prior registration with MAPA.
Seeds and Plant Varieties: Companies that perform activities with seeds are subject to Law No. 10,711/2013 and Decree No. 10,586/2020. Establishments that pack, process, store, transport, or sell seeds must register with MAPA and the National Registry of Seeds and Seedlings (Registro Nacional de Sementes e Mudas), or RENASEM, and must have a technician duly enrolled with the relevant professional council in charge of its activities. In addition, any such seeds must be certified by RENASEM. Plant varieties can be protected as intellectual property rights under Law No. 9,456/1997, regulated by Decree No. 2,366/1997. To be eligible for protection, plant varieties must comply with certain specific requirements, which include novelty, distinctiveness, homogeneity, stability and denomination. Under sanitary rules, some states and municipalities require establishments to be licensed with local health sanitary authorities to perform activities involving the aforementioned products. In addition, companies operating in these fields are required to have a responsible technician in charge of their activities and to comply with technical and operational requirements aimed at the protection of agriculture, human health and the environment.
Environmental Regulation
The Brazilian Federal Constitution grants each of the Brazilian federal government, state governments and municipalities the power to enact environmental protection laws, issue regulations under such laws and inspect those pollutant activities that are not fulfilling with such regulations. Since 2011, Federal Supplementary Law No. 140 defines the competent authority for granting the environmental licenses. Prior to this law, such matters were regulated by Resolution No. 237/1997, issued by the National Environmental Council (Conselho Nacional do Meio Ambiente, “CONAMA”). While the Brazilian federal government has the power to establish environmental regulations setting forth general standards of environmental protection and broad public environmental policies, state governments have the power to enact more stringent environmental regulations empowered within its own territory. Municipalities may only issue regulations with respect to matters of local interest or that cause local impact.
Each activity undertaken in Brazil considered as potentially polluting must be subject to the environmental licensing. Those activities with a more significant impact must be submitted to a three-phase environmental licensing process:
•Preliminary License (Licença Prévia or “LP”) – issued during the preliminary phase of the project or the activity, approving its location and design, certifying the environmental feasibility and establishing the basic requirements and conditions to be met during the subsequent stages of implementation;
•Installation License (Licença de Instalação or “LI”) – authorizes the construction of the project or activity in accordance with the specifications set forth in the plans, programs and projects approved by the relevant authority, including environmental control measures and other conditions; and
•Operation License (Licença de Operação or “LO”) – authorizes the operation of the activity or project upon verification of compliance with the previous licenses, with environmental control measures and conditions specified for the operation.
The renewal of environmental licenses must generally be requested within 120 days prior to their respective expiration dates. If the renewal of a license is timely requested, its effectiveness is automatically extended until the issuance of a final opinion of the environmental agency on that request. Conversely, if the request is untimely, the license will be deemed to have expired. Moreover, the effectiveness of licenses depends on compliance with the technical conditions established by the competent environmental agency, which are included in the relevant licenses.
In addition, Law No. 9,985/2000 regulates the National System of Conservation Units (Sistema Nacional de Unidades de Conservação, “SNUC”). According to such law and Federal Decrees No. 4,340/2002 and No. 6,848/2009, certain activities deemed to cause an actual or potential significant environmental impact must pay compensation for damages by paying a certain amount to maintain conservation units that is proportionate to the impact caused by such activity, based on information provided in the Impact Environmental Assessment and the respective Impact Environmental Report (Estudo de Impacto Ambiental e respectivo Relatório de Impacto Ambiental, or EIA/RIMA), which is a complex technical study that is the basis for a request for an LP for such
84
activities. The licensing environmental agency will calculate the compensation and its amount will vary, from 0% to 0.5% of the total cost of the investment made for the installation of the project, not including the amount related to the implementation and adoption of environmental programs and plans necessary to mitigate environmental damage.
The lack of environmental licenses to construct, implement, operate, expand or enlarge an enterprise or activity that causes significant environmental impact subjects the wrongdoers to criminal and administrative sanctions, despite the legal obligation to remedy the eventual damages caused. In the administrative sphere, the legislation in force authorizes the imposition of fines ranging from R$500.00 to R$10 million, among other penalties such as warning, embargo, full or partial suspension of the activities and demolition. Please notice that these sanctions are also applicable in case the entrepreneur fails to comply with the technical conditions established in the related environmental license.
Finally, the activities performed in Brazil are also subject to other several environmental legislations in force regarding the natural resources impact, such as specially protected areas, use of water resources, contamination, regular vegetation removals, biodiversity, solid waste management (including generation, storage, handling, use, transportation and discharge of hazardous materials into the ground, air and water), among others.
Colombia
In Colombia, our activities are subject to laws issued by the Colombian government; to regulations enacted by the Ministry of Agriculture and Rural Development (Ministerio de Agricultura y Desarrollo Rural), or the MADR, through the Colombian Agricultural Institute (Instituto Colombiano Agropecuario), or the ICA, and by the Ministry of Environment and Sustainable Development (Ministerio de Ambiente y Desarrollo Sostenible), or the MADS, among other relevant governmental authorities; and to Andean Community regulations (Communidad Andina), or the CAN.
For purposes of article 4 of CAN Decision No. 804/2015, the MADR, through the ICA, is the Colombian authority responsible for keeping a record of and controlling the use chemical pesticides for agricultural use. Likewise, it is the ICA’s responsibility to grant registration for the sale, and exercise legal and technical control, of fertilizers and soil conditioners, genetic material, and seeds in Colombia. In turn, the Colombian Environmental Licensing Authority (Autoridad Nacional de Licencias Ambientales), or ANLA, is the entity that controls and monitors technical environmental reports (such as licenses or technical environmental opinion) relating to the import or marketing of products. In addition, the Colombia Institute of Health (Instituto Nacional de Salud), or the INS, is the entity that issues the opinion and toxicological technical report for pesticides according to the toxicity of the product.
Regulation of Chemical Pesticides
The following are among the resolutions that govern chemical pesticides for agricultural use in Colombia:
•ICA Resolution No. 3,759/2003: sets forth procedures and requirements for the registration and control of chemical pesticides for agricultural use, and provides that manufacturers, producers, importers, exporters, packers and distributors of chemical pesticides for agricultural use must be registered with the ICA;
•MADS Resolution No. 1,675/2013: lists the requirements for management plans for the return of post-consumer pesticide products;
•CAN Decision No. 804/2015: the Andean Community standard for the registration and control of chemical pesticides for agricultural use;
•MADR Decree No. 1,071/2015: a regulatory decree that governs the Colombian administrative, agricultural and rural development sector;
•ICA Resolution No. 2,075/2019: enacts an Andean Community technical manual for the registration and control of chemical pesticides for agricultural use;
85
•ICA Resolution No. 75,487/2020: governs the gradual implementation of the United Nations Globally Harmonized System of Classification and Labelling of Chemicals; and
•ICA-ANLA-INS Joint External Circular No. 2/2020: joint guidelines for modification of registrations of chemical pesticides for agricultural use.
Regulation of Fertilizers
The following are among the resolutions that govern fertilizers for agricultural use in Colombia:
•ICA Resolution No. 150/2003: enacts technical regulations for fertilizers and soil conditioners;
•ICA Resolution No. 68,370/2020: sets forth the requirements for the registration of producers, packers, importers and technical departments of biological agricultural input agronomic efficacy tests for agricultural use, as well as the requirements for the registration of biological agricultural inputs for agricultural use; and
•ICA External Circular No. 4/2020: sets forth procedures to update company and product registration for all holders of current registrations of biological agricultural inputs for agricultural use.
Regulation of Seeds
The following are among the resolutions that govern seeds for agricultural use in Colombia:
•ICA Resolution No. 3,168/2015: regulates the production, import, sale and export of genetically modified seeds in Colombia, and the registration of agronomic evaluation and research units relating to plant breeding; and
•ICA Resolution No. 3,888/2015: amends the foregoing resolution.
Supplementary Standards
The following are among the resolutions that govern chemical pesticides for agricultural use in Colombia:
•INS Resolution No. 10,834/1992: broadens the categories and criteria for the toxicological classification of pesticides;
•Law No. 253/1996 and Law No. 1,623/2012: enacts and modifies, respectively, the Basel Convention on the control of transboundary movements of hazardous waste and its disposal, which includes ordinary waste resulting from the production and use of biocides and phytopharmaceutical products;
•Presidential Decree No. 1,609/2002: establishes technical and safety requirements for the handling and motorway transportation of dangerous products in Colombia;
•Law No. 822/2003: establishes the requirements and procedures for the registration, control and sale of generic agrochemicals in Colombia, including their technical grade active ingredients and their formulations, to minimize the risks of contamination, to human health and to the environment;
•MADR Decree No. 1,071/2015: a regulatory decree that governs the Colombian administrative, agricultural and rural development sector;
•ICA External Circular No. 1/2019: sets forth measures for the import of raw materials and finished products;
•ICA Resolution No. 11,768/2019: governs the reentry period following the application of chemical pesticides for agricultural use in Colombia; and
86
•ICA Resolution No. 2,039/2020: sets forth the rates and formulas for the calculation of environmental management evaluation and monitoring services, and details the ANLA’s purview and monitoring instruments.
Industry Overview
We currently have distribution operations in Brazil and Colombia, and have an emergent agricultural input trading company in Uruguay. Brazil is a world powerhouse in agriculture that produced 273 million tonnes of grains in the 2021/22 harvest (according to Conab), while Colombia has a relevant local market and is a world leader in flower and coffee production. The combined planted area in these amounts to 88.8 million hectares, a number which has consistently grown in the past.
We seek further growth opportunities in other countries in South and Central America, such as Chile, Peru, and Paraguay, as well as Uruguay, where we currently have an emergent company. These countries, which together account for 11.4 million hectares of arable land according to the World Bank, have important local agricultural markets.
Brazil’s Agricultural Sector in a Global and Local Context
Overview
The Brazilian agricultural sector has experienced significant growth in the past decade, with the total grain planted area growing by 3.9% per year during the 2012-2022 period, reaching 74.6 million hectares in 2022, according to Conab. This total planted area is approximately 73% of that of the United States, with 100 million hectares in 21/22 according to the USDA. This places Brazil among the top nations globally in terms of harvested area.
Harvested Area by Country (Top Countries), Millions of Hectares
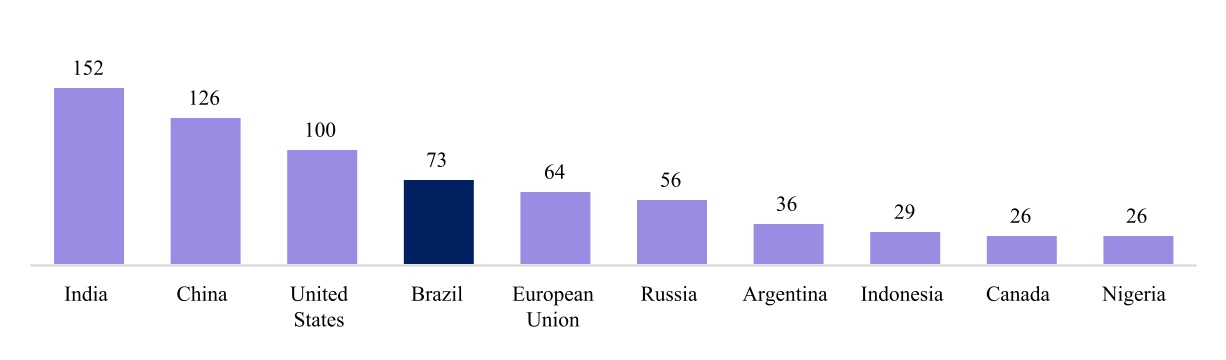
_____________
Source: USDA (2022).
Note: The agricultural commodities included in the calculation are barley, corn, cotton, millet, mixed grain, oats, oil, palm, cottonseed, oilseed, peanut rapeseed, soybean, sunflower seed, rice, milled, rye, sorghum and wheat.
87
In terms of exports, Brazil has been growing at a significant rate, with a CAGR of 8.3% in the last 10 years, according to the USDA. Brazil was the main exporter in terms of total row crop exports in the 2022/23 harvest.
Exports of Row Crops (M tons)
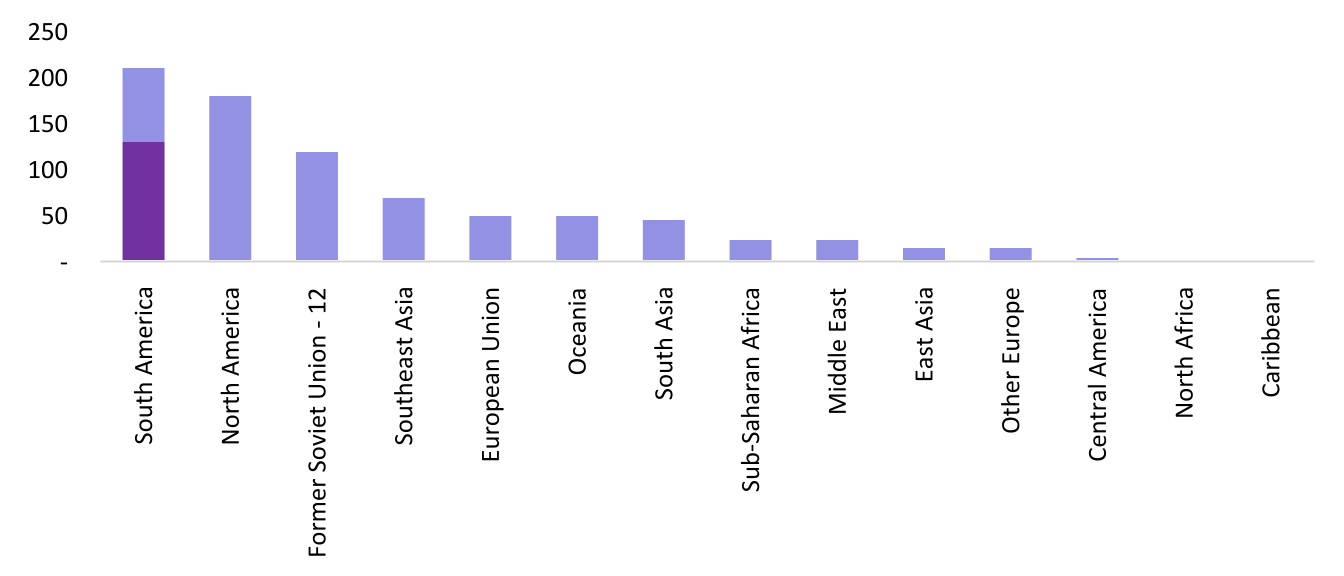
Exports of Row Crops (M tons)
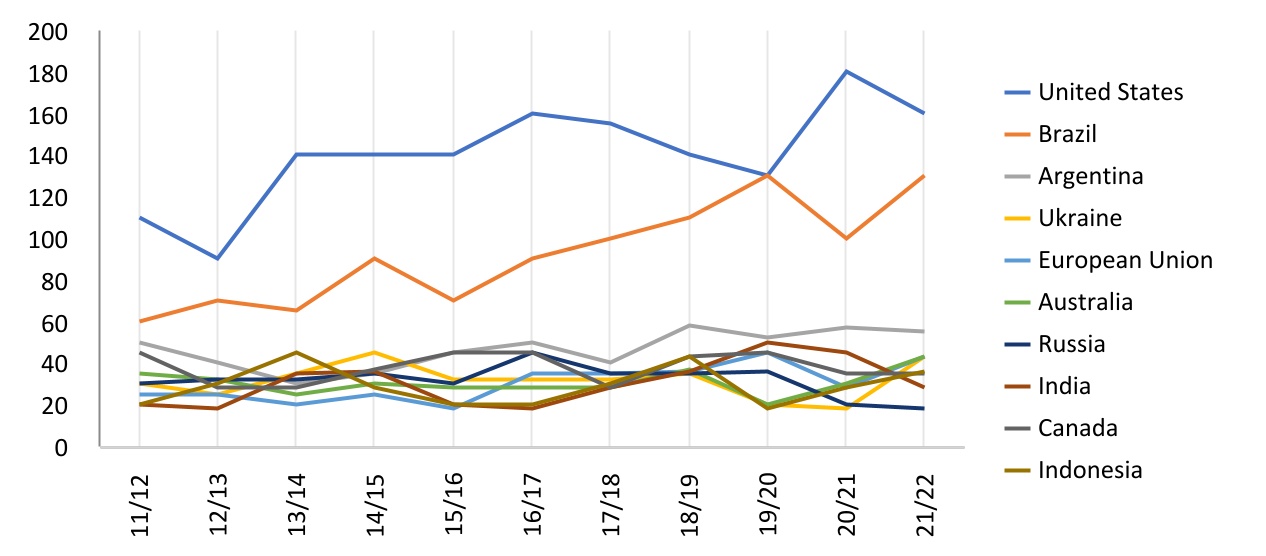
_____________
Sources: USDA (2022).
Note: The agricultural commodities included in the calculation are barley, corn, cotton, millet, mixed grain, oats, oil, palm, cottonseed, peanut, rapeseed, soybean, sunflower seed, rice, milled, rye, sorghum and wheat.
88
According to the Brazilian Agricultural Research Corporation (Empresa Brasileira de Pesquisa Agropecuária), a Brazilian state-run agricultural research agency, Brazil accounted for 8% of global grain production in 2020, while the country’s exports of grains and oilseeds fed approximately 9% of the world’s population in 2020.
Despite a large amount of area already under cultivation, Brazil has plenty of additional room to increase farm production. According to MAPA, there are an additional 47.3 million hectares of natural pasture land which could be converted to planted area, mostly from cattle-breeding areas, representing an additional 56.4% in further potential for agricultural activity.
According to the FAO, Brazil holds the largest available freshwater reserve at 8,233 km3 per year in the world, almost the amount twice that of the second largest, Russia. Additionally, Brazil’s favorable climatic conditions, which includes a relatively stable temperature and the availability of rainfall throughout the year, together with a relatively flat topography, give it an important competitive advantage for agricultural production.
Water Resources by Country (Top Countries), Km3 per Year
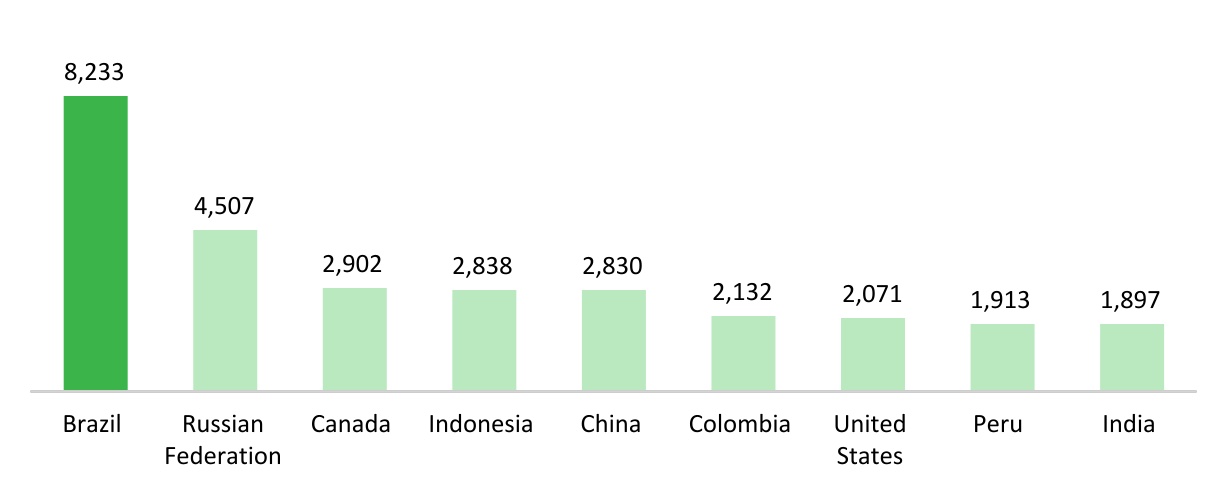
_____________
Source: FAO (2020).
Geographically, the main areas of agricultural activity in Brazil are located in the states of Mato Grosso, Paraná, Rio Grande do Sul, São Paulo, and Goiás. Together, these five states comprise approximately two-thirds of Brazil’s planted area. Together with planted areas located in six additional states, these areas comprise an aggregate of 90% of agricultural activity in the country.
89
Total Planted Area for All Brazilian Agricultural Production, Millions of Hectares by State, 2022
| State | Planted Area (in millions of hectares) | Share of Country-wide Planted Area (%) | ||||||||||||
Mato Grosso (MT) | 17.9 | 22% | ||||||||||||
Paraná (PR) | 10.9 | 14% | ||||||||||||
Rio Grande do Sul (RS) | 9.8 | 12% | ||||||||||||
São Paulo (SP) | 8.0 | 10% | ||||||||||||
Goiás (GO) | 7.3 | 9% | ||||||||||||
Mato Grosso do Sul (MS) | 6.2 | 8% | ||||||||||||
Minas Gerais (MG) | 4.8 | 6% | ||||||||||||
Bahia (BA) | 3.2 | 4% | ||||||||||||
Tocantins (TO) | 1.8 | 2% | ||||||||||||
Maranhão (MA) | 1.8 | 2% | ||||||||||||
Piauí (PI) | 1.7 | 2% | ||||||||||||
All other states | 7.2 | 9% | ||||||||||||
Total | 80.48 | 100% | ||||||||||||
_____________
Source: IBGE.
Corn and soybean are the country’s two principal crops and accounted for 63.1 million hectares, or 85%, of grain planted area in Brazil during the 2021/2022 harvest, according to Conab. The planted area devoted to these two crops has grown at a rate of 4.6% and 5.6% per year, respectively, between 2012 and 2022, according to Conab, faster than the pace of broader agricultural expansion in Brazil. The 2021/22 Brazilian grain harvest reflected a total volume of 273 million tonnes, setting a record for the biggest crop Brazil has ever had, according to Conab. This reflects positively on the economics of farmers, which supports the growth in demand for agricultural inputs.
In the 2021/22 harvest, 41.5 million hectares of soybeans were planted, generating a record 125.5 million tonnes of soybean grain, according to Conab. States with the largest soy output consist of Mato Grosso (33%); Goiás (14%), Paraná (10%); Rio Grande do Sul (7%); and Mato Grosso do Sul (7%), according to Conab. In the same year, 21.6 million hectares of corn were planted in Brazil, with production amounting to 113.1 million tonnes (of which 76% were produced in the second harvest, known as the safrinha). Five Brazilian states contributed approximately three-quarters of the 113.1 million tonnes volume: Mato Grosso (37%); Paraná (15%); Mato Grosso do Sul (11%); Goiás (9%) and Minas Gerais (7%), according to Conab.
Farmers’ Economics and Profitability
Farmers’ profitability is a critical determinant of demand for our products and services, and therefore a metric that we track closely. The financial condition of farmers impacts the production decisions they make, which, in turn, influences the quantity and quality of agricultural inputs they purchase. There are two elements to this position: the health of the farmers’ balance sheets (driven by profits and losses accumulated from past years) and future profitability expectations.
Farmers’ perceptions of agricultural commodity price trends, production costs, credit availability, and level of competition with other major global row crop exporters all factor into the perceived profitability of planting a given crop. All else equal, at the start of a crop cycle, if our farmer clients are more optimistic of their profitability for the upcoming season, based on the relative spread of prevailing crop future prices and their projected inputs spend and operating expenses, they will purchase higher volumes of inputs with a higher mix towards premium products (i.e., higher average selling price) as they aim to maximize their crop yields. Examples of this may include purchasing high performance seeds, selecting biologicals, specialty fertilizers and premium forms of crop protection chemicals, or more intensive application of fertilizers to their land. Conversely, a less favorable financial standing or projected profitability may lead farmers to lower their spend on inputs, both in terms of volume and average mix of premium products. These purchasing decisions, in turn, impact the financial performance of agricultural input retailers. This is
90
primarily expressed in terms of total revenues and gross profit collected over a given season, while product mix also has a significant impact on gross margin generated.
Farmer Profitability in Key Brazilian States for Lavoro, 2023
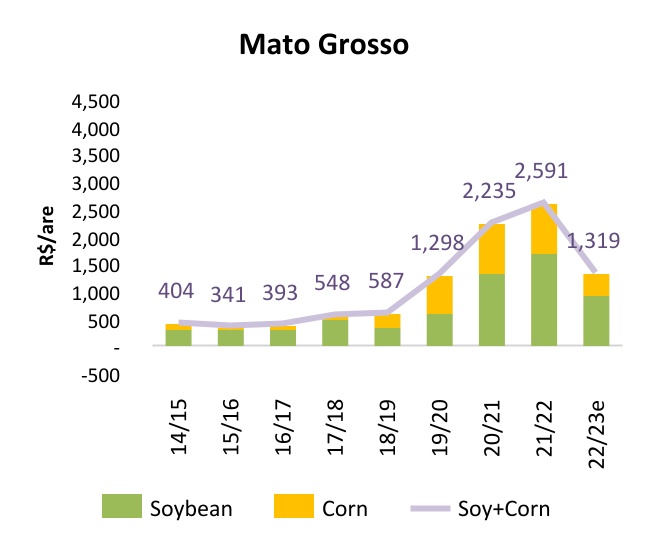
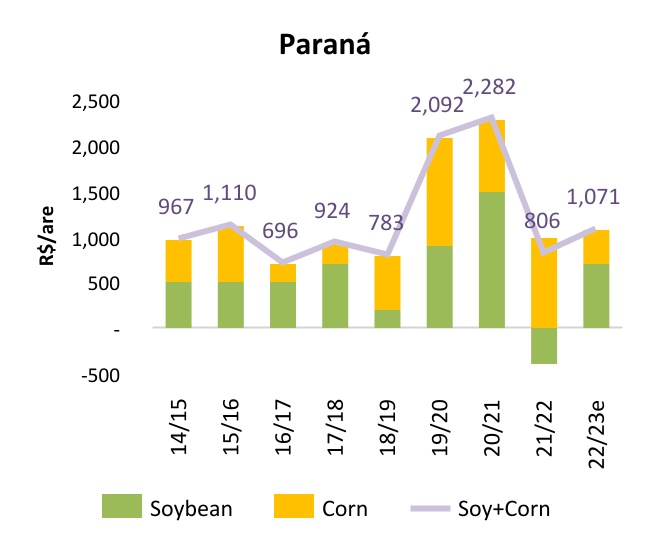
_____________
Source: Company analysis based on data from Agroconsult (2023).
Brazilian farmer economics in Mato Grosso and Paraná, two key states for Lavoro in Brazil, have improved significantly over the past few years. The estimated profits per hectare in these regions have more than doubled in the 2020/21 and 2021/22 harvest years in comparison with the 2018/19 harvest year. This means that Brazilian farmers are generating more profit from the land they utilize and are able to afford more and higher quality inputs for future harvests.
Barter Transactions
Barter is a common form of short-term operational financing for Brazilian farmers, especially in circumstances where financial credit is limited or unavailable. Farmers pledge a portion of their future crop as payment to input suppliers, who in turn provide the seeds, crop protection, fertilizers and specialty products needed at the start of the planting season. Suppliers can choose to take actual delivery of the agricultural products at the end of the season and resell or process them further down the value chain, or to immediately swap the liability with a grain trader and eliminate exposure to commodity prices at harvest time. Barter most commonly occurs with soybeans and corn. The easier it is for farmers to engage in low-risk bartering as a way to finance the current year’s production, the more likely it is that farmers will choose to buy more and better quality of products.
The barter exchange rate (relações de troca) measures how much crop needs to be pledged for a given set of agricultural inputs. For example, the data provided below shows the number of bags of soybeans needed to receive a fixed package of agricultural inputs in return. The barter rate is calculated by dividing input prices by crop prices. Greater volatility in the barter exchange rate of agricultural inputs is caused by larger fluctuations in its global prices. In the 2022/23 harvest, for example, barter rates spiked due to the increased cost of inputs.
91
Soybean Barter Exchange Rate in Mato Grosso, Brazil
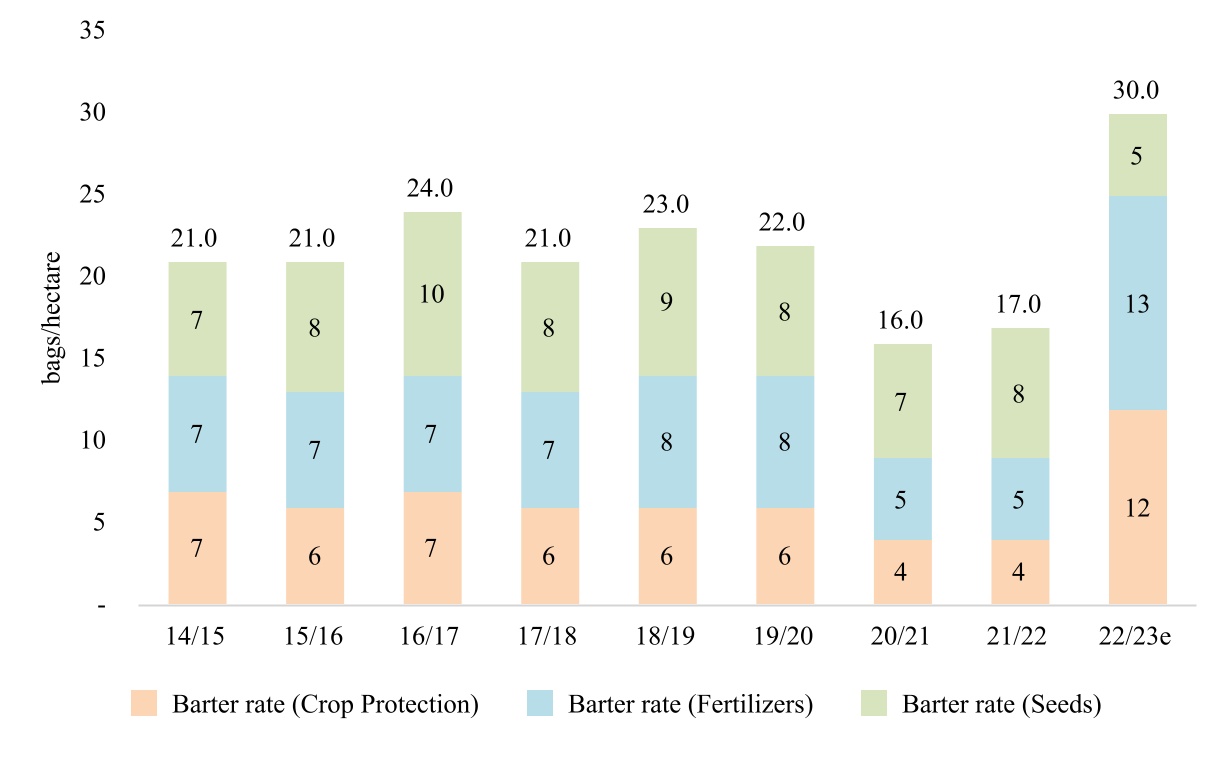
_____________
Source: Agroconsult (2023). Refers to the number of bags of soybeans bartered for a set package of products, consistent over time.
Exchange Rate (BRL/USD) and Brazilian inflation (%)
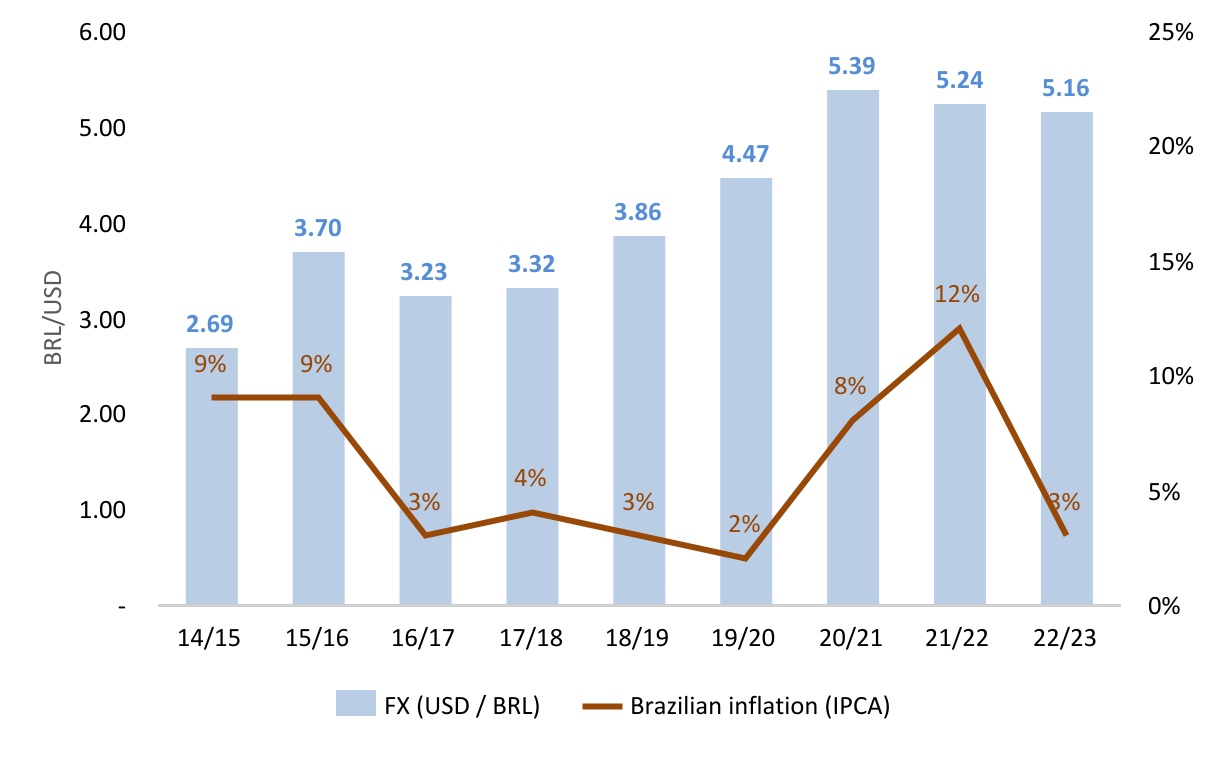
92
_____________
Source: Central Bank and IBGE.
Despite these variations, the barter exchange rate has remained comparatively stable (at least until the 2021/22 harvest year) when contrasted with the accumulated inflation and steadily depreciating exchange rate that Brazilian farmers have had to face during the past decade. The 2022/23 harvest year, however, was an exception due to the global supply crisis of inputs that occurred during the pandemic period, but we expect this situation to be normalized by the 2023/24 harvest year. With this reliable medium of exchange, farmers are more easily able to maintain stable patterns of agricultural input purchases. Furthermore, current high crop prices are likely to strengthen the barter rate in favor of farmers, which supports beneficial near-term demand for agricultural inputs in Brazil. For more information on the accounting policy underlying our barter transactions, see notes 8(g) and 11 to our audited consolidated financial statements included elsewhere in this annual report.
Growth in Agricultural Production
The table below shows the projected growth of the planted area and production volume of all grains in Brazil, according to a 2023 study by MAPA. As we mainly serve grain farmers, the outlook provides an important indication of the trends in our addressable market. The projections for the 2032/2033 harvest are for a grain harvest of 389.4 million tonnes, an increase of 24.1% (from 313.9 million tonnes in 2022 over the 2022/23 harvest), and implying an annual growth rate of 2.4%. The projected improvement of production yields can be supported by the use of better quality seeds, crop protection products, and specialty products, which are more valuable and generate higher margins for agricultural input retailers.
Evolution of Grains Planted Area in Brazil
| Harvest Year | CAGR | ||||||||||||||||||||||||||||||||||||||||||||||||||||||||||||||||||||||
| 2022 / 2023 | 2023 / 2024 | 2024 / 2025 | 2025 / 2026 | 2026 / 2027 | 2027 / 2028 | 2028 / 2029 | 2029 / 2030 | 2030 / 2031 | 2031 / 2032 | 2032 / 2033 | ‘22/’23 -’32/’33 | ||||||||||||||||||||||||||||||||||||||||||||||||||||||||||||
Planted Area (millions of hectares) | 77.5 | 79.5 | 81.3 | 82.8 | 84.3 | 85.6 | 87.0 | 88.3 | 89.7 | 91.0 | 92.3 | 1.7% | |||||||||||||||||||||||||||||||||||||||||||||||||||||||||||
Total Production (millions of tonnes) | 313.9 | 308.8 | 325.3 | 330.2 | 340.5 | 347.9 | 356.6 | 364.6 | 373.0 | 381.1 | 389.4 | 2.4% | |||||||||||||||||||||||||||||||||||||||||||||||||||||||||||
Production Yield (tonnes per hectare) | 4.0 | 3.9 | 4.0 | 4.0 | 4.0 | 4.1 | 4.1 | 4.1 | 4.2 | 4.2 | 4.2 | 0.4% | |||||||||||||||||||||||||||||||||||||||||||||||||||||||||||
_____________
Source: MAPA (Agribusiness Projections – Brazil 2022/2023 to 2032/2033).
According to this MAPA study, soybean production and area are expected to grow at an average annual rate of 2.4% between the 2022/2023 and the 2032/2033 harvests, with production expected to reach 186.7 million tonnes by the latter. This growth is supported by the increased use of soybeans as an ingredient in domestic animal feed, higher overall crop yields, and greater production of biodiesel. In addition, MAPA anticipates that states in the northern region of Brazil, such as Rondônia, Pará and Tocantins, will be the region in which a significant part of the projected production growth will occur.
The MAPA study also forecasts corn production in Brazil is projected to grow at an average annual rate of 2.6% until the 2032/33 harvest, with production reaching 159.8 million tonnes. The growing corn exports, the emerging use of corn as an ethanol feedstock, and a major increase in second corn crop planting are expected to drive this increase, according to the study. The growth of the planted area for corn is expected to grow at a compound annual growth rate of 1.5% during this period.
Corn and soybean production grows at a faster pace than that of its planted area, which could result in better technologies being used in the crop. In fact, according to McKinsey, over 30% of farmers consider input quality the second major attribute after price, 36% of farmers buy equipment/machinery based on performance (compared to 24% based on price), and 47% of farmers use at least one precision agriculture technology. This behavior is also reflected in the better use of products, such as fertilizer use, as shown in the table above.
93
Farm Size
We focus on serving small and medium-sized farmers in Brazil and Colombia. According to Brazil’s National Farm Census of 2017 conducted by IBGE, the small and medium-sized segment (i.e., farms size between 100 and 10,000 hectares) represent approximately 65% of all agricultural land in the country, providing a large addressable market for us to serve, whereas large farmers (owning more than 10,000 hectares) and micro farmers (owning less than 100 hectares) represent 15% and 20%, respectively. Usually, these small and medium-sized farmers do not have the scale to buy directly from agricultural input producers and need additional technical, logistics, and financial support to have a successful crop and harvest.
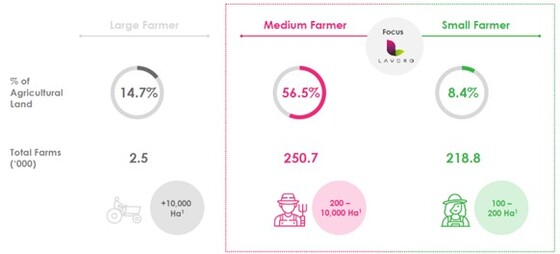
_____________
Source: IBGE (2017).
Agricultural Input Retail Channels
Several different retail channels are available to provide farmers with the necessary products to plant and grow their crops and to improve their efficiency and production yields. These products include seeds, fertilizers, crop protection, and specialty products such as biologicals and specialty fertilizers. In Brazil, sales of these products have been growing at 25% per year on average during the 2018-2023 period, and reaching an estimated R$364.4 billion in 2023 crop, according to our analysis of third-party data.
Farmers can access agricultural inputs from three different channels. They can buy directly from agricultural input manufacturers, though this is usually reserved for large farmers (10,000 hectares or more). They can also buy products via a cooperative, provided that they are a member of such cooperative, or they can buy from independent retailers.
Brazilian Agricultural Input Market Size by Retail Channel Sales
(in R$ billions)
| 2018 | 2019 | 2020 | 2021 | 2022 | 2023E | CAGR 2018/2023E | |||||||||||||||||||||||||||||||||||
Independent Retailers | 46.8 | 56.9 | 63.0 | 79.3 | 102.5 | 140.2 | 24.5% | ||||||||||||||||||||||||||||||||||
Cooperatives | 33.1 | 42.5 | 47.0 | 56.8 | 71.3 | 100.1 | 24.8% | ||||||||||||||||||||||||||||||||||
Direct Sales | 41.0 | 52.7 | 58.3 | 70.4 | 88.4 | 124.1 | 24.8% | ||||||||||||||||||||||||||||||||||
Total | 120.9 | 152.1 | 168.3 | 206.5 | 262.2 | 364.4 | 24.7% | ||||||||||||||||||||||||||||||||||
_____________
Source: Company.
94
Independent Retailers
Since 2018, the market share of independent retailers has remained stable over time at approximately 38% of the total market and reached an estimated R$140.2 billion in 2023.
There are two segments among independent retailers: large, organized retailers, and small to medium-sized independent retailers, as described below:
•Small Independent Retailers. Small independent retailers are dominated by thousands of small, family-owned retailers. This is illustrated by a 2022 survey conducted by ANDAV, which found that 81% of retailers participating in the survey were owned by their founders. Many founders have expressed an interest in receiving M&A offers. Small-scale independent operations generally have a very limited geographic sales range and work with only a few suppliers; and
•Large Independent Retailers. Some large independent retailers are focused only on a particular region, while others have a broader geographical footprint. They generally carry a full product range of seeds, fertilizers, crop protection, and specialty products, and offer products from a wide variety of manufacturers. In addition, some large agricultural input retail chains offer ancillary services, including technical assistance, logistic solutions, precision agronomy, grain trading, seed production, and downstream processing, among others.
Cooperatives
Individual cooperatives are usually focused on serving local clients. For large cooperatives, their product offering can be wide and include a full range of inputs as well as barter services and grain origination. Cooperatives are especially prevalent in the south of Brazil due to historical immigration in this region.
Since 2018, the market share of cooperatives has remained stable over time at approximately 28% of the total market and reached an estimated R$100.1 billion in 2023, as reported in internal studies conducted by the Company.
Direct Sales
Through the direct sales channel, producers and importers of agricultural inputs sell directly to the consumer, bypassing an intermediary supply chain. Usually, only larger farmers can access agricultural inputs directly from agricultural input producers. The major disadvantage to farmers of direct sales is the lack of brand variety offered by an individual seller and more limited logistics and delivery services. As opposed to stores or cooperatives, which stock a variety of goods from different manufacturers, the direct sales option generally offers only a limited range of products that are made or imported by a specific company.
Since 2018, the market share of direct sales hannels has remained stable over time at approximately 34% of the total market and reached an estimated R$124.1 billion in 2023, as reported in internal studies conducted by the Company.
95
Major Agricultural Input Lines in Brazil
The following table sets forth actual and estimated information regarding the major agricultural input retail lines in terms of sales as of the dates presented:
Brazilian Major Agricultural Input Lines Market Size by Sales
(in R$ billions)
| 2018 | 2019 | 2020 | 2021 | 2022 | 2023E | CAGR 2018 - 2022 | |||||||||||||||||||||||||||||||||||
Fertilizers | 39.7 | 46.5 | 52.6 | 68.1 | 84.1 | 119.5 | 20.6% | ||||||||||||||||||||||||||||||||||
Crop Protection | 52.9 | 72.8 | 78.3 | 89.9 | 115.5 | 165.6 | 21.6% | ||||||||||||||||||||||||||||||||||
Seeds | 10.6 | 12.1 | 15.0 | 14.3 | 20.8 | 27.8 | 18.4% | ||||||||||||||||||||||||||||||||||
Specialty Products | 17.8 | 20.8 | 22.3 | 34.2 | 41.6 | 51.4 | 23.6% | ||||||||||||||||||||||||||||||||||
Total | 121.0 | 152.2 | 168.2 | 206.5 | 262.0 | 364.3 | 21.3% | ||||||||||||||||||||||||||||||||||
_____________
Source: Company.
Fertilizers
Nutrients are added to the soil to boost the growth and yield of crops. There are three major forms of fertilizer: nitrogen (commonly applied to the soil as urea); phosphate (commonly applied to the soil as MAP); and potassium (commonly applied to the soil as “MOP”. Collectively, these are also known by the acronym NPK. These products can each be applied individually, or as a compound blend of the three nutrients, in varying concentrations. The application of such products is linked to specific crops, each of which has its specific fertilizer requirements. Maintaining good soil nutrient levels over time is required to maintain high output yields.
Revenues of the NPK market have grown at an average of 21% a year during 2018-2022, and are expected to reach R$119.5 billion in 2023, according to our internal analysis of market data.
Crop Protection
Crop protection chemicals are applied to both crops and the nearby soil to prevent damage to crops while they are growing. There are three major forms of crop protection chemicals: insecticides, which reduce threats from insects and pests, fungicides, which protect against mold and fungi, and herbicides, which eliminate weeds that compete for space and soil nutrients with the planted crops.
The application of crop protection chemicals varies from year to year, depending on the type of crop planted, and ambient soil and weather conditions.
In addition to function, crop protection products can be separated between patented and generic forms of products. Global companies such as Bayer, BASF, Syngenta, and Corteva invest significant resources in research and development to create new substances that combat plant diseases and threats. This results in the generation of new branded products that are protected by patents for a given period of time. After the patents expire, these chemicals are sold in the generic form of the compound at a discount to the branded price. In addition, some generics-producing companies seek to mix different types of chemicals together, creating unique formulations and functions based on off-patent products.
The crop protection market revenues have grown at an average of 22% a year during 2018-2022 and are forecasted to reach R$165.6 billion in 2023, according to our internal analysis of market data.
Seeds
Soybean and corn comprise a large portion of the planted area in Brazil, and are the most important varieties of seeds sold in the Brazilian market. There are two principal factors impacting seed demand: planted area and technological advancement. As the planted area for these two grain crops is forecasted to grow 1.7% per year
96
between the 2022/23 and the 2032/33 harvests, according to a 2023 study by MAPA, the advances in seed technology will drive the increase in overall market size.
For soybean, yield is the main criterion for a farmer’s seed purchase, followed by the choice of the desired plant traits and ascertaining the adaptability of the crop to the farmer’s land, according to our internal analysis. Therefore, a close relationship with farmers and strong branding is key to educating and informing them about the particular characteristics of seeds being offered for sale. In the Cerrado region of Brazil, approximately half of soy seed volumes are sold directly by producers, and the other half is marketed via retailers and cooperatives. In the south of Brazil, sales are mainly conducted through cooperatives and retailers, according to our internal analysis.
Brazilian soybean seeds are almost entirely based on genetically modified organisms, or GMOs, with non-modified products having less than 3% of the market share in 2017, as compared to 12% in 2012, according to our internal analysis. Monsanto had been the dominant supplier in the past. However, due to the expiration of its patents and resistance to glyphosate (RoundUp), other foreign producers such as Corteva, Syngenta and BASF have been introducing GMO seeds with different traits and characteristics. Local independent producers such as Don Mario and TMG also participate in this market. As soybeans can propagate further generations of crops from the same base seed, soybean harvests are genetically tested and cross-checked with the farmer’s identity to ensure that the required royalty has been paid for use of GMOs in the current season.
Corn, in turn, is sowed twice a year in Brazil, in both the summer and winter. During most of the last decade, the demand growth for winter corn seeds has been approximately double the demand for summer corn seeds, according to our internal analysis. The price of corn seeds is correlated with the real/U.S. dollar exchange rate.
The dynamics of the supply of corn seed differ from that of soybeans. Unlike soy, corn seed manufacturing is concentrated in the hands of select companies such as Corteva, Monsanto Bayer, and Syngenta. GMOs are slightly less used, with non-modified seeds comprising 2.2% of the market in 2023, according to our internal analysis. The corn plant does not re-propagate, so no genetic monitoring is required to ensure royalties are paid. Finally, the GMO product itself has already fragmented into several different traits, providing a much broader selection of characteristics to farmers, according to our internal analysis. This implies that future growth could be slower compared to the soybean seed, as there are fewer new technological factors to drive the expansion of market value.
The total Brazilian seed market has been growing at an average of 18% per year between 2018 and 2022, and according to our analysis of market data, should reach a value of R$27.8 billion in 2023.
Specialty Products
The specialty products market contains a diverse group of smaller products that enhance and augment the crop-growing process. These include foliar fertilizer, which are nutrients applied to and absorbed by plant leaves (as opposed to standard fertilizer application on the ground); adjuvants, which improve the effectiveness of crop protection chemicals in penetrating their target; and organominerals and soil correctives, in which trace amounts of certain minerals such as sulphur, magnesium, or boron are applied to improve the chemical balance and fertility of the soil.
The size of the specialty products market has grown at an average of 24% a year during 2018-2022. One of the main drivers of growth is the new adoption of these niche products by farmers. It is forecasted to reach R$51.4 billion in 2023, according to our internal market analysis.
Colombia’s Agricultural Sector
Overview
Colombia’s agricultural sector is smaller and more diverse than that of Brazil. The focus is on more intensive production of various cash crops, as opposed to the expansive planting of grains as is common in Brazil. Colombia had 4.994 million hectares of planted area in 2021, an increase of 6.8% from planted area in 2018, according to our internal analysis. Moreover, agricultural activity in Colombia is expanding, but at a relatively slow pace. Farmed area is forecasted to increase by 3.6% between 2021 and 2025, representing an annual average growth of 0.9%, according to our internal analysis.
97
Evolution of Planted Area in Colombia
| 2018 | 2019 | 2020 | 2021E | 2022E | 2023E | 2024E | 2025E | ||||||||||||||||||||||||||||||||||||||||
Planted Area in Colombia (thousands of hectares) | 4,676 | 4,633 | 4,879 | 4,994 | 5,068 | 5,103 | 5,139 | 5,175 | |||||||||||||||||||||||||||||||||||||||
_____________
Source: Company; Federación Nacional de Cafeteros; Federación Nacional de Arroceros; Departamento Administrativo Nacional de Estadística; Agronet (Ministerio de Agricultura).
Geographically, the main areas of agricultural activity are spread relatively evenly around Colombia, with the top five producing states of Meta, Antioquia, Valle del Cauca, Tolima, and Santander representing approximately 40% of Colombia’s farming activity in 2021, as shown in the table and illustration below:
Planted Area by Colombian State
| State | Planted Area (in thousands of hectares) | Proportion of National Planted Area (%) | ||||||||||||
Meta | 530.6 | 11% | ||||||||||||
Antioquia | 393.3 | 8% | ||||||||||||
Valle del Cauca | 353.7 | 7% | ||||||||||||
Tolima | 338.5 | 7% | ||||||||||||
Santander | 335.2 | 7% | ||||||||||||
Huila | 262.5 | 5% | ||||||||||||
Casanare | 262.0 | 5% | ||||||||||||
Bolivar | 239.9 | 5% | ||||||||||||
Nariño | 236.3 | 5% | ||||||||||||
Cauca | 231.9 | 5% | ||||||||||||
Cundina Marca | 207.3 | 4% | ||||||||||||
Sesar | 189.2 | 4% | ||||||||||||
Cordoba | 187.5 | 4% | ||||||||||||
Magdalena | 161.8 | 3% | ||||||||||||
Norte de Santander | 149.7 | 3% | ||||||||||||
Caldas | 132.4 | 3% | ||||||||||||
Boyaca | 112.3 | 2% | ||||||||||||
Choco | 100.0 | 2% | ||||||||||||
All others | 567.8 | 11% | ||||||||||||
Total | 4,991.9 | 100% | ||||||||||||
_____________
Source: Company; Federación Nacional de Cafeteros; Federación Nacional de Arroceros; Departamento Administrativo Nacional de Estadística; Agronet (Ministerio de Agricultura).
98
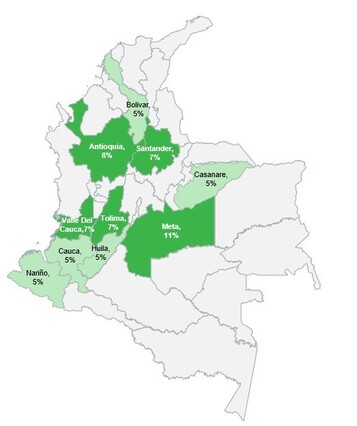
The table below shows the breakdown of major agricultural crops grown in Colombia’s planted areas:
Planted Area by Major Agricultural Crops in Colombia
| Crop | Planted Area (in thousands of hectares) | Proportion of National Planted Area (%) | ||||||||||||
Coffee | 845.9 | 17% | ||||||||||||
Plantain | 661.4 | 12% | ||||||||||||
Oil Palm | 598.1 | 13% | ||||||||||||
Rice | 565.1 | 11% | ||||||||||||
Corn | 512.0 | 10% | ||||||||||||
All others | 1,809.2 | 36% | ||||||||||||
Total | 4,991.7 | 100% | ||||||||||||
_____________
Source: Company; Federación Nacional de Cafeteros; Federación Nacional de Arroceros; Departamento Administrativo Nacional de Estadística; Agronet (Ministerio de Agricultura).
Coffee, oil palm, rice, plantain, and corn are Colombia’s principal crops, representing 3.182 million hectares (64%) of the country’s planted area in 2021. The area devoted to these crops grew 4.3% between 2018 and 2021, a rate lower than the general growth trend in farmed land, which points to the continued diversification of Colombia’s crop profile. Nonetheless, these crops are forecasted to maintain their top-five ranking through 2025 according to our internal analysis of data from Federación Nacional de Cafeteros, Federación Nacional de Arroceros; Departamento Administrativo Nacional de Estadística, and Agronet (Ministerio de Agricultura).
99
Colombian Agricultural Input Market
Total sales for the Colombian agricultural input market reached COP$13,353 million in 2022. This included COP$8,767 million in fertilizer sales, COP$3,822 million in the sale of crop protection products, and COP$773 million in seed sales. The most important purchasing geographies were the states of Meta, Antioquia, and Cundinamarca, which accounted for one-third of all sales during the year. From an individual crop point of view, inputs for coffee, rice and potatoes represented almost half of the agricultural input spending in Colombia in 2022.
Looking forward through 2028, the market is expected to grow at an average annual rate of 0.4%, according to our internal analysis. This growth is explained by the fact that 2022 was a record-high year for prices, and prices are expected to normalize from 2023 onwards. Nevertheless, a recovery of the market is expected for the next few years.
Market Size for Major Agricultural Input Retail Lines
| 2022 | 2025E | CAGR 2022-2025E | |||||||||||||||
(in millions of COP$) | |||||||||||||||||
Fertilizers | 8,767 | 7,422 | (2.7 | %) | |||||||||||||
Crop Protection | 3,822 | 5,046 | 4.7 | % | |||||||||||||
Seeds | 773 | 1,215 | 7.8 | % | |||||||||||||
Total | 13,353 | 13,683 | 0.4 | % | |||||||||||||
_____________
Source: Company.
Agricultural Sector in Other Latin American Countries
We believe Chile, Peru, Uruguay and Paraguay are important avenues for diversification and growth given their combined size and the synergies that they have with our current operations in Brazil and Colombia.
Chile is among the top 10 agricultural exporters in the world. Its main exports include wine, fresh fruit, dairy, meat, and fishery products, according to the International Trade Administration, or the ITA. The agriculture industry, including agricultural-related products, is responsible for 28% of Chile’s overall trade, 11% of its total gross domestic product, and around 10% of the country’s national workforce, as reported by the ITA. According to our internal analysis, planted area in Chile has been declining over the past few years, shrinking by 0.7% per year between 2016 and 2020 to 1.23 million hectares. Despite this overall decline, the orchard fruit and nut market is still showing growth, with its planted area expanding by 2.8% per year during the same period and reaching 362,000 hectares in 2020. This category includes products such as apples, cherries, avocados, and walnuts, which are grown mainly for export. Chile’s agricultural input market grew at an average of 2.1% per year between 2016 and 2020.
Peruvian agriculture represented 6.8% of its gross domestic product in 2020, according to EMIS. That year, Peru’s agricultural exports reached US$7.8 billion, according to the American International Trade Administration. Peru’s harvested area totals 3.4 million hectares, and in 2020, cereal production totaled 5.3 million tonnes according to the FAO. According to our internal analysis, planted area has increased slightly over the past few years, growing by 0.8% per year between 2016 and 2020 to 3.33 million hectares. The fruit market is showing better growth, with its planted area expanding by 2.2% per year during the same period and reaching 440,000 hectares in 2020. This category includes products such as blueberries, avocados, and bananas. The increase in fruit planting has been driven by the completion of irrigation projects and a governmental focus on the conversion of land use for agricultural export products. Peru’s agricultural input market grew at an average of 7.2% per year between 2016 and 2020.
Uruguay’s agriculture accounts for approximately 12% of the country’s gross domestic product and 70% of its total exports, according to the ITA. Its main crops are soybean, rice, wheat and grapes. Uruguay’s harvested area amounts to 1.8 million hectares, as reported by the FAO, and in 2020, cereal production totaled 3.9 million tonnes according to the FAO.
Paraguayan agriculture, together with the forestry and fishing sectors, accounted for approximately 11.0% of the country’s gross domestic product in 2020, according to the World Bank. Harvested area in Paraguay amounts to 6.1
100
million hectares, according to the most recent FAO data. Further, Paraguay produced 3.8 million tonnes of corn and cereal production in the 2019-20 harvest, according to the International Grains Council.
C.Organizational Structure
The following diagram depicts a simplified organizational structure of the Company as of the date hereof.
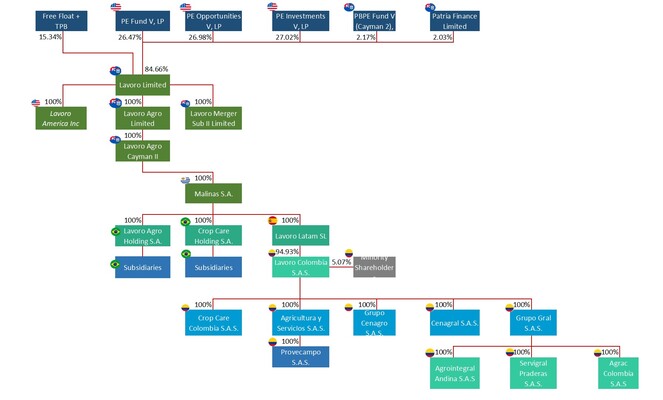
For more information, see “Item 7. Major Shareholders and Related Party Transactions—A. Major Shareholders.”
D.Property, Plants and Equipment
Our corporate headquarters are located in the city of São Paulo, São Paulo State, and our executive offices, which include the majority of our product development, sales, marketing, and business operations, are located in the Brazilian states of São Paulo, Mato Grosso, Goiás, and Paraná, and in Colombia. We rely on lease agreements for all our properties. The lease for our corporate headquarters and principal executive office in São Paulo has been renewed for an indefinite term, and can be terminated upon 30 days’ notice. We also have offices in several other locations, including offshore in the Cayman Islands and in Uruguay, and believe our facilities are sufficient for our current needs.
101
The table below lists the types and number of properties we lease or own as June 30, 2023:
| Type of Property | Number | % of Total | ||||||||||||
Administrative Offices | 10 | 4.2 | % | |||||||||||
Silos | 6 | 2.5 | % | |||||||||||
Stores | 220 | 93.2 | % | |||||||||||
Total | 236 | 100 | % | |||||||||||
We believe that our facilities are suitable and adequate for our business as presently conducted, however, we periodically review our facility requirements and may acquire new space to meet the needs of our business or consolidate and dispose of facilities that are no longer required.
Item 4A. Unresolved Staff Comments
None / Not applicable.
Item 5. Operating and Financial Review and Prospects
A.Operating Results
The following discussion of our financial condition and results of operations should be read in conjunction with our audited consolidated financial statements and the notes thereto. The following discussion contains forward-looking statements that involve risks and uncertainties. Our actual results may differ materially from those discussed in the forward-looking statements as a result of various factors, including those set forth in ”Forward-Looking Statements” and “Item 3. Key Information—D. Risk factors.”
Overview
Lavoro is a leading player in the Latin America agricultural inputs retail market, with operations spread across Brazil and Colombia, and an emergent agricultural input trading company in Uruguay. We play a key role in the agriculture value chain, providing farmers with a comprehensive portfolio of services and products through an omnichannel platform designed for farmers’ needs.
We focus on serving small and medium-sized farmers (owning between 100 and 10,000 hectares), which represent 65% of the total cultivated land in Brazil, whereas large farmers (owning more than 10,000 hectares) and micro farmers (owning less than 100 hectares) represent 15% and 20%, respectively, according to a 2017 census by the IBGE. We have a broad geographical footprint, covering the most important agricultural states in Brazil and Colombia, supported by 220 physical stores and 1,080 RTVs, as of June 30, 2023, as well as our own digital channel anchored by our Minha Lavoro smartphone application.
We have long-lasting relationships with several of the industry’s key suppliers, and as a result, we are able to deliver a comprehensive portfolio of crop protection, fertilizers, seeds and specialty products. We are also investing in a portfolio of private label products through our Crop Care Cluster. In order to provide a full one-stop-shop experience to our farmer clients, we also offer a full package of services, such as technical assistance, logistics solutions, barter offering, seed quality assistance, and precision agronomy.
Lavoro differentiates itself from competitors with a strong mergers and acquisitions, or M&A, execution track record and pipeline, a prominent leadership position in the agricultural inputs retail market in Latin America, a highly diversified operation across geographies, clients, suppliers and crops, highly trained and engaged RTVs to deliver the best service to its clients, and a strong position in the digital transformation of agriculture in the region.
Lavoro recently introduced two pioneering initiatives to offer a more comprehensive and innovative solution to our clients. Through a collaboration with Pattern Ag, we aim to provide Brazilian farmers with advanced soil testing and analysis services. This would allow them to effectively assess crop risks, identify nutrient deficiencies, and receive tailored product recommendations through specialized software. In addition, our partnership with Stenon, a German agricultural innovator, brings real-time, on-demand soil analysis to Brazil, to assist in the precise
102
identification of essential elements for optimal plant growth and yield optimization. We believe that these strategic alliances exemplify Lavoro's commitment to expanding its digital tools and services, thereby empowering our clients to boost productivity, increase crop yields, and streamline costs.
Our financial condition and results of operations have been, or are expected to be, impacted by several significant trends, uncertainties and certain other factors, which primarily include:
◦Farmers’ financial condition, including their ability to purchase our goods and services and our use of barter transactions with farmers as a way of providing them with credit, which we believe is a fundamental aspect of our operational strategy as it helps us manage and mitigate risks relating to farmers’ financial condition.
◦Climatic conditions, as changes in temperature can directly impact crop yields and therefore farmers’ financial condition, which may lead them to reconsider their procurement strategy, including the terms and conditions of their arrangements with us, or change their product purchase mix. We believe that the effects of climatic conditions on our results can be partially mitigated given our broad geographical exposure and continental footprint, in addition to our expertise with different types of crops.
◦Seasonality, as the sale of our products is dependent upon planting and growing seasons, which vary from year to year, and are expected to result in both highly seasonal patterns and substantial fluctuations in quarterly sales and profitability. The seasonality of agricultural inputs demand results in our sales volumes and net sales typically being the highest during the South American spring and summer seasons and our working capital requirements typically being the highest just after the end of the spring season.
◦Macroeconomic and geopolitical environment, as supply and demand dynamics globally can affect our results. The level of demand for our products, exchange rate fluctuations, inflation, interest rates and the occurrence of significant geopolitical events, can all impact both our costs and our revenues. Demand for our products can benefit or be negatively impacted by the global performance of soft commodities (in our case, especially corn and soy), which is one of the most important drivers for the financial condition of farmers in the countries in which we operate. Moreover, changes in the prices of certain commodity products could result in higher overall costs along the agricultural supply chain, which may negatively affect our ability to commercialize our products due to a reduction of demand by our clients. In addition, the occurrence of significant geopolitical developments, such as the ongoing armed conflict between Russia and Ukraine, can adversely affect the global supply chain, with negative implications on the availability and prices of agricultural commodities and raw materials (including petrol, which would affect the price of agricultural inputs), energy prices, and our customers, as well as the global financial markets and financial services industry and the global supply chain in general. In particular, as a result of the ongoing Russia-Ukraine conflict, the availability and pricing of fertilizers for the 2022/2023 soy harvest is subject to significant continuing uncertainty in Brazil, which may adversely affect our results of operations, in particular if we are unable to mitigate any relevant reduction in fertilizer sales volumes through measures such as price increases of other products.
◦Acquisitions, which are a key business strategy to expand our business into new markets or territories, add additional facilities, bolster our competitive edge or acquire and access new technologies and skillsets. We seek targets with suitable qualifications, relationships with key clients, and operations in areas we are already present or toward which we are looking to expand. We seek to capture synergies when integrating our targets within our platform and expect our targets to generate cost synergies through increased bargaining power with suppliers or other cost-cutting measures that take advantage of overlapping resources. We can take advantage of revenue synergies and generate more revenue in many ways, including by reducing competitive pressures, branching out into new geographic regions, expanding our customer base, and increasing cross-selling opportunities, especially with our private label products (i.e., Crop Care). However, we may face challenges in finding suitable acquisition targets, integrating the operations of our acquired companies, and the size and timing of significant transactions may also increase the unpredictability of our operating results.
103
These factors are discussed in greater detail below under “—Significant Factors Affecting Our Results of Operations.” We expect that these factors will continue to impact our results of operations, cash flows, and financial position.
Key Financial and Operating Metrics
We review a number of key financial and operating performance metrics to evaluate our business, measure our performance, identify trends affecting our business, formulate business plans, and make strategic decisions. These supplemental business metrics are presented to assist investors to better understand our business and how it operates.
Key Financial Metrics
This annual report uses the terms gross margin, Adjusted EBITDA, Adjusted EBITDA Margin, Net Debt (Net Cash), Net Debt (Net Cash)/Adjusted EBITDA Ratio, and working capital/revenue, for which definitions are presented below. We strongly advise that these measures may differ from the calculations of other companies, and as a result, may not be comparable.
The following table presents certain key financial performance metrics as of the dates and for the periods indicated:
| As of and For the Fiscal Year Ended June 30, | |||||||||||||||||||||||
| 2023 | 2023 | 2022 | 2021 | ||||||||||||||||||||
| (in US$)(1) | (in R$) | ||||||||||||||||||||||
| (in millions, except as otherwise indicated) | |||||||||||||||||||||||
Revenue | 1,939.6 | 9,347.4 | 7,746.5 | 5,098.5 | |||||||||||||||||||
Gross margin(2) | 18.5% | 18.5% | 17.1% | 14.4% | |||||||||||||||||||
Profit (loss) for the period/year | (45.4) | (218.7) | 107.8 | 21.5 | |||||||||||||||||||
Adjusted EBITDA(3) | 163.5 | 787.9 | 505.4 | 265.1 | |||||||||||||||||||
Adjusted EBITDA Margin(3) | 8.4% | 8.4% | 6.5% | 5.2% | |||||||||||||||||||
Net Debt(4) | 179.0 | 862.8 | 619.2 | N/A | |||||||||||||||||||
Net Debt/Adjusted EBITDA Ratio(4) | 1.1x | 1.1x | 1.2x | N/A | |||||||||||||||||||
Working capital/revenue(5) | 0.2x | 0.2x | 0.2x | N/A | |||||||||||||||||||
_____________
N/A = Not Applicable.
(1)For convenience purposes only, amounts in reais have been translated to U.S. dollars using an exchange rate of R$4.8192 to US$1.00, the commercial selling rate for U.S. dollars as of June 30, 2023, as reported by the Central Bank. These translations should not be considered representations that any such amounts have been, could have been or could be converted at that or any other exchange rate. See “Item 3. Key Information—D. Risk Factors—Risks Relating to Latin America—Exchange rate instability may impact our ability to hedge exchange rate risk, which may lead to interest rate volatility and have a material adverse effect on the price of our Ordinary Shares.”
(2)Gross margin is calculated as gross profit as a percentage of revenue for the period.
(3)Adjusted EBITDA is defined as profit (loss) for the year, adjusted for finance income (costs), net, income taxes, depreciation and amortization and excluding the impact of certain revenues or expenses that we believe are isolated in nature incurred as part of our expansion, namely: (i) fair value on inventories sold from acquired companies; (ii) M&A adjustments that in management’s judgment do not necessarily occur on a regular basis; (iii) gains on bargain purchases; (iv) listing and other expenses recognized in connection with the Business Combination; (v) share-based compensation expenses; (vi) bonuses paid out to our employees as a result of the closing of the Business Combination; and (vii) expenses paid to Patria in connection with management consultancy services. Adjusted EBITDA Margin is calculated as Adjusted EBITDA as a percentage of revenue for the period. For further information on Adjusted EBITDA and Adjusted EBITDA Margin, see “Presentation of Financial and Other Information—Special Note Regarding Non-IFRS Financial Measures—Adjusted EBITDA and Adjusted EBITDA Margin.” In addition, see “Item 5. Operating and Financial Review and Prospects—A. Operating Results—Non-IFRS Financial Measures and Reconciliations” for a reconciliation of our Adjusted EBITDA and Adjusted EBITDA Margin to our profit (loss) for the year for the period.
(4)Net Debt (Net Cash) is calculated as borrowings (current and non-current) plus payables for the acquisition of subsidiaries (current and non-current), obligations to FIAGRO quota holders, warrant liabilities and liability for FPA shares, less cash equivalents and restricted cash. Net Debt (Net Cash)/Adjusted EBITDA Ratio, also a non-IFRS financial measure, is calculated as Net Debt (Net Cash) divided by Adjusted EBITDA. For further information on Net Debt (Net Cash) and Net Debt (Net Cash)/Adjusted EBITDA Ratio, see “Presentation of Financial and Other Information—Special Note Regarding Non-IFRS Financial Measures—Net Debt (Net Cash) and Net Debt (Net Cash)/Adjusted EBITDA Ratio.” In addition, see “Item 5. Operating and Financial Review and Prospects—A. Operating Results—Non-IFRS Financial Measures and Reconciliations” for a reconciliation of our Net Debt (Net Cash) and Net Debt (Net Cash)/Adjusted EBITDA Ratio to our borrowings.
104
(5)Working capital/revenue is calculated as working capital as a percentage of revenue for the period/year. Working capital is calculated as the sum of the balance (current and non-current) of trade receivables, inventories, advances to suppliers, taxes recoverable, and other assets less the sum of the balance (current and non-current) of trade payables, advances from customers, salaries and social charges, taxes payable and other liabilities.
Gross Margin
Gross margin is calculated as gross profit as a percentage of revenue for the period/year. This financial ratio evaluates our ability to sell inputs above our purchasing cost. Gross margins are affected by our ability to use our scale to negotiate better terms with our suppliers, close strategic alliances to obtain better rates long-term, purchase products upfront (see also “—Working Capital as a Percentage of Revenue”) and negotiate better prices for our products with our customers.
Adjusted EBITDA and Adjusted EBITDA Margin
Adjusted EBITDA and Adjusted EBITDA Margin, which are non-IFRS measures, are among the measures used by our management team to evaluate our financial and operating performance and make day-to-day financial and operating decisions and are presented in this annual report to provide investors with additional information regarding our financial results. We also believe that Adjusted EBITDA is helpful to investors because it provides additional information about trends in our operating performance prior to considering the impact of capital structure, depreciation, amortization and taxation on our results, as well as the effects of certain items or events that vary widely among similar companies, and therefore may hamper comparability across periods.
Adjusted EBITDA is defined as profit (loss) for the year, adjusted for finance income (costs), net, income taxes, depreciation and amortization and excluding the impact of certain revenues or expenses that we believe are isolated in nature incurred as part of our expansion, namely: (i) fair value on inventories sold from acquired companies,; (ii) M&A adjustments that in management’s judgment do not necessarily occur on a regular basis; (iii) gains on bargain purchases; (iv) listing and other expenses recognized in connection with the Business Combination; (v) share-based compensation expenses; (vi) bonuses paid out to our employees as a result of the closing of the Business Combination; and (vii) expenses paid to Patria in connection with management consultancy services. Adjusted EBITDA Margin is calculated as Adjusted EBITDA as a percentage of revenue for the period.
Adjusted EBITDA Margin is calculated as Adjusted EBITDA as a percentage of revenue for the period/year.
By monitoring and controlling our Adjusted EBITDA and Adjusted EBITDA Margin, we can gauge the overall profitability of our Company. Adjusted EBITDA and Adjusted EBITDA Margin are not measurements of financial performance under IFRS and should not be considered an alternative to cash flow from operating activities or as a measure of liquidity or an alternative to profit (loss) for the period as indicators of operating performance or any other measures of performance derived in accordance with IFRS. For further information on Adjusted EBITDA and Adjusted EBITDA Margin, see “Presentation of Financial and Other Information—Special Note Regarding Non-IFRS Financial Measures—Adjusted EBITDA and Adjusted EBITDA Margin.” See “Item 5. Operating and Financial Review and Prospects—A. Operating Results—Non-IFRS Financial Measures and Reconciliations” for a reconciliation of our Adjusted EBITDA and Adjusted EBITDA Margin to our profit (loss) for the year for the period.
Net Debt (Net Cash) and Net Debt (Net Cash)/Adjusted EBITDA Ratio
Net Debt (Net Cash) is calculated as borrowings (current and non-current) plus payables for the acquisition of subsidiaries (current and non-current) obligations to FIAGRO quota holders, warrant liabilities and liability for FPA shares, less cash equivalents and restricted cash. Net Debt (Net Cash)/Adjusted EBITDA Ratio, also a non-IFRS financial measure, is calculated as Net Debt (Net Cash) divided by Adjusted EBITDA. We believe that Net Debt (Net Cash)/Adjusted EBITDA Ratio is an important measure to monitor leverage and evaluate our financial position. With respect to Net Debt (Net Cash), cash and equivalents are subtracted from the IFRS measure of borrowings because they could be used to reduce our borrowings. A limitation associated with using Net Debt (Net Cash) is that it subtracts cash and equivalents and therefore may imply that there is less Company debt than the comparable IFRS measures indicate. We believe that investors may find it useful to monitor leverage and evaluate our financial position using Net Debt (Net Cash) and Net Debt (Net Cash)/Adjusted EBITDA Ratio, although these measures are not explicitly defined under IFRS.
105
Net Debt (Net Cash) and Net Debt (Net Cash)/Adjusted EBITDA Ratio are not measurements of indebtedness under IFRS and should not be considered an alternative to borrowings or cash equivalents as indicators of our financial condition or any other measures of performance derived in accordance with IFRS. For further information on Net Debt (Net Cash) and Net Debt (Net Cash)/Adjusted EBITDA Ratio, see “Presentation of Financial and Other Information—Special Note Regarding Non-IFRS Financial Measures—Net Debt (Net Cash) and Net Debt (Net Cash)/Adjusted EBITDA Ratio.” See “Item 5. Operating and Financial Review and Prospects—A. Operating Results—Non-IFRS Financial Measures and Reconciliations” for a reconciliation of our Net Debt (Net Cash) and Net Debt (Net Cash)/Adjusted EBITDA Ratio to our borrowings.
Working Capital as a Percentage of Revenue
Evaluating working capital as a percentage of revenue enables a status check of several aspects of our retail operations, offering important insights into our financing, profitability, pace of sales and receivables health. In general, as this percentage increases, it indicates that a larger proportion of sales must go toward meeting short-term operational expenses or liabilities. However, importantly, working capital is also closely linked to the prices we pay for inputs and, therefore, our input margins. To the extent we purchase inputs paying up-front with cash on hand, rather than relying on credit, we generally can obtain better prices, lowering our costs and improving our gross margins. However, this approach increases our working capital requirements. Similarly, selling to our clients in harvest terms (i.e., by granting credit to our clients until they collect their harvest) enables us to finance our clients, sell at better prices and improve our margins, at the cost of increased working capital needs. Accordingly, an increase in working capital as a percentage of revenues does not necessarily imply a deterioration in operations; this metric must be evaluated in conjunction with gross margin evolution rather than viewed in isolation.]
Key Operating Metrics
The following table presents certain key operating performance metrics as of the dates indicated:
| As of June 30, | 2023-2022 Variation (%) | 2022-2021 Variation (%) | |||||||||||||||||||||||||||
| 2023 | 2022 | 2021 | |||||||||||||||||||||||||||
Number of stores | 220 | 193 | 152 | 14.0 | % | 27.0 | % | ||||||||||||||||||||||
Number of RTVs(1) | 1,080 | 924 | 744 | 16.9 | % | 24.2 | % | ||||||||||||||||||||||
Number of employees(2) | 3,778 | 3,379 | 2,375 | 11.8 | % | 42.3 | % | ||||||||||||||||||||||
Number of clients(3) | 74,789 | 60,839 | 47,567 | 22.9 | % | 27.9 | % | ||||||||||||||||||||||
_____________
(1)RTVs (Representante Técnico de Vendas) refer to our technical sales representatives for each of our retail stores, and who develop commercial relationships with farmers.
(2)Includes number of RTVs.
(3)Number of clients refers to the total number of small and medium-sized farmers that purchased products from us in the preceding 12 months.
Total Number of RTVs
RTV is our designation for our technical sales representatives, which are supported by a particular retail store and the principal point of contact with customers in the field. They are responsible for developing commercial relationships with farmers, within their designated regions, and serving our clients on site or at our stores. Each RTV works in association with a given store to generate revenues and expand our retail presence in a particular region. Thus, the number of RTVs represents a measure of our sales operation footprint and sales potential. With more RTVs, we are able to cover more planted area and clients, and generate additional revenue. However, the average number of hectares covered by each RTV varies depending on their region of operation and average farm size; the northern area of Brazil, for example, has a greater average farm size relative to the southern region of Brazil.
Total Number of Stores
Our stores provide a location for the storage and distribution of products and offer administrative support to our RTVs. While most of our actual sales transactions occur in person on a client’s farm through our RTVs, our stores function as the regional base for customer outreach, and help build our brand awareness in a specific region. In addition, as we continue to consolidate the agricultural input sector in Latin America, our number of stores provides
106
an indication of both the activity levels of our retail business, as well as our progress towards implementing our consolidation strategy.
Total Number of Employees
Total number of employees reflects our total administrative and operational headcount and includes RTVs. We grow our total number of employees as needed in order to accommodate the administrative and operational requirements associated with our growth and consolidation strategy in Latin America. The total number of employees therefore is helpful to understand our efficiency in scaling up our operations.
Total Number of Clients
Small and medium-sized farmers represent our key target market and main source of revenue. We grow our client base through organic and inorganic measures. The number of clients therefore reflects the success in the implementation of our overall growth strategy, and is a proxy for our ability to decrease client concentration and de-risk our operations. Total number of clients includes clients that purchased products from us in the preceding 12 months.
Significant Factors Affecting Our Results of Operations
Farmers’ Financial Condition
Farmers’ financial condition measures the capacity of our farmer clients to purchase our goods and services and pay for them accordingly. From a farmer clients’ perspective, these relate to decisions of when, what, how much, and where to buy a product. Ultimately, for the farmers, these decisions are with their balance sheet strength, the future price of the commodities they will sell at harvest and the price of the inputs they will acquire for their crops.
The financial position or availability of credit to farmers affects their total purchasing power and willingness to invest in their coming harvest. With more money at their disposal (either in the form of cash or commercial credit), farmers can spend more, boosting purchasing power and increasing our addressable market. Expected soft commodity prices play an important role in the planning decisions of farmers, including planted/harvested acreage of crops and willingness to invest in better agricultural inputs to obtain higher yield production. Sustained periods of low soft commodity prices increase food security for consumers but also reduce farm revenue. This causes farmers to increasingly rely on credit, making them vulnerable to changing economic conditions, such as interest rate increases. Periods of sustained high soft commodity prices, on the other hand, contribute to increases in farm revenues and farmer resilience to changes in economic conditions.
Agricultural input prices represent the main variable in a farmer’s cost base. Lower agricultural input costs increase farmers’ propensity to increase usage in volume terms, or to trade-up for a more sophisticated and high-end agricultural input product. However, agricultural input costs can be impacted by global commodity prices. Therefore, a key metric tracked by farmers, especially by soybean and corn producers, is the barter exchange rate for the agricultural input products they purchase. In a barter transaction, farmers pledge a portion of their future crop production as payment to input suppliers or input distributors, which, in turn, provide the seeds, crop protection, and fertilizers needed at the start of the harvest season. Suppliers or agricultural input distributors can take physical delivery of the crops at the end of the harvest season, with the corresponding commodity risk, or immediately swap the future receivable with a grain trader. In the latter case, the receivables in the form of “bags of grain” are exchanged with a pre-determined cash payment. We generally take the latter course of action and avoid incurring exposure to commodity trading risk. We also guarantee purchases from farmers and act as an intermediary between agricultural input producers and trading companies.
In the event of a significant appreciation of the price of the commodity provided for in the barter agreement, at the time of settlement of such agreement, producers may consider diverting their production to other trading companies or customers, hence failing to deliver grains to us. In this case, we are required to purchase the commodity in the spot market and deliver it to the commodity trading company, or pay compensation to the commodity trading company in an amount equal to the difference between the commodity price between the time of delivery and the time of closing of the agreement (the so-called “washout risk”). Pursuant to the contractual arrangements governing these transactions, we may charge our customers for any losses we might incur in the case
107
of such events. For more information, see “Item 3. Key Information—D. Risk Factors—Risks Relating to Our Business and Industry—We may incur significant losses if our customers do not meet their obligations under the barter transactions entered into with trading companies.”
Barter transactions are common in soy and corn due to the availability of future prices, enabling farmers to close future purchase contracts. Farmers use this information to evaluate the “barter exchange rate” (relação de troca), i.e., the number of bags of grain it would take to purchase agricultural inputs such as crop protection products and fertilizers. This ratio has been relatively stable over time, but a decrease in the barter rate would mean that inputs are relatively less expensive to purchase.
Bartering is an important tool for producers and distributors to manage risk, and, with the restricted availability of credit in Brazil, we believe it is a fundamental aspect of our operational strategy. Bartering enables producers to reduce their reliance on bank loans to finance the crop as well as to hedge part of their commodity exposure. At the same time, bartering is a currency that farmers can use to purchase agricultural inputs from us. For distributors, it is a way to provide credit using a farmer’s most liquid asset as collateral: their future production. Whereas credit lines for Brazilian farmers have historically been scarce, we use barter transactions to increase agrochemical sales. In the fiscal year ended June 30, 2023, we bartered over 257,541 tonnes of soybean and 171,225 tonnes of corn, which represented 6.8% of our total sales in the same period (473,952 tonnes of soybean and 313,125 tonnes of corn in the fiscal year ended June 30, 2022, which represented 9.0% of our total sales in the period). For more information on the accounting policy underlying our barter transactions, see notes 8(g) and 11 to our audited consolidated financial statements included elsewhere in this annual report. See also “Item 11. Quantitative and Qualitative Disclosures about Market Risk—Commodity Price Risk in Barter Transactions.”
Climatic Conditions
Agriculture is highly dependent on the climate, as changes in temperature can increase or decrease crop yields. Positive or negative impacts on agricultural productivity resulting from climate change may directly affect our results of operations by impacting the financial condition of farmers, which, as our customers, may lead them to reconsider their procurement strategy, including the terms and conditions of their arrangements with us, or change their product purchase mix. For more information, see “Item 3. Key Information—D. Risk Factors—Risks Relating to Our Business and Industry—Our business is highly seasonal and affected by adverse weather conditions and other factors beyond our control, which may cause our sales and operating results to fluctuate significantly” and “Item 3. Key Information—D. Risk Factors—Risks Relating to Our Business and Industry—Climate change may have an adverse effect on agribusiness in Latin America and us.”
However, we believe that the effects of climatic conditions on our results can be partially mitigated given our broad geographical exposure and continental footprint, in addition to our expertise with different types of crops. To realize potential benefits or minimize losses arising from climatic conditions, farmers can use different types of nutrients and products that we offer. Our RTVs are trained to understand the new conditions that farmers will have to face as a result of climatic changes, and assist farmers by offering the products most suited to them considering historical climatic conditions and any available weather forecasts in each of the regions in which we currently operate.
Seasonality
Seasonality is an important factor for companies that commercialize agricultural products, such as Lavoro. Seasonal supply and demand levels in agricultural product markets are important considerations in making negotiation decisions. Standardized trading months for corn, soybean and wheat futures reflect the seasonal patterns in the sowing, harvesting and marketing of each respective crop. During the sowing months (spring for corn and soybean and fall for wheat in the southern hemisphere), grains from the previous year’s harvest are available for sale to or for purchase by customers. On the other hand, during the harvest months, the recent harvest reaches the market and supply is increased.
Brazil has unique climatic and geographic conditions compared to most other countries producing agricultural commodities. These conditions enable farmers to plant two crops per year in a given area. The second crop is usually planted after a first, early soybean harvest, a practice that is most common in the South-Central region of Brazil given its more favorable climate. It is common to intercrop soybean and corn plantations, resulting in what is
108
known as safrinha corn. Below is a simplified chart of changes in product offering mix for different crop periods throughout the year:
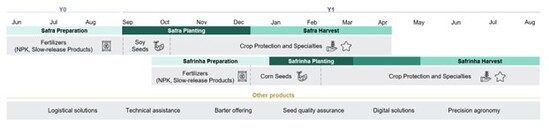
_____________
Source: Company.
Accordingly, the sale of our products is dependent upon planting and growing seasons, which vary from year to year, and are expected to result in both highly seasonal patterns and substantial fluctuations in quarterly sales and profitability. Our sales typically track the seasonality of agricultural planting, with stronger sales of agricultural inputs in the months preceding the sowing of a certain crop. In particular, demand for our products is typically strongest between October and December, with a second period of strong demand between January and March. The seasonality of agricultural inputs demand results in our sales volumes and net sales typically being the highest during the South American spring season and our working capital requirements typically being the highest just after the end of the spring season. Additionally, the delay or deferral of use of our agricultural products and services and the fiscal or quarterly budget cycles of our direct customers and end users may also impact the seasonality of our results. Customers may purchase large quantities of our products in a particular quarter to store and use over long periods of time or time their purchases to manage their inventories, which may cause significant fluctuations in our operating results for a particular quarter or year.
The overall level of seasonality in our business is difficult to evaluate as a result of our expansion into new geographical territories, the introduction of new products and the timing of introductions of new products. It is possible that our business may be more seasonal or experience seasonality in different periods than anticipated. For more information, see “Item 3. Key Information—D. Risk Factors—Risks Relating to Our Business and Industry—Our business is highly seasonal and affected by adverse weather conditions and other factors beyond our control, which may cause our sales and operating results to fluctuate significantly.”
Macroeconomic and Geopolitical Environment
Our results of operations are impacted, to a large extent, by the macroeconomic and geopolitical environment. Supply and demand dynamics globally, as well as the occurrence of geopolitical events affecting global supply and demand dynamics, as in any other business, can affect our results. The level of demand for our products, exchange rate fluctuations, inflation, interest rates and the occurrence of significant geopolitical events, can all impact both our costs and our revenues. Demand for our products can benefit or be negatively impacted by the global performance of soft commodities (in our case, especially corn and soy), which is one of the most important drivers for the financial condition of farmers in the countries in which we operate. Changes in the prices of certain commodity products could result in higher overall costs along the agricultural supply chain, which may negatively affect our ability to commercialize our products due to a reduction of demand by our clients. Additionally, negative fluctuations in commodity prices could have an impact on growers’ purchasing decisions and negatively affect their ability and decisions to purchase our agricultural input products and services. For more information, see “Item 3. Key Information—D. Risk Factors—Risks Relating to Our Business and Industry—We may be adversely affected by global market and economic conditions” and “Item 3. Key Information—D. Risk Factors—Risks Relating to Our Business and Industry—Our operating results are highly dependent upon and fluctuate based upon business and economic conditions and governmental policies affecting the agricultural industry in which we or our customers operate. These factors are outside of our control and may significantly affect our profitability.”
In addition, we monitor and believe that the growth of the agriculture sector is a key macroeconomic variable, which can be estimated by population or GDP growth ratios. Currently, we face a positive outlook for food demand,
109
which is expected to rise by 1.3% per year between 2021 and 2030, according to a 2021 OECD/FAO report, which growth is expected to come largely from the developing economies of China, India, other Asian countries, and the continent of Africa. An increasing population and GDP for these economies should have a positive impact on global demand for grains and, consequently, lead to higher prices. Given that Brazil is a primary exporting hub, grain prices in Brazil (in particular soy and corn prices) are directly influenced by these positive global trends.
Moreover, given that agricultural products in Latin America are mostly exported, their prices are denominated in U.S. dollars. Therefore, with the depreciation of the local currency in Latin American countries, the volume of grain sales tends to increase, as Latin American producers become more competitive in comparison to other markets (they incur at least a portion of their costs in local currency while receiving almost the entirety of their revenues in U.S. dollars). To this extent, a depreciated exchange rate favors exports from these countries and may have a positive impact on our sales.
Given our strong footprint in Brazil and Colombia, our results are largely affected by the financial conditions of Brazilian and Colombian farmers, which, in turn, are also exposed to these countries internal economic variables. For example, our customers may experience deterioration of their businesses, cash flow shortages or difficulties obtaining financing, which could adversely affect the demand for our agricultural products and services. As a result, our revenues and profitability are, to some extent, subject to political and economic developments in Brazil and Colombia and the effect that these factors have on the availability of credit and interest rates in both countries. Our operations, and the industry in general, may be affected by changes in economic conditions. For more information, see “Item 3. Key Information—D. Risk Factors—Risks Relating to Latin America—Latin America has experienced, and may continue to experience, adverse economic or political conditions that may impact our business, financial condition and results of operations.”
The following table shows data for local inflation (which affects our costs, in particular, the cost of labor), interest rates in Brazil and in Colombia, and the respective U.S. dollar exchange rates at the dates and for the periods indicated:
| Fiscal Year Ended June 30, | |||||||||||||||||
| 2023 | 2022 | 2021 | |||||||||||||||
| (inter-annual data) | |||||||||||||||||
| (in percentages, except as otherwise indicated) | |||||||||||||||||
Brazil | |||||||||||||||||
Inflation (IGP-M) | (690.0) | 1070.0 | 3580.0 | ||||||||||||||
Inflation (IPCA) | 320.0 | 1190.0 | 830.0 | ||||||||||||||
CDI Rate (average)(1) | 1360.0 | 870.0 | 230.0 | ||||||||||||||
Period-end exchange rate—R$ per US$1.00 | 4,8192 | 5,238 | 5,0022 | ||||||||||||||
Average exchange rate—R$ per US$1.00(2) | 5,1636 | 5,244 | 5,3854 | ||||||||||||||
Appreciation (depreciation) of the real vs. US$ in the period(3) | 11.1 | (4.7) | 8.7 | ||||||||||||||
Colombia | |||||||||||||||||
Inflation (CPI) | 1230.0 | 970.0 | 360.0 | ||||||||||||||
TIB Rate (average) | 1330.0 | 340.0 | 180.0 | ||||||||||||||
Period-end exchange rate—COP$ per US$1.00 | 4,176 | 4,127 | 3,757 | ||||||||||||||
Average exchange rate—COP$ per US$1.00(2) | 4,596 | 3,888 | 3,659 | ||||||||||||||
Appreciation (depreciation) of the COP$ vs. US$ in the period(4) | (0.7) | (9.9) | 0.1 | ||||||||||||||
_____________
Sources: FGV, IBGE, Central Bank, Colombian National Administrative Department of Statistics (Departamento Administrativo Nacional de Estadistica) and Banco de la República.
(1)Average of annualized daily rates during the period indicated.
(2)Average of the exchange rate on each business day of the period.
(3)Comparing the US$ closing selling exchange rate as reported by the Central Bank at the end of the period’s last day with the day immediately prior to the first day of the period discussed.
110
(4)Comparing the Representative Market Rate (Tasa Representativa del Mercado), or TRM, exchange rate as reported by the Banco de la República at the end of the period’s last day with the day immediately prior to the first day of the period discussed.
Interest Rates
Our financial performance can also be influenced by fluctuations in interest rates, such as the CDI Rate. Such fluctuations affect our finance income from our cash equivalents, which generally bear interest based on the CDI Rate, as well as our finance costs, as our loans and borrowings generally bear interest based on the CDI Rate. However, an increase in interest rates is expected to have an immaterial direct impact on our financial results given that we operate at a low leverage, which can be measured by our Net Debt (Net Cash)/Adjusted EBITDA Ratio of 1.1x and 1.2x as of June 30, 2023 and June 30, 2022, respectively. Even though we have historically made a series of acquisitions and will continue with our M&A strategy, our acquisitions are primarily self-funded with cash generated by our operations and opportunistic acquisition finance to acquire our targets, which typically represents a small portion of our source of funds.
The indirect impact of interest rates fluctuations can have a material impact on us as a result of our customers and suppliers’ decisions. As in most sectors, when interest rates rise, borrowers are less likely to borrow money from lenders, postponing or decreasing the purchase of goods. On the other hand, when interest rates go down, customers tend to anticipate their consumption decision. The agricultural input value chain indebtedness is heavily based on supply finance provided by the large input producers throughout the chain and is an important source of working capital for farmers and distributors. Even though typical macroeconomic dynamics for interest rates hold true in our sector, it has been operating over the past five to 10 years with constant or almost fixed interest rates on supply finance instruments, which has favored farmers’ finance planning and the sector’s stability.
Exchange Rates
Foreign exchange variations impact our financial performance primarily due to the impact on the prices of agricultural commodities, which are generally indexed to the U.S. dollar and affect the final price of our products.
Given that we also operate with foreign exchange-indexed trade receivables and payables (originated from our barter operations) and given that these could be affected by fair value differences in derivative financial instruments and result in potential foreign exchange differences and impacts on our results, we have a strict hedging policy in place. Whenever we make a transaction in a currency other than Brazilian reais or Colombian pesos, we seek to hedge our position to zero net our foreign exchange exposure. This hedging strategy allows us to stabilize our operational margins and mitigate our exposure to exchange rate fluctuations, which is key for our business given that our core activity is the resale and distribution of inputs.
In 2021 and 2020, the Brazilian real faced a strong devaluation in relation to the U.S. dollar, which caused an increase in the cost of fertilizers, chemicals and seeds. Such impacts are typical and easily reflected in market prices, and we believe we have a strong pass-through ability in terms of foreign exchange changes given that our customers have their revenue linked to the U.S. dollar. A devaluation of the Brazilian real is beneficial to our grain-exporting customers due to other factors, such as labor costs, denominated in local currency. Therefore, with lower local costs and higher export revenues, farmers’ margins generally expand when local currencies depreciate relative to the U.S. dollar. We do not expect exchange rate variation to significantly impact our cash flow and cash position, as our outstanding foreign currency indebtedness is not material. As a result, we understand that exchange rates did not have a material impact on our financial condition for the fiscal years ended June 30, 2023 and 2022.
Inflation
Global inflation tends to affect the prices of the goods we sell given that variables such as global energy prices, oil prices, salaries, and supply imbalances are directly linked with the production of agricultural inputs. On the other hand, our customers’ revenues are benefitted by a natural hedge against global inflation, given that soft commodities (in our case, mainly soybean and corn) follow international prices and are highly correlated with global inflation indexes, which enables us to more easily pass cost increases in our products arising from inflation onto our customers.
111
Local inflation also has an impact on our operations. Inflation can impact our sales, general and administrative expenses and our cost of goods sold primarily through logistics costs and wages, rents, and marketing expenses. As opposed to global inflation, local inflation is not necessarily linked to commodity prices, but we have been able to counterbalance the potential negative effects from a rise in local inflation by either improving our efficiency or adjusting prices without compromising our volume of goods sold and maintaining stable margins.
Geopolitical Developments - Impact of the Ongoing Armed Conflict between Russia and Ukraine
As a result of the current geopolitical tensions and armed conflict between Russia and Ukraine, and the recent recognition by Russia of the independence of the self-proclaimed republics of Donetsk and Luhansk in the Donbas region of Ukraine, the governments of the United States, the European Union, Japan and other jurisdictions have recently announced the imposition of sanctions on certain industry sectors and parties in Russia, Belarus and the regions of Donetsk and Luhansk, as well as enhanced export controls on certain products and industries. These and any additional sanctions and export controls, as well as any counter responses by the governments of Russia or other jurisdictions, could adversely affect, directly or indirectly, the global supply chain, with negative implications on the availability and prices of agricultural commodities and raw materials (including petrol, which would affect the price of agricultural inputs), energy prices, and our customers, as well as the global financial markets and financial services industry and the global supply chain in general, which has also been impacted by the ongoing COVID-19 pandemic.
From a supply point of view, Brazil is highly dependent on fertilizers imports, and Russia and Belarus hold a market share in Brazilian soil fertilizer imports of approximately 26% to 30%, respectively (a share which is higher for potash-based products), according to the Brazilian Ministry of Industry, Foreign Trade and Services. We currently buy all of our fertilizers from suppliers based in Brazil, but most of our fertilizer suppliers conduct or have conducted imports, to some degree, from sources in Russia and Belarus. Fertilizers represented approximately 21% of our revenues in the fiscal year ended June 30, 2023, compared to 20% of our revenues in the fiscal year ended June 30, 2022. In addition, fertilizer prices, which had already risen before the conflict, have continued to rise and have led producers to delay purchase negotiations. As a result of such supply risk and the slow pace of the market, we had a reduction in the total volume of fertilizers used in Brazil in the 2022/2023 harvest when compared to the 2021/2022 harvest. However, we believe that this trend has since subsided and that the current supply of fertilizer products has stabilized. While we do not currently expect material shortages of fertilizers to continue in the future and expect fertilizer consumption to grow going forward, no assurance can be provided in this respect.
Furthermore, in connection with the Russian war against Ukraine, we have limited the acquisition of NPK of Russian origin to one-off purchases, a volume that represented between 15% and 20% of the total sold in the 2022/2023 harvest. NPK is an essential input for large-scale agriculture and we are focused on avoiding shortages as much as possible, seeking supply alternatives whenever necessary. This did not have a material adverse effect on our
business during the 2021/2022 harvest year, given that we had delivered substantially all soy and corn fertilizer for the harvest year, or during the 2022/2023 harvest year. However, given current market conditions and the continuing military conflict between Russia and Ukraine, the volume of fertilizers sold by us may be adversely affected in the future, which may adversely affect our results of operations, in particular if we are unable to mitigate any relevant reduction in fertilizer sales volumes through measures such as price increases of other products. In addition, we may also be unsuccessful in finding alternative direct imports from non-sanctioned regions or in increasing our prices to reflect increased supply costs in the future.
Acquisitions
Acquisitions are a key business strategy to expand our business into new markets or territories, add additional facilities, bolster our competitive edge or acquire and access new technologies and skillsets. We seek targets with suitable qualifications, relationships with key clients, and operations in areas we are already present or toward which we are looking to expand (including the Latin American markets toward which we seek to expand). We believe the long-term value of acquired companies should be greater than the purchase price. We seek to capture synergies when integrating our targets within our platform and expect our targets to generate cost synergies through increased bargaining power with suppliers or other cost-cutting measures that take advantage of overlapping resources.
112
We also expect to generate revenue synergies that alter the competitive balance of power and create opportunities to change market dynamics, sell more products, and/or raise our prices. We can take advantage of revenue synergies and generate more revenue in many ways, including by reducing competitive pressures, branching out into new geographic regions, expanding our customer base, and increasing cross-selling opportunities, especially with our private label products (i.e., Crop Care). For more information, see “Presentation of Financial and Other Information—Lavoro Group Financial Statements—Acquisitions.”
We may face challenges in integrating the operations of our acquired companies. If we are not able to manage these integrations effectively, our results of operations may be affected. See “Item 3. Key Information—D. Risk Factors—Risks Relating to Acquisitions and Financial Information—Any acquisition, partnership or joint venture we make or enter into could disrupt our business and harm our financial condition.” In addition, the size and timing of significant transactions may also increase the unpredictability of our operating results. For example, as mentioned above, our most profitable months tend to be October, November and December in a given calendar year. If we acquire a large target between January and June of a given year, we would be missing its best performing months, and, therefore, our annual accounting statements for the fiscal year ended June 30 would not fully reflect the positive impact of the acquisition. Moreover, we may not be able to successfully expand our international operations through acquisitions in a cost-effective or timely manner, if at all, as a result of a number of risks and uncertainties; see “Item 3. Key Information—D. Risk Factors—Risks Relating to Our Business and Industry—Our continued international expansion efforts may not be successful, or may subject our business to increased risks.”
Expansion of E-Commerce Operations and Adoption of Digital Channels by Farmers
The e-commerce market and digital channel adoption by farmers have experienced rapid growth over the past several years. Widespread access to the internet, the introduction of digital payment methods, and the increased use of smartphones have made online shopping more convenient worldwide, catalyzing the growth of the global e-commerce market. According to a 2021 study by Orion Market Reports, global e-commerce sales of agricultural products are estimated to grow at an annual average rate of 5.0% during the 2021-2027 period. A representative portion of our customers already prefers digital channels in acquiring agricultural inputs, according to a 2021 study by McKinsey, which found that approximately 46% of Brazilian farmers prefer online channels. A survey conducted by McKinsey in 2020 showed that approximately 44% of Brazilian farmers use digital channels to evaluate their input suppliers, and approximately 45% use digital channels to buy agricultural inputs. As more farmers choose to use online channels to acquire agricultural inputs, we expect to attract more customers to our omnichannel platform. Additionally, we have experienced a nine-fold increase in our average sales ticket since the launch of our online platform in May 2020.
Our digital transformation agenda, which includes our online sales platform, weather information system, online chatbot and our Super App, is an important step to integrate all of our digital channels. With this initiative, we not only expect to provide additional convenience to our customers, but also capture operational synergies between physical and digital sales channels. This ongoing initiative has the potential to be an important lever of profitability in our business.
Description of Principal Line Items
Revenue
Revenue from contracts with customers is recognized when control of the goods or services is transferred to the customer at an amount that reflects the consideration which we expect to be entitled to receive in exchange for those goods or services. Revenue from the sale of agricultural inputs is recognized at the point in time when control of the product is transferred to the customer, as follows:
•retail sales: sale of products in retail locations or delivered to customers, including crop protection products, fertilizers, seeds, specialty inputs and grains as a result of barter transactions; and
•private label products: products delivered to the client, such as biological, specialty fertilizers and off-patent products.
113
When products are delivered to our customers, revenue is recognized when our customer receives the product at the specified location. We engage third parties to provide freight services. In addition, we provide pulverization services and recognize revenues from these services when the customer receives and consumes the benefits provided to them, at the time the pulverization services take place. The vast majority of our revenue is derived from the sale of agricultural inputs, and the cost of substantially all of the services we render (with the exception of certain services in Colombia) are embedded in the price of agricultural inputs sold.
In the fiscal year ended June 30, 2023, only 0.3% of our revenues were derived from the provision of services rendered by Lavoro, as reported in note 28 to our audited consolidated financial statements (R$27.5 million out of a total of R$9,347.4 million) (1.0% in the fiscal year ended June 30, 2022 and R$78.1 million out of a total of R$7,746.5 million).
We generally act as a principal as we have primary responsibility for delivering the contracted goods, bear the inventory risk, and have discretion to establish the price. Revenue from contracts with customers is recognized at an amount that reflects the consideration to which we expect to be entitled in exchange for those goods or services. Sales prices are substantially based on international benchmark market prices, which are variable and subject to global supply and demand, and other market factors. There are no general warranties to customers. Returns and incentives are estimated based on historical and forecasted data, contractual terms, and current conditions. Transportation costs are generally recovered from the customer through sales pricing and are included in the cost of goods sold.
Trade receivables usually include a significant financing component. As such, the transaction price is discounted using the implicit interest rate in the contract (i.e., the interest rate that discounts the trade receivable amount to the cash selling price), and revenue is recognized for such amount. The significant financing component is recognized as financial income under the amortized cost method. The average monthly interest rate applied was 0.96% and 1.00% for the fiscal years ended June 30, 2023 and 2022, respectively.
Moreover, we receive grains from certain customers in exchange to the product sold. The fair value of such non-cash consideration received from the customer is included in the transaction price and measured when we obtain control of the grains. We estimate the fair value of the non-cash consideration by reference to its market price. For more information, see note 11 to our audited consolidated financial statements included elsewhere in this annual report.
Cost of Goods Sold
Our cost of goods sold consists of the cost of purchases of goods for resale, net of rebates, discounts and commercial agreements received from suppliers, variations in inventories and logistics costs (inbound and outbound). The cost of goods sold includes the cost of the logistics operations managed or outsourced by us, including storage, handling and freight costs incurred until the goods are ready to be sold.
Trade payables include a significant financing component. As such, trade payables are discounted using the interest rate implicit in the contract (i.e., the interest rate that discounts the trade payable amount to the purchase paid in cash), and inventory is recorded at such amount. The significant financing component is recognized as a financial expense under the amortized cost method. The average monthly interest rate applied was 1.58% and 1.18% for the fiscal years ended June 30, 2023 and 2022, respectively.
Gross Profit
Our gross profit consists of our revenue minus our cost of goods sold.
114
Operating Expenses
Our operating expenses consist of our sales, general and administrative expenses and other operating income (expenses), net, as described below.
Sales, General and Administrative Expenses
Sales, general and administrative expenses refer to indirect expenses and the cost of the corporate departments, information technology, treasury, salesforce personnel and marketing and advertising expenses.
Other Operating Income (Expenses), Net
Our other operating income (expenses), net consists of recovery of expenses, awards and incentives, insurance indemnities, income from the sale of fixed assets (e.g., vehicles), bonuses, donations, and other items.
Operating Profit (Loss)
Our operating profit (loss) consists of our gross profit minus our operating expenses.
Finance Income
Our finance income consists of income generated by cash equivalents and judicial deposits, gains from foreign exchange differences, gains related to the measurement of derivatives at fair value, and gains from fair value of forward contracts, among others. Interest income is recorded for all financial assets measured at amortized cost, using the effective interest rate, which corresponds to the discount rate for future payments or cash receipts over the expected useful life of the financial instrument – or a shorter period, as appropriate—at the net carrying amount of the financial asset. Cash equivalents include cash, banks, and highly liquid floating rate securities, which have maturities of less than 90 days.
Finance Costs
Our finance costs include substantially all expenses generated by net borrowings and by the cost of selling receivables during the year, losses related to the measurement of derivatives at fair value, losses on disposals of financial assets, financial charges on lawsuits and taxes and interest expenses on finance leases, as well as adjustments related to discounts.
Profit (Loss) Before Income Taxes
Our profit (loss) before income taxes consists of our operating income minus our finance income (costs), net.
Income Taxes
Current income tax assets and liabilities are measured at the amount expected to be recovered from or paid to the taxation authorities. The tax rates and tax laws used to compute the amount are those that are enacted or substantively enacted at the reporting date in the countries where we operate and generate taxable income. Current income tax relating to items recognized directly in equity is recognized in equity and not in the statement of profit or loss. Management periodically evaluates positions taken in the tax returns with respect to situations in which applicable tax regulations are subject to interpretation and establishes provisions, where appropriate. Income taxes in Brazil and Colombia are paid by each legal entity on a standalone basis.
Deferred taxes are calculated using the liability method on temporary differences between the carrying amount of assets and liabilities and their tax basis. Deferred tax liabilities are recognized for all taxable temporary differences, except:
•when the deferred tax liability arises from the initial recognition of goodwill or an asset or liability in a transaction that is not a business combination and, at the time of the transaction, affects neither the accounting profit nor taxable profit or loss; or
115
•in respect of taxable temporary differences associated with investments in subsidiaries, associates and interests in joint arrangements, when the timing of the reversal of the temporary differences can be controlled and it is probable that the temporary differences will not reverse in the foreseeable future.
Deferred tax assets are recognized for all deductible temporary differences, the carry forward of unused tax credits and any unused tax losses. Deferred tax assets are recognized to the extent that it is probable that taxable profit will be available against which the deductible temporary differences, and the carry forward of unused tax credits and unused tax losses can be utilized, except:
•when the deferred tax asset relating to the deductible temporary difference arises from the initial recognition of an asset or liability in a transaction that is not a business combination and, at the time of the transaction, affects neither the accounting profit nor taxable profit or loss; or
•in respect of deductible temporary differences associated with investments in subsidiaries, deferred tax assets are recognized only to the extent that it is probable that the temporary differences will reverse in the foreseeable future and taxable profit will be available against which the temporary differences can be utilized.
The carrying amount of deferred tax assets is reviewed at each reporting date and reduced to the extent that it is no longer probable that sufficient taxable profit will be available to allow all or part of the deferred tax asset to be utilized. Unrecognized deferred tax assets are re-assessed at each reporting date and are recognized to the extent that it has become probable that future taxable profits will allow the deferred tax asset to be recovered. In assessing the recoverability of deferred tax assets, we rely on the same forecast assumptions used elsewhere in the financial statements and in other management reports. The benefits of uncertain tax positions are recorded only after determining, based on the position of its internal and external legal advisors, a more-likely-than-not probability that the uncertain tax positions will withstand challenge, if any, from taxing authorities.
Deferred tax assets and liabilities are offset where there is a legally enforceable right to offset current tax assets and liabilities and where the deferred tax balances relate to the same taxation authority.
Profit (Loss) for the Year
Our profit (loss) for the year consists of our profit (loss) before income taxes minus our income tax obligations.
116
Historical Consolidated Statements of Profit or Loss
Fiscal Year Ended June 30, 2023 Compared to Fiscal Year Ended June 30, 2022
The following table sets forth our consolidated statements of profit or loss data for the period indicated.
| For the Fiscal Year Ended June 30, | |||||||||||||||||||||||
| 2023 | 2023 | 2022 | Variation (%) | ||||||||||||||||||||
| (in US$ millions)(1) | (in R$ millions, except as otherwise indicated) | ||||||||||||||||||||||
Revenue | 1,939.6 | 9,347.4 | 7,746.5 | 20.7 | % | ||||||||||||||||||
Cost of goods sold | (1,580.5) | (7,616.6) | (6,421.0) | 18.6 | % | ||||||||||||||||||
Gross profit | 359.1 | 1,730.8 | 1,325.5 | 30.6 | % | ||||||||||||||||||
Operating expenses: | |||||||||||||||||||||||
Sales, general and administrative expenses | (254.8) | (1,228.1) | (1,022.4) | 20.1 | % | ||||||||||||||||||
Other operating (expenses) income, net | (57.2) | (275.8) | 56.8 | n.m. | |||||||||||||||||||
Operating profit | 47.1 | 226.9 | 359.9 | (37.0 | %) | ||||||||||||||||||
Finance income (costs): | |||||||||||||||||||||||
Finance income | 77.0 | 371.1 | 426.9 | (13.1 | %) | ||||||||||||||||||
Finance costs | (205.2) | (988.9) | (646.4) | 53.0 | % | ||||||||||||||||||
Profit (loss) before income taxes | (81.1) | (390.9) | 140.4 | n.m. | |||||||||||||||||||
Income taxes: | |||||||||||||||||||||||
Current | 7.8 | 37.5 | (111.4) | n.m. | |||||||||||||||||||
Deferred | 28.0 | 134.8 | 78.7 | 71.3 | % | ||||||||||||||||||
Profit (loss) for the year | (45.4) | (218.7) | 107.8 | n.m. | |||||||||||||||||||
_____________
n.m. = not meaningful.
(1)For convenience purposes only, amounts in reais have been translated to U.S. dollars using an exchange rate of R$4.8192 to US$1.00, the commercial selling rate for U.S. dollars as of June 30, 2023, as reported by the Central Bank. These translations should not be considered representations that any such amounts have been, could have been or could be converted at that or any other exchange rate. See “Item 3. Key Information—D. Risk Factors—Risks Relating to Latin America—Exchange rate instability may impact our ability to hedge exchange rate risk, which may lead to interest rate volatility and have a material adverse effect on the price of our Ordinary Shares.”
Revenue
Revenue for the fiscal year ended June 30, 2023 was R$9,347.4 million, an increase of R$1,600.9 million, or 20.7%, from R$7,746.5 million for the fiscal year ended June 30, 2022, which was primarily attributable to
(i) a R$1,478.1 million increase in revenue from the Brazil Cluster, reaching R$7,829.3 million for the fiscal year ended June 30, 2023. This growth was driven by an increase in input sales, reflecting both organic and inorganic growth. The revenue amount disregards the intersegment elimination related to sales between the Brazil Cluster and the Crop Care Cluster, as outlined in explanatory note 4 of our audit financial statements;
(ii) a R$39.9 million increase in revenue from the LATAM Cluster, reaching R$1,206.3 million for the fiscal year ended June 30, 2023. This growth chiefly resulted from an increase in input sales, reflecting Lavoro’s both organic and inorganic expansion;
(iii) a R$300.6 million increase in revenue from the Crop Care Cluster, reaching R$632.8 million for the fiscal year ended June 30, 2023, reflecting the sales growth of our private label products. The revenue amount disregards the intersegment elimination related to sales between the Brazil Cluster and the Crop Care Cluster, as outlined in explanatory note 4 of our audit financial statements;
117
Cost of Goods Sold
Cost of goods sold for the fiscal year ended June 30, 2023 was R$7,616.6 million, an increase of R$1,195.6 million, or 18.6%, from R$6,421.0 million for the fiscal year ended June 30, 2022, which was primarily attributable to:
(i)a R$1,206.3 million increase in the cost of goods sold in the Brazil Cluster, primarily driven by higher cost of inventory, as well as increased freight expenses resulting from higher sales volume;. The amount of cost of goods sold disregards intersegment elimination related to sales between the Brazil Cluster and the Crop Care Cluster, as outlined in explanatory note 4 of our audit financial statements;
(ii)a R$34.0 million increase in the cost of goods sold in the LATAM Cluster, reflecting higher costs associated with services and barter operations, which can also be attributed to the increased sales of grains;
(iii)a R$140.3 million increase in the cost of goods sold in the Crop Care Cluster, primarily due to higher inventory cost and increased freight expenses resulting from the growth in sales. The amount of cost of goods sold disregards intersegment elimination related to sales between the Brazil Cluster and the Crop Care Cluster, as outlined in explanatory note 4 of our audit financial statements;
Gross Profit
As a result of the foregoing, gross profit for the fiscal year ended June 30, 2023 was R$1,730.8 million, an increase of R$405.3 million, or 30.6%, from R$1,325.5 million for the fiscal year ended June 30, 2022. This represents a gross margin of 18.5% for the fiscal year ended June 30, 2023, compared to 17.1% for the fiscal year ended June 30, 2022.
Disregarding the intersegment elimination related to sales between the Brazil Cluster and the Crop Care Cluster, as outlined in explanatory note 4 of of our audit financial statements; gross profit in the Brazil Cluster increased by R$271.8 million, reaching R$1,286.0 million for the fiscal year ended June 30, 2023. This resulted in a gross margin of 16.4%, compared to 16.0% for the fiscal year ended June 30, 2022. The 0.4 percentage point margin increase is attributed to a more favorable product mix, successful commercial and procurement strategies, and synergies from company acquisitions. These factors mitigated lower margins in fertilizers and crop protection products, particularly herbicides, due to a return to regular supply conditions and the presence of substantial inventories throughout the supply chain.
Gross profit in the LATAM Cluster increased by R$6.0 million, reaching R$196.6 million for the fiscal year ended June 30, 2023. This resulted in a gross margin of 16.3%, consistent with the fiscal year ended June 30, 2022. This stable margin was achieved despite the impact of reduced crop protection prices resulting from the current market scenario and increased competition.
Disregarding the intersegment elimination related to sales between the Brazil Cluster and the Crop Care Cluster, as outlined in explanatory note 4 of of our audit financial statements, gross profit in the Crop Care Cluster increased by R$271.8 million, reaching R$1,286.0 million for the fiscal year ended June 30, 2023. Gross profit in the Crop Care Cluster increased by R$160.3 million, reaching R$280.9 million for the fiscal year ended June 30, 2023. This resulted in a gross margin of 44.4%, which was 8.1 percentage points higher than in the fiscal year ended June 30, 2022. The margin increase can be attributed to a more favorable product mix, and improved operational efficiency, with greater absorption of fixed costs.
Sales, General and Administrative Expenses
Sales, general and administrative expenses for the fiscal year ended June 30, 2023 was R$1,228.1 million, an increase of R$205.7 million, or 20.1%, compared to R$1,022.4 million for the fiscal year ended June 30, 2022, which was mainly attributable to an increase of (i) R$142.6 million in personnel expenses, of which R$21.1 million represents the hiring of RTVs and administrative staff as a result of our acquisitions during the period, (ii) R$9.4
118
million in our provision for expected credit losses as a result of a larger volume of our operations, and (iii) R$18.2 million in commissions as a result of the increase in sales in the period.
Other Operating (Expenses) Income , Net
We recorded other operating expenses, net for the fiscal year ended June 30, 2023 of R$275.8 million, compared to other operating income, net of R$56.8 million for the fiscal year ended June 30, 2022, which was primarily attributable stock exchange listing expenses of R$319.6 million as a result of the Business Combination, partially offset by an increase of R$11.8 million in other operating income. For more information, see notes 22 and 31 to our audited consolidated financial statements included elsewhere in this annual report.
Operating Profit
For the reasons described above, operating profit for the fiscal year ended June 30, 2023 was R$226.9 million, a decrease of R$133.0 million from operating profit of R$359.9 million for the fiscal year ended June 30, 2022.
Finance Income
Finance income for the fiscal year ended June 30, 2023 was R$371.1 million, a decrease of R$55.9 million, or 13.1%, from R$426.9 million for the fiscal year ended June 30, 2022, which was primarily attributable to a decrease of R$157.1 million in interest income from receivables from revenue contracts as a result of a lower volume of financing facilities provided to customers. This was partially offset by a R$79.4 million increase in gain on changes in fair value of derivative instruments in the fiscal year ended June 30, 2023 compared to the same period in 2022.
Finance Costs
Finance costs for the fiscal year ended June 30, 2023 were R$988.9 million, an increase of R$342.5 million, or 53.0%, from R$646.4 million for the fiscal year ended June 30, 2022, which was primarily attributable to: (i) an increase of R$245.5 million in interest on borrowings, mainly due to an increase in our total indebtedness; and (ii) an increase of R$91.9 million in loss on fair value of commodity forward contracts as a result of declining commodity prices.
Current Income Taxes
We recorded a current income tax credit for the fiscal year ended June 30, 2023, of R$37.5 million, compared to a current income tax expense of R$111.4 million for the fiscal year ended June 30, 2022, which was primarily attributable to a tax benefit that allowed us to deduct ICMS taxes in the calculation of our income taxes. For more information, see notes 10 and 23 to our audited consolidated financial statements included elsewhere in this annual report.
Deferred Income Taxes
Deferred income tax gain for the fiscal year ended June 30, 2023 was R$134.8 million, an increase of R$56.0 million, or 71.1%, from R$78.7 million for the fiscal year ended June 30, 2022, which was primarily attributable to an increase in the recognition of deferred tax assets arising from: (i) tax losses, which increased by R$73.7 million and (ii) the adjustment to present value of trade receivables and trade payables, which decreased by R$26.4 million.
Profit (loss) for the Year
Due to the foregoing, we recorded a loss for the fiscal year ended June 30, 2023 of R$218.7 million, compared to a profit of R$107.8 million for the fiscal year ended June 30, 2022. Corporate expenses accounted for R$356.3 million loss in the fiscal year ended June 30, 2023, mainly due to the R$319.6 million in listing fees.
Disregarding the intersegment elimination related to sales between the Brazil Cluster and the Crop Care Cluster, as outlined in explanatory note 4 of our audit financial statements, the Brazil Cluster recorded a profit for the fiscal year ended June 30, 2023, of R$65.5 million, an increase of R$31.1 million compared to the fiscal year ended June 30, 2022. This growth reflected the 54.3% increase in operating profit, which reached R$134.5 million, and an income tax gain of R$204.4 million; offsetting the R$307.8 million financial costs increase.
119
The LATAM Cluster recorded a profit for the fiscal year ended June 30, 2023, of R$36.4 million, an increase of R$3.2 million compared to the fiscal year ended June 30, 2022. This increase reflected the 16.3% increase in operating profit, which reached R$10.4 million, offsetting the higher financial costs.
Disregarding the intersegment elimination related to sales between the Brazil Cluster and the Crop Care Cluster, as outlined in explanatory note 4 of our audit financial statements, the Crop Care Cluster: recorded a profit of R$57.3 million in the fiscal year ending June 30, 2023, a R$17.1 million increase from the fiscal year ending June 30, 2022. This increase was primarily due to a substantial 169.5% growth in operating profit, reaching R$82.2 million, offsetting higher financial costs and income tax expenses.
Fiscal Year Ended June 30, 2022 Compared to Fiscal Year Ended June 30, 2021
The following table sets forth our consolidated statements of profit or loss data for the period indicated.
| For the Fiscal Year Ended June 30, | |||||||||||||||||||||||
| 2022 | 2022 | 2021 | Variation (%) | ||||||||||||||||||||
| (in US$ millions)(1) | (in R$ millions, except as otherwise indicated) | ||||||||||||||||||||||
Revenue | 1,607.4 | 7,746.5 | 5,098.5 | 51.9% | |||||||||||||||||||
Cost of goods sold | (1,332.4) | (6,421.0) | (4,362.7) | 47.2% | |||||||||||||||||||
Gross profit | 275.0 | 1,325.5 | 735.9 | 80.1% | |||||||||||||||||||
Operating expenses: | |||||||||||||||||||||||
Sales, general and administrative expenses | (212.1) | (1,022.4) | (619.5) | 65.0% | |||||||||||||||||||
Other operating (expenses) income, net | 11.8 | 56.8 | 15.6 | 264.1% | |||||||||||||||||||
Operating profit | 74.7 | 359.9 | 132.0 | 172.7% | |||||||||||||||||||
Finance income (costs): | |||||||||||||||||||||||
Finance income | 88.6 | 426.9 | 227.1 | 88.0% | |||||||||||||||||||
Finance costs | (134.1) | (646.4) | (312.9) | 106.6% | |||||||||||||||||||
Profit before income taxes | 29.1 | 140.4 | 46.2 | 203.9% | |||||||||||||||||||
Income taxes | |||||||||||||||||||||||
Current income taxes | (23.1) | (111.4) | (61.7) | 80.6% | |||||||||||||||||||
Deferred income taxes | 16.3 | 78.7 | 37.0 | 112.7% | |||||||||||||||||||
Profit for the year | 22.4 | 107.8 | 21.5 | 401.4% | |||||||||||||||||||
_____________
(1)For convenience purposes only, amounts in reais have been translated to U.S. dollars using an exchange rate of R$4.8192 to US$1.00, the commercial selling rate for U.S. dollars as of June 30, 2023, as reported by the Central Bank. These translations should not be considered representations that any such amounts have been, could have been or could be converted at that or any other exchange rate. See “Item 3. Key Information—D. Risk Factors—Risks Relating to Latin America—Exchange rate instability may impact our ability to hedge exchange rate risk, which may lead to interest rate volatility and have a material adverse effect on the price of our Ordinary Shares.”
Revenue
Revenue for the fiscal year ended June 30, 2022 was R$7,746.5 million, an increase of R$2,648.0 million, or 51.9%, from R$5,098.5 million for the fiscal year ended June 30, 2021, which was primarily attributable to:
(i) a R$2,152.7 million increase in revenue from the Brazil Cluster, reaching R$6,351.2 million for the fiscal year ended June 30, 2022. This growth was driven by an increase in input sales, primarily as a result of an increase in our market share in Brazil Cluster, reflecting acquisitions in the period. The amount of revenue disregards intersegment elimination related to sales between the Brazil Cluster and the Crop Care Cluster, as outlined in explanatory note 4 of our audit financial statements;
(ii) a R$307.6 million increase in revenue from the LATAM Cluster, reaching R$1,166.4 million for the fiscal year ended June 30, 2022. This growth resulted from a an increase in input sales reflecting both organic and inorganic expansions;
120
(iii) a R$285.4 million increase in revenue from the Crop Care Cluster, reaching R$332.2 million for the fiscal year ended June 30, 2022. This increase was reflected in the R$97.6 million increase in sales of private label products to the Brazil Cluster, totaling R$103.3 million, and a R$187.8 million increase in sales of private label products to other clients, amounting to R$228.9 million. The amount of cost of goods sold disregards intersegment elimination related to sales between the Brazil Cluster and the Crop Care Cluster, as outlined in explanatory note 4 of our audit financial statements;
Cost of Goods Sold
Cost of goods sold for the fiscal year ended June 30, 2022 was R$6,421.0 million, an increase of R$2,058.3 million, or 47.2%, from R$4,362.7 million for the fiscal year ended June 30, 2021, which was primarily attributable to:
(i) a R$1,683.2 million increase in the cost of goods sold in the Brazil Cluster, primarily driven by higher cost of inventory, as a result of acquisitions in the period. The amount of cost of goods sold disregards intersegment elimination related to sales between the Brazil Cluster and the Crop Care Cluster, as outlined in explanatory note 4 of our audit financial statements;
(ii) a R$271.0 million increase in the cost of goods sold in the LATAM Cluster, reflecting higher inventory costs and freight expenses, as a result of the increase in input sales;
(iii) a R$201.8 million increase in the cost of goods sold in the Crop Care Cluster, primarily due to a higher cost of inventory, increased freight expenses resulting from the strong growth in sales, and our acquisitions in the period. The amount of cost of goods sold disregards intersegment elimination related to sales between the Brazil Cluster and the Crop Care Cluster, as outlined in explanatory note 4 of our audit financial statements;
Gross Profit
As a result of the foregoing, gross profit for the fiscal year ended June 30, 2022 was R$1,325.5 million, an increase of R$589.6 million, or 80.1%, from R$735.9 million for the fiscal year ended June 30, 2021. This represents a gross margin of 17.1% for the fiscal year ended June 30, 2022, compared to 14.4% for the fiscal year ended June 30, 2021.
Disregarding the intersegment elimination related to sales between the Brazil Cluster and the Crop Care Cluster, as outlined in explanatory note 4 of our audit financial statements; gross profit in the Brazil Cluster increased by R$469.5 million, reaching R$1,014.2 million for the fiscal year ended June 30, 2022. This resulted in a gross margin of 16.0%, compared to 13.0% for the fiscal year ended June 30, 2021. The 3.0 percentage point margin increase is attributed to an improvement in procurement and favorable product mix, with an increase in the sales of high-margin products and synergies due to the acquisitions in the period.
Gross profit in the LATAM Cluster increased by R$36.6 million, reaching R$190.7 million for the fiscal year ended June 30, 2022. This resulted in a gross margin of 16.3%, compared to 17.9% for the fiscal year ended June 30, 2021, or a decrease of 1.6 percentage points, which can be attributed to a worse mix of inputs sold.
Disregarding the intersegment elimination related to sales between the Brazil Cluster and the Crop Care Cluster, as outlined in explanatory note 4 of our audit financial statements; gross profit in the Crop Care Cluster increased by R$83.6 million, reaching R$120.6 million for the fiscal year ended June 30, 2022. This resulted in a gross margin of 36.3% compared to a 79.0% gross margin for the fiscal year ended June 30, 2021. The margin decline is attributed to the segment expansion, considering that, in the previous year, this segment was still in its early stages and had not yet reached maturity. This shift in margin for fiscal year 2022 better reflects the normal operating conditions for the Crop Care Cluster.
Sales, General and Administrative Expenses
Sales, general and administrative expenses for the fiscal year ended June 30, 2022 was R$1,022.4 million, an increase of R$402.9 million, or 65.0%, from R$619.5 million for the fiscal year ended June 30, 2021, which was primarily attributable to an increase of (i) R$199.6 million in personnel expenses following the hiring of 180 RTVs,
121
(ii) R$50.2 million in consulting, legal and other professional services as a result of increased M&A efforts, (iii) R$33.2 million in amortization of rights of use assets as a result of the addition of 38 new stores to Lavoro’s retail network, and (iv) R$27.9 million in amortization of intangibles as a result of a larger asset base in comparison to the fiscal year ended June 30, 2021, as a result of acquisitions. Sales, general and administrative expenses were primarily driven by the Brazil Cluster, followed by the LATAM Cluster, as a result of acquisitions in the period.
Other Operating (Expenses) Income , Net
Other operating (expense) income, net for the fiscal year ended June 30, 2022 was R$56.8 million, an increase of R$41.1 million, or 264.1%, from R$15.6 million for the fiscal year ended June 30, 2021, which was primarily attributable to an increase of R$18.3 million in gain on bargain purchases arising from the acquisition of Union Agro.
Operating Profit
For the reasons described above, operating profit for the fiscal year ended June 30, 2022 was R$359.9 million, an increase of R$227.9 million from operating profit of R$132.0 million for the fiscal year ended June 30, 2021.
Finance Income
Finance income for the fiscal year ended June 30, 2022 was R$426.9 million, an increase of R$199.8 million, or 88.0%, from R$227.1 million for the fiscal year ended June 30, 2021, which was primarily attributable to: (i) an increase of R$202.7 million in interest arising from revenue contracts as a result of a larger volume of our operations, as a result of acquisitions in the period; and (ii) an increase of R$6.2 million in interest from cash equivalents, which comprise of short-term highly liquid investments with a maturity of three months or less. This was partially offset by a R$12.8 million decrease in gains from foreign exchange differences related to the U.S. dollar for the fiscal year ended June 30, 2022 compared to the same period in 2021.
Finance Costs
Finance costs for the fiscal year ended June 30, 2022 were R$646.4 million, an increase of R$333.5 million, or 106.6%, from R$312.9 million for the fiscal year ended June 30, 2021, which was primarily attributable to: (i) an increase of R$250.7 million in interest on trade payables charged by our suppliers as a result of a larger volume of our operations, as a result of acquisitions in the period; and (ii) an increase of R$40.1 million in interest on borrowings, mainly due to increase in borrowing levels.
Current Income Taxes
Current income taxes for the fiscal year ended June 30, 2022 was an expense of R$111.4 million, an increase of R$49.7 million, or 80.6%, from an expense of R$61.7 million for the fiscal year ended June 30, 2021, which was primarily attributable to an increase of total income taxes as a result of the increase in profit before income taxes. As total income taxes increased so did the corresponding current income taxes.
Deferred Income Taxes
Deferred income tax and social contribution for the fiscal year ended June 30, 2022 was a gain of R$78.7 million, an increase of R$41.7 million, or 112.8%, from a gain of R$37.0 million for the fiscal year ended June 30, 2021, which was primarily attributable to an increase in the recognition of deferred tax assets in relation to: (i) the adjustment to present value, which increased by R$21.9 million and (ii) the allowance for expected credit losses, which increased by R$20.7 million.
Profit for the Year
Due to the foregoing, our profit for the fiscal year ended June 30, 2022, was R$107.8 million, an increase of R$86.2 million, or 401.4% compared to a profit of R$21.5 million for the fiscal year ended June 30, 2021.
Disregarding the intersegment elimination related to sales between the Brazil Cluster and the Crop Care Cluster, as outlined in explanatory note 4 of our audit financial statements, Brazil Cluster recorded a profit for the fiscal year
122
ended June 30, 2022, of R$34.4 million, an increase of R$30.0 million compared to the fiscal year ended June 30, 2021. This increase can be attributed to a R$166.2 million growth in operating profit and income tax gains, which offset higher financial costs.
LATAM Cluster recorded a profit for the fiscal year ended June 30, 2022, of R$33.2 million, an increase of R$9.0 million compared to the fiscal year ended June 30, 2021. This increase is primarily linked to a R$10.5 million growth in operating profit, offsetting higher financial costs.
Disregarding the intersegment elimination related to sales between the Brazil Cluster and the Crop Care Cluster, as outlined in explanatory note 4 of our audit financial statements, Crop Care Cluster recorded a profit for the fiscal year ended June 30, 2022, of R$47.2 million, a significant improvement from the loss of R$7.0 million in the fiscal year ending June 30, 2021. This improvement is credited to a R$51.2 million growth in operating profit and increased financial income, offsetting higher income tax losses.
Non-IFRS Financial Measures and Reconciliations
The financial information and other data contained in this subsection is presented to aid the reader to evaluate our business, financial condition, results of operations and prospects. This annual report presents our Adjusted EBITDA, Adjusted EBITDA Margin, Net Debt (Net Cash) and Net Debt (Net Cash) Adjusted EBITDA Ratio, and their reconciliations for the convenience of investors, which are non-IFRS financial measures. A non-IFRS financial measure is generally defined as a numerical measure of historical or future financial performance, financial position, or cash flow that purports to measure financial performance but excludes or includes amounts that would not be so adjusted in the most comparable IFRS measure. For further information on why our management chooses to use these non-IFRS financial measures, and on the limits of using these non-IFRS financial measures, please see “Presentation of Financial and Other Information—Special Note Regarding Non-IFRS Financial Measures.”
Adjusted EBITDA and Adjusted EBITDA Margin
Adjusted EBITDA is defined as profit (loss) for the year, adjusted for finance income (costs), net, income taxes, depreciation and amortization and excluding the impact of certain revenues or expenses that we believe are isolated in nature incurred as part of our expansion, namely: (i) fair value on inventories sold from acquired companies,; (ii) M&A adjustments that in management’s judgment do not necessarily occur on a regular basis; (iii) gains on bargain purchases; (iv) listing and other expenses recognized in connection with the Business Combination; (v) share-based compensation expenses; (vi) bonuses paid out to our employees as a result of the closing of the Business Combination; and (vii) expenses paid to Patria in connection with management consultancy services. Adjusted EBITDA Margin is calculated as Adjusted EBITDA as a percentage of revenue for the period. For further information on Adjusted EBITDA and Adjusted EBITDA Margin, see “Presentation of Financial and Other Information—Special Note Regarding Non-IFRS Financial Measures—Adjusted EBITDA and Adjusted EBITDA Margin.”
123
| For the Fiscal Year Ended June 30, | |||||||||||||||||||||||
| 2023 | 2023 | 2022 | 2021 | ||||||||||||||||||||
| (in US$ millions)(1) | (in R$ millions, except as otherwise indicated) | ||||||||||||||||||||||
Profit (loss) for the year | (45.4) | (218.7) | 107.8 | 21.5 | |||||||||||||||||||
| (+) Depreciation and amortization | 29.2 | 140.6 | 118.5 | 53.4 | |||||||||||||||||||
| (+) Income taxes current and deferred | (35.7) | (172.3) | 32.7 | 24.7 | |||||||||||||||||||
| (+) Finance income (costs), net | 128.2 | 617.8 | 219.4 | 85.8 | |||||||||||||||||||
| (+) Fair value on inventories sold from acquired companies | 5.5 | 26.9 | 27.0 | 39.5 | |||||||||||||||||||
| (+) M&A expenses(2) | 2.3 | 11.1 | 15.8 | 40.2 | |||||||||||||||||||
| (-) Gain on bargain purchases(3) | — | — | (18.3) | — | |||||||||||||||||||
| (+) Listing expenses(4) | 66.3 | 319.6 | — | — | |||||||||||||||||||
| (+) Share-based compensation expenses(5) | 3.0 | 14.5 | — | — | |||||||||||||||||||
| (+) SPAC bonuses(6) | 6.2 | 29.7 | — | — | |||||||||||||||||||
(+) Monitoring expenses(7) | 3.9 | 18.7 | 2.5 | — | |||||||||||||||||||
Adjusted EBITDA | 163.5 | 787.9 | 505.4 | 265.1 | |||||||||||||||||||
| (/) Revenue | 1,939.6 | 9,347.4 | 7,746.5 | 5,098.5 | |||||||||||||||||||
Adjusted EBITDA Margin | 8.4% | 8.4% | 6.5% | 5.2% | |||||||||||||||||||
_____________
(1)For convenience purposes only, amounts in reais have been translated to U.S. dollars using an exchange rate of R$4.8192 to US$1.00, the commercial selling rate for U.S. dollars as of June 30, 2023, as reported by the Central Bank. These translations should not be considered representations that any such amounts have been, could have been or could be converted at that or any other exchange rate. See “Item 3. Key Information—D. Risk Factors—Risks Relating to Latin America—Exchange rate instability may impact our ability to hedge exchange rate risk, which may lead to interest rate volatility and have a material adverse effect on the price of our Ordinary Shares.”
(2)M&A expenses primarily include M&A team compensation expenses and accounting and tax due diligence expenses.
(3)Refers to the difference between the fair value of the Union Agro’s net assets and the price paid by the Company, recorded as a gain. For more information, see note 21(m) to our audited consolidated financial statements included elsewhere in this annual report.
(4)Refers to any excess of fair value of our Ordinary Shares issued over the fair value of TPB SPAC identifiable net assets acquired, which represents compensation for the service of a stock exchange listing for our shares and is expensed as incurred. For more information, see note 22 to our audited consolidated financial statements included elsewhere in this annual report.
(5)Refers to share-based compensation expenses recognized for employee services received during the period. For more information, see note 27(b) to our audited consolidated financial statements included elsewhere in this annual report.
(6)Refers to a one-time SPAC bonus to employees following closing of the Business Combination in the third quarter of the fiscal year ended June 30, 2023.
(7)Refers to expenses paid to Patria in relation to management support services for acquisition transactions. For more information, see “Item 7. Major Shareholders and Related Party Transactions—B. Related Party Transactions—Certain Related Party Transactions.”
Net Debt (Net Cash) and Net Debt (Net Cash)/Adjusted EBITDA Ratio
Net Debt (Net Cash) is calculated as borrowings (current and non-current) plus payables for the acquisition of subsidiaries (current and non-current), obligations to FIAGRO quota holders, warrant liabilities and liability for FPA shares, less cash equivalents and restricted cash. Net Debt (Net Cash)/Adjusted EBITDA Ratio, also a non-IFRS financial measure, is calculated as Net Debt (Net Cash) divided by Adjusted EBITDA. For further information on Net Debt (Net Cash) and Net Debt (Net Cash)/Adjusted EBITDA Ratio, see “Presentation of Financial and Other Information—Special Note Regarding Non-IFRS Financial Measures—Net Debt (Net Cash) and Net Debt (Net Cash)/Adjusted EBITDA Ratio.”
124
| As of June 30, | |||||||||||||||||
| 2023 | 2023 | 2022 | |||||||||||||||
| (in US$ millions)(1) | (in R$ millions, except as otherwise indicated) | ||||||||||||||||
Borrowings (current and non-current) | 200.3 | 965.5 | 710.6 | ||||||||||||||
Obligations to FIAGRO quota holders (2) | 31.1 | 150.0 | — | ||||||||||||||
Payables for the acquisition of subsidiaries (current and non-current) | 57.1 | 275.2 | 164.4 | ||||||||||||||
Warrants liabilities (3) | 7.6 | 36.4 | — | ||||||||||||||
Liabilities for FPA Shares (3) | 28.9 | 139.1 | — | ||||||||||||||
(-) Cash equivalents | (117.1) | (564.3) | (254.4) | ||||||||||||||
(-) Restricted cash (3) | (28.9) | (139.2) | (1.3) | ||||||||||||||
Net Debt | 179.0 | 862.8 | 619.2 | ||||||||||||||
Adjusted EBITDA | 163.5 | 787.9 | 505.4 | ||||||||||||||
Net Debt/Adjusted EBITDA Ratio | N/A | 1.1x | 1.2x | ||||||||||||||
_________________
(1)For convenience purposes only, amounts in reais have been translated to U.S. dollars using an exchange rate of R$4.8192 to US$1.00, the commercial selling rate for U.S. dollars as of June 30, 2023, as reported by the Central Bank. These translations should not be considered representations that any such amounts have been, could have been or could be converted at that or any other exchange rate. See “Item 3. Key Information—D. Risk Factors—Risks Relating to Latin America—Exchange rate instability may impact our ability to hedge exchange rate risk, which may lead to interest rate volatility and have a material adverse effect on the price of our Ordinary Shares.”
(2)For more information on our obligations to FIAGRO quota holders, see note 19 to our audited consolidated financial statements.
(3)For more information on our warrant liabilities, liability for FPA shares and restricted cash, see note 22 to our audited consolidated financial statements.
Material Weakness in Internal Controls and Remediation
As mentioned elsewhere in this annual report, prior to the Business Combination, we were a private company with limited accounting personnel and other resources to address our internal control over financial reporting and procedures.
Our management has not completed an assessment of the effectiveness of our internal control over financial reporting and our independent registered public accounting firm has not conducted an audit of our internal control over financial reporting. In connection with preparation and the audit of our consolidated financial statements the year ended June 30, 2023, we and our independent registered public accounting firm identified a number of material weaknesses in our internal controls over financial reporting as of June 30, 2023. Specifically, (i) inadequate controls around the monthly closing process which resulted in the need to make adjustments to the financial statements; (ii) controls on accounting procedures over revenue recognition, including cutoff procedures and revenue measurement; (iii) controls over the calculation of inventory impairment provisions and (iv) inadequate design of information technology general controls related to management and logical access, to prevent the information system from providing complete and accurate information consistent with financial reporting objectives and current needs. These material weaknesses did not result in a material misstatement in our consolidated financial statements as of June 30, 2023.
We are working on a remediation plan with respect to the material weaknesses identified above, adopting actions such as striving to implement a centralized ERP SAP S/4 Hana and SAP Business One for all subsidiaries, including new subsidiaries as a result of new investments. The implementation of new processes and procedures, include additional levels of review to improve our internal controls procedures, additional training for our staff, changing our internal organizational structure, and enhancing our documentation. We cannot guarantee that the measures we have taken to date and actions we may take in the future will be sufficient to remediate the control deficiencies that led to our material weaknesses in our internal control over financial reporting or that they will prevent or avoid potential future deficiencies. For additional information, see “Item 3. Key Information—D. Risk Factors—Risks Relating to Our Business and Industry—We and our independent registered public accounting firm have identified material weaknesses in our internal control over financial reporting and, if we fail to implement and maintain
125
effective internal controls over financial reporting, we may be unable to accurately report our results of operations, meet our reporting obligations or prevent fraud.”
B.Liquidity and Capital Resources
As of June 30, 2023, 2022 and 2021, we had R$564.3 million, R$254.4 million and R$459.5 million in cash equivalents, respectively. We believe that our current available cash equivalents and the cash flows from our operating activities will be sufficient to meet our working capital requirements and capital expenditures in the ordinary course of business for the next 12 months.
Because of the likelihood that our Warrants will expire worthless or may be exercised on a “cashless” basis, we do not intend to rely on the receipt of proceeds from the exercise of Warrants to fund our liquidity and capital resource requirements. See “—Proceeds from Warrants” below. Similarly, because of the likelihood that we will be required to repurchase Forward Purchase Agreement Shares from FPA Investors on the Maturity Date, we do not intend to rely on the receipt of proceeds in connection therewith to fund our liquidity and capital resource requirements. See “—Forward Purchase Agreements” below.
In addition, in the fiscal year ended June 30, 2023, we obtained a tax benefit that permits us to deduct an ICMS benefit from our income tax calculation. For more information, see notes 10 and 23 to our audited consolidated financial statements included elsewhere in this annual report. In accordance with Article 30 of Law No. 12,973/2014, the amount of ICMS benefits must be allocated to the fiscal incentive reserve category when there is sufficient profit in each subsidiary. Additionally, under the same law, these tax benefits must be included in the calculation base for corporate income tax and the related social contribution on net profits when dividends are distributed or capital is refunded to the shareholders of the subsidiaries. As of June 30, 2023, the amount of fiscal incentive reserve in the subsidiaries is R$358.8 million and the balance of the fiscal benefit not yet allocated due to insufficient profits for this allocation stands at R$680.4 million. We have no intention to make our subsidiaries to distribute the incentive amounts to the parent. In the event of dividend distribution taxation will apply, as per the provisions of tax laws.
Cash Flows
The following table shows the generation and use of cash for the periods indicated:
| For the Fiscal Year Ended June 30, | |||||||||||||||||||||||
| 2023 | 2023 | 2022 | 2021 | ||||||||||||||||||||
| (US$ millions(1)) | (R$ millions) | ||||||||||||||||||||||
Cash Flow Data | |||||||||||||||||||||||
Net cash flows used in (from) operating activities | 22.4 | 108.1 | (259.5) | 51.0 | |||||||||||||||||||
Net cash flows used in investing activities | (45.8) | (220.7) | (244.7) | (311.1) | |||||||||||||||||||
Net cash flows provided by financing activities | 93.1 | 448.7 | 299.1 | 561.0 | |||||||||||||||||||
_____________
(1)For convenience purposes only, amounts in reais have been translated to U.S. dollars using an exchange rate of R$4.8192 to US$1.00, the commercial selling rate for U.S. dollars as of June 30, 2023, as reported by the Central Bank. These translations should not be considered representations that any such amounts have been, could have been or could be converted at that or any other exchange rate. See “Item 3. Key Information—D. Risk Factors—Risks Relating to Latin America—Exchange rate instability may impact our ability to hedge exchange rate risk, which may lead to interest rate volatility and have a material adverse effect on the price of our Ordinary Shares.”
Cash equivalents are comprised of short-term highly liquid investments with a maturity of three months or less, that are readily convertible to a known amount of cash and subject to an insignificant risk of changes in value. For more information, see note 5 to our audited consolidated financial statements included elsewhere in this annual report.
Operating Activities
In the fiscal year ended June 30, 2023, our net cash from operating activities was R$108.1 million, an increase of R$367.5 million, compared to net cash used in operating activities of R$259.5 million in the fiscal year ended June 30, 2022, mainly due to: (i) an increase of R$261.7 million in our profit for the period and the adjustments to
126
reconcile profit for the year to net cash flows, (ii) a decrease of R$275.0 million in our cash use for operating assets and liabilities, the variations of inventories, trade receivables, advances from customers, trade payables, taxes recoverable and salaries and social charges being the largest contributors to this decrease, partially offset by (i) an increase of R$74.4 million in interest paid on trade payables, lease liabilities and borrowings as a result of the larger volume of our operations and (ii) a decrease of R$104.5 million in interest received from revenue contracts compared to 2022. For more information, see note 22 to our audited consolidated financial statements included elsewhere in this annual report.
In the fiscal year ended June 30, 2022, our net cash used in operating activities varied from net cash flows generated from operating activities of R$51.0 million in the fiscal year ended June 30, 2021 to net cash used in operating activities of R$259.5 million in the fiscal year ended June 30, 2022, mainly due to: (i) an increase of R$593.3 million in our cash use for operating assets and liabilities, the variations of inventories, trade receivables and advances from customers being the largest contributors to this decrease, and (ii) an increase of R$128.7 million in interest paid on trade payables and leases liabilities as a result of a larger volume of our operations. This was partially offset by an increase of R$131.2 million in interest received from revenue contracts as a result of a larger volume of our operations and an increase of R$283.3 million in our profit for the period and the adjustments to reconcile profit for the year to net cash flows.
Investing Activities
In the fiscal year ended June 30, 2023, our net cash used in investing activities decreased by R$24.0 million, from R$244.7 million in the fiscal year ended June 30, 2022 to R$220.7 million in the fiscal year ended June 30, 2023, mainly due to: (i) a decrease of R$40.9 million in the acquisition of non-controlling interests, in the fiscal year ended June 30, 2023 compared to the corresponding period in 2022; and (ii) an increase in additions to property, plant and equipment and intangible assets in the period of R$17.7 million, in particular as a result of the larger volume of our operations.
In the fiscal year ended June 30, 2022, our net cash flows used in investing activities decreased by R$66.4 million, from R$311.1 million in the fiscal year ended June 30, 2021 to R$244.7 million in the fiscal year ended June 30, 2022, mainly due to: (i) a decrease of R$82.1 million in acquisition of subsidiaries, net of cash acquired in 2022 compared to 2021, partially offset by a R$12.8 million increase in additions to property, plant and equipment and intangible assets.
Financing Activities
In the fiscal year ended June 30, 2023, our net cash provided by financing activities increased by R$149.6 million, from R$299.1 million in the fiscal year ended June 30, 2022 to R$448.7 million in the fiscal year ended June 30, 2023, mainly due to: (i) an increase of R$1,156.4 million in the repayment of borrowings and R$833.5 million in proceeds from borrowings, (ii) a R$150.0 million increase in proceeds from FIAGRO quota holders, net of transaction costs, and (iii) proceeds from the Business Combination in the amount of R$391.6 million, net of transaction costs. For more information, see note 22 to our audited consolidated financial statements included elsewhere in this annual report.
In the fiscal year ended June 30, 2022, our net cash flows provided by financing activities decreased by R$261.9 million, from R$561.0 million in the fiscal year ended June 30, 2021 to R$299.1 million in the fiscal year ended June 30, 2022, mainly due to a R$592.2 million decrease in proceeds from capital contributions and dividends paid, which was partially offset by a R$323.0 million decrease in the repayment of borrowings and proceeds from borrowings.
Indebtedness
As of June 30, 2023, we had R$965.5 million in outstanding borrowings (current and non-current) (compared to R$710.6 million and R$242.4 million as of June 30, 2022 and 2021, respectively). In addition, as of June 30, 2023, we had R$150.0 million in obligations to FIAGRO quota holders (nil as of June 30, 2022 and 2021). For more information on FIAGRO, see note 19 to our audited consolidated financial statements.
127
The following is a description of our material indebtedness as of June 30, 2023:
On September 15, 2014, our subsidiary Union Agro issued a Credito Fixo to Banco do Brasil S.A. in consideration of a term loan credit facility in the principal amount of R$1.4 million, with interest accruing at a rate per annum equal to the 4.50% and maturing on October 15, 2024. As of June 30, 2023, R$0.2 million was outstanding under this credit facility.
On December 22, 2014, our subsidiary Union Agro issued a Credito Fixo to Banco do Brasil S.A. in consideration of a term loan credit facility in the principal amount of R$0.1 million, with interest accruing at a rate per annum equal to the 4.50% and maturing on January 15, 2025. As of June 30, 2023, R$0.01 million was outstanding under this credit facility.
On December 4, 2015, our subsidiary Union Agro issued a Credito Fixo to Banco do Brasil S.A. in consideration of a term loan credit facility in the principal amount of R$0.1 million, with interest accruing at a rate per annum equal to the 7.00% and maturing on December 15, 2023. As of June 30, 2023, R$0.01 million was outstanding under this credit facility.
On December 7, 2015, our subsidiary Union Agro issued a Credito Fixo to Banco do Brasil S.A. in consideration of a term loan credit facility in the principal amount of R$0.4 million, with interest accruing at a rate per annum equal to the 7.00% and maturing on December 15, 2023. As of June 30, 2023, R$0.04 million was outstanding under this credit facility.
On August 20, 2020, our subsidiary Union Agro issued a CCB to Banco do Brasil S.A. in consideration of a term loan credit facility in the principal amount of R$1.0 million, with interest accruing at a rate per annum equal to the CDI Rate plus 4.50% and maturing on August 19, 2023. As of June 30, 2023, R$0.1 million was outstanding under this credit facility.
On August 22, 2020, our subsidiary Cultivar entered into a BNDES FGI term loan facility with Banco Santander (Brasil) S.A., in the principal amount of R$5.0 million, with interest accruing at a rate of 9.38% per annum and maturing on August 21, 2023. This term loan credit facility is guaranteed by our subsidiary Lavoro Agro Holding S.A. As of June 30, 2023, R$0.4 million was outstanding under this credit facility.
On August 27, 2020, our subsidiary Cultivar entered into a BNDES FGI term loan facility with Banco Itaú Unibanco S.A. in the principal amount of R$10.0 million, with interest accruing at a rate of 9.38% per annum and maturing on September 2, 2024. This term loan credit facility is guaranteed by our subsidiary Lavoro Agro Holding S.A. As of June 30, 2023, R$3.2 million was outstanding under this credit facility.
On September 8, 2020, our subsidiary Union Agro issued a CCB to Banco do Brasil S.A. in consideration of a term loan credit facility in the principal amount of R$4.5 million, with interest accruing at a rate per annum equal to the CDI Rate plus 4.50% and maturing on September 15, 2023. As of June 30, 2023, R$0.6 million was outstanding under this credit facility.
On September 12, 2022, our subsidiary Lavoro Agrocomercial issued an NCE to Banco do Brasil S.A. in consideration of a term loan credit facility in the principal amount of R$50.0 million, with interest accruing at a rate per annum equal to the CDI Rate plus 2.86% and maturing on August 25, 2023. This term loan credit facility is guaranteed by our subsidiary Lavoro Agro Holding S.A. As of June 30, 2023, R$53.4 million was outstanding under this credit facility.
On October 27, 2020, our subsidiary Union Agro issued a CCB to Banco do Brasil S.A. in consideration of a term loan credit facility in the principal amount of R$1.7 million, with interest accruing at a rate per annum equal to the CDI Rate plus 4.50% and maturing on October 21, 2023. As of June 30, 2023, R$0.2 million was outstanding under this credit facility.
On November 9, 2020, our subsidiary Facirolli Comércio e Representação S/A. issued a CCB to Banco Bradesco S.A. in consideration of a term loan credit facility in the principal amount of R$4.8 million, with interest accruing at a rate per annum equal to 10.25% and maturing on November 10, 2025. As of June 30, 2023, R$3.1 million was outstanding under this credit facility.
128
On September 16, 2020, our subsidiary Facirolli Comércio e Representação S/A. issued a CCB to Banco Daycoval S.A. in consideration of a term loan credit facility in the principal amount of R$4.0 million, with interest accruing at a rate per annum equal to 10.03% and maturing on September 16, 2024. This term loan credit facility is guaranteed by our subsidiary Lavoro Agro Holding S.A. As of June 30, 2023, R$1.0 million was outstanding under this credit facility.
On January 22, 2021, our subsidiary Union Agro issued a CCB to Banco do Brasil S.A. in consideration of a term loan credit facility in the principal amount of R$2.5 million, with interest accruing at a rate per annum equal to the CDI Rate plus 4.50% and maturing on August 10, 2023. As of June 30, 2023, R$0.2 million was outstanding under this credit facility.
On September 29, 2021, our subsidiary Lavoro Agrocomercial S.A. issued a CCB to Banco C6 S.A. in consideration of a term loan credit facility in the principal amount of R$12.0 million, with interest accruing at a rate per annum equal to the CDI Rate plus 4.91% and maturing on September 29, 2023. This term loan credit facility is guaranteed by our subsidiary Lavoro Agro Holding S.A. As of June 30, 2023, R$1.5 million was outstanding under this credit facility.
On October 11, 2021, our subsidiary Union Agro issued a CCB to Banco do Brasil S.A. in consideration of a term loan credit facility in the principal amount of R$6.5 million, with interest accruing at a rate per annum equal to the CDI Rate plus 4.09% and maturing on October 11, 2023. As of June 30, 2023, R$2.2 million was outstanding under this credit facility.
On March 11, 2022, our subsidiary Agrobiológica issued a CCB to SICOOB S.A. in consideration of a term loan credit facility in the principal amount of R$19.3 million, with interest accruing at a rate per annum equal to the CDI Rate plus 4.35% and maturing on March 15, 2027. As of June 30, 2023, R$14.5 million was outstanding under this credit facility.
On July 15, 2022, our subsidiary Union Agro issued a Credito Fixo to Banco Santander S.A. in consideration of a term loan credit facility in the principal amount of R$0.2 million, with interest accruing at a rate per annum equal to the CDI Rate plus 13.40% and maturing on July 14, 2025. This term loan credit facility is guaranteed by our subsidiary Lavoro Agro Holding S.A. As of June 30, 2023, R$0.2 million was outstanding under this credit facility.
On July 27, 2022, our subsidiary Agrointegral Andina S.A.S. entered into a Finagro credit facility with Bancolombia S.A. in the principal amount of COP$10,000.0 million, with interest accruing at a rate per annum equal to the IBR Rate plus 2.45% and maturing on July 27, 2023. This term loan credit facility is guaranteed by our subsidiary Agroquimicos para la Agricultura Colombiana S.A.S. and Grupo Gral S.A.S. As of June 30, 2023, COP$833.3 million was outstanding under this credit facility.
On July 27, 2022, our subsidiary Agricultura y Servicios S.A.S issued a Tesorería to Bancolombia S.A. in consideration of a term loan credit facility in the principal amount of COP$12,002.4 million, with interest accruing at a rate per annum equal to the IBR Rate plus 4.00% and maturing on July 27, 2027. This term loan credit facility is guaranteed by our subsidiary Lavoro Colombia S.A.S. As of June 30, 2023, COP$10,655.3 million was outstanding under this credit facility.
On July 27, 2022, our subsidiary Agrointegral Andina S.A.S. entered into a Finagro credit facility with Banco de Bogotá S.A. in the principal amount of COP$8,500.0 million, with interest accruing at a rate per annum equal to the IBR Rate plus 2.90% and maturing on July 22, 2023. This term loan credit facility is guaranteed by our subsidiary Grupo Gral S.A.S. As of June 30, 2023, COP$708.3 million was outstanding under this credit facility.
On August 17, 2022, our subsidiary Lavoro Agrocomercial S.A. issued a Finame to Banco Santander S.A. in consideration of a term loan credit facility in the principal amount of R$80.0 million, with interest accruing at a rate per annum equal to the CDI Rate plus 3.5% and maturing on September 15, 2023. As of June 30, 2023, R$93.3 million was outstanding under this credit facility.
On August 30, 2022, our subsidiary Grupo Cenagro S.A.S entered into a Finagro credit facility with Banco de Occidente S.A. in the principal amount of COP$5,450.0 million, with interest accruing at a rate per annum equal to
129
the IBR Rate plus 1.50% and maturing on January 25, 2025. As of June 30, 2023, COP$4,087.5 million was outstanding under this credit facility.
On September 7, 2022, our subsidiary Agrointegral Andina S.A.S. entered into a Finagro credit facility with Banco de Bogotá S.A in the principal amount of COP$7,300.0 million, with interest accruing at a rate per annum equal to the IBR Rate plus 4.55% and maturing on September 2, 2023. This term loan credit facility is guaranteed by our subsidiary Grupo Gral S.A.S. As of June 30, 2023, COP$1,715.9 million was outstanding under this credit facility.
On September 19, 2022, our subsidiary Pitangueiras, issued an NCE to Banco do Brasil S.A. in consideration of a term loan credit facility in the principal amount of R$50.0 million, with interest accruing at a rate per annum equal to the CDI Rate plus 2.86% and maturing on August 25, 2023. This term loan credit facility is guaranteed by our subsidiary Lavoro Agro Holding S.A. As of June 30, 2023, R$53.4 million was outstanding under this credit facility.
On September 21, 2022, our subsidiary Pitangueiras, issued an NCE to Banco C6 S.A. in consideration of a term loan credit facility in the principal amount of R$7.0 million, with interest accruing at a rate per annum equal to the CDI Rate plus 4.70% and maturing on September 21, 2023. This term loan credit facility is guaranteed by our subsidiary Lavoro Agro Holding S.A. As of June 30, 2023, R$3.5 million was outstanding under this credit facility.
On September 22, 2022, our subsidiary Pitangueiras, issued an NCE to Banco Safra S.A. in consideration of a term loan credit facility in the principal amount of R$100.0 million, with interest accruing at a rate per annum equal to the CDI Rate plus 2.80% and maturing on September 18, 2023. This term loan credit facility is guaranteed by our subsidiary Lavoro Agro Holding S.A. As of June 30, 2023, R$114.1 million was outstanding under this credit facility.
On September 27, 2022, our subsidiary Agrointegral Andina S.A.S. entered into a Finagro credit facility with Bancolombia S.A. in the principal amount of COP$1,850.0 million, with interest accruing at a rate per annum equal to the IBR Rate plus 3.30% and maturing on September 27, 2023. This term loan credit facility is guaranteed by our subsidiary Agroquimicos para la Agricultura Colombiana S.A.S. and Grupo Gral S.A.S. As of June 30, 2023, COP$925.0 million was outstanding under this credit facility.
On September 28, 2022, our subsidiary Produtec issued a 4131 note to Banco Itaú Unibanco S.A. in consideration of a term loan credit facility in the principal amount of R$50.0 million, with interest accruing at a rate per annum equal to the CDI Rate plus 2.67% and maturing on September 28, 2023. This term loan credit facility is guaranteed by our subsidiary Lavoro Agro Holding S.A. As of June 30, 2023, R$56.9 million was outstanding under this credit facility.
On September 27, 2022, our subsidiary Lavoro Agrocomercial issued an NCE to Banco BTG Pactual S.A. in consideration of a term loan credit facility in the principal amount of R$30.0 million, with interest accruing at a rate per annum equal to the CDI Rate plus 3.90% and maturing on September 27, 2023. This term loan credit facility is guaranteed by our subsidiary Lavoro Agro Holding S.A. As of June 30, 2023, R$30.5 million was outstanding under this credit facility.
On September 30, 2022, our subsidiary Union Agro issued a financial rural products note (cédulo de produto rural financeira), or a CPR-F, to Banco Itaú BBA S.A. in consideration of a term loan credit facility in the principal amount of R$20.0 million, with interest accruing at a rate per annum equal to the CDI Rate plus 2.87% and maturing on September 30, 2023. This term loan credit facility is guaranteed by our subsidiary Lavoro Agro Holding S.A. As of June 30, 2023, R$22.5 million was outstanding under this credit facility.
On October 3, 2022, our subsidiary Union Agro issued a Credito Fixo to SICOOB S.A.in consideration of a term loan credit facility in the principal amount of R$19.0 million, with interest accruing at a rate per annum equal to the CDI Rate plus 4.95% and maturing on October 10, 2025. This term loan credit facility is guaranteed by our subsidiary Lavoro Agro Holding S.A. As of June 30, 2023, R$16.3 million was outstanding under this credit facility.
On October 10, 2022, our subsidiary Lavoro Agrocomercial issued an NCE to Banco Itaú Unibanco S.A. in consideration of a term loan credit facility in the principal amount of R$20.0 million, with interest accruing at a rate
130
per annum equal to the CDI Rate plus 2.48% and maturing on October 13, 2023. This term loan credit facility is guaranteed by our subsidiary Lavoro Agro Holding S.A. As of June 30, 2023, R$22.6 million was outstanding under this credit facility.
On October 10, 2022, our subsidiary Pitangueiras issued an NCE to Banco Itaú Unibanco S.A. in consideration of a term loan credit facility in the principal amount of R$20.0 million, with interest accruing at a rate per annum equal to the CDI Rate plus 2.84% and maturing on October 13, 2023. This term loan credit facility is guaranteed by our subsidiary Lavoro Agro Holding S.A. As of June 30, 2023, R$22.3 million was outstanding under this credit facility.
On October 14, 2022, our subsidiary Union Agro issued a Credito Fixo to Banco Santander S.A. in consideration of a term loan credit facility in the principal amount of R$0.1 million, with interest accruing at a rate per annum equal to the CDI Rate plus 13.40% and maturing on October 14, 2024. As of June 30, 2023, R$0.1 was outstanding under this credit facility.
On October 26, 2022, our subsidiary Agroquimicos para la Agricultura Colombiana S.A.S. entered into a Finagro credit facility with Bancolombia S.A. in the principal amount of COP$2,100.0 million, with interest accruing at a rate per annum equal to the IBR Rate plus 3.55% and maturing on October 26, 2023. This term loan credit facility is guaranteed by our subsidiary Grupo Gral S.A.S. and Agrointegral Andina S.A.S. As of June 30, 2023, COP$1,050.0 million was outstanding under this credit facility.
On October 26, 2022, our subsidiary Agrointegral Andina S.A.S. entered into a Finagro credit facility with Bancolombia S.A. in the principal amount of COP$1,900.0 million, with interest accruing at a rate per annum equal to the IBR Rate plus 3.55% and maturing on October 26, 2023. This term loan credit facility is guaranteed by our subsidiary Agroquimicos para la Agricultura Colombiana S.A.S. and Grupo Gral S.A.S. As of June 30, 2023, COP$950.0 million was outstanding under this credit facility.
On October 27, 2022, our subsidiary Lavoro Agrocomercial issued an NCE to Banco ABC S.A. in consideration of a term loan credit facility in the principal amount of R$50.0 million, with interest accruing at a rate per annum equal to the CDI Rate plus 3.00% and maturing on October 27, 2023. This term loan credit facility is guaranteed by our subsidiary Lavoro Agro Holding S.A. As of June 30, 2023, R$50.7 million was outstanding under this credit facility.
On October 31, 2022, our subsidiary Lavoro Agrocomercial issued an NCE to Banco BV S.A. in consideration of a term loan credit facility in the principal amount of R$15.0 million, with interest accruing at a rate per annum equal to the CDI Rate plus 3.05% and maturing on November 30, 2023. This term loan credit facility is guaranteed by our subsidiary Lavoro Agro Holding S.A. As of June 30, 2023, R$15.6 million was outstanding under this credit facility.
On November 23, 2022, our subsidiary Agrobiológica issued an CPR-F to Banco Itaú BBA S.A. in consideration of a term loan credit facility in the principal amount of R$1.0 million, with interest accruing at a rate per annum equal to the CDI Rate plus 3.05% and maturing on November 23, 2023. This term loan credit facility is guaranteed by our subsidiary Lavoro Agro Holding S.A. As of June 30, 2023, R$1.0 million was outstanding under this credit facility.
On November 23, 2022, our subsidiary Agrobiológica issued an CPR-F to Banco Itaú BBA S.A. in consideration of a term loan credit facility in the principal amount of R$2.0 million, with interest accruing at a rate per annum equal to the CDI Rate plus 3.05% and maturing on November 23, 2023. This term loan credit facility is guaranteed by our subsidiary Lavoro Agro Holding S.A. As of June 30, 2023, R$2.2 million was outstanding under this credit facility.
On November 28, 2022, our subsidiary Agricultura y Servicios S.A.S issued a tesorería note to Bancolombia S.A. in consideration of a term loan credit facility in the principal amount of COP$3,002.0 million, with interest accruing at a rate per annum equal to the IBR Rate plus 6.35% and maturing on November 28, 2027. This term loan credit facility is guaranteed by our subsidiary Lavoro Colombia S.A.S. and Provecampo S.A.S. As of June 30, 2023, COP$2,701.8 million was outstanding under this credit facility.
131
On November 29, 2022, our subsidiary Agrointegral Andina S.A.S issued a tesorería note to Banco de Bogotá S.A. in consideration of a term loan credit facility in the principal amount of COP$4,000.0 million, with interest accruing at a rate per annum equal to 15.72% and maturing on November 24, 2023. This term loan credit facility is guaranteed by our subsidiary Grupo Gral S.A.S. As of June 30, 2023, COP$1,545.7 million was outstanding under this credit facility.
On January 28, 2023, our subsidiary Sollo Sul issued a CPR to Banco Itaú S.A. in consideration of a term loan credit facility in the principal amount of R$24.4 million, with interest accruing at a rate per annum equal to the CDI Rate plus 2.87% and maturing on January 29, 2024. As of June 30, 2023, R$26.4 million was outstanding under this credit facility.
On March 7, 2023, our subsidiary Agrobiológica issued a capital de giro note to Caixa Econômica Federal in consideration of a term loan credit facility in the principal amount of R$2.0 million, with interest accruing at a rate per annum equal to the CDI Rate plus 2.43% and maturing on December 7, 2023. As of June 30, 2023, R$2.0 million was outstanding under this credit facility.
On March 24, 2023, our subsidiary Agrobiológica issued a capital de giro note to Caixa Econômica Federal in consideration of a term loan credit facility in the principal amount of R$3.0 million, with interest accruing at a rate per annum equal to the CDI Rate plus 2.43% and maturing on December 26, 2023. As of June 30, 2023, R$3.0 million was outstanding under this credit facility.
On March 24, 2023, our subsidiary Agrobiológica issued a capital de giro note to Caixa Econômica Federal in consideration of a term loan credit facility in the principal amount of R$4.0 million, with interest accruing at a rate per annum equal to the CDI Rate plus 5.66% and maturing on March 24, 2026. As of June 30, 2023, R$2.0 million was outstanding under this credit facility.
On April 06, 2023, our subsidiary Lavoro Agrocomercial issued an NCE USD Swap to Banco Citibank S.A. in consideration of a term loan credit facility in the principal amount of R$100.0 million, with interest accruing at a rate per annum equal to the CDI Rate plus 2.9% and maturing on April 20, 2024. This term loan credit facility is guaranteed by our subsidiary Lavoro Agro Holding S.A. As of June 30, 2023, R$101.1 million was outstanding under this credit facility.
On April 27, 2023, our subsidiary Agrointegral Andina S.A.S. entered into a Finagro credit facility with Itaú S.A. in the principal amount of COP$9,900.0 million, with interest accruing at a rate per annum equal to the IBR Rate plus 3.83% and maturing on July 27, 2023. This term loan credit facility is guaranteed by our subsidiary Agroquimicos para la Agricultura Colombiana S.A.S. and Grupo Gral S.A.S. As of June 30, 2023, COP$9,900.0 million was outstanding under this credit facility.
On May 10, 2023, our subsidiary Agrointegral Andina S.A.S. entered into a Tesorería credit facility with Bancolombia S.A. in the principal amount of COP$11,700.0 million, with interest accruing at a rate per annum equal to the IBR Rate plus 3.33% and maturing on May 24, 2024. This term loan credit facility is guaranteed by our subsidiary Agroquimicos para la Agricultura Colombiana S.A.S. and Grupo Gral S.A.S. As of June 30, 2023, COP$10,725.0 million was outstanding under this credit facility.
On May 22, 2023, our subsidiary Central Agrícola issued an NCE to Banco do Brasil S.A. in consideration of a term loan credit facility in the principal amount of R$70.0 million, with interest accruing at a rate per annum equal to the CDI Rate plus 2.98% and maturing on May 28, 2024. As of June 30, 2023, R$72.0 million was outstanding under this credit facility.
On May 22, 2023, our subsidiary Pitangueiras issued an NCE to Banco do Brasil S.A. in consideration of a term loan credit facility in the principal amount of R$55.0 million, with interest accruing at a rate per annum equal to the CDI Rate plus 2.4% and maturing on May 28, 2024. This term loan credit facility is guaranteed by our subsidiary Lavoro Agro Holding S.A. As of June 30, 2023, R$56.6 million was outstanding under this credit facility.
On May 29, 2023, our subsidiary Central Agrícola issued an NCE to Banco Itaú S.A. in consideration of a term loan credit facility in the principal amount of R$60.0 million, with interest accruing at a rate per annum equal to the
132
CDI Rate plus 2.98% and maturing on August 28, 2023. As of June 30, 2023, R$61.7 million was outstanding under this credit facility.
On May 31, 2023, our subsidiary Agrointegral Andina S.A.S. entered into a Tesorería credit facility with Banco de Bogotá S.A. in the principal amount of COP$8,000.0 million, with interest accruing at a rate per annum equal to the IBR Rate plus 3.00% and maturing on May 30, 2024. This term loan credit facility is guaranteed by our subsidiary Agroquimicos para la Agricultura Colombiana S.A.S. and Grupo Gral S.A.S. As of June 30, 2023, COP$8,000.0 million was outstanding under this credit facility.
On June 27, 2023, our subsidiary Agrointegral Andina S.A.S. entered into a Tesorería credit facility with Bancolombia S.A. in the principal amount of COP$8,000.0 million, with interest accruing at a rate per annum equal to the IBR Rate plus 3.54% and maturing on June 26, 2024. This term loan credit facility is guaranteed by our subsidiary Agroquimicos para la Agricultura Colombiana S.A.S. and Grupo Gral S.A.S. As of June 30, 2023, COP$8,000.0 million was outstanding under this credit facility.
As of June 30, 2023 and as of the date of this annual report, we are in compliance with the covenants in our borrowing agreements, which do not contain financial covenants. For further information on our indebtedness, see note 18 to our audited consolidated financial statements included elsewhere in this annual report.
FIAGRO (Agribusiness Credit Rights Investment Fund)
On July 22, 2022, we entered into an agreement to transfer receivables in the aggregate amount of R$160.0 million to Lavoro Agro Fundo de Investimentos nas Cadeias Produtivas Agroindustriais (Fiagro)—Direitos Creditórios, or “Fiagro,” an investment fund legal structure established under Brazilian law designed specifically for investing in agribusiness credit rights receivables. Given the long collection period associated with certain of our receivables, the acquisition of such receivables by the Fiagro investment fund enables us to anticipate the receipt of funds from such receivables, and to use such resources to obtain more favorable payment terms and conditions with our vendors.
The Fiagro fund was structured with several tranches of quotas, with senior and mezzanine quotas bearing interest at a benchmark rate of return ranging from the CDI rate + 2.45% per year up to the CDI rate + 8.0% per year. Residual returns from the Fiagro fund, if any, are paid on the subordinated quotas, which do not bear interest and are not otherwise entitled to any pre-established rate of return. Senior and mezzanine quotas amortize annually over a three year period after an initial 24-month grace period, whereas subordinated quotas amortize at the end of the fifth annual period.
Certain of Patria’s related parties acquired the mezzanine quotas of Fiagro in an aggregate amount of R$56.0 million. We acquired the subordinated quotas of Fiagro in an aggregate amount of R$8.1 million. Under the terms of the Fiagro, we are not liable in case there is a default on the credit rights acquired by the fund, but any such default may adversely affect our stake in Fiagro quotas. Our agreement to assign certain credit rights to Fiagro will expire when all assigned receivables have been liquidated.
In accordance with IFRS 10, we concluded we control FIAGRO and, therefore, it is consolidated in our financial statements. The senior and mezzanine quotas are accounted for as a financial liability under “Obligations to FIAGRO quota holders” and the remuneration paid to senior and mezzanine quota holders is recorded as interest expense. For further information, see note 19 to our audited consolidated financial statements included elsewhere in this annual report.
Proceeds from Warrants
We will not receive any of the proceeds from sales of Warrants, except with respect to amounts we may receive upon the exercise of the Warrants. Whether warrantholders will exercise their Warrants, and therefore the amount of cash proceeds we would receive upon exercise, is dependent upon the trading price of the Ordinary Shares, the reported sales price for which was US$5.96 per share on June 30, 2023. Each Warrant is exercisable for one
133
Ordinary Share at an exercise price of US$11.50. Therefore, if and when the trading price of the Ordinary Shares is less than US$11.50, we expect that warrantholders would not exercise their Warrants.
We could receive up to an aggregate of approximately US$115,961,469 if all of the Warrants are exercised for cash, but we would only receive such proceeds if and when the warrantholders exercise the Warrants which, based on the current trading price of our Ordinary Shares, is unlikely unless there is a relevant increase in trading price. The Warrants may not be or remain in the money during the period they are exercisable and prior to their expiration and, therefore, it is possible that the Warrants may not be exercised prior to their maturity on February 28, 2028, even if they are in the money, and as such, may expire worthless with minimal proceeds received by us, if any, from the exercise of Warrants. To the extent that any of the Warrants are exercised on a “cashless basis,” we will not receive any proceeds upon such exercise. As a result, we do not expect to rely on the cash exercise of Warrants to fund our operations. Instead, we intend to rely on other sources of cash discussed elsewhere in this annual report to continue to fund our operations.
Forward Purchase Agreements
On February 21, 2023, TPB SPAC entered into separate Forward Purchase Agreements with certain FPA Investors, pursuant to which TPB SPAC (or Second Merger Sub, as successor-in-interest to TPB SPAC following the Closing) agreed to purchase in the aggregate, on the Maturity Date, up to 2,830,750 Ordinary Shares then held by the FPA Investors (subject to certain conditions and purchase limits set forth in the Forward Purchase Agreements). Pursuant to the terms of the Forward Purchase Agreements, each FPA Investor further agreed not to redeem, in connection with the Extraordinary General Meeting, of any of the SPAC Class A Ordinary Shares owned by it at such time. The per Ordinary Share price at which the FPA Investors have the right to sell the Ordinary Shares to us on the Maturity Date is (i) the total amount of the Escrowed Property in the Escrow Account (in each case, as defined in “Item 7. Major Shareholders and Related Party Transactions—B. Related Party Transactions—Transactions Related to the Business Combination—Forward Purchase Agreements”), divided by (ii) the total number of Ordinary Shares held by the FPA Investors as of the Maturity Date. The Forward Purchase Agreements may also be terminated, subject to certain conditions, if the trading price of our Ordinary Shares is less than US$5.00 per share (as adjusted for stock splits, stock dividends, cash dividends, reorganizations, combinations, recapitalizations and the like) on any 20 trading days within any consecutive 30 trading day period occurring following the six month anniversary of the date on which the Ordinary Shares are registered for resale. In this event, we would be required to deliver to the FPA Investors, for the FPA Investors’ use without restriction, an amount equal to (i) the Escrowed Property, divided by (ii) the total number of Ordinary Shares then held by the FPA Investors, multiplied by (iii) the number of Ordinary Shares then held by the FPA Investors.
If the FPA Investors hold some or all of the 2,830,750 Forward Purchase Agreement Shares on the Maturity Date, and the per share trading price of our Ordinary Shares is less than the per Ordinary Share price at which the FPA Investors have the right to sell the Ordinary Shares to us on the Maturity Date, we would expect that the FPA Investors will exercise this repurchase right with respect to such shares. We have placed an amount equal to the Escrowed Property to secure our purchase obligation to the FPA Investors under the Forward Purchase Agreements. Nonetheless, in the event that we are required to repurchase these Forward Purchase Agreement Shares, or in the event that the Forward Purchase Agreements are terminated under the conditions described above, the amount of Escrowed Property to which we could be entitled to as of the Maturity Date may be reduced to zero, which would accordingly reduce the amount of cash arising from the Business Combination that would ultimately be available to fund our liquidity and capital resource requirements, which would adversely affect our ability to fund our growth plan in the manner we had contemplated when entering into the Forward Purchase Agreements.
For more information, see “Item 7. Major Shareholders and Related Party Transactions—B. Related Party Transactions—Transactions Related to the Business Combination—Forward Purchase Agreements.”
Capital Expenditures
In the fiscal years ended June 30, 2023 and 2022, our principal capital expenditures consisted of additions to property, plant and equipment and intangible assets, which amounted to R$73.7 million and R$47.7 million in such fiscal years, respectively. In these fiscal years, our capital expenditures were primarily used to acquire vehicles, machines and equipment, to improve facilities to support the growth of our operations and to improve efficiency and
134
quality, including a R$100 million investment (between 2022 and 2025) in Agrobiológica to develop its research and development and production site in Itapolis, state of São Paulo. Such capital expenditures are financed through cash generated from our operations or, in the case of the Agrobiológica expenditure, through long-term indebtedness. To the extent the proceeds of the Business Combination and cash from our business activities are insufficient to fund future capital requirements, including potential future acquisitions, we may need to seek equity or debt financing in the future. We will continue to make capital expenditures to support the expected growth of our business.
Tabular Disclosure of Contractual Obligations
The following is a summary of our contractual obligations as of June 30, 2023:
| Payments Due By Period as of June 30, 2023 | |||||||||||||||||
| Total | Up to 1 year | 1-5 years | |||||||||||||||
(in R$ millions) | |||||||||||||||||
Leases liabilities | 202.7 | 91.4 | 111.3 | ||||||||||||||
Borrowings | 1,030.7 | 982.3 | 48.4 | ||||||||||||||
Payables for the acquisition of subsidiaries | 279.9 | 224.7 | 55.2 | ||||||||||||||
Obligations to FIAGRO quota holders | 159.7 | 159.7 | — | ||||||||||||||
Warrant liabilities | 36.4 | — | 36.4 | ||||||||||||||
Liability for FPA shares | 139.1 | — | 139.1 | ||||||||||||||
Total | 1,848.5 | 1,458.1 | 390.4 | ||||||||||||||
The following is a summary of our contractual obligations as of June 30, 2022:
| Payments Due By Period as of June 30, 2022 | |||||||||||||||||
| Total | Up to 1 year | 1-5 years | |||||||||||||||
(in R$ millions) | |||||||||||||||||
Leases liabilities | 165.7 | 72.2 | 93.5 | ||||||||||||||
Borrowings | 741.0 | 709.3 | 31.8 | ||||||||||||||
Payables for the acquisition of subsidiaries | 170.0 | 114.5 | 55.4 | ||||||||||||||
Total | 1,076.7 | 896.0 | 180.7 | ||||||||||||||
Off-Balance Sheet Arrangements
We provide guarantees to our input suppliers in consideration for installment purchases of agricultural inputs. These guarantees are represented by short-term bank guarantees and the endorsement of rural producer notes (cédula do produtor rural), or CPRs, obtained from customers in the sales process. The amount of these guarantees was R$920.9 million and R$506.8 million as of June 30, 2023 and 2022, respectively.
Other than as set forth above, we did not have any off-balance sheet arrangements as of June 30, 2023.
C.Research and Development, Patents and Licenses, etc.
We rely on a combination of trademark, domain names and trade secret laws, as well as employee and third-party non-disclosure, confidentiality and other types of contractual arrangements to establish, maintain and enforce our intellectual property rights, including with respect to our proprietary rights related to our products and services. In addition, we license technology from third parties.
As of June 30, 2023, we owned one Brazil-issued patent related to bacterial growth medium. We own a number of trademarks including “Lavoro,” “Integra,” “Qualicitrus,” “América,” “Agrovenci,” and other valuable trademarks and designs covering various brands, products and services, including “Perterra.” We also own a number of domain
135
names registered in Brazil, including lavoroagro.com, grupopitangueiras.com.br, impactoinsumos.com.br, and agrobiologica.com.br and abroad such as grupogral.co.
As of the date of this annual report, our application to register the trademark “Lavoro” in the United States is pending approval by the relevant authority.
D.Trend Information
Other than as disclosed elsewhere in this annual report, we are not aware of any other trends, uncertainties, demands, commitments or events for the fiscal year ended June 30, 2023 that are reasonably likely to have a material and adverse effect on our revenues, income, profitability, liquidity or capital resources, or that would cause the disclosed financial information to be not necessarily indicative of future results of operations or financial conditions.
E.Critical Accounting Estimates
Our financial statements are prepared in conformity with IFRS. In preparing our financial statements, we make assumptions, judgments and estimates that can have a significant impact on amounts reported in our financial statements. We base our assumptions, judgments and estimates on historical experience and various other factors that we believe to be reasonable under the circumstances. Actual results could differ materially from these estimates under different assumptions or conditions. We regularly reevaluate our assumptions, judgments and estimates. Our significant accounting policies are described in note 2 to our audited consolidated financial statements included elsewhere in this annual report.
For information about recent accounting pronouncements that will apply to us in the near future, see note 3 to our audited consolidated financial statements included elsewhere in this annual report.
Item 6. Directors, Senior Management and Employees
A.Directors and Senior Management
We are managed by our board of directors and by our senior management, pursuant to our governing documents, the Companies Act and the common law of the Cayman Islands.
Board of Directors
Our board of directors is comprised of seven members. Each director holds office for the term, if any, fixed by the shareholder resolution that appointed him or her, or, if no term is fixed on the appointment of the director, until the earlier of his or her removal from or vacating office as a director in accordance with our governing documents. Our board of directors is divided into three classes, with only one class of directors being appointed in each year, and with each class (except for those directors appointed prior to its first annual general meeting) serving a three-year term. Our directors do not have a retirement age requirement under our governing documents.
The following table sets forth certain information, as of the date of this annual report, concerning our directors. Unless otherwise indicated, the business address for our directors is Av. Dr. Cardoso de Melo, 1450, 4th floor, office 401, São Paulo, SP, 04548-005.
| Name | Date of Birth | Position(s) | ||||||||||||
Marcos de Mello Mattos Haaland | June 3, 1965 | Chairman | ||||||||||||
Ricardo Leonel Scavazza | December 26, 1977 | Director | ||||||||||||
Daniel Fisberg | June 20, 1984 | Director | ||||||||||||
David Friedberg | June 6, 1980 | Director | ||||||||||||
Michael Stern | March 19, 1961 | Independent Director(1) | ||||||||||||
Lauren StClair | May 8, 1980 | Independent Director(1) | ||||||||||||
Eduardo Daher | December 26, 1949 | Independent Director(1) | ||||||||||||
136
_____________
(1)Member of the Audit Committee.
Marcos de Mello Mattos Haaland is the chairman of our board of directors. Mr. Haaland was appointed as the Operating Partner at Patria starting February 2023. Prior to that, Mr. Haaland was a Managing Director for Alvarez & Marsal Brasil Participações Ltda for over 10 years from May 2012 to January 2023, most recently leading the Agribusiness business unit. He was also a board member and chairman at certain periods at Affinity Petcare, trademark of Mogiana Alimentos S.A. from July 2013 to August 2021 and board member and chairman at certain periods for Guabi Nutrição e Saúde Animal S.A. from May 2010 to December 2019. From April 2006 to July 2011, Mr. Haaland was General Manager at Nutriplant Industria e Comercio S.A., a specialty fertilizer company, leading its IPO in 2008. He was also General Manager at Mogiana Alimentos S.A., a feed and pet food company, from February 1995 to April 2003. He was also a consultant with Booz, Allen & Hamilton from March 1990 to February 1995. Mr. Haaland holds a bachelors’ degree in mechanical engineering from Universidade Estadual de Campinas, Brazil, a MSc from University of Illinois, USA and a MBA from INSEAD, France. He is a certified board member from the Brazilian Institute of Corporate Governance. We believe Mr. Haaland is well qualified to serve as director due to his extensive business management experience.
Ricardo Leonel Scavazza is a member of our board of directors. Mr. Scavazza is a Managing Partner of Patria and is the Chief Executive Officer and Chief Investments Officer of Latin American Private Equity since December 2020. Mr. Scavazza is responsible for all Latin America Private Equity strategy at Patria. Before taking over as CEO and CIO for Private Equity Latin America, Mr. Scavazza served as the Head of Private Equity Strategy in Brazil. Mr. Scavazza joined Patrimônio in 1999, became a Partner in 2005, and has worked on several new investments and acquisitions for the portfolio companies of Private Equity Funds I, II, III, IV and V. Mr. Scavazza held operating roles in several investments, including a tenure as Chief Executive Officer at Anhanguera between 2009 and 2013. He was Chief Financial Officer at DASA in 2001 and at Anhanguera Educacional from 2003 to 2006. Mr. Scavazza holds a bachelor’s degree in Business Administration and Management from Fundação Getulio Vargas (FGV) and the University of Texas at Austin. Mr. Scavazza also holds a Master’s in Business Administration and Management from the Kellogg School of Management at Northwestern University. We believe Mr. Scavazza is well qualified to serve as director due to his extensive private equity and investment experience.
Daniel Fisberg is a member of our board of directors. Mr. Fisberg is a Private Equity Managing Director and primarily responsible for M&A projects for Lavoro. Prior to that, Mr. Fisberg was Lavoro’s Chief Investment Officer, a position he held from October 2019 to January 2022. Prior to joining us, Mr. Fisberg was the head of M&A and corporate development for South America at the Archer-Daniels-Midland Company, a Fortune 50 agribusiness powerhouse. From 2012 to 2014, Mr. Fisberg served as head of M&A for Cielo S.A., a leading financial services company in Brazil. Mr. Fisberg also acted as a management consultant for over five years for Roland Berger, a strategy-consulting firm, with projects in Europe and in South America. Mr. Fisberg holds a bachelor’s degree in business from Universidade de São Paulo and an MBA from London Business School. Mr. Fisberg also spent a semester at the Massachusetts Institute of Technology, focusing on venture capital and private equity investments. We believe Mr. Fisberg is well qualified to serve as director due to his extensive agribusiness and investment experience.
David Friedberg is a member of our board of directors. Mr. Friedberg has served as the Chief Executive Officer of The Production Board since 2015. In his role at The Production Board, Mr. Friedberg is also the founder and sits on the boards of several private companies. From September 2006 to October 2013, Mr. Friedberg founded and was the Chief Executive Officer of The Climate Corporation, an agriculture-focused weather insurance and software company acquired by The Monsanto Company in 2013. Mr. Friedberg was also the founder of Metromile, a pay-per-mile car insurance company (“Metromile”), and served as the Chairman of Metromile’s Board of Directors from January 2011 to December 2021. Previously, Mr. Friedberg worked in Corporate Development and Product Management at Google. Mr. Friedberg holds a Bachelor of Arts in Astrophysics from the University of California, Berkeley. We believe Mr. Friedberg is well qualified to serve as director due to his role as the founder of TPB, his executive leadership experience, and his service as a director at numerous companies.
Michael Stern is a member of our board of directors. Dr. Stern was Head of Digital Farming for Bayer Crop Sciences (Bayer) from August 2018 to April 2021 and a member of the Crop Sciences Executive Team from August 2018 to March 2021. Before joining Bayer, Dr. Stern had a 30-year career at Monsanto Company from December
137
1988 to June 2018, where he was the CEO of the Climate Corporation, and a member of Monsanto’s executive team. In addition, Dr. Stern served in a variety of leadership roles at Monsanto, including leading their Row Crop Business across the Americas, Vice President of U.S. Seeds and Traits, President of American Seeds, CEO of Renessen LLC, a biotechnology joint venture with Cargill, and Director of Technology for Agricultural Productivity. Dr. Stern also serves on the board of directors of Aquabounty Technologies Inc (AQB). Dr. Stern received a Ph.D. in Chemistry from Princeton University, a Masters in Chemistry from the University of Michigan and a Bachelor of Science degree in Chemistry from Denison University. We believe Dr. Stern is well qualified to serve as director due to his extensive agribusiness and investment experience.
Lauren StClair is a member of our board of directors. Ms. StClair has served as NerdWallet’s Chief Financial Officer since December 2020. Prior to joining NerdWallet, Ms. StClair served as Chief Financial Officer, North America at eBay Inc., a position she held since June 2019. Prior to June 2019, Ms. StClair served as Chief Financial Officer, International at StubHub, a position she held since February 2017. Prior to February 2017, Ms. StClair served as Director, Investor Relations at eBay Inc. Ms. StClair holds a Bachelor of Science from Stanford University and a Masters of Business Administration from Duke University. We believe Ms. StClair is well qualified to serve as director due to her extensive business experience.
Eduardo Daher is a member of our board of directors. Mr. Daher has been an Executive Director at Associação Brasileira do Agronegócio (ABAG) since February 2020. From April 2010 to April 2016, Mr. Daher took over as Executive Director of the Brazilian Crop Protection National Association (Andef). Mr. Daher was a founding member of the Brazilian Association of Rural Marketing and Agribusiness. Mr. Daher also held a seat on the Superior Council for Agribusiness (Cosag) of the Federation of Industries of the State of São Paulo (Fiesp) and advisor to Fiesp at the Foundation for the Development of Agribusiness Research (Fundepag). From October 2003 to April 2010, Mr. Daher was an Executive Officer of the Brazilian National Fertilizer Association (ANDA). Mr. Daher holds a bachelors’ degree in economics and business administration and management from Universidade de São Paulo and Fundação Getulio Vargas (FGV), respectively, and a master’s degree in marketing from Fundação Getulio Vargas (FGV). We believe Mr. Daher is well qualified to serve as director due to his extensive agribusiness experience.
Executive Officers
Our executive officers are responsible for the management and representation of our company.
The following table sets forth certain information, as of the date of this annual report, concerning our executive officers. Unless otherwise indicated, the business address for our executive officers is Av. Dr. Cardoso de Melo, 1450, 4th floor, office 401, São Paulo, SP, 04548-005.
| Name | Date of Birth | Position | ||||||||||||
Ruy Cunha | January 19, 1974 | Chief Executive Officer | ||||||||||||
Julian Garrido Del Val Neto | July 22, 1967 | Chief Financial Officer | ||||||||||||
André Rizk | November 8, 1974 | Chief Legal and Compliance Officer | ||||||||||||
Marcelo Pessanha | November 27, 1984 | Crop Care Chief Executive Officer | ||||||||||||
Gustavo Modenesi | November 15, 1984 | Chief Strategy Officer | ||||||||||||
Karen Christiane Ramirez Chaves de Mello | May 24, 1976 | Chief Human Resources Officer | ||||||||||||
Gustavo Ocampo Duran | July 1, 1960 | Latin America General Manager | ||||||||||||
Rafael Ughini Villarroel | May 5, 1973 | Business Unit Brazil President | ||||||||||||
Ruy Cunha is our Chief Executive Officer, a position he has held since February 2022. Mr. Cunha joined Lavoro in January 2018, having served as Chief Transformation Officer of Lavoro Group until December 2019 and Chief Operating Officer until January 2021. Prior to joining us, from January 2013 to December 2017, Mr. Cunha was president of Santal Equipamentos S.A., and managing director for sugar cane equipment at AGCO Corp., a leading global manufacturer of agriculture equipment. From August 2010 to December 2012, Mr. Cunha served as director of strategy and integration for AGCO in South America. Prior to joining AGCO, Mr. Cunha was a management consultant at Booz & Company, an international consulting firm, and led the process engineering teams
138
at General Motors of Brasil from 1997 to 2004. Mr. Cunha has a bachelor’s engineering degree from Instituto Mauá de Tecnologia, a specialist degree in business from Fundação Getulio Vargas and an MBA from the Kellogg School of Management at Northwestern University.
Julian Garrido Del Val Neto is our Chief Financial Officer, a position he has held since May 2023. Mr. Garrido has over 30 years of executive leadership experience in multinational and publicly traded companies. He most recently served as Chief Financial Officer and Head of Investor Relations at Alpargatas S.A., a large manufacturing company (from August 2018 until April 2023) and has held CFO and senior roles at SKY Brasil (from December 2014 until August 2018), at General Electric Healthcare Latin America (from March 2011 until December 2014), and at Andritz Hydro Inepar (from January 2009 until January 2011). Mr. Garrido holds a Business Administration degree from Fundação Getulio Vargas and completed Management and Leadership programs from Harvard University and the GE Management Development Institute – Crotonville.
André Rizk is our Chief Legal and Compliance Officer, a position he has held since February 2023. Prior to joining Lavoro, he was chief legal officer of Grupo BIG Brasil S.A. from 2019 to 2022, a key retail food and non-food player in Brazil. From 2016 to 2019, Mr. Rizk acted as chief legal officer of TOTVS S.A., one of the largest technology companies in Brazil. From 2004 to 2016, Mr. Rizk worked at Grupo Pão de Açucar, or GPA, a retail food and non-food company, serving as chief legal officer of GPA and its subsidiary Via Varejo S.A. Mr. Rizk has a bachelor’s degree in law from Centro Universitário das Faculdades Metropolitanas Unidas and a bachelor’s degree in economics from Fundação Armando Alvares Penteado, and a post-graduate degree in corporate and contractual law from Fundação Getulio Vargas.
Marcelo Pessanha is our Crop Care Chief Executive Officer, a position he has held since April 2022. Mr. Pessanha joined Lavoro in November 2019, having served as Crop Care’s business officer from November 2019 to April 2022. Prior to joining us, from June 2010 to November 2019, Mr. Pessanha served in various capacities at UPL Brasil, an agricultural solutions and agriculture technology company, including serving as Head of Business Unit F&V, Citrus and Coffee from April 2019 to November 2019 and Head of Business Unit Centro from April 2018 to November 2019, among other positions held at the company. Mr. Pessanha holds a degree in agronomy engineering and agriculture from Faculdade Dr. Francisco Maeda – FAFRAM (2007), an MBA from Fundação Dom Cabral (2017) and an MBA in marketing from Fundação Getulio Vargas (2012).
Gustavo Modenesi is our Chief Strategy Officer, a position he has held since February 2022. Mr. Modenesi has been working in Lavoro since its inception, having served as Chief Transformation Officer of Lavoro from June 2019 to January 2022. Prior to joining us, from 2015 to 2017, Mr. Modenesi worked at Patria, one of the leading firms in alternative asset management in Latin America, leading the transformation programs at Patria’s portfolio companies, as well as developing a new investment thesis for the agricultural sector. From 2007 to 2015, Mr. Modenesi worked at The Boston Consulting Group Company, a leading management consulting firm, with his latest role being the project manager. Mr. Modenesi holds an industrial engineering degree from Universidade de São Paulo and an MBA with distinctions from the Ross School of Business at the University of Michigan.
Karen Christiane Ramirez Chaves de Mello is our Chief Human Resources Officer, a position she has held since February 2022. Prior to joining us, from 2020 to 2021, Ms. Mello was business strategy, people and culture director at Hospital Sírio Libanês, a healthcare company. From 2016 to 2020, Ms. Mello served as HR Director of Philip Morris International (PMI), a consumer goods/tobacco company. Prior to joining PMI, Ms. Mello was organizational and development head at Pepsico do Brasil Ltda., a consumer goods/foods company. Ms. Mello has a business administration degree from Pontifícia Universidade Católica de Minas Gerais MG and a master of arts from London Metropolitan University.
Gustavo Ocampo Duran is our Latin America General Manager, a position he has held since August 2017. Prior to joining us, from 2005 to 2017, Mr. Ocampo was chief executive officer of Agrointegral Andina S.A.S., an agricultural input retailing company, which belonged to Grupo Gral (acquired by Lavoro in 2017). From 2000 to 2005, Mr. Ocampo served as marketing manager of Syngenta, an agricultural science and technology company. Previously, from 1983 to 1990, Mr. Ocampo was the commercial manager of Procampo S.A., an agribusiness company. Mr. Ocampo holds an agricultural engineering degree from Universidad de Caldas and a business management postgraduate degree from Universidad de Los Andes.
139
Rafael Ughini Villarroel is our Business Unit Brazil President, a position he has held since November 2022. Mr. Villarroel joined Lavoro in April 2021, as Head of Business Unit East in Brazil. Prior to joining Lavoro, he was CEO of Oceana Minerais Marinhos Ltda., from July 2019 to February 2021, a key player in the seaweed business for plant and animal nutrition. From June 2017 to March 2019, Mr. Villarroel acted as CEO of Rural Brasil Ltda., a leading regional distribution player in the Cerrados area. From January 1996 to March 2017, he held several leading positions as Supply Chain Director, Strategy VP, COO, and CEO within Bayer S.A., located in Brazil, Germany and Central America. Mr. Villarroel has a bachelor’s engineering degree from Universidade Federal do Rio Grande do Sul and MBA degrees in Finance & Administration from Fundação Getulio Vargas and in Strategy & Marketing in Fundação Dom Cabral / Kellogg School of Management at Northwestern University.
Family Relationships
There are no family relationships among any of our executive officers or directors.
Share Ownership
The shares and any outstanding beneficially owned by our directors and officers and/or entities affiliated with these individuals are disclosed in “Item 7. Major Shareholders and Related Party Transactions—A. Major Shareholders.”
Board Diversity
The following matrix outlines the gender identity and the demographic background of the members of our board of directors in accordance with the Nasdaq rules to which we are subject:
| Board Diversity Matrix (as of June 30, 2023) | ||||||||||||||
| Country of Principal Executive Offices: | Brazil | |||||||||||||
| Foreign Private Issuer: | Yes (the Cayman Islands) | |||||||||||||
| Disclosure Prohibited under Home Country Law: | No | |||||||||||||
| Total Number of Directors: | 7 | |||||||||||||
| Part I: Gender Identity | ||||||||||||||
| Female | Male | Non-Binary | Did Not Disclose Gender | |||||||||||
| Directors: | 1 | 6 | ||||||||||||
| Part II: Demographic Background | ||||||||||||||
| Underrepresented Individual in Home Country Jurisdiction: | ||||||||||||||
| LGBTQ+: | ||||||||||||||
| Did not Disclose Demographic Background: | 7 | |||||||||||||
140
B.Compensation
Compensation of Directors and Officers
Under Cayman Islands law, we are not required to disclose compensation paid to our senior management on an individual basis and we have not otherwise publicly disclosed this information elsewhere. Our executive officers, directors and management receive fixed and variable compensation. They also receive benefits in line with market practice in Brazil. The fixed component of their compensation is set on market terms and adjusted annually. The variable component consists of cash bonuses. Cash bonuses are paid to executive officers and members of our management based on previously agreed targets for the business.
For the fiscal years ended June 30, 2023, 2022 and 2021, the aggregate compensation expense for our directors and executive officers and to the directors and executive officers of our subsidiaries for services in all capacities was R$55.0 million, R$15.6 million and R$13.2 million, respectively, which includes both benefits paid in kind and compensation. See note 26(c) to our audited consolidated financial statements included elsewhere in this annual report and note 24 to our audited combined financial statements for the fiscal year ended June 30, 2022.
Employment Agreements
We have entered into employment agreements with our executive officers. The employment agreements provide for the compensation that our executive officers are entitled to receive, including certain equity grants, and contain termination notice periods of 36 months. We will have title to the intellectual property rights developed in connection with the executive officer’s employment, if any. There is a standard 12-24 month non-compete period following the end of employment in our agreement for all executive officers.
Share-Based Compensation
Lavoro Share Plan
On August 17, 2022, Lavoro approved the Lavoro Agro Holding S.A. Long-Term Incentive Policy (Política de Incentivo de Longo Prazo da Lavoro Agro Holding S.A.) (the “Lavoro Share Plan”). Under the Lavoro Share Plan, individuals selected by the Lavoro board of directors (“Selected Employees”) are eligible to receive incentive compensation consisting of cash, assets or share options issued by Lavoro Agro Limited, in an amount linked to the appreciation in the company share price at the time of the liquidity event, upon the satisfaction of certain conditions (as described below). At the Company’s sole discretion, and subject to obtaining any required corporate approvals, the Company may also make payments of incentive compensation under the Lavoro Share Plan in Lavoro Agro Limited’s shares. Share options granted under the Lavoro Share Plan will vest in the event the following market conditions are met (the “Market Conditions”): (i) the occurrence of a liquidity event satisfying a minimum internal rate of return specified in the Lavoro Share Plan; and (ii) the price per share obtained under such liquidity event must be greater than or equal to one of the following amounts: (a) a pre-established reference price multiplied by three; or (b) an amount calculated in accordance with a pre-established formula, in each case specified under the Lavoro Share Plan. Moreover, upon the satisfaction of the Market Conditions, such share options will vest according to the following schedule (the “Service Conditions”): (i) one-third of the options vest on the third anniversary of the grant date; (ii) one-third of the options vest on the fourth anniversary of the grant date; and (iii) one-third of the options vest on the fifth anniversary of the grant date. The Lavoro Share Plan has a term of five years; if the Market Conditions have not been satisfied within this period, all options granted under the Lavoro Share Plan will be extinguished, with no further payment or incentive obligation remaining due by Lavoro. As of the date of this annual report, no share options granted as incentive compensation have vested and no other incentive compensation payments have been made, in each case under the Lavoro Share Plan, as the Market Conditions for vesting have not been satisfied.
On the Closing Date, our board of directors adopted, and our shareholders approved, the assumption of the Lavoro Share Plan. As a result, we reserved for issuance the number of Lavoro Limited Ordinary Shares equal to the number of Lavoro Share Plan Shares under the Lavoro Share Plan, as adjusted in accordance with the Business Combination Agreement. As of June 30, 2023, we had granted 49,518,732 share options as incentive compensation to Selected Employees under the Lavoro Share Plan and had reserved for issuance 1,663,405 Ordinary Shares for
141
issuance in connection with the Lavoro Share Plan. For more information, see note 27(b) to our audited consolidated financial statements included elsewhere in this annual report.
New Lavoro Equity Plan
On August 16, 023 and September 27, 2023, our board of directors approved and adopted the Lavoro Limited Restricted Stock Unit Plan, or the New Lavoro Equity Plan, which provides for the grant of restricted stock units, or RSUs, to participants identified by our board. The total number of Ordinary Shares that may be delivered to participants within the scope of the New Lavoro Equity Plan considering all RSUs granted shall not exceed five percent (5%) of the total number of Ordinary Shares that were outstanding as of the date of the New Lavoro Equity Plan’s approval. Subject to the terms of the New Lavoro Equity Plan and to individual grants, RSUs are subject to a five-year vesting period, in which one-third of RSUs granted will vest on each of the third, fourth and fifth anniversary of the date in which they were granted. Termination of a participant from their employment with the company will lead to the forfeiture of any unvested RSUs. As of June 30, 2023, we had not granted any RSUs to participants under the New Lavoro Equity Plan. As of the date of this annual report, 1,597,076 RSUs have been granted, with each RSU entitling the holder to one Ordinary Share after the vesting period. For more information, see note 33 to our audited consolidated financial statements included elsewhere in this annual report.
C.Board Practices
Foreign Private Issuer Status
We are subject to Nasdaq corporate governance listing standards. As a foreign private issuer, however, the standards applicable to us are considerably different from the standards that apply to U.S. listed companies. Under Nasdaq rules, as a foreign private issuer, we may follow the “home country” practice of the Cayman Islands, except that we are required (a) to have an audit committee or audit board that meets certain requirements, pursuant to an exemption available to foreign private issuers (subject to the phase-in rules described under “—Committees of the Board of Directors—Audit Committee”); (b) to provide prompt certification by our chief executive officer of any material non-compliance with any corporate governance rules; and (c) to provide a brief description of the significant differences between our corporate governance practices and Nasdaq corporate governance practice required to be followed by U.S. listed companies.
Nasdaq listing rules include certain accommodations in the corporate governance requirements that allow foreign private issuers, such as us, to follow “home country” corporate governance practices in lieu of the otherwise applicable corporate governance standards of Nasdaq. The application of such exceptions requires that we disclose each Nasdaq corporate governance standard that we do not follow and describe the Cayman Islands corporate governance practices we do follow in lieu of the relevant Nasdaq corporate governance standard. We currently follow Cayman Islands corporate governance practices in lieu of the corporate governance requirements of Nasdaq in respect of the following:
•the majority independent director requirement under Section 5605(b)(1) of Nasdaq listing rules;
•the requirement under Section 5605(d) of Nasdaq listing rules that a compensation committee comprised solely of independent directors governed by a compensation committee charter oversee executive compensation;
•the requirement under Section 5605(e) of Nasdaq listing rules that director nominees be selected or recommended for selection by either a majority of the independent directors or a nominations committee comprised solely of independent directors;
•the requirement under Section 5635(d) of Nasdaq listing rules that a listed issuer obtain shareholder approval prior to an issuance of securities in connection with: (i) the acquisition of the stock or assets of another company; (ii) equity-based compensation of officers, directors, employees or consultants; (iii) a change of control; and (iv) transactions other than public offerings. Pursuant to the laws of the Cayman Islands and our governing documents, we are not required to obtain any such approval; and
142
•the requirement under Section 5605(b)(2) of Nasdaq listing rules that the independent directors have regularly scheduled meetings with only the independent directors present.
Cayman Islands law does not impose a requirement that the board consist of a majority of independent directors or that such independent directors meet regularly without other members present. Nor does Cayman Islands law impose specific requirements on the establishment of a compensation committee or nominating committee or nominating process.
See “Item 10. Additional Information—B. Memorandum and Articles of Association—Principal Differences between Cayman Islands and U.S. Corporate Law” for more information.
Committees of the Board of Directors
We currently have an audit committee and a compensation committee. The composition and responsibilities of our audit and compensation committees are described below. Members serve on each of these committees until their resignation or until as otherwise determined by our board of directors.
Audit Committee
Our audit committee consists of Michael Stern, Lauren StClair and Eduardo Daher, with Lauren StClair serving as chairperson. Our board of directors has determined that each of Michael Stern, Lauren StClair and Eduardo Daher meet the requirements for independence under the listing standards of Nasdaq and SEC rules and regulations. Each member of our audit committee also meets the financial literacy and sophistication requirements of the listing standards of Nasdaq. In addition, our board of directors has determined that Lauren StClair is an audit committee financial expert within the meaning of Item 407(d) of Regulation S-K under the Securities Act. Our audit committee must, among other things:
•select a qualified firm to serve as the independent registered public accounting firm to audit our financial statements;
•help to ensure the independence and performance of the independent registered public accounting firm;
•discuss the scope and results of the audit with the independent registered public accounting firm, and review, with management and the independent registered public accounting firm, our interim and year-end results of operation;
•develop procedures for employees to submit concerns anonymously about questionable accounting or audit matters;
•review our policies on risk assessment and risk management;
•review related party transactions; and
•approve or, as required, pre-approve, all audit and all permissible non-audit services, other than de minimis non-audit services, to be performed by the independent registered public accounting firm.
Our audit committee operates under a written charter that satisfies the applicable rules and regulations of the SEC and the listing standards of Nasdaq.
Compensation Committee
Our board of directors established a compensation committee on September 28, 2023. Our compensation committee consists of Daniel Fisberg, Marcos de Mello Mattos Haaland and Michael Stern, with Daniel Fisberg serving as chairperson. Our compensation committee must, among other things:
•oversee our executive compensation and benefit plans;
143
•assist our board of directors in the management of the New Lavoro Equity Plan and other equity-based incentive plans;
•oversee the evaluation process for our executive officers; and
•assist our board of directors with its executive officer succession plan.
Our compensation committee operates under a written charter adopted by our board of directors. As permitted by the listing requirements of Nasdaq, we have opted out of Section 5605(d) of Nasdaq listing rules, which requires that a compensation committee consist entirely of independent directors.
Controlled Company Exception
As of the date of this annual report, the Lavoro Original Shareholders beneficially own approximately 84.7% of our outstanding Ordinary Shares. As a result, we are a “controlled company” within the meaning of the corporate governance standards of Nasdaq corporate governance rules. Under these rules, a company of which more than 50% of the voting power in the election of directors is held by an individual, group or another company is a “controlled company” and may elect not to comply with certain corporate governance requirements.
As a “controlled company,” we may elect not to comply with certain corporate governance standards, including the requirements (1) that a majority of our board of directors consist of independent directors; (2) that our board of directors have a compensation committee that is comprised entirely of independent directors with a written charter addressing the committee’s purpose and responsibilities; and (3) that our board of directors have a nominating and corporate governance committee that is comprised entirely of independent directors with a written charter addressing the committee’s purpose and responsibilities. For so long as we qualify as a controlled company, we may take advantage of these exemptions. Accordingly, our shareholders may not have the same protections afforded to shareholders of companies that are subject to all of these corporate governance requirements. In the event that we ceases to be a “controlled company” and our Ordinary Shares continue to be listed on Nasdaq, we will be required to comply with the corporate governance standards within the applicable transition periods.
Limitation of Liability and Indemnification of Officers and Directors
The Companies Act does not limit the extent to which a company’s articles of association may provide for indemnification of directors and officers, except to the extent that it may be held by the Cayman Islands courts to be contrary to public policy, such as to provide indemnification against civil fraud or the consequences of committing a crime. In accordance with our governing documents, each of our directors and officers must be indemnified out of our assets against any liability incurred by that director or officer as a result of any act or failure to act in carrying out their functions, except for any such liability that the director or officer may incur by their own actual fraud or willful default. This standard of conduct is generally the same as permitted under the Delaware General Corporation Law for a Delaware corporation.
Insofar as indemnification for liabilities arising under the Securities Act may be permitted to directors, officers or persons controlling our company pursuant to the foregoing provisions, we have been informed that, in the opinion of the SEC, such indemnification is against public policy as expressed in the Securities Act and is therefore unenforceable.
D.Employees
As of June 30, 2023, 2022 and 2021, we had 3,778, 3,379 and 2,375 employees, respectively. As of June 30, 2023, all our employees were based in our offices in Curitiba, State of Paraná and São Paulo, State of São Paulo, and our facilities in the Brazilian states of Mato Grosso, Mato Grosso do Sul, Paraná, Goiás, Tocantins, Rondônia, Rio Grande do Sul, Santa Catarina and Minas Gerais, as well as in Colombia, where we have business operations through the entities in our LATAM Cluster.
144
The table below breaks down our full-time personnel by function as of June 30, 2023:
| Function | Number of Employees | % of Total | ||||||||||||
Management | 343 | 9.1% | ||||||||||||
Technology | 15 | 0.4% | ||||||||||||
Sales and Marketing | 1,107 | 29.3% | ||||||||||||
Customer Support | 20 | 0.5% | ||||||||||||
General and Administrative | 2,293 | 60.7% | ||||||||||||
Total | 3,778 | 100 | % | |||||||||||
Our employees in Brazil are affiliated with the unions of independent sales agents and of consulting, information, research and accounting firms for the geographic area in which they render services. We believe we have a constructive relationship with these unions, as we have never experienced strikes, work stoppages or disputes leading to any form of downtime.
E.Share Ownership
For information regarding the share ownership of our directors and executive officers, see “Item 7. Major Shareholders and Related Party Transactions—A. Major Shareholders.” For information as to stock options granted to our directors, executive officers and other employees, see “—B. Compensation.”
F.Disclosure of a Registrant’s Action to Recover Erroneously Awarded Compensation
Not applicable.
Item 7. Major Shareholders and Related Party Transactions
A.Major Shareholders
The following table sets forth information regarding the beneficial ownership of our Ordinary Shares as of the date of June 30, 2023:
•each person known by us to be the beneficial owner of more than 5% of Ordinary Shares;
•each of our directors and executive officers; and
•all our directors and executive officers as a group.
Beneficial ownership is determined according to the rules of the SEC, which generally provide that a person has beneficial ownership of a security if that person possesses sole or shared voting or investment power over that security. A person is also deemed to be a beneficial owner of securities that person has a right to acquire within 60 days including, without limitation, through the exercise of any option, warrant or other right or the conversion of any other security. Such securities, however, are deemed to be outstanding only for the purpose of computing the percentage beneficial ownership of that person but are not deemed to be outstanding for the purpose of computing the percentage beneficial ownership of any other person. Under these rules, more than one person may be deemed to be a beneficial owner of the same securities. Pursuant to our governing documents, each Ordinary Share entitles the holder to one vote on all matters upon which the holders are entitled to vote.
The percentage of our Ordinary Shares beneficially owned is computed on the basis of 116,608,329 Ordinary Shares issued and outstanding as of June 30, 2023, prior to the exercise of any Warrants. This amount includes 2,951,436 Ordinary Shares outstanding as of June 30, 2023 that constitute Vesting Founder Shares. Vesting Founder Shares are subject to certain vesting, lock-up and beneficial ownership limitations upon the Sponsor under the terms of Sponsor Letter Agreement, as amended. See “Item 7. Major Shareholders and Related Party Transactions—B. Related Party Transactions—Transactions Related to the Business Combination—Sponsor Letter Agreement” elsewhere in this annual report.
145
Unless otherwise indicated, we believe that all persons named in the table below have sole voting and investment power with respect to all Ordinary Shares beneficially owned by them.
| Beneficial Owners | Ordinary Shares(1) | % of Total Ordinary Shares(2) | ||||||||||||
Directors and Executive Officers(3) | ||||||||||||||
Ruy Cunha | — | — | ||||||||||||
Julian Garrido Del Val Neto | — | — | ||||||||||||
André Rizk | — | — | ||||||||||||
Marcelo Pessanha | — | — | ||||||||||||
Gustavo Modenesi | — | — | ||||||||||||
Karen Christiane Ramirez Chaves de Mello | — | — | ||||||||||||
Gustavo Ocampo Duran | — | — | ||||||||||||
Rafael Ughini Villarroel | — | — | ||||||||||||
Ricardo Leonel Scavazza | — | — | ||||||||||||
Marcos de Mello Mattos Haaland | — | — | ||||||||||||
Daniel Fisberg | — | — | ||||||||||||
David Friedberg(4) | — | — | ||||||||||||
Michael Stern | — | — | ||||||||||||
Lauren StClair | — | — | ||||||||||||
Eduardo Daher | — | — | ||||||||||||
All directors and executive officers as a group (15 individuals) | — | — | ||||||||||||
Principal Shareholders | ||||||||||||||
Investment Funds(5)(6) | 96,359,488 | 82.6% | ||||||||||||
Patria Finance Limited(5) | 2,366,913 | 2.0% | ||||||||||||
Patria Investments Limited(6)(7) | 98,726,401 | 84.7% | ||||||||||||
Sponsor(8) | 1,649,172 | 1.4% | ||||||||||||
The Production Board, LLC(9) | 11,649,172 | 9.9% | ||||||||||||
_____________
(1)The number of Ordinary Shares listed for each beneficial owner assumes the exercise of all of the Warrants beneficially owned by beneficial owner.
(2)In calculating the percentages of Ordinary Shares outstanding, (a) the numerator is calculated by adding the number of Ordinary Shares beneficially owned by such beneficial owner and the number of Ordinary Shares issuable upon the exercise of Warrants beneficially owned by such beneficial owner (if any); and (b) the denominator is calculated by adding the total aggregate number of Ordinary Shares outstanding, the number of Ordinary Shares issuable upon the exercise of Warrants beneficially owned by such beneficial owner, if any (but not the number of Ordinary Shares issuable upon the exercise of Warrants beneficially owned by any other beneficial owner).
(3)Unless otherwise noted, the business address of our directors and executive officers is Av. Dr. Cardoso de Melo, 1450, 4th floor, office 401, São Paulo—SP, 04548-005, Brazil.
(4)As noted in footnotes (7) and (8) below, Mr. Friedberg is a manager on the board of managers of both the Sponsor and The Production Board. There are three or more managers or directors on the board of managers or board of directors, as applicable, of each of the Sponsor and The Production Board. Each manager on each such board has one vote, and the approval of a majority is required to approve an action. Under the so-called “rule of three,” if voting and dispositive decisions regarding an entity’s securities are made by three or more individuals, and voting or dispositive decisions require the approval of a majority of those individuals, then none of the individuals is deemed a beneficial owner of the entity’s securities. Based on the foregoing, no individual manager of either the Sponsor or The Production Board exercises voting or dispositive control over any of the securities held by the applicable entity, even those in which he holds a pecuniary interest. Accordingly, Mr. Friedberg will not be deemed to have or share beneficial ownership of such shares.
(5)The Investment Funds, a group of Cayman Islands, Delaware and Ontario entities, are the record holders of such shares, and PBPE General Partner V, Ltd. and PBPE Fund V (DE GP) Garden, LLC are the general partners of the Investment Funds; Patria Finance Limited is the sole shareholder of PBPE General Partner V, Ltd. and PBPE Fund V (DE GP) Garden, LLC; Patria Finance Limited is wholly owned by Patria Investments Cayman Limited; Patria Investments Cayman Limited is wholly owned by Patria Investments Latam S.A.; Patria Investments Latam S.A. is wholly owned by Patria Investments Limited; Patria Investments Limited is controlled by Patria Holdings Limited. Each of the entities described in this footnote (other than to the extent it directly holds securities as described herein) may be deemed to beneficially own the shares directly or indirectly controlled by such entities, but each disclaims any beneficial ownership of the reported shares other than to the extent of any pecuniary interest they may have therein, directly or indirectly. The business address of each of the Cayman, Delaware and Ontario Investment Funds is c/o Maples Corporate Services, PO Box 309, Ugland House, South Church Street, KY1-1104, George Town, Grand Cayman, Cayman Islands, c/o Maples Fiduciary Services (Delaware) Inc., 4001 Kennet Pike, Suite
146
302, Wilmington, DE 19807, United States, 199 Bay St, Commerce Court West, Suite 5300 (c/o 152928 Canada Inc.), Toronto, ON M5L 189, Canada; respectively. The business address of PBPE General Partner V, Ltd. and PBPE Fund V (DE GP) Garden, LLC is c/o Maples Corporate Services, PO Box 309, Ugland House, South Church Street, KY1-1104, George Town, Grand Cayman, Cayman Islands. The business address of each of the other entities described in this footnote is c/o Patria Investments Limited, at 18 Forum Lane, 3rd floor, Camana Bay, PO Box 757, KY1-9006, Grand Cayman, Cayman Islands.
(6)On August 25, 2023, one of the Investment Funds pledged 64,239,660 of our Ordinary Shares to secure certain financial and other obligations in connection with the Loan Documents, which Ordinary Shares represent 55.1% of our outstanding share capital. If enforcement action is taken by or on behalf of the entities that have the benefit of the share pledges, or if shares of common stock are otherwise transferred in satisfaction of debt obligations, such enforcement action or transfers could result in transfer of such shares to the lender and one or more third parties and could result in a change of control with respect to us. A change of control may trigger a default under certain of our debt instruments and other material agreements, which may cause a material adverse effect on our business, operations, financial condition, liquidity and results of operations.
(7)While Patria Investments Limited does not own such shares directly, as described in the foregoing footnote, Patria Investments Limited may be deemed to beneficially own the shares directly or indirectly held by the entities controlled (directly or indirectly) by it, whenever those entities are acting in the capacity of general partner and to the extent and subject to the limitations set forth in the limited partnership agreements of the Investment Funds. Patria Investments Limited disclaims any beneficial ownership of the reported shares other than to the extent of any pecuniary interest it may have therein, directly or indirectly. The business address of Patria Investments Limited is c/o Patria Investments Limited, at 18 Forum Lane, 3rd floor, Camana Bay, PO Box 757, KY1-9006, Grand Cayman, Cayman Islands.
(8)Consists of (1) 1,398,025 Ordinary Shares that are not subject to further vesting and (2) 251,147 Ordinary Shares that are subject to vesting as set forth in Amendment No. 3 (as defined herein). The Ordinary Shares subject to further vesting will vest if at any time during the three-year period following the Closing Date the closing share price of the Ordinary Shares is greater than or equal to certain market values over any 20 trading days within any consecutive 30 trading day period; provided that, per the terms of Amendment No. 3, no such Ordinary Shares shall vest to the extent that after giving effect to such vesting, the Sponsor and its affiliates would beneficially own a number of Ordinary Shares in excess of 9.99%. The Production Board is the sole member of the Sponsor. David Friedberg, Bharat Vasan and William Hauser are managers on the board of managers of the Sponsor, and each disclaims beneficial ownership of the securities held by the Sponsor and its subsidiaries except to the extent of his pecuniary interest therein. The business address of the Sponsor is 1 Letterman Drive, Suite A3-1, San Francisco, CA 94129.
(9)Consists of (a) 10,000,000 Ordinary Shares owned by The Production Board (of which 1,398,025 Ordinary Shares are subject to lock-up restrictions, as set forth in Amendment No. 3) that are not subject to further vesting, (b) 1,398,025 Ordinary Shares owned by the Sponsor that are not subject to further vesting and (c) 251,147 Ordinary Shares owned by the Sponsor that are subject to further vesting as set forth in Amendment No. 3. While The Production Board does not own the Ordinary Shares or Warrants beneficially owned by the Sponsor directly, as described in the foregoing footnote, The Production Board may be deemed to beneficially own the securities directly or indirectly held by the entities controlled (directly or indirectly) by it. The Production Board disclaims any beneficial ownership of the reported securities other than to the extent of any pecuniary interest it may have therein, directly or indirectly. David Friedberg, Anil Patel, Sen. Bob Kerrey and Barney Schauble are directors on the board of directors of The Production Board, and each disclaims beneficial ownership of the securities held by The Production Board and its subsidiaries except to the extent of his pecuniary interest therein. The business address of The Production Board, LLC is 1 Letterman Drive, Suite A3-1, San Francisco, CA 94129.
B.Related Party Transactions
Policies and Procedures for Related Party Transactions
Our audit committee has the primary responsibility for reviewing and approving or disapproving transactions with related parties. Our related party transaction policy states that any related party transaction must be approved or ratified by our audit committee, board of directors or a designated committee thereof. In determining whether to approve or ratify a transaction with a related person, our audit committee, board of directors or the designated committee will consider all relevant facts and circumstances, including without limitation the commercial reasonableness of the terms of the transaction, the benefit and perceived benefit, or lack thereof, to us, opportunity costs of alternate transactions, the materiality and character of the related person’s direct or indirect interest and the actual or apparent conflict of interest of the related person. Our audit committee, board of directors or the designated committee will not approve or ratify a related person transaction unless it has determined that, upon consideration of all relevant information, such transaction is in, or not inconsistent with, our best interests and the best interests of our shareholders.
Moreover, as a Cayman Islands exempted company with limited liability that has the majority of its operations in Brazil, Lavoro Limited adopted corporate governance policies and practices required by applicable legislation to govern transactions with related parties, including those requirements of Brazilian Corporate Law. Brazilian Corporate Law prohibits a company’s management from, among other matters (i) performing any action that may result in a personal advantage at the Company’s expense, (ii) receiving any personal advantage from third parties arising, directly or indirectly, as a result of the exercise of that person’s responsibilities with the Company and (iii) participating in any transaction, or resolution with respect thereto taken by management, in which they have a conflict of interest.
147
Certain Related Party Transactions
In the ordinary course of our business, we sell products to the non-controlling shareholders of some of the companies that we have acquired. We received revenue from sales of products in the amount of R$33.0 million, R$13.0 million and R$5.6 million from these services in the fiscal years ended June 30, 2023, 2022 and 2021, respectively).
We have incurred certain expenses payable to Patria and its affiliates for management support services rendered in connection with our acquisitions:
•On July 1, 2021, Crop Care Holding S.A. entered into a consultancy services agreement with Gestão e Transformação Consultoria S.A., or Gestão, an affiliate of Patria, which was entitled to a monthly compensation of R$397,000. The agreement expired on December 31, 2021. On January 3, 2022, Crop Care Holding S.A. entered into a second consultancy services agreement with Gestão, which was entitled to annual compensation of R$106,000. The agreement expired on December 31, 2022. On January 3, 2023, Crop Care Holding S.A. entered into a third consultancy services agreement with Gestão, which is entitled to annual compensation of R$1.2 million. The agreement expires on December 31, 2023.
•On July 1, 2021, Lavoro Agro Holding S.A. entered into a consultancy services agreement with Gestão, which was entitled to a monthly compensation of R$132,000. The agreement expired on December 31, 2021. On January 3, 2022, Lavoro Agro Holding S.A. entered into a second consultancy services agreement with Gestão, which was entitled to annual compensation of R$3.4 million. The agreement expired on December 31, 2022. On January 3, 2023, Lavoro Agro Holding S.A. entered into a third consultancy services agreement with Gestão, which is entitled to annual compensation of R$14.2 million. The agreement expires on December 31, 2023.
We recorded monitoring expenses in the amount of R$18.7 million, R$2.5 million and nil in the fiscal years ended June 30, 2023, 2022 and 2021, respectively).
On February 27, 2023, the board of directors of Lavoro Agro Limited approved, by unanimous written resolution, the issuance of an aggregate of 2.78 Lavoro Agro Limited Shares for a total subscription price of US$11,716,689. These Lavoro Agro Limited Shares were divided among, subscribed and paid for by the Investment Funds and Patria Finance, affiliates of Patria.
Transactions Related to the Business Combination
Certain other related agreements have been entered into in connection with the Business Combination. This section describes the material provisions of certain additional agreements entered into pursuant to the Business Combination Agreement (the “Related Agreements”) but does not purport to describe all of the terms thereof. The following summary is qualified in its entirety by reference to the complete text of each of the Related Agreements, and you are urged to read such Related Agreements in their entirety. For a summary of the Business Combination and the Business Combination Agreement, see “Item 4. Information on the Company—A. History and Development of the Company—Business Combination.”
Voting and Support Agreement
Concurrently with the execution and delivery of the Business Combination Agreement, New Lavoro, TPB SPAC and the Investment Funds entered into a voting and support agreement (the “Voting and Support Agreement”), pursuant to which, prior to the First Effective Time (and conditioned upon the occurrence of the First Effective Time), the Investment Funds voted to approve the Third Merger and such other actions as contemplated in the Business Combination Agreement for which their approval was required.
The foregoing description is only a summary of the Voting and Support Agreement and is qualified in its entirety by reference to the full text of the Voting and Support Agreement, the form of which is filed as an exhibit hereto and is incorporated by reference herein.
148
Lock-up Agreement
Concurrently with the execution and delivery of the Business Combination Agreement, New Lavoro, TPB SPAC and the Investment Funds entered into a lock-up agreement (the “Lock-up Agreement”), pursuant to which the Investment Funds agreed, among other things, to certain transfer restrictions on the Ordinary Shares held by such Investment Funds (and their respective permitted transferees) as of the Closing Date (the “Lock-up Shares”) for a period (i) for 25% of the Lock-Up Shares (and their respective permitted transferees), the date that is 180 days following the closing date, (ii) for an additional 25% of the Lock-Up Shares (i.e., totaling an aggregate of 50% of the Lock-Up Shares), the date that is one year following the closing date, (iii) for an additional 25% of the Lock-Up Shares (i.e., totaling an aggregate of 75% of the Lock-Up Shares), the date that is eighteen (18) months following the closing date, and (iv) for an additional 25% of the Lock-Up Shares (i.e., totaling an aggregate of 100% of the Lock-Up Shares), the date that is two years following the closing date, subject to certain exceptions. The Lock-up Agreement also provides for a carveout from the Investment Funds’ lockup after Closing, such that the Investment Funds are permitted to transfer their Ordinary Shares to any third party so long as such third party agrees to be bound by the same lockup period set forth in the Lock-up Agreement.
The foregoing description is only a summary of the Lock-up Agreement and is qualified in its entirety by reference to the full text of the Lock-up Agreement, which is filed as an exhibit hereto and is incorporated by reference herein.
On August 25, 2023, our board of directors agreed to waive the restrictions set forth in the Lock-up Agreement in connection with pledges and transfers of Lock-up Shares prior to the 181st day following February 28, 2023, with respect to 64,239,660 Ordinary Shares pledged in connection with a term loan agreement and a pledge and security agreement, or the Loan Documents, entered into by one of the Investment Funds. In connection with the Loan Documents, the lender party thereto agreed to be bound by the lock-up restrictions set forth in our governing documents and in the Lock-up Agreement, with respect to such pledged shares.
Subscription Agreement
Concurrently with the execution and delivery of the Business Combination Agreement, The Production Board entered into a subscription agreement with TPB SPAC and the Company pursuant to which The Production Board subscribed for and purchased, for an aggregate purchase price of US$100,000,000, 10,000,000 SPAC Class A Ordinary Shares (at US$10.00 per share). Such subscribed shares were converted to Ordinary Shares in connection with the Business Combination. New Lavoro also agreed to grant certain customary registration rights to The Production Board in connection with the TPB PIPE Investment.
The foregoing description is only a summary of the Subscription Agreement and is qualified in its entirety by reference to the full text of the Subscription Agreement, which is filed as an exhibit hereto and is incorporated by reference herein.
Sponsor Letter Agreement
Concurrently with the execution of the Business Combination Agreement (“Amendment No. 1”) at the closing of the Business Combination (“Amendment No. 2”) and following the closing of the Business Combination (“Amendment No. 3”), we, TPB SPAC, the Sponsor, The Production Board and certain affiliates of the Sponsor agreed to amend the existing Sponsor Letter Agreement. Under Amendment No. 1, Amendment No. 2 and Amendment No. 3, the Sponsor agreed to, among other things, (i) vote all of their SPAC Class B Ordinary Shares in favor of the Business Combination and related transactions, (ii) to take certain other actions in support of the Business Combination Agreement and related transactions, and (iii) waive certain anti-dilution protections to which it would otherwise be entitled to in connection with the Business Combination, in each case, on the terms and subject to the conditions set forth in the Sponsor Letter Agreement, as amended.
In addition, the Sponsor agreed to be bound by transfer restrictions for two years after the Closing Date (the “Sponsor Lock-Up”) in respect of 3,006,049 Ordinary Shares into which certain of its SPAC Class B Ordinary Shares were exchanged at Closing (the “Sponsor Lock-Up Shares”) and The Production Board agreed to be bound by transfer restrictions for two years after the Closing Date (the “PIPE Lock-Up” and together with the Sponsor Lock-Up, the “TPB Lock-Up”) in respect of 1,398,025 Ordinary Shares acquired pursuant to the Subscription
149
Agreement (the “PIPE Lock-Up Shares” and together with the Sponsor Lock-Up Shares, the “TPB Lock-Up Shares”), provided however (x) 50% of the TPB Lock-up Shares shall be released from the TPB Lock-Up one year following the Closing Date, (y) an additional 25% of the TPB Lock-up Shares (i.e., totaling an aggregate of 75% of the TPB Lock-up Shares) shall be released from the TPB Lock-Up eighteen (18) months following the Closing Date, and (z) an additional 25% of the TPB Lock-up Shares (i.e., totaling an aggregate of 100% of the TPB Lock-up Shares) shall be released from the TPB Lock-Up the date that is two years following the Closing Date.
The Sponsor also agreed that 3,006,049 of the Founder Shares held by the Sponsor (the “Vesting Founder Shares”) shall be subject to vesting and that (i) 50% of the Vesting Founder Shares will vest if at any time during the 3-year period following the Closing Date the closing share price of the Ordinary Shares is greater than or equal to US$12.50 over any 20 trading days within any consecutive 30 trading day period and (ii) the remaining 50% of the Vesting Founder Shares will vest if at any time during the three year period following the Closing Date the closing share price of the Ordinary Shares is greater than or equal to US$15.00 over any 20 trading days within any consecutive 30 trading day period, subject to the terms of the Sponsor Letter Agreement, as amended (the end of such period, the “Vesting Release Date”). In addition, Sponsor and TPB agreed that, to the extent Sponsor, taken together with its affiliates and any other persons whose beneficial ownership of the Company’s securities would be aggregated with the Sponsor’s for purposes of Section 13(d) of the Exchange Act (such as any other members of a Section 13(d) “group”), would otherwise beneficially own a number of Ordinary Shares in excess of 9.99% of the number of Ordinary Shares outstanding (the “Ownership Limitation”), Sponsor and TPB will, and will cause their affiliates and transferees to, waive any right to vote or transfer, sell or otherwise dispose of, directly or indirectly such number of Ordinary Shares as is necessary for the Ownership Limitation to not be exceeded. Any Ordinary Shares that would otherwise vest pursuant to the Sponsor Letter Agreement but remain unvested subject to the Ownership Limitation shall vest at the earlier of such time as when the Ownership Limitation would not be exceeded, subject to the Ownership Limitation Priority (as defined in Amendment No. 3). As of June 30, 2023, there were 2,951,436 outstanding Vesting Founder Shares.
For clarity, the Sponsor cannot transfer any Vesting Founder Shares until such shares vest, even subsequent to the expiration of the Sponsor Lock-Up. Any Vesting Founder Shares that have not vested in accordance with the Sponsor Letter Agreement, as amended, on or before the Vesting Release Date will be immediately forfeited at 11:59 p.m., New York, New York time on the Vesting Release Date (except that any Vesting Founder Shares that would have vested in accordance with the Sponsor Letter Agreement but for the Ownership Limitation, shall not be subject to forfeiture on the Vesting Release Date).
Any dividends or other distributions paid with respect to the Vesting Founder Shares during any period of time that such Vesting Founding Shares are subject to vesting shall be deposited by us for the benefit of the Sponsor in a separate account held and maintained solely for the benefit of Sponsor, subject to the terms and conditions of that certain escrow agreement to be entered into by and between the parties (the “Escrow Agreement”). The parties agree that for U.S. federal, state and local tax purposes, Sponsor is the owner of the Vesting Founder Shares and the Escrow Account, and in furtherance of the foregoing, Sponsor will be treated as the recipient of (A) any dividends or other distributions paid with respect to the Vesting Founder Shares (“Dividends”) and (B) any interest or other income or gains earned with respect to amounts held in the Escrow Account (“ Escrow Income”), whether or not ultimately distributed from the Escrow Account to Sponsor. Upon the vesting of any Vesting Founder Shares, we shall instruct the escrow agent to release any amounts held in the escrow account (including Dividends and Escrow Income) in respect of such Vesting Founder Shares to Sponsor. In the event that any Vesting Founder Shares are forfeited, then any amounts held in the escrow account (including Dividends and Escrow Income) in respect of such Vesting Founder Shares shall be forfeited to Lavoro Agro Limited. For the avoidance of doubt, no tax reporting shall be required in respect of the release of all or a portion of any amounts from the escrow account to Sponsor, and Sponsor shall be responsible for paying taxes (including any penalties and interest thereon) on all taxable Dividends and any Escrow Income, and for filing all necessary tax returns with respect to such income.
The foregoing descriptions are only a summary of Amendment No. 1, Amendment No. 2 and Amendment No. 3 and are qualified in their entirety by reference to the full text of Amendment No. 1 Amendment No. 2 and Amendment No. 3, which are filed as exhibits hereto and are incorporated by reference herein.
150
Registration Rights Agreement
On February 28, 2023, we and the Sponsor entered into that certain Amended and Restated Registration Rights Agreement, pursuant to which that certain Registration Rights Agreement, dated as of August 13, 2021, was amended and restated in its entirety. Under the A&R Registration Rights Agreement, the holders of certain registrable securities (as defined therein) are able to make a written demand for registration under the Securities Act of all or a portion of their registrable securities, subject to certain limitations so long as such demand includes a number of registrable securities with a total offering price in excess of US$30.0 million. Any such demand may be in the form of an underwritten offering, it being understood that, subject to certain exceptions, we shall not be required to conduct more than two underwritten offerings in any 12-month period. In addition, the holders of registrable securities will have “piggy-back” registration rights to include their securities in other registration statements filed by us subsequent to the closing of the Business Combination. We have also filed with the SEC the Resale Registration Statement covering the resale of all registrable securities.
The foregoing description is only a summary of the A&R Registration Rights Agreement and is qualified in its entirety by reference to the full text of the A&R Registration Rights Agreement, the form of which is filed as an exhibit hereto and is incorporated by reference herein.
Forward Purchase Agreements
On February 21, 2023, TPB SPAC entered into separate forward share purchase agreements (each, a “Forward Purchase Agreement” or an “FPA,” and together, the “Forward Purchase Agreements”) with certain equity holders of TPB SPAC (together, the “FPA Investors”), pursuant to which TPB SPAC (or Second Merger Sub, as successor-in-interest to TPB SPAC following the Closing) agreed to purchase in the aggregate, on the date that is 24 months after the Closing Date (the “Maturity Date”), i.e. on February 28, 2025, up to 2,830,750 Ordinary Shares then held by the FPA Investors (subject to certain conditions and purchase limits set forth in the Forward Purchase Agreements). Pursuant to the terms of the Forward Purchase Agreements, each FPA Investor, acting separately and solely for its own account, further agreed not to redeem, in connection with the Extraordinary General Meeting, of any of the SPAC Class A Ordinary Shares owned by it at such time.
On the Closing Date, and pursuant to an escrow agreement (the “Escrow Agreement”) entered into with Citibank, N.A., a national banking association organized and existing under the laws of the United States of America (the “Escrow Agent”), we placed into an escrow account (the “Escrow Account”) an amount equal to the Escrowed Property (as defined below) to secure our purchase obligation to the FPA Investors. “Escrowed Property” refers to (i) (a) the price per share that SPAC Class A Ordinary Shares were redeemed for in connection with TPB SPAC’s shareholder’s approval of the Business Combination (the “Shares Purchase Price”) multiplied by the number of SPAC Class A Ordinary Shares held by the FPA Investors as of the Closing Date less (b) any amounts previously disbursed from the Escrow Account in accordance with the Forward Purchase Agreements and the Escrow Agreement, plus (ii) the interest, investment income, or proceeds accrued from the deposit or investment from the Escrow Account.
Following the Third Effective Time, we agreed to use our best efforts to cause the filing of a registration statement, at our cost and expense, with the SEC registering the resale of the Ordinary Shares subject to the Forward Purchase Agreements (the “FPA Registration Statement”) under the Securities Act within 30 days following the Closing Date, and have the FPA Registration Statement declared effective as soon as practicable after the filing thereof, but no later than the earliest of (i) the 45th calendar day (or 90th calendar day if the SEC notifies us that it will review the FPA Registration Statement) following such closing and (ii) the 5th business day after the date we are notified (orally or in writing, whichever is earlier) by the SEC that such FPA Registration Statement will not be reviewed or will not be subject to further review. Pursuant to the Forward Purchase Agreements, the FPA Investors will use commercially best efforts to sell any or all of their Ordinary Shares in the open market if the per share sale price exceeds the Shares Purchase Price prior to the payment of any commissions due by the FPA Investors for such sale, with such sales commencing after the date on which the Ordinary Shares are registered on the FPA Registration Statement after the Closing Date.
If and when any FPA Investor sells Ordinary Shares to any third party, upon receipt by the Escrow Agent and us of written notice of such sale of Ordinary Shares (such date, the “Instruction Date”), the Escrow Agent shall release
151
to us an amount equal to (i) the Escrowed Property divided by the number of Ordinary Shares held by such FPA Investor as of the Instruction Date, multiplied by (ii) the number of Ordinary Shares sold by such FPA Investor pursuant to the Forward Purchase Agreements.
The per Ordinary Share price at which the FPA Investors have the right to sell the Ordinary Shares to us on the Maturity Date is (i) the total amount of the Escrowed Property in the Escrow Account, divided by (ii) the total number of Ordinary Shares held by the FPA Investors as of the Maturity Date (subject to the Share Purchase Limit (as defined in the Forward Purchase Agreements)). The FPA Investors will notify us in writing not less than five business days prior to the Maturity Date, specifying the number of Ordinary Shares that we will be required to purchase (the “Shares Sale Notice”). In exchange for our commitment to purchase Ordinary Shares on the Maturity Date, the FPA Investors agreed to continue to hold, and not to redeem, SPAC Class A Ordinary Shares prior to the Closing. Any FPA Investor that fails to timely deliver a Shares Sale Notice shall be deemed to have forfeited its right to sell any Ordinary Shares to us pursuant to the Forward Purchase Agreements.
The Forward Purchase Agreements may be terminated on the date on which the VWAP Price (as defined below) of the Ordinary Shares exceeds US$12.50 per share (as adjusted for stock splits, stock dividends, cash dividends, reorganizations, combinations, recapitalizations and the like) on any 20 trading days within any consecutive 30 trading day period occurring following the date on which the Ordinary Shares are registered on the FPA Registration Statement; provided that the cumulative number of Ordinary Shares that have been traded on the principal trading market of the Ordinary Shares since such date, as reported by Bloomberg, exceeds 25,000,000 Ordinary Shares. If the Forward Purchase Agreements are so terminated, then the Escrow Agent shall promptly release to us any Escrowed Property that remains in the Escrow Account. “VWAP Price” means, for any trading day, the Rule 10b-18 volume weighted average price per Ordinary Share for such day as reported on Bloomberg Screen “LVRO <Equity> AQR SEC” (or any successor thereto), or if such price is not so reported on such trading day for any reason or is erroneous, the VWAP Price shall be as reasonably determined by us.
In addition, the Forward Purchase Agreements may be terminated on or after the VWAP Price of the Ordinary Shares is less than US$5.00 per share (as adjusted for stock splits, stock dividends, cash dividends, reorganizations, combinations, recapitalizations and the like) on any 20 trading days within any consecutive 30 trading day period occurring following the six month anniversary of the date on which the Ordinary Shares are registered on the FPA Registration Statement; provided that the cumulative number of Ordinary Shares that have been traded on the principal trading market of the Ordinary Shares since such date, as reported by Bloomberg, exceeds 25,000,000 Ordinary Shares (“US$5.00 Notice Trigger”), and within five business days of the US$5.00 Notice Trigger, the FPA Investors deliver written notice to us and to the Escrow Agent expressing their intention to terminate the Forward Purchase Agreements. If the Forward Purchase Agreements are so terminated, the FPA Investors shall deliver, or cause to be delivered, all of their Ordinary Shares free and clear of all liens and encumbrances to us and, in exchange therefor, the Escrow Agent shall deliver to the FPA Investors, for the FPA Investors’ use without restriction, an amount equal to (i) the Escrowed Property, divided by (ii) the total number of Ordinary Shares held by the FPA Investors as of the date of the US$5.00 Notice Trigger, multiplied by (iii) the number of Ordinary Shares then held by the FPA Investors.
The Forward Purchase Agreements contain customary representations, warranties and covenants from the parties thereto. The foregoing descriptions are only a summary of the Forward Purchase Agreements and Escrow Agreement and are qualified in their entirety by reference to the full text of the Forward Purchase Agreements, including the Escrow Agreement, the form of which is included as Exhibit A thereto, which is filed as an exhibit hereto and is incorporated by reference herein.
If the FPA Investors hold some or all of the 2,830,750 Forward Purchase Agreement Shares on the Maturity Date, and the per share trading price of our Ordinary Shares is less than the per Ordinary Share price at which the FPA Investors have the right to sell the Ordinary Shares to us on the Maturity Date, we would expect that the FPA Investors will exercise this repurchase right with respect to such shares. We have placed an amount equal to the Escrowed Property to secure our purchase obligation to the FPA Investors under the Forward Purchase Agreements. Nonetheless, in the event that we are required to repurchase these Forward Purchase Agreement Shares, or in the event that the Forward Purchase Agreements are terminated under the conditions described above, the amount of Escrowed Property to which we could be entitled to as of the Maturity Date may be reduced to zero, which would accordingly reduce the amount of cash arising from the Business Combination that would ultimately be available to
152
fund our liquidity and capital resource requirements, which would adversely affect our ability to fund our growth plan in the manner we had contemplated when entering into the Forward Purchase Agreements. For more information, see “Item 3. Key Information—D. Risk Factors—Risks Relating to Our Ordinary Shares and Warrants—We may be required to repurchase up to 2,830,750 Ordinary Shares from the investors with whom we entered into Forward Purchase Agreements in connection with the closing of the Business Combination, which would reduce the amount of cash available to us to fund our growth plan.”
C.Interests of Experts and Counsel
None / Not applicable.
Item 8. Financial Information
A.Consolidated Statements and Other Financial Information
Financial Statements
See item 18 of this annual report for financial statements and other financial information.
Legal Proceedings
From time to time, we are involved in disputes that arise in the ordinary course of our business. Any claims against us, whether meritorious or not, can be time-consuming, result in costly litigation, require significant management time, and result in the diversion of significant operational resources.
We are subject to a number of judicial and administrative proceedings, including civil, labor, criminal, tax, regulatory, and social security claims and other proceedings, which we believe are common and incidental to business operations in general. We recognize provisions for legal proceedings in our financial statements, in accordance with accounting rules, when we are advised by independent outside counsel that (1) it is probable that an outflow of resources will be required to settle the obligation; and (2) a reliable estimate can be made of the amount of the obligation. The assessment of the likelihood of loss includes analysis by outside counsel of available evidence, the hierarchy of laws, available case law, recent court rulings and their relevance in the legal system. Our provisions for probable losses arising from these matters are estimated and periodically adjusted by management. In making these adjustments our management relies on the opinions of our external legal advisors.
As of June 30, 2023 and 2022, we had R$8.8 million and R$3.0 million in provisions for contingencies recorded in our financial statements, respectively, in connection with legal proceedings for which we believe a loss is probable in accordance with applicable accounting rules and have no judicial deposits in connection with outstanding proceedings. However, legal proceedings are inherently unpredictable and subject to significant uncertainties. If one or more cases were to result in a judgment against us in any reporting period for amounts that exceeded our management’s expectations, the impact on our results of operations or financial condition for that reporting period could be material. See “Item 3. Key Information—D. Risk Factors—Risks Relating to Lavoro’s Business and Industry—Adverse outcomes in legal proceedings could subject us to substantial damages and adversely affect our results of operations and profitability.”
For further information, see note 24 to our audited consolidated financial statements included elsewhere in this annual report.
Agrobiológica Investigation
Our subsidiary Agrobiológica Soluções is currently subject to a police investigation in the municipality of Leme, State of São Paulo, which investigation is based on allegations made by CropLife Brasil (a Brazilian association of agricultural pesticide companies). Agrobiológica Soluções is alleged to have illegally promoted the so-called “on-farm” multiplication of bacteria for agricultural use because it sells products that allow farmers to carry out the “on-farm” multiplication of pesticides, an activity that, according to CropLife Brasil, would be illegal. However, Agrobiológica Soluções understands that no law in Brazil prohibits the “on-farm” multiplication of pesticides by farmers in their own establishments and used in their own agricultural production. The activities
153
carried out by Agrobiológica Soluções concerning the “on-farm” multiplication of pesticides by the producers have not been questioned by any Brazilian regulatory or law enforcement agencies as of the date of this annual report. The police investigation is a preliminary fact-finding inquiry, and it does not imply a financial contingency or penalty at this stage.
Dividend Policy
We have never declared or paid any cash dividend on our Ordinary Shares. The payment of cash dividends in the future will depend upon our revenues and earnings, if any, capital requirements and general financial condition. Any further determination to pay dividends on our Ordinary Shares would be at the discretion of our board of directors.
B.Significant Changes
Except as disclosed elsewhere in this annual report, we have not experienced any significant changes since the date of our audited consolidated financial statements included in this annual report.
Item 9. The Offer and Listing
A.Offer and Listing Details
Our Ordinary Shares and Public Warrants are listed on Nasdaq under the symbols “LVRO” and “LVROW,” respectively.
Holders of Ordinary Shares and Public Warrants should obtain current market quotations for their securities.
B.Plan of Distribution
Not applicable.
C.Markets
Our Ordinary Shares and Public Warrants are listed on Nasdaq under the symbols “LVRO” and “LVROW,” respectively.
D.Selling Shareholders
Not applicable.
E.Dilution
Not applicable.
F.Expenses of the Issue
Not applicable.
Item 10. Additional Information
A.Share Capital
As of the date hereof, there are 116,608,329 Ordinary Shares outstanding and issued. There are also 6,012,085 Public Warrants listed on Nasdaq and 4,071,507 Private Placement Warrants held by the Sponsor issued and outstanding.
B.Memorandum and Articles of Association
We are an exempted company incorporated with limited liability in the Cayman Islands. Our affairs are governed by our governing documents, the Companies Act and the common law of the Cayman Islands. The
154
following is a summary of the material terms of our share capital. This summary is not intended to be complete and it is qualified by reference to our governing documents, a copy of which is included elsewhere in this annual report.
Share Capital
Our authorized share capital is US$1,500,000 consisting of 1,400,000,000 Ordinary Shares and 100,000,000 preferred shares. As of June 30, 2023, issued and outstanding share capital is US$116,608.33 consisting of 116,608,329 Ordinary Shares.
General
All of the issued and outstanding Ordinary Shares are fully paid and non-assessable. Certificates (to the extent any are issued) representing the issued and outstanding Ordinary Shares are generally not issued and legal title to the issued shares is recorded in fully registered, book-entry form in the register of members. Holders of Ordinary Shares have no pre-emptive, subscription, redemption or conversion rights.
Register of Members
We must keep a register of members in accordance with the Companies Act, and there shall be entered therein:
•the names and addresses of the members, a statement of the shares held by each member, and of the amount paid or agreed to be considered as paid, on the shares of each member and the voting rights of shares of each member;
•the date on which the name of any person was entered on the register as a member; and
•the date on which any person ceased to be a member.
Under Cayman Islands law, the register of members is prima facie evidence of the matters set out therein (i.e. the register of members will raise a presumption of fact on the matters referred to above unless rebutted) and a member registered in the register of members is deemed as a matter of Cayman Islands law to have legal title to the shares as set against its name in the register of members. As a result, the shareholders recorded in the register of members are deemed to have legal title to the shares set against their name.
If the name of any person is incorrectly entered in or omitted from the register of members, or if there is any default or unnecessary delay in entering on the register the fact of any person having ceased to be a member of the company, the person or member aggrieved (or any member of the company or the company itself) may apply to the Cayman Islands Grand Court for an order that the register be rectified, and the Court may either refuse such application or it may, if satisfied of the justice of the case, make an order for the rectification of the register.
Issue of Shares
Subject to our governing documents and the rules of Nasdaq, our board of directors may issue, allot and dispose of or grant options over all shares and issue warrants or similar instruments with respect thereto to such persons, on such terms, and with or without preferred, deferred or other rights and restrictions, whether in regard to dividend, voting, return of capital or otherwise, and otherwise in such manner as they may think fit. Subject to the description in “—Variation of Rights of Shares” below, the issuance of any such shares is subject to and cannot adversely affect the rights of the holders of any of our existing shares.
Dividends
Subject to the Companies Act and the special rights attaching to shares of any class, our directors may, in their absolute discretion, declare dividends on shares in issue and authorize payment of the dividends out of our funds lawfully available for those purposes. Dividends must be paid out of our realized or unrealized profits, out of our share premium account, or as otherwise permitted by the Companies Act. A dividend may not be paid if this would result in us being unable to pay our debts as they fall due in the ordinary course of business.
155
Except as otherwise provided by the rights attached to shares, or as otherwise determined by the directors, all dividends in respect of shares must be declared and paid according to the par value of the shares that a shareholder holds. If any share is issued on terms providing that it shall rank for dividend as from a particular date, then that share will rank for dividend accordingly.
For the purpose of determining the shareholders entitled to receive payment of any dividend, our directors may either before or on the date of declaration of such dividend fix a date as the record date for such determination. If no record date is fixed for the determination of shareholders entitled to receive payment of a dividend, the date on which the resolution of the directors declaring such dividend is adopted will be the record date.
Voting Rights
Each Ordinary Share entitles the holder to one vote on all matters upon which the holders are entitled to vote. Voting at any general meeting is by show of hands, unless voting by way of poll is demanded by the chairman of the board of directors or any shareholder present in person or by proxy.
General meetings require a quorum to be present. Quorum is met by the presence, in person or by proxy, of one or more persons holding at least twenty per cent in par value of the issued Ordinary Shares that confer the right to attend and vote at that meeting.
A special resolution will be required for important matters such as a reduction of our share capital, registration by way of continuation, approval of a plan of merger or consolidation, making changes to our governing documents, or our voluntary winding up.
An ordinary resolution of our shareholders requires the affirmative vote of at least a simple majority of the votes cast at a quorate general meeting, while a special resolution requires the affirmative vote of no less than two-thirds of the votes cast at a quorate general meeting. Any action required or permitted to be taken at our general meeting may be taken by resolution in writing of all the shareholders.
Variation of Rights of Shares
All or any of the rights attached to any class of our shares (unless otherwise provided by the terms of issue of the shares of that class) may, whether or not we are being wound up, be varied without the consent of the holders of the issued shares of that class where such variation is considered by our board of directors not to have a material adverse effect upon such rights; otherwise, any such variation shall be made only with the consent in writing of the holders of not less than two thirds of the issued shares of that class, or with the sanction of a resolution passed by a majority of not less than two thirds of the votes cast at a separate meeting of the holders of the shares of that class.
Transfer of Ordinary Shares
Any shareholder may transfer all or any of his or her shares by an instrument of transfer in the usual or common form or any other form prescribed by Nasdaq or as otherwise approved by the board of directors. The transferor shall be deemed to remain the holder of such shares until the name of the transferee is entered in the register of members.
Redemption of Ordinary Shares
We may issue shares on terms that such shares are subject to redemption, at our option or at the option of the shareholder, on such terms and in such manner as may be determined by our board of directors before the issue of such shares. We may also repurchase any of our shares provided that the manner and terms of such purchase have been approved by our board of directors and agreed with the shareholder or are otherwise authorized by our governing documents. Subject to the Companies Act, the redemption or repurchase of any share may be paid out of a company’s profits, its capital, or out of the proceeds of a fresh issue of shares made for the purpose of such redemption or repurchase. In addition, under the Companies Act no such share may be redeemed or repurchased (i) unless it is fully paid-up, (ii) if such redemption or repurchase would result in there being no shares in issue, or (iii) if the company has commenced liquidation. In addition, we may accept the surrender of any fully paid share for no consideration.
156
Changes in Capital
We may from time to time by ordinary resolution:
•increase the share capital by such sum as the resolution prescribes;
•consolidate and divide all or any of our share capital into shares of a larger amount than our existing shares;
•convert all or any of our paid-up shares into stock and reconvert that stock into paid-up shares of any denomination;
•sub-divide our existing shares into shares of a smaller amount than that fixed by our governing documents or into shares without par value; and
•cancel any shares that at the date of the passing of the resolution have not been taken or agreed to be taken by any person and diminish the amount of its share capital by the amount of the shares so canceled.
Subject to the Companies Act and our governing documents, our shareholders may by special resolution reduce its share capital.
Liquidation
On our winding up, if the assets available for distribution among our shareholders shall be insufficient to repay all of the paid-up capital, the assets will be distributed so that, as nearly as may be, the losses are borne by our shareholders in proportion to the par value of the shares held by them. If the assets available for distribution among our shareholders shall be more than sufficient to repay the whole of the share capital at the commencement of the winding up, the surplus will be distributed among our shareholders in proportion to the par value of the shares held by them at the commencement of the winding up, subject to a deduction from those shares in respect of which there are monies due, of all monies payable to us for unpaid calls or otherwise.
Warrants
General
There are currently outstanding an aggregate of 6,012,085 Public Warrants. The Public Warrants, which entitle the holder to purchase one Ordinary Share at an exercise price of US$11.50 per share (“Exercise Price”), became exercisable on March 30, 2023, which was 30 days after the completion of the Business Combination. The Public Warrants will expire on February 28, 2028 (i.e., five years after the completion of the Business Combination) or earlier upon redemption or liquidation in accordance with their terms.
Upon the completion of the Business Combination, there were also 4,071,507 Private Warrants held by the Sponsor. The Private Warrants are identical to the Public Warrants in all material respects, except that the Private Warrants, so long as they are held by the Sponsor or its permitted transferees, (i) are not redeemable by us, (ii) may be exercised by the holders on a cashless basis and (iii) are entitled to registration rights. Private Warrants that are transferred to persons other than permitted transferees shall upon such transfer cease to be Private Warrants and shall become Public Warrants.
Exercise
A Warrant may be exercised by delivering to the warrant agent (i) the Warrant, (ii) an election to purchase form, and (iii) the payment in full of the Exercise Price and any and all applicable taxes due in connection with the exercise.
As soon as practicable after the exercise of any Warrant we will issue a book-entry position or certificate, as applicable, for the Ordinary Shares. All Ordinary Shares issued upon the proper exercise of a Warrant in conformity with the Warrant Agreement will be validly issued, fully paid and non-assessable.
157
Adjustments
We may, in our sole discretion, lower the Exercise Price at any time prior to the expiration date for a period of not less than 20 business days, provided that we provide at least three days prior written notice of such reduction to registered holders of the Warrants and that any such reduction shall be identical among all of the Warrants.
The number of Ordinary Shares issuable upon the exercise of the Warrants is subject to customary adjustments in certain circumstances, such as a share sub-division, dividend or reclassification of our Ordinary Shares, as described in the Warrant Agreement. In the event the number of Ordinary Shares purchasable upon the exercise of the Warrants is adjusted, the Exercise Price will be adjusted (to the nearest cent) by multiplying the Exercise Price immediately prior to such adjustment, by a fraction (x) the numerator of which shall be the number of Ordinary Shares purchasable upon the exercise of the Warrants immediately prior to such adjustment, and (y) the denominator of which shall be the number of Ordinary Shares so purchasable immediately thereafter.
If, by reason of any adjustment made pursuant to the events described above, the holder of any Warrant would be entitled, upon the exercise of such Warrant, to receive a fractional interest in an Ordinary Share, we will, upon such exercise, round down to the nearest whole number the number of Ordinary Shares to be issued to such holder.
Warrant holders also have replacement rights in the case of certain reorganization, merger, consolidation or sale transactions involving our company or substantially all of our assets (each a “Replacement Event”). Upon the occurrence of any Replacement Event, Warrant holders will have the right to purchase and receive (in lieu of our Ordinary Shares) the kind and amount of shares or other securities or property (including cash) receivable upon such Replacement Event that the holder would have received if the Warrants were exercised immediately prior to such event.
Upon any adjustment of the Exercise Price or the number of Ordinary Shares issuable upon exercise of a Warrant, we will provide written notice of such adjustment to the warrant agent stating the Exercise Price resulting from such adjustment and the increase or decrease, if any, in the number of Ordinary Shares purchasable at such price upon the exercise of a Warrant. We will also provide notice of any adjustment described above to each Warrant holder at the last address set forth in the warrant register stating the date of the event.
Cashless Exercise
We agreed to use commercially reasonable efforts to file with the SEC as soon as practicable a registration statement for the registration, under the Securities Act, of the Ordinary Shares issuable upon exercise of the Warrants. We are obligated to use commercially reasonable efforts to cause the registration statement to become effective and to maintain its effectiveness, and a current prospectus relating thereto, until the expiration or redemption of the Warrants. If any such registration statement has not been declared effective by the 60th business say following the closing of the Business Combination, Warrant holders have the right, during the period beginning on the 61st business day after the closing of the Business Combination and ending upon such registration statement being declared effective by the SEC, and during any other period when we shall fail to have maintained an effective registration statement covering the Ordinary Shares issuable upon exercise of the Warrants, to exercise such Warrants on a “cashless basis.” In a cashless exercise, holders may exchange their Warrants for a number of Ordinary Shares equal to the lesser of (A) the quotient obtained by dividing (x) the product of the number of Ordinary Shares underlying the Warrants, multiplied by the excess of the Fair Market Value (as defined hereinafter) over the Exercise Price by (y) the Fair Market Value and (B) 0.361. “Fair Market Value” in this paragraph means the volume weighted average price of the Ordinary Shares as reported during the ten trading days ending on the trading day prior to the date that notice of exercise is received by the warrant agent from the holder of such Warrants or its securities broker or intermediary.
If, by reason of any exercise of Warrants on a “cashless basis,” the holder of any Warrant would be entitled, upon the exercise of such Warrant, to receive a fractional interest in an Ordinary Share, we will round down to the nearest whole number, the number of Ordinary Shares to be issued to such holder.
158
Redemption
We have the right to redeem all the Public Warrants (but not less than all the Public Warrants), at any time while they are exercisable and prior to their expiration, at the price of US$0.01 per Warrant if (i) the last reported sale price of our Ordinary Shares has been at least US$18.00 per share (subject to certain adjustments), on 20 trading days within the 30-trading-day period ending on the third business day prior to the date on which notice of the redemption is given and (ii) there is an effective registration statement covering issuance of the Ordinary Shares issuable upon exercise of the Warrants, and a current prospectus relating thereto, available throughout the 30 days prior to the redemption date. These redemption rights do not apply to the Private Warrants unless and until they are transferred to persons other than the Sponsor and its permitted transferees.
We may also redeem the Public Warrants in whole (but not in part) at any time while they are exercisable and prior to their expiration, at the price of US$0.10 per Warrant if the last reported sale price of our Ordinary Shares has been at least US$10.00 per share (subject to certain adjustments) on 20 trading days within the 30-trading-day period ending on the third business day prior to the date on which notice of the redemption is given. If the last reported sale price of our Ordinary Shares has been less than US$18.00 per share (subject to certain adjustments) on 20 trading days within the 30-trading-day period ending on the third business day prior to the date on which notice of the redemption is given, the Private Warrants are also concurrently called for redemption on the same terms as the outstanding Public Warrants. During the 30-day redemption period, Warrant holders may elect to exercise their Warrants on a “cashless basis” and receive a number of Ordinary Shares as described under “—Cashless Exercise” above.
If we choose to redeem our Warrants, we are required to (i) fix a date for the redemption and (ii) provide notice to the registered holders of the Warrants at least 30 days prior to the redemption date. We will mail any such notice of redemption by first class mail, postage prepaid, not less than 30 days prior to the redemption date to registered Warrant holders. The notice will be sent to each registered holder’s last address as it appears on the registration books. Any notice so mailed will be conclusively presumed to have been duly given, whether or not the registered holder actually receives such notice.
On and after the redemption date, the record holder of the warrants will have no further rights except to receive, upon surrender of the warrants, the redemption price.
Transfers and Exchanges
Warrants may be exchanged or transferred upon surrender of the Warrant to the warrant agent, together with a written request for exchange or transfer. Upon any transfer, a new Warrant representing an equal aggregate number of Warrants will be issued and the old Warrant will be cancelled by the warrant agent.
Book-entry Warrants may be transferred only in whole and Warrants bearing a restrictive legend may transferred or exchanged only if the Warrant agent has received an opinion of counsel stating that such transfer may be made and indicating whether the new Warrants must also bear a restrictive legend.
No Rights as a Shareholder
A Warrant does not entitle the holder to any of the rights of a shareholder of our company, including, without limitation, the right to receive dividends or other distributions, exercise any preemptive right to vote or to consent or the right to receive notice as shareholders in respect of the meetings of shareholders or the appointment of directors of our company or any other matter.
Directors
Appointment and Removal
Our management is vested in a board of directors. Our governing documents provide that there shall be a board of directors consisting of no less than one (1) director, provided that the directors may increase or decrease the limits on the number of directors. Our board of directors consists of seven directors and.
159
Our governing documents provide that the directors shall be divided into three (3) classes designated as Class 1, Class 2 and Class 3, with as nearly equal a number of directors in each group as possible. Subject to our governing documents, directors must be assigned to each class in accordance with a resolution or resolutions adopted by the board of directors.
Director nominees must be elected by an ordinary resolution in accordance with our governing documents at each annual general meeting of our shareholders to fill the seats of those directors whose terms expire at such annual general meeting and the persons to stand for election at each annual general meeting of our shareholders shall be nominated by the directors. For illustrative purposes, at the 2023 annual general meeting, the term of office of the Class 1 directors shall expire and Class 1 directors shall be elected for a full term of three (3) years. At the 2024 annual general meeting, the term of office of the Class 2 directors shall expire and Class 2 directors shall be elected for a full term of three (3) years. At the 2025 annual general meeting, the term of office of the Class 3 directors shall expire and Class 3 directors shall be elected for a full term of three (3) years. Subject to our governing documents, at each succeeding annual general meeting, directors shall be elected for a full term of three (3) years to succeed the directors of the class whose terms expire at such annual general meeting.
Without prejudice to our power to appoint a person to be a director by ordinary resolution and subject to our governing documents, the board of directors, so long as a quorum of directors remains in office, has the power at any time and from time to time to appoint any person to be a director so as to fill a casual vacancy or otherwise.
Indemnity of Directors and Officers
Our governing documents contain provisions that limit the liability of our directors, agents and officers for monetary damages for any liability incurred by them as a result of any act or failure to act in carrying out their functions other than such liability (if any) that they may incur (i) arising from their own actual fraud, willful default or willful neglect, (ii) for acts or omissions not in good faith or that involve intentional misconduct or a knowing violation of law, or (iii) for any transaction from which such person derived any improper benefit. Any repeal or modification of the foregoing provisions of our governing documents by our shareholders shall not adversely affect any right or protection of a director, agent or officer of the Company existing at the time of, or increase the liability of any director, agent or officer of the Company with respect to any acts or omissions of such Director, agent or officer occurring prior to, such repeal or modification.
In addition, our governing documents contain provisions that indemnify every director, agent or officer of the Company out of the assets of the Company against any liability incurred by them as a result of any act or failure to act in carrying out their functions other than such liability (if any) that they may incur (i) arising from their own actual fraud, willful default or willful neglect, (ii) for acts or omissions not in good faith or that involve intentional misconduct or a knowing violation of law, or (iii) for any transaction from which such person derived any improper benefit. Further, we have entered into or will enter into indemnification agreements with each of our directors and executive officers that may be broader than the specific indemnification provisions contained in the Delaware General Corporation Law. These indemnification agreements require us, among other things, to indemnify our directors and executive officers against liabilities that may arise by reason of their status or service. These indemnification agreements also require us to advance all expenses incurred by the directors and executive officers in investigating or defending any such action, suit or proceeding. We believe that these agreements are necessary to attract and retain qualified individuals to serve as directors and executive officers. The limitation of liability and indemnification provisions that are included in our governing documents and in indemnification agreements that we have entered into or will enter into with our directors and executive officers may discourage shareholders from bringing a lawsuit against our directors and executive officers for breach of their fiduciary duties. They may also reduce the likelihood of derivative litigation against our directors and executive officers, even though an action, if successful, might benefit us and other shareholders. Further, a shareholder’s investment may be adversely affected to the extent that we pay the costs of settlement and damage awards against directors and executive officers as required by these indemnification provisions. At present, we are not aware of any pending litigation or proceeding involving any person who is or was one of our directors, officers, employees or other agents or is or was serving at our request as a director, officer, employee or agent of another corporation, partnership, joint venture, trust or other enterprise, for which indemnification is sought, and we are not aware of any threatened litigation that may result in claims for indemnification.
160
We have obtained insurance policies under which, subject to the limitations of the policies, coverage is provided to our directors and executive officers against loss arising from claims made by reason of breach of fiduciary duty or other wrongful acts as a director or executive officer, including claims relating to public securities matters, and to us with respect to payments that may be made by us to these directors and executive officers pursuant to our indemnification obligations or otherwise as a matter of law. In addition, certain of our non-employee directors may, through their relationships with their employers, be insured or indemnified against certain liabilities incurred in their capacity as members of our board of directors.
Certain Anti-Takeover Provisions in our Governing Documents
As described in “—Directors—Appointment and Removal” above, our governing documents provide that our board of directors will be classified into three classes of directors. As a result, in most circumstances, a person can gain control of our board only by successfully engaging in a proxy contest at two or more annual general meetings.
Our authorized but unissued Ordinary Shares are available for future issuances without shareholder approval and could be utilized for a variety of corporate purposes, including future offerings to raise additional capital, acquisitions and employee benefit plans. The existence of authorized but unissued and unreserved Ordinary Shares could render more difficult or discourage an attempt to obtain control by means of a proxy contest, tender offer, merger or otherwise.
Enforcement of Civil Liabilities – Cayman Islands
The Cayman Islands has a different body of securities laws as compared to the United States and provides less protection to investors. Additionally, Cayman Islands companies may not have standing to sue before the Federal courts of the United States.
Our Cayman Islands legal counsel have advised that the courts of the Cayman Islands are unlikely (i) to recognize or enforce against the company judgments of courts of the United States predicated upon the civil liability provisions of the federal securities laws of the United States or any state; and (ii) in original actions brought in the Cayman Islands, to impose liabilities against the company predicated upon the civil liability provisions of the federal securities laws of the United States or any state, so far as the liabilities imposed by those provisions are penal in nature. In those circumstances, although there is no statutory enforcement in the Cayman Islands of judgments obtained in the United States, the courts of the Cayman Islands will recognize and enforce a foreign money judgment of a foreign court of competent jurisdiction without retrial on the merits based on the principle that a judgment of a competent foreign court imposes upon the judgment debtor an obligation to pay the sum for which judgment has been given provided certain conditions are met. For a foreign judgment to be enforced in the Cayman Islands, such judgment must be final and conclusive and for a liquidated sum, and must not be in respect of taxes or a fine or penalty, inconsistent with a Cayman Islands judgment in respect of the same matter, impeachable on the grounds of fraud or obtained in a manner, and or be of a kind the enforcement of which is, contrary to natural justice or the public policy of the Cayman Islands (awards of punitive or multiple damages may well be held to be contrary to public policy). A Cayman Islands court may stay enforcement proceedings if concurrent proceedings are being brought elsewhere.
Anti-Money Laundering – Cayman Islands
If any person in the Cayman Islands knows or suspects or has reasonable grounds for knowing or suspecting that another person is engaged in criminal conduct or money laundering or is involved with terrorism or terrorist financing and property and the information for that knowledge or suspicion came to their attention in the course of business in the regulated sector, or other trade, profession, business or employment, the person will be required to report such knowledge or suspicion to (i) the Financial Reporting Authority of the Cayman Islands, pursuant to the Proceeds of Crime Act (as revised) of the Cayman Islands if the disclosure relates to criminal conduct or money laundering, or (ii) a police officer of the rank of constable or higher, or the Financial Reporting Authority, pursuant to the Terrorism Act (as revised) of the Cayman Islands, if the disclosure relates to involvement with terrorism or terrorist financing and property. Such a report shall not be treated as a breach of confidence or of any restriction upon the disclosure of information imposed by any enactment or otherwise.
161
Data Protection Law – Cayman Islands
We have certain duties under the Data Protection Act (as revised) of the Cayman Islands (the “DPA”) based on internationally accepted principles of data privacy.
Principal Differences between Cayman Islands and U.S. Corporate Law
The Companies Act was modeled originally after similar laws in England and Wales but does not follow subsequent statutory enactments in England and Wales. In addition, the Companies Act differs from laws applicable to U.S. corporations and their shareholders. Set forth below is a summary of the significant differences between the provisions of the Companies Act applicable to the Company and the laws applicable to companies incorporated in the United States and their shareholders.
Mergers and Similar Arrangements
The Companies Act permits mergers and consolidations between Cayman Islands companies and between Cayman Islands companies and non-Cayman Islands companies.
For these purposes, (1) “merger” means the merging of two or more constituent companies and the vesting of their undertaking, property and liabilities in one of such companies as the surviving company and (2) a “consolidation” means the combination of two or more constituent companies into a consolidated company and the vesting of the undertaking, property and liabilities of such companies in the consolidated company. In order to effect such a merger or consolidation, the directors of each constituent company must approve a written plan of merger or consolidation, which must then be authorized by (a) a special resolution of the shareholders of each constituent company; and (b) such other authorization, if any, as may be specified in such constituent company’s articles of association. The plan must be approved by the directors of each constituent company and filed with the Registrar of Companies together with a declaration as to: (i) the solvency of the consolidated or surviving company; (ii) the merger or consolidation is bona fide and not intended to defraud unsecured creditors of the constituent companies; (iii) no petition or other similar proceeding has been filed and remains outstanding and no order or resolution to wind up the company in any jurisdiction; (iv) no receiver, trustee, administrator or similar person has been appointed in any jurisdiction and is acting in respect of the constituent company, its affairs or property; (v) no scheme, order, compromise or similar arrangement has been entered into or made in any jurisdiction with creditors; (vi) a list of the assets and liabilities of each constituent company; (vii) the non-surviving constituent company has retired from any fiduciary office held or will do so; (viii) that the constituent company has complied with any requirements under the regulatory laws, where relevant; and (ix) an undertaking that a copy of the certificate of merger or consolidation will be published in the Cayman Islands Gazette, and where the surviving company is a Cayman Islands company, given to the members and creditors of each constituent company.
Dissenting shareholders have the right to be paid the fair value of their shares (which, if not agreed between the parties, may be determined by the Cayman Islands’ court) if they follow the required procedures, subject to certain exceptions. Court approval is not required for a merger or consolidation that is effected in compliance with these statutory procedures.
In addition, there are statutory provisions that facilitate the reconstruction and amalgamation of companies, provided that the arrangement in question is approved by a majority in number of each class of shareholders and creditors with whom the arrangement is to be made, and who must in addition represent three-fourths in value of each such class of shareholders or creditors, as the case may be, that are present and voting either in person or by proxy at a meeting, or meetings, convened for that purpose. The convening of the meetings and subsequently the arrangement must be sanctioned by the Grand Court of the Cayman Islands. While a dissenting shareholder would have the right to express to the court the view that the transaction should not be approved, the court can be expected to approve the arrangement if it satisfies itself that:
•the Company is not proposing to act illegally or ultra vires and the statutory provisions as to majority vote have been complied with;
•the shareholders have been fairly represented at the meeting in question;
162
•the arrangement is such that may be reasonably approved by an intelligent and honest man of that class acting in respect of his interest; and
•the arrangement is not one that would more properly be sanctioned under some other provision of the Companies Act or that would amount to a “fraud on the minority.”
If the arrangement and reconstruction are thus approved, any dissenting shareholders would have no rights comparable to appraisal rights, which might otherwise ordinarily be available to dissenting shareholders of U.S. corporations and allow such dissenting shareholders to receive payment in cash for the judicially determined value of their shares.
When a takeover offer is made and accepted by holders of 90.0% in value of the shares affected within four months, the offeror may, within a two-month period thereafter, require the holders of the remaining shares to transfer such shares on the terms of the offer. An objection may be made to the Grand Court of the Cayman Islands but is unlikely to succeed unless there is evidence of fraud, bad faith or collusion.
In application may be made by a dissenting shareholder to the Grand Court for an order that the transfer of the shares be made otherwise than on the terms of the offer.
Shareholders’ Suits
Class actions are not recognized in the Cayman Islands, but groups of shareholders with identical interests may bring representative proceedings, which are similar. However, a class action suit could nonetheless be brought in a U.S. court pursuant to an alleged violation of U.S. securities laws and regulations.
In principle, the Company itself would normally be the proper plaintiff and as a general rule, while a derivative action may be initiated by a minority shareholder on behalf of the Company in a Cayman Islands court, such shareholder will not be able to continue those proceedings without the permission of a Grand Court judge, who will only allow the action to continue if the shareholder can demonstrate that the Company has a good case against the defendant, and that it is proper for the shareholder to continue the action rather than the Company’s board of directors. Examples of circumstances in which derivative actions would be permitted to continue are where:
•a company is acting or proposing to act illegally or beyond the scope of its authority;
•the act complained of, although not beyond the scope of its authority, could be effected duly if authorized by more than a simple majority vote that has not been obtained; and
•those who control the company are perpetrating a “fraud on the minority.”
Corporate Governance
Cayman Islands law restricts transactions between a company and its directors unless there are provisions in our governing documents which provide a mechanism to alleviate possible conflicts of interest. Additionally, Cayman Islands law imposes on directors duties of care and skill and fiduciary duties to the companies which they serve. Under our governing documents, a director must disclose the nature and extent of his interest in any contract or arrangement, and following such disclosure and subject to any separate requirement under applicable law or the listing rules of the Nasdaq, and unless disqualified by the chairman of the relevant meeting, the interested director may vote in respect of any transaction or arrangement in which he or she is interested. The interested director shall be counted in the quorum at such meeting and the resolution may be passed by a majority of the directors present at the meeting.
Subject to the foregoing and our governing documents, including the attributions and responsibilities of our compensation committee, our directors may exercise all the powers of the Company to vote compensation to themselves or any member of their body in the absence of an independent quorum.
163
As a foreign private issuer, we are permitted to follow home country practice in lieu of certain Nasdaq corporate governance rules, subject to certain requirements. We currently rely, and will continue to rely, on the foreign private issuer exemption with respect to the following rules:
•the majority independent director requirement under Section 5605(b)(1) of Nasdaq listing rules;
•the requirement under Section 5605(d) of Nasdaq listing rules that a compensation committee comprised solely of independent directors governed by a compensation committee charter oversee executive compensation;
•the requirement under Section 5605(e) of Nasdaq listing rules that director nominees be selected or recommended for selection by either a majority of the independent directors or a nominations committee comprised solely of independent directors;
•the requirement under Section 5635(d) of Nasdaq listing rules that a listed issuer obtain shareholder approval prior to an issuance of securities in connection with: (i) the acquisition of the stock or assets of another company; (ii) equity-based compensation of officers, directors, employees or consultants; (iii) a change of control; and (iv) transactions other than public offerings. Pursuant to the laws of the Cayman Islands and our governing documents, we are not required to obtain any such approval; and
•the requirement under Section 5605(b)(2) of Nasdaq listing rules that the independent directors have regularly scheduled meetings with only the independent directors present.
Borrowing Powers
Our directors may exercise all the powers of the Company to borrow money and to mortgage or charge its undertaking, property and assets (present and future) and uncalled capital or any part thereof and to issue debentures, debenture stock, mortgages, bonds and other such securities whether outright or as security for any debt, liability or obligation of the Company or of any third party. Such powers may be varied by a special resolution of shareholders (requiring a two-thirds majority vote).
Indemnification of Directors and Executive Officers and Limitation of Liability
The Companies Act does not limit the extent to which a company’s articles of association may provide for indemnification of directors and officers, except to the extent that it may be held by the Cayman Islands courts to be contrary to public policy, such as to provide indemnification against civil fraud or the consequences of committing a crime. Our governing documents provide that we shall indemnify and hold harmless our directors and officers against all actions, proceedings, costs, charges, expenses, losses, damages, liabilities, judgments, fines, settlements and other amounts incurred or sustained by such directors or officers, other than by reason of such person’s actual fraud or willful default, in or about the conduct of our company’s business or affairs (including as a result of any mistake of judgment) or in the execution or discharge of his duties, powers, authorities or discretions, including without prejudice to the generality of the foregoing, any costs, expenses, losses or liabilities incurred by such director or officer in defending (whether successfully or otherwise) any civil, criminal or other proceedings concerning the Company or our affairs in any court whether in the Cayman Islands or elsewhere. This standard of conduct is generally the same as permitted under the Delaware General Corporation Law for a Delaware corporation.
Insofar as indemnification for liabilities arising under the Securities Act may be permitted to our directors, officers or persons controlling the Company under the foregoing provisions, we have been informed that, in the opinion of the SEC, this indemnification is against public policy as expressed in the Securities Act and is therefore unenforceable.
Directors’ Fiduciary Duties
As a matter of Cayman Islands law, a director of a Cayman Islands company is in the position of a fiduciary with respect to the company. Accordingly, directors owe fiduciary duties to their companies to act bona fide in what they consider to be the best interests of the company, to exercise their powers for the purposes for which they are
164
conferred and not to place themselves in a position where there is a conflict between their personal interests and their duty to the company. Accordingly, a director owes a company a duty not to make a profit based on his or her position as director (unless the company permits him or her to do so) and a duty not to put himself or herself in a position where the interests of the company conflict with his or her personal interest or his or her duty to a third party. However, this obligation may be varied by the company’s articles of association, which may permit a director to vote on a matter in which he has a personal interest provided that he has disclosed that nature of his interest to the board of directors. Our governing documents provides that a director must disclose the nature and extent of his or her interest in any contract or arrangement, and following such disclosure and subject to any separate requirement under applicable law or the listing rules of the Nasdaq, and unless disqualified by the chairman of the relevant meeting, such director may vote in respect of any transaction or arrangement in which he or she is interested and may be counted in the quorum at the meeting.
A director of a Cayman Islands company also owes to the company duties to exercise independent judgment in carrying out his functions and to exercise reasonable skill, care and diligence, which has both objective and subjective elements. Recent Cayman Islands case law confirmed that directors must exercise the care, skill and diligence that would be exercised by a reasonably diligent person having the general knowledge, skill and experience reasonably to be expected of a person acting as a director. Additionally, a director must exercise the knowledge, skill and experience which he or she actually possesses.
A general notice may be given to the board of directors to the effect that (1) the director is a member or officer of a specified company or firm and is to be regarded as interested in any contract or arrangement which may after the date of the notice be made with that company or firm, or (2) he or she is to be regarded as interested in any contract or arrangement which may after the date of the notice to the board of directors be made with a specified person who is connected with him or her, which will be deemed sufficient declaration of interest. This notice shall specify the nature of the interest in question. Following the disclosure being made pursuant to our governing documents and subject to any separate requirement under applicable law or the listing rules of the Nasdaq, and unless disqualified by the chairman of the relevant meeting, a director may vote in respect of any transaction or arrangement in which he or she is interested and may be counted in the quorum at the meeting.
In comparison, under Delaware corporate law, a director of a Delaware corporation has a fiduciary duty to the corporation and its shareholders. This duty has two components: the duty of care and the duty of loyalty. The duty of care requires that a director act in good faith, with the care that an ordinarily prudent person would exercise under similar circumstances. Under this duty, a director must inform himself or herself of, and disclose to shareholders, all material information reasonably available regarding a significant transaction. The duty of loyalty requires that a director act in a manner he or she reasonably believes to be in the best interests of the corporation. He or she must not use his or her corporate position for personal gain or advantage. This duty prohibits self-dealing by a director and mandates that the best interest of the corporation and its shareholders take precedence over any interest possessed by a director, officer or controlling shareholder and not shared by the shareholders generally. In general, actions of a director are presumed to have been made on an informed basis, in good faith and in the honest belief that the action taken was in the best interests of the corporation. However, this presumption may be rebutted by evidence of a breach of one of the fiduciary duties. Should such evidence be presented concerning a transaction by a director, a director must prove the procedural fairness of the transaction, and that the transaction was of fair value to the corporation.
Shareholder Proposals
Under the Delaware General Corporation Law, a shareholder has the right to put any proposal before the annual meeting of shareholders, provided it complies with the notice provisions in the governing documents. The Delaware General Corporation Law does not provide shareholders an express right to put any proposal before the annual meeting of shareholders, but Delaware corporations generally afford shareholders an opportunity to make proposals and nominations provided that they comply with the notice provisions in the certificate of incorporation or bylaws. A special meeting may be called by the board of directors or any other person authorized to do so in the governing documents, but shareholders may be precluded from calling special meetings.
The Companies Act provides shareholders with only limited rights to requisition a general meeting, and does not provide shareholders with any right to put any proposal before a general meeting. However, these rights may be
165
provided in a company’s articles of association. Our governing documents provide that upon the requisition of one or more shareholders representing not less than one-half of the voting rights entitled to vote at general meetings, the board will convene an extraordinary general meeting and put the resolutions so requisitioned to a vote at such meeting. Our governing documents provide no other right to put any proposals before annual general meetings or extraordinary general meetings.
Cumulative Voting
Under the Delaware General Corporation Law, cumulative voting for elections of directors is not permitted unless the corporation’s certificate of incorporation specifically provides for it. Cumulative voting potentially facilitates the representation of minority shareholders on a board of directors since it permits the minority shareholder to cast all the votes to which the shareholder is entitled on a single director, which increases the shareholder’s voting power with respect to electing such director. As permitted under Cayman Islands law, our governing documents do not provide for cumulative voting. As a result, our shareholders are not afforded any less protections or rights on this issue than shareholders of a Delaware corporation.
Removal of Directors
The office of a director shall be vacated automatically if, among other things, he or she (1) becomes prohibited by law from being a director, (2) becomes bankrupt or makes an arrangement or composition with his creditors, (3) dies or is in the opinion of all his co-directors, incapable by reason of mental disorder of discharging his duties as director (4) resigns his or her office by notice in writing to us or (5) if a majority of the other directors (being not less than two in number) determine that the director should be removed, either by a resolution passed by a majority of the other directors at a meeting of the directors duly convened and held in accordance with the Articles or by a resolution in writing signed by a majority of the other directors.
Transaction with Interested Shareholders
The Delaware General Corporation Law provides that, unless the corporation has specifically elected not to be governed by this statute, it is prohibited from engaging in certain business combinations with an “interested shareholder” for three years following the date that this person becomes an interested shareholder. An interested shareholder generally is a person or a group who or which owns or owned 15% or more of the target’s outstanding voting shares or who or which is an affiliate or associate of the corporation and owned 15% or more of the corporation’s outstanding voting shares within the past three years. This has the effect of limiting the ability of a potential acquirer to make a two-tiered bid for the target in which all shareholders would not be treated equally. The statute does not apply if, among other things, prior to the date on which the shareholder becomes an interested shareholder, the board of directors approves either the business combination or the transaction which resulted in the person becoming an interested shareholder. This encourages any potential acquirer of a Delaware corporation to negotiate the terms of any acquisition transaction with the target’s board of directors.
Cayman Islands law has no comparable statute. As a result, the Company cannot avail itself of the types of protections afforded by the Delaware business combination statute. However, although Cayman Islands law does not regulate transactions between a company and its significant shareholders, it does provide that the board of directors owe duties to ensure that these transactions are entered into bona fide in the best interests of the company and for a proper corporate purpose and, as noted above, a transaction may be subject to challenge if it has the effect of constituting a fraud on the minority shareholders.
Dissolution; Winding-Up
Under the Delaware General Corporation Law, unless the board of directors approves the proposal to dissolve, dissolution must be approved by shareholders holding 100% of the total voting power of the corporation. If the dissolution is initiated by the board of directors, it may be approved by a simple majority of the corporation’s outstanding shares. Delaware law allows a Delaware corporation to include in its certificate of incorporation a supermajority voting requirement in connection with dissolutions initiated by the board. Under Cayman Islands law, a company may be wound up by either an order of the courts of the Cayman Islands or by a special resolution of its members or, if the company resolves by ordinary resolution that it be wound up because it is unable to pay its debts
166
as they fall due. The court has authority to order winding-up in a number of specified circumstances, including where it is, in the opinion of the court, just and equitable to do so.
Under the Companies Act, the Company may be dissolved, liquidated or wound up by a special resolution of shareholders (requiring a two-thirds majority vote). Our governing documents also give its board of directors authority to petition the Cayman Islands Court to wind up the Company.
Variation of Rights of Shares
Under the Delaware General Corporation Law, a corporation may vary the rights of a class of shares with the approval of a majority of the outstanding shares of that class, unless the certificate of incorporation provides otherwise. Under our governing documents, if the share capital is divided into more than one class of shares, the rights attached to any class may only be varied with the written consent of the holders of two-thirds of the shares of that class or the sanction of a special resolution passed at a separate meeting of the holders of the shares of that class.
Also, except with respect to share capital (as described above), alterations to our governing documents may only be made by special resolution of shareholders (requiring a two-thirds majority vote).
Amendment of Governing Documents
Under the Delaware General Corporation Law, a corporation’s certificate of incorporation may be amended only if adopted and declared advisable by the board of directors and approved by a majority of the outstanding shares entitled to vote, and the bylaws may be amended with the approval of a majority of the outstanding shares entitled to vote and may, if so provided in the certificate of incorporation, also be amended by the board of directors. Under Cayman Islands law, our governing documents (and save for certain amendments to share capital described in this section) may only be amended by special resolution of shareholders (requiring a two-thirds majority vote).
Rights of Nonresident or Foreign Shareholders
There are no limitations imposed by our governing documents on the rights of nonresident or foreign shareholders to hold or exercise voting rights on our shares. In addition, there are no provisions in our governing documents governing the ownership threshold above which shareholder ownership must be disclosed.
Privacy Notice
Introduction
This privacy notice puts our shareholders on notice that through investment in the company the shareholder will provide the company with certain personal information which constitutes personal data within the meaning of the DPA (“personal data”). In the following discussion, references to “the company” refers to us and our affiliates and/or delegates, except where the context requires otherwise.
Investor Data
We will collect, use, disclose, retain and secure personal data to the extent reasonably required only and within the parameters that could be reasonably expected during the normal course of business. We will only process, disclose, transfer or retain personal data to the extent legitimately required to conduct our activities of on an ongoing basis or to comply with legal and regulatory obligations to which we are subject. We will only transfer personal data in accordance with the requirements of the DPA, and will apply appropriate technical and organizational information security measures designed to protect against unauthorized or unlawful processing of the personal data and against the accidental loss, destruction or damage to the personal data.
In our use of this personal data, we will be characterized as a “data controller” for the purposes of the DPA, while our affiliates and service providers who may receive this personal data from us in the conduct of our activities may either act as our “data processors” for the purposes of the DPA or may process personal information for their own lawful purposes in connection with services provided to us.
167
We may also obtain personal data from other public sources. Personal data includes, without limitation, the following information relating to a shareholder and/or any individuals connected with a shareholder as an investor: name, residential address, email address, contact details, corporate contact information, signature, nationality, place of birth, date of birth, tax identification, credit history, correspondence records, passport number, bank account details, source of funds details and details relating to the shareholder’s investment activity.
Whom this Affects
If you are a natural person, this will affect you directly. If you are a corporate investor (including, for these purposes, legal arrangements such as trusts or exempted limited partnerships) that provides us with personal data on individuals connected to you for any reason in relation your investment in the company, this will be relevant for those individuals and you should transmit the content of this Privacy Notice to such individuals or otherwise advise them of its content.
How the Company May Use a Shareholder’s Personal Data
The company, as the data controller, may collect, store and use personal data for lawful purposes, including, in particular:
(i)where this is necessary for the performance of our rights and obligations under any purchase agreements;
(ii)where this is necessary for compliance with a legal and regulatory obligation to which we are subject (such as compliance with anti-money laundering and FATCA/CRS requirements); and/or
(iii)where this is necessary for the purposes of our legitimate interests and such interests are not overridden by your interests, fundamental rights or freedoms.
Should we wish to use personal data for other specific purposes (including, if applicable, any purpose that requires your consent), we will contact you.
Why We May Transfer Your Personal Data
In certain circumstances we may be legally obliged to share personal data and other information with respect to your shareholding with the relevant regulatory authorities such as the Cayman Islands Monetary Authority or the Tax Information Authority. They, in turn, may exchange this information with foreign authorities, including tax authorities.
We anticipate disclosing personal data to persons who provide services to us and their respective affiliates (which may include certain entities located outside the United States, the Cayman Islands or the European Economic Area), who will process your personal data on our behalf.
The Data Protection Measures We Take
Any transfer of personal data by us or our duly authorized affiliates and/or delegates outside of the Cayman Islands shall be in accordance with the requirements of the DPA.
We and our duly authorized affiliates and/or delegates shall apply appropriate technical and organizational information security measures designed to protect against unauthorized or unlawful processing of personal data, and against accidental loss or destruction of, or damage to, personal data.
We shall notify you of any personal data breach that is reasonably likely to result in a risk to your interests, fundamental rights or freedoms or those data subjects to whom the relevant personal data relates.
168
C.Material Contracts
Material Contracts Relating to Our Operations
Following and as a result of the Business Combination, all of our business is conducted through our subsidiaries. Information pertaining to our material contracts is set forth in this annual report under the headings “Item 4. Information on the Company,” “Item 5. Operating and Financial Review and Prospects,” “Item 7. Major Shareholders and Related Party Transactions—B. Related Party Transactions” or elsewhere in this annual report.
Material Contracts Relating to the Business Combination
Business Combination Agreement
The description of the Business Combination Agreement is set forth in “Item 4. Information on the Company—A. History and Development of the Company—Business Combination,” which information is incorporated herein by reference.
Related Agreements
The description of the material provisions of certain additional agreements entered into pursuant to the Business Combination Agreement is set forth in “Item 7. Major Shareholders and Related Party Transactions—B. Related Party Transactions—Transactions Related to the Business Combination,” which information is incorporated herein by reference.
D.Exchange Controls
There are no governmental laws, decrees, regulations or other legislation in the Cayman Islands that may affect the import or export of capital, including the availability of cash and cash equivalents for use by us, or that may affect the remittance of dividends, interest, or other payments by us to non-resident holders of Ordinary Shares. There is no limitation imposed by laws of Cayman Islands or in our governing documents on the right of non-residents to hold or vote Ordinary Shares.
E.Taxation
U.S. Federal Income Tax Considerations
The following is a summary of certain material U.S. federal income tax consequences generally applicable to the ownership and disposition of our Ordinary Shares and Warrants by U.S. Holders (as defined below).
This summary is limited to certain U.S. federal income tax considerations generally relevant to U.S. Holders that hold Ordinary Shares and Warrants, as “capital assets” within the meaning of Section 1221 of the U.S. Internal Revenue Code of 1986, as amended (the “Code”) (generally, property held for investment). This summary does not address the U.S. federal income taxation of U.S. Holders that acquired their Ordinary Shares and Warrants in the SPAC Mergers. This summary also does not address all aspects of U.S. federal income taxation that may be relevant to particular U.S. Holders in light of their individual circumstances or status, including but not limited to:
•our Sponsor or any member, founder, director, or officer, thereof;
•banks, financial institutions or financial services entities;
•broker-dealers or traders in securities or currencies;
•taxpayers that are subject to the mark-to-market tax accounting rules;
•tax-exempt entities including private foundations;
•governments or agencies or instrumentalities thereof;
169
•insurance companies;
•pension plans;
•cooperatives;
•partnerships (or entities or arrangements treated as partnerships for U.S. federal income tax purposes), S corporations, or other pass-through entities or arrangements (or investors therein);
•regulated investment companies;
•real estate investment trusts;
•persons liable for alternative minimum tax;
•expatriates or former long-term residents of the United States;
•persons that actually or constructively own five percent or more of our Ordinary Shares by vote or value;
•persons that acquired Ordinary Shares pursuant to an exercise of employee share options, in connection with employee share incentive plans or otherwise as compensation;
•persons that own Ordinary Shares as part of a straddle, constructive sale, hedging, conversion or other integrated or similar transaction;
•persons that own Ordinary Shares in connection with a trade or business, permanent establishment, or fixed place of business outside the United States; or
•U.S. Holders (as defined below) whose functional currency is not the U.S. dollar.
If a partnership (or any entity or arrangement so characterized for U.S. federal income tax purposes) owns Ordinary Shares or Warrants, the U.S. federal income, tax treatment of such partnership and its partners will generally depend on the status of the partners and the activities of the partnership. Partnerships holding any Ordinary Shares or Warrants and their partners should consult their tax advisers as to the particular U.S. federal income tax consequences of ownership and disposition of Ordinary Shares or Warrants.
This summary is based on the Code, proposed, temporary and final Treasury regulations promulgated under the Code, and judicial and administrative interpretations thereof, all as of the date hereof. All of the foregoing are subject to differing interpretation and subject to change, which differing interpretation or change could apply retroactively and could affect the tax considerations described herein. This summary does not address any estate or gift tax considerations, any alternative minimum tax considerations, Medicare contribution tax considerations, the special tax accounting rules under Section 451(b) of the Code or U.S. federal taxes other than those pertaining to U.S. federal income taxation, nor does it address any aspects of U.S. state, local or non-U.S. taxation.
We have not requested nor will we request any ruling from the U.S. Internal Revenue Service (the “IRS”) regarding any of the U.S. federal income tax considerations described herein. There can be no assurance that the IRS will not take positions that are inconsistent with those discussed below or that any such positions would not be sustained by a court.
As used herein, the term “U.S. Holder” means a beneficial owner of Ordinary Shares or Warrants, as the case may be, who or that is for U.S. federal income tax purposes, (i) a citizen or individual resident of the United States, (ii) a corporation (or other entity that is treated as a corporation for U.S. federal income tax purposes) created or organized in or under the laws of the United States, any state therein or the District of Columbia; (iii) an estate the income of which is subject to U.S. federal income taxation regardless of its source or (iv) a trust if (A) a court within the United States is able to exercise primary supervision over the administration of the trust and one or more “United States persons” (as defined in the Code) have the authority to control all substantial decisions of the trust or (B) the trust has in effect a valid election to be treated as a United States person.
170
THIS SUMMARY DOES NOT PURPORT TO BE A COMPREHENSIVE ANALYSIS OR DESCRIPTION OF ALL POTENTIAL U.S. FEDERAL INCOME TAX CONSEQUENCES OF THE OWNERSHIP AND DISPOSITION OF ORDINARY SHARES OR WARRANTS. U.S. HOLDERS SHOULD CONSULT THEIR TAX ADVISERS REGARDING THEIR PARTICULAR TAX CIRCUMSTANCES, INCLUDING THE APPLICABILITY AND EFFECTS OF U.S. FEDERAL, STATE, LOCAL, AND NON-U.S. TAX LAWS.
Ownership and Disposition of Ordinary Shares or Warrants
Distributions on Ordinary Shares
Subject to the PFIC rules discussed below, a U.S. Holder generally will be required to include in gross income as dividends the amount of any cash distribution paid on Ordinary Shares at the time actually or constructively received to the extent the distribution is paid out of New Lavoro’s current or accumulated earnings and profits (as determined under U.S. federal income tax principles). Such dividends will be taxable to a corporate U.S. Holder at regular corporate tax rates and will not be eligible for the dividends-received deduction generally allowed to domestic corporations in respect of dividends received from other domestic corporations. Subject to the PFIC rules discussed below, distributions in excess of such earnings and profits generally will be applied against and reduce the U.S. Holder’s basis in its Ordinary Shares (but not below zero) and, to the extent in excess of such basis, will be treated as gain from the sale or exchange of such Ordinary Shares. Because New Lavoro may not maintain calculations of earnings and profits under U.S. federal income tax principles, it is expected that the full amount of distributions (if any) paid by New Lavoro will be reported as dividends for U.S. federal income tax purposes.
With respect to non-corporate U.S. Holders, under tax laws currently in effect and subject to the PFIC rules, dividends generally will be taxed at the lower applicable long-term capital gains rate (see “—Gain or Loss on Sale, or Other Taxable Disposition of Ordinary Shares and Warrants”) only if the Ordinary Shares are readily tradable on an established securities market in the United States and certain other requirements are met. U.S. Holders should consult their tax advisors regarding the availability of such lower rate for any dividends paid with respect to the Ordinary Shares.
Gain or Loss on Sale or Other Taxable Disposition of Ordinary Shares and Warrants
Subject to the PFIC rules discussed below, a U.S. Holder generally will recognize capital gain or loss on the sale or other taxable disposition of the Ordinary Shares or Warrants. Any such capital gain or loss generally will be long-term capital gain or loss if the U.S. Holder’s holding period for such Ordinary Shares or Warrants exceeds one year at the time of such disposition.
The amount of gain or loss recognized on a sale or other taxable disposition generally will be equal to the difference between (i) the sum of the amount of cash and the fair market value of any property received in such disposition and (ii) the U.S. Holder’s adjusted tax basis in its Ordinary Shares or Warrants so disposed of. Long-term capital gain realized by a non-corporate U.S. Holder is currently eligible to be taxed at reduced rates. See “—Exercise, Lapse or Redemption of Warrants” below for a discussion regarding a U.S. Holder’s basis in an Ordinary Share acquired pursuant to the exercise of a Warrant. The deductibility of capital losses is subject to certain limitations.
Exercise, Lapse or Redemption of Warrants
Subject to the PFIC rules discussed below, and except as discussed below with respect to the cashless exercise of a Warrant, a U.S. Holder generally will not recognize gain or loss upon the acquisition of an Ordinary Share upon the exercise of a Warrant for cash. A U.S. Holder’s tax basis in an Ordinary Share received upon exercise of the Warrant generally will equal the sum of the U.S. Holder’s tax basis in the Warrant and the exercise price. It is unclear whether a U.S. Holder’s holding period for the Ordinary Share will commence on the date of exercise of the Warrant or the day following the date of exercise of the Warrant; in either case, the holding period will not include the period during which the U.S. Holder held the Warrant. If a Warrant is allowed to lapse unexercised, a U.S. Holder generally will recognize a capital loss equal to such holder’s tax basis in the Warrant. Such capital loss will be long-term capital loss if the U.S. Holder held the Warrant for more than one year at the time of such lapse.
171
The tax consequences of a cashless exercise of a Warrant are not clear under current law. A cashless exercise may not be taxable, either because the exercise is not a realization event or because the exercise is treated as a recapitalization for United States federal income tax purposes. In either situation, a U.S. Holder’s tax basis in the Ordinary Share received generally would equal the U.S. Holder’s tax basis in the Warrants. If the cashless exercise was not treated as a recapitalization (but not a realization event), it is unclear whether a U.S. Holder’s holding period for the Ordinary Share will commence on the date of exercise of the Warrant or the day following the date of exercise of the warrant. If the cashless exercise were treated as a recapitalization, the holding period of the Ordinary Share would include the holding period of the Warrant.
It is also possible that a cashless exercise may be treated in part as a taxable exchange in which gain or loss would be recognized. In such event, a portion of the Warrants to be exercised on a cashless basis could, for U.S. federal income tax purposes, be deemed to have been surrendered in consideration for the exercise price of the remaining Warrants, which would be deemed to be exercised. For this purpose, a U.S. Holder may be deemed to have surrendered Warrants with an aggregate value equal to the exercise price for the total number of Warrants to be deemed exercised. Subject to the PFIC rules discussed below, the U.S. Holder would recognize capital gain or loss in an amount equal to the difference between the fair market value of the Warrants deemed surrendered and the U.S. Holder’s tax basis in such warrants. In this case, a U.S. Holder’s tax basis in the Ordinary Shares received would equal the sum of the U.S. Holder’s tax basis in the Warrants deemed exercised and the exercise price of such Warrants. It is unclear whether a U.S. Holder’s holding period for the Ordinary Shares would commence on the date of exercise of the Warrant or the day following the date of exercise of the Warrant.
Due to the absence of authority on the United States federal income tax treatment of a cashless exercise, there can be no assurance which, if any, of the alternative tax consequences and holding periods described above would be adopted by the IRS or a court of law. Accordingly, U.S. Holders should consult their tax advisors regarding the tax consequences of a cashless exercise.
Possible Constructive Distributions
The terms of the Warrants provide for an adjustment to the number of Ordinary Shares for which the warrant may be exercised or to the exercise price of the warrant in certain events. An adjustment which has the effect of preventing dilution generally is not taxable. U.S. Holders of Warrants would, however, be treated as receiving a constructive distribution from New Lavoro if, for example, the adjustment increases the warrantholders’ proportionate interest in New Lavoro’s assets or earnings and profits (e.g., through an increase in the number of Ordinary Shares that would be obtained upon exercise) as a result of a distribution of cash to the holders of Ordinary Shares which is taxable to the U.S. Holders of such Ordinary Shares as described under “—Distributions on Ordinary Shares.” Such constructive distribution would be subject to tax as described under that section in the same manner as if the U.S. Holders of the Warrants received a cash distribution from New Lavoro equal to the fair market value of the increase in the interest. U.S. Holders should consult their tax advisors regarding the tax consequences in their particular circumstances, including the possibility of any constructive distributions.
Passive Foreign Investment Company Rules
The treatment of a U.S. Holder of Ordinary Shares and Warrants could be materially different from that described above if New Lavoro is or was treated as a PFIC for U.S. federal income tax purposes.
In general, a non-U.S. corporation is a PFIC for U.S. federal income tax purposes for any taxable year in which (i) 50% or more of the value of its assets (generally determined on the basis of a quarterly average) consists of assets that produce, or are held for the production of, passive income, or (ii) 75% or more of its gross income consists of passive income. Passive income generally includes dividends, interest, certain royalties and rents, and gains from the disposition of passive assets. Cash and cash equivalents are passive assets. The value of goodwill will generally be treated as an active or passive asset based on the nature of the income produced in the activity to which the goodwill is attributable. For purposes of the PFIC rules, a non-U.S. corporation that owns, directly or indirectly, at least 25% by value of the stock of another corporation is treated as if it held its proportionate share of the assets of the other corporation, and received directly its proportionate share of the income of the other corporation.
Based on the expected composition of New Lavoro’s income and assets and the estimated value of New Lavoro’s assets, New Lavoro does not believe they were a PFIC for the taxable year ending June 30, 2023.
172
However, because New Lavoro’s PFIC status for any taxable year is an annual determination that can be made only after the end of that year and will depend on the composition of New Lavoro’s income and assets and the value of its assets from time to time (including the value of its goodwill, which may be determined in large part by reference to the market price of the Ordinary Shares from time to time, which could be volatile), there can be no assurances New Lavoro will not be a PFIC for its taxable year ending June 30, 2023, or any future taxable year.
If New Lavoro is a PFIC for any taxable year during which a U.S. person owns Ordinary Shares and any entity in which it owns equity interests is also a PFIC (a “Lower-tier PFIC”), the U.S. Holder will be deemed to own their proportionate amount (by value) of the shares of each Lower-tier PFIC and will be subject to U.S. federal income tax on (i) certain distributions by a Lower-tier PFIC and (ii) dispositions of shares of Lower-tier PFICs, in each case, as if the U.S. Holder held such shares directly, even though the U.S. Holder will not receive any proceeds of those distributions or dispositions.
If New Lavoro is a PFIC for any taxable year (or portion thereof) that is included in the holding period of a U.S. Holder of Ordinary Shares, gain recognized by the U.S. Holder on a sale or other disposition (including certain pledges) of its Ordinary Shares will be allocated ratably over the U.S. Holder’s holding period for such Ordinary Shares. The amounts allocated to the taxable year of the sale or disposition and to any year before New Lavoro became a PFIC will be taxed as ordinary income. The amount allocated to each other taxable year will be subject to tax at the highest rate in effect for individuals or corporations, as applicable, for that taxable year, and an interest charge will be imposed on the resulting tax liability for each such year. Furthermore, to the extent that distributions received by a U.S. Holder in any taxable year on its Ordinary Shares exceed 125% of the average of the annual distributions on the Ordinary Shares received during the preceding three taxable years or the U.S. Holder’s holding period, whichever is shorter, the excess distributions will be subject to taxation in the same manner. The foregoing PFIC tax consequences are referred to as the “PFIC Default Regime.”
Alternatively, if New Lavoro is a PFIC and if the Ordinary Shares are “regularly traded” on a “qualified exchange,” a U.S. Holder could avoid the PFIC Default Regime by making a mark-to-market election. The Ordinary Shares will be treated as regularly traded for any calendar year in which more than a de minimis quantity of the Ordinary Shares are traded on a qualified exchange on at least 15 days during each calendar quarter. Nasdaq, where the Ordinary Shares are listed, is a qualified exchange for this purpose. If a U.S. Holder of Ordinary Shares makes the mark-to-market election, the U.S. Holder generally will recognize as ordinary income any excess of the fair market value of the Ordinary Shares at the end of each taxable year over their adjusted tax basis, and will recognize an ordinary loss in respect of any excess of the adjusted tax basis of the Ordinary Shares over their fair market value at the end of the taxable year, but only to the extent of the net amount of income previously included as a result of the mark-to-market election. If a U.S. Holder makes the mark-to-market election, the U.S. Holder’s tax basis in the Ordinary Shares will be adjusted to reflect the income or loss amounts recognized. Any gain recognized on the sale or other disposition of Ordinary Shares in a year in which we are a PFIC will be treated as ordinary income and any loss will be treated as an ordinary loss (but only to the extent of the net amount of income previously included as a result of the mark-to-market election, with any excess treated as capital loss). If a U.S. Holder makes the mark-to-market election, distributions paid on Ordinary Shares will be treated as discussed under “—Distributions on Ordinary Shares” above. U.S. Holders should consult their tax advisers regarding the availability and advisability of making a mark-to-market election in their particular circumstances. U.S. Holders should note that there is no provision in the Code, Treasury regulations or other official IRS guidance that would give them the right to make a mark-to-market election with respect to any Lower-tier PFIC, the shares of which are not regularly traded, and, therefore, the general rules applicable to ownership of a PFIC described above could continue to apply to a U.S. Holder with respect to any Lower-tier PFIC of New Lavoro, even if the U.S. Holder made a mark-to-market election with respect to the Ordinary Shares. A mark-to-market election may not be made with respect to the Warrants.
New Lavoro intends to provide the information necessary for a U.S. Holder to make and maintain a “qualified electing fund” election with respect to Ordinary Shares for the taxable year ending June 30, 2023 and the following taxable year if New Lavoro determines that it is a PFIC for such year but may not make such information available for any subsequent year.
If New Lavoro is a PFIC for any taxable year during which a U.S. Holder owns (or is deemed to own) any Ordinary Shares, subject to certain limited exceptions set forth in applicable Treasury regulations, the U.S. Holder will be required to file annual reports with the IRS with respect to New Lavoro and any Lower-tier PFIC. U.S.
173
Holders should consult their tax advisers regarding the determination of whether New Lavoro is a PFIC for any taxable year and the potential application of the PFIC rules to their ownership of Ordinary Shares.
Information Reporting and Backup Withholding
Dividend payments with respect to Ordinary Shares and proceeds from the sale, exchange or redemption of Ordinary Shares or Warrants may be subject to information reporting to the IRS and possible United States backup withholding. Backup withholding will not apply, however, to a U.S. Holder who furnishes a correct taxpayer identification number and makes other required certifications, or who is otherwise exempt from backup withholding and establishes such exempt status. U.S. Holders who are required to establish their exempt status may be required to provide such certification on IRS Form W-9.
Backup withholding is not an additional tax. Amounts withheld as backup withholding may be credited against a U.S. Holder’s United States federal income tax liability, and a U.S. Holder generally may obtain a refund of any excess amounts withheld under the backup withholding rules by timely filing the appropriate claim for refund with the IRS and furnishing any required information. U.S. Holders are urged to consult their own tax advisors regarding the application of backup withholding and the availability of and procedure for obtaining an exemption from backup withholding in their particular circumstances.
The U.S. federal income tax discussion set forth above is included for general information only and may not be applicable depending upon a holder’s particular situation. U.S. Holders are urged to consult their tax advisors with respect to the tax consequences to them of the ownership and disposition of Ordinary Shares and Warrants and the exercise of their redemption rights, including the tax consequences under state, local, estate, non-U.S. and other tax laws and tax treaties and the possible effects of changes in U.S. or other tax laws.
Cayman Islands Tax Considerations
The following summary contains a description of certain Cayman Islands income tax consequences of the acquisition, ownership and disposition of Ordinary Shares, but it does not purport to be a comprehensive description of all the tax considerations that may be relevant to a decision to purchase Ordinary Shares. The summary is based upon the tax laws of Cayman Islands and regulations thereunder as of the date hereof, which are subject to change.
Prospective investors should consult their professional advisers on the possible tax consequences of buying, holding or selling any shares under the laws of their country of citizenship, residence or domicile.
The following is a discussion on certain Cayman Islands income tax consequences of an investment in the Ordinary Shares. The discussion is a general summary of present law, which is subject to prospective and retroactive change. It is not intended as tax advice, does not consider any investor’s particular circumstances, and does not consider tax consequences other than those arising under Cayman Islands law.
Under Existing Cayman Islands Laws:
Payments of dividends and capital in respect of Ordinary Shares will not be subject to taxation in the Cayman Islands and no withholding will be required on the payment of interest and principal or a dividend or capital to any holder of Ordinary Shares, as the case may be, nor will gains derived from the disposal of the Ordinary Shares be subject to Cayman Islands income or corporation tax. The Cayman Islands currently have no income, corporation or capital gains tax and no estate duty, inheritance tax or gift tax.
No stamp duty is payable in respect of the issue of Ordinary Shares or on an instrument of transfer in respect of Ordinary Shares.
We have been incorporated under the laws of the Cayman Islands as an exempted company with limited liability and, as such, have obtained an undertaking from the Governor in Cabinet of the Cayman Islands in the following form:
174
The Tax Concessions Law
Undertaking as to Tax Concessions
In accordance with section 6 of the Tax Concessions Act (As Revised) of the Cayman Islands, the Governor in Cabinet of the Cayman Islands has undertaken with the Company that:
(a)no law which is thereafter enacted in the Cayman Islands imposing any tax to be levied on profits, income, gains or appreciations shall apply to the Company or its operations; and
(b)in addition, that no tax to be levied on profits, income, gains or appreciations or which is in the nature of estate duty or inheritance tax shall be payable:
(i)on or in respect of the shares, debentures or other obligations of the Company; or
(ii)by way of the withholding in whole or in part of any relevant payment as defined in the Tax Concessions Act.
The concessions apply for a period of twenty years from August 29, 2022.
The Cayman Islands currently levy no taxes on individuals or corporations based upon profits, income, gains or appreciations and there is no taxation in the nature of inheritance tax or estate duty. There are no other taxes likely to be material to the Company levied by the Government of the Cayman Islands save certain stamp duties which may be applicable, from time to time, on certain instruments executed in or brought within the jurisdiction of the Cayman Islands.
F.Dividends and Paying Agents
Not applicable.
G.Statement by Experts
Not applicable.
H.Documents on Display
We are subject to certain of the informational filing requirements of the Exchange Act. Since we are a “foreign private issuer,” we are exempt from the rules and regulations under the Exchange Act prescribing the furnishing and content of proxy statements, and our officers, directors and principal shareholders are exempt from the reporting and “short-swing” profit recovery provisions contained in Section 16 of the Exchange Act, with respect to their purchase and sale of our shares. In addition, we are not required to file reports and financial statements with the SEC as frequently or as promptly as U.S. companies whose securities are registered under the Exchange Act. However, we are required to file with the SEC an annual report on Form 20-F containing financial statements audited by an independent accounting firm. We may, but are not required, to furnish to the SEC, on Form 6-K, unaudited financial information after each of our first three fiscal quarters. The SEC also maintains a website at http://www.sec.gov that contains reports and other information that we file with or furnish electronically with the SEC. You may read and copy any report or document we file, including the exhibits, at the SEC’s public reference room located at 100 F Street, N.E., Washington, D.C. 20549. Please call the SEC at 1-800-SEC-0330 for further information on the public reference room.
I.Subsidiary Information
Not applicable.
J.Annual Report to Security Holders
Not applicable.
175
Item 11. Quantitative and Qualitative Disclosures About Market Risk
We are exposed to market risks in the ordinary course of our business, including the effects of credit, interest rate, capital and liquidity risks. Information relating to quantitative and qualitative disclosures about these market risks is described below and in note 8 to our audited consolidated financial statements included elsewhere in this annual report.
Credit Risk
Credit risk is the risk of financial losses if our customers or a counterparty to a financial instrument fails to fulfill its contractual obligations, which arise mainly from our receivables. We maintain short-term investments with financial institutions approved by our management according to objective criteria for diversification of risks.
We seek to mitigate our credit risk related to trade receivables by setting forth credit limits for each counterparty based on the analysis of our credit management area. Such credit exposure determination is performed considering the qualitative and quantitative information of each counterparty. We also focus on the diversification of our portfolio and monitor different solvency and liquidity indicators of the counterparties that were previously approved. In addition, primarily for receivables in installments, we monitor the risk by granting credit and by constantly analyzing the balances of allowances for expected credit losses (see notes 6 and 8 to our audited consolidated financial statements).
Our primary strategies to mitigate credit risk include:
•creating credit approval policies and procedures for new and existing customers;
•extending credit to qualified customers:
◦through a review of credit agency reports, financial statements and/or credit references, when available;
◦through a review of existing customer accounts every 12 months based on individual credit limits;
◦by evaluating customer and regional risks;
◦by obtaining guarantees through the endorsement of CPRs, which give physical ownership of the relevant agricultural goods in the event of the customer’s default;
•setting up provisions using the lifetime expected credit loss method considering all possible default events over the expected life of a financial instrument. Receivables are categorized based on the number of overdue days and/or a customer’s credit risk profile. Estimated losses on receivables are based on known troubled accounts and historical losses. Receivables are considered to be in default and are written off against the allowance for credit losses when it is probable that all remaining contractual payments due will not be collected in accordance with the terms of the respective contractual agreement;
•requiring minimum acceptable counterparty credit ratings from financial counterparties;
•setting limits for counterparties or credit exposure; and
•developing relationships with investment-grade counterparties.
176
The table below presents our maximum exposure to credit risk as of the dates presented:
| As of June 30, | |||||||||||||||||||||||
| 2023 | 2023 | 2022 | 2021 | ||||||||||||||||||||
| (US$ millions(1)) | (R$ millions) | ||||||||||||||||||||||
Trade receivables (current and non-current) | 562.0 | 2,708.5 | 1,834.4 | 1,467.2 | |||||||||||||||||||
Advances to suppliers | 39.9 | 192.1 | 383.3 | 442.4 | |||||||||||||||||||
Total | 601.9 | 2,900.6 | 2,217.7 | 1,909.6 | |||||||||||||||||||
________________
(1)For convenience purposes only, amounts in reais have been translated to U.S. dollars using an exchange rate of R$4.8192 to US$1.00, the commercial selling rate for U.S. dollars as of June 30, 2023, as reported by the Central Bank. These translations should not be considered representations that any such amounts have been, could have been or could be converted at that or any other exchange rate. See “Item 3. Key Information—D. Risk Factors—Risks Relating to Latin America—Exchange rate instability may impact our ability to hedge exchange rate risk, which may lead to interest rate volatility and have a material adverse effect on the price of our Ordinary Shares.”
Liquidity Risk
We define liquidity risk as the risk that we may have difficulty in complying with our obligations associated with financial liabilities that are settled in cash or other financial assets. Our approach to managing this risk is to ensure that we have sufficient liquidity to settle our obligations without incurring losses or affecting our operations. Our management is ultimately responsible for managing our liquidity risk, which relies on a liquidity risk management model to manage funding requirements and liquidity in the short, medium and long terms.
Our cash position is monitored by our senior management through management reports and periodic performance meetings. We also manage our liquidity risk by maintaining reserves, bank credit facilities and other borrowing facilities deemed appropriate, through ongoing monitoring of forecast and actual cash flows, as well as through the combination of maturity profiles of financial assets and liabilities. For additional information on the outstanding contractual maturities of our non-derivative financial liabilities and contractual repayment terms, see notes 7 and 8 to our audited consolidated financial statements included elsewhere in this annual report.
For more information on liquidity, see “Item 5. Operating and Financial Review and Prospects—B. Liquidity and Capital Resources—Tabular Disclosure of Contractual Obligations.”
Capital Risk
We manage our capital to ensure our ability to continue as a going concern and at the same time maximize the return of stakeholders by optimizing the balances of debt and equity. We further monitor our significant capital risk indicators, such as our Net Debt (Net Cash) and our Net Debt (Net Cash)/Adjusted EBITDA Ratio. Our strategy is to maintain a Net Debt (Net Cash)/Adjusted EBITDA Ratio of up to 2.2x.
For further information on Net Debt (Net Cash) and Net Debt (Net Cash)/Adjusted EBITDA Ratio, see “Presentation of Financial and Other Information—Special Note Regarding Non-IFRS Financial Measures—Net Debt (Net Cash) and Net Debt (Net Cash)/Adjusted EBITDA Ratio.” In addition, see “Item 5. Operating and Financial Review and Prospects—A. Operating Results—Non-IFRS Financial Measures and Reconciliations” for a reconciliation of our Net Debt (Net Cash) and Net Debt (Net Cash)/Adjusted EBITDA Ratio to our borrowings.
Interest Rate Risk
Our interest rates on financial investments are primarily linked to the CDI Rate, the DTF Rate and the IBR Rate, with conditions, rates and terms compatible with those of similar transactions carried out in the market. Fluctuations in interest rates, such as the CDI Rate, the DTF Rate and the IBR Rate, may have an effect on the cost of our borrowings and new borrowings. We periodically monitor the effects of market changes in interest rates on our financial instruments portfolio. Funds raised by us are used to finance working capital for each crop season and are substantially raised at short-term conditions.
As of June 30, 2023 and 2022, we had no derivative financial instruments used to mitigate interest rate risk. To mitigate our exposure to interest rate risk, we use different scenarios to evaluate the sensitivity of variations in
177
transactions impacted by the CDI Rate, the DTF Rate and the IBR Rate. The “probable” scenario below represents the impact on booked amounts considering the most current CDI Rate, DTF Rate and the IBR Rate (as of July 2023, for figures as of June 30, 2023, and as of July 2022, for figures as of June 30, 2022, respectively) and reflects management’s best estimates. The other scenarios consider an appreciation of 25% and 50% in such market interest rates before taxes, which represents a significant change in the probable scenario for sensitivity purposes:
| As of June 30, 2023 | |||||||||||||||||||||||
| Current Index | Probable | Possible(1) | Remote(2) | ||||||||||||||||||||
| (in R$ millions) | |||||||||||||||||||||||
Floating rate borrowings in Brazil | CDI Rate (12.65%) | 149.1 | 177.2 | 205.2 | |||||||||||||||||||
Floating rate borrowings in Colombia | IBR Rate (12.75%) | 11.5 | 13.7 | 15.9 | |||||||||||||||||||
Total | 160.6 | 190.9 | 221.1 | ||||||||||||||||||||
_______________
(1)Considers a 25% appreciation in the CDI Rate and the IBR Rate.
(2)Considers a 50% appreciation in the CDI Rate and the IBR Rate.
| As of June 30, 2022 | |||||||||||||||||||||||
| Current Index | Probable | Possible(1) | Remote(2) | ||||||||||||||||||||
| (in R$ millions) | |||||||||||||||||||||||
Floating rate borrowings in Brazil | CDI Rate (13.15%) | 114.1 | 22.7 | 45.4 | |||||||||||||||||||
Floating rate borrowings in Colombia | DTF Rate (7.72%) | 3.9 | 1.4 | 2.2 | |||||||||||||||||||
Total | 118.0 | 24.1 | 47.6 | ||||||||||||||||||||
_______________
(1)Considers a 25% appreciation in the CDI Rate and the DTF Rate.
(2)Considers a 50% appreciation in the CDI Rate and the DTF Rate.
Exchange Rate Risk
We are exposed to foreign exchange risk arising from our operations and to exposure to the U.S. dollar, which significantly impacts global prices of agricultural inputs in general. Although all purchases and sales of agricultural inputs are conducted locally, certain purchase and sale contracts are indexed to the U.S. dollar.
Our current commercial policy seeks to reduce this exposure. Our marketing department is responsible for managing pricing tables and commercial strategies to seek a natural hedge between purchases and sales and to match currency and terms to the greatest extent possible. Our corporate treasury department is responsible for monitoring the forecasted cash flow exposure to the U.S. dollar, and whenever any mismatches as to terms and currencies are identified, non-deliverable forward derivative financial instruments are purchased to offset these exposures, and fulfill internal policy requirements. Management is made by macro hedging through the analysis of the forecasted cash flow for the next two harvests.
To mitigate our exposure to exchange rate risk, we use different scenarios to evaluate our asset and liability positions in foreign currency and their potential effects on our results. The “probable” scenario below represents the impact on carrying amounts of the most current market rates for the U.S. dollar (R$4.7362 to US$ 1.00, for figures as of June 30, 2023, R$5.2570 to US$1.00, for figures as of June 30, 2022). This analysis assumes that all other variables, particularly interest rates, remain constant. The other scenarios consider the appreciation of the Brazilian
178
real against the U.S. dollar at the rates of 25% and 50% before taxes, which represents a significant change in the probable scenario for sensitivity purposes:
| As of June 30, 2023 | |||||||||||||||||||||||
| Effect of Profit or Loss | |||||||||||||||||||||||
| Current Index | Probable | Possible(1) | Remote(2) | ||||||||||||||||||||
| (in R$ millions) | |||||||||||||||||||||||
Trade receivables in U.S. dollars | R$ | 4.74 | (3.7) | 49.0 | 101.7 | ||||||||||||||||||
Trade payables in U.S. dollars | R$ | 4.74 | 5.7 | (76.2) | (158.2) | ||||||||||||||||||
Borrowings in U.S. dollars | R$ | 4.74 | (2.8) | 36.5 | 75.8 | ||||||||||||||||||
Net impacts on commercial operations | (0.7) | 9.2 | 19.2 | ||||||||||||||||||||
Derivative financial instruments | R$ | 4.74 | 0.6 | (8.6) | (17.8) | ||||||||||||||||||
Total impact, net of derivatives | (0.1) | 0.7 | 1.4 | ||||||||||||||||||||
_______________
(1)Considers a 25% appreciation of the Brazilian real against the U.S. dollar (before taxes).
(2)Considers a 50% appreciation of the Brazilian real against the U.S. dollar (before taxes).
| As of June 30, 2022 | |||||||||||||||||||||||
| Effect of Profit or Loss | |||||||||||||||||||||||
| Current Index | Probable | Possible(1) | Remote(2) | ||||||||||||||||||||
| (in R$ millions) | |||||||||||||||||||||||
Trade receivables in U.S. dollars | R$ | 5.26 | 5.1 | 71.9 | 138.7 | ||||||||||||||||||
Trade payables in U.S. dollars | R$ | 5.26 | (4.9) | (69.6) | (134.2) | ||||||||||||||||||
Borrowings in U.S. Dollars | R$ | 5.26 | (2.8) | (40.0) | (77.1) | ||||||||||||||||||
Net impacts on commercial operations | (2.7) | (37.6) | (72.6) | ||||||||||||||||||||
Derivative financial instruments | R$ | 5.26 | — | 0.1 | 0.3 | ||||||||||||||||||
Total impact, net of derivatives | (2.7) | (37.5) | (72.3) | ||||||||||||||||||||
_______________
(1)Considers a 25% appreciation of the Brazilian real against the U.S. dollar (before taxes).
(2)Considers a 50% appreciation of the Brazilian real against the U.S. dollar (before taxes).
Commodity Price Risk in Barter Transactions
In all of our barter transactions, we use future commodity market prices as the reference to value the quantities of commodities included in the forward contracts to be delivered by the customers as payment for our products. We use prices quoted by commodity trading companies to value the grain purchase contracts from farmers. Immediately thereafter, we enter into grain sale contracts to sell those same grains to trading companies, at the same price of the purchase contracts we enter into with farmers. As such, we manage our exposure to those commodity prices by entering into the purchase and sale contracts at similar conditions. These transactions are conducted by a corporate department which manages and controls such contracts as well as our compliance with our policies.
To mitigate our exposure to commodity price risk, we use different scenarios to evaluate our asset and liability positions on forward contracts in soybean and corn and their potential effects on our results. The “probable” scenario below represents the impact on carrying amounts as of June 30, 2023 and June 30, 2022, with assumptions described in note 11 to our audited consolidated financial statements. The other scenarios consider the appreciation of our
179
main assumptions at the rates of 25% and 50% before taxes, which represents a significant change in the probable scenario for sensitivity purposes:
| As of June 30, 2023 | |||||||||||||||||||||||||||||||||||||||||||||||||||||
| ‘+25%current | ‘+50% current | ||||||||||||||||||||||||||||||||||||||||||||||||||||
| Tons | Position | Current Risk (i) | Average of contract prices | Current Market (R$/bag) | Market | Impact | Market | Impact | |||||||||||||||||||||||||||||||||||||||||||||
| (in R$ thousands, except as otherwise indicated) | |||||||||||||||||||||||||||||||||||||||||||||||||||||
Position | |||||||||||||||||||||||||||||||||||||||||||||||||||||
Corn 2023 | 248,796 | Purchased | (140,542) | 67.42 | 35.34 | 44.18 | (35,136) | 53.01 | (70,271) | ||||||||||||||||||||||||||||||||||||||||||||
Corn 2023 | (248,999) | Sold | 54,190 | 48.39 | 34.96 | 43.70 | 13,548 | 52.44 | 27,095 | ||||||||||||||||||||||||||||||||||||||||||||
Soybean 2024 | 449,847 | Purchased | (634) | 127.86 | 127.95 | 159.94 | (159) | 191.93 | (317) | ||||||||||||||||||||||||||||||||||||||||||||
Soybean 2024 | (145,915) | Sold | 4,449 | 143.80 | 145.71 | 182.14 | 1,112 | 218.57 | 2,225 | ||||||||||||||||||||||||||||||||||||||||||||
Corn 2024 | 54,433 | Purchased | (9,499) | 55.35 | 43.11 | 53.89 | (2,375) | 64.67 | (4,750) | ||||||||||||||||||||||||||||||||||||||||||||
Corn 2024 | (6,500) | Sold | (170) | 47.44 | 49.28 | 61.60 | (43) | 73.92 | (85) | ||||||||||||||||||||||||||||||||||||||||||||
Net exposure on grain contracts | 351,662 | (92,206) | (23,053) | (46,103) | |||||||||||||||||||||||||||||||||||||||||||||||||
Soybean 2024 | (319,271) | Sold on derivatives | (2,761) | 13.25 | 16.56 | (690) | 19.86 | (1,377) | |||||||||||||||||||||||||||||||||||||||||||||
Corn 2024 | (55,645) | Sold on derivatives | 11,598 | 60.24 | 75.30 | 2,900 | 90.36 | 5,799 | |||||||||||||||||||||||||||||||||||||||||||||
Net exposure on derivative | (374,917) | 8,837 | 2,210 | 4,422 | |||||||||||||||||||||||||||||||||||||||||||||||||
Net exposure | (23,255) | (83,369) | (20,843) | (41,681) | |||||||||||||||||||||||||||||||||||||||||||||||||
_______________
(i)The mismatch on current fair value of Commodity forward contracts for Corn 2023 is related to derivatives contracts that were settled in advance for cash management purposes resulting in an income of R$ 80,990 recognized as finance income.
| As of June 30, 2022 | |||||||||||||||||||||||||||||||||||||||||||||||
| Possible(1) | Remote(2) | ||||||||||||||||||||||||||||||||||||||||||||||
| Tons | Position | Current Risk | Current Market (R$) | Market (R$) | Impact | Market (R$) | Impact | ||||||||||||||||||||||||||||||||||||||||
| (in R$ thousands, except as otherwise indicated) | |||||||||||||||||||||||||||||||||||||||||||||||
Position | |||||||||||||||||||||||||||||||||||||||||||||||
Soybean 2022 | 104 | Purchased | 23 | 16.75 | 20.94 | 6 | 25.13 | 12 | |||||||||||||||||||||||||||||||||||||||
Soybean 2022 | 804 | Sold | (61) | 16.75 | 20.94 | (15) | 25.13 | (31) | |||||||||||||||||||||||||||||||||||||||
Corn 2022 | 66,038 | Purchased | (1,562) | 87.29 | 109.11 | (391) | 130.94 | (781) | |||||||||||||||||||||||||||||||||||||||
Corn 2022 | 65,438 | Sold | 3,447 | 87.29 | 109.11 | 862 | 130.94 | 1723 | |||||||||||||||||||||||||||||||||||||||
Soybean 2023 | 80,465 | Purchased | 10,461 | 14.53 | 18.17 | 2,615 | 21.80 | 5,230 | |||||||||||||||||||||||||||||||||||||||
Soybean 2023 | 69,387 | Sold | (9,480) | 14.53 | 18.17 | (2,370) | 21.80 | (4,740) | |||||||||||||||||||||||||||||||||||||||
Corn 2023 | 115,438 | Purchased | (8,672) | 86.75 | 108.44 | (2,168) | 130.13 | (4,336) | |||||||||||||||||||||||||||||||||||||||
Corn 2023 | 48,626 | Sold | 10,797 | 86.75 | 108.44 | 2699 | 130.13 | 5,398 | |||||||||||||||||||||||||||||||||||||||
Soybean 2024 | 450 | Purchased | 234 | 13.28 | 16.60 | 58 | 19.92 | 117 | |||||||||||||||||||||||||||||||||||||||
Soybean 2025 | 180 | Purchased | 260 | 13.28 | 16.60 | 65 | 19.92 | 130 | |||||||||||||||||||||||||||||||||||||||
Soybean 2026 | 180 | Purchased | 314 | 13.28 | 16.60 | 79 | 19.92 | 157 | |||||||||||||||||||||||||||||||||||||||
Net exposure | 5,761 | 1,440 | 2,879 | ||||||||||||||||||||||||||||||||||||||||||||
_______________
(1)Considers a 25% appreciation in carrying amounts.
(2)Considers a 50% appreciation in carrying amounts.
Item 12. Description of Securities Other Than Equity Securities
A.Debt Securities
Not applicable.
180
B.Warrants and Rights
Warrants
As of June 30, 2023, there are 6,012,085 Public Warrants outstanding. Public Warrants, which entitle the holder to purchase one Ordinary Share at an exercise price of US$11.50 per share, became exercisable on March 30, 2023, which was 30 days after the completion of the Business Combination. Public Warrants will expire on February 28, 2028 (i.e., five years after the completion of the Business Combination) or earlier upon redemption or liquidation in accordance with their terms. Upon the completion of the Business Combination, there were also 4,071,507 Private Placement Warrants held by the Sponsor. The Private Placement Warrants are identical to the Public Warrants in all material respects, except that the Private Placement Warrants, so long as they are held by the Sponsor or its permitted transferees, (i) will not be redeemable by the Company, (ii) could not, subject to certain limited exceptions, be transferred, assigned or sold by the holders until March 30, 2023, which was 30 days after the completion of the Business Combination, (iii) may be exercised by the holders on a cashless basis and (iv) are entitled to registration rights.
C.Other Securities
Not applicable.
D.American Depositary Shares
Not applicable
181
PART II
Item 13. Defaults, Dividend Arrearages and Delinquencies
None.
Item 14. Material Modifications to the Rights of Security Holders and Use of Proceeds
None.
Item 15. Controls and Procedures
(a)Disclosure Controls and Procedures
We have evaluated, with the participation of our chief executive officer and chief financial officer, the effectiveness of our disclosure controls and procedures as of June 30, 2023. There are inherent limitations to the effectiveness of any system of disclosure controls and procedures, including the possibility of human error and the circumvention or overriding of the controls and procedures. Accordingly, even effective disclosure controls and procedures can only provide reasonable assurance of achieving their control objectives. Based upon our evaluation, our chief executive officer and chief financial officer concluded that our disclosure controls and procedures were ineffective as of June 30, 2023, due to the material weaknesses mentioned in “Item 3. Key Information—D. Risk Factors—Risks Relating to Our Business and Industry—We and our independent registered public accounting firm have identified material weaknesses in our internal control over financial reporting and, if we fail to implement and maintain effective internal controls over financial reporting, we may be unable to accurately report our results of operations, meet our reporting obligations or prevent fraud.” and “Item 5. Operating and Financial Review and Prospects—A. Operating Results—Material Weakness in Internal Controls and Remediation.” Notwithstanding such material weaknesses, the chief executive officer and chief financial officer have concluded that the Company’s consolidated financial statements as of June 30, 2023 were fairly stated in all material respects in accordance with IFRS for each of the years presented.
(b)Management’s Annual Report on Internal Control over Financial Reporting
This annual report does not include a report of management’s assessment regarding internal control over financial reporting due to a transition period established by the rules of the SEC for newly public companies.
(c)Attestation Report of the Registered Public Accounting Firm
This annual report does not include an attestation report of the Company’s registered public accounting firm regarding internal control over financial reporting due to a transition period established by the rules of the SEC for newly public companies.
(d)Changes in Internal Control over Financial Reporting
Except as described in “Item 3. Key Information—D. Risk Factors—Risks Relating to Our Business and Industry—We and our independent registered public accounting firm have identified material weaknesses in our internal control over financial reporting and, if we fail to implement and maintain effective internal controls over financial reporting, we may be unable to accurately report our results of operations, meet our reporting obligations or prevent fraud.” and “Item 5. Operating and Financial Review and Prospects—A. Operating Results—Material Weakness in Internal Controls and Remediation,” there were no changes in our internal controls over financial reporting that occurred during the period covered by this annual report on Form 20-F that have materially affected, or are reasonably likely to materially affect, our internal control over financial reporting.
Item 16. Reserved.
Item 16A. Audit Committee Financial Expert
Our audit committee consists of Michael Stern, Lauren StClair and Eduardo Daher, with Lauren StClair serving as Chairperson. Our board of directors has determined that each of Michael Stern, Lauren StClair and Eduardo
182
Daher meet the requirements for independence under the listing standards of Nasdaq and SEC rules and regulations. Each member of our audit committee also meets the financial literacy and sophistication requirements of the listing standards of Nasdaq. In addition, our board of directors has determined that Lauren StClair is an audit committee financial expert within the meaning of Item 407(d) of Regulation S-K under the Securities Act. For more information, see “Item 6. Directors, Senior Management and Employees—A. Directors and Senior Management—Committees of the Board of Directors—Audit Committee”
Item 16B. Code of Ethics
Our board of directors adopted a code of business conduct and ethics that applies to all of our employees, officers and directors, including our chief executive officer, chief financial officer, and other executive and senior financial officers. The full text of our code of business conduct and ethics is posted on the investor relations page on our website at https://ir.lavoroagro.com/ and is attached as an exhibit to this annual report. We intend to disclose any amendments to our code of business conduct and ethics, or waivers of its requirements, on our website or in public filings. The information on our website is not incorporated by reference into this annual report, and you should not consider the information contained on our website to be a part of this annual report.
Item 16C. Principal Accountant Fees and Services
The following table describes the total amount billed to us by Ernst & Young Auditores Independentes S/S Ltda. for services performed during the fiscal years ended June 30, 2023 and 2022:
| For the Fiscal Year Ended June 30, | |||||||||||
| 2023 | 2022 | ||||||||||
(in thousands of reais) | |||||||||||
Audit fees | 6,278.7 | 8,507.3 | |||||||||
Audit-related fees | 508.7 | 2,308.7 | |||||||||
Tax fees | — | — | |||||||||
All other fees | 2,132.8 | 2,016.7 | |||||||||
Total consolidated audit fees | 8,920.2 | 12,832.7 | |||||||||
Audit fees are fees billed for the audit of our annual financial statements and for the reviews of our quarterly financial statements furnished on Form 6-K. Audit related fees correspond to services provided in connection with assistance related to review of documents to be filed with local and foreign regulatory bodies, including documents regarding compliance with legislation and regulations, audit of specific financial statements and annual report review, due diligence activities, assurance of special purpose reports, and other previously agreed-upon procedures. Tax fees correspond for the aggregate fees billed for professional services rendered by the principal accountant for tax compliance, tax advice, and tax planning. “All other fees” comprises the aggregate fees billed for products and services provided by the principal accountant, other than the services reported in the previous items
Our audit committee approves all audit, audit-related services, tax services and other services provided by our principal accountants. Any services provided by our principal accountants that are not specifically included within the scope of the audit must be pre-approved by the board of directors in advance of any engagement. The board of directors is permitted to approve certain fees for audit-related services, tax services and other services pursuant to a de minimis exception prior to the completion of the audit engagement.
Item 16D. Exemptions from the Listing Standards for Audit Committees
See “Item 6. Directors, Senior Management and Employees—C. Board practices—Foreign Private Issuer Status.”
Item 16E. Purchases of Equity Securities by the Issuer and Affiliated Purchasers
None.
183
Item 16F. Change in Registrant’s Certifying Accountant
Not applicable.
Item 16G. Corporate Governance
Nasdaq listing rules include certain accommodations in the corporate governance requirements that allow foreign private issuers, such as us, to follow “home country” corporate governance practices in lieu of the otherwise applicable corporate governance standards of Nasdaq. The application of such exceptions requires that we disclose each Nasdaq corporate governance standard that we do not follow and describe the Cayman Islands corporate governance practices we do follow in lieu of the relevant Nasdaq corporate governance standard. We currently follow Cayman Islands corporate governance practices in lieu of the corporate governance requirements of Nasdaq in respect of the following:
•the majority independent director requirement under Section 5605(b)(1) of Nasdaq listing rules;
•the requirement under Section 5605(d) of Nasdaq listing rules that a compensation committee comprised solely of independent directors governed by a compensation committee charter oversee executive compensation;
•the requirement under Section 5605(e) of Nasdaq listing rules that director nominees be selected or recommended for selection by either a majority of the independent directors or a nominations committee comprised solely of independent directors;
•the requirement under Section 5635(d) of Nasdaq listing rules that a listed issuer obtain shareholder approval prior to an issuance of securities in connection with: (i) the acquisition of the stock or assets of another company; (ii) equity-based compensation of officers, directors, employees or consultants; (iii) a change of control; and (iv) transactions other than public offerings. Pursuant to the laws of the Cayman Islands and our governing documents, we are not required to obtain any such approval; and
•the requirement under Section 5605(b)(2) of Nasdaq listing rules that the independent directors have regularly scheduled meetings with only the independent directors present.
Cayman Islands law does not impose a requirement that the board consist of a majority of independent directors or that such independent directors meet regularly without other members present. Nor does Cayman Islands law impose specific requirements on the establishment of a compensation committee or nominating committee or nominating process.
Item 16H. Mine Safety Disclosure
Not applicable.
Item 16I. Disclosure Regarding Foreign Jurisdictions that Prevent Inspections
Not applicable.
Item 16J. Insider Trading Policy.
Not applicable.
184
PART III
Item 17. Financial Statements
See Item 18.
Item 18. Financial Statements
See our consolidated financial statements beginning at page F-1.
Item 19. Exhibits
Exhibit Index
| Exhibit No. | Description | |||||||
1.1 | ||||||||
2.1 | ||||||||
2.2* | ||||||||
4.1# | ||||||||
4.2 | ||||||||
4.3 | ||||||||
4.4 | ||||||||
4.5 | ||||||||
4.6 | ||||||||
4.7 | ||||||||
4.8 | ||||||||
4.9 | ||||||||
185
| Exhibit No. | Description | |||||||
| 4.10 | ||||||||
4.11† | ||||||||
4.12 | ||||||||
4.13*† | ||||||||
8.1* | ||||||||
11.1* | ||||||||
12.1* | ||||||||
12.2* | ||||||||
13.1* | ||||||||
13.2* | ||||||||
23.1* | ||||||||
101.INS* | Inline XBRL Instance Document | |||||||
101.SCH* | Inline XBRL Taxonomy Extension Schema Document | |||||||
101.CAL* | Inline XBRL Taxonomy Extension Calculation Linkbase Document | |||||||
101.DEF* | Inline XBRL Taxonomy Extension Definition Linkbase Document | |||||||
101.LAB* | Inline XBRL Taxonomy Extension Label Linkbase Document | |||||||
101.PRE* | Inline XBRL Taxonomy Extension Presentation Linkbase Document | |||||||
104* | Cover Page Interactive Data File (formatted as Inline XBRL and contained in Exhibit 101) | |||||||
___________
*Filed herewith.
†Indicates a management contract or any compensatory plan, contract or arrangement.
#Certain of the exhibits and schedules to this Exhibit have been omitted in accordance with Regulation S-K Item 601(a)(5). The Company agrees to furnish a copy of all omitted exhibits and schedules to the SEC upon its request.
186
SIGNATURE
The registrant hereby certifies that it meets all of the requirements for filing on Form 20-F and that it has duly caused and authorized the undersigned to sign this annual report on Form 20-F on its behalf.
| LAVORO LIMITED | |||||||||||||||||
| Date: | [November 1], 2023 | By: | /s/ Ruy Cunha | ||||||||||||||
| Name: | Ruy Cunha | ||||||||||||||||
| Title: | Chief Executive Officer | ||||||||||||||||
187
INDEX TO FINANCIAL STATEMENTS
Consolidated Financial Statements as of June 30, 2023 and 2022 and for the years ended June 30, 2023, 2022 and 2021 | |||||
Report of Independent Registered Public Accounting Firm (PCAOB ID | |||||
F-1
Report of Independent Registered Public Accounting Firm
To the Shareholders and the Board of Directors of
Lavoro Limited
Opinion on the Financial Statements
We have audited the accompanying consolidated statement of financial position of Lavoro Limited (Lavoro or the Company) as of June 30, 2023 and 2022, the related consolidated statement of profit or loss, comprehensive income or loss, changes in equity and cash flows for each of the three years in the period ended June 30, 2023, and the related notes (collectively referred to as the “consolidated financial statements”). In our opinion, the consolidated financial statements present fairly, in all material respects, the financial position of the Company at June 30, 2023 and 2022, and the results of its operations and its cash flows for each of the three years in the period ended June 30, 2023, in conformity with International Financial Reporting Standards (IFRS), as issued by the International Accounting Standards Board (IASB).
Basis for Opinion
These financial statements are the responsibility of the Company's management. Our responsibility is to express an opinion on the Company’s financial statements based on our audits. We are a public accounting firm registered with the Public Company Accounting Oversight Board (United States) (PCAOB) and are required to be independent with respect to the Company in accordance with the U.S. federal securities laws and the applicable rules and regulations of the Securities and Exchange Commission and the PCAOB.
We conducted our audits in accordance with the standards of the PCAOB. Those standards require that we plan and perform the audit to obtain reasonable assurance about whether the financial statements are free of material misstatement, whether due to error or fraud. The Company is not required to have, nor were we engaged to perform, an audit of its internal control over financial reporting. As part of our audits we are required to obtain an understanding of internal control over financial reporting but not for the purpose of expressing an opinion on the effectiveness of the Company's internal control over financial reporting. Accordingly, we express no such opinion.
Our audits included performing procedures to assess the risks of material misstatement of the financial statements, whether due to error or fraud, and performing procedures that respond to those risks. Such procedures included examining, on a test basis, evidence regarding the amounts and disclosures in the financial statements. Our audits also included evaluating the accounting principles used and significant estimates made by management, as well as evaluating the overall presentation of the financial statements. We believe that our audits provide a reasonable basis for our opinion.
Critical Audit Matters
The critical audit matters communicated below are matters arising from the current period audit of the financial statements that were communicated or required to be communicated to the audit committee and that: (1) relate to accounts or disclosures that are material to the financial statements and (2) involved our especially challenging, subjective or complex judgments. The communication of critical audit matters does not alter in any way our opinion on the consolidated financial statements, taken as a whole, and we are not, by communicating the critical audit matters below, providing separate opinions on the critical audit matters or on the accounts or disclosures to which they relate.
SPAC Transaction
Description of the Matter
As discussed in Notes 1(a) and 22 to the consolidated financial statements, the Company consummated on February 28, 2023, a corporate reorganization as a result of the SPAC Transaction between Lavoro and TPB Acquisition Corp. The transaction was accounted for as a capital reorganization in accordance with IFRS 2, Share-based
F-2
Payment, being TPB Acquisition Corp. identified as the “acquired” company and Lavoro as the accounting “acquirer”. As a result, on the date the corporate reorganization was consummated Lavoro received assets and assumed liabilities to certain of its shareholders of TPB Acquisition Corp. The amount of R$319,554 thousand representing the excess of fair value of Lavoro’s ordinary shares issued over the fair value of TPB Acquisition Corp identifiable net assets acquired represents a compensation for the service of a stock exchange listing for its shares and was registered in the statement of profit and loss as listing expenses incurred.
Auditing this transaction was specially challenging due to the complexity of the transaction in determining the accounting acquirer and assess it as a corporate reorganization, the significant amounts involved in the determination of the value of the listing expenses, including the Monte Carlo simulation used by management to determine the fair value of equity instruments, and accounting treatment of the financial instruments related to this transaction.
How We Addressed the Matter in Our Audit
Our audit procedures included, among others, assessing the terms of the agreements related to the SPAC transaction, assessing management`s evaluation for determining the accounting acquirer, assessing the classification and valuation of financial instruments such as warrants and forward purchase agreement and the Company's calculations of listing expense. We also involved our valuation specialists to assist in evaluating the Company's use of a Monte Carlo simulation for valuing the vesting and unvested founder shares.
We also evaluated the corresponding disclosures in Notes 1(a) and 22.
Goodwill impairment test
Description of the Matter
As of June 30, 2023, the carrying amount of goodwill in the Company’s statement of financial position is R$546,665 thousand. As discussed in Note 16 to the consolidated financial statements, the Company performs goodwill impairment testing at the cash generating unit (CGU) level annually to assess whether there is an indicator of impairment.
Auditing the Company’s annual goodwill impairment test was complex and highly judgmental due to the significant estimation required to determine the value in use of the CGUs utilizing a discounted cash flows model. In particular, the value in use estimate was sensitive to significant assumptions, such as changes in the revenue growth rate, operating margin and discount rate, which are affected by expectations about future market or economic conditions and those related to sales of each of the Company’s CGUs.
How We Addressed the Matter in Our Audit
We evaluated management’s assumptions by performing audit procedures that included, among others, comparing the significant assumptions used by management to current market and economic trends and evaluated whether changes to the Company’s assumptions would affect the value in use. We assessed the historical accuracy of management’s estimates and performed sensitivity analyses of significant assumptions, such as revenue growth rate and discount rate, to evaluate the changes in the value in use of the cash generating units that would result from changes in the assumptions. We also involved our valuation specialists in assessing valuation methodology used by the Company, to assist in testing the discount rate used and to recalculate the discounted cash flows.
We also assessed the adequacy of the related disclosures in Note 16
/s/ ERNST & YOUNG
Auditores Independentes S/S Ltda.
We have served as the Company’s auditor since 2020.
October 31, 2023
F-3

Content
4. | Segment information | |||||||
F-4
Consolidated statement of financial position As of June 30, 2023 and 2022 (In thousands of Brazilian reais - R$, except if otherwise indicated) |  | ||||
| Notes | 2023 | 2022 | ||||||||||||
| Assets | ||||||||||||||
| Current assets | ||||||||||||||
| Cash equivalents | 5 | |||||||||||||
| Trade receivables | 6 | |||||||||||||
| Inventories | 9 | |||||||||||||
| Taxes recoverable | 10 | |||||||||||||
| Derivative financial instruments | 8 | |||||||||||||
| Commodity forward contracts | 11 | |||||||||||||
| Advances to suppliers | 12 | |||||||||||||
| Other assets | ||||||||||||||
| Total current assets | ||||||||||||||
| Non-current assets | ||||||||||||||
| Restricted cash | 22 | |||||||||||||
| Trade receivables | 6 | |||||||||||||
| Other assets | ||||||||||||||
| Judicial deposits | ||||||||||||||
| Right-of-use assets | 13 | |||||||||||||
| Taxes recoverable | 10 | |||||||||||||
| Deferred tax assets | 23 | |||||||||||||
| Property, plant and equipment | 14 | |||||||||||||
| Intangible assets | 15 | |||||||||||||
| Total non-current assets | ||||||||||||||
| Total assets | ||||||||||||||
The accompanying notes are an integral part of the consolidated financial statements.
 | F-5 | ||||
Consolidated statement of financial position As of June 30, 2023 and 2022 (In thousands of Brazilian reais - R$, except if otherwise indicated) | | ||||
| Notes | 2023 | 2022 | ||||||||||||
| Liabilities | ||||||||||||||
| Current liabilities | ||||||||||||||
| Trade payables | 17 | |||||||||||||
| Trade payables – Supplier finance | 17(c) | |||||||||||||
| Lease liabilities | 13 | |||||||||||||
| Borrowings | 18 | |||||||||||||
| Obligations to FIAGRO quota holders | 19 | |||||||||||||
| Payables for the acquisition of subsidiaries | 20 | |||||||||||||
| Derivative financial instruments | 8 | |||||||||||||
| Commodity forward contracts | 11 | |||||||||||||
| Salaries and social charges | ||||||||||||||
| Taxes payable | ||||||||||||||
| Dividends payable | ||||||||||||||
| Warrant liabilities | 22 | |||||||||||||
| Advances from customers | 25 | |||||||||||||
| Other liabilities | ||||||||||||||
| Total current liabilities | ||||||||||||||
| Non-current liabilities | ||||||||||||||
| Trade payables | 17 | |||||||||||||
| Lease liabilities | 13 | |||||||||||||
| Borrowings | 18 | |||||||||||||
| Payables for the acquisition of subsidiaries | 20 | |||||||||||||
| Provision for contingencies | 24 | |||||||||||||
| Liability for FPA Shares | 22 | |||||||||||||
| Other liabilities | ||||||||||||||
| Taxes payable | ||||||||||||||
| Deferred tax liabilities | 23 | |||||||||||||
| Total non-current liabilities | ||||||||||||||
| Equity / Net investment | 27 | |||||||||||||
| Net investment from the parent | - | |||||||||||||
| Share Capital | - | |||||||||||||
| Additional Paid-in Capital | - | |||||||||||||
| F-6 | ||||
Consolidated statement of financial position As of June 30, 2023 and 2022 (In thousands of Brazilian reais - R$, except if otherwise indicated) | | ||||
| Capital reserve | - | |||||||||||||
| Other comprehensive loss | ( | - | ||||||||||||
| Accumulated losses | ( | - | ||||||||||||
| Equity attributable to shareholders of the Parent Company / Parent Company's Net investment | ||||||||||||||
| Non-controlling interests | ||||||||||||||
| Total equity / net investment | ||||||||||||||
| Total liabilities and equity / net investment | ||||||||||||||
The accompanying notes are an integral part of the consolidated financial statements.
| F-7 | ||||
Consolidated statement of profit or loss For the years ended June 30, 2023, 2022 and 2021 (In thousands of Brazilian reais - R$, except if otherwise indicated) | | ||||
| Notes | 2023 | 2022 | 2021 | ||||||||||||||||||||
| Revenue | 28 | ||||||||||||||||||||||
| Cost of goods sold | 29 | ( | ( | ( | |||||||||||||||||||
| Gross profit | |||||||||||||||||||||||
| Operating expenses | |||||||||||||||||||||||
| Sales, general and administrative expenses | 29 | ( | ( | ( | |||||||||||||||||||
| Other operating (expenses) income, net | 31 | ( | |||||||||||||||||||||
| Operating profit | |||||||||||||||||||||||
| Finance Income (costs) | |||||||||||||||||||||||
| Finance income | 30 | ||||||||||||||||||||||
| Finance costs | 30 | ( | ( | ( | |||||||||||||||||||
| Profit (loss) before income taxes | ( | ||||||||||||||||||||||
| Income taxes | |||||||||||||||||||||||
| Current | 23 | ( | ( | ||||||||||||||||||||
| Deferred | 23 | ||||||||||||||||||||||
| Profit (loss) for the year | ( | ||||||||||||||||||||||
| Attributable to: | |||||||||||||||||||||||
| Net investment of the parent/ Equity holders of the parent | ( | ||||||||||||||||||||||
| Non-controlling interests | ( | ||||||||||||||||||||||
| Earnings (loss) per share | |||||||||||||||||||||||
| Basic, profit (loss) for the year attributable to net investment of the parent/ equity holders of the parent | 27 | ( | |||||||||||||||||||||
| Diluted, profit (loss) for the year attributable to net investment of the parent/ equity holders of the parent | 27 | ( | |||||||||||||||||||||
The accompanying notes are an integral part of the consolidated financial statements.
| F-8 | ||||
Consolidated statement of comprehensive income or loss For the years ended June 30, 2023, 2022 and 2021 (In thousands of Brazilian reais - R$, except if otherwise indicated) | | ||||
| 2023 | 2022 | 2021 | |||||||||||||||
| Profit (loss) for the year | ( | ||||||||||||||||
| Items that may be reclassified to profit or loss in subsequent years | |||||||||||||||||
| Exchange differences on translation of foreign operations | ( | ( | ( | ||||||||||||||
| Total comprehensive (loss) income for the year | ( | ||||||||||||||||
| Attributable to: | |||||||||||||||||
| Net investment of the parent/ equity holders of the parent | ( | ||||||||||||||||
| Non-controlling interests | ( | ||||||||||||||||
The accompanying notes are an integral part of the consolidated financial statements.
| F-9 | ||||
Consolidated statement of changes in equity For the years ended June 30, 2023, 2022 and 2021 (In thousands of Brazilian reais - R$, except if otherwise indicated) | | ||||
| Notes | Net investment of the Parent | Share Capital | Additional Paid-in Capital | Share-Based Compensation reserve | Acumulated gain/losses | Foreign currency translation reserve | Total | Non-controlling interest | Total Equity/ Net Investment | |||||||||||||||||||||||||||||||||||||||||||||||
| At June 30, 2020 | - | - | - | - | - | |||||||||||||||||||||||||||||||||||||||||||||||||||
| Capital contributions | 27 | - | - | - | - | - | ||||||||||||||||||||||||||||||||||||||||||||||||||
| Acquisition of non-controlling interests | 27 | ( | - | - | - | - | - | ( | ( | ( | ||||||||||||||||||||||||||||||||||||||||||||||
| Acquisition of subsidiaries | 21 | - | - | - | - | - | ||||||||||||||||||||||||||||||||||||||||||||||||||
| Profit for the year | - | - | - | - | - | ( | ||||||||||||||||||||||||||||||||||||||||||||||||||
| Exchange differences on translation of foreign operations | ( | - | - | - | - | - | ( | - | ( | |||||||||||||||||||||||||||||||||||||||||||||||
| At June 30, 2021 | - | - | - | - | - | |||||||||||||||||||||||||||||||||||||||||||||||||||
| Capital contributions | 27 | - | - | - | - | - | ||||||||||||||||||||||||||||||||||||||||||||||||||
| Dividends paid | ( | - | - | - | - | - | ( | ( | ( | |||||||||||||||||||||||||||||||||||||||||||||||
| Acquisition of non-controlling interests | 27 | ( | - | - | - | - | - | ( | ( | ( | ||||||||||||||||||||||||||||||||||||||||||||||
| Acquisition of subsidiaries | 21 | - | - | - | - | - | ||||||||||||||||||||||||||||||||||||||||||||||||||
| Profit for the year | - | - | - | - | - | |||||||||||||||||||||||||||||||||||||||||||||||||||
| Exchange differences on translation of foreign operations | ( | - | - | - | - | - | ( | ( | ( | |||||||||||||||||||||||||||||||||||||||||||||||
| At June 30, 2022 | - | - | - | - | - | |||||||||||||||||||||||||||||||||||||||||||||||||||
| Capital contributions | 27 | - | - | - | - | - | — | |||||||||||||||||||||||||||||||||||||||||||||||||
| Acquisition of non-controlling interests | 27 | ( | - | - | - | - | - | ( | ( | ( | ||||||||||||||||||||||||||||||||||||||||||||||
| Non-controlling dilution on capital contributions | 27 | ( | - | - | - | - | - | ( | ||||||||||||||||||||||||||||||||||||||||||||||||
| Dividends paid | — | - | - | - | - | - | — | ( | ( | |||||||||||||||||||||||||||||||||||||||||||||||
| Acquisition of subsidiaries | 21 | - | - | - | - | - | ||||||||||||||||||||||||||||||||||||||||||||||||||
| Share-based payments | 27 | - | - | - | - | - | — | |||||||||||||||||||||||||||||||||||||||||||||||||
| Profit for the period | - | - | - | - | - | |||||||||||||||||||||||||||||||||||||||||||||||||||
| Exchange differences on translation of foreign operations | ( | - | - | - | - | - | ( | ( | ( | |||||||||||||||||||||||||||||||||||||||||||||||
 | F-10 | ||||
Consolidated statement of changes in equity For the years ended June 30, 2023, 2022 and 2021 (In thousands of Brazilian reais - R$, except if otherwise indicated) | | ||||
| Pre reorganization | - | - | - | - | - | |||||||||||||||||||||||||||||||||||||||||||||||||||
| Changes in parent company's net investment | 27 | ( | ( | — | ||||||||||||||||||||||||||||||||||||||||||||||||||||
| SPAC merger transaction | 22 | - | — | — | - | |||||||||||||||||||||||||||||||||||||||||||||||||||
| Exchange differences on translation of foreign operations | — | — | — | — | — | |||||||||||||||||||||||||||||||||||||||||||||||||||
| Loss for the period | - | - | - | - | ( | - | ( | ( | ( | |||||||||||||||||||||||||||||||||||||||||||||||
| Share-based payment | 27 | — | — | — | — | — | ||||||||||||||||||||||||||||||||||||||||||||||||||
| Acquisition of subsidiaries | 21 | - | - | - | - | - | - | - | ||||||||||||||||||||||||||||||||||||||||||||||||
| At June 30, 2023 | ( | ( | ||||||||||||||||||||||||||||||||||||||||||||||||||||||
The accompanying notes are an integral part of the consolidated financial statements.
| F-11 | ||||
Consolidated statement of cash flows For the years ended June 30, 2023, 2022 and 2021 (In thousands of Brazilian reais - R$, except if otherwise indicated) |  | ||||
| Notes | 2023 | 2022 | 2021 | |||||||||||||||||
| Operating activities: | ||||||||||||||||||||
| Profit (loss) before income taxes | ( | |||||||||||||||||||
| Adjustments to reconcile profit (loss) for the year to net cash flow: | ||||||||||||||||||||
| Allowance for expected credit losses | 29 | |||||||||||||||||||
| Listing expense | 31 | |||||||||||||||||||
| Foreign exchange diferences | ( | ( | ||||||||||||||||||
| Accrued interest expenses | 30 | |||||||||||||||||||
| Interest arising from revenue contracts | 30 | ( | ( | ( | ||||||||||||||||
| Loss (gain) on derivatives | 30 | ( | ||||||||||||||||||
| Interest from tax benefit | 30 | ( | ||||||||||||||||||
| Other finance loss, net | 30 | |||||||||||||||||||
| Fair value on commodity forward contracts | 30 | ( | ( | |||||||||||||||||
| Amortization of intangibles | 29 | |||||||||||||||||||
| Amortization of right-of-use assets | 29 | |||||||||||||||||||
| Depreciation | 29 | |||||||||||||||||||
| Losses and damages of inventories | 29 | |||||||||||||||||||
| Gain on bargain purchase | ( | |||||||||||||||||||
| Provisions for contingencies | ( | ( | ||||||||||||||||||
| Share-based payment expense | 27 | |||||||||||||||||||
| Others | ( | ( | ( | |||||||||||||||||
| Changes in operating assets and liabilities: | ||||||||||||||||||||
| Assets | ||||||||||||||||||||
| Trade receivables | ( | |||||||||||||||||||
| Inventories | ( | |||||||||||||||||||
| Advances to suppliers | ( | |||||||||||||||||||
| Derivative financial instruments | ( | ( | ||||||||||||||||||
| Taxes recoverable | ( | ( | ( | |||||||||||||||||
| Other receivables | ( | |||||||||||||||||||
| Liabilities | ||||||||||||||||||||
| Trade payables | ( | ( | ||||||||||||||||||
| Advances from customers | ( | |||||||||||||||||||
| Derivative financial instruments | ( | ( | ||||||||||||||||||
| Salaries and social charges | ||||||||||||||||||||
| Taxes payable | ( | ( | ||||||||||||||||||
| F-12 | ||||
Consolidated statement of cash flows For the years ended June 30, 2023, 2022 and 2021 (In thousands of Brazilian reais - R$, except if otherwise indicated) | | ||||
| Other payables | ( | ( | ||||||||||||||||||
| Interest paid on borrowings | 18 | ( | ( | ( | ||||||||||||||||
| Interest paid on trade payables and lease liabilities | ( | ( | ( | |||||||||||||||||
| Interest paid on acquisition of subsidiary | ( | ( | ( | |||||||||||||||||
| Interest received from revenue contracts | ||||||||||||||||||||
| Income taxes paid | ( | ( | ( | |||||||||||||||||
| Net cash flows from (used in) operating activities | ( | |||||||||||||||||||
| Investing activities: | ||||||||||||||||||||
| Acquisition of subsidiary, net of cash acquired | 20 and 21 | ( | ( | ( | ||||||||||||||||
| Additions to property, plant and equipment and intangible assets | ( | ( | ( | |||||||||||||||||
| Proceeds from the sale of property, plant and equipment | ||||||||||||||||||||
| Net cash flows used in investing activities | ( | ( | ( | |||||||||||||||||
| Financing activities: | ||||||||||||||||||||
| Proceeds from borrowings | 18 | |||||||||||||||||||
| Repayment of borrowings | 18 | ( | ( | ( | ||||||||||||||||
| Payment of principal portion of lease liabilities | 13 | ( | ( | ( | ||||||||||||||||
| Proceeds from FIAGRO quota holders, net of transaction costs | 19 | |||||||||||||||||||
| Trade payables – Supplier finance | 17(c) | |||||||||||||||||||
| Dividend payments | ( | ( | ||||||||||||||||||
| Proceeds from SPAC merger, net | 22 | |||||||||||||||||||
| Acquisition of non-controlling interests | 27 | ( | ( | ( | ||||||||||||||||
| Capital contributions | 27 | |||||||||||||||||||
| Net cash flows provided by financing activities | ||||||||||||||||||||
| Net increase (decrease) in cash equivalents | ( | |||||||||||||||||||
| Net foreign exchange difference | ( | |||||||||||||||||||
| Cash equivalents at beginning of year | ||||||||||||||||||||
| Cash equivalents at end of year | ||||||||||||||||||||
The accompanying notes are an integral part of the consolidated financial statements.
| F-13 | ||||
Notes to the consolidated financial statements (In thousands of Brazilian reais - R$, except if otherwise indicated) | | ||||
1.Background information
Lavoro Limited is a Cayman Island exempted company incorporated on August 22, 2022.
Lavoro Limited is a public company listed with the US Securities and Exchange Commission (“SEC”) and its shares are traded on Nasdaq Global Select Market under ticker symbol “LVRO”.
Lavoro Limited (“Lavoro” and collectively with its subsidiaries, the “Group”) is one of the main agricultural input distribution platforms in Latin America, with relevant agricultural input distribution operations in Brazil and Colombia, and an early stage agricultural input trading company in Uruguay. Also, as a result of a verticalization strategy, the Group produces agricultural biological and special fertilizers products through its own facilities. The Group offers farmers a complete portfolio of products and services with the goal of helping farmer customers succeed by providing multi-channel support.
As of June 30, 2023, the Group is controlled by investment funds, managed by general partners which are ultimately controlled by Patria Investments Limited (the “Parent” or “Patria”), a manager of alternative assets with its shares listed on the NASDAQ.
(a)The SPAC Transaction
On September 14, 2022, Lavoro and TPB Acquisition Corporation I (“TPB Acquisition Corp.”), a special purpose acquisition company sponsored by The Production Board LLC, signed an agreement pursuant to which they entered into a definitive business combination agreement (the “Business Combination Agreement”) that resulted in Lavoro becoming a U.S. publicly listed company on the NASDAQ Global Market.
The SPAC Transaction was approved at an extraordinary general meeting of TPB Acquisition Corp’s shareholders on February 22, 2023.
On February 28, 2023, as a result of the SPAC Transaction Lavoro and TPB Acquisition Corp consummated a corporate reorganization, as further explained below, pursuant to which (i) Lavoro Agro Limited’s shareholders contributed their shares in Lavoro Agro Limited to Lavoro in exchange of Lavoro’s shares at a pre-determined exchange ratio, becoming Lavoro’s controlling shareholders (ii) TPB Acquisition Corp’s shareholders contributed the net assets of TPB Acquisition Corp, which primarily consisted of cash and marketable securities held in the trust account and certain public and private warrants liabilities in exchange of Lavoro’s shares, becoming Lavoro’s non-controlling shareholders.
| F-14 | ||||
Notes to the consolidated financial statements (In thousands of Brazilian reais - R$, except if otherwise indicated) | | ||||
See Note 22 for further information.
(b)Corporate reorganizations
The Group’s operations include the operations of the following entities (i) Lavoro Agro Holding S.A. and its subsidiaries (“Lavoro Holding”) which was incorporated in 2017 and is domiciled in the city of São Paulo, Brazil, (ii) Crop Care Holding S.A., and its subsidiaries (“Crop Care”) which was incorporated in 2018 and is domiciled in the city of São Paulo, Brazil and (iii) Lavoro Colombia S.A.S. and its subsidiaries (“Lavoro Colombia”) which was incorporated in 2021 and is domiciled in the city of Bogotá, Colombia.
In January 2023, as part of the SPAC Transaction a corporate reorganization was completed whereby Lavoro Brazil, Crop Care and Lavoro Colombia were contributed to, and became subsidiaries of Lavoro Agro Limited, a Cayman Islands exempted company with limited liability which was incorporated on November 21, 2021, to become the holding company of all the operations of the Group.
As mentioned above, following the consummation of the SPAC Transaction Lavoro became the parent company of Lavoro Agro Limited and the holding company of all the operations of the Group.
(c)The Group’s business
The Group initiated its operations in 2017 and has expanded mainly through mergers and acquisitions in the distribution of agricultural inputs such as crop protection products, fertilizers, seeds and specialty inputs (foliar fertilizers, biologicals, adjuvants and organominerals) and its production through its proprietary portfolio of products under the crop care segment.
Through Crop Care, the Group operates as an importer of post-patent agricultural inputs and producer of specialties products through its own factories’ manufacturing plants. The inputs produced are delivered through the Group’s own distribution channels and by means of direct sales to customers.
The Group operates in Brazil, Colombia and Uruguay in the agricultural input distribution market through its own stores and sells agricultural inputs and products, in particular fertilizers, seeds, and pesticides. The Group’s customers are rural producers that operate in the production of cereals, mainly soybeans and corn, in addition to cotton, citrus and fruit and vegetable crops, among others.
Seasonality
Agribusiness is subject to seasonality throughout the year, especially due to the crop cycles that depend on specific weather conditions. Operations, especially in Brazil, have unique weather conditions compared to other countries producing agricultural commodities, making it possible to harvest two to three crops in the
| F-15 | ||||
Notes to the consolidated financial statements (In thousands of Brazilian reais - R$, except if otherwise indicated) | | ||||
same area per year. Thus, considering that the activities of the Group’s customers are directly related to crop cycles, which are seasonal in nature, revenues and cash flows from sales may also be substantially seasonal.
The sale of our products is dependent upon planting and growing seasons, which vary from year to year, and are expected to result in both highly seasonal patterns and substantial fluctuations in quarterly sales and profitability. Demand for our products is typically strongest between October and December, with a second period of strong demand between January and March. The seasonality of agricultural inputs results in our sales volumes and net sales typically being the highest during the period between September to February and our working capital and total debt requirements typically being the highest just after the end of this period.
(d)Other relevant events
•Acquisitions
The Group concluded several business acquisitions during the year ended June, 30, 2023, for which the total consideration was R$302,468 including cash, amounts payable in installments and issuance of shares. These acquisitions are further described in Note 21. Additionally, the Group completed an acquisition subsequent to June 30, 2023, which are described in note 33.
•Ongoing armed conflict between Russia and Ukraine
As a result of the current geopolitical tensions and conflict between Russia and Ukraine, and the recent recognition by Russia of the independence of the self-proclaimed republics of Donetsk and Luhansk in the Donbas region of Ukraine, the governments of the United States, the European Union, Japan and other jurisdictions have recently announced the imposition of sanctions on certain industry sectors and parties in Russia, Belarus and the regions of Donetsk and Luhansk, as well as enhanced export controls on certain products and industries. These and any additional sanctions and export controls, as well as any counter responses by the governments of Russia or other jurisdictions, could adversely affect, directly or indirectly, the global supply chain, with negative implications on the availability and prices of agricultural commodities and raw materials (including petrol, which would affect the price of agricultural inputs), energy prices, and Group’s customers, as well as the global financial markets and financial services industry and the global supply chain in general.
From a supply point of view, Brazil is highly dependent on fertilizer imports, and Russia and Belarus hold a market share in Brazilian soil fertilizer imports of approximately 26% to 30%, respectively (a share which is higher for potash-based products). The Group currently buys all of the Group’s fertilizers from suppliers based in Brazil, but most of the Group’s fertilizer suppliers import or have
| F-16 | ||||
Notes to the consolidated financial statements (In thousands of Brazilian reais - R$, except if otherwise indicated) | | ||||
imported, to some degree, from sources in Russia and Belarus. Fertilizers represented approximately 21 % of Group’s net revenues in the year ended June 30, 2023 (and 20 % of Group’s net revenues in the year ended June 30, 2022). In addition, fertilizer prices, which had already risen before the conflict, have continued to rise, which has led producers to delay purchase negotiations. Despite such supply risk, the Group does not expect material shortages of fertilizers.
The Group does not believe that fertilizer supply challenges will cause any material adverse effects on the Group’s business during the upcoming crop year, given that the Group has already delivered substantially all soy and corn fertilizer for the crop year.
2. Significant accounting policies
(a)Basis for preparation of consolidated financial statements -Predecessor method
Lavoro became the Group’s legal holding company through the corporate reorganization described in Note 1 (b). Such corporate reorganization was recorded at book value since it is a transaction under common control.
Under IFRS there is no specific guidance applicable to business combinations of entities under common control, as IFRS 3, excludes business combinations between such entities from its scope.
Due to the lack of specific guidance the Group has established an accounting policy as required by IAS 8 — Accounting Policies, Changes in Accounting Estimates and Errors. In doing so, the Group considered guidance of other standards-setting bodies that use a similar conceptual framework to develop accounting standards as well as the accounting practices of entities subject to those standards such as the United States of America and the United Kingdom.
As a result, the Group accounted for the corporate reorganizations using the predecessor method of accounting, and the consolidated financial statements are presented “as if” the historical consolidated operations of Lavoro Brazil, Crop Care and Lavoro Colombia were the predecessor of Lavoro. Under the predecessor method, the historical operations of the Group prior to the corporate reorganizations are deemed to be those of Lavoro. Thus, these consolidated financial statements reflect:
•the historical operating results and financial position of Lavoro Brazil, Crop Care and Lavoro Colombia on a combined basis prior to the corporate reorganizations
•the assets and liabilities of Lavoro Brazil, Crop Care and Lavoro Colombia at their historical cost; and
| F-17 | ||||
•Lavoro’s earnings per share for all years presented. The number of ordinary shares issued by Lavoro, as a result of the corporate reorganization is reflected retroactively, for the purposes of calculating earnings per share in all prior years presented.
The consolidated financial statements as of June 30, 2023 and 2022 and for the year ended June 30, 2023, 2022 and 2021 have been prepared in accordance with International Financial Reporting Standards (IFRS) as issued by the International Accounting Standards Board (“IASB”).
The Group has prepared the financial statements on the basis that it will continue to operate as a going concern. The Directors consider that there are no material uncertainties that may cast significant doubt over this assumption. They have formed a judgement that there is a reasonable expectation that the Group has adequate resources to continue in operational existence for the foreseeable future, and not less than 12 months from the end of the reporting period.
The consolidated financial statements have been prepared under the historical cost basis, except for financial assets and financial liabilities (including commodity forward contracts and derivative instruments) at fair value through profit or loss.
The consolidated financial statements are presented in Brazilian reais (“BRL” or “R$”), which is the Group’s functional and presentation currency. All amounts are rounded to the nearest thousand (R$000), except when otherwise indicated.
On October 31, 2023, the issuance of the consolidated financial statements was approved by the Group’s Board of Directors.
(b)Significant accounting judgments, estimates and assumptions
Use of critical accounting estimates and judgments
The preparation of financial statements requires management to make judgments, estimates and assumptions that affect the application of the Group’s accounting policies and the reported amounts of assets, liabilities, revenues, income, and expenses. These estimates are based on management’s experience and knowledge, information available at the reporting date and other factors, including expectations of future events that are believed to be reasonable under normal circumstances. Any changes in facts and circumstances may lead to a revision of these estimates. Actual results could differ from these estimates.
The estimates and assumptions are revised on an ongoing basis. Revisions to estimates are recognized on a forward-looking basis. The significant estimates
| F-18 | ||||
and judgments applied by the Group in the preparation of these consolidated financial statements are presented in the following notes:
| Note | Significant estimates and judgments | ||||
| 11 | Commodity forward contract | ||||
| 16 | Impairment testing of non-financial assets | ||||
| 21 | Business combination | ||||
| 22 | SPAC Transaction | ||||
| 23 | Deferred income taxes recoverability | ||||
(c)Basis of combination/consolidation procedures
Lavoro’s fiscal year end is June 30. The consolidated financial statements are prepared for the same reporting periods, using consistent accounting policies.
All unrealized intra-group and intercompany balances, transactions, gains and losses relating to transactions between group companies were eliminated in full.
The consolidated financial statements include the following subsidiaries of Lavoro Limited:
| Equity interest | |||||||||||||||||
| Name | Core activities | Location | 2023 | 2022 | 2021 | ||||||||||||
| Corporate: | |||||||||||||||||
| Lavoro Agro Limited (i) | Holding | George Town – Cayman Island | |||||||||||||||
| Lavoro America Inc. (i) | Holding | California - USA | |||||||||||||||
| Lavoro Merger Sub II Limited (i) | Holding | George Town – Cayman Island | |||||||||||||||
| Lavoro Agro Cayman II (i) | Holding | George Town – Cayman Island | |||||||||||||||
| Lavoro Latam SL (i) | Holding | Madrid - Spain | |||||||||||||||
| Malinas S.A. (i) | Holding | Montevideu – Uruguay | |||||||||||||||
| Lavoro Brazil: | |||||||||||||||||
| Lavoro Agro Holding S.A. | Holding | São Paulo – Brazil | |||||||||||||||
| Lavoro Agrocomercial S.A. (viii) | Distributor of agricultural inputs | Rondonópolis – Brazil | |||||||||||||||
| Agrocontato Comércio e Representações de Produtos Agropecuários S.A. (viii) | Distributor of agricultural inputs | Sinop – Brazil | |||||||||||||||
| F-19 | ||||
| PCO Comércio, Importação, Exportação e Agropecuária Ltda. (viii) | Distributor of agricultural inputs | Campo Verde – Brazil | |||||||||||||||
| Agrovenci Distribuidora de Insumos Agrícolas Ltda. (MS) (ii) (v) | Distributor of agricultural inputs | Chapadão do Sul – Brazil | |||||||||||||||
| Produtiva Agronegócios Comércio e Representação Ltda. (v) | Distributor of agricultural inputs | Paracatu – Brazil | |||||||||||||||
| Facirolli Comércio e Representação S.A. (Agrozap) (v) | Distributor of agricultural inputs | Uberaba – Brazil | |||||||||||||||
| Agrovenci Comércio, Importação, Exportação e Agropecuária Ltda. (viii) | Distributor of agricultural inputs | Campo Verde – Brazil | |||||||||||||||
| Central Agrícola Rural Distribuidora de Defensivos Ltda. (viii) | Distributor of agricultural inputs | Vilhena – Brazil | |||||||||||||||
| Distribuidora Pitangueiras de Produtos Agropecuários S.A. (viii) | Distributor of agricultural inputs | Ponta Grossa – Brazil | |||||||||||||||
| Produtec Comércio e Representações S.A. (viii) | Distributor of agricultural inputs | Cristalina – Brazil | |||||||||||||||
| Qualiciclo Agrícola S.A. (viii) | Distributor of agricultural inputs | Limeira – Brazil | |||||||||||||||
| Desempar Participações Ltda. (viii) | Distributor of agricultural inputs | Palmeira – Brazil | |||||||||||||||
| Denorpi Distribuidora de Insumos Agrícolas Ltda. (viii) | Distributor of agricultural inputs | Palmeira – Brazil | |||||||||||||||
| Deragro Distribuidora de Insumos Agrícolas Ltda. (viii) | Distributor of agricultural inputs | Palmeira – Brazil | |||||||||||||||
| Desempar Tecnologia Ltda. (viii) | Holding | Palmeira – Brazil | |||||||||||||||
| Futuragro Distribuidora de Insumos Agrícolas Ltda. (viii) | Distributor of agricultural inputs | Palmeira – Brazil | |||||||||||||||
| Plenafértil Distribuidora de Insumos Agrícolas Ltda. (viii) | Distributor of agricultural inputs | Palmeira – Brazil | |||||||||||||||
| Realce Distribuidora de Insumos Agrícolas Ltda. (viii) | Distributor of agricultural inputs | Palmeira – Brazil | |||||||||||||||
| Cultivar Agrícola Comércio, Importação e Exportação S.A. (viii) | Distributor of agricultural inputs | Chapadão do Sul – Brazil | |||||||||||||||
| América Insumos Agrícolas Ltda. (iii) | Distributor of agricultural inputs | Sorriso – Brazil | |||||||||||||||
| F-20 | ||||
| Integra Soluções Agrícolas Ltda. (iv) | Distributor of agricultural inputs | Catalão – Brazil | |||||||||||||||
| Nova Geração (v) (viii) | Distributor of agricultural inputs | Pinhalzinho – Brazil | |||||||||||||||
| Floema Soluções Nutricionais de Cultivos Ltda. (v) | Distributor of agricultural inputs | Uberaba – Brazil | |||||||||||||||
| Casa Trevo Participações S.A. (v) | Holding | Nova Prata – Brazil | |||||||||||||||
| Casa Trevo Comercial Agrícola LTDA. (v) | Distributor of agricultural inputs | Nova Prata – Brazil | |||||||||||||||
| CATR Comercial Agrícola LTDA (v) | Distributor of agricultural inputs | Nova Prata – Brazil | |||||||||||||||
| Sollo Sul Insumos Agrícolas Ltda (v) | Distributor of agricultural inputs | Pato Branco – Brazil | |||||||||||||||
| Dissul Insumos Agrícolas Ltda. (v) | Distributor of agricultural inputs | Pato Branco – Brazil | |||||||||||||||
| Lavoro Agro Fundo de Investimento nas Cadeias Produtivas Agroindustriais (vi) | FIAGRO | São Paulo – Brazil | |||||||||||||||
| Lavoro Colômbia: | |||||||||||||||||
| Lavoro Colombia S.A.S. (viii) | Holding | Bogota – Colombia | |||||||||||||||
| Crop Care Colombia (viii) | Distributor of agricultural inputs | Bogota - Colombia | |||||||||||||||
| Agricultura y Servicios S.A.S. (viii) | Distributor of agricultural inputs | Ginebra - Colombia | |||||||||||||||
| Fertilizantes Liquidos y Servicios S.A.S. (vii) | Distributor of agricultural inputs | Cali - Colombia | |||||||||||||||
| Grupo Cenagro S.A.S. (v) | Distributor of agricultural inputs | Yumbo – Colombia | |||||||||||||||
| Cenagral S.A.S (v) | Distributor of agricultural inputs | Yumbo – Colombia | |||||||||||||||
| Grupo Gral S.A.S. (viii) | Distributor of agricultural inputs | Bogota - Colombia | |||||||||||||||
| Agrointegral Andina S.A.S. (viii) | Distributor of agricultural inputs | Bogota – Colombia | |||||||||||||||
| F-21 | ||||
| Servigral Praderas S.A.S. (viii) | Distributor of agricultural inputs | Bogota – Colombia | |||||||||||||||
| Agroquímicos para la Agricultura Colombiana S.A.S. (viii) | Distributor of agricultural inputs | Bogota – Colombia | |||||||||||||||
| Provecampo S.A.S. (v) | Distributor of agricultural inputs | Envigado – Colombia | |||||||||||||||
| Crop Care: | |||||||||||||||||
| Crop Care Holding S.A. | Holding | São Paulo – Brazil | |||||||||||||||
| Perterra Insumos Agropecuários S.A. | Private label products | São Paulo – Brazil | |||||||||||||||
| Araci Administradora de Bens S.A. | Private label products | São Paulo – Brazil | |||||||||||||||
| Union Agro S.A. (v) | Private label products | Pederneiras – Brazil | |||||||||||||||
| Agrobiológica Sustentabilidade S.A. | Private label products | São Paulo – Brazil | |||||||||||||||
| Agrobiológica Soluções Naturais Ltda. | Private label products | Leme – Brazil | |||||||||||||||
| Cromo Indústria Química LTDA. (v) | Private label products | Estrela - Brasil | |||||||||||||||
| Perterra Trading S.A. | Private label products | Montevideu - Uruguay | |||||||||||||||
(i)Refers to entities of the reorganization, see note 1.b
(ii)Agrovenci Distribuidora de Insumos Agrícolas Ltda. was incorporated in August 2021.
(iii)América Insumos Agrícolas Ltda. was merged with another entity within the Group in November 2022.
(iv)Integra Soluções Agrícolas Ltda. was merged with another entity within the Group in May 2023.
(v)See note 21 of Acquisitions of subsidiaries.
(vi)Lavoro Agro Fundo de Investimentos nas Cadeias Produtivas Agroindustriais - Direitos Creditórios was incorporated in July 2022. (see Note 19).
(vii)Fertilizantes Liquidos y Servicios S.A.S. was merged with another entity within the Group in May 2022.
(viii)Changes in non-controlling interests were described in note 27 of Equity.
3.Summary of significant accounting policies
The significant accounting policies applied in the preparation of the consolidated financial statements have been included in the related explanatory notes and are consistent in all reporting years.
(a)New accounting standards, interpretations and amendments adopted starting July 1, 2020:
The following new accounting standards, interpretations and amendments were adopted starting July 1, 2020:
•Reference to the Conceptual Framework – Amendments to IFRS 3;
•Property, Plant and Equipment: Proceeds before Intended Use – Amendments to IAS 16;
| F-22 | ||||
•IFRS 1 First-time Adoption of International Financial Reporting Standards – Subsidiary as a first-time Adopter;
•IFRS 9 Financial Instruments – Fees in the ’10 per cent’ test for derecognition of financial liabilities;
•IAS 41 Agriculture – Taxation in fair value measurements; and
•Onerous Contracts – Costs of Fulfilling a Contract – Amendments to IAS 37.
The adoption of these new standards and interpretations did not have a material effect on the consolidated financial statements.
(b)New accounting standards, interpretations and amendments issued but not yet effective
Some accounting standards and interpretations have been issued, but are not yet effective.
The Group has not early adopted any of these standards and does not expect these standards to have a material impact on the financial statements in subsequent periods.
New and amended standards and interpretations issued, but not yet effective up to the date of the issuance of the Group’s consolidated financial statements are as follows:
•Amendments to IAS 1: Classification of Liabilities as Current or Non-current;
•Definition of Accounting Estimates - Amendments to IAS 8;
•Disclosure of Accounting Policies - Amendments to IAS 1 and IFRS Practice Statement 2.
•Deferred Tax related to Assets and Liabilities arising from a Single Transaction - Amendments to IAS 12: requires the recognition of deferred tax on transactions that, on initial recognition, give rise to equal amounts of taxable and deductible temporary differences. It will apply to transactions such as leases of lessees and decommissioning obligations and will require the recognition of additional deferred tax assets and liabilities. The amendment should be applied to transactions that occur on or after the beginning of the earliest comparative period presented.
The Group intends to adopt these new standards, amendments and interpretations, if applicable, when they become effective; and the Group does not expect them to have a material impact on the financial statements, except for the Amendment to IAS 12, which the Group is currently evaluating.
(c)Foreign currency
(i)Functional currency and presentation
The consolidated financial statements are presented in Brazilian reais (“R$”), which is the Group’s functional currency.
The Group determines the functional currency of each of the consolidated entities. Items included in the financial statements of each entity are measured using that functional currency. The functional currency for the majority of the Group’s entities is the Brazilian real. (Brazil Cluster and Crop Care Cluster – see
| F-23 | ||||
Note 4), except for the companies in Colombia, whose functional currency is the Colombian peso (COP$).
For consolidation, the operations in Colombia are translated into Brazilian reais, as follows:
(i)Assets and liabilities are translated into Reais at the closing exchange as of the reporting date;
(ii)Profit or loss items are translated at the average monthly exchange rate; and
(iii)Exchange differences arising on translation are recognized in other comprehensive income.
On disposal of a foreign operation, the component of other comprehensive income relating to that particular foreign operation is reclassified to profit or loss. Any goodwill arising on the acquisition of a foreign operation and any fair value adjustments to the carrying amounts of assets and liabilities arising from the acquisition are treated as assets and liabilities of the foreign operation and translated at the spot rate of exchange as of the reporting date.
(j)Transactions and balances
Transactions in foreign currencies are initially recorded by the Group’s entities at their respective functional currency spot rates at the date the transaction first qualifies for recognition.
Monetary assets and liabilities denominated in foreign currencies are translated at the functional currency spot rates of exchange as of the reporting date. Differences arising on settlement or translation of monetary items are recognized in the statement of profit or loss.
(d)Current versus non-current classification
The Group presents assets and liabilities in the statement of financial position based on current/non-current classification. An asset is current when it is:
•Expected to be realized or intended to be sold or consumed in the normal operating cycle;
•Held primarily for the purpose of trading;
•Expected to be realized within twelve months after the reporting period; or
•Cash or cash equivalent unless restricted from being exchanged or used to settle a liability for at least twelve months after the reporting period.
| F-24 | ||||
All other assets are classified as non-current.
A liability is current when:
•It is expected to be settled in the normal operating cycle;
•It is held primarily for the purpose of trading;
•It is due to be settled within twelve months after the reporting period; or
•There is no unconditional right to defer the settlement of the liability for at least twelve months after the reporting period.
The terms of the liability that could, at the option of the counterparty, result in its settlement by the issue of equity instruments do not affect its classification.
The Group classifies all other liabilities as non-current Deferred tax assets and liabilities are classified as non-current assets and liabilities.
(e)Statement of cash flows
In 2023, cash outflows related to acquisitions of non-controlling interests are classified under net cash flows provided by financing activities and interest paid on acquisitions of subsidiary is classified under net cash flows from (used in) operating activities. In 2022 and 2021, both amounts were classified under net cash flows used in investing activities.
While the effect of the change in classification of those cash flows from investing to financing and operating activities is not material, management has retrospectively revised those periods for comparison purposes.
The retrospective changes in the comparative periods can be summarized as follows:
| 2022 | |||||||||||||||||
| Originally presented | Effects of Change in classification | After change in classification | |||||||||||||||
| Acquisition of subsidiary, net of cash acquired | ( | ( | |||||||||||||||
| Acquisition of non-controlling interests | ( | ||||||||||||||||
| Net cash flows used in investing activities | ( | ( | |||||||||||||||
| Acquisition of non-controlling interests | ( | ( | |||||||||||||||
| Net cash flows provided by financing activities | ( | ||||||||||||||||
| Interest paid on acquisition of subsidiary | ( | ( | |||||||||||||||
Net cash flows from operating activities | ( | ( | ( | ||||||||||||||
| F-25 | ||||
2021 | |||||||||||||||||
| Originally presented | Effects of Change in classification | After change in classification | |||||||||||||||
| Acquisition of subsidiary, net of cash acquired | ( | ( | |||||||||||||||
| Acquisition of non-controlling interests | ( | ||||||||||||||||
| Net cash flows used in investing activities | ( | ( | |||||||||||||||
| Acquisition of non-controlling interests | ( | ( | |||||||||||||||
| Net cash flows provided by financing activities | ( | ||||||||||||||||
| Interest paid on acquisition of subsidiary | ( | ( | |||||||||||||||
Net cash flows from (used) in operating activities | ( | ||||||||||||||||
4. Segment information
(a)Reportable segments by management
The chief operating decision-maker of the Group (the “CODM”) is the board of directors which is responsible for allocating resources among operating segments and assessing their performance and for making strategic decisions.
The determination of the reportable segments is based on internal reports reviewed by the CODM, which include considerations in relation to risks and returns, organizational structure, etc. Certain expenses across segments are allocated based on reasonable allocation criteria, such as revenues or historical trends.
The Group’s reportable segments are the following:
•Brazil Cluster: includes companies located in Brazil that sell agricultural inputs;
•LATAM Cluster: includes companies located in Colombia that sell agricultural inputs;
•Crop Care Cluster: includes companies that produce and import their own portfolio of proprietary products including off-patent crop protection and specialty products (e.g, biologicals and special fertilizers).
The CODM used information on a pro forma basis giving effect of the acquisitions completed during the year to assess the segment performance. Starting March 31, 2023, the CODM used historical segment financial information. Segment information for prior years has been recast for comparative purposes.
| F-26 | ||||
Notes to the consolidated financial statements (In thousands of Brazilian reais - R$, except if otherwise indicated) |  | ||||
(b)Financial information by segment
Segment assets and liabilities as of June 30, 2023:
| Description | Brazil | LATAM | Crop Care | Total reportable segments | Corporate (i) | Eliminations between segments (ii) | Consolidated | ||||||||||||||||||||||||||||||||||
| Certain assets | |||||||||||||||||||||||||||||||||||||||||
| Cash equivalents | |||||||||||||||||||||||||||||||||||||||||
| Trade receivables | ( | ||||||||||||||||||||||||||||||||||||||||
| Inventories | ( | ||||||||||||||||||||||||||||||||||||||||
| Advances to suppliers | ( | ||||||||||||||||||||||||||||||||||||||||
| Total assets | ( | ||||||||||||||||||||||||||||||||||||||||
| Certain liabilities | |||||||||||||||||||||||||||||||||||||||||
| Trade payables | ( | ||||||||||||||||||||||||||||||||||||||||
| Borrowings | |||||||||||||||||||||||||||||||||||||||||
| Advances from customers | |||||||||||||||||||||||||||||||||||||||||
| Total liabilities and equity | ( | ||||||||||||||||||||||||||||||||||||||||
(i)Corporate items refer to balances and expenses with certain corporate demands not directly related to any operating segment.
(ii)Transactions between the Crop Care segment and the Brazil segment.
F-27
Notes to the consolidated financial statements (In thousands of Brazilian reais - R$, except if otherwise indicated) | | ||||
Statement of profit or loss data for the year ended June 30, 2023:
| Description | Brazil | LATAM | Crop Care | Total reportable segments | Corporate (i) | Eliminations between segments (ii) | Consolidated | ||||||||||||||||||||||||||||||||||
| Revenue | ( | ||||||||||||||||||||||||||||||||||||||||
| Cost of goods sold | ( | ( | ( | ( | ( | ||||||||||||||||||||||||||||||||||||
| Sales, general and administrative expenses (iii) | ( | ( | ( | ( | ( | ( | |||||||||||||||||||||||||||||||||||
| Other operating income, net | ( | ( | ( | ||||||||||||||||||||||||||||||||||||||
| Financial (costs) income | ( | ( | ( | ( | ( | ( | |||||||||||||||||||||||||||||||||||
| Income taxes | ( | ( | |||||||||||||||||||||||||||||||||||||||
| Profit (loss) for the year | ( | ( | ( | ||||||||||||||||||||||||||||||||||||||
| Depreciation and amortization | ( | ( | ( | ( | ( | ||||||||||||||||||||||||||||||||||||
(i)Corporate items refer to balances and expenses with certain corporate demands not directly related to any operating segment.
(ii)Sales between the Crop Care segment and the Brazil segment.
(iii)Sales, general and administrative expenses include depreciation and amortization
F-28
Notes to the consolidated financial statements (In thousands of Brazilian reais - R$, except if otherwise indicated) | | ||||
Segment assets and liabilities as of June 30, 2022:
| Description | Brazil | LATAM | Crop Care | Total reportable segments | Eliminations between segments (i) | Combined | |||||||||||||||||||||||||||||
| Certain assets | |||||||||||||||||||||||||||||||||||
| Cash equivalents | |||||||||||||||||||||||||||||||||||
| Trade receivables | ( | ||||||||||||||||||||||||||||||||||
| Inventories | |||||||||||||||||||||||||||||||||||
| Advances to suppliers | ( | ||||||||||||||||||||||||||||||||||
| Total assets | ( | ||||||||||||||||||||||||||||||||||
| Certain liabilities | |||||||||||||||||||||||||||||||||||
| Trade payables | ( | ||||||||||||||||||||||||||||||||||
| Borrowings | |||||||||||||||||||||||||||||||||||
| Advances from customers | ( | ||||||||||||||||||||||||||||||||||
| Total liabilities and equity | ( | ||||||||||||||||||||||||||||||||||
(i)Transactions between the Crop Care segment and the Brazil segment.
F-29
Notes to the consolidated financial statements (In thousands of Brazilian reais - R$, except if otherwise indicated) | | ||||
Statement of profit or loss data for the year ended June 30, 2022:
| Description | Brazil | LATAM | Crop Care | Total reportable segments | Eliminations between segments (i) | Combined | |||||||||||||||||||||||||||||
| Revenue | ( | ||||||||||||||||||||||||||||||||||
| Cost of goods sold | ( | ( | ( | ( | ( | ||||||||||||||||||||||||||||||
| Sales, general and administrative expenses (ii) | ( | ( | ( | ( | ( | ||||||||||||||||||||||||||||||
| Other operating income, net | ( | ||||||||||||||||||||||||||||||||||
| Financial (costs) income | ( | ( | ( | ( | |||||||||||||||||||||||||||||||
| Income taxes | ( | ( | ( | ( | |||||||||||||||||||||||||||||||
| Profit for the year | |||||||||||||||||||||||||||||||||||
| Depreciation and amortization | ( | ( | ( | ( | ( | ||||||||||||||||||||||||||||||
(i)Sales between the Crop Care segment and the Brazil segment.
(ii)Sales, general and administrative expenses include depreciation and amortization
F-30
Notes to the consolidated financial statements (In thousands of Brazilian reais - R$, except if otherwise indicated) | | ||||
Statement of profit or loss data for year ended June 30, 2021:
| Description | Brazil | LATAM | Crop Care | Total reportable segments | Eliminations between segments (i) | Combined | |||||||||||||||||||||||||||||
| Revenue | ( | ||||||||||||||||||||||||||||||||||
| Cost of goods sold | ( | ( | ( | ( | ( | ||||||||||||||||||||||||||||||
| Sales, general and administrative expenses (ii) | ( | ( | ( | ( | ( | ||||||||||||||||||||||||||||||
| Other operating income, net | |||||||||||||||||||||||||||||||||||
| Financial (costs) income | ( | ( | ( | ( | ( | ||||||||||||||||||||||||||||||
| Income taxes | ( | ( | ( | ( | ( | ||||||||||||||||||||||||||||||
| Profit for the year | ( | ||||||||||||||||||||||||||||||||||
| Depreciation and amortization | ( | ( | ( | ( | ( | ||||||||||||||||||||||||||||||
(i)Sales between the Crop Care segment and the Brazil segment.
(ii)Sales, general and administrative expenses include depreciation and amortization
Revenues from external customers for each product and service are disclosed in Note 28. Further breakdown in relation to products and services provided by the Group is not available and such information cannot be produced without unreasonable effort.
F-31
Notes to the consolidated financial statements (In thousands of Brazilian reais - R$, except if otherwise indicated) | | ||||
5. Cash equivalents
Accounting policy
| Annual yield | 2023 | 2022 | |||||||||||||||
| Cash equivalents (R$) | |||||||||||||||||
| Cash equivalents (COP) | |||||||||||||||||
| Cash equivalents (US$) | |||||||||||||||||
| Total cash equivalents | |||||||||||||||||
(i)Represents the Brazilian interbank deposit rate, which is an average of the overnight interbank rates in Brazil (the "CDI").
(ii)Colombian investment rate, which is an average of interbank and corporate finance ("DTF").
(iii)Average annualized yield obtained in the last year from overseas bank accounts.
6. Trade receivables
Accounting policy
| 2023 | 2022 | ||||||||||
| Trade receivables (Brazil) | |||||||||||
| Trade receivables (Colombia) | |||||||||||
| (-) Allowance for expected credit losses | ( | ( | |||||||||
| Total | |||||||||||
| Current | |||||||||||
| Non-current | |||||||||||
| F-32 | ||||
Notes to the consolidated financial statements (In thousands of Brazilian reais - R$, except if otherwise indicated) | | ||||
The average effective interest rate used to discount trade receivables for the year ended June 30, 2023 was 0.96 % per month (1.00 % as of June 30, 2022). The Group does not have any customer that represents more than 10% of its trade receivables or revenues.
As of June 30, 2023, the Group also transferred trade receivables to the FIAGRO in the amount of R$167,278 . There were no trade receivables transferred as of June 30, 2022.
As the Group has retained the risks and rewards of ownership, these amounts were not derecognized from trade receivables. Consequently, the liability resulting from these operations is recorded as obligations to FIAGRO quota holders (note 19).
Allowance for expected credit losses
| 2023 | 2022 | 2021 | |||||||||||||||
| Opening balance | ( | ( | ( | ||||||||||||||
| Increase in allowance | ( | ( | ( | ||||||||||||||
| Allowance for credit losses from acquisitions | ( | ( | ( | ||||||||||||||
| Trade receivables write-off | |||||||||||||||||
| Exchange rate translation adjustment | ( | ||||||||||||||||
| Ending balance (i) | ( | ( | ( | ||||||||||||||
(i)The credit risk of the Group is described in note 8.b.
The aging analysis of trade receivables is as follow:
| 2023 | 2022 | ||||||||||
| Not past due | |||||||||||
| Overdue | |||||||||||
| 1 to 60 days | |||||||||||
| 61 to 180 days | |||||||||||
| 181 to 365 days | |||||||||||
| Over 365 days | |||||||||||
| Allowance for expected credit losses | ( | ( | |||||||||
| F-33 | ||||
Notes to the consolidated financial statements (In thousands of Brazilian reais - R$, except if otherwise indicated) | | ||||
7. Financial instruments
Accounting policy
Initial recognition and measurement
(i)Financial assets
Financial assets are classified, at initial recognition, and subsequently measured at amortized cost or fair value through profit or loss.
The classification of financial assets at initial recognition depends on the financial asset’s contractual cash flow characteristics and the Group’s business model for managing them. The Group initially measures a financial asset at its fair value plus, in the case of a financial asset not at fair value through profit or loss, transaction costs.
In order for a financial asset to be classified and measured at amortized cost, it needs to give rise to cash flows that are ‘solely payments of principal and interest (SPPI)’ on the principal amount outstanding. This assessment is referred to as the SPPI test and is performed at an instrument level. Financial assets with cash flows that are not SPPI are classified and measured at fair value through profit or loss, irrespective of the business model.
The Group’s business model for managing financial assets refers to how it manages its financial assets in order to generate cash flows. The business model determines whether cash flows will result from collecting contractual cash flows, selling the financial assets, or both. Financial assets classified and measured at amortized cost are held within a business model with the objective to hold financial assets in order to collect contractual cash flows.
Subsequent measurement
For purposes of subsequent measurement, Group’s financial assets are classified in following categories:
•Financial assets at amortized cost
•Financial assets at fair value through profit or loss
Financial assets at amortized cost
Financial assets at amortized cost are subsequently measured using the effective interest method and are subject to impairment. Gains and losses are recognized in profit or loss when the asset is derecognized, modified or impaired.
Financial assets at fair value through profit or loss
Financial assets at fair value through profit or loss are carried in the statement of financial position at fair value with net changes in fair value recognized in the statement of profit or loss.
| F-34 | ||||
Notes to the consolidated financial statements (In thousands of Brazilian reais - R$, except if otherwise indicated) | | ||||
Derecognition
A financial asset is primarily derecognized when the rights to receive cash flows from the asset have expired.
Impairment
The Group recognizes an allowance for expected credit losses for trade receivables, which is the only debt instrument not held at fair value through profit or loss.
(ii)Financial liabilities:
The Group classifies its financial liabilities in the following categories: (i) measured at amortized cost and (ii) fair value through profit or loss. Financial liabilities classified as fair value through profit or loss include financial liabilities held for trading and financial liabilities designated upon initial recognition as fair value through profit or loss. Financial liabilities are derecognized when contractual obligations are withdrawn, canceled, or expired. The difference between the extinguished book value and the consideration paid (including transferred assets or assumed liabilities) is recognized in the statement of income.
| F-35 | ||||
Notes to the consolidated financial statements (In thousands of Brazilian reais - R$, except if otherwise indicated) | | ||||
The Group’s financial instruments were classified according to the following categories:
| 2023 | |||||||||||
| Amortized cost | Fair value through profit or loss | ||||||||||
| Assets: | |||||||||||
| Trade receivables | |||||||||||
| Commodity forward contracts | |||||||||||
| Derivative financial instruments | |||||||||||
| Restricted cash | |||||||||||
| Total | |||||||||||
| Liabilities: | |||||||||||
| Trade payables | |||||||||||
| Lease liabilities | |||||||||||
| Borrowings | |||||||||||
| Obligations to FIAGRO quota holders | |||||||||||
| Payables for the acquisition of subsidiaries | |||||||||||
| Derivative financial instruments | |||||||||||
| Salaries and social charges | |||||||||||
| Commodity forward contracts | |||||||||||
| Dividends payable | |||||||||||
| Warrant liabilities | |||||||||||
| Liability for FPA Shares | |||||||||||
| Total | |||||||||||
| F-36 | ||||
Notes to the consolidated financial statements (In thousands of Brazilian reais - R$, except if otherwise indicated) | | ||||
| 2022 | |||||||||||
| Amortized cost | Fair value through profit or loss | ||||||||||
| Assets: | |||||||||||
| Trade receivables | |||||||||||
| Commodity forward contracts | |||||||||||
| Derivative financial instruments | |||||||||||
| Restricted cash | |||||||||||
| Total | |||||||||||
| Liabilities: | |||||||||||
| Trade payables | |||||||||||
| Lease liabilities | |||||||||||
| Borrowings | |||||||||||
| Payables for the acquisition of subsidiaries | |||||||||||
| Derivative financial instruments | |||||||||||
| Salaries and social charges | |||||||||||
| Commodity forward contracts | |||||||||||
| Dividends payable | |||||||||||
| Total | |||||||||||
The Group considers that assets and liabilities measured at amortized cost, have a carrying value approximate to their fair value and, therefore, information on their fair values is not presented.
(a)Hierarchy of fair value
The Group uses various methods to measure and determine fair value (including market approaches and income or cost approaches) and to estimate the value that market participants would use to price the asset or liability. Financial assets and liabilities carried at fair value are classified and disclosed within the following fair value hierarchy levels:
Level 1 - Quoted prices (unadjusted) in active, liquid and visible markets, for identical assets and liabilities that are readily available at the measurement date;
Level 2 - Valuation techniques for which the lowest level input that is significant to the fair value measurement is directly or indirectly observable; and
Level 3 – Valuation techniques for which the lowest level input that is significant to the fair value measurement is unobservable.
For assets and liabilities that are recognized in the financial statements at fair value on a recurring basis, the Group determines whether transfers have occurred
| F-37 | ||||
Notes to the consolidated financial statements (In thousands of Brazilian reais - R$, except if otherwise indicated) | | ||||
between levels in the hierarchy by re-assessing categorization (based on the lowest level input that is significant to the fair value measurement as a whole) at the end of each reporting period.
All financial instruments accounted for at fair value are classified as level 2, except for the Warrant liability which is classified as level 1. On June 30, 2023 and June 30, 2022, there were no changes in the fair value methodology of the financial instruments and, therefore, there were no transfers between levels.
8. Financial and capital risk management
(a)Considerations on risk factors that may affect the business of the Group
The Group is exposed to several market risk factors that might impact its business. The Group’s board of directors is responsible for monitoring these risk factors, as well as establishing policies and procedures to address them. The Group’s risk management structure considers the size and complexity of its activities, which allows for a better understanding of how such risks could impact Group’s strategy through committees and other internal meetings.
Currently, the Group is focused on action plans relating to risks that could have a significant impact on its strategic goals, including those required by applicable regulations. To efficiently manage and mitigate these risks, its risk management structure conducts risk identification and assessments to prioritize the risks that are key to pursuing potential opportunities that may prevent value from being created or that may compromise existing value, with the possibility of impacting its results, capital, liquidity, customer relationships and/or reputation.
The Group’s risk management strategies were developed to mitigate and/or reduce the financial market risks which it is exposed to, which are as follows:
•credit risk
•liquidity risk
•capital risk
•interest rate risk
•exchange rate risk
•commodity price risk in barter transactions
(b)Credit risk
Credit risk is the risk of financial losses if a customer or a counterparty to a financial instrument fails to fulfill its contractual obligations, which arise mainly from the Group’s trade receivables. The Group maintains short-term investments and derivatives with financial institutions approved by its management according to objective criteria for diversification of such risk.
| F-38 | ||||
Notes to the consolidated financial statements (In thousands of Brazilian reais - R$, except if otherwise indicated) | | ||||
The Group seeks to mitigate its credit risk related to trade receivables by setting forth credit limits for each counterparty based on the analysis of its credit management process. Such credit exposure determination is performed considering the qualitative and quantitative information of each counterparty. The Group also focuses on the diversification of its portfolio and monitors different solvency and liquidity indicators of its counterparties. In addition, primarily for receivables in installments, the Group monitors the balance of allowances for expected credit losses. (see Note 6)
The main strategies on credit risks management are listed below:
•creating credit approval policies and procedures for new and existing customers.
•extending credit to qualified customers through a review of credit agency reports, financial statements and/or credit references, when available.
•reviewing existing customer accounts every twelve months based on the credit limit amounts.
•evaluating customer and regional risks.
•obtaining guarantees through the endorsement of rural producer notes (“CPR”), which give physical ownership of the relevant agricultural goods in the event of the customer’s default.
•establishing credit approval for suppliers in case of payments in advance.
•setting up provisions using the lifetime expected credit loss method considering all possible default events over the expected life of a financial instrument. Receivables are categorized based on the number of overdue days and/or a customer’s credit risk profile. Estimated losses on receivables are based on known troubled accounts and historical losses. Receivables are considered to be in default and are written off against the allowance for credit losses when it is probable that all remaining contractual payments due will not be collected in accordance with the terms of the agreement.
•requiring minimum acceptable counterparty credit ratings from financial counterparties.
•setting limits for counterparties or credit exposure; and
•developing relationships with investment-grade counterparties.
| F-39 | ||||
Notes to the consolidated financial statements (In thousands of Brazilian reais - R$, except if otherwise indicated) | | ||||
The current credit policy sets forth credit limits for customers based on credit score analysis made by the Group’s credit management area. Such score is determined considering the qualitative and quantitative information related to each customer, resulting in a rating classification and a level of requirement of guarantees as follows:
| % Of guarantees required on sales | ||||||||||||||||||||||||||
| Credit rating | % Customers | Risk classification | Medium-sized farmers (i) | Other | ||||||||||||||||||||||
| AA & A | Very small | |||||||||||||||||||||||||
| B | Medium | |||||||||||||||||||||||||
| C & D | High | |||||||||||||||||||||||||
| Simplified | Small farmers | N/A | N/A | |||||||||||||||||||||||
(i)Medium-sized farmers ranging between 100 and 10,000 hectares in planted acreage that are typically not serviced directly by agricultural input producers.
For Colombia there is a similar credit scoring process, however, guarantees are not required based on credit ratings but instead based on qualitative factors such as relationships and past experiences with customers.
Maximum exposure to credit risk as of June 30, 2023 and June 30, 2022:
| 2023 | 2022 | ||||||||||
| Trade receivables (current and non-current) | |||||||||||
| Advances to suppliers | |||||||||||
(c)Liquidity risk
The Group defines liquidity risk as the risk of financial losses if it is unable to comply with its payment obligations in connection with financial liabilities settled in cash or other financial assets in a timely manner as they become due. The Group’s approach to managing this risk is to ensure that it has sufficient cash available to settle its obligations without incurring losses or affecting the operations. Management is ultimately responsible for managing liquidity risk, which relies on a liquidity risk management model to manage funding requirements and liquidity in the short, medium and long term.
The Group’s cash position is monitored by its senior management, through management reports and periodic performance meetings. The Group also
| F-40 | ||||
Notes to the consolidated financial statements (In thousands of Brazilian reais - R$, except if otherwise indicated) | | ||||
manages its liquidity risk by maintaining reserves, bank credit facilities and other borrowing facilities deemed appropriate, through ongoing monitoring of forecast and actual cash flows, as well as through the combination of maturity profiles of financial assets and liabilities.
The following maturity analysis of the Group’s financial liabilities and gross settled derivative financial instruments contracts (for which the cash flows are settled simultaneously) is based on the expected undiscounted contractual cash flows from the year end date to the contractual maturity date:
| 2023 | |||||||||||||||||
| Up to 1 year | From 1 to 5 years | Total | |||||||||||||||
| Trade payables | |||||||||||||||||
| Lease liabilities | |||||||||||||||||
| Borrowings | |||||||||||||||||
| Obligations to FIAGRO quota holders | |||||||||||||||||
| Payables for the acquisition of subsidiaries | |||||||||||||||||
| Commodity forward contracts | |||||||||||||||||
| Derivative financial instruments | |||||||||||||||||
| Salaries and social charges | |||||||||||||||||
| Dividends payable | |||||||||||||||||
| Warrant liabilities | |||||||||||||||||
| Liability for FPA Shares | |||||||||||||||||
| F-41 | ||||
Notes to the consolidated financial statements (In thousands of Brazilian reais - R$, except if otherwise indicated) | | ||||
| 2022 | |||||||||||||||||
| Up to 1 year | From 1 to 5 years | Total | |||||||||||||||
| Trade payables | |||||||||||||||||
| Lease liabilities | |||||||||||||||||
| Borrowings | |||||||||||||||||
| Payables for the acquisition of subsidiaries | |||||||||||||||||
| Commodity forward contracts | |||||||||||||||||
| Derivative financial instruments | |||||||||||||||||
| Salaries and social charges | |||||||||||||||||
| Dividends payable | |||||||||||||||||
(d)Capital risk
The Group manages its capital risk through its leverage policy to ensure its ability to continue as a going concern and to maximize the return of its stakeholders by optimizing its balances of debt and equity.
The Group's strategy is to maintain the net debt up to 2.2
(e)Interest rate risk
Fluctuations in interest rates, such as the Brazilian interbank deposit rate, which is an average of interbank overnight rates in Brazil, and Colombian investment rate, which is an average of interbank and financial corporation loans, may have an effect on the cost of the Group’s borrowings and new borrowings.
The Group periodically monitors the effects of market changes in interest rates on its financial instruments portfolio. Funds raised by the Group are used to finance working capital for each crop season and are typically raised at short term conditions.
As of June 30, 2023 and June 30, 2022, the Group had no
(i)Sensitivity analysis – exposure to interest rates
To mitigate its exposure to interest rate risk, the Group uses different scenarios to evaluate the sensitivity of variations transactions impacted by the CDI Rate and IBR Rate. The Scenario 1 represents the impact on booked amounts considering
| F-42 | ||||
Notes to the consolidated financial statements (In thousands of Brazilian reais - R$, except if otherwise indicated) | | ||||
the most current (September 2023) CDI Rate and IBR Rate and reflects management’s best estimates. The Scenario 2 and Scenario 3 consider an appreciation of 25 % and 50 % in such market interest rates, before taxes, which represents a significant change in the probable scenario for sensitivity purposes.
The following table sets forth the potential impacts on the statements of profit or loss:
| 2023 | ||||||||||||||||||||
| Expense on profit or loss | ||||||||||||||||||||
| Current Index | Scenario 1 | Scenario 2 | Scenario 3 | |||||||||||||||||
| Floating rate borrowings in Brazil | CDI Rate ( | |||||||||||||||||||
| Floating rate borrowings in Colombia | IBR Rate ( | |||||||||||||||||||
(f)Exchange rate risk
The Group is exposed to foreign exchange risk arising from its operations related to agricultural inputs, mainly related to the U.S. dollar, which significantly impacts global prices of agricultural inputs in general. Although all purchases and sales are conducted locally, certain purchase and sales contracts are indexed to the U.S. dollar.
The Group’s current commercial department seeks to reduce this exposure. Its marketing department is responsible for managing pricing tables and commercial strategies to seek a natural hedge between purchases and sales and to match currency and terms to the greatest extent possible.
The Group’s corporate treasury department is responsible for monitoring the forecasted cash flow exposure to the U.S. dollar, and whenever any mismatches as to terms and currencies are identified, non-deliverable forwards derivative financial instruments are purchased to offset these exposures, and therefore fulfill internal policy requirements. U.S. dollar exposure is managed by macro hedging through the analysis of the forecasted cash flow for the next two harvests. The Group may not have any leveraged derivative position.
The Group’s exchange rate exposure monitoring committee meets periodically across the commercial, treasury and corporate business departments. There are also committees on purchase valuation and business intelligence for the main goods traded by the Group.
| F-43 | ||||
Notes to the consolidated financial statements (In thousands of Brazilian reais - R$, except if otherwise indicated) | | ||||
The Group does not adopt hedge accounting. Therefore, gains and losses from derivative operations are fully recognized in the statements of profit or loss, as disclosed in Note 30.
(i)Sensitivity analysis – exposure to exchange rates
To gauge its exposure to exchange rate risk, the Group uses different scenarios to evaluate its asset and liability positions in foreign currency and their potential effects on its results.
The Scenario 1 below represents the impact on carrying amounts of the most current (September 2023) market rates for the U.S. dollar (R$5.73 to US$1.00). This analysis assumes that all other variables, particularly interest rates, remain constant. The Scenario 2 and Scenario 3 consider the appreciation of the Brazilian real against the US dollar at the rates of 25 % and 50 %, before taxes, which represents a significant change in the probable scenario for sensitivity purposes.
The following table set forth the potential impacts on the statements of profit or loss:
| 2023 | |||||||||||||||||||||||
| Effect on profit or loss and | |||||||||||||||||||||||
| Current Index | Scenario 1 | Scenario 2 | Scenario 3 | ||||||||||||||||||||
| Trade receivables in U.S. Dollars | ( | ||||||||||||||||||||||
| Trade payables in U.S. Dollars | ( | ( | |||||||||||||||||||||
| Borrowings in U.S. Dollars | ( | ||||||||||||||||||||||
| Net impacts on commercial operations | ( | ||||||||||||||||||||||
| Derivative financial instruments | ( | ( | |||||||||||||||||||||
| Total impact, net of derivatives | ( | ||||||||||||||||||||||
(g)Commodity prices risk in barter transactions
In all barter transactions mentioned in Note 11, the Group uses future commodity market price as the reference to value the quantities of commodities included in the forward contracts to be delivered by the customers as payment for the Group’s products into currency. The Group uses prices quoted by commodity trading companies to value the grain purchase contracts from farmers. Lavoro enters into grain sale contracts with trading companies or forward derivatives
| F-44 | ||||
Notes to the consolidated financial statements (In thousands of Brazilian reais - R$, except if otherwise indicated) | | ||||
with financial institutions to sell those same grains, at the same price of the purchased contracts with farmers. As such, the Group strategy to manage its exposure to those commodity prices by entering into the purchase and sale contracts at similar conditions.
These transactions are conducted by a corporate department which manages and controls such contracts as well as the compliance of Group’s policies.
(i)Sensitivity analysis – exposure to commodity price
To gauge its exposure to commodity price risk, the Group uses different scenarios to evaluate its asset and liability positions on commodity forward contracts in soybean and corn and their potential effects on its results.
The “current risk” scenario below represents the impact on carrying amounts as of June 30, 2023, with assumptions described in Note 11. The other scenarios consider the appreciation of main assumptions at the rates of 25% and 50%, before taxes, which represents a significant change in the probable scenario for sensitivity purposes.
| F-45 | ||||
Notes to the consolidated financial statements (In thousands of Brazilian reais - R$, except if otherwise indicated) | | ||||
As of June 30, 2023:
| Tons | Position | Current Risk (i) | Average of contract prices | Current Market (R$/bag) | +25% current | +50% current | |||||||||||||||||||||||||||||||||||||||||||||||
| Position | Market | Impact | Market | Impact | |||||||||||||||||||||||||||||||||||||||||||||||||
| Corn 2023 | Purchased | ( | ( | ( | |||||||||||||||||||||||||||||||||||||||||||||||||
| Corn 2023 | ( | Sold | |||||||||||||||||||||||||||||||||||||||||||||||||||
| Soybean 2024 | Purchased | ( | ( | ( | |||||||||||||||||||||||||||||||||||||||||||||||||
| Soybean 2024 | ( | Sold | |||||||||||||||||||||||||||||||||||||||||||||||||||
| Corn 2024 | Purchased | ( | ( | ( | |||||||||||||||||||||||||||||||||||||||||||||||||
| Corn 2024 | ( | Sold | ( | ( | ( | ||||||||||||||||||||||||||||||||||||||||||||||||
| Net exposure on grain contracts | Net purchased | ( | ( | ( | |||||||||||||||||||||||||||||||||||||||||||||||||
| Soybean 2024 | ( | Sold on derivatives | ( | ( | ( | ||||||||||||||||||||||||||||||||||||||||||||||||
| Corn 2024 | ( | Sold on derivatives | |||||||||||||||||||||||||||||||||||||||||||||||||||
| Net exposure on derivatives | ( | Net sold | |||||||||||||||||||||||||||||||||||||||||||||||||||
| Net exposure | ( | ( | ( | ( | |||||||||||||||||||||||||||||||||||||||||||||||||
(i)The mismatch on current fair value of Commodity forward contracts for Corn 2023 is related to derivatives contracts that were settled in advance for cash management purposes, resulting in an income of R$80,990 recognized as finance income.
(h)Derivative financial investments
The Group is exposed to market risks mainly related to fluctuations in exchange rates and commodity prices. The Group maintains operations with financial instruments of protection to mitigate exposure to these risks. The Group has been implementing and improving the internal controls to identify and measure the effects of transactions with trading companies and with financial institutions, so that such transactions are captured, recognized and disclosed in the consolidated financial statements. The Group does not carry out investments of a nature speculative in derivatives or any other risk assets. Trading derivatives are classified as current assets or liabilities.
| F-46 | ||||
Notes to the consolidated financial statements (In thousands of Brazilian reais - R$, except if otherwise indicated) | | ||||
| June 30, 2023 | June 30, 2022 | ||||||||||
| Options (put/call of commodities) | ( | ( | |||||||||
| Forwards (R$/US$) (i) | ( | ||||||||||
| Swap (R$/US$) | ( | ||||||||||
| Derivative financial instruments, net | ( | ||||||||||
9. Inventories
Accounting policy
Inventories are valued at the lower of cost and net realizable value. The costs of individual items of inventory are determined using weighted average costs less any losses, when applicable.
Net realizable value is the estimated selling price in the ordinary course of business, less estimated costs of completion (when applicable) and the estimated costs necessary to make the sale.
An inventory loss is recognized for inventories that are close to their expiration date and there is no expectation that they will be sold.
| 2023 | 2022 | ||||||||||
| Goods for resale | |||||||||||
| (-) Allowance for inventory losses | ( | ( | |||||||||
| Total | |||||||||||
| F-47 | ||||
Notes to the consolidated financial statements (In thousands of Brazilian reais - R$, except if otherwise indicated) | | ||||
10. Taxes recoverable
| 2023 | 2022 | ||||||||||
| State VAT (“ICMS”) (i) | |||||||||||
| Brazilian federal contributions (ii) | |||||||||||
| Colombian federal contributions | |||||||||||
| Total | |||||||||||
| Current | |||||||||||
| Non-current | |||||||||||
(i)Refers to the Brazilian value-added tax on sales and services. The Group’s ICMS relates mainly to the purchase of inputs and the Group has the benefit of a reduced ICMS tax rate.
(ii)Includes: a) credits arising from the Brazilian government’s taxes charged for the social integration program (PIS) and the social security program (COFINS), and Brazilian corporate income tax and social contributions. These credits, which are recognized as current assets, will be used by the Group to offset other Federal taxes; b) withholding and overpaid taxes which can be used to settle overdue or future payable federal taxes; c) withholding income tax on cash equivalents which can be used to offset taxes owed at the end of the calendar year, in case of taxable profit, or are carried forward in case of tax loss; and
Income tax Benefits arising from ICMS deduction
During 2022/2023 the Group obtained the benefit of deducting the ICMS benefit explained in item (i) in the income tax calculation. This was applied for the current year tax calculation and for the prior years and generated an income tax credit recorded in the year ended June 30, 2023 in the amount of R$244,717 , recorded under “Brazilian federal contributions”.
In accordance with Article 30 of Law No. 12,973/2014, the amount of ICMS benefits must be allocated to the fiscal incentive reserve category when there is sufficient profit in each subsidiary. Additionally, under the same law, these tax benefits must be included in the calculation base for Corporate Income Tax (IRPJ) and Social Contribution on Net Profits (CSLL) when dividends are distributed or capital is refunded to the shareholders of the subsidiaries.
| F-48 | ||||
Notes to the consolidated financial statements (In thousands of Brazilian reais - R$, except if otherwise indicated) | | ||||
11. Commodity forward contracts – Barter transactions
For certain contracts with customers, the Group carries out term sales of agricultural inputs (e.g., fertilizers, crop chemicals, seeds) in exchange for future delivery of grains, mainly soybeans and corn, at the time of their harvest (“Barter transactions").
A contract (grain purchase agreement) is signed between the Group and the customer, pursuant to which Lavoro and the customer agree on an amount of commodity, to be delivered at harvesting, which is equivalent to the total sales price based on the future commodity price on the date in which the contract with the customer is entered into. The customers’ main obligation under this contract is to deliver the agreed upon volume of commodities as payment at a future date.
Contemporaneously, the Group enters into a future grain sale agreement with a commodity trading company, pursuant to which the Group is committed to deliver the commodity to be received by the customer under the inputs sales transaction. The Group strategy is to sign this agreement for the same quantity and the same terms of the contract between the Group and its customer. While this physical sale of the grains is not concluded with trading companies, the Group may enter into a derivative contract on commodity and futures exchanges such as CBOT, ICE, or B3, in an equivalent term associated with the physical grain purchases. This aims to mitigate exposure to price fluctuations. Consequently, the Group maintains these derivative contracts to naturally hedge against market volatility. As soon as the physical sale of the grains is concluded, the derivative contracts are promptly liquidated to realize the hedging gains or losses.
In the event the customer fails to deliver the committed commodity amount upon harvesting, for example due to a significant increase in the commodity price the Group is required to:
•purchase the commodity in the spot market and deliver it to the commodity trading company; or
•pay compensation to the commodity trading company in an amount equal to the difference between the commodity price between the time of delivery and the time of closing of the agreement (“washout risk”).
The Group is entitled to charge its customers for any losses arising from the settlement of its obligations above with the commodity trading companies.
Even though these agreements are settled physically (grains purchase and sale), under IFRS 9, the Group designates, at initial recognition, such forward contracts as measured at fair value through profit and losses (FVTPL).
The fair value of the commodity forward contracts, entered into with the customer and the commodity trading company is estimated based on information available in the market and specific valuation methodologies, and
| F-49 | ||||
Notes to the consolidated financial statements (In thousands of Brazilian reais - R$, except if otherwise indicated) | | ||||
discounted to present value, considering the contractual terms and the current market prices for such commodities. Such contracts are disclosed on a gross basis in the statement of financial position.
Critical accounting estimates and judgments
Fair value of commodity forward contracts is estimated on a regional basis, and they are based on the commodity prices available at exchange future markets, over the counter premium data quoted by market players and the expected freight costs estimated by the Group considering historical inland freight data.
As of June 30, fair value of commodity forward contracts is as follows:
| 2023 | 2022 | ||||||||||
| Fair value of commodity forward contracts: | |||||||||||
Assets | |||||||||||
Purchase contracts | |||||||||||
Sale contracts | |||||||||||
Liabilities | |||||||||||
Purchase contracts | ( | ( | |||||||||
Sale contracts | ( | ( | |||||||||
| ( | ( | ||||||||||
The changes in fair value recognized in the statements of profit or loss are in note 30.
| F-50 | ||||
Notes to the consolidated financial statements (In thousands of Brazilian reais - R$, except if otherwise indicated) | | ||||
The main assumptions used in the fair value calculation are as follows:
| Outstanding Volume (tons) | Average of contract prices R$/Bag | Average Market Prices (Corn R$/bag (ii); Soybean US$/bu(i)) | Soybean market premium (US$/bu) | Freight (R$/ton) | ||||||||||||||||||||||||||||
| Purchase Contracts | ||||||||||||||||||||||||||||||||
| Soybean | ||||||||||||||||||||||||||||||||
| As of June 30, 2022 | ||||||||||||||||||||||||||||||||
| As of June 30, 2023 | ( | |||||||||||||||||||||||||||||||
| Corn | ||||||||||||||||||||||||||||||||
| As of June 30, 2022 | N/A | |||||||||||||||||||||||||||||||
| As of June 30, 2023 | N/A | |||||||||||||||||||||||||||||||
| Selling Contracts | ||||||||||||||||||||||||||||||||
| Soybean | ||||||||||||||||||||||||||||||||
| As of June 30, 2022 | ||||||||||||||||||||||||||||||||
| As of June 30, 2023 | ||||||||||||||||||||||||||||||||
| Corn | ||||||||||||||||||||||||||||||||
| As of June 30, 2022 | N/A | |||||||||||||||||||||||||||||||
| As of June 30, 2023 | N/A | |||||||||||||||||||||||||||||||
(i)Market price published by Chicago Board of Trade which is a futures and options exchange in United States.
12. Advances to suppliers
13. Right-of-use assets and lease liabilities
Accounting policy
The Group leases commercial buildings for its administrative functions, retail stores, equipment, and vehicles. In general, lease agreements have a term of three years to eight years , but they may include extension options.
Lease terms are individually negotiated and contain differentiated terms and conditions. The lease contracts do not contain restrictive clauses, but the leased assets cannot be used as collateral for loans.
| F-51 | ||||
Notes to the consolidated financial statements (In thousands of Brazilian reais - R$, except if otherwise indicated) | | ||||
Right of use assets:
The Group recognizes right-of-use assets at the commencement date of the lease. Right-of-use assets are measured at cost, less any accumulated depreciation and impairment losses, and adjusted for any remeasurement of ease liabilities. The cost of right-of-use assets includes the amount of lease liabilities recognized, initial direct costs incurred, and lease payments made at or before the commencement date less any lease incentives received. Right-of-use assets are depreciated on a straight-line basis over the shorter of the lease term and the estimated useful lives of the assets, as follows:
| Vehicles | |||||
| Buildings | |||||
| Machines and equipment | |||||
Lease liabilities:
At the commencement date of the lease, the Group recognizes lease liabilities measured at the present value of lease payments to be made over the lease term. The lease payments include:
•fixed payments (including fixed payments in essence, less any incentives from
•amounts expected to be paid by the lessee in accordance with residual value guarantees;
•payments of fines for lease termination if the lease term reflects the lessee exercising the option to terminate the lease.
Lease payments are discounted using the lessee's incremental borrowing rate, which is the rate a lessee would have to pay on a loan to obtain the funds necessary to acquire an asset of similar value in a similar economic environment with equivalent terms and conditions.
In determining the incremental borrowing rate, the Group:
•whenever possible, uses as a starting point rates from recent financing contracts third-party financing, adjusted to reflect changes in financing conditions since such third-party financing was received;
•uses a progressive approach that starts from a risk-free interest rate adjusted for credit risk
•uses a progressive approach that takes a risk-free interest rate adjusted for credit risk for leases held by the Group with no recent third-party financing; and
•makes specific adjustments to the rate, such as to term, country, currency and collateral.
Lease payments are allocated between principal and finance expense. Finance expense is recognized in the statement of profit or loss over the lease term to produce a constant periodic rate of interest on the remaining balance of the liability for each year.
Payments associated with short-term leases of equipment and vehicles and all and leases of low-value assets are recognized as incurred as an expense in income statement. Short-term leases are those with a term of 12 months or less. Low-value
| F-52 | ||||
Notes to the consolidated financial statements (In thousands of Brazilian reais - R$, except if otherwise indicated) | | ||||
As of June 30, 2023 and 2022, the Group had no lease agreements with variable lease payments.
(a)Right-of-use assets
| Vehicles | Buildings | Machinery and equipment | Total | ||||||||||||||||||||
| Cost | |||||||||||||||||||||||
| Accumulated depreciation | ( | ( | ( | ( | |||||||||||||||||||
| Balance at June 30, 2022 | |||||||||||||||||||||||
| Cost | |||||||||||||||||||||||
| Accumulated depreciation | ( | ( | ( | ( | |||||||||||||||||||
| Balance at June 30, 2023 | |||||||||||||||||||||||
Right-of-use assets amortization expense for the year ended June 30, 2023 was R$56,236 (R$50,171 for the year ended June 30, 2022)
| F-53 | ||||
Notes to the consolidated financial statements (In thousands of Brazilian reais - R$, except if otherwise indicated) | | ||||
(b)Lease liabilities
| 2023 | 2022 | ||||||||||
| Vehicles | |||||||||||
| Buildings | |||||||||||
| Machinery and equipment | |||||||||||
| Total | |||||||||||
| Current | |||||||||||
| Non-current | |||||||||||
Total interest on lease liabilities incurred for the year ended June 30, 2023 was R$16,977 (R$13,217 for the year ended June 30, 2022).
| F-54 | ||||
Notes to the consolidated financial statements (In thousands of Brazilian reais - R$, except if otherwise indicated) | | ||||
14. Property, plant and equipment
Accounting policy
Items of property, plant and equipment are measured at historical cost of acquisition or construction, less accumulated depreciation. When significant parts of an item of property, plant and equipment have different useful lives, they are recorded as separate items (major components) of property, plant and equipment. Any gains and losses on the disposal of an item of property, plant and equipment are recognized in the statement of profit or loss. Subsequent costs are capitalized only when it is probable that future economic benefits associated with the expenditure will be earned by the Group.
Depreciation is calculated and its residual values estimated, using the straight-line method based on the estimated useful lives of the items. Depreciation is recognized in the statement of profit or loss. Land is not depreciated. The estimated useful lives of property, plant and equipment are as follows:
| Vehicles | |||||
| Building and Improvements | |||||
| Machines, equipment and facilities | |||||
| Furnitures and fixtures | |||||
| Computer equipments | |||||
The Group uses an estimated useful life of the assets to depreciate property, plant and equipment. At the end of each fiscal year, this estimate is reviewed and, if necessary, adjusted prospectively.
An asset's carrying amount is written down immediately to its recoverable amount when the asset's carrying amount is higher than its estimated recoverable value.
Gains and losses on disposals are determined by comparing the proceeds from the sale with the carrying amount and are recognized under "Other (expenses) income, net" in the statement of profit or loss.
| F-55 | ||||
Notes to the consolidated financial statements (In thousands of Brazilian reais - R$, except if otherwise indicated) | | ||||
(a)Property, plant and equipment balance is as follows:
| Vehicles | Lands, buildings and improvements | Machines, equipment and facilities | Furniture and fixtures | Computer equipment | Total | ||||||||||||||||||||||||||||||
| Cost | |||||||||||||||||||||||||||||||||||
| Accumulated depreciation | ( | ( | ( | ( | ( | ( | |||||||||||||||||||||||||||||
| Balance at June 30, 2022 | |||||||||||||||||||||||||||||||||||
| Cost | |||||||||||||||||||||||||||||||||||
| Accumulated depreciation | ( | ( | ( | ( | ( | ( | |||||||||||||||||||||||||||||
| Balance at June 30, 2023 | |||||||||||||||||||||||||||||||||||
Depreciation expense of property, plant and equipment for the year ended June 30, 2023 was R$16,408 (R$9,697 for the year ended June 30, 2022).
F-56
Notes to the consolidated financial statements (In thousands of Brazilian reais - R$, except if otherwise indicated) | | ||||
15. Intangible assets
Accounting policy
Intangible assets are recorded at acquisition cost or at the fair value of intangible assets acquired in a business combination and, for finite useful life intangibles, less accumulated amortization calculated using the straight-line method. These intangible assets have useful lives defined based on the useful economic life.
The goodwill arising on a business combination is initially measured as the excess of the consideration transferred over the fair value of the net assets acquired (net identifiable assets acquired and liabilities assumed). Subsequent to initial recognition, goodwill is measured at cost, less any accumulated impairment losses, as described in Note 16.
The useful lives and methods of amortization of intangibles are reviewed at each balance sheet date and adjusted prospectively, if appropriate.
The estimated useful lives of intangible assets for the years ended June 30, 2023 and 2022 are as follows:
| Customer relationship | |||||
| Purchase contacts | |||||
| Software and other | |||||
An intangible asset is derecognized upon disposal or when no future economic benefits are expected, and any gain or loss is recognized in the statement of profit or loss when the asset is derecognized.
The impairment policy for intangibles is described in note 16.
| F-57 | ||||
Notes to the consolidated financial statements (In thousands of Brazilian reais - R$, except if otherwise indicated) | | ||||
(b)Intangible assets balance is as follows:
| Goodwill | Customer relationship | Purchase contracts and brands | Software and other | Total | |||||||||||||||||||||||||
| Cost: | |||||||||||||||||||||||||||||
| At June 30, 2020 | |||||||||||||||||||||||||||||
| Additions | |||||||||||||||||||||||||||||
| Business combinations | |||||||||||||||||||||||||||||
| At June 30, 2021 | |||||||||||||||||||||||||||||
Additions | |||||||||||||||||||||||||||||
Business combinations (i) | |||||||||||||||||||||||||||||
Translation adjustment | ( | ( | ( | ( | |||||||||||||||||||||||||
| Other (ii) | ( | ( | |||||||||||||||||||||||||||
| At June 30, 2022 | |||||||||||||||||||||||||||||
Additions | |||||||||||||||||||||||||||||
Business combinations (i) | |||||||||||||||||||||||||||||
Other (iii) | ( | ( | |||||||||||||||||||||||||||
Translation adjustment | ( | ( | ( | ( | ( | ||||||||||||||||||||||||
| At June 30, 2023 | |||||||||||||||||||||||||||||
F-58
Notes to the consolidated financial statements (In thousands of Brazilian reais - R$, except if otherwise indicated) | | ||||
| Amortization: | |||||||||||||||||||||||||||||
| At June 30, 2020 | |||||||||||||||||||||||||||||
| Amortization for the year | |||||||||||||||||||||||||||||
| At June 30, 2021 | |||||||||||||||||||||||||||||
Amortization for the year | |||||||||||||||||||||||||||||
| At June 30, 2022 | |||||||||||||||||||||||||||||
Amortization for the year | |||||||||||||||||||||||||||||
| At June 30, 2023 | |||||||||||||||||||||||||||||
| At June 30, 2022 | |||||||||||||||||||||||||||||
| At June 30, 2023 | |||||||||||||||||||||||||||||
(i)Balances arising from business combinations (Note 21).
(ii)Balances arising from the adjustment in the purchase price from acquisition of Desempar and Cultivar, which occurred in the year ended June 30, 2021. The consideration for each acquisition was subject to post-closing price adjustments, based on the working capital variations of the purchased company.
(iii)Balance arising from the adjustment in the purchase price from acquisition of Agrozap, which occurred in the year ended June 30, 2022. The consideration for the acquisition was subject to post-closing price adjustment, based on the working capital variations of the purchased company.
F-59
Notes to the consolidated financial statements (In thousands of Brazilian reais - R$, except if otherwise indicated) | | ||||
16. Impairment testing of non-financial assets
Accounting policy
The carrying amount of the Group’s non-financial assets are reviewed at each reporting date to assess whether there is an indication of impairment. This indication may be due to internal factors arising from the operational efficiency of the assets or external factors due to the macroeconomic scenario and the behavior of the commodity prices and the U.S. dollar. If there is such indication, the recoverable amount of the asset is estimated. The recoverable amount of an asset is defined as the higher of the fair value of the asset and the value in use of its CGU, unless the asset does not generate cash inflows that are largely independent of those from other assets or groups of assets.
When the carrying amount of an asset or CGU exceeds its recoverable amount, the asset is considered impaired and a provision for impairment is recognized to adjust the carrying amount to its recoverable amount. In assessing value in use, the estimated future cash flow is discounted to present value using a pre-tax discount rate that reflects current market assessments of the time value of money and the risks specific to the asset.
Impairment losses are recognized in the statement of profit or loss in expense categories consistent with the function of the impaired asset, when applicable. A previously recognized impairment loss is reversed only if there has been a change in the assumptions used to determine the asset’s recoverable amount since the last impairment loss was recognized, except in the case of goodwill that cannot be reversed in future periods.
The Group assessed its business segments by grouping the assets of each region into independent cash-generating units (“CGUs”), which represent the smallest identifiable group of assets that generates cash inflows that are largely independent of the cash inflows from other assets or groups of assets.
Critical accounting estimates and judgments
The Group determines its cash flows based on the budgets approved by its management, which use the following assumptions: (i) revenue growth rate (ii) margins applied to the cost of sale of its products; and (iii) discount rates that reflect specific risks of each CGU. These assumptions are subject to risks and uncertainties. Therefore, it is possible that changes in circumstances may alter these projections, which may affect the recoverable amount of the assets.
| F-60 | ||||
Notes to the consolidated financial statements (In thousands of Brazilian reais - R$, except if otherwise indicated) | | ||||
Business segments are composed by certain CGUs as follows:
| Segment | Identified CGUs | |||||||
| LATAM Cluster | Colombia CGU | |||||||
| Brazil Cluster | North CGU, East CGU, South CGU | |||||||
| Crop Care Cluster | Biological products and special fertilizers CGU | |||||||
Goodwill arising from business combinations are allocated to the CGUs that benefited from the acquisition and are tested for impairment at that level.
The Group consistently monitors whether new CGUs are identified, and whether they are justifiable.
The main assumptions used in the impairment test are as follows:
| Cash-generating unit | Revenue growth rate | Operating margin average | Pre Tax discount rate | Recoverable amount | ||||||||||||||||||||||
| Colombia CGU | ||||||||||||||||||||||||||
| North CGU | ||||||||||||||||||||||||||
| East CGU | ||||||||||||||||||||||||||
| South CGU | ||||||||||||||||||||||||||
| Biological products and special fertilizers CGU | ||||||||||||||||||||||||||
| F-61 | ||||
Notes to the consolidated financial statements (In thousands of Brazilian reais - R$, except if otherwise indicated) | | ||||
17. Trade payables
Accounting policy
(a)Trade payables
| 2023 | 2022 | ||||||||||
| Trade payables – Brazil | |||||||||||
| Trade payables – Colombia | |||||||||||
| Total | |||||||||||
| Current | |||||||||||
| Non-current | |||||||||||
The average effective interest rate used to discount trade payables for the year ended June 30, 2023 was 1.58 % per month (1.18 % as of June 30, 2022).
(b)Guarantees
The Group acquires guarantees with financial institutions in connection with installment purchases of agricultural inputs from certain suppliers. These guarantees are represented by short-term bank guarantees and endorsement to the supplier of CPRs obtained from customers in the sale process. The amount of these guarantees as of June 30, 2023 was R$920,870 (R$506,750 as of June 30, 2022).
(c)Trades payable — Supplier finance
During the year ended June, 30, 2023, the Group signed agreements with financial institutions to negotiate with suppliers to extend the payment terms and discounting of trade receivable from its suppliers, with interest rates ranging from 1 and 1.5 per month. When trade payable is included in this transaction, such amount is transferred from “Trade Payables” to “Trades payable — Supplier finance”. The Group did not sign supplier finance agreements for the year ended June 30, 2022.
| F-62 | ||||
Notes to the consolidated financial statements (In thousands of Brazilian reais - R$, except if otherwise indicated) | | ||||
18. Borrowings
Accounting policy
| 2023 | 2022 | ||||||||||
| Borrowing in Colombia | |||||||||||
| Borrowings in Brazil | |||||||||||
| Total borrowings | |||||||||||
The Group’s borrowings are contracted for the purpose of strengthening the working capital and have repayment terms scheduled in conjunction with the operating cycles of each harvest.
(a)Debt composition
| Average interest rate 2023 (i) | 2023 | Average interest rate 2022 (i) | 2022 | ||||||||||||||||||||
| Debt contracts in Brazil in: | |||||||||||||||||||||||
| R$, indexed to CDI (ii) (iv) | |||||||||||||||||||||||
| R$, with fixed interest (iv) | |||||||||||||||||||||||
| U.S. Dollars, with fixed interest (iv) | |||||||||||||||||||||||
| Debt contracts in Colombia in: | |||||||||||||||||||||||
| COP, indexed to IBR (iii) / (iv) | |||||||||||||||||||||||
| COP, with fixed interest (iv) | |||||||||||||||||||||||
| Total | |||||||||||||||||||||||
| Current | |||||||||||||||||||||||
| Non-current | |||||||||||||||||||||||
(i)In order to determine the average interest rate for debt contracts with floating rates, the Group used the rates prevailing during the years.
| F-63 | ||||
Notes to the consolidated financial statements (In thousands of Brazilian reais - R$, except if otherwise indicated) | | ||||
(ii)Brazilian reais denominated debt that bears interest at the CDI Rate (see Note 8 for a definition of those indexes), plus spread.
(iii)Colombian peso-denominated debt that bears interest at the IBR rate (see Note 8 for a definition of those indexes), plus spread.
(iv)The borrowings are guaranteed by R$822 of transferred credit rights (see note 6).
(b)Movement in borrowings
| At June 30, 2020 | |||||
| Proceeds from borrowings | |||||
| Repayment of principal amount | ( | ||||
| Accrued interest | |||||
| Borrowings from acquired companies | |||||
| Interest payment | ( | ||||
| At June 30, 2021 | |||||
| Proceeds from borrowings | |||||
| Repayment of principal amount | ( | ||||
| Accrued interest | |||||
| Borrowings from acquired companies | |||||
| Interest payment | ( | ||||
| At June 30, 2022 | |||||
| Proceeds from borrowings | |||||
| Repayment of principal amount | ( | ||||
| Accrued interest | |||||
| Borrowings from acquired companies | |||||
| Exchange rate translation | |||||
| Interest payment | ( | ||||
| At June 30, 2023 | |||||
| F-64 | ||||
Notes to the consolidated financial statements (In thousands of Brazilian reais - R$, except if otherwise indicated) | | ||||
(c)Schedule of maturity of noncurrent portion of borrowings
The installments are distributed by maturity year:
| 2023 | 2022 | ||||||||||
| 2023 | |||||||||||
| 2024 | |||||||||||
| 2025 | |||||||||||
| 2026 | |||||||||||
| 2027 | |||||||||||
| Total | |||||||||||
(d)Covenants
The Group has no financial covenants as of June 30, 2023.
19. Obligations to FIAGRO quota holders
On July 22, 2022, the Group entered into an agreement to transfer receivables in the aggregate amount of R$160,000 to FIAGRO, a structured entity, as defined by IFRS 10, established under Brazilian law designed specifically for investing in agribusiness credit rights receivables. The acquisition of such receivables by the FIAGRO investment fund enables the Group to anticipate the receipt of funds from such receivables.
The Group holds all subordinated quotas issued by the FIAGRO, representing approximately 5 % of the total outstanding quotas in an aggregate amount of R$8,100 while other parties hold all senior and mezzanine quotas, representing approximately 95 % of the total outstanding quotas, which includes certain of Patria’s related parties that acquired the mezzanine quotas of FIAGRO in an aggregate amount of R$56,000 . Under the terms of the FIAGRO, we are not liable in case there is a default on the credit rights acquired by the fund, but any such default may adversely affect our stake in FIAGRO quotas. Our agreement to assign certain credit rights to FIAGRO will expire when all assigned receivables have been liquidated.
The bylaws of the FIAGRO were established by the Group at their inception, and grant the Group significant decision-making authority over these entities, such as the right to determine which credits rights are eligible to be acquired by the FIAGRO.
In addition, senior and mezzanine quota holders receive interest at a benchmark rate of return ranging from the CDI rate +2.45 % per year up to the CDI rate +8.0 % per year. Residual returns from the FIAGRO fund, if any, are paid on the
| F-65 | ||||
Notes to the consolidated financial statements (In thousands of Brazilian reais - R$, except if otherwise indicated) | | ||||
subordinated quotas, which do not bear interest and are not otherwise entitled to any pre-established rate of return. Senior and mezzanine quotas amortize annually over a three-year period after an initial 24-month grace period, whereas subordinated quotas amortize at the end of the fifth annual period.
In accordance with IFRS 10, we concluded we control FIAGRO and, therefore, it is consolidated in our financial statements. The senior and mezzanine quotas are accounted for as a financial liability under “Obligations to FIAGRO quota holders” and the remuneration paid to senior and mezzanine quota holders is recorded as interest expense.
20. Payables for the acquisition of subsidiaries
21. Acquisition of subsidiaries
Accounting policy
The acquisition method is used to account for each business combination carried out by the Group, which consists of the following:
•Determining the acquisition date;
•Determining the acquirer and the acquiree;
•Determining the consideration transferred for the acquisition of control;
•Determining the fair value of separately identifiable assets and liabilities; and
•Determining the residual goodwill or gain on bargain purchase.
The acquisition date is typically the date on which the Group assumes the control of the business.
Consideration transferred is measured at the acquisition date at the fair value of the assets transferred, including cash, the liabilities incurred, and the equity instruments issued by the Group at the acquisition date.
| F-66 | ||||
Notes to the consolidated financial statements (In thousands of Brazilian reais - R$, except if otherwise indicated) | | ||||
For each business combination, the Group measures the non-controlling interests in the acquiree based on its share of the subsidiary’s identifiable net assets. Acquisition-related costs are expensed as incurred.
When the Group acquires a business, it assesses the fair value of the assets and liabilities assumed in order to allocate them according to the contractual terms, economic circumstances and pertinent conditions at the acquisition date.
Any contingent consideration to be transferred by the acquirer is recognized at the acquisition date fair value. Subsequent changes in the fair value of the contingent consideration, considered an asset or a liability, shall be recognized in accordance with IFRS 9 Financial Instruments, in the statement of profit or loss.
Goodwill or a gain on bargain purchase is the difference between the fair value of the assets acquired and liabilities assumed, and the consideration transferred. When the consideration transferred is higher than the fair value of the net assets acquired goodwill is recognized for the difference, and it is subsequently tested for impairment. When the consideration transferred is lower that the fair value of net assets acquired, a gain on bargain purchase is recognized in the statement of profit or loss.
Intangible assets recognized within the scope of a business combination are accounted for in accordance with the accounting policy described in Note 15.
Critical accounting estimates and judgments
Accounting for business combination requires the Group to exercise critical judgment in determining the fair value of the assets and liabilities of the businesses being acquired. Accordingly, the Group makes certain assumptions about future conditions that are uncertain, including future commodity prices, interest rates, inflation and weather conditions.
Changes in some of these assumptions may impact the Group’s business and expected results may differ materially from the estimated amounts at the acquisition date.
The Group entered into several agreements to acquire groups of companies to expand its business into new markets or territories, add additional facilities, bolster its competitive edge, or acquire and access new technologies and skillsets.
| F-67 | ||||
Notes to the consolidated financial statements (In thousands of Brazilian reais - R$, except if otherwise indicated) | | ||||
(a)Acquisitions in the year ended June 30, 2023
The fair value of the identifiable assets and liabilities, consideration transferred and goodwill as of the date of each acquisition was:
| Fair value as of the acquisition date | |||||||||||||||||||||||||||||||||||
| Assets | Floema (e) | Casa Trevo (f) | Provecampo (g) | Sollo Sul and Dissul (h) | Cromo (i) | Total | |||||||||||||||||||||||||||||
| Cash equivalents | |||||||||||||||||||||||||||||||||||
| Trade receivables | |||||||||||||||||||||||||||||||||||
| Inventories | |||||||||||||||||||||||||||||||||||
| Other assets | |||||||||||||||||||||||||||||||||||
| Property, plant and equipment | |||||||||||||||||||||||||||||||||||
| Intangible assets | |||||||||||||||||||||||||||||||||||
| Liabilities | |||||||||||||||||||||||||||||||||||
| Trade payables | |||||||||||||||||||||||||||||||||||
| Borrowings | |||||||||||||||||||||||||||||||||||
| Provision for contingencies | |||||||||||||||||||||||||||||||||||
| Other liabilities | |||||||||||||||||||||||||||||||||||
| Total identifiable net assets at fair value | |||||||||||||||||||||||||||||||||||
| Non-controlling interests (1) | ( | ( | ( | ||||||||||||||||||||||||||||||||
| Goodwill arising on acquisition | |||||||||||||||||||||||||||||||||||
| Consideration transferred | |||||||||||||||||||||||||||||||||||
| Cash paid | |||||||||||||||||||||||||||||||||||
| Shares issued (1) | |||||||||||||||||||||||||||||||||||
| Payable in installments | |||||||||||||||||||||||||||||||||||
(1)The total of non-controlling interests and shares issued represents the acquisition of subsidiaries presented in the statement of changes in equity.
| F-68 | ||||
Notes to the consolidated financial statements (In thousands of Brazilian reais - R$, except if otherwise indicated) | | ||||
(b)Acquisitions in the year ended June 30, 2022
The fair value of the identifiable assets and liabilities, consideration transferred and goodwill as of the date of each acquisition was:
| Fair value as of the acquisition date | |||||||||||||||||||||||||||||||||||||||||
| Assets | Produtiva (j) | Cenagro (k) | Cenagral (l) | Union Agro (m) | Agrozap (n) | Nova Geração (o) | Total | ||||||||||||||||||||||||||||||||||
| Cash and cash equivalents | |||||||||||||||||||||||||||||||||||||||||
| Trade receivables | |||||||||||||||||||||||||||||||||||||||||
| Inventories | |||||||||||||||||||||||||||||||||||||||||
| Other assets | |||||||||||||||||||||||||||||||||||||||||
| Property, plant and equipment | |||||||||||||||||||||||||||||||||||||||||
| Intangible assets | |||||||||||||||||||||||||||||||||||||||||
| Liabilities | |||||||||||||||||||||||||||||||||||||||||
| Trade payables | |||||||||||||||||||||||||||||||||||||||||
| Borrowings | |||||||||||||||||||||||||||||||||||||||||
| Provision for contingencies | |||||||||||||||||||||||||||||||||||||||||
| Other liabilities | |||||||||||||||||||||||||||||||||||||||||
| Total identifiable net assets at fair value | |||||||||||||||||||||||||||||||||||||||||
| Non-controlling interests (1) | ( | ( | ( | ( | ( | ||||||||||||||||||||||||||||||||||||
| Goodwill arising on acquisition | - | ||||||||||||||||||||||||||||||||||||||||
| Gain on bargain purchase | - | - | - | ( | - | ( | |||||||||||||||||||||||||||||||||||
| Consideration transferred | |||||||||||||||||||||||||||||||||||||||||
| Cash paid | |||||||||||||||||||||||||||||||||||||||||
| Shares issued (1) | |||||||||||||||||||||||||||||||||||||||||
| Payable in installments | |||||||||||||||||||||||||||||||||||||||||
(1)The total of non-controlling interests and shares issued represents the acquisition of subsidiaries presented in the statement of changes in net investment.
| F-69 | ||||
Notes to the consolidated financial statements (In thousands of Brazilian reais - R$, except if otherwise indicated) | | ||||
(c)Acquisitions in the year ended June 30, 2021
The fair value of the identifiable assets and liabilities, consideration transferred and goodwill as of the date of each acquisition were:
| Fair value as of the acquisition date in 2021 | |||||||||||||||||||||||||||||||||||||||||
| Assets | Integra (p) | Quali Ciclo (q) | América (r) | Culti Var (s) | Desem Par (t) | Agrobi Ológica (u) | Total | ||||||||||||||||||||||||||||||||||
| Cash and cash equivalents | |||||||||||||||||||||||||||||||||||||||||
| Trade receivables | |||||||||||||||||||||||||||||||||||||||||
| Inventories | |||||||||||||||||||||||||||||||||||||||||
| Other assets | |||||||||||||||||||||||||||||||||||||||||
| Property, plant and equipment | |||||||||||||||||||||||||||||||||||||||||
| Intangible assets | |||||||||||||||||||||||||||||||||||||||||
| Liabilities | |||||||||||||||||||||||||||||||||||||||||
| Trade payables | |||||||||||||||||||||||||||||||||||||||||
| Borrowings | |||||||||||||||||||||||||||||||||||||||||
| Other liabilities | |||||||||||||||||||||||||||||||||||||||||
| Total identifiable net assets at fair value | |||||||||||||||||||||||||||||||||||||||||
| Non-controlling interests (1) | ( | ( | ( | ||||||||||||||||||||||||||||||||||||||
| Goodwill arising on acquisition | |||||||||||||||||||||||||||||||||||||||||
| Consideration transferred | |||||||||||||||||||||||||||||||||||||||||
| Cash paid | |||||||||||||||||||||||||||||||||||||||||
| Shares issued (1) | |||||||||||||||||||||||||||||||||||||||||
| Payable in installments | |||||||||||||||||||||||||||||||||||||||||
(1)The total of non-controlling interests and shares issued represents the acquisition of subsidiaries presented in the statement of changes in net investment.
| F-70 | ||||
Notes to the consolidated financial statements (In thousands of Brazilian reais - R$, except if otherwise indicated) | | ||||
(d)Fair value of assets acquired
The Group estimated the fair value of significant assets acquired using the following valuation methods:
| Item | 2023 | 2022 | 2021 | Nature | Valuation method | |||||||||||||||||||||||||||
| Customer relationship | A loyal relationship between the acquirees and its customers, which translates into recurring purchases of products and services | Multi Period Excess Earnings Method (MPEEM) | ||||||||||||||||||||||||||||||
| Inventories | Inventories | Selling price less all expenses related to the distribution of that good | ||||||||||||||||||||||||||||||
| Purchase Contracts | Favorable purchase contract with suppliers | Multi Period Excess Earnings Method (MPEEM) | ||||||||||||||||||||||||||||||
| Brand | Private label products (Produtiva, Union and Cenagral) | Relief from Royalty method | ||||||||||||||||||||||||||||||
There were no differences between accounting basis and tax basis on fair value adjustments, and therefore no deferred taxes were recorded, except for Provecampo, Cenagro and Cenagral, where the Group recorded a corresponding deferred tax liability of R$5,298 since the Group does not have a viable tax plan that will permit that the accounting basis and tax basis be the same after the acquisition.
(e)Acquisition of Floema
On March 22, 2022, the Group signed an agreement for the acquisition of Floema Soluções Nutricionais de Cultivos Ltda. (“Floema”), establishing the terms and other conditions for its acquisition.
The fair value of the shares issued to this acquisition was based on an equity transaction with third parties close to the acquisition date.
The acquisition was completed on August 4, 2022 and the Group currently owns a 62.61 % interest.
(f)Acquisition of Casa Trevo Participações S.A.
On May 5, 2022, the Group signed an agreement for the acquisition of Casa Trevo Participações S.A. (“Casa Trevo”), establishing the terms and other conditions for its acquisition.
| F-71 | ||||
Notes to the consolidated financial statements (In thousands of Brazilian reais - R$, except if otherwise indicated) | | ||||
The acquisition was completed on August 31, 2022 and the Group currently owns a 79.14 % interest.
(g)Acquisition of Provecampo
On June 16, 2022, the Group signed an agreement for the acquisition of Provecampo S.A.S. (“Provecampo”), an entity incorporated in Colombia, establishing the terms and other conditions for its acquisition.
The acquisition was completed on July 29, 2022 and the Group currently owns a 94.90 % interest.
(h)Acquisition of Sollo Sul e Dissul
On July 22, 2022, the Group signed an agreement for the acquisition of Sollo Sul Insumos Agrícolas Ltda (“Sollo Sul”) and Dissul Insumos Agrícolas Ltda. ("Dissul"), establishing the terms and other conditions for its acquisition.
The acquisition was completed on November 30, 2022 and the Group currently owns a 93.11 % interest.
(i)Acquisition of Cromo
On January 13, 2023, the Group signed an agreement for the acquisition of Cromo Indústria Química Ltda. (“Cromo”), establishing the terms and other conditions for its acquisition.
The acquisition was completed on May 31, 2023 and the Group currently owns a 70 % interest.
(j)Acquisition of Produtiva
On June 23, 2021, an agreement was signed between Produtec Comércio e Representações S.A. (“Produtec”), a subsidiary of Lavoro Brazil, to acquire Produtiva Agronegócios Comércio e Representações S.A. (“Produtiva”), establishing the terms and other conditions for its acquisition.
The fair value of the shares issued to this acquisition was based on an equity transaction with third parties close to the acquisition date.
The acquisition was completed on September 2, 2021, and the Group currently indirectly owns an 87.40 % interest.
Under the terms of the acquisition agreement the Group is committed to repaying the sellers an amount of R$4,733 related to the successful collection of receivables past due as of the acquisition date.
| F-72 | ||||
Notes to the consolidated financial statements (In thousands of Brazilian reais - R$, except if otherwise indicated) | | ||||
(k)Acquisition of Cenagro
On July 28, 2021, the Group signed an agreement to acquire Grupo Cenagro SAS (“Cenagro”), an entity incorporated in Colombia, establishing the terms and other conditions for its acquisition.
The acquisition was completed on August 31, 2021 and the Group currently owns an 94.90 % interest in Cenagro.
(l)Acquisition of Cenagral
On July 28, 2021, the Group signed an agreement to acquire Cenagral SAS (“Cenagral”), an entity incorporated in Colombia, establishing the terms and other conditions for its acquisition.
The acquisition was completed on August 31, 2021 and the Group currently owns an 94.90 % interest in Cenagral.
(m)Acquisition of Union Agro
On July 26, 2021, the Group signed an agreement to acquire Union Agro S.A. (“Union Agro”), establishing the terms and other conditions for its acquisition.
The acquisition was completed on October 28, 2021 and the Group currently owns a 73 % interest.
A gain on bargain purchase in the amount of R$18,295 was recognized on the acquisition date. This gain is recorded under other operating income, net, as discussed in Note 31.
(n)Acquisition of Agrozap
On August 5, 2021, the Group signed an agreement for the acquisition of Facirolli Comércio e Representações Ltda. (“AgroZap”), establishing the terms and other conditions for its acquisition.
The acquisition was completed on January 7, 2022 and the Group currently owns a 62.61 % interest.
Under the terms of the acquisition agreement, the Group is committed to repaying the sellers an amount of R$4,029 related to the successful collection of receivables past due as of the acquisition date.
(o)Acquisition of Nova Geração
On December 24, 2021, the Group signed an agreement for the acquisition of Nova Geração Comércio de Produtos Agrícolas Ltda. (“Nova Geração”), establishing the terms and other conditions for its acquisition.
| F-73 | ||||
Notes to the consolidated financial statements (In thousands of Brazilian reais - R$, except if otherwise indicated) | | ||||
The acquisition was completed on April 6, 2022 and the Group currently owns a 66.75 % interest.
Total consideration transferred amounted to R$30,668 of which R$10,930 was paid in cash on the closing date of the acquisition, which occurred on April 6, 2022 and R$7,807 was paid in shares. The remaining R$11,931 was paid in cash in April 2023.
(p)Acquisition of Integra
On June 18, 2020, an agreement was signed between a subsidiary of Lavoro Brazil, Produtec Comércio e Representações S.A. (“Produtec”), and the shareholders of Integra Soluções Agrícolas Ltda. (“Integra”), establishing the terms and other conditions for its acquisition.
Consideration transferred to the acquisition was composed of 70.3 % to be paid in cash and 29.7 % settled in shares issued by Produtec to the selling shareholders representing 8.4 % of its capital. The fair value of these shares was R$12,848 and was based on an equity transaction with third parties close to the acquisition date.
The acquisition was completed on September 1, 2020, and the Group currently indirectly owns 72.42 % interest at Integra through Produtec, which directly owns 100 % of Integra.
(q)Acquisition of Qualiciclo
On July 17, 2020, an agreement was signed between the Group and the shareholders of Qualiciclo Agrícola S.A. (“Qualiciclo”), establishing the terms and other conditions for its acquisition.
The acquisition was completed on November 17, 2020. The Group currently owns a 66.75 % interest.
Under the terms of the agreement the Group is committed the repay the sellers amounts related to the successful collection of administrative proceeding on tax credits with the RFB in the amount of R$13,844 . The Group recognizes an account payable for the amounts of probable disbursements as of the acquisition date.
(r)Acquisition of América
On September 11, 2020, an agreement was signed between the Group and the shareholders of América Insumos Agrícolas Ltda. (“América”), establishing the terms and other conditions for its acquisition.
The acquisition was completed on December 30, 2020. The Group currently owns a 100 % interest.
| F-74 | ||||
Notes to the consolidated financial statements (In thousands of Brazilian reais - R$, except if otherwise indicated) | | ||||
(s)Acquisition of Cultivar
On November 12, 2020, an agreement was signed between Distribuidora Pitangueiras de Produtos Agropecuários S.A, a subsidiary Lavoro Agro, and the current shareholders of Cultivar Agrícola e Comércio, Importação e Exportação Ltda. (“Cultivar”), establishing the terms and other conditions for its acquisition.
Pitangueiras became the parent company of Cultivar, holding 63.47 % of its capital on the deal’s closing date, April 1, 2021. The contract guarantees the payment of installment in the event of successful collection of receivables past due at the acquisition date in the amount of R$5,752 . The Group recognizes an account payable for the amounts for which there are probable disbursements.The Group currently owns a 93.11 % interest.
(t)Acquisition of Desempar
On December 4, 2020, an agreement was signed by the Group for the acquisition of Desempar Participações Ltda. (“Desempar”), establishing the terms and other conditions for its acquisition.
The acquisition was completed on March 31, 2021. The Group currently owns 93.11 % interest.
(u)Acquisition of Agrobiológica
On July 21, 2020, an agreement was signed by Agrobiológica Sustentabilidade S.A. (formerly Maneogene Agrociência S.A.) (“Agrobiológica Sustentabilidade”), a subsidiary Lavoro Brazil, to acquire Agrobiológica Soluções Naturais Ltda. (“Agrobiológica”), establishing the terms and other conditions for its acquisition.
Consideration transferred to the acquisition was composed of 55.2 % to be paid in cash and 44.8 % settled in shares issued by Agrobiológica Sustentabilidade to the selling shareholders representing 34.9 % of its capital. The fair value of the shares issued was R$18,006 and was based on discounted cash flow methodology.
The acquisition was completed on August 28, 2020. The Group currently indirectly owns 65.13 % interest at Agrobiológica through Agrobiológica Sustentabilidade, which directly owns 100 % interest at Agrobiológica.
| F-75 | ||||
Notes to the consolidated financial statements (In thousands of Brazilian reais - R$, except if otherwise indicated) | | ||||
(v)Pro forma information (unaudited)
The following tables discloses the Group’s revenues and profit or loss for the year assuming all of the acquisitions completed during the year were completed at the beginning of such year:
| 2023 | 2022 | 2021 | |||||||||||||||
| Revenues | |||||||||||||||||
| Profit (loss) for the year | ( | ||||||||||||||||
(w)Revenues and results from new subsidiaries
The revenues and profit or loss of the acquisitions from the acquisition date through the end of the fiscal year in which the acquisition was completed and included in the consolidated statement of profit or loss are as follows:
Acquisitions in the year ended June 30, 2023:
| Revenues | Profit (loss) | Period from | ||||||||||||||||||
| Provecampo | August 2022 | |||||||||||||||||||
| Floema | August 2022 | |||||||||||||||||||
| Casa Trevo | September 2022 | |||||||||||||||||||
| Sollo Sul | ( | December 2022 | ||||||||||||||||||
| Cromo | ( | May 2023 | ||||||||||||||||||
| Total | ||||||||||||||||||||
Acquisitions in the year ended June 30, 2022:
| Revenues | Profit | Period from | ||||||||||||||||||
| Produttiva | September, 2021 | |||||||||||||||||||
| Cenagro | September, 2021 | |||||||||||||||||||
| Cenagral | ( | September, 2021 | ||||||||||||||||||
| Union Agro | November, 2021 | |||||||||||||||||||
| Agrozap | January, 2022 | |||||||||||||||||||
| Nova Geração | ( | January, 2022 | ||||||||||||||||||
| Total | ||||||||||||||||||||
| F-76 | ||||
Notes to the consolidated financial statements (In thousands of Brazilian reais - R$, except if otherwise indicated) | | ||||
Acquisitions in the year ended June 30, 2021:
| Revenues | Profit | Period from | ||||||||||||||||||
| Integra | ( | September, 2020 | ||||||||||||||||||
| Agrobiológica | September, 2020 | |||||||||||||||||||
| Qualiciclo | ( | December, 2020 | ||||||||||||||||||
| América | January, 2021 | |||||||||||||||||||
| Cultiva | ( | April, 2021 | ||||||||||||||||||
| Desempar | ( | April, 2021 | ||||||||||||||||||
| Total | ( | |||||||||||||||||||
(x)Signed agreement for future acquisitions
-Acquisition of NS Agro S.A. (“NS Agro”)
The Group signed an agreement on August 25, 2022, for the acquisition of 82 % interest in NS Agro S.A. (“NS Agro”), establishing the terms and other conditions for its acquisition. Consideration to be transferred for the acquisition amounted to R$664,210 to be paid in cash in three installments. The completion of this acquisition is subject to the usual precedent conditions for this type of transaction, including the approval by the regulatory authorities in Brazil, and has not been completed by the Group as of the issuance date of these financial statements.
22. Accounting considerations related to the SPAC Transaction
On February 28, 2023, Lavoro and TPB Acquisition Corp. consummated a capital reorganization transaction as described in note 1.b.
The SPAC Transaction was accounted for as a capital reorganization in accordance with IFRS 2, Share-based Payment. Under this method of accounting, TPB Acquisition Corp. is treated as the “acquired” company for financial reporting purposes and Lavoro as the accounting “acquirer”. The net assets of TPB Acquisition Corp were stated at historical cost, with no goodwill or other intangible assets recorded. The SPAC Transaction, which is not within the scope of IFRS 3, since TPB Acquisition Corp. did not meet the definition of a “business” pursuant to IFRS 3, was accounted for within the scope of IFRS 2 — Share-Based Payments, or IFRS 2. Any excess of fair value of Lavoro’s ordinary shares issued over the fair value of TPB Acquisition Corp identifiable net assets acquired represents compensation for the service of a stock exchange listing for its shares and is expensed as incurred.
| F-77 | ||||
Notes to the consolidated financial statements (In thousands of Brazilian reais - R$, except if otherwise indicated) | | ||||
Critical accounting estimates and judgments
Accounting of SPAC transaction is considered a critical accounting estimate primarily due to the complex nature of the transaction, including the determination the accounting acquirer and assess it as a corporate reorganization, the calculation of the listing expenses and the determination of the accounting treatment of the financial instruments.
Changes in some of these assumptions could impact the consolidated financial statements.
Accordingly, the Group recorded a listing expense as follows:
| As of February 27, 2023 | |||||
| Deemed cost of shares issued to TPB Acquisition Corp shareholders (i) | |||||
| Less: Net assets of TPB Acquisition Corp at historical cost | ( | ||||
| Listing expense | |||||
Warrants
TPB Acquisition Corp. issued 10,083,606 public and private warrants to certain of its shareholders and its maturity is February 28, 2028. Such public and private warrants were assumed by Lavoro as a result of the SPAC Transaction. The outstanding warrants as of June 30, 2023, is 10,083,592 and aggregate fair value of the private and public warrants is R$36,446 , and the warrants are reported in the consolidated statement of financial position as warrant liabilities under non-current liabilities. For the year ended June 30, 2023, the Group recognized a gain of R$3,756 related to changes to the fair value of public warrants and private warrants. The fair value of the warrants was calculated based on the listed market price of such warrants.
Vesting founder shares and unvested founder shares
As part of the SPAC Transaction certain TPB Acquisition Corp.’s shareholders were issued a number of Lavoro ordinary shares tin exchange of TPB Acquisition Corp.’s Class B Ordinary Share that they held prior to the completion of the SPAC Transaction, of which (i) Two-thirds (3,006,050 ) of such Lavoro ordinary share were deemed to be vesting founder share, and (ii) one-third (1,503,025 ) of such Lavoro ordinary share were issued to those shareholders.
| F-78 | ||||
Notes to the consolidated financial statements (In thousands of Brazilian reais - R$, except if otherwise indicated) | | ||||
Vesting founder shares will be subject to certain vesting conditions. If at any time during the 3 -year period following the close of the SPAC Transaction, for over any 20 trading days within any consecutive 30 trading day period, the closing share price of Lavoro ordinary share is greater than or equal to:
-$12.50 , then one-half of the vesting founder shares will vest; and
-$15.00 , then an additional one-half of the vesting founder shares will vest.
Lavoro’s ordinary share price targets will be equitably adjusted for stock splits, stock dividends, cash dividends, reorganizations, combinations, recapitalizations and similar transactions affecting Lavoro’s ordinary shares. Any vesting founder shares that will not vest during the 3 -year period following the closing of the SPAC Transaction will be forfeited after the 3 -year period.
The vesting founder shares are considered equity classified contingent considerations under IFRS 2 and are reported as additional paid-in capital under equity.
In order to determine the fair value of the Vesting Founder Shares as of the closing of the SPAC Transaction, a Monte Carlo simulation was used, where the future stock price was modeled such that it follows a geometric Brownian motion with constant drift and volatility, where volatility was based on quoted prices of comparable companies. A volatility rate of 54.4 % and a risk-free rate of 4.51 % were used in the model. Value per share was $9.53 and $8.53 for the shares vesting at $12.50 and $15.00 , respectively. In order to determine the fair value of the Unvested Founder Shares as of the closing of the SPAC Transaction, the shares were discounted using a Finnerty put model, assuming a risk-free rate of 4.88 %, volatility rate of 54.4 %, and a restricted term of 3 months (the estimated time to complete a registration statement). Value per share was determined to be $10.08 .
Forward share purchase agreements
TPB Acquisition Corp. entered into certain Forward Share Purchase Agreements with certain shareholders of TPB Acquisition Corp., in which TPB Acquisition Corp. agreed to purchase, in the aggregate, up to 2,830,750 of TPB Acquisition Corp.’s Class A Ordinary Shares held by those equity holders, either after 24 months after closing of the SPAC Transaction or after meeting certain criteria as defined in the Forward Share Purchase Agreements. Such Forward Share Purchase Agreements were assumed by Lavoro, whereby Lavoro agreed to purchase the same number of Lavoro’s ordinary shares under the same conditions as defined in those Forward Share Purchase Agreements. Lavoro placed a designated balance of funds into an escrow account at the closing of the SPAC Transaction for the purpose acquiring such shares.
| F-79 | ||||
Notes to the consolidated financial statements (In thousands of Brazilian reais - R$, except if otherwise indicated) | | ||||
23. Income taxes
Accounting policy
(a)Current income tax
Current income tax assets and liabilities are measured at the amount expected to be recovered from or paid to the taxation authorities. The tax rates and tax laws used to compute the amount are those that are enacted or substantively enacted at the reporting date in the countries where the Group operates and generates taxable income. Current income tax relating to items recognized directly in equity is recognized in equity and not in the statement of profit or loss.
Management periodically evaluates positions taken in the tax returns with respect to situations in which applicable tax regulations are subject to interpretation and establishes provisions where appropriate.
Income taxes in Brazil and Colombia are paid by each legal entity on a stand alone basis.
(b)Deferred tax
Deferred taxes is provided using the liability method on temporary differences between the carrying amount of assets and liabilities and their tax basis.
Deferred tax liabilities are recognized for all taxable temporary differences, except:
•When the deferred tax liability arises from the initial recognition of goodwill or an asset or liability in a transaction that is not a business combination and, at the time of the transaction, affects neither the accounting profit nor taxable profit or loss;
•With respect to taxable temporary differences associated with investments in subsidiaries, associates and interests in joint arrangements, when the timing of the reversal of the temporary differences can be controlled and it is probable that the temporary differences will not reverse in the foreseeable future.
| F-80 | ||||
Notes to the consolidated financial statements (In thousands of Brazilian reais - R$, except if otherwise indicated) | | ||||
Deferred tax assets are recognized for all deductible temporary differences, the carry forward of unused tax credits and any unused tax losses. Deferred tax assets are recognized to the extent that it is probable that taxable profit will be available against which the deductible temporary differences, and the carry forward of unused tax credits and unused tax losses can be utilized, except:
•When the deferred tax asset relating to the deductible temporary difference arises from the initial recognition of an asset or liability in a transaction that is not a business combination and, at the time of the transaction, affects neither the accounting profit nor taxable profit or loss
•In respect of deductible temporary differences associated with investments in subsidiaries, deferred tax assets are recognized only to the extent that it is probable that the temporary differences will reverse in the foreseeable future and taxable profit will be available against which the temporary differences can be utilized.
The carrying amount of deferred tax assets is reviewed at each reporting date and reduced to the extent that it is no longer probable that sufficient taxable profit will be available to allow all or part of the deferred tax asset to be utilized.
Unrecognized deferred tax assets are re-assessed at each reporting date and are recognized to the extent that it has become probable that future taxable profits will allow the deferred tax asset to be recovered. In assessing the recoverability of deferred tax assets, the Group relies on the same forecast assumptions used elsewhere in the financial statements and in other management reports.
The benefits of uncertain tax positions are recorded only after determining, based on the position of its internal and external legal advisors, a more-likely-than-not probability that the uncertain tax positions will withstand challenge, if any, from taxing authorities.
Deferred tax assets and liabilities are offset where there is a legally enforceable right to offset current tax assets and liabilities and where the deferred tax balances relate to the same taxation authority.
Critical accounting estimates and judgments
Significant judgements, estimates and assumptions are required to determine the amount of deferred tax assets that are recognized based on the likely timing and future taxable profits. Deferred tax assets arising from tax losses carryforward and temporary differences are recognized considering assumptions and projected cashflows. Deferred tax assets may be affected by factors including, but not limited to: (i) internal assumptions on the projected taxable income, which are based on sales planning, operational costs and planned capital costs; (ii) macroeconomic environment; and (iii) trade and tax scenarios.
| F-81 | ||||
Notes to the consolidated financial statements (In thousands of Brazilian reais - R$, except if otherwise indicated) | | ||||
(a)Reconciliation of income taxes expense
| 2023 | 2022 | 2021 | |||||||||||||||
| Profit (loss) before income taxes | ( | ||||||||||||||||
| Statutory rate (i) | |||||||||||||||||
| Income taxes at statutory rate | ( | ( | |||||||||||||||
| Unrecognized deferred tax asset (ii) | ( | ( | ( | ||||||||||||||
| Difference from income taxes calculation based on taxable profit computed as a percentage of gross revenue | |||||||||||||||||
| Deferred income taxes over goodwill tax recoverable | ( | ||||||||||||||||
| Tax benefit (iii) | |||||||||||||||||
| Other | ( | ( | ( | ||||||||||||||
| Income tax expense | ( | ( | |||||||||||||||
| Income tax and social contribution effective rate | ( | ||||||||||||||||
| Current income taxes | ( | ( | |||||||||||||||
| Deferred income taxes | |||||||||||||||||
(i)The effective tax rate reconciliation considers the statutory income taxes rates in Brazil, due to the significance of the Brazilian operation when compared to Colombia. The difference to reconcile the effective rate to the Colombian statutory rate (32%) is included in others.
(ii)The Group did not recognize deferred tax assets on accumulated tax losses from certain subsidiaries in a total amount of unrecognized credits on tax losses of R$187,310 (R$7,055 for June 30, 2022 and R$11,755 for June 30, 2021). The Group assessed that is unlikely that these subsidiaries will generate future taxable income in the foreseeable future.
(iii)This amount reflects the tax benefit from the deduction of the ICMS tax benefits in the calculation of the income tax (see note 10).
| F-82 | ||||
Notes to the consolidated financial statements (In thousands of Brazilian reais - R$, except if otherwise indicated) | | ||||
(b)Deferred income taxes balances
| 2023 | 2022 | ||||||||||
| Deferred assets and liabilities: | |||||||||||
| Amortization of fair value adjustment | |||||||||||
| Tax losses | |||||||||||
| Allowance for expected credit losses | |||||||||||
| Adjustment to present value | |||||||||||
| Provision for management bonuses | |||||||||||
| Allowance for inventory losses | |||||||||||
| Financial effect on derivatives | ( | ||||||||||
| Fair value of commodity forward contracts | ( | ||||||||||
| Unrealized exchange gains or losses | ( | ( | |||||||||
| Unrealized profit in Inventories | ( | ||||||||||
| Gain on bargain purchase | ( | ||||||||||
| Amortized right-of-use assets | |||||||||||
| Deferred tax on goodwill | ( | ||||||||||
| Other provisions | ( | ||||||||||
| Deferred income tax assets, net | |||||||||||
| Deferred income tax liabilities, net | ( | ( | |||||||||
| Deferred income tax assets, net | |||||||||||
| Deferred income tax and social contribution | |||||
| At June 30, 2021 | |||||
| Recognized in the statement of profit or loss | |||||
| At June 30, 2022 | |||||
| Recognized in the statement of profit or loss | |||||
| Deferred tax from acquired companies | ( | ||||
| At June 30, 2023 | |||||
| F-83 | ||||
Notes to the consolidated financial statements (In thousands of Brazilian reais - R$, except if otherwise indicated) | | ||||
The aging analysis of net deferred income tax is as follow:
| 2023 | |||||
| Up to 1 year | |||||
| Over 1 year | |||||
| Total | |||||
24. Provisions for contingencies
Provisions are recognized when the Group has a present legal or constructive obligation as a result of past events, it is probable that an outflow of resources will be required to settle the obligation, and the amount can be reliably estimated. Provisions are reviewed and adjusted to reflect management’s best estimate at the reporting dates.
Probable losses
The balance of probable losses from civil, tax and labor contingencies recognized by the Group was R$8,845 and R$2,966 respectively as of June 30, 2023 and June 30, 2022.
Possible losses
The Group is a party to various proceedings involving tax, environmental and civil matters that were assessed by management, under advice of legal counsel, as possibly leading to losses. Possible losses from contingencies amounted to R$77,724 and R$11,600 as of June 30, 2023 and June 30, 2022, respectively.
25. Advances from customers
| F-84 | ||||
Notes to the consolidated financial statements (In thousands of Brazilian reais - R$, except if otherwise indicated) | | ||||
(a)Movement in the year
| 2023 | 2022 | 2021 | |||||||||||||||
| Balance as of the beginning of the year | |||||||||||||||||
| Revenue recognized that was included in the contract liability balance at the beginning of the year | ( | ( | ( | ||||||||||||||
| Increase in advances | |||||||||||||||||
| Advances from acquired companies | |||||||||||||||||
| Balance at the end of the year | |||||||||||||||||
26. Related parties
Related parties of the Group that have receivable, payable or other balances are either (i) Non-controlling shareholders, (ii) Patria Investments Limited, which manages the funds that control the Group, or (iii) Key management personnel.
(a)Breakdown of assets and liabilities:
| 2023 | 2022 | ||||||||||
| Assets | |||||||||||
| Trade receivables (i) | |||||||||||
| Advances to suppliers (i) | |||||||||||
| Total assets | |||||||||||
| Liabilities | |||||||||||
| Trade payables (i) | |||||||||||
| Advances from customers (i) | |||||||||||
| Payables for the acquisition of subsidiaries (ii) | |||||||||||
| Total liabilities | |||||||||||
(i)Refer to commercial transactions in the ordinary course of business with non-controlling shareholders of subsidiaries. Such transactions are carried at the same commercial terms as non-related parties customers.
(ii)Payments in installments to the non-controlling shareholders related to certain business combinations as described in Note 20.
| F-85 | ||||
Notes to the consolidated financial statements (In thousands of Brazilian reais - R$, except if otherwise indicated) | | ||||
(b)Statement of profit or loss
| 2023 | 2022 | 2021 | |||||||||||||||
| Revenue from sales of products (i) | |||||||||||||||||
| Monitoring expenses (ii) | ( | ( | |||||||||||||||
| Interest on payables for the acquisition of subsidiaries | ( | ||||||||||||||||
| Other expenses | ( | ( | |||||||||||||||
| - | |||||||||||||||||
| Total | |||||||||||||||||
(i)Refer to commercial transactions in the ordinary course of business with non-controlling shareholders of subsidiaries. Such transactions are carried at the same commercial terms as non-related party customers.
(ii)Expenses paid to the Parent in relation to management support services for acquisition transactions by Gestão e Transformação S.A.
(c)Key management personnel compensation
| 2023 | 2022 | 2021 | |||||||||||||||
| Wages | |||||||||||||||||
| Direct and indirect benefits | |||||||||||||||||
| Variable compensation (bonuses) | |||||||||||||||||
| Short-term benefits | |||||||||||||||||
| Share-based payment benefits | |||||||||||||||||
| Total | |||||||||||||||||
27. Equity
(a)Prior reorganization
The financial statements were prepared in accordance with principles described in Note 2. No share capital is presented. The net investment and the profit for the year is derived by aggregating the net assets and business activities of the Group.
Acquisitions of non-controlling interests in the year ended June 30, 2023:
In 2022, the Group acquired an additional 26.24 % stake of Cultivar for R$42,500 . The carrying amount of the 26.24 % non-controlling interest was R$16,607 . The
| F-86 | ||||
Notes to the consolidated financial statements (In thousands of Brazilian reais - R$, except if otherwise indicated) | | ||||
Group recognized a decrease in non-controlling interest of R$16,607 and a decrease in net investment of the Parent of R$25,893 .
In 2022, the Group acquired an additional 6.89 % stake of Pitangueiras for R$45,000 . The carrying amount of the 6.89 % non-controlling interest was R$19,569 . The Group recognized a decrease in non-controlling interest of R$19,569 and a decrease in net investment of the Parent of R$25,431 . Agrovenci, Qualiciclo, Desempar Participações, Denorpi, Deragro, Desempar Tecnologia, Futuragro, Plenafértil, Realce, Cultivar and Nova Geração are direct or indirect controlled by Pitangueiras and the equity interest of each subsidiary were changed on the consolidated financial statements as described in note 2.c. Additionally, the Group paid R$13,387 related to non-controlling interests on Produtec.
The effect on the total net investment during the period is summarized as follow:
Pre reorganization:
| Carrying amount of non-controlling interests acquired | |||||
| Consideration paid to non-controlling interests | ( | ||||
| Excess of consideration paid recognized in net investment of the Parent | ( | ||||
Acquisitions of non-controlling interests in the year ended June 30, 2022:
In December 2021, the Group acquired an additional 20 % stake of Group Cenagro through the exchange of shares of Lavoro Colombia SAS representing a 2.68 % interest. No cash consideration was paid. The fair value of such shares was R$6,480 and the carrying amount of the 20 % non-controlling interest was R$4,602 . The fair value of the consideration was based on an equity transaction with third partiesclose to the acquisition date.The Group recognized an increase in non-controlling interest of R$1,878 and a decrease in net investment of the Parent of R$1,878 .
In June 2022, the Group acquired an additional 5.77 % stake of Lavoro Agrocomercial S.A. paid in cash for R$16,782 . The carrying amount of the 5.77 % non-controlling interest was R$9,769 . The Group recognized a decrease in non-controlling interest of R$9,769 and a decrease in net investment of the Parent of R$7,013 .
In June 2022, the Group acquired an additional 7.65 % stake of Produtec Comércio e Representações S.A. paid in cash for R$17,569 . The carrying amount of the 6.89 % non-controlling interest was R$23,203 . The Group recognized a decrease in non-controlling interest of R$23,203 and an increase in net investment of the Parent of R$5,634 .
| F-87 | ||||
Notes to the consolidated financial statements (In thousands of Brazilian reais - R$, except if otherwise indicated) | | ||||
The effect on the total net investment during the year is summarized as follow:
In the year ended June 30, 2022:
| Carrying amount of non-controlling interests acquired | ||||||||
| Difference between consideration paid in shares and non-controlling interest acquired | ( | |||||||
| Total carrying amount of non-controlling interests acquired, net | ||||||||
| Consideration paid to non-controlling interests | ( | |||||||
| Excess of consideration paid recognized in net investment of the Parent | ( | |||||||
Acquisitions of non-controlling interests in the year ended June 30, 2021:
In fiscal year ended June 30, 2021, the Group acquired an additional 8.94 % stake of Lavoro Agrocomercial paid in cash for R$79,493 . The carrying amount of the 8.94 % non-controlling interest was R$57,422 . The Group recognized a decrease in non-controlling interests of R$57,422 and a decrease in net investment of the Parent of R$22,071 , as follows:
| Carrying amount of non-controlling interests acquired | ||||||||
| Consideration paid in cash to non-controlling interests | ( | |||||||
| Excess of consideration paid recognized in net investment of the Parent | ( | |||||||
(b)After reorganization
The following table illustrates the impact of the closing of SPAC Transaction on the shareholders’ equity of the Lavoro:
| Ordinary authorized and issued shares | Number of shares | Share capital | Additional Paid-in Capital | ||||||||||||||
| Net investment | - | - | - | ||||||||||||||
| Shares issued to the shareholders of Lavoro Agro Limited | |||||||||||||||||
| Shares issued to the shareholders of TPB Acquisition Corp | |||||||||||||||||
| As of June 30, 2023 | |||||||||||||||||
Ordinary Shares
A Lavoro ordinary shares have a par value of US$0.001 and are entitled to one vote per share.
Other capital reserves
Other capital reserves is comprised of a reserve set-up by the Group share-based payment (an equity-settled share-based compensation plan).
| F-88 | ||||
Notes to the consolidated financial statements (In thousands of Brazilian reais - R$, except if otherwise indicated) | | ||||
Share based payment
Accounting policy for share based payment
Equity-settled transactions
The cost of equity-settled transactions is determined by the fair value at the date when the grant is made using an appropriate valuation model. That cost is recognized in personnel expenses (Note 29), together with a corresponding increase in equity (other capital reserves), over the period in which the service and, where applicable, the performance conditions are fulfilled (the vesting period). The cumulative expense recognized for equity-settled transactions at each reporting date until the vesting date reflects the extent to which the vesting period has expired and the Group’s best estimate of the number of equity instruments that will ultimately vest.
Service conditions are not taken into account when determining the grant date fair value of awards, but the likelihood of the conditions being met is assessed as part of the Group’s best estimate of the number of equity instruments that will ultimately vest. Market performance conditions are reflected within the grant date fair value. Any other conditions attached to an award, but without an associated service requirement, are considered to be non-vesting conditions.
No expense is recognized for awards that do not ultimately vest because non-market performance and/or service conditions have not been met. Where awards include a market or non-vesting condition, the transactions are treated as vested irrespective of whether the market or non-vesting condition is satisfied, provided that all other performance and/or service conditions are satisfied.
When the terms of an equity-settled award are modified, the minimum expense recognized is the grant date fair value of the unmodified award, provided the original vesting terms of the award are met. An additional expense, measured as at the date of modification, is recognized for any modification that increases the total fair value of the share-based payment transaction, or is otherwise beneficial to the employee. Where an award is cancelled by the entity or by the counterparty, any remaining element of the fair value of the award is expensed immediately through profit or loss.
Share-based payment (“SBP”)
On August 17, 2022, the Group approved the Lavoro Agro Holding S.A. Long-Term Incentive Policy (the “Lavoro Share Plan”). Under the Lavoro Share Plan, individuals selected by the Lavoro board of directors (“Selected Employees”) are eligible to receive incentive compensation consisting of cash, assets or share options issued by Lavoro Agro Limited, in an amount linked to the appreciation in the Lavoro
| F-89 | ||||
Notes to the consolidated financial statements (In thousands of Brazilian reais - R$, except if otherwise indicated) | | ||||
Agro Limited share price at the time of the liquidity event, upon the satisfaction of certain conditions, as described below.
As of June 30, 2023, Lavoro has granted 49,518,732 share options as incentive compensation to Selected Employees. Share options granted under the Lavoro Share Plan will vest in the event the following market conditions are met (the “Market Conditions”):
(i)the occurrence of a liquidity event satisfying a minimum internal rate of return specified in the Lavoro Share Plan; and
(ii)the price per share obtained under such liquidity event must be greater than or equal to one of the following amounts:
(a)a pre-established reference price multiplied by three; or
(b)an amount calculated in accordance with a pre-established formula, in each case specified under the Lavoro Share Plan.
Moreover, upon the satisfaction of the Market Conditions, such share options will vest according to the following schedule (the “Service Conditions”):
(i)one-third of the options vest on the third anniversary of the grant date;
(ii)one-third of the options vest on the fourth anniversary of the grant date; and
(iii)one-third of the options vest on the fifth anniversary of the grant date.
The Lavoro Share Plan has a term of five years : if the Market Conditions have not been satisfied within this year, all options granted under the Lavoro Share Plan will be extinguished, with no further payment or incentive obligation remaining due by Lavoro. The consummation of the SPAC Transaction (see note 1) did not satisfy the Market Conditions.
As of February 28, 2023, the shareholders of Lavoro approved the Lavoro Share Plan. As a result, Lavoro reserved for issuance the number of ordinary shares equal to the number of Lavoro Share Plan Shares under the Lavoro Share Plan, as adjusted in accordance with the Business Combination Agreement, in an amount of 1,663,405 ordinary shares.
The exercise price of the share-based payment is equal to the options price agreed with the employee in the contracts, representing the amount of R$1 monetarily adjusted until the date on which the liquidity event occurs.
The fair value of share options granted is estimated at the date of grant considering the terms and conditions using the Black-Scholes model, taking into account the terms and conditions on which the share options were granted. The model also takes into account historical and expected dividends, and the share price volatility of Lavoro.
| F-90 | ||||
Notes to the consolidated financial statements (In thousands of Brazilian reais - R$, except if otherwise indicated) | | ||||
On May 26, 2023 the Board of Directors approved a long-term incentive plan (the “New Lavoro Equity Plan”) in which eligible participants may include members of our management, our employees and our directors. Beneficiaries under the New Lavoro Equity Plan will be granted equity awards pursuant to the terms and conditions of the New Lavoro Equity Plan and any applicable award agreement.
The expense recognized for employee services received during the year and the number of options granted is shown in the following tables:
| Other capital reserves | |||||
| At June 30, 2022 | |||||
| Share-based payments expense during the year | |||||
| At June 30, 2023 | |||||
| Options granted | ||||||||
| At June 30, 2022 | ||||||||
| Granted options | ||||||||
| Canceled | ( | |||||||
| At June 30, 2023 | ||||||||
The weighted average fair value of the options granted during the period was R$0.44 per option. The significant data included in the model were: weighted average share price of R$2.88 on the grant date, exercise price presented above, volatility of 33.88 %, no dividend yield, an expected option life of 3.37 years and a risk-free annual interest rate of 12.45 %.
Earnings per share
Earnings (loss) per share is calculated by dividing the profit (loss) for the period attributable to net investment of the parent/equity holders of the parent by the weighted average number of common shares available during the fiscal year. Diluted earnings (loss) per share is calculated by adjusting the weighted average number of common shares, presuming the conversion of all the potential diluted common shares.
| F-91 | ||||
Notes to the consolidated financial statements (In thousands of Brazilian reais - R$, except if otherwise indicated) | | ||||
The number of ordinary shares issued by Lavoro, as a result of the corporate reorganization is reflected retroactively, for purposes of calculating earnings per share in all prior periods presented.
The table below show data used in calculating basic and diluted earnings (loss) per share attributable to the net investment of the parent/equity holders of the parent:
| 2023 | 2022 | 2021 | |||||||||||||||
| Weighted average ordinary shares of Lavoro | |||||||||||||||||
| Effects of dilution from: | |||||||||||||||||
| Share-based payment(i) | |||||||||||||||||
| Number of ordinary shares adjusted for the effect of dilution | |||||||||||||||||
| Profit (loss) for the period attributable to net investment of the parent/equity holders of the parent | ( | ||||||||||||||||
| Basic earnings (loss) per share | ( | ||||||||||||||||
| Diluted earnings (loss) per share | ( | ||||||||||||||||
(i)Based on the numbers of shares reserved by Lavoro Limited to the Lavoro Share Plan, as explained above.
The Group reported a loss for the year ended June 30, 2023, accordingly the ordinary shares related to the share-based payment have a non-dilutive effect and therefore were not considered in the total number of shares outstanding to determine the diluted earnings (loss) per share.
All public and private warrants are out of the money as of June 30, 2023; therefore, the approximately 6,012,085 and 4,071,507 public and private warrants, respectively, were not included in the calculation of the diluted earnings (loss) per share. Similarly, the 3,060,662 Founder Shares were not considered in the calculation of the diluted earnings (loss) per share due to the Group’s market share price.
| F-92 | ||||
Notes to the consolidated financial statements (In thousands of Brazilian reais - R$, except if otherwise indicated) | | ||||
28. Revenue from contracts with customers
Accounting policy
Revenue from contracts with customers is recognized when control of the goods or services are transferred to the customer at an amount that reflects the consideration to which the Group expects to be entitled in exchange for those goods or services.
Revenue from the sale of agricultural inputs is recognized at the point in time when control of the product is transferred to the customer as follows:
(i)Retail sales – Sale of products in retail locations, or delivered to the customers, including crop protection, fertilizers, seeds and specialty inputs;
(ii)Grains – Sale of grains as a result of Barter transactions (Note 11);
(iii)Private Label products – Products delivered to the client such as biological, special fertilizers and off-patent.
When products are delivered to the customer revenue is recognized when the customer receives the product at the specified location. The Group engages third parties to provide freight services.
The Group provides pulverization services. The Group recognizes revenues from these services when the customer receives and consumes the benefits provided to them, at the time the pulverization services take place.
The Group generally acts as a principal as it has the primary responsibility for delivering the contracted goods, bears the inventory risk, and has discretion to establish the price.
Revenue from contracts with customers is recognized at an amount that reflects the consideration to which the Group expects to be entitled in exchange for those goods or services. For sales of grains see Note 11.
Sales prices are substantially based on international benchmark market prices, which are variable and subject to global supply and demand, and other market factors. There are no general warranties to the customers. Returns and incentives are estimated based on historical and forecasted data, contractual terms, and current conditions. Transportation costs are generally recovered from the customer through sales pricing and is included in cost of goods sold.
| F-93 | ||||
Notes to the consolidated financial statements (In thousands of Brazilian reais - R$, except if otherwise indicated) | | ||||
June 2022 and 2021. Below is revenue from contracts with customers disaggregated by product line and geographic location:
| 2023 | 2022 | 2021 | |||||||||||||||
| Inputs Retails sales | |||||||||||||||||
| Brazil | |||||||||||||||||
| Colombia | |||||||||||||||||
| Private Label products | |||||||||||||||||
| Crop Care | |||||||||||||||||
| Grains (ii) | |||||||||||||||||
| Brazil | |||||||||||||||||
| Colombia | |||||||||||||||||
| Services | |||||||||||||||||
| Colombia | |||||||||||||||||
| Total Revenues | |||||||||||||||||
| Summarized by region | |||||||||||||||||
| Brazil | |||||||||||||||||
| Colombia | |||||||||||||||||
(i)Sales between the Crop Care Cluster and the Brazil Cluster.
(ii)As explained in Note 11, the Group receives grains from certain customers in exchange to the product sold. The fair value of such non-cash consideration received from the customer is included in the transaction price and measured when the Group obtains control of the grains. The Group estimates the fair value of the non-cash consideration by reference to its market price.
29. Costs and expenses by nature
Accounting policy
(a)Cost of goods sold
| F-94 | ||||
Notes to the consolidated financial statements (In thousands of Brazilian reais - R$, except if otherwise indicated) | | ||||
(b)Sales, general and administrative expenses
| F-95 | ||||
Notes to the consolidated financial statements (In thousands of Brazilian reais - R$, except if otherwise indicated) | | ||||
The breakdown of costs and expenses by nature is as follows:
| 2023 | 2022 | 2021 | |||||||||||||||
| Cost of inventory (i) | |||||||||||||||||
| Personnel expenses | |||||||||||||||||
| Maintenance of the units | |||||||||||||||||
| Consulting, legal and other services | |||||||||||||||||
| Freight on sales | |||||||||||||||||
| Commissions | |||||||||||||||||
| Storage | |||||||||||||||||
| Travel | |||||||||||||||||
| Depreciation | |||||||||||||||||
| Amortization of intangibles | |||||||||||||||||
| Amortization of right-of-use assets | |||||||||||||||||
| Taxes and fees | |||||||||||||||||
| Short term rentals | |||||||||||||||||
| Business events | |||||||||||||||||
| Marketing and advertising | |||||||||||||||||
| Insurance | |||||||||||||||||
| Utilities | |||||||||||||||||
| Allowance for expected credit losses | |||||||||||||||||
| Losses and damage of inventories | |||||||||||||||||
| Fuels and lubricants | |||||||||||||||||
| Legal fees | |||||||||||||||||
| SPAC bonuses (ii) | |||||||||||||||||
| Other administrative expenditures | |||||||||||||||||
| Total | |||||||||||||||||
| Classified as: | |||||||||||||||||
| Cost of goods sold | |||||||||||||||||
| Sales, general and administrative expenses | |||||||||||||||||
(i)Includes fair value on inventory sold from acquired companies, in the amounts of R$26,914 ,R$27,005 and R$39,536 respectively for the years ended June 30, 2023, 2022 and 2021.
| F-96 | ||||
Notes to the consolidated financial statements (In thousands of Brazilian reais - R$, except if otherwise indicated) | | ||||
30. Finance income (costs)
| 2023 | 2022 | 2021 | |||||||||||||||
| Finance income | |||||||||||||||||
| Interest from cash equivalents | |||||||||||||||||
| Interest arising from revenue contracts | |||||||||||||||||
| Foreign exchange differences | |||||||||||||||||
| Gain on changes in fair value of derivative instruments | |||||||||||||||||
| Gain on changes in fair value of commodity forward contracts | |||||||||||||||||
| Interest from tax benefit (see note 23) | |||||||||||||||||
| Other | |||||||||||||||||
| Total | |||||||||||||||||
| Finance costs | |||||||||||||||||
| Interest on borrowings | ( | ( | ( | ||||||||||||||
| Interest on leases | ( | ( | ( | ||||||||||||||
| Interest on trade payables and acquisitions of subsidiary | ( | ( | ( | ||||||||||||||
| Foreign exchange differences | ( | ( | |||||||||||||||
| Loss on changes in fair value of derivative instruments | ( | ( | |||||||||||||||
| Loss on fair value of commodity forward contracts | ( | ||||||||||||||||
| Other | ( | ( | ( | ||||||||||||||
| Total | ( | ( | ( | ||||||||||||||
| Finance costs, net | ( | ( | ( | ||||||||||||||
| F-97 | ||||
Notes to the consolidated financial statements (In thousands of Brazilian reais - R$, except if otherwise indicated) | | ||||
31. Other operating (expenses) income, net
| 2023 | 2022 | 2021 | |||||||||||||||
| Listing expense (ii) | ( | ||||||||||||||||
| Gain on bargain purchase (i) | |||||||||||||||||
| Sales of fixed assets | |||||||||||||||||
| Other operating income | |||||||||||||||||
| Other operating income (expenses), net | ( | ||||||||||||||||
(i)Acquisition of Union. See note 21.
(ii)This represents stock exchange listing service as a result of the SPAC Transaction. Refer to Note 22 for further discussion.
32. Non-cash transactions
The Group carries out non-cash transactions which are not reflected in the statement of cash flows.
The Group had non-cash transactions related to the acquisition of subsidiaries through the issuance of shares and accounts payable as described in Note 20.
The Group had non-cash transactions related to the acquisition of non-controlling interest through the exchange of shares as described in Note 27.
The Group had non-cash transaction related to the SPAC Transaction as described in Note 22.
33. Subsequent events
•New financing transactions
Subsequent to June 30, 2023, through the date of this annual report, certain of our Brazilian and Colombian subsidiaries entered into a number of financing agreements totaling an aggregate principal amount of R$1,250.7 million with interest rates ranging from CDI Rate plus 1.80 % to 3.04 % and maturities ranging from October 2023 to September 2024 and COP$24,244.1 million with interest rates ranging from IBR Rate plus 3.20 % to 5.60 % and up to 16.60 % at a fixed rate and maturities ranging from July 2024 to August 2028. These new financing transactions are in line with our business plan and reflect the seasonality of our business as the last quarter usually demands additional working capital.
| F-98 | ||||
Notes to the consolidated financial statements (In thousands of Brazilian reais - R$, except if otherwise indicated) | | ||||
•Closing of Referencia acquisition
On February 28, 2023, the Group entered into an agreement for the acquisition of a 70 % interest in Referencia Agroinsumos LTDA., or “Referencia Agro.” The consideration transferred for the acquisition amounted R$102,112 of which R$67,112 was paid in cash on the closing date, and the remaining R$35,000 will be paid in cash a year after the closing date.
This acquisition was completed on July 31, 2023 and the Group currently owns a 66.57 % interest.
The following table summarizes the preliminary allocation of the consideration transferred as of July 29, 2022:
| Cash paid | ||||||||
| Payable in installments | ||||||||
| Fair value of consideration transferred | ||||||||
| (-) Fair value of net assets acquired: | ||||||||
| Assets | ||||||||
| Cash and cash equivalents | ||||||||
| Trade receivables | ||||||||
| Inventories | ||||||||
| Property, plant and equipment | ||||||||
| Intangible | ||||||||
| Other assets | ||||||||
| Liabilities | ||||||||
| Borrowings | ||||||||
| Trade payables | ||||||||
| Other liabilities | ||||||||
| Total identifiable net assets at fair value | ||||||||
| Preliminary goodwill arising on acquisition | ||||||||
•Lavoro Limited Restricted Stock Unit Plan (“RSU Plan”)
On August 16, 2023 and September 27, 2023, the board of directors of Lavoro (the “Board”) adopted the Lavoro Limited Restricted Stock Unit Plan (the “RSU Plan”), which provides for the grant of restricted stock units (“RSUs”) to participants identified by the Board.
| F-99 | ||||
Notes to the consolidated financial statements (In thousands of Brazilian reais - R$, except if otherwise indicated) | | ||||
As of the date of the issuance of the consolidated financial statements, 1,634,852 RSUs have been granted, with each RSU entitling the holder to one share of Lavoro stock after the vesting period, as detailed below:
| Options granted | ||||||||
| Granted options | ||||||||
| Canceled | ( | |||||||
| F-100 | ||||