FY 2023 FORM 10-K |
|
UNITED STATES
SECURITIES AND EXCHANGE COMMISSION
Washington, D.C. 20549
FORM
(Mark One)
ANNUAL REPORT PURSUANT TO SECTION 13 OR 15(d) OF THE SECURITIES EXCHANGE ACT OF 1934 |
For the fiscal year ended
OR
TRANSITION REPORT PURSUANT TO SECTION 13 OR 15(d) OF THE SECURITIES EXCHANGE ACT OF 1934 |
For the transition period from ________ to ________
Commission File No. | |
| ||
(Exact name of registrant as specified in its charter) | ||
| ||
| ||
(State or other jurisdiction of incorporation or organization) | (I.R.S. Employer Identification No.) | |
|
| |
(Address of principal executive offices) (zip code) | ||
|
| |
Registrant’s telephone number, including area code: ( | ||
Securities registered pursuant to Section 12(b) of the Act:
Title of each class | Trading Symbol(s) |
| Name of each exchange on which registered | |
Securities registered pursuant to Section 12(g) of the Act: None |
Indicate by check mark if the registrant is a well-known seasoned issuer, as defined in Rule 405 of the Securities Act. ☐ Yes ☒
Indicate by check mark if the registrant is not required to file reports pursuant to Section 13 or Section 15(d) of the Act. ☐ Yes ☒
Indicate by check mark whether the registrant (1) has filed all reports required to be filed by Section 13 or 15(d) of the Securities Exchange Act of 1934 during the preceding 12 months (or for such shorter period that the registrant was required to file such reports), and (2) has been subject to such filing requirements for the past 90 days. ☒
Indicate by check mark whether the registrant has submitted electronically every Interactive Data File required to be submitted pursuant to Rule 405 of Regulation S-T (§232.405 of this chapter) during the preceding 12 months (or for such shorter period that the registrant was required to submit and post such files). ☒
Indicate by check mark whether the registrant is a large accelerated filer, an accelerated filer, a non-accelerated filer, smaller reporting company or an emerging growth company. See the definitions of “large accelerated filer,” “accelerated filer,” “smaller reporting company,” and “emerging growth company” in Rule 12b-2 of the Exchange Act:
Large accelerated filer ☐
If an emerging growth company, indicate by check mark if the registrant has elected not to use the extended transition period for complying with any new or revised financial accounting standards provided pursuant to Section 13(a) of the Exchange Act. ☐
Indicate by check mark whether the registrant has filed a report on and attestation to its management’s assessment of the effectiveness of its internal control over financial reporting under Section 404(b) of the Sarbanes-Oxley Act (15 U.S.C. 7262(b)) by the registered public accounting firm that prepared or issued its audit report.
If securities are registered pursuant to Section 12(b) of the Act, indicate by check mark whether the financial statements of the registrant included in the filing reflect the correction of an error to previously issued financial statements.
Indicate by check mark whether any of those error corrections are restatements that required a recovery analysis of incentive-based compensation received by any of the registrant’s executive officers during the relevant recovery period pursuant to §240.10D-1(b). ☐
Indicate by check mark whether the registrant is a shell company (as defined in Rule 12b-2 of the Exchange Act).
The aggregate market value of the voting stock held by non-affiliates of the registrant as of June 30, 2023, the last business day of the registrant’s most recently completed second fiscal quarter, was $
At February 29, 2024, there were
DOCUMENTS INCORPORATED BY REFERENCE The information required by Part III is incorporated herein by reference to the Registrant’s definitive proxy statement for its 2023 Annual Meeting of Shareholders which is to be filed pursuant to Regulation 14A within 120 days of the close of its fiscal year ended December 31, 2023.
TABLE OF CONTENTS
CERTAIN FACTORS AFFECTING FORWARD-LOOKING STATEMENTS
Certain statements in this Annual Report on Form 10-K (the “Annual Report”), including but not limited to statements made in Part II, Item 7–“Management’s Discussion and Analysis of Financial Condition and Results of Operations,” statements made with respect to future operating results, expectations of future customer orders and the availability of resources necessary for our business are forward-looking statements. Forward-looking statements can be identified by the use of words such as “may,” “will,” “should,” “could,” “continue,” “future,” “potential,” “believe,” “project,” “plan,” “intend,” “seek,” “estimate,” “predict,” “expect,” “anticipate” and variations of such words and similar expressions. Forward-looking statements also include the assumptions underlying or relating to any of the foregoing statements. Such forward-looking statements are made based on our management’s beliefs as well as assumptions made by, and information currently available to, our management. Our actual results may differ materially from the results anticipated in these forward-looking statements due to, among other things, the risks set forth in Part I, Item 1A, “Risk Factors” in this Annual Report on Form 10-K and in our other filings with the Securities and Exchange Commission.
Given these uncertainties, you should not place undue reliance on these forward-looking statements. You should read this Annual Report, the documents that we reference in this Annual Report and the documents that we have filed as exhibits to this Annual Report completely and with the understanding that our actual future results may be materially different from what we expect. Also, forward-looking statements represent our management’s beliefs and assumptions only as of the date of this Annual Report. Except as required by law, we assume no obligation to update these forward-looking statements publicly, or to update the reasons actual results could differ materially from those anticipated in these forward-looking statements, even if new information becomes available in the future.

ITEM 1. BUSINESS
OUR COMPANY
Miller Industries, Inc., (“Miller Industries”), a Tennessee corporation, is The World’s Largest Manufacturer of Towing and Recovery Equipment®, with executive offices in Ooltewah, Tennessee, domestic manufacturing operations in Tennessee and Pennsylvania, and foreign manufacturing operations in France and the United Kingdom.
Miller Industries was founded in 1990. Since its inception, the Company has developed innovative high-quality towing and recovery equipment worldwide. We design and manufacture bodies of car carriers and wreckers, which are installed on chassis manufactured by third parties, and sold to our customers. Our products are marketed and sold through a network of distributors that serve all 50 states, Canada, Mexico and other foreign markets, and through prime contractors to governmental entities. Further, we have substantial distribution capabilities in Europe as a result of our ownership of Jige International S.A. and Boniface Engineering, Ltd. While most of our distributor agreements do not generally contain exclusivity provisions, management believes that more than 90 percent of our independent distributors do not offer products of any other towing and recovery equipment manufacturer, which we believe is a testament of their loyalty to our brands.
In addition to selling our products, our independent distributors provide end-users with parts and service. We also utilize sales representatives to inform prospective end-users about our current product lines in an effort to drive sales to independent distributors. Management believes the strength of our distribution network and the breadth and quality of our product offerings are two key advantages over our competitors.
In this Annual Report on Form 10-K, the words “Miller Industries,” the “Company,” “we,” “our,” “ours” and “us” refer to Miller Industries, Inc., and its subsidiaries.
PRODUCT LINES

Car Carriers
Car carriers are specialized flat-bed vehicles with hydraulic tilt mechanisms that enable a towing operator to drive or winch a vehicle onto the bed for transport. Car carriers are used to transport new or disabled vehicles and other equipment and are particularly effective for transporting vehicles or other equipment over longer distances. In addition to transporting vehicles, car carriers may also be used for other purposes, including transportation of industrial equipment. Most professional towing operators have car carriers in their fleets to complement their towing capabilities.
Wreckers
Wreckers are generally used to recover and tow disabled vehicles and other equipment and range in type from the conventional tow truck to large recovery vehicles with up to 100-ton lifting capacities. Wreckers are available with specialized features, including underlifts, L-arms, crossbars and scoops, which lift disabled vehicles by the tires or front axle to minimize front end damage to the towed vehicles. Certain heavy-duty wrecker models offer rotating booms and remote-control devices which allow heavy-duty wreckers to recover vehicles from any angle. In addition, certain light-duty wreckers are equipped with automatic wheel-lift hookup devices that allow operators to engage a disabled or unattended vehicle without leaving the cab of the wrecker.
Our wreckers range in capacity from four to 100 tons, and are classified as either light-duty or heavy-duty, with wreckers of 16-ton or greater capacity being classified as heavy-duty. Light-duty wreckers are used to remove vehicles from accident scenes and vehicles illegally parked, abandoned or disabled, and for general recovery. Heavy-duty wreckers are used in towing and recovery operations including overturned tractor trailers, buses, motor homes and other large vehicles.
Transport Trailers
Our multi-vehicle transport trailers are specialized auto transport trailers with upper and lower decks and hydraulic ramps for loading vehicles. These trailers are used for moving multiple vehicles for auto auctions, car dealerships, leasing companies and other similar operations. These trailers are easy to load and transport up to seven vehicles. The vehicles can be secured to transport quickly with ratchet and chain tie-downs that are mounted throughout the frame of the transport trailer. Many professional towing operators have added auto transport trailers to their fleets to add to their service offerings.
4 | FY 2023 FORM 10-K |
OUR BRANDS
We manufacture and market our car carriers, wreckers and trailers under 10 separate brand names. Although certain brands overlap in terms of features, prices and distributors, each brand has its own distinctive image and customer base.
Century®
The Century® brand is our “top-of-the-line” brand and represents what management believes to be the broadest product line in the industry. The Century® line was started in 1974 and produces wreckers ranging from 8-ton light-duty to 100-ton heavy-duty models, and car carriers in lengths from 20 to 30 feet. Management believes the Century® brand has a reputation as the industry’s leading product innovator.
Vulcan®
Our Vulcan® product line includes a range of premium light-duty and heavy-duty wreckers, ranging from 8-ton light-duty to 75-ton heavy-duty models, and car carriers.
Chevron™
Our Chevron™ product line is comprised primarily of premium car carriers. Chevron™ produces a range of premium single-car, multi-car and industrial carriers, as well as wreckers ranging from 8-ton to 16-ton models.
Holmes®
Our Holmes® product line includes mid-priced wreckers with 4 to 16-ton capacities, a 16-ton rotator and a detachable towing unit (“DTU”). The Holmes® wrecker was first produced in 1916. Historically, the Holmes® name has been the most well-recognized and leading industry brand both domestically and internationally.
Challenger®
Our Challenger® products compete with the Century® and Vulcan® products and constitute a third premium product line. Challenger® products consist of heavy-duty wreckers with capacities ranging from 25 to 75 tons. The Challenger® line was started in 1975 and is known for its high-performance heavy-duty wreckers and aesthetic design.
Champion®
The Champion® brand, which was introduced in 1991, includes car carriers that range in length from 19 to 21 feet. The Champion® product line, which is generally lower-priced, allows us to offer a full line of car carriers at various competitive price points.
Jige™
Our Jige™ product line is comprised of a broad line of premium light-duty and heavy-duty wreckers and car carriers marketed primarily in Europe. Jige™ is a market leader best known for its innovative designs of car carriers and light-duty wreckers necessary to operate within the narrow confines of European cities, as well as heavy-duty wreckers.
Boniface™
Our Boniface™ product line is comprised predominantly of premium heavy-duty wreckers marketed primarily in Europe. Boniface™ produces heavy-duty wreckers specializing in the long underlift technology required to tow modern European tour buses.
Titan®
Our Titan® product line is comprised of premium multi-vehicle transport trailers which can transport up to seven vehicles depending on configuration.
Eagle®
Our Eagle® products consist of light-duty wreckers with the “Eagle Claw®” hook-up system that allows towing operators to engage a disabled or unattended vehicle without leaving the cab of the tow truck. The “Eagle Claw®” hook-up system was originally developed for the repossession market. Since acquiring Eagle, we have upgraded the quality and features of the Eagle® product line and expanded its recovery capability.
ACQUISITIONS
We have acquired a number of businesses over the years that have enhanced our products portfolio.
|
Most recently, during fiscal 2023, the Company acquired substantially all of the assets and assumed certain liabilities of Southern Hydraulic Cylinder, Inc., (“SHC”), a Tennessee corporation. SHC manufactures, sells and services custom-build, welded hydraulic cylinders and related components. Management believes this acquisition will strengthen its efforts to enhance the stability of its supply chain.
Our strategy has always been to diversify our product-line and remain open to opportunities for acquisitions. We expect to continue to pursue additional acquisitions in the future.
For further information on the acquisition of SHC, Inc., see Note 2 to our consolidated financial statements.
MANUFACTURING
Miller Industries has a long history of innovation in our manufacturing processes utilizing advanced technologies. We manufacture wreckers, car carriers and trailers at six manufacturing facilities located in the United States, France and the United Kingdom. Our manufacturing facilities are designed to provide efficient assembly-line manufacturing of our products. In order to utilize our manufacturing facilities and technology more efficiently and effectively, we pursue continuous improvements in our manufacturing process. Our manufacturing personnel, in consultation with, our engineering department which consists of 52 engineers, use sophisticated computer-aided design and stress analysis systems to test new product designs and integrate various product improvements.
At our research and development (“R&D”) facility in Chattanooga, Tennessee, we continuously pursue innovations in our products and improvements in our manufacturing processes. These efforts led to our exclusive product, the M100. The Century® M100 is the world’s largest rotator truck and the industry’s first heavy-duty unit. The Century® M100 also features our patented Raptor™ Control System which includes wrecker controls that allow the boom to be remotely extended away from the vehicle to enhance operator sightlines during use and an information screen with load-sensing functions. | Century® M100
|

In addition, our Holmes® and Century® brands are associated with four major innovations in the industry: the rapid reverse winch, the tow sling, the hydraulic lifting mechanism and the underlift with parallel linkage and L-arms.
The manufacturing process for our products consists primarily of cutting and bending sheet steel or aluminum into parts that are welded together to form the wrecker, car carrier body or trailer. We also produce wrecker bodies using composites and other non-metallic materials, which reduces the vehicle weight and increases fuel efficiency. After the frame is formed, components such as hydraulic cylinders, winches, valves and pumps, that are purchased by us from third-party suppliers, are attached to the frame to form the completed wrecker or car carrier body. The completed body is either installed by us or shipped by common carrier to a distributor where it is then installed on a chassis. Generally, the wrecker or car carrier bodies are painted, and towing operators can select customized colors to coordinate with chassis colors or customer fleet colors. To the extent final painting is required before delivery, we either complete such painting or contract with independent paint shops for such services.
Our domestic facilities have undergone substantial expansion and modernization. Since 2017, we invested over $98.4 million on property, plant and equipment. These projects not only increased our manufacturing production capacity, but also included installing sophisticated robotics and implementing other advanced technologies to optimize our manufacturing process.
CUSTOMERS
We sell our products to a diverse network of independent distributors, consisting of approximately 74 distributor locations in North America, that serve all 50 states, Canada & Mexico, and approximately 50 distributors that serve other foreign markets. These distributors then sell our products to end-users. Our long-standing relationships with our distributors give them a deep knowledge of our products and our corporate culture, allowing them to effectively promote our products to end-users. Our diverse network of distributors lessens our dependence on particular distributors.
In 2023, no distributor accounted for more than 10% of our consolidated total sales and we do not consider our business to be materially dependent on any single customer.
We engage sales representatives who provide sales support to our entire network of independent distributors. Sales representatives receive commissions on direct sales based on product type and brand and generally are assigned specific territories in which to promote sales of our products and to maintain customer relationships. To support sales and marketing efforts, we produce demonstrator models that are used by our sales representatives and independent distributors.
6 | FY 2023 FORM 10-K |
In addition to providing services to our network of independent distributors, our sales representatives sell our products to various governmental entities, including the U.S. federal government and foreign governments, through prime contractors. We routinely respond to requests for proposals or bid invitations in consultation with our local distributors. Our products have been selected by the United States General Services Administration as an approved source for certain federal and defense agencies. We intend to continue to pursue federal, state, local and foreign government contracting opportunities.
The towing and recovery equipment industry places heavy marketing emphasis on product exhibitions at national, regional and international trade shows. To focus our marketing efforts and to control marketing costs at major trade shows, we work with our network of independent distributors to concentrate on various regional shows.
SUPPLIERS
We purchase raw materials and component parts from several sources. Although we have no long-term supply contracts, management believes we have good relationships with our primary suppliers. In recent years prices have fluctuated significantly and supply chain challenges have been severe. Prior to these challenges, we have generally experienced no significant interferences in obtaining adequate supplies of raw materials and component parts to meet the requirements of our production schedules, and found the materials used in the production of our products were available at competitive prices from an adequate number of alternative suppliers. However, supply chain challenges continue and the loss of a single supplier could have a material adverse effect on our business.
COMPETITION
We operate in a highly competitive environment in the manufacturing and selling of towing and recovery equipment. We compete on many levels, including product quality and innovation, reputation, technology, customer service, product availability and price, with an emphasis on product quality, innovation and customer service. Accordingly, we have invested substantial resources and time in building and maintaining strong relationships with distributors.
Our marketing strategy is to continue to compete primarily on the basis of quality and reputation rather than solely on the basis of price, and to continue to target the growing group of professional towing operators who recognize the quality of our products.
Traditionally, the capital requirements for entry into the towing and recovery manufacturing industry have been relatively low. Management believes a manufacturer’s capital resources and access to technological improvements have become a more integral component of success in recent years. Certain of our competitors may have greater financial and other resources and may provide more attractive dealer and retail customer financing alternatives than we do.
BACKLOG
We produce virtually all of our products to order. The backlog of orders represents customer purchase orders that have been received but not yet fulfilled as of the reporting date. Backlog can fluctuate for a number of reasons including adjustments based on changes in customer requirements, pricing actions, manufacturing and shipping schedules, cancellation and/or rescheduling of orders from our customers, timing of when they are originally placed, and when we are able to fulfill them.
Our backlog of orders grew substantially due to the lingering impacts of the supply chain disruptions that began in fiscal 2021. We continue to experience some ongoing challenges for products and component parts inventory, though supply chain conditions began to stabilize during fiscal 2023 returning our backlog to normal levels. While management regularly reviews the backlog and assesses its ability to fulfill these orders within a reasonable period of time, it is possible that continued global supply chain disruptions, or other factors, could cause further delays in delivery and an inability to complete customer orders. However, the level of backlog at any particular time may not be an appropriate indicator of our future operating performance.
PRODUCT WARRANTIES AND INSURANCE
The Company generally offers a 12-month limited manufacturer’s product and services warranty for products sold to customers on our wrecker and car carrier products. These warranties generally provide for failed parts or components. Our independent distributors typically perform warranty repair work, rather than shipping products back to us. The independent distributors then submit claims (invoices) for warranty reimbursement for the cost of parts and labor.
At the time of sale, we record an accrual for manufactured products for estimated costs in connection with forecasted future warranty claims. Our estimate of the cost of future warranty claims is based primarily on the estimated number of products under warranty, historical average costs incurred to service warranty claims, the trend in the historical ratio of claims and the historical length of time between the sale and resulting warranty claim.
The Company maintains general liability and product liability insurance coverage to mitigate liability claims. Management believes that the combination of warranty provisions and product liability insurance provides adequate coverage to address potential liabilities arising from our limited manufacturer’s product and services warranties.
HUMAN CAPITAL MANAGEMENT
|
Employees
As of December 31, 2023, we employed approximately 1,821 employees globally, of which 99.1% are full-time employees. None of our employees are covered by collective bargaining agreements or similar representation in the United States; however, employees have certain similar representation provided by their respective government’s employment regulations based outside of the United States. We consider our employee relations generally to be good.
Culture and Talent
Culture
The Company’s culture is rooted in our values and behaviors, based on treating others the way we would like to be treated and fostering a work environment that is inclusive, diverse, fair and engaged. In addition, our Code of Business Conduct and Ethics is intended to reinforce our core values of respect, integrity, collaboration, innovation, trust, and excellence throughout our operations. Providing a positive work environment supports our ability to attract, retain and develop our employees and enables business performance.
Professional Development
To facilitate talent attraction and retention, we provide training programs that address skill shortages in our workforce, foster career development and encourage proper use of technology and resources. These programs include our Welding School that teaches employees how to read blueprints, interpret weld symbols and learn welding techniques. In addition, the Front-Line Leadership Academy was created to develop high-potential employees for future leadership roles in the Company, and provide change management, decision making and problem-solving skills to future leaders. We have also established a tuition reimbursement program for continuing education, including undergraduate and graduate degrees or certifications and licenses relevant to the business.
Competitive Pay and Employee Benefits
Our employees are essential to our success and we strive to offer comprehensive and competitive wages and benefits, as well as various wellness initiatives. The benefits we offer include, but are not limited to, comprehensive medical coverage, short-term and long-term disability, life insurance, wellness screening, dental coverage, paid time off, incentive programs, an employee assistance program, access to telehealth services and a U.S. 401(k) plan with a Company match. To ensure our pay rates for our employees remain competitive, we periodically perform compensation studies.
During fiscal 2022, we experienced substantially increased employee turnover rates in our skilled workforce and in response took various actions to attract and retain skilled laborers, including attending hiring events, broadening our recruitment platforms and paying sign-on and retention bonuses. Due in part to these efforts, employee turnover rates have trended down throughout fiscal 2023.
Employee Engagement
Miller Industries solicits feedback and suggestions from employees through various mechanisms, including an “open door” policy, utilizing an employment engagement and communication specialist who is dedicated to communication with our employees and employee engagement surveys conducted by a third party. As a result of employee engagement surveys, the Company has launched “Link Up,” a townhall event for leadership to provide brief updates on the business, increased the Team Leader to employee ratio on the production floor to improve on-the-job training, overall product quality and employee safety, provided a six-week Team Leader Bootcamp Training program and started the Front-Line Academy to provide in-house professional development opportunities.
We have invested substantial time and resources in recent years to optimize employee engagement, productivity and safety of our workforce, which we believe is the foundation upon which we can maintain our competitive advantages in product quality and customer service.
Diversity, Equity and Inclusion
At Miller Industries, we are focused on building a diverse and inclusive workplace that values the unique perspectives and contributions of all our employees.
Our initiatives are sponsored by our senior executives and our Human Resources (“HR”) organization, and are designed to promote a culture of diversity, equity and inclusion.
We also monitor pay equity, which guides the ongoing analysis and benchmarking to help inform us of our salary and compensation practices. We define pay equity as equal pay for people of all gender identities and ethnicities who are performing substantially similar work. Some of the things we consider include job-related skills, tenure, experience and education level, performance rating and geography.
Worker Health and Safety
The health, safety and security of our employees and contractors is a priority for us. We employ systems designed to continually monitor our facilities and work environment to promote worker safety and identify and prevent or mitigate any potential risks. This includes procedures and equipment for security. We routinely assess facilities to closely monitor adherence to established security and safety standards. Our workers receive specialized training related to
8 | FY 2023 FORM 10-K |
their role, work setting and equipment used in their work environment. We update relevant safety training modules, which may include new training programs as our processes evolve.
For more information on our approach to human capital management, please refer to our annual Corporate Social Responsibility Report, which is available on our website.
INTELLECTUAL PROPERTY RIGHTS
Our development of the underlift parallel linkage and L-arms, at the time, was considered one of the most innovative developments in the wrecker industry. This technology continues to be significant because it allows the damage-free towing of aerodynamic vehicles made of lighter weight materials. This technology, particularly the L-arms, is still used in a majority of commercial wreckers today. Our patents on the L-arms have expired, but we hold a number of utility and design patents for our products. We have also obtained the rights to use and develop certain technologies owned or patented by others.
Our trademarks “M®” (stylized), “Miller Industries®” (with a stylized “M”), “Century®,” “Holmes®,” “Champion®,” “Challenger®,” “Pro Star®,” “Street Runner®,” “Vulcan®,” “Right Approach®” and “Extreme Angle®,” among others, are registered with the United States Patent and Trademark Office. Management believes our trademarks are well-recognized by dealers, distributors and end-users in their respective markets and are associated with a high level of quality and value.
GOVERNMENT REGULATIONS AND ENVIRONMENTAL MATTERS
Our business is highly regulated in the United States, at both the federal and state level, and in foreign countries.
Environment
Our operations are subject to federal, state and local laws and regulations governing the protection of the environment and health and safety, including laws and regulations governing the generation, storage, handling, emissions, transportation and discharge of materials into the environment. The costs of complying with such environmental protection laws and regulations have not had a material adverse impact on our financial condition or results of operations in the past, but we may be subject to other more stringent environmental laws in the future. Our facilities and operations could also be subject to regulations related to climate change and climate change (or events caused by climate change) may also have an impact on the Company’s operations. However, these impacts are uncertain, and the Company cannot predict with certainty the nature and scope of those impacts.
In addition, laws and regulations intended to achieve the goal of significantly reducing engine emissions associated with the operation of commercial vehicles are also being phased in by the U.S. Environmental Protection Agency and state regulators. For example, the California Air Resources Board’s (“CARB”) Advanced Clean Trucks regulation, which has been adopted by several other states, requires manufacturers, including truck body chassis manufacturers that supply to us, to sell an increasing percentage of zero-emission or near zero-emission medium and heavy-duty trucks into the California market starting in calendar year 2024. CARB’s Advanced Clean Fleets regulation sets requirements for organizations to reduce the overall emissions of the vehicle fleets they operate, which affects our customers who own and operate fleets in California. These regulations are intended to drive larger market penetration of zero-emission commercial trucks. There are currently multiple efforts underway which seek to prevent or delay some or all of these regulations from taking effect, or otherwise seek relief from CARB’s regulations. However, compliance with the regulations as currently written, or new or more stringent laws or regulations, or stricter interpretations of existing laws or regulations could materially adversely affect our results of operations, financial condition or cash flows.
Government Programs
We act as a subcontractor for certain U.S. and other government programs. As a result, we are subject to regulations and requirements of the U.S. and other government agencies and entities that govern these programs, including with respect to the award, administration and performance of contracts under such programs.
Privacy, Data Protection and Cybersecurity
We are subject to various federal, state and non-U.S. laws and regulations related to privacy, data protection and cybersecurity, including the European Union's General Data Protection Regulation (the "GDPR"), and U.S. state laws such as California’s Consumer Privacy Act of 2018. These state laws require an information security program based on an ongoing risk assessment, overseeing third-party service providers, investigating data breaches and notifying regulators of a cybersecurity event. The GDPR and the California Consumer Privacy Act of 2018 grant individuals the right to request that a company delete or de-identify their personal information. There is a strong possibility that other states, including states in which we transact business, enact their own data security regulations and privacy laws.
Sourcing of Minerals
We are subject to the additional diligence and disclosure requirements adopted by the Securities and Exchange Commission (the “SEC”) related to certain minerals sourced from the Democratic Republic of Congo or adjoining countries in connection with the Dodd-Frank Wall Street Reform and Consumer
|
Protection Act. The SEC rules impose these obligations with respect to “conflict minerals,” defined as tin, tantalum, tungsten and gold, which are necessary to the functionality of a product manufactured, or contracted to be manufactured, by an SEC reporting company. If any “conflict minerals” that are necessary to the functionality of a product manufactured by an SEC reporting company originated in the Democratic Republic of Congo or an adjoining country, the rules require the issuer to prepare and file a report addressing its efforts to exercise due diligence on the source of such “conflict minerals” and their chain of custody. In addition to the SEC regulation, the European Union adopted new requirements for European Union importers of conflict minerals, which went into effect on January 1, 2021, and that may impact and increase the cost of our conflict minerals compliance program.
Regulation of Warranties
We are subject to the Magnuson-Moss Warranty Federal Trade Commission Improvement Act which regulates the description of warranties on products. The description and substance of our warranties are also subject to a variety of federal, state and foreign laws and regulations applicable to the manufacturing of vehicle components. Management believes that continued compliance with various government regulations will not materially affect our operations.
INFORMATION ABOUT OUR EXECUTIVE OFFICERS
Our executive officers are appointed annually by our Board of Directors and our directors are elected annually by our shareholders. All officers serve until their successors are duly chosen or elected and qualified, except in the case of earlier death, resignation or removal.
William G. Miller, II is the son of William G. Miller. Other than Messrs. Miller and Miller II, there are no family relationships among the executive officers, directors or nominees for director, nor are there any arrangements or understandings between any of the executive officers and any other persons pursuant to which they were selected as executive officers.
Information with respect to our executive officers as of February 29, 2024, is as follows:
WILLIAM G. MILLER |
Chairman of the Board of Directors Mr. Miller, age 77, has served as Chairman of the Board of Directors since April 1994. Mr. Miller served as President and Chief Executive Officer from 1994 to 1996 and as Chief Executive Officer from 1996 to 1997. Mr. Miller also served as Co-Chief Executive Officer from October 2003 to March 2011. Mr. Miller served as Chairman and President of Miller Group from 1990 to 1993 and as Chairman and CEO of Miller Group from 1993 to 1994. Prior to 1987, Mr. Miller served in various management positions for Bendix Corporation, Neptune International Corporation, Wheelabrator-Frye, Inc. and The Signal Companies, Inc. |
WILLIAM G. MILLER II |
President and Chief Executive Officer Mr. Miller II, age 45, has served as a director since May 2014, our Chief Executive Officer since March 2022 and President since March 2011, after serving as Co-Chief Executive Officer from December 2013 to March 2022 and as a Regional Vice President of Sales of Miller Industries Towing Equipment Inc. from November 2009 to February 2011. Mr. Miller II also served as Vice President of Strategic Planning of the Company from October 2007 until November 2009, as Light-Duty General Manager from November 2004 to October 2007, and as a Sales Representative of Miller Industries Towing Equipment Inc. from 2002 to 2004. |
JEFFREY I. BADGLEY |
President of International and Military Mr. Badgley, age 71, has served as our President of International and Military since March 2022. Prior to serving as President of International and Military, Mr. Badgley served in various executive positions, including Chief Executive Officer (1997 – 2003; 2011 – 2013), Co-Chief Executive Officer (2003 – 2011; 2013 - 2022), President (1996 – 2011), and Vice President (1994 – 1996). In addition, Mr. Badgley served as a director from 1996 to 2014 and as Vice Chairman of the Board of Directors from 2011 to 2014. Mr. Badgley also served as Vice President to Miller Industries Towing Equipment Inc. from 1988 to 1996 and has been their President since 1996. |
FRANK MADONIA |
Executive Vice President, Secretary and General Counsel |
10 | FY 2023 FORM 10-K |
Mr. Madonia, age 75, has served as our Executive Vice President, Secretary and General Counsel since September 1998. From April 1994 to September 1998 Mr. Madonia served as our Vice President, General Counsel and Secretary. Mr. Madonia served as Secretary and General Counsel to Miller Industries Towing Equipment Inc. since its acquisition by Miller Group in 1990. From July 1987 through April 1994, Mr. Madonia served as Vice President, General Counsel and Secretary of Flow Measurement. Prior to 1987, Mr. Madonia served in various legal and management positions for United States Steel Corporation, Neptune International Corporation, Wheelabrator-Frye, Inc. and The Signal Companies, Inc. |
DEBORAH L. WHITMIRE |
Executive Vice President, Chief Financial Officer and Treasurer Ms. Whitmire, age 58, has served as a director from February 2020 to May 2023, our Executive Vice President, Chief Financial Officer and Treasurer since January 2017, after serving as our Vice President and Corporate Controller from January 2014 to December 2016 and Corporate Controller to Miller Industries Towing Equipment Inc. from March 2005 to January 2014. From April 2000 to March 2005, Ms. Whitmire also served as Director of Finance – Manufacturing to Miller Industries Towing Equipment Inc. In addition, Ms. Whitmire served as Controller to Miller Industries Towing Equipment Inc. from October 1997 to April 2000 and Accounting Manager to Miller Industries Towing Equipment Inc. from October 1996 to October 1997. |
JOSIAS W. REYNEKE |
Vice President and Chief Information Officer Mr. Reyneke, age 67, has served as our Vice President since March 2021 and our Chief Information Officer since January 2017, after serving as our Vice President of Operations to Miller Industries Towing Equipment Inc. from July 2011 to December 2016. From 2002 to 2011, Mr. Reyneke served as Director of Management Information Systems and Materials of Miller Industries Towing Equipment Inc. Mr. Reyneke joined Miller Industries Towing Equipment Inc. as a consultant in 1997 to assist with the implementation of an enterprise resource planning system and was subsequently offered the position of Director of Management Information Systems in 1998, a position he held until 2002. Prior to 1998, Mr. Reyneke also served in various management positions for SE Technologies, Wheels of Africa and Toyota South Africa. |
JAMISON LINDEN |
Vice President and Chief Manufacturing Officer Mr. Linden, age 49, has served as our Vice President and Chief Manufacturing Officer since January 2021, after serving as our Vice President of Operations from January 2017 to December 2020 and as Director of Special Projects from January 2015 to December 2016. From August 2012 to December 2014, Mr. Linden served as General Manager, Ooltewah Operations. In addition, Mr. Linden served as Production and Manufacturing Services Manager from December 2009 to July 2012 and Engineer from May 2004 to November 2009. |
VINCE TIANO |
Vice President and Chief Revenue Officer Mr. Tiano, age 59, has served as our Vice President and Chief Revenue Officer since January 2021. From May 1997 to December 2020, Mr. Tiano served as Vice President of Sales for Miller Industries Towing Equipment, Inc. |
AVAILABLE INFORMATION
Our Annual Report on Form 10-K, Quarterly Reports on Form 10-Q, Current Reports on Form 8-K, and amendments to those reports are available free of charge on our website (www.millerind.com), under the “Investors — Filings — Annual Reports” caption, as soon as reasonably practicable after we electronically file them with, or furnish them to, the SEC. The SEC also maintains a website (www.sec.gov) where you can search for annual, quarterly and current reports, proxy and information statements, and other information regarding us and other public companies.
Our Corporate Governance Guidelines, Code of Business Conduct and Ethics and the charters of the Audit, Compensation and Nominating Committees of the Board of Directors are also available on our website.
|
ITEM 1A. RISK FACTORS
In addition to information discussed elsewhere in this Form 10-K, you should carefully consider the following risk factors, as well as additional factors not presently known to us or that we currently deem to be immaterial, which could materially affect our business, liquidity, financial condition, and/or results of operations in future periods.
Risks Relating to Our Operations
Macroeconomic trends, including inflationary pressures, and the availability of financing and uncertain interest rates, could adversely affect our business, results of operation or financial condition, as well as our customers’ ability to fund purchases of our products.
Global economic events and other factors, such as restrictive monetary and fiscal policy, the lingering impact of the COVID-19 pandemic and the conflicts in Ukraine and the Middle East, have contributed to significant inflation in many of the markets in which we operate. In order to combat inflation and restore price stability, the U.S. Federal Reserve and central banks worldwide have raised interest rates and may continue incrementally raising interest rates in 2024. The combination of increased inflation and interest rates may hinder the economic growth in the U.S. and in the global economy. This economic weakness and the possibility of a global recession have had, and may continue to have, a negative effect on our business and financial condition.
We continue to monitor these inflationary pressures closely and, when possible, attempt to mitigate the risk associated with them, including by implementing several price increases and surcharges during 2022 and a price increase effective in the first quarter of 2023. While we have attempted to pass increased costs on to our customers, there can be no assurances that we will be able to continue doing so in the future. It is possible that sustained price increases, surcharges or price inflation (or inflation pressure generally), in turn, may lead to declines in volume, and while we seek to project tradeoffs between price increases, surcharges and inflation, on the one hand, and volume, on the other, there can be no assurance that our projections will prove to be accurate.
Furthermore, the continued decline of the United States' credit rating or a recession in global or regional economy could negatively impact our business, financial condition, and liquidity. Any potential inflation or further pressure on credit markets could also adversely affect our and our customers' ability to continue to access preferred sources of liquidity resulting in increased borrowing costs.
Our dependence upon outside suppliers for component parts, chassis and raw materials, including aluminum, steel, and petroleum-related products, leaves us subject to changes in price and availability and delays in receiving supplies of such materials, component parts or chassis.
We are dependent upon outside suppliers for our raw material needs and other purchased component parts. Prices and availability of these raw materials are subject to substantial fluctuations that are beyond our control due to factors such as changing economic conditions, inflation, governmental regulations (including CARB’s Advanced Clean Trucks regulation), currency and commodity price fluctuations, tariffs, resource availability, transportation costs, weather conditions and natural disasters, political unrest and instability, war (such as the ongoing military conflict between Russia and Ukraine) and other factors impacting supply and demand pressures. Delays in shipments of our raw materials and purchased component parts, including chassis, and government actions related to tariffs on imports and trade policies have previously adversely impacted, and have the potential to further impact our revenues, results of operations and financial condition. We also continue to monitor the impact of the Russia conflict with Ukraine on our fuel costs and supply chain for materials and component parts, particularly with respect to steel and items with substantial steel content.
Our third-party suppliers’ ability to supply us with component parts and chassis is limited by their available capacity to manufacture the component parts and chassis we require, and to secure adequate freight capacity to deliver them to our facilities. As the economy continued to recover from the impact of the pandemic over the course of 2022, various supply chain disruptions continued to impact our ability to obtain certain raw materials, purchased component parts and chassis from third party suppliers and resulted in substantial price increases. We continued to experience such difficulties in early 2023. These supply chain difficulties have had a material adverse impact on our profitability and results of operations. Delays in deliveries of our finished products due to delays of purchased component parts and chassis used in our products could also adversely affect future demand for our products if our customers reduce their purchase levels with us and/or seek alternative solutions to meet their demand. If these delays, limitations on availability and price increases for raw materials, purchased component parts, and chassis continue, recur or worsen, they will continue to have a material adverse effect on production at our facilities.
Furthermore, as a result of our supply chain challenges, it has become more difficult to accurately forecast, purchase, warehouse and transport to our manufacturing facilities purchased materials, component parts and chassis at sufficient volumes. If we are unable to accurately match the timing and quantities of component purchases to our actual needs, or successfully manage our inventory or our workforce to adapt to the increased complexity in our supply chain, we may incur unexpected production disruption, as well as storage, transportation and labor costs, which could have a material adverse effect on our financial condition and results of operations. In addition, we may not be able to meet our customers’ delivery schedules and could face the loss of orders or customers as a result.
Shortages, price increases and/or delays in shipments of our raw materials and purchased component parts, including chassis, have had and should be anticipated to continue to have a material adverse effect on our profitability, financial performance, competitive position and reputation.
12 | FY 2023 FORM 10-K |
Increases in the cost of skilled labor could adversely impact our business and profitability.
The timely manufacture and delivery of our products requires an adequate supply of skilled labor, and the operating costs of our manufacturing facilities can be adversely affected by increasing labor costs in skilled positions. Accordingly, our ability to increase or maintain our current levels of sales, productivity and net earnings will be limited to a degree by our ability to control the costs of skilled laborers necessary to meet our requirements. We must attract, train and retain skilled employees while controlling related labor costs and maintaining our core values, including safety standards. Our ability to control labor costs is subject to numerous external factors, including the limited supply of available skilled labor for hire, prevailing wage rates, increases in healthcare and other enhanced employee benefits, in addition to cost increases associated with employee recruitment.
The market for qualified talent continues to be competitive and we must ensure that we continue to offer competitive wages, benefits and workplace conditions to retain qualified employees. We experienced substantial increases in employee wages throughout 2022 and 2023. This trend may continue over the near term, and possibly longer. We continue to monitor our labor costs and attempt to mitigate the risk associated with employee turnover through increased recruiting, training and retention efforts. The impact of these disruptions remains largely out of our control, and these factors may continue to have a material adverse impact on our profitability and results of operations.
We invest significant time and expense in training our employees, which increases their value to competitors who may seek to recruit them. If we fail to retain our employees, we could incur significant expenses in hiring and training their replacements. There can be no assurance that we will be able to maintain an adequate skilled labor force necessary to efficiently operate our facilities. In addition, while our employees are not currently members of a union, there can be no assurance that the employees at any of our facilities will not choose to become unionized in the future.
Demand from our customers and towing operators is affected by the availability of capital and access to credit.
The ability of our customers and of towing operators to purchase our products is affected by the availability of capital and credit to them. Our independent distributor customers rely on floor plan financing in connection with the purchase of our products, and the availability of that financing on acceptable terms has a direct effect on the volume of their purchases. More restrictive lending practices in conjunction with continuing increases in the cost of such financing can prevent distributors from carrying adequate levels of inventory, which limits product offerings available to the end customer and could lead to reduced sales of our products. Additionally, in many cases, a towing operator’s decision to purchase our products from one of our distributors is dependent upon their ability to obtain financing upon acceptable terms. Volatility in the capital markets and rising interest rates have increased the cost of borrowing for our customers and towing operators. In the past, such volatility and disruptions to the capital and credit markets, principally in the U.S. and Europe, in the past has decreased the availability of capital to, and credit capacity of, our customers and towing operators. In addition, in the past, certain providers of floor plan financing have exited the market, which made floor plan financing increasingly difficult for our independent distributor customers to secure at those times. This reduced availability of capital and credit has negatively affected the ability and capacity of our customers and of towing operators to purchase towing and related equipment. This, in turn, has negatively impacted sales of our products. If interest rates continue to rise and our customers are unable to access capital or credit, it could materially and adversely affect our ability to sell our products, and as a result, could negatively affect our business and operating results.
Our business operations are subject to various international political, economic and other uncertainties that could materially adversely affect our business results.
Historically, a portion of our net sales occur outside the United States, primarily in Europe. We also have manufacturing operations at two facilities located in Europe. As such, our operations are subject to various international political, economic and other uncertainties, including risks of restrictive taxation policies, changing political conditions and governmental regulations and trade policies. The uncertainty surrounding the ongoing military conflicts in Ukraine, and more recently in the Middle East, and the United Kingdom’s “Brexit” from the European Union and their impact on European and worldwide economic and supply chain conditions. These developments have created and may continue to create legal, political and economic uncertainties and impacts, including disruptions to trade and free movement of goods, services and people to and from Europe, disruptions to our workforce or the workforce of our suppliers or business partners. All of the foregoing risks could have a material adverse effect on our business, financial condition and results of operations.
In addition, a portion of our net sales derived outside the United States, as well as salaries of employees located outside the United States and certain other expenses, are denominated in foreign currencies, including the British pound sterling and the euro. We are, therefore, subject to risk of financial loss resulting from fluctuations in exchange rates of these currencies against the US dollar. Brexit has caused, and may continue to result in, significant volatility in global stock markets and currency exchange rate fluctuations of the US dollar relative to other foreign currencies in which we conduct business, including both the British pound sterling and the euro.
In addition, political unrest, terrorist acts, military conflict, including the ongoing military conflict between Russia and Ukraine and the more recent conflict in the Middle East, and disease outbreaks, such as the COVID-19 pandemic, have increased the risks of doing business abroad in general.
|
Our business is subject to the cyclical nature of our industry and changes in consumer confidence and in economic conditions in general. Adverse changes or continued uncertainty with respect to these factors may lead to a downturn in our business.
The towing and recovery industry is cyclical in nature. Historically, the overall demand for our products and our resulting revenues have at times been negatively affected by wavering levels of consumer confidence, volatility and disruption in domestic and international capital and credit markets and the resulting decrease in the availability of financing for our customers and towing operators and the overall effects of global economic conditions. We remain concerned about the potential effects of these factors on the towing and recovery industry, and we continue to monitor our overall cost structure to see that it remains in line with business conditions. A prolonged economic downturn, including as a result of political unrest, terrorist acts, military conflict or outbreaks of disease such as the COVID-19 pandemic, and slow or negative growth in the domestic and global economy, could have a material adverse effect on our business, financial condition and results of operations for the foreseeable future.
Our sales to U.S. and other governmental entities through prime contractors are subject to special risks.
We act as a subcontractor for certain U.S. and other government programs. As a result, we are subject to extensive regulations and requirements of the U.S. and other government agencies and entities that govern these programs, including with respect to the award, administration and performance of contracts under such programs. Our U.S. and other government business is subject to the following risks, among others: (i) this business is susceptible to changes in government spending, which may reduce future revenues; (ii) most of our contracts with governmental entities through prime contractors are fixed-price contracts, and our actual costs on any of these contracts could exceed our projected costs, (iii) competition for the award of these contracts is intense, and we may not be successful in bidding on future contracts, and (iv) the products we sell to governmental entities are subject to highly technical requirements, and any failure to comply with these requirements could result in unanticipated retrofit costs, delayed acceptance of products, late or reduced payment or cancellation of the contract. Our inability to address any of the foregoing concerns could seriously harm our business, financial condition and results of operations.
Overall demand from our customers may be affected by increases in their fuel and insurance costs and changes in weather conditions.
In the past, our customers have experienced substantial increases in fuel and other transportation costs, and in the cost of insurance. Our customers also have, from time to time, been subject to unpredictable and varying weather conditions which could, among other things, impact the cost and availability of fuel and other materials. More recently, the ongoing military conflict between Russia and Ukraine and market dislocations associated with the economy’s recovery from the COVID-19 pandemic have both resulted in, and may continue to result in, substantial volatility in fuel costs in the U.S. and worldwide, and the extent and duration of such volatility cannot be predicted. Any of these factors could negatively affect our customers’ capacity for purchasing towing and related equipment, and, consequently, have a material negative effect upon our business and operating results.
Our competitors could impede our ability to attract or retain customers.
The towing and recovery equipment manufacturing industry is highly competitive. Capital requirements for entry into the towing and recovery manufacturing industry have been relatively low, which could result in an increase in the number of competitors entering the industry. Competition for sales exists domestically and internationally at the manufacturer, distributor and towing-operator levels and is based primarily on product quality and innovation, reputation, technology, customer service, product availability and price. Competition for sales also comes from the market for used towing and recovery equipment. Certain of our competitors may have substantially greater financial and other resources and may provide more attractive dealer and retail customer financing alternatives than us. If these competitors are able to make it more difficult for us to attract or retain customers, it could have a negative impact on our sales, revenue and financial performance.
The catastrophic loss of one of our manufacturing facilities could harm our business, financial condition and results of operations.
While we manufacture our products in several facilities and maintain insurance covering our facilities, including business interruption insurance to mitigate losses resulting from any production interruption or shutdown caused by an insured loss, a catastrophic loss of the use of all or a portion of any one of our manufacturing facilities due to accident, labor issues, weather conditions, natural disaster, civil unrest, terrorist acts, military conflict or disease outbreaks (including the COVID-19 pandemic), or otherwise, whether short or long-term, could materially harm our business, financial condition and results of operations. Any recovery under our insurance policies may not offset the lost sales or increased costs that may be experienced during the disruption of operations.
Risks Related to Legal, Regulatory and Compliance Matters
Environmental and health and safety liabilities and requirements could require us to incur material costs.
We are subject to various U.S. and foreign laws and regulations relating to environmental protection and worker health and safety, including those governing discharges of pollutants into the ground, air and water; the generation, handling, use, storage, transportation, treatment and disposal of hazardous substances and waste materials; and the investigation and cleanup of contaminated properties. In certain cases, these regulatory requirements may limit the productive capacity of our operations.
14 | FY 2023 FORM 10-K |
In addition, laws and regulations intended to achieve the goal of significantly reducing engine emissions associated with the operation of commercial vehicles are also being phased in by the U.S. Environmental Protection Agency and state regulators. For example, the California Air Resources Board’s (“CARB”), Advanced Clean Trucks regulation, which has been adopted by several other states, requires manufacturers, including truck body chassis manufacturers that supply to us, to sell an increasing percentage of zero-emission or near zero-emission medium and heavy-duty trucks into the California market starting in calendar year 2024.
CARB’s Advanced Clean Fleets regulation sets requirements for organizations to reduce the overall emissions of the vehicle fleets they operate, which affects our customers who own and operate fleets in California. These regulations are intended to drive larger market penetration of zero-emission commercial trucks. There are currently multiple efforts underway which seek to prevent or delay some or all of these regulations from taking effect, or otherwise seek relief from CARB’s regulations. However, compliance with the regulations as currently written, or new or more stringent laws or regulations, or stricter interpretations of existing laws or regulations could materially adversely affect our results of operations, financial condition or cash flows.
Environmental and health-related requirements are complex, subject to change and have tended to become more and more stringent. Future developments could cause us to incur various expenditures and could also subject us to fines or sanctions, obligations to investigate or remediate contamination or restore natural resources, liability for third party property damage or personal injury claims and the imposition of new permitting requirements and/or the modification or revocation of our existing operating permits, among other effects. These and other developments could materially harm our business, financial condition and results of operations.
Our facilities and operations could in the future be subject to regulations related to climate change and climate change (or events caused by climate change) may also have some impact on the Company’s operations. However, these impacts are currently uncertain, and the Company cannot presently predict the nature and scope of those impacts.
Failure to comply with domestic and foreign anti-corruption laws could have an adverse effect on our business.
Our domestic and international operations require us to comply with a number of U.S. and international laws and regulations, including those involving anti-bribery and anti-corruption. Failure to comply with the Foreign Corrupt Practices Act, the U.K. Bribery Act, and other foreign anti-bribery laws could have an adverse effect on our business. Violations of these laws, or allegations of such violations, could result in our incurring significant fees and having fines and criminal sanctions imposed on us or our employees, and could adversely impact our business with government entities.
Our future success depends upon our ability to develop or acquire proprietary products and technology and assertions against us relating to intellectual property rights could harm our business.
Historically, we have been able to develop or acquire patented and other proprietary product innovations which have allowed us to produce what management believes to be technologically advanced products relative to most of our competition. While we are continuing to develop new technology and apply for patents, if we are unable to develop or acquire new products and technology in the future, our ability to maintain market share, and, consequently, our revenues and operating results, may be negatively affected.
Our industry is marked by rapid technological developments and innovations (such as the use of artificial intelligence and machine learning) and evolving industry standards. If we are unable to provide enhancements and new features and integrations for our existing platform, develop new products that achieve market acceptance, or innovate quickly enough to keep pace with these rapid technological developments, our business could be harmed.
Third parties may claim that our products infringe their patents or other intellectual property rights. If a competitor were to challenge our patents, or assert that our products or processes infringe its patent or other intellectual property rights, we could incur substantial litigation costs, be forced to design around their patents, pay substantial damages or even be forced to cease our operations, any of which could be expensive and/or have an adverse effect on our operating results. Third-party infringement claims, regardless of their outcome, would not only consume our financial resources, but also would divert the time and effort of our management and could result in our customers or potential customers deferring or limiting their purchase or use of the affected products or services until resolution of the litigation.
Changes in the tax regimes and related government policies and regulations in the countries in which we operate could adversely affect our results and our effective tax rate.
As a result of our international operations, we are subject to various taxes in both U.S. and non-U.S. jurisdictions. Due to economic and political conditions, tax laws, regulations and rates in these various jurisdictions may be subject to significant change. Our future effective income tax rate could be affected by changes in the mix of earnings in countries with differing statutory tax rates, the adoption of a global minimum tax rate for corporate entities, changes in the valuation of deferred tax assets or changes in tax laws or their interpretation. Changes to long-standing tax principles in the countries in which we operate could adversely affect our effective tax rate or result in higher cash tax liabilities. Increases in our effective tax rate or tax liabilities could have a material adverse effect on us.
In addition, the provisions of the Inflation Reduction Act, which was enacted in August 2022, include a minimum tax equal to 15% of the adjusted financial statement income of certain large corporations, as well as a 1% excise tax on certain share buybacks by public corporations that would be imposed on
|
such corporations. It is possible that changes under the Tax Cuts and Jobs Act, which was enacted in December 2017, the IRA or other tax legislation could increase our future tax liability, which could in turn adversely impact our business and future profitability.
The effects of regulations relating to conflict minerals may adversely affect our business.
In 2012, the SEC adopted rules under the Dodd-Frank Wall Street Reform and Consumer Protection Act to improve transparency and accountability concerning the supply of certain minerals, known as “conflict minerals”, originating from the Democratic Republic of Congo and adjoining countries. These rules could adversely affect the sourcing, availability and pricing of such minerals if they are found to be used in the manufacture of our products, as the number of suppliers who provide conflict-free minerals may be limited. In addition, we have incurred and expect to incur additional costs to comply with the disclosure requirements, including costs related to determining the source of any of the relevant minerals and metals used in our products. In addition to the SEC regulation, the European Union adopted new requirements for European Union importers of conflict minerals, which went into effect on January 1, 2021, and that may impact and increase the cost of our conflict minerals compliance program. The Company’s supply chain is complex. As a result, we have encountered and continue to expect significant difficulty in determining the country of origin or the source and chain of custody for all “conflict minerals” used in our products and disclosing that our products are “conflict free” (meaning that they do not contain “conflict minerals” that directly or indirectly finance or benefit armed groups in the Democratic Republic of the Congo or an adjoining country). We may face reputational challenges from customers, investors or others if we are unable to verify the origins for all “conflict minerals” used in our products. In such event, we may also face difficulties in satisfying customers who may require that all of the components of our products be certified as conflict mineral free.
A product warranty or product liability claim in excess of our insurance coverage, or an inability to acquire or maintain insurance at commercially reasonable rates, could have a material adverse effect upon our business.
We are subject to various claims, including product warranty and product liability claims arising in the ordinary course of business, and may at times be a party to various legal proceedings incidental to our business. We maintain reserves and liability insurance coverage at levels based upon commercial norms and our historical claims experience. If we manufacture poor quality products or receive defective materials, we may incur unforeseen costs in excess of what we have reserved in our financial statements. A successful product warranty, product liability or other claim brought against us in excess of our insurance coverage, or the inability of us to acquire or maintain insurance at commercially reasonable rates, could have a material adverse effect upon our business, operating results and financial condition. In addition, we are subject to potential recalls of components or parts manufactured by suppliers which we purchase and incorporate into our towing and recovery equipment products, as well as potential recalls of our products from customers to cure manufacturing defects or in the event of a failure to comply with applicable regulatory standards or customers’ order specifications. Moreover, the adverse publicity that may result from a product liability claim, perceived or actual defect with our products or a product recall could have a material adverse effect on our ability to market our products successfully.
RISKS RELATED TO OUR COMMON STOCK
Our stock price may fluctuate greatly as a result of the general volatility of the stock market, or from our involvement with activist shareholders.
From time to time, there may be significant volatility in the market price for our common stock. Our quarterly operating results, changes in earnings estimated by analysts, if any, changes in general conditions in our industry or the economy or the financial markets or other developments affecting us, including our ability to pay dividends, could cause the market price of our common stock to fluctuate substantially.
In addition, we seek to actively engage with shareholders and consider their views on business and strategy. However, we could be subject to actions or proposals from shareholders or others that do not align with our business strategies or the interests of our other shareholders. And publicly traded companies have increasingly become subject to campaigns by activist investors advocating corporate actions such as governance changes, financial restructurings, increased borrowings, special dividends, stock repurchases or even sales of assets or entire companies to third parties or to the activists themselves. Responding to activist investors could be costly and time-consuming, disrupt our business and operations, adversely affect our relationships with our employees, customers, or service providers, and divert the attention of our Board of Directors and senior management. Further, we may be required to incur significant fees and other expenses related to such matters, including fees and expenses for third-party advisors. Perceived uncertainties associated with such activities could interfere with our ability to effectively execute our strategic plan, impact long-term growth, and limit our ability to hire and retain qualified personnel, business partners, customers, and others important to our success. In addition, actions of these shareholders may cause periods of fluctuation in our stock price based on temporary or speculative market perceptions or other factors that do not necessarily reflect the underlying fundamentals and prospects of our business.
16 | FY 2023 FORM 10-K |
Our charter and bylaws contain anti-takeover provisions that may make it more difficult or expensive to acquire us in the future or may negatively affect our stock price.
Our charter and bylaws contain restrictions that may discourage other persons from attempting to acquire control of us, including, without limitation, prohibitions on shareholder action by written consent and advance notice requirements regarding amendments to certain provisions of our charter and bylaws. In addition, our charter authorizes the issuance of up to 5,000,000 shares of preferred stock. The rights and preferences for any series of preferred stock may be set by the Board of Directors, in its sole discretion and without shareholder approval, and the rights and preferences of any such preferred stock may be superior to those of common stock and thus may adversely affect the rights of holders of common stock.
RISKS RELATED TO INDEBTEDNESS AND LIQUIDITY
Our credit facility could restrict our ability to operate our business and failure to comply with its terms could adversely affect our business; our obligations to repurchase products from third-party lenders could adversely impact our future revenues and financial condition.
Our credit facility contains customary representations and warranties, events of default, and financial, affirmative and negative covenants for loan agreements of this kind. In addition, covenants under our current credit facility restrict our ability to pay cash dividends if the Company would be in violation of the minimum tangible net worth test or the leverage ratio test in the current loan agreement as a result of the dividend, among various restrictions. We have been in compliance with these covenants throughout 2023 and anticipate that we will continue to be in compliance during 2024. If we fail to comply with the requirements of our current credit facility, such non-compliance would result in an event of default. If not waived by the bank, such event of default would result in the acceleration of any amounts due under the current credit facility.
We also have certain obligations to repurchase our products repossessed by third-party lenders if our distributors should default in their obligations to those lenders. Such repurchases could result in reduced net revenue in future periods as we resell such products and, if we are unable to sell the products, could adversely impact our financial condition.
We cannot assure you that we will continue to declare dividends on our common stock.
Our Board of Directors approved a dividend policy in 2011 to consider and pay quarterly dividends on our common stock subject to our ability to satisfy all applicable statutory requirements and our continued financial strength. While we currently intend to pay a quarterly dividend on shares of our common stock, to the extent that we have sufficient funds available for such purpose, the declaration, amount and payment of any future dividends on shares of common stock will be at the sole discretion of our Board of Directors and we may reduce or discontinue entirely the payment of such dividends at any time. Our Board of Directors may take into account general and economic conditions, our financial condition and operating results, capital requirements, restrictions in financing agreements and such other factors as they may deem relevant from time to time.
GENERAL RISK FACTORS
A disruption in, or breach in security of, our information technology (“IT”) systems or any violation of data protection laws could adversely impact our business and operations.
We rely on the accuracy, capacity and security of our IT systems and our ability to update these systems in response to the changing needs of our business. We use our IT systems to collect and store confidential and sensitive data, including information about our business, our customers, our suppliers and our employees. We rely on IT systems to protect this information and to keep financial records, process orders, manage inventory, coordinate shipments to customers, and operate other critical functions. Our IT systems may be disrupted or fail for a number of reasons, including natural disasters, such as fires; power loss; software “bugs”, hardware defects or human error or malfeasance; or security breaches caused by hacking, computer viruses, malware, ransomware or other cyber-attacks. The risk of such cyber-attacks may be heightened as a result of the Russian conflict with Ukraine.
As technology continues to evolve, we anticipate that we will collect and store even more data in the future and that our systems will increasingly use remote communication features that are susceptible to both willful and unintentional security breaches. We have incurred costs and expect to incur significant additional costs in order to implement security measures that we feel are appropriate to protect our IT systems. Despite these efforts, future attacks could result in our systems or data being breached and/or damaged by computer viruses or unauthorized physical or electronic access. Such a breach could result in theft of our intellectual property or trade secrets and/or unauthorized access to controlled data and personal information stored in connection with our human resources function. In the event of a breach in security that allows third parties access to personal information, we are subject to a variety of ever-changing laws on a global basis that may require us to provide notification to the data owners, and that may subject us to lawsuits, fines and other means of regulatory enforcement or harm employee morale.
|
Any disruption, outage or breach of our IT systems could result in interruption of our business operations, damage to our reputation and a loss of confidence in our security measures, all of which could adversely affect our business. In addition, if our systems are improperly implemented, breached, damaged or cease to function properly, we may have to make significant investments to fix or replace them. To the extent that any data is lost or destroyed or any confidential information is inappropriately disclosed or used, it could adversely affect our competitive position or customer relationships, harm our business and possibly lead to significant claims, liability, or fines based upon alleged breaches of contract or applicable laws, which liabilities may not be covered by insurance. The Company is also required to comply with increasingly complex and changing laws and regulations enacted to protect business and personal data in the United States and other jurisdictions regarding privacy, data protection and data security, including those related to the collection, storage, use, transmission and protection of personal information and other customer, vendor or employee data. Regulators globally are also imposing greater monetary fines for privacy violations including the GDPR that became effective in the European Union in 2018. The GDPR and other changes in laws or regulations associated with the enhanced protection of certain types of sensitive data, such as healthcare data or other personal information, could increase our cost of providing our products and services.
Any loss of the services of our key executives could have a material adverse impact on our operations.
Our success is highly dependent on the continued services of our management team because of the management teams’ experience and skills gained from their long-term service to the Company. The loss of services of one or more key members of our senior management team could have a material adverse effect on us.
18 | FY 2023 FORM 10-K |
ITEM 1B. UNRESOLVED STAFF COMMENTS
None.
ITEM 1C. CYBERSECURITY
We proactively address cybersecurity risk through a comprehensive cybersecurity program to identify, protect, detect and respond to and manage reasonably foreseeable cybersecurity risks and threats. We use a multi-faceted approach including, but not limited to, third-party assessments, internal cybersecurity audits, IT security, governance, risk and compliance reviews. To defend, detect and respond to cybersecurity incidents, we, among other things, require mandatory third-party cybersecurity training and testing for all employees, perform periodic user access reviews across the organization, perform penetration testing using external third-party tools and techniques to test security controls, employ multifactor authentication and biometrics login tools, take steps to verify whether vendors have appropriate cybersecurity programs, and conduct frequent security assessments to identify and remedy vulnerabilities.
We also employ the use of Secure Socket Layer inspection on our firewalls, which are able to decrypt and scan all network traffic entering and leaving our facilities. We regularly engage external auditors and consultants to assess our internal cybersecurity programs and compliance with applicable practices and standards, including regularly reviewing and updating our incident response plan.
We have not experienced any material cybersecurity incidents to date. However, as described in Item 1A, “Risk Factors,” any breach of data security could result in a disruption of our services or improper disclosure of personal data or confidential information, which could harm our reputation, require us to expend resources to remedy such a security breach or defend against further attacks or subject us to liability under laws that protect personal data, resulting in increased operating costs or loss of revenue.
Cybersecurity is an important part of our enterprise-wide risk management processes and an area of focus for our Board and management. The entire Board of Directors reviews significant cybersecurity risks and works with the Audit Committee to address these issues. Our Chief Information Officer is responsible for overseeing cybersecurity and reports to the Board at all its regular quarterly meetings regarding matters of cybersecurity. These reports include existing and new cybersecurity risks, status on how management is addressing and/or mitigating those risks, cybersecurity and data privacy incidents (if any) and updating the status on defensive security measures and risk assessment and key information security initiatives. Our Board members also engage in ad hoc conversations with management on cybersecurity-related news events and discuss any updates to our cybersecurity risk management and strategy programs.
Our Chief Information Officer has been with the Company for more than 25 years, developing and overseeing our information systems and cybersecurity risk management program. Our Chief Information Officer and his team, which includes a cybersecurity professional, are informed about, and monitor the prevention, mitigation, detection and remediation of cybersecurity incidents through their management of, and participation in, the cybersecurity risk management and strategy processes described above, including the operation of our incident response plan, and report to the Board and Audit Committee on any appropriate items.
ITEM 2. PROPERTIES
Corporate Office
Our principal executive offices are headquartered in an owned facility located at 8503 Hilltop Drive in Ooltewah, Tennessee.
Production Facilities
We operate six manufacturing facilities in the United States, one in Norfolk, England and two in the Lorraine region of France. We also operate a research and development facility in the United States and have a storage facility located in France.
Our two Ooltewah, Tennessee facilities manufacture light and heavy-duty wreckers; our Athens, Tennessee facility manufactures hydraulic cylinders; our Hermitage, Pennsylvania facility manufactures car carriers; and our two Greeneville, Tennessee facilities manufacture car carriers.
We believe that our existing facilities are suitable and adequate for our present purposes. However, we regularly evaluate our properties and may make further additions and improvements or consolidate locations as we seek opportunities to expand or enhance the efficiency of our operations.
ITEM 3. LEGAL PROCEEDINGS
The legal proceedings in Note 10 – Commitments and Contingencies, of the Notes to the Consolidated Financial Statements are incorporated in the “Litigation” section by reference.
ITEM 4. MINE SAFETY DISCLOSURES
Not applicable.
|
ITEM 5. MARKET FOR REGISTRANT’S COMMON EQUITY, RELATED STOCKHOLDER MATTERS AND ISSUER PURCHASES OF EQUITY SECURITIES
Market Information
Our common stock is traded on the New York Stock Exchange under the symbol “MLR.”
Holders of Record
As of February 29, 2024, there were approximately 389 registered holders of record of our common stock. The number of record holders does not include persons who held our common stock in nominee or “street name” accounts through brokers.
Dividends
During fiscal 2023, the Company’s Board of Directors declared the following dividends on its common stock:
Declaration Date | Record Date | Payable Date | Per Share | ||||
March 6, 2023 | March 20, 2023 | March 27, 2023 | $ | 0.18 | |||
May 1, 2023 | June 5, 2023 | June 12, 2023 | $ | 0.18 | |||
August 7, 2023 | September 1, 2023 | September 11, 2023 | $ | 0.18 | |||
November 6, 2023 | December 4, 2023 | December 11, 2023 | $ | 0.18 | |||
The Company has paid consecutive quarterly cash dividends since May 2011. Any future determination as to the payment of cash dividends will depend upon factors such as earnings, capital requirements, our financial condition, restrictions in financing agreements and other factors deemed relevant by our Board of Directors. Covenants under our current credit facility restrict the payment of cash dividends if the Company would be in violation of the minimum tangible net worth test or the leverage ratio test in the current loan agreement as a result of the dividend, among various other restrictions.
For more information on dividends, see Note 11 – Shareholders’ Equity, to our Consolidated Financial Statements.
Equity Compensation Plan Information
The information required by this item is incorporated by reference from the information to be included in our 2024 Proxy Statement under the section entitled “Equity Compensation Plan Information,” which will be filed with the SEC within 120 days after December 31, 2023.
Sales of Unregistered Securities
None.
Stock Performance Graph
The following graph compares the performance of our common stock to the NYSE Composite index and two peer groups of issuers. Peer group 1 consists of peers used by an investor’s services group and peer group 2 was developed by the Company with input from the compensation consultant of the Compensation Committee of the Board of Directors.
In October 2023, peer, CIRCOR International, Inc., was acquired by a global investment firm. As a result, its shares ceased to trade on the NYSE. Correspondingly, the Company removed CIRCOR International, Inc., from its performance data for all periods presented to allow for more meaningful comparisons.
20 | FY 2023 FORM 10-K |
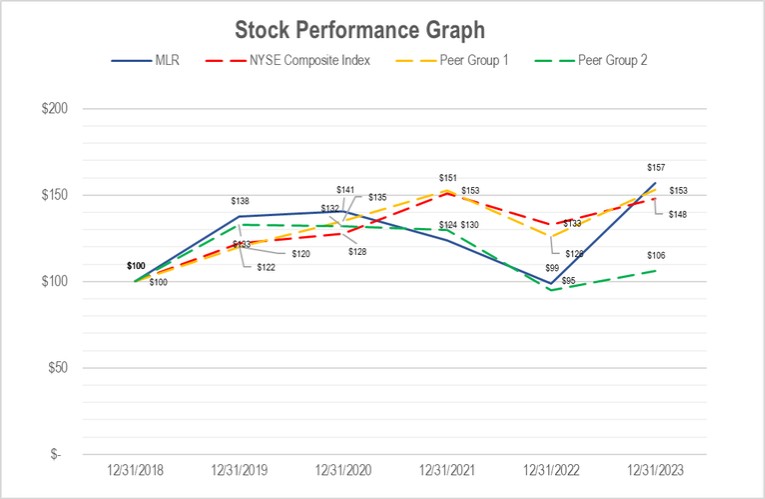
The performance graph above assumes $100 was invested on December 31, 2018 in common stock of Miller Industries. Any dividends paid during the period presented were assumed to be reinvested. The performance was plotted using the following data:
12/31/2018 | 12/31/2019 | 12/31/2020 | 12/31/2021 | 12/31/2022 | 12/31/2023 | ||
Miller Industries, Inc. | $ 100 | $ 138 | $ 141 | $ 124 | $ 99 | $ 157 | |
NYSE Composite Index | $ 100 | $ 122 | $ 128 | $ 151 | $ 133 | $ 148 | |
Peer Group 1 | $ 100 | $ 120 | $ 135 | $ 153 | $ 126 | $ 153 | |
Peer Group 2 | $ 100 | $ 133 | $ 132 | $ 130 | $ 95 | $ 106 |
Peer Group 1 index consists of Albany International Corp. (AIN); Blue Bird Corp. (BLBD); Columbus McKinnon Corp. (CMCO); Commercial Vehicle Group, Inc. (CVGI); Enerpac Tool Group Corp. (EPAC); ESCO Technologies Inc. (ESE); L.B. Foster Co. (FSTR); Gorman-Rupp Co. (GRC); Helios Technologies Inc. (HLIO); Kadant Inc. (KAI); Lindsay Corp. (LNN); Luxfer Holdings PLC (LXFR); NN, Inc. (NNBR); Douglas Dynamics Inc. (PLOW); Proto Labs Inc. (PRLB); Shyft Group Inc. (SHYF); and Standex International Corp (SXI).
Peer Group 2 index consists of Astec Industries, Inc. (ASTE); Blue Bird Corp. (BLBD); Commercial Vehicle Group, Inc. (CVGI); Enerpac Tool Group Corp. (EPAC); L.B. Foster Co. (FSTR); Motorcar Parts of America, Inc. (MPAA); NN, Inc. (NNBR); Park-Ohio Holdings Corp (PKOH); Stoneridge, Inc. (SRI); Douglas Dynamics Inc. (PLOW); and Shyft Group Inc. (SHYF).
ITEM 6.
Reserved.
|
ITEM 7. MANAGEMENT’S DISCUSSION AND ANALYSIS OF FINANCIAL CONDITION AND RESULTS OF OPERATIONS
INTRODUCTION
As used in this report, "Miller Industries," the “Company,” "we," "our," “ours” "us," and similar pronouns refer to Miller Industries, Inc., and its consolidated subsidiaries, unless the context requires otherwise. Our fiscal year ends on December 31. References to fiscal 2023, 2022 and 2021, are to the fiscal years ended December 31, 2023, 2022, and 2021, respectively. Except as otherwise specified, information in this report is provided as of December 31, 2023. To facilitate timely reporting, the consolidated financial statements include accounts of certain subsidiaries whose fiscal closing dates differ from December 31st by 31 days (or less).
Management’s Discussion and Analysis of Financial Condition and Results of Operations
Our MD&A within this Form 10-K generally discusses fiscal 2023 and fiscal 2022 items and year-over-year comparisons between fiscal 2023 and fiscal 2022. Fiscal 2022 items and discussions of year-over-year comparisons between fiscal 2022 and fiscal 2021 that are not included in this Form 10-K can be found in Management’s Discussion and Analysis of Financial Condition and Results of Operations in our Annual Report on Form 10-K for the fiscal year ended December 31, 2022 (the "Fiscal 2022 Form 10-K").
Important Information Regarding Forward-Looking Statements
This report (including information incorporated by reference) includes forward-looking statements addressing expectations, prospects, estimates and other matters that are dependent upon future events or developments. Many forward-looking statements appear in MD&A and Risk Factors, but there are others throughout this report, which may be identified by words such as “may,” “will,” “should,” “could,” “continue,” “future,” “potential,” “believe,” “project,” “plan,” “intend,” “seek,” “estimate,” “predict,” “expect,” “anticipate” and variations of such words and similar expressions, and include statements reflecting future results or guidance, statements of outlook and expense accruals. These matters are subject to risks and uncertainties that could cause actual results to differ materially from those projected, anticipated or implied. The most significant of these risks and uncertainties are described in “Risk Factors” in this report. Forward-looking statements in this report speak only as of the date of this report. Except to the extent required by applicable law, we undertake no obligation to update or revise any forward-looking statement.
Available Information
Our Annual Report on Form 10-K, Quarterly Reports on Form 10-Q, Current Reports on Form 8-K, and amendments to those reports are available free of charge on our website (www.millerind.com), under the “Investors — Filings — Annual Reports” caption, as soon as reasonably practicable after we electronically file them with, or furnish them to, the SEC. The SEC also maintains a website (www.sec.gov) where you can search for annual, quarterly and current reports, proxy and information statements, and other information regarding us and other public companies.
22 | FY 2023 FORM 10-K |
ABOUT MILLER INDUSTRIES
Miller Industries, headquartered in Ooltewah, Tennessee, was formed in 1990 and has become The World’s Largest Manufacturer of Towing and Recovery Equipment®, with domestic manufacturing operations in Tennessee and Pennsylvania, and foreign manufacturing operations in France and the United Kingdom.
The Company develops innovative high-quality towing and recovery equipment worldwide. We design and manufacture bodies of car carriers and wreckers, which are installed on chassis manufactured by third parties, and resale to our customers under our Century®, Vulcan®, Chevron™, Holmes®, Challenger®, Champion®, Jige™, Boniface™, Titan® and Eagle® brand names.
Our management focuses on a variety of key indicators to monitor our overall operating and financial performance. These indicators include measurements of revenue, income from operations, gross margin, net income, earnings per share, capital expenditures and cash flow.
Our history of innovation in the towing and recovery industry has been an important factor behind our growth over the last decade and we believe that our continued emphasis on research and development will be a key factor in our future growth.
SIGNIFICANT TRENDS AND OUTLOOK
In 2023, we were presented with several ongoing challenges, such as supply chain constraints, freight challenges, intense inflation, rapidly increasing interest rates and labor shortages, all of which impacted our profitability and liquidity.
Supply Chain
We continue to see significant pressure on global supply chains due to a confluence of events from the pandemic to geopolitical tensions, and economic uncertainty. Logistic disruptions and supplier shortages have caused delays in shipping and freight cost increases. Increases in freight costs and supplier constraints due to workforce disruptions and material shortages have affected our ability to receive essential materials and component parts on time. These supply chain issues have had a direct impact on our production capabilities. Also affecting supply chain is the ongoing conflict in Ukraine and more recently in the Middle East. Given these challenges, we are maintaining focus on meeting the needs of our customers. Ongoing communication and prioritization continues with our suppliers in an effort to identify and mitigate such risks and to proactively manage inventory levels of materials and component parts to align with anticipated demand for our products.
The global supply chain issues have also had a direct impact on our production capabilities including production delays and cost pressures. Production delays have affected product availability and delivery timelines and increased logistics costs have led to higher operating cost which resulted in price adjustments for our products. In 2022, we implemented several price increases and surcharges and announced an eight-percent price increase effective in the first quarter of 2023. We have also developed alternatives to some of the components used in our production process that incorporate raw materials, and our suppliers have implemented these alternatives in the production of our component parts. In addition, beginning in the first quarter of fiscal 2022, we sought additional production capabilities through capital deployment, such as our acquisition of SHC in the second quarter of 2023 and our purchase of an additional small facility in Ooltewah, TN to be used in the production of small carrier units.
Based on our strong backlog, the price increases and productivity improvements we have implemented, lessening supply chain disruptions and easing inflationary pressures, our operating results improved throughout fiscal 2023 and we believe we are well-positioned to continue enhancing our operating results. However, our performance will be heavily influenced by, among other things, whether supply chain constraints and inflationary pressures continue to lessen or worsen, the continuing impact of the wars in Ukraine and Middle East or other geopolitical factors, and the threat of recession and general economic factors. The impact of these factors remains largely out of our control, and we currently anticipate that these factors will continue to have an adverse impact on our production capabilities, financial results and cash flow to continue into fiscal 2024.
Inflation
Impacts of current global supply chain disruptions, inflationary environment, geopolitical tensions and other macroeconomic factors can lead to foreign currency fluctuations. The impact of inflationary or deflationary pressues have caused and may continue to cause foreign currency translation gains or losses within our consolidated statement of comprehensive income/loss.
California’s Air Resources Board
The information regarding the California Air Resources Board’s regulations is included under the heading “Government Regulations and Environmental Matters” in Part I, Item I and in Part I, Item 1A–“Risk Factors” of this Annual Report.
|
RESULTS OF OPERATIONS
The following table sets forth the components of the consolidated statements of income expressed as a percentage of net sales for the years ended:
December 31, | |||||||||
(in thousands) | 2023 |
| 2022 |
| Change | ||||
Net Sales | $ | 1,153,354 | $ | 848,456 | 35.9% | ||||
Costs of operations | 1,001,500 | 766,037 | 30.7% | ||||||
Gross Profit | 151,854 | 82,419 | 84.2% | ||||||
Operating Expenses: |
|
| |||||||
Selling, general and administrative | 73,087 | 52,827 | 38.4% | ||||||
Non-operating (income) expenses |
|
| |||||||
Interest expense, net | 5,974 | 3,379 | 76.8% | ||||||
Other (income) expense, net | (991) | 481 | (306.0)% | ||||||
Total expenses, net | 78,070 | 56,687 | 37.7% | ||||||
Income before income taxes | 73,784 | 25,732 | 186.7% | ||||||
Income tax provision | 15,493 | 5,386 | 187.7% | ||||||
Net income | $ | 58,291 | $ | 20,346 | 186.5% | ||||
Comparison of the Years Ended December 31, 2023 and 2022
Net Sales
Consolidated net sales in fiscal 2023 were $1,153.4 million compared to $848.5 million in fiscal 2022, an increase of 35.9%. The increase in net sales was primarily driven by increases in production volume due to supply chain improvements and continued strong customer demand, as well as pricing adjustments implemented in the first quarter.
Net foreign sales in fiscal 2023 were $114.4 million compared to $83.1 million in fiscal 2022, an increase of 38.0%.
Cost of Operations
Costs of operations in fiscal 2023 were $1,001.5 million compared to $766.0 million in fiscal 2022, an increase of 30.7%. The increase in cost of operations was primarily attributed to increased deliveries resulting from increased stabilization in supply chain.
Gross Profit
Gross profit is equal to net sales less cost of sales. Gross profit in fiscal 2023 was $151.9 million compared to $82.4 million in fiscal 2022, an increase of 84.2%. Cost of sales includes the direct cost of manufacturing, including direct materials, labor and related overhead, physical inventory adjustments, as well as inbound and outbound freight.
Selling, General and Administrative
Selling, general and administrative expenses in fiscal 2023 were $73.1 million compared to $52.8 million in fiscal 2022, an increase of 38.4%. The increase in selling, general and administrative expenses was primarily due to additional executive compensation expense, investor relations activity, increased expenses associated with increased sales volume and increased investment in our workforce, specifically for training and more competitive compensation to improve employee retention. As a percentage of net sales, selling, general and administrative expenses increased to 6.3% in 2023 from 6.2% in 2022.
Interest Expense, Net
Interest expense, net in fiscal 2023 was $6.0 million compared to $3.4 million in fiscal 2022, an increase of 76.8%. Increases in interest expense, net were primarily due to increased borrowings, increased interest rates and increases in floor plan interest payments, offset by interest income.
Other (Income) Expense
The Company is exposed to foreign currency transaction risk when the Company has transactions that are denominated in a currency other than its functional currency. When the related balance sheet items are remeasured in the functional currency of the Company, gains and losses are recorded through other (income) expense. Other (income) expense, net is composed primarily of these foreign currency exchange gains and losses. The Company experienced a net foreign currency exchange gain of $0.8 million for 2023 compared to a net exchange loss of $0.7 million for 2022. Other (income) expense for fiscal 2023 includes $0.2 million of other income.
24 | FY 2023 FORM 10-K |
Provision for Income Taxes
The provision for income taxes for the years ended December 31, 2023 and 2022 reflects a combined federal, state and foreign tax rate of 21.0% and 21.0%, respectively, which corresponds to a tax provision of $15.5 million in 2023 compared to $5.4 million for 2022. For more information on the effective tax rate, see Note 8 to our consolidated financial statements.
LIQUIDITY AND CAPITAL RESOURCES
We expect our primary sources of cash to be from cash and temporary investments, cash flow from operations and availability under our credit facility at December 31, 2023. We currently believe that, based on available capital resources and projected operating cash flow, we have adequate capital resources to fund our operations and expected future cash needs as described below. However, our ability to satisfy our cash needs will substantially depend upon a number of factors including our future operating performance, taking into account the economic, regulatory and other factors discussed elsewhere in this Annual Report, many of which are beyond our control.
Cash and Temporary Investments
At December 31, 2023 and 2022, we had consolidated cash and temporary investments of $29.9 million and $40.2 million, respectively. Our primary cash requirements include working capital, capital expenditures, the funding of any declared cash dividends and principal and interest payments on indebtedness.
At December 31, 2023 and 2022, cash and temporary investments included $18.2 million and $18.3 million held by foreign subsidiaries based in the local currency, respectively. We do not currently have plans to repatriate undistributed foreign earnings to the United States and have not determined any timeline or amount for any such future distributions.
Working Capital
Working capital at December 31, 2023 and 2022 was $275.8 million and $219.9 million, respectively. Changes in working capital, which impact operating cash flow, can vary significantly depending on factors such as the timing of customer payments, inventory purchases and payments to vendors. Management continually monitors working capital to ensure it remains at levels to support ongoing operations, meet obligations and pursue growth opportunities. See “Cash Flows” – “Cash Flows provided by (used in) Operating Activities” contained within this MD&A for additional discussion on working capital.
Capital Expenditures
Capital expenditures during fiscal 2023 and 2022 were $12.1 million and $28.9 million, respectively. We make ongoing capital investments in our property, plant and equipment, and continue to increase purchases of materials, components and chassis to ramp up production to meet demand, which has been at historic levels. We believe that in periods of normalized supply chain, our historical capital investments in our manufacturing facilities and other capital assets will increase the production capacity and efficiencies of our operations. See “Cash Flows” – “Cash Flows provided by (used in) Investing Activities” contained within this MD&A for additional discussion on capital expenditures.
Dividends
Our Board of Directors declared quarterly cash dividends of $0.18 per share in fiscal 2023. Future common stock cash dividends will depend on our financial condition, results of operations, capital requirements and other factors deemed relevant by our Board of Directors. See Note 11, Shareholders’ Equity, for additional discussion on dividends.
Indebtedness
Credit Facility
On October 28, 2022, we entered into a first amendment to the loan agreement with First Horizon Bank (“First Horizon”) that provides an unsecured revolving credit facility with a maturity date of May 31, 2027, to increase the credit facility from $50.0 million to $100.0 million, made certain technical and operational adjustments necessary to implement the one month Term SOFR Rate (as defined in the loan agreement) as the primary interest rate index under the credit facility and added a new asset coverage financial covenant test. All other material terms and conditions of the credit facility remained unchanged.
The Company pays a quarterly, non-usage fee under the current loan agreement at a rate per annum equal to between 0.15% and 0.35% of the unused amount under the credit facility. The credit facility contains customary representations and warranties, events of default and financial, affirmative and negative covenants for loan agreements of this kind.
Our ongoing operations have, to date, been funded by a combination of cash flow from operations and borrowings under our credit facility. As of December 31, 2023, the Company had $60.0 million in borrowings outstanding under the credit facility. In January 2024, the Company paid $5.0 million towards its credit facility and retains a balance of $55.0 million at February 29, 2024.
|
Changes in interest rates affect the interest paid on indebtedness under our credit facility because the outstanding amounts of indebtedness under our current credit facility are subject to variable interest rates. Under our credit facility, the non-default rate of interest is equal to the one-month Term SOFR plus 1.00% or 1.25% per annum, depending on our leverage ratio, for a rate of interest of 6.47% at December 31, 2023.
As of December 31, 2023, we were in compliance with all covenants under the credit facility.
Other Long-Term Obligations
Prior to applying a discount rate to our lease liabilities, we had approximately $0.9 million in non-cancellable operating lease obligations and no non-cancellable finance lease obligations for both years ended December 31, 2023 and 2022. Leases with original contractual terms less than one year were excluded from non-cancellable lease obligations.
During fiscal 2021, we completed phase one of our enterprise software solution implementation. During fiscal 2022 and fiscal 2023, we continued to implement additional functionality available in the enterprise software solution. We expect this software to substantially improve our administrative efficiency and customer service levels. We have $1.4 million in remaining contractual payments under our agreement with the software provider, which extends through 2025.
Cash Flows
Information about our cash flows, by category, is presented in our consolidated statement of cash flows and is summarized below:
December 31, | ||||||||
(in thousands) |
| 2023 |
| 2022 |
| Change | ||
Operating activities | $ | 10,963 | $ | (19,155) | 157.2 | % | ||
Investing activities | (29,075) | (28,931) | 0.5 | % | ||||
Financing activities | 6,751 | 36,765 | (81.6) | % | ||||
Effect of exchange rate changes on cash and temporary investments |
| 1,117 | (2,858) | 139.1 | % | |||
Net increase / (decrease) in cash and temporary investments | $ | (10,244) | $ | (14,179) | (27.8) | % | ||
Cash Flows provided by (used in) Operating Activities
Cash provided by operating activities during 2023 was $11.0 million, compared to $19.2 million of cash used in operating activities during 2022. Cash provided by operating activities is generally attributable to the receipt of payments from our customers as settlement of their contractual obligation once we have fulfilled all performance obligations related to our contracts with them. These cash receipts are netted with payments for purchases of inventory, payments for materials used in manufacturing and other payments that are necessary in the ordinary course of our operations, such as those for utilities and taxes. The change in operating activities is primarily due to increased net income and a stabilization of changes in operating assets and liabilities as a result of improved availability of purchased components.
Cash used in operating activities during fiscal 2022, included purchases of materials, components and chassis to ramp up production to meet our historic demand levels and to mitigate various supply chain disruptions. These purchases coupled with the increased costs of inventory and labor caused cash provided by operating activities to be exceeded by cash used in operating activities.
Changes in working capital, which impact operating cash flow, can vary significantly depending on factors such as the timing of customer payments, inventory purchases, payments to vendors and tax payments in the regular course of business.
Cash Flows provided by (used in) Investing Activities
Cash used in investing activities during 2023 was $29.1 million, compared to $28.9 million used during 2022. The cash used in investing activities for 2023 was primarily for the purchase of SHC, Inc., (see Note 2) and purchases of property, plant and equipment.
Cash used in investing activities during fiscal 2022 was primarily for the purchase of property, plant and equipment, including an aircraft purchased which is used to enhance our marketing efforts, establish and maintain our relationships with key suppliers and visit our facilities that are not easily accessible via commercial air travel. We also continued to invest in manufacturing automation, ERP system enhancements and employee safety initiatives.
Cash Flows provided by (used in) Financing Activities
Cash provided by financing activities during 2023 was $6.8 million, compared to $36.8 million provided by 2022. The cash provided by financing activities in 2023 resulted from advances of $15.0 million under the Company’s primary credit facility, offset by the payment of cash dividends of $8.2 million.
Cash provided by financing activities during fiscal 2022 included advances on the credit facility of $45.0 million, offset by dividend payments of $8.2 million and an immaterial amount of payments on finance lease obligations.
CRITICAL ACCOUNTING POLICIES AND SENSITIVE ACCOUNTING ESTIMATES
26 | FY 2023 FORM 10-K |
Critical accounting policies and estimates are those accounting policies that (i) can have a significant impact on our financial condition and results of operations and (ii) require the use of complex and subjective estimates based upon past experience and management’s judgment. Because estimates are inherently uncertain, actual results may differ. In this section, we describe the significant policies applied in preparing our consolidated financial statements that management believes are the most dependent on estimates and assumptions. See Note 1 of the consolidated financial statements for further discussion on significant accounting policies.
Allowance for Credit Losses
The allowance for credit losses includes general and specific reserves. We determine our allowance for credit losses by reviewing accounts receivable aging, historical write-off trends, payment history, pricing discrepancies, industry trends, customer financial strength, customer credit ratings or bankruptcies. We regularly evaluate how changes in economic conditions may affect credit risks.
A hypothetical 0.1 percent increase or decrease in the reserve as a percentage of trade receivables at December 31, 2023, would result in an increase or decrease in bad debt expense of $0.3 million. We believe the reserve maintained and expenses recorded in fiscal 2023 are appropriate.
At this time, we are not aware of any analytical findings or customer issues that are likely to lead to a significant future increase in the allowance for credit losses as a percentage of revenue. The following table presents information regarding our allowance for credit losses over the past three fiscal years:
(in thousands, except percentages) |
| 2023 | 2022 | 2021 | |||||
Allowance for credit losses, beginning of period |
| $ | 1,319 | $ | 1,155 | $ | 1,295 | ||
Charges to costs and expenses | 208 | 174 | (137) | ||||||
Reduction to allowance for customer write-offs |
| — |
| (10) |
| (3) | |||
Allowance for credit losses, end of period | $ | 1,527 | $ | 1,319 | $ | 1,155 | |||
Allowance as a percentage of customer receivables | 0.5% | 0.7% | 0.7% | ||||||
Allowance as percentage of revenue | 0.1% | 0.2% | 0.2% | ||||||
Inventory
Inventories are valued at the lower of cost or net realizable value determined primarily on a moving average unit cost basis. As needed, we record an inventory valuation adjustment for excess, slow moving and obsolete inventory that is equal to the excess of the cost of the inventory over the estimated net realizable value. The inventory valuation adjustment to net realizable value establishes a new cost basis of the inventory that cannot be subsequently reversed.
In developing inventory valuation adjustments for excess, slow moving, and obsolete inventory, we are required to use judgment and make estimates of future sales demand and production requirements compared with current inventory levels.
Our estimate of forecasted sales demand and production requirements is primarily based on actual orders received, historical and projected sales trends, demand, product pricing, and economic trends and competitive factors. Forecasted sales demand and production requirements can also be affected by the significant redesign of our existing products. If actual conditions are less favorable than our assumptions, additional inventory reserves may be required.
Long-Lived Assets
Long-lived assets are reviewed for impairment whenever events or circumstances indicate that the carrying amount of these assets may not be fully recoverable. When a determination has been made that the carrying amount of long-lived assets may not be fully recovered, the amount of impairment is measured by comparing an asset’s estimated fair value to its carrying value. The determination of fair value is based on projected future cash flows discounted at a rate determined by management, or if available, independent appraisals or sales price negotiations.
The estimation of fair value includes significant judgment regarding assumptions of revenue, operating costs, interest rates, property and equipment additions, and industry competition and general economic and business conditions among other factors. We believe that these estimates are reasonable; however, changes in any of these factors could affect these evaluations. Based on these estimates, we believe that our long-lived assets are appropriately valued.
Business Combinations
When applicable, we account for the acquisition of a business in accordance with ASC 805, Business Combinations, whereby the fair value of total consideration transferred is allocated to the assets acquired and liabilities assumed, including amounts attributable to non-controlling interests, when applicable, based on their respective estimated fair values as of the date of acquisition. Goodwill represents the excess of consideration transferred over the estimated fair value of the net assets acquired.
|
The allocation of purchase consideration requires management to make significant estimates and assumptions. Management’s estimates of fair value are based upon assumptions believed to be reasonable, but which are inherently uncertain and unpredictable and, as a result, actual results may differ from such estimates. During the measurement period, which is no longer than one year from the acquisition date, the Company may record adjustments to the assets acquired and liabilities assumed. Upon the conclusion of the measurement period, any subsequent adjustments are recognized in operations.
While the ultimate responsibility for determining estimated fair values of the acquired net assets resides with management, for material acquisitions we may retain the services of certified valuation specialists to assist with assigning estimated fair values to certain acquired assets and assumed liabilities.
Goodwill
Goodwill is initially recognized as a result of the excess of purchase consideration transferred over the estimated fair value of the net assets acquired in a business combination. Goodwill is not amortized, but is tested at least annually for impairment during the fourth quarter of our fiscal year unless events or changes in circumstances indicate that impairment may have occurred prior to our annual assessment.
We may elect to first perform a qualitative assessment to determine whether changes in events or circumstances since our most recent quantitative test for impairment indicate that it is more likely than not that the fair value of a reporting unit is less than its respective carrying amount. We have an unconditional option to bypass the qualitative assessment for a reporting unit and proceed directly to performing the quantitative analysis. If elected, in conducting the initial qualitative assessment, we analyze our most recent estimates of the fair value of a reporting unit by assessing actual and projected growth trends for operating results, as well as historical operating results versus planned performance. Additionally, a reporting unit is assessed for critical areas that may impact its operating performance, including macroeconomic conditions, industry and market considerations, cost factors such as products and component parts and labor, as well as market-related exposures such as fluctuations in our company's market capitalization and share price, and/or any other potential risks to operating performance, such as regulatory and environmental changes. If, after evaluating the weight of the changes in events and circumstances, both positive and negative, we conclude that an impairment of goodwill may exist, a quantitative test for impairment is performed.
If performed due to identified impairment indicators under the qualitative assessment or our election to bypass the qualitative assessment and move directly to the quantitative analysis, the quantitative impairment analysis for goodwill is conducted under the income approach. Under the income approach, we calculate the fair value of our reporting unit’s assets using the present value of future cash flows. Assumptions utilized in determining fair value under the income approach include forecasted operating results, terminal growth rates, and weighted-average cost of capital ("WACC") or discount rates.
Estimating the fair value of a reporting unit requires the use of estimates and significant judgments that are based on a number of factors including actual operating results. The use of estimates and assumptions could materially affect the determination of fair value for a reporting unit and potentially result in goodwill impairment. If a reporting unit fails to achieve expected earnings or operating cash flow, or otherwise fails to meet current financial plans, or if there were changes to any other key assumptions used in the tests, the reporting unit could incur a goodwill impairment in a future period.
Warranty Reserves
Our products are warranted to provide assurance that the product will function as expected and to ensure customer confidence in design, workmanship, and overall quality. Warranty coverage on our products is generally provided for specified periods of time and generally covers parts, labor, and other expenses for non-maintenance repairs.
At the time of sale, we recognize expense and record a warranty accrual by product line for estimated costs in connection with forecasted future warranty claims. Our estimate of the cost of future warranty claims is based primarily on the estimated number of products under warranty, historical average costs incurred to service warranty claims, the trend in the historical ratio of warranty claims to sales, and the historical length of time between the sale and resulting warranty claim. If applicable, historical claims experience may be adjusted for known product design improvements.
We believe that our analysis of historical warranty claim trends and knowledge of potential manufacturing and/or product design improvements provide sufficient information to establish a reasonable estimate for the cost of future warranty claims at the time of sale and our warranty accruals as of the date of our consolidated balance sheets. However, due to the inherent uncertainty in the accrual estimation process, including forecasting future warranty claims and costs associated with servicing future warranty claims, our actual warranty costs incurred may differ from our warranty accrual estimate. An unexpected increase in warranty claims and/or in the costs associated with servicing those claims would result in an increase in our warranty accruals and a decrease in our net earnings.
Income Taxes
We estimate our deferred tax assets and liabilities, income taxes payable, provision for income taxes, and unrecognized tax benefit liabilities based upon various factors including, but not limited to, historical pretax operating income, future estimates of pretax operating income, differences between book and tax treatment of various items of income and expense, interpretation of tax laws and tax planning strategies. We are subject to income taxes in the U.S. and foreign jurisdictions.
We recognize tax assets and liabilities in accordance with ASC 740, Income Taxes, for income tax accounting. Accordingly, we recognize a tax benefit from an uncertain tax position when it is more likely than not the position will be sustained upon examination based on the largest benefit that has a greater than
28 | FY 2023 FORM 10-K |
50 percent likelihood of being realized upon ultimate settlement. Due to the complexity of some of these uncertainties, the ultimate resolution may result in a payment that is materially different from our current estimate of the unrecognized tax benefit liabilities. In addition, changes in existing tax laws or rates could significantly change our current estimate of our unrecognized tax benefit liabilities. These differences will be reflected as increases or decreases to income tax expense in the period in which they are determined. Changes in current estimates, if significant, could have a material adverse impact on our financial statements.
We recognize our deferred tax assets and liabilities based upon the expected future tax outcome of amounts recognized in our results of operations. If necessary, we recognize a valuation allowance on deferred tax assets when it is more likely than not they will not be realized. We evaluate our ability to realize the tax benefits associated with deferred tax assets by assessing the adequacy of future expected taxable income, historical and projected operating results and the availability of prudent and feasible tax planning strategies. The realization of deferred tax assets is evaluated by jurisdiction and the realizability of these assets can vary based on the character of the tax attribute and the carryforward periods specific to each jurisdiction. We believe it is more likely than not the results of future operations will generate sufficient taxable income to realize our existing deferred tax assets, net of valuation allowances. Changes in the realizability of our deferred tax assets will be reflected in our effective tax rate in the period in which they are determined.
Foreign Currency Translations
The functional currency of the Company's foreign operations is generally the applicable local currency. The functional currency is translated into U.S. dollars using the respective current exchange rate in effect as of the balance sheet date for balance sheet accounts and the respective weighted-average exchange rate during the period for revenue and expense accounts. The resulting translation adjustments are deferred as a component of other comprehensive income within the Consolidated Statements of Comprehensive Income and the Consolidated Statements of Shareholders' Equity. Gains or losses resulting from transactions denominated in foreign currencies are included in other income, net in the Consolidated Statements of Income.
RECENT ACCOUNTING PRONOUNCEMENTS
See Note 1 to the consolidated financial statements for a discussion of recent accounting standards and pronouncements.
|
ITEM 7A. QUANTITATIVE AND QUALITATIVE DISCLOSURES ABOUT MARKET RISK
We are exposed to cash flow and earnings fluctuations as a result of certain market risks. These market risks relate to interest rate risks and foreign currency exchange rate risks.
Interest Rate Sensitivity
Interest rate risk is significant given the potential effects on our earnings and cash flows. Annually, we perform sensitivity analysis on our exposure to interest rates. In conducting this sensitivity analysis, we assumed a hypothetical 100 basis point change in interest rates on our outstanding amounts of indebtedness under our credit facility, subject to variable interest rates. Under our credit facility, the non-default rate of interest is equal to the one-month Term SOFR Rate plus 1.00% or 1.25% per annum, depending on the leverage ratio. For the year ended December 31, 2023, the effect of a hypothetical 100 basis point increase or decrease in overall interest rates on our variable rate debt would have changed interest expense by approximately $0.6 million. The 100 basis point change on our variable rate debt would not have materially impacted our earnings or cash flows for fiscal 2023.
Foreign Exchange Rate Risk
The Company conducts operations in Europe that exposes us to foreign exchange rate risk, primarily with the British Pound and Euro. We are subject to inherent foreign exchange rate risk when translating the financial statements of our foreign subsidiaries into the Company’s reporting currency. We actively manage foreign currency translation risk through our operating and financing activities. From time to time, we may enter into forward foreign currency exchange contracts to mitigate the effects of foreign currency exchange rate risk.
For the years ended December 31, 2023, 2022, and 2021 the impact of foreign currency exchange rate changes on our results of operations and cash flows was a net foreign currency exchange gain of $0.8 million, and a loss of $0.7 million and $0.5 million, respectively.
For the years ended December 31, 2023, 2022 and 2021, we recognized a foreign currency translation gain of $3.2 million, and losses of $4.2 million and $2.2 million, respectively because of the strengthening or weakening of the U.S. dollar against certain foreign currencies.
30 | FY 2023 FORM 10-K |
ITEM 8. FINANCIAL STATEMENTS AND SUPPLEMENTARY DATA

INDEX TO CONSOLIDATED FINANCIAL STATEMENTS
Management’s Report on Internal Control Over Financial Reporting | 32 |
Reports of Independent Registered Public Accounting Firm (PCAOB ID: | 33 |
35 | |
36 | |
37 | |
38 | |
39 | |
40 | |
40 | |
45 | |
46 | |
46 | |
5. | 46 |
47 | |
47 | |
47 | |
9. | 48 |
50 | |
50 | |
50 | |
51 | |
51 | |
52 | |
52 |
|
MANAGEMENT’S ANNUAL REPORT ON INTERNAL CONTROL OVER FINANCIAL REPORTING
Disclosure Controls and Procedures
We evaluated, with the participation of our principal executive officer and principal financial officer, the effectiveness of our disclosure controls and procedures, as defined in Rules 13a-15(e) and 15d-15(e) under the Securities Exchange Act of 1934 (the "Exchange Act") as of December 31, 2023. Based on this evaluation, our principal executive officer and principal financial officer has concluded that our disclosure controls and procedures were effective as of December 31, 2023 to provide reasonable assurance that information required to be disclosed in our reports under the Exchange Act is recorded, processed, summarized and reported within the time periods specified in the SEC rules and forms.
Management’s Report on Internal Control over Financial Reporting
Management is responsible for establishing and maintaining adequate internal control over financial reporting as defined in Rules 13a-15(f) and 15d-15(f) under the Exchange Act. Our internal controls over financial reporting is designed to provide reasonable assurance regarding the reliability of financial reporting and the preparation of consolidated financial statements for external purposes in accordance with generally accepted accounting principles. Because of its inherent limitations, internal control over financial reporting may not prevent or detect misstatements. Also, projections of any evaluation of effectiveness to future periods are subject to the risk that controls may be inadequate because of changes in conditions, or that the degree of compliance with the policies or procedures may deteriorate.
Management conducted an evaluation of the effectiveness of our internal control over financial reporting as of December 31, 2023. In making its assessment, management used the criteria set forth by the Committee of Sponsoring Organizations of the Treadway Commission in “Internal Control—Integrated Framework” (2013). Based on management’s assessment under those criteria, we concluded that, as of December 31, 2023, we maintained effective internal control over financial reporting.
Elliott Davis, LLC, the independent registered public accounting firm who audited the Company’s consolidated financial statements included in this Annual Report, has issued an audit report on the effectiveness of the Company’s internal control over financial reporting as of December 31, 2023, which appears herein.
Changes in Internal Control over Financial Reporting
There were no significant changes in our internal control over financial reporting that occurred during the quarter ended December 31, 2023 that have materially affected, or are reasonably likely to materially affect, our internal control over financial reporting.
32 | FY 2023 FORM 10-K |
REPORT OF INDEPENDENT REGISTERED PUBLIC ACCOUNTING FIRM
Shareholders and the Board of Directors
Miller Industries, Inc.
Ooltewah, Tennessee
Opinions on the Financial Statements and Internal Control Over Financial Reporting
We have audited the accompanying consolidated balance sheets of Miller Industries, Inc. and subsidiaries (the “Company”) as of December 31, 2023 and 2022, and the related consolidated statements of income, comprehensive income, shareholders' equity and cash flows for each of the three years in the period ended December 31, 2023, and the related notes (collectively, the “financial statements”). We also have audited the Company’s internal control over financial reporting as of December 31, 2023, based on criteria established in Internal Control – Integrated Framework issued by the Committee of Sponsoring Organizations of the Treadway Commission in 2013.
In our opinion, the financial statements referred to above present fairly, in all material respects, the financial position of the Company as of December 31, 2023 and 2022, and the results of its operations and its cash flows for each of the three years in the period ended December 31, 2023, in conformity with accounting principles generally accepted in the United States of America. Also in our opinion, the Company maintained, in all material respects, effective internal control over financial reporting as of December 31, 2023, based on criteria established in Internal Control — Integrated Framework issued by the Committee of Sponsoring Organizations of the Treadway Commission in 2013.
Basis for Opinions
The Company's management is responsible for these financial statements, for maintaining effective internal control over financial reporting, and for its assessment of the effectiveness of internal control over financial reporting, included in the accompanying Management’s Annual Report on Internal Control Over Financial Reporting. Our responsibility is to express an opinion on the Company's financial statements and an opinion on the Company's internal control over financial reporting based on our audits. We are a public accounting firm registered with the Public Company Accounting Oversight Board (United States) (PCAOB) and are required to be independent with respect to the Company in accordance with U.S. federal securities laws and the applicable rules and regulations of the Securities and Exchange Commission and the PCAOB.
We conducted our audits in accordance with the standards of the PCAOB. Those standards require that we plan and perform the audit to obtain reasonable assurance about whether the financial statements are free of material misstatement, whether due to error or fraud, and whether effective internal control over financial reporting was maintained in all material respects.
|
Basis for Opinions, Continued
Our audits of the financial statements included performing procedures to assess the risks of material misstatement of the financial statements, whether due to error or fraud, and performing procedures that respond to those risks. Such procedures included examining, on a test basis, evidence regarding the amounts and disclosures in the financial statements. Our audits also included evaluating the accounting principles used and significant estimates made by management, as well as evaluating the overall presentation of the financial statements. Our audit of internal control over financial reporting included obtaining an understanding of internal control over financial reporting, assessing the risk that a material weakness exists, and testing and evaluating the design and operating effectiveness of internal control based on the assessed risk. Our audits also included performing such other procedures as we considered necessary in the circumstances. We believe that our audits provide a reasonable basis for our opinions.
Definition and Limitations of Internal Control Over Financial Reporting
A company's internal control over financial reporting is a process designed to provide reasonable assurance regarding the reliability of financial reporting and the preparation of financial statements for external purposes in accordance with generally accepted accounting principles. A company's internal control over financial reporting includes those policies and procedures that (1) pertain to the maintenance of records that, in reasonable detail, accurately and fairly reflect the transactions and dispositions of the assets of the company; (2) provide reasonable assurance that transactions are recorded as necessary to permit preparation of financial statements in accordance with generally accepted accounting principles, and that receipts and expenditures of the company are being made only in accordance with authorizations of management and directors of the company; and (3) provide reasonable assurance regarding prevention or timely detection of unauthorized acquisition, use or disposition of the company's assets that could have a material effect on the financial statements.
Because of its inherent limitations, internal control over financial reporting may not prevent or detect misstatements. Also, projections of any evaluation of effectiveness to future periods are subject to the risk that controls may become inadequate because of changes in conditions, or that the degree of compliance with the policies or procedures may deteriorate.
Critical Audit Matters
Critical audit matters are matters arising from the current period audit of the financial statements that were communicated or required to be communicated to the audit committee and that: (1) relate to accounts or disclosures that are material to the financial statements and (2) involved our especially challenging, subjective or complex judgments. We determined that there are no critical audit matters.

We have served as the Company's auditor since 2003.
March 6, 2024
34 | FY 2023 FORM 10-K |
MILLER INDUSTRIES, INC. AND SUBSIDIARIES
CONSOLIDATED BALANCE SHEETS
(in thousands) | December 31, 2023 |
| December 31, 2022 | ||
Assets | |||||
Current assets: | |||||
Cash and temporary investments | $ | | $ | | |
Accounts receivable, net of allowance for credit losses of $ |
| |
| | |
Inventories, net |
| |
| | |
Prepaid expenses |
| |
| | |
Total current assets |
| |
| | |
Property, plant and equipment, net |
| |
| | |
Right-of-use assets - operating leases | | | |||
Goodwill |
| |
| | |
Other assets |
| |
| | |
Total assets | $ | | $ | | |
Liabilities and shareholders' equity | |||||
Current liabilities: | |||||
Accounts payable | $ | | $ | | |
Accrued liabilities |
| |
| | |
Income taxes payable | | | |||
Current portion of operating lease obligation | | | |||
Total current liabilities |
| |
| | |
Long-term obligations |
| |
| | |
Noncurrent portion of operating lease obligation |
| |
| | |
Deferred income tax liabilities |
| |
| | |
Total liabilities |
| |
| | |
Commitments and contingencies (Note 10) | |||||
Shareholders' equity: | |||||
Preferred shares, $ |
|
| |||
Authorized– | |||||
Common shares, $0.01 par value: |
| ||||
Authorized– | | | |||
Additional paid-in capital |
| |
| | |
Retained Earnings |
| |
| | |
Accumulated other comprehensive loss |
| ( |
| ( | |
Total shareholders’ equity |
| |
| | |
Total liabilities and shareholders' equity | $ | | $ | | |
The accompanying notes are an integral part of these consolidated statements.
|
MILLER INDUSTRIES, INC. AND SUBSIDIARIES
CONSOLIDATED STATEMENTS OF INCOME
Years Ended December 31, | ||||||||
(in thousands, except share amounts) | 2023 | 2022 | 2021 | |||||
Net sales | $ | | $ | | $ | | ||
Costs of operations |
| |
| |
| | ||
Gross profit |
| |
| |
| | ||
Operating expenses: | ||||||||
Selling, general and administrative expenses |
| |
| |
| | ||
| ||||||||
Non-operating expenses: | ||||||||
Interest expense, net |
| |
| |
| | ||
Other (income) expense, net |
| ( |
| |
| | ||
Total expense, net |
| |
| |
| | ||
|
| |||||||
Income before income taxes | |
| |
| | |||
Income tax provision |
| | | | ||||
Net income |
| |
| |
| | ||
Income per common share | ||||||||
Basic | $ | | $ | | $ | | ||
Diluted | $ | | $ | | $ | | ||
Cash dividends declared per common share | $ | | $ | | $ | | ||
Weighted average shares outstanding: |
|
|
|
|
| |||
Basic |
| |
| |
| | ||
Diluted |
| |
| |
| | ||
The accompanying notes are an integral part of these consolidated statements.
36 | FY 2023 FORM 10-K |
MILLER INDUSTRIES, INC. AND SUBSIDIARIES
CONSOLIDATED STATEMENTS OF COMPREHENSIVE INCOME
Years Ended December 31, | ||||||||
(in thousands) | 2023 |
| 2022 |
| 2021 | |||
Net income | $ | | $ | | $ | | ||
Other comprehensive income (loss): |
|
|
|
|
|
| ||
Foreign currency translation adjustment |
| |
| ( |
| ( | ||
Total other comprehensive income (loss) |
| |
| ( |
| ( | ||
Total comprehensive income | $ | | $ | | $ | | ||
The accompanying notes are an integral part of these consolidated statements.
|
MILLER INDUSTRIES, INC. AND SUBSIDIARIES
CONSOLIDATED STATEMENTS OF SHAREHOLDERS’ EQUITY
Common Stock | Accumulated Other | |||||||||||||||
(in thousands) | Shares | Amount | Additional Paid-in Capital | Retained Earnings |
| Comprehensive Gain (Loss) | Total Equity | |||||||||
Balances, December 31, 2020 (Revised) | | $ | | $ | | $ | | $ | ( | $ | | |||||
Issuance of common stock to non-employee directors | | — | | — | — | | ||||||||||
Dividends paid ($0.72) | — | — | — | ( | — | ( | ||||||||||
Foreign currency translation gain (loss) | — |
| — |
| — |
| — |
| ( |
| ( | |||||
Net income | — | — | — | | — | | ||||||||||
Balances, December 31, 2021 (Revised) | | $ | | $ | | $ | | $ | ( | $ | | |||||
Issuance of common stock to non-employee directors | | — | | — | — | | ||||||||||
Stock-based compensation on nonvested restricted stock units | — | — | | — | — | | ||||||||||
Dividends paid ($0.72) | — | — | — | ( | — | ( | ||||||||||
Foreign currency translation gain (loss) | — | — |
| — |
| — |
| ( |
| ( | ||||||
Net income | — | — | — | | — | | ||||||||||
Balances, December 31, 2022 | | $ | | $ | | $ | | $ | ( | $ | | |||||
Issuance of common stock to non-employee directors | | — | | — | — | | ||||||||||
Stock-based compensation on nonvested restricted stock units | — | — | | — | — | | ||||||||||
Stock-based compensation on vested restricted stock units | | — | ( | — | — | ( | ||||||||||
Dividends paid ($0.72) | — | — | — | ( | — | ( | ||||||||||
Foreign currency translation gain (loss) | — | — | — | — | | | ||||||||||
Net income | — | — | — | | — | | ||||||||||
Balances, December 31, 2023 | | $ | | $ | | $ | | $ | ( | $ | | |||||
The accompanying notes are an integral part of these consolidated statements.
38 | FY 2023 FORM 10-K |
MILLER INDUSTRIES, INC. AND SUBSIDIARIES
CONSOLIDATED STATEMENTS OF CASH FLOWS
Year Ended December 31, | ||||||||
(in thousands) | 2023 |
| 2022 |
| 2021 | |||
Cash flows from operating activities: |
|
|
|
|
| |||
Net income | $ | | $ | | $ | | ||
Adjustments to reconcile net income to net cash flows from operating activities: |
|
|
|
|
|
| ||
Depreciation and amortization |
| |
| |
| | ||
(Gain) Loss on disposal of property, plant and equipment |
| ( |
| ( |
| ( | ||
Provision for credit losses |
| |
| |
| ( | ||
Issuance of non-employee director shares |
| |
| |
| | ||
Stock-based compensation | | | — | |||||
Deferred tax provision |
| ( |
| |
| | ||
Changes in operating assets and liabilities: |
|
|
|
|
|
| ||
Accounts receivable |
| ( |
| ( |
| ( | ||
Inventories |
| ( |
| ( |
| ( | ||
Prepaid expenses |
| |
| |
| ( | ||
Other assets |
| |
| |
| | ||
Accounts payable |
| |
| |
| | ||
Accrued liabilities |
| |
| |
| | ||
Income taxes payable |
| |
| |
| ( | ||
Net cash flows from operating activities |
| |
| ( |
| | ||
Cash flows from investing activities: |
|
|
|
|
|
| ||
Purchases of property, plant and equipment |
| ( |
| ( |
| ( | ||
Proceeds from sale of property, plant and equipment |
| |
| |
| | ||
Acquisition of business | ( | — | — | |||||
Net cash flows from investing activities |
| ( |
| ( |
| ( | ||
Cash flows from financing activities: |
|
|
|
|
|
| ||
Net borrowings under credit facility |
| |
| |
| — | ||
Payments of cash dividends |
| ( |
| ( |
| ( | ||
Finance lease obligation payments | — | ( | ( | |||||
Net cash flows from financing activities |
| |
| |
| ( | ||
Effect of exchange rate changes on cash and temporary investments |
| |
| ( |
| ( | ||
Net change in cash and temporary investments |
| ( |
| ( |
| ( | ||
Cash and temporary investments, beginning of period |
| |
| |
| | ||
Cash and temporary investments, end of period | $ | | $ | | $ | | ||
Supplemental information: |
|
|
|
|
|
| ||
Cash payments for interest | $ | | $ | | $ | | ||
Cash payments for income taxes, net of refunds | $ | | $ | | $ | | ||
The accompanying notes are an integral part of these consolidated statements.
|
1.ORGANIZATION AND SUMMARY OF SIGNIFICANT ACCOUNTING POLICIES
Description of Business
Miller Industries, Inc., and subsidiaries (the “Company”) is The World’s Largest Manufacturer of Towing and Recovery Equipment.® The principal markets for the Company’s towing and recovery equipment are approximately
Basis of Presentation
The accompanying Consolidated Financial Statements have been prepared in accordance with accounting principles generally accepted ("GAAP") in the United States ("U.S.") and include the accounts of the Company and its wholly-owned subsidiaries. In the opinion of management, the consolidated financial statements include all adjustments necessary for the fair presentation of the Company's consolidated financial position, results of operations, and cash flows for the periods presented. All intercompany accounts and transactions have been eliminated.
To facilitate timely reporting, the consolidated financial statements include accounts of certain subsidiaries whose fiscal closing dates differ from December 31st by 31 days (or less).
Use of Estimates
The preparation of consolidated financial statements in accordance with GAAP requires us to make estimates, judgments and assumptions that affect the reported amounts in the consolidated financial statements and accompanying notes. Significant estimates include: income tax accruals, the net realizable value of inventory, warranty accruals, allowance for expected credit losses, legal accruals, impairment testing to goodwill, other long-lived assets, stock-based compensation and valuations of the assets acquired and liabilities assumed in a business combination or asset acquisition, when applicable. Actual results could differ materially from those estimates. Management evaluates its estimates and assumptions on an ongoing basis using historical experience and other factors that management believes to be reasonable under the circumstances, including the current economic environment and other relevant factors, as applicable. Management adjusts such estimates and assumptions when facts and circumstances dictate.
Reclassifications
Certain prior period amounts have been reclassified for consistency with current period presentation. These reclassifications had no effect on the reported results. Specifically, we disaggregated accrued liabilities from other and reclassed financing lease cost. Additionally, we have separated stock-based compensation on the Consolidated Statement of Shareholders Equity.
Cash and Temporary Investments
Cash consists of deposits held at financial institutions. We consider liquid investments purchased with an initial maturity of three months or less to be cash equivalents. The carrying value of cash equivalents approximates fair value.
Accounts Receivable and Allowance for Credit Losses
Trade receivables are presented net of an allowance for doubtful accounts of $
For receivables not serviced through third-party floor plan financing arrangements, the company extends credit ranging in terms depending on product line, to customers in the normal course of business. For a rollforward of the allowance for credit losses, see “Schedule II – Valuation of Qualifying Accounts” contained herein.
Concentrations of Credit Risk
Financial instruments that potentially subject the Company to significant concentrations of credit risk consist principally of cash and temporary investments and trade accounts receivable. Cash and temporary investments consist primarily of cash on deposit or short-term liquid investments with original contractual maturities of three months or less. At times, we have cash deposited with major financial institutions in excess of the Federal Deposit Insurance Corporation (“FDIC”) insurance limits. We have not historically incurred any related losses.
40 | FY 2023 FORM 10-K |
Our trade receivables are exposed to a concentration of credit risk with certain large customers. We perform regular credit evaluations of our customers’ financial conditions and maintain reserves for losses through the established allowance for doubtful accounts. Historically, such losses have been within our expectations. At December 31, 2023, there was no
Refer to the "Accounts Receivables and Allowance for Credit Losses" policy within this Note for additional information on the accounting treatment of reserves for allowance for credit losses.
Inventories, Net
Inventory costs associated with the manufacturing of inventories include materials, labor and factory overhead. Inventories are valued at the lower of cost or net realizable value determined primarily on a moving average unit cost basis. Appropriate consideration is given to obsolescence, valuation and other factors in determining net realizable value. Net realizable value is the value of an asset that can be realized upon the sale of the asset, less a reasonable estimate of the costs associated with the sale of the asset. Significant variances in those estimates may require a revision to future inventory reserve estimates.
Property, Plant and Equipment
Property, plant and equipment are carried at cost less accumulated depreciation. Property, plant and equipment held for sale are recorded at the lower of cost less accumulated depreciation or fair value less any cost to sell. Fully depreciated assets are retained in property, plant and equipment and accumulated depreciation until they are removed from service. When assets are retired or otherwise disposed of, the related costs and accumulated depreciation are removed from the consolidated balance sheets and any resulting gain or loss from disposition is recorded as other (income) expense, net in the consolidated statements of income in the period realized. When certain events or changes in operating conditions occur, an impairment assessment may be performed on the recoverability of the carrying amounts.
We capitalize project costs relating to computer software development when the activities related to the project reach the application stage and amortize those costs to expense on a straight-line basis over
Depreciation expense for financial reporting purposes is computed using the straight-line method over the estimated useful lives of the assets. Buildings and improvements are depreciated over
Business Combinations
Business combinations are accounted for under Accounting Standards Codification (“ASC”) 805, Business Combinations, using the acquisition method of accounting under which all acquired tangible and identifiable intangible assets and assumed liabilities and applicable noncontrolling interests are recognized at fair value as of the respective acquisition date, while the costs associated with the acquisition of a business are expensed as incurred.
The company may refine the estimated fair values of assets acquired and liabilities assumed, if necessary, over a period not to exceed one year from the date of acquisition by taking into consideration new information about facts and circumstances that existed as of the acquisition date that, if known at the date of acquisition, would have affected the estimated fair values ascribed to the assets acquired and liabilities assumed. Net working capital adjustments related to the acquisitions are estimated as of the closing date and will be adjusted based on that estimate. Net working capital adjustments, if any, will be recorded in other assets on the consolidated balance sheet. During the measurement period, any purchase price allocation changes that impact the carrying value of goodwill would also affect the amount of goodwill impairment taken, if applicable. If necessary, purchase price allocation revisions that occur outside of the measurement period are recorded within cost of sales or selling, general and administrative expense within the consolidated statements of income depending on the nature of the adjustment.
When an acquisition does not meet the definition of a business combination because either: (i) substantially all of the fair value of the gross assets acquired is concentrated in a single identifiable asset, or group of similar identified assets, or (ii) the acquired entity does not have an input and a substantive process that together significantly contribute to the ability to create outputs, the company accounts for the acquisition as an asset acquisition.
Goodwill
Goodwill represents the excess of consideration transferred over the estimated fair value of assets acquired and liabilities assumed in a business combination.
Goodwill is not amortized. However, the Company reviews goodwill for impairment annually, during the fourth quarter of each fiscal year or whenever events or changes in circumstances indicate that an impairment may exist. In conducting our annual impairment test, the Company first reviews qualitative factors to determine whether it is more likely than not that the fair value of a reporting unit is less than its carrying amount. If factors indicate that the fair value of a reporting unit is less than its carrying amount, the Company performs a quantitative assessment and the fair value is determined by analyzing the expected
|
present value of future cash flows. If the carrying value of a reporting unit continues to exceed its fair value, the fair value of goodwill is calculated and an impairment loss equal to the excess is recorded.
Long-Lived Assets
Long-lived assets are reviewed for impairment whenever events or circumstances indicate that the carrying amount of these assets may not be fully recoverable. When a determination has been made that the carrying amount of long-lived assets may not be fully recovered, the amount of impairment is measured by comparing an asset’s estimated fair value to its carrying value. The determination of fair value is based on projected future cash flows discounted at a rate determined by management, or if available, independent appraisals or sales price negotiations.
The following table summarizes long-lived assets by geographic location for the years ended:
December 31, | |||||||||
(in thousands) |
| 2023 |
| 2022 | 2021 | ||||
Geographic regions: |
|
|
|
|
| ||||
North America | $ | | $ | | $ | | |||
Foreign |
| |
| |
| | |||
Total long-lived assets | $ | | $ | | $ | | |||
Leases
Our leases are primarily for facilities and certain equipment. We determine if an arrangement is a lease at its inception by evaluating whether the arrangement conveys the right to use an identified asset and whether we obtain substantially all of the economic benefits from and have the ability to direct the use of the asset. Lease obligations represent the Company’s obligation to make lease payments arising from the lease.
Operating lease right-of-use assets and corresponding operating lease liabilities are recognized in our consolidated balance sheets at the lease commencement date based on the present value of lease payments over the lease term. Operating lease expense for operating lease assets is recognized on a straight-line basis over the lease term. Finance lease expense is recognized as the expense from straight-line amortization of the right-of-use asset plus the periodic interest expense from the lease obligation. As most of our leases do not provide an implicit rate, we use our collateralized incremental borrowing rate based on the information available at the lease commencement date in determining the present value of lease payments. We use the implicit rate if it is readily determinable.
We apply a practical expedient for short-term leases whereby we do not recognize a lease liability and right-of-use asset for leases with a term of less than 12 months. Short-term lease expense recognized in fiscal 2023, 2022 and 2021 was immaterial. We do not separate lease and non-lease components.
Our leases have remaining lease terms and expire at various dates through 2027. Our lease terms may include options to extend or terminate the lease when it is reasonably certain and there is a significant economic incentive to exercise that option. Lease payments during renewal periods were considered in the calculation of right-of-use assets and lease obligations.
See Note 9 for additional information regarding leases.
Contract Assets and Contract Liabilities
Contract assets are recognized when a performance obligation has been satisfied and the Company has an unconditional right to receive payment for the goods or services transferred. Contract assets are transferred to accounts receivable when the rights for payment become unconditional. Contract liabilities are recognized when the Company receives consideration from a customer before satisfying a performance obligation.
For the years ended December 31, 2023, 2022 and 2021 the Company did
Product Warranty
Our products are warranted to provide assurance that the product will function as expected and to ensure customer confidence in design, workmanship, and overall quality. Warranty coverage on our products is generally provided for specified periods of time and generally covers parts, labor, and other expenses for non-maintenance repairs.
42 | FY 2023 FORM 10-K |
At the time of sale, the Company recognizes expense and records an accrual for estimated costs. The Company’s estimate of the cost of future warranty claims is based primarily on the estimated number of products under warranty, historical average costs incurred to service warranty claims, the trend in the historical ratio of warranty claims to sales and the historical length of time between the sale and resulting warranty claim.
Warranty expense in 2023, 2022 and 2021, was $
The table below provides a summary of the warranty liability:
December 31, | ||||||
(in thousands) |
| 2023 |
| 2022 | ||
Accrual at beginning of the year | $ | | $ | | ||
Provision |
| |
| | ||
Settlement and other, net of translation adjustment |
| ( |
| ( | ||
Accrual at end of year | $ | | $ | | ||
Foreign Currency Translation
The functional currency for the Company’s foreign operations is the applicable local currency. The translation from the applicable foreign currencies to U.S. dollars is performed for balance sheet accounts using current exchange rates in effect at the balance sheet date, historical rates for equity and the weighted average exchange rate during the period for revenue and expense accounts. Foreign currency translation adjustments resulting from such translations are included in shareholders’ equity. Intercompany transactions denominated in a currency other than the functional currency are remeasured into the functional currency. Gains and losses resulting from foreign currency transactions are included in other (income) expense, net in our consolidated statements of income.
Income Taxes
We account for income taxes using the asset and liability method. The Company is subject to income taxes in both the United States and foreign jurisdictions.
Deferred tax assets and liabilities are recognized for the future tax consequences attributable to differences between the financial statement carrying amounts of existing assets and liabilities and their respective tax basis. Deferred tax assets and liabilities are measured using enacted tax rates expected to apply to taxable income in the years that those temporary differences are expected to be recovered or settled. The effect on deferred tax assets and liabilities of a change in tax rates is recognized in income tax expense in the period that includes the enactment date. A valuation allowance is provided when, in management's judgment, it is more likely than not that some portion or all of the deferred tax asset will not be realized. Tax loss carryforwards, reversal of deferred tax liabilities, tax planning and estimates of future taxable income are considered in assessing the need for a valuation allowance.
The company recognizes the effect of income tax positions only if it is more likely than not that those positions will be sustained. Recognized income tax positions are measured at the largest amount that is greater than 50.0 percent likely to be realized. Changes in recognition or measurement are reflected in the period in which the change in judgment occurs. The Company also records interest and penalties related to unrecognized tax benefits within income tax expense. At December 31, 2023 and 2022, the Company reported
Revenue Recognition
Revenues are recognized when obligations under the terms of a contract with a customer are satisfied. Generally, this occurs upon shipment, which is when control of the promised goods or service is transferred to a customer. From time to time, revenue is recognized under a bill and hold arrangement. Recognition of revenue on bill and hold arrangements occurs when control transfers to the customer. Control transfers when the reason for the bill and hold arrangement is substantive, the product is separately identified as belonging to the customer, the product is ready for physical transfer and the product cannot be used or directed to another customer.
Revenue is measured as the amount of consideration expected to be received in exchange for the transfer of products. Sales and other taxes collected concurrent with revenue-producing activities are excluded from revenue. Depending on the terms of the arrangement, for certain contracts the Company may defer the recognition of a portion of the consideration received because a future obligation has not yet been satisfied, such as an extended warranty contract. An observable stand-alone selling price for separate performance obligations or a cost-plus margin approach is utilized when one is not available.
|
Disaggregation of Revenue
The following table summarizes revenue by region for the years ended:
December 31, | |||||||||
(in thousands) |
| 2023 |
| 2022 | 2021 | ||||
Geographic regions: |
|
|
|
|
| ||||
North America | $ | | $ | | $ | | |||
Foreign |
| |
| |
| | |||
Total net revenue | $ | | $ | | $ | | |||
Research and Development
The Company’s research and development costs are expensed as incurred and included in cost of operations and to a lesser extent in selling, general and administrative expenses. Research and development costs were $
Shipping and Handling
The Company records revenues earned for shipping and handling as revenue, while the costs are primarily included in cost of operations in our consolidated statements of income (loss). Costs include all delivery expenses as well as all costs to prepare the product for shipment.
Stock-Based Compensation
Stock-based compensation provided to employees and non-employee directors is recognized in the consolidated statements of income/(loss) based on the grant date fair value of the awards. The fair value of restricted stock units is determined by the grant date market price of our common shares. The compensation expense recognized for stock-based awards is net of estimated forfeitures and is recognized ratably over the service period of the awards. All income tax effects of share-based awards are recognized in the consolidated statements of income/(loss) as awards vest or are settled. We classify stock-based compensation in selling, general and administrative expenses within the consolidated statements of income. See Note 12 for additional information regarding stock-based compensation.
On November 6, 2023, the Compensation Committee approved the Excess Incentive-Based Compensation Recoupment Policy of the Company (the “Policy”), with an effective date of November 6, 2023, in order to comply with the final clawback rules adopted by the Securities and Exchange Commission under Section 10D and Rule 10D-1 of the Securities Exchange Act of 1934, as amended (“Rule 10D-1”), and the listing standards of the New York Stock Exchange (together with Rule 10D-1, the “Final Clawback Rules”). The Policy provides for the mandatory recovery of erroneously awarded incentive-based compensation from current and former executive officers of the Company, as defined in Rule 10D-1, in the event the Company is required to prepare an accounting restatement, in accordance with Final Clawback Rules.
Earnings Per Share
We compute basic earnings per share based on the weighted average number of shares of common stock outstanding during the period. We calculate diluted earnings per share based on the weighted average number of shares of common stock plus the effect of potentially dilutive common shares outstanding during the period. Potentially dilutive common shares include outstanding restricted stock units. When we are in a loss position for the period, dilutive securities are excluded from the calculation of earnings per share, as they would have an anti-dilutive effect. See Note 13.
Recently Adopted Standards
In October 2021, the FASB issued ASU 2021-08, Business Combinations (Topic 805): Accounting for Contract Assets and Contract Liabilities from Contracts with Customers. The amendments in this Update require that an entity recognize and measure contract assets and contract liabilities acquired in a business combination in accordance with Topic 606 as if it had originated the contracts. The amendments in this Update were effective for the Company for fiscal years ending December 31, 2023 including interim periods within those fiscal years. Early adoption was permitted including adoption at an interim period. The Company has applied the amendments prospectively. The adoption of this update did not have a material impact on the Company’s consolidated financial statements and related disclosures.
Recently Issued Standards
In November 2023, the FASB issued ASU 2023-07, Segment Reporting (Topic 280): Improvements to Reportable Segment Disclosures. The amendments in this Update require an entity to disclose significant segment expenses and other segment items on an annual and interim basis and to provide in interim periods all disclosures about a reportable segment’s profit or loss and assets that are currently required annually. The ASU also requires entities with a single reportable segment to provide all segment disclosures under ASC 280, including the new disclosures under this ASU. The amendments in this
44 | FY 2023 FORM 10-K |
Update are effective for fiscal years beginning after 15 December 2023, and interim periods within fiscal years beginning after 15 December 2024, with early adoption permitted. We are currently evaluating the impact this standard will have on our disclosures.
In December 2023, the FASB issued ASU 2023-09, Income Taxes (Topic 740): Improvements to Income Tax Disclosures. The amendments in this Update improve transparency of income tax disclosures by requiring (1) consistent categories and greater disaggregation of information in the rate reconciliation and (2) income taxes paid disaggregated by jurisdiction. It also includes certain other amendments to improve the effectiveness of income tax disclosures. The amendments in this Update are effective for fiscal years beginning after 15 December 2024, with early adoption permitted for annual financial statements that have not been issued or made available for issuance. We are currently evaluating the impact this standard will have on our disclosures.
2. BUSINESS COMBINATIONS
On May 31, 2023, the Company acquired substantially all of the assets and assumed certain liabilities of Southern Hydraulic Cylinder, Inc., (“SHC”), a Tennessee corporation. SHC manufactures, sells and services hydraulic cylinders and related components. The operations of SHC align with those of the Company, which management believes will strengthen its efforts to enhance the stability of the Company’s supply chain.
The purchase price totaling approximately $
The preliminary allocation of the consideration for the net assets acquired from the acquisition of SHC were as follows:
(in thousands) | |||
Sources of financing | |||
Cash | $ | | |
Fair value of consideration transferred | | ||
Fair value of assets and liabilities | |||
Accounts receivable | | ||
Fixed assets | | ||
Inventory | | ||
Prepaid insurance | | ||
Intangibles | | ||
Total identifiable assets acquired | | ||
Assumed liabilities | | ||
Goodwill | $ | |
Goodwill represents the excess of the purchase price over the fair value of the net tangible and intangible assets acquired and is deductible for tax purposes. The acquisition of SHC resulted in the recognition of $
The real property fair value of $
Identifiable intangible assets consisted of a restrictive covenant agreement of $
The fair value of the assets acquired includes trade receivables of $
The results of operations of SHC for the period from the May 31, 2023 acquisition date through December 31, 2023, are included in the accompanying consolidated statements of operations since the acquisition date. Transaction costs associated with the acquisition were not significant.
Pro Forma Consolidated Financial Information (Unaudited)
The results of operations for SHC, and the estimated fair values of the assets acquired and liabilities assumed have been included in the Company’s consolidated financial statements since its respective date of acquisition. For the year ended December 31, 2023 and since the June 1, 2023 date of its acquisition, SHC contributed approximately $
|
The unaudited pro forma financial information in the table below summarizes the combined results of the Company’s operations and those of SHC for the periods as shown as if the acquisition of SHC had occurred on January 1, 2021. The pro forma financial information presented below is for informational purposes only, and is subject to a number of estimates, assumptions and other uncertainties.
The Company did not have any material, nonrecurring pro forma adjustments directly attributable to the business combination included in the reported pro forma revenue and earnings.
Pro forma for Years Ended December 31, | ||||||||
(in thousands) | 2023 | 2022 | 2021 | |||||
Revenue | $ | | $ | | $ | | ||
Earnings | $ | | $ | | $ | | ||
3.INVENTORY
Inventories, net of reserves, consisted of the following:
December 31, | ||||||
(in thousands) |
| 2023 |
| 2022 | ||
Chassis | $ | | $ | | ||
Raw materials |
| |
| | ||
Work in process |
| |
| | ||
Finished goods |
| |
| | ||
Total inventory | $ | | $ | | ||
For the years ended December 31, 2023 and 2022, inventories presented in the consolidated balance sheets are net of inventory reserves of $
The Company did not recognize any impairment of inventory.
4.PROPERTY, PLANT AND EQUIPMENT
Property, plant and equipment consisted of the following:
December 31, | ||||||
(in thousands) |
| 2023 |
| 2022 | ||
Land and improvements | $ | | $ | | ||
Buildings and improvements |
| |
| | ||
Machinery and equipment |
| |
| | ||
Furniture and fixtures |
| |
| | ||
Software costs |
| |
| | ||
| |
| | |||
Less accumulated depreciation |
| ( |
| ( | ||
$ | | $ | | |||
Depreciation expense related to property and equipment was $
5.GOODWILL
The Company’s acquisition of Southern Hydraulic Cylinder, Inc., resulted in the recognition of approximately $
The following table summarizes the changes in the carrying amount of goodwill:
(in thousands) | Total | ||
Balance at December 31, 2022 | $ | | |
SHC, Inc. | | ||
Balance at December 31, 2023 | $ | |
46 | FY 2023 FORM 10-K |
6.ACCRUED LIABILITIES
The major classes of accrued liabilities are summarized as follows:
December 31, | ||||||
(in thousands) |
| 2023 |
| 2022 | ||
Accrued wages, commissions, bonuses and benefits | $ | | $ | | ||
Accrued sales related expenses | | | ||||
Deferred revenue | | | ||||
Accrued product warranty |
| |
| | ||
Other |
| |
| | ||
Total accrued liabilities | $ | | $ | | ||
7.LONG-TERM OBLIGATIONS
Credit Facility
On October 28, 2022, we entered into a first amendment to the loan agreement with First Horizon Bank to increase the credit facility from $
The credit facility contains customary representations and warranties, events of default, and financial affirmative and negative covenants. Covenants under the credit facility restrict the payment of cash dividends if we would be in violation of the minimum tangible net worth test or the leverage ratio test as a result of the dividend, among other restrictions.
Interest expense on the credit facility was $
The Company had outstanding borrowings of $
8.INCOME TAXES
The following table summarizes income/(loss) before income taxes, including intercompany amounts:
December 31, | |||||||||
(in thousands) |
| 2023 |
| 2022 |
| 2021 | |||
United States | $ | | $ | | $ | | |||
Foreign |
| |
| |
| | |||
Total | $ | | $ | | $ | | |||
The following table presents the significant components of the income tax provision:
December 31, | |||||||||
(in thousands) |
| 2023 |
| 2022 |
| 2021 | |||
Current: |
|
|
|
|
|
| |||
Federal | $ | | $ | | $ | | |||
State |
| |
| |
| | |||
Foreign |
| |
| |
| | |||
Total Current | $ | | $ | | $ | | |||
Deferred: |
|
|
|
|
|
| |||
Federal | $ | | $ | | $ | | |||
State |
| |
| |
| | |||
Foreign |
| |
| |
| | |||
Total Deferred | $ | | $ | | $ | | |||
Provision for/(benefit from) income taxes | $ | | $ | | $ | | |||
|
The following table presents a reconciliation of income taxes calculated at the statutory rate and the provision for income taxes:
December 31, | ||||||||||
| 2023 | 2022 | 2021 | |||||||
Federal statutory tax rate |
| % | % | % | ||||||
State taxes, net of federal tax benefit |
| % | % | % | ||||||
Excess of foreign tax over U.S. tax on foreign income |
| % | % | % | ||||||
Domestic tax deductions and credits |
| ( | % | ( | % | ( | % | |||
Foreign derived intangible income deduction |
| ( | % | ( | % | — | % | |||
Other |
| | % | % | % | |||||
Effective tax rate |
| % | % | % | ||||||
The following table shows significant components of our deferred tax assets and liabilities:
December 31, | ||||||
(in thousands) |
| 2023 |
| 2022 | ||
Deferred tax assets: |
|
|
|
| ||
Allowance for credit losses | $ | | $ | | ||
Accruals and reserves |
| |
| | ||
Research and development | | | ||||
Other |
| |
| | ||
Total deferred tax assets |
| |
| | ||
Deferred tax liabilities: |
|
|
| |||
Property, plant, and equipment |
| |
| | ||
Other |
| |
| | ||
Total deferred tax liabilities |
| |
| | ||
Net deferred tax liability | $ | ( | $ | ( | ||
Deferred tax assets represent the future tax benefit of future deductible differences and, if it is more likely than not that a tax asset will not be realized, a valuation allowance is required to reduce the recorded deferred tax assets to net realizable value. The Company has evaluated positive and negative evidence to assess the realizability of its deferred taxes. Based on the evidence, the Company believes it is more likely than not that its deferred tax assets will be realizable. Accordingly, the Company has not included a valuation allowance against its deferred tax assets at this time.
We do not currently have plans to repatriate undistributed foreign earnings to the United States and have not determined any timeline or amount for any such future distributions.
As of December 31, 2023 and 2022, the Company had
The Company is subject to United States federal income taxes, as well as income taxes in various states and foreign jurisdictions. The Company’s 2020 and later tax years remain open to examination by the tax authorities. With few exceptions, as of December 31, 2023, the Company is no longer subject to U.S. federal, state or non-U.S. income tax examination prior to 2020.
9.LEASES
The following table summarizes the components of lease cost:
December 31, | |||||||||
(in thousands) |
| 2023 |
| 2022 |
| 2021 | |||
Lease Cost | |||||||||
Finance lease cost: | |||||||||
Amortization of right-of-use assets | $ | — | $ | | $ | | |||
Interest on lease obligation |
| — |
| |
| | |||
Total finance lease cost | — | | | ||||||
Total long-term operating lease cost |
| |
| |
| | |||
Total short-term operating lease cost |
| |
| |
| | |||
Total lease cost | $ | | $ | | $ | | |||
48 | FY 2023 FORM 10-K |
The following table summarizes supplemental balance sheet and other information related to leases at:
December 31, | ||||||
(in thousands) | 2023 |
| 2022 | |||
Operating Leases | $ | |||||
Operating lease right-of-use assets | | | ||||
Current portion of operating lease liabilities | | | ||||
Long-term operating lease liabilities | | | ||||
Total operating lease liabilities | | | ||||
The following table presents other lease information related to the Company’s leases:
December 31, | |||||||
2023 | 2022 | ||||||
Weighted-average remaining lease term (years) | |||||||
Operating leases | |||||||
Finance leases | |||||||
Weighted-average discount rate | |||||||
Operating leases | | % | % | ||||
Finance leases | — | % | % | ||||
The following table summarizes supplemental cash flow information related to leases:
December 31, | |||||||||
(in thousands) | 2023 |
| 2022 |
| 2021 | ||||
Other Information | |||||||||
Cash paid for amounts included in the measurement of lease obligation: |
|
| |||||||
Operating cash flows from operating leases | $ | | $ | | $ | | |||
Financing cash flows from finance leases |
| — |
| |
| | |||
Right-of-use assets obtained in exchange for new operating lease obligations |
| — |
| |
| | |||
Future lease payments under non-cancellable leases as of December 31, 2023 were as follows:
(in thousands) | Operating Lease Obligations | ||
Remaining lease payments to be paid during the year ended December 31, | |||
2024 |
| $ | |
2025 |
| | |
2026 |
| | |
2027 |
| | |
2028 |
| | |
Thereafter |
| | |
Total lease payments | | ||
Less imputed interest | ( | ||
Lease obligation at December 31, 2023 | $ | | |
Related Party Leases
The Company’s subsidiary in the United Kingdom leased facilities used for manufacturing and office space from a related party with related lease costs during the years ended December 31, 2023, 2022, and 2021 of $
|
10.COMMITMENTS AND CONTINGENCIES
Commitments
At December 31, 2023 and December 31, 2022, the Company had commitments of approximately $
Contingencies
The Company has entered into arrangements with third-party lenders where it has agreed to repurchase products that are repossessed from the independent distributor customer in the event of default. These arrangements are typically subject to a maximum repurchase amount. For fiscal years ended December 31, 2023 and December 31, 2022, the maximum amount of collateral the Company could be required to purchase was $
Litigation
We are subject to a variety of claims and lawsuits that arise from time to time in the ordinary course of business. The Company has established accruals for matters that are probable and reasonably estimable and maintains product liability and other insurance that management believes to be adequate. Although management believes that any pending claims and lawsuits will not have a significant impact on the Company’s consolidated financial position or results of operations, the adjudication of such matters are subject to inherent uncertainties and management’s assessment may change depending on future events.
11.SHAREHOLDERS’ EQUITY
Common Shares
The Company is authorized to issue up to
For more information on stock-based compensation and the Company’s 2016 Stock Incentive Plan, see Note 12 to our consolidated financial statements.
Preferred Shares
The Company is authorized to issue up to
Dividends
The Company pays quarterly cash dividends and has paid quarterly cash dividends consecutively since May 2011. We paid cash dividends per common share of $
12.STOCK INCENTIVE PLAN
Effective August 1, 2016, the Company adopted the 2016 Stock Incentive Plan (“the 2016 Plan”). Pursuant to the 2016 Plan, the Board of Directors may grant up to
Restricted Stock Units
Restricted stock units are subject only to service conditions. Executive Officer awards vest ratably over years and non-employee director awards cliff-vest after year.
50 | FY 2023 FORM 10-K |
The following table summarizes all transactions related to restricted stock units under the 2016 Plan:
(in thousands, except share amounts) | Restricted Stock Units | Weighted Average Grant Date Fair Value | ||||
Nonvested at December 31, 2021 | — | $ | — | |||
Granted | |
| | |||
Vested | — |
| — | |||
Forfeited | — | — | ||||
Nonvested at December 31, 2022 | | $ | | |||
Granted | | | ||||
Vested | ( | ( | ||||
Forfeited | — | — | ||||
Nonvested at December 31, 2023 | | $ | |
The following table provides additional data related to restricted share unit activity:
(in thousands) | 2023 | 2022 | 2021 | ||||||
Total compensation cost, net of estimated forfeitures, related to nonvested restricted share unit awards not yet recognized, pre tax | $ | | $ | | $ | — | |||
Weighted-average period in years over which restricted share and share unit cost is expected to be recognized (in years) | |||||||||
Total fair value of shares vested during the year | $ | | $ | — | $ | — |
On April 11, 2023, the Compensation Committee of the Board of Directors adopted the 2023 Executive Annual Bonus Plan (the “New Bonus Program”). The New Bonus Program supersedes and replaces the cash bonus programs the Company previously adopted for its Co-Chief Executive Officers in September 2018, for certain of its executive officers in May 2021 and for the Company’s executive officers in February 2022.
As of the date of this filing, no restricted stock units under the New Bonus Program have been granted. For further information under this New Bonus Program, please see the Form 8-K filed on April 17, 2023.
13.EARNINGS PER SHARE
The following table reconciles the number of common shares used to calculate basic and diluted earnings per share:
December 31, | |||||||||
(in thousands, except per share amounts) |
| 2023 |
| 2022 | 2021 | ||||
Basic earnings (loss) per common share: |
|
|
|
|
| ||||
Net income (loss) - basic | $ | | $ | | $ | | |||
Weighted shares outstanding |
| |
| |
| | |||
Basic earnings (loss) per common share: | $ | $ | $ | ||||||
Diluted earnings (loss) per common share: | |||||||||
Net income (loss) - basic | $ | | $ | | $ | | |||
Weighted shares outstanding - basic | | | | ||||||
Effect of dilutive securities | | — | — | ||||||
Weighted shares outstanding - diluted | | | | ||||||
Diluted earnings (loss) per common share | $ | $ | $ | ||||||
14.EMPLOYEE BENEFIT PLANS
Substantially all of our full-time employees with at least
|
15.CORRECTION OF PRIOR PERIOD ERRORS
As previously disclosed in Note 11 to the Company’s consolidated financial statements as of and for the fiscal year ended December 31, 2022, the Company identified prior period accounting errors that the Company has concluded are not material to the Company’s previously reported consolidated financial statements and unaudited interim condensed consolidated financial statements. The financial reporting periods affected by these errors include the Company’s previously reported consolidated financial statements for the fiscal year ended December 31, 2021 and the Company’s previously reported unaudited interim condensed consolidated financial information for each of the quarterly and fiscal year-to-date periods in the fiscal year ended December 31, 2022 (collectively the “previously reported financial statements”).
Based on management’s evaluation of the accounting errors under the SEC Staff’s Accounting Bulletins Nos. 99 (“SAB 99”) and 108 (“SAB 108”) and interpretations thereof, the Company concluded the errors are not material, on an individual or aggregate basis, to the Company’s previously reported financial statements. The errors originated many years ago, are less than
The following tables present the impact of correcting these errors on the Company’s previously reported financial statements for the periods presented:
December 31, 2021 | |||||||||
(in thousands) |
| As Reported |
| Adjustment |
| Revised | |||
Property, plant and equipment, net |
| $ | | $ | ( | $ | | ||
Accounts payable |
| | | | |||||
Accumulated surplus | | ( | | ||||||
December 31, 2020 | |||||||||
(in thousands) |
| As Reported |
| Adjustment |
| Revised | |||
Property, plant and equipment, net |
| $ | | $ | ( | $ | | ||
Accounts payable |
| | | | |||||
Accumulated surplus | | ( | | ||||||
16.SUBSEQUENT EVENTS
Quarterly Dividend
On
52 | FY 2023 FORM 10-K |
ITEM 9. CHANGES IN AND DISAGREEMENTS WITH ACCOUNTANTS ON ACCOUNTING AND FINANCIAL DISCLOSURE
None.
ITEM 9A. CONTROLS AND PROCEDURES
Disclosure Controls and Procedures
We evaluated, with the participation of our principal executive officer and principal financial officer, the effectiveness of our disclosure controls and procedures, as defined in Rules 13a-15(e) and 15d-15(e) under the Securities Exchange Act of 1934 (the "Exchange Act") as of December 31, 2023. Based on this evaluation, our principal executive officer and principal financial officer has concluded that our disclosure controls and procedures were effective as of December 31, 2023 to provide reasonable assurance that information required to be disclosed in our reports under the Exchange Act is recorded, processed, summarized and reported within the time periods specified in the SEC rules and forms.
Internal Control Over Financial Reporting
See page 32 of this Form 10-K for Management’s Annual Report on Internal Control over Financial Reporting, which is incorporated herein by reference.
See page 33 of this Form 10-K for the attestation report of
Changes in Internal Control over Financial Reporting
There were no significant changes in our internal control over financial reporting that occurred during the quarter ended December 31, 2023 that have materially affected, or are reasonably likely to materially affect, our internal control over financial reporting.
ITEM 9B. OTHER INFORMATION
ITEM 9C. DISCLOSURE REGARDING FOREIGN JURISDICTIONS THAT PREVENT INSPECTIONS
None.
|
ITEM 10. DIRECTORS, EXECUTIVE OFFICERS AND CORPORATE GOVERNANCE
The information required by this Item, except for the information regarding executive officers required by Item 401 of Regulation S-K which is included in Part I hereof, is incorporated by reference to the sections titled “Election of Directors", "Corporate Governance", and "Executive Officers" and "Delinquent Section 16(a) Reports" in the definitive proxy statement (the “Proxy Statement”) to be filed with the SEC within 120 days after December 31, 2023 in connection with the solicitation of proxies for the Company’s next annual meeting of shareholders.
ITEM 11. EXECUTIVE COMPENSATION
The information required by this Item is incorporated by reference to the sections titled "Executive Compensation" and "Director Compensation" in the Proxy Statement.
ITEM 12. SECURITY OWNERSHIP OF CERTAIN BENEFICIAL OWNERS AND MANAGEMENT AND RELATED STOCKHOLDER MATTERS
The information required by this Item is incorporated by reference to the section titled "Security Ownership of Certain Beneficial Owners and Management" in the Proxy Statement.
The Proxy Statement will also contain information relating to our equity compensation plans, which information is incorporated herein by reference.
ITEM 13. CERTAIN RELATIONSHIPS AND RELATED TRANSACTIONS, AND DIRECTOR INDEPENDENCE
The information required by this Item is incorporated by reference to the sections titled "Certain Relationships and Related Party Transactions" and "Corporate Governance - Director Independence" in the Proxy Statement.
ITEM 14. PRINCIPAL ACCOUNTING FEES AND SERVICES
The information required by this Item is incorporated by reference to the section titled "Accounting Matters" in the Proxy Statement.
54 | FY 2023 FORM 10-K |
ITEM 15. EXHIBITS AND FINANCIAL STATEMENT SCHEDULES
(a)The following documents are filed as part of this report:
1Financial Statements: See our consolidated financial statements under Item 8.
2Financial Statement Schedule:
See “Schedule II – Valuation and Qualifying Accounts” within Item 15 below
Certain Financial Statement Schedules have been omitted since they are either not required, not applicable or the information is otherwise included.
3Exhibits. See “Index to Exhibits” within Item 15 below.
SCHEDULE II –VALUATION AND QUALIFYING ACCOUNTS
Balance at Beginning of Period | Charged to Expense | Accounts Written Off | Balance at End of Period | |||||||
(in thousands) | ||||||||||
Year ended December 31, 2023 |
|
|
|
|
|
|
|
| ||
Deduction from asset accounts: |
|
|
|
|
|
|
|
| ||
Allowance for credit losses | $ | |
| |
| — | $ | | ||
|
|
|
|
|
|
|
| |||
Year ended December 31, 2022 |
|
|
|
|
|
|
|
| ||
Deduction from asset accounts: |
|
|
|
|
|
|
|
| ||
Allowance for credit losses | $ | |
| |
| ( | $ | | ||
|
|
|
|
|
|
|
| |||
Year ended December 31, 2021 |
|
|
|
|
|
|
|
| ||
Deduction from asset accounts: |
|
|
|
|
|
|
|
| ||
Allowance for credit losses | $ | |
| ( |
| ( | $ | | ||
INDEX TO EXHIBITS
Exhibit No. | Description |
|---|---|
10.1 | Form of Noncompetition Agreement between the Registrant and certain officers of the Registrant (incorporated by reference to Exhibit 10.28 on Form S-1 (Registration No. 33-79430), filed with the SEC in August 1994) |
|
Exhibit No. | Description |
|---|---|
Certification Pursuant to Rules 13a-14(a)/15d-14(a) by Chief Executive Officer* | |
Certification Pursuant to Rule 13a-14(a)/15d-14(a) by Chief Financial Officer* | |
56 | FY 2023 FORM 10-K |
Exhibit No. | Description |
|---|---|
97.1 | Excess Incentive-Based Compensation Recoupment Policy of the Registrant* |
101.INS | Inline XBRL Instance Document – the instance document does not appear in the Interactive Data File because its XBRL tags are embedded within the Inline XBRL document |
101.SCH | Inline XBRL Taxonomy Extension Schema Document |
101.CAL | Inline XBRL Taxonomy Extension Calculation Linkbase Document |
101.DEF | Inline XBRL Taxonomy Extension Definition Linkbase Document |
101.LAB | Inline XBRL Taxonomy Extension Label Linkbase Document |
101.PRE | Inline XBRL Taxonomy Extension Presentation Linkbase Document |
104 | The cover page from the Company’s Annual Report on Form 10-K for the year ended December 31, 2023, has been formatted in Inline XBRL |
*Filed herewith
± | Exhibit is being furnished and shall not be deemed “filed” for purposes of Section 18 of the Exchange Act, or otherwise subjected to the liabilities of that Section. This exhibit shall not be incorporated by reference into any given registration statement or other document pursuant to the Securities Act of 1933, as amended, except as shall be expressly set forth by specific reference in such a filing. |
** | Management contract or compensatory plan or arrangement. |
ITEM 16. FORM 10-K SUMMARY
None.
|
SIGNATURES
Pursuant to the requirements of Section 13 or 15(d) of the Securities Exchange Act of 1934, the registrant has duly caused this report to be signed on its behalf by the undersigned, thereunto duly authorized on March 6, 2024.
MILLER INDUSTRIES, INC. | ||
By: | /s/ William G. Miller, II | |
William G. Miller, II | ||
President, Chief Executive Officer and Director | ||
Know all men by these presents, that each person whose signature appears below constitutes and appoints William G. Miller, II and Frank Madonia, and each or any one of them, as attorney-in-fact and agent, with full power of substitution, for him in any and all capacities, to sign any amendments to this Annual Report on Form 10-K, and to file the same, with exhibits thereto, and other documents in connection therewith, with the Securities and Exchange Commission, hereby ratifying and confirming all that said attorneys-in-fact and agents, or any of them, or their or his substitutes or substitute, may lawfully do or cause to be done by virtue hereof.
Pursuant to the requirements of Section 13 or 15(d) of the Securities Exchange Act of 1934, the registrant has duly caused this report to be signed on its behalf by the undersigned, thereunto duly authorized on March 6, 2024.
SIGNATURE | TITLE | ||
/s/ William G. Miller | |||
William G. Miller | Chairman of the Board of Directors | ||
/s/ William G. Miller, II | |||
William G. Miller, II | President, Chief Executive Officer and Director | ||
/s/ Deborah L. Whitmire | Executive Vice President, Chief Financial Officer, Treasurer and | ||
Deborah L. Whitmire | Director (Principal Financial and Accounting Officer) | ||
/s/ Theodore H. Ashford, III | |||
Theodore H. Ashford, III | Director | ||
/s/ A. Russell Chandler, III | |||
A. Russell Chandler, III | Director | ||
s/ Richard H. Roberts | |||
Richard H. Roberts | Director | ||
/s/ Leigh Walton | |||
Leigh Walton | Director | ||
/s/ Susan Sweeney | |||
Susan Sweeney | Director | ||
/s/ Jill Sutton | |||
Jill Sutton | Director | ||
/s/ Javier Reyes | |||
Javier Reyes | Director | ||
/s/ Peter Jackson | |||
Peter Jackson | Director |
eter J
58 | FY 2023 FORM 10-K |