Table of Contents
UNITED STATES
SECURITIES AND EXCHANGE COMMISSION
WASHINGTON, D.C. 20549
Form
(Mark One)
REGISTRATION STATEMENT PURSUANT TO SECTION 12(b) OR 12(g) OF THE SECURITIES EXCHANGE ACT OF 1934 |
OR
ANNUAL REPORT PURSUANT TO SECTION 13 OR 15(d) OF THE SECURITIES EXCHANGE ACT OF 1934 |
For the fiscal year ended
OR
TRANSITION REPORT PURSUANT TO SECTION 13 OR 15(d) OF THE SECURITIES EXCHANGE ACT OF 1934 |
OR
SHELL COMPANY REPORT PURSUANT TO SECTION 13 OR 15(d) OF THE SECURITIES EXCHANGE ACT OF 1934 |
Date of event requiring this shell company report |
|
|
For the transition period from |
|
to |
|
|
Commission file number:
(Exact name of Registrant as specified in its charter)
N/A
(Translation of Registrant’s name into English)
(Jurisdiction of incorporation or organization)
(Address of principal executive offices)
Tel:
Email:
(Name, Telephone, Email and/or Facsimile number and Address of Company Contact Person)
Securities registered or to be registered pursuant to Section 12(b) of the Act:
Title of each class
|
Trading Symbol(s)
|
Name of each exchange on which registered
|
US$0.00001 per share* |
(The New York Stock Exchange) |
* for trading, but only in connection with the listing on The New York Stock Exchange of American depositary shares.
Table of Contents
Securities registered or to be registered pursuant to Section 12(g) of the Act:
None
(Title of Class)
Securities for which there is a reporting obligation pursuant to Section 15(d) of the Act:
None
(Title of Class)
Indicate the number of outstanding shares of each of the issuer’s classes of capital or common stock as of the close of the period covered by the annual report:
Indicate by check mark if the registrant is a well-known seasoned issuer, as defined in Rule 405 of the Securities Act. ☐ Yes ☒
If this report is an annual or transition report, indicate by check mark if the registrant is not required to file reports pursuant to Section 13 or 15(d) of the Securities Exchange Act of 1934. ☐ Yes ☒
Note – Checking the box above will not relieve any registrant required to file reports pursuant to Section 13 or 15(d) of the Securities Exchange Act of 1934 from their obligations under those Sections.
Indicate by check mark whether the registrant: (1) has filed all reports required to be filed by Section 13 or 15(d) of the Securities Exchange Act of 1934 during the preceding 12 months (or for such shorter period that the registrant was required to file such reports), and (2) has been subject to such filing requirements for the past 90 days. ☒
Indicate by check mark whether the registrant has submitted electronically every Interactive Data File required to be submitted pursuant to Rule 405 of Regulation S-T (§232.405 of this chapter) during the preceding 12 months (or for such shorter period that the registrant was required to submit such files). ☒
Indicate by check mark whether the registrant is a large accelerated filer, an accelerated filer, a non-accelerated filer, or an emerging growth company. See definition of “large accelerated filer,” “accelerated filer,” and “emerging growth company” in Rule 12b-2 of the Exchange Act.
Large accelerated filer ☐ |
|
Accelerated filer ☐ |
|
|
Emerging growth company |
If an emerging growth company that prepares its financial statements in accordance with U.S. GAAP, indicate by check mark if the registrant has elected not to use the extended transition period for complying with any new or revised financial accounting standards† provided pursuant to Section 13(a) of the Exchange Act.
† |
The term “new or revised financial accounting standard” refers to any update issued by the Financial Accounting Standards Board to its Accounting Standards Codification after April 5, 2012. |
Indicate by check mark whether the registrant has filed a report on and attestation to its management’s assessment of the effectiveness of its internal control over financial reporting under Section 404(b) of the Sarbanes-Oxley Act (15 U.S.C. 7262(b)) by the registered public accounting firm that prepared or issued its audit report.
If securities are registered pursuant to Section 12(b) of the Act, indicate by check mark whether the financial statements of the registrant included in the filing reflect the correction of an error to previously issued financial statements. ☐
Indicate by check mark whether any of those error corrections are restatements that required a recovery analysis of incentive-based compensation received by any of the registrant’s executive officers during the relevant recovery period pursuant to §240.10D-1(b). ☐
Indicate by check mark which basis of accounting the registrant has used to prepare the financial statements included in this filing:
|
International Financial Reporting Standards as issued by the International Accounting Standards Board ☐ |
|
Other ☐ |
If “Other” has been checked in response to the previous question, indicate by check mark which financial statement item the registrant has elected to follow. ☐ Item 17 ☐ Item 18
If this is an annual report, indicate by check mark whether the registrant is a shell company (as defined in Rule 12b-2 of the Exchange Act). ☐ Yes
(APPLICABLE ONLY TO ISSUERS INVOLVED IN BANKRUPTCY PROCEEDINGS DURING THE PAST FIVE YEARS)
Indicate by check mark whether the registrant has filed all documents and reports required to be filed by Sections 12, 13 or 15(d) of the Securities Exchange Act of 1934 subsequent to the distribution of securities under a plan confirmed by a court. ☐ Yes ☐ No
Table of Contents
TABLE OF CONTENTS
1 |
||
2 |
||
|
3 |
|
ITEM 1 |
3 |
|
ITEM 2 |
3 |
|
ITEM 3 |
3 |
|
ITEM 4 |
62 |
|
Item 4A. |
89 |
|
Item 5. |
89 |
|
Item 6. |
106 |
|
Item 7. |
113 |
|
Item 8. |
115 |
|
Item 9. |
115 |
|
Item 10. |
116 |
|
Item 11. |
129 |
|
Item 12. |
130 |
|
|
131 |
|
Item 13. |
131 |
|
Item 14. |
Material Modifications to the Rights of Security Holders and Use of Proceeds |
131 |
Item 15. |
132 |
|
Item 16. |
133 |
|
Item 16A. |
133 |
|
Item 16B. |
133 |
|
Item 16C. |
134 |
|
Item 16D. |
134 |
|
Item 16E. |
Purchases of Equity Securities by the Issuer and Affiliated Purchasers |
134 |
Item 16F. |
135 |
|
Item 16G. |
135 |
|
Item 16H. |
135 |
|
Item 16I. |
Disclosure Regarding Foreign Jurisdictions Than Prevent Inspections |
135 |
Item 16J. |
136 |
|
|
137 |
|
Item 17. |
137 |
|
Item 18. |
137 |
|
Item 19. |
137 |
|
139 |
||
i
Table of Contents
INTRODUCTION
Unless otherwise indicated or the context otherwise requires, references in this annual report to:
1
Table of Contents
Unless otherwise noted, all translations from Renminbi to U.S. dollars and from U.S. dollars to Renminbi in this annual report are made at a rate of RMB6.8676 to US$1.0000, the exchange rate in effect as of March 31, 2023 as set forth in the H.10 statistical release of The Board of Governors of the Federal Reserve System. We make no representation that any Renminbi or U.S. dollar amounts could have been, or could be, converted into U.S. dollars or Renminbi, as the case may be, at any particular rate, or at all.
We have prepared our financial statements in accordance with U.S. GAAP. Our fiscal year ends on March 31 and references to the fiscal years of 2021, 2022 and 2023 are to the fiscal years ended March 31, 2021, 2022 and 2023, respectively.
FORWARD-LOOKING INFORMATION
This annual report contains forward-looking statements that relate to our current expectations and views of future events. These statements involve known and unknown risks, uncertainties and other factors that may cause our actual results, performance or achievements to be materially different from those expressed or implied by the forward-looking statements. These statements are made under the “safe harbor” provisions of the U.S. Private Securities Litigations Reform Act of 1995.
You can identify some of these forward-looking statements by words or phrases such as “may,” “will,” “expect,” “anticipate,” “aim,” “estimate,” “intend,” “plan,” “believe,” “is/are likely to,” “potential,” “continue” or other similar expressions. We have based these forward-looking statements largely on our current expectations and projections about future events that we believe may affect our financial condition, results of operations, business strategy and financial needs. These forward-looking statements include statements relating to:
You should read this annual report and the documents that we refer to in this annual report and have filed as exhibits to this annual report completely and with the understanding that our actual future results may be materially different from what we expect. Other sections of this annual report discuss factors which could adversely impact our business and financial performance. Moreover, we operate in an evolving environment. New risk factors emerge from time to time and it is not possible for our management to predict all risk factors, nor can we assess the impact of all factors on our business or the extent to which any factor, or combination of factors, may cause actual results to differ materially from those contained in any forward-looking statements. We qualify all of our forward-looking statements by these cautionary statements.
You should not rely upon forward-looking statements as predictions of future events. The forward-looking statements made in this annual report relate only to events or information as of the date on which the statements are made in this annual report. Except as required by law, we undertake no obligation to update or revise publicly any forward-looking statements, whether as a result of new information, future events or otherwise, after the date on which the statements are made or to reflect the occurrence of unanticipated events.
2
Table of Contents
PART I
ITEM 1. IDENTITY OF DIRECTORS, SENIOR MANAGEMENT AND ADVISERS
Not applicable.
ITEM 2. OFFER STATISTICS AND EXPECTED TIMETABLE
Not applicable.
ITEM 3. KEY INFORMATION
Our Company
We are an online service provider in China, operating a KOL-driven online fashion and lifestyle platform Mogujie and providing customized online branding solutions to businesses. Through our Mogujie platform, we provide individuals with a more accessible and enjoyable shopping experience for everyday fashion, with features to allow them to live their lives online. Our KOLs contributed to most of our contents on the platform, which are mostly in live-streaming format. The contents are rich and diverse, intended to convey the latest fashion styles and trends. We also feature products from our merchants in the contents, which has led our users to purchase those products along with their shopping journey and exploration of our platform. Users can conveniently access our platform through mobile applications, including our flagship Mogujie mobile app and Mini Programs on Weixin. We actively pursue higher operational efficiency and better user experience by ways such as continuously providing users, especially female users, with more products based on their fashion and beauty consumption needs including fashion apparel, beauty makeup, personal care, food, medical beauty products on our platform. Concurrently, we have adjusted our product offering and enriched our product portfolio with a variety of healthcare products, grocery, household suppliers and foods. In addition, with the acquisition of Ruisha Technology, a platform solution provider, we expect to expand our business operations to further serve business customers and deepen our business cooperation with them by providing customized solutions for their online operations.
3
Table of Contents
Our Holding Company Structure and Contractual Arrangements with the VIEs
Corporate Structure
The following diagram illustrates our corporate structure, including our principal subsidiaries and the VIEs, as of the date of this annual report:

Notes:
4
Table of Contents
We are a company incorporated in the Cayman Islands. We are not a Chinese operating Company but a Cayman Islands holding company with no equity ownership in the VIEs. Our Hong Kong subsidiary is not an operating company but a holding company. We conduct our operations in China through (i) our PRC subsidiaries and (ii) the VIEs with which we have maintained contractual arrangements. Hangzhou Shiqu is our PRC subsidiary and a foreign-invested enterprise under PRC laws. Current PRC laws and regulations impose certain restrictions or prohibitions on foreign ownership of companies that engage in value-added telecommunication services and certain other businesses. To comply with PRC laws and regulations, we conduct certain business in China through Hangzhou Juangua and Beijing Meilishikong, the VIEs in the PRC which we collectively refer to as the VIEs in this annual report, based on a series of contractual arrangements by and among Hangzhou Shiqu and the VIEs. The contractual arrangements including shareholder voting proxy agreements, equity interest pledge agreements and loan agreements that have been entered into by and among our subsidiaries and the VIEs, enable us to have the power to direct the activities of the VIEs that most significantly impact the VIEs’ economic performance and realize substantially all of the economic risks and the economic benefits of the business operations of the VIEs, and therefore providing us with a controlling financial interest in each entity and allowing us to consolidate the VIEs under U.S. GAAP (ASC 810) as the primary beneficiary of the VIEs for accounting purposes. The VIEs are used to provide investors with exposure to foreign investments in China-based companies where Chinese law prohibits direct foreign investment in the operating companies. Investors may never hold equity interests in the Chinese operating companies.
As a result of the direct ownership in Hangzhou Shiqu and its contractual arrangements with the VIEs, we are regarded as the primary beneficiary of the VIEs for accounting purposes, and have consolidated the financial results of the VIEs in our consolidated financial statements in accordance with U.S. GAAP. Revenue contributed by the VIEs accounted for 22.9%, 30.1% and 37.8% of our total revenues for the fiscal years of 2021, 2022 and 2023, respectively. However, neither MOGU Inc. nor its investors have an equity ownership in, direct foreign investment in, or control through such ownership or investment of, the VIEs, and the VIEs
5
Table of Contents
contractual arrangements are not equivalent to an equity ownership in the business of the VIEs. As of the date of this annual report, the contracts with the VIEs have not been tested in a court of law.
However, such contractual arrangements are subject to significant risks. See “Item 4C. Information on the Company – Organizational Structure – Contractual Arrangements with the VIEs and Their Respective Shareholders.” and “Item 3. Key Information—D. Risk Factors—Risks Related to Our Corporate Structure.” The contractual arrangements may not be as effective as direct ownership of these China-based operating entities, and we may incur substantial costs to enforce the terms of the arrangements. If we had direct ownership of our VIEs in China, we would be able to exercise our rights as a shareholder to effect changes in the board of directors of the VIEs, which in turn could implement changes, subject to any applicable fiduciary obligations, at the management and operational level. However, under the current contractual arrangements, we rely on the performance by the VIEs and their respective shareholders of their obligations under the contracts. In addition, the shareholders of the VIEs may have potential conflicts of interest with us. The shareholders of the VIEs include Mr. Qi Chen, who is the chairman of our board of directors, and Messrs.Yibo Wei and Xuqiang Yue, who are also our shareholders. We cannot assure you that when conflicts arise, these shareholders will act in the best interest of our company. We also cannot assure you that these conflicts will be resolved in our favor and we may need to rely on expensive and time-consuming legal proceedings to resolve the conflicts, which may materially and adversely affect our business and financial performance. See “Item 3. Key Information—D. Risk Factors—Risks Related to Our Corporate Structure—We rely on contractual arrangements with the VIEs and their respective shareholders for our business operations. These arrangements provide us with a controlling financial interest in these entities, which may not be as effective as direct ownership in providing operational control.” and “— The shareholders of the VIEs may have potential conflicts of interest with us, which may materially and adversely affect our business and financial condition.”
There are also uncertainties under PRC laws and regulations regarding the enforceability of the whole or any part of our contractual arrangements with the VIEs. If the whole or any part of our contractual arrangements with the VIEs is found to be unenforceable, we may not be able to consolidate, derive economic benefits from, or hold a controlling financial interest in the VIEs, which could result in a material adverse change in the financial performance of our company and the value of our ADSs. Also, the Chinese regulatory authorities could disallow this structure, which would likely result in a material change in our operations and materially adversely affect the value of the ADSs we registered for sale, including that it could cause the value of our ADSs to significantly decline or become worthless. If the PRC government deems that our contractual arrangements with the VIEs do not comply with PRC regulatory restrictions on foreign investment in the relevant industries, or if the existing regulations or the interpretation of existing regulations change or are interpreted differently in the future, we could be subject to severe penalties or be forced to relinquish our rights under the contractual agreements in those operations, and the value of our ADSs might significantly decline or become worthless. MOGU, its PRC subsidiaries, the VIEs and the investors of MOGU face uncertainty about potential future actions by the PRC government that could affect the enforceability of the contractual arrangements with the VIEs and, consequently, could significantly affect the financial performance of our company and the VIEs as a whole, and the value of our ADSs might significantly decline or become worthless. See “Item 3. Key Information—D. Risk Factors—Risks Related to Our Corporate Structure—If the PRC government determines that the contractual arrangements constituting part of the VIE structure do not comply with PRC regulations, or if these regulations or the interpretation of existing regulations change in the future, we could be subject to severe penalties or be forced to relinquish our rights under the contractual agreements in those operations, which may cause the value of our ADSs to significantly decline or become worthless.”
In addition, the PRC government’s significant authority in regulating our operations and its broad oversight over overseas offerings by, and foreign investment in, China-based issuers could significantly limit or completely hinder our ability to offer or continue to offer securities to investors. Implementation of industry-wide regulations, including data security or anti-monopoly related regulations, in this nature may cause the value of such securities to significantly decline or be of little or no value. For more details, see “Item 3. Key Information—Risk Factors—Risks Related to Doing Business in China— The Chinese government has jurisdiction to oversee and may have significant influence on our operations, and provide more stringent regulatory oversight over offerings conducted overseas and foreign investment in China-based issuers, and the PRC government’s authority in regulating our operations, our overseas offerings of securities and foreign investment in us could limit our ability or prevent us from conducting future offerings of securities to investors, which may cause the value of our securities to significantly decline or become worthless.”
Our business operations and financial results are also affected by the risks and uncertainties arising from the legal system in China, including risks and uncertainties regarding the enforcement of laws and quickly evolving rules and regulations in China, could result in a material adverse change in our operations and the value of our ADSs. For more details, see “Risk Factors—Risks Related to Doing Business in China— The Chinese government has jurisdiction to oversee and may have significant influence on our operations, and provide more stringent regulatory oversight over offerings conducted overseas and foreign investment in China-based issuers, and the PRC government’s authority in regulating our operations, our overseas offerings of securities and foreign investment in us could limit our ability or prevent us from conducting future offerings of securities to investors, which may cause the value of our securities to significantly decline or become worthless.”
6
Table of Contents
Contractual Arrangements with the VIEs and Their Respective Shareholders
The following is a summary of our contractual agreements that are currently in effect, by and among our wholly-owned subsidiary Hangzhou Shiqu, the VIEs and their shareholders. Our contractual arrangements with the VIEs and their respective shareholders allow us to (i) have power to direct activities of the VIEs that most significantly affect the economic performance of the VIEs, (ii) receive the economic benefits of the VIEs that could be significant to the VIEs, and (iii) have an exclusive option to purchase all or part of the equity interests in the VIEs when and to the extent permitted by PRC law. As a result, we are regarded as the primary beneficiary of the VIEs for accounting purposes and have consolidated the financial results of the VIEs in our consolidated financial statements in accordance with U.S. GAAP. However, neither our Cayman Islands holding company nor the investors in the holding company have an equity ownership or direct investment in the VIEs.
Agreements that provide us with a controlling financial interest in the VIEs
Amended and Restated Shareholder Voting Proxy Agreements and Powers of Attorney. Pursuant to the amended and restated shareholder voting proxy agreement, dated July 18, 2018, by and among Hangzhou Shiqu, Hangzhou Juangua and the shareholders of Hangzhou Juangua, each of the shareholders of Hangzhou Juangua has executed a power of attorney to irrevocably authorize Mr. Qi Chen, the chairman of our board of directors, as designated by Hangzhou Shiqu, to act as his attorney-in-fact to exercise all of his rights as a shareholder of Hangzhou Juangua, including, but not limited to, the right to convene and attend shareholders’ meetings, vote on any resolution that requires a shareholder vote, such as the appointment and removal of directors, supervisors and officers, as well as the sale, transfer and disposal of all or part of the equity interests owned by such shareholder. The powers of attorney will remain effective until the amended and restated shareholder voting proxy agreement is terminated in accordance with the provisions of the agreement.
On August 20, 2017, Hangzhou Shiqu, Beijing Meilishikong and each of the shareholders of Beijing Meilishikong entered into an amended and restated shareholder voting proxy agreement, and each of the shareholders of Beijing Meilishikong executed a power of attorney, which contained terms substantially similar to the amended and restated shareholder voting proxy agreement and powers of attorney by and among Hangzhou Shiqu, Hangzhou Juangua and the shareholders of Hangzhou Juangua described above.
Amended and Restated Equity Interest Pledge Agreements. Pursuant to the amended and restated equity interest pledge agreement, dated July 18, 2018, by and among Hangzhou Shiqu, Hangzhou Juangua and the shareholders of Hangzhou Juangua, the shareholders of Hangzhou Juangua have pledged 100% equity interests in Hangzhou Juangua to Hangzhou Shiqu to guarantee performance by the shareholders of their obligations under the amended and restated exclusive option agreement, the amended and restated shareholder voting proxy agreement and the amended and restated loan agreements, as well as the performance by Hangzhou Juangua of its obligations under the amended and restated exclusive option agreement and the amended and restated exclusive consultation and service agreement. In the event of a breach by Hangzhou Juangua or any of its shareholder of contractual obligations under the amended and restated exclusive option agreement, the amended and restated shareholder voting proxy agreement, the amended and restated exclusive consultation and service agreement and the amended and restated equity interest pledge agreement, as the case may be, Hangzhou Shiqu, as pledgee, will have the right to dispose of the pledged equity interests in Hangzhou Juangua and will have priority in receiving the proceeds from such disposal. The shareholders of Hangzhou Juangua also covenant that, without the prior written consent of Hangzhou Shiqu, they will not dispose of, create or allow any encumbrance on the pledged equity interests. Hangzhou Juangua covenants that, without the prior written consent of Hangzhou Shiqu, it will not assist or allow any encumbrance to be created on the pledged equity interests.
On August 20, 2017, Hangzhou Shiqu, Beijing Meilishikong and the shareholders of Beijing Meilishikong entered into an amended and restated equity interest pledge agreement, which contained terms substantially similar to the amended and restated equity interest pledge agreement by and among Hangzhou Shiqu, Hangzhou Juangua and the shareholders of Hangzhou Juangua described above.
We have completed the registration of the equity interest pledge under the amended and restated equity interest pledge agreement in relation to Beijing Meilishikong and Hangzhou Juangua with the relevant office of the State Administration of Market Regulation in accordance with the PRC Property Rights Law.
Amended and Restated Loan Agreements. Pursuant to the amended and restated loan agreement between Hangzhou Shiqu and Mr. Qi Chen, a shareholder of Hangzhou Juangua, dated July 18, 2018, Hangzhou Shiqu made loans in an aggregate amount of RMB5,867,000 to Mr. Chen for the sole purpose of making capital contributions to Hangzhou Juangua. Mr. Chen can only repay the loans by the sale of all his equity interest in Hangzhou Juangua to Hangzhou Shiqu or its designated person pursuant to the amended and restated exclusive option agreement, and, to the extent permitted under PRC law, pay all of the proceeds from sale of such equity interests to Hangzhou Shiqu. In the event that Mr. Chen sells his equity interests in Hangzhou Juangua to Hangzhou Shiqu or its designated person at a price equal to or less than the principal amount of the loans, the loans will be interest free and the loans
7
Table of Contents
shall be deemed to be duly repaid by Mr. Chen. If the price is higher than the principal amount of the loans, the excess amount will be deemed as interest on the loans paid to Hangzhou Shiqu. The term of the amended and restated loan agreement is 20 years from the date of the loan agreement, which may be extended upon mutual agreement.
On July 18, 2018, Hangzhou Shiqu and each of Mr. Yibo Wei and Mr. Xuqiang Yue, each a shareholder of Hangzhou Juangua entered into an amended and restated loan agreement in the principal amount of RMB2,362,000 and RMB1,771,000, respectively, which contained terms substantially similar to the amended and restated loan agreement by and between Hangzhou Shiqu and Mr. Qi Chen described above.
Agreements that allow us to receive economic benefits from the VIEs
Amended and Restated Exclusive Consultation and Service Agreements. Pursuant to the amended and restated exclusive consultation and service agreement, dated July 18, 2018, by and between Hangzhou Shiqu and Hangzhou Juangua, Hangzhou Shiqu has the exclusive right to provide Hangzhou Juangua with technical and consulting services. Without Hangzhou Shiqu’s prior written consent, Hangzhou Juangua may not accept any services subject to this agreement from any third party. Hangzhou Juangua agrees to pay Hangzhou Shiqu a quarterly service fee at an amount that is equal to Hangzhou Juangua’s revenue for the relevant quarter after deducting any applicable taxes, cost of revenues and retained earnings (which should be zero unless Hangzhou Shiqu otherwise agrees in writing) or an amount adjusted at Hangzhou Shiqu’s sole discretion for the relevant quarter, which should be paid within 10 business days after Hangzhou Juangua confirms in writing the amount and breakdown of the service fee for the relevant quarter. Hangzhou Shiqu has the exclusive ownership of all the intellectual property rights created as a result of the performance of the agreement. To guarantee Hangzhou Juangua’s performance of its obligations under the agreement, the shareholders of Hangzhou Juangua have pledged their entire equity interests in Hangzhou Juangua to Hangzhou Shiqu pursuant to the amended and restated equity interest pledge agreement. The agreement has a term of 10 years, which will be automatically renewed upon expiration, unless it is otherwise terminated in accordance with the provisions of the agreement.
On August 20, 2017, Hangzhou Shiqu and Beijing Meilishikong entered into an amended and restated exclusive consultation and service agreement, which contained terms substantially similar to the amended and restated exclusive consultation and service agreement by and between Hangzhou Shiqu and Hangzhou Juangua described above.
Agreements that provide us with the option to purchase the equity interests in the VIEs
Amended and Restated Exclusive Option Agreements. Pursuant to the amended and restated exclusive option agreement, dated July 18, 2018, by and among Hangzhou Shiqu, Hangzhou Juangua and the shareholders of Hangzhou Juangua, each of the shareholders of Hangzhou Juangua has irrevocably granted Hangzhou Shiqu an exclusive option to purchase all or part of his equity interests in Hangzhou Juangua. Hangzhou Shiqu or its designated person may exercise such option at the lowest price permitted under applicable PRC law. The shareholders of Hangzhou Juangua covenant that, without Hangzhou Shiqu’s prior written consent, they will not, among other things, (i) create any pledge or encumbrance on their equity interests in Hangzhou Juangua; (ii) transfer or otherwise dispose of their equity interests in Hangzhou Juangua; (iii) change Hangzhou Juangua’s registered capital; (iv) amend Hangzhou Juangua’s articles of association in any material respect; (v) dispose of or cause Hangzhou Juangua’s management to dispose of Hangzhou Juangua’s material assets (except in the ordinary course of business); (vi) cause Hangzhou Juangua to enter into transactions that are likely to have a material impact on its assets, liabilities, operations, shareholding structure or equity ownership in other entities; (vii) change Hangzhou Juangua’s directors and supervisors; (viii) declare or distribute dividends; (ix) terminate, liquidate or dissolve Hangzhou Juangua; or (x) allow Hangzhou Juangua to extend or borrow loans, provide any form of guarantee, or assume any material obligations except in the ordinary course of business. In addition, Hangzhou Juangua covenants that, without Hangzhou Shiqu’s prior written consent, it will not, among other things, create or assist or allow its shareholders to create, any pledge or encumbrance on its assets and equity interests, or transfer or otherwise dispose of its assets (except in the ordinary course of business). The amended and restated exclusive option agreement will remain effective until the entire equity interests in Hangzhou Juangua have been transferred to Hangzhou Shiqu or its designated person.
On August 20, 2017, Hangzhou Shiqu, Beijing Meilishikong and the shareholders of Beijing Meilishikong entered into an amended and restated exclusive option agreement, which contained terms substantially similar to the amended and restated exclusive option agreement by and among Hangzhou Shiqu, Hangzhou Juangua and the shareholders of Hangzhou Juangua described above.
Spousal Consent Letters. The spouses of the shareholders of Hangzhou Juangua and Beijing Meilishikong each signed a spousal consent letter. Under each spousal consent letter, the signing spouse unconditionally and irrevocably agreed that the equity interest in Hangzhou Juangua and Beijing Meilishikong held by and registered in the name of her spouse be disposed of in accordance with the above-mentioned amended and restated exclusive option agreement, equity interest pledge agreement, shareholder voting proxy agreement and powers of attorney, as applicable, and that her spouse may perform, amend or terminate such agreements without
8
Table of Contents
her additional consent. Additionally, the spouse agreed not to assert any rights over the equity interest in Hangzhou Juangua or Beijing Meilishikong held by her spouse. In addition, in the event that the spouse obtains any equity interest in Hangzhou Juangua or Beijing Meilishikong held by her spouse for any reason, she agrees to be bound by and sign any legal documents substantially similar to the contractual arrangements, as may be amended from time to time.
In the opinion of King & Wood Mallesons, our PRC legal counsel:
However, our PRC legal counsel, has also advised us that there are substantial uncertainties regarding the interpretation and application of current and future PRC laws, regulations and rules. Accordingly, the PRC regulatory authorities may take a view that is contrary to the opinion of our PRC legal counsel. It is uncertain whether any new PRC laws or regulations relating to the VIE structures will be adopted or if adopted, what they would provide. If we or any of the VIEs are found to be in violation of any existing or future PRC laws or regulations, or fail to obtain or maintain any of the required permits or approvals, the relevant PRC regulatory authorities would have broad discretion to take action in dealing with such violations or failures. See “Item 3. Key Information—D. Risk Factors—Risks Related to Our Corporate Structure— If the PRC government determines that the contractual arrangements constituting part of the VIE structure do not comply with PRC regulations, or if these regulations or the interpretation of existing regulations change in the future, we could be subject to severe penalties or be forced to relinquish our rights under the contractual agreements in those operations, which may cause the value of our ADSs to significantly decline or become worthless.” and “Item 3. Key Information—D. Risk Factors—Risks Related to Doing Business in China— Rules and regulations governing the internet industry in China are relatively new and quickly evolving. The enforcement of rules and regulations in China governing the internet industry could adversely affect our results of business and financial operations and the value of our ADSs.”
Our Operations are subject to PRC Laws and Regulations
We face various risks and uncertainties related to doing business in China. Our business operations are primarily conducted in China, and we are subject to complex and evolving PRC laws and regulations. For example, we face risks associated with regulatory approvals on offshore offerings, anti-monopoly regulatory actions, and oversight on cybersecurity and data privacy, as well as the lack of inspection by the PCAOB, on our auditor, which may impact our ability to conduct certain businesses, accept foreign investments, or list on a United States stock exchange. These risks could result in a material adverse change in our operations and the value of our ADSs, significantly limit or completely hinder our ability to continue to offer securities to investors, or cause the value of such securities to significantly decline. For a detailed description of risks related to doing business in China, please refer to risks disclosed under “Item 3D. Key Information—Risk Factors—Risks Related to Doing Business in China.”
The PRC government’s significant authority in regulating our operations and its oversight and discretion over offerings conducted overseas by, and foreign investment in, China-based issuers could significantly limit or completely hinder our ability to offer or continue to offer securities to investors. Implementation of industry-wide regulations, including data security or anti-monopoly related regulations, in this nature may cause the value of such securities to significantly decline. See “Item 3D. Key Information—Risk Factors—Risks Related to Doing Business in China— The Chinese government has jurisdiction to oversee and may have significant influence on our operations, and provide more stringent regulatory oversight over offerings conducted overseas and foreign investment in China-based issuers, and the PRC government’s authority in regulating our operations, our overseas offerings of securities and foreign investment in us could limit our ability or prevent us from conducting future offerings of securities to investors, which may cause the value of our securities to significantly decline or become worthless.”
Laws and regulations in China are quickly evolving, which could result in a material adverse change in our operations and the value of our ADSs. See “Item 3D. Key Information—Risk Factors— Risks Related to Doing Business in China — Rules and regulations governing the internet industry in China are relatively new and quickly evolving. The enforcement of rules and regulations in China governing the internet industry could adversely affect our result of business and financial operations and the value of our ADSs.” and “—We may be adversely affected by the complexity, uncertainties and changes in PRC regulation of internet-related businesses and companies, and any lack of requisite approvals, licenses or permits applicable to our business may have a material adverse effect on our business and results of operations.”
In addition, other recent statements and regulatory actions by the PRC government, such as those related to data security or anti-monopoly concerns, may affect our ability to conduct its business, accept foreign investments, or list on a U.S. or other foreign exchange.
9
Table of Contents
In terms of laws and regulations of anti-monopoly, on February 7, 2021, the Anti-Monopoly Committee of the State Council promulgated the Anti-Monopoly Guidelines for the Internet Platform Economy Sector which stipulates that any concentration of undertakings involving VIEs shall fall within the scope of anti-monopoly review. According to the afore guidelines, business practices such as deploying big data analytics to discriminate customers in terms of pricing and other transactional conditions, coercive exclusivity arrangements with transaction counterparties, blocking of competitor interface through technological means and unlawful collection of user data without consent, are prohibited. In August 2022, the Anti-monopoly Law of the People's Republic of China (2022) came into force with the new regulations prohibiting undertaking from engaging in monopolistic conduct by utilizing data and algorithm, technology, capital advantage, or platform rules, among others. The heightened regulatory scrutiny of business operators under the laws and regulations of anti-monopoly may increase our compliance costs and subject us to heightened risks and challenges.
In terms of data security regulation, a series of laws and regulations have been published by the PRC government in the past year. In June 2021, the SCNPC promulgated the Data Security Law, which took effect on September 1, 2021. In December 2021, the CAC, together with other authorities, jointly promulgated the Measures of Cybersecurity Review, which became effective on February 15, 2022. These laws and regulations impose cybersecurity review obligations on critical information infrastructure operators and network platform operators. According to the Measures of Cybersecurity Review, any network platform operator that holds personal data of more than one million users must apply for a cybersecurity review before it makes any public offering on a foreign stock exchange. As of the date of this annual report, for entities that have been listed overseas before the implementation of the Measures of Cybersecurity Review rather than doing an initial public listing, the Measures of Cybersecurity Review do not clearly stipulate that such entities or their subsidiaries, as network platform operators, shall report to Cybersecurity Review Office for cybersecurity review, and also do not clearly stipulate that such entities or their subsidiaries shall obtain any permissions or approvals by the CAC. Based on the above-mentioned and other effective PRC laws and regulations as of the date of this annual report, as advised by King & Wood Mallesons, our PRC legal counsel, none of us, the VIEs or its subsidiaries is required to conduct a cybersecurity review. However, the laws and regulations in the area of data security are new and quickly evolving and the PRC government may interpret the above laws and regulations differently or issue new regulations in the future. Therefore, it is uncertain whether we would be deemed to be a critical information infrastructure operator or a network platform operator under PRC law and be required to undergo cybersecurity reviews in the future.
The Holding Foreign Companies Accountable Act
The Holding Foreign Companies Accountable Act, or the HFCAA, was enacted on December 18, 2020. Pursuant to the HFCAA, if the SEC determines that we have filed audit reports issued by a registered public accounting firm that has not been subject to inspection by the PCAOB for three consecutive years beginning in 2021, the SEC may prohibit our shares or ADSs from being traded on a national securities exchange or in the over-the-counter market in the United States. Furthermore, on December 2, 2021, the SEC adopted final amendments implementing the disclosure and submission requirements under the HFCAA, pursuant to which the SEC will identify a “Commission-Identified Issuer” if an issuer has filed an annual report containing an audit report issued by a registered public accounting firm that the PCAOB has determined it is unable to inspect or investigate completely because of a position taken by an authority in the foreign jurisdiction, and will then impose a trading prohibition on an issuer after it is identified as a “Commission-Identified Issuer” for three consecutive years. On December 16, 2021, the PCAOB announced the PCAOB HFCA Act determinations (the “PCAOB determinations”) relating to the PCAOB’s inability to inspect or investigate completely registered public accounting firms headquartered in mainland China or Hong Kong, a Special Administrative Region and dependency of the PRC, because of a position taken by one or more authorities in the PRC or Hong Kong. The PCAOB identified our auditor as one of the registered public accounting firms headquartered in mainland China that the PCAOB is unable to inspect and investigate completely. On August 22, 2022, in connection with its implementation of the HFCAA, the SEC conclusively named our company as a “Commission-Identified Issuer” following the filing of our Form 20-F for the fiscal year ended March 31, 2022 with the SEC on July 15, 2022.
In addition, on August 26, 2022, the PCAOB signed a Statement of Protocol with the Chinese authorities governing inspections and investigations of audit firms based in China, which represents the first step toward providing access for the PCAOB to inspect and investigate registered public accounting firms in China without any limitations on scope. However, there remain uncertainties in the enforcement of the Statement of Protocol. On December 15, 2022, the PCAOB announced that it was able to secure complete access to inspect and investigate PCAOB-registered public accounting firms headquartered in mainland China and Hong Kong completely in 2022. The PCAOB vacated its previous PCAOB determinations that the PCAOB was unable to inspect or investigate completely registered public accounting firms headquartered in mainland China and Hong Kong. As such, we do not expect to be identified as a “Commission-Identified Issuer” under the HFCAA after we file this annual report on Form 20-F for the fiscal year ended March 31, 2023.
However, whether the PCAOB will continue to be able to satisfactorily conduct inspections and investigations of registered public accounting firms headquartered in mainland China is subject to substantial uncertainty and depends on a number of
10
Table of Contents
factors out of our, and our auditor’s control, including the implementation of the Statement of Protocol signed by the PCAOB and the Chinese authorities and the uncertainties surrounding China-U.S. relations.
On December 23, 2022, the Accelerating Holding Foreign Companies Accountable Act was enacted, which amended the HFCAA, by requiring the SEC to prohibit an issuer’s securities from trading on any U.S. stock exchanges if its auditor is not subject to PCAOB inspections for two consecutive years instead of three. If the PCAOB determines in the future that it no longer has full access to inspect and investigate accounting firms headquartered in mainland China and Hong Kong and we continue to use such accounting firms to conduct audit work, we would be identified as a “Commission-Identified Issuer” under the HFCAA following the filing of the annual report for the relevant fiscal year, and if we were so identified for two consecutive years, trading in our securities on U.S. markets would be prohibited.
Our auditor is an independent registered public accounting firm that issues the consolidated financial statements incorporated by reference in this annual report, is a firm registered with the PCAOB and is subject to laws in the United States pursuant to which the PCAOB conducts regular inspections to assess its compliance with the applicable professional standards. However, we cannot assure you whether Nasdaq or regulatory authorities would apply additional and more stringent criteria to us after considering the effectiveness of our auditor’s audit procedures and quality control procedures, adequacy of personnel and training, or sufficiency of resources, geographic reach, or experience as it relates to the audit of our financial statements. Such uncertainty could cause the market price of our ADSs to be materially and adversely affected, and our ADSs could be delisted or prohibited from being traded “over-the-counter” earlier than would be required by the HFCAA.
The related risks and uncertainties could cause the value of our ADSs to significantly decline. For more details, see “Item 3D. Key Information—Risk Factors—Risks Related to Doing Business in China—If the PCAOB is unable to continue to inspect or investigate completely registered public accounting firms located in mainland China for two consecutive years in the future, our ADSs will be prohibited from trading in the United States under the HFCAA in the future. The delisting of our ADSs, or the threat of them being delisted, may materially and adversely affect the value of your investment.”
Permissions Required from the PRC Authorities for Our Operations
We conduct our business primarily through our subsidiaries and the VIEs in China. Our operations in China are governed by PRC laws and regulations. As of the date of this annual report, nor our company or the VIEs has been involved in any investigations or review initiated by any PRC regulatory authority, or has any of them received any inquiry, notice or sanction for our operations or our issuance of securities to investors. Nevertheless, the Standing Committee of the National People’s Congress (the “SCNPC”) or PRC regulatory authorities may in the future promulgate laws, regulations or implementing rules that require us, our subsidiaries, the VIEs or their subsidiaries to obtain permissions from PRC regulatory authorities to approve the VIEs operations.
On August 8, 2006, six PRC regulatory agencies jointly adopted The Regulations on Mergers and Acquisitions of Domestic Enterprises by Foreign Investors, or the M&A Rules, which came into effect on September 8, 2006 and were amended on June 22, 2009. Under the regulations, an offshore special purpose vehicle formed for overseas listing purposes and controlled directly or indirectly by the PRC citizens shall obtain the approvals of the CSRC prior to overseas listing and trading of such special purpose vehicle’s securities on an overseas stock exchange. Under the PRC laws and regulations in effect at the time of this annual report, as advised by King & Wood Mallesons, our PRC legal counsel, we will not be required to submit an application to the CSRC for its permissions or approvals of offering and the listing and trading of our securities to foreign investors under the M&A Rules. However, the interpretation and application of the regulations remain unclear, and the above opinions of King & Wood Mallesons, our PRC counsel are subject to any new laws, rules and regulations or detailed implementations and interpretations in any form relating to the M&A Rules. We cannot assure you that relevant Chinese government agencies, including the CSRC, would reach the same conclusion in the future.
On December 28, 2021, the Cyberspace Administration of China, or CAC jointly with the relevant authorities formally published Measures for Cybersecurity Review (2021) which will take effect on February 15, 2022 and replace the former Measures for Cybersecurity Review (2020). Measures for Cybersecurity Review (2021) stipulates that operators of critical information infrastructure purchasing network products and services, and online platform operator (together with the operators of critical information infrastructure, the “Operators”) carrying out data processing activities that affect or may affect national security, shall conduct a cybersecurity review, any online platform operator who controls more than one million users’ personal information must go through a cybersecurity review by the cybersecurity review office if it seeks to be listed in a foreign country. On April 4, 2020, the CAC held a press conference and limited the above Operators to telecommunications, finance, national defense and other industries related to national security, which is not the industry we are engaged in. Moreover, as of the date of this annual report, for entities that have been listed overseas before the implementation of the Measures of Cybersecurity Review rather than doing a public listing, the Measures of Cybersecurity Review do not clearly stipulate that such entities or their subsidiaries, as network platform operators, shall report to Cybersecurity Review Office for cybersecurity review, and also do not clearly stipulate that such entities or their subsidiaries
11
Table of Contents
shall obtain any permissions of approvals by the CAC. However, it remains uncertain whether any future regulatory changes would impose additional restrictions on companies like us. The aforementioned policies and any related implementation rules to be enacted may subject us to additional compliance requirements in the future. Therefore, we cannot assure you that we will remain fully compliant with all new regulatory requirements of these opinions or any future implementation rules on a timely basis, or at all.
On February 17, 2023, the CSRC issued the Trial Administrative Measures of Overseas Securities Offering and Listing by Domestic Companies and five supporting guidelines, or, collectively, the Filing Measures, effective on March 31, 2023. Pursuant to the Filing Measures, PRC domestic companies that directly or indirectly offer or list their securities in an overseas market, which include (i) any PRC company limited by shares, and (ii) any offshore company that conducts its business operations primarily in China and contemplates an offering or listing of its securities in an overseas market based on its onshore equities, assets or similar interests, are required to file with the CSRC within three business days after submitting their listing application documents. Based on the above-mentioned laws and regulations, as of the date of this annual report, as advised by King & Wood Mallesons, our PRC legal counsel, we are an existing enterprise defined by the Filing Measures. An existing enterprise is not required to file with the CSRC immediately, and the filing shall be made as required if we involve refinancing and other filing matters in the future. However, the interpretation and application of the regulations remain unclear and the relevant regulations are quickly evolving. We cannot assure you that CSRC, would reach the same conclusion in the future.
Based on the above-mentioned and other effective PRC laws and regulations as of the date of this annual report, as advised by King &Wood Mallesons, our PRC legal counsel, except for necessary company business license, foreign investment information report to the commerce administrative authority and foreign exchange registration or filing, we and the VIEs do not have to obtain any permissions or approvals from the PRC government authorities for our business operations in China or for securities offerings to foreign investors. Also, as advised by our PRC legal counsel, as an existing enterprise (the domestic companies that have already been listed overseas before the effective date of the Filling Measures) defined under the Filing Measures, none of us or the VIEs is required to file with the CSRC immediately. However, according to the Filling Measures, we will be required to file with the CSRC for our overseas offering of equity and equity linked securities in the future. Furthermore, given the uncertainties of interpretation and implementation of relevant laws and regulations and the enforcement practice by government authorities, we may be required to obtain such permissions or approvals in the future. We cannot predict, if required, whether or for how long we will be able to complete such filings or obtain such approvals. And the failure to complete such filing or the failure to obtain or delay in obtaining such permissions or approvals would subject us to restrictions and penalties imposed by the CSRC, CAC or any other PRC regulatory authorities, and our ability to offer securities to foreign investors could be significantly limited or completely hindered and the ADSs currently being offered may substantially decline in value and be worthless.
Supplemental Financial Information Related to the VIEs
The following tables present supplemental information provided in the form of condensed consolidated statements of operations, condensed consolidated balance sheets and condensed consolidated cash flows for MOGU Inc. (parent company), the primary beneficiaries of the VIEs, the VIEs, and other subsidiaries for the periods as of and for the dates presented.
Condensed Consolidated Statements of Operations
|
|
For the Year Ended March 31, 2023 |
|
|||||||||||||||||||||
|
|
MOGU Inc. |
|
|
Other |
|
|
Primary |
|
|
VIEs |
|
|
Eliminating |
|
|
Consolidated |
|
||||||
|
|
(RMB, in thousands) |
|
|||||||||||||||||||||
Third-party revenues |
|
|
— |
|
|
|
293 |
|
|
|
170,811 |
|
|
|
60,972 |
|
|
|
— |
|
|
|
232,076 |
|
Inter-company revenues(1) |
|
|
— |
|
|
|
— |
|
|
|
13,546 |
|
|
|
26,785 |
|
|
|
(40,331 |
) |
|
|
— |
|
Third-party costs and expenses(2) |
|
|
(53,206 |
) |
|
|
(8,717 |
) |
|
|
(175,669 |
) |
|
|
(189,199 |
) |
|
|
— |
|
|
|
(426,791 |
) |
Inter-company costs and expenses(1) |
|
|
— |
|
|
|
— |
|
|
|
(26,786 |
) |
|
|
(13,545 |
) |
|
|
40,331 |
|
|
|
— |
|
Third-party other operating income |
|
|
8,351 |
|
|
|
(15,619 |
) |
|
|
9,613 |
|
|
|
4,922 |
|
|
|
— |
|
|
|
7,267 |
|
Inter-company other operating income/(expenses)(3) |
|
|
(86,381 |
) |
|
|
89,731 |
|
|
|
(21,000 |
) |
|
|
17,650 |
|
|
|
— |
|
|
|
— |
|
Share of loss from subsidiaries and VIEs(4) |
|
|
(38,453 |
) |
|
|
(106,161 |
) |
|
|
(73,784 |
) |
|
|
— |
|
|
|
218,398 |
|
|
|
— |
|
(Expense)/income from non-operations |
|
|
(16,717 |
) |
|
|
2,114 |
|
|
|
3,788 |
|
|
|
9,874 |
|
|
|
— |
|
|
|
(941 |
) |
Loss before income tax expense |
|
|
(186,406 |
) |
|
|
(38,359 |
) |
|
|
(99,481 |
) |
|
|
(82,541 |
) |
|
|
218,398 |
|
|
|
(188,389 |
) |
Income tax (expense)/benefit |
|
|
— |
|
|
|
(94 |
) |
|
|
(6,680 |
) |
|
|
8,757 |
|
|
|
— |
|
|
|
1,983 |
|
Net loss |
|
|
(186,406 |
) |
|
|
(38,453 |
) |
|
|
(106,161 |
) |
|
|
(73,784 |
) |
|
|
218,398 |
|
|
|
(186,406 |
) |
Net loss attributable to non-controlling interests |
|
|
— |
|
|
|
— |
|
|
|
— |
|
|
|
(8,422 |
) |
|
|
— |
|
|
|
(8,422 |
) |
Net loss attributable to ordinary shareholders |
|
|
(186,406 |
) |
|
|
(38,453 |
) |
|
|
(106,161 |
) |
|
|
(65,362 |
) |
|
|
218,398 |
|
|
|
(177,984 |
) |
12
Table of Contents
|
|
For the Year Ended March 31, 2022 |
|
|||||||||||||||||||||
|
|
MOGU Inc. |
|
|
Other subsidiaries |
|
|
Primary Beneficiaries of VIEs |
|
|
VIEs |
|
|
Eliminating adjustments |
|
|
Consolidated Totals |
|
||||||
|
|
(RMB, in thousands) |
|
|||||||||||||||||||||
Third-party revenues |
|
|
— |
|
|
|
3,006 |
|
|
|
264,670 |
|
|
|
69,793 |
|
|
|
— |
|
|
|
337,469 |
|
Inter-company revenues(1) |
|
|
— |
|
|
|
— |
|
|
|
15,779 |
|
|
|
31,816 |
|
|
|
(47,595 |
) |
|
|
— |
|
Third-party costs and expenses(2) |
|
|
(307,017 |
) |
|
|
(201,737 |
) |
|
|
(336,666 |
) |
|
|
(187,958 |
) |
|
|
— |
|
|
|
(1,033,378 |
) |
Inter-company costs and expenses(1) |
|
|
— |
|
|
|
— |
|
|
|
(31,816 |
) |
|
|
(15,779 |
) |
|
|
47,595 |
|
|
|
— |
|
Third-party other operating income |
|
|
1,008 |
|
|
|
6,620 |
|
|
|
15,384 |
|
|
|
2,415 |
|
|
|
— |
|
|
|
25,427 |
|
Inter-company other operating income/(expenses)(3) |
|
|
— |
|
|
|
236,825 |
|
|
|
(39,127 |
) |
|
|
(197,698 |
) |
|
|
— |
|
|
|
— |
|
Share of loss from subsidiaries and VIEs(4) |
|
|
(334,730 |
) |
|
|
(376,973 |
) |
|
|
(269,972 |
) |
|
|
— |
|
|
|
981,675 |
|
|
|
— |
|
(Expense)/income from non-operations |
|
|
(1,635 |
) |
|
|
(2,294 |
) |
|
|
4,775 |
|
|
|
12,750 |
|
|
|
— |
|
|
|
13,596 |
|
Loss before income tax expense |
|
|
(642,374 |
) |
|
|
(334,553 |
) |
|
|
(376,973 |
) |
|
|
(284,661 |
) |
|
|
981,675 |
|
|
|
(656,886 |
) |
Income tax (expense)/benefit |
|
|
— |
|
|
|
(177 |
) |
|
|
— |
|
|
|
14,689 |
|
|
|
— |
|
|
|
14,512 |
|
Net loss |
|
|
(642,374 |
) |
|
|
(334,730 |
) |
|
|
(376,973 |
) |
|
|
(269,972 |
) |
|
|
981,675 |
|
|
|
(642,374 |
) |
Net loss attributable to non-controlling interests |
|
|
— |
|
|
|
— |
|
|
|
— |
|
|
|
(2,574 |
) |
|
|
— |
|
|
|
(2,574 |
) |
Net loss attributable to ordinary shareholders |
|
|
(642,374 |
) |
|
|
(334,730 |
) |
|
|
(376,973 |
) |
|
|
(267,398 |
) |
|
|
981,675 |
|
|
|
(639,800 |
) |
|
|
For the Year Ended March 31, 2021 |
|
|||||||||||||||||||||
|
|
MOGU Inc. |
|
|
Other subsidiaries |
|
|
Primary Beneficiaries of VIEs |
|
|
VIEs |
|
|
Eliminating adjustments |
|
|
Consolidated Totals |
|
||||||
|
|
(RMB, in thousands) |
|
|||||||||||||||||||||
Third-party revenues |
|
|
— |
|
|
|
131 |
|
|
|
397,249 |
|
|
|
85,012 |
|
|
|
— |
|
|
|
482,392 |
|
Inter-company revenues(1) |
|
|
— |
|
|
|
— |
|
|
|
32,508 |
|
|
|
25,679 |
|
|
|
(58,187 |
) |
|
|
— |
|
Third-party costs and expenses(2) |
|
|
(331,385 |
) |
|
|
(9,153 |
) |
|
|
(525,209 |
) |
|
|
(95,454 |
) |
|
|
— |
|
|
|
(961,201 |
) |
Inter-company costs and expenses(1) |
|
|
— |
|
|
|
(17 |
) |
|
|
(25,680 |
) |
|
|
(32,490 |
) |
|
|
58,187 |
|
|
|
— |
|
Third-party other operating income |
|
|
6,138 |
|
|
|
12,451 |
|
|
|
25,313 |
|
|
|
5,983 |
|
|
|
— |
|
|
|
49,885 |
|
Share of loss from subsidiaries and VIEs(4) |
|
|
(82,563 |
) |
|
|
(88,890 |
) |
|
|
1,721 |
|
|
|
— |
|
|
|
169,732 |
|
|
|
— |
|
Income from non-operations |
|
|
89,596 |
|
|
|
3,133 |
|
|
|
5,208 |
|
|
|
8,197 |
|
|
|
— |
|
|
|
106,134 |
|
Loss before income tax expense |
|
|
(318,214 |
) |
|
|
(82,345 |
) |
|
|
(88,890 |
) |
|
|
(3,073 |
) |
|
|
169,732 |
|
|
|
(322,790 |
) |
Income tax (expense)/benefit |
|
|
(9,757 |
) |
|
|
(218 |
) |
|
|
— |
|
|
|
4,794 |
|
|
|
— |
|
|
|
(5,181 |
) |
Net (loss)/income |
|
|
(327,971 |
) |
|
|
(82,563 |
) |
|
|
(88,890 |
) |
|
|
1,721 |
|
|
|
169,732 |
|
|
|
(327,971 |
) |
Net loss attributable to ordinary shareholders |
|
|
(327,971 |
) |
|
|
(82,563 |
) |
|
|
(88,890 |
) |
|
|
1,721 |
|
|
|
169,732 |
|
|
|
(327,971 |
) |
13
Table of Contents
Condensed Consolidated Balance Sheets
|
|
As of March 31, 2023 |
|
|||||||||||||||||||||
|
|
MOGU Inc. |
|
|
Other subsidiaries |
|
|
Primary Beneficiaries of VIEs |
|
|
VIEs |
|
|
Eliminating adjustments |
|
|
Consolidated Totals |
|
||||||
|
|
(RMB, in thousands) |
|
|||||||||||||||||||||
ASSETS |
|
|
|
|
|
|
|
|
|
|
|
|
|
|
|
|
|
|
||||||
Cash and cash equivalents |
|
|
14,668 |
|
|
|
121,806 |
|
|
|
20,694 |
|
|
|
259,033 |
|
|
|
— |
|
|
|
416,201 |
|
Restricted cash |
|
|
— |
|
|
|
— |
|
|
|
— |
|
|
|
810 |
|
|
|
— |
|
|
|
810 |
|
Short-term investments |
|
|
— |
|
|
|
252 |
|
|
|
120,000 |
|
|
|
25,584 |
|
|
|
— |
|
|
|
145,836 |
|
Inventories, net |
|
|
— |
|
|
|
— |
|
|
|
13 |
|
|
|
131 |
|
|
|
— |
|
|
|
144 |
|
Loan receivables, net |
|
|
— |
|
|
|
— |
|
|
|
— |
|
|
|
7,229 |
|
|
|
— |
|
|
|
7,229 |
|
Prepayments and other current assets |
|
|
47 |
|
|
|
153 |
|
|
|
14,309 |
|
|
|
54,617 |
|
|
|
— |
|
|
|
69,126 |
|
Amounts due from related party |
|
|
618 |
|
|
|
— |
|
|
|
28 |
|
|
|
614 |
|
|
|
— |
|
|
|
1,260 |
|
Amounts due from intercompany (6) |
|
|
1,050,048 |
|
|
|
70,088 |
|
|
|
1,525,363 |
|
|
|
105,334 |
|
|
|
(2,750,833 |
) |
|
|
— |
|
Property and equipment, net |
|
|
— |
|
|
|
116 |
|
|
|
2,875 |
|
|
|
191,598 |
|
|
|
— |
|
|
|
194,589 |
|
Intangible assets, net |
|
|
— |
|
|
|
— |
|
|
|
621 |
|
|
|
11,933 |
|
|
|
— |
|
|
|
12,554 |
|
Right-of-use assets |
|
|
— |
|
|
|
25 |
|
|
|
4,766 |
|
|
|
650 |
|
|
|
— |
|
|
|
5,441 |
|
Goodwill |
|
|
— |
|
|
|
— |
|
|
|
— |
|
|
|
— |
|
|
|
— |
|
|
|
— |
|
Investments |
|
|
30,849 |
|
|
|
— |
|
|
|
— |
|
|
|
38,469 |
|
|
|
— |
|
|
|
69,318 |
|
Other non-current assets |
|
|
— |
|
|
|
— |
|
|
|
30,590 |
|
|
|
33,050 |
|
|
|
— |
|
|
|
63,640 |
|
Investment in subsidiaries and VIEs (5) |
|
|
— |
|
|
|
549,953 |
|
|
|
— |
|
|
|
— |
|
|
|
(549,953 |
) |
|
|
— |
|
Total assets |
|
|
1,096,230 |
|
|
|
742,393 |
|
|
|
1,719,259 |
|
|
|
729,052 |
|
|
|
(3,300,786 |
) |
|
|
986,148 |
|
LIABILITIES AND SHAREHOLDERS’ EQUITY |
|
|
|
|
|
|
|
|
|
|
|
|
|
|
|
|
|
|
||||||
Short-term borrowings |
|
|
— |
|
|
|
— |
|
|
|
— |
|
|
|
— |
|
|
|
— |
|
|
|
— |
|
Accounts payable |
|
|
— |
|
|
|
241 |
|
|
|
7,390 |
|
|
|
548 |
|
|
|
— |
|
|
|
8,179 |
|
Salaries and welfare payable |
|
|
— |
|
|
|
125 |
|
|
|
8,027 |
|
|
|
5,398 |
|
|
|
— |
|
|
|
13,550 |
|
Advances from customers |
|
|
— |
|
|
|
— |
|
|
|
177 |
|
|
|
68 |
|
|
|
— |
|
|
|
245 |
|
Taxes payable |
|
|
526 |
|
|
|
— |
|
|
|
7,354 |
|
|
|
3,246 |
|
|
|
— |
|
|
|
11,126 |
|
Amounts due to related parties |
|
|
— |
|
|
|
— |
|
|
|
2,801 |
|
|
|
1,395 |
|
|
|
— |
|
|
|
4,196 |
|
Current portion of lease liabilities |
|
|
— |
|
|
|
— |
|
|
|
2,347 |
|
|
|
307 |
|
|
|
— |
|
|
|
2,654 |
|
Accruals and other current liabilities |
|
|
2,429 |
|
|
|
40,612 |
|
|
|
13,317 |
|
|
|
214,359 |
|
|
|
— |
|
|
|
270,717 |
|
Amounts due to intercompany (6) |
|
|
104,015 |
|
|
|
1,051,699 |
|
|
|
82,369 |
|
|
|
1,512,750 |
|
|
|
(2,750,833 |
) |
|
|
— |
|
Share of investment in subsidiaries and VIEs (5) |
|
|
350,284 |
|
|
|
— |
|
|
|
1,044,771 |
|
|
|
— |
|
|
|
(1,395,055 |
) |
|
|
— |
|
Non-current lease liabilities |
|
|
— |
|
|
|
— |
|
|
|
753 |
|
|
|
— |
|
|
|
— |
|
|
|
753 |
|
Deferred tax liabilities |
|
|
1,614 |
|
|
|
— |
|
|
|
— |
|
|
|
1,755 |
|
|
|
— |
|
|
|
3,369 |
|
Other non-current liabilities |
|
|
— |
|
|
|
— |
|
|
|
— |
|
|
|
— |
|
|
|
— |
|
|
|
— |
|
Total liabilities |
|
|
458,868 |
|
|
|
1,092,677 |
|
|
|
1,169,306 |
|
|
|
1,739,826 |
|
|
|
(4,145,888 |
) |
|
|
314,789 |
|
Shareholder’s equity/(deficit): |
|
|
|
|
|
|
|
|
|
|
|
|
|
|
|
|
|
|
||||||
Total MOGU Inc. shareholders’equity/(deficit) (5) |
|
|
637,362 |
|
|
|
(350,284 |
) |
|
|
549,953 |
|
|
|
(1,044,771 |
) |
|
|
845,102 |
|
|
|
637,362 |
|
Non-controlling interests |
|
|
— |
|
|
|
— |
|
|
|
— |
|
|
|
33,997 |
|
|
|
— |
|
|
|
33,997 |
|
Total shareholders’ equity/(deficit) (5) |
|
|
637,362 |
|
|
|
(350,284 |
) |
|
|
549,953 |
|
|
|
(1,010,774 |
) |
|
|
845,102 |
|
|
|
671,359 |
|
Total liabilities and shareholders’equity/(deficit) |
|
|
1,096,230 |
|
|
|
742,393 |
|
|
|
1,719,259 |
|
|
|
729,052 |
|
|
|
(3,300,786 |
) |
|
|
986,148 |
|
14
Table of Contents
|
|
As of March 31, 2022 |
|
|||||||||||||||||||||
|
|
MOGU Inc. |
|
|
Other subsidiaries |
|
|
Primary Beneficiaries of VIEs |
|
|
VIEs |
|
|
Eliminating adjustments |
|
|
Consolidated Totals |
|
||||||
|
|
(RMB, in thousands) |
|
|||||||||||||||||||||
ASSETS |
|
|
|
|
|
|
|
|
|
|
|
|
|
|
|
|
|
|
||||||
Cash and cash equivalents |
|
|
4,349 |
|
|
|
150,401 |
|
|
|
70,764 |
|
|
|
213,094 |
|
|
|
— |
|
|
|
438,608 |
|
Restricted cash |
|
|
— |
|
|
|
— |
|
|
|
— |
|
|
|
809 |
|
|
|
— |
|
|
|
809 |
|
Short-term investments |
|
|
— |
|
|
|
6,853 |
|
|
|
190,000 |
|
|
|
— |
|
|
|
— |
|
|
|
196,853 |
|
Inventories, net |
|
|
— |
|
|
|
— |
|
|
|
15 |
|
|
|
64 |
|
|
|
— |
|
|
|
79 |
|
Loan receivables, net |
|
|
— |
|
|
|
— |
|
|
|
— |
|
|
|
26,788 |
|
|
|
— |
|
|
|
26,788 |
|
Prepayments and other current assets |
|
|
795 |
|
|
|
2,178 |
|
|
|
18,025 |
|
|
|
34,137 |
|
|
|
— |
|
|
|
55,135 |
|
Amounts due from related party |
|
|
571 |
|
|
|
— |
|
|
|
69 |
|
|
|
— |
|
|
|
— |
|
|
|
640 |
|
Amounts due from intercompany (6) |
|
|
1,066,882 |
|
|
|
70,087 |
|
|
|
1,418,077 |
|
|
|
76,920 |
|
|
|
(2,631,966 |
) |
|
|
— |
|
Property and equipment, net |
|
|
— |
|
|
|
182 |
|
|
|
6,282 |
|
|
|
1,238 |
|
|
|
— |
|
|
|
7,702 |
|
Intangible assets, net |
|
|
46,000 |
|
|
|
— |
|
|
|
718 |
|
|
|
43,104 |
|
|
|
— |
|
|
|
89,822 |
|
Goodwill |
|
|
— |
|
|
|
— |
|
|
|
— |
|
|
|
63,460 |
|
|
|
— |
|
|
|
63,460 |
|
Investments |
|
|
37,789 |
|
|
|
— |
|
|
|
— |
|
|
|
34,331 |
|
|
|
— |
|
|
|
72,120 |
|
Other non-current assets |
|
|
— |
|
|
|
— |
|
|
|
2,351 |
|
|
|
212,613 |
|
|
|
— |
|
|
|
214,964 |
|
Investment in subsidiaries and VIEs (5) |
|
|
— |
|
|
|
635,888 |
|
|
|
— |
|
|
|
— |
|
|
|
(635,888 |
) |
|
|
— |
|
Total assets |
|
|
1,156,386 |
|
|
|
865,589 |
|
|
|
1,706,301 |
|
|
|
706,558 |
|
|
|
(3,267,854 |
) |
|
|
1,166,980 |
|
LIABILITIES AND SHAREHOLDERS’EQUITY |
|
|
|
|
|
|
|
|
|
|
|
|
|
|
|
|
|
|
||||||
Short-term borrowings |
|
|
— |
|
|
|
10,064 |
|
|
|
— |
|
|
|
— |
|
|
|
— |
|
|
|
10,064 |
|
Accounts payable |
|
|
— |
|
|
|
841 |
|
|
|
16,557 |
|
|
|
552 |
|
|
|
— |
|
|
|
17,950 |
|
Salaries and welfare payable |
|
|
— |
|
|
|
84 |
|
|
|
7,763 |
|
|
|
4,464 |
|
|
|
— |
|
|
|
12,311 |
|
Advances from customers |
|
|
— |
|
|
|
— |
|
|
|
812 |
|
|
|
89 |
|
|
|
— |
|
|
|
901 |
|
Taxes payable |
|
|
526 |
|
|
|
— |
|
|
|
1,083 |
|
|
|
1,656 |
|
|
|
— |
|
|
|
3,265 |
|
Amounts due to related parties |
|
|
— |
|
|
|
— |
|
|
|
3,363 |
|
|
|
1,331 |
|
|
|
— |
|
|
|
4,694 |
|
Accruals and other current liabilities |
|
|
1,439 |
|
|
|
39,939 |
|
|
|
13,733 |
|
|
|
217,527 |
|
|
|
— |
|
|
|
272,638 |
|
Amounts due to intercompany (6) |
|
|
104,015 |
|
|
|
1,073,033 |
|
|
|
49,454 |
|
|
|
1,405,464 |
|
|
|
(2,631,966 |
) |
|
|
— |
|
Share of investment in subsidiaries and VIEs (5) |
|
|
258,372 |
|
|
|
— |
|
|
|
977,648 |
|
|
|
— |
|
|
|
(1,236,020 |
) |
|
|
— |
|
Deferred tax liabilities |
|
|
1,408 |
|
|
|
— |
|
|
|
— |
|
|
|
10,704 |
|
|
|
— |
|
|
|
12,112 |
|
Other non-current liabilities |
|
|
890 |
|
|
|
— |
|
|
|
— |
|
|
|
— |
|
|
|
— |
|
|
|
890 |
|
Total liabilities |
|
|
366,650 |
|
|
|
1,123,961 |
|
|
|
1,070,413 |
|
|
|
1,641,787 |
|
|
|
(3,867,986 |
) |
|
|
334,825 |
|
Shareholder’s equity/(deficit): |
|
|
|
|
|
|
|
|
|
|
|
|
|
|
|
|
|
|
||||||
Total MOGU Inc. shareholders’equity/(deficit) (5) |
|
|
789,736 |
|
|
|
(258,372 |
) |
|
|
635,888 |
|
|
|
(977,648 |
) |
|
|
600,132 |
|
|
|
789,736 |
|
Non-controlling interests |
|
|
— |
|
|
|
— |
|
|
|
— |
|
|
|
42,419 |
|
|
|
— |
|
|
|
42,419 |
|
Total shareholders’ equity/(deficit) (5) |
|
|
789,736 |
|
|
|
(258,372 |
) |
|
|
635,888 |
|
|
|
(935,229 |
) |
|
|
600,132 |
|
|
|
832,155 |
|
Total liabilities and shareholders’equity/(deficit) |
|
|
1,156,386 |
|
|
|
865,589 |
|
|
|
1,706,301 |
|
|
|
706,558 |
|
|
|
(3,267,854 |
) |
|
|
1,166,980 |
|
15
Table of Contents
Condensed Consolidated Cash Flows
|
|
For the Year Ended March 31, 2023 |
|
|||||||||||||||||||||
|
|
MOGU Inc. |
|
|
Other subsidiaries |
|
|
Primary Beneficiaries of VIEs |
|
|
VIEs |
|
|
Eliminating adjustments |
|
|
Consolidated Totals |
|
||||||
|
|
(RMB, in thousands) |
|
|||||||||||||||||||||
Inter-company receipts/(payments) for service charge (7) |
|
|
— |
|
|
|
— |
|
|
|
4,561 |
|
|
|
(4,561 |
) |
|
|
— |
|
|
|
— |
|
Inter-company (payments)/receipts for other operating activities (8) |
|
|
— |
|
|
|
(1,151 |
) |
|
|
(113,171 |
) |
|
|
114,322 |
|
|
|
— |
|
|
|
— |
|
Operating activities with external parties |
|
|
(1,712 |
) |
|
|
(3,019 |
) |
|
|
21,251 |
|
|
|
(26,610 |
) |
|
|
— |
|
|
|
(10,090 |
) |
Net cash (used in)/provided by operating activities |
|
|
(1,712 |
) |
|
|
(4,170 |
) |
|
|
(87,359 |
) |
|
|
83,151 |
|
|
|
— |
|
|
|
(10,090 |
) |
Investment in intercompany (9) |
|
|
— |
|
|
|
— |
|
|
|
— |
|
|
|
— |
|
|
|
— |
|
|
|
— |
|
Receipt of loans repayment from subsidiaries |
|
|
19,311 |
|
|
|
— |
|
|
|
— |
|
|
|
— |
|
|
|
(19,311 |
) |
|
|
— |
|
Other investing activities |
|
|
(5,947 |
) |
|
|
6,477 |
|
|
|
37,289 |
|
|
|
(37,211 |
) |
|
|
— |
|
|
|
608 |
|
Net cash provided by/(used in) investing activities |
|
|
13,364 |
|
|
|
6,477 |
|
|
|
37,289 |
|
|
|
(37,211 |
) |
|
|
(19,311 |
) |
|
|
608 |
|
Capital contribution from Group companies (9) |
|
|
— |
|
|
|
— |
|
|
|
— |
|
|
|
— |
|
|
|
— |
|
|
|
— |
|
Repayment of loan from Group companies |
|
|
— |
|
|
|
(19,311 |
) |
|
|
— |
|
|
|
— |
|
|
|
19,311 |
|
|
|
— |
|
Other financing activities |
|
|
(1,333 |
) |
|
|
(10,731 |
) |
|
|
— |
|
|
|
— |
|
|
|
— |
|
|
|
(12,064 |
) |
Net cash (used in)/provided by financing activities |
|
|
(1,333 |
) |
|
|
(30,042 |
) |
|
|
— |
|
|
|
— |
|
|
|
19,311 |
|
|
|
(12,064 |
) |
|
|
For the Year Ended March 31, 2022 |
|
|||||||||||||||||||||
|
|
MOGU Inc. |
|
|
Other subsidiaries |
|
|
Primary Beneficiaries of VIEs |
|
|
VIEs |
|
|
Eliminating adjustments |
|
|
Consolidated Totals |
|
||||||
|
|
(RMB, in thousands) |
|
|||||||||||||||||||||
Inter-company receipts/(payments) for service charge (7) |
|
|
— |
|
|
|
— |
|
|
|
40,409 |
|
|
|
(40,409 |
) |
|
|
— |
|
|
|
— |
|
Inter-company (payments)/receipts for other operating activities (8) |
|
|
— |
|
|
|
(40,042 |
) |
|
|
(91,008 |
) |
|
|
131,050 |
|
|
|
— |
|
|
|
— |
|
Operating activities with external parties |
|
|
(1,642 |
) |
|
|
(11,210 |
) |
|
|
(32,492 |
) |
|
|
(69,065 |
) |
|
|
— |
|
|
|
(114,409 |
) |
Net cash (used in)/provided by operating activities |
|
|
(1,642 |
) |
|
|
(51,252 |
) |
|
|
(83,091 |
) |
|
|
21,576 |
|
|
|
— |
|
|
|
(114,409 |
) |
Investment in intercompany (9) |
|
|
— |
|
|
|
(84,194 |
) |
|
|
— |
|
|
|
— |
|
|
|
84,194 |
|
|
|
— |
|
Receipt of loans repayment from subsidiaries |
|
|
24,543 |
|
|
|
— |
|
|
|
— |
|
|
|
— |
|
|
|
(24,543 |
) |
|
|
— |
|
Other investing activities |
|
|
(10,935 |
) |
|
|
(11,037 |
) |
|
|
7,776 |
|
|
|
28,143 |
|
|
|
— |
|
|
|
13,947 |
|
Net cash provided by/(used in) investing activities |
|
|
13,608 |
|
|
|
(95,231 |
) |
|
|
7,776 |
|
|
|
28,143 |
|
|
|
59,651 |
|
|
|
13,947 |
|
Capital contribution from Group companies (9) |
|
|
— |
|
|
|
— |
|
|
|
84,194 |
|
|
|
— |
|
|
|
(84,194 |
) |
|
|
— |
|
Repayment of loan from Group companies |
|
|
— |
|
|
|
(24,543 |
) |
|
|
— |
|
|
|
— |
|
|
|
24,543 |
|
|
|
— |
|
Other financing activities |
|
|
(9,689 |
) |
|
|
10,139 |
|
|
|
— |
|
|
|
— |
|
|
|
— |
|
|
|
450 |
|
Net cash (used in)/provided by financing activities |
|
|
(9,689 |
) |
|
|
(14,404 |
) |
|
|
84,194 |
|
|
|
— |
|
|
|
(59,651 |
) |
|
|
450 |
|
16
Table of Contents
|
|
For the Year Ended March 31, 2021 |
|
|||||||||||||||||||||
|
|
MOGU Inc. |
|
|
Other subsidiaries |
|
|
Primary Beneficiaries of VIEs |
|
|
VIEs |
|
|
Eliminating adjustments |
|
|
Consolidated Totals |
|
||||||
|
|
(RMB, in thousands) |
|
|||||||||||||||||||||
Inter-company receipts/(payments) for service charge (7) |
|
|
— |
|
|
|
— |
|
|
|
39,859 |
|
|
|
(39,859 |
) |
|
|
— |
|
|
|
— |
|
Inter-company (payments)/receipts for other operating activities (8) |
|
|
— |
|
|
|
(583 |
) |
|
|
(67,734 |
) |
|
|
68,317 |
|
|
|
— |
|
|
|
— |
|
Operating activities with external parties |
|
|
3,322 |
|
|
|
(17,626 |
) |
|
|
(60,495 |
) |
|
|
(3,132 |
) |
|
|
— |
|
|
|
(77,931 |
) |
Net cash provided by/(used in) operating activities |
|
|
3,322 |
|
|
|
(18,209 |
) |
|
|
(88,370 |
) |
|
|
25,326 |
|
|
|
— |
|
|
|
(77,931 |
) |
Investment in intercompany (9) |
|
|
— |
|
|
|
(32,549 |
) |
|
|
— |
|
|
|
— |
|
|
|
32,549 |
|
|
|
— |
|
Loans to subsidiaries |
|
|
(61,651 |
) |
|
|
— |
|
|
|
— |
|
|
|
— |
|
|
|
61,651 |
|
|
|
— |
|
Other investing activities |
|
|
99,097 |
|
|
|
7,185 |
|
|
|
(633 |
) |
|
|
(202,312 |
) |
|
|
— |
|
|
|
(96,663 |
) |
Net cash provided by/(used in) investing activities |
|
|
37,446 |
|
|
|
(25,364 |
) |
|
|
(633 |
) |
|
|
(202,312 |
) |
|
|
94,200 |
|
|
|
(96,663 |
) |
Capital contribution from Group companies (9) |
|
|
— |
|
|
|
— |
|
|
|
32,549 |
|
|
|
— |
|
|
|
(32,549 |
) |
|
|
— |
|
Borrowings under loan from Group companies |
|
|
— |
|
|
|
61,651 |
|
|
|
— |
|
|
|
— |
|
|
|
(61,651 |
) |
|
|
— |
|
Other financing activities |
|
|
(119,249 |
) |
|
|
— |
|
|
|
— |
|
|
|
— |
|
|
|
— |
|
|
|
(119,249 |
) |
Net cash (used in)/provided by financing activities |
|
|
(119,249 |
) |
|
|
61,651 |
|
|
|
32,549 |
|
|
|
— |
|
|
|
(94,200 |
) |
|
|
(119,249 |
) |
Transfers of Cash within the Group
Because Mogu and its subsidiaries operate its business in the PRC and receive economic benefits through the VIEs and the contractual arrangements, Mogu and its subsidiaries are not able to make direct capital contributions to the VIEs and their subsidiaries. Instead, Mogu and its subsidiaries may transfer cash to the VIEs by loans or by making payments to the VIEs as inter-group transactions. We have established stringent controls and procedures for cash flows within our organization. Each transfer of cash between our company and a subsidiary or a VIE is subject to internal approval. To regulate our cash payments in daily operations, ensure safe use of capital and manage cash related risks and improve the efficiency of use of cash, we implement cash management policies, which are in compliance with PRC law. Transfers of cash between the Company, our subsidiaries, and the consolidated VIEs are considered as nonoperational payments and require application for internal approvals from our accountants and supervising management of the finance department. If a payment amount is larger than RMB3.0 million or over the annual expenditure budget, the application requires approval from our Chief Executive Officer. As part of the internal cash transfer procedure, our cashier and the management of the finance department will also review the approved application again before making the payment.
The cash inflows from investing activities of our company were primarily generated from the proceeds we received from our public offerings of ordinary shares and other financing activities. MOGU Inc. transfers cash to its wholly-owned Hong Kong subsidiaries by making capital contributions or providing operating cash, and the Hong Kong subsidiaries transfer cash to the subsidiaries in China by making capital contributions or providing operating cash to them.Under PRC law, Mogu Inc. may provide funding to our PRC subsidiaries only by loans or payments to the VIEs as inter-group transactions, subject to satisfaction of applicable government registration and approval requirements, due to regulatory restrictions relating to foreign investment in PRC domestic enterprises engaged in internet information services, online games, online audio-visual program services and related businesses. MOGU Inc. and its subsidiaries receive economic benefits from the VIEs through contractual arrangements. See “Item 3. Key Information – Risk Factors – Risks Related to Doing Business in China – PRC regulation of loans to and direct investment in PRC entities by offshore holding companies and governmental control of currency conversion may delay or prevent us from using the proceeds of our initial public offering to make loans to or make additional capital contributions to our PRC subsidiaries and VIEs, which could materially and adversely affect our liquidity and our ability to fund and expand our business.”
17
Table of Contents
The following table presents the amounts of cash transfers, dividends and distributions between MOGU Inc. (parent company), the VIEs, and other subsidiaries for the years ended March 31, 2021, 2022 and 2023, respectively. See “Item 3. Key Information – Supplemental Financial Information Related to the VIEs.” and “Item 18. Financial Statements.”
|
|
For the Year Ended March 31, |
|
|||||||||
|
|
2021 |
|
|
2022 |
|
|
2023 |
|
|||
|
|
(RMB, in thousands) |
|
|||||||||
Cash paid by VIEs to PRC subsidiaries under service agreements(1) |
|
|
(39,859 |
) |
|
|
(40,409 |
) |
|
|
(4,561 |
) |
Cash received by VIEs from Hong Kong and PRC subsidiaries for |
|
|
68,317 |
|
|
|
131,050 |
|
|
|
114,322 |
|
Loans from /(paid to) MOGU Inc. to /(from) Hong Kong subsidiaries(3) |
|
|
61,651 |
|
|
|
(24,543 |
) |
|
|
(19,311 |
) |
Capital contributions from Hong Kong subsidiaries to PRC |
|
|
32,549 |
|
|
|
84,194 |
|
|
|
— |
|
Notes:
The VIEs historically transferred and may continue to transfer cash to the relevant WFOEs by paying service fees according to the exclusive consultation and service agreements. Pursuant to these agreements between each of the VIEs and its corresponding WFOEs, each of the VIEs agrees to pay the relevant WFOE a quarterly service fee for the technical and consulting services at an amount that is equal to the VIEs’ revenue for the relevant quarter after deducting any applicable taxes, cost of revenues and retained earnings (which should be zero unless the relevant WFOEs otherwise agree in writing) or an amount adjusted at the relevant WFOEs’ sole discretion for the relevant quarter, which should be paid within 10 business days after the VIEs confirm in writing the amount and breakdown of the service fee for the relevant quarter in accordance with the terms of the agreements.
For the years ended March 31, 2021, 2022 and 2023, no dividends or distributions were made to MOGU Inc. by our subsidiaries.Under PRC laws and regulations, our PRC subsidiaries and the VIEs are subject to certain restrictions with respect to paying dividends or otherwise transferring any of their net assets to us. Remittance of dividends by a wholly foreign-owned enterprise out of China is also subject to examination by the banks designated by the State Administration of Foreign Exchange (the “SAFE”). For example, loans by us to our wholly owned PRC subsidiaries to finance their activities cannot exceed statutory limits and must be registered with the local branches of the SAFE. If we decide to finance our wholly owned PRC subsidiaries by means of capital contributions, these capital contributions are subject to the requirement of making necessary filings in the Foreign Investment Comprehensive Management Information System and registration with other governmental authorities in China. Any foreign loan procured by our PRC subsidiaries is required to be registered or filed with SAFE or its local branches or satisfy relevant requirements as provided in the Notice by the State Administration of Foreign Exchange of Further Facilitating Cross-border Trade and Investment (“SAFE Circular 28”). Any medium or long-term loan to be provided by us to the VIEs must be registered with the National Development and Reform Commission and the SAFE or its local branches. See “Item 3. Key Information — D. Risk Factors — Risks Related to Doing Business in China – PRC regulation of loans to and direct investment in PRC entities by offshore holding companies and governmental control of currency conversion may delay or prevent us from using the proceeds of our initial public offering to make loans to or make additional capital contributions to our PRC subsidiaries and VIEs, which could materially and adversely affect our liquidity and our ability to fund and expand our business.” Our PRC subsidiaries have not paid dividends and will not be able to pay dividends until they generate accumulated profits and meets the requirements for statutory reserve funds.
18
Table of Contents
For purposes of illustration, the following discussion reflects the hypothetical taxes that might be required to be paid within China, assuming that: (i) we have taxable earnings, and (ii) we determine to pay dividends in the future.
|
|
Tax calculation(1) |
Hypothetical pre-tax earnings |
|
100% |
Tax on earnings at statutory rate of 25% (2) |
|
(25)% |
Net earnings available for distribution |
|
75% |
Withholding tax at standard rate of 10% (3) |
|
(7.5)% |
Net distribution to Parent/Shareholders |
|
67.5% |
Notes:
MOGU Inc. has not declared or paid any cash dividends, nor has any plan currently to pay any cash dividends on our ordinary shares in the foreseeable future. We currently intend to retain most, if not all, of our available funds and any future earnings to operate and expand our business. We currently do not have any plan to require our PRC subsidiaries to distribute their retained earnings and we intend to use the retained earnings for the operations and expansion of our business in the PRC. See “Item 8. Financial Information—A. Consolidated Statements and Other Financial Information—Dividend Policy.” For PRC and United States federal income tax considerations of an investment in our ADSs, see “Item 10. Additional Information—E. Taxation.”
Depending on the Group’s overall fund utilization and the VIEs’ financial performance, we will settle the amounts owed on a quarterly basis when the VIEs generate profits according to the contractual agreements.
For the years ended March 31, 2021, 2022 and 2023, no assets other than cash were transferred within our organization. In addition, we have no operations outside PRC, and cash generated from operations in the PRC may not be available for other use outside of the PRC due to interventions in or the imposition of restrictions and limitations on the ability of us, our subsidiaries, or the consolidated VIEs by the PRC government to transfer cash. See “Item 3. Key Information — D. Risk Factors — Risks Related to Our Corporate Structure.”
Not applicable.
Not applicable.
Summary of Risk Factors
Investing in our ordinary shares involves significant risks. You should carefully consider all of the information in this annual report before making an investment in our ordinary shares. Below please find a summary of the principal risks we face. These risks are discussed more fully in the section titled “Item 3. Key Information—D. Risk Factors.” in this annual report.
19
Table of Contents
Risks Related to Our Business and Industry
Risks Related to Our Corporate Structure
We are considered to be the primary beneficiary of the VIEs (have the power to direct the activities of the VIEs that most significantly impact the VIEs’ economic performance and substantially deriving the related economic risks and benefits of these entities) through the contractual arrangements and, accordingly, we consolidate the financial results of the VIEs under U.S. GAAP for accounting purposes; however, the contractual arrangements have not been tested in a court of law and are subject to significant risks, including:
20
Table of Contents
Risks Related to Doing Business in China
Risks Related to the ADSs
21
Table of Contents
Risks Related to Our Business and Industry
Our limited operating history across our new business initiatives makes it difficult to evaluate our business prospects.
We have a limited operating history across some of our new business initiatives, including focusing our platform on the provision of fashion content in media formats, the use of live video broadcasts and other engaging socially-oriented sales methods, the development and offerings of new forms of commissions and marketing services, the provision of other new service offerings targeting different customer bases and user behaviors as well as the expansion and elevation of the supply chain of our fashion ecosystem, in particular our effects to optimate the fashion product supply chain and support deep collaboration between merchants and key opinion leaders on our platform. Also, as we expand to the business areas of providing online platform operation solutions to merchants, we might not be able to provide services or solutions that ensure successful improvements on the functionality of their online platform, their business performance or their market expansion needs. As a result, our historical performance may not be indicative of our future financial results. In addition, we may continue to introduce and implement new business strategies and initiatives as we continue to respond to changing market trends and user preferences. We cannot assure you that we will be able to successfully implement our new business initiatives or achieve our expected growth rate, or at all, as our business model continues to evolve in the future. Our overall business growth may continue to be negative, and our revenues may continue to decline for a number of possible reasons, some of which are beyond our control, including decreasing consumer spending, increasing competition, declining growth of our overall market or industry, the emergence of alternative business models, changes in rules, regulations, government policies or general economic conditions. Moreover, we may not have sufficient resources to address the risks associated with operating in rapidly evolving markets. If we fail to achieve revenue growth or if our new business initiatives fail to yield positive user acceptance or economic returns as expected or if such initiatives cause any material disruption to our business model, investors’ perceptions of our business and prospects may be materially and adversely affected and the market price of the ADSs could decline. You should consider our prospects in light of the risks and uncertainties that companies with a limited operating history may encounter.
If we are unable to execute our monetization and other operational strategies effectively, our business and prospects may be materially and adversely affected.
To achieve revenue growth, we will need to, among other things, continue to strengthen our brand, grow our user base in a cost-effective manner, enhance user experience, expand our content and product offerings, and strengthen our ability to successfully monetize our user base and products and services. However, we cannot assure you that we will be able to execute any of such strategies for monetization and business expansion successfully. We recorded net losses of RMB328.0 million, RMB642.4 million and RMB186.4 million(US$27.1 million) for the years ended March 31, 2021, 2022 and 2023, respectively.
In addition, growing our business requires significant efforts and resources from our management. For instance, we need to manage and continue to manage our relationships with KOLs, merchants and businesses with branding needs to ensure a sufficient and timely supply of quality content, promotion of products and provision of services. Such new offerings may not achieve broad user acceptance, present new and difficult technological or operational challenges and subject us to claims if the individual users and business owners are not satisfied with the quality of the content, products or services or do not have satisfactory experience in general. Also, we will need to manage our relationships with third-party service providers to ensure the efficient performance of our technology platform and continue to expand, train, manage and motivate our workforce. In addition, we will need to continue to improve our transaction processing, technological, operational and financial systems, policies, procedures and controls. All of these endeavors involve risks and will require significant management, financial and human resources. We cannot assure you that we will be able to implement our strategies successfully. If we are not able to achieve growth in our financial performance effectively, or at all, our business and prospects may be materially and adversely affected.
We have a limited history operating under our current KOL-driven, LVB-focused business model and limited history expanding our business to providing online branding solutions to businesses and may be unable to achieve or sustain growth or profitability or reasonably predict our future results.
22
Table of Contents
In 2019, we made a strategic decision to transition from our traditional e-commerce business model to our current KOL-driven, LVB-focused interactive e-commerce model. As a result, we have become more of a facilitator between merchants and KOLs rather than directly serving our users. Although connection exists between the two business models, and we have been leveraging our existing experience and expertise in transitioning to our current business model, we still have a limited history operating under our current business model. As such, it is difficult to evaluate our current business and future prospects, which may increase the risk of your investment.
In July 2021, we acquired Ruisha Technology to expand and further utilize MOGU’s merchants’ service capabilities that we have been building over the years. We expect to be able to cooperate with more brands through Ruisha Technology, enriching our platform with more fashionable and high-quality product offerings for our users. However, Ruisha Technology has a limited history operating under our current business model. We might have difficulties fully integrate Ruisha Technology’s business operation into ours in a timely and cost-efficient manner, or at all. As such, it is difficult to evaluate our current business and future prospects, which may increase the risk of your investment.
Our revenues decreased by 42.3% from RMB835.3 million in the year ended March 31, 2020 to RMB482.4 million in the year ended March 31, 2021, decreased by 30.0% from RMB482.4 million in the year ended March 31, 2021 to RMB337.5 million in the year ended March 31, 2022 and decreased by 31.2% from RMB337.5 million in the year ended March 31, 2022 to RMB232.1 million (US$33.8 million) in the year ended March 31, 2023. We incurred net losses of RMB328.0 million, RMB642.4 million and RMB186.4 million (US$27.1 million) in the years ended March 31, 2021, 2022 and 2023, respectively. The restructuring of our business mix towards a KOL-driven, LVB-focused business model has negatively affected our ability to achieve growth and profitability in the last two years, and we may not be able to generate enough revenue to achieve growth or profitability for the foreseeable future. There can be no assurance that we will be able to achieve either revenue growth or profitability under our current business model.
Any harm to our brand or failure to maintain and enhance our brand recognition may materially and adversely affect our business and results of operations.
We believe that the recognition and reputation of our brands among our users, KOLs and our merchants and brand partners are crucial to our business and competitiveness. Many factors, some of which are beyond our control, are important to maintaining and enhancing our brands and may negatively impact our brands and reputation if not properly managed. These factors include our ability to:
Our business is subject to the changing needs and preferences of our users. If we fail to anticipate buyer needs and provide products and services to attract and retain buyers, or fail to adapt our services or business model to changing buyer needs or emerging industry standards, our business may be materially and adversely affected.
The e-commerce market in which we operate as well as buyer needs and preferences are constantly evolving. As a result, we must continuously respond to changes in the market and buyer demand and preferences to remain competitive, grow our business and maintain our market position. We intend to further diversify our products and service offerings to enhance to our revenue sources in the future. New products and services, new types of buyers or new business models may involve risks and challenges we do not currently face. Any new initiatives may require us to devote significant financial and management resources and may not perform as well as expected.
Furthermore, we may have difficulty in anticipating buyer demand and preferences, and the products offered on our platforms may not be accepted by the market or be rendered obsolete or uneconomical. Therefore, any inability to adapt to these changes may result in a failure to capture new buyers or retain existing buyers, the occurrence of which would materially and adversely affect our business, financial condition and results of operations.
23
Table of Contents
In addition, to remain competitive, we must continue to enhance and improve the responsiveness, functionality and features of our platforms. The internet and e-commerce markets are characterized by rapid technological evolution, changes in buyer requirements and preferences, frequent introductions of new products, features and services embodying new technologies and the emergence of new industry standards and practices, any of which could render our existing technologies and systems obsolete. Our success will depend, in part, on our ability to identify, develop and adapt to new technologies useful in our business, and respond to technological advances and emerging industry standards and practices, in particular with respect to mobile internet, in a cost-effective and timely way. We cannot assure you that we will be successful in these efforts.
We may experience a decline in the popularity of online shopping in general, or any failure by us to adapt our platform and improve the shopping experience of our users in response to fashion trends and users’ preferences may adversely affect our business and results of operations.
We offer products and content with a primary focus on providing a superior shopping experience. Our future growth depends on our ability to continue to attract new users as well as users’ continued spending on our platform. The apparel market is cyclical and fashion trends and users’ purchasing needs and personal preferences are changing frequently. Consequently, we must stay abreast of fashion and lifestyle trends and respond to changes in the market and user preferences. Since our inception, we have been focused on developing new features and offerings on our platform to satisfy the ever-changing needs of our users. We have been actively tracking user traffic and feedback to identify trending content and encourage our KOLs to create content and our merchants to supply products that cater to users’ changing tastes. We have also been exploring new interfaces and functions of our mobile apps to prioritize fashion content offerings on our platform. However, these features and offerings are relatively new, do not have a long operating track record and may fail to be accepted by our users. They may also become obsolete or unappealing by competition or developments in the industry. The long-term viability and prospects of our business model are subject to the changing user preferences and industry standards, making it difficult to assess our future prospects or forecast our future results. Any of these changes may require us to reevaluate our business model and adopt significant changes to our strategies and business plan. If we fail to adapt to these changes, continue to expand and diversify our content and product offerings, identify trends, or maintain the quality of our content and products, our users may lose interest in our platform and thus may visit our platform less frequently or even stop visiting our platform, which in turn may materially and adversely affect our business, financial condition, and results of operations.
We face intense competition. If we do not compete successfully against existing or new competitors, we may lose market share, users, KOLs and other business partners.
We face intense competition particularly on our e-commerce, fashion content and technology elements. Our current or potential competitors include major e-commerce platforms in China as well as major traditional and brick-and-mortar retailers in China. Our competitors may have longer operating histories, greater brand recognition, larger user and merchant bases or greater financial, technical or marketing resources than we do. Competitors may leverage their brand recognition experience and resources to compete with us in a variety of ways, thereby increasing their respective market and mind shares. Some of our competitors may be able to secure more favorable terms from merchants, third-party service providers and other business partners, devote greater resources to marketing and promotional campaigns, adopt more aggressive pricing policies and devote substantially more resources to their platform and systems development than us.
There can be no assurance that we will be able to compete successfully against current or future competitors, and such competitive pressures may have a material and adverse effect on our business, financial condition and results of operations. Failure to compete successfully against existing or new competitors may cause us to lose market share, users, KOLs and other business partners. Any disputes with current or future competitors may lead us to public complaints or publicity campaigns against us, which may cause us to incur significant costs to defend against these activities and harm our business.
If we are unable to provide superior user experience, we may not be able to maintain or grow our user base or keep our users highly engaged. As a result, our revenues, margins and business prospects may be materially and adversely affected.
The success of our business largely depends on our ability to provide superior user experience in order to maintain and grow our user base and keep our users highly engaged on our platform, which in turn depends on a variety of factors. These factors include our ability to continue to offer attractive and relevant fashion content in engaging formats and stylish products, source quality merchants to respond to user demands and preferences, maintain the quality of our products and services, provide reliable and user-friendly mobile application features for our users to browse for content and products, and provide high-quality customer service. If our users are not satisfied with our content, products or services, or our platform is severely interrupted or otherwise fail to meet our users’ requests, our reputation and user loyalty could be adversely affected.
Our merchants rely on third-party delivery service providers to deliver products to our users. Interruptions to or failures in the delivery services could prevent the timely or successful delivery of products purchased on our platform. These interruptions or
24
Table of Contents
failures may be due to unforeseen events that are beyond our control or the control of third-party delivery service providers, such as inclement weather, natural disasters or labor unrest. If products on our platform are not delivered on time or are delivered in a damaged state, users may refuse to accept our products and have less confidence in our services. Any failure to provide high-quality delivery services to our users may negatively impact the shopping experience of our users, damage our reputation and cause us to lose users.
In addition, if users cannot obtain satisfactory customer services after they purchase products with us, our brand and user loyalty may be adversely affected. In addition, any negative publicity or poor feedback regarding our customer service may harm our brand and reputation and in turn cause us to lose users and market share.
As a result, if we are unable to continue to maintain our user experience and provide high-quality customer service, we may not be able to retain or attract users or keep them highly engaged with the fashion content and products we offer on our platform, which may have a material adverse effect on our business, financial condition and results of operations.
A substantial portion of our GMV and revenue is generated from a limited number of KOLs who stream on our platform. We may experience a decrease in purchases on our platform.
In the years ended March 31, 2021, 2022 and 2023, our top-10 KOLs contributed 43.7%, 57.3% and 75.7% of our total GMV, respectively. The popularity of our KOLs is a significant driver of our growth in active buyers through LVB, which in turn drives our GMV and revenue. KOLs with more fans are able to reach a wider audience when they promote or sell products on their LVB, and they also tend to attract more merchants to our platform for partnership opportunities. As of March 31, 2021, 2022 and 2023, our top-10 KOLs had 16.2%, 20.8% and 29.0% of the total number of fans of all of our KOLs, respectively.
Our concentrated active buyer acquisition from a few top-tier KOLs exposes us to risk of significant decreases in, or impediments to the growth of, our GMV and revenue if the number of fans or the popularity of any of such KOLs decreases or fails to grow. We anticipate that our top-tier KOLs will continue to contribute to the majority of our total net revenues in the near future, as it will take time for other KOLs to develop their fan base and thus our active buyer base. We cannot assure you that our top-tier KOLs will be able to retain their popularity, or our other KOLs will be able to increase their number of fans. If the popularity of our top-tier KOLs decreases and our other KOLs fail to enlarge their fan base meaningfully, it may materially and adversely affect our business, prospects, financial performance and results of operations.
If we fail to maintain and expand our relationships with content creators, in particular KOLs, or if our KOLs fail to produce popular fashion contents, or if we fail to provide online branding solutions through Ruisha Technology our revenues and results of operations will be adversely affected.
We rely on our content creators, in particular KOLs, to present popular fashion content on our platform and promote products that appeal to our existing and potential users. In addition, some of our major KOLs are also merchants on our platform and have contributed to our total GMV. We cannot assure you that we will be able to control, incentivize and retain major KOLs to provide popular fashion content and stimulate purchases on our platform. In addition, we may experience content creator attrition in the ordinary course of business resulting from several factors, such as losses to competitors and perception that our platform is ineffective as a monetization channel for content creators. If we fail to retain our major content creators or experience significant content creators attrition, or if we are unable to incubate and attract new content creators, our revenues and results of operations may be materially and adversely affected.
We and our fashion influences may terminate our cooperative relationships at any time. If any of our major KOLs decides not to continue cooperation with us, the popularity of our platform may decline and the number of our users may decrease, which could materially and adversely affect our results of operations and financial condition. In addition, we may have disputes with our KOLs with respect to their compliance with our content control policies and live video broadcast standards and the disciplinary measures that we take against them due to violation of these policies or failure to meet these standards from time to time, which may cause KOLs to be dissatisfied with our platform. If popular KOLs cease to contribute content to or curate products on our platform, or the fashion content provided by them fails to attract users, we may experience a decline in user traffic and user engagement, which may have material and adverse impact on our results of operations and financial conditions.
If we fail to observe the latest trends and timely and effectively guide our content creators, or if our content creators fail to identify fashion trends or produce popular fashion content, our users may view our platform less attractive and our financial condition and results of operations may be materially and adversely affected.
In addition, we expect to maintain and develop cooperation with our major customers and business partners by providing quality branding services through Ruisha Technology. If we fail to incorporate Ruisha Technology as part of our business and fail to
25
Table of Contents
maintain our business relationships, our major customers or business partners may terminate their cooperation with us, which could materially and adversely affect our results of operations and financial condition. In addition, Ruisha Technology might have disputes with our major customers or business partners when providing online services and curtail our ongoing business relationship with those customers.
Any compromise of the cybersecurity of our platform could materially and adversely affect our business, operations and reputation.
Our products and services involve the storage and transmission of users’ and other customers’ information, and security breaches expose us to a risk of loss of this information, litigation and potential liability. Our security measures may also be breached due to employee error, malfeasance or otherwise. Additionally, outside parties may attempt to fraudulently induce employees, users or other customers to disclose sensitive information in order to gain access to our data or our users’ or other customers’ data or accounts, or may otherwise obtain access to such data or accounts. As the techniques used to obtain unauthorized access, disable or degrade service or sabotage systems change frequently and often are not recognized until launched against a target, we may be unable to anticipate these techniques or to implement adequate preventative measures. If an actual or perceived breach of our security occurs, the market perception of the effectiveness of our security measures could be harmed, we could lose users and other customers, and may be exposed to significant legal and financial risks, including legal claims and regulatory fines and penalties. Any of these actions could have a material and adverse effect on our business, reputation and results of operations.
Any quality issues of the products offered by our merchants or brand partners or any negative publicity with respect to us, our KOLs, merchants and other partners, as well as the industry in which we operate, our business and results of operations may be materially and adversely affected.
Public perception that non-authentic, counterfeit or defective products are sold on our platform or that we or the merchants on our platform do not provide satisfactory customer services, even if meritless or unsuccessful, could damage our reputation, diminish the value of our brand, undermine the trust and credibility we have established and have a negative impact on our ability to attract new users or retain our existing users, and could divert our management’s attention and other resources from other business concerns. We may be required by laws and regulations to bear joint and several liability with merchants on our platform and other partners that we cooperate with if we are unable to provide the true names, addresses and valid contact information of such merchants or partners. We may also be required to adopt new or amend existing return and exchange policies from time to time. For example, pursuant to the amended PRC Consumer Protection Law, which became effective in March 2014, consumers are generally entitled to return products purchased from business operators over the internet within seven days upon receipt of the products. See “Item 4. Information on the Company—B. Business Overview—Regulation—Regulations on Consumer Protection.” Any significant claims against us could result in the use of funds and managerial efforts in defending them and could negatively impact on our reputation. If we are unable to maintain our reputation, enhance our brand recognition or increase positive awareness of our platform, products and services, it may be difficult to maintain and grow our user base.
In addition, adverse publicity about the industry in which we operate and the KOLs, merchants and other partners that we cooperate with could damage our reputation and brand image, undermine our users’ confidence in us and reduce the long-term demand for our content and products, even if such publicity is unfounded. As a result, we may fail to maintain and grow our user base and may experience significant declines in our revenue and user traffic from which we may not be able to recover and our business would be materially and adversely affected.
If we fail to manage and expand the relationships with merchants and brand partners on our platform, in particular the major merchants that contribute a significant portion of our GMV, or otherwise fail to cooperate with them at favorable terms, our business and growth prospects may suffer.
Our business depends on our ability to attract quality merchants and brand partners. Maintaining strong relationships with these merchants and brand partners is important to the growth of our business. We cannot assure you that our current merchants and brand partners will continue to cooperate with us on commercially attractive terms to us, or at all, after the term of the current agreements expire. If we lose any of these important merchants or brand partners, or if GMV generated from a significant merchant is substantially reduced due to, for example, increased competition, ineffectiveness of our advertisement solutions, a significant change in the business policy or operation of the relevant merchants or brand partners, any deterioration in our relationship with such merchants or brand partners, or significant delays in payments for our services, our business, financial condition and results of operations may be materially and adversely affected. Even if we maintain good relationships with our merchants and brand partners, they may be unable to remain in business due to economic conditions, labor actions, regulatory or legal decisions, natural disasters or other causes, in which event our business and results of operations may be materially and adversely affected.
26
Table of Contents
Any negative developments in our relationships with merchants and brand partners could materially and adversely affect our business and growth prospects. If we fail to attract merchants and brand partners to offer products for users on our platform due to any reason, our business and growth prospects may be materially and adversely affected.
We generate a portion of our revenues from marketing services. If we fail to attract more marketing services customers to our platform or if marketing services customers are less willing to purchase services from us, our revenues may be adversely affected.
We generate a portion of our revenues from provision of marketing services to marketing services customers, including our merchants and brand partners. Our revenues from marketing services partly depend on the continual development of the online marketing industry in China and marketing services customers’ willingness to allocate budgets to online marketing. In addition, marketing services customers that decide to market and promote online may utilize more established methods or channels, such as more established Chinese internet portals or search engines, over marketing on our platform. If any of our current marketing methods or promotion activities becomes less effective or efficient or if our marketing services are not as satisfactory as our marketing services customers expect, we may lose our existing or fail to attract new marketing services customers. As a result, our ability to increase our marketing service revenues and our margins and prospects may be materially and adversely affected. We recently embarked on a number of new business initiatives, including focusing our platform on the provision of fashion content in rich media formats and our emphasis on live video broadcasts and other engaging socially oriented sales methods. Since these business initiatives have been implemented for a limited period of time and are not yet at scale, it is difficult for us to evaluate the effect, if any, they will bring to our financial prospects. As a result, we cannot reasonably predict the future trends of our marketing service revenues, our commission revenues or our total revenues.
If we are unable to maintain low delinquency rates for the financing solutions offered on our platform, our business and results of operations may be materially and adversely affected. Further, historical delinquency rates may not be indicative of future results.
We offer Bai Fu Mei, a financing solution with flexible repayment terms, to users on our platform, through which users can easily obtain small credits for their purchases of products on our platform after going through our streamlined application process. Loans that we make to consumers through Bai Fu Mei are collateralized by the accounts receivables related to the purchased goods. We also offer advanced payment collection service to merchants by collecting service fees based on the principal, to obtain funds from sale of goods upon shipment, rather than upon delivery to customers, which shortens the cash collection cycle for merchants. In addition, we also provide loans to merchants secured by their accounts receivables from customers, which are provided through the VIEs that have factoring business qualification. We charge a service fee for the loans and the amount of which is based on the principal of the loans. The default rate for our internet financing solutions has historically been low. We may not be able to maintain low delinquency rates for the financing solutions offered on our platform, and such delinquency rates may be significantly affected by economic downturns or credit cycle associated with the volatility of general economy beyond the control of us, our users and merchants. If economic conditions deteriorate, we may face increased risk of default or delinquency of our users and merchants. If we cannot track the deterioration of the creditworthiness of our users and merchants, the criteria we use for the analysis of their credit profiles may be rendered inaccurate. As a result, we may not be able to accurately assess the credit profiles of them. Since financing solutions’ contribution to our total revenues has continued to increase over the past year, if any of the foregoing were to occur, our results of operations, financial position and liquidity would be materially and adversely affected.
Our users use third-party payment service providers to make payments on our platform. If these payment services are restricted or curtailed in any way or become unavailable to us or our users for any reason, our business may be materially and adversely affected.
Our users make payments through a variety of methods, including payment through our third-party online payment service partners, such as Wechat Pay, Alipay, LianLian Pay and China UnionPay. We may also be subject to fraud, user data leakage and other illegal activities in connection with the various payment methods we offer. In addition, our business depends on the billing, payment and escrow systems of the third-party payment service providers to maintain accurate records of payments of sales proceeds by users and collect such payments. If the quality, utility, convenience or attractiveness of these payment processing and escrow services declines, or if we have to change the pattern of using these payment services for any reason, the attractiveness of our platform could be materially and adversely affected.
Business involving online payment services is subject to a number of risks that could materially and adversely affect third-party online payment service providers’ ability to provide payment processing and escrow services to us, including:
27
Table of Contents
Certain commercial banks in China impose limits on the amounts that may be transferred by automated payment from users’ bank accounts to their linked accounts with third-party online payment services. We cannot predict whether these and any additional restrictions that could be put in place would have a material adverse effect on our platform. We may also be subject to various rules, regulations and requirements, regulatory or otherwise, governing electronic fund transfers and online payment, which could change or be reinterpreted to make it difficult or impossible for us to comply with.
In addition, we cannot assure you that we will be successful to enter into and maintain amicable relationships with online payment service providers. Identifying, negotiating and maintaining relationships with these providers require significant time and resources. They could choose to terminate their relationships with us or propose terms that we cannot accept. In addition, these service providers may not perform as expected under our agreements with them, and we may have disagreements or disputes with such payment service providers, any of which could adversely affect our brand and reputation as well as our business operations.
A strategic partner provides services to us in connection with various aspects of our operations. If such services become limited, restricted, curtailed or less effective or more expensive in any way or become unavailable to us for any reason, our business may be materially and adversely affected.
We collaborate with Tencent, one of our principal shareholders, on various aspects of our business, including Weixin Mini Program, as well as services such as payment processing, marketing and cloud technology. If services provided by Tencent to us become limited, compromised, restricted, curtailed or less effective or become more expensive or unavailable to us unexpectedly, or does not technologically compatible with the features of the platforms we operate for any reason, our business may be materially and adversely affected. Failure to maintain our relationship with Tencent could materially and adversely affect our business and results of operations. In addition, we may experience a decline in user traffic if Tencent’s platform becomes less popular, which may have a material and adverse impact on our results of operations and financial conditions.
If we are unable to conduct our brand promotion and marketing activities cost-effectively, our business, prospects, results of operations and financial condition may be materially and adversely affected.
We have incurred expenses on a variety of different marketing and brand promotion efforts designed to enhance our brand recognition and increase sales from our platform. Our marketing and promotional activities may not be well received by users and may not result in the levels of product sales that we anticipate. We incurred RMB229.8 million, RMB148.4 million and RMB67.7 million (US$9.9 million) in sales and marketing expenses in the fiscal years ended March 31, 2021, 2022 and 2023, respectively. Marketing approaches and tools in the consumer products market in China are evolving. This further requires us to enhance our marketing approaches and experiment with new marketing methods to keep pace with industry developments and user preferences, which may not be as cost-effective as our marketing activities in the past and may lead to significantly higher marketing expenses in the future. Failure to refine our existing marketing approaches or to introduce new effective marketing approaches in a cost-effective manner could reduce our market share, cause our net revenues to decline and negatively impact our margin.
We face risks related to natural disasters, health epidemics and other outbreaks, such as the COVID-19 pandemic, which could significantly affect our business, financial condition and results of operations.
In recent years, there have been outbreaks of epidemics in China and globally. Our results of operations could be adversely and materially affected to the extent COVID-19 or any other epidemic, such as H1N1 flu, H7N9 flu, Severe Acute Respiratory Syndrome or SARS, Zika virus, Ebola virus, avian flu or other infectious disease, that harms the Chinese and global economy in general and the development of e-commerce industry in China.
Beginning in 2020, COVID-19 has resulted in quarantines, travel restrictions, and temporary closure of businesses and facilities in China and worldwide. For its impact on our financial results, see “Item 5. Operating and Financial Review and Prospects –
28
Table of Contents
A. Operating Results.” China began to modify its COVID control policy at the end of 2022, and most of the travel restrictions and quarantine requirements were lifted in December 2022. However, there remains uncertainty as to the future impact of the virus. The extent to which the COVID-19 pandemic impacts our long-term results will depend on future developments which are highly uncertain, unpredictable and beyond our control, including the frequency, duration and extent of outbreaks of COVID-19, the appearance of new variants with different characteristics, the effectiveness of efforts to contain or treat cases, and future actions that may be taken in response to these developments, and measures to stimulate the general economy to improve business condition. Consequently, the COVID-19 pandemic may materially and adversely affect our business, financial condition and results of operations. We keep closely monitoring the impacts of COVID-19 pandemic on us.
We are also vulnerable to natural disasters and other calamities. Fire, floods, typhoons, earthquakes, power loss, telecommunications failures, break-ins, war, riots, terrorist attacks or similar events may give rise to server interruptions, breakdowns, system failures or internet failures, which could cause the loss or corruption of data or malfunctions of software or hardware as well as adversely affect our ability to provide our services. Various impacts arising from these or other severe conditions may cause business disruption, resulting in material, adverse impact to our financial condition and results of operations.
Any change, disruption, discontinuity in the features and functions of major social networks in China could severely limit our ability to continue growing our user base, and our business may be materially and adversely affected.
Our success depends on our ability to attract new users and retain existing users. We leverage our users’ social network to acquire and engage new users for our platform and the platforms of businesses that we provide branding services. For example, we leverage Weixin and QQ to enable users to share product information with their friends, family and other social contacts. A portion of our traffic comes from such user recommendation or product sharing features. As compared to the traffic generated through social networks such as Weixin, it is impracticable for us to accurately bifurcate and quantify other user traffic that are generated organically. Buyers’ behaviors vary in different circumstances, which can make it difficult to identify the actual source of traffic and a buyer’s path to making a purchase on our platform. The source of the traffic may involve in-app activities, as well as the tools and services on social networks and associated access points.
To the extent that we fail to leverage users’ social networks, our ability to attract or retain users may be severely harmed. If any of these social media platform changes its functions or became technically incompatible with us, or stops offering its functions or technical support to us, we may not be able to locate alternative platforms of similar scale that can provide similar functions or support on commercially reasonable terms in a timely manner, or at all. Any interruption to or discontinuation of our relationships with major social network operators may severely and negatively impact our ability to grow our user base, and any occurrence of the circumstances mentioned above may have a material adverse effect on our business, financial condition and results of operations. Furthermore, we may fail to establish or maintain relationships with additional social network operators to achieve growth of our business on economically viable terms, or at all.
Increases in labor costs and restrictions in the supply of labor in China and our inability to retain or attract talents may materially and adversely affect our business, financial condition and results of operations and cause our ADSs to be worthless.
Merchants that sold products via our platforms are based in China and relied on the supply of labor in China. With the rapid development of the Chinese economy and the development of labor laws and regulations, the cost of labor has risen and may continue to rise. Rising labor costs in China will increase costs of merchants who use our platform to sell products and may cause the third-party logistics and delivery service providers engaged by our merchants to charge higher fees for their products and services, which will restrict our merchants’ ability to offer attractive pricing for or maintain the quality of products offered on our platform, which in turn may cause us to lose users and negatively impact our margin. Our results of operations will be materially and adversely affected if the labor costs of our merchant increase. In addition, even if labor costs do not increase, our merchants may not be able to find a sufficient number of workers to produce the products that they offer.
Also, our corporate operations also rely on talents who are based in China. and if we are not able to provide satisfactory wages and benefits to talents who support the operations of our platforms, we may not be able to retain or recruit new talents to maintain our competitiveness in the market.
If we fail to obtain and maintain the licenses, permits and approvals required or applicable to our business under the complex regulatory environment for our businesses in China, our business, financial condition and results of operations may be materially and adversely affected.
As the e-commerce industry in China is still at a relatively early stage of development, new laws and regulations may be adopted from time to time to address new issues that come to the authorities’ attention. Considerable uncertainties still exist with respect to the interpretation and implementation of existing and future laws and regulations governing our business activities. For
29
Table of Contents
example, in August 2018, the SCNPC promulgated the E-Commerce Law, which became effective on January 1, 2019. The E-Commerce Law provides that e-commerce operators must obtain administrative licenses if the business activities conducted by the e-commerce operators are subject to administrative licensing requirements under applicable laws and regulations. See “Item 4. Information on the Company—B. Business Overview—Regulation—Regulations on E-commerce.” for further details. On March 15, 2021, the SAMR promulgated a revised vision of the Online Trading Measures, which became effective on May 1, 2021. The revision makes further provisions with regard to emerging models of online trading (such as online social networking and online live streaming), consumer rights protection, personal information protection, etc. However, it remains uncertain as to how the E-Commerce Law will be further interpreted and implemented. We cannot assure you that we will not be found in violation of any future laws and regulations or any of the laws and regulations currently in effect due to changes in or discrepancies with respect to the relevant authorities’ interpretation of these laws and regulations. We changed the website from mogujie.com to mogu.com. We have updated the related licenses and approvals pursuant to the relevant laws and regulations and may be required to obtain additional license or approvals, and we cannot assure you that we will be able to timely obtain or maintain all the required licenses or approvals or make all the necessary filings in the future. Advised by King & Wood Mallesons, our PRC legal counsel, we do not believe that our provision of sales promotion activities through live video broadcasts will be viewed as provision of internet audio-visual programs to the public which would require a license for providing internet audio-visual program services. We cannot assure you that the relevant PRC government authorities would agree with our conclusions. Also, we believe the provision of sales promotion activities through live video broadcasts has been a relatively minor portion of our business and is likely to be further reduced. However, if we fail to obtain or maintain any of the required licenses or approvals or make the necessary filings or fail to obtain required licenses or approvals in a timely manner, we may be subject to various penalties, such as confiscation of the net revenues that were generated through the unlicensed internet activities, the imposition of fines and the termination or restriction of our operations. Any such penalties may disrupt our business operations or materially and adversely affect our business, financial condition and results of operations.
Moreover, heightened regulatory scrutiny may lead to frequent regulatory communications, inquiries or investigations that could materially and adversely affect our business model, results of operations and prospects. For instance, since April 2021, the SAMR has required online platform operators including us to conduct self-inspections on compliance on regular basis. As of the date of this annual report, we have not been subject to any material fines or other penalties due to any material violations of applicable PRC laws or regulations. However, if the PRC government continues to tighten its regulatory framework for internet service industries in the future or requires us to adjust our existing business practices for regulatory compliance, our business, financial condition and prospects could be materially and adversely affected.
The proper functioning of our internet platform is essential to our business. Any disruption to our IT systems could materially affect our ability to maintain the satisfactory performance of our platform and deliver consistent services to our users and merchants.
The proper functioning of our internet platform is essential to our business. The satisfactory performance, reliability and availability of our IT systems are critical to our success, our ability to attract and retain users and our ability to maintain and deliver consistent services to our users and merchants. However, our technology infrastructure may fail to keep pace with increased sales on our platform, in particular with respect to our new product and service offerings, and therefore our users may experience delays as we seek to source additional capacity, which would adversely affect our results of operations as well as our reputation.
Additionally, we must continue to upgrade and improve our technology infrastructure to support our business operation. However, we cannot assure you that we will be successful in executing these system upgrades, and the failure to do so may impede our business operation. We currently use cloud services and servers operated by Tencent Cloud to store our data, to allow us to analyze a large amount of data simultaneously and to update our user database and user profiles quickly. Any interruption or delay in the functionality of Tencent Cloud may materially and adversely affect the operations of our business.
We may be unable to monitor and ensure high-quality maintenance and upgrade of our IT systems and infrastructure on a real-time basis, and users may experience service outages and delays in accessing and using our platform to place orders. In addition, we may experience surges in online traffic and orders associated with promotional activities and generally as we scale, which can put additional demand on our platform at specific times. Our technology or infrastructure may not function properly all the time. Any system interruptions caused by telecommunications failures, computer viruses, hacking or other attempts to harm our systems that result in the unavailability or slowdown of our platform or reduced order fulfillment performance could reduce the volume of products sold and the attractiveness of product offerings on our platform. Our servers may also be vulnerable to computer viruses, physical or electronic break-ins and similar disruptions, which could lead to system interruptions, website or mobile app slowdown or unavailability, delays or errors in transaction processing, loss of data or the inability to accept and fulfill buyer orders. Any of such occurrences could cause severe disruption to our daily operations. As a result, our reputation may be materially and adversely affected, our market share could decline and we could be subject to liability claims.
30
Table of Contents
Our business generates and processes a large amount of data, and we are required to comply with PRC and international laws relating to data privacy and cyber security. The improper use or disclosure of data could have a material and adverse effect on our business and prospects.
Our business generates and processes a large quantity of data. We face risks inherent in handling and protecting large volume of data. In particular, we face a number of challenges relating to data from transactions and other activities on our platform, including:
The PRC regulatory and enforcement regime with regard to data security and data protection is evolving. We may be required by Chinese governmental authorities to share personal information and data that we collect to comply with PRC laws relating to cybersecurity. All these laws and regulations may result in additional expenses to us and subject us to negative publicity which could harm our reputation and negatively affect the trading price of the ADSs. There are also uncertainties with respect to how laws and regulations may be interpreted and implemented in practice. PRC regulators have been increasingly focused on regulation in the areas of data security and data protection. For example, in August 2021, the SCNPC released the Personal Information Protection Law. The Personal Information Protection Law provides for various requirements on personal information protection, including legal bases for data collection and processing, requirements on data localization and cross-border data transfer, requirements for consent and requirements on processing of sensitive personal information. As many specific requirements of the Personal Information Protection Law remain to be clarified by the CAC, other regulatory authorities and courts in practice, we may be required to make further adjustments to our business practices to comply with the enacted form of the law. See “Item 4. Information on the Company—B. Business Overview—Regulation—Regulations on Cybersecurity and Privacy.”
Moreover, different regulatory bodies in China, including the Ministry of Industry and Information Technology, or the MIIT, the Cyberspace Administration of China, or CAC, the Ministry of Public Security and the SAMR, have enforced data privacy and protections laws and regulations with various standards and applications. These various standards in enforcing data privacy and protection laws may create difficulties in ensuring full compliance and increase our operating cost, as we need to spend time and resources to deal with various inspections for compliance. We expect that these areas will receive greater attention and focus from regulators, as well as attract continued or greater public scrutiny and attention going forward, which could increase our compliance costs and subject us to heightened risks and challenges associated with data security and protection. Although we collect personal information and data only with users’ prior consent and have adopted measures to protect the data security and minimize the risk of data loss, we cannot assure you that the measures we have taken are always sufficient and effective. In the past, we received notices from regulator authorities that identified certain compliance defects in our data privacy and protections practices, requiring us to rectify our data privacy measures but without imposing any penalty on us. We have adopted several remedial measures in response to such notices and submitted our rectification reports to the relevant governmental authorities, but we cannot guarantee that such remedial measures will not invite any further scrutiny from the relevant regulatory authorities. If we are unable to manage these risks, we could have our mobile apps be blocked or suspended and/or become subject to penalties, fines, suspension of business and revocation of required licenses, and our reputation and results of operations could be materially and adversely affected.
Cybersecurity and Data Security
PRC authorities have promulgated a number of laws and regulations relating to cybersecurity and data security in the past year. In June 2021, the SCNPC promulgated the Data Security Law, which took effect on September 1, 2021. In July 2021, the state council promulgated the Regulations on the Protection of Critical Information Infrastructure, which became effective on September 1, 2021. In December 2021, the CAC, together with other authorities, jointly promulgated the Cybersecurity Review Measures, which became effective on February 15, 2022. These laws and regulations impose cybersecurity review obligations on critical information infrastructure operators and network platform operators. Under the Regulations on the Protection of Critical Information Infrastructure, “critical information infrastructure” is defined as those network facilities or information systems that may endanger national security, people’s livelihoods and the public interest if such facilities or systems were to experience data breaches, damage, or system malfunctions. In particular, the network facilities or information systems used in certain critical industries or sectors (such as telecommunications, energy, transportation, finance, public services and national defense) are considered critical information infrastructure. Critical information infrastructure operators, as determined and notified by the applicable governing authorities, are required to undergo cybersecurity reviews if they procure network products and services which could affect the security of their information infrastructure, network or data. As of the date of this annual report, we have not received any notice that
31
Table of Contents
we are a critical information infrastructure operator by any government authority. Under the Cybersecurity Review Measures, any network platform operator that holds personal data of more than one million users must apply for a cybersecurity review before it makes any public offering on a foreign stock exchange. As these laws and regulations are relatively new, certain concepts thereunder, including the exact scope of the term “critical information infrastructure operators” and “network platform operators,” remain subject to further clarification. Therefore, it is uncertain whether we would be deemed to be a critical information infrastructure operator or a network platform operator under PRC law and become subject to the relevant PRC cybersecurity laws and regulations.
In addition to the currently effective laws and regulations described above, PRC authorities may adopt additional laws and regulations in the future that further heighten the regulation of data security. For example, in November 2021, the CAC released a consultation draft of the Regulations on Network Data Security Management, or the Draft Network Data Security Regulations, for public comment. These regulations create cybersecurity review obligations for data processors, which are broadly defined as individuals or organizations that have discretion in deciding the objectives and means of their data processing activities, such as data collection, storage, utilization, transmission, publication and deletion. In particular, pursuant to the Draft Network Data Security Regulations, a data processor must apply for cybersecurity review if, among others, it (i) seeks a public offering on a foreign stock exchange and processes the data of more than one million users, (ii) it seeks a Hong Kong listing that affects or may affect national security, or (iii) otherwise conducts data processing activities that affect or may affect national security. However, as of the date of this annual report, there have been no clarifications from the relevant authorities as to the standards for determining whether an activity is one that “affects or may affect national security.” In addition to the foregoing cybersecurity review obligations, the Draft Network Data Security Regulations also proposed to create a system of annual data security self-assessments, whereby data processors that (i) process “important data” or (ii) are listed overseas must conduct an annual data security assessment, and submit the annual assessment report to the applicable municipal cybersecurity department by the end of January in the following year. As of the date of this annual report, the Draft Network Data Security Regulations have only been released for public comment, and their respective provisions and anticipated adoption or effective date remain subject to change with substantial uncertainty. However, if such regulations were to be adopted in their current form, we would be subject to additional regulatory obligations with respect to data security, and may face challenges in addressing their requirements and amending our internal data processing policies and practices to ensure compliance therewith.
Personal Data and Privacy
The Anti-monopoly Guidelines for the Platform Economy Sector published by the Anti-monopoly Committee of the State Council, effective February 7, 2021, prohibit collection of user information through coercive means by online platforms operators.
In August 2021, the SCNPC promulgated the Personal Information Protection Law, which unified a number of hitherto separate rules with respect to personal information rights and privacy protection, and took effect on November 1, 2021. The Personal Information Protection Law strengthened the protection of personal information. As a general principle, the processing of personal data must be directly related to a specific and reasonable purpose and the related collection of personal information must be tailored to what is necessary to meet that purpose. The Personal Information Protection Law also created a number of specific requirements for the processing of personal data. For example, the law prohibits any person that processes personal data from engaging in price discrimination or otherwise applying unreasonable differential treatment to individuals based on automated analysis of collected personal information. To meet the latest regulatory requirements of the PRC authorities, we update our privacy policies from time to time and adopt technical measures to protect data and ensure that we systematically protect personal information rights. However, many of the specific requirements of the Personal Information Protection Law remain to be clarified by the CAC, other regulatory authorities, and courts in practice. We may be required to make further adjustments to our business practices to comply with personal information protection laws and regulations.
In addition, we may need to comply with increasingly complex and rigorous regulatory standards enacted to protect business and personal data in the U.S., Europe and elsewhere. For example, the European Union adopted the General Data Protection Regulation, or the GDPR, which became effective on May 25, 2018. The GDPR imposes additional obligations on companies regarding the handling of personal data and provides certain individual privacy rights to persons whose data is stored. Compliance with existing, proposed and recently enacted laws (including implementation of the privacy and process enhancements called for under GDPR) and regulations can be costly; any failure to comply with these regulatory standards could subject us to legal and reputational risks.
Orders for products we offer are made through our internet platform. In addition, online payments for our products are settled through third-party online payment services. Our merchants also share certain personal information about our users with third-party delivery service providers, such as their names, addresses, and phone numbers. In such cases, maintaining complete security for the transmission of confidential information on our platform, such as usernames, personal information and billing addresses, is essential to maintaining user confidence.
32
Table of Contents
We have adopted security policies and measures, including encryption technology, to protect our proprietary data and user information. We also maintain insurance against damages incurred by us resulting from user identity theft and subsequent fraudulent payments. However, advances in technology, the expertise of hackers, new discoveries in the field of cryptography or other events or developments could result in a compromise or breach of the technology that we use to protect confidential information. We may not be able to prevent third parties, especially hackers or other individuals or entities engaging in similar activities, from illegally obtaining such confidential or private information we hold as a result of our users’ visits on our internet platform. Such individuals or entities obtaining our users’ confidential or private information may further engage in various other illegal activities using such information. In addition, we have limited control or influence over the security policies or measures adopted by third-party providers of online payment services. The third-party delivery service providers our merchants use may also violate their confidentiality obligations and disclose or use information about our users illegally. Any negative publicity on our platform’s safety or privacy protection mechanism and policy could have a material and adverse effect on our public image and reputation. Any compromise of our information security or third-party service providers’ information security measures could have a material and adverse effect on our reputation, business, prospects, financial condition and results of operations.
In 2021, we have complied with industry standards and were subject to the terms of our own privacy policies. Compliance with any additional laws could be expensive and may place restrictions on the conduct of our business and the manner in which we interact with our customers. Any failure to comply with applicable regulations could also result in regulatory enforcement actions against us, and misuse of or failure to secure personal information could also result in violation of data privacy laws and regulations, proceedings against us by governmental authorities or other authorities, damage to our reputation and credibility and could have a negative impact on revenues and profits.
Significant capital and other resources may be required to protect against information security breaches or to alleviate problems caused by such breaches or to comply with our privacy policies or privacy-related legal obligations. The resources required may increase over time as the methods used by hackers and others engaged in online criminal activities are increasingly sophisticated and constantly evolving. Any failure or perceived failure by us to prevent information security breaches or to comply with privacy policies or privacy-related legal obligations, or any compromise of security that results in the unauthorized release or transfer of personally identifiable information or other customer data, could cause our customers to lose trust in us and could expose us to legal claims. Any perception by the public that online transactions or the privacy of user information are becoming increasingly unsafe or vulnerable to attacks could inhibit the growth of online retail and other online services generally, which may reduce the number of orders we receive.
Our reputation, business and results of operations would be adversely impacted by any counterfeit, unauthorized or infringing products sold on our platform that fail to meet the applicable legal requirements.
Merchants on our platform and our brand partners are separately responsible for sourcing their products. Although we have adopted measures to verify the authenticity of products sold on our platform and to immediately remove any counterfeit products found on our platform, these measures may not always be successful. If we were to negligently participate or assist in infringement activities associated with counterfeit goods, failed to duly verify the qualifications or the licenses of the business operators on the platforms, or failed to duly perform our safety protection obligations with respect to goods or services that are pertinent to the life and health of consumers and provided via e-commerce platforms, potential sanctions under PRC law include injunctions to cease infringing activities, rectification, compensation, administrative penalties and even criminal liability, depending on the gravity of such misconduct. See “Item 4. Information on the Company—B. Business Overview—Regulation—Regulations on Consumer Protection.” and “Item 4. Information on the Company—B. Business Overview—Regulation—Regulations on E-commerce.”
We believe our brand and reputation are extremely important to our success and our competitive position. If counterfeit products were sold on our platform or we were facing any administrative penalties against us due to products that failed to meet the applicable legal requirements, our reputation could be severely damaged, and users may choose not to spend time on our platform. As a result, our business operations and financial results may be negatively affected.
Our business and operating results may be harmed by service disruptions, cybersecurity related threats or by our failure to timely and effectively scale and adapt our existing technology and infrastructure.
We have experienced, and may in the future experience, service disruptions, outages and other performance problems due to a variety of factors, including infrastructure changes and cybersecurity related threats as follows:
33
Table of Contents
Any disruption or failure in our services and infrastructure could also hinder our ability to handle existing or increased traffic on our platform or cause us to lose content stored on our platform, which could significantly harm our business and our ability to retain existing users and attract new users.
As the number of our users increases and more content is generated on our platform, we may be required to expand and adapt our technology and infrastructure to continue to reliably store and analyze this content. It may become increasingly difficult to maintain and improve the performance of our services, especially during peak usage times, as our services become more complex and our user traffic increases. If our users are unable to access our online platform in a timely fashion, or at all, our user experience may be compromised and the users may seek other online fashion platforms to meet their needs and may not return to us or use our platform as often in the future, or at all. This would negatively impact our ability to attract users and maintain the level of user engagement.
Tightening of tax compliance efforts that affect merchants on our platform could materially and adversely affect our business, financial condition and results of operations.
E-commerce in China is still developing, and the PRC government may require internet platforms with e-commerce functions to assist in the collection of taxes with respect to the revenue or profit generated by merchants from transactions conducted on their platforms. A significant number of merchants operating businesses on our platform may not have completed the required tax registration. Pursuant to the new E-commerce Law, PRC tax authorities may enforce registration requirements that target these merchants on our platform and may request our assistance in these efforts. As a result, these merchants may be subject to more stringent tax compliance requirements and liabilities and their business on our platform could suffer or they could decide to terminate their relationship with us rather than comply with tax regulations, which could in turn negatively affect us. We may also be requested by tax authorities to supply information on our merchants, such as transaction records and bank account information, and assist in the enforcement of tax regulations, including the payment and withholding obligations against our merchants, in which case, we may lose existing merchants and potential merchants might not be willing to operate their business on our platform. Failure to comply with the requirements may result in operators of e-commerce platforms being subject to fines and, in severe circumstances, suspension of business operations of e-commerce platforms. Substantial uncertainties exist with respect to the interpretation and implementation of the E-Commerce Law. Stricter tax enforcement by the PRC tax authorities may also reduce the activities by merchants on our platform and result in liability to us. Potential heightened enforcement against merchants on our platform (including imposition of reporting or withholding obligations on operators of marketplaces with respect to value-added tax of merchants and stricter tax enforcement against merchants generally) could have a material adverse effect on our business, financial condition and results of operations.
We do not have material tangible assets and have incurred, and may in the future incur, goodwill and intangible asset impairment charges. Significant impairment of our goodwill and intangible assets could materially impact our financial position and results of our operations.
We record goodwill in connection with the excess of the purchase price over the fair value of the identifiable assets and the liabilities acquired in business combinations. Our goodwill accounted for 10.1% and 5.4% of our total assets as of March 31, 2021, and 2022, respectively, as a result of historical business combinations. As of March 31, 2023, our goodwill is nil. We are required to review our goodwill for impairment on an annual basis or more frequently if events or changes in circumstances indicate evidence of impairment. The application of a goodwill impairment test requires significant management judgment. If our estimates and judgment are inaccurate, the fair value determined could be inaccurate and the impairment may not be recognized in a timely manner. If the fair value declines, we may need to recognize goodwill impairment in the future, which could have a material adverse effect on our results of operations. As of March 31, 2023, based on our annual impairment assessment, our goodwill was fully impaired and the balance was nil.
In addition, we perform valuation of the intangible assets arising from business combination to determine the relative fair value to be assigned to each asset acquired. The intangible assets are expensed or amortized using the straight-line approach over
34
Table of Contents
the estimated economic useful lives of the assets. We had impairment of goodwill and intangible assets of nil, 235.4 million and RMB84.7 million for the years ended March 31, 2021, 2022 and 2023, respectively. For further information, see “Item 5. Operating and Financial Review and Prospects—Key Components of Results of Operations.” There can be no assurance that we will not be required to record additional impairments on goodwill and intangible assets in the future or that such impairments will not be material. As of March 31, 2022 and 2023, the market capitalization of our company was lower than the carrying value of net assets of our company. If the market capitalization of our company continues to be lower than the carrying value of net assets of our company for a prolonged period, as happened during the years ended March 31, 2022 and 2023, it may be considered as a triggering event for us to perform an interim intangible assets impairment test and we may need to recognize intangible assets impairment if the fair value is estimated to be less than their carrying amount. In addition, weaker-than-expected operating results and cash flows performance in the future or other relevant factors could be considered triggers which would require an intangible assets impairment assessment, and additional impairment charges could result and be recognized in future periods. Any significant impairment losses charged against our intangible assets could have a material adverse effect on our business, financial condition and results of operations.
We have and may continue to invest in or acquire complementary assets, technologies and businesses, and such efforts may fail and have in the past, and may continue to, result in equity or earnings dilution.
We have in the past and may continue to invest in and acquire assets, technologies and businesses that are complementary to our business. Acquired businesses or assets may not yield the results we expect. In addition, acquisitions of assets and businesses have in the past, and may continue to, result in the use of substantial amounts of cash, potentially dilutive issuances of equity securities, significant amortization expenses related to intangible assets and exposure to potential unknown liabilities of the acquired businesses or assets. For example, in July 2021, we acquired Ruisha Technology at an aggregate consideration of RMB50.0 million in cash, to expand and further utilize MOGU’s merchants’ service capabilities that we have been building over the years.
Moreover, the cost of identifying and consummating acquisitions, and integrating the acquired businesses or assets into ours, may be significant, and the integration of acquired businesses or assets may be disruptive to our business operations. In addition, we may have to obtain approval from the relevant PRC governmental authorities for the acquisitions and comply with any applicable PRC rules and regulations, which may be costly. Our financial condition and results of operations may be materially and adversely affected by our past and future acquisitions of assets or businesses.
We may be held liable for information or content displayed on, retrieved from or linked to our platform, or distributed to our users, and PRC authorities may impose legal sanctions on us, including, in serious cases, suspending or revoking the licenses necessary to operate our platform.
Our KOLs engage in sales promotion activities through our live video broadcasts and they interact and exchange information with our users and generate and distribute content. However, because a majority of the communications on our platform is conducted in real time, we are unable to verify the sources of all information posted thereon or examine the content generated by KOLs and users before they are posted. Therefore, it is possible that users may engage in illegal, obscene or incendiary conversations or activities, including the displaying or publishing of inappropriate or illegal information or content that may be deemed unlawful under PRC laws and regulations on our platform. We also allow users to upload user-generated content on our platform, which exposes us to potential disputes and liabilities in connection with third-party copyright. When users register on our platform, they agree to our standard agreement, under which they agree not to disseminate any content infringing on third-party copyright on our platform. However, if any information or content on our platform is deemed illegal, obscene or incendiary, or if appropriate licenses and third-party consents have not been obtained, claims may be brought against us for defamation, libel, negligence, copyright, patent or trademark infringement, other unlawful activities or other theories and claims based on the nature and content of the information delivered on or otherwise accessed through our platform. We also may face liability for copyright or trademark infringement, fraud, and other claims based on the nature and content of the materials that are delivered, shared or otherwise accessed through or published on our platform. Defending any such actions could be costly and involve significant time and attention of our management and other resources. In addition, online service providers, which provide storage space for users to upload works, may be held liable for copyright infringement under various circumstances pursuant to applicable PRC laws and regulations, including situations where the online service provider knows or should reasonably have known that the relevant content uploaded or linked to on its platform infringes upon the copyright of others and the online service provider profits from such infringing activities.
If we are not eligible for the safe harbor exemption, or if it is found that we have not adequately managed the information or content on our platform, we may be subject to joint infringement liability and PRC authorities may impose legal sanctions on us, including, in serious cases, suspending or revoking the licenses necessary to operate our platform.
We may need additional capital, and financing may be not available on terms acceptable to us, or at all.
35
Table of Contents
We believe our current cash and cash equivalents and short-term investments will be sufficient to meet our anticipated cash needs for the next 12 months. We may, however, require additional cash resources due to changed business conditions or other future developments, including any marketing initiatives or investments we may decide to pursue. If these resources are insufficient to satisfy our cash requirements, we may seek to obtain a credit facility or sell additional equity or debt securities. The sale of additional equity securities could result in dilution of our existing shareholders. The incurrence of indebtedness would result in increased debt service obligations and could result in operating and financing covenants that would restrict our operations. It is uncertain whether financing will be available in amounts or on terms acceptable to us, if at all.
If our existing and new financing solutions do not achieve sufficient market acceptance, our operation and financial results will be harmed.
We have devoted significant resources to market our financing solutions for our users and merchants and enhance their market awareness. We also incur expenses and expend resources upfront to develop and market new financing solutions that incorporate additional features, improve functionality or otherwise make our products more desirable to users and merchants. New financing solutions for users and merchants must achieve high levels of market acceptance in order for us to recoup our investment in developing and bringing them to market. In addition, as our financing solutions are issued with fixed interest rates, the fluctuation of interest rates may affect the demand for our products. If we fail to respond to the fluctuations in interest rates in a timely manner and adjust our financing solutions accordingly, our users and merchants may show less interest in us and seek financing options from other channels. If our existing and new financing solutions fail to attain sufficient market acceptance, our competitive position, results of operations and financial condition could be harmed.
Our results of operations may be affected by seasonality and weather conditions.
The performance of our businesses is subject to seasonal fluctuations. For example, our revenues are relatively lower during the Chinese New Year period, which is typically in the fourth quarter of our fiscal year, when users tend to do less online shopping. Also, online sales in China are significantly higher in the fourth quarter of each calendar year than in the preceding three quarters. Such sales seasonality pattern generally makes us experience the strongest sales in our third fiscal quarter ending December 31. As a significant portion of our GMV relates to the sales of apparel on our platform, changes in weather pattern may also affect users’ needs in apparel and purchasing behaviors, and further lead to fluctuations in our revenues. As a result, we believe that comparisons of our operating results and net income over any interim periods in the past may not be an accurate indicator of our future performance.
Changes in our product mix may expose us to more risks.
Since our inception, we have focused on selling fashion apparel. We have expanded the product offerings on our internet platform to include selected categories of lifestyle, healthcare and other complementary products, and we have extended our offering of products and services to business that needs branding services. Changes in our product mix involve risks and challenges different from those of our existing product categories. Our lack of familiarity with and lack of relevant customer data relating to these products may make it more difficult for us to anticipate customer demand and preferences and to inspect and control quality and ensure proper handling, storage and delivery by our merchants. Our merchants may experience higher return rates on new products, receive more customer complaints about such products and face costly claims because of selling such products, which would harm our brand and reputation as well as our financial performance. We may also be involved in disputes with the merchants in connection with these claims and complaints.
As we broaden our product offerings, we may be required to obtain additional licenses or permits for the sales of certain new product mix on our platform and subject to additional regulations by the relevant PRC government authorities. There is no assurance that we will be able to acquire additional requisite licenses or permits or to comply with the relevant legal requirements. In addition, other product categories may have lower profit margins than our existing categories of apparel, and we may need to price aggressively to gain market share or remain competitive in any new categories, which may further reduce our profit margins.
We may be subject to claims under consumer protection laws and may be subject to product liability claims if people or properties are harmed by the products sold on our platform.
Some of the products sold by the merchants on our platform or our brand partners may be defectively designed or manufactured. As a result, sales of such products could expose us to product liability claims relating to personal injury or property damage and may require product recalls or other actions. Third parties subject to such injury or damage may bring claims or legal proceedings against us as a platform service provider. If we fail to provide the real names, addresses and valid contact details of our merchants in the event that consumers ask such information for compensation from the merchants or our brand partners, the consumers may also claim damages from us, or if we know or should have known that merchants on our platform use our platform to
36
Table of Contents
infringe upon the legitimate rights and interests of consumers but we fail to take necessary measures, we shall bear joint and several liability with the merchants. See “Item 4. Information on the Company—B. Business Overview—Regulation—Regulations on Advertising.” Currently, we do not maintain third-party liability insurance or product liability insurance in relation to products offered on our platform. Any material product liability claim or litigation could materially and adversely affect our business, financial condition and results of operations. Even unsuccessful claims could result in the use of funds and managerial efforts in defending them and could negatively impact on our reputation.
In addition, the PRC government may, from time to time, promulgate new advertising laws and regulations in the future to impose further requirements on online advertising services. For example, on February 25, 2023, the SAMR promulgated the Measures for the Administration of Internet Advertisements which took effective on May 1, 2023. The Measures for the Administration of Internet Advertisements stipulates that the promotion of commodities or services in the form of paid listings on the Internet must be prominently identified as advertisements, among other heightened obligations. As these measures are enacted into law, our costs of complying with and our potential liability under the relevant laws and regulations would increase, which may have a material adverse effect on our business, financial condition and results of operations.
We may engage in acquisitions, investments or strategic alliances in the future, which could require significant management attention and materially and adversely affect our business and results of operations.
We may identify strategic partners to form strategic alliances, invest in or acquire additional assets, technologies or businesses that are complementary to our existing business. These investments may involve minority stakes in other companies, acquisitions of entire companies or acquisitions of selected assets.
Any future strategic alliances, investments or acquisitions and the subsequent integration of the new assets and businesses obtained or developed from such transactions into our own may divert management from their primary responsibilities and subject us to additional liabilities. In addition, the costs of identifying and consummating investments and acquisitions may be significant. We may also incur costs and experience uncertainties in completing necessary registrations and obtaining necessary approvals from relevant government authorities in China and elsewhere in the world. The costs and duration of integrating newly acquired assets and businesses could also materially exceed our expectations. Any such negative developments could have a material adverse effect on our business, financial condition, results of operations and cash flow.
Our business depends substantially on the continuing efforts of our management. If we lose their services, we could incur significant costs in finding suitable replacements and our business may be severely disrupted.
Our business operations depend substantially on the continuing efforts of our management. If one or more members of our management were unable or unwilling to continue their employment with us, we might not be able to replace them in a timely manner, or at all. We may incur additional expenses to recruit and retain qualified replacements. Our business may be severely disrupted and our financial condition and results of operations may be materially and adversely affected. In addition, our management may join a competitor or form a competing company. We can provide no assurance that we will be able to successfully enforce our contractual rights included in the employment agreements we have entered with our management team, particularly in China, where all these individuals reside. As a result, our business may be negatively affected due to the loss of one or more members of our management.
We rely on proper operation and maintenance of our mobile platform and internet infrastructure and telecommunications networks in China. Any deficiencies, malfunction, capacity constraint or operation interruption, any undetected programming errors or flaws or failure to maintain effective customer service could harm our reputation, impair our platform, and may have an adverse impact on our business.
Currently, a substantial majority of our sales of products are generated online through our mobile platform. Therefore, the satisfactory performance, reliability and availability of our mobile platform are critical to our success and our ability to attract and retain users. Our business depends on the performance and reliability of the internet infrastructure in China. The reliability and availability of our mobile platform depends on telecommunications carriers and other third-party providers for communications and storage capacity, including bandwidth and server storage, among other things. If we are unable to enter and renew agreements with these providers on acceptable terms, or if any of our existing agreements with such providers are terminated because of our breach or otherwise, our ability to provide our services to our users could be adversely affected. Access to internet in China is maintained through state-owned telecommunications carriers under administrative control, and we obtain access to end-user networks operated by such telecommunications carriers and internet service providers to give users access to our mobile platform. The failure of telecommunications network operators to provide us with the requisite bandwidth could also interfere with the speed and availability of our mobile platform. Service interruptions prevent users from accessing our mobile platform and placing orders, and frequent
37
Table of Contents
interruptions could frustrate users and discourage them from attempting to place orders, which could cause us to lose users and harm our operating results.
In addition, our platform and internal systems rely on software that is highly technical and complex and depend on the ability of such software to store, retrieve, process and manage immense amount of data. The software on which we rely has contained, and may now or in the future contain, undetected programming errors or flaws. Some errors may only be discovered after the code has been released for external or internal use. Errors or other design defects within the software on which we rely may result in a negative experience for users using our platform, disruptions to the operations of our merchants, delay introductions of new features or enhancements, result in errors or compromise our ability to support effective user service and enjoyable user engagement. Any errors, bugs or defects discovered in the software on which we rely could result in harm to our reputation and loss of users, which could adversely affect our business, results of operations and financial conditions.
We may be subject to intellectual property infringement claims, which may be expensive to defend and may disrupt our business and operations.
We cannot be certain that our operations or any aspects of our business do not or will not infringe upon or otherwise violate trademarks, patents, copyrights, know-how or other intellectual property rights held by third parties. We may be subject to legal proceedings and claims relating to the intellectual property rights of others. In addition, there may be other third-party intellectual property that is infringed upon by our products, services, merchants, the content displayed on our platform or other aspects of our business. There could also be existing patents or other intellectual property rights of which we are not aware that our products or content may inadvertently infringe. We cannot assure you that holders of the relevant intellectual property rights purportedly relating to some aspect of our technology platform or business, if any such holders exist, would not seek to enforce such intellectual property rights against us in China, the United States or any other jurisdictions. In addition, we strive to closely monitor the products offered on our platform, and require merchants on our platform to indemnify us for any losses we suffer or any costs that we incur in relation to the products offered by such merchants on our internet platform. However, we cannot be certain that these measures would be effective in completely preventing the infringement of trademarks, patents, copyrights, know-how or other intellectual property rights held by third parties. Further, the application and interpretation of China’s intellectual property right laws and the procedures and standards for granting trademarks, patents, copyrights, know-how or other intellectual property rights in China are still evolving and are uncertain, and we cannot assure you that PRC courts or regulatory authorities would agree with our analysis. If we are found to have violated the intellectual property rights of others, we may be subject to liability for our infringement activities or may be prohibited from using such intellectual property, and we may incur licensing fees or be forced to develop alternatives of our own. In addition, we may incur significant expenses, and may be forced to divert management’s time and other resources from our business and operations to defend against these third-party infringement claims, regardless of their merits. Successful infringement or licensing claims made against us may result in significant monetary liabilities and may materially disrupt our business and operations by restricting or prohibiting our use of the intellectual property in question.
We may not be able to prevent others from unauthorized use of our intellectual property, which could harm our business and competitive position.
We regard our trademarks, copyrights, patents, domain names, know-how, proprietary technologies, and similar intellectual property as critical to our success, and we rely on a combination of intellectual property laws and contractual arrangements, including confidentiality, invention assignment and non-compete agreements with our employees and others, to protect our proprietary rights. We are aware of certain copycat online platforms that attempt to cause confusion or diversion of traffic from us at the moment, against which we are considering initiating lawsuits, and we may continue to become an attractive target to such attacks in the future because of our brand recognition in the e-commerce industry in China. In addition, we notice that some third party is applying to register or has registered trademarks similar to ours in different classes of goods. These trademarks may have the same word element such as “蘑菇街,” “锐鲨” or “美丽说” and may potentially cause consumer confusion and compromise our reputation and brand recognition. However, we cannot be certain that these measures could be effective in defending against such copycat online platforms or third parties. Despite these measures, any of our intellectual property rights could be challenged, invalidated, circumvented or misappropriated, or such intellectual property may not be sufficient to provide us with competitive advantages. In addition, there can be no assurance that (i) our application for registration of trademarks, patents, and other intellectual property rights will be approved, (ii) any intellectual property rights will be adequately protected, or (iii) such intellectual property rights will not be challenged by third parties or found by a judicial authority to be invalid or unenforceable. Further, because of the rapid pace of technological change in our industry, parts of our business rely on technologies developed or licensed by third parties, and we may not be able to obtain or continue to obtain licenses and technologies from these third parties at all or on reasonable terms.
It is often difficult to register, maintain and enforce intellectual property rights in China. Statutory laws and regulations are subject to judicial interpretation and enforcement and may not be applied consistently due to the lack of clear guidance on statutory interpretation. Confidentiality, invention assignment and non-compete agreements may be breached by counterparties, and
38
Table of Contents
there may not be adequate remedies available to us for any such breach. Accordingly, we may not be able to effectively protect our intellectual property rights or to enforce our contractual rights in China. Policing any unauthorized use of our intellectual property is difficult and costly and the steps we take may be inadequate to prevent the infringement or misappropriation of our intellectual property. For example, third-parties may register trademarks or domain names or purchase internet search engine keywords that are similar to our trademarks, brands or websites, or misappropriate our intellectual property or data and copy our platform, all of which could cause confusion to our users, divert online customers away from our content and products and harm our reputation. In the event that we resort to litigation to enforce our intellectual property rights, such litigation could result in substantial costs and a diversion of our management and financial resources, and could put our intellectual property at risk of being invalidated or narrowed in scope. We can provide no assurance that we will prevail in such litigation, and even if we do prevail, we may not obtain a meaningful recovery. In addition, our trade secrets may be leaked or otherwise become available to, or be independently discovered by, our competitors. Any failure in maintaining, protecting or enforcing our intellectual property rights could have a material adverse effect on our business, financial condition and results of operations.
We rely on assumptions and estimates to calculate certain key operating metrics, and real or perceived inaccuracies in such metrics may harm our reputation and negatively affect our business.
The number of established LVB hosts and active buyers through LVB on our platform, as well as user time spent on our platform, are calculated using internal company data that has not been independently verified. While these numbers are based on what we believe to be reasonable calculations for the applicable periods of measurement, there are inherent challenges in measuring usage and user engagement across our large user base. We treat each device or account as a separate user for the purposes of calculating our active buyers through LVB, because it may not always be possible to identify people that use more than one device or have set up more than one account. Accordingly, the calculations of our active buyers through LVB may not accurately reflect the actual number of people using our platform.
Our measures of user growth and user engagement may differ from estimates published by third parties or from similarly titled metrics used by our competitors due to differences in methodology. If users, KOLs and merchants do not perceive our user metrics to be accurate representations of our user base or user engagement, or if we discover material inaccuracies in our user metrics, our reputation may be harmed and merchants and KOLs may be less willing to allocate their resources or spending to our platform, which could negatively affect our business and operating results.
We have granted, and may continue to grant, share options, restricted shares and other forms of share-based incentive awards, which have resulted in and may continue to result in significant share-based compensation expenses.
We adopted the Global Share Plan in 2011, which was amended in September 2016 and March 2018 and is referred to as the Plan in this annual report, for the purpose of granting share-based compensation awards to employees, directors and consultants to incentivize their performance and align their interests with ours. Under the Plan, the maximum aggregate number of shares which may be issued pursuant to all awards is 316,317,652 ordinary shares. In November 2018, our board of directors and shareholders adopted the Amended and Restated Global Share Plan, which we refer to as the Amended Plan in this annual report, to amend and restate the Plan in its entirety, which superseded all the prior versions of the Plan. As of June 30, 2023, options to purchase 5,758,327 ordinary shares as well as 72,118,800 restricted share units are issued and outstanding under the Amended Plan. See “Item 6. Directors, Senior Management and Employees—B. Compensation—Amended and Restated Global Share Plan.” We account for compensation costs for all share options using a fair value-based method and recognize expenses in our consolidated statement of operations and comprehensive loss in accordance with U.S. GAAP. We believe the granting of share-based compensation is of significant importance to our ability to attract and retain key personnel and employees, and we will continue to grant share-based compensation to employees in the future. As a result, our expenses associated with share-based compensation may increase, which may have an adverse effect on our results of operations.
If we fail to implement and maintain an effective system of internal controls over financial reporting, we may be unable to accurately report our results of operations, meet our reporting obligations or prevent fraud.
We are a public company in the United States subject to the Sarbanes-Oxley Act of 2002. Section 404 of the Sarbanes-Oxley Act of 2002, or Section 404, requires that we include a report of management on our internal control over financial reporting in our annual report on Form 20-F. Our management has concluded that we did not maintain effective internal control over financial reporting as of March 31, 2023 due to material weakness identified. See “Item 15. Controls and Procedures—Internal Control over Financial Reporting.” In addition, if we cease to be an “emerging growth company” as such term is defined in the Jumpstart Our Business Startups Act of 2012, or the JOBS Act, our independent registered public accounting firm must attest to and report on the effectiveness of our internal control over financial reporting. Our management may continue to conclude that our internal control over financial reporting is not effective. Moreover, even if our management concludes that our internal control over financial reporting is effective, our independent registered public accounting firm, after conducting its own independent testing, may issue a report that is
39
Table of Contents
qualified if it is not satisfied with our internal controls or the level at which our controls are documented, designed, operated or reviewed, or if it interprets the relevant requirements differently from us. In addition, our reporting obligations as a public company may place a significant strain on our management, operational and financial resources and systems for the foreseeable future. We may be unable to timely complete our evaluation testing and any required remediation.
During our initial public offering in 2018, we and our independent registered public accounting firm respectively identified one material weakness in our internal control over financial reporting. In accordance with reporting requirements set forth by the SEC, a “material weakness” is a deficiency, or a combination of deficiencies, in internal control over financial reporting, such that there is a reasonable possibility that a material misstatement of our company’s annual or interim consolidated financial statements will not be prevented or detected on a timely basis. The material weakness identified relates to lack of sufficient competent financial reporting and accounting personnel with appropriate understanding of U.S. GAAP to design and implement formal period-end financial reporting policies and procedures; to address complex U.S. GAAP technical accounting issues; and to prepare and review our consolidated financial statements and related disclosures in accordance with U.S. GAAP and financial reporting requirements set forth by the SEC. To remedy our identified material weakness, we have implemented and plan to implement a number of measures to address the material weakness. The measures implemented included hiring additional qualified financial and accounting staff with working experience of U.S. GAAP and SEC reporting requirements, and arranging our financial and accounting staff to attend external training courses to deepen their U.S GAAP and SEC reporting knowledge. We have also established the financial reporting policies with clear roles and responsibilities for accounting and financial reporting staff to address complex accounting and financial reporting issues. Furthermore, we will continue to further expedite and streamline our financial reporting process including: (i) establishing a comprehensive policy and procedure manual, to allow early detection, prevention and resolution of potential misstatement to the consolidated financial statements, (ii) establishing effective oversight and clarifying reporting requirements for non-recurring and complex transactions to ensure consolidated financial statements and related disclosures are accurate, complete and in accordance with U.S. GAAP and SEC reporting requirements, (iii) implementing regular and consistent U.S. GAAP accounting and financial reporting training programs for our accounting and financial reporting personnel, and (iv) enhancing our internal audit function and improve overall internal control. We also intend to continue to hire additional resources equipped with relevant U.S. GAAP and SEC reporting knowledge and experience and consider requiring financial reporting personnel to obtain US GAAP related qualifications. However, such measures have not been fully implemented and we concluded that the material weakness and deficiencies in our internal control over financial reporting have not been remediated as of March 31, 2023. See “Item 15. Controls and Procedures—Internal Control over Financial Reporting.”
During documenting and testing our internal control procedures, to satisfy the requirements of Section 404, we may identify other weaknesses and deficiencies in our internal control over financial reporting. In addition, if we fail to maintain the adequacy of our internal control over financial reporting, as these standards are modified, supplemented, or amended from time to time, we may not be able to conclude that we have effective internal control over financial reporting in accordance with Section 404. Moreover, our internal control over financial reporting may not prevent or detect all errors and all fraud. A control system, no matter how well designed and operated, can provide only reasonable, not absolute, assurance that the control system’s objectives will be met. Because of the inherent limitations in all control systems, no evaluation of controls can provide absolute assurance that misstatements due to error or fraud will not occur or that all control issues and instances of fraud will be detected.
If we fail to achieve and maintain an effective internal control environment, we could suffer material misstatements in our financial statements and fail to meet our reporting obligations, which would likely cause investors to lose confidence in our reported financial information. This could in turn limit our access to capital markets, harm our results of operations and lead to a decline in the trading price of our ADSs. Additionally, ineffective internal control over financial reporting could expose us to increased risk of fraud or misuse of corporate assets, and subject us to potential delisting from the stock exchange on which we list, regulatory investigations and civil or criminal sanctions.
We have limited insurance coverage which could expose us to significant costs and business disruption.
We believe we have obtained a prudent amount of insurance for the insurable risks relating to our business. However, there is no assurance that the insurance policies we maintain are sufficient to cover our business operations. If we were to incur substantial liabilities that were not covered by our insurance, we could incur costs and losses that could materially and adversely affect our results of operations.
Our business, financial condition and results of operations depend on the level of consumer confidence and spending in China and may be adversely affected by the downturn in the global or Chinese economy.
Our business, financial condition and results of operations are sensitive to changes in overall economic conditions that affect consumer spending in China. The retail industry, including the online retail sector, is highly sensitive to general economic changes. Online purchases tend to decline significantly during recessionary periods. Many factors outside of our control, including
40
Table of Contents
inflation and deflation, interest rates, volatility of equity and debt securities markets, taxation rates, employment and other government policies can adversely affect consumer confidence and spending.
The global macroeconomic environment is facing challenges. The growth rate of the Chinese economy has gradually slowed in recent years and the trend may continue. There is considerable uncertainty over the long-term effects of the monetary and fiscal policies adopted by the central banks and financial authorities of some of the world’s leading economies, including the United States and China. The Federal Reserve has raised interest rates in the United States. The rapid rise in interest rates in the United States during 2022 have resulted in a state of volatility and uncertainty with respect to the health of the U.S. banking system. The conflicts in Ukraine and the imposition of broad economic sanctions on Russia could raise energy prices and disrupt global markets. Unrest, terrorist threats and the potential for war in the Middle East and elsewhere may increase market volatility across the globe. There have also been concerns on the relationship among China and other countries, including the surrounding Asian countries, which may potentially have economic effects. In particular, there is significant uncertainty about the future relationship between the United States and China with respect to trade policies, treaties, government regulations and tariffs. Economic conditions in China are sensitive to global economic conditions, as well as changes in domestic economic and political policies and the expected or perceived overall economic growth rate in China. Any severe or prolonged slowdown in the global or PRC economy may materially and adversely affect our business, results of operations, and financial condition. In addition, continued turbulence in the international markets may adversely affect our ability to access capital markets to meet liquidity needs.
In addition, the domestic and international political environments, including military conflicts and political turmoil or social instability, may also adversely affect consumer confidence and reduce spending, which could in turn materially and adversely affect our business, financial condition, and results of operations.
Increasing focus with respect to environmental, social and governance matters may impose additional costs on us or expose us to additional risks.
Governments and public advocacy groups have been increasingly focused on environment, social and governance (“ESG”) issues in recent years, making our business more sensitive to ESG issues and changes in governmental policies and laws and regulations associated with environment protection and other ESG-related matters. Any ESG concern or issue could increase our regulatory compliance costs.
In particular, the PRC government and public advocacy groups have been increasingly focused on environment protection in recent years, making the apparel manufacturing and textile industries more sensitive to environmental issues and changes in environment protection laws and policies. Our results of operations and financial condition are dependent upon whether the merchants on our platform can offer quality products at attractive price, which in turn depends on the costs and supply of the key main raw materials used in producing the products. There are comprehensive environmental regulations and policies governing textile and fabric production and printing, as well as the apparel industry in general. Any environmental concern or issue could significantly increase the costs of the raw materials used in the products on our platform. If merchants on our platform lower the quality of products offered to our users due to increased costs of raw materials, fail to offer high-quality products at attractive prices, or reduce the volume of products offered on our platform, our platform may become less competitive or appealing to our users and our business and results of operations would be harmed.
Heightened regulatory and public concerns over consumer protection and consumer safety issues may also subject us to additional legal responsibilities, increased scrutiny or negative publicity over these issues. And we are more likely to subject to these additional requirements due to the large number of transactions that take place on our platform on a daily basis and the increasing scope of our overall business operations. For example, our merchants are required to adhere to national health and safety standards in terms of the products offered on our platform. Failure to meet these standards could result in fines, suspension of operations, and in more extreme cases, criminal proceedings against our company and/or our merchants, and our business, results of operations and brand image would be negatively affected. Increasing public scrutiny over us, including complaints to regulatory agencies, negative media coverage, and malicious reports, may severely damage our reputation and materially and adversely affect our business and prospects.
In addition, investor advocacy groups, certain institutional investors, investment funds, and other influential investors are also increasingly focused on ESG practices and in recent years have placed increasing importance on the implications and social cost of their investments. Regardless of the industry, increased focus from investors and governmental entities on ESG and similar matters may hinder our access to capital, as investors may decide to reallocate capital or to not commit capital as a result of their assessment of a company’s ESG practices. If we do not adapt to or comply with the evolving expectations and standards on ESG matters or are perceived to have not responded appropriately to the growing concern for ESG issues, regardless of whether there is a legal requirement to do so, we may suffer from reputational damage and face financing difficulties, and the business, financial condition, and the price of our ADSs could be materially and adversely effected.
41
Table of Contents
Risks Related to Our Corporate Structure
If the PRC government determines that the contractual arrangements constituting part of the VIE structure do not comply with PRC regulations, or if these regulations or the interpretation of existing regulations change in the future, we could be subject to severe penalties or be forced to relinquish our rights under the contractual agreements in those operations, which may cause the value of our ADSs to significantly decline or become worthless.
Foreign ownership of telecommunication businesses and certain other businesses, such as provision of internet video and online games, is subject to restrictions under current PRC laws and regulations. Specifically, foreign ownership of an internet information service provider may not exceed 50%, and the major foreign investor is required to have a record of good performance and operating experience in managing value-added telecommunications business. We are a company incorporated in the Cayman Islands. Hangzhou Shiqu is our PRC subsidiary and a wholly foreign-owned enterprise under PRC laws. To comply with PRC laws and regulations, we conduct our business in China mainly through Hangzhou Juangua and Beijing Meilishikong and their respective subsidiaries, the VIEs based on a series of contractual arrangements entered by and among Hangzhou Shiqu, the VIEs and their respective shareholders. For a description of these contractual arrangements, see “Item 4. Information on the Company—C. Organizational Structure.” As a result of these contractual arrangements, we hold a controlling financial interest in the VIEs and consolidate their financial results in our financial statements under U.S. GAAP.
In the opinion of King & Wood Mallesons, our PRC legal counsel, (i) the ownership structure of Hangzhou Shiqu and the VIEs in China does not result in any violation of PRC laws and regulations currently in effect; and (ii) the contractual arrangements between Hangzhou Shiqu, the VIEs and their respective shareholders governed by PRC law will not result in any violation of PRC laws or regulations currently in effect. However, we have been further advised by our PRC counsel that there are substantial uncertainties regarding the interpretation and application of current or future PRC laws and regulations. Thus, the PRC government may ultimately take a view contrary to the opinion of our PRC counsel. If the PRC government otherwise find that we are in violation of any existing or future PRC laws or regulations or lack the necessary permits or licenses to operate our business, the relevant governmental authorities would have broad discretion in dealing with such violation, including, without limitation:
Any of these events could cause significant disruption to our business operations and severely damage our reputation, which would in turn materially and adversely affect our business, financial condition and results of operations. If occurrences of any of these events results in our inability to direct the activities of our VIEs in China that most significantly impact their economic performance, and/or our failure to receive the economic benefits from the VIEs, we would not be able to consolidate the entities in our consolidated financial statements in accordance with U.S. GAAP. In addition, our results of operations may be materially and adversely affected, and the value of our ADSs might significantly decline or become worthless.
We rely on contractual arrangements with the VIEs and their respective shareholders for our business operations. These arrangements provide us with a controlling financial interest in these entities, which may not be as effective as direct ownership in providing operational control.
We have relied and expect to continue to rely on contractual arrangements with the VIEs and their shareholders to operate our business in China. These contractual arrangements may not be as effective as direct ownership in providing us with control (a controlling financial interest, as defined under ASC 810) over the VIEs. For example, the VIEs and their respective shareholders could breach their contractual arrangements with us by, among other things, failing to conduct their operations in an acceptable manner or taking other actions that are detrimental to our interests.
If we had direct ownership of our VIEs in China, we would be able to exercise our rights as a shareholder to effect changes in the board of directors of the VIEs, which in turn could implement changes, subject to any applicable fiduciary obligations, at the management and operational level. However, under the current contractual arrangements, we rely on the performance by the VIEs and their respective shareholders of their obligations under the contracts to operate our business and realize economic benefits.
42
Table of Contents
The shareholders of the VIEs may not act in the best interests of our company or may not perform their obligations under these contracts. Such risks exist throughout the period in which we intend to operate certain portion of our business through the contractual arrangements with the VIEs. If any dispute relating to these contracts remains unresolved, we will have to enforce our rights under these contracts through the operations of PRC law and arbitration, litigation and other legal proceedings and therefore will be subject to uncertainties in the PRC legal system. See “—Any failure by the VIEs or their shareholders to perform their obligations under our contractual arrangements with them would have a material and adverse effect on our business.” Therefore, our contractual arrangements with our VIEs may not be as effective in ensuring our control over the relevant portion of our business operations as direct ownership would be.
Any failure by the VIEs or their shareholders to perform their obligations under our contractual arrangements with them would have a material and adverse effect on our business.
If the VIEs or their shareholders fail to perform their respective obligations under the contractual arrangements, we may have to incur substantial costs and expend additional resources to enforce such arrangements. We may also have to rely on legal remedies under PRC law, including seeking specific performance or injunctive relief, and contractual remedies, which we cannot assure you will be sufficient or effective under PRC law. For example, if the shareholders of any of the VIEs were to refuse to transfer their equity interests in the VIEs to us or our designee if we exercise the purchase option pursuant to these contractual arrangements, or if they were otherwise to act in bad faith toward us, then we may have to take legal actions to compel them to perform their contractual obligations.
All the agreements under our contractual arrangements are governed by PRC law and provide for the resolution of disputes through arbitration in China. Accordingly, these contracts would be interpreted in accordance with PRC law and any disputes would be resolved in accordance with PRC legal procedures. Uncertainties in the PRC legal system could limit our ability to enforce these contractual arrangements. There are very few precedents and little formal guidance as to how contractual arrangements in the context of a VIE should be interpreted or enforced under PRC law. There remain significant uncertainties regarding the ultimate outcome of such arbitration should legal action become necessary. In addition, under PRC law, rulings by arbitrators are final, parties cannot appeal the arbitration results in courts, and if the losing parties fail to carry out the arbitration awards within a prescribed time limit, the prevailing parties may only enforce the arbitration awards in PRC courts through arbitration award recognition proceedings, which would require additional expenses and delay. In the event we are unable to enforce these contractual arrangements, or if we suffer significant delay or other obstacles in the process of enforcing these contractual arrangements, we may not be able to hold a controlling financial interest in the VIEs, and our ability to conduct our business may be negatively affected. See “—Risks Related to Doing Business in China— Rules and regulations governing the internet industry in China are relatively new and quickly evolving. The enforcement of rules and regulations in China governing the internet industry could adversely affect our results of business and financial operations and the value of our ADSs.”
The shareholders of the VIEs may have potential conflicts of interest with us, which may materially and adversely affect our business and financial condition.
The shareholders of the VIEs include Mr. Qi Chen, who is the chairman of our board of directors, and Messrs.Yibo Wei and Xuqiang Yue, who are also our shareholders. Conflicts of interest may arise between the roles of them as shareholders, directors or officers of our company and as shareholders of the VIEs. For individuals who are also our directors and officers, we rely on them to abide by the laws of the Cayman Islands, which provide that directors and officers owe fiduciary duties to our company, including duties to act in good faith and in the best interest of our company and not to use their positions for personal gain. The shareholders of the VIEs have executed powers of attorney to appoint Hangzhou Shiqu or a person designated by Hangzhou Shiqu to vote on their behalf and exercise voting rights as shareholders of the VIEs. We cannot assure you that when conflicts arise, these shareholders will act in the best interest of our company or that conflicts will be resolved in our favor. If we cannot resolve any conflicts of interest or disputes between us and these shareholders, we would have to rely on legal proceedings, which may be expensive, time-consuming and disruptive to our operations. There is also substantial uncertainty as to the outcome of any such legal proceedings.
Our ability to enforce the contractual agreements between us and the VIE’s shareholders may be subject to PRC laws and regulations.
We have relied on contractual arrangements with Hangzhou Juangua and Beijing Meilishikong and its shareholders to conduct a portion of operations in China. All of the agreements under our contractual arrangements are governed by and interpreted in accordance with PRC laws, and disputes arising from these contractual arrangements will be resolved through arbitration in China. The legal system in China is a civil law system based on written statutes. Unlike common law systems, it is a system in which decided legal cases may be cited for reference but have less precedential value. The laws, regulations, and legal requirements in China are quickly evolving and their interpretation and enforcement involve uncertainties. As a result, these uncertainties could limit our ability to enforce these contractual arrangements. Meanwhile, there are very few precedents and little formal guidance as to how contractual
43
Table of Contents
arrangements in the context of a VIE should be interpreted or enforced under PRC law. There remain significant uncertainties regarding the ultimate outcome of such arbitration should legal action become necessary. In addition, under PRC laws, rulings by arbitrators are final, parties cannot appeal the arbitration results in courts, and if the losing parties fail to carry out the arbitration awards within a prescribed time limit, the prevailing parties may only enforce the arbitration awards in the PRC courts through arbitration award recognition proceedings, which would require additional expenses and delay. If we are unable to enforce these contractual arrangements, or if we suffer significant delay or face other obstacles in the process of enforcing these contractual arrangements, we may not be able to receive economic benefits from the VIE, and our ability to conduct our business may be negatively affected. See “Risks Related to Doing Business in China— Rules and regulations governing the internet industry in China are relatively new and quickly evolving. The enforcement of rules and regulations in China governing the internet industry could adversely affect our results of business and financial operations and the value of our ADSs.”
Contractual arrangements in relation to the VIEs may be subject to scrutiny by the PRC tax authorities and they may determine that we or our VIEs are subject to additional taxes, which could negatively affect our financial condition and the value of your investment.
Under applicable PRC laws and regulations, arrangements and transactions among related parties may be subject to audit or challenge by the PRC tax authorities within ten years after the taxable year when the transactions are conducted. We could face material and adverse tax consequences if the PRC tax authorities determine that the contractual arrangements in relation to the VIEs were not entered into on an arm’s length basis in such a way as to result in an impermissible reduction in taxes under applicable PRC laws, rules and regulations, and adjust income of the VIEs in the form of a transfer pricing adjustment. A transfer pricing adjustment could, among other things, result in a reduction of expense deductions recorded by the VIEs for PRC tax purposes, which could in turn increase its tax liabilities without reducing our PRC subsidiary’s tax expenses. In addition, the PRC tax authorities may impose late payment fees and other penalties on the VIEs for the adjusted but unpaid taxes according to the applicable regulations. Our financial position could be materially and adversely affected if the VIEs’ tax liabilities increase or if it is required to pay late payment fees and other penalties.
We may lose the ability to use and enjoy assets held by the VIEs that are material to the operation of a certain portion of our business if the any of the VIEs goes bankrupt or becomes subject to a dissolution or liquidation proceeding.
As part of our contractual arrangements with the VIEs, the VIEs hold certain assets that are material to the operation of a certain portion of our business, including permits, domain names and most of our intellectual property rights. If any of the VIEs goes bankrupt and all or part of its assets become subject to liens or rights of third-party creditors, we may be unable to continue some or all of our business activities, which could materially and adversely affect our business, financial condition and results of operations. Under the contractual arrangements, the VIEs may not, in any manner, sell, transfer, mortgage or dispose of its assets or legal or beneficial interests in the business without our prior consent. If any of the VIEs undergoes a voluntary or involuntary liquidation proceeding, the independent third-party creditors may claim rights to some or all of its assets, thereby hindering our ability to operate our business, which could materially and adversely affect our business, financial condition and results of operations.
Uncertainties exist with respect to the interpretation and implementation of the newly enacted PRC Foreign Investment Law and how it may impact the viability of our current corporate structure, corporate governance and business operations.
On March 15, 2019, the National People’s Congress approved the Foreign Investment Law, which came into effect on January 1, 2020 and replace the trio of existing laws regulating foreign investment in China, namely, the Sino-foreign Equity Joint Venture Enterprise Law, the Sino-foreign Cooperative Joint Venture Enterprise Law and the Wholly Foreign-invested Enterprise Law, together with their implementation rules and ancillary regulations. The Foreign Investment Law embodies an expected PRC regulatory trend to rationalize its foreign investment regulatory regime in line with prevailing international practice and the legislative efforts to unify the corporate legal requirements for both foreign and domestic investments. However, since it is relatively new, uncertainties still exist in relation to its interpretation and implementation. The Foreign Investment Law does not touch upon the relevant concepts and regulatory regimes that were historically suggested relating to the regulating of VIE corporate structures. For instance, under the Foreign Investment Law, “foreign investment” refers to the investment activities directly or indirectly conducted by foreign individuals, enterprises or other entities in China. On December 26, 2019, the State Council issued the Implementation Regulations for the Foreign Investment Law of the People’s Republic of China, or the Implementation Regulations, which became effective on January 1, 2020. Pursuant to the Implementation Regulations, in the event of any discrepancy between the Foreign Investment law and the Implementation Regulations and relevant requirements for foreign investment promulgated prior to January 1, 2020, the Foreign Investment Law and the Implementation Regulations shall prevail. The Implementation Regulations on the Foreign Investment Law does not stipulate whether contractual arrangements should be deemed as a form of foreign investment. Though it does not explicitly classify contractual arrangements as a form of foreign investment, there is no assurance that foreign investment via contractual arrangement would not be interpreted as a type of indirect foreign investment activities under the definition in the future. In addition, the definition contains a catch-all provision which includes investments made by foreign investors through means stipulated in laws or
44
Table of Contents
administrative regulations or other methods prescribed by the State Council. Therefore, it still leaves leeway for future laws, administrative regulations or provisions promulgated by the State Council to provide for contractual arrangements as a form of foreign investment. In any of these cases, it will be uncertain whether our contractual arrangements will be deemed to be in violation of the market access requirements for foreign investment under the PRC laws and regulations. Furthermore, if future laws, administrative regulations or provisions prescribed by the State Council mandate further actions to be taken by companies with respect to existing contractual arrangements, we may face substantial uncertainties as to whether we can complete such actions in a timely manner, or at all. If the ownership structure, contractual arrangements and business of our company, our PRC subsidiaries or the VIEs are found to be in violation of any existing or future PRC laws or regulations, or if we fail to obtain or maintain any of the required permits or approvals, the relevant governmental authorities would have broad discretion in dealing with such violation, including levying fines, confiscating our income or the income of our PRC subsidiaries or the VIEs, revoking the business licenses or operating licenses of our PRC subsidiaries or the VIEs, shutting down our servers or blocking our online platform, discontinuing or placing restrictions or onerous conditions on our operations, requiring us to undergo a costly and disruptive restructuring, restricting or prohibiting our use of proceeds from our initial public offering to finance our business and operations in China, and taking other regulatory or enforcement actions that could be harmful to our business. Failure to take timely and appropriate measures to cope with any of these or similar regulatory compliance challenges could materially and adversely affect our current corporate structure, corporate governance and business operations. If any of these occurrences results in our inability to direct the activities of any of the VIEs and/or our failure to receive economic benefits from any of them, we may not be able to consolidate their results into our consolidated financial statements in accordance with U.S. GAAP.
We may rely on dividends paid by our PRC or Hong Kong subsidiaries to fund cash and financing requirements. To the extent cash is located in the PRC or Hong Kong or within a PRC or Hong Kong domiciled entity and may need to be used outside of the PRC or Hong Kong, the funds may not be available due to limitations placed on us by the PRC government. Any limitation on the ability of our PRC or Hong Kong subsidiaries to pay dividends to us could have a material adverse effect on our ability to conduct our business and to pay dividends to holders of the ADSs and our ordinary shares.
We are a holding company, and we may rely on dividends to be paid by our PRC or Hong Kong subsidiaries for our cash and financing requirements, including the funds necessary to pay dividends and other cash distributions to the holders of the ADSs and our ordinary shares and service any debt we may incur. Within our direct holding structure, the cross-border transfer of funds within our corporate group is legal and compliant with the laws and regulations of the PRC, Hong Kong and the Cayman Islands. If our PRC or Hong Kong subsidiaries incur debt on their own behalf in the future, the instruments governing the debt may restrict their ability to pay dividends or make other distributions to us.
Our PRC and Hong Kong subsidiaries are permitted under the respective laws of the PRC and Hong Kong to provide funding to us through dividends without restriction on the amount of the funds, other than as limited by the amount of their distributable earnings. However, to the extent cash is in our business in the PRC or Hong Kong, or PRC or Hong Kong entities, there is a possibility that the funds may not be available to fund our operations or for other uses outside of the PRC or Hong Kong due to interventions or the imposition of restrictions and limitations by the PRC government on the ability to transfer cash. In addition, if any of our subsidiaries incur debt on their own behalf in the future, the instruments governing such debt may restrict their ability to pay dividends to us. See “Item 3. Key Information — D. Risk Factors — Risks Related to Our Corporate Structure.”
In particular, under PRC laws and regulations, wholly foreign-owned enterprises in the PRC, such as Hangzhou Shiqu and Meilishuo Beijing, may pay dividends only out of their accumulated profits as determined in accordance with PRC accounting standards and regulations. In addition, a wholly foreign-owned enterprise is required to set aside at least 10% of its after-tax profits each year, after making up previous years’ accumulated losses, if any, to fund certain statutory reserve funds, until the aggregate amount of such a fund reaches 50% of its registered capital. At the discretion of the board of directors of the wholly foreign-owned enterprise, it may allocate a portion of its after-tax profits based on PRC accounting standards to staff welfare and bonus funds. These reserve funds and staff welfare and bonus funds are not distributable as cash dividends. Any limitation on the ability of our wholly-owned PRC or Hong Kong subsidiaries to pay dividends or make other distributions to us could materially and adversely limit our ability to grow, make investments or acquisitions that could be beneficial to our business, pay dividends, or otherwise fund and conduct our business.
During the fiscal years ended March 31, 2021, 2022 and 2023 and through the date of this annual report, neither the Company nor any of its subsidiaries has paid dividends or made distributions to U.S. investors. In the future, any cash proceeds raised from overseas financing activities may be transferred by us to our subsidiaries via capital contribution or shareholder loans, as the case may be.
45
Table of Contents
Risks Related to Doing Business in China
The Chinese government has jurisdiction to oversee and may have significant influence on our operations, and provide more stringent regulatory oversight over offerings conducted overseas and foreign investment in China-based issuers, and the PRC government’s authority in regulating our operations, our overseas offerings of securities and foreign investment in us could limit our ability or prevent us from conducting future offerings of securities to investors, which may cause the value of our securities to significantly decline or become worthless.
We conduct our business primarily in China. Our operations in China are governed by PRC laws and regulations. The PRC government has significant oversight and discretion over our business operations. The PRC government has released regulations and policies that have significantly impacted various industries in general and specific operators within such industries, and may in the future release new regulations or policies that could intervene in or influence our operations or the industry sectors in which we operate. For example, on July 6, 2021, the relevant PRC government authorities issued Opinions on Strictly Cracking Down Illegal Securities Activities in accordance with the Law. These opinions emphasized the need to strengthen the administration over illegal securities activities and the supervision on overseas listings by China-based companies and proposed to take effective measures, such as promoting the construction of relevant regulatory systems to deal with the risks and incidents faced by China-based overseas-listed companies. On December 27, 2021,the NDRC and the MOFCOM, jointly issued the Negative List (2021), which became effective on January 1, 2022. Pursuant to the Negative List (2021), if a domestic company engaging in the prohibited business stipulated in the Negative List (2021) seeks an overseas offering and listing, it shall obtain the approval from the competent governmental authorities. Although as advised by our PRC legal advisor, King & Wood Mallesons, we believe we are currently not required to obtain permission from any of the PRC central or local government and has not received any notice of denial of permission to list on the U.S. exchange, it is uncertain when and whether we will be required to obtain permission from the PRC government to list on U.S. exchanges if the relevant laws, regulations or interpretations change in the future, and even when such permission is obtained, whether it will be denied or rescinded. The PRC government may also require us to obtain new permits or approvals to continue our operations or further offer our securities to investors. If we fail to comply with these regulations, policies or requirements, it could result in a material change in our operations or the value of our ADSs to significantly decline or become worthless. Therefore, investors of our company and our business face uncertainty from potential actions taken by regulators that may affect our business.
The approval of, or report and fillings with the CSRC or other PRC government authorities may be required in connection with our offshore offerings under PRC law, and, if required, we cannot predict whether or for how long we will be able to obtain such approval or complete such filing and report process.
The Regulations on Mergers and Acquisitions of Domestic Enterprises by Foreign Investors, or the M&A Rules, adopted by six PRC regulatory agencies in 2006 and amended in 2009, requires an overseas special purpose vehicle formed for listing purposes through acquisitions of PRC domestic companies and controlled by PRC persons or entities to obtain the approval of the CSRC prior to the listing and trading of such special purpose vehicle’s securities on an overseas stock exchange. The interpretation and application of the regulations is still evolving, and our offshore offerings may ultimately require approval of the CSRC. If the CSRC approval is required, it is uncertain whether we can or how long it will take us to obtain the approval and, even if we obtain such CSRC approval, the approval could be rescinded. Any failure to obtain or delay in obtaining the CSRC approval for any of our offshore offerings, or a rescission of such approval if obtained by us, would subject us to sanctions imposed by the CSRC or other PRC regulatory authorities, which could include fines and penalties on our operations in China, restrictions or limitations on our ability to pay dividends outside of China, and other forms of sanctions that may materially and adversely affect our business, financial condition, and results of operations.
On July 6, 2021, the relevant PRC government authorities issued Opinions on Strictly Cracking Down Illegal Securities Activities in Accordance with the Law. These opinions emphasized the need to strengthen the administration over illegal securities activities and the supervision on overseas listings by China-based companies and proposed to take effective measures, such as promoting the construction of relevant regulatory systems to deal with the risks and incidents faced by China-based overseas-listed companies. As a follow-up, on December 24, 2021, the CSRC issued a draft of the Provisions of the State Council on the Administration of Overseas Securities Offering and Listing by Domestic Companies, and a draft of Administrative Measures for the Filing of Overseas Securities Offering and Listing by Domestic Companies for public comments. On February 17, 2023, the CSRC issued the Filing Measures, which became effective on March 31, 2023. The Filing Measures establish a new filing-based regime to regulate overseas offerings and listings by domestic companies. Specifically, an overseas offering and listing by a PRC company, whether directly or indirectly, an initial or follow-on offering, must be filed with the CSRC. The examination and determination of an indirect offering and listing will be conducted on a substance-over-form basis, and an offering and listing shall be deemed as a PRC company’s indirect overseas offering and listing if the issuer meets the following conditions: (i) any of the operating income, gross profit, total assets, or net assets of the PRC enterprise in the most recent fiscal year was more than 50% of the relevant line item in the issuer’s audited consolidated financial statement for that year; and (ii) senior management personnel responsible for business operations and management are mostly PRC citizens or are ordinarily resident in the PRC, and the principal place of business is in the PRC or carried out in the PRC. The issuer or its affiliated PRC entity, as the case may be, shall file with the CSRC for its initial public
46
Table of Contents
offering, follow-on offering and other equivalent offing activities. Particularly, the issuer shall submit the filing with respect to its initial public offering and listing within three business days after its initial filing of the listing application, and submit the filing with respect to its follow-on offering within three business days after the completion of the follow-on offering. Failure to comply with the filing requirements may result in fines to the relevant PRC companies, suspension of their businesses, revocation of their business licenses and operation permits and fines on the controlling shareholder and other responsible persons. The Filing Measures also set forth certain regulatory red lines for overseas offerings and listings by PRC enterprises. On February 24, 2023, the CSRC promulgated the Provisions on Strengthening the Confidentiality and Archives Administration related to the Overseas Securities Offering and Listing by Domestic Enterprises, or the Confidentiality Provisions, according to which, a domestic company that plans to, either directly or through its overseas listed entity, publicly disclose or provide to relevant entities or individuals including securities companies, securities service providers, and overseas regulators, documents and materials that contain state secrets or government work secrets, shall first obtain approval from competent authorities according to law, and file with the secrecy administrative department at the same level. A domestic company that plans to, either directly or through its overseas listed entity, publicly disclose or provide to relevant entities or individuals including securities companies, securities service providers, and overseas regulators, other documents and materials that, if divulged, will jeopardize national security or public interest, shall strictly fulfill relevant procedures stipulated by applicable national regulations.
These measures or provisions to regulate direct or indirect overseas offering and listing may be further amended, revised or updated. The Filling Measures do not provide for detailed requirements of the substance and form of the filing documents. The Confidentiality Provisions do not provide for a narrowly defined scope of government work secrets or the documents and materials that, if divulged, will jeopardize national security or public interest, and the PRC government authorities may have wide discretion in the interpretation and enforcement of the applicable laws. Given the evolving nature of the CSRC filing requirements at this stage, we cannot assure you that we will be able to complete the filings and fully comply with the relevant new rules on a timely basis, if at all.
On December 27, 2021, the NDRC and the MOFCOM, jointly issued the Negative List (2021), which became effective on January 1, 2022. Pursuant to the Negative List (2021), if a domestic company engaging in the prohibited business stipulated in the Negative List (2021) seeks an overseas offering and listing, it shall obtain the approval from the competent governmental authorities. Besides, the foreign investors of the company shall not be involved in the company’s operation and management, and their shareholding percentages shall be subject, mutatis mutandis, to the relevant regulations on the domestic securities investments by foreign investors. At a press conference held on January 18, 2022, the NDRC clarified that the requirement as mentioned above would only apply to domestic company’s direct overseas offerings; as for the domestic company to list overseas indirectly, the CSRC is seeking public comments on the relevant regulations. As the Negative List (2021) is relatively new, there remain substantial uncertainties as to the interpretation and implementation of these new requirements, and it is unclear as to whether and to what extent listed companies like us will be subject to these new requirements. If we are required to comply with these requirements and fail to do so on a timely basis, if at all, our business operation, financial conditions and business prospect may be adversely and materially affected.
In addition, we cannot assure you that any new rules or regulations promulgated in the future will not impose additional requirements on us. If it is determined in the future that approval and filing from the CSRC or other regulatory authorities or other procedures are required for our offshore offerings, it is uncertain whether we can or how long it will take us to obtain such approval or complete such filing procedures and any such approval or filing could be rescinded or rejected. Any failure to obtain or delay in obtaining such approval or completing such filing procedures for our offshore offerings, or a rescission of any such approval or filing if obtained by us, would subject us to sanctions by the CSRC or other PRC regulatory authorities for failure to seek CSRC approval or filing or other government authorization for our offshore offerings. These regulatory authorities may impose fines and penalties on our operations in China, limit our ability to pay dividends outside of China, limit our operating privileges in China, delay or restrict the repatriation of the proceeds from our offshore offerings into China or take other actions that could materially and adversely affect our business, financial condition, results of operations, and prospects, as well as the trading price of our listed securities. The CSRC or other PRC regulatory authorities also may take actions requiring us, or making it advisable for us, to halt our offshore offerings before settlement and delivery of the shares offered. Consequently, if investors engage in market trading or other activities in anticipation of and prior to settlement and delivery, they do so at the risk that settlement and delivery may not occur. In addition, if the CSRC or other regulatory authorities later promulgate new rules or explanations requiring that we obtain their approvals or accomplish the required filing or other regulatory procedures for our prior offshore offerings, we may be unable to obtain a waiver of such approval requirements, if and when procedures are established to obtain such a waiver. Any uncertainties or negative publicity regarding such approval requirement could materially and adversely affect our business, prospects, financial condition, reputation, and the trading price of our listed securities.
Litigation and negative publicity surrounding China-based companies listed in the U.S. may result in increased regulatory scrutiny of us and negatively impact the trading price of the ADSs and could have a material adverse effect upon our business, including our results of operations, financial condition, cash flows and prospects.
47
Table of Contents
We believe that litigation and negative publicity surrounding companies with operations in China that are listed in the U.S. have negatively impacted stock prices for such companies. Various equity-based research organizations have published reports on China-based companies after examining, among other things, their corporate governance practices, related party transactions, sales practices and financial statements that have led to special investigations and stock suspensions on national exchanges. Any similar scrutiny of us, regardless of its lack of merit, could result in a diversion of management resources and energy, potential costs to defend ourselves against rumors, decreases and volatility in the ADS trading price, and increased directors and officers insurance premiums and could have a material adverse effect upon our business, including our results of operations, financial condition, cash flows and prospects.
Changes in China’s political, economic or social conditions or government policies could have a material adverse effect on our business and operations.
Our revenues are all generated from our operations in China. Accordingly, our business, financial condition, results of operations and prospects may be influenced to a significant degree by political, economic and social conditions in China generally. The Chinese economy differs from the economies of other countries in many respects, including the level of government involvement, level of development, growth rate, control of foreign exchange and allocation of resources. The Chinese government continues to play a significant role in regulating industry development by imposing industrial policies.
The Chinese government also oversights China’s economic growth through allocating resources, controlling payment of foreign currency-denominated obligations, setting monetary policy, and providing preferential treatment to particular industries or companies.
While the Chinese economy has experienced significant growth over the past decades, the rate of growth has been slowing since 2012, and the impact of COVID-19 on the Chinese economy in 2020 was severe. According to the National Bureau of Statistics of China, China’s real GDP growth rate was approximately 2.3%, 8.1% and 3.0% in 2020, 2021 and 2022, respectively. Any adverse changes in economic conditions in China, in the policies of the Chinese government or in the laws and regulations in China could have a material adverse effect on the overall economic growth of China. Such developments could adversely affect our business and operating results, lead to reduction in demand for our products and services and adversely affect our competitive position. Any disruptions or continuing or worsening slowdown could significantly reduce domestic commerce activities in China, which could lead to significant reduction in demand for and spending on the products and services we offer. An economic downturn, whether actual or perceived, a further decrease in economic growth rates or an otherwise uncertain economic outlook in China could have a material adverse effect on business and consumer spending and, as a result, adversely affect our business, financial condition and results of operations. The Chinese government has implemented various measures to encourage economic growth and guide the allocation of resources. Some of these measures may benefit the overall Chinese economy, but may have a negative effect on us. For example, our financial condition and results of operations may be adversely affected by government control over capital investments or changes in tax regulations.
In addition, because we hold a significant amount of cash and cash equivalents and short-term investments, if financial institutions and issuers of financial instruments that we hold become insolvent or if the market for these financial instruments become illiquid as a result of a severe economic downturn, our business and financial condition could be materially and adversely affected.
Rules and regulations governing the internet industry in China are relatively new and quickly evolving. The enforcement of rules and regulations in China governing the internet industry could adversely affect our results of business and financial operations and the value of our ADSs.
The PRC legal system is evolving rapidly, and the interpretations of many laws, regulations and rules may contain inconsistencies and enforcement of these laws, regulations and rules involves uncertainties.
From time to time, we may have to resort to administrative and court proceedings to enforce our legal rights. However, since PRC judicial and administrative authorities have significant discretion in interpreting and implementing statutory and contractual terms, it may be difficult to predict the outcome of a judicial or administrative proceeding. Furthermore, the PRC legal system is based, in part, on government policies and internal rules. As a result, we may not always be aware of any potential violation of these policies and rules. Such unpredictability towards our contractual, property (including intellectual property) and procedural rights could adversely affect our business and impede our ability to continue our operations. See “Item 3. Key Information—D. Risk Factors—Risks Related to Our Corporate Structure—Our ability to enforce the contractual agreements between us and the VIE’s shareholders may be subject to PRC laws and regulations.”
48
Table of Contents
We may be adversely affected by the complexity, uncertainties and changes in PRC regulation of internet-related businesses and companies, and any lack of requisite approvals, licenses or permits applicable to our business may have a material adverse effect on our business and results of operations.
The PRC government extensively regulates the internet industry, including foreign ownership of, and the licensing and permit requirements pertaining to, companies in the internet industry. These internet-related laws and regulations are relatively new and evolving. As a result, in certain circumstances it may be difficult to determine what actions or omissions may be deemed to be in violation of applicable laws and regulations.
We only have contractual control over our mobile app. We do not directly own the mobile app due to the restrictions on foreign investment in businesses providing value-added telecommunications services in China, including e-commerce services and internet content-related services. This may significantly disrupt our business, subject us to sanctions, compromise enforceability of related contractual arrangements, or have other harmful effects on us.
The evolving PRC regulatory system for the internet industry may lead to the establishment of new regulatory agencies. For example, in May 2011, the State Council announced the establishment of the State Internet Information Office (with the involvement of the State Council Information Office, the MIIT and the MPS). The primary role of the State Internet Information Office is to facilitate the policy-making and legislative development in this field, to direct and coordinate with the relevant departments in connection with online content administration and to deal with cross-ministry regulatory matters in relation to the internet industry.
The Circular on Strengthening the Administration of Foreign Investment in and Operation of Value-added Telecommunications Business, issued by the MIIT in July 2006, prohibits domestic telecommunications service providers from leasing, transferring or selling VATS Licenses to any foreign investor in any form, or providing any resources, sites or facilities to any foreign investor for their illegal operation of a telecommunications business in China. According to this circular, either the holder of a value-added telecommunications services operation permit or its shareholders must directly own the domain names and trademarks used by such license holders in their provision of value-added telecommunications services. The circular also requires each license holder to have the necessary facilities, including servers, for its approved business operations and to maintain such facilities in the regions covered by its license. Hangzhou Shiqu and Hangzhou Juangua owns the relevant domain names and trademarks in connection with our online platform and has the necessary personnel to operate our online platform.
The interpretation and application of the evolving PRC laws, regulations and policies relating to the internet industry have created uncertainties regarding the legality of existing and future foreign investments in, and the businesses and activities of, internet businesses in China, including our business. We cannot assure you that we have obtained all the permits or licenses required for conducting our business in China or will be able to maintain our existing licenses or obtain new ones. If the PRC government considers that we were operating without the proper approvals, licenses or permits or promulgates new laws and regulations that require additional approvals or licenses or imposes additional restrictions on the operation of any part of our business, it has the power, among other things, to levy fines, confiscate our income, revoke our business licenses, and require us to discontinue our relevant business or impose restrictions on the affected portion of our business. Any of these actions by the PRC government may have a material adverse effect on our business and results of operations.
Fluctuations in exchange rates could have a material and adverse effect on our results of operations and the value of your investment.
The conversion of Renminbi into foreign currencies, including U.S. dollars, is based on rates set by the People’s Bank of China. The Renminbi has fluctuated against the U.S. dollar, at times significantly and unpredictably. The value of Renminbi against the U.S. dollar and other currencies is affected by changes in China’s political and economic conditions and by China’s foreign exchange policies, among other things. We cannot assure you that Renminbi will not appreciate or depreciate significantly in value against the U.S. dollar in the future. It is difficult to predict how market forces or PRC or U.S. government policy may impact the exchange rate between Renminbi and the U.S. dollar in the future.
Any significant appreciation or depreciation of Renminbi may materially and adversely affect our revenues, earnings and financial position, and the value of, and any dividends payable on, our ADSs in U.S. dollars. For example, to the extent that we need to convert U.S. dollars we receive from our initial public offering into Renminbi for our operations, appreciation of the Renminbi against the U.S. dollar would have an adverse effect on the Renminbi amount we would receive from the conversion. Conversely, if we decide to convert our Renminbi into U.S. dollars for the purpose of making payments for dividends on our ordinary shares or ADSs or for other business purposes, appreciation of the U.S. dollar against the Renminbi would have a negative effect on the U.S. dollar amount available to us.
49
Table of Contents
Very limited hedging options are available in China to reduce our exposure to exchange rate fluctuations. To date, we have not entered into any hedging transactions in an effort to reduce our exposure to foreign currency exchange risk. While we may decide to enter hedging transactions in the future, the availability and effectiveness of these hedges may be limited and we may not be able to adequately hedge our exposure or at all. In addition, our currency exchange losses may be magnified by PRC exchange control regulations that restrict our ability to convert Renminbi into foreign currency. As a result, fluctuations in exchange rates may have a material adverse effect on your investment.
Governmental control of currency conversion may limit our ability to utilize our revenues effectively and affect the value of your investment.
The PRC government imposes controls on the convertibility of the Renminbi into foreign currencies and, in certain cases, the remittance of currency out of China. We receive substantially all of our revenues in Renminbi. Under our current corporate structure, our Cayman Islands holding company may rely on dividend payments from our PRC subsidiaries to fund any cash and financing requirements we may have. Under existing PRC foreign exchange regulations, payments of current account items, including profit distributions, interest payments and trade and service-related foreign exchange transactions, can be made in foreign currencies without prior approval of SAFE by complying with certain procedural requirements. Specifically, under the existing exchange restrictions, without prior approval of SAFE, cash generated from the operations of our PRC subsidiaries in China may be used to pay dividends to our company. However, approval from or registration with appropriate government authorities is required where Renminbi is to be converted into foreign currency and remitted out of China to pay capital expenses such as the repayment of loans denominated in foreign currencies. As a result, we need to obtain SAFE approval to use cash generated from the operations of our PRC subsidiaries and VIEs to pay off their respective debt in a currency other than Renminbi owed to entities outside China, or to make other capital expenditure payments outside China in a currency other than Renminbi.
In recent years, the PRC government imposed more restrictive foreign exchange policies and stepped up scrutiny of major outbound capital movement including overseas direct investment. More restrictions and substantial vetting process are put in place by SAFE to regulate cross-border transactions falling under the capital account. If any of our shareholders regulated by such policies fails to satisfy the applicable overseas direct investment filing or approval requirement timely or at all, it may be subject to penalties from the relevant PRC authorities. The PRC government may at its discretion further restrict access in the future to foreign currencies for current account transactions. If the foreign exchange control system prevents us from obtaining sufficient foreign currencies to satisfy our foreign currency demands, we may not be able to pay dividends in foreign currencies to our shareholders, including holders of our ADSs.
The M&A Rules and certain other PRC regulations establish complex procedures for some acquisitions of Chinese companies by foreign investors, which could make it more difficult for us to pursue growth through acquisitions in China.
The Regulations on Mergers and Acquisitions of Domestic Companies by Foreign Investors, or the M&A Rules, adopted by six PRC regulatory agencies in 2006 and amended in 2009, and some other regulations and rules concerning mergers and acquisitions established additional procedures and requirements that could make merger and acquisition activities by foreign investors more time consuming and complex, including requirements in some instances that the anti-monopoly law enforcement agency be notified in advance of any change-of-control transaction in which a foreign investor takes control of a PRC domestic enterprise. Moreover, the Anti-Monopoly Law requires that the anti-monopoly law enforcement agency shall be notified in advance of any concentration of undertaking if certain thresholds are triggered. In addition, the security review rules issued by the Ministry of Commerce, or the MOFCOM, that became effective in September 2011 specify that mergers and acquisitions by foreign investors that raise “national defense and security” concerns and mergers and acquisitions through which foreign investors may acquire de facto control over domestic enterprises that raise “national security” concerns are subject to strict review by the MOFCOM, and the rules prohibit any activities attempting to bypass a security review, including by structuring the transaction through a proxy or contractual control arrangement. In the future, we may grow our business by acquiring complementary businesses. Complying with the requirements of the above-mentioned regulations and other relevant rules to complete such transactions could be time consuming, and any required approval processes, including obtaining approval from the MOFCOM or its local counterpart or anti-monopoly law enforcement agency may delay or inhibit our ability to complete such transactions, which could affect our ability to expand our business or maintain our market share.
PRC regulation of loans to and direct investment in PRC entities by offshore holding companies and governmental control of currency conversion may delay or prevent us from using the proceeds of our initial public offering to make loans to or make additional capital contributions to our PRC subsidiaries and VIEs, which could materially and adversely affect our liquidity and our ability to fund and expand our business.
We are an offshore holding company conducting our operations in China through our PRC subsidiaries, VIEs and their subsidiaries. We may make loans to our PRC subsidiaries, VIEs and their subsidiaries, or we may make additional capital
50
Table of Contents
contributions to our PRC subsidiaries, or we may establish new PRC subsidiaries and make capital contributions to these new PRC subsidiaries, or we may acquire offshore entities with business operations in China in an offshore transaction.
Most of these ways are subject to PRC regulations and approvals. For example, loans by us to our wholly owned PRC subsidiaries to finance their activities cannot exceed statutory limits and must be registered with the local counterpart of the State Administration of Foreign Exchange, or SAFE. If we decide to finance our wholly owned PRC subsidiaries by means of capital contributions, these capital contributions are subject to the requirement of making necessary filings in the Foreign Investment Comprehensive Management Information System and registration with other governmental authorities in China. Any foreign loan procured by our PRC subsidiaries is required to be registered or filed with SAFE or its local branches or satisfy relevant requirements as provided in SAFE Circular 28. Any medium or long-term loan to be provided by us to the VIEs must be registered with the National Development and Reform Commission and SAFE or its local branches. We may not be able to obtain these government approvals or complete such registrations on a timely basis, if at all, with respect to future capital contributions or foreign loans by us to our PRC subsidiaries. If we fail to receive such approvals or complete such registration or filing, our ability to use the proceeds of our initial public offering and to capitalize our PRC operations may be negatively affected, which could adversely affect our liquidity and our ability to fund and expand our business. Due to the restrictions imposed on loans in foreign currencies extended to any PRC domestic companies, we are not likely to make such loans to the VIEs, which are PRC domestic companies.
Further, we are prohibited from financing the activities of the VIEs by means of capital contributions due to regulatory restrictions relating to foreign investment in PRC domestic enterprises engaged in internet information services, online games, online audio-visual program services and related businesses. See “Item 3 Key Information – Transfers of Cash within the Group.”
SAFE promulgated Circular on the Reforming of the Management Method of the Settlement of Foreign Currency Capital of Foreign-invested Enterprises, or SAFE Circular 19, effective June 2015, in replacement of the Circular on the Relevant Issues Concerning the Launch of Reforming Trial of the Administration Model of the Settlement of Foreign Currency Capital of Foreign-Invested Enterprises, the Notice from the State Administration of Foreign Exchange on Relevant Issues Concerning Strengthening the Administration of Foreign Exchange Businesses, and the Circular on Further Clarification and Regulation of the Issues Concerning the Administration of Certain Capital Account Foreign Exchange Businesses. According to SAFE Circular 19, the flow and use of the RMB capital converted from foreign currency-denominated registered capital of a foreign-invested company is regulated such that RMB capital may not be used for the issuance of RMB entrusted loans, the repayment of inter-enterprise loans or the repayment of banks loans that have been transferred to a third party. Although SAFE Circular 19 allows RMB capital converted from foreign currency-denominated registered capital of a foreign-invested enterprise to be used for equity investments within China, it also reiterates the principle that RMB capital converted from the foreign currency-denominated capital of a foreign-invested company may not be directly or indirectly used for purposes beyond its business scope. Thus, it is unclear whether SAFE will permit such capital to be used for equity investments in China in actual practice. SAFE promulgated the Notice of the State Administration of Foreign Exchange on Reforming and Standardizing the Foreign Exchange Settlement Management Policy of Capital Account, or SAFE Circular 16, effective on June 9, 2016, which reiterates some of the rules set forth in SAFE Circular 19, but changes the prohibition against using RMB capital converted from foreign currency-denominated registered capital of a foreign-invested company to issue RMB entrusted loans to a prohibition against using such capital to issue loans to non-associated enterprises. Violations of SAFE Circular 19 and SAFE Circular 16 could result in administrative penalties. SAFE Circular 19 and SAFE Circular 16 may significantly limit our ability to transfer any foreign currency we hold, including the net proceeds from our initial public offering, to our PRC subsidiaries, which may adversely affect our liquidity and our ability to fund and expand our business in China. On October 23, 2019, SAFE promulgated the Notice of the Administration of Foreign Exchange on Further Promoting the Convenience of Cross-Border Trade and Investment, or SAFE Circular 28, which, among other things, stipulates that non-investment foreign-invested entities may use foreign exchange capital or Renminbi funds converted from the foreign exchange capital to make domestic equity investments, provided that such investments should comply with the Negative List and other relevant PRC laws and regulations. Even though SAFE Circular 28 allows all foreign-invested enterprises (including those without an investment business scope) to utilize and convert their foreign exchange capital for making equity investment in China if certain requirements prescribed therein are satisfied, since it is relatively new, uncertainties still exist in relation to its interpretation and implementation.
In light of the various requirements imposed by PRC regulations on loans to and direct investment in PRC entities by offshore holding companies, we cannot assure you that we will be able to complete the necessary government registrations or obtain the necessary government approvals on a timely basis, if at all, with respect to future loans by us to our PRC subsidiary or with respect to future capital contributions by us to our PRC subsidiary. If we fail to complete such registrations or obtain such approvals, our ability to use the proceeds we received from our initial public offering and to capitalize or otherwise fund our PRC operations may be negatively affected, which could materially and adversely affect our liquidity and our ability to fund and expand our business.
PRC regulations relating to the establishment of offshore special purpose companies by PRC residents may subject our PRC resident beneficial owners or our PRC subsidiaries to liability or penalties, limit our ability to inject capital into our PRC
51
Table of Contents
subsidiaries, limit our PRC subsidiaries’ ability to increase their registered capital or distribute profits to us, or may otherwise adversely affect us.
The SAFE promulgated the Circular on Relevant Issues Relating to Domestic Resident’s Investment and Financing and Round-Trip Investment through Special Purpose Vehicles, or SAFE Circular 37, in July 2014 that requires PRC residents or entities to register with SAFE or its local branch in connection with their establishment or control of an offshore entity established for the purpose of overseas investment or financing with such PRC residents or entities’ legally owned assets or equity interests in domestic enterprises or offshore assets or interests. On February 13, 2015, SAFE issued SAFE Circular No. 13, which took effect on June 1, 2015, pursuant to which, the power to accept SAFE registration was delegated from local SAFE to local qualified banks where the assets or interest in the domestic entity was located.
SAFE Circular 37 is issued to replace the Notice on Relevant Issues Concerning Foreign Exchange Administration for PRC Residents Engaging in Financing and Roundtrip Investments via Overseas Special Purpose Vehicles, or SAFE Circular 75.
If our shareholders who are PRC residents or entities do not complete their registration with the local SAFE branches, our PRC subsidiaries may be prohibited from distributing their profits and proceeds from any reduction in capital, share transfer or liquidation to us, and we may be restricted in our ability to contribute additional capital to our PRC subsidiaries. Moreover, failure to comply with the SAFE registration described above could result in liability under PRC laws for evasion of applicable foreign exchange restrictions.
We have used our best efforts to notify PRC residents or entities who directly or indirectly hold shares in our Cayman Islands holding company and who are known to us as being PRC residents to complete the foreign exchange registrations. However, we may not be informed of the identities of all the PRC residents or entities holding direct or indirect interest in our company, nor can we compel our beneficial owners to comply with SAFE registration requirements. We cannot assure you that all shareholders or beneficial owners of ours who are PRC residents or entities have complied with, and will in the future make, obtain or update any applicable registrations or approvals required by, SAFE regulations. Failure by such shareholders or beneficial owners to comply with SAFE regulations, or failure by us to amend the foreign exchange registrations of our PRC subsidiaries, could subject us to fines or legal sanctions, restrict our overseas or cross-border investment activities, limit our PRC subsidiaries’ ability to make distributions or pay dividends to us or affect our ownership structure, which could adversely affect our business and prospects.
Failure to comply with PRC regulations regarding the registration requirements for employee stock ownership plans or share option plans may subject the PRC plan participants or us to fines and other legal or administrative sanctions.
Pursuant to SAFE Circular 37, PRC residents who participate in share incentive plans in overseas non-publicly-listed companies due to their position as director, senior management or employees of the PRC subsidiaries of the overseas companies may submit applications to SAFE or its local branches for the foreign exchange registration with respect to offshore special purpose companies. Our directors, executive officers and other employees who are PRC residents and who have been granted share-based awards may follow SAFE Circular 37 to apply for the foreign exchange registration before our company becomes an overseas listed company. In February 2012, SAFE promulgated the Notices on Issues Concerning the Foreign Exchange Administration for Domestic Individuals Participating in Stock Incentive Plans of Overseas Publicly-Listed Company, or SAFE Circular 7. Under SAFE Circular 7 and other relevant rules and regulations, PRC residents who participate in stock incentive plan in an overseas publicly-listed company are required to register with SAFE or its local branches and complete certain other procedures. Participants of a stock incentive plan who are PRC residents must retain a qualified PRC agent, which could be a PRC subsidiary of such overseas publicly listed company or another qualified institution selected by such PRC subsidiary, to conduct the SAFE registration and other procedures with respect to the stock incentive plan on behalf of its participants. Such participants must also retain an overseas entrusted institution to handle matters in connection with their exercise of share-based awards, the purchase and sale of corresponding shares or interests and fund transfers. In addition, the PRC agent is required to amend the SAFE registration with respect to the stock incentive plan if there is any material change to the stock incentive plan, the PRC agent or the overseas entrusted institution or other material changes. We and our PRC employees who have been granted share-based awards are subject to SAFE Circular 7 and other relevant rules and regulations these regulations. Failure of our PRC share-based award holders to complete their SAFE registrations may subject these PRC residents to fines and legal sanctions and may also limit our ability to contribute additional capital into our PRC subsidiary, limit our PRC subsidiary’s ability to distribute dividends to us, or otherwise materially adversely affect our business.
If we are classified as a PRC resident enterprise for PRC income tax purposes, such classification could result in unfavorable tax consequences to us and our non-PRC shareholders or ADS holders.
Under the PRC Enterprise Income Tax Law and its implementation rules, an enterprise established outside of the PRC with its “de facto management body” within the PRC is considered a “resident enterprise” and will be subject to PRC enterprise income tax on its global income at the rate of 25%. The implementation rules define the term “de facto management body” as the body that exercises full and substantial control and overall management over the business, productions, personnel, accounts and properties
52
Table of Contents
of an enterprise. In 2009, the State Administration of Taxation, or the SAT, issued a circular, known as SAT Circular 82, which provides certain specific criteria for determining whether the “de facto management body” of a PRC-controlled enterprise that is incorporated offshore is located in China. Although this circular only applies to offshore enterprises controlled by PRC enterprises or PRC enterprise groups, not those controlled by PRC individuals or foreigners, the criteria set forth in the circular may reflect the State Administration of Taxation’s general position on how the “de facto management body” text should be applied in determining the tax resident status of all offshore enterprises. According to SAT Circular 82, an offshore incorporated enterprise controlled by a PRC enterprise or a PRC enterprise group will be regarded as a PRC tax resident by virtue of having its “de facto management body” in China and will be subject to PRC enterprise income tax on its global income only if all of the following conditions are met: (i) the primary location of the day-to-day operational management is in the PRC; (ii) decisions relating to the enterprise’s financial and human resource matters are made or are subject to approval by organizations or personnel in the PRC; (iii) the enterprise’s primary assets, accounting books and records, company seals, and board and shareholder resolutions, are located or maintained in the PRC; and (iv) at least 50% of voting board members or senior executives habitually reside in the PRC.
We believe none of our entities outside of China is a PRC resident enterprise for PRC tax purposes. However, the tax resident status of an enterprise is subject to determination by the PRC tax authorities and uncertainties remain with respect to the interpretation of the term “de facto management body.” If the PRC tax authorities determine that MOGU Inc. is a PRC resident enterprise for enterprise income tax purposes, we may be required to withhold a 10% withholding tax from dividends we pay to our shareholders that are non-resident enterprises, including the holders of the ADSs. In addition, non-resident enterprise shareholders (including our ADS holders) may be subject to PRC tax at a rate of 10% on gains realized on the sale or other disposition of ADSs or ordinary shares at a rate of 10%, if such income is treated as sourced from within the PRC. Furthermore, if PRC tax authorities determine that we are a PRC resident enterprise for enterprise income tax purposes, dividends paid to our non-PRC individual shareholders (including the ADS holders) and any gain realized on the transfer of ADSs or ordinary shares by such shareholders may be subject to PRC tax at a rate of 20% (which, in the case of dividends, may be withheld at source by us), if such dividends or gains are deemed to be from PRC sources. These rates may be reduced by an applicable tax treaty, but it is unclear whether non-PRC shareholders of MOGU Inc. would be able to claim the benefits of any tax treaties between their country of tax residence and the PRC in the event that MOGU Inc. is treated as a PRC resident enterprise. Any such PRC tax may reduce the returns on your investment in the ADSs.
We may be subject to indirect transfer of equity interests in PRC resident enterprises by their non-PRC holding companies.
We may be subject to the reporting on and consequences of previous private equity financing transactions involving the transfer and exchange of shares in our company by non-resident investors. In February 2015, the State Administration of Taxation issued the Bulletin on Issues of Enterprise Income Tax on Indirect Transfers of Assets by Non-PRC Resident Enterprises, or Bulletin 7. Pursuant to Bulletin 7, an “indirect transfer” of PRC assets, including a transfer of equity interests in an unlisted non-PRC holding company of a PRC resident enterprise, by non-PRC resident enterprises may be re-characterized and treated as a direct transfer of the underlying PRC assets, if such arrangement does not have a reasonable commercial purpose and was established for the purpose of avoiding payment of PRC enterprise income tax. As a result, gains derived from such indirect transfer may be subject to PRC enterprise income tax, and the transferee or other person who is obligated to pay for the transfer is obligated to withhold the applicable taxes, currently at a rate of 10%, for the transfer of equity interests in a PRC resident enterprise. Bulletin 7 does not apply to transactions of sale of shares by investors through a public stock exchange where such shares were acquired from a transaction through a public stock exchange. On October 17, 2017, the SAT issued the Announcement of the State Administration of Taxation on Issues of Tax Withholding regarding Non-resident Enterprise Income Tax, or Bulletin 37, which came into effect on December 1, 2017. The Bulletin 37 further clarifies the practice and procedure of the withholding of nonresident enterprise income tax.
There is uncertainty as to the application of Bulletin 37 or previous rules under Bulletin 7 to our company. We face uncertainties on the reporting and consequences of private equity financing transactions, share exchanges or other transactions involving the transfer of shares in our company by investors that are non-PRC resident enterprises. Our company may be subject to filing obligations or taxes if our company is the transferor in such transactions, and may be subject to withholding obligations if our company is the transferee in such transactions, under Bulletin 37 and Bulletin 7.
The PCAOB had historically in years prior to 2023 been unable to inspect registered public accounting firms located in mainland China (including our auditor). The inability of the PCAOB to conduct inspections over these firms, including our auditor, in the past had deprived our investors with the benefits of such inspections.
Our auditor, the independent registered public accounting firm that issues the audit report included elsewhere in this annual report, as an auditor of companies that are traded publicly in the United States and a firm registered with the Public Company Accounting Oversight Board (United States), or the PCAOB, is subject to laws in the United States pursuant to which the PCAOB conducts regular inspections to assess its compliance with the applicable professional standards. Our auditor is located in mainland China, a jurisdiction where the PCAOB was historically unable to conduct inspections completely before December 15, 2022. As a result, we and investors in our ADSs were deprived of the benefits of such PCAOB inspections. The inability of the PCAOB to
53
Table of Contents
conduct inspections of auditors in mainland China in the past had made it more difficult to evaluate the effectiveness of our independent registered public accounting firm’s audit procedures or quality control procedures as compared to auditors located in the jurisdictions that are subject to the PCAOB inspections. On December 15, 2022, the PCAOB issued a report that vacated its previous PCAOB determinations and removed mainland China and Hong Kong from the list of jurisdictions where it is unable to inspect or investigate completely registered public accounting firms. However, if the PCAOB determines in the future that it no longer has full access to inspect and investigate completely registered public accounting firms in mainland China and Hong Kong for two consecutive years, and we use an accounting firm headquartered in one of these jurisdictions to issue an audit report on our financial statements filed with the SEC, we and investors in our ADSs would be deprived of the benefits of such PCAOB inspections again, which could cause investors and potential investors in our ADSs to lose confidence in our audit procedures and reported financial information and the quality of our financial statements.
If the PCAOB is unable to continue to inspect or investigate completely registered public accounting firms located in mainland China for two consecutive years in the future, our ADSs will be prohibited from trading in the United States under the HFCAA in the future. The delisting of our ADSs, or the threat of them being delisted, may materially and adversely affect the value of your investment.
The HFCAA was enacted on December 18, 2020, pursuant to which if the SEC determines that we have filed audit reports issued by a registered public accounting firm that has not been subject to inspection by the PCAOB for three consecutive years beginning in 2021, the SEC would prohibit our shares or ADSs from being traded on a national securities exchange or in the over-the-counter trading market in the U.S. In particular, pursuant to the SEC’s final amendments implementing the disclosure and submission requirements of the HFCAA announced on December 2, 2021, starting from fiscal years after December 18, 2020, the SEC would identify an issuer as a “Commission Identified Issuer” if the issuer filed an annual report containing an audit report issued by a registered public accounting firm that the PCAOB has determined that it would be unable to inspect or investigate completely. The SEC would then impose a trading prohibition on an issuer if it identified the issuer as a “Commission-Identified Issuer” for three consecutive years. On December 16, 2021, the PCAOB has also issued a report to notify the SEC that it was unable to inspect or investigate completely registered public accounting firms headquartered in mainland China and Hong Kong.
In addition, the full implication of the regulatory enforcement actions under HFCAA remains uncertain as more stringent requirements may be implemented. On March 24, 2021, the SEC adopted interim final rules to implement certain disclosure and documentation requirements under the HFCAA, including additional disclosures under Section 3 of the HFCAA that requires disclosure of the shares of the issuer owned by government entities in the jurisdiction in which the issuer is incorporated or otherwise organized (other than the U.S) and members of the Board who are officials of the Chinese Communist Party. The SEC has been assessing how to implement other requirements under the HFCAA, and as part of the effort, the SEC proposed a framework on May 13, 2021 for the PCAOB to determine if it is unable to inspect or investigate completely registered public accounting firms located in a foreign jurisdiction because of a position taken by one or more authorities in that jurisdiction.
On August 22, 2022, we were identified by the SEC as a “Commission-Identified Issuer” following the filing of our Form 20-F for the fiscal year ended March 31, 2022 with the SEC on July 15, 2022. On December 15, 2022, the PCAOB issued a report that vacated its previous PCAOB determinations. Accordingly, we are currently not at risk of having our ADSs subject to a trading prohibition under the HFCAA as we do not expect to be identified as a “Commission-Identified Issuer” for a second consecutive year.
On December 29, 2022, the Accelerating Holding Foreign Companies Accountable Act became effective, which amended the HFCAA, by requiring the SEC to prohibit an issuer’s securities from trading on any U.S. stock exchanges if its auditor is not subject to PCAOB inspections for two consecutive years instead of three. The PCAOB is expected to continue to demand complete access to inspections and investigations against accounting firms headquartered in mainland China and Hong Kong in the future and has stated that it has already made plans to resume regular inspections in early 2023 and beyond. The PCAOB is required under the HFCAA to make its determination on an annual basis with regards to its ability to inspect and investigate completely accounting firms based in the mainland China and Hong Kong. However, if the PCAOB determines in the future that it no longer has full access to inspect and investigate accounting firms headquartered in mainland China and Hong Kong and we continue to use such accounting firm to conduct audit work, we would be identified as a “Commission-Identified Issuer” under the HFCAA following the filing of the annual report for the relevant fiscal year, and if we were so identified for two consecutive years, trading in our securities on U.S. markets would be prohibited.
Further, whether the PCAOB will continue to be able to conduct inspections of our auditor is subject to substantial uncertainty and depends on a number of factors out of our, and our auditor’s, control, including the implementation of the Statement of Protocol signed by the PCAOB and the Chinese authorities and the uncertainties surrounding China-U.S. relations. If our shares and ADSs are prohibited from trading in the United States, there is no certainty that we will be able to list on a non-U.S. exchange or that a market for our shares will develop outside of the United States. Such a prohibition would substantially impair your ability to sell or
54
Table of Contents
purchase our ADSs when you wish to do so, and the risk and uncertainty associated with delisting would have a negative impact on the price of our ADSs. Also, such a prohibition would significantly affect our ability to raise capital on terms acceptable to us, or at all, which would have a material adverse impact on our business, financial condition, and prospects.
The enforcement of the PRC Labor Contract Law and other labor-related regulations in the PRC may adversely affect our business and results of operations.
The SCNPC enacted the Labor Contract Law in 2008, and amended it on December 28, 2012. The Labor Contract Law introduced specific provisions related to fixed-term employment contracts, part-time employment, probationary periods, consultation with labor unions and employee assemblies, employment without a written contract, dismissal of employees, severance, and collective bargaining to enhance previous PRC labor laws. Under the Labor Contract Law, an employer is obligated to sign an unlimited-term labor contract with any employee who has worked for the employer for ten consecutive years. Further, if an employee requests or agrees to renew a fixed-term labor contract that has already been entered into twice consecutively, the resulting contract, with certain exceptions, must have an unlimited term, subject to certain exceptions. With certain exceptions, an employer must pay severance to an employee where a labor contract is terminated or expires. In addition, the PRC governmental authorities have continued to introduce various new labor-related regulations since the effectiveness of the Labor Contract Law.
Under the PRC Social Insurance Law and the Administration of Housing Fund, employees are required to participate in pension insurance, work-related injury insurance, medical insurance, unemployment insurance, maternity insurance, and housing funds and employers are required, together with their employees or separately, to pay the social insurance premiums and housing funds for their employees. Failure to make adequate social insurance and housing fund contributions, we may be subject to fines and legal sanctions, and our business, financial conditions and results of operations may be adversely affected.
These laws designed to enhance labor protection tend to increase our labor costs. In addition, as the interpretation and implementation of these regulations are still evolving, our employment practices may not be at all times be deemed in compliance with the regulations. As a result, we could be subject to penalties or incur significant liabilities in connection with labor disputes or investigations.
Risks Related to the ADSs
We are a Cayman Islands holding company conducting our operations primarily through our PRC subsidiaries, the VIEs and their subsidiaries in China; we have no equity ownership in the VIEs and their subsidiaries. Holders of our ordinary shares or the ADSs hold equity interest in our Cayman Islands holding company, and do not have direct or indirect equity interests in the VIEs and their subsidiaries.
We are a Cayman Islands holding company conducting our operations primarily through our PRC subsidiaries, the VIEs and their subsidiaries in China; we have no equity ownership in the VIEs and their subsidiaries. Holders of our ordinary shares or the ADSs hold an equity interest in Mogu Inc., our Cayman Islands holding company, and do not have direct or indirect equity interests in the VIEs and their subsidiaries. If the PRC government determines that the contractual arrangements constituting part of the VIE structure do not comply with PRC laws and regulations, or if these regulations or their interpretations change in the future, we could be subject to severe penalties or be forced to relinquish our rights under the contractual agreements in those operations, which may cause the value of our ADSs to significantly decline or become worthless. Mogu Inc., its PRC subsidiaries and VIEs, and investors of Mogu Inc. face uncertainty about potential future actions by the PRC government that could affect the enforceability of the contractual arrangements with the VIEs and, consequently, significantly affect the financial performance of the VIEs and our company as a whole.
The trading price of the ADSs is likely to be volatile, which could result in substantial losses to investors.
The trading price of the ADSs is likely to be volatile and could fluctuate widely due to multiple factors, some of which are beyond our control. This may happen because of broad market and industry factors, including the performance and fluctuation of the market prices of other companies with business operations located mainly in China that have listed their securities in the United States. In addition to market and industry factors, the price and trading volume for the ADSs may be highly volatile for factors specific to our own operations, including the following:
55
Table of Contents
Any of these factors may result in large and sudden changes in the volume and price at which our ADSs will trade.
In November 2021, we received a letter from the New York Stock Exchange notifying us that the Company’s average closing price of its security on the consolidated tap is less than US$1.00 over a consecutive 30 trading-day period and was below compliance criteria. In response to the noncompliance letter and to countervail any short-term adverse effect resulted and rectify the deficiencies in our trading price, we decided to change the ratio of our ADS from one ADS to twenty-five (25) Class A ordinary shares to three hundred (300) Class A ordinary shares, effective on March 28, 2022. However, we cannot assure you that the closing price will not be less than US$1.00 in the future. Further, we cannot guarantee that we will be able to maintain the compliance criteria that require the average market capitalization over a 30 trading-day period of to be at least $15 million, even though we are currently in compliance with such criteria. If we fail to comply with any compliance criteria for continued listing and we are unable to regain compliance pursuant to the relevant procedures, our ADSs may be delisted or prohibited from trading on NYSE pursuant to Section 802.01B of the NYSE’s Listed Company Manual. In addition, in the past, shareholders of public companies have often brought securities class action suits against those companies following periods of instability in the market price of their securities. If we were involved in a class action suit, it could divert a significant amount of our management’s attention and other resources from our business and operations and require us to incur significant expenses to defend the suit, which could harm our results of operations. Any such class action suit, whether or not successful, could harm our reputation and restrict our ability to raise capital in the future. In addition, if a claim is successfully made against us, we may be required to pay significant damages, which could have a material adverse effect on our financial condition and results of operations.
We cannot guarantee that any share repurchase program will be fully consummated or that any share repurchase program will enhance long-term shareholder value, and share repurchases could increase the volatility of the trading price of the ADSs and could diminish our cash reserves.
In May 2020, our board of directors authorized a new repurchase of up to US$10 million of the ADSs or our ordinary shares over a twelve-month period from May 28, 2020 through May 27, 2021. In September 2020, our board of directors authorized another repurchase of up to US$10 million of the ADSs or our ordinary shares over a twelve-month period from September 13, 2020 through September 12, 2021. In August 2021, our board of directors authorized another repurchase of up to US$10 million of the ADSs or our ordinary shares over a twelve-month period from August 27, 2021 through August 26, 2022. In September 2022, our board of directors further authorized another repurchase of up to US$10 million of the ADSs or our ordinary shares over the period from September 9, 2022 through August 31, 2023. See “Item 16E. Purchases of Equity Securities by the Issuer and Affiliated Purchasers.” for details of our share repurchase transactions pursuant to these share repurchase programs for the fiscal year ended March 31, 2023. Although our board of directors has authorized share repurchase programs and can authorized additional share repurchase programs in the future, we are not obligated to purchase any specific dollar amount or to acquire any specific number of shares. The timing and amount of repurchases, if any, will depend upon several factors, including market, business conditions, the trading price of the ADSs or our ordinary shares and the nature of other investment opportunities. Our share repurchase program could affect the price of the ADSs and increase volatility and may be suspended or terminated at any time, which may result in a decrease in the trading price of the ADSs. For example, the existence of a share repurchase program could cause the price of the ADSs to be higher than it would be in the absence of such a program and could potentially reduce the market liquidity for the ADSs. Additionally, our share repurchase program could diminish our cash reserves, which may impact our ability to finance future growth and to pursue possible future strategic opportunities. There can be no assurance that any share repurchases will enhance shareholder value because the market price of the ADSs or our ordinary shares may decline below the levels at which we determine to repurchase the ADSs or our ordinary shares. Although our share repurchase program is intended to enhance long-term shareholder value, there is no assurance that it will do so and short-term share price fluctuations could reduce the program’s effectiveness.
If securities or industry analysts do not publish research or reports about our business, or if they adversely change their recommendations regarding the ADSs, the market price for the ADSs and trading volume could decline.
The trading market for the ADSs will be influenced by research or reports that industry or securities analysts publish about our business. If one or more analysts who cover us downgrade the ADSs, the market price for the ADSs would likely decline. If one or more of these analysts cease to cover us or fail to regularly publish reports on us, we could lose visibility in the financial markets, which in turn could cause the market price or trading volume for the ADSs to decline.
56
Table of Contents
The sale or availability for sale of substantial amounts of the ADSs could adversely affect their market price.
Sales of substantial amounts of the ADSs in the public market, or the perception that these sales could occur, could adversely affect the market price of the ADSs and could materially impair our ability to raise capital through equity offerings in the future. We cannot predict what effect, if any, market sales of securities held by our shareholders or the availability of these securities for future sale will have on the market price of the ADSs.
Techniques employed by short sellers may drive down the market price of our listed ADSs.
Short selling is the practice of selling securities that a seller does not own but rather has borrowed from a third party with the intention of buying identical securities back at a later date to return to the lender. Short sellers hope to profit from a decline in the value of the securities between the sale of the borrowed securities and the purchase of the replacement shares, as short sellers expect to pay less in that purchase than they received in the sale. As it is in short sellers’ interest for the price of the security to decline, many short sellers publish, or arrange for the publication of, negative opinions and allegations regarding the relevant issuer and its business prospects in order to create negative market momentum and generate profits for themselves after selling a security short. These short attacks have, in the past, led to selling of shares in the market.
Public companies listed in the United States that have substantially all of their operations in China have been the subject of short selling. Much of the scrutiny and negative publicity has centered on allegations of a lack of effective internal control over financial reporting resulting in financial and accounting irregularities and mistakes, inadequate corporate governance policies or a lack of adherence thereto and, in many cases, allegations of fraud. As a result, many of these companies are now conducting internal and external investigations into the allegations and, in the interim, are subject to shareholder lawsuits and/or SEC enforcement actions.
Any allegations or reports published by short sellers against our company may be followed by periods of instability in the market price of our ADSs and negative publicity. Regardless of whether such allegations and information in such reports are proven to be true or untrue, we may have to expend a significant amount of resources to investigate such allegations and/or defend ourselves against negative information in such reports, including in connection with class actions or regulatory enforcement actions derivative of such allegations. While we would strongly defend against any such short seller attacks, we may be constrained in the manner in which we can proceed against the relevant short sellers by principles of freedom of speech, applicable state law or issues of commercial confidentiality. Such a situation could be costly and time-consuming, and could divert management’s attention from the day-to-day operations of our company. Even if such allegations are ultimately proven to be groundless, allegations against us could severely impact the market price of our ADSs and our business operations.
Our dual-class voting structure will limit your ability to influence corporate matters and could discourage others from pursuing any change of control transactions that holders of our Class A ordinary shares and the ADSs may view as beneficial.
Our authorized share capital is divided into Class A ordinary shares and Class B ordinary shares. Holders of Class A ordinary shares is entitled to one vote per share, while holders of Class B ordinary shares is entitled to 30 votes per share. Each Class B ordinary share is convertible into one Class A ordinary share at any time by the holder thereof, while Class A ordinary shares are not convertible into Class B ordinary shares under any circumstances.
As of June 30, 2023, Mr. Qi Chen, our co-founder, the chairman of our board of directors, beneficially owned all of our issued Class B ordinary shares. These Class B ordinary shares constitutes approximately 12.3% of our total issued and outstanding share capital and 80.8% of our aggregate voting power as of June 30, 2023. As a result of the dual-class share structure and the concentration of ownership, holders of Class B ordinary shares have considerable influence over matters such as decisions regarding mergers and consolidations, election of directors and other significant corporate actions. Such holders may take actions that are not in the best interest of us or our other shareholders. This concentration of ownership may discourage, delay or prevent a change in control of our company, which could have the effect of depriving our other shareholders of the opportunity to receive a premium for their shares as part of a sale of our company and may reduce the price of the ADSs. This concentrated control will limit your ability to influence corporate matters and could discourage others from pursuing any potential merger, takeover or other change of control transactions that holders of Class A ordinary shares and ADSs may view as beneficial.
Because we do not expect to pay dividends in the foreseeable future, you must rely on price appreciation of the ADSs for return on your investment.
We currently intend to retain most, if not all, of our available funds and any future earnings to fund the development and growth of our business. As a result, we do not expect to pay any cash dividends in the foreseeable future. Therefore, you should not rely on an investment in the ADSs as a source for any future dividend income.
57
Table of Contents
Our board of directors has complete discretion as to whether to distribute dividends, subject to certain restrictions under Cayman Islands law, namely that our company may only pay dividends out of profits or share premium account, and provided always that in no circumstances may a dividend be paid if this would result in our company being unable to pay its debts as they fall due in the ordinary course of business. In addition, our shareholders may by ordinary resolution declare a dividend, but no dividend may exceed the amount recommended by our board of directors. Even if our board of directors decides to declare and pay dividends, the timing, amount and form of future dividends, if any, will depend on our future results of operations and cash flow, our capital requirements and surplus, the amount of distributions, if any, received by us from our subsidiaries, our financial condition, contractual restrictions and other factors deemed relevant by our board of directors. Accordingly, the return on your investment in the ADSs will likely depend entirely upon any future price appreciation of the ADSs. There is no guarantee that our ADSs will appreciate in value or even maintain the price at which you purchased the ADSs. You may not realize a return on your investment in the ADSs and you may even lose your entire investment in the ADSs.
Our memorandum and articles of association contain anti-takeover provisions that could have a material adverse effect on the rights of holders of our ordinary shares and the ADSs.
Our memorandum and articles of association contain provisions which could limit the ability of others to acquire control of our company or cause us to engage in change-of-control transactions. These provisions could have the effect of depriving our shareholders of an opportunity to sell their shares at a premium over prevailing market prices by discouraging third parties from seeking to obtain control of our company in a tender offer or similar transaction. Our board of directors has the authority, without further action by our shareholders, to issue preferred shares in one or more series and to fix their designations, powers, preferences, privileges, and relative participating, optional or special rights and the qualifications, limitations or restrictions, including dividend rights, conversion rights, voting rights, terms of redemption and liquidation preferences, any or all of which may be greater than the rights associated with our ordinary shares, in the form of ADS or otherwise. Preferred shares could be issued quickly with terms calculated to delay or prevent a change in control of our company or make removal of management more difficult. If our board of directors decides to issue preferred shares, the price of our ADSs may fall and the voting and other rights of the holders of our ordinary shares and ADSs may be materially and adversely affected.
You may face difficulties in protecting your interests, and your ability to protect your rights through U.S. courts may be limited, because we are incorporated under Cayman Islands law.
We are an exempted company with limited liability incorporated under the laws of the Cayman Islands. Our corporate affairs are governed by our memorandum and articles of association, the Companies Act (As Revised) of the Cayman Islands (the “Companies Act”) and the common law of the Cayman Islands. The rights of shareholders to take action against our directors, actions by our minority shareholders and the fiduciary duties of our directors to us under Cayman Islands law are to a large extent governed by the common law of the Cayman Islands. The common law of the Cayman Islands is derived in part from comparatively limited judicial precedent in the Cayman Islands as well as from the common law of England, the decisions of whose courts are of persuasive authority, but are not binding, on a court in the Cayman Islands. The rights of our shareholders and the fiduciary duties of our directors under Cayman Islands law are not as clearly established as they would be under statutes or judicial precedent in some jurisdictions in the United States. In particular, the Cayman Islands has a less developed body of securities laws than the United States. Some U.S. states, such as Delaware, have more fully developed and judicially interpreted bodies of corporate law than the Cayman Islands. In addition, Cayman Islands companies may not have standing to initiate a shareholder derivative action in a federal court of the United States.
Shareholders of Cayman Islands exempted companies like us have no general rights under Cayman Islands law to inspect corporate records (other than the memorandum and articles of association, any special resolutions passed by such companies, and the registers of mortgages and charges of such companies) or to obtain copies of lists of shareholders of these companies. Our directors have discretion under our articles of association to determine whether or not, and under what conditions, our corporate records may be inspected by our shareholders, but are not obliged to make them available to our shareholders. This may make it more difficult for you to obtain the information needed to establish any facts necessary for a shareholder motion or to solicit proxies from other shareholders in connection with a proxy contest.
Certain corporate governance practices in the Cayman Islands, which is our home country, differ significantly from requirements for companies incorporated in other jurisdictions such as the United States. Currently, we intend to follow our home country practice in lieu of the following NYSE corporate governance requirements: (i) having a majority of independent directors on our board of directors, (ii) having a minimum of three members in our audit committee, (iii) holding annual shareholders’ meetings, (iv) having a compensation committee composed entirely of independent directors, and (v) having a nominating and corporate governance committee composed entirely of independent directors. To the extent that we choose to follow home country practice with respect to corporate governance matters, our shareholders may be afforded less protection than they otherwise would under rules and regulations applicable to U.S. domestic issuers.
58
Table of Contents
As a result of all of the above, our public shareholders may have more difficulty in protecting their interests in the face of actions taken by our management, members of our board of directors or our controlling shareholders than they would as public shareholders of a company incorporated in the United States.
It may be difficult for overseas regulators to conduct investigation or collect evidence within China.
Shareholder claims or regulatory investigation that are common in the United States generally are difficult to pursue as a matter of law or practicality in China. For example, in China, there are significant legal and other obstacles to providing information needed for regulatory investigations or litigation initiated outside China. Although the authorities in China may establish a regulatory cooperation mechanism with the securities regulatory authorities of another country or region to implement cross-border supervision and administration, such cooperation with the securities regulatory authorities in the Unities States may not be efficient in the absence of mutual and practical cooperation mechanism. Furthermore, according to Article 177 of the PRC Securities Law, or Article 177, which became effective in March 2020, no overseas securities regulator is allowed to directly conduct investigation or evidence collection activities within the territory of the PRC. While detailed interpretation of or implementation rules under Article 177 have yet to be promulgated, the inability for an overseas securities regulator to directly conduct investigation or evidence collection activities within China may further increase difficulties faced by you in protecting your interests. See also “—Risks Related to the ADSs—You may face difficulties in protecting your interests, and your ability to protect your rights through U.S. courts may be limited, because we are incorporated under Cayman Islands law.”
The voting rights of holders of ADSs are limited by the terms of the deposit agreement, and you may not be able to exercise your right to direct how the Class A ordinary shares which are represented by your ADSs are voted.
Holders of ADSs do not have the same rights as our registered shareholders. As a holder of the ADSs, you will not have any direct right to attend general meetings of our shareholders or to cast any votes at such meetings. You will only be able to exercise the voting rights which are carried by the underlying Class A ordinary shares represented by your ADSs indirectly by giving voting instructions to the depositary in accordance with the provisions of the deposit agreement. Under the deposit agreement, you may vote only by giving voting instructions to the depositary. If we instruct the depositary to ask for your instructions, then upon receipt of your voting instructions, the depositary will try, as far as is practicable, to vote the underlying Class A ordinary shares which are represented by your ADSs in accordance with your instructions. If we do not instruct the depositary to ask for your instructions, the depositary may still vote in accordance with instructions you give, but it is not required to do so. You will not be able to directly exercise your right to vote with respect to the underlying Class A ordinary shares represented by your ADSs unless you withdraw the shares and become the registered holder of such shares prior to the record date for the general meeting. Under our memorandum and articles of association, the minimum notice period required to be given by our company to our registered shareholders to convene a general meeting is ten calendar days. When a general meeting is convened, you may not receive sufficient advance notice of the meeting to withdraw the Class A ordinary shares underlying your ADSs and become the registered holder of such shares to allow you to attend the general meeting and to vote directly with respect to any specific matter or resolution to be considered and voted upon at the general meeting. In addition, under our memorandum and articles of association, for the purposes of determining those shareholders who are entitled to attend and vote at any general meeting, our directors may close our register of members and/or fix in advance a record date for such meeting, and such closure of our register of members or the setting of such a record date may prevent you from withdrawing the Class A ordinary shares underlying your ADSs and becoming the registered holder of such shares prior to the record date, so that you would not be able to attend the general meeting or to vote directly. If we ask for your instructions, the depositary will notify you of the upcoming vote and will arrange to deliver our voting materials to you. We have agreed to give the depositary at least 40 days’ prior notice of shareholder meetings. Nevertheless, we cannot assure you that you will receive the voting materials in time to ensure that you can instruct the depositary to vote the underlying Class A ordinary shares represented by your ADSs. In addition, the depositary and its agents are not responsible for failing to carry out voting instructions or for their manner of carrying out your voting instructions. This means that you may not be able to exercise your right to direct how the Class A ordinary shares underlying your ADSs are voted and you may have no legal remedy if the Class A ordinary shares underlying your ADSs are not voted as you requested.
We are entitled to amend the deposit agreement and to change the rights of ADS holders under the terms of such agreement, or to terminate the deposit agreement, without the prior consent of the ADS holders.
We and the depositary are entitled to amend the deposit agreement and to change the rights of the ADS holders under the terms of such agreement, without the prior consent of the ADS holders. We and the depositary may agree to amend the deposit agreement in any way we decide is necessary or advantageous to us. Amendments may reflect, among other things, operational changes in the ADS program, legal developments affecting ADSs or changes in the terms of our business relationship with the depositary. In the event that the terms of an amendment are disadvantageous to ADS holders, ADS holders will only receive 30 days’ advance notice of the amendment, and no prior consent of the ADS holders is required under the deposit agreement. Furthermore, we may decide to terminate the ADS facility at any time for any reason. For example, terminations may occur when we decide to list our
59
Table of Contents
shares on a non-U.S. securities exchange and determine not to continue to sponsor an ADS facility or when we become the subject of a takeover or a going-private transaction. If the ADS facility terminates, ADS holders will receive at least 90 days’ prior notice, but no prior consent is required from them. Under the circumstances that we decide to make an amendment to the deposit agreement that is disadvantageous to ADS holders or terminate the deposit agreement, the ADS holders may choose to sell their ADSs or surrender their ADSs and become direct holders of the underlying ordinary shares, but will have no right to any compensation whatsoever.
ADSs holders may not be entitled to a jury trial with respect to claims arising under the deposit agreement, which could result in less favorable outcomes to the plaintiff(s) in any such action.
The deposit agreement governing the ADSs representing our Class A ordinary shares provides that, to the fullest extent permitted by law, ADS holders waive the right to a jury trial of any claim they may have against us or the depositary arising out of or relating to our shares, the ADSs or the deposit agreement, including any claim under the U.S. federal securities laws.
If we or the depositary opposed a jury trial demand based on the waiver, the court would determine whether the waiver was enforceable based on the facts and circumstances of that case in accordance with the applicable state and federal law. To our knowledge, the enforceability of a contractual pre-dispute jury trial waiver in connection with claims arising under the federal securities laws has not been finally adjudicated by the United States Supreme Court. However, we believe that a contractual pre-dispute jury trial waiver provision is generally enforceable, including under the laws of the State of New York, which govern the deposit agreement, by a federal or state court in the City of New York, which has non-exclusive jurisdiction over matters arising under the deposit agreement. In determining whether to enforce a contractual pre-dispute jury trial waiver provision, courts will generally consider whether a party knowingly, intelligently and voluntarily waived the right to a jury trial. We believe that this is the case with respect to the deposit agreement and the ADSs. It is advisable that you consult legal counsel regarding the jury waiver provision before entering into the deposit agreement.
If you or any other holders or beneficial owners of ADSs bring a claim against us or the depositary in connection with matters arising under the deposit agreement or the ADSs, including claims under federal securities laws, you or such other holder or beneficial owner may not be entitled to a jury trial with respect to such claims, which may have the effect of limiting and discouraging lawsuits against us and / or the depositary. If a lawsuit is brought against us and/or the depositary under the deposit agreement, it may be heard only by a judge or justice of the applicable trial court, which would be conducted according to different civil procedures and may result in different outcomes than a trial by jury would have had, including results that could be less favorable to the plaintiff(s) in any such action.
Nevertheless, if this jury trial waiver provision is not permitted by applicable law, an action could proceed under the terms of the deposit agreement with a jury trial. No condition, stipulation or provision of the deposit agreement or ADSs serves as a waiver by any holder or beneficial owner of ADSs or by us or the depositary of compliance with any substantive provision of the U.S. federal securities laws and the rules and regulations promulgated thereunder.
You may experience dilution of your holdings due to inability to participate in rights offerings.
We may, from time to time, distribute rights to our shareholders, including rights to acquire ADSs. Under the deposit agreement, the depositary will not distribute rights to holders of ADSs unless the distribution and sale of rights and the ADSs to which these rights relate are either exempt from registration under the Securities Act with respect to all holders of ADSs, or are registered under the provisions of the Securities Act. The depositary may, but is not required to, attempt to sell these undistributed rights to third parties, and may allow the rights to lapse. We may be unable to establish an exemption from registration under the Securities Act, and we are under no obligation to file a registration statement with respect to these rights or underlying securities or to endeavor to have a registration statement declared effective. Accordingly, holders of ADSs may be unable to participate in our rights offerings and may experience dilution of their holdings as a result.
You may be subject to limitations on transfer of your ADSs.
Your ADSs are transferable on the books of the depositary. However, the depositary may close its books at any time or from time to time when it deems expedient in connection with the performance of its duties. The depositary may close its books from time to time for a number of reasons, including in connection with corporate events such as a rights offering, during which time the depositary needs to maintain an exact number of ADS holders on its books for a specified period. The depositary may also close its books in emergencies, and on weekends and public holidays. The depositary may refuse to deliver, transfer or register transfers of the ADSs generally when our share register or the books of the depositary are closed, or at any time if we or the depositary thinks it is advisable to do so because of any requirement of law or of any government or governmental body, or under any provision of the deposit agreement, or for any other reason.
60
Table of Contents
We are an emerging growth company within the meaning of the Securities Act and may take advantage of certain reduced reporting requirements.
We are an “emerging growth company” as defined in the JOBS Act, and we may take advantage of certain exemptions from requirements applicable to other public companies that are not emerging growth companies including, most significantly, not being required to comply with the auditor attestation requirements of Section 404 of the Sarbanes-Oxley Act of 2002 for so long as we remain an emerging growth company. As a result, if we elect not to comply with such auditor attestation requirements, our investors may not have access to certain information they may deem important.
We will incur increased costs as a result of being a public company, particularly after we cease to qualify as an “emerging growth company.”
We are a public company and expect to incur significant legal, accounting and other expenses that we did not incur as a private company. The Sarbanes-Oxley Act of 2002, as well as rules subsequently implemented by the SEC and the New York Stock Exchange, impose various requirements on the corporate governance practices of public companies. As a company with less than US$1.235 billion in revenues for our last fiscal year, we qualify as an “emerging growth company” pursuant to the JOBS Act. An emerging growth company may take advantage of specified reduced reporting and other requirements that are otherwise applicable generally to public companies. These provisions include exemption from the auditor attestation requirement under Section 404 of the Sarbanes-Oxley Act of 2002, in the assessment of the emerging growth company’s internal control over financial reporting. The JOBS Act also permits an emerging growth company to delay adopting new or revised accounting standards until such time as those standards apply to private companies. We rely on such exemption provided by the JOBS Act. As a result, our financial statements may not be comparable to companies that comply with public company effective dates.
We expect these rules and regulations to increase our legal and financial compliance costs and to make some corporate activities more time-consuming and costly. After we are no longer an “emerging growth company,” we expect to incur significant expenses and devote substantial management effort toward ensuring compliance with the requirements of Section 404 of the Sarbanes-Oxley Act of 2002 and the other rules and regulations of the SEC. For example, as a result of being a public company, we need to increase the number of independent directors and adopt policies regarding internal controls and disclosure controls and procedures. Also, operating as a public company makes it more difficult and more expensive for us to obtain director and officer liability insurance, and we may be required to accept reduced policy limits and coverage or incur substantially higher costs to obtain the same or similar coverage. In addition, we will incur additional costs associated with our public company reporting requirements. It may also be more difficult for us to find qualified persons to serve on our board of directors or as executive officers. We are currently evaluating and monitoring developments with respect to these rules and regulations, and we cannot predict or estimate with any degree of certainty the amount of additional costs we may incur or the timing of such costs.
We are a foreign private issuer within the meaning of the rules under the Exchange Act, and as such we are exempt from certain provisions applicable to United States domestic public companies.
Because we are a foreign private issuer under the Exchange Act, we are exempt from certain provisions of the securities rules and regulations in the United States that are applicable to U.S. domestic issuers, including: (i) the rules under the Exchange Act requiring the filing of quarterly reports on Form 10-Q or current reports on Form 8-K with the SEC; (ii) the sections of the Exchange Act regulating the solicitation of proxies, consents, or authorizations in respect of a security registered under the Exchange Act; (iii) the sections of the Exchange Act requiring insiders to file public reports of their stock ownership and trading activities and liability for insiders who profit from trades made in a short period of time; and (iv) the selective disclosure rules by issuers of material nonpublic information under Regulation FD.
We are required to file an annual report on Form 20-F within four months of the end of each fiscal year. In addition, we intend to publish our results on a semi-annually basis through press releases, distributed pursuant to the rules and regulations of the New York Stock Exchange. Press releases relating to financial results and material events will also be furnished to the SEC on Form 6-K. However, the information we are required to file with or furnish to the SEC will be less extensive and less timely compared to that required to be filed with the SEC by U.S. domestic issuers. As a result, you may not be afforded the same protections or information, which would be made available to you, were you investing in a U.S. domestic issuer.
As a company incorporated in the Cayman Islands, we are permitted to adopt certain home country practices in relation to corporate governance matters that differ significantly from the NYSE corporate governance listing standards; these practices may afford less protection to shareholders than they would enjoy if we comply fully with the NYSE corporate governance listing standards.
61
Table of Contents
As a Cayman Islands company listed on the New York Stock Exchange, we are subject to the NYSE corporate governance listing standards. However, NYSE rules permit a foreign private issuer like us to follow the corporate governance practices of its home country. Certain corporate governance practices in the Cayman Islands, which is our home country, may differ significantly from the NYSE corporate governance listing standards. Currently, we intend to follow our home country practice in lieu of the following NYSE corporate governance requirements: (i) having a majority of independent directors on our board of directors, (ii) having a minimum of three members in our audit committee, (iii) holding annual shareholders’ meetings, (iv) having a compensation committee composed entirely of independent directors, and (v) having a nominating and corporate governance committee composed entirely of independent directors. To the extent that we choose to follow home country practice with respect to corporate governance matters, our shareholders may be afforded less protection than they would otherwise enjoy under the NYSE corporate governance listing standards applicable to U.S. domestic issuers.
We are a “controlled company” within the meaning of the New York Stock Exchange listing rules and, as a result, can rely on exemptions from certain corporate governance requirements that provide protection to shareholders of other companies.
We are a “controlled company” as defined under the New York Stock Exchange listing rules because Mr. Qi Chen, our co-founder and the chairman of our board of directors, owns more than 50% of our total voting power. For so long as we remain a controlled company under that definition, we are permitted to elect to rely, and may rely, on certain exemptions from corporate governance rules. As a result, you may not have the same protection afforded to shareholders of companies that are subject to these corporate governance requirements.
We may be a passive foreign investment company, which could result in adverse U.S. federal income tax consequences to U.S. Holders owning the ADSs or ordinary shares.
A non-U.S. corporation, such as our company, will be considered a passive foreign investment company, or “PFIC,” for any taxable year if either (i) at least 75% of its gross income is passive income or (ii) at least 50% of the value of its assets (based on an average of the quarterly values of the assets during a taxable year) is attributable to assets that produce or are held for the production of passive income. Although the law in this regard is not entirely clear, we treat the VIEs as being owned by us for U.S. federal income tax purposes because we have power to direct activities of the VIEs that most significantly affect the economic performance of the VIEs and are entitled to the economic benefits associated with them that could be significant to the VIEs, and thus we are regarded as the primary beneficiary of the VIEs for accounting purposes. As a result, we consolidate their results of operations in our consolidated U.S. GAAP financial statements. If it were determined, however, that we are not the owner of the VIEs for U.S. federal income tax purposes, we would likely be treated as a PFIC for the current taxable year and any subsequent taxable year.
Assuming that we are the owner of the VIEs for U.S. federal income tax purposes, we do not believe we were a PFIC for the taxable year ended March 31, 2023 and we do not expect to be a PFIC for the foreseeable future. However, no assurance can be given in this regard because the determination of whether we are or will become a PFIC is a factual determination made annually that will depend, in part, upon the composition of our income and assets. Fluctuations in the market price of ADSs may cause us to be a PFIC for the current or future taxable years because the value of our assets for purposes of the asset test, including the value of our goodwill and unbooked intangibles, may be determined by reference to the market price of ADSs from time to time (which may be volatile). If our market capitalization subsequently declines, we may be or become a PFIC for the current taxable year or future taxable years. Furthermore, the composition of our income and assets may also be affected by how, and how quickly, we use our liquid assets. Under circumstances where our revenue from activities that produce passive income significantly increases relative to our revenue from activities that produce non-passive income, or where we determine not to deploy significant amounts of cash for active purposes, our risk of becoming a PFIC may substantially increase.
If we were treated as a PFIC for any taxable year during which a U.S. Holder (as defined in Item 10. Additional Information—E. Taxation—United States Federal Income Tax Considerations) held an ADS or an ordinary share, certain adverse U.S. federal income tax consequences could apply to the U.S. Holder. See “Item 10. Additional Information—E. Taxation—United States Federal Income Tax Considerations—Passive Foreign Investment Company Rules.”
ITEM 4. INFORMATION ON THE COMPANY
We launched our online fashion platform under the Mogujie brand in February 2011. Our holding company, MOGU Holdings Limited, was incorporated in the Cayman Islands in June 2011. MOGU Holdings Limited was subsequently renamed Meili Inc. in June 2016. In November 2018, we renamed our company as MOGU Inc.
62
Table of Contents
In June 2011, we incorporated MOGU (HK) Limited in Hong Kong. In July 2016, we renamed it Meili Group Limited, or Meili HK. In November 2011, Meili HK established a wholly-owned PRC subsidiary, Hangzhou Shiqu Information and Technology Co., Ltd., or Hangzhou Shiqu. In the same month, we obtained control over Hangzhou Juangua Network Co., Ltd., or Hangzhou Juangua, through Hangzhou Shiqu by entering into a series of contractual arrangements with Hangzhou Juangua and its shareholders.
In February 2016, we acquired Meiliworks Limited and its subsidiaries (including Meilishuo (Beijing) Network Technology Co., Ltd.) and VIEs, or Meilishuo, a leading online fashion platform in China, through a series of transactions. In the same month, we obtained control over Beijing Meilishikong Network and Technology Co., Ltd., or Beijing Meilishikong, which was incorporated in July 2010, through Hangzhou Shiqu by entering into a series of contractual arrangements with Beijing Meilishikong and its shareholders.
On December 6, 2018, the ADSs representing our Class A common shares commenced trading on the New York Stock Exchange under the symbol “MOGU.” We raised approximately US$58.0 million in net proceeds from the issuance of new shares from the initial public offering after deducting underwriting commissions and the offering expenses payable by us.
On August 8, 2020, we signed an agreement to purchase an office building located at the Hangzhou Zijingang Technology Zone for a total consideration of RMB209.0 million (US$31.9 million), on which we have paid installment payments. The office building has been completed in December of 2022. We expect to begin business operations in this office building from October, 2023.
On July 26, 2021, we acquired Ruisha Technology by increasing our share of equity interests to 59.6%.
On March 28, 2022, we changed the ratio of our ADS from one ADS represents twenty-five Class A common shares to one ADS represents three hundred Class A common shares.
Our principal executive offices are located at Huanglong Wanke Center, 23/F, Building No. G, No. 77 Xueyuan Road, Xihu District, Hangzhou, 310012, People’s Republic of China. Our telephone number at this address is +86 571 8530 8201. Our registered office in the Cayman Islands is located at offices of Maples Corporate Services Limited at P.O. Box 309, Ugland House, Grand Cayman, KY1-1104, Cayman Islands. Our agent for service of process in the United States is Puglisi & Associates, located at 850 Library Avenue, Suite 204, Newark, Delaware 19711.
We are a KOL-driven online fashion and lifestyle destination in China. We provide people with a more accessible and enjoyable shopping experience for everyday fashion, particularly as they increasingly live their lives online. People shop not only to buy, but also for leisure, entertainment and to stay informed of the latest trends. By connecting merchants, KOLs and users together, our platform serves as a valuable marketing channel for merchants, a powerful incubator for KOLs, and a vibrant and dynamic community for people to discover and share the latest fashion trends with others, where users can enjoy a truly comprehensive online shopping experience. In July 2021, we acquired Ruisha Technology as a means to explore new opportunities in the global operation of merchants. Ruisha Technology focuses on serving leading brands in the retail industry and providing brands with private domain operation and private domain product systems, etc. solutions and services. Ruisha Technology is dedicated to providing brands with one-stop brand-wide integrated marketing solutions that keep abreast of the times.
Our large base of KOLs is the primary source of the rich and diverse content on our platform, which is mostly in live-streaming format and distills styles and trends, often features products from our merchants and guides our users along their shopping journey from discovery to purchase. We attract merchant partners due to the sizeable user base of our platform, and these merchant partners incentivize and empower our KOLs to produce engaging fashion content by providing the KOLs with their fashion products, which often reflect the latest fashion trends. Our highly engaging content comprises live video broadcasts, short-form videos, photographs, and product reviews. Our users may directly purchase the products promoted or reviewed during a live video broadcast from the LVB hosts by clicking on the links to the products available in the live video broadcast channels. In addition, when a user sees a certain item featured in a live video broadcast or a short-form video, or sees it recommended by a friend or a KOL through a like or share on our platform, the user can directly purchase that item.
Users access our platform primarily through mobile applications, including our flagship Mogujie mobile app, as well as through our Mini Programs on Weixin. Our highly engaged user base primarily consists of young females between the ages of 25 and 35. In March 2023, on average, an active buyer through LVB on our platform spent over 47 minutes per day watching our live video broadcasts, and 93% of them repurchased within 30 days of their initial purchase. If an individual actively uses multiple devices or
63
Table of Contents
accounts to access our live video broadcasts simultaneously, such individual would be counted as multiple “users” in calculating the above average time spent.
We are a technology-driven company that has relentlessly pursued the development of industry-leading AI and big data analytical capabilities to improve operational efficiency and user experience. Our user data is multidimensional as it relates to our users’ shopping behaviors, fashion tastes and purchasing history, which enables us to provide better and more personalized experience for them.
Starting from 2021, we continuously provide our users, especially female users, with more products based on their fashion and beauty consumption needs, including beauty makeup, personal care, food, medical beauty etc. on our platform.
As many consumers pay more attention to their health and general well-being in the past three years, we have actively adjusted our product offering and enriched our product portfolio with a variety of healthcare products, grocery, household suppliers and foods concurrently. We aim to continue to offer our consumers more variety of products and bring more fun to the shopping experience.
Our Online Platform
Our platform serves as a vibrant and dynamic community that allows people to both discover and share the latest fashion trends with others and transact with merchants for a comprehensive selection of attractive fashion products. Our users primarily access our online platform through our flagship Mogujie mobile app and our Mini Programs on Weixin. In addition, our online platform also includes our Mogu.com website.
Mobile Application
Our mobile applications are designed around LVB functions. When users open our flagship Mogujie mobile app, they are greeted with an intuitive interface, where can conveniently search for and enter their favorite LVB channels. Users can also easily purchase products in the LVB channel, where links to product purchase are embedded and featured on screen. Once inside the channel, our users can interact with each other or the LVB host in real time by typing chat messages, follow or subscribe to LVB hosts, and share any LVB content on social media. In addition, the LVB channels primarily function as a place for product purchase and entertainment, where users can complete fun daily challenges and recommend the LVB channel to their contacts to earn shopping award points and show their appreciation of the LVB host.
Our mobile app also features a content community, where users can browse and share fashion content, discover fashion products and find and follow LVB hosts to their liking. The community also has a “fan wall” comment page function that allows fans to communicate with the LVB hosts they follow outside of LVB streaming time, deepening the long-term interaction between LVB hosts and their fans and boosting content creation.
Weixin Mini Programs
Mini Program is an innovative platform built into Weixin, facilitating discovery and consumption of services and products. It is useful for discovery and quick actions, and complements full-function native apps by increasing their downloads and traffic.
Our KOLs
KOLs are the main creators of the popular and engaging content on our platform, which is mostly in live-streaming format. Among KOLs, our LVB hosts play an especially important role as content creators, because they are very active in streaming content that features appealing fashion products or the latest fashion trends. In their live video broadcasts, our LVB hosts often try out the fashion products they are promoting at various locations, including factory showrooms and brand flagship stores, so that the viewers have a more lively and intuitive experience with such products. Content created by our KOLs helps shape purchasing decisions of users on our platform and encourage social interactions.
We have invested in LVB host incubation programs that help us expand our LVB host talent pool and increase the popularity of LVB hosts. We have a bottom-heavy LVB host tier system, where we attract new LVB hosts from all walks of life to stream on our platform, and we discover and cultivate new LVB hosts with potential for building a large fan base and promoting product sales. in the process. We also hold events or competitions, such as the “Duo Hundred” and “Migrating Bird” plans we rolled out in 2019, to discover LVB hosts with good potential in large numbers so that we can focus on incubating them. Leveraging our experience in LVB host incubation, we cultivate and support our LVB hosts in many ways, including user traffic diversion that
64
Table of Contents
matches the LVB host’s popularity, continuing guidance on effective viewer interactions during LVB, supply chain support for products sold by the LVB host, user or fan data analytics, branding partnerships with our merchant partners, and otherwise promoting the LVB host in multiple media channels. In our internal system, we define LVB hosts who have achieved a certain level of fan following and product sales as established LVB hosts. Established LVB hosts typically possess loyal fan base, professional sales capability, and proven content creation know-how. The number of established LVB hosts are 249, 240 and 165 as of March 31, 2021, 2022 and 2023.
Our Users
Our young and engaged user base is the key to our success. Our users are from cities and towns all over China. Most of our active buyers through LVB are females of ages between 25 and 35, who are used to viewing live video broadcasts, passionate about the latest fashion and beauty trends, active on social networks, and used to online shopping. Many of our users become fans of certain LVB hosts by following them on our platform. Fans may communicate with and show support to their LVB hosts by commenting on a message wall dedicated to such hosts, where they may also like and respond to other comments, creating a virtual fan club for all participants in the process. Fans who want to help expand the LVB hosts’ fan base may do so by referring the LVB hosts’ channels to other users, who may continue this referral process with more users to rapidly expand the network of fans for the LVB hosts. Certain fans who are especially active in interaction with the LVB hosts may even become the head of their fan base, enjoying privileges such as discount on products.
Fashion Content
Our online platform serves as a one-stop destination where we distill fashion styles and trends into engaging content tailored for our users, guide them along their journey to an informed purchase decision and allow them to effortlessly act on those decisions and fulfill their transactions. Through our large and diversified content, we aim to efficiently facilitate users’ discovery of fashion trends and products with enjoyable user experience. We also make a comprehensive selection of product offerings of our merchants and brand partners integrated with the fashion content on our platform so as to capture every purchase impulse, meet the fast-evolving fashion tastes and needs of users and deliver a seamless user experience.
We strive to provide our users with the broadest range of high-quality and engaging original content, catering to both popular and niche tastes in fashion and helping users relate to fashion, and our content broadly revolves around different fashion and lifestyle topics, such as fashion and lifestyle tips, try-outs and reviews. We facilitated KOLs and users in generating content on our platform, and the content is available in a variety of multi-media formats, including:
Our comprehensive and rich content provides us with continuous monetization opportunities. Through products embedded within the content on our platform and social network platforms, we provide marketing services to our merchants and brand partners to enable them to promote their brands and products. See “— Monetization—Marketing Services.”
65
Table of Contents
Creation and Curation
Our KOLs mainly create original fashion content that often feature fashion products. Such content is mostly contained in the live video broadcasts on our platform, which is relevant and interesting to our users. We take pride in having a vibrant online community of KOLs and users who actively contribute original and inspiring fashion content.
Empowered by our AI and big data capabilities, we enable our KOLs to curate personalized fashion content so as to attract targeted audience more effectively and meet their diversified fashion preferences. We study the social and purchasing behaviors of users. Through our automated recommendation algorithm, we integrate our curated content with the most relevant merchandise and make customized recommendation to our users, meeting their different fashion needs and creating a unique and engaging user experience.
Integration with Social Network Platforms
We believe our dynamic user and KOL community contributes to our content base and brings it to life through interactive social network platforms. We distribute our content through all major social communication, social media and content platforms in China and encourage our users to share and repost our content, which amplify our brand image and enable us to reach more potential users. We primarily publish our fashion content through Weibo, Weixin, Bilibili and QQ have had our content shared widely across these platforms.
We relentlessly pursue the latest innovative social media marketing tools to make our platform more accessible and enjoyable. We leverage the functions of major social network platforms in China to enable our users to make purchases and refer LVB hosts as part of their social activities. We believe we were one of the pioneers of social-oriented marketing in China, as we believe we have a proven track record of launching simple and fun social features and other marketing campaigns that have developed into viral internet memes as they were shared and multiplied over social media networks.
Fashion E-commerce
Merchants
Sourcing
We have a dedicated team that is responsible for sourcing merchants. Our product sourcing efforts are influenced by our content, and we source merchants based on our astute understanding of fashion and accurate analysis and prediction of fashion trends.
Once potential merchants are identified and pass our review and assessment process, they are allowed to sell their products or engage a KOL to promote or sell their products on our platform. Our selection mechanism helps to ensure that our merchants are of high standards and good reputation to meet our users’ expectations. We enter into standard service agreements with our merchants, which typically have indefinite terms but may be terminated by either party with 30-day advance notice.
KOL Partnership
The partnership between our merchants and KOLs is mutually beneficial and under our supervision. Our merchants can attract KOLs to our platform due to the strength of their brand, and they also empower our KOLs primarily by providing products for them to promote or sell through their content. Our KOLs, leveraging their popularity with fans, boost the brand image of the merchants by serving as their brand ambassadors in addition to increasing their product sales. Our merchants establish contractual relationship with our KOLs directly.
Our Support
We enable our merchants to open multiple storefronts on our platform to showcase their extensive product offerings. We provide them with software and other platform-wide services, helping them promote their products and facilitate their transactions on our platform. In addition, our sophisticated AI and big data analytic capabilities empower our merchants to identify their target purchasers and better curate and offer tailored products to address the evolving needs and preferences of our users. To facilitate sales of our merchants, we match our merchants with the most suitable KOLs and organize major promotional events regularly on our platform. Lastly, the orders placed through our platform are aggregated before being processed by the merchants, which increases their supply chain effectiveness. Through all these means, we improve the efficiency of our merchants’ operations and marketing efforts and drive their growth.
66
Table of Contents
Featured Products
We give our users the accessibility and freedom to dress in style and confidently express themselves by offering a wide selection of fashion apparel and other lifestyle products, such as beauty products and accessories. We supplement our fashion product offerings with a variety of carefully selected lifestyle products in order capture a broader spectrum of user demands.
While merchants are free to set their own prices on our online platform, prices of products offered on our platform are attractive for our key user demographic. We organize a number of special sales events year-round, such as the anniversary of the founding of our company and China’s online shopping festival on November 11, and on important holidays such as Christmas and Chinese New Year, when our merchants typically offer discounts on their products. We also hold regular promotions for selected products for a limited period of time, such as flash sales events. Special promotions attract bargain hunters and give our users an additional incentive to visit our platform regularly. We have set aside special areas of our online platform for limited time offers at deep discounts. In addition, we offer discounted products to our users under a group purchase model, offering them a varied and fun shopping experience.
Quality Control
We encourage merchants to make product quality their priority. Our service agreements require merchants to represent that the products they supply are authentic, are from legitimate sources and do not infringe upon rights of third parties, and to indemnify us for any damages resulting from any breach of such representations. In addition, merchants on our platform are required to offer consumer protection programs, such as nation-wide free shipment services, guaranteed timely shipment and returns and product warranties. Over the last few years, we introduced monetary penalties on merchants who violated our service guarantees or sold products with quality issues on our platform as an additional quality assurance measure. We monitor and control the quality and performance of our merchants through multiple policies and measures, including requiring merchants to pay guarantee deposits for the quality of their products sold via our platforms.
Customer Service
Providing a superior customer experience and maintaining customer satisfaction are at the heart of what we do. We have developed key policies and procedures for our customer service that maintain the health and sustainability of our platform, including consumer protection programs, platform rules, qualification standards for merchants and buyer, seller and LVB host rating systems.
Our around-the-clock customer service center provides real-time assistance to our massive customer base. Customers can access our sales and after-sales online representatives constantly. We have a dedicated in-house team of customer service representatives. We train our customer service representatives to answer customer inquiries and proactively educate potential customers about products and promptly resolve customer complaints. Each representative is required to complete mandatory training, conducted by experienced managers on product knowledge, complaint handling and communication skills. Our commitment to excellent customer services has ensured the high quality of user experience and the strong growth in our customer base.
Payment
In addition to accepting user payment directly on our platform, we cooperate with leading third-party online payment service providers in China, including Weixin Pay, Alipay, LianLian Pay and China UnionPay, to enable our buyers to make payments for their purchases easily and efficiently. We are not dependent on any particular provider for online payment services.
Delivery, Returns and Exchanges
Merchants on our platform are required to ship their products using designated reputable delivery service providers. We cooperate with a number of third-party delivery companies that merchants can choose to use to fulfill orders and deliver their products to customers. To ensure timely delivery of products, merchants are bound by the terms of their service agreements with us to ship their products within the stipulated timeframe that they had promised to their customers at the time of purchase, failure of which will subject such merchants to mandatory penalty paid to their customers.
We generally offer a seven-day free return and exchange policy for products purchased from our platform. In the event that a merchant does not handle a return request and make the refund payment, we will be involved to resolve the refund request and charge back to the merchant.
67
Table of Contents
For successful product return or exchange with respect to qualified users, we compensate a portion of the shipping expense incurred by the user. In addition, we cooperate with third-party insurance companies who provide us with shipping return and exchange insurance, which cover users’ return or exchange shipping expenses.
Monetization
We monetize across the fashion value chain through a variety of means including marketing services, commissions and financial services to users and merchants.
Commission
We earn commissions from merchants on our platform when transactions are completed and settled. Such commissions are generally determined as an agreed percentage of the value of merchandise sold by merchants based on the sources and formats of our GMV. We typically charge a commission rate of approximately 5% to merchants that choose our entry-level service offerings. For live video merchants, a commission rate of 10% is typically charged.
Marketing Services
We provide various types of marketing services to empower our KOLs and the merchants on our platform to gain more exposure to our users. In particular, KOLs can benefit from our marketing services to attract more fans and to increase their sales volume. We primarily charge marketing service clients on a cost-per-click or cost-per-mille basis.
Technology service
We provide businesses with marketing needs with one-stop and customized services for their online operations, including various website operational services, data management platforms and other software, as well as value-added services such as data traffic improvements and technology services to insurance companies.
Financial Services
We offer financing solutions to our users to serve their consumption and credit needs when purchasing merchandise on our platform. We also cooperate with third-party financial institutions and display their consumer financing products on our platform for our users. In addition, we provide a variety of short-term financing solutions to our qualified merchants, which enable them to obtain cost-effective financing to expand their operations and improve their liquidity.
Branding and Marketing
We believe that our rich content and satisfactory user experience have contributed to the expansion of our user base and the increase in user engagement, leading to a strong word-of-mouth effect that strengthens our brand awareness.
Technology and Infrastructure
The success of our business is supported by our strong technological capabilities that enable us to deliver superior user experience and increase our operational efficiency. Our technology team, coupled with our proprietary technology infrastructure and the large volume of data generated and collected on our platform each day, have created opportunities for continuous improvements in our technology capabilities, empowering reliability, scalability and flexibility.
Artificial Intelligence
With access to a massive amount of data, we believe we are in a unique position to capitalize on the use of artificial intelligence technology to improve our risk management, operating efficiencies and user satisfaction. To date, we have applied various artificial intelligence and machine learning technologies on our platform in multiple areas. We utilize artificial intelligence and machine learning technologies to develop automated customer service chatbots, which have significantly improved customer experience and reduced our operating expenses. Our deep learning capabilities accelerate our innovations in areas such as image recognition as well as product and content recommendation. Leveraging our data insights and technology capabilities, our credit assessment engine can predict the creditworthiness of each customer and merchant through sophisticated algorithms and a dynamic model. The customer and merchant behavior and risk profile data power our machine learning algorithms that improve our risk management capabilities. As a result of our automation and data capabilities, we are able to perform comprehensive credit analysis on our merchants and customers.
68
Table of Contents
Big Data
We build our big data analytics capability upon computing infrastructure that can efficiently handle complex computing tasks of billions of data instances and millions of analytical dimensions. Based on users’ purchase behaviors and usage patterns, we leverage big data analytics and artificial intelligence technology to enhance the accuracy of user behavior predictions and user profiling and optimize our operation, targeted marketing and user experience. For example, we not only look into the basic order information but also user behavioral data such as how long such user spent on browsing and reviewing a particular product and products of similar categories or styles. We then strive to build predictive and statistical models based on the big data we have accumulated.
The seamless collaboration among our technology and operational teams, together with our big data analytics capability, result in improved operational efficiency. Our algorithm engineers are fully involved in all critical operational areas. They have thorough understanding of the computational needs from different business segments, and are therefore capable of providing technological support to address diversified needs in operating our business.
Security and Data Privacy
We are committed to protecting information security of all participants on our platform. We collect personal information and data only with users’ prior consent.
We back up our user and other forms of data daily in separate and various secured data back-up systems to minimize the risk of data loss. We also conduct frequent reviews of our back-up systems to ensure that they function properly and are well maintained. Our back-end security system is capable of handling malicious attacks each day to safeguard the security of our platform and to protect the privacy of our users and merchants.
We have a data security team of engineers and technicians dedicated to protecting the security of our data. We have also adopted strict data protection policy to ensure the security of our proprietary data. We encrypt confidential personal information we gather from our platform. To ensure data security and avoid data leakage, we have established stringent internal protocols under which we grant classified access to confidential personal data only to limited employees with strictly defined and layered access authority. We strictly control and manage the use of data within our various departments.
Cloud Services
We have developed a secure, efficient and cost-effective cloud-based core system to operate our business. Cloud-based technology allows us to process large amount of complex data in-house, which significantly reduces cost and improves operation efficiency. Our cloud-based core system connects external cloud service system with our merchants to provide them with product development and supply chain management solutions. We also have multiple layers of redundancy to ensure the reliability of our network. We also have a working data redundancy model with comprehensive backups of our databases conducted every day.
Risk Management
Content Screening and Monitoring
We are committed to complying with the relevant laws and regulations on online content. We have invested significant resources in developing advanced content monitoring technologies, policies and procedures.
We maintain content management and review procedures to monitor live video broadcast content on our platform to ensure that we are able to promptly identify content that may be deemed to be inappropriate, in violation of laws, regulations and government policies or infringing upon third-party rights. When any inappropriate or illegal content is identified, we promptly terminate the live video broadcasts and remove the concerned comments. Further actions may also be taken to hold relevant content creators accountable.
Our automated AI-backed screening mechanism serves as the first layer of defense in our content review system. This system automatically flags and screens out live video broadcasts that involve inappropriate or illegal audio, video, comments or chats by comparing the image, sound or text against our databases in real time. Once the content is processed by our AI-backed automated screening mechanism, our system then extracts identifiers from the content and sends them to our manual content screening team, our second layer of defense, for further review. We have a dedicated team reviewing and handling content on our platform for compliance with applicable laws and regulations. Our manual content screening team constantly monitors content uploaded to our platform to ensure that the flagged content is reviewed and any inappropriate or illegal live video broadcasts is immediately suspended or
69
Table of Contents
terminated. In addition, our manual content screening team proactively monitors and reviews the live video broadcasts independently on a real-time basis.
Finally, we have adopted an easy-to-use and responsive abuse reporting mechanism on our platform, which allows any of our users to report inappropriate content through “report” links. Any content being reported will be reviewed by our content screening team and appropriate actions will be taken.
Our LVB hosts are required to register with our platform on a real-name basis. In addition, we require hosts to consent to the terms and conditions set forth in the host agreement of our platform before they can start live video broadcasts. Pursuant to such agreement, each host undertakes not to live video broadcast or otherwise distribute content that violates any PRC laws or regulations or infringes upon the intellectual property rights of any third party, and agrees to indemnify us for all damages arising from third-party claims against us caused by the infringing content produced by such host.
Credit Risks
We take advantage of our big data and machine learning capabilities to effectively manage risks associated with our business. We believe that we are well positioned to assess credit risks, predict spending and borrowing behaviors, and serve the credit needs of our merchants and customers.
Data Aggregation. We collect and continuously update merchant and customer credit data from internal and external sources. Factors we consider important for assessing the probability of delinquency include, among others, repayment history, fraudulent records, identity information, contact information, amount and source of income, occupation, credit information from the People’s Bank of China and other third parties, online consumption activities, and behaviors on our platform, third-party platforms and social networks. We are able to analyze data and capture useful parameters to feed into our risk assessment models, and quickly iterate and adjust these models based on newly acquired data, further improving our risk management capabilities.
Anti-fraud. Our anti-fraud model uses a multifaceted detection process to identify both individual and collusive frauds. We use existing fraud databases, particularly credit blacklists maintained by us or our business partners. We conduct social network analysis to analyze users’ personal relationships and identify abnormal behavioral patterns that are pertinent to fraud detection. We continuously update our fraud database with new information on similar borrowers to improve the effectiveness of our fraud detection.
Collection. We monitor the delinquency rate of our financing solutions in real time, and allocate resources in advance according to the quantity and performance of outstanding loans. We have a dedicated collection team which monitors the repayment status of our borrowers, and they follow up with the delinquent borrowers in the event of late repayment or default via sending reminder messages or making phone calls in accordance with our comprehensive collection guidelines.
Intellectual Property
Our trademarks, software copyrights, service marks, domain names, trade secrets, proprietary technologies and other intellectual property are critical to our success, and we rely on trademark, copyright and trade secret protection laws in the PRC, as well as confidentiality procedures and contractual provisions with our employees, service providers, KOLs, third-party merchants business customers and others to protect our proprietary rights. As of March 31, 2023, we own 18 registered patent, 1009 registered trademarks in the PRC, copyrights to 240 software programs developed by us relating to various aspects of our operations, and 205 registered domain names, including mogu.com, mogujie.com and meilishuo.com.
Competition
The fashion retail industry in China is highly competitive and rapidly evolving. Our primary competitors include (i) major e-commerce platforms in China, (ii) major traditional and brick-and-mortar fashion retailers in China, and (iii) social media platforms and content providers in China that cover the fashion and apparel industries. With the acquisition of Ruisha Technology in July 2021, we also expect to expand our business operations to further serve business customers and deepen our business cooperation with them by providing customized solutions for their online operations. As such, we also compete with businesses that provide customized solutions and operational services to online operations of brand-named and other retail companies.
We compete primarily on the basis of the following factors: (i) our ability to attract, incubate and empower high-quality KOLs, especially LVB hosts, in growing numbers; (ii) the relevance of our fashion-related content for our targeted user base; (iii) our ability to seamlessly connect content with merchandise; (iv) the superior shopping experience on our platform; (v) our large and active user base; (vi) pricing of products and services provided via our platform; (vii) our ability to attract and retain merchants and business
70
Table of Contents
with marketing needs; (viii) product and service quality and selection; (ix) brand recognition and reputation; (x) the experience and expertise of our management team; and (xi) our capacity and resources to provide customed solutions to business customers.
We believe that we are well-positioned to effectively compete on the basis of the factors listed above. However, our competitors may have longer operating histories, greater brand recognition, better relationships with merchants and brand partners, stronger infrastructure, larger user base or greater financial, technical or marketing resources than we do, and they may also offer similar products and services.
Insurance
We maintain various insurance policies to safeguard against risks and unexpected events. We have contracted with leading Chinese insurance companies to obtain their insurance coverage for losses incurred by us in subsidizing product return shipment costs of users. In addition, we provide group accident insurance and supplementary medical insurance for certain of our employees.
Regulation
Regulations on Value-added Telecommunication Services
Regulations on Foreign Investment
On March 15, 2019, the National People’s Congress promulgated the PRC Foreign Investment Law, or the Foreign Investment Law, which came into effect on January 1, 2020 and replace the existing laws regulating foreign investment in China, namely the Sino-foreign Equity Joint Venture Enterprise Law, the Sino-foreign Cooperative Joint Venture Enterprise Law and the Wholly Foreign-invested Enterprise Law, together with their implementation rules and ancillary regulations. The organization form, organization and activities of foreign-invested enterprises shall be governed, among others, by the PRC Company Law and the PRC Partnership Enterprise Law. Foreign-invested enterprises established before the enacting and implementation of the Foreign Investment Law may remain their organization forms within five years after the implementation of the Foreign Investment Law.
The Foreign Investment Law is formulated to further expand opening-up, vigorously promote foreign investment and protect the legitimate rights and interests of foreign investors, and the Foreign Investment Law establishes the basic framework for the access to, and the promotion, protection and administration of foreign investments in view of investment protection and fair competition. According to the Foreign Investment Law, “foreign investment” refers to investment activities directly or indirectly conducted by one or more natural persons, business entities, or otherwise organizations of a foreign country (collectively referred to as “foreign investor”) within China, and the investment activities include the following situations: (i) a foreign investor, individually or collectively with other investors, establishes a foreign-invested enterprise within China; (ii) a foreign investor acquires stock shares, equity shares, shares in assets, or other similar rights and interests of an enterprise within China; (iii) a foreign investor, individually or collectively with other investors, invests in a new project within China; and (iv) investments in other means as provided by laws, administrative regulations, or the State Council.
Pursuant to the Foreign Investment Law, the State Council will publish or approve to publish a catalog for special administrative measures, or the “negative list.” Once an entity falls within the definition of foreign investment entity, it may be subject to foreign investment “restrictions” or “prohibitions” set forth in a “negative list” to be separately issued by the State Council later. If a foreign investment entity proposes to conduct business in an industry subject to foreign investment “restrictions” in the “negative list,” it must go through a pre-approval process. The current industry entry clearance requirements governing investment activities in the PRC by foreign investors are set out in two categories both issued by the National Development and Reform Commission and the MOFCOM issued, namely the Encouraged Foreign Investment Catalog (2020 version), as promulgated on December 27, 2020 and took effect on January 27, 2021, and the Special Entry Management Measures (Negative List) for the Access of Foreign Investment (2021 version), or the 2021 Negative List, which was promulgated on December 27, 2021 and took into effect on January 1, 2022. The 2021 Negative List sets out the industries in which foreign investments are prohibited or restricted, and according to the 2021 Negative List, the proportion of foreign investment in entities engaged in value-added telecommunication services (excluding e-commerce, domestic multi-party communications services, store-and-forward services, and call center services) shall not exceed 50%.
Among others, the state guarantees that foreign invested enterprises participate in the formulation of standards in an equal manner and that foreign-invested enterprises participate in government procurement activities through fair competition in accordance with the law. The state shall not expropriate any foreign investment except under special circumstances, where the state may levy or expropriate the investment of foreign investors in accordance with the law for the needs of the public interest.
On December 26, 2019, the State Council issued the Implementation Regulations for the Foreign Investment Law of the PRC, or the Implementation Regulations, which became effective on January 1, 2020. Under the Implementation Regulations, in the
71
Table of Contents
event of any discrepancy between provisions or regulations on foreign investment formulated or promulgated prior to January 1, 2020 and the Foreign Investment Law and the Implementation Regulations, the Foreign Investment Law and the Implementation Regulations shall prevail. The Implementation Regulations also indicated that foreign investors that invest in sectors on the Negative List in which foreign investment is restricted shall comply with special management measures with respect to shareholding, senior management personnel and other matters in the Negative List. The Foreign Investment Law and the Implementation Regulations do not mention the relevant concept and regulatory regime of VIE structures. However, since it is relatively new, uncertainties still exist in relation to its interpretation and implementation. See “Item 3. Key Information—D. Risk Factors—Risks Related to Our Corporate Structure—Uncertainties exist with respect to the interpretation and implementation of the newly enacted PRC Foreign Investment Law and how it may impact the viability of our current corporate structure, corporate governance and business operations.”
On December 30, 2019, the MOFCOM and the State Administration for Market Regulation, or the SAMR, jointly issued the Measures for Reporting of Foreign Investment Information, or the Foreign Investment Information Measures, which came into effect on January 1, 2020 and replaced the Interim Administrative Measures for the Record-filing of the Establishment and Modification of Foreign-invested Enterprises. Since January 1, 2020, for foreign investors carrying out investment activities directly or indirectly in the PRC, foreign investors or foreign-invested enterprises shall submit investment information through the Enterprise Registration System and the National Enterprise Credit Information Publicity System operated by the SAMR. Foreign investors or foreign-invested enterprises shall disclose their investment information by submitting reports for their establishments, modifications and cancellations and their annual reports in accordance with the Foreign Investment Information Measures, and relevant information will be shared by the competent market regulation department to the competent commercial department, and separate report to the commercial department is no longer required.
Regulations on Foreign Investment in the Value-added Telecommunications Industry
Foreign direct investment in telecommunications companies in China is governed by the Provisions on the Administration of Foreign-Invested Telecommunications Enterprises, which was promulgated by the State Council on December 11, 2001 and amended on September 10, 2008, February 6, 2016, and March 29, 2022. These regulations require that foreign-invested value-added telecommunications enterprises in China must be established as Sino-foreign equity joint ventures and that foreign investors may not hold a majority equity interest in such joint ventures. In addition, foreign investors must demonstrate significant experience in value-added telecommunications business as well as a good business track record. Moreover, foreign investors that meet these requirements must obtain approvals from the MIIT and the MOFCOM, to provide value-added telecommunication services in China and the MIIT and the MOFCOM retain considerable discretion in granting such approvals.
On July 13, 2006, the Ministry of Information Industry (the predecessor of the MIIT) issued the Circular on Strengthening the Administration of Foreign Investment in and Operation of Value-added Telecommunications Business, pursuant to which a PRC company that holds an Internet Content Provider License, or the ICP License, is prohibited from leasing, transferring or selling the ICP License to foreign investors in any form, and from providing any assistance, including resources, sites or facilities, to foreign investors that conduct value-added telecommunications business illegally in China. Moreover, the domain names and registered trademarks used by an operating company providing value-added telecommunications service shall be legally owned by such company and/or its shareholders. In addition, such company’s operation premises and equipment must comply with its approved ICP License, and such company should improve its internal internet and information security standards and emergency management procedures.
On June 19, 2015, MIIT issued the Circular on Loosening the Restrictions on Shareholding by Foreign Investors in Online Data Processing and Transaction Processing Business (for-profit E-commerce), or the Circular 196. The Circular 196 allows a foreign investor to hold 100% of the equity interest in a PRC entity that provides online data processing and transaction processing services (for-profit E-commerce). With respect to the applications for a license for on-line data processing and transaction processing business (for-profit E-commerce), the requirements for the proportion of foreign equity are governed by this Circular, other requirements and corresponding approval procedures are subject to the FITE Regulations. However, due to the lack of additional interpretation from PRC regulatory authorities, it remains unclear as to what impact MIIT Circular 2015 may have on us or other PRC internet companies with similar corporate and contractual structures.
In view of these restrictions on foreign direct investment in value-added telecommunications services and certain other types of businesses under which our business may fall, including internet culture services, internet audio-visual program services and radio/television programs production and operation business, we engage in value-added telecommunications services through various VIEs established in China. For more information, please see “Item 4. Information on the Company—C. Organizational Structure—Contractual Arrangements with The VIEs and Their Respective Shareholders.” Due to the lack of interpretative guidance from the relevant PRC governmental authorities, there are uncertainties regarding whether PRC governmental authorities would consider our corporate structure and contractual arrangements to constitute foreign ownership of a value-added telecommunications business. See “Item 3. Key Information—D. Risk Factors—Risks Related to Our Corporate Structure— If the PRC government determines that the
72
Table of Contents
contractual arrangements constituting part of the VIE structure do not comply with PRC regulations, or if these regulations or the interpretation of existing regulations change in the future, we could be subject to severe penalties or be forced to relinquish our rights under the contractual agreements in those operations, which may cause the value of our ADSs to significantly decline or become worthless.” If our current ownership structure is found to be in violation of current or future PRC laws, rules or regulations regarding the legality of foreign investment in value-added telecommunications services and other types of businesses on which foreign investment is restricted or prohibited, we could be subject to severe penalties.
Regulations on Telecommunications Services and Content
Regulations on Telecommunications Services
On September 25, 2000, the State Council promulgated the Telecommunications Regulations of PRC, or the Telecom Regulations, which was amended on July 29, 2014 and February 6, 2016. Pursuant to the Telecom Regulations, operators of value-added telecommunications services are required to obtain operating licenses from the MIIT or its provincial branches.
According to the Catalog of Telecommunications Services (2015 Amendment) promulgated on December 28, 2015, effective as of March 1, 2016 and amended on June 6, 2019, or the Catalog, Internet information services, or ICP service and online data processing and transaction processing services (for-profit e-commerce), or EDI Service are classified as value-added telecommunications services, and the provider of ICP Service and EDI Service shall obtain ICP License and EDI Licenses from the MIIT, or its provincial branches, prior to the provision of ICP Services or EDI Services.
Regulations on Content
The Administrative Measures on Internet Information Services, or the ICP Measures, promulgated by the State Council on September 25, 2000 and amended on January 8, 2011, a commercial ICP service providers who also provide internet information services related to news, publishing, education, medical treatment, health, pharmaceuticals or medical apparatus, certain approvals from the relevant PRC competent authorities shall be obtained before applying for ICP License or carrying out record-filing procedures. In addition, the ICP Measures and other relevant measures also prohibit publication of any content that propagates, among others, obscenity, pornography, gambling and violence, incite the commission of crimes or infringe upon the lawful rights and interests of third parties. In July 2017, the MIIT promulgated a new version of the Administrative Measures on Telecommunications Business Operating Licenses, which take effect on September 1, 2017 and supersede the Administrative Measures on Telecommunications Business Operating Licenses (2009 version). The new Administrative Measures on Telecommunications Business Operating Licenses simplifies the procedures to apply for telecommunications business operating license and strengthens the supervision of daily operation of telecommunications business.
We engage in internet information services as defined in the Catalog and the ICP Measures. To comply with the relevant laws and regulations, each of Hangzhou Juangua and Beijing Meilishikong, as our information services operator, holds an ICP License for the operation of our ICP Services, and each of Hangzhou Juangua and Hangzhou Shiqu, as our EDI Service operators, holds an EDI License for the operation of our EDI Services. For further information, see “Item 3. Key Information—D. Risk Factors—Risks Related to Our Business and Industry—If we fail to obtain and maintain the licenses, permits and approvals required or applicable to our business under the complex regulatory environment for our businesses in China, our business, financial condition and results of operations may be materially and adversely affected.”
Regulations on Internet Audio-Visual Program Services
The Ministry of Culture (the predecessor of the Ministry of Culture and Tourism), promulgated the Interim Administrative Provisions on Internet Culture, or the Internet Culture Provisions on February 17, 2011 and further amended on December 15, 2017. Pursuant to the Internet Culture Provisions, providers of internet audiovisual programs and internet game operations must file an application for establishment to the competent culture administration authorities for approval and must obtain the online culture operating permit.
On September 15, 2021, the CAC promulgated the Opinions on Further Enforcing Responsibilities on Website Platforms as the Main Responsible Party for Information Content Management. Pursuant to the Opinions, website platforms are required to perform specific responsibilities as the main responsible party for information content management, including, among others, enhancing the platform community rules, strengthening the regulation and management of accounts, improving the content vetting mechanism, improving the quality of information content, managing the dissemination of information content, and strengthening the management of key functions.
73
Table of Contents
Audio-Visual License
On December 20, 2007, the State Administration of Press, Publication, Radio, Film and Television, or the SARFT (the predecessor of the National Radio and Television Administration) and the MII jointly promulgated the Administrative Provisions on Internet Audio-Visual Program Services, or the Audio-Visual Program Provisions, which became effective as of January 31, 2008 and was subsequently amended on August 28, 2015. Providers of internet audio-visual program services are required to obtain the license for online transmission of audio-visual programs, or the Audio-Visual License issued by SARFT, or complete record-filing procedures with SARFT. In general, providers of internet audio-visual program services must be either state-owned or state-controlled entities, and their businesses must satisfy the overall planning and guidance catalog for internet audiovisual program service determined by SARFT.
On May 21, 2008, SARFT issued a Notice on Relevant Issues Concerning Application and Approval of License for the Online Transmission of Audio-Visual Programs, which was amended on August 28, 2015, and further sets out detailed provisions concerning the application and approval process regarding the Audio-Visual License. The notice also stipulates that internet audio-visual program services providers which had engaged in such services prior to the promulgation of the Audio-Visual Program Provisions are able to apply for the license so long as (i) the violation of the laws and regulations is minor in scope and can be rectified in a timely manner, and (ii) the providers had no violations of laws during the last three months prior to the promulgation of the Audio-Visual Program Provisions.
On March 30, 2009, SARFT promulgated the Notice on Strengthening the Administration of the Content of Internet Audio-Visual Programs, which reiterates the pre-approval requirements for the audio-visual programs transmitted via the internet, including through mobile networks, where applicable, and prohibits internet audiovisual programs containing violence, pornography, gambling, terrorism, superstition or other similarly prohibited elements.
On April 1, 2010, the SARFT issued the Internet Audio-visual Program Services Categories for trial implementation, or the Categories, which was amended on March 10, 2017. In addition, the Notice concerning Strengthening the Administration of the Live Video Broadcast Service of Online Audio-Visual Programs promulgated by the State Administration of Press, Publication, Radio, Film and Television (the predecessor of the National Radio and Television Administration) on September 2, 2016 emphasizes that, unless a specific license is granted, audio-visual programs service provider is forbidden from engaging in live video broadcast on major political, military, economic, social, cultural, sports, etc.
CAC Rules
On November 4, 2016, the Cyberspace Administration of China, or the CAC, promulgated the Provisions on the Administration of Online Live Video Broadcast Services effective as of December 1, 2016. Under these provisions, an online live video broadcast service provider shall (i) establish a live video broadcast content review platform; (ii) conduct authentication registration of internet live video broadcast issuers based on their identity certificates, business licenses and organization code certificates; and (iii) enter into a service agreement with internet live video broadcast services user to specify both parties’ rights and obligations.
On July 12, 2017, the CAC issued a notice requiring that online live video broadcast service providers shall file with local branches of the CAC from July 15, 2017 so as to tighten the scrutiny on the content distributed through the live video broadcast platforms.
Although we do not believe that providing sales promotion activities through live video broadcast shall be recognized as providing internet audio-visual programs related services to the public, and should not require an Audio-Visual License, the relevant PRC government authorities, including the SARFT, may not reach the same conclusion as we do, and we may be required to obtain an Audio-Visual License or any additional licenses or approvals. One of our VIEs, Hangzhou Juangua, has duly completed such record-filing procedures. See “Item 3. Key Information—D. Risk Factors—Risks Related to Our Business and Industry—If we fail to obtain and maintain the licenses, permits and approvals required or applicable to our business under the complex regulatory environment for our businesses in China, our business, financial condition and results of operations may be materially and adversely affected.”
Regulations on Consumer Protection and Advertising
Regulations on Consumer Protection
On October 31, 1993, the SCNPC promulgated the Law on the Protection of Rights and Interests of Consumers, or the Consumer Protection Law, which was amended on August 27, 2009 and October 25, 2013. Pursuant to the Consumer Protection Law, the business operators must ensure that the commodities they sell satisfy the safety requirements, provide consumers with authentic information, and guarantee the quality, function, term of use of the commodities. Failure to comply with the Consumer Protection Law
74
Table of Contents
may subject business operators to liabilities such as refund, returns, repairs, and payment of damages. If business operators infringe the legal rights and interests of consumers, they may be subject to criminal liabilities. The amended Consumer Protection Law launched in October 2013 further enhances consumer protection and intensifies the obligations imposed on online trading platform and business operators.
The Civil Code of the PRC, which was promulgated by the SCNPC on May 28, 2020 and became effective on January 1, 2021, provides that if an online services provider is aware or should aware that an online user is engaged in infringing activities, such as selling counterfeit products through its internet services, but fails to take necessary measures, it shall be held jointly liable. If the online service provider receives any notice from the infringed party on any infringing activities, the online service provider shall take necessary measures, including removing, blocking and unlinking the infringing content, in a timely manner. Otherwise, it shall be held jointly liable with the relevant online user.
On May 31, 2010, the SAIC (the predecessor of the State Administration of Market Regulation) adopted the Interim Administrative Measures for the Online Commodities Trading and Relevant Services. According to these measures, enterprises or other operators which engage in online commodities trading and other services that have been registered with SAIC or its local branches must make the information available to the public in their business licenses, either through physical copies or electronic links. Operators that provide platform services for online trading shall review the identities of companies or individuals that apply for provision of commodities and services through online trading platform, conclude agreements with the aforesaid parties as well as establish relevant internal rules to provide necessary and reliable transaction environment and transaction service, and maintain order of online trading.
On January 26, 2014, the SAIC promulgated the Administrative Measure for the Online Trading, or the Online Trading Measures, which became effective as of March 15, 2014 and replaced the above measures. The online trading platform operators are obligated to examine the legal status of the third-party merchants and make the information such third-party merchants available to the public through business licenses, either through displaying the information specified in their business licenses or electronic links to their business licenses. The online trading platform operators must distinguish between their own products and those of third-party merchants on the platform, as applicable. Subsequent to the Online Trading Measures, the SAIC issued the Guidelines for the Performance of Social Responsibilities by Online Trading Platform Operators on May 28, 2014 to regulate online product trading and the relevant services, guide online trading platform operators to actively perform social responsibilities, protect the lawful rights and interests of consumers and business operators and promote the sustainable and healthy development of online economy. These guidelines aim at enhancing the social responsibilities of online trading platforms.
On January 6, 2017, the SAIC promulgated the Interim Measures for 7-day Unconditional Return of Online Purchased Goods, which was effective as of March 15, 2017. Under such measures, customers are entitled to return goods without cause, subject to certain exceptions. For example, these measures shall not apply to customized goods, newspapers or periodicals, perishable goods, audio-visual products, computer software and other digital products, products downloaded from the internet or products whose packages have been opened by customers. Online trading platform operators should guide and supervise the merchants who use the platform to perform the duties of “7-day Unconditional Return,” conduct inspections, and provide technical support.
Regulations on Advertising
On October 27, 1994, the SCNPC promulgated the Advertising Law, which was amended on April 24, 2015. Under the Advertising Law, advertisers refer to any legal persons, economic organizations or individuals that, directly or through agents, design, produce and publish advertisements to promote products or services. Advertisement operators refer to those legal persons, economic organizations or individuals consigned to provide advertisement content design, production and agency services. Advertisement publishers refers to those legal persons or other economic organizations that publish advertisements for the advertisers or for those advertisement operators which are consigned by the advertisers. An advertisement should present distinct and clear descriptions of the product’s function, place of origin, quality, price, manufacturer, validity period, warranties or the contents, forms, quality, price or promises of the services offered. False advertising that may mislead consumers and compromise legal rights and interests of consumers shall subject the advertiser to civil liabilities. Where the advertising operator or advertising publisher is unable to provide the real name, address or valid contact information of the advertiser, the consumers may require the advertising operator or advertising publisher make compensation in advance. For false advertisements of goods or services other than those stipulated in the preceding paragraph which caused harm to consumers, where the advertising operator, advertising publisher and advertising spokesperson knew or should have known the falsity yet still provided design, production, agency or publishing services, or provide recommendation or endorsement, they shall bear joint and several liability with the advertiser.
On July 4, 2016, the SAIC promulgated the Interim Measures for the Administration of Internet Advertising, or the Internet Advertising Measures, which became effective as of on September 1, 2016. The Internet Advertising Measures set forth further compliance requirements for online advertising business in addition to those in the Advertising Law. Pursuant to the Internet Advertising Measures, Internet Advertising refers to the commercial advertising for direct or indirect marketing goods or services in
75
Table of Contents
the form of text, image, audio, video, or others means through websites, webpages, internet apps, or other internet media. Major additional compliance requirements are: (i) advertisements must be identifiable and marked with the word “advertisement,” enabling consumers to distinguish them from non-advertisement content; (ii) publishing advertisements on the Internet through a pop-up page or in other forms shall provide a prominently marked “CLOSE” button to ensure “one-click closure”; (iii) sponsored search results must be clearly distinguished from organic search results; (iv) it is forbidden to send advertisements or advertisement links by email without the recipient’s permission or induce Internet users to click on an advertisement in a deceptive manner; and (v) internet information service providers that do not participate in the operation of internet advertisements should stop publishing illegal advertisements if they know or should know that the advertisements are illegal.
Regulations on Cybersecurity and Privacy
Regulations on Cybersecurity
On December 16, 1997, the Ministry of Public Security, or the MPS, issued the Administration Measures on the Security Protection of Computer Information Network with Internationally Connections, as amended on January 8, 2011, which prohibit using the internet in ways which, among others, result in a leakage of state secrets or a spread of socially destabilizing content. On December 28, 2000, the SCNPC enacted the Decision on the Protection of Internet Security, as amended on August 27, 2009, which provides that the following activities conducted through the internet are subject to criminal liabilities: (a) gaining improper entry into any of the computer information networks relating to state affairs, national defensive affairs, or cutting-edge science and technology; (b) spreading rumor, slander or other harmful information via the internet for the purpose of inciting subversion of the state political power; (c) stealing or divulging state secrets, intelligence or military secrets via internet; (d) spreading false or inappropriate commercial information; or (e) infringing on the intellectual property.
On December 13, 2005, the MPS promulgated Provisions on Technological Measures for Internet Security Protection, or the Internet Protection Measures, which took effect on March 1, 2006. All internet information services operators are required to take proper measures to control computer viruses, back up data, and keep records of certain information about their users (including user registration information, log-in and log-out time, IP address, content and time of posts by users) for at least 60 days. In June 2007, the MPS, State Secrecy Administration, State Cryptography Administration jointly promulgated the Administrative Measures for the Multi-level Protection of Information Security, under which companies operating and using information systems shall protect the information systems and any system equal to or above level II as determined in accordance with these measures, a record-filing with the competent authority is required.
On November 7, 2016 the SCNPC promulgated the Cybersecurity Law, which became effective as of June 1, 2017. Regarded as the fundamental law in the area of cybersecurity in China, the Cybersecurity Law regulates network operators and others from the following perspectives: the principle of Cyberspace sovereignty, security obligations of network operators and providers of network products and services, protection of personal information, protection of critical information infrastructure, data use and cross-border transfer, network interoperability and standardization. Under the Cybersecurity Law, network operators are generally obligated to protect their networks against disruption, damage or unauthorized access, and to prevent data leakage, theft or tampering. In addition, network operators will also be subject to specific rules depending on their classification under the multi-level network security protection scheme. Providers of network products and services must comply with national standards and ensure the security of their products. The critical network equipment and network security products must be tested by accredited evaluation centers before being marketed in China.
On June 10, 2021, the Data Security Law was promulgated by the SCNPC, which became effective on September 1, 2021. The Data Security Law mainly sets forth specific provisions regarding establishment of basic systems for data security management, including hierarchical data classification management system, risk assessment system, monitoring and early warning system, and emergency disposal system. In addition, the Data Security Law clarifies the data security protection obligations of organizations and individuals carrying out data related activities and implementing data security protection measures.
Regulations on Privacy Protection
On July 16, 2013, the MIIT promulgated the Protection Provisions for the Personal Information of Telecommunications and Internet Users, effective as of September 1, 2013, to regulate activities of collecting and using the personal information of users in the process of providing telecommunications services and Internet information services within PRC territory, under which telecommunications business operators and internet information service providers are required, in the course of providing services, to collect and use the personal information of users in a lawful and proper manner by following the principle that information collection or use is necessary and responsible for the security of the personal information of users collected and used in the course of providing services. In addition, the Personal Information Protection Provision also explicitly rules that without the consent of users, no telecommunications business operators and Internet information service providers are allowed to collect and use the personal information of users. On June 28, 2016, the CAC promulgated the Administrative Provisions on Mobile Internet Applications
76
Table of Contents
Information Services, or the APP Provisions, which became effective as of August 1, 2016 further clarified that Internet application providers shall not activate such functions as collecting geographical location, reading the address book, using camera, and recording, without giving an explicit indication to and obtaining consent from users. Any violation of these laws and regulations may subject the internet information service provider to warnings, fines, confiscation of illegal gains, revocation of licenses, cancelation of filings, closedown of websites or even criminal liabilities.
In addition, pursuant to the Notice on Legally Punishing Criminal Activities Infringing upon the Personal Information of Citizens issued by of the Supreme People’s Court, the Supreme People’s Procuratorate and the MPS in 2013, and the Interpretation on Several Issues regarding Legal Application in Criminal Cases Infringing upon the Personal Information of Citizens issued by the Supreme People’s Court and the Supreme People’s Procuratorate in May 2017, the following activities may constitute the criminal infringement upon a citizen’s personal information: (i) providing a citizen’s personal information to specified persons or releasing a citizen’s personal information online or through other methods in violation of relevant national provisions; (ii) providing legitimately collected information relating to a citizen to others without such citizen’s consent (unless the information is processed, not traceable to a specific person and not recoverable); (iii) collecting a citizen’s personal information in violation of applicable rules and regulations when performing a duty or providing services; or (iv) collecting a citizen’s personal information by purchasing, accepting or exchanging such information in violation of applicable rules and regulations.
On August 29, 2015, the SCNPC issued the Ninth Amendment to the Criminal Law, effective as of November 1, 2015, to stipulate that any online service provider that fails to fulfill the obligations related to internet information security administration and refuses to rectify upon orders is subject to criminal penalty for causing (i) any dissemination of illegal information in large scale; (ii) any significant damages due to the leakage of the client’s information; (iii) any serious loss of criminal evidence; or (iv) other serious harm. Any individual or entity information may be subject to criminal penalty for (i) illegally selling or providing personal information to third parties, or (ii) stealing or illegally obtaining any personal information.
On April 13, 2020, the CAC promulgated the Measures for the Security Review, which became effective since June 1, 2020. The Measures for the Security Review further requires operators of network product or service to prejudge the possible risks to national security if such product or service is put into use in the future. Where national security is or may be affected, an application for cybersecurity review shall be filed with the Cybersecurity Review Office.
The Civil Code of the PRC, which was adopted by the National People’s Congress on May 28, 2020 and took effect on January 1, 2021, also stipulates the protection on personal information of individuals. Any organization or individual requiring personal information of others shall obtain such information legally and ensure the security of such information, and shall not illegally collect, use, process, or transmit such personal information, or illegally buy, sell, provide, or publish such personal information
For the protection of personal information, network operators like us may not disclose or tamper with personal information that we have collected, and we are obligated to store the personal information and important business data collected or generated in the course of operations within the country within PRC territory, to remove unlawfully collected information and to amend incorrect information. Moreover, we may not provide personal information to third parties without prior consent. See “Item 3. Key Information—D. Risk Factors—Risks Related to Our Business and Industry—Our business generates and processes a large amount of data, and we are required to comply with PRC laws relating to cyber security. The improper use or disclosure of data could have a material and adverse effect on our business and prospects.”
Regulations on Mobile Applications
The APP Provisions provide that mobile Internet application providers and app store service providers shall not use the apps to (i) conduct any unlawful activity that jeopardizes the national security, disrupts the social order, infringes others’ legitimate rights and interests, or (ii) produce, duplicate, publish or disseminate any information content prohibited by laws and regulations.
On December 16, 2016, the MIIT promulgated the Interim Administrative Provisions on the Pre-installation and Distribution of Mobile Smart Terminal Application Software, or the Pre-installation Provisions, effective as of July 1, 2017. The Pre-installation Provisions stipulate a set of compliance requirements related to pre-installation apps (i.e., mobile smart terminal application software). For example, provider of internet information services shall, according to laws and regulations, provide the apps, and take effective measures to safeguard network security, in order to effectively protect the legitimate rights and interests of users and ensure that the apps other than the basic functional software can be uninstalled.
Regulations on Account Names of Internet Users
On February 4, 2015, the CAC promulgated the Administrative Provisions on the Account Names of Internet Users, which became effective as of March 1, 2015. These provisions strengthened the administration of the account names of internet users.
77
Table of Contents
In addition to the authentication requirement for the real identity of internet users by requiring users to provide real name in backstage during the registration process, these provisions specifically require that any internet information service provider shall enhance security administration, perfect the user service agreement, purge any illegal or malicious information from account names, photos, personal profiles and user registration information. Service providers must employ specialized personnel in proportion to its service scale, to (i) review account names, photos, personal profile and all relevant user registration information of internet users, (ii) deregister account names containing illegal and malicious information, and (iii) protect the information of the users, accept the supervision from the public, and purge the illegal and malicious information in account names, photos, self-introductions and other registration-related information reported by the public in a timely manner.
Regulations on E-commerce
On August 31, 2018, the SCNPC promulgated the PRC E-Commerce Law, or the E-Commerce Law, which became effective on January 1, 2019. The E-Commerce Law establishes the regulatory framework for the e-commerce sector in the PRC for the first time by laying out certain requirements on e-commerce operators, including e-commerce platform operators like us. Pursuant to the E-Commerce Law, e-commerce platform operators are required to (i) take necessary actions or report to relevant competent government authorities when such operators notice any illegal production or services provided by merchants on the e-commerce platforms; (ii) verify the identity of the business operators on the platforms; (iii) provide identity and tax related information of merchants to local branches of State Administration of Market Regulation and tax bureaus; or (iv) record and preserve goods and service information and transaction information on the e-commerce platform. The E-Commerce Law also specifically stipulates that e-commerce platform operators shall not impose unreasonable restrictions or conditions on the transactions of their business operators on the platforms. According to the E-Commerce Law, failures to comply with these requirements may subject the e-commerce platform operators to administrative penalties, fines and/or suspension of business. In addition, for goods and services provided via e-commerce platforms and pertinent to the life and health of consumers, e-commerce platform operators shall bear relevant responsibilities, which may give rise to civil or criminal liabilities if the consumers suffered damages due to the e-commerce platform operators’ failure to duly verify the qualifications or the licenses of the business operators on the platforms or to duly perform their safety protection obligations as required by the E-Commerce Law.
Moreover, the E-Commerce Law imposes a requirement on operators of e-commerce platforms to assist in tax collection with respect to income generated by sellers from transactions conducted on e-commerce platforms, including among others, submitting to the tax authority information on the identities of sellers on e-commerce platforms and other information relating to tax payment. Failure to comply with the requirement may result in operators of e-commerce platform being subject to fines and, in severe circumstances, suspension of business operations of e-commerce platforms.
On January 26, 2014, the State Administration for Industry and Commerce, which is the predecessor of the SAMR, promulgated the Administrative Measures for Online Trading, or the Online Trading Measures, which became effective on March 15, 2014, to regulate all operating activities for product sales and services provision via the internet (including mobile internet). It stipulates the obligations of online product operators and services providers and certain special requirements applicable to third-party platform operators. On March 15, 2021, the SAMR promulgated the revised vision of the Online Trading Measures, which took into effect on May 1, 2021. The revision makes further provisions with regard to emerging models of online trading (such as online social networking and online live streaming), consumer rights protection, personal information protection, etc. It also imposes new obligations on the e-commerce platform operators, such as verifying and registering the identity of trading parties on the platform either that are required to registered with SAMR or that are exempted from such registration, regular reporting of prescribed information of trading parties on the platform to the relevant branch of SAMR, establishing a system of inspection and monitoring of information on the goods sold or services provided on the platform.
Internet Drug Information Service Qualification Certificate
The Administrative Measures on Internet Drug Information Service was promulgated by the State Food and Drug Administration, or the SFDA (which has now been merged into SAIC) in July 8, 2004 and amended in November 17, 2017 and came into effect on November 17, 2017, pursuant to which the internet drug information services is to provide drug (including medical device) information services to online users; services are divided into commercial internet drug information services and non-commercial internet drug information services. The website operator that provides drugs (including medical devices) information services must obtain an Internet Drug Information Service Qualification Certificate from the competent counterpart of the SFDA. The valid term for an Internet Drug Information Service Qualification Certificate is five years and may be renewed at least six months prior to its expiration date upon a re-examination by the relevant governmental authorities.
78
Table of Contents
Filing by Online Trading Platforms Providing Services for the Distribution of Publications
We are subject to regulations relating to online trading platform services provided for distribution of publications including books and audio-video products. Pursuant to the Regulation on the Protection of the Right to Network Dissemination of Information promulgated by the State Council, a network service provider of information storage, searching and linking services, should remove the link to a work, performance or audio-video product if the work is suspected of infringing on other’s right. The removal should take place promptly by the service provider upon receipt of a notice alleging such infringement issued by the owner of such work or audio-video products. According to the Provisions on the Administration of the Publication Market, an online trading platform that provides services for the distribution of publications shall complete filing procedures with the competent publication administrative authority. An online trading platform is required to examine the identity of the dealers distributing publications through the platform, verify their business license and Publications Operation Permit, establish a mechanism to prevent and control the trading risks and take effective measures to rectify illicit actions conducted by the dealers distributing publications on the platform. If any entity subject to such requirements fails to complete the filing or fails to fulfill the relevant duties of examination and supervision in accordance with this regulation, it may be subject to an order to cease illegal acts and a warning by the competent publication administrative authority, as well as a penalty not exceeding RMB30,000.
Filing by Third-Party Platforms Providers for Medical Device Online Trading Services
The SFDA promulgated the Measures for the Supervision and Administration of Online Sale of Medical Devices in December 2017, which became effective in March 2018. Pursuant to such measures, a third-party platform providing online trading services for medical devices shall complete filing procedures with the competent provincial food and drug administrative department. According to the measures, a third-party platform that fails to complete the filing in accordance with the measures may be ordered by the competent provincial food and drug administrative department to make rectification within a prescribed time limit, and failure to make such rectification may subject the platform to public exposure of incompliance and a penalty of not exceeding RMB30,000.
Filing by Third-Party Platform Providers for Online Food Trading
In July 2016, the SFDA promulgated the Measures for Investigation and Handling of Illegal Acts Involving Online Food Safety, pursuant to which a third-party platform providing online food trading in the PRC shall file a record with the food and drug administration at the provincial level and obtain a filing number. Where the platform fails to complete such filing, it may be ordered to make rectifications and given a warning by the competent food and drug administration, and failure to make such rectification may be subject to fines ranging from RMB5,000 to RMB30,000.
Regulations on Commercial Factoring
On June 27, 2012, MOFCOM issued the Circular of the Ministry of Commerce on the Pilot Work of Commercial Factoring, effective as of the same. This circular allows the trial-implementation of commercial factoring pilot work in Shanghai Pudong New Area to explore the approaches to develop the commercial factoring. Specifically, the business scope of the commercial factoring companies includes but not limited to trade financing, sales subsidiary ledger management, credit investigation and assessment, receivables management and collection, and credit risk guarantee. In addition, MOFCOM released another notice on the enhancement the management of commercial factoring pilot work, which set forth that Shanghai Pudong New Area could commence the commercial factoring pilot work from June 2012 and added reporting obligation and inspection rights into the framework of the commercial factoring pilot work. On October 18, 2019, the CBIRC issued the Circular on Strengthening the Supervision and Administration of Commercial Factoring Enterprises to regulate the operating activities of commercial factoring enterprises, clarify regulatory responsibilities and emphasize that commercial factoring enterprises shall not engage in, among others, the following businesses: (i) absorbing public funds either directly or in disguise; (ii) lending or borrowing money from other commercial factoring enterprises, directly or in disguise; and (iii) facilitating loans or entrusted by another person to facilitate loan.
Regulations on Intellectual Property
Software
The State Council and the National Copyright Administration have promulgated various rules and regulations relating to protection of software in China. According to these rules and regulations, software owners, licensees and transferees may register their rights in software with the Copyright Protection Center or its local branches and obtain software copyright registration certificates. Although such registration is not mandatory under PRC law, software owners, licensees and transferees are encouraged to go through the registration process and registered software rights may be entitled to better protections.
79
Table of Contents
Trademark
Trademarks are protected by the Trademark Law of the PRC, which was adopted on August 23, 1982, and subsequently amended in 1993, 2001, 2013 and 2019 respectively as well as by the Implementation Regulations of the PRC Trademark Law adopted by the State Council in 2002 and as most recently amended on April 29, 2014. The Trademark Law and its implementation regulations set forth an application for trademark registration shall be filled in based on the published classification of commodities and services. The description of commodities or services shall be filled in based on the class number and description in the classification of commodities and services; where the commodities or services are not listed in the classification of commodities and services, a statement on the commodities or services shall be attached.
Pursuant to the Trademark Law and its implementation regulations, the period of validity for a registered trademark is 10 years, from the date of registration. Upon expiry of the period of validity, the registrant shall go through the formalities for renewal within twelve months prior to the date of expiry as required if the registrant needs to continue to use the trademark. Where the registrant fails to do so, a grace period of six months may be granted. The period of validity for each renewal of registration is 10 years, from the day immediately after the expiry of the preceding period of validity for the trademark. In the absence of a renewal upon expiration, the registered trademark shall be canceled.
Copyright
On September 7, 1990, the SCNPC promulgated the PRC Copyright Law, which was lasted amended on November 11, 2020 and became effective on June 1, 2021. The implementing regulations of the PRC Copyright Law was promulgated in 2002 and amended in 2013. The PRC Copyright Law and its implementation regulations are the principal laws and regulations governing the copyright related matters. Pursuant to the amended PRC Copyright Law, products disseminated over the internet and software products, among the subjects, are entitled to copyright protections. Registration of copyright is voluntary, and it is administrated by the China Copyright Protection Center. The latest amended version of the PRC Copyright Law extends copyright protection to internet activities, products disseminated over the internet and software products. For instance, reproducing, distributing, performing, projecting, broadcasting or compiling a work or communicating the same to the public via an information network without permission from the owner of the copyright therein, unless otherwise provided for in the Copyright Law of the PRC, constitute infringements of copyrights.
On May 18, 2006, the State Council promulgated the Regulation on Protection of the Right to Network Dissemination of Information, as amended on January 30, 2013, effective as of March 1, 2013. The owners’ right to network dissemination of information is protected by the Copyright Law and this regulation. Except where otherwise provided for in laws or administrative regulations, any organization or person providing to the public the works, performances, or audio-visual recordings of others through information networks shall obtain the permission from, and pay remuneration, to the owners.
Domain Name
On August 24, 2017, the MIIT promulgated the Administrative Measures for Internet Domain Names, effective as of November 1, 2017, or the Domain Name Measures. The Domain Name Measures replaced the Administrative Measures on China Internet Domain Names promulgated by the MII on November 5, 2004. The principle of “first apply, first register” applies to domain name registration service in accordance with the Domain Name Measures. In the event that there is any change to the contact information of a domain name holder, the holder shall go through formalities for changes to the registered information of its domain name with the domain name registrar concerned within 30 days after such change arises. In addition, the corresponding permit shall be obtained pursuant to the Domain Name Measures from the MIIT or the communication administrative bureau of the province, autonomous region or centrally administered municipality for establishment of domain name root servers and domain name root server operating organizations, domain name registration management organizations and domain name registration service organizations.
According to the Notice on Regulating the Use of Domain Names in Providing Internet-based Information Services issued by the MIIT on November 27, 2017, effective as of January 1, 2018, the domain name used by an Internet-based information service provider in providing Internet-based information services shall be registered and owned by such provider in accordance with the law. If the Internet-based information service provider is an entity, the domain name registrant shall be the entity (or any of the entity’s shareholders), the entity’s principal or the senior manager.
Patents
The National People’s Congress promulgated the PRC Patent Law in 1984 and most recently amended on October 17, 2020 and became effective on June 1, 2021. Any invention, utility model or design must meet three conditions to be patentable: novelty, inventiveness and practical applicability. Patents cannot be granted for scientific discoveries, rules and methods for
80
Table of Contents
intellectual activities, methods used to diagnose or treat diseases, animal and plant breeds or substances obtained by means of nuclear transformation. The Patent Office under the State Intellectual Property Office is responsible for receiving, examining and approving patent applications. A patent is valid for a twenty-year term for an invention and a ten-year term for a utility model or design, starting from the application date. Except under certain specific circumstances provided by law, any third-party user must obtain consent or a proper license from the patent owner to use the patent, or else the use will constitute an infringement of the rights of the patent holder.
Regulations on Foreign Exchange
Regulations on Foreign Currency Exchange
The Foreign Exchange Administration Regulations (2008 Amendment) was promulgated in August 2008, pursuant to which certain organizations in the PRC, including foreign invested enterprises, may purchase, sell and/or remit foreign currencies at certain banks authorized to conduct foreign exchange business upon providing valid commercial documents. However, the approval of the PRC State Administration of Foreign Exchange, or SAFE, is required for capital account transactions.
On August 29, 2008, SAFE issued Circular 142 to regulate the conversion of foreign currency into Renminbi by a foreign-invested enterprise by restricting the ways in which the converted Renminbi may be used. Circular 142 requires that the registered capital of a foreign invested enterprise converted into Renminbi from foreign currencies may only be utilized for purposes within its business scope. Meanwhile, the SAFE strengthened its oversight of the flow and use of the registered capital of a foreign-invested enterprise settled in Renminbi converted from foreign currencies.
In 2014, SAFE decided to further reform the foreign exchange administration system and issued the Circular on the Relevant Issues Concerning the Launch of Reforming Trial of the Administration Model of the Settlement of Foreign Currency Capital of Foreign-Invested Enterprises in Certain Areas on July 4, 2014, or SAFE Circular 36. SAFE Circular 36 suspends the application of SAFE Circular 142 in certain areas and allows a foreign-invested enterprise registered in such areas to use the RMB capital converted from foreign currency registered capital for equity investments within the scope of business, which will be regarded as the reinvestment of foreign-invested enterprise. On March 30, 2015, SAFE issued the Circular on the Reforming of the Management Method of the Settlement of Foreign Currency Capital of Foreign-Invested Enterprises, or SAFE Circular 19, which took effect on June 1, 2015, and replaced SAFE Circular 142 and SAFE Circular 36. Under SAFE Circular 19, a foreign-invested enterprise, within the scope of business, may also choose to convert its registered capital from foreign currency to RMB on a discretionary basis, and the RMB capital so converted can be used for equity investments within PRC, which will be regarded as the reinvestment of foreign-invested enterprise.
On October 23, 2019, SAFE promulgated the Notice of the Administration of Foreign Exchange on Further Promoting the Convenience of Cross-Border Trade and Investment, which, among other things, stipulates that non-investment foreign-invested entities may use foreign exchange capital or Renminbi funds converted from the foreign exchange capital to make domestic equity investments, provided that such investments should comply with the Negative List and other relevant PRC laws and regulations.
Regulations on Dividend Distribution
The principal regulations governing the distribution of dividends paid by wholly foreign-owned enterprises include the Wholly Foreign-Owned Enterprise Law and the Implementation Regulations on the Wholly Foreign-Owned Enterprise Law.
Pursuant to these regulations, a wholly foreign-owned enterprise in China, or a WFOE, may pay dividends only out of its accumulated profits, if any, determined in accordance with PRC accounting standards and regulations. In addition, a WFOE is required to allocate at least 10% of its accumulated profits each year, if any, to statutory reserve funds unless its reserves have reached 50% of the registered capital of the enterprises. These reserves are not distributable as cash dividends. The proportional ratio for withdrawal of rewards and welfare funds for employees shall be determined at the discretion of the WFOE. Profits of a WFOE shall not be distributed before the losses thereof before the previous accounting years have been made up. Any undistributed profit for the previous accounting years may be distributed together with the distributable profit for the current accounting year.
Regulations on Foreign Exchange Registration of Overseas Investment by PRC Residents
Circular 37
Pursuant to SAFE’s Notice on Relevant Issues Relating to Domestic Residents’ Investment and Financing and Round-Trip Investment through Special Purpose Vehicles, or SAFE Circular 37, issued and effective on July 4, 2014, and its appendixes, PRC residents, including PRC institutions and individuals, must register with local branches of SAFE in connection with their direct establishment or indirect control of an offshore entity, for the purpose of overseas investment and financing, with such PRC residents’ legally owned assets or equity interest in domestic enterprises or offshore assets or interests, referred to in SAFE Circular 37 as a
81
Table of Contents
“special purpose vehicle.” SAFE Circular 37 further requires amendment to the registration in the event of any significant changes with respect to the special purpose vehicle, including but not limited to increase or decrease of capital contributed by PRC individuals, share transfer or exchange, merger, division or other material events.
In the event that a PRC shareholder holding interests in a special purpose vehicle fails to fulfill the required SAFE registration, the PRC subsidiaries of that special purpose vehicle may be prohibited from making distributions of profit to the offshore parent and from carrying out subsequent cross-border foreign exchange activities and the special purpose vehicle may be restricted in their ability to contribute additional capital into its PRC subsidiary. And failure to comply with the various SAFE registration requirements described above could result in liability under PRC law for foreign exchange evasion, including (i) of up to 30% of the total amount of foreign exchange remitted overseas and deemed to have been evasive, and (ii) in circumstances involving serious violations, a fine of no less than 30% of and up to the total amount of remitted foreign exchange deemed evasive. Furthermore, the persons-in-charge and other persons at our PRC subsidiaries who are held directly liable for the violations may be subject to criminal sanctions. These regulations apply to our direct and indirect shareholders who are PRC residents and may apply to any offshore acquisitions and share transfer that we make in the future if our shares are issued to PRC residents. Our PRC resident shareholders have completed their SAFE registration and updated their change of shareholding with the local SAFE branch in relation to their investment in our company. Nevertheless, we may not be aware of the identities of all of our beneficial owners who are also PRC residents. See “Item 3. Key Information—D. Risk Factors—Risks Related to Doing Business in China—PRC regulations relating to the establishment of offshore special purpose companies by PRC residents may subject our PRC resident beneficial owners or our PRC subsidiaries to liability or penalties, limit our ability to inject capital into our PRC subsidiaries, limit our PRC subsidiaries’ ability to increase their registered capital or distribute profits to us, or may otherwise adversely affect us.”
Stock Incentive Plans
Pursuant to the Notice on Issues Concerning the Foreign Exchange Administration for Domestic Individuals Participating in Stock Incentive Plan of Overseas Publicly Listed Company, or Circular 7, issued by SAFE in February 2012, employees, directors, supervisors and other senior management participating in any stock incentive plan of an overseas publicly listed company who are PRC citizens or who are non-PRC citizens residing in China for a continuous period of not less than one year, subject to a few exceptions, are required to register with SAFE through a domestic qualified agent, which could be a PRC subsidiary of such overseas listed company, and complete certain other procedures. Failure to complete the SAFE registrations may subject them to fines and legal sanctions and may also limit our ability to contribute additional capital into our wholly foreign owned subsidiaries in China and limit these subsidiaries’ ability to distribute dividends to us. The PRC agents shall, on behalf of the PRC residents who have the right to exercise the employee share options, apply to SAFE or its local branches for an annual quota for the payment of foreign currencies in connection with the PRC residents’ exercise of the employee share options. The foreign exchange proceeds received by the PRC residents from the sale of shares under the stock incentive plans granted and dividends distributed by the overseas listed companies must be remitted into the bank accounts in the PRC opened by the PRC agents before distribution to such PRC residents. In addition, the PRC agents shall file each quarter the form for record-filing of information of the Domestic Individuals Participating in the Stock Incentive Plans of Overseas Listed Companies with SAFE or its local branches. We and our PRC citizen employees who have been granted share options, or PRC optionees, are subject to the Stock Option Rules. If we or our PRC optionees fail to comply with the Individual Foreign Exchange Rule and the Stock Option Rules, we and our PRC optionees may be subject to fines and other legal sanctions. See “Item 3. Key Information—D. Risk Factors—Risks Related to Doing Business in China—PRC regulations relating to the establishment of offshore special purpose companies by PRC residents may subject our PRC resident beneficial owners or our PRC subsidiaries to liability or penalties, limit our ability to inject capital into our PRC subsidiaries, limit our PRC subsidiaries’ ability to increase their registered capital or distribute profits to us, or may otherwise adversely affect us.”
In addition, the State Administration for Taxation has issued circulars concerning employee share options, under which our employees working in the PRC who exercise share options will be subject to PRC individual income tax. Our PRC subsidiaries have obligations to file documents related to employee share options with relevant tax authorities and to withhold individual income taxes of those employees who exercise their share options. If our employees fail to pay or if we fail to withhold their income taxes as required by relevant laws and regulations, we may face sanctions imposed by the PRC tax authorities or other PRC government authorities.
Regulations on Tax
Regulations on Enterprise Income Tax
On March 16, 2007, the SCNPC promulgated the Enterprise Income Tax Law, which was amended on February 24, 2017 and December 29, 2018. On December 6, 2007, the State Council enacted the Regulations for the Implementation of the Enterprise Income Tax Law, which was amended on April 23, 2019, or collectively with the Enterprise Income Tax Law, the EIT Law. The EIT Law came into effect on January 1, 2008. Under the EIT Law, both resident enterprises and non-resident enterprises are subject to tax in the PRC. Resident enterprises are defined as enterprises that are established in China in accordance with PRC laws, or
82
Table of Contents
that are established in accordance with the laws of foreign countries but are actually or in effect controlled from within the PRC. Non-resident enterprises are defined as enterprises that are organized under the laws of foreign countries and whose actual management is conducted outside the PRC, but have established institutions or premises in the PRC, or have no such established institutions or premises but have income generated from inside the PRC. Under the EIT Law and relevant implementing regulations, a uniform corporate income tax rate of 25% is applied. However, if non-resident enterprises have not formed permanent establishments or premises in the PRC, or if they have formed permanent establishment or premises in the PRC but there is no actual relationship between the relevant income derived in the PRC and the established institutions or premises set up by them, enterprise income tax is set at the rate of 10% with respect to their income sourced from inside the PRC.
Regulations on Value-added Tax
The Provisional Regulations of the PRC on Value-added Tax was promulgated by the State Council on December 13, 1993 and was amended on November 10, 2008 and February 6, 2016. The Detailed Rules for the Implementation of the Provisional Regulations of the PRC on Value-added Tax (Revised in 2011) was promulgated by the MOF on December 25, 1993 and subsequently amended on December 15, 2008 and October 28, 2011, or collectively, VAT Law. On November 19, 2017, the State Council promulgated the Decisions on Abolishing the Provisional Regulations of the PRC on Business Tax and Amending the Provisional Regulations of the PRC on Value-added Tax, or the Order 691. On April 4, 2018, MOF and SAT jointly promulgated the Circular on Adjustment of Value-Added Tax Rates, or Circular 32. On March 31, 2019, the MOF, SAT and General Administration of Customs jointly issued the Announcement on Relevant Polices for Deepening Value-added Tax Reform, or Announcement No. 39. According to the VAT Law, the Order 691 and the Circular 32, all enterprises and individuals engaged in the sale of goods, services, intangible assets, real property, the provision of processing, repair and replacement services, and the importation of goods within the territory of the PRC are the taxpayers of VAT. According to Announcement No. 39, the VAT tax rates generally applicable are simplified as 13%, 6% and 0%, and the VAT tax rate applicable to the small-scale taxpayers is 3%.
Regulations on Dividend Withholding Tax
The EIT Law provides that since January 1, 2008, an income tax rate of 10% will normally be applicable to dividends declared to non-PRC resident investors which do not have an establishment or place of business in the PRC, or which have such establishment or place of business, but the relevant income is not effectively connected with the establishment or place of business, to the extent such dividends are derived from sources within the PRC.
Pursuant to an Arrangement Between the Mainland of China and the Hong Kong Special Administrative Region for the Avoidance of Double Taxation and the Prevention of Fiscal Evasion with Respect to Taxes on Incomes, or the Double Tax Avoidance Arrangement, and other applicable PRC laws, if a Hong Kong resident enterprise is determined by the competent PRC tax authority to have satisfied the relevant conditions and requirements under such Double Tax Avoidance Arrangement and other applicable laws, the 10% withholding tax on the dividends the Hong Kong resident enterprise receives from a PRC resident enterprise may be reduced to 5%. However, based on the Circular on Certain Issues with Respect to the Enforcement of Dividend Provisions in Tax Treaties, or the SAT Circular 81, issued on February 20, 2009 by the SAT, if the relevant PRC tax authorities determine, in their discretions, that a company benefits from such reduced income tax rate due to a structure or arrangement that is primarily tax-driven, such PRC tax authorities may adjust the preferential tax treatment. According to the Circular on Several Questions regarding the “Beneficial Owner” in Tax Treaties, which was issued on February 3, 2018 by the SAT and took effect on April 1, 2018, when determining the applicant’s status of the “beneficial owner” regarding tax treatments in connection with dividends, interests or royalties in the tax treaties, several factors apply, including without limitation: (i) whether the applicant is obligated to pay more than 50% of his or her income in twelve months to any resident of any third country or region, (ii) whether the business operated by the applicant constitutes the actual business activities, and (iii) whether the counterparty country or region to the tax treaties levies any tax or grants tax exemption on relevant incomes or levies tax at an extremely low rate, will be taken into account, and it will be analyzed according to the actual circumstances of the specific cases. This circular further provides that applicants who intend to prove his or her status of the “beneficial owner” shall submit the relevant documents to the relevant tax bureau according to the Announcement on Issuing the Measures for the Administration of Non-Resident Taxpayers’ Enjoyment of the Treatment under Tax Agreements.
Regulations on Tax regarding Indirect Transfer
On February 3, 2015, the SAT issued the Circular on Issues of Enterprise Income Tax on Indirect Transfers of Assets by Non-PRC Resident Enterprises, or Circular 7. Pursuant to Circular 7, an “indirect transfer” of assets, including equity interests in a PRC resident enterprise, by non-PRC resident enterprises, may be re-characterized and treated as a direct transfer of PRC taxable assets, if such arrangement does not have a reasonable commercial purpose and is established for the purpose of avoiding payment of PRC enterprise income tax. As a result, gains derived from such indirect transfer may be subject to PRC enterprise income tax. When determining whether there is a “reasonable commercial purpose” of the transaction arrangement, considerations include, inter alia, (i) whether the main value of the equity interest of the relevant offshore enterprise derives directly or indirectly from PRC taxable assets; (ii) whether the assets of the relevant offshore enterprise mainly consists of direct or indirect investment in China or if its income is
83
Table of Contents
mainly derived from China; and (iii) whether the offshore enterprise and its subsidiaries directly or indirectly holding PRC taxable assets have real commercial nature evidenced by their actual function and risk exposure. According to the Circular 7, where the payer fails to withhold any or sufficient tax, the transferor shall declare and pay such tax to the tax authority by itself within the statutory time limit. Late payment of applicable tax will subject the transferor to default interest. The Circular 7 does not apply to transactions of sale of shares by investors through a public stock exchange where such shares were acquired on a public stock exchange. On October 17, 2017, the SAT issued the Circular on Issues of Tax Withholding regarding Non-PRC Resident Enterprise Income Tax, or SAT Circular 37, which further elaborates the relevant implemental rules regarding the calculation, reporting and payment obligations of the withholding tax by the non-resident enterprises. Nonetheless, there remain uncertainties as to the interpretation and application of the SAT Circular 7. The SAT Circular 7 may be determined by the tax authorities to be applicable to our offshore transactions or sale of our shares or those of our offshore subsidiaries where non-resident enterprises, being the transferors, were involved.
Regulations on Employment and Social Welfare
Employment
According to the Labor Law of the PRC which was promulgated by the SCNPC on July 5, 1994, effective since January 1, 1995 and amended on August 27, 2009 and Labor Contract Law of the PRC which was promulgated by the SCNPC on June 29, 2007 and amended on December 28, 2012, employers must execute written labor contracts with full-time employees. All employers must pay their employees with wages equal to at least the local minimum wage standards. In addition, an employer is obligated to sign an indefinite term labor contract with an employee if the employer continues to employ the employee after two consecutive fixed term labor contracts. Violations of the PRC Labor Contract Law and the PRC Labor Law may result in the imposition of fines and other administrative penalties. For serious violations, criminal liability may arise.
Social Insurance and Housing Fund
According to the Social Insurance Law of the PRC, which was promulgated by the National People’s Congress of the PRC on October 28, 2010, effective on July 1, 2011, and amended on December 29, 2018, together with other relevant laws and regulations, the PRC establishes a social insurance system including basic pension insurance, basic medical insurance, occupational injury insurance, unemployment insurance and maternity insurance. An employer declares and makes social insurance contributions in full and on time, failures to make social insurance contributions may be ordered to pay the required contributions within a stipulated deadline. If the employer still fails to rectify the noncompliance within the stipulated deadline, it may be subject to a fine ranging from one to three times the amount overdue.
According to the Regulations on Administration of Housing Fund promulgated by the State Council on April 3, 1999 and last amended in March 2019, employers are required to register at the designated administrative centers, open bank accounts for depositing employees’ housing fund and make housing fund contributions for employees in the PRC. An enterprise that fails to make housing fund contributions may be ordered to rectify the noncompliance and pay the required contributions within a stipulated deadline; otherwise, a petition may be made to a local court for enforcement.
84
Table of Contents
The following diagram illustrates our corporate structure, including our significant subsidiaries and the VIEs, as of the date of this annual report:
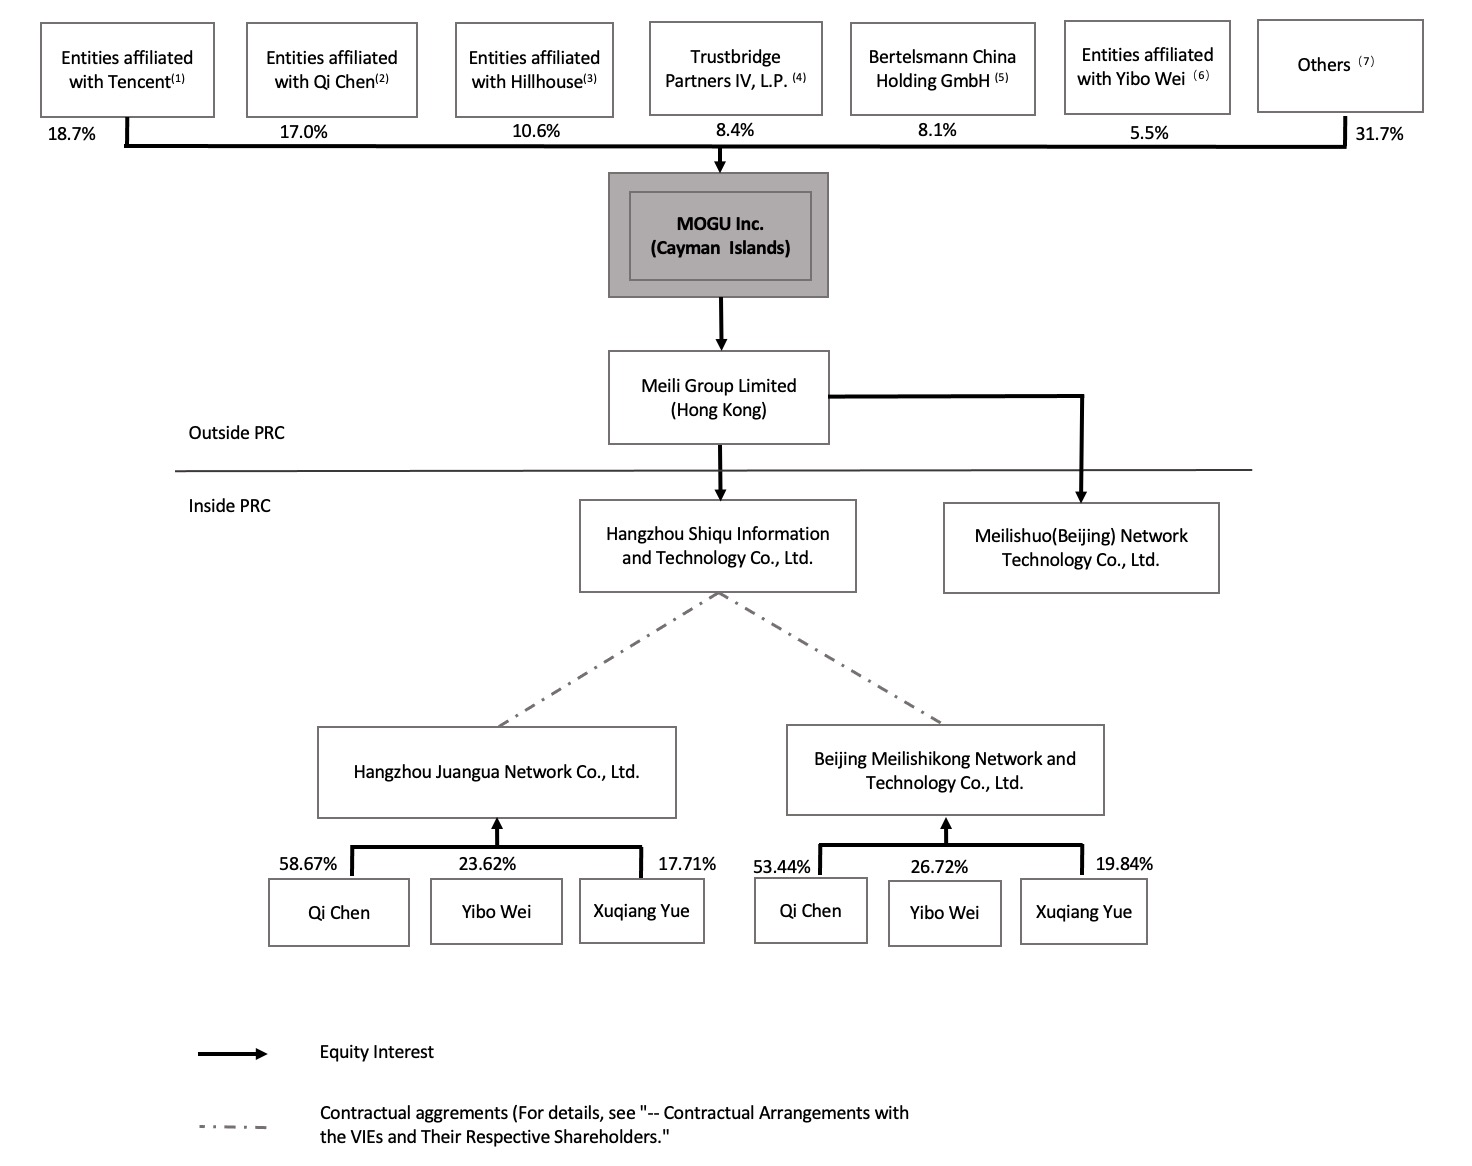
Notes:
85
Table of Contents
The following is a summary of the currently effective contractual arrangements relating to Hangzhou Juangua and Beijing Meilishikong.
Contractual Arrangements with the VIEs and Their Respective Shareholders
The following is a summary of our contractual agreements that are currently in effect, by and among our wholly-owned subsidiary Hangzhou Shiqu, the VIEs and their shareholders. Our contractual arrangements with the VIEs and their respective shareholders allow us to (i) have power to direct activities of the VIEs that most significantly affect the economic performance of the VIEs, (ii) receive the economic benefits of the VIEs that could be significant to the VIEs, and (iii) have an exclusive option to purchase all or part of the equity interests in the VIEs when and to the extent permitted by PRC law. As a result, we are regarded as the primary beneficiary of the VIEs for accounting purposes and have consolidated the financial results of the VIEs in our consolidated financial statements in accordance with U.S. GAAP. However, neither our Cayman Islands holding company nor the investors in the holding company have an equity ownership or direct investment in the VIEs.
Agreements that provide us with a controlling financial interest in the VIEs
Amended and Restated Shareholder Voting Proxy Agreements and Powers of Attorney. Pursuant to the amended and restated shareholder voting proxy agreement, dated July 18, 2018, by and among Hangzhou Shiqu, Hangzhou Juangua and the shareholders of Hangzhou Juangua, each of the shareholders of Hangzhou Juangua has executed a power of attorney to irrevocably authorize Mr. Qi Chen, the chairman of our board of directors and our chief executive officer, as designated by Hangzhou Shiqu, to act as his attorney-in-fact to exercise all of his rights as a shareholder of Hangzhou Juangua, including, but not limited to, the right to
86
Table of Contents
convene and attend shareholders’ meetings, vote on any resolution that requires a shareholder vote, such as the appointment and removal of directors, supervisors and officers, as well as the sale, transfer and disposal of all or part of the equity interests owned by such shareholder. The powers of attorney will remain effective until the amended and restated shareholder voting proxy agreement is terminated in accordance with the provisions of the agreement.
On August 20, 2017, Hangzhou Shiqu, Beijing Meilishikong and each of the shareholders of Beijing Meilishikong entered into an amended and restated shareholder voting proxy agreement, and each of the shareholders of Beijing Meilishikong executed a power of attorney, which contained terms substantially similar to the amended and restated shareholder voting proxy agreement and powers of attorney by and among Hangzhou Shiqu, Hangzhou Juangua and the shareholders of Hangzhou Juangua described above.
Amended and Restated Equity Interest Pledge Agreements. Pursuant to the amended and restated equity interest pledge agreement, dated July 18, 2018, by and among Hangzhou Shiqu, Hangzhou Juangua and the shareholders of Hangzhou Juangua, the shareholders of Hangzhou Juangua have pledged 100% equity interests in Hangzhou Juangua to Hangzhou Shiqu to guarantee performance by the shareholders of their obligations under the amended and restated exclusive option agreement, the amended and restated shareholder voting proxy agreement and the amended and restated loan agreements, as well as the performance by Hangzhou Juangua of its obligations under the amended and restated exclusive option agreement and the amended and restated exclusive consultation and service agreement. In the event of a breach by Hangzhou Juangua or any of its shareholder of contractual obligations under the amended and restated exclusive option agreement, the amended and restated shareholder voting proxy agreement, the amended and restated exclusive consultation and service agreement and the amended and restated equity interest pledge agreement, as the case may be, Hangzhou Shiqu, as pledgee, will have the right to dispose of the pledged equity interests in Hangzhou Juangua and will have priority in receiving the proceeds from such disposal. The shareholders of Hangzhou Juangua also covenant that, without the prior written consent of Hangzhou Shiqu, they will not dispose of, create or allow any encumbrance on the pledged equity interests. Hangzhou Juangua covenants that, without the prior written consent of Hangzhou Shiqu, it will not assist or allow any encumbrance to be created on the pledged equity interests.
On August 20, 2017, Hangzhou Shiqu, Beijing Meilishikong and the shareholders of Beijing Meilishikong entered into an amended and restated equity interest pledge agreement, which contained terms substantially similar to the amended and restated equity interest pledge agreement by and among Hangzhou Shiqu, Hangzhou Juangua and the shareholders of Hangzhou Juangua described above.
We have completed the registration of the equity interest pledge under the amended and restated equity interest pledge agreement in relation to Beijing Meilishikong and Hangzhou Juangua with the relevant office of the State Administration of Market Regulation in accordance with the PRC Property Rights Law.
Amended and Restated Loan Agreements. Pursuant to the amended and restated loan agreement between Hangzhou Shiqu and Mr. Qi Chen, a shareholder of Hangzhou Juangua, dated July 18, 2018, Hangzhou Shiqu made loans in an aggregate amount of RMB5,867,000 to Mr. Chen for the sole purpose of making capital contributions to Hangzhou Juangua. Mr. Chen can only repay the loans by the sale of all his equity interest in Hangzhou Juangua to Hangzhou Shiqu or its designated person pursuant to the amended and restated exclusive option agreement, and, to the extent permitted under PRC law, pay all of the proceeds from sale of such equity interests to Hangzhou Shiqu. In the event that Mr. Chen sells his equity interests in Hangzhou Juangua to Hangzhou Shiqu or its designated person at a price equal to or less than the principal amount of the loans, the loans will be interest free and the loans shall be deemed to be duly repaid by Mr. Chen. If the price is higher than the principal amount of the loans, the excess amount will be deemed as interest on the loans paid to Hangzhou Shiqu. The term of the amended and restated loan agreement is 20 years from the date of the loan agreement, which may be extended upon mutual agreement.
On July 18, 2018, Hangzhou Shiqu and each of Mr. Yibo Wei and Mr. Xuqiang Yue, each a shareholder of Hangzhou Juangua entered into an amended and restated loan agreement in the principal amount of RMB2,362,000 and RMB1,771,000, respectively, which contained terms substantially similar to the amended and restated loan agreement by and between Hangzhou Shiqu and Mr. Qi Chen described above.
Agreements that allow us to receive economic benefits from the VIEs
Amended and Restated Exclusive Consultation and Service Agreements. Pursuant to the amended and restated exclusive consultation and service agreement, dated July 18, 2018, by and between Hangzhou Shiqu and Hangzhou Juangua, Hangzhou Shiqu has the exclusive right to provide Hangzhou Juangua with technical and consulting services. Without Hangzhou Shiqu’s prior written consent, Hangzhou Juangua may not accept any services subject to this agreement from any third party. Hangzhou Juangua agrees to pay Hangzhou Shiqu a quarterly service fee at an amount that is equal to Hangzhou Juangua’s revenue for the relevant quarter after deducting any applicable taxes, cost of revenues and retained earnings (which should be zero unless Hangzhou Shiqu otherwise agrees
87
Table of Contents
in writing) or an amount adjusted at Hangzhou Shiqu’s sole discretion for the relevant quarter, which should be paid within 10 business days after Hangzhou Juangua confirms in writing the amount and breakdown of the service fee for the relevant quarter. Hangzhou Shiqu has the exclusive ownership of all the intellectual property rights created as a result of the performance of the agreement. To guarantee Hangzhou Juangua’s performance of its obligations under the agreement, the shareholders of Hangzhou Juangua have pledged their entire equity interests in Hangzhou Juangua to Hangzhou Shiqu pursuant to the amended and restated equity interest pledge agreement. The agreement has a term of 10 years, which will be automatically renewed upon expiration, unless it is otherwise terminated in accordance with the provisions of the agreement.
On August 20, 2017, Hangzhou Shiqu and Beijing Meilishikong entered into an amended and restated exclusive consultation and service agreement, which contained terms substantially similar to the amended and restated exclusive consultation and service agreement by and between Hangzhou Shiqu and Hangzhou Juangua described above.
Agreements that provide us with the option to purchase the equity interests in the VIEs
Amended and Restated Exclusive Option Agreements. Pursuant to the amended and restated exclusive option agreement, dated July 18, 2018, by and among Hangzhou Shiqu, Hangzhou Juangua and the shareholders of Hangzhou Juangua, each of the shareholders of Hangzhou Juangua has irrevocably granted Hangzhou Shiqu an exclusive option to purchase all or part of his equity interests in Hangzhou Juangua. Hangzhou Shiqu or its designated person may exercise such option at the lowest price permitted under applicable PRC law. The shareholders of Hangzhou Juangua covenant that, without Hangzhou Shiqu’s prior written consent, they will not, among other things, (i) create any pledge or encumbrance on their equity interests in Hangzhou Juangua; (ii) transfer or otherwise dispose of their equity interests in Hangzhou Juangua; (iii) change Hangzhou Juangua’s registered capital; (iv) amend Hangzhou Juangua’s articles of association in any material respect; (v) dispose of or cause Hangzhou Juangua’s management to dispose of Hangzhou Juangua’s material assets (except in the ordinary course of business); (vi) cause Hangzhou Juangua to enter into transactions that are likely to have a material impact on its assets, liabilities, operations, shareholding structure or equity ownership in other entities; (vii) change Hangzhou Juangua’s directors and supervisors; (viii) declare or distribute dividends; (ix) terminate, liquidate or dissolve Hangzhou Juangua; or (x) allow Hangzhou Juangua to extend or borrow loans, provide any form of guarantee, or assume any material obligations except in the ordinary course of business. In addition, Hangzhou Juangua covenants that, without Hangzhou Shiqu’s prior written consent, it will not, among other things, create or assist or allow its shareholders to create, any pledge or encumbrance on its assets and equity interests, or transfer or otherwise dispose of its assets (except in the ordinary course of business). The amended and restated exclusive option agreement will remain effective until the entire equity interests in Hangzhou Juangua have been transferred to Hangzhou Shiqu or its designated person.
On August 20, 2017, Hangzhou Shiqu, Beijing Meilishikong and the shareholders of Beijing Meilishikong entered into an amended and restated exclusive option agreement, which contained terms substantially similar to the amended and restated exclusive option agreement by and among Hangzhou Shiqu, Hangzhou Juangua and the shareholders of Hangzhou Juangua described above.
Spousal Consent Letters. The spouses of the shareholders of Hangzhou Juangua and Beijing Meilishikong each signed a spousal consent letter. Under each spousal consent letter, the signing spouse unconditionally and irrevocably agreed that the equity interest in Hangzhou Juangua and Beijing Meilishikong held by and registered in the name of her spouse be disposed of in accordance with the above-mentioned amended and restated exclusive option agreement, equity interest pledge agreement, shareholder voting proxy agreement and powers of attorney, as applicable, and that her spouse may perform, amend or terminate such agreements without her additional consent. Additionally, the spouse agreed not to assert any rights over the equity interest in Hangzhou Juangua or Beijing Meilishikong held by her spouse. In addition, in the event that the spouse obtains any equity interest in Hangzhou Juangua or Beijing Meilishikong held by her spouse for any reason, she agrees to be bound by and sign any legal documents substantially similar to the contractual arrangements, as may be amended from time to time.
In the opinion of King & Wood Mallesons, our PRC legal counsel:
However, our PRC legal counsel, has also advised us that there are substantial uncertainties regarding the interpretation and application of current and future PRC laws, regulations and rules. Accordingly, the PRC regulatory authorities may take a view that is contrary to the opinion of our PRC legal counsel. It is uncertain whether any new PRC laws or regulations relating to the VIE structures will be adopted or if adopted, what they would provide. If we or any of the VIEs are found to be in violation of any existing
88
Table of Contents
or future PRC laws or regulations, or fail to obtain or maintain any of the required permits or approvals, the relevant PRC regulatory authorities would have broad discretion to take action in dealing with such violations or failures. See “Item 3. Key Information—D. Risk Factors—Risks Related to Our Corporate Structure— If the PRC government determines that the contractual arrangements constituting part of the VIE structure do not comply with PRC regulations, or if these regulations or the interpretation of existing regulations change in the future, we could be subject to severe penalties or be forced to relinquish our rights under the contractual agreements in those operations, which may cause the value of our ADSs to significantly decline or become worthless.” and “Item 3. Key Information—D. Risk Factors—Risks Related to Doing Business in China— Rules and regulations governing the internet industry in China are relatively new and quickly evolving. The enforcement of rules and regulations in China governing the internet industry could adversely affect our results of business and financial operations and the value of our ADSs.”
We are headquartered in Hangzhou, China, and have leased an aggregate of approximately 6.2 thousand square meters of office space in Hangzhou as of March 31, 2023. We had an aggregate of approximately 1.8 thousand square meters of office space in Lishui as of March 31, 2023. We also had an aggregate of approximately 0.1 thousand square meters of office space in Shanghai as of March 31, 2023. We lease our premises under operating lease agreements from independent third parties. A summary of our leased properties as of March 31, 2023 is shown below:
Location |
|
Space (in thousands of square meters) |
|
Use |
|
Lease Term (years) |
Hangzhou, China |
|
6.2 |
|
Office |
|
1-5 |
Lishui, China |
|
1.8 |
|
Office |
|
1 |
Shanghai, China |
|
0.1 |
|
Office |
|
1 |
On August 8, 2020, we signed an agreement to purchase an office building located at the Hangzhou Zijingang Technology Zone for a total consideration of RMB209.0 million (US$31.9 million). The office building has been completed in December, 2022. We expect to begin business operations in this office building From September 2023.
Item 4A. Unresolved Staff Comments
None.
Item 5. Operating and Financial Review and Prospects
You should read the following discussion and analysis of our financial condition and results of operations in conjunction with our consolidated financial statements and the related notes included elsewhere in this annual report. This discussion contains forward-looking statements that involve risks and uncertainties about our business and operations. Our actual results and the timing of selected events may differ materially from those anticipated in these forward-looking statements as a result of various factors, including those we describe under “Item 3. Key Information—D. Risk Factors.” and elsewhere in this annual report. We have prepared our financial statements in accordance with U.S. GAAP. Our fiscal year ends on March 31 and references to fiscal years of 2021, 2022 and 2023 are to the fiscal years ended March 31, 2021, 2022 and 2023, respectively.
Overview
We are a KOL-driven online fashion and lifestyle destination in China. We have scaled our GMV. In our operations, we monitor the number of our GMV associated with LVB, number of active buyers through LVB and number of established LVB hosts on a regular basis, as they are, among other things, drivers of our revenue and metrics to help us evaluate the current performance of the business. A significant dip in any of these metrics will usually prompt remedial actions from us to keep our business on the right track.
Our GMV associated with LVB was RMB10.9 billion, RMB9.8 billion and RMB5.9 billion for the years ended March 31, 2021, 2022 and 2023, respectively. Our active buyers through LVB were 3.5 million, 3.0 million and 1.6 million for the years ended March 31, 2021, 2022 and 2023, respectively. Our established LVB hosts were 249, 240 and 165 as of March 31, 2021, 2022 and 2023, respectively.
89
Table of Contents
Our total GMV was RMB13.9 billion, RMB10.7 billion and RMB6.1 billion for the years ended March 31, 2021, 2022 and 2023, respectively. Our total revenues were RMB482.4 million, RMB337.5 million and RMB232.1 million (US$33.8 million) for the years ended March 31, 2021, 2022 and 2023, respectively.
Key Factors Affecting Our Results of Operations
Our business and operating results are affected by the general factors affecting China’s retail industry, including China’s overall economic growth, the increase in per capita disposable income and the growth in consumer spending in China. In addition, they are also affected by factors driving online retail in China, such as the growing number of online shoppers, the improved logistics infrastructure and the increasing adoption of mobile payment. Furthermore, our business and operating results are influenced by PRC governmental policies and initiatives affecting the online content industry, particularly live video broadcasts and short-form videos. Changes in any of these general factors could affect the demand for products and services on our platform and our results of operations.
While our business is influenced by general factors affecting our industry in China generally, we believe our results of operations are more directly affected by the following specific factors, including:
Impact of COVID-19 on Our Operations and Financial Performance
The COVID-19 pandemic has had, and, together with any subsequent outbreaks driven by new variants of COVID-19, may continue to have, a significant impact on our operations and financial results. The potential downturn brought by and the duration of the COVID-19 pandemic may be difficult to assess or predict where actual effects will depend on many factors beyond our control. The extent to which the COVID-19 pandemic impacts our long-term results remains uncertain, and we are closely monitoring its impact on us.
In 2020, in response to the intensifying efforts to contain the spread of COVID-19, the Chinese government took a number of actions, including extending the Chinese New Year holiday, quarantining individuals suspected of having COVID-19, asking residents in China to stay at home and to avoid public gathering, among other things. COVID-19 has also resulted in temporary closure of many corporate offices, retail stores, and manufacturing facilities and factories across China, and put significant strain on merchandise shipping and delivery in 2020. Despite the successful roll-out of vaccines around the world, a varying degree of uncertainty remained throughout 2021. This was caused by new variants of COVID-19, varying vaccine effectiveness rates and the need for the reimposition of government-imposed restrictions. During the first quarter of 2022, due to the outbreak of COVID-19 in China and the implementation of relevant COVID-19 mandates, businesses have experienced an overall disruption of logistics and supply chain across industries. As a result, the delivery of certain merchandise sold on our platform was delayed. The Chinese government began to modify its COVID control policy at the end of 2022, and most of the travel restrictions and quarantine requirements were lifted in December 2022. As of the date of this annual report, our business activities have returned to normal levels. As of March 31, 2023, our cash and cash equivalents were RMB417.0 million (US$60.7 million) and our short-term investments was RMB145.8 million (US$21.2 million). We believe this level of liquidity is sufficient to meet our anticipated working capital requirements and capital expenditures for at least the next 12 months.
The extent to which the COVID-19 pandemic impacts our long-term results will depend on future developments which are highly uncertain, unpredictable and beyond our control, including the frequency, duration and extent of outbreaks of COVID-19,
90
Table of Contents
the appearance of new variants with different characteristics, the effectiveness of efforts to contain or treat cases, and future actions that may be taken in response to these developments, and measures to stimulate the general economy to improve business condition. See also “Item 3. Key Information—D. Risk Factors—Risks Related to Our Business and Industry—We face risks related to natural disasters, health epidemics and other outbreaks, such as the COVID-19 pandemic, which could significantly affect our business, financial condition and results of operations.”
Key Line Items and Specific Factors Affecting Our Results of Operations
Revenues
The following table sets forth the components of our revenues by amounts and percentages of our total revenues for the years presented:
|
|
For the Year Ended March 31, |
|
|||||||||||||||||||||||||
|
|
2021 |
|
|
2022 |
|
|
2023 |
|
|||||||||||||||||||
|
|
RMB |
|
|
% |
|
|
RMB |
|
|
% |
|
|
RMB |
|
|
US$ |
|
|
% |
|
|||||||
Revenues |
|
|
|
|
|
|
|
|
|
|
|
|
|
|
|
|
|
|
|
|
|
|||||||
Commission revenues |
|
|
318,602 |
|
|
|
66.0 |
|
|
|
226,742 |
|
|
|
67.2 |
|
|
|
147,514 |
|
|
|
21,480 |
|
|
|
63.6 |
|
Marketing services revenues |
|
|
71,345 |
|
|
|
14.8 |
|
|
|
17,888 |
|
|
|
5.3 |
|
|
|
4,416 |
|
|
|
643 |
|
|
|
1.8 |
|
Financing solutions revenues |
|
|
49,285 |
|
|
|
10.2 |
|
|
|
31,852 |
|
|
|
9.4 |
|
|
|
12,947 |
|
|
|
1,885 |
|
|
|
5.6 |
|
Technology service revenues |
|
|
28,505 |
|
|
|
6.0 |
|
|
|
46,077 |
|
|
|
13.7 |
|
|
|
58,867 |
|
|
|
8,572 |
|
|
|
25.4 |
|
Other revenues |
|
|
14,655 |
|
|
|
3.0 |
|
|
|
14,910 |
|
|
|
4.4 |
|
|
|
8,332 |
|
|
|
1,213 |
|
|
|
3.6 |
|
Total revenues |
|
|
482,392 |
|
|
|
100.0 |
|
|
|
337,469 |
|
|
|
100.0 |
|
|
|
232,076 |
|
|
|
33,793 |
|
|
|
100.0 |
|
|
|
|
|
|
|
|
|
|
|
|
|
|
|
|
|
|
|
|
|
|
|
|||||||
Commission revenues. We earn commissions from merchants on our platform when transactions are completed and settled. The merchandise transactions are deemed completed (with related commission revenue earned) upon users’ acceptance of merchandise. Such commissions are generally determined as an agreed percentage of the value of merchandise sold by merchants. We typically charge a commission rate of approximately 5% to 10% to merchants.
Marketing services revenues. We generate revenues from marketing services by providing online marketing services, including display-based, search-based and native content-based advertisements and marketing services, to merchants and brand partners.
Financing solutions revenues. We generate revenues from loaning to users and merchants through factoring arrangements and from making services by facilitating the financial institutions to provide loans to merchants and users through our online platform and services to manage repayments.
Technology service revenues. We provide businesses with marketing needs with one-stop and customized services for their online operations, including various website operational services, data management platforms and other software, as well as value-added services such as data traffic improvements and technology services to insurance companies.
Other revenues. Our other revenues primarily consist of logistic services revenue, promotion services revenue and others.
91
Table of Contents
Costs and expenses
The following table sets forth the principal components of our costs and expenses by amounts and percentages of our total costs and expenses for the years presented:
|
|
For the Year Ended March 31, |
|
|||||||||||||||||||||||||
|
|
2021 |
|
|
2022 |
|
|
2023 |
|
|||||||||||||||||||
|
|
RMB |
|
|
% |
|
|
RMB |
|
|
% |
|
|
RMB |
|
|
US$ |
|
|
% |
|
|||||||
|
|
(in thousands, except for percentages) |
|
|||||||||||||||||||||||||
Cost of revenues (exclusive of amortization of intangible assets shown separately below) |
|
|
(183,112 |
) |
|
|
19.1 |
|
|
|
(159,601 |
) |
|
|
15.4 |
|
|
|
(113,884 |
) |
|
|
(16,583 |
) |
|
|
26.7 |
|
Sales and marketing expenses |
|
|
(229,775 |
) |
|
|
23.9 |
|
|
|
(148,410 |
) |
|
|
14.4 |
|
|
|
(67,709 |
) |
|
|
(9,859 |
) |
|
|
15.9 |
|
Research and development expenses |
|
|
(103,474 |
) |
|
|
10.8 |
|
|
|
(82,641 |
) |
|
|
8.0 |
|
|
|
(37,068 |
) |
|
|
(5,398 |
) |
|
|
8.7 |
|
General and administrative expenses |
|
|
(103,038 |
) |
|
|
10.7 |
|
|
|
(79,178 |
) |
|
|
7.7 |
|
|
|
(63,445 |
) |
|
|
(9,238 |
) |
|
|
14.9 |
|
Amortization of intangible assets |
|
|
(341,802 |
) |
|
|
35.5 |
|
|
|
(328,154 |
) |
|
|
31.7 |
|
|
|
(59,992 |
) |
|
|
(8,736 |
) |
|
|
14.1 |
|
Goodwill and intangible assets impairment |
|
|
— |
|
|
|
— |
|
|
|
(235,394 |
) |
|
|
22.8 |
|
|
|
(84,693 |
) |
|
|
(12,332 |
) |
|
|
19.7 |
|
Total costs and expenses |
|
|
(961,201 |
) |
|
|
100.0 |
|
|
|
(1,033,378 |
) |
|
|
100.0 |
|
|
|
(426,791 |
) |
|
|
(62,146 |
) |
|
|
100.0 |
|
Cost of revenues. Costs of revenues primarily consist of payroll costs including share-based compensation expenses, information technology related expenses, cost of inventory, payment handling costs, depreciation expenses, rental expenses, warehousing and logistic expenses and other costs.
Sales and marketing expenses. Sales and marketing expenses primarily consist of payroll costs including share-based compensation expenses, promotion expenses and other daily expenses which are related to the sales and marketing departments.
Research and development expenses. Research and development expenses are expensed as incurred and primarily consist of staff costs including share-based compensation expenses, rental expenses and other expenses. We expense all costs that are incurred in connection with the planning and implementation phases of development and costs that are associated with repair or maintenance of the existing websites and mobile applications or the development of software, mobile application and website content.
General and administrative expenses. General and administrative expenses consist of staff costs including share-based compensation expenses and related expenses for employees involved in general corporate functions, including accounting, finance, tax, legal and human relations; and costs associated with use by these functions of facilities and equipment, such as depreciation expenses, rental and other general corporate related expenses.
Amortization of intangible assets. We incur expenses for the amortization of our intangible assets, which primarily consist of our merchant resources, brand, strategic business resources, customer relationship and technology that were acquired in our business combinations with Meilishuo in 2016 and Ruisha Technology in 2021, as well as the amortization of the intangible assets recorded as a result of the business cooperation agreement that we entered into with Tencent in July 2018. As of March 31, 2023, the net carrying amount of our intangible assets was RMB12.6 million (US$1.8 million) which primarily consist of the intangible assets which were recorded in connection with the business combination with Ruisha Technology.
Impairment of goodwill and intangible assets. We recorded goodwill in connection with the excess of the purchase price over the fair value of the identifiable assets and the liabilities acquired in our business combinations with Meilishuo in 2016 and Ruisha Technology in 2021. For the year ended March 31, 2023, impairment charges relating to goodwill and certain intangible assets totaling RMB84.7 million (US$12.3 million) were recorded. For further information, see Notes 12 and 14 to our consolidated financial statements included elsewhere in this annual report.
|
|
For the Year Ended March 31, |
|
|||||||||||||||||||||||||
|
|
2021 |
|
|
2022 |
|
|
2023 |
|
|||||||||||||||||||
|
|
RMB |
|
|
% |
|
|
RMB |
|
|
% |
|
|
RMB |
|
|
US$ |
|
|
% |
|
|||||||
|
|
(in thousands, except for percentages) |
|
|||||||||||||||||||||||||
Other income, net |
|
|
49,885 |
|
|
|
(100.0 |
) |
|
|
25,427 |
|
|
|
(100.0 |
) |
|
|
7,267 |
|
|
|
1,058 |
|
|
|
(100.0 |
) |
Other income, net. Other income, net primarily consists of government grants, refund from depositary bank, merchant penalty income and gains/(losses) on disposal of equipment, exchange gain/(loss) and others.
92
Table of Contents
Taxation
Cayman Islands
The Cayman Islands currently levies no taxes on individuals or corporations based upon profits, income, gains or appreciation and there is no taxation in the nature of inheritance tax or estate duty. There are no other taxes likely to be material to us levied by the government of the Cayman Islands except for stamp duties which may be applicable on instruments executed in, or brought within the jurisdiction of the Cayman Islands. In addition, the Cayman Islands does not impose withholding tax on dividend payments.
Hong Kong
Under the current Hong Kong Inland Revenue Ordinance, our subsidiaries incorporated in Hong Kong are subject to a two-tiered profits tax rates regime. Under the two-tiered profits tax rates regime, the first HK$2 million of profits of the qualifying group entity will be taxed at 8.25%, and profits above HK$2 million will be taxed at 16.5%. Under the Hong Kong tax laws, we are exempted from the Hong Kong income tax on our foreign-derived income. In addition, payments of dividends from our Hong Kong subsidiary to us are not subject to any Hong Kong withholding tax. No provision for Hong Kong tax has been made in our consolidated financial statements, as our Hong Kong subsidiaries had not generated any assessable income in fiscal years of 2021, 2022 and 2023.
PRC
Generally, the PRC subsidiaries, the VIEs and their subsidiaries are subject to enterprise income tax on their taxable income in China at a statutory rate of 25%. The enterprise income tax is calculated based on the entity’s global income as determined under PRC tax laws and accounting standards.
We are generally subject to value-added tax at a rate of 13% on online sales and 6% on online marketing services, platform commissions, financing solutions, storage services and technical and consulting services. Certain PRC subsidiaries and VIEs are deemed as small taxpayers under PRC law, which subject them to reduced value-added tax rate of 3%. We are also subject to 3% cultural undertaking development fees on part of revenues from online marketing services, which are considered as advertising revenues. Furthermore, we are subject to 1% and 7% urban construction tax, 3% education surcharges, 2% local education surcharges and other surcharges on value-added tax payments during the fiscal years presented.
Hangzhou Shiqu Information and Technology Co., Ltd., our PRC subsidiary, and Hangzhou Juangua Network Co., Ltd., or Hangzhou Juangua, one of the VIEs, both qualified as national high and new technology enterprises, or HNTE, in November 2016, which reduced their enterprise income tax rate to 15%. The HNTE certificates of Hangzhou Shiqu and Hangzhou Juangua were renewed in 2019 and were valid for another three years from 2019 to 2021. The HNTE certificate of Hangzhou Shiqu was renewed in 2022 and is valid for another three years from 2022 to 2024. The HNTE certificate of Hangzhou Juangua expired in 2022 and Hangzhou Juangua is still applying for its renewal in 2023.
On November 30, 2018, Hangzhou Juandou Network Co., Ltd., or Hangzhou Juandou, a subsidiary of Hangzhou Juangua, obtained its HNTE certificate with a valid period of three years. Therefore, Hangzhou Juandou is eligible to enjoy a preferential tax rate of 15% from 2018 to 2020 to the extent that it has taxable income under the EIT Law and as long as it maintains the HNTE qualification and duly conducts relevant filing procedures under the EIT Law with the relevant tax authority. The HNTE certificate of Hangzhou Juandou was renewed in 2021 and are valid for another three years from 2021 to 2023.
On December 16, 2021, Ruisha Technology, a subsidiary of Hangzhou Juangua, and Lishui Juanfu Network Technology Co., Ltd., or Lishui Juanfu, a subsidiary of Hangzhou Shiqu, obtained their HNTE certificates with a valid period of three years. Therefore, Ruisha Technology and Lishui Juanfu are eligible to enjoy a preferential tax rate of 15% from 2021 to 2023 to the extent that they have taxable income under the EIT Law and as long as they maintain the HNTE qualification and duly conduct relevant filing procedures under the EIT Law with the relevant tax authority.
Dividends paid by our wholly foreign-owned subsidiaries in China to our intermediary holding company in Hong Kong will be subject to a withholding tax rate of 10%, unless the relevant Hong Kong entity satisfies all the requirements under the Arrangement between China and the Hong Kong Special Administrative Region on the Avoidance of Double Taxation and Prevention of Fiscal Evasion with respect to Taxes on Income and Capital and receives approval from the relevant tax authority. If our Hong Kong subsidiary satisfies all the requirements under the tax arrangement and receives approval from the relevant tax authority, then the dividends paid to the Hong Kong subsidiary would be subject to withholding tax at the standard rate of 5%. Effective from November 1, 2015, the above mentioned approval requirement has been abolished, but a Hong Kong entity is still required to file application package with the relevant tax authority, and settle the overdue taxes if the preferential 5% tax rate is denied based on the
93
Table of Contents
subsequent review of the application package by the relevant tax authority. See “Item 3. Key Information—D. Risk Factors—Risks Related to Our Corporate Structure—We may rely on dividends paid by our PRC or Hong Kong subsidiaries to fund cash and financing requirements. To the extent cash is located in the PRC or Hong Kong or within a PRC or Hong Kong domiciled entity and may need to be used outside of the PRC or Hong Kong, the funds may not be available due to limitations placed on us by the PRC government. Any limitation on the ability of our PRC or Hong Kong subsidiaries to pay dividends to us could have a material adverse effect on our ability to conduct our business and to pay dividends to holders of the ADSs and our ordinary shares.”
If our holding company in the Cayman Islands or any of our subsidiaries outside of China were deemed to be a “resident enterprise” under the PRC Enterprise Income Tax Law, it would be subject to enterprise income tax on its worldwide income at a rate of 25%. See “Item 3. Key Information—D. Risk Factors—Risks Related to Doing Business in China—If we are classified as a PRC resident enterprise for PRC income tax purposes, such classification could result in unfavorable tax consequences to us and our non-PRC shareholders or ADS holders.”
Results of Operations
The following table sets forth a summary of our consolidated results of operations for the years presented, both in absolute amount and as a percentage of our revenues for the years presented. This information should be read together with our consolidated financial statements and related notes included elsewhere in this annual report. The results of operations in any particular period are not necessarily indicative of our future trends.
|
|
For the Year Ended March 31, |
|
|||||||||||||||||||||||||
|
|
2021 |
|
|
2022 |
|
|
2023 |
|
|||||||||||||||||||
|
|
RMB |
|
|
% |
|
|
RMB |
|
|
% |
|
|
RMB |
|
|
US$ |
|
|
% |
|
|||||||
|
|
(in thousands, except for percentages) |
|
|||||||||||||||||||||||||
Revenues |
|
|
|
|
|
|
|
|
|
|
|
|
|
|
|
|
|
|
|
|
|
|||||||
Commission revenues |
|
|
318,602 |
|
|
|
66.0 |
|
|
|
226,742 |
|
|
|
67.2 |
|
|
|
147,514 |
|
|
|
21,480 |
|
|
|
63.6 |
|
Marketing services revenues |
|
|
71,345 |
|
|
|
14.8 |
|
|
|
17,888 |
|
|
|
5.3 |
|
|
|
4,416 |
|
|
|
643 |
|
|
|
1.8 |
|
Financing solutions revenues |
|
|
49,285 |
|
|
|
10.2 |
|
|
|
31,852 |
|
|
|
9.4 |
|
|
|
12,947 |
|
|
|
1,885 |
|
|
|
5.6 |
|
Technology service revenues |
|
|
28,505 |
|
|
|
6.0 |
|
|
|
46,077 |
|
|
|
13.7 |
|
|
|
58,867 |
|
|
|
8,572 |
|
|
|
25.4 |
|
Other revenues |
|
|
14,655 |
|
|
|
3.0 |
|
|
|
14,910 |
|
|
|
4.4 |
|
|
|
8,332 |
|
|
|
1,213 |
|
|
|
3.6 |
|
Total revenues |
|
|
482,392 |
|
|
|
100.0 |
|
|
|
337,469 |
|
|
|
100.0 |
|
|
|
232,076 |
|
|
|
33,793 |
|
|
|
100.0 |
|
Cost of revenues (exclusive of amortization of intangible assets shown separately below)(1) |
|
|
(183,112 |
) |
|
|
(38.0 |
) |
|
|
(159,601 |
) |
|
|
(47.3 |
) |
|
|
(113,884 |
) |
|
|
(16,583 |
) |
|
|
(49.0 |
) |
Sales and marketing expenses(1) |
|
|
(229,775 |
) |
|
|
(47.6 |
) |
|
|
(148,410 |
) |
|
|
(44.0 |
) |
|
|
(67,709 |
) |
|
|
(9,859 |
) |
|
|
(29.2 |
) |
Research and development expenses(1) |
|
|
(103,474 |
) |
|
|
(21.5 |
) |
|
|
(82,641 |
) |
|
|
(24.5 |
) |
|
|
(37,068 |
) |
|
|
(5,398 |
) |
|
|
(16.0 |
) |
General and administrative expenses(1) |
|
|
(103,038 |
) |
|
|
(21.4 |
) |
|
|
(79,178 |
) |
|
|
(23.5 |
) |
|
|
(63,445 |
) |
|
|
(9,238 |
) |
|
|
(27.3 |
) |
Amortization of intangible assets |
|
|
(341,802 |
) |
|
|
(70.9 |
) |
|
|
(328,154 |
) |
|
|
(97.2 |
) |
|
|
(59,992 |
) |
|
|
(8,736 |
) |
|
|
(25.9 |
) |
Goodwill and intangible assets impairment |
|
|
— |
|
|
|
— |
|
|
|
(235,394 |
) |
|
|
(69.7 |
) |
|
|
(84,693 |
) |
|
|
(12,332 |
) |
|
|
(36.5 |
) |
Other income, net |
|
|
49,885 |
|
|
|
10.3 |
|
|
|
25,427 |
|
|
|
7.5 |
|
|
|
7,267 |
|
|
|
1,058 |
|
|
|
3.1 |
|
Loss from operations |
|
|
(428,924 |
) |
|
|
(88.9 |
) |
|
|
(670,482 |
) |
|
|
(198.7 |
) |
|
|
(187,448 |
) |
|
|
(27,295 |
) |
|
|
(80.8 |
) |
Interest income |
|
|
19,601 |
|
|
|
4.1 |
|
|
|
13,903 |
|
|
|
4.1 |
|
|
|
17,389 |
|
|
|
2,532 |
|
|
|
7.5 |
|
Interest expense |
|
|
— |
|
|
|
— |
|
|
|
— |
|
|
|
— |
|
|
|
(598 |
) |
|
|
(87 |
) |
|
|
(0.3 |
) |
Gain/(loss) from investments, net |
|
|
86,497 |
|
|
|
17.9 |
|
|
|
232 |
|
|
|
0.1 |
|
|
|
(18,615 |
) |
|
|
(2,711 |
) |
|
|
(8.0 |
) |
Loss before income tax and share of results of equity investee |
|
|
(322,826 |
) |
|
|
(66.9 |
) |
|
|
(656,347 |
) |
|
|
(194.5 |
) |
|
|
(189,272 |
) |
|
|
(27,561 |
) |
|
|
(81.6 |
) |
Income tax benefits/(expenses) |
|
|
(5,181 |
) |
|
|
(1.1 |
) |
|
|
14,512 |
|
|
|
4.3 |
|
|
|
1,983 |
|
|
|
288 |
|
|
|
0.9 |
|
Share of results of equity investee |
|
|
36 |
|
|
|
— |
|
|
|
(539 |
) |
|
|
(0.2 |
) |
|
|
883 |
|
|
|
129 |
|
|
|
0.4 |
|
Net loss |
|
|
(327,971 |
) |
|
|
(68.0 |
) |
|
|
(642,374 |
) |
|
|
(190.4 |
) |
|
|
(186,406 |
) |
|
|
(27,144 |
) |
|
|
(80.3 |
) |
94
Table of Contents
Note:
|
|
For the Year Ended March 31, |
|
|||||||||||||
|
|
2021 |
|
|
2022 |
|
|
2023 |
|
|||||||
|
|
RMB |
|
|
RMB |
|
|
RMB |
|
|
US$ |
|
||||
|
|
(in thousands) |
|
|||||||||||||
Cost of revenues |
|
|
(2,464 |
) |
|
|
(1,872 |
) |
|
|
(1,448 |
) |
|
|
(211 |
) |
Sales and marketing expenses |
|
|
(5,416 |
) |
|
|
(3,905 |
) |
|
|
(3,398 |
) |
|
|
(495 |
) |
Research and development expenses |
|
|
(3,940 |
) |
|
|
108 |
|
|
|
(862 |
) |
|
|
(126 |
) |
General and administrative expenses |
|
|
(14,475 |
) |
|
|
(6,789 |
) |
|
|
(7,855 |
) |
|
|
(1,144 |
) |
Total |
|
|
(26,295 |
) |
|
|
(12,458 |
) |
|
|
(13,563 |
) |
|
|
(1,976 |
) |
The table below sets forth the respective revenue contribution and assets of our company and our wholly-owned subsidiaries and the VIEs for the years and as of the date indicated:
|
|
Revenues(1) |
|
|
Total Assets(1) |
|
||||||||||
|
|
For the Year Ended March 31, |
|
|
As of March 31, |
|
||||||||||
|
|
2021 |
|
|
2022 |
|
|
2023 |
|
|
2023 |
|
||||
MOGU Inc. and its wholly-owned subsidiaries |
|
|
82.4 |
% |
|
|
79.3 |
% |
|
|
73.7 |
% |
|
|
36.8 |
% |
VIEs |
|
|
17.6 |
% |
|
|
20.7 |
% |
|
|
26.3 |
% |
|
|
63.2 |
% |
Total revenues |
|
|
100.0 |
% |
|
|
100.0 |
% |
|
|
100.0 |
% |
|
|
100.0 |
% |
Note:
Year ended March 31, 2023 compared to year ended March 31, 2022
Revenues
Our revenues decreased by 31.2% from RMB337.5 million in the year ended March 31, 2022 to RMB232.1 million (US$33.8 million) in the year ended March 31, 2023.
Our commission revenues decreased by 34.9% from RMB226.7 million in the year ended March 31, 2022 to RMB147.5 million (US$21.5 million) in the year ended March 31, 2023, primarily attributable to the lower GMV due to the increasingly competitive online shopping environment and several surges in COVID-19 case in China.
Our revenues from marketing services decreased by 75.3% from RMB17.9 million in the year ended March 31, 2022 to RMB4.4 million (US$0.6 million) in the year ended March 31, 2023, primarily due to the challenging competitive environment.
Our revenues from financing solutions services decreased by 59.4% from RMB31.9 million in the year ended March 31, 2022 to RMB12.9 million (US$1.9 million) in the year ended March 31, 2023, primarily due to a decrease in service fees from loans to users in line with less loan originations resulting from lower GMV.
Our revenues from technology services increased by 27.8% from RMB46.1 million in the year ended March 31, 2022 to RMB58.9 million (US$8.6 million) in the year ended March 31, 2023, primarily attributable to the incremental year-over-year contribution of Ruisha Technology, a business acquired in July 2021. This acquisition demonstrates the Company’s commitment to provide brand merchants with one-stop and customized services for full-domain operations, including a wide variety of operational services, data platforms and other software services, as well as value-added services such as traffic placement.
Our other revenues decreased by 44.1% from RMB14.9 million in the year ended March 31, 2022 to RMB8.3 million (US$1.2 million) in the year ended March 31, 2023, primarily due to the decrease in promotion services provided to financial institutions.
95
Table of Contents
Costs and expenses
Our total costs and expenses decreased by 58.7% from RMB1,033.4 million in the year ended March 31, 2022 to RMB426.8 million (US$62.1 million) in the year ended March 31, 2023. The decrease was primarily due to the decrease in impairment charges for goodwill and intangible assets as well as the decrease in amortization for intangible assets.
Cost of revenues. Our costs of revenues decreased by 28.6% from RMB159.6 million in the year ended March 31, 2022 to RMB113.9 million (US$16.6million) in the year ended March 31, 2023. The decrease was primarily due to a decrease in payroll, IT-related expenses and payment handling and outsourcing costs, in line with the overall reduction in revenue.
Sales and marketing expenses. Our sales and marketing expenses decreased by 54.4% from RMB148.4 million in the year ended March 31, 2022 to RMB67.7 million (US$9.9 million) in the year ended March 31, 2023. The decrease was primarily due to optimized spending on branding and user acquisition activities, in line with the overall reduction in revenue.
Research and development expenses. Our research and development expenses decreased by 55.1% from RMB82.6 million in the year ended March 31, 2022 to RMB37.1 million (US$5.4 million) in the year ended March 31, 2023, primarily due to a decrease in payroll costs.
General and administrative expenses. Our general and administrative expenses decreased by 19.9% from RMB79.2 million in the year ended March 31, 2022 to RMB63.4 million (US$9.2 million) in the year ended March 31, 2023. The decrease was primarily due to a decrease in professional service fees and payroll costs.
Amortization of intangible assets. Our amortization of intangible assets decreased by 81.7% from RMB328.2 million in the year ended March 31, 2022 to RMB60.0 million (US$8.7 million) in the year ended March 31, 2023, primarily because the majority of the intangible assets recorded as a result of the business cooperation agreement MOGU entered into with Tencent in July 2018 have been fully amortized as of March 31, 2022.
Impairment of goodwill and intangible assets. Our impairment of goodwill and intangible assets decreased from RMB235.4 million in the year ended March 31, 2022 to RMB84.7 million (US$12.3 million) in the year ended March 31, 2023, primarily due to the Company’s recognition of a full impairment charge of RMB 63.5 million (US$9.2 million) against its remaining goodwill balance and impairments totaling of RMB21.2 million (US$3.1 million) for intangible assets which had been recorded in connection with the acquisition of Ruisha Technology. The recorded impairments resulted from weaker-than-expected operating results which reflect an increasingly competitive business environment and the related limited future economic benefit expected to be generated from these intangible assets. As of March 31, 2023, the carrying value of the Company’s goodwill was nil.
Other income, net
Other income, net. Our other net income decreased by 71.4% from RMB25.4 million in the year ended March 31, 2022 to RMB7.3 million (US$1.1 million) in the year ended March 31, 2023, primarily due to the decrease in refunds from a depositary bank as well as exchange loss. The fluctuations in the exchange rate between the Renminbi and U.S. dollars resulted in a change from foreign exchange gain in the year ended March 31, 2022 of RMB1.2 million to a foreign exchange loss in the year ended March 31, 2023 of RMB8.5 million (US$1.2 million).
Loss from operations
As a result of the foregoing, we incurred loss from operations of RMB187.4 million (US$27.3 million) in the year ended March 31, 2023, compared to loss from operations of RMB670.5 million in the year ended March 31, 2022, primarily attributable to the decrease of impairment of goodwill and intangible assets as well as amortization of intangible assets.
Interest income
Interest income represents interest earned on short-term investments and cash deposits in financial institutions. Our interest income was RMB17.4 million (US$2.5 million) in the year ended March 31, 2023, compared to RMB13.9 million in the year ended March 31, 2022.
Interest expense
Interest expense represents interest paid for short-term borrowing from financial institutions. Our interest expense was RMB0.6 million (US$0.1 million) in the year ended March 31, 2023, compared to nil in the year ended March 31, 2022.
96
Table of Contents
(Loss)/Gain from investments, net
We had a net loss from investments of RMB18.6 million (US$2.7 million) in the year ended March 31, 2023, as compared to a net gain from investments of RMB0.2 million in the year ended March 31, 2022.
Income tax benefits/(expenses)
We recorded an income tax benefit of RMB2.0 million (US$0.3 million) in the year ended March 31, 2023, compared to an income tax benefit of RMB14.5 million in the year ended March 31, 2022.
Share of results of equity investee
We recorded share of results of equity investee of a positive RMB0.9 million (US$0.1 million) in the year ended March 31, 2023, compared to a negative RMB0.5 million in the year ended March 31, 2022.
Net loss
As a result of the foregoing, we incurred net loss of RMB186.4 million (US$27.1 million) in the year ended March 31, 2023, compared to a net loss of RMB642.4 million in the year ended March 31, 2022.
Year ended March 31, 2022 compared to year ended March 31, 2021
For a detailed description of the comparison of our operating results for the year ended March 31, 2022 with those for the year ended March 31, 2021, see “Item 5. Operating and Financial Review and Prospects—Operating Results—Results of Operation— Year ended March 31, 2022 compared to year ended March 31, 2021.” of our annual report on the Form 20-F for the fiscal year ended March 31, 2022 filed with the Securities and Exchange Commission on July 15, 2022.
The following table sets forth a summary of our cash flows for the years presented:
|
|
For the Year Ended March 31, |
|
|||||||||||||
|
|
2021 |
|
|
2022 |
|
|
2023 |
|
|||||||
|
|
RMB |
|
|
RMB |
|
|
RMB |
|
|
US$ |
|
||||
|
|
(in thousands) |
|
|||||||||||||
Summary Consolidated Cash Flow Data: |
|
|
|
|
|
|
|
|
|
|
|
|
||||
Net cash used in operating activities |
|
|
(77,931 |
) |
|
|
(114,409 |
) |
|
|
(10,090 |
) |
|
|
(1,469 |
) |
Net cash (used in)/provided by investing activities |
|
|
(96,663 |
) |
|
|
13,947 |
|
|
|
608 |
|
|
|
89 |
|
Net cash (used in)/provided by financing activities |
|
|
(119,249 |
) |
|
|
450 |
|
|
|
(12,064 |
) |
|
|
(1,757 |
) |
Effect of foreign exchange rate changes on cash and |
|
|
(20,647 |
) |
|
|
(3,455 |
) |
|
|
(860 |
) |
|
|
(125 |
) |
Net (decrease)/increase in cash and cash equivalents |
|
|
(314,490 |
) |
|
|
(103,467 |
) |
|
|
(22,406 |
) |
|
|
(3,262 |
) |
Cash and cash equivalents and restricted cash at |
|
|
857,374 |
|
|
|
542,884 |
|
|
|
439,417 |
|
|
|
63,984 |
|
Cash and cash equivalents and restricted cash |
|
|
542,884 |
|
|
|
439,417 |
|
|
|
417,011 |
|
|
|
60,722 |
|
To date, we have financed our operating and investing activities primarily through cash generated by our operations and historical financing activities. As of March 31, 2021, 2022 and 2023, our cash and cash equivalents were RMB542.1 million, RMB438.6 million and RMB416.2 million (US$60.6 million), respectively. Our cash and cash equivalents consist primarily of cash on hand, time deposits as well as highly liquid investments, which have original maturities of three months or less. As of March 31, 2021, 2022 and 2023, our short-term investments were RMB260.2 million, RMB196.9 million and RMB145.8 million (US$21.2 million), respectively. Short-term investments nearly all consist of time deposits placed with banks with original maturities longer than three months but less than one year, and investments in wealth management products issued by banks or other financial institutions, which contain a fixed or variable interest rate with original maturities within one year.
We believe that our current cash and cash equivalents and short-term investments will be sufficient to meet our anticipated working capital requirements and capital expenditures for at least the next 12 months. We may decide to enhance our
97
Table of Contents
liquidity position or increase our cash reserve for future investments through additional capital and finance funding. The issuance and sale of additional equity would result in further dilution to our shareholders. The incurrence of indebtedness would result in increased fixed obligations and could result in operating covenants that would restrict our operations. We cannot assure you that financing will be available in amounts or on terms acceptable to us, if at all.
As of March 31, 2023, 67.4%, 29.1% and 3.5% of our cash and cash equivalents were held in China, Hong Kong and the Cayman Islands, respectively, of which 22.3% were denominated in U.S. dollars and 77.7% were denominated in Renminbi. Although we consolidate the results of the VIEs and their subsidiaries, we only have access to the assets or earnings of the VIEs and their subsidiaries through our contractual arrangements with the VIEs and their shareholders. See “Item 4. Information on the Company—C. Organizational Structure—Contractual Arrangements with the VIEs and Their Respective Shareholders.” For restrictions and limitations on liquidity and capital resources as a result of our corporate structure, see “—Holding Company Structure.”
In utilizing the proceeds we received from our initial public offering, we may make additional capital contributions to our PRC subsidiaries, establish new PRC subsidiaries and make capital contributions to these new PRC subsidiaries, make loans to our PRC subsidiaries, or acquire offshore entities with operations in China in offshore transactions. However, most of these uses are subject to PRC regulations. See “Item 3. Key Information—D. Risk Factors—Risks Related to Doing Business in China—PRC regulation of loans to and direct investment in PRC entities by offshore holding companies and governmental control of currency conversion may delay or prevent us from using the proceeds of our initial public offering to make loans to or make additional capital contributions to our PRC subsidiaries and VIEs, which could materially and adversely affect our liquidity and our ability to fund and expand our business.”
We expect that substantially all of our future revenues will be denominated in Renminbi. Under existing PRC foreign exchange regulations, payments of current account items, including profit distributions, interest payments and trade and service-related foreign exchange transactions, can be made in foreign currencies without prior SAFE approval as long as certain routine procedural requirements are fulfilled. Therefore, our PRC subsidiaries are allowed to pay dividends in foreign currencies to us without prior SAFE approval by following certain routine procedural requirements. However, approval from or registration with competent government authorities is required where the Renminbi is to be converted into foreign currency and remitted out of China to pay capital expenses such as the repayment of loans denominated in foreign currencies. The PRC government may at its discretion restrict access to foreign currencies for current account transactions in the future.
Operating activities
Net cash used in operating activities in the year ended March 31, 2023 was RMB10.1 million (US$1.5 million). The difference between net cash used in operating activities and the net loss of RMB186.4 million (US$27.1 million) in the same period was primarily due to non-cash items, which mainly consisted of depreciation and amortization of RMB65.3 million (US$9.5 million), impairment of goodwill and intangible assets of RMB84.7 million (US$12.3 million), net loss from investments of RMB19.8 million (US$2.9 million), share-based compensation expenses of RMB13.6 million (US$2.0 million) and deferred tax benefit of RMB8.9 million (US$1.3 million). The effect of the non-cash items was partially offset by the changes in working capital, which mainly included a decrease of RMB12.5 million (US$1.8 million) in accruals and other current liabilities and a decrease of RMB9.8 million (US$1.4 million) in accounts payable.
Net cash used in operating activities in the year ended March 31, 2022 was RMB114.4 million. The difference between net cash used in operating activities and the net loss of RMB642.4 million in the same period was primarily due to non-cash items, which mainly consisted of depreciation and amortization of RMB333.6 million, impairment of goodwill and intangible assets of RMB235.4 million, share-based compensation expenses of RMB12.5 million and deferred tax benefit of RMB16.0 million. The effect of the non-cash items was partially offset by the changes in working capital, which mainly included a decrease of RMB67.0 million in accruals and other current liabilities and a decrease of RMB22.2 million in prepayments and other current assets.
Net cash used in operating activities in the year ended March 31, 2021 was RMB77.9 million. The difference between net cash used in operating activities and the net loss of RMB328.0 million in the same period was primarily due to non-cash items, which mainly consisted of depreciation and amortization of RMB351.1 million, net gain from investments of RMB86.5 million, and share-based compensation expenses of RMB26.3 million. The effect of the non-cash items was partially offset by the changes in working capital, which mainly included a decrease of RMB52.1 million in accruals and other current liabilities and a decrease of RMB21.2 million in prepayments and other current assets.
Investing activities
Net cash received from investing activities in the year ended March 31, 2023 was RMB0.6 million (US$0.1 million), primarily due to net cash inflow for short-term investments of RMB51.5 million (US$7.5 million), net cash received from loans to
98
Table of Contents
users of RMB18.6 million (US$2.7 million), partially offset by purchases of property and equipment of RMB19.0 million (US$2.8 million), cash paid for investment in gold of RMB36.6 million (US$5.3 million) and cash paid for long-term investment of RMB14.8 million (US$2.2 million).
Net cash received from investing activities in the year ended March 31, 2022 was RMB13.9 million, primarily due to net cash inflow for short-term investments of RMB59.0 million and net cash received from loan to users of RMB75.4 million, partially offset by purchases of property and equipment of RMB55.1 million, cash paid for acquisition of subsidiaries of RMB36.1 million and cash paid for long-term investment of RMB34.6 million.
Net cash used in investing activities in the year ended March 31, 2021 was RMB96.7 million, primarily due to purchases of property and equipment, net and intangible assets of RMB165.8 million, cash paid for long-term investments of RMB23.0 million and net cash outflow for short-term investments of RMB21.9 million, partially offset by proceeds from disposal of long-term investment of RMB104.4 million.
Financing activities
Net cash used in financing activities in the year ended March 31, 2023 was RMB12.1 million (US$1.8 million), primarily attributable to payments for short-term borrowing of RMB11.3 million (US$1.7 million), and cash payments for repurchase of our ordinary shares of RMB1.3 million (US$0.2 million).
Net cash provided by financing activities in the year ended March 31, 2022 was RMB0.5 million, primarily attributable to proceeds from short-term borrowing of RMB10.1 million and cash payments for repurchase of our ordinary shares of RMB9.7 million.
Net cash used in financing activities in the year ended March 31, 2021 was RMB119.2 million, primarily attributable to cash payments for repurchase of our ordinary shares.
Capital expenditures
Our capital expenditures are primarily incurred for purchases of electronic equipment, furniture and office equipment, leasehold improvements, as well as office buildings. Our capital expenditures were RMB165.8 million in the fiscal year of 2021, RMB55.1 million in the fiscal year of 2022 and RMB55.5 million (US$8.1 million) in the fiscal year of 2023. We intend to fund our future capital expenditures with our existing cash balance, short-term investments and proceeds from our initial public offering. We will continue to make capital expenditures to meet the expected growth of our business.
Material Cash requirements
Off-Balance Sheet Arrangements
We have not entered into any financial guarantees or other commitments to guarantee the payment obligations of any third parties. In addition, we have not entered into any derivative contracts that are indexed to our shares and classified as shareholder’s equity or that are not reflected in our consolidated financial statements. Furthermore, we do not have any retained or contingent interest in assets transferred to an unconsolidated entity that serves as credit, liquidity or market risk support to such entity. We do not have any variable interest in any unconsolidated entity that provides financing, liquidity, market risk or credit support to us or engages in leasing, hedging or product development services with us.
Contractual Obligations
The following table sets forth our contractual obligations as of March 31, 2023:
|
|
For the Year Ended March 31, |
|
|||||||||||||||||
|
|
(in RMB thousands) |
|
|||||||||||||||||
|
|
2024 |
|
|
2025 |
|
|
2026 |
|
|
2027 |
|
|
2028 |
|
|||||
Asset purchase remaining obligations(1) |
|
|
10,450 |
|
|
|
— |
|
|
|
— |
|
|
|
— |
|
|
|
— |
|
Note:
99
Table of Contents
Other than as shown above, we did not have any significant capital and other commitments, long-term obligations or guarantees as of March 31, 2023.
Holding Company Structure
MOGU Inc. is a holding company with no material operations of its own. We conduct our operations primarily through our PRC subsidiaries and the VIEs in China. As a result, MOGU Inc.’s ability to pay dividends depends upon dividends paid by our PRC subsidiaries. If our existing PRC subsidiaries or any newly formed ones incur debt on their own behalf in the future, the instruments governing their debt may restrict their ability to pay dividends to us. In addition, our wholly foreign-owned subsidiaries in China are permitted to pay dividends to us only out of their retained earnings, if any, as determined in accordance with PRC accounting standards and regulations. Under PRC law, each of the subsidiaries and VIEs in China is required to set aside at least 10% of its after-tax profits each year, if any, to fund certain statutory reserve funds until such reserve funds reach 50% of their registered capital. In addition, our wholly foreign-owned subsidiaries in China may allocate a portion of their after-tax profits based on PRC accounting standards to enterprise expansion funds and staff bonus and welfare funds at their discretion, and the VIEs may allocate a portion of their after-tax profits based on PRC accounting standards to a surplus fund at their discretion. The statutory reserve funds and the discretionary funds are not distributable as cash dividends. Remittance of dividends by a wholly foreign-owned company out of China is subject to examination by the banks designated by SAFE. Our PRC subsidiaries have not paid dividends and will not be able to pay dividends until they generate accumulated profits and meet the requirements for statutory reserve funds. Total restrictions placed on the distribution of our PRC subsidiaries’ net assets were RMB552.1 million (US$80.4 million) as of March 31, 2023.
See “Item 4. Information on the Company—B. Business Overview—Technology and Infrastructure.” and “Item 4. Information on the Company—B. Business Overview—Intellectual Property.”
Other than as disclosed elsewhere in this annual report, we are not aware of any trends, uncertainties, demands, commitments or events for the year ended March 31, 2023 that are reasonably likely to have a material and adverse effect on our net revenues, income, profitability, liquidity or capital resources, or that would cause the disclosed financial information to be not necessarily indicative of future results of operations or financial conditions.
We prepare financial statements in conformity with U.S. GAAP, which requires us to make estimates and assumptions that affect the reported amounts of assets and liabilities, disclosures of contingent assets and liabilities on the date of the balance sheet and the reported amounts of revenues and expenses during the financial reporting period. We continually evaluate these estimates and assumptions based on the most recently available information, our own historical experiences and various other assumptions that are believed to be reasonable under the circumstances, which together form the basis for making judgments about the carrying values of assets and liabilities that are not readily apparent from other sources. Since the use of estimates is an integral component of the financial reporting process, actual results could differ from those estimates. Some of our accounting policies require higher degrees of judgment than others in their application. We consider the policies discussed below to be critical to an understanding of our financial statements as their application places the most significant demands on management’s judgment.
Business combination
We account for our business combinations using the acquisition method of accounting in accordance with Accounting Standards Codification (“ASC”) 805 “Business Combinations.” The cost of an acquisition is measured as the aggregate of the acquisition date fair values of the assets transferred and liabilities incurred by our company to the sellers and equity instruments issued. Transaction costs directly attributable to the acquisition are expensed as incurred. Identifiable assets and liabilities acquired or assumed are measured separately at their fair values as of the acquisition date, irrespective of the extent of any non-controlling interests. The excess of (i) the total costs of acquisition, fair value of the non-controlling interests and acquisition date fair value of any previously held equity interest in the acquiree over (ii) the fair value of the identifiable net assets of the acquiree is recorded as goodwill. If the cost of acquisition is less than the fair value of the net assets of the subsidiary acquired, the difference is recognized directly in our Consolidated Statements of Operations and Comprehensive Loss.
In a business combination achieved in stages, we re-measure the previously held equity interest in the acquiree immediately before obtaining control at our acquisition-date fair value, and the re-measurement gain or loss, if any, is recognized in our Consolidated Statements of Operations and Comprehensive Loss.
100
Table of Contents
The determination and allocation of fair values to the identifiable assets acquired and liabilities assumed is based on various assumptions and valuation methodologies requiring considerable management judgment. The most significant variables in these valuations are discount rates, terminal values, growth rates, the number of years on which to base the cash flow projections, as well as the assumptions and estimates used to determine the cash inflows and outflows.
Goodwill
Goodwill represents the excess of the purchase price over the fair value of the identifiable assets and liabilities acquired in a business combination.
Goodwill is not depreciated or amortized but is tested for impairment on an annual basis as of March 31, and in between annual tests when an event occurs, or circumstances change that could indicate that the assets might be impaired. In accordance with the FASB guidance on “Testing of Goodwill for Impairment,” a company first has the option to assess qualitative factors to determine whether it is more likely than not that the fair value of a reporting unit is less than its carrying amount. If the z decides, as a result of its qualitative assessment, that it is more likely than not that the fair value of a reporting unit is less than its carrying amount, the quantitative impairment test is mandatory. Otherwise, no further testing is required. The quantitative impairment test consists of a comparison of the fair value of each reporting unit with its carrying amount, including goodwill.
We adopted ASU No. 2017-04, 2020, following the new guidance, an impairment charge shall be recognized for the amount by which the carrying amount exceeds the reporting unit’s fair value. Application of a goodwill impairment test requires significant management judgment, including the identification of reporting units, assigning assets and liabilities to reporting units, assigning goodwill to reporting units, and determining the fair value of each reporting unit. The judgment in estimating the fair value of reporting units includes estimating future cash flows, determining appropriate discount rates and making other assumptions. Changes in these estimates and assumptions could materially affect the determination of fair value for each reporting unit.
As of Mach 31, 2021, we only had one reporting unit, which was the LVB focused online business reporting unit. Upon consummation of the acquisition of Ruisha Technology in July 2021, we had two reporting units, which was the LVB focused online business reporting unit and brands and customized services business reporting unit. The goodwill balance of RMB186.5 million as of March 31, 2021 mainly arose from the acquisition of Meiliworks Limited in February 2016. And the balance of RMB63.5 million as of March 31, 2022 mainly arose from the acquisition of Ruisha Technology in July 2021.
As of March 31, 2021, considering qualitative factors that we were suffering from accumulated loss and operating cash outflow and our market capitalization was below the carrying value of our reporting unit, we concluded that quantitative goodwill impairment test was required.
When performing the annual goodwill impairment test, we estimated the fair value of the LVB focused online business reporting unit using the income approach methodology of valuation where significant judgments and estimates were applied. We determined the fair value of the LVB focused online business reporting unit based on cash flow projection of the reporting unit until the year ended March 31, 2027 with a terminal value related to the future cash flows extrapolated beyond the year ended March 31, 2027 using an expected future growth rate. Key assumptions used to determine the fair value of the LVB focused online business reporting unit included annual revenue growth rates and earning before interests and income tax (“EBIT”) margins, discount rates, and expected future growth rates beyond forecast period. The revenue growth rates used were estimated based on past experience, current industry environment and forecasts of future market developments, and did not exceed the long-term average growth rates of the industry we operate. We estimated budgeted EBIT margins based on past experience and forecasts of future market developments. The discount rate used by us was the weighted average cost of capital that was able to reflect the risks. The expected future growth rates beyond forecast period were estimated based on the long-term inflation rate of China. Changes in these estimates and assumptions could materially affect the determination of fair value for the reporting unit.
Based on the result of the goodwill impairment testing as of March 31, 2021, the estimated the fair value of the LVB focused online business reporting unit exceeded its carrying amount by approximately 17% as of March 31, 2021. As a result, there was no additional impairment of goodwill as of March 31, 2021.
In the first half year of the fiscal year of 2022, the overall operation performance of the LVB focused online reporting unit had been continually decreasing which was resulted from less-than-expected performance of LVB-focused business due to an increasingly heightened competitive Live eCommerce industry and low rate of return compared with the increasing traffic cost. Furthermore, the LVB associated GMV started decreasing compared with the same period of the fiscal year of 2021. We concluded the existence of the triggering events which required us to perform an interim goodwill impairment test as of September 30, 2021.
101
Table of Contents
When performing the interim goodwill impairment test, we estimated the fair value of the LVB focused online business reporting unit using the income approach methodology of valuation where significant judgments and estimates were applied, including the forecasts of future operating results, discount rates, and expected future growth rates with the consideration of the recent market environment. Changes in these estimates and assumptions could materially affect the determination of fair value for the reporting unit. Based upon the results of this impairment test, we impaired all remaining goodwill related to the LVB focused online business reporting unit in the amount of RMB186,504 as of September 30, 2021.
As of March 31, 2022, we performed an annual goodwill impairment test on our brands and customized services business reporting unit. To determine the fair value of the brands and customized services business reporting unit, we used the income approach methodology of valuation where significant judgments and estimates were applied, including the forecasts of future operating results, discount rates, and expected future growth rates with the consideration of the recent market environment. Changes in these estimates and assumptions could materially affect the determination of fair value for the reporting unit. Based on the result of annual impairment testing, the fair value of the brands and customized services business reporting unit exceeded its carrying amount by approximately 9%. As a result, there was no additional impairment of goodwill as of March 31, 2022.
In the second half year of fiscal year of 2023, we have taken measures to integrate Ruisha Technology’s business operation into its core business. As of March 31, 2023, we concluded that there was only one reporting unit given the costs and expenses were not directly attributable to a specific operating segment and the chief operating decision maker only reviews the operating results on a consolidated basis. Accordingly, as of March 31, 2023, we performed the annual impairment test on the goodwill by comparing our market capitalization as of March 31, 2023 with the carrying amount of our net assets. Given the prolonged period of deficits in market price, also taking into consideration of our continuously weaker-than-expected performance, we provided full impairment charge of RMB63,460 against the balance of goodwill. Consequently, as of March 31, 2023, the carrying value of our goodwill was nil.
Intangible assets
We amortize definite lived intangible assets on a straight-line basis over their estimated useful lives, which is 2 to 20 years. The estimated life of amortized intangibles is reassessed if circumstances occur that indicate the life has changed. Changes in these estimates and assumptions could materially affect the determination of the useful lives of intangible assets.
Impairment of long-lived assets
Long-lived assets (including intangibles with definite lives) are reviewed for impairment whenever events or changes in circumstances indicate that the carrying amount of an asset may not be recoverable. Reviews are performed to determine whether the carrying value of asset group is impaired, based on comparison to undiscounted expected future cash flows. If this comparison indicates that there is impairment, we recognize an impairment of long-lived assets to the extent the carrying amount of such assets exceeds the fair value.
As of March 31, 2022, and after considering the first-ever year-over-year decrease of the GMV from LVB and the weaker-than-expected operating results, we concluded that these changes in circumstances represented a triggering event which required us to perform an impairment test on the LVB focused online business asset group. Given that the aggregated undiscounted cash flows were lower than the carrying amount of this asset group, we concluded that it was necessary to determine the fair value of the asset group for purposes of determining a potential impairment charge. The determined fair value of the LVB focused online business asset group resulted in an impairment charge of RMB48,862 which was allocable to each asset in the group. The charge was allocated to each asset on a pro rata basis based upon respective carrying values and after giving consideration to the fair values of each individual asset. The fair value of each asset was determined using appropriate valuation methodologies, including the relief of royalty method for the broadcasting, insurance agency and domain name intangibles. The cost savings approach was used to fair value the strategic business services intangible asset. The replacement cost approach was used to fair value property, plant, and equipment. Judgment in estimating the fair values of these assets included estimating future growth rates, royalty rates and/or discount rates. As a result of management’s analysis, we recorded impairment charges for the broadcasting license, insurance agency license and domain name intangible assets of RMB38,690, RMB2,100 and RMB8,072, respectively, for the year ended March 31, 2022, as we believed the future economic benefit to be generated from these intangible assets were not sufficient to recover related net book values. No impairment charges were recorded in 2020 and 2021.
As of March 31, 2023, considering our weaker-than-expected operating results, we concluded that there were indicators that the carrying value of our intangible assets may not be fully recoverable. As the aggregated undiscounted cash flows were lower than the carrying amount of the brands and the customized services business asset group, we concluded that it was necessary to determine the fair value of the asset group for purposes of determining a potential impairment charge. The determined fair value of the asset group resulted in an impairment charge of RMB21,233 which was allocable to each asset in the group. The charge was allocated
102
Table of Contents
to each asset on a pro rata basis based upon respective carrying values and after giving consideration to the fair values of each individual asset. The fair value of each intangible asset was determined using appropriate valuation methodologies, including the relief of royalty method for the technology and multi-period excess earnings method for customer relationship. Judgment in estimating the fair values of these assets included estimating future growth rates, royalty rates and/or discount rates. As a result of the impairment assessment, we provided impairment charges against the carrying value of the customer relationship and technology intangible assets acquired as a result of the acquisition of Ruisha Technology of RMB17,033 and RMB4,200, respectively, for the year ended March 31, 2023, as we believed the future economic benefit to be generated from these intangible assets is not sufficient to recover related net book values.
As of March 31, 2022 and 2023, we have no indefinite lived intangibles.
Revenue recognition
We adopted ASC Topic 606, namely Revenue from Contracts with Customers, for all periods presented. Consistent with the criteria of Topic 606, we recognize revenue to depict the transfer of promised goods or services to customers in an amount that reflects the consideration to which we expect to receive in exchange for those goods or services.
To achieve that core principle, we apply the five steps as defined under Topic 606. We assess our revenue arrangements against specific criteria in order to determine if we are acting as principal or agent. Revenue arrangements with multiple performance obligations are divided into separate units of accounting. We allocate the transaction price to each performance obligation based on the relative standalone selling prices of the goods or services being provided. Revenue is recognized upon transfer of control of promised goods or services to a customer.
Revenue is recorded net of value-added-tax. Revenue recognition policies for each type of revenue stream are analyzed as follows:
Commission revenues
We operate our online platform for merchants to sell their merchandise to our users and also provide integrated platform-wide services. The merchants can choose the marketplace service only or both of the marketplace service and integrated platform-wide services. When the transactions are completed on our platform, we charge merchants commissions at their respective agreed percentage of the amount of merchandise sold by merchants. We have determined that services to enable the successful merchandise transactions on our marketplace and integrated promotional related services are separate performance obligations. The merchandise transactions are deemed completed (with related commission revenue earned) upon users’ acceptance of merchandise. For the year ended March 31, 2022 and 2023, commission revenue only related to our obligation to enable successful merchandise transactions. There was no commission revenue recognized in fiscal 2022 and 2023 related to integrated promotional related services. Commision revenue recognized in fiscal 2021 related to integrated promotional related services was immaterial. We apply the practical expedient that allocates the commission revenues for the integrated services to the respective day on which we have the right to invoice. We do not control the underlying merchandise provided by merchants before they are transferred to users, as we are not responsible for fulfilling the promise to provide the merchandise to users and have no inventory risk before the merchandise are transferred to the users or after the control is transferred to the users. In addition, we have no discretion in establishing prices of the merchandise provided by merchants. Commission revenues are recognized on a net basis by us as an agent at the point of users’ acceptance of merchandise.
Commission fees are refundable if and when users return the merchandise to merchants and the refund is recognized as variable consideration. We determine the amount of consideration to which we expect to be entitled subject to constraint that it is probable that a significant reversal in the cumulative amount of revenue recognized will not occur when the uncertainty is resolved. We recognize the amounts received for which we do not expect to be entitled as a refund liability when we transfer service to merchants as an agent. At the end of each reporting period, we update our assessment of amounts for which it expects to be entitled in exchange for the transferred services and makes a corresponding change to the amount of commission revenue recognized.
Marketing services revenues
We provide marketing services to merchants and brand partners that help them promote their products in designated areas on our platform directly or via social network platforms over particular periods of time that will then divert users back to our platform. Such services are charged at fixed prices or at prices established through our online auction system. In general, merchants and brand partners need to prepay for the marketing services. Revenue is recognized ratably over the period during which the content is displayed, or when the content or offerings are clicked or viewed by users, or when an underlying transaction is completed by a merchant.
103
Table of Contents
Financing solutions revenues
We generate revenues from loaning to users and merchants through factoring arrangements and from making services by facilitating the financial institutions to provide loans to merchants and users through our online platform and services to manage repayments.
For loans to users and merchants through factoring arrangements, we extend loans to users by making payments to the merchants on behalf of the users so that effectively we purchase merchants’ receivables due from respective users without recourse and charges a service fee to users based on the principal and repayment terms. We also extend loans to merchants by purchasing their accounts receivables from users with recourse and charges a service fee to merchants based on the principal. We records loan receivables when the cash is advanced to the users or merchants. The service fees are recognized over the term of loans.
For the services to facilitate the financial institutions to provide loans to merchants and users through our online platform and services to manage repayments, our service fees are charged to the borrowers based on agreed rates of the principal and are allocated between facilitation service and repayment management service in the same transaction based on the relative standalone selling price of each. Revenue is recognized when the fund is drawn down by the borrowers for the facilitation service or over the financing period on a straight-line basis for the repayment management service.
Technology services revenues
We provide technology services to business customers who operate through our online platform and third-party platform. Fees are fixed or charged as agreed percentages of the amount of the successful transactions of the customers. Revenue from technology services is recognized when the services are rendered, ratably over the period during which the services are provided, or upon the completion of successful transactions.
Other revenues
Other revenues are mainly comprised of the revenues from: (i) online direct sales whereby that we sell our own merchandise products through our platform and recognize the product sales revenue on a gross basis, (ii) promotion services that we provide to financial institutions, (iii) logistical services provided to merchants and users, and (iv) other services. Revenue is recognized when the services are rendered.
Remaining performance obligations
Revenue allocated to remaining performance obligations represents that portion of the overall transaction price that has been received (or for which we have an unconditional right to payment) allocated to performance obligations that we have not yet fulfilled, which is presented as deferred revenue that has not yet been recognized. As of March 31, 2023, the remaining performance obligation represents the advance payment received by us for future technology services provide to brand customers, and the aggregate amount of the transaction price allocated to remaining performance obligations was RMB1,501.
Investments
Our investments include equity method investment and available-for-sale security investments.
We have investments in privately held companies. We apply the equity method of accounting to account for an equity investment, in common stock or in-substance common stock, according to ASC 323 “Investment—Equity Method and Joint Ventures,” over which it has significant influence but does not own a majority equity interest or otherwise control.
An investment in in-substance common stock is an investment in an entity that has risk and reward characteristics that are substantially similar to that entity’s common stock. We consider subordination, risks and rewards of ownership and obligation to transfer value when determining whether an investment in an entity is substantially similar to an investment in that entity’s common stock.
Under the equity method, our share of the post-acquisition profits or losses of the equity investee are recorded in share of results of equity investee in the Consolidated Statements of Operations and Comprehensive Loss and our share at post-acquisition movements in accumulated other comprehensive income in relation to foreign currency translation adjustment is recognized in shareholders’ equity. The excess of the carrying amount of the investment over the underlying equity in net assets of the equity investee represents goodwill and intangible assets acquired. When our share of losses in the equity investee equals or exceeds its interest in the equity investee, we do not recognize further losses, unless we have incurred obligations or made payments or guarantees
104
Table of Contents
on behalf of the equity investee. If the investee subsequently reports net income, we resume applying the equity method only after its share of that net income equals the share of net losses not recognized during the period the equity method was suspended.
Investments in debt securities are accounted for as available-for-sale debt security investments, and are recognized based on trade date and carried at estimated fair value with the aggregate unrealized gains and losses related to these investments, net of taxes, reported through other comprehensive income. Realized gains or losses are charged to earnings during the period in which the gains or losses are realized. Gain or losses are realized when such investments are sold or when dividends are declared or payments are received or when other than temporarily impaired.
Equity securities that have readily determinable fair values are measured at fair value, with changes in fair value reported through earnings.
Currently, the maturities for debt securities we held are longer than 12 months and we do not expect to convert securities to cash within one year.
We continually review our investments to determine whether a decline in fair value to below the carrying value is other-than-temporary. The primary factors we consider in our determination are the duration and severity of the decline in fair value; the financial condition, operating performance and the prospects of the equity investee; and other company specific information such as recent financing rounds. When indicators of impairment exist, we also prepare quantitative measurements of the fair value of our investments using income or market approach, which requires the use of unobservable inputs, such as revenue growth rate, weighted average cost of capital, selection of comparable companies and multiples, expected volatility, discount for lack of marketability and probability of exit events as it relates to liquidation and redemption preferences when applicable. The fair value information is sensitive to changes in the unobservable inputs used to determine fair value and such changes could result in the fair value at the reporting date to be different from the fair value presented.
Fair value measurement of available-for-sale debt securities
We classify our available-for-sales debt securities as Level 3 investments. We determined the fair value of our available-for-sale debt securities by using the market approach. See Note 7 to our consolidated financial statements included elsewhere in this annual report.
As for the market approach, the determination of the fair value was based on estimates, judgments and information of other comparable public companies as well as observable price changes based on recent transactions of the securities, or similar securities that we hold. The significant unobservable inputs adopted in the valuation as of March 31, 2021, 2022 and 2023 are as following:
|
|
For the years ended March 31, |
||||
|
|
2021 |
|
2022 |
|
2023 |
Lack of marketability discount |
|
30% |
|
30% |
|
30% |
Risk-free rate |
|
0.5% |
|
2%~3% |
|
3.6%-4.3% |
Expected volatility |
|
45% |
|
30%~46% |
|
39%-60% |
Revenue multiple |
|
7.92 |
|
1~10 |
|
4~9 |
Net profit multiple |
|
16 |
|
25 |
|
— |
Significant increases (decreases) in the lack of marketability discount in isolation would result in significantly lower (higher) fair value measurement. Significant increases (decreases) in the risk-free rate, expected volatility, revenue multiple or net profit multiple assumptions in isolation would result in significantly higher (lower) fair value measurement. When our assumptions related to the estimates of the fair value of the investment decreased/increased by 5% while holding all other estimates constant, there would be no significant impact to our consolidated results of operations.
Loan receivables, net
Loan receivables represent the funds extended by the us to qualified merchants and users through our factoring arrangements. The loan periods generally range from 1 month to 12 months. The loan receivables are measured at amortized cost and net of allowance for doubtful accounts.
We consider many factors in assessing the collectability of its loan receivable, such as the age of the amounts due, the payment history, creditworthiness and financial conditions of the borrowers, to determine the allowance percentage of the overdue balances. Such assumptions may change in future periods. We adjust the allowance balance periodically when there are significant
105
Table of Contents
differences between estimated and actual bad debts. An allowance for doubtful accounts is recorded in the period in which a loss is determined probable.
If the loan receivable with allowance for doubtful accounts is subsequently collected, the previously recognized allowance for doubtful accounts is reversed. The amount of reversal is recognized in the Consolidated Statements of Operations and Comprehensive Loss.
Recently Issued Accounting Pronouncements
We discuss recently adopted and issued accounting standards in Note 2, “Summary of Significant Accounting Policies—Recent accounting pronouncements” to our consolidated financial statements, which are included in this annual report beginning on page F-1.
Item 6. Directors, Senior Management and Employees
The following table sets forth information regarding our directors and executive officers as of the date of this annual report.
Directors and Executive Officers |
|
Age |
|
Position/Title |
Qi Chen |
|
41 |
|
Co-founder, Chairman of the Board of Directors |
Yiming Fan |
|
35 |
|
Director and Chief Executive Officer |
Qi Feng |
|
42 |
|
Director and Financial Controller |
Andrew Hong Teoh |
|
46 |
|
Independent Director |
Shengwen Rong |
|
54 |
|
Independent Director |
Mr. Qi Chen is our co-founder and has served as the chairman of our board of directors and our chief executive officer since June 2011, and resigned as the chief executive officer due to personal reasons, effective on March 17, 2023. Mr. Chen is a pioneer of online fashion community in China. Prior to co-founding Mogujie, Mr. Chen worked at Taobao.com, a subsidiary of Alibaba, from 2004 to 2010, first as a user interface and user experience designer and later as a product manager. Mr. Chen received his bachelor’s degree in computer science from Zhejiang University.
Mr. Fan Yiming is currently serving as the chief executive officer of our Company. He has been working at the Company since 2014, and served as a brand director, a vice president of marketing and a general manager of business prior to his appointment as the CEO. At his prior position, Mr. Fan was in charge of the Company’s live video broadcast, platform operation, marketing, branding public relations and other businesses. At the same time, Mr. Fan serves as a visiting professor at Suzhou University and acted as the final judge of various international marketing communication awards. Prior to joining the Company, Mr. Fan worked at an advertising company for 5 years, which is a member of The American Association of Advertising Agencies. Mr. Fan graduated from Jiangsu Normal University, majoring in advertising.
Ms. Qi Feng has served as our financial controller since May 2021. Ms. Feng joined us in June 2013 as the director of finance department and served as the president assistant from February 2018 to May 2021. Prior to joining us, Ms. Feng worked at State Street Technology (Zhejiang) Co., Ltd. as the reporting manager from 2012 to 2013 and worked for over 6 years in total at PricewaterhouseCoopers Consultants (Shenzhen) Limited and KPMG Enterprise Consulting Co., Ltd. Ms. Feng received her bachelor’s degree in mathematics in 2003 and master’s degree in financing in 2006 from Zhejiang University.
Mr. Andrew Hong Teoh has served as our independent director since December 2018. Mr. Teoh has spent nearly his entire career working with entrepreneurs in the technology area as an operator, investor and advisor focusing in Greater China. Mr. Teoh is the co-founding managing partner of Ameba Capital, an early stage technology fund focusing in China. Mr. Teoh also co-founded Ikaria Capital, a multi-family investment company focusing on late-stage and public technology company investments. Prior to founding both companies, Mr. Teoh was the vice president and head of corporate finance at Alibaba Group where he built and led the corporate development and corporate finance efforts of Alibaba Group. At Alibaba Group, Mr. Teoh also led its treasury efforts including cash planning, investment and risk management. Prior to joining Alibaba, Mr. Teoh was an investment banker at ABM AMRO and a management consultant at PricewaterhouseCoopers. Mr. Teoh received his bachelor’s degree in commerce from the University of New South Wales, Australia.
Mr. Shengwen Rong has served as our independent director since September 2019. Mr. Rong has over two decades of experience in the global financial industry. Mr. Rong currently also serves as an independent director of BlueCity Holdings Limited
106
Table of Contents
(NASDAQ: BLCT), Qudian Inc. (NYSE: QD) and X Financial (NYSE: XYF). From February 2017 to September 2018, Mr. Rong served as the senior vice president and chief financial officer at Yixia Technology Co., Ltd, a leading live video broadcast and short-video platform in China. Prior to that, he served as the chief financial officer at Quixey, Inc. from 2015 to 2016, the chief financial officer at UCWeb from 2012 to 2014, and the chief financial officer at Country Style Cooking Restaurant Chain Co., Ltd, an NYSE-listed company, from 2010 to 2012. Mr. Rong received his bachelor’s degree in international finance from Renmin University in 1991, a master’s degree in accounting from West Virginia University in 1996, and an MBA degree from University of Chicago’s Booth School of Business in 2000. Mr. Rong is a Certified Public Accountant in the United States.
For the year ended March 31, 2023, we paid an aggregate of RMB12.3 million (US$1.8 million) in cash compensation and granted 72,413,700 restricted share units to our executive officers and non-executive directors. We have not set aside or accrued any amount to provide pension, retirement or other similar benefits to our directors and executive officers. Our PRC subsidiaries and the VIEs are required by law to make contributions equal to certain percentages of each employee’s salary for his or her pension insurance, medical insurance, unemployment insurance and other statutory benefits and a housing provident fund.
Employment Agreements and Indemnification Agreements
We have entered into employment agreements with each of our executive officers. Under these agreements, each of our executive officers is employed for a specified time period. We may terminate employment for cause, at any time, without advance notice or remuneration, for certain acts of the executive officer, such as conviction or plea of guilty to a felony or any crime involving moral turpitude, negligent or dishonest acts to our detriment, or misconduct or a failure to perform agreed duties. We may also terminate an executive officer’s employment without cause upon three-month advance written notice. In such case of termination by us, we will provide severance payments to the executive officer as expressly required by applicable law of the jurisdiction where the executive officer is based. The executive officer may resign at any time with a three-month advance written notice.
Each executive officer has agreed to hold, both during and after the termination or expiry of his or her employment agreement, in strict confidence and not to use, except as required in the performance of his or her duties in connection with the employment or pursuant to applicable law, any of our confidential information or trade secrets, any confidential information or trade secrets of our clients or prospective clients, or the confidential or proprietary information of any third party received by us and for which we have confidential obligations. The executive officers have also agreed to disclose in confidence to us all inventions, designs and trade secrets which they conceive, develop or reduce to practice during the executive officer’s employment with us and to assign all right, title and interest in them to us, and assist us in obtaining and enforcing patents, copyrights and other legal rights for these inventions, designs and trade secrets.
In addition, each executive officer has agreed to be bound by non-competition and non-solicitation restrictions during the term of his or her employment and typically for one year following the last date of employment. Specifically, each executive officer has agreed not to (i) approach our suppliers, clients, customers or contacts or other persons or entities introduced to the executive officer in his or her capacity as a representative of us for the purpose of doing business with such persons or entities that will harm our business relationships with these persons or entities; (ii) assume employment with or provide services to any of our competitors, or engage, whether as principal, partner, licensor or otherwise, any of our competitors, without our express consent; or (iii) seek directly or indirectly, to solicit the services of any of our employees who is employed by us on or after the date of the executive officer’s termination, or in the year preceding such termination, without our express consent.
We have also entered into indemnification agreements with each of our directors and executive officers. Under these agreements, we agree to indemnify our directors and executive officers against certain liabilities and expenses incurred by such persons in connection with claims made by reason of their being a director or officer of our company.
Amended and Restated Global Share Plan
In September 2011, our shareholders and board of directors adopted the Global Share Plan, which we refer to as the Plan in this annual report, to attract and retain the best available personnel, provide additional incentives to employees, directors and consultants, and promote the success of our business. The Plan was amended and restated in September 2016 to permit the grant of restricted share units and was further amended and restated in its entirety in November 2018 by our board of directors and shareholders. Such amended and restated version, which we refer to as the Amended and Restated Global Share Plan, or the Amended Plan, superseded all the prior versions of the Plan.
Under the Amended Plan, the maximum aggregate number of ordinary shares available for issuance is initially 228,327,161 ordinary shares, plus one or several increases during the term of the Amended Plan by an amount equal to such number
107
Table of Contents
of shares of our company as may be determined by our board of directors, provided that (i) the aggregate number of shares increased in each fiscal year shall not be more than 3% of the total number of shares issued and outstanding on the last day of the immediately preceding fiscal year and (ii) the aggregate number of shares increased during the term of the Amended Plan shall not be more than 6% of the total number of shares issued and outstanding on the last day of the fiscal year immediately preceding the most recent increase. As of June 30, 2023, options to purchase 5,758,327 ordinary shares and 72,118,800 restricted share units have been granted and are outstanding under the Plan, excluding options and restricted share units that were forfeited or canceled after the relevant grant dates.
The following paragraphs describe the principal terms of the Amended Plan:
Types of Awards. The Amended Plan permits the awards of options, restricted shares, restricted share units or any other type of awards approved by the administration committee.
Plan Administration. Our board of directors or a committee designated by the board of directors will act as the plan administrator. The plan administrator will determine the participants who are to receive awards, the type or types of awards to be granted, the number of awards to be granted, and the terms and conditions of each award grant.
Award Agreement. Awards granted under the Amended Plan are evidenced by an award agreement that sets forth terms, conditions and limitations for each award, which may include the term of the award, the provisions applicable in the event that the grantee’s employment or service terminates, and our authority to unilaterally or bilaterally amend, modify, suspend, cancel or rescind the award.
Eligibility. We may grant awards to our employees, directors and consultants of our company. However, we may grant options that are intended to qualify as incentive share options only to our employees and employees of our parent companies and subsidiaries.
Vesting Schedule. In general, the plan administrator determines the vesting schedule, which is specified in the relevant award agreement.
Transfer Restrictions. Awards may not be transferred in any manner by the recipient other than in accordance with the exceptions provided in the Amended Plan, such as transfers by will or the laws of descent and distribution.
Termination and Amendment of the Amended Plan. Unless terminated earlier, the Amended Plan has a term of ten years. Our board of directors has the authority to amend or terminate the Amended Plan. However, no such action may adversely affect in any material way any awards previously granted unless agreed by the relevant grantee.
The following table summarizes, as of June 30, 2023, the awards granted under the Amended Plan to our directors and executive officers, excluding awards that were exercised, forfeited or canceled after the relevant grant dates.
Name |
|
Ordinary Shares |
|
|
Average Exercise |
|
Date of Grant |
|
Date of Expiration |
|
Andrew Hong Teoh |
|
* |
|
|
Nominal |
|
May 1, 2016 |
|
April 30, 2026 |
|
Qi Feng |
|
* |
|
|
Nominal |
|
Various dates from |
|
Various dates from |
|
Yiming Fan |
|
|
110,830,550 |
|
|
Nominal |
|
Various dates from |
|
Various dates from |
Note:
* Aggregate number of shares represented by all grants of options and restricted share units to the person accounted for less than 1% of our total outstanding ordinary shares on an as-converted basis as of June 30, 2023.
As of June 30, 2023, grantees other than executive officers and directors as a group held outstanding options to purchase 4,244,327 ordinary shares of our company, at a weighted average exercise price of US$0.18 per share, and 34,786,950 restricted share units.
108
Table of Contents
Our board of directors consists of five directors. A director is not required to hold any shares in our company by way of qualification. A director who is in any way, whether directly or indirectly, interested in a contract or proposed contract with our company is required to declare the nature of his or her interest at a meeting of our directors. A director may vote with respect to any contract, proposed contract or arrangement notwithstanding that he or she may be interested therein, and if he or she does so his or her vote shall be counted and he or she may be counted in the quorum at any meeting of our directors at which any such contract or proposed contract or arrangement is considered. Our directors may exercise all the powers of our company to borrow money, mortgage or charge its undertaking, property and uncalled capital, and to issue debentures or other securities whenever money is borrowed or as security for any debt, liability or obligation of our company or of any third party. None of our non-executive directors has a service contract with us that provides for benefits upon termination of service.
Committees of the Board of Directors
We have established three committees under the board of directors: an audit committee, a compensation committee and a nominating and corporate governance committee. We have adopted a charter for each of the three committees. Each committee’s members and functions are described below.
Audit Committee. Our audit committee consists of Mr. Andrew Hong Teoh and Mr. Shengwen Rong. Mr. Shengwen Rong is the chairperson of our audit committee. We have determined that Mr. Andrew Hong Teoh and Mr. Shengwen Rong satisfy the “independence” requirements of Section 303A of the Corporate Governance Rules of the New York Stock Exchange and Rule 10A-3 under the Exchange Act. We have determined that each of Mr. Andrew Hong Teoh and Mr. Shengwen Rong qualifies as an “audit committee financial expert.” The audit committee oversees our accounting and financial reporting processes and the audits of the financial statements of our company. The audit committee is responsible for, among other things:
Compensation Committee. Our compensation committee consists of Mr. Andrew Hong Teoh and Ms. Qi Feng. Mr. Andrew Hong Teoh is the chairman of our compensation committee. We have determined that Mr. Andrew Hong Teoh satisfies the “independence” requirements of Section 303A of the Corporate Governance Rules of the New York Stock Exchange. The compensation committee assists the board of directors in reviewing and approving the compensation structure, including all forms of compensation, relating to our directors and executive officers. Our chief executive officer may not be present at any committee meeting during which his compensation is deliberated. The compensation committee is responsible for, among other things:
Nominating and Corporate Governance Committee. Our nominating and corporate governance committee consists of Mr. Qi Chen and Mr. Andrew Hong Teoh. Mr. Qi Chen is the chairman of our nominating and corporate governance committee. Mr. Andrew Hong Teoh satisfies the “independence” requirements of Section 303A of the Corporate Governance Rules of the New York
109
Table of Contents
Stock Exchange. The nominating and corporate governance committee assists the board of directors in selecting individuals qualified to become our directors and in determining the composition of the board and its committees. The nominating and corporate governance committee is responsible for, among other things:
Duties of Directors
Under Cayman Islands law, our directors owe fiduciary duties to our company, including a duty of loyalty, a duty to act honestly, and a duty to act in what they consider in good faith to be in our best interests. Our directors must also exercise their powers only for a proper purpose. Our directors also owe to our company a duty to exercise skills they actually possess and such care and diligence that a reasonably prudent person could exercise in comparable circumstances. It was previously considered that a director need not exhibit in the performance of his or her duties a greater degree of skill than may reasonably be expected from a person of his or her knowledge and experience. However, English and Commonwealth courts have moved towards an objective standard with regard to the required skill and care and these authorities are likely to be followed in the Cayman Islands. In fulfilling their duty of care to us, our directors must ensure compliance with our memorandum and articles of association, as amended and restated from time to time, and the class rights vested thereunder in the holders of the shares. In certain limited exceptional circumstances, a shareholder may have the right to seek damages in our name if a duty owed by our directors is breached.
Our board of directors has all the powers necessary for managing, and for directing and supervising, our business affairs. The functions and powers of our board of directors include, among others:
Terms of Directors and Officers
Our directors may be elected by an ordinary resolution of our shareholders. Alternatively, our board of directors may, by the affirmative vote of a simple majority of the remaining directors present and voting at a board meeting, appoint any person as a director to fill a casual vacancy on our board or as an addition to the existing board. An appointment of a director may be on terms that the director shall automatically retire from office (unless he or she has sooner vacated office) at the next or a subsequent annual general meeting or upon any specified event or after any specified period in a written agreement between our company and the director, if any; but no such term shall be implied in the absence of express provision. Each director whose term of office expires shall be eligible for re-election at a meeting of the shareholders or re-appointment by the board. A director will cease to be a director if, among other things, the director (i) becomes bankrupt or makes any arrangement or composition with his creditors; (ii) dies or is found by our company to be or becomes of unsound mind; (iii) resigns his or her office by notice in writing to the company; (iv) without special leave of absence from our board, is absent from three consecutive board meetings and our directors resolve that his or her office be vacated; or (v) is removed from office pursuant to any other provision of our articles of association.
Our officers are elected by and serve at the discretion of our board of directors.
110
Table of Contents
We had 605, 468 and 407 employees as of March 31, 2021, 2022 and 2023, respectively. The following table sets forth the number of our employees categorized by areas of operations as of March 31, 2023:
Operations |
|
Number of |
Platform and branding operation |
|
301 |
Sales and marketing |
|
27 |
Technology |
|
28 |
Administration and management |
|
51 |
Total |
|
407 |
Our success depends on our ability to attract, motivate, train and retain qualified personnel. We believe we offer our employees competitive compensation packages and an environment that encourages self-development and, as a result, have generally been able to attract and retain qualified personnel and maintain a stable core management team.
As required by regulations in China, we participate in various employee social security plans that are organized by municipal and provincial governments, including pension, unemployment insurance, childbirth insurance, work-related injury insurance, medical insurance and housing insurance. We are required under PRC law to make contributions to employee benefit plans at specified percentages of the salaries, bonuses and certain allowances of our employees, up to a maximum amount specified by the local government from time to time. To date, we have not experienced any significant labor disputes.
Except as specifically noted, the following table sets forth information with respect to the beneficial ownership of our ordinary shares as of June 30, 2023 by:
The calculations in the table below are based on 2,161,518,000 Class A ordinary shares and 303,234,004 Class B ordinary shares outstanding as of June 30, 2023.
Beneficial ownership is determined in accordance with the rules and regulations of the SEC. In computing the number of shares beneficially owned by a person and the percentage ownership of that person, we have included shares that the person has the right to acquire within 60 days, including through the exercise of any option, warrant or other right or the conversion of any other security. These shares, however, are not included in the computation of the percentage ownership of any other person.
|
|
Ordinary Shares Beneficially Owned |
|
|||||||||||||||||
|
|
Class A |
|
|
Class B |
|
|
Total ordinary |
|
|
% of Total |
|
|
% of Aggregate |
|
|||||
Directors and Executive Officers**: |
|
|
|
|
|
|
|
|
|
|
|
|
|
|
|
|||||
Qi Chen(1) |
|
|
116,476,500 |
|
|
|
303,234,004 |
|
|
|
419,710,504 |
|
|
|
17.0 |
% |
|
|
81.8 |
% |
Andrew Hong Teoh(2) |
|
* |
|
|
|
— |
|
|
* |
|
|
* |
|
|
* |
|
||||
Shengwen Rong |
|
|
— |
|
|
|
— |
|
|
|
— |
|
|
|
— |
|
|
|
— |
|
Qi Feng |
|
* |
|
|
|
— |
|
|
* |
|
|
* |
|
|
* |
|
||||
Yiming Fan |
|
* |
|
|
|
— |
|
|
* |
|
|
* |
|
|
* |
|
||||
All Directors and Executive Officers as a Group |
|
|
118,261,500 |
|
|
|
303,234,004 |
|
|
|
421,495,504 |
|
|
|
17.1 |
% |
|
|
81.8 |
% |
Principal Shareholders: |
|
|
|
|
|
|
|
|
|
|
|
|
|
|
|
|||||
Entities affiliated with Tencent(3) |
|
|
460,141,266 |
|
|
|
— |
|
|
|
460,141,266 |
|
|
|
18.7 |
% |
|
|
4.1 |
% |
Entities affiliated with Qi Chen(4) |
|
|
116,476,500 |
|
|
|
303,234,004 |
|
|
|
419,710,504 |
|
|
|
17.0 |
% |
|
|
81.8 |
% |
Entities affiliated with Hillhouse(5) |
|
|
261,174,005 |
|
|
|
— |
|
|
|
261,174,005 |
|
|
|
10.6 |
% |
|
|
2.4 |
% |
Trustbridge Partners IV, L.P.(6) |
|
|
206,730,009 |
|
|
|
— |
|
|
|
206,730,009 |
|
|
|
8.4 |
% |
|
|
1.8 |
% |
Bertelsmann China Holding GmbH(7) |
|
|
200,662,100 |
|
|
|
— |
|
|
|
200,662,100 |
|
|
|
8.1 |
% |
|
|
1.8 |
% |
Entities affiliated with Yibo Wei(8) |
|
|
135,293,385 |
|
|
|
— |
|
|
|
135,293,385 |
|
|
|
5.5 |
% |
|
|
1.2 |
% |
111
Table of Contents
Notes:
* Less than 1% of our total outstanding ordinary shares or aggregate voting power on an as-converted basis.
** Except as indicated otherwise below, the business address of our directors and executive officers is Huanglong Wanke Center, 23/F, Building No. G, No. 77 Xueyuan Road, Xihu District, Hangzhou, 310012, People’s Republic of China.
*** For each person or group included in this column, percentage of total voting power represents voting power based on both Class A and Class B ordinary shares held by such person or group with respect to all outstanding shares of our Class A and Class B ordinary shares as a single class. Each holder of our Class A ordinary shares is entitled to one vote per share. Each holder of our Class B ordinary shares is entitled to 30 votes per share. Our Class B ordinary shares are convertible at any time by the holder into Class A ordinary shares on a one-for-one basis, while Class A ordinary shares are not convertible into Class B ordinary shares under any circumstances.
112
Table of Contents
As of June 30, 2023, 2,464,752,004 of our ordinary shares were issued and outstanding. To our knowledge, approximately 66.1% of our total outstanding ordinary shares were held by eight record holders in the United States, including approximately 66.1% held by The Bank of New York Mellon, the depositary of our ADS program. None of our outstanding Class B ordinary shares are held by record holders in the United States. The number of beneficial owners of the ADSs in the United States is likely to be much larger than the number of record holders of our ordinary shares in the United States.
Please refer to “Item 6. Directors, Senior Management and Employees—E. Share Ownership.”
Contractual Arrangements with the VIEs and Their Respective Shareholders
For a description of these contractual arrangements, see “Item 4. Information on the Company—C. Organizational Structure—Contractual Arrangements with The VIEs and Their Respective Shareholders.”
Shareholders Agreement
We entered into our eleventh amended and restated shareholders agreement on June 3, 2016, as amended on July 17, 2018, with our shareholders, which consist of holders of ordinary shares and preferred shares.
The shareholders agreement provides for certain shareholders’ rights, including right of participation, right of first refusal, co-sale rights and pre-emptive rights, and contains provisions governing the board of directors and other corporate governance matters.
The shareholders agreement also provides that for so long as Tencent and its affiliates hold no less than 50% of the shares in our company that they current hold, Tencent has a veto right on any proposed transfer or issuance of our securities to the competitors of Tencent, subject to certain exceptions for open market transactions and underwritten offerings.
Except for Tencent’s veto right described above and the registration rights described below, all other shareholders’ rights and the corporate governance provisions have automatically terminated upon the completion of our initial public offering. For the complete text of the shareholders agreement, please see the copy filed as an exhibit to this annual report.
Registration Rights
We have granted certain registration rights to our shareholders. Set forth below is a description of the registration rights granted under the shareholders agreement.
Demand Registration Rights. At any time after the earlier of (i) December 31, 2019 or (ii) six months following the closing of our initial public offering, holders of at least 10% of the registrable securities (including preferred shares and ordinary shares issued upon conversion of preferred shares) then outstanding have the right to demand that we file a registration statement of all registrable securities that the holders request to be registered and included in such registration statement by written notice. Other than required by the underwriter(s) in connection with our initial public offering, at least 25% of the registrable securities requested by the holders to be included in such underwriting and registration shall be so included. We have the right to defer filing of a registration statement for a period of not more than 90 days after the receipt of the request of the initiating holders if we furnish to the holders requesting registration a certificate signed by our president or chief executive officer stating that in the good faith judgment of our board of directors, it would be materially detrimental to us and our shareholders for such registration statement to be filed at such time. However, we cannot exercise the deferral right more than once in any twelve-month period. We are obligated to effect no more than
113
Table of Contents
two demand registrations, other than demand registration to be effected pursuant to registration statement on Form F-3, for which an unlimited number of demand registrations shall be permitted.
Piggyback Registration Rights. If we propose to file a registration statement for a public offering of our securities, we must offer shareholders an opportunity to include in the registration statement all or any part of the registrable securities held by such holders. If the managing underwriters of any underwritten offering determine in good faith that marketing factors require a limitation of the number of shares to be underwritten, and the number of shares that may be included in the registration statement and the underwriting shall be allocated (i) first, to us, (ii) second, to each holder requesting inclusion of its registrable securities in such registration statement on a pro rata basis based on the total number of registrable securities then held by each such holder, (iii) third, to holders of other securities of us.
Form F-3 Registration Rights. Our shareholders may request us in writing to file an unlimited number of registration statements on Form F-3. We shall effect the registration of the securities on Form F-3 as soon as practicable, except in certain circumstances.
Expenses of Registration. We will bear all registration expenses (other than underwriting discounts and commissions and conversion fees) and expenses incurred by holders upon our or an underwriters’ request in connection with any demand, piggyback or Form F-3 registration.
Termination of Registration Rights. Our shareholders’ registration rights will terminate upon the earlier of (i) December 10, 2023, and (ii) as to any shareholder when the shares subject to registration rights held by such shareholder can be sold without restriction in any 90-day period pursuant to Rule 144 promulgated under the Securities Act of 1933, as amended.
Employment Agreements and Indemnification Agreements
See “Item 6. Directors, Senior Management and Employees—B. Compensation—Employment Agreements and Indemnification Agreements.”
Share Incentive Plan
See “Item 6. Directors, Senior Management and Employees—B. Compensation—Amended and Restated Global Share Plan.”
Business Cooperation Agreement and Transactions with Tencent
Business Cooperation Agreement. In July 2018, we entered into a Business Cooperation Agreement with Tencent, a provider of internet value-added services serving online community in China. Pursuant to the Business Cooperation Agreement, Tencent agreed to offer us traffic support through Tencent’s online platform. In addition, Tencent has agreed to license us the channels to promote and advertise our products and brands on an annual quota basis, through certain intellectual property resources selected by Tencent, including but not limited to Tencent’s online televisions shows. Under the agreement, we and Tencent have agreed to further explore and pursue additional opportunities for potential cooperation for the purpose of optimizing user experience. The Business Cooperation Agreement has a term of five years and is renewable upon mutual agreement. The Business Cooperation Agreement is governed by PRC law. For any dispute arising out of or relating to the agreement, the parties should first strive to resolve the dispute through amicable consultation. In case no settlement can be reached through consultation within three months since the occurrence of the dispute, either we or Tencent can bring the dispute to a local court in Shenzhen, China for resolution.
Transactions with Tencent. Tencent has been a principal shareholder of us since February 2016. As of March 31, 2021, 2022 and 2023, we had amounts due to Tencent of RMB6.2 million, RMB4.7 million and RMB4.2 million (US$0.6 million), respectively, which represent ordinary course trade payables to Tencent for technology services and payment processing fees payable to Tencent.
Not applicable.
114
Table of Contents
ITEM 8. FINANCIAL INFORMATION
We have appended consolidated financial statements filed as part of this annual report.
Legal Proceedings
We are currently not a party to, and we are not aware of any pending or threatened legal, arbitral or administrative proceedings or claims, which, in the opinion of our management, is likely to have a material and adverse effect on our business, financial condition or results of operations. We may from time to time become a party to various legal, arbitral or administrative proceedings or claims arising in the ordinary course of our business.
Dividend Policy
Our board of directors has discretion on whether to distribute dividends, subject to certain requirements of Cayman Islands law. In addition, our shareholders may by ordinary resolution declare a dividend, but no dividend may exceed the amount recommended by our board of directors. In either case, all dividends are subject to certain restrictions under Cayman Islands law, namely that our company may only pay dividends out of profits or share premium account, and provided always that in no circumstances may a dividend be paid if this would result in our company being unable to pay its debts as they fall due in the ordinary course of business. Even if we decide to pay dividends, the form, frequency and amount will depend upon our future operations and earnings, capital requirements and surplus, general financial condition, contractual restrictions and other factors that the board of directors may deem relevant.
We do not have any present plan to pay any cash dividends on our ordinary shares in the foreseeable future. We currently intend to retain most, if not all, of our available funds and any future earnings to operate and expand our business.
We are a holding company incorporated in the Cayman Islands. We may rely on dividends from our subsidiaries in China for our cash requirements, including any payment of dividends to our shareholders. PRC regulations may restrict the ability of our PRC or Hong Kong subsidiaries to pay dividends to us. See “Item 4. Information on the Company—B. Business Overview—Regulation—Regulations on Dividend Distribution.”
If we pay any dividends on our ordinary shares, we will pay those dividends which are payable in respect of the ordinary shares underlying the ADSs to the depositary, as the registered holder of such ordinary shares, and the depositary then will pay such amounts to the ADS holders in proportion to the ordinary shares underlying the ADSs held by such ADS holders, subject to the terms of the deposit agreement, including the fees and expenses payable thereunder. Cash dividends on our ordinary shares, if any, will be paid in U.S. dollars.
Except as disclosed elsewhere in this annual report, we have not experienced any significant changes since the date of our audited consolidated financial statements included in this annual report.
ITEM 9. THE OFFER AND LISTING
The ADSs, each representing 300 Class A ordinary shares of ours, have been listed on the New York Stock Exchange since December 6, 2018. The ADSs trade under the symbol “MOGU.”
In response to noncompliance letter issued by the New York Stock Exchange in November 2021 and to countervail any short-term adverse effect resulted and rectify the deficiencies in our trading price, we decided to change the ratio of our ADS from one ADS to twenty-five (25) Class A ordinary shares to three hundred (300) Class A ordinary shares, effective on March 28, 2022.
Not applicable.
115
Table of Contents
The ADSs, each representing 300 Class A ordinary shares of ours, have been listed on the New York Stock Exchange since December 6, 2018 under the symbol “MOGU.”
Not applicable.
Not applicable.
Not applicable.
ITEM 10. ADDITIONAL INFORMATION
Not applicable.
The following are summaries of material provisions of our currently effective fifteenth amended and restated memorandum and articles of association (“memorandum and articles of association”) and of the Companies Act, insofar as they relate to the material terms of our ordinary shares.
Ordinary Shares. Our ordinary shares are divided into Class A ordinary shares and Class B ordinary shares. Holders of our Class A ordinary shares and Class B ordinary shares will have the same rights except for voting and conversion rights. Our ordinary shares are issued in registered form and are issued when registered in our register of members (shareholders). We may not issue shares to bearer. Our shareholders who are non-residents of the Cayman Islands may freely hold and vote their shares.
Conversion. Our Class B ordinary shares may be converted into the same number of Class A ordinary shares by the holders thereof at any time, while Class A ordinary shares cannot be converted into Class B ordinary shares under any circumstances. Upon any sale, transfer, assignment or disposition of any Class B ordinary share by a shareholder to any person who is not the Founder (as defined in our memorandum and articles of association) or a Founder Affiliate (as defined in our memorandum and articles of association), upon a change of ultimate beneficial ownership of any Class B ordinary share to any person who is not the Founder or a Founder Affiliate, or upon the Founder ceasing to be the chief executive officer of our company, such Class B ordinary share (or, in the case that the Founder ceases to be the chief executive officer of our company, each Class B ordinary share held by the Founder and any Founder Affiliate) shall be automatically and immediately converted into one Class A ordinary share.
Dividends. The holders of our ordinary shares are entitled to such dividends as may be declared by our board of directors or declared by our shareholders by ordinary resolution (provided that no dividend may be declared by our shareholders which exceeds the amount recommended by our directors). Our memorandum and articles of association provide that dividends may be declared and paid out of the funds of our company lawfully available therefor. Under the laws of the Cayman Islands, our company may pay a dividend out of either profit or share premium account, provided that in no circumstances may a dividend be paid if this would result in our company being unable to pay its debts as they fall due in the ordinary course of business.
Voting Rights. Holders of Class A ordinary shares and Class B ordinary shares shall, at all times, vote together as one class on all matters submitted to a vote by the members at any general meeting of our company. Each Class A ordinary share shall be entitled to one vote on all matters subject to the vote at general meetings of our company, and each Class B ordinary share shall be entitled to 30 votes on all matters subject to the vote at general meetings of our company. Voting at any meeting of shareholders is by show of hands unless a poll is demanded. A poll may be demanded by the chairman of such meeting or any one shareholder present in person or by proxy.
An ordinary resolution to be passed at a meeting by the shareholders requires the affirmative vote of a simple majority of the votes attaching to the ordinary shares cast at a meeting, while a special resolution requires the affirmative vote of no less than
116
Table of Contents
two-thirds of the votes cast attaching to the outstanding ordinary shares at a meeting. A special resolution will be required for important matters such as a change of name or making changes to our memorandum and articles of association.
General Meetings of Shareholders. As a Cayman Islands exempted company, we are not obliged by the Companies Act to call shareholders’ annual general meetings. Our memorandum and articles of association provide that we may (but are not obliged to) in each year hold a general meeting as our annual general meeting in which case we shall specify the meeting as such in the notices calling it, and the annual general meeting shall be held at such time and place as may be determined by our directors.
Shareholders’ general meetings may be convened by our chairman of the board or a majority of our board of directors. Advance notice of at least ten calendar days is required for the convening of our annual general shareholders’ meeting (if any) and any other general meeting of our shareholders. A quorum required for any general meeting of shareholders consists of one or more of our shareholders holding shares which carry in aggregate (or representing by proxy) not less than one-third of all votes attaching to all of our shares in issue and entitled to vote at such general meeting.
The Companies Act provides shareholders with only limited rights to requisition a general meeting, and does not provide shareholders with any right to put any proposal before a general meeting. However, these rights may be provided in a company’s articles of association. Our memorandum and articles of association provide that upon the requisition of shareholders who together hold shares which carry in aggregate not less than one-third of the total number of votes attaching to all issued and outstanding shares of our company entitled to vote at general meetings, our board will convene an extraordinary general meeting and put the resolutions so requisitioned to a vote at such meeting. However, our memorandum and articles of association do not provide our shareholders with any right to put any proposals before annual general meetings or extraordinary general meetings not called by such shareholders.
Transfer of Ordinary Shares. Subject to the restrictions set out in our memorandum and articles of association as set out below, any of our shareholders may transfer all or any of his or her ordinary shares by an instrument of transfer in writing and in any usual or common form or such other form approved by our board of directors and be executed by or on behalf of the transferor and if in respect of a nil or partly paid up share, or if so required by the directors, shall also be executed on behalf of the transferee.
Our board of directors may, in its absolute discretion, decline to register any transfer of any ordinary share which is not fully paid up or on which we have a lien. Our board of directors may also decline to register any transfer of any ordinary share unless:
If our directors refuse to register a transfer they shall, within three calendar months after the date on which the instrument of transfer was lodged, send to each of the transferor and the transferee notice of such refusal.
The registration of transfers may, after compliance with any notice required of the New York Stock Exchange, be suspended and the register closed at such times and for such periods as our board of directors may from time to time determine, provided, however, that the registration of transfers shall not be suspended nor the register closed for more than 30 calendar days in any calendar year as our board may determine.
Liquidation. On the winding up of our company, if the assets available for distribution amongst our shareholders shall be more than sufficient to repay the whole of the share capital at the commencement of the winding up, the surplus shall be distributed amongst our shareholders in proportion to the par value of the shares held by them at the commencement of the winding up, subject to a deduction from those shares in respect of which there are monies due, of all monies payable to our company for unpaid calls or otherwise. If our assets available for distribution are insufficient to repay all of the paid-up capital, the assets will be distributed so that the losses are borne by our shareholders in proportion to the par value of the shares held by them.
117
Table of Contents
Calls on Shares and Forfeiture of Shares. Our board of directors may from time to time make calls upon shareholders for any amounts unpaid on their shares in a notice served to such shareholders at least 14 calendar days prior to the specified time and place of payment. The shares that have been called upon and remain unpaid are subject to forfeiture.
Redemption, Repurchase and Surrender of Shares. We may issue shares on terms that such shares are subject to redemption, at our option or at the option of the holders of these shares, on such terms and in such manner as may be determined, before the issue of such shares, by either our board of directors or the shareholders by special resolution. Our company may also repurchase any of our shares on such terms and in such manner as have been approved by our board of directors or by an ordinary resolution of our shareholders. Under the Companies Act, the redemption or repurchase of any share may be paid out of our company’s profits or out of the proceeds of a new issue of shares made for the purpose of such redemption or repurchase, or out of capital (including share premium account and capital redemption reserve) if our company can, immediately following such payment, pay its debts as they fall due in the ordinary course of business. In addition, under the Companies Act no such share may be redeemed or repurchased (a) unless it is fully paid up, (b) if such redemption or repurchase would result in there being no shares outstanding or (c) if the company has commenced liquidation. In addition, our company may accept the surrender of any fully paid share for no consideration.
Variation of Rights of Shares. If at any time, our share capital is divided into different classes or series of shares, the rights attached to any class or series of shares (unless otherwise provided by the terms of issue of the shares of that class or series), whether or not our company is being wound-up, may be varied with the consent in writing of two-thirds of the holders of the issued shares of that class or series or with the sanction of a special resolution at a separate meeting of the holders of the shares of the class or series. The rights conferred upon the holders of any shares or class of shares with preferred or other rights shall not, unless otherwise expressly provided in the rights attaching to or the terms of issue of such shares, be deemed to be materially adversely varied by, inter alia, the creation, allotment or issue of further shares ranking pari passu with or subsequent to them or the redemption or purchase of any shares of any class by our company.
Issuance of Additional Shares. Our memorandum and articles of association authorize our board of directors to issue additional ordinary shares from time to time as our board of directors shall determine, to the extent of available authorized but unissued shares.
Our memorandum and articles of association also authorize our board of directors to establish from time to time one or more series of preference shares and to determine, with respect to any series of preference shares, the terms and rights of that series, including:
Our board of directors may issue preference shares without action by our shareholders to the extent authorized but unissued. Issuance of these shares may dilute the voting power of holders of ordinary shares.
Inspection of Books and Records. Holders of our ordinary shares will have no general right under Cayman Islands law to inspect or obtain copies of our list of shareholders or our corporate records (other than copies of our memorandum and articles of association, our register of mortgage and charges, and any special resolution passed by our shareholders). However, we will provide our shareholders with annual audited financial statements.
Anti-Takeover Provisions. Some provisions of our memorandum and articles of association may discourage, delay or prevent a change of control of our company or management that shareholders may consider favorable, including provisions that:
However, under Cayman Islands law, our directors may only exercise the rights and powers granted to them under our memorandum and articles of association for a proper purpose and for what they believe in good faith to be in the best interests of our company.
118
Table of Contents
Exempted Company. We are an exempted company with limited liability under the Companies Act. The Companies Act distinguishes between ordinary resident companies and exempted companies. Any company that is registered in the Cayman Islands but conducts business mainly outside of the Cayman Islands may apply to be registered as an exempted company. The requirements for an exempted company are essentially the same as for an ordinary company except that an exempted company:
“Limited liability” means that the liability of each shareholder is limited to the amount unpaid by the shareholder on the shares of the company (except in exceptional circumstances, such as involving fraud, the establishment of an agency relationship or an illegal or improper purpose or other circumstances in which a court may be prepared to pierce or lift the corporate veil).
Register of Members. Under the Companies Act, we must keep a register of members and there should be entered therein:
Under Cayman Islands law, the register of members of our company is prima facie evidence of the matters set out therein (i.e. the register of members will raise a presumption of fact on the matters referred to above unless rebutted) and a member registered in the register of members is deemed as a matter of Cayman Islands law to have legal title to the shares as set against its name in the register of members.
If the name of any person is incorrectly entered in or omitted from our register of members, or if there is any default or unnecessary delay in entering on the register the fact of any person having ceased to be a member of our company, the person or member aggrieved (or any member of our company or our company itself) may apply to the Grand Court of the Cayman islands for an order that the register be rectified, and the Court may either refuse such application or it may, if satisfied of the justice of the case, make an order for the rectification of the register.
Registered Office and Objects
Our registered office in the Cayman Islands is located at the offices of Maples Corporate Services Limited, P.O. Box 309, Ugland House, Grand Cayman KY1-1104, Cayman Islands, or at such other location within the Cayman Islands as our directors may from time to time decide. The objects for which our company is established are unrestricted and we have full power and authority to carry out any object not prohibited by the Companies Act or any other law of the Cayman Islands.
Differences in Corporate Law
The Companies Act is derived, to a large extent, from the older Companies Acts of England but does not follow recent English statutory enactments, and accordingly there are significant differences between the Companies Act and the current Companies Act of England. In addition, the Companies Act differs from laws applicable to U.S. corporations and their shareholders. Set forth below is a summary of certain significant differences between the provisions of the Companies Act applicable to us and the laws applicable to companies incorporated in the United States and their shareholders.
119
Table of Contents
Mergers and Similar Arrangements. The Companies Act permits mergers and consolidations between Cayman Islands companies and between Cayman Islands companies and non-Cayman Islands companies. For these purposes, (i) “merger” means the merging of two or more constituent companies and the vesting of their undertaking, property and liabilities in one of such companies as the surviving company and (ii) a “consolidation” means the combination of two or more constituent companies into a consolidated company and the vesting of the undertaking, property and liabilities of such companies to the consolidated company. In order to effect such a merger or consolidation, the directors of each constituent company must approve a written plan of merger or consolidation, which must then be authorized by (a) a special resolution of the shareholders of each constituent company, and (b) such other authorization, if any, as may be specified in such constituent company’s articles of association. The written plan of merger or consolidation must be filed with the Registrar of Companies of the Cayman Islands together with a declaration as to the solvency of the consolidated or surviving company, a list of the assets and liabilities of each constituent company and an undertaking that a copy of the certificate of merger or consolidation will be given to the members and creditors of each constituent company and that notification of the merger or consolidation will be published in the Cayman Islands Gazette. Court approval is not required for a merger or consolidation which is effected in compliance with these statutory procedures.
A merger between a Cayman parent company and its Cayman subsidiary or subsidiaries does not require authorization by a resolution of shareholders of that Cayman subsidiary if a copy of the plan of merger is given to every member of that Cayman subsidiary to be merged unless that member agrees otherwise. For this purpose a company is a “parent” of a subsidiary if it holds issued shares that together represent at least ninety percent (90%) of the votes at a general meeting of the subsidiary.
The consent of each holder of a fixed or floating security interest over a constituent company is required unless this requirement is waived by a court in the Cayman Islands.
Save in certain limited circumstances, a shareholder of a Cayman constituent company who dissents from the merger or consolidation is entitled to payment of the fair value of his shares (which, if not agreed between the parties, will be determined by the Cayman Islands court) upon dissenting to the merger or consolidation, provide the dissenting shareholder complies strictly with the procedures set out in the Companies Act. The exercise of dissenter rights will preclude the exercise by the dissenting shareholder of any other rights to which he or she might otherwise be entitled by virtue of holding shares, save for the right to seek relief on the grounds that the merger or consolidation is void or unlawful.
Separate from the statutory provisions relating to mergers and consolidations, the Companies Act also contains statutory provisions that facilitate the reconstruction and amalgamation of companies by way of schemes of arrangement, provided that the arrangement is approved by (a) 75% in value of the shareholders or class of shareholders, as the case may be, or (b) a majority in number representing 75% in value of the creditors or each class of creditors, as the case may be, with whom the arrangement is to be made, that are, in each case, present and voting either in person or by proxy at a meeting, or meetings, convened for that purpose. The convening of the meetings and subsequently the arrangement must be sanctioned by the Grand Court of the Cayman Islands. While a dissenting shareholder has the right to express to the court the view that the transaction ought not to be approved, the court can be expected to approve the arrangement if it determines that:
The Companies Act also contains a statutory power of compulsory acquisition which may facilitate the “squeeze out” of dissentient minority shareholder upon a tender offer. When a tender offer is made and accepted by holders of 90.0% of the shares affected within four months, the offeror may, within a two-month period commencing on the expiration of such four-month period, require the holders of the remaining shares to transfer such shares to the offeror on the terms of the offer. An objection can be made to the Grand Court of the Cayman Islands but this is unlikely to succeed in the case of an offer which has been so approved unless there is evidence of fraud, bad faith or collusion.
If an arrangement and reconstruction by way of scheme of arrangement is thus approved and sanctioned, or if a tender offer is made and accepted in accordance with the foregoing statutory procedures, a dissenting shareholder would have no rights comparable to appraisal rights, which would otherwise ordinarily be available to dissenting shareholders of Delaware corporations, providing rights to receive payment in cash for the judicially determined value of the shares.
120
Table of Contents
Shareholders’ Suits. In principle, we will normally be the proper plaintiff to sue for a wrong done to us as a company, and as a general rule a derivative action may not be brought by a minority shareholder. However, based on English authorities, which would in all likelihood be of persuasive authority in the Cayman Islands, the Cayman Islands court can be expected to follow and apply the common law principles (namely the rule in Foss v. Harbottle and the exceptions thereto) so that a non-controlling shareholder may be permitted to commence a class action against or derivative actions in the name of the company to challenge actions where:
Indemnification of Directors and Executive Officers and Limitation of Liability. Cayman Islands law does not limit the extent to which a company’s memorandum and articles of association may provide for indemnification of officers and directors, except to the extent any such provision may be held by the Cayman Islands courts to be contrary to public policy, such as to provide indemnification against civil fraud or the consequences of committing a crime. Our memorandum and articles of association provide that our directors shall be indemnified and secured harmless against all actions, proceedings, costs, charges, expenses, losses, damages or liabilities incurred or sustained by such director, other than by reason of such director’s own dishonesty, willful default or fraud, in or about the conduct of our company’s business or affairs (including as a result of any mistake of judgment) or in the execution or discharge of his duties, powers, authorities or discretions, including without prejudice to the generality of the foregoing, any costs, expenses, losses or liabilities incurred by such director in defending (whether successfully or otherwise) any civil proceedings concerning our company or its affairs in any court whether in the Cayman Islands or elsewhere. This standard of conduct is generally the same as permitted under the Delaware General Corporation Law for a Delaware corporation.
In addition, we have entered into indemnification agreements with our directors and executive officers that provide such persons with additional indemnification beyond that provided in our memorandum and articles of association.
Insofar as indemnification for liabilities arising under the Securities Act may be permitted to our directors, officers or persons controlling us under the foregoing provisions, we have been informed that in the opinion of the SEC, such indemnification is against public policy as expressed in the Securities Act and is therefore unenforceable.
Directors’ Fiduciary Duties. Under Delaware corporate law, a director of a Delaware corporation has a fiduciary duty to the corporation and its shareholders. This duty has two components: the duty of care and the duty of loyalty. The duty of care requires that a director act in good faith, with the care that an ordinarily prudent person would exercise under similar circumstances. Under this duty, a director must inform himself of, and disclose to shareholders, all material information reasonably available regarding a significant transaction. The duty of loyalty requires that a director acts in a manner he reasonably believes to be in the best interests of the corporation. He must not use his corporate position for personal gain or advantage. This duty prohibits self-dealing by a director and mandates that the best interest of the corporation and its shareholders take precedence over any interest possessed by a director, officer or controlling shareholder and not shared by the shareholders generally. In general, actions of a director are presumed to have been made on an informed basis, in good faith and in the honest belief that the action taken was in the best interests of the corporation. However, this presumption may be rebutted by evidence of a breach of one of the fiduciary duties. Should such evidence be presented concerning a transaction by a director, the director must prove the procedural fairness of the transaction, and that the transaction was of fair value to the corporation.
As a matter of Cayman Islands law, a director of a Cayman Islands company is in the position of a fiduciary with respect to the company and therefore it is considered that he owes the following duties to the company — a duty to act bona fide in the best interests of the company, a duty not to make a profit based on his position as director (unless the company permits him to do so), a duty not to put himself in a position where the interests of the company conflict with his personal interest or his duty to a third party, and a duty to exercise powers for the purpose for which such powers were intended. A director of a Cayman Islands company owes to the company a duty to exercise the skill they actually possess and such care and diligence that a reasonably prudent person would exercise in comparable circumstances. It was previously considered that a director need not exhibit in the performance of his duties a greater degree of skill than may reasonably be expected from a person of his knowledge and experience. However, English and Commonwealth courts have moved towards an objective standard with regard to the required skill and care and these authorities are likely to be followed in the Cayman Islands.
Shareholder Action by Written Consent. Under the Delaware General Corporation Law, a corporation may eliminate the right of shareholders to act by written consent by amendment to its certificate of incorporation. Cayman Islands law and our
121
Table of Contents
memorandum and articles of association provide that our shareholders may approve corporate matters by way of a unanimous written resolution signed by or on behalf of each shareholder who would have been entitled to vote on such matter at a general meeting without a meeting being held.
Shareholder Proposals. Under the Delaware General Corporation Law, a shareholder has the right to put any proposal before the annual meeting of shareholders; provided that it complies with the notice provisions in the governing documents. A special meeting may be called by the board of directors or any other person authorized to do so in the governing documents, but shareholders may be precluded from calling special meetings.
The Companies Act provides shareholders with only limited rights to requisition a general meeting, and does not provide shareholders with any right to put any proposal before a general meeting. However, these rights may be provided in a company’s articles of association. Our memorandum and articles of association allow our shareholders who together hold shares which carry in aggregate not less than one-third of all votes attaching to all issued and outstanding shares of our company entitled to vote at general meetings to requisition an extraordinary general meeting of our shareholders, in which case our board is obliged to convene an extraordinary general meeting and to put the resolutions so requisitioned to a vote at such meeting. Other than this right to requisition a shareholders’ meeting, our memorandum and articles of association do not provide our shareholders with any other right to put proposals before annual general meetings or extraordinary general meetings. As an exempted Cayman Islands company, we are not obliged by law to call shareholders’ annual general meetings.
Cumulative Voting. Under the Delaware General Corporation Law, cumulative voting for elections of directors is not permitted unless the corporation’s certificate of incorporation specifically provides for it. Cumulative voting potentially facilitates the representation of minority shareholders on a board of directors since it permits the minority shareholder to cast all the votes to which the shareholder is entitled on a single director, which increases the shareholder’s voting power with respect to electing such director. There are no prohibitions in relation to cumulative voting under the laws of the Cayman Islands but our memorandum and articles of association do not provide for cumulative voting.
Removal of Directors. Under the Delaware General Corporation Law, a director of a corporation with a classified board may be removed only for cause with the approval of a majority of the issued and outstanding shares entitled to vote, unless the certificate of incorporation provides otherwise. Under our memorandum and articles of association, subject to certain restrictions as contained therein, directors may be removed with or without cause, by an ordinary resolution of our shareholders. An appointment of a director may be on terms that the director shall automatically retire from office (unless he or she has sooner vacated office) at the next or a subsequent annual general meeting or upon any specified event or after any specified period in a written agreement between the company and the director, if any; but no such term shall be implied in the absence of express provision. In addition, a director’s office shall be vacated if the director (i) resigns his office by notice in writing to the company; (ii) becomes of unsound mind or dies; (iii) without special leave of absence from our board, is absent from meetings of our board for three (3) consecutive times, unless the board resolves that his office not be vacated; (iv) becomes bankrupt or makes any arrangement or composition with his creditors; or (v) is removed from office pursuant to any other provision of our memorandum and articles of association.
Transactions with Interested Shareholders. The Delaware General Corporation Law contains a business combination statute applicable to Delaware corporations whereby, unless the corporation has specifically elected not to be governed by such statute by amendment to its certificate of incorporation, it is prohibited from engaging in certain business combinations with an “interested shareholder” for three years following the date that such person becomes an interested shareholder. An interested shareholder generally is a person or a group who or which owns or owned 15% or more of the target’s outstanding voting shares within the past three years. This has the effect of limiting the ability of a potential acquirer to make a two-tiered bid for the target in which all shareholders would not be treated equally. The statute does not apply if, among other things, prior to the date on which such shareholder becomes an interested shareholder, the board of directors approves either the business combination or the transaction which resulted in the person becoming an interested shareholder. This encourages any potential acquirer of a Delaware corporation to negotiate the terms of any acquisition transaction with the target’s board of directors.
Cayman Islands law has no comparable statute. As a result, we cannot avail ourselves of the types of protections afforded by the Delaware business combination statute. However, although Cayman Islands law does not regulate transactions between a company and its significant shareholders, it does provide that such transactions must be entered into bona fide in the best interests of the company and not with the effect of constituting a fraud on the minority shareholders.
Restructuring. A company may present a petition to the Grand Court of the Cayman Islands for the appointment of a restructuring officer on the grounds that the company:
(a) is or is likely to become unable to pay its debts; and
122
Table of Contents
(b) intends to present a compromise or arrangement to its creditors (or classes thereof) either pursuant to the Companies Act, the law of a foreign country or by way of a consensual restructuring.
The Grand Court may, among other things, make an order appointing a restructuring officer upon hearing of such petition, with such powers and to carry out such functions as the court may order. At any time (i) after the presentation of a petition for the appointment of a restructuring officer but before an order for the appointment of a restructuring officer has been made, and (ii) when an order for the appointment of a restructuring officer is made, until such order has been discharged, no suit, action or other proceedings (other than criminal proceedings) shall be proceeded with or commenced against the company, no resolution to wind up the company shall be passed, and no winding up petition may be presented against the company, except with the leave of the court. However, notwithstanding the presentation of a petition for the appointment of a restructuring officer or the appointment of a restructuring officer, a creditor who has security over the whole or part of the assets of the company is entitled to enforce the security without the leave of the court and without reference to the restructuring officer appointed.
Dissolution; Winding Up. Under the Delaware General Corporation Law, unless the board of directors approves the proposal to dissolve, dissolution must be approved by shareholders holding 100% of the total voting power of the corporation. Only if the dissolution is initiated by the board of directors may it be approved by a simple majority of the corporation’s outstanding shares. Delaware law allows a Delaware corporation to include in its certificate of incorporation a supermajority voting requirement in connection with dissolutions initiated by either an order of the courts of the Cayman Islands or by the board of directors.
Under Cayman Islands law, a company may be wound up by either an order of the courts of the Cayman Islands or by a special resolution of its members or, if the company is unable to pay its debts as they fall due, by an ordinary resolution of its members. The court has authority to order winding up in a number of specified circumstances including where it is, in the opinion of the court, just and equitable to do so.
Variation of Rights of Shares. Under the Delaware General Corporation Law, a corporation may vary the rights of a class of shares with the approval of a majority of the outstanding shares of such class, unless the certificate of incorporation provides otherwise. Under our memorandum and articles of association, if our share capital is divided into more than one class of shares, we may vary the rights attached to any class with the written consent of the holders of two-thirds of the issued shares of that class or with the sanction of a special resolution passed at a separate meeting of the holders of the shares of that class. The rights conferred upon the holders of any shares or class of shares with preferred or other rights shall not, unless otherwise expressly provided in the rights attaching to or the terms of issue of such shares, be deemed to be materially adversely varied by, inter alia, the creation, allotment or issue of further shares ranking pari passu with or subsequent to them or the redemption or purchase of any shares of any class by our company.
Amendment of Governing Documents. Under the Delaware General Corporation Law, a corporation’s governing documents may be amended with the approval of a majority of the outstanding shares entitled to vote, unless the certificate of incorporation provides otherwise. As permitted by Cayman Islands law, our memorandum and articles of association may only be amended by a special resolution of our shareholders.
Rights of Non-Resident or Foreign Shareholders. There are no limitations imposed by our memorandum and articles of association on the rights of non-resident or foreign shareholders to hold or exercise voting rights on our shares. In addition, there are no provisions in our memorandum and articles of association that require our company to disclose shareholder ownership above any particular ownership threshold.
We have not entered into any material contracts other than in the ordinary course of business and other than those described in “Item 4. Information on the Company.” and “Item 7. Major Shareholders and Related Party Transactions—B. Related Party Transactions.” or elsewhere in this annual report on Form 20-F.
See “Item 4. Information on the Company—B. Business Overview—Regulation—Regulations on Foreign Exchange.”
The following summary of the Cayman Islands, PRC and U.S. federal income tax considerations of an investment in our ADSs or Class A ordinary shares is based upon laws and relevant interpretations thereof as of the date of this annual report, all of which are subject to change. This summary does not deal with all possible tax considerations relating to an investment in our ADSs or
123
Table of Contents
Class A ordinary shares, such as the tax considerations under U.S. state and local tax laws or under the tax laws of jurisdictions other than the Cayman Islands, the People’s Republic of China and the United States.
Cayman Islands Taxation
The Cayman Islands currently levies no taxes on individuals or corporations based upon profits, income, gains or appreciation and there is no taxation in the nature of inheritance tax or estate duty. There are no other taxes likely to be material to us levied by the government of the Cayman Islands except for stamp duties which may be applicable on instruments executed in, or, after execution, brought within the jurisdiction of the Cayman Islands. The Cayman Islands is not party to any double tax treaties that are applicable to any payments made to or by our company. There are no exchange control regulations or currency restrictions in the Cayman Islands.
Payments of dividends and capital gains in respect of our ordinary shares or ADSs will not be subject to taxation in the Cayman Islands and no withholding will be required on the payment of a dividend or capital gains to any holder of our ordinary shares or ADSs, nor will capital gains derived from the disposal of our ordinary shares or ADSs be subject to Cayman Islands income or corporate tax.
People’s Republic of China Taxation
Under the PRC Enterprise Income Tax Law and its implementation rules, an enterprise established outside of the PRC with a “de facto management body” within the PRC is considered a resident enterprise and will be subject to the enterprise income tax at the rate of 25% on its global income. The implementation rules define the term “de facto management body” as the body that exercises full and substantial control over and overall management of the business, productions, personnel, accounts and properties of an enterprise. In April 2009, the State Administration of Taxation issued the Notice of the State Administration of Taxation on Issues about the Determination of Chinese-Controlled Enterprises Registered Abroad as Resident Enterprises on the Basis of Their Body of Actual Management, known as Circular 82, which provides certain specific criteria for determining whether the “de facto management body” of a PRC-controlled enterprise that is incorporated offshore is located in China. Although this circular only applies to offshore enterprises controlled by PRC enterprises or PRC enterprise groups, not those controlled by PRC individuals or foreigners, the criteria set forth in the circular may reflect the State Administration of Taxation’s general position on how the “de facto management body” test should be applied in determining the tax resident status of all offshore enterprises. According to Circular 82, an offshore incorporated enterprise controlled by a PRC enterprise or a PRC enterprise group will be regarded as a PRC tax resident by virtue of having its “de facto management body” in China only if all of the following conditions are met: (i) the primary location of the day-to-day operational management is in the PRC; (ii) decisions relating to the enterprise’s financial and human resource matters are made or are subject to approval by organizations or personnel in the PRC; (iii) the enterprise’s primary assets, accounting books and records, company seals, and board and shareholder resolutions, are located or maintained in the PRC; and (iv) at least 50% of voting board members or senior executives habitually reside in the PRC.
We believe that MOGU Inc. is not a PRC resident enterprise for PRC tax purposes. MOGU Inc. is not controlled by a PRC enterprise or PRC enterprise group, and we do not believe that MOGU Inc. meets all of the conditions above. MOGU Inc. is a company incorporated outside of the PRC. For the same reasons, we believe our other controlled entities outside of China are not PRC resident enterprises either. However, the tax resident status of an enterprise is subject to determination by the PRC tax authorities and uncertainties remain with respect to the interpretation of the term “de facto management body.” There can be no assurance that the PRC government will ultimately take a view that is consistent with us.
If the PRC tax authorities determine that MOGU Inc. is a PRC resident enterprise for enterprise income tax purposes, our worldwide income could be subject to 25% enterprise income tax and we may be required to withhold a 10% withholding tax from dividends we pay to our shareholders that are non-resident enterprises, including the holders of our ADSs. In addition, non-resident enterprise shareholders (including our ADS holders) may be subject to a 10% PRC tax on gains realized on the sale or other disposition of ADSs or ordinary shares, if such income is treated as sourced from within the PRC. Furthermore, if PRC tax authorities determine that we are a PRC resident enterprise for enterprise income tax purposes, dividends paid to our non-PRC individual shareholders (including our ADS holders) and any gain realized on the transfer of ADSs or ordinary shares by such shareholders may be subject to PRC tax at a rate of 20% (which, in the case of dividends, may be withheld at source by us), if such dividends or gains are deemed to be from PRC sources. It is unclear whether non-PRC shareholders of MOGU Inc. would be able to claim the benefits of any tax treaties between their country of tax residence and the PRC in the event that MOGU Inc. is treated as a PRC resident enterprise. See “Item 3. Key Information—D. Risk Factors—Risks Related to Doing Business in China—If we are classified as a PRC resident enterprise for PRC income tax purposes, such classification could result in unfavorable tax consequences to us and our non-PRC shareholders or ADS holders.”
124
Table of Contents
United States Federal Income Tax Considerations
The following discussion is a summary of U.S. federal income tax considerations generally applicable to the ownership and disposition of the ADSs or ordinary shares by a U.S. Holder (as defined below) that acquires our ADSs and holds the ADSs as “capital assets” (generally, property held for investment) under the U.S. Internal Revenue Code of 1986, as amended, or the Code. This discussion is based upon existing U.S. federal tax law, which is subject to differing interpretations or change, possibly with retroactive effect. No ruling has been sought from the Internal Revenue Service, or the IRS, with respect to any U.S. federal income tax considerations described below, and there can be no assurance that the IRS or a court will not take a contrary position. This discussion, moreover, does not address the U.S. federal estate, gift, Medicare, and alternative minimum tax considerations, or any state, local and non-U.S. tax considerations, relating to the ownership or disposition of our ADSs or ordinary shares. The following summary does not address all aspects of U.S. federal income taxation that may be important to particular investors in light of their individual circumstances or to persons in special tax situations such as:
all of whom may be subject to tax rules that differ significantly from those discussed below.
Each U.S. Holder is urged to consult its tax advisor regarding the application of U.S. federal taxation to its particular circumstances, and the state, local, non-U.S. and other tax considerations of the ownership and disposition of our ADSs or ordinary shares.
General
For purposes of this discussion, a “U.S. Holder” is a beneficial owner of the ADSs or ordinary shares that is, for U.S. federal income tax purposes:
125
Table of Contents
If a partnership (or other entity treated as a partnership for U.S. federal income tax purposes) is a beneficial owner of the ADSs or ordinary shares, the tax treatment of a partner in the partnership will generally depend upon the status of the partner and the activities of the partnership. Partnerships holding the ADSs or ordinary shares and their partners are urged to consult their tax advisors regarding an investment in the ADSs or ordinary shares.
For U.S. federal income tax purposes, it is generally expected that a U.S. Holder of ADSs will be treated as the beneficial owner of the underlying ordinary shares represented by the ADSs. The remainder of this discussion assumes that a U.S. Holder of the ADSs will be treated in this manner. Accordingly, deposits or withdrawals of ordinary shares for ADSs will generally not be subject to U.S. federal income tax.
Passive Foreign Investment Company Considerations
A non-U.S. corporation, such as our company, will be a PFIC, for U.S. federal income tax purposes for any taxable year, if either (i) 75% or more of its gross income for such year consists of certain types of “passive” income or (ii) 50% or more of the value of its assets (determined on the basis of a quarterly average) during such year is attributable to assets that produce or are held for the production of passive income. For this purpose, cash and assets readily convertible into cash are categorized as passive assets and the company’s goodwill and other unbooked intangibles are generally taken into account in determining the company’s asset value. Passive income generally includes, among other things, dividends, interest, rents, royalties, and gains from the disposition of passive assets. We will be treated as owning a proportionate share of the assets and earning a proportionate share of the income of any other corporation in which we own, directly or indirectly, 25% or more (by value) of the stock.
Although the law in this regard is not entirely clear, we treat the VIEs as being owned by us for U.S. federal income tax purposes because have power to direct activities of the VIEs that most significantly affect the economic performance of the VIEs and are entitled to the economic benefits associated with them that could be significant to the VIEs, and thus we are regarded as the primary beneficiary of the VIEs for accounting purposes. As a result, we consolidate their results of operations in our consolidated U.S. GAAP financial statements. If it were determined, however, that we are not the owner of the VIEs for U.S. federal income tax purposes, we would likely be treated as a PFIC for the current taxable year and any subsequent taxable year.
Assuming that we are the owner of the VIEs for U.S. federal income tax purposes, we do not believe we were a PFIC for the taxable year ended March 31, 2023 and we do not expect to be a PFIC for the foreseeable future. However, no assurance can be given in this regard because the determination of whether we are or will become a PFIC is a factual determination made annually that will depend, in part, upon the composition of our income and assets. Fluctuations in the market price of the ADSs may cause us to be a PFIC for the current or future taxable years because the value of our assets for purposes of the asset test, including the value of our goodwill and unbooked intangibles, may be determined by reference to the market price of the ADSs from time to time (which may be volatile). If our market capitalization subsequently declines, we may be or become a PFIC for the current taxable year or future taxable years. Furthermore, the composition of our income and assets may also be affected by how, and how quickly, we use our liquid assets. Under circumstances where our revenue from activities that produce passive income significantly increases relative to our revenue from activities that produce non-passive income, or where we determine not to deploy significant amounts of cash for active purposes, our risk of becoming a PFIC may substantially increase.
If we are a PFIC for any year during which a U.S. Holder holds the ADSs or ordinary shares, the PFIC rules discussed below under “—Passive Foreign Investment Company Rules.” generally will apply to such U.S. Holder for such taxable year, and unless the U.S. Holder makes certain elections, will apply in future years even if we cease to be a PFIC.
The discussion below under “—Dividends.” and “—Sale or Other Disposition.” is written on the basis that we will not be or become a PFIC for U.S. federal income tax purposes. The U.S. federal income tax rules that apply generally if we are treated as a PFIC are discussed below under “—Passive Foreign Investment Company Rules.”
Dividends
Any cash distributions paid on the ADSs or ordinary shares (including the amount of any PRC tax withheld) out of our current or accumulated earnings and profits, as determined under U.S. federal income tax principles, will generally be includible in the
126
Table of Contents
gross income of a U.S. Holder as dividend income on the day actually or constructively received by the U.S. Holder, in the case of ordinary shares, or by the depositary, in the case of ADSs. Because we do not intend to determine our earnings and profits on the basis of U.S. federal income tax principles, any distribution we pay will generally be treated as a “dividend” for U.S. federal income tax purposes. Dividends received on the ADSs or ordinary shares will not be eligible for the dividends received deduction allowed to corporations in respect of dividends received from U.S. corporations.
Individuals and other non-corporate U.S. Holders will be subject to tax at the lower capital gain tax rate applicable to “qualified dividend income,” provided that certain conditions are satisfied, including that (1) our ADSs or ordinary shares are readily tradable on an established securities market in the United States, or, in the event that we are deemed to be a PRC resident enterprise under the PRC tax law, we are eligible for the benefit of the United States-PRC income tax treaty (the “Treaty”), (2) we are neither a PFIC nor treated as such with respect to a U.S. Holder (as discussed below) for the taxable year in which the dividend is paid and the preceding taxable year, and (3) certain holding period and other requirements are met. We expect that the ADSs will be readily tradable on the New York Stock Exchange, which is an established securities market in the United States and that we will be a qualified foreign corporation with respect to dividends paid on the ADSs. There can be no assurance that the ADSs will continue to be considered readily tradable on an established securities market in later years. Because the ordinary shares will not be listed on a U.S. exchange, dividends received with respect to ordinary shares that are not represented by ADSs may not be treated as qualified dividends. U.S. Holders are urged to consult their tax advisors regarding the availability of the lower rate for dividends paid with respect to the ADSs or ordinary shares.
In the event that we are deemed to be a PRC resident enterprise under the PRC Enterprise Income Tax Law (see “—E. Taxation—People’s Republic of China Taxation.”), we may be eligible for the benefits of the Treaty. If we are eligible for such benefits, dividends we pay on our ordinary shares, regardless of whether such shares are represented by the ADSs, and regardless of whether the ADSs are readily tradable on an established securities market in the United States, would be eligible for the reduced rates of taxation described in the preceding paragraph subject to applicable limitations described in (2) and (3) of the preceding paragraph.
For U.S. foreign tax credit purposes, dividends paid on the ADSs or ordinary shares generally will be treated as income from foreign sources and generally will constitute passive category income. In addition, subject to certain conditions and limitations, PRC withholding taxes on dividends not in excess of any applicable Treaty rate may be treated as foreign taxes eligible for credit against a U.S. Holder’s U.S. federal income tax liability. A U.S. Holder who does not elect to claim a foreign tax credit for foreign tax withheld may instead claim a deduction for U.S. federal income tax purposes, in respect of such withholding, but only for a year in which such holder elects to do so for all creditable foreign income taxes. The rules governing the foreign tax credit are complex and U.S. Holders are urged to consult their tax advisors regarding the availability of the foreign tax credit under their particular circumstances.
Sale or Other Disposition
A U.S. Holder will generally recognize gain or loss upon the sale or other disposition of ADSs or ordinary shares in an amount equal to the difference between the amount realized upon the disposition and the holder’s adjusted tax basis in such ADSs or ordinary shares. The gain or loss will generally the capital gain or loss. Individuals and other non-corporate U.S. Holders who have held the ADSs or ordinary shares for more than one year will generally be eligible for reduced tax rates. The deductibility of a capital loss may be subject to limitations. Any such gain or loss that the U.S. Holder recognizes will generally be treated as U.S. source income or loss for foreign tax credit limitation purposes, which will generally limit the availability of foreign tax credits. However, in the event we are deemed to be a PRC resident enterprise under the PRC Enterprise Income Tax Law, we may be eligible for the benefits of the Treaty. In such event, if PRC tax were to be imposed on any gain from the disposition of the ADSs or ordinary shares, a U.S. Holder that is eligible for the benefits of the Treaty may elect to treat such gain as PRC source income. If a U.S. Holder is not eligible for the benefits of the income tax treaty or fails to make the election to treat any gain as foreign source, then such U.S. holder may not be able to use the foreign tax credit arising from any PRC tax imposed on the disposition of the ADSs or ordinary shares unless such credit can be applied (subject to applicable limitations) against U.S. federal income tax due on other income derived from foreign sources in the same income category (generally, the passive category). U.S. Holders are urged to consult their tax advisors regarding the creditability of any PRC tax.
Passive Foreign Investment Company Rules
If we are a PFIC for any taxable year during which a U.S. Holder holds the ADSs or ordinary shares, and unless the U.S. Holder makes a mark-to-market election (as described below), the U.S. Holder will generally be subject to special tax rules on (i) any excess distribution that we make to the U.S. Holder (which generally means any distribution paid during a taxable year to a U.S. Holder that is greater than 125 percent of the average annual distributions paid in the three preceding taxable years or, if shorter, the
127
Table of Contents
U.S. Holder’s holding period for the ADSs or ordinary shares), and (ii) any gain realized on the sale or other disposition of ADSs or ordinary shares. Under the PFIC rules:
If we are a PFIC for any taxable year during which a U.S. Holder holds the ADSs or ordinary shares and any of our subsidiaries, the VIEs or any of the subsidiaries of the VIEs is also a PFIC, such U.S. Holder would be treated as owning a proportionate amount (by value) of the shares of the lower-tier PFIC for purposes of the application of these rules. U.S. Holders are urged to consult their tax advisors regarding the application of the PFIC rules to any of our subsidiaries, the VIEs or any of the subsidiaries of the VIEs.
As an alternative to the foregoing rules, a U.S. Holder of “marketable stock” (as defined below) in a PFIC may make a mark-to-market election with respect to such stock. If a U.S. Holder makes this election with respect to the ADSs, the holder will generally (i) include as ordinary income for each taxable year that we are a PFIC the excess, if any, of the fair market value of ADSs held at the end of the taxable year over the adjusted tax basis of such ADSs and (ii) deduct as an ordinary loss the excess, if any, of the adjusted tax basis of the ADSs over the fair market value of such ADSs held at the end of the taxable year, but such deduction will only be allowed to the extent of the amount previously included in income as a result of the mark-to-market election. The U.S. Holder’s adjusted tax basis in the ADSs would be adjusted to reflect any income or loss resulting from the mark-to-market election. If a U.S. Holder makes a mark-to-market election in respect of our ADSs and we cease to be a PFIC, the holder will not be required to take into account the gain or loss described above during any period that we are not a PFIC. If a U.S. Holder makes a mark-to-market election, any gain such U.S. Holder recognizes upon the sale or other disposition of the ADSs in a year when we are a PFIC will be treated as ordinary income and any loss will be treated as ordinary loss, but such loss will only be treated as ordinary loss to the extent of the net amount previously included in income as a result of the mark-to-market election.
The mark-to-market election is available only for “marketable stock,” which is stock that is traded in other than de minimis quantities on at least 15 days during each calendar quarter (“regularly traded”) on a qualified exchange or other market, as defined in applicable United States Treasury regulations. The ADSs are listed on the New York Stock Exchange, which is an established securities market in the United States. Consequently, if the ADSs continue to be listed on the New York Stock Exchange and are regularly traded, we expect that the mark-to-market election would be available to a U.S. Holder that holds the ADSs were we to be or become a PFIC.
Because a mark-to-market election cannot be made for any lower-tier PFICs that we may own, a U.S. Holder may continue to be subject to the PFIC rules with respect to such U.S. Holder’s indirect interest in any investments held by us that are treated as an equity interest in a PFIC for U.S. federal income tax purposes.
We do not intend to provide information necessary for U.S. Holders to make qualified electing fund elections which, if available, would result in tax treatment different from (and generally less adverse than) the general tax treatment for PFICs described above.
If a U.S. Holder owns our ADSs or ordinary shares during any taxable year that we are a PFIC, the holder must generally file an annual IRS Form 8621. You should consult your tax advisor regarding the U.S. federal income tax consequences of owning and disposing of the ADSs or ordinary shares if we are or become a PFIC.
Not applicable.
Not applicable.
128
Table of Contents
We previously filed with the SEC our registration statement on Form F-1 (File No. 333-228317), as amended, including the prospectus contained therein, to register our Class A ordinary shares in relation to our initial public offering. We have also filed with the SEC a related registration statement on Form F-6 (File No. 333-228527) to register the ADSs representing our Class A ordinary shares.
We are subject to periodic reporting and other informational requirements of the Exchange Act as applicable to foreign private issuers and are required to file reports and other information with the SEC. Specifically, we are required to file annually an annual report on Form 20-F within four months after the end of each fiscal year, which is March 31. All information filed with the SEC can be obtained over the internet at the SEC’s website at www.sec.gov or inspected and copied at the public reference facilities maintained by the SEC at 100 F Street, N.E., Washington, D.C. 20549. You can request copies of documents, upon payment of a duplicating fee, by writing to the SEC. As a foreign private issuer, we are exempt from the rules under the Exchange Act prescribing the furnishing and content of quarterly reports and proxy statements, and officers, directors and principal shareholders are exempt from the reporting and short-swing profit recovery provisions contained in Section 16 of the Exchange Act.
We will furnish The Bank of New York Mellon, the depositary of the ADSs, with our annual reports, which will include a review of operations and annual audited consolidated financial statements prepared in conformity with U.S. GAAP, and all notices of shareholders’ meetings and other reports and communications that are made generally available to our shareholders. The depositary will make such notices, reports and communications available to holders of ADSs and, upon our request, will mail to all record holders of ADSs the information contained in any notice of a shareholders’ meeting received by the depositary from us.
Not applicable.
Not applicable.
ITEM 11. QUANTITATIVE AND QUALITATIVE DISCLOSURES ABOUT MARKET RISK
Foreign Exchange Risk
Substantially all of our revenues and expenses are denominated in RMB. We do not believe that we currently have any significant direct foreign exchange risk and have not used any derivative financial instruments to hedge exposure to such risk.
Although our exposure to foreign exchange risks should be limited in general, the value of your investment in our ADSs will be affected by the exchange rate between U.S. dollar and Renminbi because the value of our business is effectively denominated in RMB, while our ADSs will be traded in U.S. dollars.
The conversion of Renminbi into foreign currencies, including U.S. dollars, is based on rates set by the People’s Bank of China. The Renminbi has fluctuated against the U.S. dollar, at times significantly and unpredictably. It is difficult to predict how market forces or PRC or U.S. government policy may impact the exchange rate between Renminbi and the U.S. dollar in the future.
To the extent that we need to convert U.S. dollars into Renminbi for our operations, appreciation of Renminbi against the U.S. dollar would reduce the Renminbi amount we receive from the conversion. Conversely, if we decide to convert Renminbi into U.S. dollars for the purpose of making payments for dividends on our ordinary shares or ADSs, servicing our outstanding debt, or for other business purposes, appreciation of the U.S. dollar against the Renminbi would reduce the U.S. dollar amounts available to us.
As of March 31, 2023, we had Renminbi-denominated cash and cash equivalents of RMB323.4 million (US$47.1 million). A 10% depreciation of Renminbi against the U.S. dollar based on the foreign exchange rate on March 31, 2023 would result in a decrease of US$4.3 million in such cash and cash equivalents. A 10% appreciation of Renminbi against the U.S. dollar based on the foreign exchange rate on March 31, 2023 would result in an increase of US$5.2 million in such cash and cash equivalents.
Interest Rate Risk
Our exposure to interest rate risk primarily relates to the interest income generated by excess cash, which is mostly held in interest-bearing bank deposits and wealth management products. Interest-earning instruments carry a degree of interest rate risk.
129
Table of Contents
We have not been exposed to material risks due to changes in interest rates, and we have not used any derivative financial instruments to manage our interest risk exposure.
We may invest the net proceeds we receive from our initial public offering in interest-earning instruments. Investments in both fixed rate and floating rate interest earning instruments carry a degree of interest rate risk. Fixed rate securities may have their fair market value adversely impacted due to a rise in interest rates, while floating rate securities may produce less income than expected if interest rates fall.
Inflation
To date, inflation in China has not materially affected our results of operations. According to the National Bureau of Statistics of China, the year-over-year percent changes in the consumer price index for March 2021, 2022 and 2023 were increases of 0.4%, 1.5% and 0.7% respectively. Although we have not been materially affected by inflation in the past, we may be affected if China experiences higher rates of inflation in the future.
ITEM 12. DESCRIPTION OF SECURITIES OTHER THAN EQUITY SECURITIES
Not applicable.
Not applicable.
Not applicable.
Fees and Expenses Our ADS Holders May Have to Pay
The Bank of New York Mellon, as depositary, will register and deliver ADSs. Each ADS represents 300 of our Class A ordinary shares (or a right to receive 300 Class A ordinary shares) deposited with The Hong Kong and Shanghai Banking Corporation Limited, as custodian for the depositary in Hong Kong. Each ADS will also represent any other securities, cash or other property which may be held by the depositary. The deposited Class A ordinary shares together with any other securities, cash or other property held by the depositary are referred to as the deposited securities. The depositary’s office at which the ADSs will be administered is located at 101 Barclay Street, New York, NY 10286. The Bank of New York Mellon’s principal executive office is located at 225 Liberty Street, New York, NY 10286.
Persons depositing or withdrawing Class A ordinary |
|
For: |
|
|
|
$5.00 (or less) per 100 ADSs (or portion of 100 ADSs) |
|
• Issuance of ADSs, including issuances resulting from a distribution of Class A ordinary shares or rights or other property |
|
|
|
|
|
• Cancellation of ADSs for the purpose of withdrawal, including if the deposit agreement terminates |
|
|
|
$0.05 (or less) per ADS |
|
• Any cash distribution to ADS holders |
|
|
|
A fee equivalent to the fee that would be payable if securities distributed to you had been Class A ordinary shares and the Class A ordinary shares had been deposited for issuance of ADSs |
|
• Distribution of securities distributed to holders of deposited securities (including rights) that are distributed by the depositary to ADS holders |
|
|
|
$0.05 (or less) per ADS per calendar year |
|
• Depositary services |
|
|
|
Registration or transfer fees |
|
• Transfer and registration of Class A ordinary shares on our share register to or from the name of the depositary or its agent when you deposit or withdraw Class A ordinary shares |
130
Table of Contents
Persons depositing or withdrawing Class A ordinary |
|
For: |
|
|
|
Expenses of the depositary |
|
• Cable and facsimile transmissions (when expressly provided in the deposit agreement) |
|
|
|
|
|
• Converting foreign currency to U.S. dollars |
|
|
|
Taxes and other governmental charges the depositary or the custodian has to pay on any ADSs or Class A ordinary shares underlying ADSs, such as stock transfer taxes, stamp duty or withholding taxes |
|
• As necessary |
|
|
|
Any charges incurred by the depositary or its agents for servicing the deposited securities |
|
• As necessary |
The depositary collects its fees for delivery and surrender of ADSs directly from investors depositing Class A ordinary shares or surrendering ADSs for the purpose of withdrawal or from intermediaries acting for them. The depositary collects fees for making distributions to investors by deducting those fees from the amounts distributed or by selling a portion of distributable property to pay the fees. The depositary may collect its annual fee for depositary services by deduction from cash distributions or by directly billing investors or by charging the book-entry system accounts of participants acting for them. The depositary may collect any of its fees by deduction from any cash distribution payable (or by selling a portion of securities or other property distributable) to ADS holders that are obligated to pay those fees. The depositary may generally refuse to provide fee-attracting services until its fees for those services are paid.
In performing its duties under the deposit agreement, the depositary may use brokers, dealers, foreign currency dealers or other service providers that are owned by or affiliated with the depositary and that may earn or share fees, spreads or commissions.
The depositary may convert currency itself or through any of its affiliates and, in those cases, acts as principal for its own account and not as agent, advisor, broker or fiduciary on behalf of any other person and earns revenue, including, without limitation, transaction spreads, that it will retain for its own account. The revenue is based on, among other things, the difference between the exchange rate assigned to the currency conversion made under the deposit agreement and the rate that the depositary or its affiliate receives when buying or selling foreign currency for its own account. The depositary makes no representation that the exchange rate used or obtained in any currency conversion under the deposit agreement will be the most favorable rate that could be obtained at the time or that the method by which that rate will be determined will be the most favorable to ADS holders, subject to the depositary’s obligations under the deposit agreement. The methodology used to determine exchange rates used in currency conversions is available upon request.
Fees and Other Payments Made by the Depositary to Us
From time to time, the depositary may make payments to us to reimburse us for costs and expenses generally arising out of establishment and maintenance of the ADS program, waive fees and expenses for services provided to us by the depositary or share revenue from the fees collected from ADS holders. For the year ended March 31, 2023, we did not receive any reimbursement from the depositary.
PART II
ITEM 13. DEFAULTS, DIVIDEND ARREARAGES AND DELINQUENCIES
None.
ITEM 14. MATERIAL MODIFICATIONS TO THE RIGHTS OF SECURITY HOLDERS AND USE OF PROCEEDS
Material Modifications to the Rights of Security Holders
See “Item 10. Additional Information.” for a description of the rights of securities holders, which remain unchanged.
Use of Proceeds
The following “Use of Proceeds” information relates to the registration statement on Form F-1, as amended (File No. 333-228317) (the “F-1 Registration Statement”) in relation to our initial public offering of 4,750,000 ADSs representing 118,750,000
131
Table of Contents
Class A ordinary shares, at an initial offering price of US$14.0 per ADS. Our initial public offering closed in December 2018. Morgan Stanley & Co. LLC, Credit Suisse Securities (USA) LLC and China Renaissance Securities (Hong Kong) Limited were the representatives of the underwriters for our initial public offering.
The F-1 Registration Statement was declared effective by the SEC on December 4, 2018. For the period from the effective date of the F-1 Registration Statement to March 31, 2023, the total expenses incurred for our company’s account in connection with our initial public offering was approximately US$10.4 million, which included approximately US$4.7 million in underwriting discounts and commissions for the initial public offering and approximately US$5.7 million in other costs and expenses for our initial public offering. Counting in the ADSs sold upon the exercise of the over-allotment option by our underwriters, we offered and sold an aggregate of 4,834,910 ADSs at an initial public offering price of US$14.0 per ADS, and received approximately US$58.0 million in net proceeds after deducting underwriting commissions and discounts and the offering expenses payable by us. None of the transaction expenses included payments to directors or officers of our company or their associates, persons owning more than 10% or more of our equity securities or our affiliates. None of the net proceeds from the initial public offering were paid, directly or indirectly, to any of our directors or officers or their associates, persons owning 10% or more of our equity securities or our affiliates.
As of March 31, 2023, we had used approximately US$37.7 million of the net proceeds received from our initial public offering on developing and expanding our content offering, technology development, collaboration with merchants and brand partners, and general corporate purposes. We still intend to use the remainder of the proceeds from our initial public offering as disclosed in the F-1 Registration Statement. We may also use part of the proceeds to repurchase our ADSs.
ITEM 15. CONTROLS AND PROCEDURES
Evaluation of Disclosure Controls and Procedures
Our management, under the supervision and with the participation of our chief executive officer and principal financial officer, carried out an evaluation of the effectiveness of our disclosure controls and procedures, which is defined in Rules 13a-15(e) of the Exchange Act.
Based upon that evaluation, our management, with the participation of our chief executive officer and principal financial officer, has concluded that, as of March 31, 2023, our disclosure controls and procedures were ineffective because of the material weakness in our internal control over financial reporting described under “Internal Control over Financial Reporting.” Notwithstanding thereof, we believe that our consolidated financial statements included in this annual report fairly present our financial position, results of operations and cash flows for the fiscal years covered thereby in all material respects.
Management’s Report on Internal Control over Financial Reporting
Our management is responsible for establishing and maintaining adequate internal control over financial reporting, as defined in Rules 13a-15(f) under the Exchange Act. Our management, with the participation of our chief executive officer and principal financial officer, evaluated the effectiveness of our internal control over financial reporting based on criteria established in the framework in Internal Control—Integrated Framework (2013) issued by the Committee of Sponsoring Organizations of the Treadway Commission. Based on this evaluation, our management has concluded that we did not maintain effective internal control over financial reporting as of March 31, 2023 due to a material weakness identified in our internal control over financial reporting as described below under “Internal Control over Financial Reporting.”
Notwithstanding management’s assessment that we did not maintain effective internal control over financial reporting as of March 31, 2023 due to the material weakness identified, we believe that the consolidated financial statements included in this annual report fairly present our financial position, results of operations and cash flows for the fiscal years covered thereby in all material respects.
Internal Control Over Financial Reporting
During our initial public offering, we and our independent registered public accounting firm identified a material weakness in our internal control over financial reporting. As defined in the standards established by the U.S. Public Company Accounting Oversight Board, a “material weakness” is a deficiency, or combination of deficiencies, in internal control over financial reporting, such that there is a reasonable possibility that a material misstatement of the annual or interim financial statements will not be prevented or detected on a timely basis.
132
Table of Contents
The material weakness that has been identified relates to our lack of sufficient financial reporting and accounting personnel with appropriate knowledge of U.S. GAAP and SEC reporting requirements to properly address complex U.S. GAAP accounting issues and to prepare and review our consolidated financial statements and related disclosures to fulfill U.S. GAAP and SEC financial reporting requirements. The material weakness, if not timely remedied, may lead to material misstatements in our consolidated financial statements in the future. We have implemented and plan to implement a number of measures to address the material weakness that has been identified in connection with the audits of our consolidated financial statements as of and for the years ended March 31, 2021, 2022 and 2023. The measures implemented included hiring additional qualified financial and accounting staff with working experience of U.S. GAAP and SEC reporting requirements and arranging our financial and accounting staff to attend external training courses to deepen their U.S GAAP and SEC reporting knowledge. We have also established the financial reporting policies with clear roles and responsibilities for accounting and financial reporting staff to address complex accounting and financial reporting issues. Furthermore, we will continue to further expedite and streamline our financial reporting process including: (i) establishing a comprehensive policy and procedure manual, to allow early detection, prevention and resolution of potential misstatement to the consolidated financial statements (ii) establishing effective oversight and clarifying reporting requirements for non-recurring and complex transactions to ensure consolidated financial statements and related disclosures are accurate, complete and in accordance with U.S. GAAP and SEC reporting requirements, (iii) implementing regular and consistent U.S. GAAP accounting and financial reporting training programs for our accounting and financial reporting personnel, and (iv) enhancing our internal audit function and improve overall internal control. We also intend to continue to hire additional resources equipped with relevant U.S. GAAP and SEC reporting knowledge and experience and consider requiring financial reporting personnel to obtain US GAAP related qualifications.
However, such measures have not been fully implemented and we concluded that the material weakness in our internal control over financial reporting have not been remediated as of March 31, 2023.
Attestation Report of the Registered Public Accounting Firm
As a company with less than US$1.235 billion in revenue for our last fiscal year, we qualify as an “emerging growth company” pursuant to the JOBS Act. An emerging growth company may take advantage of specified reduced reporting and other requirements that are otherwise applicable generally to public companies. These provisions include exemption from the auditor attestation requirement under Section 404 of the Sarbanes-Oxley Act of 2002, in the assessment of the emerging growth company’s internal control over financial reporting. This annual report on Form 20-F does not include an attestation report of our independent registered public accounting firm.
Changes in Internal Control over Financial Reporting
Other than as described above, there were no changes in our internal controls over financial reporting that occurred during the period covered by this annual report on Form 20-F that have materially affected, or are reasonably likely to materially affect, our internal control over financial reporting.
ITEM 16. RESERVED
ITEM 16A. AUDIT COMMITTEE FINANCIAL EXPERT
Our board of directors has determined that each of Mr. Andrew Hong Teoh and Mr. Shengwen Rong, each a member of our audit committee and an independent director (under the standards set forth in Section 303A of the Corporate Governance Rules of the NYSE and Rule 10A-3 under the Securities Exchange Act of 1934), is an audit committee financial expert.
ITEM 16B. CODE OF ETHICS
Our board of directors adopted a code of business conduct and ethics that applies to our directors, officers and employees in December 2018. We have posted a copy of our code of business conduct and ethics on our website at http://ir.mogu-inc.com.
133
Table of Contents
ITEM 16C. PRINCIPAL ACCOUNTANT FEES AND SERVICES
The following table sets forth the aggregate fees by categories specified below in connection with certain professional services rendered by PricewaterhouseCoopers Zhong Tian LLP, our principal external auditors, for the periods indicated.
|
|
For the Year Ended March 31, |
|
|||||||
|
|
2022 |
|
|
2023 |
|
||||
|
|
(in thousands) |
|
|||||||
Audit fees(1) |
|
RMB |
|
5,900 |
|
|
RMB |
|
5,900 |
|
Tax fees(2) |
|
RMB |
|
203 |
|
|
RMB |
|
— |
|
Other fees(3) |
|
RMB |
|
54 |
|
|
RMB |
|
13 |
|
The policy of our audit committee is to pre-approve all audit and non-audit services provided by PricewaterhouseCoopers Zhong Tian LLP, including audit services, audit-related services, tax services and other services as described above, other than those for de minimis services which are approved by the audit committee prior to the completion of the audit.
ITEM 16D. EXEMPTIONS FROM THE LISTING STANDARDS FOR AUDIT COMMITTEES
Not applicable.
ITEM 16E. PURCHASES OF EQUITY SECURITIES BY THE ISSUER AND AFFILIATED PURCHASERS
In May 2020, our board of directors approved a share repurchase program, whereby we are authorized to repurchase our ordinary shares or ADSs with an aggregate value of up to US$10 million during the next twelve-month period. The share repurchase program was publicly announced on May 29, 2020. In September 2020, our board of directors approved another share repurchase program, whereby we are authorized to repurchase our ordinary shares or ADSs with an aggregate value of up to US$10 million during the next twelve-month period. This share repurchase program was publicly announced on September 14, 2020 and completed in September 2021.
In August 2021, our board of directors approved a new share repurchase program, whereby we are authorized to repurchase our ordinary shares or ADSs with an aggregate value of up to US$10 million during the next twelve-month period. This share repurchase program was publicly announced on August 27, 2021.
In September 2022, our board of directors further approved a new share repurchase program, whereby we are authorized to repurchase our ordinary shares or ADSs with an aggregate value of up to US$10 million until August 31, 2023. This share repurchase program was publicly announced on September 9, 2022.
The table below is a summary of the Class A ordinary shares repurchased by us in the fiscal year ended March 31, 2023. The shares were repurchased in open market or in privately negotiated transactions pursuant to our share repurchase programs.
134
Table of Contents
Period |
|
Total Number of |
|
|
Average Price |
|
|
Total Number of |
|
|
Approximate |
|||
April 1 – April 30, 2022 |
|
|
— |
|
|
|
— |
|
|
|
— |
|
|
US$9,792,173 |
May 1 – May 31, 2022 |
|
|
— |
|
|
|
— |
|
|
|
— |
|
|
US$9,792,173 |
June 1 – June 30, 2022 |
|
|
— |
|
|
|
— |
|
|
|
— |
|
|
US$9,792,173 |
July 1 – July 31, 2022 |
|
|
— |
|
|
|
— |
|
|
|
— |
|
|
US$9,792,173 |
August 1 - August 31, 2022 |
|
|
— |
|
|
|
— |
|
|
|
— |
|
|
US$9,792,173 |
September 1 - September 30, 2022 |
|
|
29,778,000 |
|
|
US$0.0067 |
|
|
|
29,778,000 |
|
|
US$9,801,733 |
|
October 1 – October 31, 2022 |
|
|
— |
|
|
|
— |
|
|
|
— |
|
|
US$9,801,733 |
November 1 – November 30, 2022 |
|
|
— |
|
|
|
— |
|
|
|
— |
|
|
US$9,801,733 |
December 1 – December 31, 2022 |
|
|
— |
|
|
|
— |
|
|
|
— |
|
|
US$9,801,733 |
January 1 – January 31, 2023 |
|
|
— |
|
|
|
— |
|
|
|
— |
|
|
US$9,801,733 |
February 1 – February 28, 2023 |
|
|
— |
|
|
|
— |
|
|
|
— |
|
|
US$9,801,733 |
March 1 – March 31, 2023 |
|
|
— |
|
|
|
— |
|
|
|
— |
|
|
US$9,801,733 |
Total |
|
|
29,778,000 |
|
|
US$0.0067 |
|
|
|
29,778,000 |
|
|
US$9,801,733 |
|
ITEM 16F. CHANGE IN REGISTRANT’S CERTIFYING ACCOUNTANT
Not applicable.
ITEM 16G. CORPORATE GOVERNANCE
As a Cayman Islands company listed on the NYSE, we are subject to the NYSE corporate governance listing standards. However, NYSE rules permit a foreign private issuer like us to follow the corporate governance practices of its home country. Certain corporate governance practices in the Cayman Islands, which is our home country, may differ significantly from the NYSE corporate governance listing standards. Currently, we intend to follow our home country practice in lieu of the following NYSE corporate governance requirements: (i) having a majority of independent directors on our board of directors, (ii) having a minimum of three members in our audit committee, (iii) holding annual shareholders’ meetings, (iv) having a compensation committee composed entirely of independent directors, and (v) having a nominating and corporate governance committee composed entirely of independent directors. The home country practices we intend to follow with respect to each of the aforementioned NYSE corporate governance requirements are as follows: (i) as permitted under Cayman Islands law, our board of directors consists of two independent directors and three directors that are not independent; (ii) as permitted under Cayman Islands law, our audit committee has only two members; (iii) as permitted under Cayman Islands law, we did not hold an annual meeting of shareholders in 2021 and will not hold one in 2022; (iv) as permitted under Cayman Islands law, our compensation committee consists of one independent director and one director that is not independent; and (v) as permitted under Cayman Islands law, our nominating and corporate governance committee consists of one independent director and one director that is not independent. See “Item 3. Key Information—D. Risk Factors—Risks Related to the ADSs—As a company incorporated in the Cayman Islands, we are permitted to adopt certain home country practices in relation to corporate governance matters that differ significantly from the NYSE corporate governance listing standards; these practices may afford less protection to shareholders than they would enjoy if we comply fully with the NYSE corporate governance listing standards.”
ITEM 16H. MINE SAFETY DISCLOSURE
Not applicable.
ITEM 16I. DISCLOSURE REGARDING FOREIGN JURISDICTIONS THAT PREVENT INSPECTIONS
On August 22, 2022, we were conclusively identified by the SEC a “Commission-Identified Issuer” under the HFCAA following the filing of our annual report on Form 20-F for the fiscal year ended March 31, 2022. Our auditor, a registered public accounting firm that the PCAOB was unable to inspect or investigate completely in 2021, issued an audit report for our fiscal year ended March 31, 2022. On December 15, 2022, the PCAOB issued a report that vacated its December 16, 2021 determination and removed mainland China and Hong Kong from the list of jurisdictions where it is unable to inspect or investigate completely registered public accounting firms. For this reason, we do not expect to be identified as a “Commission-Identified Issuer” under the HFCAA after we file this annual report on Form 20-F for the fiscal year ended March 31, 2023.
135
Table of Contents
As of the date of this annual report and to our best knowledge: (i) none of the Company's shares or the shares of the VIEs are owned by governmental entities in the Cayman Islands or China; (ii) none of the governmental entities in the applicable foreign jurisdiction with respect to our registered public accounting firm have a controlling financial interest in the Company or the VIEs; (iii) none of the members of the Company’s (and its operating entities) board of directors or the board of directors of the VIEs is an official of the Chinese Communist Party; and (iv) the currently effective articles of incorporation (or equivalent organizing documents) of the Company and the VIEs do not contain any charter of the Chinese Communist Party, including the text of any such charter or organizing documents.
ITEM 16J. INSIDER TRADING POLICIES
Not applicable.
136
Table of Contents
PART III
ITEM 17. FINANCIAL STATEMENTS
We have elected to provide financial statements pursuant to Item 18.
ITEM 18. FINANCIAL STATEMENTS
The consolidated financial statements of MOGU Inc. are included at the end of this annual report.
ITEM 19. EXHIBITS
Exhibit Number |
|
Description of Document |
|
|
|
1.1 |
|
|
|
|
|
2.1 |
|
|
|
|
|
2.2 |
|
|
|
|
|
2.3 |
|
|
|
|
|
2.4 |
|
|
|
|
|
2.5 |
|
|
|
|
|
4.1 |
|
|
|
|
|
4.2 |
|
|
|
|
|
4.3 |
|
|
|
|
|
4.4 |
|
|
|
|
|
4.5 |
|
|
|
|
|
4.6 |
|
|
|
|
|
4.7 |
|
137
Table of Contents
Exhibit Number |
|
Description of Document |
|
|
|
4.8 |
|
|
|
|
|
4.9 |
|
|
|
|
|
4.10 |
|
|
|
|
|
4.11 |
|
|
|
|
|
4.12 |
|
|
|
|
|
4.13 |
|
|
|
|
|
4.14 |
|
|
|
|
|
8.1* |
|
Significant Subsidiaries and Consolidated Entities of the Registrant |
|
|
|
11.1 |
|
|
|
|
|
12.1* |
|
Chairman Certification Pursuant to Section 302 of the Sarbanes-Oxley Act of 2002 |
|
|
|
12.2* |
|
CFO Certification Pursuant to Section 302 of the Sarbanes-Oxley Act of 2002 |
|
|
|
13.1** |
|
Chariman Certification Pursuant to Section 906 of the Sarbanes-Oxley Act of 2002 |
|
|
|
13.2** |
|
CFO Certification Pursuant to Section 906 of the Sarbanes-Oxley Act of 2002 |
|
|
|
15.1* |
|
|
|
|
|
15.2* |
|
|
|
|
|
15.3* |
|
Supplemental Submission Pursuant to Item 16I(a) of Form 20-F |
|
|
|
101.INS* |
|
Inline XBRL Instance Document- the instance document does not appear in the Interactive Data File because its XBRL tags are embedded within the Inline XBRL document. |
|
|
|
101.SCH* |
|
Inline XBRL Taxonomy Extension Scheme Document |
|
|
|
101.CAL* |
|
Inline XBRL Taxonomy Extension Calculation Linkbase Document |
|
|
|
101.DEF* |
|
Inline XBRL Taxonomy Extension Definition Linkbase Document |
|
|
|
101.LAB* |
|
Inline XBRL Taxonomy Extension Label Linkbase Document |
|
|
|
101.PRE* |
|
Inline XBRL Taxonomy Extension Presentation Linkbase Document |
|
|
|
104.* |
|
Cover Page Interactive Data File (formatted as inline XBRL and contained in Exhibit 101) |
* Filed herewith
** Furnished herewith
138
Table of Contents
SIGNATURES
The registrant hereby certifies that it meets all of the requirements for filing on Form 20-F and that it has duly caused and authorized the undersigned to sign this annual report on its behalf.
|
MOGU Inc. |
||
|
|
||
|
By: |
/s/ Qi Chen |
|
|
|
Name: |
Qi Chen |
|
|
Title: |
Chairman of the Board of Directors |
|
|
|
|
Date: July 31, 2023 |
|
|
|
139
Table of Contents
MOGU INC.
INDEX TO CONSOLIDATED FINANCIAL STATEMENTS
|
Page
|
Report of Independent Registered Public Accounting Firm (PCAOB ID: |
F-2 |
F-3 |
|
F-5 |
|
F-6 |
|
Consolidated Statements of Cash Flows for the Years Ended March 31, 2021, 2022 and 2023 |
F-8 |
F-10 |
F-1
Table of Contents
REPORT OF INDEPENDENT REGISTERED PUBLIC ACCOUNTING FIRM
Opinion on the Financial Statements
We have audited the accompanying consolidated balance sheets of MOGU Inc. and its subsidiaries (the “Company”) as of March 31, 2023 and 2022, and the related consolidated statements of operations and comprehensive loss, of changes in shareholders’ equity and of cash flows for each of the three years in the period ended March 31, 2023, including the related notes (collectively referred to as the “consolidated financial statements”). In our opinion, the consolidated financial statements present fairly, in all material respects, the financial position of the Company as of March 31, 2023 and 2022, and the results of its operations and its cash flows for each of the three years in the period ended March 31, 2023 in conformity with accounting principles generally accepted in the United States of America.
Change in Accounting Principle
As discussed in Note 2 to the consolidated financial statements, the Company adopted a change in the manner in which it accounts for leases in 2023.
Basis for Opinion
These consolidated financial statements are the responsibility of the Company’s management. Our responsibility is to express an opinion on the Company’s consolidated financial statements based on our audits. We are a public accounting firm registered with the Public Company Accounting Oversight Board (United States) (PCAOB) and are required to be independent with respect to the Company in accordance with the U.S. federal securities laws and the applicable rules and regulations of the Securities and Exchange Commission and the PCAOB.
We conducted our audits of these consolidated financial statements in accordance with the standards of the PCAOB. Those standards require that we plan and perform the audit to obtain reasonable assurance about whether the consolidated financial statements are free of material misstatement, whether due to error or fraud. The Company is not required to have, nor were we engaged to perform, an audit of its internal control over financial reporting. As part of our audits we are required to obtain an understanding of internal control over financial reporting but not for the purpose of expressing an opinion on the effectiveness of the Company’s internal control over financial reporting. Accordingly, we express no such opinion.
Our audits included performing procedures to assess the risks of material misstatement of the consolidated financial statements, whether due to error or fraud, and performing procedures that respond to those risks. Such procedures included examining, on a test basis, evidence regarding the amounts and disclosures in the consolidated financial statements. Our audits also included evaluating the accounting principles used and significant estimates made by management, as well as evaluating the overall presentation of the consolidated financial statements. We believe that our audits provide a reasonable basis for our opinion.
/s/
July 31, 2023
We have served as the Company’s auditor since 2012.
F-2
Table of Contents
MOGU INC.
CONSOLIDATED BALANCE SHEETS
As of March 31, 2022 and 2023
(All amounts in thousands, except for share and per share data)
|
|
|
|
|
As of March 31, |
|
||||||||||
|
|
Note |
|
|
2022 |
|
|
2023 |
|
|||||||
|
|
|
|
|
RMB |
|
|
RMB |
|
|
US$ Note 2(f) |
|
||||
ASSETS |
|
|
|
|
|
|
|
|
|
|
|
|
||||
Current assets: |
|
|
|
|
|
|
|
|
|
|
|
|
||||
Cash and cash equivalents |
|
|
|
|
|
|
|
|
|
|
|
|
||||
Restricted cash |
|
|
|
|
|
|
|
|
|
|
|
|
||||
Short-term investments |
|
|
7 |
|
|
|
|
|
|
|
|
|
|
|||
Inventories, net |
|
|
|
|
|
|
|
|
|
|
|
|
||||
Loan receivables, net |
|
|
8 |
|
|
|
|
|
|
|
|
|
|
|||
Prepayments, receivables and other current assets |
|
|
9 |
|
|
|
|
|
|
|
|
|
|
|||
Amounts due from related parties |
|
|
19 |
|
|
|
|
|
|
|
|
|
|
|||
Total current assets |
|
|
|
|
|
|
|
|
|
|
|
|
||||
Non-current assets: |
|
|
|
|
|
|
|
|
|
|
|
|
||||
Property and equipment, net |
|
|
11 |
|
|
|
|
|
|
|
|
|
|
|||
Intangible assets, net |
|
|
12 |
|
|
|
|
|
|
|
|
|
|
|||
Right-of-use assets |
|
13 |
|
|
|
|
|
|
|
|
|
|
||||
Goodwill |
|
|
14 |
|
|
|
|
|
|
|
|
|
|
|||
Investments |
|
|
10 |
|
|
|
|
|
|
|
|
|
|
|||
Other non-current assets |
|
|
9 |
|
|
|
|
|
|
|
|
|
|
|||
Total non-current assets |
|
|
|
|
|
|
|
|
|
|
|
|
||||
Total assets |
|
|
|
|
|
|
|
|
|
|
|
|
||||
LIABILITIES AND SHAREHOLDERS’ EQUITY |
|
|
|
|
|
|
|
|
|
|
|
|
||||
Current liabilities |
|
|
|
|
|
|
|
|
|
|
|
|
||||
Short-term borrowings |
|
2(r) |
|
|
|
|
|
|
|
|
|
|
||||
Accounts payable |
|
|
|
|
|
|
|
|
|
|
|
|
||||
Salaries and welfare payable |
|
|
|
|
|
|
|
|
|
|
|
|
||||
Advances from customers |
|
|
|
|
|
|
|
|
|
|
|
|
||||
Taxes payable |
|
|
|
|
|
|
|
|
|
|
|
|
||||
Amounts due to related parties |
|
|
19 |
|
|
|
|
|
|
|
|
|
|
|||
Current portion of lease liabilities |
|
|
13 |
|
|
|
|
|
|
|
|
|
|
|||
Accruals and other current liabilities (including accruals and other current liabilities of the consolidated VIEs and VIEs’ subsidiaries without recourse to the primary beneficiaries of RMB |
|
|
15 |
|
|
|
|
|
|
|
|
|
|
|||
Total current liabilities |
|
|
|
|
|
|
|
|
|
|
|
|
||||
Non-current liabilities: |
|
|
|
|
|
|
|
|
|
|
|
|
||||
Non-current lease liabilities |
|
|
13 |
|
|
|
|
|
|
|
|
|
|
|||
Deferred tax liabilities |
|
|
16 |
|
|
|
|
|
|
|
|
|
|
|||
Other non-current liabilities |
|
|
15 |
|
|
|
|
|
|
|
|
|
|
|||
Total non-current liabilities |
|
|
|
|
|
|
|
|
|
|
|
|
||||
Total liabilities |
|
|
|
|
|
|
|
|
|
|
|
|
||||
The accompanying notes are an integral part of these consolidated financial statements.
F-3
Table of Contents
MOGU INC.
CONSOLIDATED BALANCE SHEETS—(Continued)
As of March 31, 2022 and 2023
(All amounts in thousands, except for share and per share data)
|
|
|
|
|
As of March 31, |
|
||||||||||
|
|
Note |
|
|
2022 |
|
|
2023 |
|
|||||||
|
|
|
|
|
RMB |
|
|
RMB |
|
|
US$ Note 2(f) |
|
||||
Commitments and contingencies (Note 22) |
|
|
|
|
|
|
|
|
|
|
|
|
||||
SHAREHOLDERS’ EQUITY |
|
|
|
|
|
|
|
|
|
|
|
|
||||
Class A ordinary shares par value; |
|
|
17 |
|
|
|
|
|
|
|
|
|||||
Class B ordinary shares par value; |
|
|
17 |
|
|
|
|
|
|
|
|
|||||
Treasury stock par value; |
|
2(ab), 17 |
|
|
|
( |
) |
|
|
( |
) |
|
|
( |
) |
|
Additional paid-in capital |
|
|
|
|
|
|
|
|
|
|
|
|
||||
Statutory reserves |
|
|
|
|
|
|
|
|
|
|
|
|
||||
Accumulated other comprehensive income |
|
|
|
|
|
|
|
|
|
|
|
|
||||
Accumulated deficit |
|
|
|
|
|
( |
) |
|
|
( |
) |
|
|
( |
) |
|
Total MOGU Inc. shareholders’ equity |
|
|
|
|
|
|
|
|
|
|
|
|
||||
Non-controlling interests |
|
|
|
|
|
|
|
|
|
|
|
|
||||
Total shareholders’ equity |
|
|
|
|
|
|
|
|
|
|
|
|
||||
Total liabilities and shareholders’ equity |
|
|
|
|
|
|
|
|
|
|
|
|
||||
The accompanying notes are an integral part of these consolidated financial statements.
F-4
Table of Contents
MOGU INC.
CONSOLIDATED STATEMENTS OF OPERATIONS AND COMPREHENSIVE LOSS
For the years ended March 31, 2021, 2022 and 2023
(All amounts in thousands, except for share and per share data)
|
|
|
|
For the year ended March 31, |
|
|||||||||||||
|
|
Note |
|
2021 |
|
|
2022 |
|
|
2023 |
|
|||||||
|
|
|
|
RMB |
|
|
RMB |
|
|
RMB |
|
|
US$ |
|
||||
Revenues |
|
|
|
|
|
|
|
|
|
|
|
|
|
|
||||
Commission revenues |
|
|
|
|
|
|
|
|
|
|
|
|
|
|
||||
Marketing services revenues |
|
|
|
|
|
|
|
|
|
|
|
|
|
|
||||
Financing solutions revenues |
|
|
|
|
|
|
|
|
|
|
|
|
|
|
||||
Technology services revenues |
|
|
|
|
|
|
|
|
|
|
|
|
|
|
||||
Other revenues |
|
5 |
|
|
|
|
|
|
|
|
|
|
|
|
||||
Total revenues |
|
|
|
|
|
|
|
|
|
|
|
|
|
|
||||
Cost of revenues (exclusive of amortization of intangible assets shown separately below, including transactions with related parties of RMB |
|
|
|
|
( |
) |
|
|
( |
) |
|
|
( |
) |
|
|
( |
) |
Sales and marketing expenses |
|
|
|
|
( |
) |
|
|
( |
) |
|
|
( |
) |
|
|
( |
) |
Research and development expenses |
|
|
|
|
( |
) |
|
|
( |
) |
|
|
( |
) |
|
|
( |
) |
General and administrative expenses |
|
|
|
|
( |
) |
|
|
( |
) |
|
|
( |
) |
|
|
( |
) |
Amortization of intangible assets |
|
12 |
|
|
( |
) |
|
|
( |
) |
|
|
( |
) |
|
|
( |
) |
Impairment of goodwill and intangible assets |
|
12, 14 |
|
|
|
|
|
( |
) |
|
|
( |
) |
|
|
( |
) |
|
Other income, net |
|
6 |
|
|
|
|
|
|
|
|
|
|
|
|
||||
Loss from operations |
|
|
|
|
( |
) |
|
|
( |
) |
|
|
( |
) |
|
|
( |
) |
Interest income |
|
|
|
|
|
|
|
|
|
|
|
|
|
|
||||
Interest expense |
|
|
|
|
|
|
|
|
|
|
( |
) |
|
|
( |
) |
||
Gain/(loss) from investments, net |
|
|
|
|
|
|
|
|
|
|
( |
) |
|
|
( |
) |
||
Loss before income tax and share of results of equity investee |
|
|
|
|
( |
) |
|
|
( |
) |
|
|
( |
) |
|
|
( |
) |
Income tax (expenses)/benefits |
|
16 |
|
|
( |
) |
|
|
|
|
|
|
|
|
|
|||
Share of results of equity method investees |
|
|
|
|
|
|
|
( |
) |
|
|
|
|
|
|
|||
Net loss |
|
|
|
|
( |
) |
|
|
( |
) |
|
|
( |
) |
|
|
( |
) |
Net loss attributable to non-controlling interests |
|
|
|
|
|
|
|
( |
) |
|
|
( |
) |
|
|
( |
) |
|
Net loss attributable to MOGU Inc. |
|
|
|
|
( |
) |
|
|
( |
) |
|
|
( |
) |
|
|
( |
) |
Net loss |
|
|
|
|
( |
) |
|
|
( |
) |
|
|
( |
) |
|
|
( |
) |
Other comprehensive income/(loss): |
|
|
|
|
|
|
|
|
|
|
|
|
|
|
||||
Foreign currency translation adjustments, net of |
|
2(e) |
|
|
( |
) |
|
|
( |
) |
|
|
|
|
|
|
||
Share of other comprehensive loss of equity method investees |
|
|
|
|
|
|
|
|
|
|
|
|
|
|
||||
Unrealized securities holding losses, net of tax |
|
|
|
|
( |
) |
|
|
( |
) |
|
|
( |
) |
|
|
( |
) |
Total comprehensive loss |
|
|
|
|
( |
) |
|
|
( |
) |
|
|
( |
) |
|
|
( |
) |
Total comprehensive loss attributable to non-controlling interests |
|
|
|
|
|
|
|
( |
) |
|
|
( |
) |
|
|
( |
) |
|
Total comprehensive loss attributable to MOGU Inc. |
|
|
|
|
( |
) |
|
|
( |
) |
|
|
( |
) |
|
|
( |
) |
Net loss per ordinary share |
|
|
|
|
|
|
|
|
|
|
|
|
|
|
||||
Basic |
|
|
|
|
( |
) |
|
|
( |
) |
|
|
( |
) |
|
|
( |
) |
Diluted |
|
|
|
|
( |
) |
|
|
( |
) |
|
|
( |
) |
|
|
( |
) |
Net loss per ADS |
|
|
|
|
|
|
|
|
|
|
|
|
|
|
||||
Basic |
|
|
|
|
( |
) |
|
|
( |
) |
|
|
( |
) |
|
|
( |
) |
Diluted |
|
|
|
|
( |
) |
|
|
( |
) |
|
|
( |
) |
|
|
( |
) |
Weighted average number of shares used in computing net |
|
|
|
|
|
|
|
|
|
|
|
|
|
|
||||
Basic |
|
|
|
|
|
|
|
|
|
|
|
|
|
|
||||
Diluted |
|
|
|
|
|
|
|
|
|
|
|
|
|
|
||||
Share-based compensation expenses included in: |
|
|
|
|
|
|
|
|
|
|
|
|
|
|
||||
Cost of revenues |
|
|
|
|
( |
) |
|
|
( |
) |
|
|
( |
) |
|
|
( |
) |
General and administrative expenses |
|
|
|
|
( |
) |
|
|
( |
) |
|
|
( |
) |
|
|
( |
) |
Sales and marketing expenses |
|
|
|
|
( |
) |
|
|
( |
) |
|
|
( |
) |
|
|
( |
) |
Research and development expenses |
|
|
|
|
( |
) |
|
|
|
|
|
( |
) |
|
|
( |
) |
|
Note: Basic and diluted earnings per ADS for the years ended March 31, 2021 has been retrospectively adjusted for the ADS ratio change that was effective on March 28, 2022 as detailed in Note 2(a).
The accompanying notes are an integral part of these consolidated financial statements.
F-5
Table of Contents
MOGU INC.
CONSOLIDATED STATEMENTS OF CHANGES IN SHAREHOLDERS’ EQUITY
For the years ended March 31, 2021, 2022 and 2023
(All amounts in thousands, except for share and per share data)
|
|
Class A |
|
|
Class B |
|
|
Treasury Stock |
|
|
Additional |
|
|
Statutory |
|
|
Accumulated |
|
|
Accumulated |
|
|
Total |
|
|
Noncontrolling |
|
|
|
|
||||||||||||||||||||||
|
|
Shares |
|
|
Amount |
|
|
Shares |
|
|
Amount |
|
|
Shares |
|
|
Amount |
|
|
capital |
|
|
reserves |
|
|
deficit |
|
|
income |
|
|
equity |
|
|
interests |
|
|
Total Equity |
|
|||||||||||||
|
|
|
|
|
RMB |
|
|
|
|
|
RMB |
|
|
|
|
|
RMB |
|
|
RMB |
|
|
RMB |
|
|
RMB |
|
|
RMB |
|
|
RMB |
|
|
RMB |
|
|
RMB |
|
|||||||||||||
Balances at March 31, 2020 |
|
|
|
|
|
|
|
|
|
|
|
|
|
|
|
|
|
( |
) |
|
|
|
|
|
|
|
|
( |
) |
|
|
|
|
|
|
|
|
— |
|
|
|
|
||||||||||
Net loss |
|
|
— |
|
|
|
— |
|
|
|
— |
|
|
|
— |
|
|
|
— |
|
|
|
— |
|
|
|
— |
|
|
|
— |
|
|
|
( |
) |
|
|
— |
|
|
|
( |
) |
|
|
— |
|
|
|
( |
) |
Share-based compensation |
|
|
— |
|
|
|
— |
|
|
|
— |
|
|
|
— |
|
|
|
— |
|
|
|
— |
|
|
|
|
|
|
— |
|
|
|
— |
|
|
|
— |
|
|
|
|
|
|
— |
|
|
|
|
|||
Foreign currency translation adjustment |
|
|
— |
|
|
|
— |
|
|
|
— |
|
|
|
— |
|
|
|
— |
|
|
|
— |
|
|
|
— |
|
|
|
— |
|
|
|
— |
|
|
|
( |
) |
|
|
( |
) |
|
|
— |
|
|
|
( |
) |
Unrealized securities holding losses, net of tax |
|
|
— |
|
|
|
— |
|
|
|
— |
|
|
|
— |
|
|
|
— |
|
|
|
— |
|
|
|
— |
|
|
|
— |
|
|
|
— |
|
|
|
( |
) |
|
|
( |
) |
|
|
— |
|
|
|
( |
) |
Appropriations to statutory reserves |
|
|
— |
|
|
|
— |
|
|
|
— |
|
|
|
— |
|
|
|
— |
|
|
|
— |
|
|
|
— |
|
|
|
|
|
|
( |
) |
|
|
— |
|
|
|
— |
|
|
|
— |
|
|
|
— |
|
|
Repurchase of ordinary shares (Note 17) |
|
|
( |
) |
|
|
— |
|
|
|
— |
|
|
|
— |
|
|
|
|
|
|
( |
) |
|
|
— |
|
|
|
— |
|
|
|
— |
|
|
|
— |
|
|
|
( |
) |
|
|
— |
|
|
|
( |
) |
|
Exercise of option and RSUs |
|
|
|
|
|
|
|
|
— |
|
|
|
— |
|
|
|
— |
|
|
|
— |
|
|
|
|
|
|
— |
|
|
|
— |
|
|
|
— |
|
|
|
|
|
|
— |
|
|
|
|
|||||
Balances at March 31, 2021 |
|
|
|
|
|
|
|
|
|
|
|
|
|
|
|
|
|
( |
) |
|
|
|
|
|
|
|
|
( |
) |
|
|
|
|
|
|
|
|
— |
|
|
|
|
||||||||||
Net loss |
|
|
— |
|
|
|
— |
|
|
|
— |
|
|
|
— |
|
|
|
— |
|
|
|
— |
|
|
|
— |
|
|
|
— |
|
|
|
( |
) |
|
|
— |
|
|
|
( |
) |
|
|
( |
) |
|
|
( |
) |
Share-based compensation |
|
|
— |
|
|
|
— |
|
|
|
— |
|
|
|
— |
|
|
|
— |
|
|
|
— |
|
|
|
|
|
|
— |
|
|
|
— |
|
|
|
— |
|
|
|
|
|
|
— |
|
|
|
|
|||
Foreign currency translation adjustment |
|
|
— |
|
|
|
— |
|
|
|
— |
|
|
|
— |
|
|
|
— |
|
|
|
— |
|
|
|
— |
|
|
|
— |
|
|
|
— |
|
|
|
( |
) |
|
|
( |
) |
|
|
— |
|
|
|
( |
) |
Unrealized securities holding losses, net of tax |
|
|
— |
|
|
|
— |
|
|
|
— |
|
|
|
— |
|
|
|
— |
|
|
|
— |
|
|
|
— |
|
|
|
— |
|
|
|
— |
|
|
|
( |
) |
|
|
( |
) |
|
|
— |
|
|
|
( |
) |
Repurchase of ordinary shares (Note 17) |
|
|
( |
) |
|
|
— |
|
|
|
— |
|
|
|
— |
|
|
|
|
|
|
( |
) |
|
|
— |
|
|
|
— |
|
|
|
— |
|
|
|
— |
|
|
|
( |
) |
|
|
— |
|
|
|
( |
) |
|
Exercise of option and RSUs |
|
|
|
|
|
— |
|
|
|
— |
|
|
|
— |
|
|
|
— |
|
|
|
— |
|
|
|
— |
|
|
|
— |
|
|
|
— |
|
|
|
— |
|
|
|
— |
|
|
|
— |
|
|
|
— |
|
|
Non-controlling interests on acquisition of subsidiaries (Note 3) |
|
|
— |
|
|
|
— |
|
|
|
— |
|
|
|
— |
|
|
|
— |
|
|
|
— |
|
|
|
— |
|
|
|
— |
|
|
|
— |
|
|
|
— |
|
|
|
— |
|
|
|
|
|
|
|
||
Balances at March 31, 2022 |
|
|
|
|
|
|
|
|
|
|
|
|
|
|
|
|
|
( |
) |
|
|
|
|
|
|
|
|
( |
) |
|
|
|
|
|
|
|
|
|
|
|
|
|||||||||||
Net loss |
|
|
— |
|
|
|
— |
|
|
|
— |
|
|
|
— |
|
|
|
— |
|
|
|
— |
|
|
|
— |
|
|
|
— |
|
|
|
( |
) |
|
|
— |
|
|
|
( |
) |
|
|
( |
) |
|
|
( |
) |
Share-based compensation |
|
|
— |
|
|
|
— |
|
|
|
— |
|
|
|
— |
|
|
|
— |
|
|
|
— |
|
|
|
|
|
|
— |
|
|
|
— |
|
|
|
— |
|
|
|
|
|
|
— |
|
|
|
|
|||
Foreign currency translation adjustment |
|
|
— |
|
|
|
— |
|
|
|
— |
|
|
|
— |
|
|
|
— |
|
|
|
— |
|
|
|
— |
|
|
|
— |
|
|
|
— |
|
|
|
|
|
|
|
|
|
— |
|
|
|
|
|||
Unrealized securities holding losses, net of tax |
|
|
— |
|
|
|
— |
|
|
|
— |
|
|
|
— |
|
|
|
— |
|
|
|
— |
|
|
|
— |
|
|
|
— |
|
|
|
— |
|
|
|
( |
) |
|
|
( |
) |
|
|
— |
|
|
|
( |
) |
Repurchase of ordinary shares (Note 17) |
|
|
( |
) |
|
|
— |
|
|
|
— |
|
|
|
— |
|
|
|
|
|
|
( |
) |
|
|
— |
|
|
|
— |
|
|
|
— |
|
|
|
— |
|
|
|
( |
) |
|
|
— |
|
|
|
( |
) |
|
Exercise of option and RSUs |
|
|
|
|
|
|
|
|
— |
|
|
|
— |
|
|
|
— |
|
|
|
— |
|
|
|
— |
|
|
|
— |
|
|
|
— |
|
|
|
|
|
|
|
|
|
— |
|
|
|
|
|||||
Non-controlling interests on acquisition of subsidiaries (Note 3) |
|
|
— |
|
|
|
— |
|
|
|
— |
|
|
|
— |
|
|
|
— |
|
|
|
— |
|
|
|
— |
|
|
|
— |
|
|
|
— |
|
|
|
|
|
|
— |
|
|
|
|
|
|
— |
|
||
Balances at March 31, 2023 |
|
|
|
|
|
|
|
|
|
|
|
|
|
|
|
|
|
( |
) |
|
|
|
|
|
|
|
|
( |
) |
|
|
|
|
|
|
|
|
|
|
|
|
|||||||||||
F-6
Table of Contents
The accompanying notes are an integral part of these consolidated financial statements.
F-7
Table of Contents
MOGU INC.
CONSOLIDATED STATEMENTS OF CASH FLOWS
For the years ended March 31, 2021, 2022 and 2023
(All amounts in thousands, except for share and per share data)
|
|
For the year ended March 31, |
|
|||||||||||||
|
|
2021 |
|
|
2022 |
|
|
2023 |
|
|||||||
|
|
RMB |
|
|
RMB |
|
|
RMB |
|
|
US$ |
|
||||
Cash flows from operating activities: |
|
|
|
|
|
|
|
|
|
|
|
|
||||
Net loss |
|
|
( |
) |
|
|
( |
) |
|
|
( |
) |
|
|
( |
) |
Adjustments to reconcile net loss to net cash used in operating |
|
|
|
|
|
|
|
|
|
|
|
|
||||
Depreciation and amortization |
|
|
|
|
|
|
|
|
|
|
|
|
||||
Provision for/(reversal of) allowance for doubtful accounts |
|
|
|
|
|
( |
) |
|
|
|
|
|
|
|||
(Gains)/losses on disposal of property and equipment |
|
|
( |
) |
|
|
|
|
|
( |
) |
|
|
( |
) |
|
Foreign exchange (gain)/loss |
|
|
( |
) |
|
|
( |
) |
|
|
|
|
|
|
||
Goodwill impairment |
|
|
|
|
|
|
|
|
|
|
|
|
||||
Impairment of intangible assets |
|
|
|
|
|
|
|
|
|
|
|
|
||||
Share-based compensation expenses |
|
|
|
|
|
|
|
|
|
|
|
|
||||
Deferred income tax benefit |
|
|
( |
) |
|
|
( |
) |
|
|
( |
) |
|
|
( |
) |
(Gain)/loss from investments, net |
|
|
( |
) |
|
|
( |
) |
|
|
|
|
|
|
||
Share of results of equity investee |
|
|
( |
) |
|
|
|
|
|
( |
) |
|
|
( |
) |
|
Amortization of right-of-use asset and interest on lease liabilities |
|
|
|
|
|
|
|
|
|
|
|
|
||||
Changes in operating assets and liabilities: |
|
|
|
|
|
|
|
|
|
|
|
|
||||
Prepayments, receivables and other current assets |
|
|
|
|
|
|
|
|
|
|
|
|
||||
Loan receivables - service fee |
|
|
|
|
|
|
|
|
|
|
|
|
||||
Inventories |
|
|
|
|
|
|
|
|
( |
) |
|
|
( |
) |
||
Amounts due from related parties |
|
|
( |
) |
|
|
|
|
|
( |
) |
|
|
( |
) |
|
Other non-current assets |
|
|
( |
) |
|
|
( |
) |
|
|
|
|
|
|
||
Accounts payable |
|
|
|
|
|
( |
) |
|
|
( |
) |
|
|
( |
) |
|
Salary and welfare payable |
|
|
( |
) |
|
|
|
|
|
|
|
|
|
|||
Taxes payable |
|
|
( |
) |
|
|
|
|
|
|
|
|
|
|||
Advances from customers |
|
|
( |
) |
|
|
|
|
|
( |
) |
|
|
( |
) |
|
Amounts due to related parties |
|
|
( |
) |
|
|
( |
) |
|
|
( |
) |
|
|
( |
) |
Operating lease liabilities |
|
|
|
|
|
|
|
|
( |
) |
|
|
( |
) |
||
Accruals and other current liabilities |
|
|
( |
) |
|
|
( |
) |
|
|
( |
) |
|
|
( |
) |
Net cash used in operating activities |
|
|
( |
) |
|
|
( |
) |
|
|
( |
) |
|
|
( |
) |
Cash flows from investing activities: |
|
|
|
|
|
|
|
|
|
|
|
|
||||
Purchase of property and equipment |
|
|
( |
) |
|
|
( |
) |
|
|
( |
) |
|
|
( |
) |
Purchase of intangible assets |
|
|
( |
) |
|
|
|
|
|
|
|
|
|
|||
Disposal of property and equipment |
|
|
|
|
|
|
|
|
|
|
|
|
||||
Disposal of long-term investment |
|
|
|
|
|
|
|
|
|
|
|
|
||||
Purchase of short-term investments |
|
|
( |
) |
|
|
( |
) |
|
|
( |
) |
|
|
( |
) |
Proceeds from sale of short term investments |
|
|
|
|
|
|
|
|
|
|
|
|
||||
Purchase of gold |
|
|
|
|
|
|
|
|
( |
) |
|
|
( |
) |
||
Cash paid for long-term investments |
|
|
( |
) |
|
|
( |
) |
|
|
( |
) |
|
|
( |
) |
Cash received from long-term investments |
|
|
|
|
|
|
|
|
|
|
|
|
||||
Cash paid for loan originations |
|
|
( |
) |
|
|
( |
) |
|
|
( |
) |
|
|
( |
) |
Cash received from loan repayments |
|
|
|
|
|
|
|
|
|
|
|
|
||||
Acquisition of subsidiaries, net of cash acquired |
|
|
|
|
|
( |
) |
|
|
|
|
|
|
|||
Net cash (used in)/provided by investing activities |
|
|
( |
) |
|
|
|
|
|
|
|
|
|
|||
Cash flows from financing activities: |
|
|
|
|
|
|
|
|
|
|
|
|
||||
Proceeds from short-term borrowing |
|
|
|
|
|
|
|
|
|
|
|
|
||||
Repayment of short-term borrowing |
|
|
|
|
|
|
|
|
( |
) |
|
|
( |
) |
||
Proceeds from exercise of share options |
|
|
|
|
|
|
|
|
|
|
|
|
||||
Cash payment for repurchase of ordinary shares (Note 17) |
|
|
( |
) |
|
|
( |
) |
|
|
( |
) |
|
|
( |
) |
Net cash (used in)/provided by financing activities |
|
|
( |
) |
|
|
|
|
|
( |
) |
|
|
( |
) |
|
Effect of foreign exchange rate changes on cash and cash equivalents |
|
|
( |
) |
|
|
( |
) |
|
|
( |
) |
|
|
( |
) |
Net decrease in cash and cash equivalents and restricted cash |
|
|
( |
) |
|
|
( |
) |
|
|
( |
) |
|
|
( |
) |
Cash and cash equivalents and restricted cash at beginning of year |
|
|
|
|
|
|
|
|
|
|
|
|
||||
Cash and cash equivalents and restricted cash at end of year |
|
|
|
|
|
|
|
|
|
|
|
|
||||
Supplemental disclosures of cash flow information: |
|
|
|
|
|
|
|
|
|
|
|
|
||||
Cash paid for income taxes |
|
|
( |
) |
|
|
( |
) |
|
|
( |
) |
|
|
( |
) |
Cash paid for interest |
|
|
|
|
|
( |
) |
|
|
( |
) |
|
|
( |
) |
|
Supplemental schedule of non-cash investing and financing |
|
|
|
|
|
|
|
|
|
|
|
|
||||
Payable related to purchase of property and equipment |
|
|
|
|
|
|
|
|
|
|
|
|
||||
F-8
Table of Contents
The accompanying notes are an integral part of these consolidated financial statements.
F-9
Table of Contents
MOGU INC.
NOTES TO THE CONSOLIDATED FINANCIAL STATEMENTS
(All amounts in thousands, except for share and per share data)
1 ORGANIZATION AND PRINCIPAL ACTIVITIES
MOGU Inc. (formerly known as Meili Inc.) (the “Company”) was incorporated as an exempted company registered under the Companies Act (As Revised) of the Cayman Islands on June 9, 2011 with limited liability.
In June 2011, Meili Group Limited, formerly known as MOGU (HK) Limited, was established by the Company in Hong Kong. In November 2011, Meili Group Limited established a wholly-owned PRC subsidiary, Hangzhou Shiqu Information and Technology Co., Ltd. (“Hangzhou Shiqu”). In the same month, the Company through Hangzhou Shiqu entered into a series of contractual agreements with Hangzhou Juangua Network Co., Ltd. (“Hangzhou Juangua”), a variable interest entity (VIE), and its shareholders to obtain a controlling financial interest (as the primary beneficiary) of Hangzhou Juangua. Accordingly, this VIE is consolidated by the Company under US GAAP (ASC 810). The Company obtained voting interest control over Aimei Tech Holdings Limited (“Aimei”) and Meiliworks Limited (“Meiliworks”) through a series of transactions in January and February 2016, respectively. In August 2017, Hangzhou Shiqu, Beijing Meilishikong Network and Technology Co., Ltd. (“Beijing Meilishikong”), a VIE and the shareholders of Beijing Meilishikong entered into a series of contractual agreements, which contained terms substantially similar to the contractual agreements by and among Hangzhou Shiqu, Hangzhou Juangua and the shareholders of Hangzhou Juangua described above. Accordingly, Beijing Meilishikong is consolidated by the Company under US GAAP (ASC 810). In July 2021, Hangzhou Juangua obtained voting interest control over Hangzhou Ruisha Technology Co., Ltd. (“Ruisha Technology”) through a business acquisition transaction (Note 3). As a result, the Company controls Hangzhou Ruisha through Hangzhou Juangua. In December 2022, Aimei was dissolved.
The Company, through its subsidiaries, the consolidated VIEs and the VIE’s subsidiaries (collectively, the “Group”), operates online platform that primarily offers to its users a wide selection of fashion apparel and other products provided by third party merchants in the People’s Republic of China (“PRC”) through mobile apps, including flagship Mogujie app, mini-programs on Weixin, and Mogu.com, Mogujie.com and Meilishuo.com websites. The Group also provides online marketing, commission, financing, technology and other relevant services to merchants and users as well as technology services to brands owners.
The Group’s consolidated financial statements include the financial statements of the Company, its subsidiaries, the consolidated VIEs and the VIE’s subsidiaries.
As of March 31, 2023, the Company’s major subsidiaries, the consolidated VIEs and VIE’s subsidiary are as follows:
|
|
Equity interest |
|
Place and date of |
|
|
|
|
|
Subsidiaries: |
|
|
|
|
Meili Group Limited |
|
|
||
Hangzhou Shiqu |
|
|
|
|
Meilishuo (Beijing) Network Technology Co., Ltd. |
|
|
|
|
|
|
|
|
|
|
|
|
|
Place and date of |
Consolidated VIEs: |
|
|
|
|
Hangzhou Juangua |
|
|
|
|
Beijing Meilishikong Network and Technology Co., Ltd. |
|
|
|
|
|
|
|
|
|
|
|
|
|
Place and date of |
VIE’s subsidiary: |
|
|
|
|
Ruisha Technology |
|
|
|
F-10
Table of Contents
In order to comply with PRC regulatory requirements restricting foreign ownership of internet information services under value-added telecommunications services and certain other businesses in China, the Group operates an online platform that provides internet information services and engages in other foreign-ownership-restricted businesses through certain PRC domestic companies, whose equity interests are held by certain management members of the Group (“Nominee Shareholders”). The Group has entered into a series of contractual agreements with these PRC domestic companies and their respective Nominee Shareholders (“Contractual Agreements”). These Contractual Agreements cannot be terminated by the Nominee Shareholders or the PRC domestic companies. As a result of these Contractual Agreements, the Group has a financial controlling interest over these entities (which are considered to be VIEs) and accordingly as the primary beneficiary, consolidates each under US GAAP (ASC 810). Refer to Note 2(b) for the principles of consolidation.
The principal terms of the agreements entered into amongst the consolidated VIEs, their respective shareholders and the Group’s subsidiaries are further described below.
Loan Agreements
Pursuant to the relevant loan agreements, the Group’s relevant PRC subsidiaries made loans to the Nominee Shareholders for the sole purpose of making capital contributions to the consolidated VIEs by the Nominee Shareholders. The Nominee Shareholders can only repay the loans by the sale of all their equity interests in the consolidated VIEs to the Group’s relevant PRC subsidiaries or their designated person pursuant to the exclusive option agreements, and, to the extent permitted under PRC law, pay all of the proceeds from sale of such equity interests to the Group’s relevant PRC subsidiaries. In the event that the Nominee Shareholders sell their equity interests in the consolidated VIEs to the Group’s relevant PRC subsidiaries or their designated person at a price equal to or less than the principal amount of the loans, the loans will be interest free. If the price is higher than the principal amount of the loans, the excess amount will be deemed as interest on the loans paid to the Group’s relevant PRC subsidiaries. The term of the loans agreements are
On July 18, 2018, Hangzhou Shiqu and each of Mr. Qi Chen, Mr. Yibo Wei and Mr. Xuqiang Yue, each a shareholder of Hangzhou Juangua, entered into an amended and restated loan agreement in the principal amount of RMB
Exclusive Consultation and Service Agreements
Pursuant to the exclusive consultation and service agreements, the Group’s relevant PRC subsidiaries have the exclusive right to provide the consolidated VIEs with technical and consulting services. Without the Group’s relevant PRC subsidiaries’ prior written consent, the consolidated VIEs may not accept any services subject to these agreements from any third party. The consolidated VIEs agree to pay the Group’s relevant PRC subsidiaries a quarterly service fee at an amount that is equal to the consolidated VIEs’ revenue for the relevant quarter after deducting any applicable taxes, cost of revenues and retained earnings (which should be zero unless the Group’s relevant PRC subsidiaries otherwise agrees in writing) or an amount adjusted at the Group’s relevant PRC subsidiaries’ sole discretion for the relevant quarter, which should be paid within 10 business days after the consolidated VIEs confirms in writing the amount and breakdown of the service fee for the relevant quarter. The Group’s relevant PRC subsidiaries have the exclusive ownership of all the intellectual property rights created as a result of the performance of the agreements. To guarantee the consolidated VIEs’ performance of their obligations under the agreements, the Nominee Shareholders of the consolidated VIEs have pledged their entire equity interests in the consolidated VIEs to the Group’s relevant PRC subsidiaries pursuant to the equity interest pledge agreements. The agreements have a term of
Exclusive Purchase Option Agreements
Pursuant to the exclusive option agreements, each of the Nominee Shareholders of the consolidated VIEs has irrevocably granted the Group’s relevant PRC subsidiaries exclusive options to purchase all or part of their equity interests in the consolidated VIEs. The Group’s relevant PRC subsidiaries or their designated person may exercise such option at the lowest price permitted under applicable PRC law. The Nominee Shareholders of the consolidated VIEs covenant that, without the Group’s relevant PRC subsidiaries’ prior written consent, they will not, among other things, (i)create any pledge or encumbrance on their equity interests in the consolidated VIEs; (ii)transfer or otherwise dispose of their equity interests in the consolidated VIEs; (iii)change the consolidated VIEs’ registered capital; (iv)amend the consolidated VIEs’ articles of association in any material respect; (v)dispose of or cause the consolidated VIEs’ management to dispose of the consolidated VIEs’ material assets (except in the ordinary course of business); (vi)cause the consolidated VIEs to enter into transactions that are likely to have a material impact on its assets, liabilities, operations, shareholding structure or equity ownership in other entities; (vii)change the consolidated VIEs’ directors and supervisors; (viii)declare or distribute dividends; (ix)terminate, liquidate or dissolve the consolidated VIEs; or (x)allow the consolidated VIEs to extend or borrow loans, provide any form of guarantee, or assume any material obligations except in the ordinary course of business. In addition, the consolidated VIEs covenant that, without the Group’s relevant PRC subsidiaries’
F-11
Table of Contents
prior written consents, they will not, among other things, create or assist or allow their Nominee Shareholders to create, any pledge or encumbrance on their assets and equity interests, or transfer or otherwise dispose of their assets (except in the ordinary course of business). The exclusive option agreements will remain effective until the entire equity interests in the consolidated VIEs have been transferred to the Group’s relevant PRC subsidiaries or their designated person.
Shareholder Voting Proxy Agreements and Powers of Attorney
Pursuant to the shareholder voting proxy agreements, each of the Nominee Shareholders of the consolidated VIEs has executed a power of attorney, to irrevocably authorize an individual, as designated by the Group’s relevant PRC subsidiaries, to act as his attorney-in-fact to exercise all of his rights as a shareholder of the consolidated VIEs, including, but not limited to the right to convene and attend shareholders’ meetings, vote on any resolution that requires a shareholder vote, such as the appointment and removal of directors, supervisors and officers, as well as the sale, transfer and disposal of all or part of the equity interests owned by such shareholder. The powers of attorney will remain effective until the shareholder voting proxy agreements are terminated in accordance with the provisions of the agreements.
Equity Interest Pledge Agreements
Pursuant to the equity interest pledge agreements, the Nominee Shareholders of the consolidated VIEs have pledged
The following table sets forth the assets, liabilities, results of operations and changes in cash and cash equivalents and restricted cash of the consolidated VIEs and their subsidiaries taken as a whole, which are included in the Group’s consolidated financial statements with intercompany transactions eliminated:
|
|
As of March 31, |
|
|||||
|
|
2022 |
|
|
2023 |
|
||
|
|
RMB |
|
|
RMB |
|
||
Cash and cash equivalents |
|
|
|
|
|
|
||
Restricted cash |
|
|
|
|
|
|
||
Short-term investments |
|
|
|
|
|
|
||
Inventories, net |
|
|
|
|
|
|
||
Loan receivables, net |
|
|
|
|
|
|
||
Prepayments, receivables and other current assets |
|
|
|
|
|
|
||
Amounts due from non-VIE subsidiaries of the Company(1) |
|
|
|
|
|
|
||
Amounts due from related parties |
|
|
|
|
|
|
||
Property and equipment, net |
|
|
|
|
|
|
||
Intangible assets, net |
|
|
|
|
|
|
||
Right-of-use assets |
|
|
|
|
|
|
||
Goodwill |
|
|
|
|
|
|
||
Investments |
|
|
|
|
|
|
||
Other non-current assets |
|
|
|
|
|
|
||
Total assets |
|
|
|
|
|
|
||
F-12
Table of Contents
|
|
As of March 31, |
|
|||||
|
|
2022 |
|
|
2023 |
|
||
|
|
RMB |
|
|
RMB |
|
||
Amounts due to non-VIE subsidiaries of the Company(2) |
|
|
|
|
|
|
||
Accounts payable |
|
|
|
|
|
|
||
Salaries and welfare payable |
|
|
|
|
|
|
||
Advances from customers |
|
|
|
|
|
|
||
Taxes payable |
|
|
|
|
|
|
||
Amounts due to related parties |
|
|
|
|
|
|
||
Current portion of lease liabilities |
|
|
|
|
|
|
||
Accruals and other current liabilities |
|
|
|
|
|
|
||
Deferred tax liabilities |
|
|
|
|
|
|
||
Total liabilities |
|
|
|
|
|
|
||
Total shareholders’ deficit |
|
|
( |
) |
|
|
( |
) |
Note 1: The amount due from non-VIE subsidiaries of the Company as of March 31, 2022 and 2023 mainly represent the receivables of the VIEs due from the Company’s wholly-owned subsidiaries for treasury management purposes and service charges.
Note 2: The amount due to non-VIE subsidiaries of the Company as of March 31, 2022 and 2023 mainly represent the payables resulting from technical and consulting services fee charged by the Group’s relevant PRC subsidiaries to the VIEs in accordance with exclusive consultation and service agreements.
|
|
Year ended March 31, |
|
|||||||||
|
|
2021 |
|
|
2022 |
|
|
2023 |
|
|||
|
|
RMB |
|
|
RMB |
|
|
RMB |
|
|||
Third-party revenues |
|
|
|
|
|
|
|
|
|
|||
Inter-company revenues |
|
|
|
|
|
|
|
|
|
|||
Third-party costs and expenses |
|
|
( |
) |
|
|
( |
) |
|
|
( |
) |
Inter-company costs and expenses(3) |
|
|
( |
) |
|
|
( |
) |
|
|
( |
) |
Third-party other operating income |
|
|
|
|
|
|
|
|
|
|||
Inter-company other operating (loss)/income(4) |
|
|
|
|
|
( |
) |
|
|
|
||
Income from non-operations |
|
|
|
|
|
|
|
|
|
|||
Loss before income tax benefit |
|
|
( |
) |
|
|
( |
) |
|
|
( |
) |
Add: Income tax benefit |
|
|
|
|
|
|
|
|
|
|||
Net profit/(loss) |
|
|
|
|
|
( |
) |
|
|
( |
) |
|
|
|
Year ended March 31, |
|
|||||||||
|
|
2021 |
|
|
2022 |
|
|
2023 |
|
|||
|
|
RMB |
|
|
RMB |
|
|
RMB |
|
|||
Inter-company payments for service charges(5) |
|
|
( |
) |
|
|
( |
) |
|
|
( |
) |
Other operating activities with non-VIE subsidiaries(6) |
|
|
|
|
|
|
|
|
|
|||
Operating activities with external parties |
|
|
( |
) |
|
|
( |
) |
|
|
( |
) |
Net cash provided by operating activities |
|
|
|
|
|
|
|
|
|
|||
Net cash (used in)/provided by investing activities |
|
|
( |
) |
|
|
|
|
|
( |
) |
|
Net (decrease)/increase in cash and cash equivalents and restricted cash |
|
|
( |
) |
|
|
|
|
|
|
||
F-13
Table of Contents
Note 4: Inter-company other operating (loss)/income represents the write-off of the amounts among the Group’s non-VIE subsidiaries and the VIEs, all of which have been eliminated in the presentation of Consolidated Statements of Operations and Comprehensive Loss.
Note 5: Inter-company payments for service charges represents the cash paid by the VIEs to the Group’s relevant PRC subsidiaries for technical and consulting services charges in accordance with exclusive consultation and service agreements, all of which have been eliminated in the presentation of Consolidated Statements of Cash flows.
Note 6: Other operating activities with non-VIE subsidiaries included cash receipts for treasury management purposes and service fees charged by the VIEs to the Group’s non-VIE subsidiaries,all of which have been eliminated in the presentation of Consolidated Statements of Cash flows.
Under the Contractual Agreements with the consolidated VIEs, the Company has the power to direct activities of the consolidated VIEs and the VIEs’ subsidiaries through the Group’s relevant PRC subsidiaries, and can direct assets transferred out of the consolidated VIEs and the VIEs’ subsidiaries. Therefore, the Company considers that there is
The Group, under the advice of counsel, believes that the Group’s relevant PRC subsidiaries’ Contractual Arrangements with the consolidated VIEs and the Nominee Shareholders are in compliance with PRC laws and regulations, as applicable, and are legally binding and enforceable. However, uncertainties in the PRC legal system could limit the Company’s ability to enforce these contractual arrangements. Accordingly, the Company cannot be assured that the PRC government authorities will not ultimately take a view that is contrary to the Company’s belief and the opinion of its PRC legal counsel.
The Nominee Shareholders of the consolidated VIEs also own the majority of the voting shares of the Company. The enforceability, and therefore the benefits of the Contractual Agreements between the Company’s PRC subsidiaries and the consolidated VIEs depends on those individuals enforcing the contracts. There is a risk that the benefits of ownership between the Company and the consolidated VIEs may not be aligned in the future and they may fail to perform their contractual obligations. There would be a significant negative impact to the Company if these contracts were not enforced.
The Group’s operations depend on the consolidated VIEs to honor their Contractual Agreements with the Group and the Company’s ability to consolidate the VIEs also depends on the authorization by the Nominee Shareholders of the consolidated VIEs to exercise voting rights on all matters requiring shareholder approval in the consolidated VIEs. The Company believes that the agreements on authorization to exercise shareholder’s voting power are enforceable against each party thereto in accordance with their terms and applicable PRC laws or regulations currently in effect and the possibility that it will no longer be able to consolidate the VIEs as a result of the aforementioned risks and uncertainties is considered to be remote.
2 SUMMARY OF SIGNIFICANT ACCOUNTING POLICIES
The consolidated financial statements of the Group have been prepared in accordance with the accounting principles generally accepted in the United States of America (“U.S.GAAP”).
On March 18, 2022, the Company announced a change in the ratio of its American Depositary Shares (“ADSs”) to its Class A ordinary shares (the “ADS Ratio”), par value US$
Significant accounting policies followed by the Group in the preparation of the accompanying consolidated financial statements are summarized below.
The consolidated financial statements include the financial statements of the Company, its subsidiaries, the consolidated VIEs and VIEs’ subsidiaries for which the Company is the ultimate primary beneficiary in each instance.
F-14
Table of Contents
Subsidiaries are those entities in which the Company, directly or indirectly, controls more than one half of the voting power, or has the power to govern the financial and operating policies, to appoint or remove the majority of the members of the board of directors, or to cast a majority of votes at the meeting of directors.
A VIE is an entity in which the Company, or its subsidiaries, through Contractual Agreements, has the power to direct activities, bears the risks of, and enjoys the rewards normally associated with, ownership of the entity, and therefore the Company or its subsidiaries are the primary beneficiary of the entity.
All transactions and balances among the Company, its subsidiaries, the consolidated VIEs and VIEs’ subsidiaries have been eliminated upon consolidation.
The Company accounts for its business combinations using the acquisition method of accounting. Transaction costs directly attributable to the acquisition are expensed as incurred. Identifiable assets and liabilities acquired or assumed are measured separately at their fair values as of the acquisition date, irrespective of the extent of any non-controlling interests. The excess of (i)the total costs of acquisition, fair value of the non-controlling interests and acquisition date fair value of any previously held equity interest in the acquiree over (ii)the fair value of the identifiable net assets of the acquiree is recorded as goodwill. If the cost of acquisition is less than the fair value of the net assets of the subsidiary acquired, the difference is recognized directly in the Consolidated Statements of Operations and Comprehensive Loss. During the measurement period, which can be up to one year from the acquisition date, the Company may record adjustments to the assets acquired and liabilities assumed with the corresponding offset to goodwill. Upon the conclusion of the measurement period or final determination of the values of assets acquired or liabilities assumed, whichever comes first, any subsequent adjustments are recorded to the Consolidated Statements of Operations and Comprehensive Loss.
In a business combination achieved in stages, the Company re-measures the previously held equity interest in the acquiree immediately before obtaining control at its acquisition-date fair value and the re-measurement gain or loss, if any, is recognized in the Consolidated Statements of Operations and Comprehensive Loss.
When there is a change in ownership interests or a change in contractual arrangements that results in a loss of control of a subsidiary or consolidated VIE, the Company deconsolidates the subsidiary or consolidated VIE from the date control is lost. Any retained non-controlling investment in the former subsidiary or consolidated VIE is measured at fair value and is included in the calculation of the gain or loss upon deconsolidation of the subsidiary or consolidated VIE.
For the Company’s majority-owned subsidiaries, the consolidated VIEs and the VIEs’ subsidiaries, non-controlling interests are recognized to reflect the portion of their equity that is not attributable, directly or indirectly, to the Company as the controlling shareholder. Non-controlling interests are classified as a separate line item in the equity section of the Group’s Consolidated Balance Sheets and have been separately disclosed in the Group’s Consolidated Statements of Operations and Comprehensive Loss to distinguish the interests from that of the Company.
The preparation of the consolidated financial statements in conformity with U.S. GAAP requires management to make estimates and assumptions that affect the reported amounts of assets and liabilities, related disclosures of contingent liabilities at the balance sheet date, and the reported revenues and expenses during the reported period in the consolidated financial statements and accompanying notes. Significant accounting estimates are used for, but not limited to, fair value of available-for-sale debt securities, recoverability of receivables, assessment for impairment of long-lived assets, intangible assets and goodwill and useful lives of intangible assets and property and equipment. Actual results may differ materially from those estimates.
The Group’s reporting currency is Renminbi (“RMB”). The functional currency of the Group’s entities incorporated in Cayman Islands and Hong Kong, China (“HK”) is the United States dollars (“US$”). The Group’s PRC subsidiaries, consolidated VIEs and VIEs’ subsidiaries determined their functional currency to be RMB.
Transactions denominated in currencies other than the relevant functional currency are translated into the functional currency at the exchange rates quoted by authoritative banks prevailing at the dates of the transactions. Exchange gains and losses resulting from those foreign currency transactions denominated in a currency other than the functional currency are recorded as a component of Other income, net in the Consolidated Statements of Operations and Comprehensive Loss. Total foreign exchange gains/(losses) were a gain of RMB
F-15
Table of Contents
The financial statements of the Group entities that use US$ as functional currency are translated from the functional currency into RMB for preparation of the consolidated financial statements of the Group. Assets and liabilities denominated in foreign currencies are translated into RMB using the applicable exchange rates at the balance sheet date. Equity accounts other than earnings generated in current period are translated into RMB at the appropriate historical rates. Revenues, expenses, gains and losses are translated into RMB using the periodic average exchange rates. The resulting foreign currency translation adjustments are recorded in accumulated other comprehensive income/(loss) as a component of shareholders’ equity. Total foreign currency translation adjustments recorded in the Group’s other comprehensive (loss)/income were a loss of RMB
Translations of the Consolidated Balance Sheets, the Consolidated Statements of Operations and Comprehensive Loss and the Consolidated Statements of Cash Flows from RMB into US$ as of and for the year ended March 31, 2023 are solely for the convenience of the readers and were calculated at the rate of US$1.00=RMB
Financial instruments
Accounting guidance defines fair value as the price that would be received from selling an asset or paid to transfer a liability in an orderly transaction between market participants at the measurement date. When determining the fair value measurements for assets and liabilities measured at fair value, the Group considers the principal or most advantageous market in which it would transact and it considers assumptions that market participants would use when pricing the asset or liability.
Accounting guidance establishes a fair value hierarchy that requires an entity to maximize the use of observable inputs and minimize the use of unobservable inputs when measuring fair value. A financial instrument’s categorization within the fair value hierarchy is based upon the lowest level of input that is significant to the fair value measurement. Accounting guidance establishes three levels of inputs that may be used to measure fair value:
Accounting guidance also describes three main approaches to measuring the fair value of assets and liabilities: (1) market approach; (2) income approach and (3) cost approach. The market approach uses prices and other relevant information generated from market transactions involving identical or comparable assets or liabilities. The income approach uses valuation techniques to convert future cash flows to a single present value amount. The measurement is based on the value indicated by current market expectations about those future cash flows. The cost approach is based on the amount that would currently be required to replace an asset.
The Company’s financial instruments include cash and cash equivalents, restricted cash, short-term investments, loan receivables, other receivables, amounts due from related parties, operating lease liabilities, accounts payable, amounts due to related parties, accruals and other current liabilities and short-term borrowings. The carrying amounts of loan receivables, other receivables, accounts payable, accruals and other current liabilities and short-term borrowing approximate their fair value due to their relatively short maturity.
Cash and cash equivalents consist of cash on hand, deposits held by financial institutions as well as highly liquid investments, which have original maturities of three months or less and are readily convertible to known amount of cash.
Cash that is restricted as to withdrawal or for use or pledged as security is reported separately on the Consolidated Balance Sheets. The Group’s restricted cash mainly represents deposits held in designated bank accounts as security for payment
F-16
Table of Contents
processing. Restricted cash with an expected collection period within one year is classified as current assets in the Consolidated Balance Sheets. Restricted cash is included with cash and cash equivalents when reconciling the beginning-of-period and end-of-period total amounts shown on the Consolidated Statement of Cash Flows.
Short-term investments are comprised of (i) time deposits placed with banks with original maturities longer than three months but less than one year, (ii) investments in wealth management products issued by banks and other financial institutions, primarily with the pre-agreed fixed interest rate or variable interest rates and with original maturities within one year, and (iii) equity securities with readily determinable fair value. The time deposits and wealth management products are generally not permitted to be redeemed early or are subject to penalties for redemption prior to maturity. The short-term investments are stated at fair value. Changes in the fair value are reflected in the Consolidation Statement of Operations and Comprehensive Loss.
Loan receivables represent the funds extended by the Group to qualified merchants and users through its factoring arrangements. The loan periods generally range from
The Group considers many factors in assessing the collectability of its loan receivable, such as the age of the amounts due, the payment history, creditworthiness and financial conditions of the borrowers, to determine the allowance percentage of the overdue balances. The Group adjusts the allowance balance periodically when there are significant differences between estimated and actual bad debts. An allowance for doubtful accounts is recorded in the period in which a loss is determined probable.
If the loan receivable with allowance for doubtful accounts is subsequently collected, the previously recognized allowance for doubtful accounts is reversed. The amount of reversal is recognized in the Consolidated Statements of Operations and Comprehensive Loss.
Inventories, consisting of products available for sale, are stated at the lower of cost and net realizable value. Cost of inventory is determined using the weighted average cost method. Adjustments are recorded to write down the cost of inventory to the estimated net realizable value due to slow-moving merchandise and damaged goods, which is dependent upon factors such as historical and forecasted consumer demand, and promotional environment. The Group takes ownership, risks and rewards of the products purchased. Write downs recorded in the Consolidated Statements of Operations and Comprehensive Loss for the years ended March 31, 2021, 2022 and 2023 were immaterial.
Property and equipment are stated at cost less accumulated depreciation and impairment. Property and equipment are depreciated at rates sufficient to write off their costs less impairment and residual value, if any, over the estimated useful lives on a straight-line basis.
Electronic equipment |
|
|
Furniture and office equipment |
|
|
Computer software |
|
|
Vehicles |
|
|
Building |
|
|
Leasehold improvements |
|
Repairs and maintenance costs are charged to expense as incurred. Retirements, sales and disposals of assets are recorded by removing the costs, accumulated depreciation and impairment with any resulting gain or loss recognized in the Consolidated Statements of Operations and Comprehensive Loss.
Intangible assets purchased from third parties are initially recorded at cost. The Group performs a valuation of the identifiable intangible assets acquired in a business combination to determine the relative fair value to be assigned to each asset acquired. The intangible assets are amortized using the straight-line method or other method which reflects the pattern in which the asset’s economic benefits are consumed over the estimated economic useful lives of the assets.
F-17
Table of Contents
The estimated useful lives of intangible assets are as follows:
Domain name |
|
|
Trademarks |
|
|
Insurance agency license |
|
|
Broadcasting license |
|
|
Buyer and customer relationship |
|
|
Brand |
|
|
Technology |
|
|
Strategic business resources |
|
The Group recorded impairment charges for intangible assets of
Goodwill represents the excess of the purchase price over the fair value of the identifiable assets and liabilities acquired in a business combination.
Goodwill is not depreciated or amortized but is tested for impairment on an annual basis as of March 31, and in between annual tests when an event occurs or circumstances change that could indicate that the asset might be impaired. In accordance with the FASB guidance on “Testing of Goodwill for Impairment” a company first has the option to assess qualitative factors to determine whether it is more likely than not that the fair value of a reporting unit is less than its carrying amount. If the company decides, as a result of its qualitative assessment, that it is more likely than not that the fair value of a reporting unit is less than its carrying amount, the quantitative impairment test is mandatory. Otherwise, no further testing is required. The quantitative impairment test consists of a comparison of the fair value of each reporting unit with its carrying amount, including goodwill.
An impairment charge is recognized for the amount by which the carrying amount exceeds the reporting unit’s fair value. Application of a goodwill impairment test requires significant management judgment, including the identification of reporting units, assigning assets and liabilities to reporting units, assigning goodwill to reporting units, and determining the fair value of each reporting unit. The Company estimates the fair value of its reporting units using the income approach (discounted cash flows) methodology of valuation. The judgment in estimating the fair value of reporting units includes estimating future cash flows, determining appropriate discount rates and making other assumptions. Changes in these estimates and assumptions could materially affect the determination of fair value for each reporting unit. As of March 31, 2023, the Group had only
The Group’s investments include equity method investments and available-for-sale security investments.
The Group has investments in privately held companies. The Group applies the equity method of accounting to account for an equity investment, in common stock or in-substance common stock, over which it has significant influence but does not own a majority equity interest or otherwise control.
An investment in in-substance common stock is an investment in an entity that has risk and reward characteristics that are substantially similar to that entity’s common stock. The Group considers subordination, risks and rewards of ownership and obligation to transfer value when determining whether an investment in an entity is substantially similar to an investment in that entity’s common stock.
Under the equity method, the Group’s share of the post-acquisition profits or losses of the equity investee are recorded in share of results of equity investee in the Consolidated Statements of Operations and Comprehensive Loss. The excess of the carrying amount of the investment over the underlying equity in net assets of the equity investee represents goodwill and intangible assets acquired. When the Group’s share of losses in the equity investee equals or exceeds its interest in the equity investee, the Group does not recognize further losses, unless the Group has incurred obligations or made payments or guarantees on behalf of the equity investee. If the investee subsequently reports earnings the Group resumes applying the equity method by only recognizing such income to the extent it exceeds previously unrecognized cumulative losses,
Investments in debt securities are accounted for as available-for-sale debt security investments, and are carried at estimated fair value with the aggregate unrealized gains and losses related to these investments, net of taxes, reported through other comprehensive income. Realized gains or losses are charged to earnings during the period in which the gains or losses are realized. Gain or losses are realized when such investments are sold or when dividends are declared or payments are received or when other than temporarily impaired.
F-18
Table of Contents
Equity securities that have readily determinable fair values are measured at fair value, with changes in fair value reported through earnings.
Currently, the maturities for debt securities the Group held are longer than 12 months and the Company does not expect to convert securities to cash within one year.
The Group continually reviews its investments to determine whether a decline in fair value to below the carrying value is other-than-temporary. The primary factors the Group considers in its determination are the duration and severity of the decline in fair value; the financial condition, operating performance and the prospects of the equity investee; and other company specific information such as recent financing rounds. If the decline in fair value is deemed to be other-than-temporary, the carrying value of the investment is written down to fair value.
Long-lived assets are evaluated for impairment whenever events or changes in circumstances (such as a significant adverse change to market conditions that will impact the future use of the assets) indicate that the carrying value of an asset may not be fully recoverable or that the useful life is shorter than the Group had originally estimated. When these events occur, the Group evaluates the impairment for the long-lived assets by comparing the carrying value of the assets to an estimate of future undiscounted cash flows expected to be generated from the use of the assets and their eventual disposition. If the sum of the expected future undiscounted cash flows is less than the carrying value of the assets, the Group recognizes an impairment loss based on the excess of the carrying value of the assets over the fair value of the assets.
Borrowings are recognized initially at fair value, net of debt discounts or premiums, debt issuance costs and other incidental fees. Debt discounts or premiums, debt issuance costs and other incidental fees are recorded as a reduction of the proceeds received and the related accretion is recorded as interest expense in the Consolidated Statements of Operations and Comprehensive Loss over the estimated term of the facilities using the effective interest method. As of March 31, 2022, the Company had short-term borrowings from one financial institution of RMB
The Group adopted ASC Topic 606, “Revenue from Contracts with Customers” for all periods presented. Consistent with the criteria of Topic 606, the Group recognizes revenue to depict the transfer of promised goods or services to customers in an amount that reflects the consideration to which the entity expects to receive in exchange for those goods or services.
To achieve that core principle, the Group applies the five steps as defined under Topic 606. The Group assesses its revenue arrangements against specific criteria in order to determine if it is acting as principal or agent. Revenue arrangements with multiple performance obligations are divided into separate units of accounting. The Group allocates the transaction price to each performance obligation based on the relative standalone selling price of the goods or services provided. Revenue is recognized upon transfer of control of promised goods or services to a customer.
Revenue is recorded net of value-added-tax.
Revenue recognition policies for each type of revenue stream are analyzed as follows:
Commission revenues
The Group operates its online platform as a marketplace for merchants to sell their merchandise to the users and also provides integrated platform-wide services. The merchants can choose the marketplace service only or both of the marketplace service and integrated platform-wide services. When the transactions are completed on the Group’s platform, the Group charges merchants commissions at their respective agreed percentage of the amount of merchandise sold by merchants. The Group has determined that services to enable the successful merchandise transactions on the Group’s marketplace and integrated promotional related services are separate performance obligations. The merchandise transactions are deemed completed (with related commission revenue earned) upon users’ acceptance of merchandise. For the years ended March 31, 2022 and 2023, commission revenue related only to the obligation to enable successful merchandise transactions, and there was no commission revenue recognized in fiscal 2022 and 2023 related to integrated promotional related services. Commission revenue recognized in fiscal 2021 related to integrated promotional related services was immaterial. The Group applies the practical expedient that allocates the commission revenues for the integrated services to the respective day on which the Group has the right to invoice. The Group does not control the underlying merchandise provided by merchants before they are transferred to users, as the Group is not responsible for fulfilling the promise to provide the merchandise to users and has no inventory risk before the merchandise are transferred to the users or after the control is transferred to the users. In addition, the Group has no discretion in establishing prices
F-19
Table of Contents
of the merchandise provided by merchants. Revenues are recognized on a net basis by the Group as an agent to the extent of the commission the Group earns at the point of users’ acceptance of merchandise.
Commission fees are refundable if and when users return the merchandise to merchants and the refund is recognized as variable consideration. The Group determines the amount of consideration to which the Group expects to be entitled subject to constraint that it is probable that a significant reversal in the cumulative amount of revenue recognized will not occur when the uncertainty is resolved. The Group recognizes the amounts received for which the Group does not expect to be entitled as a refund liability when it transfers service to merchants as an agent. At the end of each reporting period, the Group updates its assessment of amounts for which it expects to be entitled in exchange for the transferred services and makes a corresponding change to the amount of commission revenue recognized.
Marketing services revenues
The Group provides marketing services to merchants and brand partners that help them promote their products in designated areas on the Group’s platform directly or via social network platforms over particular periods of time that will then divert users back to the Group’s platform. Such service revenues are charged at fixed prices or at prices established through the Group’s online auction system. In general, merchants and brand partners need to prepay for the marketing services. Revenue is recognized ratably over the period during which the content is displayed, or when the content or offerings are clicked or viewed, or when an underlying sales transaction is completed by a merchant.
Financing solutions revenues
Financing solutions include loans to users and merchants through factoring arrangements. The Group extends loans to users by making payments to merchants on behalf of users. In this manner, the Group purchases merchants’ receivables due from respective users without recourse and charges a service fee (which includes a financing component) to users based on the principal and repayment terms. The Group also extends loans to merchants by purchasing their accounts receivables from users with recourse and charges a service fee to merchants based on the principal. The Group records loan receivables when the cash is advanced to the users or merchants. The service fees are recognized over the term of loans.
Financing solutions also include the services to facilitate the financial institutions to provide loans to merchants and users through the Group’s online platform and services to manage repayments. The service fees are charged to the borrowers based on agreed rates of the principal and are allocated between facilitation service and repayment management service in the same transaction based on the relative standalone selling price of each. Revenue is recognized when the fund is drawn down by the borrowers for the facilitation service or over the financing period on a straight-line basis for the repayment management service.
Technology services revenues
The Group provides technology services to corporate customers who operate through the Group’s online platform and third-party platforms. Fees are fixed or charged as agreed percentages of the amount of the successful transactions of the customers. Revenue from technology services is recognized when the services are rendered, ratably over the period during which the services are provided, or upon the completion of successful transactions.
Other revenues
Other revenues are mainly comprised of the revenues from: (i) online direct sales whereby the Group sells its own merchandise products through its platform and recognizes the product sales revenue on a gross basis, (ii) promotion services that the Group provides to financial institutions, (iii) logistical services provided to merchants and users, and (iv) other services. Revenue is recognized when the services are rendered.
Remaining performance obligations
Revenue allocated to remaining performance obligations represents that portion of the overall transaction price that has been received (or for which the Group has an unconditional right to payment) allocated to performance obligations that the Group has not yet fulfilled, which is presented as deferred revenue that has not yet been recognized. As of March 31, 2023, remaining performance obligations represent advance payments received by the Group for future technology services provide to brand customers. The aggregate amount of the transaction price allocated to remaining performance obligations was RMB
In order to promote its online platform and attract more registered users, from time to time, the Group at its own discretion issues vouchers in various forms to users without any concurrent transactions in place or any substantive action needed from the recipient. These vouchers can be used in purchase of goods in a broad range of merchants as an immediate discount of their next purchase, some of which can only be used when the purchase amount exceeds pre-defined threshold. The Group settles with the
F-20
Table of Contents
merchants in cash for the vouchers used by the users. As the users are required to make future purchases of the merchants’ merchandises to redeem the vouchers, the Group recognizes the amounts of redeemed vouchers as marketing expenses when future purchases are made. During the years ended March 31, 2021, 2022 and 2023, the Group recorded marketing expenses related to the vouchers of RMB
Cost of revenue is comprised of primarily payroll costs including share-based compensation expenses, information technology related expenses, cost of inventory, payment handling costs, depreciation expenses, rental expenses, warehousing and logistic expenses and other costs.
Sales and marketing expenses are comprised primarily of promotion expenses, payroll costs including share-based compensation expenses, depreciation expenses and other daily expenses which are related to the sales and marketing departments.
Research and development expenses are expensed as incurred and primarily consist of staff costs including share-based compensation expenses, rental expenses and other expenses. The Company expenses all costs that are incurred in connection with the planning and implementation phases of development and costs that are associated with repair or maintenance of the existing websites and mobile applications or the development of software, mobile application and website content.
General and administrative expenses consist of staff costs including share-based compensation expenses and related expenses for employees involved in general corporate functions, including accounting, finance, tax, legal and human relations; and costs associated with use by these functions of facilities and equipment, such as depreciation expenses, rental and other general corporate related expenses.
Government grants represent cash subsidies received from the PRC government. Cash subsidies which have no conditions that need to be satisfied to fully realize the subsidies are recognized as other income when received. Total government grants received were RMB
On April 1, 2022, the Group adopted ASC 842. The Group elected the package of practical expedients permitted under the transition guidance within the new standard, which allowed the Group to carry forward the historical determination of contracts as leases, lease classification and not reassess initial direct costs for historical lease arrangements. Accordingly, previously reported financial statements, including footnote disclosures, have not been recast to reflect the application of the new standard to all comparative periods presented. The Group also elected the practical expedient of short-term lease exemption for operating leases with a term of
The Group determines if an arrangement is a lease at inception. The Group has
Upon the adoption of the new lease standard, the Company recognized operating lease assets of RMB
There was no impact to accumulated deficit at adoption.
F-21
Table of Contents
(aa) Share-based compensation
The Company grants restricted share units (“RSUs”) and share options of the Company to eligible employees, non-employee consultants and accounts for these share-based awards in accordance with ASC 718 Compensation — Stock Compensation and ASC 505-50 Equity-Based Payments to Non-Employees.
Employees’ share-based awards are measured at the grant date fair value of the awards and recognized as expenses a) immediately at grant date if no vesting conditions are required; or b) using the straight-line method, net of actual forfeitures, over the requisite service period, which is the vesting period.
All transactions in which goods or services are received in exchange for equity instruments are accounted for based on the fair value of the consideration received or the fair value of the equity instrument issued, whichever is more reliably measurable.
The Group adopted Accounting Standards Update (“ASU”) 2018-07, Compensation—Stock Compensation (Topic 718): Improvements to Non-employee Share-Based Payment Accounting for the year ended March 31, 2021. Upon the adoption of this guidance, the Company no longer re-measures equity-classified share-based awards granted to consultants or non-employees at each reporting date through the vesting date and the accounting for these share-based awards to consultants or non-employees and employees will be substantially aligned. The impact of the adoption is not material.
Before the Group’s IPO, the fair value of the RSUs was assessed using the income approach/discounted cash flow method, with a discount for lack of marketability given that the shares underlying the awards were not publicly traded at the time of grant. This assessment required complex and subjective judgments regarding the Company’s projected financial and operating results, its unique business risks, the liquidity of its ordinary shares and its operating history and prospects at the time the grants were made. After the IPO, the fair value of the RSUs is determined based on the quoted market price of ordinary shares on the grant date.
In addition, the binomial option-pricing model is used to measure the value of share options. The determination of the fair value of share options is affected by the fair value of the ordinary shares as well as assumptions regarding a number of complex and subjective variables, including the expected share price volatility, actual and projected employee and nonemployee share option exercise behavior, risk-free interest rates and expected dividend yield. Binomial option-pricing model incorporates the assumptions about grantees’ future exercise patterns. The fair value of these awards was determined with the assistance from an independent valuation firm using management’s estimates and assumptions.
The assumptions used in share-based compensation expense recognition represent management’s best estimates, but these estimates involve inherent uncertainties and application of management judgment. If factors change or different assumptions are used, the share-based compensation expenses could be materially different for any period. Moreover, the estimates of fair value of the awards are not intended to predict actual future events or the value that ultimately will be realized by grantees who receive share-based awards, and subsequent events are not indicative of the reasonableness of the original estimates of fair value made by the Company for accounting purposes.
In accordance with ASU 2016-09, the Group makes an entity-wide accounting policy election to account for forfeitures when they occur.
According to ASC 718, a change in any of the terms or conditions of RSUs or share options shall be accounted for as a modification of the plan. Therefore, the Group calculates incremental compensation cost of a modification as the excess of the fair value of the modified RSUs or share options over the fair value of the original RSUs or share options immediately before their terms are modified, measured based on the share price and other pertinent factors at the modification date. For vested RSUs or share options, the Group would recognize incremental compensation cost in the period the modification occurs and for unvested RSUs or share options, the Group would recognize, over the remaining requisite service period, the sum of the incremental compensation cost and the remaining unrecognized compensation cost for the original awards on the modification date.
(ab) Treasury stock
Effective September 1, 2022, the Board of Directors approved a new share repurchase program to repurchase shares up to US$
Each one of ADSs represents
These repurchased ADSs/Class A ordinary shares are recorded as treasury stock and are accounted for under the cost method. Under the cost method, when the Company’s shares are acquired for purposes other than retirement, the costs of the acquired stock are shown separately as a deduction from the total of capital stock. No repurchased shares of common stock have been retired. Up to March 31, 2023,
F-22
Table of Contents
US$
(ac) Employee benefits
Full time employees of the Group in the PRC participate in a government mandated defined contribution plan, pursuant to which certain pension benefits, medical care, employee housing fund and other welfare benefits are provided to the employees. Chinese labor regulations require that the PRC subsidiaries and VIEs of the Group make contributions to the government for these benefits based on certain percentages of the employees’ salaries, up to a maximum amount specified by the local government. The Group has no legal obligation for the benefits beyond the contributions made. The total amounts for such employee benefit expenses, which were expensed as incurred, were RMB
(ad) Taxation
Income taxes
Current income taxes are provided on the basis of income/(loss) for financial reporting purposes, adjusted for income and expense items which are not assessable or deductible for income tax purposes, in accordance with the regulations of the relevant tax jurisdictions. Deferred income taxes are provided using the liability method. Under this method, deferred income taxes are recognized for the tax consequences of temporary differences by applying enacted statutory rates applicable to future years to differences between the financial statement carrying amounts and the tax bases of existing assets and liabilities. The effect on deferred taxes of a change in tax rates is recognized in the Consolidated Statements of Operations and Comprehensive Loss in the period that the change is enacted in the respective jurisdiction. A valuation allowance is provided to reduce the amount of deferred tax assets if it is considered more likely than not that some portion of, or all of the deferred tax assets will not be realized. Deferred income taxes are classified as non-current in the Consolidated Balance Sheets.
Uncertain tax positions
The Group recognizes a tax benefit associated with an uncertain tax position when, in its judgment, it is more likely than not that the position will be sustained upon examination by a taxing authority. For a tax position that meets the-more-likely-than-not recognition threshold, the Group initially and subsequently measures the tax benefit as the largest amount that the Group judges to have a greater than 50% likelihood of being realized upon ultimate settlement with a taxing authority. The Group’s liability associated with unrecognized tax benefits is adjusted periodically due to changing circumstances, such as the progress of tax audits, case law developments and new or emerging legislation. Such adjustments are recognized in the period in which they are identified. The Group’s effective tax rate includes the net impact of changes in the liability for unrecognized tax benefits and subsequent adjustments as considered appropriate by management. The Group classifies interest and penalties recognized on the liability for unrecognized tax benefits as income tax expense. As of March 31, 2022, the Group did not have any significant unrecognized uncertain tax positions. As of March 31, 2023, the Group recognized a RMB
(ae) Statutory reserves
In accordance with China’s Company Laws, the Company’s consolidated VIEs and VIEs’ subsidiaries in PRC must make appropriations from their after-tax profit (as determined under the Accounting Standards for Business Enterprises as promulgated by the Ministry of Finance of the People’s Republic of China (“PRC GAAP”)) to non-distributable reserve funds including (i) statutory surplus fund and (ii) discretionary surplus fund. The appropriation to the statutory surplus fund must be at least
Pursuant to the laws applicable to China’s Foreign Investment Enterprises, the Company’s subsidiary that is a foreign investment enterprise in China have to make appropriations from their after-tax profit (as determined under PRC GAAP) to reserve funds including (i)general reserve fund, (ii)enterprise expansion fund and (iii)staff bonus and welfare fund. The appropriation to the general reserve fund must be at least 10% of the after tax profits calculated in accordance with PRC GAAP. Appropriation is not required if the general reserve fund has reached 50% of the registered capital of the respective company. Appropriations to the other two reserve funds are at the respective companies’ discretion.
The Group has made RMB
F-23
Table of Contents
(af) Comprehensive income/(loss)
Comprehensive income/(loss) is defined as the change in equity of a company during a period from transactions and other events and circumstances excluding those resulting from investments by shareholders and distributions to shareholders. The Group recognizes foreign currency translation adjustments as other comprehensive income/(loss) in the Consolidated Statements of Operations and Comprehensive Loss. As such adjustments relate to subsidiaries for which the functional currency is not RMB and which do not incur income tax obligations, there are no tax adjustments to arrive at other comprehensive income/(loss) on a net of tax basis.
(ag) Net income/(loss) per share
Basic net income/(loss) per share is computed by dividing net income/(loss) attributable to holders of ordinary shares, by the weighted average number of ordinary shares outstanding during the period using the two class method. Using the two class method, net income is allocated between ordinary shares and other participating securities (i.e. preferred shares) based on their participating rights. Net loss is not allocated to other participating securities if based on their contractual terms they are not obligated to share in the losses. Diluted net income/(loss) per share is calculated by dividing net income/(loss) attributable to ordinary shareholders, by the weighted average number of ordinary and dilutive ordinary equivalent shares outstanding during the period. Ordinary equivalent shares consist of ordinary shares issuable upon the exercise of outstanding share options using the treasury stock method. Ordinary equivalent shares are not included in the denominator of the diluted earnings per share calculation when inclusion of such shares would be anti-dilutive.
(ah) Segment reporting
Operating segments are defined as components of an enterprise engaging in businesses activities for which separate financial information is available that is regularly evaluated by the Group’s chief operating decision makers (“CODM”) in deciding how to allocate resources and assess performance. The Group’s CODM has been identified as the Chief Executive Officer. The Group’s CODM only reviews consolidated results. This resulted in only one operating and reportable segment in the Group.
The Group’s long-lived assets are substantially all located in the PRC and substantially all the Group’s revenues are derived from within the PRC, therefore, no geographical segments are presented.
(ai) Recent accounting pronouncements
In June 2016, the FASB amended guidance related to the impairment of financial instruments as part of ASU 2016-13, Financial Instruments—Credit Losses (Topic 326): Measurement of Credit Losses on Financial Instruments. This ASU relates to the measurement of credit losses for certain financial assets measured at amortized cost and available-for-sale debt securities.
The FASB further issued Accounting Standards Update No. 2018-19, “Codification Improvements to Topic 326, Financial Instruments—Credit Losses,” or ASU 2018-19, Accounting Standards Update No. 2019-04, “Codification Improvements to Topic 326, Financial Instruments—Credit Losses,” or ASU 2019-04, Accounting Standards Update No. 2019-05, “Financial Instruments-Credit Losses (Topic 326): Targeted Transition Relief,” or ASU 2019-05, Accounting Standards Update No. 2019-10, “Financial Instruments-Credit Losses (Topic 326): Effective Dates,” or ASU 2019-10 and Accounting Standards Update No. 2019-11, “Codification Improvements to Topic 326, Financial Instruments—Credit Losses,” or ASU 2019-11. The amendments in these ASUs provide clarifications to ASU 2016-13. For financial assets measured at amortized cost, ASU 2019-04 requires an entity to (1) estimate its lifetime expected credit losses upon recognition of the financial assets and establish an allowance to present the net amount expected to be collected, (2) recognize this allowance and changes in the allowance during subsequent periods through net income and (3) consider relevant information about past events, current conditions and reasonable and supportable forecasts in assessing the lifetime expected credit losses. For available-for-sale debt securities, ASU 2019-04 made several targeted amendments to the existing other-than-temporary impairment model, including (1) requiring disclosure of the allowance for credit losses, (2) allowing reversals of the previously recognized credit losses until the entity has the intent to sell, is more-likely-than-not required to sell the securities or the maturity of the securities, (3) limiting impairment to the difference between the amortized cost basis and fair value and (4) not allowing entities to consider the length of time that fair value has been less than amortized cost as a factor in evaluating whether a credit loss exists.
According to Accounting Standards Update No. 2019-10, “Financial Instruments-Credit Losses (Topic 326): Effective Dates,” for public business entities that are U.S. SEC filers, the amendments in this Update are effective for fiscal years beginning after December 15, 2019. For all other entities, the amendments in this Update are effective for fiscal years beginning after December 15, 2022, including interim periods within those fiscal years. As an emerging growth company, the Company elected to use the extended transition period for complying with any new or revised financial accounting standards. Therefore, the Group elected to adopt this new guidance for the year ended March 31, 2024, including interim periods in the year ended March 31, 2024. The ASU is currently not expected to have a material impact on the consolidated financial statements.
F-24
Table of Contents
In October 2021, the FASB issued ASU No. 2021-08, Business Combinations (Topic 805): Accounting for Contract Assets and Contract Liabilities from Contracts with Customers (ASU 2021-08), which clarifies that an acquirer of a business should recognize and measure contract assets and contract liabilities in a business combination in accordance with Topic 606, Revenue from Contracts with Customers. The new amendments are effective for us for fiscal years beginning after December 15, 2022, including interim periods within those fiscal years. The amendments should be applied prospectively to business combinations occurring on or after the effective date of the amendments, with early adoption permitted. The standard is effective for the Group for the year ended March 31, 2024 including interim periods in the year ended March 31, 2024. The ASU is currently not expected to have a material impact on the consolidated financial statements.
In June 2022, the FASB issued ASU 2022-03 Fair Value Measurement (Topic 820): Fair Value Measurement of Equity Securities Subject to Contractual Sale Restrictions. The update clarifies that a contractual restriction on the sale of an equity security is not considered part of the unit of account of the equity security and, therefore, is not considered in measuring fair value. The update also clarifies that an entity cannot, as a separate unit of account, recognize and measure a contractual sale restriction. The update also requires certain additional disclosures for equity securities subject to contractual sale restrictions. For public business entities, the amendments in this Update are effective for fiscal years beginning after December 15, 2023, and interim periods within those fiscal years. For all other entities, the amendments are effective for fiscal years beginning after December 15, 2024, and interim periods within those fiscal years. Early adoption is permitted for both interim and annual financial statements that have not yet been issued or made available for issuance. As an emerging growth company, the standard is effective for the Group for the year ended March 31, 2026 including interim periods in the year ended March 31, 2026. The Group is in the process of evaluating the impact of the new guidance on its consolidated financial statements.
3 SIGNIFICANT ACQUISITION TRANSACTIONS
Acquisition of Ruisha Technology
Ruisha Technology was engaged in providing corporate customers with one-stop brand and customized services for full-domain operations, including a wide variety of operational services, data platforms and other software services, as well as value-added services such as traffic placement. The Group previously held an approximately
The Company accounted for the step acquisition using the acquisition method of accounting. Identifiable assets and liabilities acquired or assumed are measured separately at their fair values as of the acquisition date, irrespective of the extent of any non-controlling interests. The excess of (i) the total costs of acquisition, fair value of the non-controlling interests and acquisition date fair value of any previously held equity interest in Ruisha Technology over (ii) the fair value of the identifiable net assets of Ruisha Technology is recorded as goodwill. The allocation of the purchase price as of the date of acquisition is summarized as follows:
|
|
Amount |
|
|
Estimated useful lives |
|
|
|
RMB |
|
|
|
|
Net assets acquired(1) |
|
|
|
|
|
|
Amortizable intangible assets |
|
|
|
|
|
|
Customer Relationship |
|
|
|
|
||
Technology |
|
|
|
|
||
Goodwill(2) |
|
|
|
|
|
|
Deferred tax liabilities |
|
|
( |
) |
|
|
Noncontrolling interests(3) |
|
|
( |
) |
|
|
|
|
|
|
|
|
|
|
|
Amount |
|
|
|
|
RMB |
|
|
Total purchase price is comprised of: |
|
|
|
|
-fair value of previously held equity interests |
|
|
|
|
-cash consideration |
|
|
|
|
Total |
|
|
|
|
F-25
Table of Contents
For the year ended March 31, 2022, the revenue of Ruisha Technology since the acquisition date included in the Consolidated Statement of Operations and Comprehensive Loss was RMB
F-26
Table of Contents
4 RISKS AND CONCENTRATION
Assets that potentially subject the Group to significant concentrations of credit risk primarily consist of cash and cash equivalents, restricted cash, short-term investments and loan receivables. The maximum exposure of such assets to credit risk is their carrying amounts as of the balance sheet dates. As of March 31, 2022 and 2023, all of the Group’s cash and cash equivalents, restricted cash, and short-term investments were held with major financial institutions located in the PRC and Hong Kong which management believes are of high credit quality. The Group believes that the risk of failure of any of these PRC banks is remote. Loan receivables are derived from loan to merchants and consumers in the PRC. The risk with respect to loan receivable is mitigated by credit evaluations the Group performs on merchants and consumers and its ongoing monitoring process of outstanding balances.
There were
The Group is exposed to foreign currency exchange rate risk, which mainly affects the monetary assets denominated in the currencies other than the functional currencies of the respective entities. For the years ended March 31, 2021, 2022 and 2023, such affected monetary assets primarily included cash and cash equivalents denominated in US$. In July 2005, the PRC government changed its decades-old policy of pegging the value of the RMB to the US$, and the RMB appreciated more than
Since 2020, due to the outbreak of COVID-19 in China and the implementation of relevant COVID-19 mandates, the Group’s businesses have experienced an overall disruption in its logistics and supply chain across industries. Starting in December 2022, most of the travel restrictions and quarantine requirements in China were lifted. Even though there have been certain noted improvements in the economic and operating conditions for the Group’s business since these restrictions were lifted, the impact of any continued improvement or COVID related factors (including the reinstatement of related health related restrictions) on the financial performance of the Group for the period beyond the year ended March 31, 2023 cannot be reasonably estimated at this time.
5 OTHER REVENUES
Other revenues by type of service is as follows:
|
|
For the year ended March 31, |
|
|||||||||
|
|
2021 |
|
|
2022 |
|
|
2023 |
|
|||
|
|
RMB |
|
|
RMB |
|
|
RMB |
|
|||
Online direct sales |
|
|
|
|
|
|
|
|
|
|||
Logistic services revenue |
|
|
|
|
|
|
|
|
|
|||
Promotion services revenue |
|
|
|
|
|
|
|
|
|
|||
Others |
|
|
|
|
|
|
|
|
|
|||
Total |
|
|
|
|
|
|
|
|
|
|||
Others were mainly comprised of other miscellaneous revenues, including customer service revenues, food and beverage revenue and other revenues, all of which were not material individually.
F-27
Table of Contents
6 OTHER INCOME, NET
|
|
For the year ended March 31, |
|
|||||||||
|
|
2021 |
|
|
2022 |
|
|
2023 |
|
|||
|
|
RMB |
|
|
RMB |
|
|
RMB |
|
|||
Government grants |
|
|
|
|
|
|
|
|
|
|||
Merchant penalty income(1) |
|
|
|
|
|
|
|
|
|
|||
Refund from depositary bank (Note 15(3)) |
|
|
|
|
|
|
|
|
|
|||
Exchange gains/(losses) |
|
|
|
|
|
|
|
|
( |
) |
||
Gains/(losses) on disposal of property and equipment |
|
|
|
|
|
( |
) |
|
|
|
||
Others |
|
|
|
|
|
|
|
|
|
|||
Total |
|
|
|
|
|
|
|
|
|
|||
(1)
7 FAIR VALUE MEASUREMENT
As of March 31, 2022 and 2023, the Group’s assets and liabilities that are measured or disclosed at fair value on a recurring basis in periods subsequent to their initial recognition are as follows:
|
|
|
|
|
Fair value measurement at reporting date using |
|
||||||||||
Description |
|
Fair value |
|
|
Quoted Prices in |
|
|
Significant |
|
|
Significant |
|
||||
|
|
RMB |
|
|
RMB |
|
|
RMB |
|
|
RMB |
|
||||
Assets: |
|
|
|
|
|
|
|
|
|
|
|
|
||||
Short-term investments |
|
|
|
|
|
|
|
|
|
|
|
|
||||
- wealth management products |
|
|
|
|
|
|
|
|
|
|
|
|
||||
- equity securities with readily determinable fair values |
|
|
|
|
|
|
|
|
|
|
|
|
||||
Available-for-sale debt securities |
|
|
|
|
|
|
|
|
|
|
|
|
||||
Total assets |
|
|
|
|
|
|
|
|
|
|
|
|
||||
|
|
|
|
|
Fair value measurement at reporting date using |
|
||||||||||
Description |
|
Fair value |
|
|
Quoted Prices in |
|
|
Significant |
|
|
Significant |
|
||||
|
|
RMB |
|
|
RMB |
|
|
RMB |
|
|
RMB |
|
||||
Assets: |
|
|
|
|
|
|
|
|
|
|
|
|
||||
Short-term investments |
|
|
|
|
|
|
|
|
|
|
|
|
||||
- wealth management products |
|
|
|
|
|
|
|
|
|
|
|
|
||||
- equity securities with readily determinable fair values |
|
|
|
|
|
|
|
|
|
|
|
|
||||
Available-for-sale debt securities |
|
|
|
|
|
|
|
|
|
|
|
|
||||
Total assets |
|
|
|
|
|
|
|
|
|
|
|
|
||||
When available, the Group uses quoted market prices to determine the fair value of an asset or liability. If quoted market prices are not available, the Group will measure fair value using valuation techniques that use, when possible, current market-based or independently sourced market parameters, such as interest rates and currency rates. Following is a description of the valuation techniques that the Group uses to measure the fair value of assets that the Group reports in its Consolidated Balance Sheets at fair value on a recurring basis.
F-28
Table of Contents
Short-term investments
Short-term investments held by the Group include wealth management products issued by banks and equity securities with readily determinable fair values. The Group values its investments in wealth management products in using model-derived valuations in which significant inputs are observable or can be derived principally from, or corroborated by, observable market data, and accordingly, the Group classifies the valuation techniques that use these inputs as Level 2. The Group values its investments in equity securities with readily determinable fair values using quoted market prices and classifies the valuation technique that use these inputs within Level 1.
Available-for-sale debt securities investments
The Group classifies its available-for-sales debt securities as Level 3 investments. The roll forward of major Level 3 investments are as following:
|
|
iSNOB Holdings Limited (“iSNOB”) |
|
|
Ruisha |
|
|
Huzan Inc. |
|
|
Xuanwei Limied |
|
|
Poppy Mobile Inc. |
|
|
Others |
|
|
Total |
|
|||||||
|
|
RMB |
|
|
RMB |
|
|
RMB |
|
|
RMB |
|
|
RMB |
|
|
RMB |
|
|
RMB |
|
|||||||
Fair value of Level 3 investments as at March 31, 2020 |
|
|
|
|
|
|
|
|
|
|
|
|
|
|
— |
|
|
|
|
|
|
|
||||||
Addition |
|
|
— |
|
|
|
— |
|
|
|
— |
|
|
|
|
|
|
|
|
|
|
|
|
|
||||
Disposal |
|
|
( |
) |
|
|
— |
|
|
|
— |
|
|
|
( |
) |
|
|
— |
|
|
|
— |
|
|
|
( |
) |
Impairment |
|
|
— |
|
|
|
— |
|
|
|
( |
) |
|
|
— |
|
|
|
— |
|
|
|
( |
) |
|
|
( |
) |
Effect of currency translation adjustment |
|
|
( |
) |
|
|
— |
|
|
|
( |
) |
|
|
— |
|
|
|
— |
|
|
|
— |
|
|
|
( |
) |
|
|
|
|
|
|
|
|
( |
) |
|
|
— |
|
|
|
— |
|
|
|
— |
|
|
|
|
||||
Fair value of Level 3 investments as at March 31, 2021 |
|
|
|
|
|
|
|
|
|
|
|
— |
|
|
|
— |
|
|
|
|
|
|
|
|||||
Addition |
|
|
— |
|
|
|
— |
|
|
|
— |
|
|
|
— |
|
|
|
|
|
|
|
|
|
|
|||
Disposal(1) |
|
|
— |
|
|
|
( |
) |
|
|
— |
|
|
|
— |
|
|
|
— |
|
|
|
( |
) |
|
|
( |
) |
Impairment |
|
|
— |
|
|
|
— |
|
|
|
( |
) |
|
|
— |
|
|
|
— |
|
|
|
( |
) |
|
|
( |
) |
Effect of currency translation adjustment |
|
|
( |
) |
|
|
— |
|
|
|
( |
) |
|
|
— |
|
|
|
( |
) |
|
|
— |
|
|
|
( |
) |
The change in fair value of the investments |
|
|
— |
|
|
|
( |
) |
|
|
— |
|
|
|
— |
|
|
|
— |
|
|
|
( |
) |
|
|
( |
) |
Fair value of Level 3 investments as at March 31, 2022 |
|
|
|
|
|
— |
|
|
|
— |
|
|
|
— |
|
|
|
|
|
|
|
|
|
|
||||
Addition |
|
|
— |
|
|
|
— |
|
|
|
— |
|
|
|
— |
|
|
|
— |
|
|
|
|
|
|
|
||
Impairment |
|
|
— |
|
|
|
— |
|
|
|
— |
|
|
|
— |
|
|
|
( |
) |
|
|
( |
) |
|
|
( |
) |
Effect of currency translation adjustment |
|
|
|
|
|
— |
|
|
|
— |
|
|
|
— |
|
|
|
|
|
|
|
|
|
|
||||
The change in fair value of the investments |
|
|
|
|
|
— |
|
|
|
— |
|
|
|
— |
|
|
|
— |
|
|
|
( |
) |
|
|
( |
) |
|
Fair value of Level 3 investments as at March 31, 2023 |
|
|
|
|
|
— |
|
|
|
— |
|
|
|
— |
|
|
|
— |
|
|
|
|
|
|
|
|||
The Company determines the fair value of its investments by using the market approach.
As for the market approach, the determination of the fair value was based on estimates, judgments and information of other comparable public companies as well as observable price changes based on the recent transactions of the securities, or similar securities that the Company holds.
|
|
For the years ended March 31, |
|
|||||||||
|
|
2021 |
|
|
2022 |
|
|
2023 |
|
|||
Lack of marketability discount |
|
|
% |
|
|
% |
|
|
% |
|||
Risk-free rate |
|
|
% |
|
|
|
|
|||||
Expected volatility |
|
|
% |
|
|
|
|
|||||
Revenue multiple |
|
|
|
|
|
|
|
|||||
Net profit multiple |
|
|
|
|
|
|
|
|
|
|||
F-29
Table of Contents
8 LOAN RECEIVABLES
|
|
As of March 31, |
|
|||||
|
|
2022 |
|
|
2023 |
|
||
|
|
RMB |
|
|
RMB |
|
||
Loan receivables - principal |
|
|
|
|
|
|
||
- service fee |
|
|
|
|
|
|
||
Allowance for doubtful accounts |
|
|
( |
) |
|
|
( |
) |
Loan receivables, net |
|
|
|
|
|
|
||
Allowance for doubtful accounts movement
|
|
For the year ended |
|
|||||||||
|
|
2021 |
|
|
2022 |
|
|
2023 |
|
|||
|
|
RMB |
|
|
RMB |
|
|
RMB |
|
|||
Balance at beginning of year |
|
|
( |
) |
|
|
( |
) |
|
|
( |
) |
Additions |
|
|
( |
) |
|
|
— |
|
|
|
( |
) |
Reversals |
|
|
— |
|
|
|
|
|
|
— |
|
|
Balance at end of year |
|
|
( |
) |
|
|
( |
) |
|
|
( |
) |
9 OTHER ASSETS
The other assets consist of the following:
|
|
As of March 31, |
|
|||||
|
|
2022 |
|
|
2023 |
|
||
|
|
RMB |
|
|
RMB |
|
||
Prepayments,receivables and other current assets |
|
|
|
|
|
|
||
VAT receivables |
|
|
|
|
|
|
||
Receivables of technology service |
|
|
|
|
|
|
||
Receivables from third-party payment service providers(1) |
|
|
|
|
|
|
||
Other prepaid expenses |
|
|
|
|
|
|
||
Deposits |
|
|
|
|
|
|
||
Employee loans and advances |
|
|
|
|
|
|
||
Interest receivable |
|
|
|
|
|
|
||
Receivables of financing facilitation service |
|
|
|
|
|
|
||
Prepaid promotion fees |
|
|
|
|
|
|
||
Others |
|
|
|
|
|
|
||
Less: Allowance for doubtful accounts |
|
|
( |
) |
|
|
( |
) |
Total prepayments, receivables and other current assets |
|
|
|
|
|
|
||
|
|
|
|
|
|
|
||
Other non-current assets |
|
|
|
|
|
|
||
Gold(2) |
|
|
|
|
|
|
||
Prepayment for maintenance expenditure |
|
|
|
|
|
|
||
Long-term deposit |
|
|
|
|
|
|
||
Prepayment for office building(3) |
|
|
|
|
|
|
||
Total non-current assets |
|
|
|
|
|
|
||
F-30
Table of Contents
The movement of allowance for doubtful accounts is analyzed as follows:
|
|
For the year ended |
|
|||||||||
|
|
2021 |
|
|
2022 |
|
|
2023 |
|
|||
|
|
RMB |
|
|
RMB |
|
|
RMB |
|
|||
Balance at beginning of year |
|
|
( |
) |
|
|
( |
) |
|
|
( |
) |
Additions |
|
|
( |
) |
|
|
( |
) |
|
|
( |
) |
Write-offs |
|
|
— |
|
|
|
|
|
|
|
||
Balance at end of year |
|
|
( |
) |
|
|
( |
) |
|
|
( |
) |
10 INVESTMENTS
The Company’s long-term investments consist of the following:
|
|
As of March 31, |
|
|||||
|
|
2022 |
|
|
2023 |
|
||
|
|
RMB |
|
|
RMB |
|
||
Available-for-sale debt securities |
|
|
|
|
|
|
||
iSNOB |
|
|
|
|
|
|
||
Poppy |
|
|
|
|
|
|
||
Others |
|
|
|
|
|
|
||
|
|
|
|
|
|
|
||
Equity method investments |
|
|
|
|
|
|
||
Jiaxing Neixiangyoupan Equity investment Fund Partnership |
|
|
|
|
|
|
||
Others |
|
|
|
|
|
|
||
|
|
|
|
|
|
|
||
Total |
|
|
|
|
|
|
||
Available-for-sale debt securities
The following table summarizes, by major security type, the Company’s available-for-sale debt securities as of March 31, 2022 and 2023:
|
|
As of March 31, |
|
|||||
|
|
2022 |
|
|
2023 |
|
||
|
|
RMB |
|
|
RMB |
|
||
Cost |
|
|
|
|
|
|
||
Unrealized gains, including foreign exchange adjustment |
|
|
|
|
|
|
||
Fair Value |
|
|
|
|
|
|
||
iSNOB
Upon the closing of the latest financing of iSNOB in May 2018, the Company held
In October 2020, the Company entered into a share repurchase agreement with iSNOB, pursuant to which, iSNOB repurchased
F-31
Table of Contents
Consolidated Statements of Operations and Comprehensive loss. The gain also included the recycled accumulated unrealized gains of RMB
As of March 31, 2021, the Company remeasured its remaining investment in iSNOB at a fair value of RMB
As of March 31, 2022, the Company remeasured its remaining investment in iSNOB and believed that there was
As of March 31, 2023, the Company remeasured its remaining investment in iSNOB at a fair value of RMB
Ruisha Technology
In July 2019, the Group purchased a
Huzan
As of March 31, 2021, the Company classified its equity interest in Huzan as an available-for-sale debt investment which is measured at its fair value with the changes in fair value booked in other comprehensive income as the redeemable shares of Huzan held by the Company are considered not in substance common stock. With the assistance of an independent appraiser, the Company remeasured the investment in Huzan at a fair value of RMB
In March 2022, Huzan decided to terminate its operation and was under liquidation thereafter. In connection with the business winding-up of Huzan, the Company assessed the recoverability of its investment and as a result of its assessment, the Company wrote down the carrying value of its investment of RMB
Xuanwei
In March 2020, the Company purchased a
In March 2021, the Company disposed of all the equity interest it held in Xuanwei to Tencent Group, the Company’s shareholder, at a total cash consideration of US$
F-32
Table of Contents
Poppy
In September 2021, the Company purchased a
For the year ended March 31, 2023, the actual operating results of Poppy were significantly weaker than expected. The Company assessed the recoverability of its investment and as a result of its assessment, the Company wrote down the carrying value of its investment of RMB
Equity method investments
Investment in Neixiangyoupan
In December 2019, the Group entered into a partnership agreement with Neixiangyoupan to subscribe for the shares of Neixiangyoupan as a Limited Partner (“LP”) and made the first capital injection in May 2020. As of March 31, 2022 and 2023, RMB
The Group's equity method investments are not considered individually material or in the aggregate to meet the necessary reporting threshold under Rule 4-08(g) of Regulation S-X.
11 PROPERTY AND EQUIPMENT, NET
Property and equipment consist of the following:
|
|
As of March 31, |
|
|||||
|
|
2022 |
|
|
2023 |
|
||
|
|
RMB |
|
|
RMB |
|
||
Building |
|
|
|
|
|
|
||
Leasehold improvements |
|
|
|
|
|
|
||
Electronic equipment |
|
|
|
|
|
|
||
Furniture and office equipment |
|
|
|
|
|
|
||
Vehicles |
|
|
|
|
|
|
||
Computer softwares |
|
|
|
|
|
|
||
Subtotal |
|
|
|
|
|
|
||
Less: accumulated depreciation and amortization |
|
|
( |
) |
|
|
( |
) |
Property, equipment and software, net |
|
|
|
|
|
|
||
Depreciation and amortization expense recognized for the years ended March 31, 2021, 2022 and 2023 were RMB
F-33
Table of Contents
12 INTANGIBLE ASSETS, NET
The following table summarizes the Group’s intangible assets, net:
|
|
As of March 31, 2022 |
|
|||||||||||||
|
|
Gross |
|
|
Accumulated |
|
|
Accumulated |
|
|
Net carrying |
|
||||
|
|
RMB |
|
|
RMB |
|
|
RMB |
|
|
RMB |
|
||||
Domain name |
|
|
|
|
|
( |
) |
|
|
( |
) |
|
|
|
||
Trademarks |
|
|
|
|
|
( |
) |
|
|
|
|
|
|
|||
Insurance agency license |
|
|
|
|
|
( |
) |
|
|
( |
) |
|
|
|
||
Broadcasting license |
|
|
|
|
|
( |
) |
|
|
( |
) |
|
|
|
||
Buyer and customer relationship |
|
|
|
|
|
( |
) |
|
|
|
|
|
|
|||
Brand(1) |
|
|
|
|
|
( |
) |
|
|
( |
) |
|
|
|
||
Strategic business resources(2) |
|
|
|
|
|
( |
) |
|
|
|
|
|
|
|||
Technology |
|
|
|
|
|
( |
) |
|
|
( |
) |
|
|
|
||
Total |
|
|
|
|
|
( |
) |
|
|
( |
) |
|
|
|
||
|
|
As of March 31, 2023 |
|
|||||||||||||
|
|
Gross |
|
|
Accumulated |
|
|
Accumulated |
|
|
Net carrying |
|
||||
|
|
RMB |
|
|
RMB |
|
|
RMB |
|
|
RMB |
|
||||
Domain name |
|
|
|
|
|
( |
) |
|
|
( |
) |
|
|
|
||
Trademarks |
|
|
|
|
|
( |
) |
|
|
|
|
|
|
|||
Insurance agency license |
|
|
|
|
|
( |
) |
|
|
( |
) |
|
|
|
||
Broadcasting license |
|
|
|
|
|
( |
) |
|
|
( |
) |
|
|
|
||
Buyer and customer relationship |
|
|
|
|
|
( |
) |
|
|
( |
) |
|
|
|
||
Brand(1) |
|
|
|
|
|
( |
) |
|
|
( |
) |
|
|
|
||
Strategic business resources(2) |
|
|
|
|
|
( |
) |
|
|
|
|
|
|
|||
Technology |
|
|
|
|
|
( |
) |
|
|
( |
) |
|
|
|
||
Total |
|
|
|
|
|
( |
) |
|
|
( |
) |
|
|
|
||
Amortization expense for intangible assets were RMB
As of March 31, 2022, the Group determined that there were
F-34
Table of Contents
During the year ended March 31, 2022, the Company recognized intangible assets amounting to RMB
As of March 31, 2023, considering the weaker-than-expected operating results of the Company, the Group concluded that there were indicators that the carrying value of certain intangible assets may not be fully recoverable. Given that the aggregated undiscounted cash flows of the brands and the customized services business asset group were lower than the carrying amount of this asset group, the Group concluded that it was necessary to determine the fair value of the asset group for purposes of determining a potential impairment charge. The determined fair value of the asset group resulted in an impairment charge of RMB
As of March 31, 2023, amortization expense related to the intangible assets for future periods are estimated to be as follows:
For the years ended March 31, |
|
RMB |
|
|
2024 |
|
|
|
|
2025 |
|
|
|
|
2026 |
|
|
|
|
2027 |
|
|
|
|
2028 |
|
|
|
|
Thereafter |
|
|
|
|
|
|
|
|
|
F-35
Table of Contents
13 Leases
The Group has operating leases primarily for office facilities which have lease terms varying from to
Total lease costs for the year ended March 31, 2023 was RMB
Supplemental cash flow information related to leases were as follows:
|
|
For the year ended March 31, |
|
|
|
|
2023 |
|
|
|
|
RMB |
|
|
Cash paid for the rentals included in the lease liabilities |
|
|
|
|
Right-of-use assets obtained in exchange for lease liabilities |
|
|
|
|
As of March 31, 2023, supplemental consolidated balance sheet information related to leases were as follows:
|
|
As of March 31, |
|
|
|
|
2023 |
|
|
|
|
RMB |
|
|
Right-of-use assets |
|
|
|
|
Current portion of lease liabilities |
|
|
|
|
Non-current lease liabilities |
|
|
|
|
Lease term and discount rates were as follows:
|
|
As of March 31, |
|
|
|
|
2023 |
|
|
|
|
RMB |
|
|
Weighted-average remaining lease term |
|
|
|
|
Operating leases |
|
|
||
Weighted-average discount rate |
|
|
|
|
Operating leases |
|
|
% |
|
|
|
As of March 31, |
|
|
|
|
2023 |
|
|
|
|
RMB |
|
|
Maturities of lease liabilities were as follows: |
|
|
|
|
2024 |
|
|
|
|
2025 |
|
|
|
|
Total undiscounted lease payments |
|
|
|
|
Less: imputed interest |
|
|
( |
) |
Total present value of lease liabilities |
|
|
|
|
As of March 31, 2022, future minimum payments under non-cancellable operating leases for offices consist of the following:
|
|
As of March 31, |
|
|
|
|
2022 |
|
|
For the year ended March 31, |
|
RMB |
|
|
2023 |
|
|
|
|
2024 |
|
|
|
|
2025 |
|
|
|
|
Total |
|
|
|
|
F-36
Table of Contents
Amounts are based on ASC 840, Leases that were superseded upon the Group’s adoption of ASC 842, Leases on April 1, 2022. Under ASC 840, the rental expenses were RMB
14 GOODWILL
The changes in the carrying amount of goodwill were as follows:
|
|
LVB focused online |
|
|
Brands and customized services |
|
|
Total |
|
|||
|
|
RMB |
|
|
RMB |
|
|
RMB |
|
|||
Balance as of March 31, and 2021 |
|
|
|
|
|
|
|
|
|
|||
Goodwill |
|
|
|
|
|
— |
|
|
|
|
||
Accumulated impairment loss |
|
|
( |
) |
|
|
— |
|
|
|
( |
) |
|
|
|
|
|
|
— |
|
|
|
|
||
Transaction during the year |
|
|
|
|
|
|
|
|
|
|||
Addition (Note (a)) |
|
|
— |
|
|
|
|
|
|
|
||
Impairment recognized during the year ended March 31, 2022 (Note (b)) |
|
|
( |
) |
|
|
|
|
|
( |
) |
|
Balance as of March 31, 2022 |
|
|
|
|
|
|
|
|
|
|||
Goodwill |
|
|
|
|
|
|
|
|
|
|||
Accumulated impairment loss |
|
|
( |
) |
|
|
|
|
|
( |
) |
|
|
|
|
|
|
|
|
|
|
|
|||
Transaction during the year |
|
|
|
|
|
|
|
|
|
|||
Impairment recognized during the year ended March 31, 2023 (Note (b)) |
|
|
|
|
|
( |
) |
|
|
( |
) |
|
Balance as of March 31, 2023 |
|
|
|
|
|
|
|
|
|
|||
Goodwill |
|
|
|
|
|
|
|
|
|
|||
Accumulated impairment loss |
|
|
( |
) |
|
|
( |
) |
|
|
( |
) |
|
|
|
|
|
|
|
|
|
|
|||
The Group performs an impairment test on its goodwill on an annual basis, and in between annual tests when an event occurs or circumstances change that could indicate that the goodwill might be impaired.
The Group adopted ASU No. 2017-04 which simplified the test for goodwill impairment by eliminating the second step of the impairment test. Following the new guidance, an impairment charge shall be recognized for the amount by which the carrying amount exceeds the reporting unit’s fair value.
As of March 31, 2021, as the market capitalization of the Company was below its carrying value, the Group estimated the fair value of the LVB focused online business reporting unit in using the income approach methodology of valuation where significant judgments and estimates were applied, including the forecasts of future operating results, discount rates, and expected future growth rates with the consideration of the recent market environment. Based on the result of annual impairment testing, the fair value of the LVB focused online business reporting unit exceeded its carrying amount. As a result, there was no additional impairment of goodwill as of March 31, 2021. In addition, management has further analyzed and concluded that difference between the fair value of the reporting unit and the Company’s market capitalization is mainly attributable to the control premiums that are not reflected in its quoted market price of the Company.
Upon consummation of the acquisition of Ruisha Technology in July 2021, the Group has two reporting units, including the LVB focused online business reporting unit and brands and the customized services business reporting unit. For the six months ended September 30, 2021, and as a result of weaker-than-expected operating results of the Group due to the continuously heightened competitive environment as well as ongoing market capitalization (compared with net book value) considerations, management concluded the existence of triggering events which required the Group to perform an interim goodwill impairment test of the LVB focused online business reporting unit as of September 30, 2021.
F-37
Table of Contents
When performing the interim goodwill impairment test, the Group estimated the fair value of the LVB focused online business reporting unit using the income approach methodology of valuation where significant judgments and estimates were applied, including the forecasts of future operating results, discount rates, and expected future growth rates with the consideration of the recent market environment. As a result of this test, management determined that all remaining goodwill related to the LVB focused online business reporting unit (RMB
As of March 31, 2022, the Group performed an annual goodwill impairment test on the Group’s brands and customized services business reporting unit. To determine the fair value of the brands and customized services business reporting unit, the Company used the income approach methodology of valuation where significant judgments and estimates were applied, including the forecasts of future operating results, discount rates, and expected future growth rates with the consideration of the recent market environment. Based on the result of annual impairment testing, the fair value of the brands and customized services business reporting unit exceeded its carrying amount. As a result, there was no additional impairment of goodwill as of March 31, 2022.
As of March 31, 2023, as a result of the completion of the integration of Ruisha Technology’s business operation into the Group’s core business, the Group concluded that there was only one reporting unit as defined in ASC 350-20-35-34. As of March 31, 2023, the Group performed the annual impairment test on the goodwill by comparing its market capitalization (the Group only has one reporting unit which includes all of the assets of the Group) as of March 31, 2023 with the carrying amount of its net assets. Given the prolonged period of deficits in market price, also taking into consideration of its continuously weaker-than-expected performance, the Group provided full impairment charge of RMB
15 ACCRUALS AND OTHER LIABILITIES
|
|
As of March 31, |
|
|||||
|
|
2022 |
|
|
2023 |
|
||
|
|
RMB |
|
|
RMB |
|
||
Accrued liabilities and other current liabilities |
|
|
|
|
|
|
||
Deposits from merchants (1) |
|
|
|
|
|
|
||
Receipts under custody (2) |
|
|
|
|
|
|
||
Payables for purchases of office building |
|
|
|
|
|
|
||
Accrued expenses |
|
|
|
|
|
|
||
Accrued advertisement expenses |
|
|
|
|
|
|
||
Other payables |
|
|
|
|
|
|
||
|
|
|
|
|
|
|
||
Non-current |
|
|
|
|
|
|
||
Initial reimbursement payment from depositary bank (3) |
|
|
|
|
|
|
||
|
|
|
|
|
|
|
||
16 TAXATION
During the years presented, the Group is subject to statutory VAT rate of
The Group is also subject to cultural undertaking development fees at the rate of
F-38
Table of Contents
The Group is also subject to urban construction tax at the rate of
Composition of income tax (expenses)/benefits
|
|
For the year ended March 31, |
|
|||||||||
|
|
2021 |
|
|
2022 |
|
|
2023 |
|
|||
|
|
RMB |
|
|
RMB |
|
|
RMB |
|
|||
Current income tax expense |
|
|
( |
) |
|
|
( |
) |
|
|
( |
) |
Deferred income tax benefit |
|
|
|
|
|
|
|
|
|
|||
|
|
|
( |
) |
|
|
|
|
|
|
||
Cayman Islands (“Cayman”)
Under the current tax laws of the Cayman Islands, the Company is not subject to tax on income or capital gains. In addition, upon payments of dividends by the Company to its shareholders,
Hong Kong
Under the current Hong Kong Inland Revenue Ordinance, the Company’s subsidiaries incorporated in Hong Kong are subject to a two-tiered profits tax rates regime. Under the two-tiered profits tax rates regime, the first HK$2 million of profits of the qualifying group entity will be taxed at
PRC
On March 16, 2007, the National People’s Congress of PRC enacted a new Corporate Income Tax Law (“new CIT Law”), under which Foreign Investment Enterprises (“FIEs”) and domestic companies would be subject to corporate income tax at a uniform rate of
On November 8, 2013, Hangzhou Shiqu and Hangzhou Juangua were entitled to be “Software Enterprises”. According to the new CIT Law and relevant regulations, starting from the first profit-making year, such entities could enjoy a tax holiday of
On November 30, 2018, Hangzhou Juandou obtained its HNTE certificate with a valid period from 2018 to 2021 with a preferential tax rate of
On December 16, 2021, Lishuijuanfu Network and Technology Co., Ltd. (“Lishui Juanfu”) and Ruisha Technology obtained their respective HNTE certificate with a valid period of
Tax holidays had no immediate tax impact as there is
Effective from January 1, 2018, Hangzhou Shiqu, Hangzhou Juangua and Hangzhou Juandou are allowed to carry forward the annual net operating loss incurred for the year of 2013 onwards for
According to relevant laws and regulations promulgated by the State Administration of Tax of the PRC effective from 2008 onwards, enterprises engaging in research and development activities are entitled to claim
F-39
Table of Contents
(‘Super Deduction’). The additional deduction of
The Group’s other PRC subsidiaries, consolidated VIEs and VIEs’ subsidiaries are subject to the statutory income tax rate of
PRC withholding tax on dividends
The New CIT Law provides that an enterprise established under the laws of a foreign country or region but whose “de facto management body” is located in the PRC be treated as a resident enterprise for PRC tax purposes and consequently be subject to the PRC income tax at the rate of
The CIT Law also imposes a withholding income tax of
To the extent that the consolidated VIEs and the VIEs’ subsidiaries have undistributed earnings, the Company will accrue appropriate expected tax associated with repatriation of such undistributed earnings. As of March 31, 2022 and 2023, the Company did not record any withholding tax on the retained earnings of its subsidiaries, the consolidated VIEs and the VIEs’ subsidiaries in the PRC as they were still in accumulated deficit position.
The components of loss before tax are as follows:
|
|
For the year ended March 31, |
|
|||||||||
|
|
2021 |
|
|
2022 |
|
|
2023 |
|
|||
|
|
RMB |
|
|
RMB |
|
|
RMB |
|
|||
Loss before tax |
|
|
|
|
|
|
|
|
|
|||
Loss from PRC entities |
|
|
( |
) |
|
|
( |
) |
|
|
( |
) |
Loss from Cayman Islands and Hong Kong entities |
|
|
( |
) |
|
|
( |
) |
|
|
( |
) |
Total loss before tax |
|
|
( |
) |
|
|
( |
) |
|
|
( |
) |
|
|
For the year ended March 31, |
|
|||||||||
|
|
2021 |
|
|
2022 |
|
|
2023 |
|
|||
|
|
RMB |
|
|
RMB |
|
|
RMB |
|
|||
Income tax (expense)/benefit |
|
|
|
|
|
|
|
|
|
|||
Current income tax expense |
|
|
( |
) |
|
|
( |
) |
|
|
( |
) |
Deferred tax benefit |
|
|
|
|
|
|
|
|
|
|||
Total income tax (expense)/benefit |
|
|
( |
) |
|
|
|
|
|
|
||
Reconciliation of the differences between statutory tax rate and the effective tax rate
Reconciliation of the differences between the PRC statutory tax rate of 25% and the Group’s effective tax rate is as follows:
|
|
For the year ended March 31, |
|
|||||||||
|
|
2021 |
|
|
2022 |
|
|
2023 |
|
|||
PRC Statutory tax rate |
|
|
% |
|
|
% |
|
|
% |
|||
Difference in EIT rates of certain subsidiaries |
|
|
( |
%) |
|
|
( |
%) |
|
|
( |
%) |
Permanent book – tax difference |
|
|
( |
%) |
|
|
( |
%) |
|
|
( |
%) |
Additional deduction for research and development expenditures |
|
|
% |
|
|
% |
|
|
% |
|||
Effect of change on tax rate |
|
|
% |
|
|
% |
|
|
( |
)% |
||
Changes in valuation allowance |
|
|
( |
%) |
|
|
% |
|
|
% |
||
Effective tax rate |
|
|
( |
%) |
|
|
% |
|
|
% |
||
F-40
Table of Contents
The effect of change on tax rate is due to the expiration of HNTE certification of Hangzhou Juangua.
Expenses not deductible for tax purposes and non-taxable income primarily represent share-based compensation expense and entertainment expense.
Deferred taxes were measured using the enacted tax rates for the periods in which they are expected to be reversed. Significant components of the Group’s deferred tax assets are as follows:
|
|
As of March 31, |
|
|||||
|
|
2022 |
|
|
2023 |
|
||
|
|
RMB |
|
|
RMB |
|
||
Deferred tax assets: |
|
|
|
|
|
|
||
- Tax losses carried forward |
|
|
|
|
|
|
||
- Carryforwards of un-deducted advertising expenses |
|
|
|
|
|
|
||
- Accruals and other liabilities |
|
|
|
|
|
|
||
- Provision for doubtful accounts |
|
|
|
|
|
|
||
- Impairment of available-for-sale investments |
|
|
|
|
|
|
||
Less: valuation allowance |
|
|
( |
) |
|
|
( |
) |
Net deferred tax assets |
|
|
|
|
|
|
||
Deferred tax liabilities: |
|
|
|
|
|
|
||
- Recognition of intangible assets arisen from business |
|
|
|
|
|
|
||
Net deferred tax liabilities |
|
|
|
|
|
|
||
As of March 31, 2023, the Group had net operating loss carry forwards of approximately RMB
As of March 31, 2023, net operating loss carry forwards from PRC entities will expire as follows:
At December 31, |
|
RMB |
|
|
2023 |
|
|
|
|
2024 |
|
|
|
|
2025 |
|
|
|
|
2026 |
|
|
|
|
2027 |
|
|
|
|
Thereafter |
|
|
|
|
|
|
|
|
|
A valuation allowance is provided against deferred tax assets when the Group determines that it is more likely than not that the deferred tax assets will not be utilized in the future. In making such determination, the Group evaluates a variety of factors including the Group’s operating history, accumulated deficit, existence of taxable temporary differences and reversal periods.
Movement of valuation allowance
|
|
For the year ended March 31, |
|
|||||||||
|
|
2021 |
|
|
2022 |
|
|
2023 |
|
|||
|
|
RMB |
|
|
RMB |
|
|
RMB |
|
|||
Balance at beginning of the period |
|
|
|
|
|
|
|
|
|
|||
Addition |
|
|
|
|
|
|
|
|
|
|||
Effect of change on tax rate |
|
|
|
|
|
|
|
|
|
|||
Written off for expiration of net operating losses |
|
|
( |
) |
|
|
( |
) |
|
|
( |
) |
Utilization of previously unrecognized tax loss and |
|
|
( |
) |
|
|
( |
) |
|
|
( |
) |
Balance at end of the period |
|
|
|
|
|
|
|
|
|
|||
F-41
Table of Contents
Uncertain tax positions
As of March 31, 2022, the Group did not record any reserves for uncertain tax positions.
For the year ended March 31, 2023, and as a result of information obtained through an ongoing tax examination regarding one of the Company’s PRC subsidiaries for the period from January 1, 2019 to December 31, 2021, the Group updated its estimate of the realizable benefit of an uncertain tax position that had originally been expected to be fully sustained through examination. As a result, a reserve related to an uncertain tax position of RMB
In general, the PRC tax authorities have up to five years to review a company’s tax filings. Accordingly, tax filings of the Company’s PRC subsidiaries and VIEs for tax years 2018 through 2022 remain subject to the review by the relevant PRC tax authorities.
17 ORDINARY SHARES
Prior to May 24, 2013, each ordinary share had a par value of US$0.001. On May 24, 2013, the Board of Directors of the Company passed the resolution that each issued and unissued share of the authorized share capital of the Company, with a par value of US$0.001 each, be subdivided into
Immediately prior to the consummation of the IPO, the authorized share capital of the Company is US$
On December 10, 2018, the Company consummated its IPO on the New York Stock Exchange with a total
Subsequently on December 18, 2018, over-allotment option were fully exercised and the Company issued additional
As of March 31, 2019, the Company had
Effective September 1, 2022, the Board of Directors approved an new share repurchase program to repurchase shares up to US$
The share repurchases may be made from time to time in the open market at prevailing market prices, in privately negotiated transactions, in block trades and/or through other legally permissible means, depending on market conditions and in accordance with applicable rules and regulations. The Company’s board of directors will review the share repurchase program periodically and may authorize adjustment of its terms and size. The Company expects to fund repurchases made under this program from its existing funds.
These repurchased class A ordinary shares were recorded as treasury stock and were accounted for under the cost method. Under the cost method, when the Company’s shares are acquired for purposes other than retirement, the costs of the acquired stock will be shown separately as a deduction from the total of capital stock. No repurchased shares of common stock have been retired. For the year ended March 31, 2021,
As of March 31, 2022 and 2023, the Company had
The shareholders agreement provides that for so long as Tencent and its affiliates, the principal shareholders hold no less than
F-42
Table of Contents
The Company has a dual class voting structure under which all of the ordinary shares held by the founders are designated as Class B Ordinary Shares and all of the other ordinary shares are designated as Class A Ordinary Shares. Class A and Class B Ordinary Shares have the same rights except for voting and conversion rights. Both of the Class A and Class B Ordinary Shares were entitled to
18 SHARE BASED COMPENSATION
(a) Global Share Plan
On December 9, 2011, the Company’s Board of Directors approved the establishment of Global Share Plan that provides for granting options to eligible directors, employees and etc. (collectively, the “Grantees”) to acquire ordinary shares of the Company at an exercise price as determined by the Board at the time of grant. According to the latest Amended and Restated Global Share Plan, the Board of Directors accumulatively authorized and reserved
Since adoption of the Global Share Plan, the Company granted RSUs and options to the Grantees. All RSUs and options granted have a contractual term of
The Company accounts for share based compensation costs on a straight-line basis over the requisite service period for the award based on the fair value on their respective grant dates.
Valuation of stock options
The Group uses the Binominal option pricing model to estimate the fair value of stock options. The Group estimates the risk free rate based on the yield to maturity of U.S. treasury bonds denominated in US$ at the option valuation date. The exercise multiple is estimated as the ratio of fair value of underlying shares over the exercise price as at the time the option is exercised, based on a consideration of empirical studies on the actual exercise behavior of employees. Expected term is the contract life of the option. The expected volatility at the date of grant date and each option valuation date was estimated based on the historical stock prices of comparable companies. The Group has never declared or paid any cash dividends on its capital stock, and the Group does not anticipate any dividend payments in the foreseeable future. There were
Summary of option activities under the Global Share Plan
The following table sets forth the summary of option activities under the Company’s Global Share Plan:
|
|
Number of |
|
|
Weighted |
|
|
Weighted Average |
|
|
Aggregate |
|
||||
|
|
|
|
|
(US$) |
|
|
(In years) |
|
|
(US$) |
|
||||
Outstanding as of April 1, 2020 |
|
|
|
|
|
|
|
|
|
|
|
|
||||
Exercised |
|
|
( |
) |
|
|
|
|
|
|
|
|
|
|||
Forfeited or cancelled (post-vesting) |
|
|
( |
) |
|
|
|
|
|
|
|
|
|
|||
Outstanding as of March 31, 2021 |
|
|
|
|
|
|
|
|
|
|
|
|
||||
Forfeited or cancelled (post-vesting) |
|
|
( |
) |
|
|
|
|
|
|
|
|
|
|||
Outstanding as of March 31, 2022 |
|
|
|
|
|
|
|
|
|
|
|
|
||||
Expired |
|
|
( |
) |
|
|
|
|
|
|
|
|
|
|||
Forfeited or cancelled (post-vesting) |
|
|
( |
) |
|
|
|
|
|
|
|
|
|
|||
Outstanding as of March 31, 2023 |
|
|
|
|
|
|
|
|
|
|
|
|||||
Vested and expected to vest as of March 31, 2023 |
|
|
|
|
|
|
|
|
|
|
||||||
Exercisable as of March 31, 2023 |
|
|
|
|
|
|
|
|
|
|
||||||
The aggregate intrinsic value is calculated as the difference between the exercise price of the underlying awards and the estimated fair value of the underlying stock at each reporting date.
F-43
Table of Contents
The Company recognized share-based compensation expenses of RMB
As of March 31, 2022 and 2023, there was
(b) Service-based RSUs
A summary of activities of the service-based RSUs for the years ended March 31, 2021, 2022 and 2023 is presented below:
|
|
Number of RSUs |
|
|
Weighted-Average |
|
||
|
|
|
|
|
US$ |
|
||
Unvested at March 31, 2020 |
|
|
|
|
|
|
||
Granted |
|
|
|
|
|
|
||
Vested |
|
|
( |
) |
|
|
|
|
Forfeited |
|
|
( |
) |
|
|
|
|
Unvested at March 31, 2021 |
|
|
|
|
|
|
||
Granted |
|
|
|
|
|
|
||
Vested |
|
|
( |
) |
|
|
|
|
Forfeited |
|
|
( |
) |
|
|
|
|
Unvested at March 31, 2022 |
|
|
|
|
|
|
||
Granted |
|
|
|
|
|
|
||
Vested |
|
|
( |
) |
|
|
|
|
Forfeited |
|
|
( |
) |
|
|
|
|
Unvested at March 31, 2023 |
|
|
|
|
|
|
||
For the years ended March 31, 2021, 2022 and 2023, total share-based compensation expenses recognized by the Group for the service-based RSUs granted were RMB
As of March 31, 2022 and 2023, there were RMB
The total fair value and intrinsic value of RSUs vested was RMB
19 RELATED PARTY TRANSACTIONS AND BALANCES
Parties are considered to be related if one party has the ability, directly or indirectly, to control the other party or exercise significant influence over the other party in making financial and operational decisions. Parties are also considered to be related if they are subject to common control or common significant influence. Related parties may be individuals or corporate entities.
The following entities are considered to be related parties to the Group:
Name of related parties |
Relationship with the Group |
|
|
Tencent Group |
Shareholder of the Group |
The Group had the following transactions with the major related parties:
|
|
For the year ended |
|
|||||||||
|
|
2021 |
|
|
2022 |
|
|
2023 |
|
|||
|
|
RMB |
|
|
RMB |
|
|
RMB |
|
|||
Cost of revenue: |
|
|
|
|
|
|
|
|
|
|||
Cloud technology services from Tencent Group |
|
|
|
|
|
|
|
|
|
|||
Payment processing fees to Tencent Group |
|
|
|
|
|
|
|
|
|
|||
Total |
|
|
|
|
|
|
|
|
|
|||
F-44
Table of Contents
The Group had the following balances with the major related parties:
|
|
As of March 31, |
|
|||||
|
|
2022 |
|
|
2023 |
|
||
|
|
RMB |
|
|
RMB |
|
||
Due from Tencent Group |
|
|
|
|
|
|
||
Due to Tencent Group |
|
|
( |
) |
|
|
( |
) |
All balances with the related parties as of March 31, 2022 and 2023 were unsecured, interest free.
All balances with the related parties as of March 31,2022 and 2023 had no fixed terms for repayment except for the balance due from Tencent Group of RMB
20 LOSS PER SHARE
Basic loss per share and diluted loss per share have been calculated in accordance with ASC 260 on computation of earnings per share for the years ended March 31, 2021, 2022 and 2023 as follows:
|
|
Year ended March 31, |
|
|||||||||
|
|
2021 |
|
|
2022 |
|
|
2023 |
|
|||
|
|
RMB |
|
|
RMB |
|
|
RMB |
|
|||
Numerator: |
|
|
|
|
|
|
|
|
|
|||
Net loss attributable to ordinary shareholders-Basic and Diluted |
|
|
( |
) |
|
|
( |
) |
|
|
( |
) |
Denominator: |
|
|
|
|
|
|
|
|
|
|||
Weighted average number of ordinary shares-Basic and Diluted |
|
|
|
|
|
|
|
|
|
|||
Basic and diluted loss per share |
|
|
( |
) |
|
|
( |
) |
|
|
( |
) |
Basic loss per share is computed using the weighted average number of ordinary shares outstanding during the period. Diluted loss per share is computed using the weighted average number of ordinary shares and dilutive ordinary share equivalents outstanding during the period.
The following ordinary share equivalents were excluded from the computation of diluted net loss per share for the periods presented to eliminate any anti-dilutive effect:
|
|
Year ended March 31, |
|
|||||||||
|
|
2021 |
|
|
2022 |
|
|
2023 |
|
|||
Share options and RSUs |
|
|
|
|
|
|
|
|
|
|||
21 RESTRICTED NET ASSETS
Pursuant to laws applicable to entities incorporated in the PRC, the Group’s subsidiaries in the PRC must make appropriations from after-tax profit to non-distributable reserve funds. These reserve funds include one or more of the following: (i) a general reserve, (ii) an enterprise expansion fund and (iii) a staff bonus and welfare fund. Subject to certain cumulative limits, the general reserve fund requires an annual appropriation of
In addition, due to restrictions on the distribution of share capital from the Group’s PRC subsidiaries and also as a result of these entities’ unreserved accumulated losses, total restrictions placed on the distribution of the Group’s PRC subsidiaries’ net assets were RMB
22 COMMITMENTS AND CONTINGENCIES
F-45
Table of Contents
The Group has entered into non-cancellable operating leases covering various facilities. See Note 13 for additional details on the Group’s operating lease commitments.
There is
The Group is subject to legal proceedings and regulatory actions in the ordinary course of business. The results of such proceedings cannot be predicted with certainty, but the Group does not anticipate that the final outcome arising out of any such matter will have a material adverse effect on our consolidated financial position, cash flows or results of operations on an individual basis or in the aggregate. As of March 31, 2023, the Group is not a party to any material legal or administrative proceedings.
The Group accounts for loss contingencies if both of the following conditions are met: a) Information available before the financial statements are issued or are available to be issued indicates that it is probable that an asset had been impaired or a liability had been incurred at the date of the financial statements; and b) The amount of loss can be reasonably estimated. As of March 31, 2023, the Group did
23 PARENT COMPANY ONLY CONDENSED FINANCIAL INFORMATION
The Company performed a test on the restricted net assets of consolidated subsidiaries, VIEs and VIEs’ subsidiaries in accordance with SEC Regulation S-X Rule 4-08 (e) (3), “General Notes to Financial Statements” and concluded that it was applicable for the Company to disclose the financial information for the parent company only as the restricted net assets of consolidated subsidiaries exceed
The Company did not have significant capital and other commitments, or guarantees as of March 31, 2023.
CONDENSED BALANCE SHEETS
|
|
As of March 31, |
|
|||||||||
|
|
2022 |
|
|
2023 |
|
||||||
|
|
RMB |
|
|
RMB |
|
|
US$ |
|
|||
Cash and cash equivalents |
|
|
|
|
|
|
|
|
|
|||
Prepayments, receivables and other current assets |
|
|
|
|
|
|
|
|
|
|||
Amounts due from related parties |
|
|
|
|
|
|
|
|
|
|||
Total current assets |
|
|
|
|
|
|
|
|
|
|||
Non-current assets: |
|
|
|
|
|
|
|
|
|
|||
Intangible assets, net |
|
|
|
|
|
|
|
|
|
|||
Amounts due from subsidiaries |
|
|
|
|
|
|
|
|
|
|||
Investments in other investees |
|
|
|
|
|
|
|
|
|
|||
Total non-current assets |
|
|
|
|
|
|
|
|
|
|||
Total assets |
|
|
|
|
|
|
|
|
|
|||
LIABILITIES AND SHAREHOLDERS’ EQUITY |
|
|
|
|
|
|
|
|
|
|||
Current liabilities: |
|
|
|
|
|
|
|
|
|
|||
Amounts due to subsidiaries |
|
|
|
|
|
|
|
|
|
|||
Taxes payable |
|
|
|
|
|
|
|
|
|
|||
Accruals and other current liabilities |
|
|
|
|
|
|
|
|
|
|||
Total current liabilities |
|
|
|
|
|
|
|
|
|
|||
Non-current liabilities: |
|
|
|
|
|
|
|
|
|
|||
Investment deficit of subsidiaries |
|
|
|
|
|
|
|
|
|
|||
Deferred tax liabilities |
|
|
|
|
|
|
|
|
|
|||
Other non-current liabilities |
|
|
|
|
|
|
|
|
|
|||
Total non-current liabilities |
|
|
|
|
|
|
|
|
|
|||
Total liabilities |
|
|
|
|
|
|
|
|
|
|||
F-46
Table of Contents
|
|
As of March 31, |
|
|||||||||
|
|
2022 |
|
|
2023 |
|
||||||
|
|
RMB |
|
|
RMB |
|
|
US$ |
|
|||
SHAREHOLDERS’ EQUITY |
|
|
|
|
|
|
|
|
|
|||
Class A ordinary shares par value; |
|
|
|
|
|
|
|
|
|
|||
Class B ordinary shares par value; |
|
|
|
|
|
|
|
|
|
|||
Treasury stock par value; |
|
|
( |
) |
|
|
( |
) |
|
|
( |
) |
Additional paid-in capital |
|
|
|
|
|
|
|
|
|
|||
Statutory reserves |
|
|
|
|
|
|
|
|
|
|||
Accumulated other comprehensive income |
|
|
|
|
|
|
|
|
|
|||
Accumulated deficit |
|
|
( |
) |
|
|
( |
) |
|
|
( |
) |
Total MOGU Inc. shareholders’ equity |
|
|
|
|
|
|
|
|
|
|||
Total liabilities and shareholders’ equity |
|
|
|
|
|
|
|
|
|
|||
CONDENSED STATEMENTS OF OPERATIONS AND COMPREHENSIVE LOSS
|
|
For the year ended March 31, |
|
|||||||||||||
|
|
2021 |
|
|
2022 |
|
|
2023 |
|
|||||||
|
|
RMB |
|
|
RMB |
|
|
RMB |
|
|
US$ |
|
||||
General and administrative expenses |
|
|
( |
) |
|
|
( |
) |
|
|
( |
) |
|
|
( |
) |
Amortization of intangible assets |
|
|
( |
) |
|
|
( |
) |
|
|
( |
) |
|
|
( |
) |
Other income, net |
|
|
|
|
|
|
|
|
( |
) |
|
|
( |
) |
||
Loss from operations |
|
|
( |
) |
|
|
( |
) |
|
|
( |
) |
|
|
( |
) |
Interest income |
|
|
|
|
|
|
|
|
|
|
|
|
||||
Loss from subsidiaries, VIEs and VIEs’ subsidiaries |
|
|
( |
) |
|
|
( |
) |
|
|
( |
) |
|
|
( |
) |
(Loss)/gain from investments, net |
|
|
|
|
|
( |
) |
|
|
( |
) |
|
|
( |
) |
|
Loss before income tax and share of results of equity investee |
|
|
( |
) |
|
|
( |
) |
|
|
( |
) |
|
|
( |
) |
Income tax expenses |
|
|
( |
) |
|
|
|
|
|
|
|
|
|
|||
Share of results of equity investee |
|
|
|
|
|
|
|
|
|
|
|
|
||||
Net loss |
|
|
( |
) |
|
|
( |
) |
|
|
( |
) |
|
|
( |
) |
Net loss attributable to MOGU Inc., |
|
|
( |
) |
|
|
( |
) |
|
|
( |
) |
|
|
( |
) |
Net Loss |
|
|
( |
) |
|
|
( |
) |
|
|
( |
) |
|
|
( |
) |
Other comprehensive income/(loss): |
|
|
|
|
|
|
|
|
|
|
|
|
||||
Foreign currency translation adjustments, net of |
|
|
( |
) |
|
|
( |
) |
|
|
|
|
|
|
||
Share of other comprehensive (loss)/income of subsidiaries, VIEs and VIEs’ subsidiaries, net of tax |
|
|
|
|
|
( |
) |
|
|
( |
) |
|
|
( |
) |
|
Unrealized securities holding gains/(losses), net of tax |
|
|
( |
) |
|
|
|
|
|
|
|
|
|
|||
Total other comprehensive income/(loss) |
|
|
( |
) |
|
|
( |
) |
|
|
|
|
|
|
||
Total comprehensive loss |
|
|
( |
) |
|
|
( |
) |
|
|
( |
) |
|
|
( |
) |
F-47
Table of Contents
CONDENSED STATEMENTS OF CASH FLOWS
|
|
For the year ended March 31, |
|
|||||||||||||
|
|
2021 |
|
|
2022 |
|
|
2023 |
|
|||||||
|
|
RMB |
|
|
RMB |
|
|
RMB |
|
|
US$ |
|
||||
Net cash provided by/(used in) operating activities |
|
|
|
|
|
( |
) |
|
|
( |
) |
|
|
( |
) |
|
Net cash provided by investing activities |
|
|
|
|
|
|
|
|
|
|
|
|
||||
Net cash used in financing activities |
|
|
( |
) |
|
|
( |
) |
|
|
( |
) |
|
|
( |
) |
Net (decrease)/increase in cash and cash equivalents |
|
|
( |
) |
|
|
|
|
|
|
|
|
|
|||
Cash and cash equivalents at beginning of year |
|
|
|
|
|
|
|
|
|
|
|
|
||||
Cash and cash equivalents at end of year |
|
|
|
|
|
|
|
|
|
|
|
|
||||
Basis of presentation
The Company’s accounting policies are the same as the Group’s accounting policies with the exception of the accounting for the investments in subsidiaries, VIEs and VIEs’ subsidiaries.
For the Company only condensed financial information, the Company records its investments in subsidiaries, VIEs and VIEs’ subsidiaries under the equity method of accounting as prescribed in ASC 323, Investments—Equity Method and Joint Ventures.
Such investments are presented on the Condensed Balance Sheets as “Investments in subsidiaries, VIEs and VIEs’ subsidiaries” and shares in the subsidiaries, VIEs and VIEs’ subsidiaries’ loss are presented as “Equity in loss of subsidiaries, VIEs and VIEs’ subsidiaries” on the Condensed Statements of Operations and Comprehensive Loss. The parent company only condensed financial information should be read in conjunction with the Group’ consolidated financial statements.
F-48