XBRL REVIEW 8
UNITED STATES
SECURITIES AND EXCHANGE COMMISSION
Washington, D.C. 20549
| int | ||||||||
FORM 10-K
(Mark One)
| ANNUAL REPORT PURSUANT TO SECTION 13 OR 15(d) OF THE SECURITIES EXCHANGE ACT OF 1934 | |||||
For the fiscal year ended December 31 , 2023
OR
| TRANSITION REPORT PURSUANT TO SECTION 13 OR 15(d) OF THE SECURITIES EXCHANGE ACT OF 1934 | |||||
For the transition period from __________ to __________
Commission File Number: 001-40465
(Exact name of registrant as specified in its charter)
| (State or other jurisdiction of incorporation or organization) | (I.R.S. Employer Identification Number) | ||||
| (Address of principal executive offices) | (Zip Code) | ||||
(877 ) 962-7738
(Registrant's telephone number, including area code)
Securities registered pursuant to Section 12(b) of the Act:
| Title of each class | Trading Symbol(s) | Name of each exchange on which registered | ||||||||||||
The | ||||||||||||||
| (Nasdaq Global Select Market) | ||||||||||||||
Indicate by check mark if the registrant is a well-known seasoned issuer, as defined in Rule 405 of the Securities Act of 1933 (“Securities Act”). Yes ☒ No ☐
Indicate by check mark if the registrant is not required to file reports pursuant to Section 13 or Section 15(d) of the Securities Exchange Act of 1934 (“Exchange Act”). Yes ☐ No ☒
Indicate by check mark whether the registrant (1) has filed all reports required to be filed by Section 13 or 15(d) of the Exchange Act during the preceding 12 months (or for such shorter period that the registrant was required to file such reports), and (2) has been subject to such filing requirements for the past 90 days Yes ☒ No ☐
Indicate by check mark whether the registrant has submitted electronically every Interactive Data File required to be submitted pursuant to Rule 405 of Regulation S-T (§232.405 of this chapter) during the preceding 12 months (or for such shorter period that the registrant was required to submit such files). Yes ☒ No ☐
Indicate by check mark whether the registrant is a large accelerated filer, an accelerated filer, a non-accelerated filer, a smaller reporting company, or an emerging growth company. See the definitions of “large accelerated filer,” “accelerated filer,” “smaller reporting company,” and “emerging growth company” in Rule 12b-2 of the Exchange Act.
| ☒ | Accelerated filer | ☐ | ||||||||||||
| Non-accelerated filer | ☐ | Smaller reporting company | ||||||||||||
| Emerging growth company | ||||||||||||||
If an emerging growth company, indicate by check mark if the registrant has elected not to use the extended transition period for complying with any new or revised financial accounting standards provided pursuant to Section 13(a) of the Exchange Act. ☐
Indicate by check mark whether the registrant has filed a report on and attestation to its management’s assessment of the effectiveness of its internal control over financial reporting under Section 404(b) of the Sarbanes-Oxley Act (15 U.S.C. 7262(b)) by the registered public accounting firm that prepared or issued its report. ☒
If securities are registered pursuant to Section 12(b) of the Exchange Act, indicate by check mark whether the financial statements of the registrant included in the filing reflect the correction of an error to previously issued financial statements. ☐
Indicate by check mark whether any of those error corrections are restatements that required a recovery analysis of incentive-based compensation received by any of the registrant’s executive officers during the relevant recovery period pursuant to §240.10D-1(b). ☐
Indicate by check mark whether the registrant is a shell company (as defined in Rule 12b-2 of the Exchange Act). Yes ☐ No ☒
The aggregate market value of the registrant’s Class A common stock held by non-affiliates of the registrant on June 30, 2023, the last business day of its most recently completed second fiscal quarter, was $2.3 billion based on the closing sales price of the registrant’s Class A common stock on that date. Solely for purposes of this disclosure, shares of Class A common stock held by executive officers and directors of the registrant as of such date have been excluded because such persons may be deemed to be affiliates. This determination of executive officers and directors as affiliates is not necessarily a conclusive determination for any other purposes.
As of February 23, 2024, there were 461,562,862 shares of the registrant's Class A common stock, par value $0.0001 per share, outstanding and 52,248,249 shares of the registrant's Class B common stock, par value $0.0001 per share, outstanding.
DOCUMENTS INCORPORATED BY REFERENCE
Portions of the registrant’s Proxy Statement for the 2024 Annual Meeting of Stockholders are incorporated herein by reference in Part III of this Annual Report on Form 10-K to the extent stated herein. Such proxy statement will be filed with the Securities and Exchange Commission within 120 days of the registrant’s fiscal year ended December 31, 2023.
MARQETA, INC.
FORM 10-K
TABLE OF CONTENTS
| Page | ||||||||
2
Note About Forward-Looking Statements
This Annual Report on Form 10-K contains forward-looking statements within the meaning of the federal securities laws, which are statements that involve substantial risks and uncertainties. Forward-looking statements generally relate to future events or our future financial or operating performance. In some cases, you can identify forward-looking statements because they contain words such as “may,” “will,” “shall,” “should,” “expects,” “plans,” “anticipates,” “could,” “intends,” “target,” “projects,” “contemplates,” “believes,” “estimates,” “predicts,” “potential,” or “continue” or the negative of these words or other similar terms or expressions that concern our expectations, strategy, plans, or intentions. Forward-looking statements contained in this Annual Report on Form 10-K include, but are not limited to, statements about:
•uncertainties related to U.S. and global economies and the effect on our business, results of operations, and financial condition;
•our future financial performance, including our net revenue, costs of revenue, gross profit, and operating expenses and our ability to achieve future profitability;
•the anticipated accounting treatment of our customer agreements and the risk that such accounting treatment may be subject to further changes or developments;
•our ability to scale new products and services, such as our credit card platform;
•our ability to effectively manage or sustain our growth and expand our operations;
•our ability to enhance our platform and services and develop and expand our capabilities;
•our ability to further attract, retain, diversify, and expand our customer base;
•our ability to maintain our relationships with Issuing Banks and Card Networks;
•our strategies, plans, objectives, and goals;
•our plans to expand internationally;
•our ability to compete in existing and new markets and offerings;
•our estimated market opportunity;
•economic and industry trends, projected growth, or trend analysis;
•the impact of political, social, and/or economic instability or military conflict;
•our ability to develop and protect our brand;
•our ability to comply with laws and regulations;
•our ability to successfully defend litigation brought against us;
•our ability to attract and retain qualified employees and key personnel;
•our ability to repurchase shares under authorized share repurchase programs and receive expected financial benefits; and
•our ability to maintain effective disclosure controls and internal controls over financial reporting, including our ability to remediate the material weaknesses in our internal control over financial reporting.
3
We caution you that the foregoing list may not contain all of the forward-looking statements made in this Annual Report on Form 10-K. You should not rely upon forward-looking statements as predictions of future events. We have based the forward-looking statements contained in this Annual Report on Form 10-K primarily on our current expectations and projections about future events and trends that we believe may affect our business, results of operations, financial condition, and prospects. The outcome of the events described in these forward-looking statements is subject to risks, uncertainties, and other factors described in the section titled “Risk Factors” and elsewhere in this Annual Report on Form 10-K. Moreover, we operate in a very competitive and rapidly changing environment. New risks and uncertainties emerge from time to time, and it is not possible for us to predict all risks and uncertainties that could have an impact on the forward-looking statements contained in this Annual Report on Form 10-K. The results, events, and circumstances reflected in the forward-looking statements may not be achieved or occur, and actual results, events, or circumstances could differ materially from those described in the forward-looking statements. The forward-looking statements made in this Annual Report on Form 10-K relate only to events as of the date on which the statements are made. We undertake no obligation to update any forward-looking statements made in this Annual Report on Form 10-K to reflect events or circumstances after the date of this Annual Report on Form 10-K or to reflect new information or the occurrence of unanticipated events, except as required by law. Unless otherwise indicated or unless the context requires otherwise, all references in this document to “Marqeta”, the “Company”, the “Registrant,” “we”, “us”, “our”, or similar references are to Marqeta, Inc. Capitalized terms used and not defined above are defined elsewhere within this Annual Report on Form 10-K.
4
PART I
ITEM 1. BUSINESS
Our Business
Marqeta’s mission is modernizing financial services by making the entire payment experience native and delightful. Marqeta’s modern platform empowers our customers to create customized and innovative payment card programs, giving them configurability and flexibility. When our customers come to us to build a payments solution, they are not just building a card, they are building a payments experience.
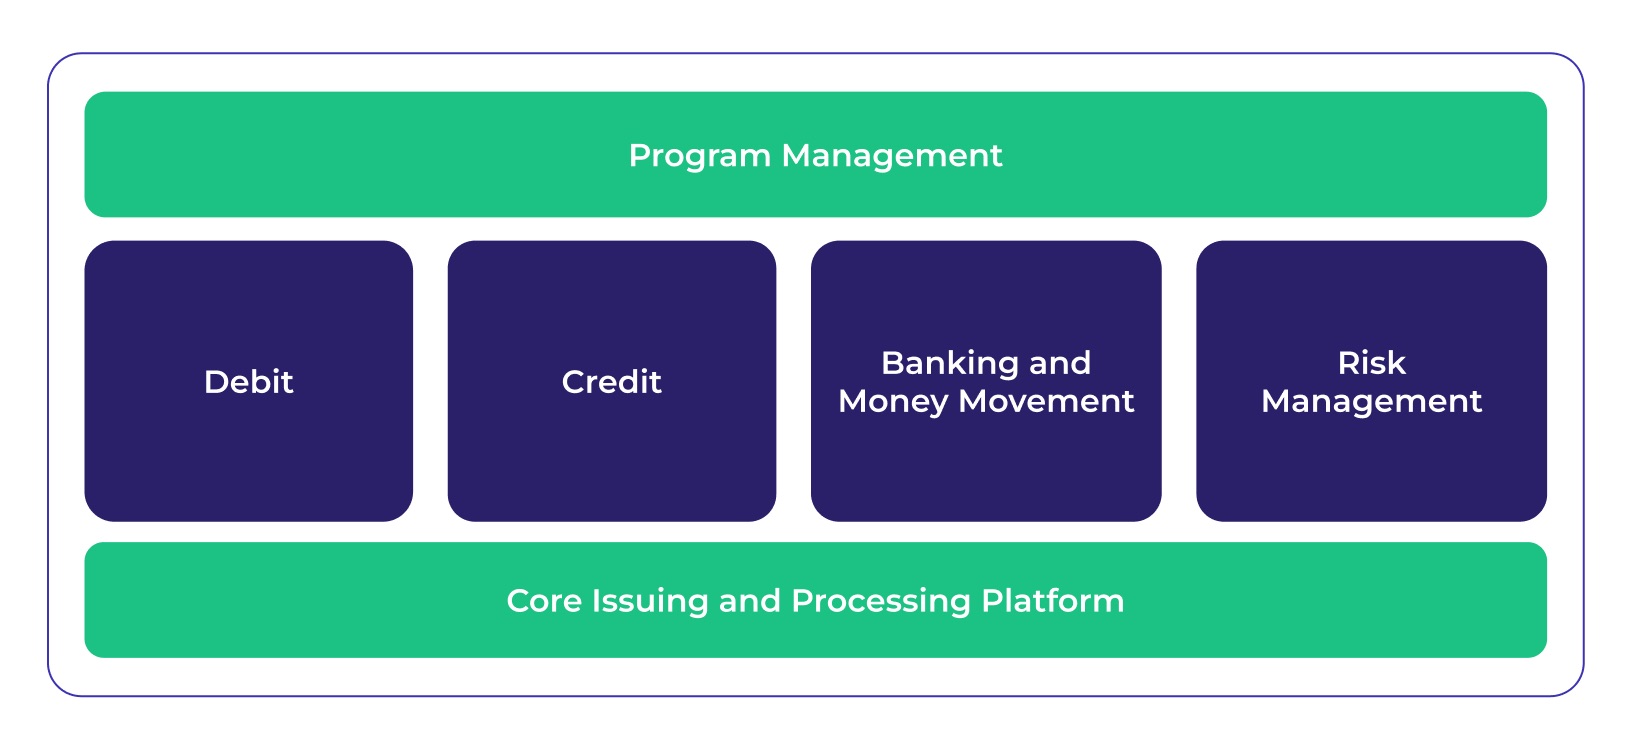
Our platform encompasses debit, prepaid, and credit programs, and provides banking and money movement, risk management, and rewards products. We deliver a scaled solution to our customers to maximize the benefit of their card programs while also providing the tech layer that bridges the bank and the customer. Marqeta’s open APIs provide instant access to a highly scalable, cloud-based payment infrastructure that enables customers to embed the payments experience into apps or websites for a personalized user experience. Customers can launch and manage their own card programs, issue cards, and authorize and settle payment transactions quickly using our platform.
We also deliver robust card program management, allowing our customers to embed Marqeta in their offering without having to build certain complex elements or customer support services. Our customers can focus on their areas of expertise, with more control over their card programs, while we manage the complexity of running the card programs with our Issuing Bank and Card Network partners (each as defined below).
In the years ended December 31, 2023, 2022, and 2021, total processing volume (“TPV”) on the Marqeta Platform was $222.3 billion, $166.3 billion, and $111.1 billion, respectively, which reflected year-over-year growth of 34% and 50%, respectively. TPV is the total dollar amount of payments processed through the Marqeta platform, net of returns and chargebacks. See “Management’s Discussion and Analysis of Financial Condition and Results of Operations” for a more detailed discussion of our strategy and key operating metric.
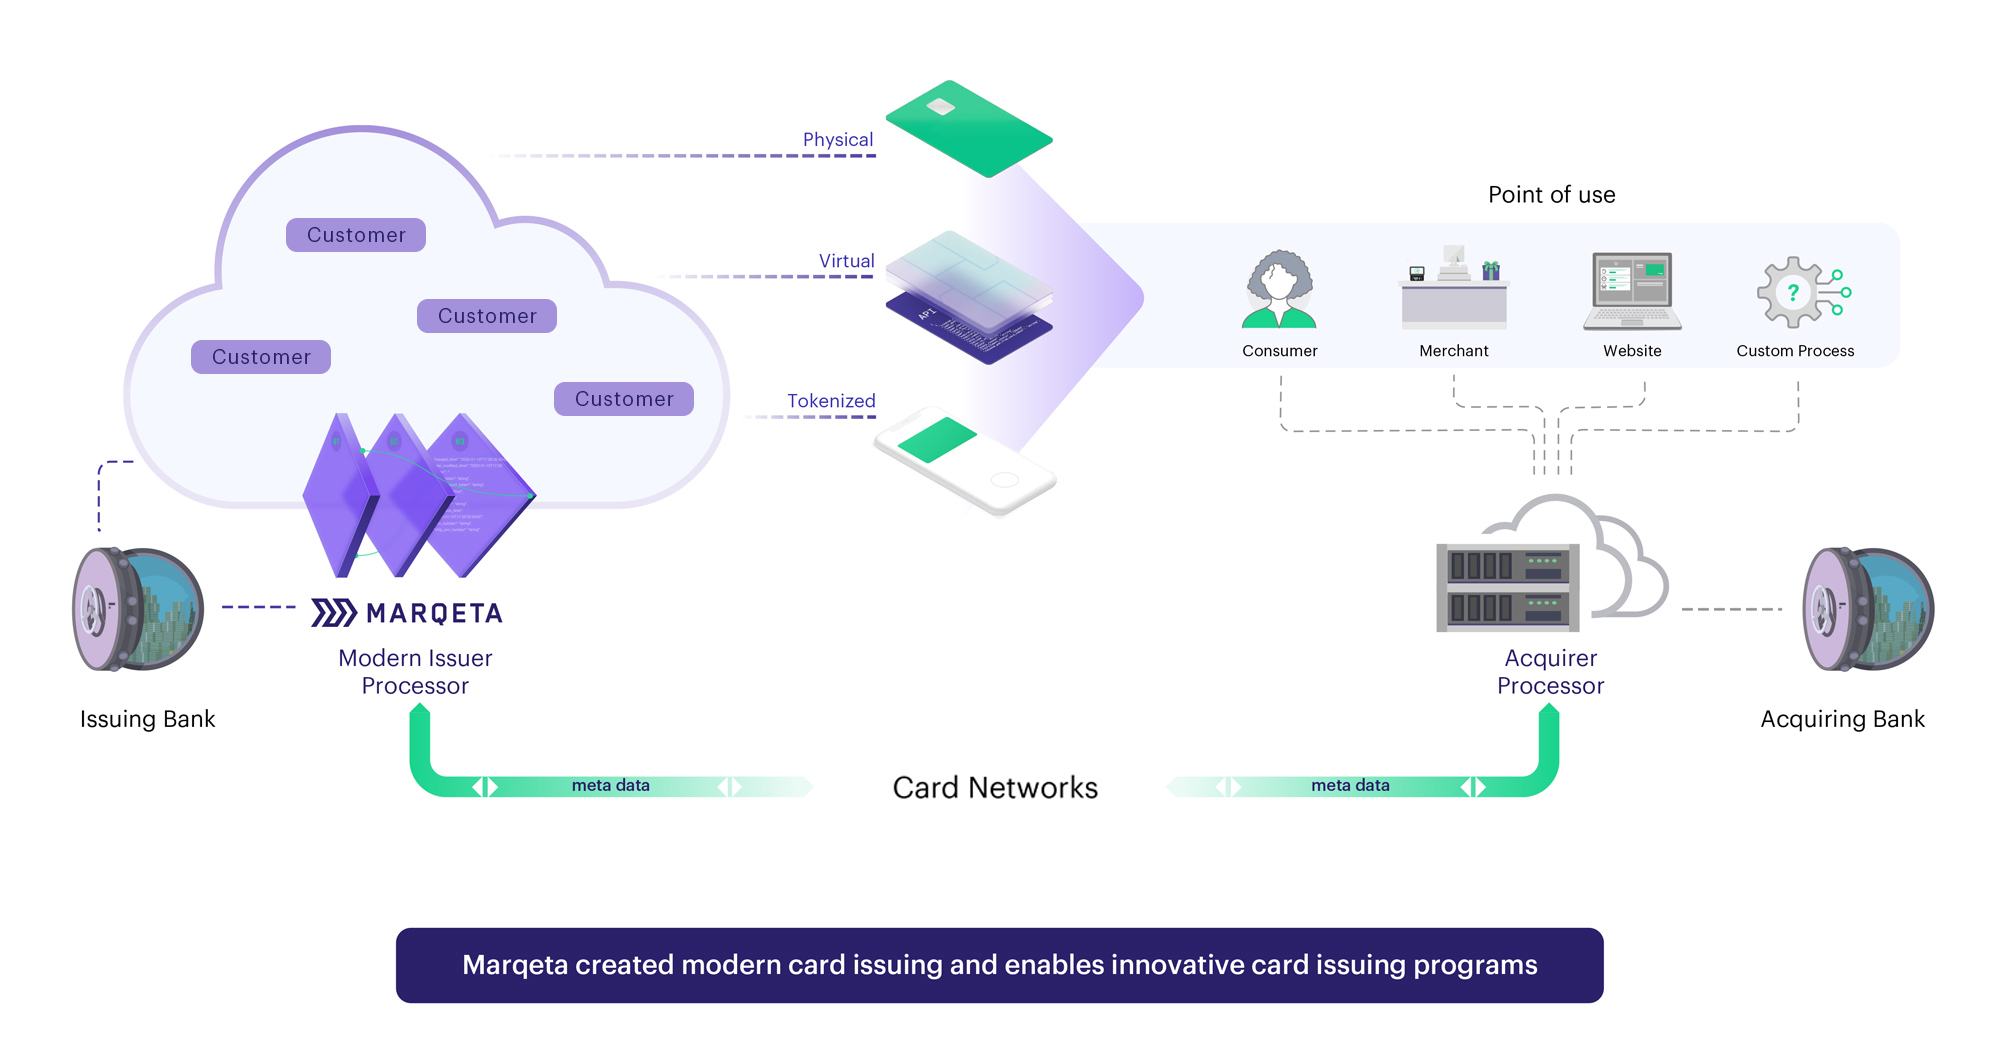
The Payments Ecosystem
With every tap, swipe, or payment, a lot happens behind the scenes. The payments ecosystem of Issuing Banks, Acquiring Banks, Acquirer Processors, Issuer Processors, and Card Networks facilitates the exchange of information and funds and underpins global payment card purchase transactions.
•“Acquirer Processors” connect Acquiring Banks and merchants to the Card Networks, to facilitate the flow of card payment information to an Issuing Bank.
•“Acquiring Banks” are the financial institutions that merchants use to hold funds and manage their business. Acquiring Banks may work with an Acquirer Processor to provide access to the Card Networks.
•The “Card Networks” provide the infrastructure for settlement and card payment information that flows between an Issuer Processor and an Acquirer Processor.
•“Issuer Processors” provides a technology platform, ledger, and infrastructure to support a card issuer and connects with a Card Network to facilitate payment transactions.
•“Issuing Banks” are the financial institution that issue a payment card (debit, prepaid, or credit) either on its own behalf or on behalf of a business.
The legacy payments ecosystem has historically been inflexible, with Issuing Banks delivering the entire value chain: the regulated entity and balance sheet, the product, and the customer experience. In the legacy payments ecosystem, the customer must contract with an Issuing Bank, who leverages an Issuer Processor to connect with a Card Network and facilitate payment transactions.
5
At Marqeta, we are modernizing the Issuer Processor side of the payments ecosystem. Issuing Banks continue to provide the chartered banking entity, treasury, and balance sheet. Marqeta provides innovation, accessibility, flexibility, control, and scale by delivering all of these benefits in one easy-to-use platform, full of applications and services, along with an Issuing Bank partner. The customer controls its customers’ experience, leveraging the Marqeta platform.
Our Platform and Products
Marqeta provides a single, global, cloud-based, open API platform for modern card issuing and transaction processing. Marqeta’s modern platform enables customers to build and rapidly scale their card programs with extensive control and configurability, and with high standards of reliability and security. Our platform is designed to reduce complexity for customers, enabling a full spectrum of consumer and commercial card issuing and transaction processing services in a single solution. We overlay robust program management expertise to help our customers design a customer-centric card program without requiring expertise in all of the nuances of managing a program themselves.
A key aspect of our modern platform is that our debit, prepaid, and credit offerings are all available in a combined offering, enabling customers to offer multiple products through Marqeta’s platform. For example, a retail company could use Marqeta to create a debit program to offer wage solutions to its hourly workers, a consumer credit program to its most loyal shoppers, and a commercial credit program to key suppliers to meet its working capital needs. These programs can all exist on Marqeta’s single, global, modern platform.
6
Our platform has a number of key attributes, including:
Control: Dynamic spend controls and Just-in-Time Funding (“JIT Funding”) provide customers with control over the payments flow.
Scale: Global platform built on a cloud-native infrastructure and a suite of APIs to support our customers worldwide with a build-once, deploy-anywhere model.
Configurable: Highly configurable capabilities empower our customers to build native solutions tailored to their customer needs.
Trust: We comply with applicable obligations under the Payment Card Industry Data Security Standard (“PCI DSS”) and provide a trusted environment for card issuing and payment processing with security, transparency, and real-time information.
Card Issuing
Our customers can issue debit, prepaid, and credit cards, including instant provision of a tokenized card to a digital wallet.
Debit: Customers can link card products to a primary bank account for their users to fund and spend from.
Prepaid: Customers can create single- or multi-use custom card experiences with dynamic spend controls and fund transactions in real time based upon business criteria.
Credit: Customers can create customized consumer and commercial credit programs with innovative rewards structures, leveraging pre-integrated partners for underwriting, mobile app design, and customer service.
Virtual: Customers can instantly issue one-time or multi-use branded payment cards that are ready to use immediately and enable faster funds disbursement with easier tracking of funds by unique virtual card numbers.
Physical: Customers can customize the look and feel, graphics, and messaging of physical cards to reinforce their brand. Physical cards can be magstripe, EMV-chip, and/or tap-to-pay enabled.
Tokenization & Digital Wallets: Customers can instantly issue branded payment cards that are ready to use immediately in app or in mobile wallets, which provides for continuity if the physical cards are lost or stolen.
Processing
Marqeta enables our customers to deliver innovative card experiences with enhanced control over transaction processing through dynamic spend controls and real-time decisioning via our JIT Funding feature.
Dynamic Spend Control: Dynamic spend controls create unique card experiences while reducing customer exposure to risk by limiting where users can transact and configuring exact spend limits. Customers can tailor cards with flexibility in where, when, and how much the card can be used. Customers can also check real-time data and events to dynamically change the card experience as needed.
JIT Funding: Marqeta’s JIT Funding feature enables customer cards to maintain a zero-amount balance until the card is used and approved. Upon approval, Marqeta automatically moves funds from an identified funding source into the appropriate account.
Digital Banking
Marqeta for Banking provides our customers with a suite of bank account and money movement features offered through our Issuing Bank partners, including demand deposit accounts, direct deposit with early pay, ACH, cash loads, and fee-free ATMs, bill pay, and instant funding capabilities. These services enable customers to drive additional engagement and spend by making it easy for their users to fund accounts and manage money.
7
RiskControl
With Marqeta’s RiskControl product, certain risk and compliance concerns are mitigated while reducing friction across the cardholder lifecycle.
Real-Time Decisioning: Customers can mitigate fraud using Marqeta’s Real-Time Decisioning solution, which provides fine-tuned control over card transactions.
Customer Identification Program: Customers can verify the identity of cardholder applicants.
3D Secure: Customers can authenticate cardholders and authorize online transactions.
Disputes Management: Customers can manage disputes and chargebacks at scale with streamlined disputes management, including risk management services to handle disputes on their behalf.
Dashboard
The Marqeta Dashboard is a comprehensive self-service portal that empowers our customers to access and manage all aspects of their card program, including card configuration, servicing cardholders, tracking data and insights, managing disputes, and accessing RiskControl capabilities.
UI/UX
User experience is an essential part of all Marqeta programs. Marqeta makes it easy for our customers to completely integrate the card experience into any app or website. For our credit customers, they can select a fully bank-approved UI template that's purpose-built for managing a credit card.
Marqeta’s Credit Platform
We announced our credit platform in October 2023. While Marqeta previously offered credit processing, we utilized partners for credit program management. Now our platform combines Marqeta’s modern issuing processing expertise, scale, experience, and stability, with the innovative and comprehensive program management capabilities we acquired in February 2023 to deliver a comprehensive credit platform.
With the Marqeta credit platform, our customers have the tools to design, launch, and scale , and can work directly with us rather than managing several different providers. Customers can customize the user experience and embed the card within their brands. Our ability to offer configurable and flexible solutions enables our customers to build highly differentiated programs with truly personalized rewards and spend controls.
Innovative Rewards Structures: Customers can leverage our proprietary rewards engine, keeping users engaged with innovative rewards structures using multiple data points across user spend as well as transactions, repayments, and other data points. Our platform enables customers to reward users in real time with multiple redemption options, creating opportunities to drive engagement and usage.
Underwriting Support: Our underwriting decisioning engine allows Issuing Banks and customers to implement custom fraud and credit decisioning criteria to help manage program fraud and delinquency risk. Our platform allows for automated decisioning using a variety of data sources and custom logic.
Our Programs
Marqeta’s innovative products are developed with deep domain expertise and a customer-first mindset to launch, scale, and manage card programs. Marqeta provides all of its customers with issuer processor services, and for most of its customers it also acts as a card program manager. Depending on a customer’s desired level of control and responsibility, Marqeta can work with companies in a range of different configurations:
8
Managed By Marqeta: With Managed By Marqeta (“MxM”), Marqeta provides an Issuing Bank partner to act as the Bank Identification Number (“BIN”) sponsor for the customer’s card program, manages the customer’s card program on behalf of the Issuing Bank, and provides a full range of services including configuring many of the critical resources required by a customer’s production environment. In addition to providing the customer access to the Marqeta dashboard via our APIs, Marqeta also manages a number of the primary tasks related to launching a card program, such as defining and managing the program with the Card Networks and Issuing Bank, operating the program and managing certain profitability components, and managing compliance with applicable regulations, the Issuing Bank, and Card Network rules. Also available to our MxM customers are a variety of managed services, including dispute management, fraud scoring, card fulfillment, and cardholder support services.
Powered By Marqeta: With Powered By Marqeta (“PxM”), Marqeta also provides customers access to the Marqeta dashboard via our APIs, provides payment processing, and assists with certain configuration elements that enable the customer to use the platform independently. Unlike under our MxM card programs, our PxM customers are responsible for other elements of the card program, including defining and managing the program with the Card Networks and Issuing Bank as well as managing compliance with applicable regulations, the Issuing Bank, and Card Network rules.
Given the modularity of the Marqeta platform, certain customers can also opt to incorporate elements of MxM into their PxM card program to create a custom Powered By Plus (“PxM+”) solution.
Our Customers
Marqeta serves customers in multiple industry verticals including financial services, on-demand services, buy now, pay later (“BNPL”), expense management, and e-commerce enablement.
We see embedded finance as a significant contributor to our next wave of growth. There are two critical components to embedded finance: native integration and non-financial services businesses. It starts with a company whose core business is not financial services, and that company offers financial services products in a manner that is natively embedded into their existing customer experience. It is seamless, and, to put it simply, you don't have to go to the bank. The bank comes to you where you already spend.
With embedded finance, enterprises across industries can offer multiple financial services to their customers to improve the user experience, enhance loyalty, and add another monetization engine to their existing business. Marqeta’s platform operates across a number of use cases for customers to capitalize on, including consumer credit cards, point-of-sale lending, accelerated/earned wage access, expense management, on-demand delivery, and spend management. Customers can also combine solutions across different use cases.
Agreements with Large Customers
Block
On April 19, 2016, we entered into a master services agreement with Block, Inc., formerly known as Square, Inc., subsequently amended (the “Block Agreement”), which includes agreements that provide for the commercial terms of our relationship with Block. Pursuant to the terms of the Block Agreement, we have agreed to manage Block’s Cash App, Square Debit Card, and Square Card Canada card issuing programs for Block. On January 31, 2022, Block completed its acquisition of our customer, Afterpay Limited. We have a separate agreement with Afterpay that provides for the commercial terms of our relationship; however, we now aggregate Afterpay as part of our Block business.
We executed contract amendments on August 4, 2023 (the “August 2023 Block Amendment”) and November 3, 2023 (the “November 2023 Block Amendment,” and, together with the August 2023 Block Amendment, the “2023 Block Amendments”) to the Block Agreement. Pursuant to the terms of the 2023 Block Amendments, the term of the Cash App and the Square Debit Card programs will expire on June 30, 2028 and automatically renew thereafter for successive one-year periods, unless terminated earlier by either party.
9
The August 2023 Block Amendment provides that we will continue to provide various services to Block, though Block will be responsible for defining and managing the Cash App program with respect to the primary Card Network going forward, including being responsible for managing the financial relationship between the Cash App program and the primary Card Network, choosing the card brand, determining the product type, and meeting program parameters. The August 2023 Block Amendment also includes a continuation of services for the Cash App program for a period of time in the event of a change of control of Marqeta. The November 2023 Block Amendment provides that we will be the default provider of issuing processing and related services in current or future markets outside of the U.S. where Block intends to operate and Marqeta is able to provide issuing processing services, subject to certain exceptions.
Either we or Block may terminate the Block Agreement under certain specified circumstances, including upon a material breach. The Block Agreement also provides for certain other terms, including representations and warranties of the parties, intellectual property rights, data ownership and security, limitations on liability, confidentiality and indemnification rights, and other covenants.
In addition, on March 13, 2021, and as specified in the Block Agreement, we granted Block a warrant to purchase up to 1,100,000 shares of our common stock at an exercise price of $0.01 per share, which is exercisable upon attaining certain milestones relating to Block’s creation of a specified percentage of new cardholders on our platform each year over a three-year period.
Our Relationships with Issuing Banks and Card Networks
Marqeta works on its customers’ behalf with Card Networks and Issuing Banks to issue cards, authorize transactions, and communicate with settlement entities. Our contractual relationships with Issuing Banks and Card Networks contribute to Marqeta’s ability to create and manage customized card programs for our customers.
Relationship and Agreements with Issuing Banks
When our customers engage us for MxM services, we provide an Issuing Bank to act as the BIN sponsor for the customer’s card program and are responsible for managing compliance with the Issuing Bank’s requirements and Card Network rules. Issuing Banks provide services for our MxM solutions that can include card issuance, Card Network sponsorship, establishing a line of credit and underwriting standards, and creating deposit accounts used to settle our customers’ transactions. Our contracts with Issuing Banks entitle Marqeta to all of the Interchange Fees generated from our customers’ card programs, which we then share with our MxM customers through Revenue Share payments, and obligate us to pay all Card Network fees associated with our MxM customers’ card transactions. “Interchange Fees” are transaction-based and volume-based fees set by a Card Network and paid by an Acquiring Bank to the Issuing Bank that issued the payment card used to purchase goods or services from a merchant and “Revenue Share” refers to provisions in our customer contracts under which we share a portion of Interchange Fees with our MxM customers.
While an Issuing Bank ultimately approves each card program, Marqeta configures the program design, negotiates key program terms, and selects the Issuing Bank. Marqeta actively works to find the most appropriate Issuing Bank partner for the potential card program based on the customer’s needs and program design. We pay volume-based and transaction-based fees to the Issuing Banks. The fees are typically structured based on volume tiers; as our processing volumes grow, these fees as a percentage of processing volume decline. These fees are reflected in our costs of revenue.
When our customers engage us for PxM services, we do not manage the customer’s relationships with the Issuing Banks and Card Networks and the customer is responsible for managing compliance with the Issuing Bank’s requirements and Card Network rules.
Certain customers engage us for PxM+ services, where they can combine different aspects of our MxM and PxM services. The involvement of our Issuing Banks in a specific PxM+ program will depend on each program’s design.
10
Sutton Bank
On April 1, 2016, we entered into a prepaid card program manager agreement with Sutton Bank, our largest Issuing Bank partner by processing volume. Under the terms of the agreement, as amended, Sutton Bank settles payment transactions for us and provides card and other related services to us, including the issuance of cards for approved card programs. The agreement provides that we pay Sutton Bank a fee based on a percentage of the value of transactions processed. Under this agreement we are entitled to receive 100% of the Interchange Fees for processing our customers’ card transactions. Our agreement with Sutton Bank requires us to indemnify Sutton Bank for certain losses, subject to specific enumerated exceptions.
Under certain circumstances, the agreement also requires us to pay termination fees, including fees and costs to Sutton Bank, if we terminate the agreement before the end of its term or any automatic renewal term. The current term of the agreement expires in 2028, after which it automatically renews on the same terms and conditions for a two-year renewal term, unless either party provides written notice of its intent not to renew at least 180 days prior to the expiration of the then-current term. Either we or Sutton Bank may terminate the agreement under certain specified circumstances, including if the other party commits a material breach that is not cured within 30 days.
Agreements with Card Networks
The Card Networks oversee their worldwide payment networks, through which debit, credit, and prepaid card payments are authorized, processed, and settled, and set Interchange Fee rates. We currently partner with a number of Card Networks, including Visa, Mastercard, and PULSE, to process our customers’ transactions on our platform.
Marqeta arranges for our MxM customers to use one or more of the available Card Networks, and we generally include the standard Card Network fees in the pricing arrangements with our MxM customers, which are reflected in our costs of revenue.
Given our ability to direct MxM processing volume to specific Card Networks, we are able to negotiate certain incentive rebates that effectively reduce the overall Card Network fees. With the scale of the transactions we process on behalf of our customers, we believe we can continue to negotiate favorable incentive rebates. However, if these fees increase, our gross margins will decrease.
Mastercard
In 2020, we entered into a strategic relationship agreement with Mastercard. We have also entered into a number of subsequent arrangements with Mastercard, including certain brand agreements. Under these agreements, as amended, we have agreed to cooperate with Mastercard on a number of initiatives, including international expansion, product, marketing, and business development collaboration. The contracts provide Marqeta with tiered incentives based on the processing volume of our customers’ transactions routed through Mastercard and its affiliated networks. The current term of the strategic relationship agreement expires in 2028 or at an earlier date if Marqeta achieves a certain processing volume milestone through the Mastercard network. Either party may terminate the agreements under specified circumstances, including upon a material breach that remains uncured for a specified period of time.
Visa
In 2017, we entered into a strategic alliance framework agreement with Visa. The agreement has been periodically amended. We have also entered into a number of subsequent arrangements with Visa, as governed by the strategic alliance framework agreement, including a service evaluation agreement, card partner agreement, and certain brand agreements. Under these agreements, we have agreed to cooperate with Visa on a number of initiatives, including international expansion, product, marketing, and business development collaboration. The contracts provide Marqeta with tiered incentives based on the processing volume of our customers’ transactions routed through Visa and its affiliated networks. As of February 2023, the parties have entered into an extension of the card partner agreement under the strategic alliance framework agreement for a term of five years. Either party may terminate the agreements under specified circumstances, including upon a material breach that remains uncured for a specified period of time. Visa may also elect to terminate the agreements prior to the natural expiration of the then-current term due to our failure to meet certain performance requirements.
11
PULSE Network
In 2013, we entered into a direct processor agreement with PULSE Network LLC, which has been subsequently amended. The contract provides Marqeta with tiered incentives based on the processing volume of our customers’ transactions routed through PULSE and its affiliated networks. The current term of the contract expires in 2028 and automatically renews annually thereafter, unless either party provides written notice of its intent not to renew. Either party may terminate the agreement under specified circumstances, including upon a material breach that remains uncured for a specified period of time.
Our Competitors
We compete in a large and evolving market. Our competitors fall into three primary categories: (1) providers with legacy technology platforms, (2) modern API-based providers, and (3) emerging providers. We compete primarily on the basis of our platform’s depth and breadth, offering a more configurable and complete solution for innovators.
We believe that the principal competitive factors in our market include:
•pricing;
•multiple program types (debit, prepaid, credit);
•multinational reach;
•complete solutions at scale;
•flexibility and configurability;
•reliability;
•compliance solutions;
•program management;
•brand recognition and reputation; and
•industry expertise and customer service.
We compare favorably with our competitors on the basis of these factors. We have a deep history of card issuing expertise, enabling us to achieve technical and operating leverage that we believe potential competitors are unable to replicate. However, some of our competitors have greater financial and operating resources. Moreover, as we expand the scope of our platform, we may face additional competition. See the section titled “Risk Factors—Risks Relating to Our Business and Industry—We participate in markets that are competitive and continuously evolving, and if we do not compete successfully with established companies and new market entrants, our business, results of operations, financial condition, and future prospects could be materially and adversely affected” for additional information regarding the competitive environment in which we operate.
Intellectual Property
We seek to protect our intellectual property by relying on a combination of patents, trademarks, copyrights, trade secrets, license agreements, confidentiality procedures, non-disclosure agreements, and employee confidential information and invention assignment agreements, as well as other legal and contractual rights.
We have a patent program designed to cover various aspects of our business in the United States and internationally. These patents and patent applications are intended to protect our proprietary inventions relevant to our business. We continually review our development efforts to assess the existence of new intellectual property and our ability to patent new intellectual property.
We also have an ongoing trademark and service mark registration program pursuant to which we register our brand names and product names, taglines, and logos in the United States and internationally to the extent we determine appropriate and cost-effective. We have also registered domain names for websites that we use in our business, such as www.marqeta.com and other similar variations.
12
From time to time, we also incorporate certain intellectual property licensed from third parties, including under certain open source licenses. Even if any such third-party technology did not continue to be available to us on commercially reasonable terms, we believe that alternative technologies would be available as needed in every case.
See the section titled “Risk Factors—Risks Relating to Intellectual Property” for a more comprehensive description of risks related to our intellectual property and proprietary rights.
Research and Development
Our research and development efforts focus on building enterprise-grade product and service capabilities for our customers and their cardholders. Our design, product, engineering, and customer success teams collaborate to design, build, deploy and monitor our platform. We enable our customers to build solutions on our platform, which connects to our Issuing Banks and Card Networks. Software development is primarily executed by our team of professionals across design, product management, and engineering disciplines. We intend to continue to invest in our research and development capabilities to extend our platform offerings.
Government Regulation
We are subject, directly, or indirectly through our relationships with our Issuing Banks, customers, or Card Networks, to a number of laws and regulations. The regulatory environment in which we operate is rapidly evolving, and the most significant government regulations that impact our business are discussed below. For more information on the risks relating to our regulatory environment, see the section titled “Risk Factors—Risks Relating to Regulation.”
Consumer Protection
The Dodd-Frank Wall Street Reform and Consumer Protection Act of 2010 (the “Dodd-Frank Act”) created the Consumer Financial Protection Bureau (the “CFPB”) which regulates consumer financial products or services. Due to our relationships with Issuing Banks and Card Networks, we may be subject to direct or indirect supervision and examination by the CFPB. CFPB rules, examinations, investigations, and enforcement actions against us or our Issuing Banks, Card Networks, or customers may require us to adjust our activities and may increase our compliance costs.
We are subject to Section 5 of the Federal Trade Commission Act, which prohibits unfair and deceptive acts or practices in or affecting commerce, and Section 1031 of the Dodd-Frank Act, which prohibits unfair, deceptive, or abusive acts or practices in connection with any consumer financial product or service.
Privacy, Data Protection, and Information Security Regulations
We provide services that are subject to various laws and regulations relating to privacy, data protection, and information security, including, among others, the Gramm-Leach Bliley Act, the EU General Data Protection Regulation, and the California Consumer Protection Act. We maintain privacy policies and terms of service, which describe our practices concerning the use, transmission, and disclosure of certain information.
Additionally, our platform hosts, transmits, processes, and stores payment card data and is therefore required to comply with the PCI DSS. As a result, we are subject to PCI DSS audits and must comply with related security requirements.
Association and Card Network Rules
Our Issuing Banks must comply with the bylaws, regulations, and requirements that are set forth by the Card Networks, including the PCI DSS and other applicable data security program requirements. In providing services through our platform, we are certified and registered with certain Card Networks as a processor for member institutions. As such, we are subject to applicable Card Network rules that could subject us to fines or penalties for certain acts or omissions. The Card Networks routinely update and modify their requirements and we, in turn, must work to comply with such updates to continue processing transactions on their networks.
13
Further, we are subject to network operating rules promulgated by the National Automated Clearing House Association relating to payment transactions processed on our platform using the Automated Clearing House Network and to various federal and state laws regarding such operations.
Prepaid, Debit, and Credit Card Regulations
The Durbin Amendment to the Dodd-Frank Act directs the Federal Reserve Board to regulate debit card Interchange Fees so that they are “reasonable and proportional” to the cost incurred by the card issuer with respect to the transaction. We generally partner with Issuing Banks who are exempt from the Interchange Fee caps in the Durbin Amendment to provide MxM services for prepaid and debit card programs. We continue to monitor proposed changes to the Durbin Amendment.
The card programs that we manage for our customers are subject to various federal and state laws and regulations, including the Credit Card Accountability, Responsibility, and Disclosure Act of 2009 and the CFPB’s Regulation E, which impose requirements on general-use prepaid cards, store gift cards, and electronic gift certificates. The CFPB also regulates prepaid accounts, including certain accounts that are capable of being loaded with funds and whose primary function is to conduct transactions with multiple, unaffiliated merchants, at ATMs, or for person-to-person transfers. These regulations include, among other things, disclosure of fees to the consumer prior to the creation of a prepaid account; liability limits and error-resolution requirements; regulation of prepaid accounts with overdraft and credit features; and the submission of prepaid account agreements to the CFPB and the publication of such agreements to the general public.
We are subject to various federal consumer protection regimes as a result of our credit platform and relationship with originating Issuing Banks, including, among others:
•the Equal Credit Opportunity Act and Regulation B promulgated thereunder, which prohibit creditors from discriminating against credit applicants on the basis of race, color, sex, age, religion, national origin, marital status, the fact that all or part of the applicant’s income derives from any public assistance program, or the fact that the applicant has in good faith exercised any right under the Federal Consumer Credit Protection Act or any applicable state law;
•the Fair Credit Reporting Act, as amended by the Fair and Accurate Credit Transactions Act, and Regulation V promulgated thereunder, which promote the accuracy, fairness, and privacy of information in the files of consumer reporting agencies;
•the Truth-in-Lending Act and Regulation Z promulgated thereunder, which require certain disclosures to consumers regarding the terms and conditions of loans and credit transactions;
•the Military Lending Act and similar state laws, which provide disclosure requirements, interest rate limitations, substantive conduct obligations, and prohibitions on certain behavior relating to loans made to covered borrowers, which include both servicemembers and their dependents; and
•the Servicemembers Civil Relief Act and similar state laws, which allows active duty military members to suspend or postpone certain civil obligations so that the military member can devote his or her full attention to military duties.
Anti-Money Laundering
Although we are not a “money services business” or otherwise subject to anti-money laundering (“AML”) registration requirements under U.S. federal or state law, we are subject to certain AML laws and regulations in various jurisdictions. In the United States, the Currency and Foreign Transactions Reporting Act, known as the Bank Secrecy Act (the “BSA”) and amended by the USA PATRIOT Act of 2001, contains a variety of provisions aimed at fighting terrorism and money laundering. Among other things, the BSA and implementing regulations issued by the U.S. Treasury Department require certain financial institutions to establish AML programs, to not engage in terrorist financing, to report suspicious activity, and to maintain a number of related records.
14
Due to our relationships with Issuing Banks that are directly regulated for AML purposes, we have implemented an AML program designed to prevent our platform from being used to facilitate money laundering, terrorist financing, and other illicit activity. When providing program management services, we design our AML program to meet the requirements of our Issuing Banks. Our programs are also designed to prevent our platform from being used to facilitate activity in violation of applicable sanctions laws and regulations, including conducting business in specified countries or with designated persons or entities, including those on lists promulgated by the U.S. Department of the Treasury’s Office of Foreign Assets Controls and equivalent foreign authorities. Our AML compliance program includes policies, procedures, reporting protocols, and internal controls to guard against money laundering, terrorist financing, and other illicit activity, including the designation of a compliance officer in the United States and in other jurisdictions to oversee our AML compliance program, and it is designed to assist in managing risk associated with money laundering and terrorist financing.
Anti-Bribery Laws
We are subject to anti-corruption and anti-bribery and similar laws, such as the U.S. Foreign Corrupt Practices Act of 1977, as amended (the “FCPA”), the U.S. domestic bribery statute contained in 18 U.S.C. § 201, the U.S. Travel Act, the U.K. Bribery Act 2010, and other anti-corruption and anti-bribery laws in countries where we conduct activities.
The FCPA includes anti-bribery and accounting provisions enforced by the Department of Justice and the Securities and Exchange Commission (the “SEC”). The statute has a broad reach, covering all U.S. companies and citizens doing business abroad, among others, and defining a foreign official to include not only those holding public office but also local citizens affiliated with foreign government- run or owned organizations. The statute also requires maintenance of appropriate books and records and maintenance of adequate internal controls.
Other
We are subject to examination by our Issuing Banks’ regulators and must comply with certain regulations to which these banks are subject, as applicable. For instance, due to our relationships with certain Issuing Banks and certain customers, we may be subject to indirect supervision and examination by the Federal Deposit Insurance Corporation (the “FDIC”), state banking regulators (such as the California Department of Financial Protection and Innovation), and the Office of the Comptroller of the Currency in connection with our platform and certain of our products and services. We are also subject to audit by certain Issuing Banks. Further, certain of our customers are financial institutions or non-bank regulated entities and, as a result, we may be indirectly subject to examination and obligated to assist those customers in complying with certain regulations to which they are subject or with responses to audits of such customers.
International Regulation
The conduct of our business and the use of our products and services outside the United States are subject to various foreign laws and regulations administered by government entities and agencies in the countries and territories where we operate and where our customers and their cardholders use our products and services. For instance, we are subject to processing fee and transaction fee regulation where our cards are used and may in the future be subject to Interchange Fee regulations in other countries where our cards are used.
Privacy and Data Protection
The privacy of our customers’ data and our customers’ cardholders’ data is important to our continued growth and success, and we take significant measures to protect the privacy and security of such data. Privacy and data protection is a shared responsibility among all our employees. We also have a privacy team that builds and executes on our privacy program, including support for data protection and privacy-related requests.
We are committed to complying with applicable privacy and data protection laws. We monitor guidance from industry and regulatory bodies and update our platform and contractual commitments accordingly.
We maintain privacy notices that describe how we collect, use, and share personal information relating to our customers and we implement appropriate contractual provisions relating to our processing of cardholders’ personal information.
15
Our Employees and Human Capital Resources
As of December 31, 2023, we had a total of 771 employees and we supplement our workforce with contractors and consultants. To our knowledge, none of our employees is represented by a labor union or covered by a collective bargaining agreement. We have not experienced any work stoppages, and we consider our relations with our employees to be good. Our human capital resources objectives include, as applicable, identifying, recruiting, retaining, incentivizing, and integrating our existing and prospective employees.
Corporate Information
We were incorporated in 2010 under the name Marqeta, Inc. as a Delaware corporation. We completed our initial public offering (“IPO”) in June 2021 and our Class A common stock is listed on the Nasdaq Global Select Market (“Nasdaq”), under the symbol “MQ.” Our principal executive offices are located at 180 Grand Avenue, 6th Floor, Oakland, CA 94612, and our telephone number is (877) 962-7738.
Available Information
Our website is located at www.marqeta.com, and our investor relations website is located at www.investors.marqeta.com. Copies of our Annual Report on Form 10-K, Quarterly Reports on Form 10-Q, Current Reports on Form 8-K, and amendments to these reports filed or furnished pursuant to Section 13(a) or 15(d) of the Securities Exchange Act of 1934, as amended (the “Exchange Act”), are available, free of charge, on our investor relations website as soon as reasonably practicable after we file such material electronically with or furnish it to the SEC. The SEC also maintains a website that contains our SEC filings. The address of the site is www.sec.gov. We use our www.investors.marqeta.com and www.marqeta.com websites, as well as our blog posts, press releases, public conference calls, webcasts, our X feed (@Marqeta), our Instagram page (@lifeatmarqeta), our Facebook page, and our LinkedIn page, as a means of disclosing material nonpublic information and for complying with our disclosure obligations under Regulation FD. The contents of our websites are not intended to be incorporated by reference into this Annual Report on Form 10-K or in any other report or document we file with the SEC, and any references to our websites are intended to be inactive textual references only.
16
Item 1A. Risk Factors
Investing in our Class A common stock involves a high degree of risk. You should carefully consider the risks and uncertainties described below, together with all of the other information in this Annual Report on Form 10-K and our Consolidated Financial Statements and the related notes and the section titled “Management’s Discussion and Analysis of Financial Condition and Results of Operations,” before making a decision to invest in our Class A common stock. Our business, results of operations, financial condition, and prospects could also be harmed by risks and uncertainties not currently known to us or that we do not currently believe to be material. If any of the risks actually occur, our business, results of operations, financial condition, and prospects could be adversely affected. In that event, the trading price of our Class A common stock could decline, and you could lose part or all of your investment.
Risk Factors Summary
Our business is subject to numerous risks and uncertainties that you should consider before investing in our company. The following is a summary of some of these risks and uncertainties. This summary should be read together with the more detailed description of each risk factor below.
•We have experienced rapid growth and our past growth rates may not be indicative of future growth rates. If we fail to manage growth effectively, our business and financial results may be adversely affected.
•Future net revenue growth depends on our ability to attract new customers and retain existing customers in a cost-effective manner.
•We participate in markets that are competitive and continuously evolving, and, if we do not compete successfully, our business, results of operations, financial condition, and future prospects may be adversely affected.
•We currently generate significant net revenue from a small number of customers, including our largest customer, Block, and the loss of any of these significant relationships or decline in net revenue from these customers, including as a result of renewals on less favorable terms, could adversely affect our business and financial results.
•We have a history of net losses and we may not be able to achieve or sustain profitability.
•Our results may fluctuate significantly and may not fully reflect the underlying performance of our business, making it difficult to accurately forecast future results. If we fail to meet the expectations of financial analysts or investors, our stock price and the value of your investment could decline.
•We rely on our relationships with Issuing Banks and Card Networks, and if we are unable to maintain these relationships, our business may be adversely affected.
•If our credit platform is inaccurate or does not perform as intended, our business may be adversely affected.
•Litigation, disputes, regulatory actions, and government or legal investigations could be costly and time-consuming to defend, and our business may be adversely affected by our involvement or the outcome of such litigation, disputes, actions, or investigations.
•If we fail to maintain an effective system of disclosure controls and procedures or internal control over financial reporting, or remediate our existing material weaknesses, our ability to report timely and accurate financial results or comply with applicable regulations could be impaired, and our business, operating results, and the price of our Class A common stock may be adversely affected.
•The trading price of our Class A common stock has been and is likely to continue to be volatile, which could cause the value of your investment to decline.
•The dual class structure of our common stock has the effect of concentrating voting control with those stockholders who hold shares of our Class B common stock, including our directors, executive officers, and their affiliates. As a result of the dual class structure of our common stock, the trading price of our Class A common stock may be depressed.
•We cannot guarantee that our share repurchase program will enhance long-term stockholder value. Share repurchases could also affect the trading price of our stock and may reduce working capital.
17
Risks Relating to Our Business and Industry
We have experienced rapid growth and our past growth rates may not be indicative of future growth rates. If we fail to manage growth effectively, our business and financial results may be adversely affected.
While we have experienced rapid net revenue growth in prior periods, our net revenue decreased in the year ended December 31, 2023. Our total net revenue was $676.2 million, $748.2 million, and $517.2 million for the years ended December 31, 2023, 2022, and 2021, respectively, a decrease of (10)% and an increase of 45% from the prior years, respectively. We believe our net revenue growth depends on several factors, including, but not limited to, our ability to:
•acquire new customers and retain existing customers on favorable terms;
•achieve widespread acceptance and use of our platform and the products and services we offer, including in markets outside of the United States;
•increase our offerings, TPV, and the number of customers and transactions on our platform;
•effectively scale our operations, including successfully integrating acquired businesses and technology;
•expand our product and service offerings;
•diversify our customer base;
•maintain and grow our network of vendors and partners, including Issuing Banks and Card Networks;
•maintain the security and reliability of our platform;
•adjust for the impact of the anticipated accounting treatment of our customer agreements and the risk that such accounting treatment may be subject to further changes or developments;
•adapt to changes in laws and regulations applicable to our business;
•adapt to changing macroeconomic conditions and evolving conditions in the payments industry; and
•successfully compete against established companies and new market entrants.
We have also historically experienced significant growth in the number of customers using our platform, the number of card programs and solutions we manage for our customers, and TPV on our platform. Our TPV was $222.3 billion, $166.3 billion, and $111.1 billion for the years ended December 31, 2023, 2022, and 2021, respectively, an increase of 34% and 50% from the prior years, respectively.
Net revenue and TPV for any prior period should not be relied on as an indication of our future performance. If our TPV and net revenue growth rates decline or continue to decline, we may not achieve profitability as expected, and our business, financial condition, results of operations, and the price of our Class A common stock would be adversely affected.
Our growth has placed, and may continue to place, significant demands on our management and our operational and financial resources. We will need to continue to grow and improve our operational, financial, and information technology controls, and our reporting systems and procedures. We will require significant capital expenditures and the allocation of valuable management resources to expand our systems and infrastructure. If we fail to manage our growth effectively, our business and financial results may be adversely affected.
Future net revenue growth depends on our ability to attract new customers and retain existing customers in a cost-effective manner.
If we are unable to attract new customers, retain existing customers on favorable terms, and grow and develop those relationships to drive increased processing volumes, our business, results of operations, financial condition, and future prospects would be adversely affected.
If we fail to attract new customers, including customers in new use cases, industry verticals, and geographies, and to expand our platform in a way that serves the needs of these customers, and to onboard them quickly, then we may not be able to continue to grow our net revenue.
18
Our customers generally are not subject to any minimum volume commitments under their contracts and have no obligation to continue using our platform, products, or services. Accordingly, these customers may have, or may enter into in the future, similar agreements with our competitors, which could adversely affect our ability to drive the processing volume and revenue growth that we seek to achieve. Some of our customer contracts provide for a termination clause that allows our customers to terminate their contract at any time following a limited notice period.
The loss of customers or reductions in their processing volumes, particularly any loss of or reductions by Block, may adversely affect our business, results of operations, and financial condition. To achieve continued growth, we must not only maintain our relationships with our existing customers, but also encourage them to renew their contracts with us and to increase adoption and usage of our products. For example, customers can have multiple card programs on our platform across different use cases and geographies. However, we cannot assure you that customers will continue to use our platform or that we will be able to continue processing transactions on our platform at the same rate as we have in the past.
We participate in markets that are competitive and continuously evolving, and, if we do not compete successfully, our business, results of operations, and financial condition, and future prospects may be adversely affected.
We operate in a highly competitive and dynamic industry and we expect competition to increase in the future as established and emerging companies continue to enter the markets we serve or attempt to address the problems that our platform addresses. We face competition along several dimensions, including providers with legacy technology platforms, such as Fidelity National Information Services (FIS), Fiserv, and Global Payments (TSYS); modern API-based providers, such as Galileo, i2c, and Visa DPS; and emerging providers, such as Adyen and Stripe. We believe that the principal competitive factors in our market include: pricing; multiple program types (debit, prepaid, credit); multinational reach; complete solutions at scale; flexibility and configurability; reliability; compliance solutions; program management; brand recognition and reputation; and industry expertise and customer service. Moreover, as we expand the scope of our platform, we may face additional competition.
Many of our existing competitors have, and some of our potential competitors could have, substantial competitive advantages such as greater brand name recognition, longer operating histories, larger sales and marketing budgets and resources, more established relationships with vendors or customers, greater customer support resources, greater resources to make acquisitions and investments, lower labor and development costs, larger and more mature intellectual property portfolios, and other substantially greater resources. Such competitors may be able to respond more quickly and effectively than we can to new or changing opportunities, technologies, standards, customer requirements, or regulatory developments. If we are unable to successfully compete, our growth could slow or decline, which would materially and adversely affect our business, results of operations, financial condition, and future prospects.
We currently generate significant net revenue from a small number of customers, including our largest customer, Block, and the loss of any of these significant relationships or decline in net revenue from these customers, including as a result of renewals on less favorable terms, could adversely affect our business, results of operations, financial condition, and future prospects.
A small number of customers account for a large percentage of our net revenue. As discussed further in the section titled “Management’s Discussion and Analysis of Financial Condition and Results of Operations,” for the years ended December 31, 2023, 2022, and 2021, Block accounted for 68%, 71%, and 69% of our net revenue, respectively.
The net revenue from Block decreased over the second half of 2023 as a percentage of our total net revenue, due to the terms of the August 2023 Block Amendment. We renewed the Block Agreement in August and November 2023, and the current term for both the Cash App and Square Debit Card programs expires in June 2028. The Block Agreement automatically renews thereafter for successive one-year periods. The August 2023 Block Amendment provides that Block is responsible for defining and managing the Cash App program with respect to the primary Card Network going forward. The August 2023 Block Amendment has, and is expected to continue to, reduce reported net revenue period-over-period comparisons through the first half of 2024.
19
However, we expect that net revenue from a relatively small group of customers, including Block, will continue to account for a significant portion of our net revenue in the near term. The concentration of a large percentage of our net revenue with a limited number of customers exposes us disproportionately to any of those customers choosing to stop using our platform or using our platform in a reduced capacity, reducing their processing volume with us, or renegotiating, terminating, or failing to renew their agreements with us, or renewing their agreements with us on different terms. For example, the August 2023 Block Amendment renewed our agreement with Block for the Cash App program on different terms, which reduced reported net revenue. Should any of those events occur, our business, results of operations, and financial condition may be adversely affected.
We have a history of net losses and we may not be able to achieve or sustain profitability.
We have incurred significant net losses since our inception, including net losses of $223.0 million, $184.8 million, and $163.9 million for the years ended December 31, 2023, 2022, and 2021, respectively. As of December 31, 2023 and December 31, 2022, our accumulated deficit was approximately $825.2 million and $602.2 million, respectively. We expect to continue to incur net losses for the foreseeable future and we may not achieve profitability. We anticipate our operating expenses to continue to increase in the foreseeable future as we hire additional personnel, adjust compensation packages to hire new or retain existing employees, expand our operations and infrastructure, and continue to enhance and expand our platform, products, and services. These initiatives may be more costly than we expect and may not result in increased net revenue. Further as we expand our offerings to additional markets, our offerings in these markets may be less profitable than the markets in which we currently operate.
In addition, as a public company, we have incurred, and we will continue to incur, additional significant legal, insurance, accounting, and other expenses that we did not incur as a private company.
From time to time, we may make decisions that may reduce our short-term operating results if we believe those decisions will improve the experiences of our customers and their end users, which we believe will improve our operating results over the long term. These decisions may not be consistent with investors’ expectations and may not produce the long-term benefits that we expect, and this may materially and adversely affect our business.
Our results may fluctuate significantly and may not fully reflect the underlying performance of our business, making it difficult to accurately forecast future results. If our results fail to meet the expectations of financial analysts or investors, our stock price and the value of your investment could decline.
Our results of operations for a given period may not fully reflect the underlying performance of our business and may fluctuate as a result of a number of factors, many of which are outside of our control and may be difficult to predict, including, but not limited to the risk factors included in this section. You should not rely on our past results as an indicator of our future performance. If our results of operations or other operating metrics fall short of the expectations of investors and financial analysts, the trading price of our Class A common stock could be adversely affected and the value of your investment could decline.
Forecasting our future results of operations can be challenging because of such fluctuations and because our net revenue depends in part on our customers’ end users. Our transaction mix adds further complexity. Our transaction mix refers to the proportion of signature debit versus PIN debit transactions and consumer versus commercial transactions that make up our TPV. In general, transactions that require a signature of the cardholder generate higher percentage-based Interchange Fees, while transactions that require a PIN generate lower percentage-based Interchange Fees. Accordingly, we may be unable to prepare accurate internal financial forecasts, and our results of operations in future reporting periods may differ materially from our estimates and forecasts or the expectations of investors or financial analysts, causing our business to suffer and our Class A common stock trading price to decline.
20
We rely on our relationships with Issuing Banks and Card Networks, and if we are unable to maintain these relationships, our business may be adversely affected.
We rely on our relationships with Issuing Banks and Card Networks to provide certain services for our platform, products, and services. We have in the past and may in the future pay certain amounts in association with these relationships, regardless of whether we were compelled to under law or contract. In addition, we have in the past and may in the future have disagreements with these financial institutions. If we are unable to maintain the quality of these relationships or fail to comply with our contractual requirements with these financial institutions, our business would be adversely affected.
A significant portion of our payment transactions are settled through a small number of Issuing Banks. For the years ended December 31, 2023, 2022, and 2021, 76%, 82%, and 90%, respectively, of TPV was settled through one Issuing Bank, Sutton Bank. If Sutton Bank terminates our agreement with them or is unable or unwilling to settle our transactions for any reason, we may be required to switch some or all of our processing volume to one or more other Issuing Banks, including to any of the other Issuing Banks that we currently contract with. Switching processing volume to another Issuing Bank would take time and could result in additional costs, which may adversely affect our business.
We also have agreements with Card Networks that, among other things, provide us certain monetary incentives based on the processing volume of our customers’ transactions routed through the respective Card Network. The timing and extent of amendments or new contracts related to our volume incentive arrangements with Card Networks could result in incentive payments that are recorded in a current period and based on volume processed in a prior period. We currently include Card Network fees in the pricing arrangements with the majority of our MxM customers. If our customers were to manage the relationship with the Card Networks directly, our reported net revenue may decrease. For example, the August 2023 Block Amendment provides that Block will be responsible for defining and managing the Cash App program with respect to the primary Card Network going forward which has the effect of reducing reported net revenue.
We intend to expand and deepen our relationships with Issuing Banks and Card Networks, and diversifying these contractual relationships and operations may increase the complexity of our operations and may also lead to increased costs. The Issuing Banks and Card Networks we work with may fail to process transactions, breach their agreements with us, or refuse to renew or renegotiate our agreements with them on terms that are favorable, commercially reasonable, or at all. They might also take actions that could degrade the functionality of our platform, impose additional costs or requirements on us, or give preferential treatment to competitive services, including their own. If we are unsuccessful in establishing, renegotiating, or maintaining relationships with Issuing Banks and Card Networks, our business may be adversely affected.
Performance issues, systems failures, and interruptions in the availability of our platform may adversely affect our business, results of operations, and financial condition.
Our continued growth depends on the efficient operation of our platform. Any significant disruption, outage, data loss, or errors in service on our platform, including events beyond our control, such as infrastructure changes or failures, or human or software errors could have a material and adverse effect on our business and financial condition. We have experienced such performance incidents in the past and expect that we will continue to periodically experience such performance issues in the future.
Our platform is designed to process a high number of transactions and deliver reports and other information related to those transactions at high processing speeds. We have in the past and may in the future experience errors, inaccuracies, or omissions in our processing, reconciling, or reporting of transactions. The risk of performance issues has increased in recent periods due to the significant increase in our TPV and increases further with new product launches and geographical expansion. We release regular updates to our platform, which have in the past contained, and may in the future contain, undetected errors, failures, and bugs. Any platform performance issues could lead to claims by customers, Card Networks, Issuing Banks, or other partners or vendors, or other claims, regulatory fines, or proceedings. It could also damage ours and our customers’ businesses and, in turn, hurt our brand and reputation.
21
The performance and availability of the data centers and cloud-based solutions that provide computing and storage infrastructure for our platform is outside of our control. If any of these infrastructure providers fail to provide sufficient capacity to support our platform or otherwise experience service outages, we may experience interruptions in our ability to operate our platform and our business could be adversely affected. We have experienced, and expect to continue to periodically experience, outages of the services provided by these providers.
If we are not able to maintain the level of service uptime and performance needed by our customers, they could face longer processing times or downtime as a result. If customers are unable to access our platform within a reasonable amount of time, or at all, we may not be able to meet the service level commitments typically provided for in our customer contracts and we would be contractually obligated to provide service level credits. We have experienced incidents, including incidents outside our control, and expect we may experience incidents in the future requiring us to pay service level credits and other customer service concessions.
In addition, our insurance policies may not adequately compensate us for any losses that we may incur as a result of damage or interruption. Further, we are continuing to refine our enterprise resilience functions such as business continuity, crisis management, and disaster recovery. Our disaster recovery plan has not been tested under actual disaster conditions, and we may not have sufficient capacity to recover all data and services in the event of an outage. Therefore, any performance issue, systems failure, outage, or interruption in the availability of our platform would adversely affect our business, and could subject us to financial penalties and liabilities.
Any real or perceived improper or unauthorized use of, disclosure of, or access to our or our customers’ and partners’ confidential, proprietary, or sensitive data, including by cyberattacks, security breaches or incidents, or employee or other misconduct, could expose us to liability and damage our reputation.
Our operations depend on receiving, storing, transmitting, and otherwise processing sensitive information pertaining to our business, employees, customers, and customers’ end users. The confidentiality, integrity, and availability of such information residing on or processed using our systems is important to our business. While we have an internal security program, the success of such program will be impacted by new and existing vulnerabilities, human error, resource constraints, the efficiency of our processes and procedures, and management of gaps in controls. The integrity of our internal security program is also subject to changing standards or interpretations of standards as new frameworks are introduced and existing frameworks evolve.
We use vendors to perform certain services for us, in some cases involving management or other processing of sensitive data, and these vendors face similar security threats to the confidentiality, security, and integrity of their systems and the data they process for us. Unauthorized parties have attempted and will continue to attempt to gain access to our platform, systems, or facilities, and those of our customers, partners, and vendors using a variety of methods such as denial-of-service attacks, phishing attacks and other forms of social engineering, and ransomware and other malicious code.
Any attempted, perceived or actual breach or incident could disrupt our systems and other aspects of our operations, result in unauthorized or unlawful access to or loss, modification, unavailability, misuse, or other unauthorized processing of our and our customers’ data, have a significant impact on our reputation as a trusted brand, and expose us to legal risk and potential liability, and costs associated with remediation. Further, if there is a breach of payment card information that we store, process, or transmit or that is stored, processed, or transmitted by our customers or other third parties that we do business with, we could be liable to the Issuing Banks or our customers for certain of their costs and expenses, in addition to the potential for fines, penalties, and other liabilities.
22
While we believe that none of the incidents that we have identified to date have materially impacted us, we cannot be certain that the security measures we have in place to detect and address security breaches, incidents, and other disruptions and protect sensitive data will be sufficient to counter the risks and threats facing us, our customers, and our vendors. We and our vendors may be unable to anticipate, react to, remediate, or otherwise address any actual or attempted security breach or other security incident in a timely manner, or implement adequate preventative measures. Any security breach or incident involving our systems or data, or those of our customers or vendors, could have a material adverse effect on our business, results of operations, and financial condition. Even the perception of inadequate security may damage our reputation and negatively impact our ability to gain new customers and retain existing customers. We expect to invest significant resources to maintain and enhance our information security program and controls in compliance with industry standards and applicable laws and regulations; however, if we experience resourcing constraints, our investments and the result of such investments may be delayed.
We have adopted a flexible-first work environment, and expect to continue to be subject to challenges and risks associated with having a remote workforce. For example, our employees are accessing our servers remotely through home or other networks to perform their job responsibilities. Such security systems may be less secure than those used in our offices, which may subject us to increased security risks, and expose us to risks of data or financial loss and associated disruptions to our business operations. In addition, any inability to track and manage hardware and software assets across our remote workforce could lead to loss of intellectual property, a security breach or incident, and unauthorized access to our systems and applications, potentially adversely affecting our business and financial condition.
While we maintain cybersecurity insurance, our insurance may be insufficient to cover all liabilities incurred by a cybersecurity breach or incident. We cannot be certain that our insurance coverage will be adequate for liabilities actually incurred, that insurance will continue to be available to us on economically reasonable terms, or at all, or that an insurer will not deny coverage as to any future claim. If a claim exceeds available insurance coverage or if the conditions of our insurance policies change, our business or financial condition could be adversely affected.
Our business depends on a strong and trusted brand, and any failure to maintain, protect, enhance, and market our brand would hurt our business.
Negative publicity about us or our industry could adversely affect our business, results of operations, financial condition, and future prospects. We have developed a strong and trusted brand that has contributed significantly to the success of our business. We believe that maintaining and promoting our brand in a cost-effective manner is important to the continued growth of our business.
Any failure to maintain high quality customer support, or a market perception that we do not maintain high quality customer support, could erode customer trust and adversely affect our reputation, business, results of operations, and financial condition. If we do not devote sufficient resources or are otherwise unsuccessful in assisting our customers effectively, it could adversely affect our ability to retain existing customers and could prevent prospective customers from adopting our platform.
Harm to our brand can arise from many other sources as well, including inadequate protection or misuse of sensitive information, compliance failures, litigation, and other claims, and misconduct by our employees, contractors, or vendors. We may also be the target of incomplete, inaccurate, and misleading or false statements about our company and our business that could damage our brand and deter customers from adopting our services. As a result, our business, results of operations, financial condition, and future prospects would be materially and adversely affected.
Our new products and technologies have a limited performance history, and any failure to execute on our related strategy could have an adverse impact on our business and financial condition.
We acquired Power Finance in the first quarter of 2023 and released our credit card issuing platform publicly in October 2023. Net revenue growth attributed to credit card issuing is dependent on increasing the number of existing customers or new customers who use our credit card issuing capabilities. We have limited experience administering our credit card issuing platform, and failure to scale the platform due to our limited experience or a competitive market could adversely affect our business and financial results.
23
Our failure to accurately predict the demand or growth of new products and technologies could have a material and adverse effect on our business, results of operations, financial condition, and future prospects. New products and technologies are inherently risky, due to, among other things, risks associated with: the product or technology not working, or not working as expected; customer acceptance; technological outages or failures; increased regulatory scrutiny; and the failure to meet customer expectations. As a result of these risks, we could experience increased claims, reputational damage, or other adverse effects, which could be material. In addition, our investment in new products and technologies and making changes or updates to our platform may either be insufficient or result in expenses that exceed the revenue actually generated from these new products.
If our credit platform is inaccurate or does not perform as intended, our business may be adversely affected.
The success of our credit platform depends on our ability to effectively manage related risks for us and our Issuing Banks. While the Issuing Banks we work with bear the credit risk, they rely on our credit decisioning engine and managed services to underwrite and service credit card programs in accordance with their credit policies. Numerous factors, many of which are outside of our control, can adversely affect the evaluation of credit risk. The information we use in our credit platform may be inaccurate or incomplete as a result of error or fraud, both of which may be difficult to detect and avoid. If a fraudulent applicant is approved based on our credit risk model, we may be liable for the losses incurred by the Issuing Bank, which could adversely affect our business and results of operations.
There may be risks that exist, or that develop in the future, including market risks, interest rate risks, economic risks, and other external events, that we have not appropriately anticipated, identified, or mitigated that would impact our Issuing Bank partners or our ability to offer credit products. If our credit risk tools do not effectively and accurately model the credit risk of potential cards issued by our Issuing Banks, greater than expected losses may result on such card programs and, as a result, our customers may stop marketing their card programs, potential customers may be less likely to initiate card programs, and Issuing Banks may stop using our platform for credit card issuing. Further, if our credit platform does not operate as intended or is inaccurate, it may be alleged that we and/or our bank partners have failed to comply with applicable laws and regulations, we and/or our bank partners may be subject to litigation or regulatory investigations or other proceedings, we and/or our bank partner may have to pay fines and penalties or become subject to civil or criminal liability or have additional obligations or restrictions imposed upon our respective businesses, and our customer relationships and reputation may be adversely affected, which could have a material adverse effect on our business, results of operations, and financial condition.
The Issuing Banks face the risk that our customers’ cardholders will default on their payment obligations, creating the risk of potential charge-offs. While we are not contractually obligated to pay for any credit-related delinquencies or charge-offs, we have in the past and may in the future make payments to our Issuing Banks in association with our relationship with them, regardless of whether we were compelled to under law or contract. Incremental charge-offs may also affect the Issuing Bank’s future credit decisioning which could impact the volume of transactions processed and the number of cards issued. This may adversely affect our business and results of operations.
If we fail to anticipate, adapt to, or keep pace with new technologies and develop new services and capabilities for our platform, our business and future growth could be harmed.
We compete in an industry that is characterized by rapid technological changes, frequent introductions of new products and services, and evolving industry standards and regulatory requirements. Our ability to attract new customers and increase net revenue will depend in significant part on our ability to adapt to industry standards, anticipate trends, and continue to enhance our platform and introduce new products and capabilities on a timely and secure basis to keep pace with technological developments and customer expectations. We must also keep pace with changing legal and regulatory regimes that affect our platform, products, services, and business.
It is also important for us to implement tools to support the operational efficiency of our platform. For example, in the past year generative artificial intelligence (“AI”) solutions have emerged as an opportunity for us, our customers, our partners, and our vendors to innovate more quickly and efficiently and better serve our customers. Rapid adoption and novel uses of generative AI may, however, introduce unique and unpredictable security risks to our systems and platform, products, and services.
24
Our business could be adversely affected if we are not successful in developing modifications, enhancements, and improvements, in bringing them to market quickly or cost-effectively, or at modifying our platform to remain compliant with applicable legal and regulatory requirements. Our business could also be harmed if we experience unintended consequences with the enhancements we provide or use.
We may continue to expand operations internationally where we have limited operating experience and may be subject to increased business, economic, and regulatory risks that could adversely impact our operations and financial results.
We have offices in the United States and United Kingdom (“U.K.”), and legal entities in various other global jurisdictions, and we may pursue further international expansion of our business in new international markets where we have limited or no experience in marketing, selling, employing personnel, and deploying our platform, products, and services. Managing international operations requires us to comply with new regulatory frameworks, additional regulatory hurdles, and implement additional resources and controls. Our business model may not be successful or have the same traction outside the United States. International expansion subjects our business to additional risks, including:
•failure to anticipate competitive conditions and competition with market players that have greater experience in the local markets than we do or that have pre-existing relationships with potential customers and investors in those markets;
•conforming our platform with applicable business customs and languages;
•increased costs and difficulty in protecting intellectual property and sensitive data;
•increased costs from local Card Networks, BIN sponsors, vendors, and other local providers;
•potential changes to our established business and pricing models;
•the ability to support and integrate with local BIN sponsors and other service providers;
•difficulties in managing foreign operations;
•increased travel, infrastructure, and legal and compliance costs;
•difficulties in recruiting and retaining qualified personnel;
•difficulties in gaining acceptance from industry self-regulatory bodies;
•risks related to government regulations in and related to foreign jurisdictions, including compliance with multiple, potentially conflicting, and changing laws and regulations;
•Interchange Fee regulation in foreign jurisdictions;
•exchange rate risk and global market volatility;
•potential restrictions on repatriation of earnings;
•management of tax consequences; and
•political, social, and/or economic instability or military conflict.
As a result of these risks, we may not be successful in managing our existing international operations or expanding our international operations, and our business and financial condition could be adversely affected.
We may incur losses relating to the settlement of payment transactions on our platform.
We settle funds on behalf of our customers on a daily basis for a variety of transaction types. We are and will continue to be subject to the risk of losses relating to the day-to-day settlement of payment transactions, including with respect to pre-funding and chargeback requests as well as human or processing error. If transactions or settlement reconciliations are not performed timely or are inaccurate due to human or processing error, we could incur losses.
While customers deposit a certain amount of pre-funding into bank accounts at our Issuing Banks, depending on the model of the card program and the timing of funding and transactions, some transactions may be authorized in an amount that exceeds the pre-funding in the customer’s account.
Customers are ultimately responsible for fulfilling their obligations to fund transactions. However, when a customer does not have sufficient funds to settle a transaction, we may be liable to the Issuing Bank to settle the transaction, including fraudulent or disputed transactions, and may incur losses as a result of claims from the Issuing Bank. We would seek to recover such losses from the customer, but we may not fully recover them if the customer is unwilling or unable to pay.
25
Additionally, when a chargeback request is approved, the purchase price of the transaction is refunded to the customer’s end user’s account through our platform. If we do not properly process the chargeback, the customer may request that we fund the refunded amount to their end user. We have in the past, and may in the future, incur costs relating to the improper processing of chargeback requests. The costs we incur related to our settlement obligations may adversely affect our business and financial condition.
We may incur losses relating to illegal and fraudulent activity on our platform.
Our resources, technologies, and fraud prevention tools may be insufficient to accurately detect and prevent fraud on our platform. We have programs to vet and monitor our potential customers and the transactions we process for them, but such programs may not be effective in detecting and preventing fraud or illegitimate transactions. Illegitimate transactions or illegal activities such as money laundering or terrorist funding can expose us to governmental and regulatory enforcement actions and potentially prevent us from satisfying our contractual obligations to our third-party partners, which may cause us to be in breach of our obligations.
The techniques used to perpetrate fraud on our customers and our platform are continually evolving, and we expend considerable resources to continue to monitor and combat them. Criminals may commit fraud using techniques such as stolen identities and bank accounts, compromised business email accounts, employee or insider fraud, account takeover, false applications, check fraud, “skimming,” counterfeit payment cards, and stolen cards or card account numbers. Fraud or theft involving cards issued through our platform or as a result of actions by our employees or contractors could result in financial losses, civil or criminal liability, reputational damage, harm to our business, or increasing costs related to remediation or more rigorous compliance obligations. Fraudulent activity could also result in the imposition of regulatory sanctions, including significant monetary fines, or other operating losses, all of which could have a material adverse effect on our business, results of operations, and financial condition.
Failure to attract and retain key personnel, including senior management and other highly skilled employees, could adversely affect our business.
Our future success depends on our ability to identify, hire, develop, motivate, and retain highly qualified personnel for all areas of our organization. Competition for highly skilled employees is intense as these employees are in high demand and may be in short supply. We have from time to time experienced, are currently experiencing, and we expect to continue to experience difficulty in hiring and retaining employees with appropriate qualifications, at a speed that is consistent with our business needs, and at an appropriate cost. Our labor expenses may increase as a result of a shortage in the supply of qualified personnel.
In addition, job candidates and existing employees often consider the value of the equity awards they receive in connection with their employment. If the value of our equity awards declines, it may impair our ability to recruit and retain highly skilled employees. If we are not able to add and retain employees effectively, our ability to achieve our strategic objectives will be adversely affected, and our business and growth prospects will be adversely affected.
The majority of our employees operate in a remote capacity, and we expect to continue to be subject to challenges and risks associated with having a remote workforce. For example, operating our business with both remote and in-person workers across different geographies and time zones could have a negative impact on our corporate culture, decrease the ability of our workforce to collaborate and communicate effectively, decrease innovation and productivity, or negatively affect workforce morale.
Changes in our executive management team may also disrupt our business. Any employment agreements we have with our executive officers or other key personnel do not require them to continue to work for us for any specified period and, therefore, they could terminate their employment with us at any time. We have in the past, and may in the future, experience high attrition and turnover rates across the Company, including executive officers and other key personnel. The loss of these employees may lead to a decrease in institutional knowledge which may adversely affect our business. Additionally, we do not maintain any key person insurance policies.
26
We may require additional capital to support our business, and this capital might not be available on acceptable terms, if at all.
We intend to continue to make investments to support our business and may require additional funds. In particular, we may seek additional funds to develop new products and enhance our platform and existing products, expand our operations, improve our infrastructure, or acquire complementary businesses, technologies, services, products, and other assets. In addition, we are using a portion of our cash to satisfy tax withholding and remittance obligations related to the vesting of RSUs. Accordingly, we may need to engage in equity or debt financings to secure additional funds.
Any new equity securities we issue could have rights, preferences, and privileges superior to those of holders of our Class A common stock and Class B common stock. Any debt financing that we may secure in the future could involve restrictive covenants relating to our capital raising activities and other financial and operational matters, potentially making it more difficult for us to obtain additional capital and to pursue business opportunities. We may not be able to obtain additional financing on terms favorable to us, if at all. Disruptions in the credit markets or other factors, such as inflation or rising interest rates, could adversely affect the availability, diversity, cost, and terms of funding arrangements.
In addition, actual events involving limited liquidity, defaults, non-performance, or other adverse developments that affect financial institutions, transactional counterparties, or other companies in the financial services industry or the financial services industry generally, or concerns or rumors about any events of these kinds or other similar risks, have in the past and may in the future lead to market-wide liquidity problems. The ultimate outcome of these events cannot be predicted, but these events could have a material adverse effect on our business. The FDIC only insures up to $250,000 per depositor per insured bank, and we currently have cash deposited in certain financial institutions in excess of FDIC insured levels. If any of the banking institutions in which we have deposited funds ultimately fails, we may lose our deposits over $250,000. Further, certain banks may be under regulatory orders and may not be able to support us due to regulatory challenges. The loss of our deposits at such banks may have a material adverse effect on our business, financial condition, and liquidity.
We have in the past and may in the future make investments in investment-grade securities. If such investments are not diversified or are concentrated at an “at-risk” institution, we may experience losses and may not be able to liquidate such investments.
If we are unable to obtain adequate financing or financing on terms satisfactory to us when we require it, our ability to continue to support our business growth, scale our infrastructure, develop product enhancements, and respond to business challenges could be significantly impaired, and our business, results of operations, and financial condition may be adversely affected.
Strategic transactions, including acquisitions, investments, partnerships, and collaborations, could fail to achieve strategic objectives, divert the attention of management, disrupt our ongoing operations, dilute stockholder value, and may adversely affect our business and financial results. We may be unable to successfully integrate any acquired businesses and technology.
We have in the past and may in the future acquire or invest in businesses, products, or technologies that we believe could complement our platform, products, and services, expand our geographic reach or customer base, or otherwise offer growth opportunities. For example, we acquired Power Finance Inc. in February 2023. The identification, pursuit, evaluation, and negotiation of potential strategic transactions may divert the attention of management and entail various expenses, whether or not such transactions are ultimately consummated. Any acquisition, investment, or business relationship may result in unforeseen operating difficulties and expenditures or require us to make adjustments to our or the acquired company's business models. There can be no assurance that we will be successful in identifying, negotiating, and consummating favorable transaction opportunities or successfully integrating the acquired personnel, operations, and technologies, or effectively scaling and managing the combined business following the acquisition.
27
Specifically, we may not successfully evaluate or utilize the acquired technology or personnel from an acquired business and we may be unable to retain key personnel after a transaction, including personnel who are critical to the success of the ongoing business. We may not accurately forecast the financial impact of an acquisition transaction. Moreover, the anticipated benefits, growth, or synergies of any acquisition, investment, or business relationship may not be realized or we may be exposed to unknown risks or liabilities. If we invest in companies that do not succeed, our investments may lose all or some of their value, which could result in us recording impairment charges reflected in our results of operations.
Litigation, disputes, regulatory actions, and government or legal investigations could be costly and time-consuming to defend, and our business may be adversely affected by our involvement or the outcome of such litigation, disputes, actions, or investigations.
In the ordinary course of business, we have been, are currently, and in the future may be, involved in litigation or disputes. We have also received and may in the future receive, inquiries, warrants, subpoenas, and other requests for information in connection with government investigations. Such claims, disputes, lawsuits, proceedings, and investigations could involve matters relating to employment, wage and hour, commercial, antitrust, securities, the duties of officers or directors, regulatory compliance, and other matters. The number and significance of litigation, regulatory, and government or legal investigation matters and disputes may increase as our business expands. We also had in the past, have currently, and may have in the future indemnification obligations as a result of our contracts with customers and partners that may require us to reimburse or pay for damages, fees, or other expenses associated with claims, lawsuits, proceedings, and investigations such customers and partners face.
Further, our liability insurance may not cover all potential claims made against us or third parties or be sufficient to cover us for all liability that may be imposed. A claim brought against us or third parties that is uninsured or under-insured could result in unanticipated costs. The costs associated with litigation, disputes, regulatory actions, and government or legal investigations can also be unpredictable depending on the complexity of the matter, the resources needed to manage it, and length of time devoted to it. These matters may also divert management’s attention and operational resources, could harm our reputation regardless of the outcome, and might seriously harm our business, overall financial condition, and operating results. We cannot assure you that any actual or potential litigation, claims, disputes, investigations, or proceedings will not have a material adverse effect on our business, results of operations, and financial condition.
We rely on third parties to provide certain products and services, and their failure to perform those services or comply with legal or regulatory requirements could adversely affect our business and financial results.
We depend on services from various third-party vendors to provide our products and services. Any disruptions in these services, including as a result of actions outside of our control, would significantly impact the continued performance of our platform.
We conduct vendor due diligence and manage such vendors using a risk-based approach intended to determine if relevant vendors have the ability to implement and maintain appropriate security measures, consistent with all applicable laws, to implement and maintain reasonable security measures in connection with their work with us, and to promptly report to us any suspected breach of their security measures that may affect our business. If we are unable to timely and accurately identify at-risk vendors or if a service provider fails to properly safeguard our data or intellectual property, fails to meet contractual requirements (including compliance with applicable laws and regulations), suffers a cyberattack, security breach or incident, or other system outage or interruption, or terminates its contract with us, we could be subject to claims from customers and other third parties or regulatory enforcement actions, and such incidents may also put information we process at risk which could in turn adversely affect our business, reputation, financial condition, or results of operations.
In some cases, vendors are the sole source, or one of a limited number of sources, of the services they provide to us. In the future, these services may not be available to us on commercially reasonable terms, or at all. Any loss of any of these services could adversely affect our business and we may incur additional costs to resolve the issue.
28
Indemnity provisions in various agreements potentially expose us to substantial liability and risk of loss.
Our agreements with Issuing Bank partners and customers include indemnification provisions under which we agree to indemnify them for losses or expenses suffered or incurred in certain circumstances, including, for example, in relation to claims arising out of the breach of such agreements, services to be provided by us, or from intellectual property infringement claims made by third parties. Some of these agreements provide for uncapped liability for indemnification claims and some indemnity provisions survive termination or expiration of the applicable agreement. In some cases, we have in the past and could continue to be exposed to liability or indemnification claims from our customers or partners in connection with the services we provide. Large payments to partners or customers could harm our business, results of operations, and financial condition. Any dispute with a partner or customer with respect to these obligations could have adverse effects on our relationship with that partner or customer and other existing or prospective partners and customers, and harm our business and results of operations. Further, although we carry insurance, our liability insurance may not cover all potential claims made against us or be sufficient to cover us for all liability that may be imposed, and any such coverage may not continue to be available to us on acceptable terms or at all.
If our estimates or judgments relating to our accounting policies prove to be incorrect, our results of operations could be adversely affected.
The preparation of financial statements in conformity with generally accepted accounting principles (“GAAP”) requires management to make estimates and assumptions that affect the amounts reported in the Consolidated Financial Statements and accompanying notes. We base our estimates in part on historical experience, market observable inputs, if available, and various other assumptions that we believe to be reasonable under the circumstances. The results of these estimates form the basis for making judgments about the carrying values of assets, liabilities and equity, and the amount of net revenue and expenses that are not readily apparent from other sources. Assumptions and estimates used in preparing our Consolidated Financial Statements include those related to revenue recognition, accounting for business combinations and share-based compensation. If we make incorrect assumptions or estimates, our reported financial results may be over- or understated, which could materially and adversely affect our business, financial condition and results of operations. Our results of operations may also be adversely affected if our assumptions change or if actual circumstances differ from those in our assumptions, which could cause our results of operations to fall below the expectations of securities analysts and investors, resulting in a decline in the trading price of our Class A common stock.
29
Risks Relating to Regulation
Our business is subject to extensive regulation and oversight in a variety of areas, directly and indirectly through our relationships with Issuing Banks and Card Networks, which regulations are subject to change and to uncertain interpretation. Compliance with such laws and regulations could result in additional costs and any failure to comply could materially harm our business and financial condition.
We, our vendors, our partners, and our customers are subject to a wide variety of laws, regulations, and industry standards, including supervision and examination with respect to the foregoing by multiple authorities and governing bodies and in multiple countries, which govern numerous areas important to our business. While we currently operate our business in an effort to ensure our business itself is not subject to the same level of regulation as the Issuing Banks and Card Networks that we partner with, Issuing Banks and Card Networks operate in a highly regulated environment, and there is a risk that those regulations could become applicable to or impact us.
As a program manager, we are responsible for aligning compliance with Issuing Bank requirements and Card Network rules, and we help create regulatory compliant card programs for our customers. In some cases, we have in the past and could continue to be exposed to liability or indemnification claims from our customers or partners in connection with the services we provide.
We are directly, and indirectly through our contractual relationships with customers, Issuing Banks, and Card Networks, subject to regulation in areas which may include privacy, data protection and information security, global sanctions regimes and export controls, and anti-bribery, and those relating to payments services (such as payment processing and settlement services), AI, consumer protection, AML, escheatment, and compliance with PCI DSS.
As our business and platform continue to develop and expand, we may become subject to additional laws, rules, regulations, and industry standards, including possible additional examination and supervision, in the United States and internationally. New or changing laws or regulations could require us to incur significant expenses and devote significant management attention to ensure compliance and could also prompt our Issuing Banks to alter their dealings with us in ways that may have adverse consequences for our business.
We may not be able to respond quickly or effectively to, or accurately predict the scope or applicability of, regulatory, legislative, or other developments, which may in turn impair our ability to offer our existing or planned features, products, and services and/or increase our cost of doing business. In addition, we may become subject to audits, inquiries, whistleblower complaints, adverse media coverage, investigations, or criminal or civil sanctions, all of which may have an adverse effect on our reputation, business, results of operations, and financial condition.
As a result of our business relationships, we may also be subject to direct or indirect supervision and examination by various authorities. The CFPB, for example, has indicated it has dormant authority to examine certain companies whose services may pose risk to consumers, which may include our company. The CFPB has also published guidance on third party risk management, which places additional vendor compliance oversight expectations for certain companies operating in the financial services industry. As a program manager, we may be viewed as overseeing third party relationships on behalf of our Issuing Banks and, as such, it is possible that regulators could hold us responsible for actual or perceived deficiencies in our oversight and control of third party relationships. New or expanded regulation or changes in interpretation or enforcement of existing regulations may have an adverse effect on our business, results of operations, and financial condition due to increased compliance costs and new restrictions affecting the offering of our platform, products and services.
Further, while we do not handle or interact with cryptocurrency and we only process transactions on our platform in fiat currencies, certain cryptocurrency businesses use our platform to provide card products to their customers and end users. The regulation of cryptocurrency is rapidly evolving and varies significantly among jurisdictions and is subject to substantial uncertainty. Various legislative and executive bodies in the U.S. and other countries may adopt laws, regulations, or guidance, or take other actions, which may impact our Issuing Banks and restrain the growth of cryptocurrency businesses and in turn impact the net revenue associated with our cryptocurrency business customers.
30
While we have developed policies and procedures designed to assist in compliance with laws and regulations, no assurance can be given that our compliance policies and procedures will be effective. If we fail to comply or are alleged or perceived to have failed to comply with applicable laws and regulations, we may be subject to litigation or regulatory investigations or other proceedings, we may have to pay fines and penalties or become subject to civil or criminal liability or have additional obligations or restrictions imposed upon our business, and our customer relationships and reputation may be adversely affected, which could have a material adverse effect on our business, results of operations, and financial condition. In some cases, regardless of fault, it may be less time-consuming or costly to settle these matters, which may require us to implement certain changes to our business practices, provide remediation to certain individuals, or make a settlement payment to a given party or regulatory body.
Laws, regulations, and industry standards related to privacy and data protection, and our actual or perceived failure to comply with such obligations, could adversely affect our business and financial results.
Governmental bodies and industry organizations in the United States and abroad have adopted, or are considering adopting, laws and regulations governing the use of, and requiring safeguarding of, personal information. We also are and may become subject to contractual obligations relating to privacy, data protection, and information security.
For example, we are subject to the California Consumer Privacy Act (“CCPA”), as amended and supplemented by the California Privacy Rights Act, which imposes significant restrictions on the collection, processing, and disclosure of personal information, including imposing increased penalties related to data privacy incidents. Other U.S. states have also passed or are considering privacy legislation, including omnibus privacy legislation similar to the CCPA, and industry organizations regularly adopt and advocate for new standards in these areas.
In Europe, we are subject to the General Data Protection Regulation (“GDPR”) which extends the scope of E.U. data protection law to all companies processing data of individuals within the E.U., regardless of the company’s location, and requires companies to meet stringent requirements regarding the handling of personal data. The U.K. has also adopted a law substantially implementing the GDPR as part of its local data protection law, referred to as the U.K. GDPR. The GDPR imposes substantial obligations and risk upon our business and provides for significant penalties in the event of any non-compliance. The GDPR and other laws and regulations in the E.U., the U.K., and elsewhere also impose limitations on international transfers of personal data. We continue to monitor and assess evolving regulatory guidance and other developments related to our data transfer mechanisms, and it is possible that our ability to transfer personal data will be impacted or challenged as such requirements evolve. Any inability to transfer personal data in compliance with these requirements may require us to modify our policies and practices and may otherwise adversely affect our business.
Current or future laws, regulations, contractual obligations, and industry standards or other frameworks may impose, or be asserted to impose, requirements that are inconsistent with our data management and processing practices or the operation of our products and services. While we have incurred and expect to continue to incur substantial expense in complying with new and evolving privacy and data protection laws and frameworks, we may not be successful in our efforts to achieve compliance. If we fail or are alleged to have failed to comply with these laws, regulations, frameworks, or other actual or asserted obligations, we may be subject to regulatory investigations, enforcement actions, and other proceedings, civil litigation, claims, and demands, and fines and other penalties, all of which may result in additional cost and liability to us, damage our reputation, and adversely affect our business.
We may also be required to make additional, significant changes in our policies and business operations, such as modifying products and services, our data processing practices or policies, or otherwise restricting our operations, which we may be unable to complete on a commercially reasonable basis or at all, and our potential liability in connection with non-compliance with laws, regulations, contractual obligations, and frameworks may increase, all of which could have a material adverse effect on our business, results of operations, and financial condition.
31
A portion of our net revenue is derived from Interchange Fees and changes in Interchange Fees or Interchange Fee regulation could adversely affect our business, results of operations, and financial condition.
A portion of our net revenue is derived from Interchange Fees and the amount of Interchange Fees we earn is highly dependent on the interchange rates that the Card Networks set and adjust. Interchange Fees and assessments are subject to change from time to time by the Card Networks and due to government regulation. Interchange Fees are the subject of intense legal and regulatory scrutiny and competitive pressures in the electronic payments industry. For example, the Durbin Amendment may restrict or otherwise impact the way we do business or limit our ability to charge certain fees to customers. Issuing Banks that are exempt from the Interchange Fee restrictions in the Durbin Amendment are able to access higher interchange rates. As a result, to maximize our Interchange Fees, we generally only contract with Issuing Banks that are subject to this exemption from the Durbin Amendment when we provide MxM services for debit and prepaid card programs. Interchange Fee regulation also exists in other countries where our customers use payment cards and such regulation could adversely affect our business in other foreign regions. Any changes in the Interchange Fees associated with our customers’ card transactions could adversely affect our business, results of operations, and financial condition.
Changes to the rules or practices set by Card Networks or our failure to comply with their rules and practices could adversely affect our business.
We are required to comply with the rules set by the Card Networks. The termination of the card association registrations held by us or any of our Issuing Banks or any changes to these Card Network rules or their interpretation could have a significant impact on our business and financial condition. If we fail to make required changes or otherwise resolve an issue with the Card Networks, the Card Networks could charge us additional fees. We have been charged such additional fees in the past, and expect to continue to be charged such fees in the future as Card Network rules change. These additional fees are considered costs of revenue. We could also be fined and our registrations or certifications could be suspended or terminated which could limit our ability to process transactions and could have a material adverse effect on our business and results of operations.
We are subject to anti-money laundering, anti-bribery and corruption (“AB&C”), sanctions, and similar laws, and non-compliance with such laws and regulations can subject us to criminal penalties or significant fines, adversely affect our business and reputation, or have other adverse consequences for us.
We can be held liable under AML, AB&C, sanctions, and similar laws for the corrupt or illegal activities of our third-party intermediaries and our employees, representatives, contractors, partners, and agents, even if we do not authorize such activities. While we have programs and controls designed to comply with applicable AML, AB&C, and sanctions laws and regulations, we cannot assure you that our programs and controls will be effective in ensuring compliance and that none of our third-party intermediaries or employees, representatives, contractors, partners, and agents will take actions in violation of those controls and laws. Ours or these third parties’ failure to comply with these laws and regulations could result in a breach and/or termination of our agreements with Issuing Banks and customers and/or fines or penalties by governmental agencies, which would have a material adverse effect on our business, results of operations, and financial condition.
We may be subject to governmental export controls and economic sanctions regulations that could impair our ability to compete in international markets and could subject us to liability if we fail to comply.
Certain of our products and services may be subject to export control and economic sanctions regulations, including the U.S. Export Administration Regulations, and various economic and trade sanctions regulations administered by the U.S. Department of the Treasury’s Office of Foreign Assets Control. If we fail to comply with these laws and regulations, we and certain of our employees could be subject to substantial civil or criminal penalties, including the possible loss of export privileges, fines imposed on us and responsible employees, and, in extreme cases, the incarceration of responsible employees.
32
Changes in applicable export or economic sanctions regulations, shifts in the enforcement or scope of existing regulations, or change in the countries, governments, persons, or technologies targeted by such regulations may create delays in the introduction and deployment of our platform and existing or future products and services in international markets, or, in some cases, prevent or decrease the use of our platform and existing or future products or provision of existing or future services in certain countries or with certain end users. Any decreased use of our platform, products, or services or limitation on our ability to provide our platform, products, or services could adversely affect our business, results of operations, and financial condition.
Further, we incorporate encryption technology into certain of our products. Various countries regulate the import of certain encryption technology, including through import permitting and licensing requirements, and have enacted laws that could limit our customers’ ability to use our products in those countries if our products are subject to such laws and regulations. While we believe our encryption products meet certain exceptions that reduce the scope of export control restrictions applicable to such products, these exceptions may be determined not to apply to our encryption products and our products and underlying technology may become subject to export control restrictions. Governmental regulation of encryption technology and regulation of exports of encryption products, or our failure to obtain required approval for our products, when applicable, could adversely affect our international sales and net revenue.
If we fail to maintain an effective system of disclosure controls and procedures or internal control over financial reporting, or remediate our existing material weaknesses, our ability to report timely and accurate financial results or comply with applicable regulations could be impaired, and our business, operating results, and the price of our Class A common stock may be adversely affected.
The Sarbanes-Oxley Act of 2002 requires, among other things, that we maintain effective disclosure controls and procedures and to report any material weakness in our internal controls over financial reporting.
In the period ended March 31, 2023, we identified a material weakness related to the accounting for our acquisition of Power Finance, and, for the period ended December 31, 2023, we identified a material weakness related to information technology general controls. See Part II, Item 9A “Controls and Procedures” for additional information about these material weaknesses.
The process of designing and implementing effective internal controls and disclosure controls is a continuous effort. To maintain and improve the effectiveness of our disclosure controls and procedures and remediate the material weaknesses in our internal control over financial reporting, we have expended, and anticipate that we will continue to expend, significant resources, including technology- and accounting-related costs and significant management oversight. If any of our controls and systems do not perform as expected, we may experience additional material weaknesses or we may be unable to remediate the existing material weaknesses. In addition, testing and maintaining internal controls and disclosure controls may divert management’s attention from other matters that are important to our business.
Any failure to implement and maintain effective internal control over financial reporting could cause us to fail to meet our reporting obligations on a timely basis, result in material misstatements in our consolidated financial statements, have an adverse effect on our business and operating results, and could cause investors to lose confidence in us, all of which could cause a decline in the price of our Class A common stock. We could also become subject to investigations by Nasdaq, the SEC, or other regulatory authorities, which could require additional financial and management resources, and we may not be able to remain listed on Nasdaq.
Changes in financial accounting standards or practices may cause adverse, unexpected financial reporting fluctuations and affect our results of operations.
A change in accounting standards or practices may have a significant effect on our results of operations or financial condition and may affect our reporting of transactions completed before the change is effective. New accounting pronouncements and varying interpretations of accounting pronouncements have occurred and may occur in the future. Changes to existing rules or practices may adversely affect our reported results of operations or the way we conduct our business.
33
Adoption of these types of accounting standards and any difficulties in implementation of changes in accounting principles, including the ability to modify our accounting systems, could cause us to fail to meet our financial reporting obligations, potentially resulting in regulatory discipline and weakening investors’ confidence in us.
Changes in tax laws or regulations could have a material adverse effect on our business, results of operations, and financial conditions.
The rules addressing taxation are constantly under review by the legislature, the Internal Revenue Service, the U.S. Department of the Treasury, and state, local, and non-U.S. tax authorities. For example, beginning on January 1, 2022, the Tax Cuts and Jobs Act of 2017 eliminated the option to deduct research and development expenditures in the current period and requires taxpayers to capitalize and amortize these expenses. However, recently proposed tax legislation, if enacted, would restore the ability to deduct currently domestic research and development expenditures through 2025 and would retroactively restore this benefit for 2022 and 2023. While this change, has not currently had a material impact on us, if such provision is not deferred or repealed, we expect to have taxable income in periods earlier than we would have had in the absence of this change, which could adversely impact our financial condition, operating results, and cash flows. On August 16, 2022, the Inflation Reduction Act of 2022 created an excise tax of 1% on stock repurchases from publicly traded US corporations, among other changes, which has resulted and is expected to continue to result in increased tax liabilities for us. In addition, the Organization for Economic Cooperation and Development (the “OECD”) has proposed enacting a global minimum tax rate of at least 15% for multinationals with global revenue exceeding certain thresholds, known as “Pillar Two,” and many countries have adopted or intended to adopt these proposals. We are currently evaluating the impact on our 2024 annual effective tax rate as we wait for additional guidance from the OECD and for additional countries to enact the Pillar Two legislation.
Any changes in tax legislation, regulations, policies, or practices in the jurisdictions in which we operate could increase our effective tax rate and materially increase the amount of taxes we owe, thereby negatively impacting our results of operations as well as our cash flows from operations. A successful assertion by one or more states, or foreign jurisdictions, requiring us to collect sales, value added, or similar indirect taxes where we presently do not do so, or to collect more of such indirect taxes in a jurisdiction in which we currently do collect some indirect taxes, could result in substantial tax liabilities, including taxes on past sales, as well as penalties and interest.
Furthermore, compliance with changing tax laws and regulations could require us to make substantial changes to our business practices, allocate additional resources, and increase our costs, potentially negatively affecting our business, results of operations, and financial condition. As we grow internationally, we may also be subject to taxation and review by taxation authorities in additional jurisdictions with increasingly complex tax laws, the application of which can be uncertain, and which could increase the amount of taxes we pay, potentially adversely affecting our liquidity and results of operations.
We may have exposure to greater-than-anticipated tax liabilities, which may materially and adversely affect our business, results of operations, and financial condition.
The determination of our worldwide provision for income taxes, value-added taxes, and other tax liabilities requires estimation and significant judgment, and the ultimate tax determination is uncertain. Like many other multinational corporations, we are subject to tax in multiple U.S. and foreign tax jurisdictions. Our determination of our tax liabilities is always subject to audit and review by applicable domestic and foreign tax authorities. Any adverse outcome of any such audit or review could have a negative effect on our business and the ultimate tax outcome may differ from the amounts recorded in our financial statements and may materially affect our results of operations and financial condition in the periods for which such determination is made. While we have established reserves based on assumptions and estimates that we believe are reasonable to cover such eventualities, these reserves may prove to be insufficient, which may have an adverse effect on our business, results of operations, and financial condition.
Our ability to use our net operating losses and other tax attributes to offset future taxable income may be subject to certain limitations.
34
We have incurred substantial net operating losses (“NOLs”) and other tax attributes, including research & development (“R&D”) credits, during our history. In general, under Section 382 of the Internal Revenue Code of 1986, as amended (the “Code”), a corporation that undergoes an “ownership change” (generally defined as a greater than 50-percentage-point cumulative change (by value) in the equity ownership of certain stockholders over a rolling three-year period) is subject to limitations on a company’s ability to utilize its NOLs and other tax attributes to offset taxable income. We have experienced ownership changes since inception and believe that our existing NOLs and other tax attributes, including R&D credit carryforward, will be subject to such limitation.
In addition, the amount of NOLs and other tax attributes that we are permitted to deduct may be subject to limitations and our NOLs and other tax attributes may expire before they are fully utilized. Our NOLs and other tax attributes may also be subject to limitations under state law. There is a risk that due to legislative or regulatory changes, or other unforeseen reasons, our existing NOLs and other tax attributes could expire or otherwise be unavailable to offset future income tax liabilities.
35
Risks Relating to Intellectual Property
If we fail to adequately protect our intellectual property rights, our business could be adversely affected and we could incur additional expenses to protect our rights.
We rely on a combination of patents, copyrights, trademarks, service marks, trade secret laws, and contractual restrictions to establish and protect our intellectual property and proprietary rights, which are critical to our success. The steps we take to protect our intellectual property, however, may be inadequate, and various events outside of our control may pose a threat to our intellectual property rights.
We cannot assure you that any patents or trademarks will be issued with respect to our currently pending patent and trademark applications. Our patents and trademarks may be contested, circumvented, or found unenforceable or invalid, and we may not be able to prevent third parties from infringing, diluting, or otherwise violating them. There can be no guarantee that others will not independently develop similar products, duplicate any of our products, or design around our patents. As the development, adoption, and use of generative AI technologies grows, our intellectual property may inadvertently be exposed through the use of such technologies. Further, the laws of some foreign countries may not protect our intellectual property rights to the same extent as the laws of the United States, and effective intellectual property protection and mechanisms may not be available in those jurisdictions.
We also rely in part on trade secrets, proprietary technology, and other confidential information to maintain our competitive position. Although we enter into confidentiality agreements with our employees, service providers, and other actual or potential strategic business partners, these agreements may not be effective in controlling access to and distribution of our platform, or certain other aspects of our trade secrets, proprietary technology, and other confidential information.
To protect our intellectual property rights, we may be required to spend significant resources to monitor and protect these rights, in the U.S. and internationally, and we may not be able to detect infringement by third parties. Litigation may be necessary in the future to enforce our intellectual property rights and to protect our trade secrets. Such litigation could be costly, time consuming, and distracting to management and could result in the impairment or loss of portions of our intellectual property.
Our use of open source software could adversely affect our ability to sell our products.
Our platform incorporates open source software, and we expect to continue to incorporate open source software in our products and platform in the future. There have been claims challenging the use of open source software against companies that incorporate it into their products. If it is alleged that we have not complied with an open source license, we could incur significant legal expenses defending against such allegation.
If we fail to comply with an open source license, we may be required to offer our products that incorporate the open source software for no cost, make available the source code for modifications or derivative works we create based upon, incorporating, or using the open source software, and license such modifications or derivative works under the terms of the open source software. We may also be required to re-engineer our products or platform or to discontinue offering our products. These events may adversely affect our business, results of operations, and financial condition.
In addition to risks related to license requirements, open source licensors generally do not provide warranties or other contractual protections regarding infringement, misappropriation, or other violations, the quality or security of code, or the origin of the software. Many of the risks associated with the use of open source software cannot be eliminated and could adversely affect our business, results of operations, and financial condition. For instance, open source software developers operate outside of our control and open source software may have security vulnerabilities, defects, or errors of which we are not aware. It may take a significant amount of time to address such vulnerabilities, defects, or errors once we are aware of them, which could negatively impact our products and services and result in liability to us, our vendors and service providers.
36
We may be accused of infringing the intellectual property rights of third parties.
We have in the past and may in the future be accused of infringing, misappropriating, or otherwise violating the intellectual property or other proprietary rights of third parties. Although we seek to comply with the statutory, regulatory, and judicial frameworks and the terms and conditions of statutory licenses, we cannot assure you that we are not infringing or violating any third-party intellectual property rights, or that we will not do so in the future.
The costs of litigation can be considerable, and we cannot assure you that we will achieve a favorable outcome of any such claim. Although we carry insurance, our insurance may not cover potential claims of this type or may not be adequate to cover us for all liability that may be imposed. If any such claim is valid, we may be required to stop using such intellectual property or other proprietary rights and pay damages, which could adversely affect our business. Even if such claims were not valid, defending them could be expensive and distract our management team.
We have agreed to defend, indemnify, and hold harmless certain of our customers and other partners from damages and costs arising from the infringement or claimed infringement by our products of third-party intellectual property rights. The scope of these indemnity obligations varies. Even if we are not a party to any litigation between a customer and a third party relating to infringement by our products, an adverse outcome in any such litigation could make it more difficult for us to defend our solutions against intellectual property infringement claims in any subsequent litigation where we are a named party. Any of these results could harm our brand and adversely affect our results of operations.
37
Risks Relating to Ownership of Our Class A Common Stock
The trading price of our Class A common stock has been and is likely to continue to be volatile, which could cause the value of your investment to decline.
The trading price of our Class A common stock has been and may continue to be highly volatile and could be subject to wide fluctuations. This volatility, as well as general economic, market, industry, and political conditions, and the occurrence of the risks discussed in this risk factor section, could reduce the market price of shares of our Class A common stock despite our operating performance.
In addition, stock markets in general, and the market for technology and fintech companies in particular, have from time to time experienced extreme price and volume fluctuations that have affected and continue to affect the market prices of equity securities of many companies. In the past, stockholders have often instituted securities class action litigation against a company following periods of overall market volatility and volatility in the market price of that company’s securities. Securities litigation can result in substantial costs and divert resources and the attention of management. See Part I, Item 3 of this Annual Report on Form 10-K for more information about litigation proceedings.
The dual class structure of our common stock has the effect of concentrating voting control with those stockholders who hold shares of our Class B common stock, including our directors, executive officers, and their affiliates. As a result of the dual class structure of our common stock, the trading price of our Class A common stock may be depressed.
Our Class B common stock has 10 votes per share, and our Class A common stock has one vote per share. Our directors, executive officers, and their affiliates, beneficially own in the aggregate 52.4% of the voting power of our capital stock as of December 31, 2023. The holders of our Class B common stock collectively continue to control a majority of the combined voting power of our common stock and therefore control all matters submitted to our stockholders for approval and may continue to control such matters until the tenth anniversary of our initial public offering, when all outstanding shares of Class A common stock and Class B common stock will convert automatically into shares of a single class of common stock.
This concentrated control limits or precludes your ability to influence corporate matters for the foreseeable future, including the election of directors, amendments of our organizational documents, and any merger, consolidation, sale of all or substantially all of our assets, or other major corporate transaction requiring stockholder approval. In addition, this concentrated control may prevent or discourage unsolicited acquisition proposals or offers for our capital stock that you may believe are in your best interest as a stockholder.
Transfers by holders of Class B common stock will generally result in those shares converting to Class A common stock, subject to limited exceptions, which has had and will continue to have the effect of increasing the relative voting power of those holders of Class B common stock who retain their shares in the long term. As a result, it is possible that one or more of the persons or entities holding our Class B common stock could gain significant voting control as other holders of Class B common stock sell or otherwise convert their shares into Class A common stock. Our dual class structure may also depress the trading price of our Class A common stock due to negative perceptions by market participants and other stakeholders. Certain index providers have announced restrictions on including companies with multiple-class share structures in certain of their indices. Similarly, several stockholder advisory firms have announced their opposition to the use of multiple-class structures. Any exclusion from indices or criticism of our corporate governance practices by stockholder advisory firms could result in a less active trading market for our Class A common stock.
Our issuance of additional capital stock may dilute your ownership and adversely affect the market price of our Class A common stock.
We expect to issue additional capital stock in the future that will result in dilution to all other stockholders. For example, we could issue shares of our Class A common stock or securities convertible into our Class A common stock or debt or other securities in connection with acquisitions or other strategic transactions or in an attempt to obtain financing or to further increase our capital resources.
38
Additionally, we expect to grant equity awards to employees and directors under our stock incentive plan. We have granted equity awards to employees and directors under our stock incentive plans in the past, and such grants may dilute your ownership as the equity vests and the RSUs are released and the options are exercised. In addition, as of December 31, 2023, we had 36,670,638 option shares outstanding that, if fully vested and exercised, would result in the issuance of an equal number of shares of Class A or Class B common stock, as well as 38,177,072 total shares of Class A or Class B common stock subject to RSU awards.
We have also granted the Executive Chairman Long-Term Performance Award to our Executive Chairman and former Chief Executive Officer, which vests upon the satisfaction of a service condition and the achievement of certain stock price goals. If the Executive Chairman Long-Term Performance Award vests and is exercised, your ownership will be diluted. See Note 11 “Stock Incentive Plans” to our Consolidated Financial Statements for more information about the Executive Chairman Long-Term Performance Award.
Any Class A common stock or securities convertible into shares of our Class A common stock that we issue from time to time will dilute your percentage ownership. In addition, issuing additional shares of our Class A common stock or securities convertible into our Class A common stock or debt or other securities may dilute your economic and voting rights and would likely reduce the market price of our Class A common stock both upon issuance and conversion, in the case of securities convertible into our Class A common stock.
We do not intend to pay dividends on our Class A common stock in the foreseeable future and, consequently, the ability of Class A common stockholders to achieve a return on investment will depend on appreciation in the trading price of our Class A common stock.
We have never declared or paid any cash dividends on our capital stock. We intend to retain any earnings to finance the operation and expansion of our business, and we do not anticipate paying any cash dividends in the foreseeable future. We anticipate that we will retain all of our future earnings for use in the operation of our business and for general corporate purposes. Any determination to pay dividends in the future will be at the discretion of our board of directors. Accordingly, investors must rely on sales of their Class A common stock after price appreciation, which may never occur, as the only way to realize any future gains on their investments.
Provisions in our charter documents and under Delaware law could make an acquisition of our company more difficult, limit attempts by our stockholders to replace or remove our current board of directors, and limit the trading price of our Class A common stock.
Provisions in our amended and restated certificate of incorporation and amended and restated bylaws may have the effect of delaying or preventing a change of control or changes in our management. Our amended and restated certificate of incorporation and amended and restated bylaws include provisions that:
•provide that our board of directors will be classified into three classes of directors with staggered three-year terms;
•permit our board of directors to establish the number of directors and fill any vacancies and newly-created directorships;
•require super-majority voting to amend some provisions in our amended and restated certificate of incorporation and amended and restated bylaws;
•authorize the issuance of “blank check” preferred stock that our board of directors could use to implement a stockholder rights plan;
•provide that only the chairperson of our board of directors, our chief executive officer, or a majority of our board of directors will be authorized to call a special meeting of stockholders;
•provide for a dual class common stock structure where holders of our Class B common stock are able to control the outcome of matters requiring stockholder approval, even if they own significantly less than a majority of the outstanding shares of our Class A and Class B common stock, including the election of directors and significant corporate transactions, such as a merger or other sale of our company or its assets;
39
•prohibit stockholder action by written consent, thereby requiring all stockholder actions to be taken at a meeting of our stockholders;
•provide that the board of directors is expressly authorized to make, alter, or repeal our amended and restated bylaws; and
•contain advance notice requirements for nominations for election to our board of directors or for proposing matters that can be acted upon by stockholders at annual stockholder meetings.
Moreover, Section 203 of the Delaware General Corporation Law may discourage, delay, or prevent a change in control of our company. Section 203 imposes certain restrictions on mergers, business combinations, and other transactions between us and holders of 15% or more of our common stock.
Our amended and restated bylaws designate state or federal courts located within the State of Delaware as the exclusive forum for certain litigation that may be initiated by our stockholders, potentially limiting stockholders’ ability to obtain a favorable judicial forum for disputes with us.
Our amended and restated bylaws provide that, unless we consent in writing to the selection of an alternative forum, to the fullest extent permitted by law, the Court of Chancery of the State of Delaware is the sole and exclusive forum for any state law claims for:
•any derivative action or proceeding brought on our behalf;
•any action asserting a claim of breach of fiduciary duty owed by any of our directors, officers or other employees to us or our stockholders;
•any action asserting a claim arising pursuant to the Delaware General Corporation Law, our amended and restated certificate of incorporation, or our amended and restated bylaws; or
•any action asserting a claim that is governed by the internal affairs doctrine (the “Delaware Forum Provision”).
The Delaware Forum Provision does not apply to any causes of action arising under the Securities Act of 1933, as amended (the “Securities Act”) or the Exchange Act. Section 22 of the Securities Act creates concurrent jurisdiction for federal and state courts over all suits brought to enforce any duty or liability created by the Securities Act or the rules and regulations thereunder. Accordingly, both state and federal courts have jurisdiction to entertain such claims. To prevent having to litigate claims in multiple jurisdictions and the threat of inconsistent or contrary rulings by different courts, among other considerations, our amended and restated bylaws provide that, unless we consent in writing to the selection of an alternative forum, the United States District Court for the District of Delaware shall be the sole and exclusive forum for resolving any complaint asserting a cause of action arising under the Securities Act (the “Federal Forum Provision”), as we are incorporated in the State of Delaware.
In addition, our amended and restated bylaws provide that any person or entity purchasing or otherwise acquiring any interest in shares of our capital stock is deemed to have notice of and consented to the Delaware Forum Provision and the Federal Forum Provision; provided, however, that stockholders cannot and will not be deemed to have waived our compliance with the U.S. federal securities laws and the rules and regulations thereunder.
The Delaware Forum Provision and the Federal Forum Provision in our amended and restated bylaws may impose additional litigation costs on stockholders in pursuing any such claims. Additionally, these forum selection clauses may limit our stockholders’ ability to bring a claim in a judicial forum that they find favorable for disputes with us or our directors, officers, or employees, potentially discouraging the filing of lawsuits against us and our directors, officers, and employees, even though an action, if successful, might benefit our stockholders. In addition, while the Delaware Supreme Court ruled in March 2020 that federal forum selection provisions purporting to require claims under the Securities Act be brought in federal court are “facially valid” under Delaware law, there is uncertainty as to whether other courts will enforce our Federal Forum Provision. If the Federal Forum Provision is found to be unenforceable, we may incur additional costs associated with resolving such matters. The Federal Forum Provision may also impose additional litigation costs on stockholders who assert that the provision is not enforceable or invalid. The Court of Chancery of the State of Delaware and the United States District Court for the District of Delaware may also reach different judgments or results than would other courts, including courts where a stockholder considering an action may be located or would otherwise choose to bring the action, and such judgments may be more or less favorable to us than our stockholders.
40
We cannot guarantee that our share repurchase program will enhance long-term stockholder value. Share repurchases could also affect the trading price of our stock and may reduce working capital.
In May 2023, our board of directors approved a $200 million share repurchase program for shares of our Class A common stock (the “2023 Share Repurchase Program”). The actual timing, manner, number, and value of shares repurchased under the program will depend on a number of factors, including the availability of cash, the market price of our Class A common stock, general market and economic conditions, applicable requirements, and other business considerations. The share repurchase program may be suspended, modified or discontinued at any time and we have no obligation to repurchase any amount of our Class A common stock under the program. The share repurchase program has no set expiration date. We intend to make all repurchases in compliance with applicable regulatory guidelines and to administer the plan in accordance with applicable laws, including Rule 10b-8 of the Exchange Act. Other risks and uncertainties include, among other things, the market price of our stock prevailing from time to time, the nature of other investment opportunities presented to us, our financial performance and our cash flows from operations, and general economic conditions, which could adversely affect our results of operations and cash flows.
General Risk Factors
Unfavorable conditions in the global economy could adversely affect our business and financial results.
Our business, the industry, and our customers’ businesses are generally sensitive to macroeconomic conditions. Our net revenue is impacted, to a significant extent, by general economic conditions, their impact on levels of spending by businesses and their customers, and the financial performance of our customers. Supply chain disruption, a global labor shortage, increased inflation, and higher interest rates have adversely affected our business, results of operations, and business outlook and may continue to create uncertainty as to our and our customers’, partners’, and vendors’ financial results, operations, and business outlook. We are unable to predict the impact that these and other macroeconomic factors may have or continue to have on our business and processing volumes, and on our future results of operations.
Weak economic conditions or a significant deterioration in economic conditions could result in a reduced volume of business for our customers and prospective customers, demand for, and use of, our platform, products, and services may decline, and prospective customers could delay adoption or elect not to adopt our platform. If spending by their customers declines, our customers could process fewer payments with us or, if our customers cease to operate, they would stop using our platform, products, and services altogether. Moreover, if the financial condition of a customer deteriorates significantly or a customer becomes subject to a bankruptcy proceeding, we may not be able to recover amounts due to us from the customer.
Weak economic conditions may make it more difficult to collect on outstanding accounts receivable. The global credit and financial markets have from time to time experienced extreme volatility and disruptions, including severely diminished liquidity and credit availability, rising interest and inflation rates, declines in consumer confidence, declines in economic growth, increases in unemployment rates, and uncertainty about economic stability. The bank closures and failures in 2023 created bank-specific and broader financial institution liquidity risk and concerns. Future adverse developments with respect to specific financial institutions or the broader financial services industry may lead to market-wide liquidity shortages, impair the ability of companies to access near-term working capital needs, and create additional market and economic uncertainty.
41
Our business is subject to the risks of earthquakes, fire, floods, pandemics, and other natural catastrophic events, and to interruption by man-made issues such as power disruptions and strikes.
Our systems and operations are vulnerable to damage or interruption from earthquakes, fires, floods, power losses, telecommunications failures, strikes, health pandemics, such as the COVID-19 pandemic, and similar events. For example, our corporate headquarters are located in the San Francisco Bay Area, a region known for seismic activity and wildfires, and a significant natural disaster in that area or any other location in which we have offices or facilities or employees working remotely, such as an earthquake, fire, or flood, could have a material adverse effect on our business, results of operations financial condition, and future prospects. Our insurance coverage may be insufficient to compensate us for the losses that may occur. In addition, strikes, wars, terrorism, and other geopolitical unrest could cause disruptions in our business and lead to interruptions, delays, or loss of critical data. If a natural disaster, power outage, connectivity issue, or other event occurs that impacts our employees’ ability to work remotely, our business and results of operations could be adversely affected. We may not have sufficient protection or recovery plans in certain circumstances, such as a significant natural disaster, and our business interruption insurance may be insufficient to compensate us for losses that may occur.
42
Item 1B. Unresolved Staff Comments
None.
Item 1C. Cybersecurity
Our industry is subject to various cybersecurity risks that could adversely affect our business, financial condition, and results of operations. While we have not, as of the date of this Annual Report on Form 10-K, experienced a cybersecurity threat or incident that resulted in a material adverse impact to our business or operations, there can be no guarantee that we will not experience such an incident in the future. See Item 1A, “Risk Factors,” in this Annual Report on Form 10-K, including the section titled “Risk Factors—Risks Relating to Regulation” for additional information regarding the risks related to cybersecurity threats.
Our Chief Information Security Officer (“CISO”) is responsible for Marqeta’s information security posture and cybersecurity program. We believe our CISO is qualified to assess and manage our material risks from cybersecurity threats based on 15 years of cybersecurity and risk management expertise as a security and risk management leader at various public and private companies and as a cyber threat intelligence analyst for a branch of the United States military. Our CISO reports to our Chief Product and Technology Officer and oversees a team of cybersecurity professionals in areas including Governance, Risk, and Compliance, Product and Infrastructure Security, Security Operations, and Identity Security.
Our cybersecurity program is designed to align with certain industry standards and best practices, such as ISO 27001 and the National Institute of Standards and Technology Cybersecurity Framework. We have a Cyber Incident Response Plan which defines roles and responsibilities in the event of a cybersecurity incident, as well as the processes for keeping the CISO, senior management, and the board of directors informed about the prevention, detection, mitigation, and remediation of cybersecurity incidents.
Our board of directors administers its cybersecurity risk oversight function directly as a whole, as well as through the audit committee. Our CISO provides quarterly and as-needed briefings to the audit committee regarding cybersecurity risks and activities, including any recent cybersecurity incidents and related responses, cybersecurity systems testing, and activities of third party consultants. Our audit committee provides quarterly and as-needed updates to the board of directors on such reports and management provides annual and as-needed updates to the board of directors regarding our cybersecurity program.
We have policies and processes in place for assessing, identifying, and managing material cybersecurity risks, and integrate these processes into our overall risk management systems. We conduct periodic risk assessments to identify reasonably foreseeable internal and external cybersecurity risks, the likelihood and potential damage that could result from such risks, and the sufficiency of existing policies, procedures, systems, and safeguards in place to manage such risks.
Following these risk assessments, we develop strategies, policies, standards, and action plans to minimize identified risks and reasonably address any identified gaps in existing safeguards. These steps include vulnerability management, shift-left secure product design, data encryption, endpoint security, network security, limiting and authorizing access controls, and multi-factor authentication for access to systems with data. We also employ system monitoring, logging, and alerting to retain and analyze the security state of our corporate and production infrastructure. As part of our overall risk management system, all employees are required to complete annual cybersecurity training and relevant employees are trained at least annually on applicable safeguards.
We engage consultants in connection with our risk assessment processes to help us design and implement our cybersecurity policies and procedures, as well as to monitor and test our safeguards. We manage third party service providers using a risk-based approach intended to determine if the relevant third parties have the ability to implement and maintain appropriate security measures, consistent with all applicable laws, to implement and maintain reasonable security measures in connection with their work with us, and to promptly report any suspected breach of their security measures that may affect our business.
The maturation and scaling of our cybersecurity program is ongoing and despite our investments in our cybersecurity program, there will always be residual risk and the potential for control failure or bypass by a determined cyber threat actor.
43
Item 2. Properties
Our corporate headquarters is located in Oakland, California, where we currently lease approximately 63,284 square feet pursuant to a lease agreement that expires in 2026. We also lease an additional facility in London, United Kingdom. We believe that our facilities are suitable to meet our current needs.
Item 3. Legal Proceedings
From time to time, we may be subject to legal proceedings and claims arising in the ordinary course of business. We are currently involved in the following matter:
On August 24, 2023, a putative class action and shareholder derivative lawsuit was filed in the case captioned Stephanie Smith v. Jason Gardner, et al. (Case No. 2023-0872-MTZ) in the Court of Chancery for the State of Delaware against each of the members of our board of directors and naming Marqeta as a nominal defendant. The complaint alleges that the individual defendants breached fiduciary duties in approving the 2023 Share Repurchase Program by failing to implement measures to prevent Marqeta founder Jason Gardner from acquiring control of the Company or to ensure that unaffiliated stockholders receive a control premium. The plaintiff seeks damages and injunctive relief in the case, among other relief.
On February 24, 2024 the parties entered into a Standstill and Release Agreement (the “Standstill Agreement”) in which (i) the plaintiff agreed to file a stipulation of dismissal of the lawsuit, (ii) Mr. Gardner agreed not to take unilateral, affirmative action to increase his voting power above 49.99% of the total voting power of the Company’s outstanding stock for the period of time between and including February 24, 2024 and September 11, 2024, and (iii) the parties agreed to releases and related provisions. The stipulation of dismissal has received court approval. The summary of the Standstill Agreement is qualified in its entirety by reference to the full text, which is filed as Exhibit 99.1 to this Form 10-K and is incorporated herein by reference.
Item 4. Mine Safety
Not applicable.
44
PART II
Item 5. Market for Registrant's Common Equity, Related Stockholder Matters and Issuer Purchases of Equity Securities
Market Information for Common Stock
Our Class A common stock has traded on the Nasdaq Global Select Market under the symbol “MQ” since our IPO on June 9, 2021. Prior to that date, there was no public market for our common stock. There is no public trading market for our Class B common stock.
Stockholders
As of February 23, 2024, we had 43 holders of record of our Class A common stock and 57 holders of record of our Class B common stock. Because many of the shares of our Class A common stock are held by brokers and other institutions on behalf of stockholders, we are unable to estimate the total number of beneficial owners of our Class A common stock represented by the record holders.
Dividend Policy
We have not declared or paid any cash dividend on our capital stock. We currently intend to retain any future earnings and do not expect to pay any dividends in the foreseeable future. Any future determination to declare cash dividends will be made at the discretion of our board of directors, subject to applicable laws, and will depend on a number of factors, including our financial condition, results of operations, capital requirements, any contractual restrictions, general business conditions, and other factors that our board of directors may deem relevant.
Stock Performance Graph
The following performance graph shall not be deemed “soliciting material” or deemed “filed” for purposes of Section 18 of the Exchange Act, or otherwise subject to the liabilities of Section 18 of the Exchange Act, and shall not be deemed to be incorporated by reference into any of our filings under the Exchange Act or the Securities Act.
The following stock performance graph depicts the cumulative total return on our Class A common stock relative to the cumulative total returns of the Nasdaq Composite Index and the S&P Information Technology Index during each monthly period from June 9, 2021 (the date our Class A common stock began trading on the Nasdaq Global Select Market) through December 31, 2023. All values assume a $100 initial investment and reinvestment of dividends. The returns shown are based on historical results and are not intended to be indicative of future performance.
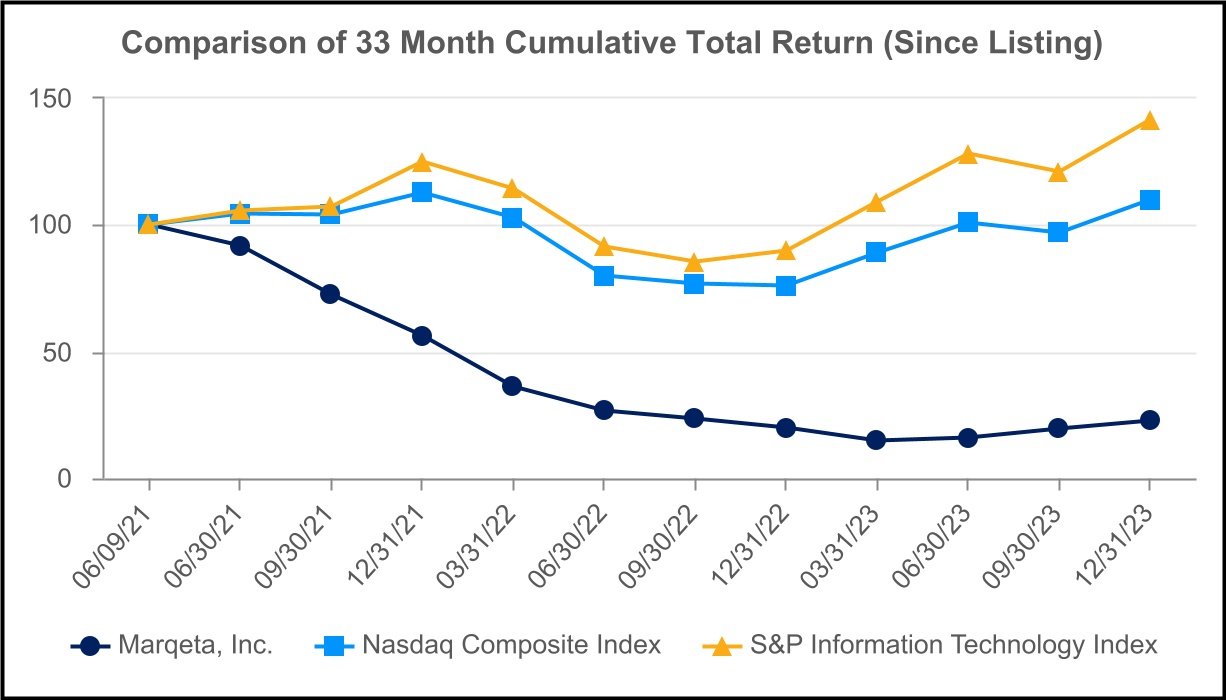
45
Purchase of Equity Securities by the Issuer
The following table contains information relating to the repurchases of our common stock made by us in the three months ended December 31, 2023:
| Period | Total Number of Shares Purchased | Average Price Paid per Share | Total Number of Shares Purchased as Part of Publicly Announced Plans or Programs (1) | Approximate Dollar Value of Shares that May Yet Be Purchased Under the Plans or Programs (2) | ||||||||||||||||||||||
October 1 - October 31, 2023 | 3,804,287 | $ | 5.47 | 3,804,287 | 67,271,767 | |||||||||||||||||||||
November 1 - November 30, 2023 | 4,091,046 | $ | 5.72 | 4,091,046 | 43,858,299 | |||||||||||||||||||||
December 1 - December 31, 2023 | 1,779,177 | $ | 6.53 | 1,779,177 | 32,244,882 | |||||||||||||||||||||
| Total | 9,674,510 | 9,674,510 | ||||||||||||||||||||||||
(1) On May 8, 2023, our board of directors authorized a share repurchase program of up to $200 million of our Class A common stock beginning May 11, 2023. Under the repurchase program, we are authorized to repurchase shares through open market purchases, in privately negotiated transactions or by other means, in accordance with applicable federal securities laws, including through trading plans under Rule 10b5-1 of the Exchange Act. The share repurchase program has no set expiration date.
Use of Proceeds
On June 11, 2021, we closed our IPO, of 52,272,727 shares of our Class A common stock at an offering price of $27.00 per share, including 6,818,181 shares pursuant to the exercise of the underwriters’ option to purchase additional shares of our Class A common stock, resulting in aggregate net proceeds to us of $1.3 billion after deducting underwriting discounts and commissions of $91.6 million, and offering costs of $7.5 million. All of the shares issued and sold in our IPO were registered under the Securities Act pursuant to a registration statement on Form S-1 (File No. 333-256154), which was declared effective by the SEC on June 8, 2021. Goldman Sachs & Co. LLC and J.P. Morgan Securities LLC acted as representatives of the underwriters for the offering.
We also used $10.9 million of the net proceeds from our IPO to satisfy the tax withholding and remittance obligations related to the settlement of our outstanding restricted stock units in connection with the offering.
No payments were made to our directors or officers or their associates, holders of 10% or more of any class of our equity securities, or to our affiliates in connection with the issuance and sale of the securities registered.
There has been no material change in the planned use of the IPO proceeds as discussed in our final prospectus filed with the SEC on June 10, 2021, pursuant to Rule 424(b) of the Securities Act.
Item 6. Reserved
46
Item 7. Management's Discussion and Analysis of Financial Condition and Results of Operations
This discussion contains forward-looking statements based upon current expectations that involve risks and uncertainties. As discussed in the section titled “Note About Forward Looking Statements,” our actual results may differ materially from those discussed in these forward-looking statements as a result of various factors, including those set forth under the section titled “Risk Factors” under Part I, Item 1A. You should read the following discussion and analysis of our financial condition and results of operations together with our Audited Consolidated Financial Statements and the related notes included elsewhere in this Annual Report on Form 10-K.
A discussion regarding our liquidity, financial condition, and results of operations for the fiscal year ended December 31, 2023 compared to the fiscal year ended December 31, 2022 is presented below. A discussion regarding our liquidity, financial condition, and results of operations for the fiscal year ended December 31, 2022 compared to the fiscal year ended December 31, 2021 can be found in “Management's Discussion and Analysis of Financial Condition and Results of Operations” in in Part II, Item 7 of our Annual Report on Form 10-K for the fiscal year ended December 31, 2022 filed with the SEC on February 28, 2023, which is hereby incorporated by reference.
Overview
Marqeta’s mission is modernizing financial services by making the entire payment experience native and delightful. Marqeta’s modern platform empowers our customers to create customized and innovative payment card programs with configurability and flexibility. Marqeta’s open APIs provide instant access to highly scalable, cloud-based payment infrastructure that enables customers to embed the payments experience into apps or websites for a personalized user experience. Customers can launch and manage their own card programs, issue cards, and authorize and settle payment transactions quickly using our platform. We also deliver robust card program management, allowing our customers to embed Marqeta in their offering without having to build certain complex compliance elements or customer support services.
See the section titled “Business” under Part I, Item 1 of this Annual Report on Form 10-K for further discussion of our business and products.
Impact of Macroeconomic Factors
We are unable to predict the impact macroeconomic factors, including various geopolitical conflicts, ongoing supply chain shortages, higher inflation and interest rates, and uncertainty in global economic conditions will have on our processing volumes, and on our future results of operations. A deterioration in macroeconomic conditions could increase the risk of lower consumer spending, consumer and merchant bankruptcy, insolvency, business failure, higher credit losses, foreign currency fluctuations, or other business interruption, which may adversely impact our business. We continue to monitor these situations and may take actions that alter our operations and business practices as may be required by federal, state, or local authorities or that we determine are in the best interests of our customers, vendors, and employees.
See the section titled “Risk Factors” under Part I, Item 1A of this Annual Report on Form 10-K for further discussion of the possible impact of these macroeconomic factors on our business.
Key Operating Metric and Non-GAAP Financial Measures
We review a number of operating and financial metrics, including the key operating metric set forth below, to help us evaluate our business and growth trends, establish budgets, evaluate the effectiveness of our investments, and assess operational efficiencies. In addition to the results determined in accordance with GAAP, the following table sets forth a key operating metric and non-GAAP financial measures that we consider useful in evaluating our operating performance.
47
| Year Ended December 31, | |||||||||||||||||
| 2023 | 2022 | 2021 | |||||||||||||||
| Total Processing Volume (TPV) (in millions) | $ | 222,264 | $ | 166,260 | $ | 111,133 | |||||||||||
| Net revenue (in thousands) | $ | 676,171 | $ | 748,206 | $ | 517,175 | |||||||||||
| Gross profit (in thousands) | $ | 329,514 | $ | 320,001 | $ | 231,705 | |||||||||||
| Gross margin | 49 | % | 43 | % | 45 | % | |||||||||||
| Net loss (in thousands) | $ | (222,962) | $ | (184,780) | $ | (163,929) | |||||||||||
| Net loss margin | (33) | % | (25) | % | (32) | % | |||||||||||
| Total operating expenses (in thousands) | $ | 612,529 | $ | 529,809 | $ | 393,711 | |||||||||||
| Non-GAAP Measures: | |||||||||||||||||
| Adjusted EBITDA (in thousands) | $ | (2,290) | $ | (41,796) | $ | (12,767) | |||||||||||
| Adjusted EBITDA margin | (0.3) | % | (6) | % | (3) | % | |||||||||||
| Non-GAAP operating expenses (in thousands) | $ | 331,804 | $ | 361,797 | $ | 244,472 | |||||||||||
Total Processing Volume (“TPV”) - TPV represents the total dollar amount of payments processed through our platform, net of returns and chargebacks. We believe that TPV is a key operating metric and a principal indicator of the market adoption of our platform, growth of our brand, growth of our customers' businesses and scale of our business.
Adjusted EBITDA - Adjusted EBITDA is a non-GAAP financial measure that is calculated as net income (loss) adjusted to exclude depreciation and amortization; share-based compensation expense; payroll tax related to share-based compensation; restructuring charges; acquisition related expenses which consist of due diligence costs, transaction costs and integration costs related to potential or successful acquisitions and cash and non-cash postcombination compensation expenses; income tax expense (benefit); and other income (expense) net, which consists of changes in the fair value of redeemable convertible preferred stock warrant liabilities (for periods prior to the IPO), interest income from our short-term investments, realized foreign currency gains and losses, our share of equity method investments’ profit or loss, impairment of equity method investments or other financial instruments, and gain from sale of equity method investments. We believe that Adjusted EBITDA is an important measure of operating performance because it allows management and our board of directors to evaluate and compare our core operating results, including our operating efficiencies, from period to period. Additionally, we utilize Adjusted EBITDA as an input into our calculation of our annual employee bonus plans. See the section below titled “Use of Non-GAAP Financial Measures” for a discussion of the use of non-GAAP measures and a reconciliation of net loss to Adjusted EBITDA.
Adjusted EBITDA Margin - Adjusted EBITDA Margin is a non-GAAP financial measure that is calculated as Adjusted EBITDA divided by net revenue. This measure is used by management and our board of directors to evaluate our operating efficiency. See the section below titled “Use of Non-GAAP Financial Measures” for a discussion of the use of non-GAAP measures and a reconciliation of net loss to Adjusted EBITDA Margin.
Non-GAAP operating expenses - Non-GAAP operating expenses is a non-GAAP financial measure that is calculated as total operating expenses adjusted to exclude depreciation and amortization; share-based compensation expense; payroll tax related to share-based compensation; restructuring charges; and acquisition related expenses which consists of due diligence costs, transaction cost and integration costs related to potential or successful acquisitions, and cash and non-cash postcombination compensation expenses. We believe that non-GAAP operating expenses is an important measure of operating performance because it allows management and our board of directors to evaluate and compare our core operating results, including our operating efficiencies, from period to period. See the section below titled “Use of Non-GAAP Financial Measures” for a discussion of the use of non-GAAP measures and a reconciliation of total operation expenses to non-GAAP operating expenses.
48
Components of Results of Operations
Net Revenue
We have two components of net revenue: platform services revenue, net and other services revenue.
Platform services revenue, net. Platform services revenue includes Interchange Fees, net of Revenue Share and other service-level payments to customers, and Card Network and Issuing Bank costs for certain customer arrangements where the Company is an agent in the delivery of services to the customer. Platform services revenue also includes processing and other fees. Interchange Fees are earned on card transactions we process for our customers and are based on a percentage of the transaction amount plus a fixed amount per transaction. Interchange Fees are recognized when the associated transactions are settled.
Revenue Share payments are incentives to our customers to increase their processing volumes on our platform. Revenue Share is generally computed as a percentage of the Interchange Fees earned or processing volume and is paid to our customers monthly. Revenue Share payments are recorded as a reduction to net revenue. Generally, as customers' processing volumes increase, the rates at which we share revenue increase.
Processing and other fees are priced as either a percentage of processing volume or on a fee per transaction basis and are earned when payment cards are used at automated teller machines or to make cross-border purchases. Minimum processing fees, where customers' processing volumes fall below certain thresholds, are also included in processing and other fees.
We recognize revenue when the promised services are complete, and our performance obligations are satisfied. Platform services are considered complete when we have authorized the transaction, validated that the transaction has no errors, and accepted and posted the data to our records.
Other services revenue. Other services revenue primarily consists of revenue earned for card fulfillment services. Card fulfillment fees are generally billed to customers upon ordering card inventory and recognized as revenue when the cards are shipped to the customers.
Costs of Revenue
Costs of revenue consist of Card Network fees, Issuing Bank fees, and card fulfillment costs for customer arrangements where the Company is the principal in providing services to the customer and excludes depreciation and amortization, which is reported separately within the Consolidated Statements of Operations and Comprehensive Loss. Card Network fees are equal to a specified percentage of processing volume or a fixed amount per transaction routed through the respective Card Network. Issuing Bank fees compensate our Issuing Banks for issuing cards to our customers and sponsoring our card programs with the Card Networks and are typically equal to a specified percentage of processing volume or a fixed amount per transaction. Card fulfillment costs include physical cards, packaging, and other fulfillment costs.
We have separate marketing and incentive arrangements with Card Networks that provide us with monetary incentives for establishing customer card programs with, and routing volume through, the respective Card Network. The amount of the incentives is generally determined based on a percentage of the processing volume or the number of transactions routed over the Card Network. We record these incentives as a reduction of Card Network fees in customer arrangements where the Company is the principal. Generally, as processing volumes increase, we earn a higher rate of monetary incentives from these arrangements, subject to attaining certain volume thresholds during an annual measurement period. For certain incentive arrangements with an annual measurement period, the one-year period may not align with our fiscal year. Additionally, unusual fluctuations in Card Network fees can occur in the quarter in which volume thresholds are attained as higher incentive rates are applied to volumes over the entire measurement periods, which can span six or twelve months.
Operating Expenses
Compensation and Benefits. Compensation and benefits consist primarily of salaries, employee benefits, severance and other termination benefits, incentive compensation, contractors’ cost, and share-based compensation.
49
Technology. Technology consists primarily of third-party hosting fees, software licenses, and hardware purchases below our capitalization threshold, and support and maintenance costs.
Professional Services. Professional services consist primarily of consulting, legal, audit, and recruiting fees.
Occupancy. Occupancy consists primarily of rent expense, repairs, maintenance, and other building related costs.
Depreciation and Amortization. Depreciation and amortization consist primarily of depreciation of our fixed assets and amortization of capitalized Internal-use software and developed technology intangible assets.
Marketing and Advertising. Marketing and advertising consist primarily of costs of general marketing and promotional activities.
Other Operating Expenses. Other operating expenses consist primarily of insurance costs, indemnification costs, travel-related expenses, indirect state and local taxes, and other general office expenses.
Other Income (Expense), net
Other income (expense), net consists primarily of interest income from our short-term investments and cash deposits, gain from sale of equity method investments, impairment of equity method investments or other financial instruments, equity method investment share of loss, realized foreign currency gains and losses, and changes in the fair value of the redeemable convertible preferred stock warrant liabilities (for periods prior to the IPO).
Income Tax Benefit
Income tax expense consists of U.S. federal and state income taxes, and income taxes related to certain foreign jurisdictions. We maintain a full valuation allowance against our U.S. federal and state net deferred tax assets as we have concluded that it is not more likely than not that we will realize our net deferred tax assets.
50
Results of Operations
The following table sets forth our results of operations for the periods presented:
| Year Ended December 31, | ||||||||||||||||||||
| (dollars in thousands) | 2023 | 2022 | 2021 | |||||||||||||||||
| Net revenue | $ | 676,171 | $ | 748,206 | $ | 517,175 | ||||||||||||||
| Costs of revenue | 346,657 | 428,205 | 285,470 | |||||||||||||||||
| Gross profit | 329,514 | 320,001 | 231,705 | |||||||||||||||||
| Operating expenses: | ||||||||||||||||||||
| Compensation and benefits | 499,595 | 415,094 | 318,116 | |||||||||||||||||
| Technology | 55,612 | 52,361 | 33,637 | |||||||||||||||||
| Professional services | 21,679 | 23,479 | 18,443 | |||||||||||||||||
| Occupancy | 4,361 | 4,514 | 4,181 | |||||||||||||||||
| Depreciation and amortization | 10,741 | 3,853 | 3,534 | |||||||||||||||||
| Marketing and advertising | 2,566 | 3,995 | 2,284 | |||||||||||||||||
| Other operating expenses | 17,975 | 26,513 | 13,516 | |||||||||||||||||
| Total operating expenses | 612,529 | 529,809 | 393,711 | |||||||||||||||||
| Loss from operations | (283,015) | (209,808) | (162,006) | |||||||||||||||||
| Other income (expense), net | 52,440 | 24,926 | (2,563) | |||||||||||||||||
| Loss before income tax expense | (230,575) | (184,882) | (164,569) | |||||||||||||||||
Income tax benefit | (7,613) | (102) | (640) | |||||||||||||||||
| Net loss | $ | (222,962) | $ | (184,780) | $ | (163,929) | ||||||||||||||
51
Comparison of the Fiscal Years Ended December 31, 2023 and 2022
Net Revenue
| Year Ended December 31, | ||||||||||||||||||||||||||
| (dollars in thousands) | 2023 | 2022 | $ Change | % Change | ||||||||||||||||||||||
| Net revenue: | ||||||||||||||||||||||||||
| Total platform services, net | $ | 654,553 | $ | 725,629 | $ | (71,076) | (10) | % | ||||||||||||||||||
| Other services | 21,618 | 22,577 | (959) | (4) | % | |||||||||||||||||||||
| Total net revenue | $ | 676,171 | $ | 748,206 | $ | (72,035) | (10) | % | ||||||||||||||||||
| Total Processing Volume (TPV) (in millions) | $ | 222,264 | $ | 166,260 | $ | 56,004 | 34 | % | ||||||||||||||||||
Total net revenue decreased by $72.0 million, or 10%, for the year ended December 31, 2023 compared to the year ended December 31, 2022, of which $68.6 million was attributable to our largest customer, Block. The decrease in net revenue was primarily driven by the August 2023 Block Amendment which allowed for reduced pricing and impacted the revenue presentation for the Cash App Program as fees owed to Issuing Banks and Card Networks related to the Cash App primary Card Network volume are recorded as a reduction to the revenue earned from the Cash App program within net revenue effective as of July 1, 2023. In prior periods, these costs were included within Costs of revenue. The impact of these fees for the year ended December 31, 2023 was a $234.4 million reduction to net revenue, negatively impacting the growth rate by 31 percentage points. These decreases in net revenue were partially offset by increased TPV from Block’s programs. Revenue from other customers decreased $3.4 million, primarily driven by one customer migrating a portion of one of their programs to a competitor starting in Q3 2022, unfavorable changes in the mix of our card programs, particularly the growth of our PxM offering, and the impact of contract renewals partially offset by a 33% increase in TPV.
Other services revenue decreased $1.0 million, or 4%, for the year ended December 31, 2023 compared to the year ended December 31, 2022 due primarily to a decrease in card fulfillment revenue.
The increase in TPV was mainly driven by growth across all our major verticals, particularly financial services, and PxM customers. The growth in TPV for our top five customers, as determined by their individual TPV in each respective period, was 33% for the year ended December 31, 2023 compared to the year ended December 31, 2022. This growth was mirrored by a 37% increase in TPV from all other customers for the same period. Note that the top five customers may differ between the two periods.
Costs of Revenue and Gross Margin
| Year Ended December 31, | ||||||||||||||||||||||||||
| (dollars in thousands) | 2023 | 2022 | $ Change | % Change | ||||||||||||||||||||||
| Costs of revenue: | ||||||||||||||||||||||||||
| Card Network fees, net | $ | 309,453 | $ | 380,162 | $ | (70,709) | (19) | % | ||||||||||||||||||
| Issuing Bank fees | 21,549 | 30,160 | (8,611) | (29) | % | |||||||||||||||||||||
| Other | 15,655 | 17,883 | (2,228) | (12) | % | |||||||||||||||||||||
| Total costs of revenue | $ | 346,657 | $ | 428,205 | $ | (81,548) | (19) | % | ||||||||||||||||||
| Gross profit | $ | 329,514 | $ | 320,001 | $ | 9,513 | 3 | % | ||||||||||||||||||
| Gross margin | 49 | % | 43 | % | ||||||||||||||||||||||
Costs of revenue decreased by $81.5 million, or 19%, for the year ended December 31, 2023 compared to the year ended December 31, 2022. The decrease was primarily due to the revenue presentation change for our fees owed to Issuing Banks and Card Networks related to the Cash App primary Card Network volume which are now reflected within net revenue as a result of the August 2023 Block Amendment. In addition, the Company realized improved economics with Issuing Bank partners. These decreases were partially offset by increases in Issuing Bank and Network fees driven by increased TPV.
52
As a result of the decreases in costs of revenue being less than the decreases in net revenue explained above, our gross profit increased by $9.5 million, or 3%, for the year ended December 31, 2023 compared to the year ended December 31, 2022. Our gross margin increased to 49% during the year ended December 31, 2023 from 43% during the year ended December 31, 2022.
Operating Expenses
| Year Ended December 31, | ||||||||||||||||||||||||||
| (dollars in thousands) | 2023 | 2022 | $ Change | % Change | ||||||||||||||||||||||
| Operating expenses: | ||||||||||||||||||||||||||
| Salaries, bonus, benefits and payroll taxes | $ | 318,856 | $ | 254,351 | $ | 64,505 | 25 | % | ||||||||||||||||||
| Share-based compensation | 180,739 | 160,743 | 19,996 | 12 | % | |||||||||||||||||||||
| Total compensation and benefits | 499,595 | 415,094 | 84,501 | 20 | % | |||||||||||||||||||||
| Percentage of net revenue | 74 | % | 55 | % | ||||||||||||||||||||||
| Technology | 55,612 | 52,361 | 3,251 | 6 | % | |||||||||||||||||||||
| Percentage of net revenue | 8 | % | 7 | % | ||||||||||||||||||||||
| Professional services | 21,679 | 23,479 | (1,800) | (8) | % | |||||||||||||||||||||
| Percentage of net revenue | 3 | % | 3 | % | ||||||||||||||||||||||
| Occupancy | 4,361 | 4,514 | (153) | (3) | % | |||||||||||||||||||||
| Percentage of net revenue | 1 | % | 1 | % | ||||||||||||||||||||||
| Depreciation and amortization | 10,741 | 3,853 | 6,888 | 179 | % | |||||||||||||||||||||
| Percentage of net revenue | 2 | % | 1 | % | ||||||||||||||||||||||
| Marketing and advertising | 2,566 | 3,995 | $ | (1,429) | (36) | % | ||||||||||||||||||||
| Percentage of net revenue | — | % | 1 | % | ||||||||||||||||||||||
| Other operating expenses | 17,975 | 26,513 | (8,538) | (32) | % | |||||||||||||||||||||
| Percentage of net revenue | 3 | % | 4 | % | ||||||||||||||||||||||
| Total operating expenses | $ | 612,529 | $ | 529,809 | $ | 82,720 | ||||||||||||||||||||
| Percentage of net revenue | 91% | 71% | ||||||||||||||||||||||||
Salaries, bonus, benefits, and payroll taxes increased by $64.5 million, or 25%, for the year ended December 31, 2023 compared to the year ended December 31, 2022, primarily due to a $74.7 million, or 38%, increase in employee salaries, partially offset by a $5.3 million, or 13%, decrease in employee bonuses and a $4.8 million, or 35%, decrease in contractor expense. The increase in employee salaries was driven by $68.9 million in postcombination compensation costs to former employees of Power Finance and $11.6 million in costs related to the restructuring announced in the second quarter of 2023, partially offset by higher salaries, bonus, and benefits costs capitalized for internal-use software development.
Share-based compensation increased by $20.0 million, or 12% in the year ended December 31, 2023 compared to the year ended December 31, 2022 mainly due to the increase in the number of RSU awards granted to employees, partially offset by higher share-based compensation capitalized for internal-use development.
| Year Ended December 31, | ||||||||||||||||||||||||||
| (dollars in thousands) | 2023 | 2022 | $ Change | % Change | ||||||||||||||||||||||
Share-based compensation: | ||||||||||||||||||||||||||
Restricted stock units | $ | 99,648 | $ | 76,094 | $ | 23,554 | 31 | % | ||||||||||||||||||
| Stock options | 26,323 | 28,816 | (2,493) | (9) | % | |||||||||||||||||||||
| Executive Chairman Long-Term Performance Award | 53,214 | 53,214 | — | — | % | |||||||||||||||||||||
| Employee Stock Purchase Plan | 1,554 | 2,619 | (1,065) | (41) | % | |||||||||||||||||||||
| Total share-based compensation | $ | 180,739 | $ | 160,743 | $ | 19,996 | 12 | % | ||||||||||||||||||
53
Technology expenses increased by $3.3 million, or 6%, for the year ended December 31, 2023 compared to the year ended December 31, 2022. The increase was due to higher software as a service costs to support our continued growth and higher software licensing costs as we implement new internal systems and tools.
Professional services expenses decreased by $1.8 million, or 8%, for the year ended December 31, 2023 compared to the year ended December 31, 2022. The decrease was due to the decreased consulting and recruiting fees.
Occupancy expense remained relatively flat for the year ended December 31, 2023 compared to the year ended December 31, 2022.
Depreciation and amortization increased by $6.9 million, or 179%, for the year ended December 31, 2023 compared to the year ended December 31, 2022. The increase was primarily due to the amortization of developed technology intangible assets originating from the Power Finance acquisition.
Marketing and advertising expenses decreased by $1.4 million, or 36%, for the year ended December 31, 2023 compared to the year ended December 31, 2022 due to decreased conference and trade show costs incurred in the current year.
Other operating expenses decreased by $8.5 million, or 32%, for the year ended December 31, 2023 compared to the year ended December 31, 2022. The decrease was primarily due to cost optimization initiatives and an indemnification cost of $5.9 million that was recognized in the prior year.
Other Income (Expense), Net
| Year Ended December 31, | ||||||||||||||||||||||||||
| (dollars in thousands) | 2023 | 2022 | $ Change | % Change | ||||||||||||||||||||||
| Other income (expense), net | $ | 52,440 | $ | 24,926 | $ | 27,514 | 110 | % | ||||||||||||||||||
| Percentage of net revenue | 8 | % | 3 | % | ||||||||||||||||||||||
Other income (expense), net increased by $27.5 million, or 110%, for the year ended December 31, 2023 compared to the year ended December 31, 2022 primarily due to an increase of $32.8 million in interest income earned on our short-term investments portfolio and cash deposit balances, offset by a gain of $17.9 million from the sale of the Company’s equity method investment in a private company paired with an impairment of $11.6 million of an option to purchase the remaining equity interests in an equity method investee incurred during the prior year.
Income Tax Benefit
Income tax benefit increased by $7.5 million for the year ended December 31, 2023 compared to the year ended December 31, 2022 primarily attributable to a $8.0 million partial valuation allowance release due to the Power Finance acquisition, offset by income tax expenses resulting from profitable foreign operations.
Customer Concentration
We generated 68% and 71% of our net revenue from our largest customer, Block, during the years ended December 31, 2023 and 2022, respectively.
54
Use of Non-GAAP Financial Measures
Our non-GAAP measures have limitations as analytical tools and you should not consider them in isolation. These non-GAAP measures should not be viewed as a substitute for, or superior to, measures prepared in accordance with GAAP. In evaluating these non-GAAP measures, you should be aware that in the future we will incur expenses similar to the adjustments in the presentation of our non-GAAP measures set forth under “Key Operating Metric and Non-GAAP Financial Measures”. There are a number of limitations related to the use of these non-GAAP measures versus their most directly comparable GAAP measures, including the following:
•other companies, including companies in our industry, may calculate adjusted EBITDA and non-GAAP operating expenses differently than how we calculate this measure or not at all; this reduces its usefulness as a comparative measure;
•although depreciation and amortization are non-cash charges, the assets being depreciated and amortized may have to be replaced in the future, and adjusted EBITDA does not reflect cash capital expenditure requirements for such replacements or for new capital expenditures; and
•adjusted EBITDA does not reflect the effect of income taxes that may represent a reduction in cash available to us.
We encourage investors to review the related GAAP financial measures and the reconciliation of the non-GAAP financial measures to their most directly comparable GAAP financial measures.
55
A reconciliation of net loss to adjusted EBITDA and GAAP operating expenses to non-GAAP operating expenses for the periods presented is as follows:
| Year Ended December 31, | |||||||||||||||||
| 2023 | 2022 | 2021 | |||||||||||||||
| (dollars in thousands) | |||||||||||||||||
| Net revenue | $ | 676,171 | $ | 748,206 | $ | 517,175 | |||||||||||
| Net loss | $ | (222,962) | $ | (184,780) | $ | (163,929) | |||||||||||
| Net loss margin | (33) | % | (25) | % | (32) | % | |||||||||||
| Total operating expenses | $ | 612,529 | $ | 529,809 | $ | 393,711 | |||||||||||
| Net loss | $ | (222,962) | $ | (184,780) | $ | (163,929) | |||||||||||
| Depreciation and amortization expense | 10,741 | 3,853 | 3,534 | ||||||||||||||
| Share-based compensation expense | 183,630 | 160,743 | 142,660 | ||||||||||||||
| Payroll tax expense related to share-based compensation | 2,211 | 1,977 | 1,956 | ||||||||||||||
Acquisition-related expenses (1) | 75,473 | 1,439 | 1,089 | ||||||||||||||
Restructuring | 8,670 | — | — | ||||||||||||||
Other (income) expense, net | (52,440) | (24,926) | 2,563 | ||||||||||||||
Income tax benefit | (7,613) | (102) | (640) | ||||||||||||||
| Adjusted EBITDA | $ | (2,290) | $ | (41,796) | $ | (12,767) | |||||||||||
| Adjusted EBITDA Margin | (0.3) | % | (6) | % | (2) | % | |||||||||||
| Total operating expenses | $ | 612,529 | $ | 529,809 | $ | 393,711 | |||||||||||
| Depreciation and amortization expense | (10,741) | (3,853) | (3,534) | ||||||||||||||
| Share-based compensation expense | (183,630) | (160,743) | (142,660) | ||||||||||||||
| Payroll tax expense related to share-based compensation | (2,211) | (1,977) | (1,956) | ||||||||||||||
Restructuring | (8,670) | — | — | ||||||||||||||
Acquisition-related expenses (1) | (75,473) | (1,439) | (1,089) | ||||||||||||||
| Non-GAAP operating expenses | $ | 331,804 | $ | 361,797 | $ | 244,472 | |||||||||||
_______________
(1) Acquisition-related expenses, which include transaction costs, integration costs, and cash and non-cash postcombination compensation expense, have been excluded from adjusted EBITDA as such expenses are not reflective of our ongoing core operations and are not representative of the ongoing costs necessary to operate our business; instead, these are costs specifically associated with a discrete transaction.
56
Liquidity and Capital Resources
Since our inception through June 30, 2021, we financed our operations primarily through sales of equity securities and payments received from our customers. In June 2021, we completed our IPO in which we received aggregate net proceeds of $1.3 billion after deducting underwriting discounts and commissions of $91.6 million and offering costs of $7.5 million.
At December 31, 2023, our principal sources of liquidity included cash, cash equivalents, and short-term investments totaling $1.2 billion, with such amounts held for working capital purposes. Our cash equivalents and short-term investments were comprised primarily of bank deposits, money market funds, U.S. treasury bills, U.S. treasury securities, U.S. agency securities, asset-backed securities and corporate debt securities. We have generated significant operating losses as reflected in our accumulated deficit. We expect to continue to incur operating losses for the foreseeable future.
On September 14, 2022, our board of directors authorized a share repurchase program (the “2022 Share Repurchase Program”) of up to $100 million of our Class A common stock beginning September 15, 2022. Under the 2022 Share Repurchase Program, we were authorized to repurchase shares through open market purchases, in privately negotiated transactions or by other means, in accordance with applicable federal securities laws, including through trading plans under Rule 10b5-1 of the Exchange Act. The 2022 Share Repurchase Program had no set expiration date; however, the 2022 Share Repurchase Program was exhausted during the first quarter of 2023.
On May 8, 2023, our board of directors authorized a share repurchase program (the “2023 Share Repurchase Program” and together with the 2022 Share Repurchase Program, the “Share Repurchase Programs”) of up to $200 million of our Class A common stock. Under the 2023 Share Repurchase Program, we are authorized to repurchase shares through open market purchases, in privately negotiated transactions or by other means, in accordance with applicable federal securities laws, including through trading plans under Rule 10b5-1 of the Exchange Act. The 2023 Share Repurchase Program has no set expiration date. As of December 31, 2023, $32.2 million remained available for future share repurchases under the 2023 Share Repurchase Program.
On February 3, 2023, we acquired all outstanding stock of Power Finance. Upon the closure of the acquisition, we paid $135.8 million to the shareholders of Power Finance Inc, net of cash acquired. As part of the terms of the acquisition, we paid additional cash of $53.1 million for contingent consideration tied to performance-based goals that were achieved. We also entered into postcombination cash compensation arrangements with certain key acquired employees whereby we agreed to pay them $85.1 million of cash over a weighted average 2.2 year service period following the acquisition date (subject to forfeiture upon termination). As of December 31, 2023, $54.1 million of the postcombination cash compensation arrangements remained outstanding.
During the second quarter of 2023, we announced a restructuring plan intended to reduce operating expenses and improve profitability by reducing the Company’s workforce. In connection with the restructuring plan, we have paid approximately $14.6 million to impacted employees primarily related to one-time severance and benefit payments as of December 31, 2023.
We believe our existing cash and cash equivalents, and our short-term investments will be sufficient to meet our working capital and capital expenditure needs for more than the next 12 months. As of the date of filing this Annual Report on Form 10-K, we have access to and control over all our cash, cash equivalents and short-term investments, except amounts held as restricted cash. Our future capital requirements will depend on many factors, including our planned continuing investment in product development, platform infrastructure, share repurchases, and global expansion. We will use our cash for a variety of needs, including for ongoing investments in our business, potential strategic acquisitions, capital expenditures and investment in our infrastructure, including our non-cancellable purchase commitments with cloud-computing service providers and certain Issuing Banks.
At December 31, 2023, we had $8.5 million in restricted cash which included a deposit held at an Issuing Bank to provide the Issuing Bank collateral in the event that our customers' funds are not deposited at the Issuing Bank in time to settle our customers' transactions with the Card Networks. Restricted cash also includes cash held at a bank to secure our payments under a lease agreement for our office space.
57
Cash Flows
The following table summarizes our cash flows for the periods indicated:
| Year Ended December 31, | |||||||||||||||||
| 2023 | 2022 | 2021 | |||||||||||||||
| (in thousands) | |||||||||||||||||
Net cash provided by (used in) operating activities | $ | 21,104 | $ | (12,966) | $ | 56,972 | |||||||||||
| Net cash provided by (used in) investing activities | 38,516 | 28,718 | (329,121) | ||||||||||||||
| Net cash (used in) provided by financing activities | (261,794) | (79,487) | 1,299,297 | ||||||||||||||
| (Decrease) Increase in cash, cash equivalents, and restricted cash | $ | (202,174) | $ | (63,735) | $ | 1,027,148 | |||||||||||
Operating Activities
Our largest source of cash provided by our operating activities is our net revenue. Our primary uses of cash in our operating activities are for Card Network and Issuing Bank fees, and employee-related compensation. The timing of settlement of certain operating liabilities, including Revenue Share payments, bonus payments and prepayments made to cloud-computing service providers, can affect the amounts reported as Net cash used in or provided by operating activities on the Consolidated Statement of Cash Flows.
Net cash provided by operating activities was $21.1 million for the year ended December 31, 2023 compared to a net cash used of $13.0 million in the year ended December 31, 2022. The increase in net cash provided by operating activities during fiscal year 2023 was mainly due to increased non-cash expenses and the timing of payments for costs of our services and operating expenses.
Investing Activities
Net cash provided by investing activities consists primarily of maturities and sales of our investments in short-term investments and sale of equity method investments. Net cash used in investing activities consists primarily of purchases of short-term investments, purchases of property and equipment, and equity method investments.
Net cash provided by investing activities was $38.5 million for the year ended December 31, 2023 compared to $28.7 million in the year ended December 31, 2022. The increase in net cash provided by investing activities during fiscal year 2023 was primarily due to sale and maturities in short-term investments, partially offset by the purchase of short-term investments, the Power Finance acquisition in 2023, the sale of equity method investments in 2022, and capitalization of internal-use software.
Financing Activities
Net cash provided by financing activities consists primarily of proceeds from the issuance of our equity securities. Net cash used in financing activities consists primarily of net payments related to the share-based compensation activity and share repurchase programs.
Net cash used in financing activities was $261.8 million for the year ended December 31, 2023 compared to a net cash used of $79.5 million in the year ended December 31, 2022. The increase in net cash used in financing activities is primarily due to payments to repurchase shares under the Share Repurchase Programs, the payment of the contingent consideration from our Power Finance acquisition and share-based compensation activity.
Obligations and Other Commitments
Our principal commitments consist of obligations under our operating leases for office space and other non-cancellable purchase commitments. For additional information about our operating leases and non-cancellable purchase commitments, see Note 7 “Leases” and Note 8 “Commitments and Contingencies” to our Consolidated Financial Statements.
58
Critical Accounting Policies and Estimates
Our Consolidated Financial Statements are prepared in accordance with accounting principles generally accepted in the United States. The preparation of these Consolidated Financial Statements requires us to make estimates and assumptions that affect the reported amounts of assets, liabilities, revenue, costs, and expenses, and related disclosures. On an ongoing basis, we evaluate our accounting estimates and assumptions. Our actual results may differ from these estimates under different assumptions or conditions.
Our significant accounting policies, including recent accounting pronouncements, are described in “Note 2- Summary of Significant Accounting Policies” in the accompanying notes to our Consolidated Financial Statements included elsewhere in this Annual Report on Form 10-K. We believe that of our significant accounting policies, the following policies involve accounting estimates and assumptions which we consider to be the most critical to our financial statements. An accounting estimate or assumption is considered critical if both (a) the nature of the estimate or assumption is material due to the levels of subjectivity and judgment involved, and (b) the impact within a reasonable range of outcomes of the estimate and assumption is material to our Consolidated Financial Statements.
Revenue Recognition
We interact with third party Issuing Banks and Card Networks to deliver our Platform Services to our customers. For revenue generated from customer arrangements that involve third parties, there is significant judgment in evaluating whether we are the principal, and report revenue on a gross basis, or the agent, and report revenue on a net basis. In this assessment, we consider if we obtain control of the specified goods or services before they are transferred to the customer. The assessment of whether we are considered the principal or the agent in a transaction could impact our Net revenue and Cost of revenue recognized on the Consolidated Statements of Operations and Comprehensive Loss.
Business Combinations
When we acquire a business, the purchase price is allocated to the acquired assets, including separately identifiable intangible assets, and assumed liabilities at their respective estimated fair values. Any residual purchase price is recorded as goodwill. The allocation of the purchase price requires management to make significant estimates in determining the fair values of assets acquired and liabilities assumed, especially with respect to intangible assets. These estimates can include, but are not limited to:
•future expected cash flows from acquired developed technologies;
•obsolescence curves and other useful life assumptions, such as the period of time and intended use of acquired intangible assets in our product offerings;
•discount rates;
•uncertain tax positions and tax-related valuation allowances; and
•fair value of assumed equity awards.
These estimates are inherently uncertain and unpredictable, and unanticipated events and circumstances may occur that may affect the accuracy or validity of such assumptions, estimates, or actual results. During the measurement period, which may be up to one year from the acquisition date, adjustments to the fair value of these tangible and intangible assets acquired and liabilities assumed may be recorded, with the corresponding offset to goodwill. We continue to collect information and reevaluate these estimates and assumptions quarterly and record any adjustments to our preliminary estimates to goodwill provided that we are within the measurement period. Upon the conclusion of the measurement period or final determination of the fair value of assets acquired or liabilities assumed, whichever comes first, any subsequent adjustments are recorded to the Consolidated Statements of Operations and Comprehensive Loss.
59
Item 7A. Quantitative and Qualitative Disclosures about Market Risk
We have operations within the United States and globally, and we are exposed to market risks in the ordinary course of our business. Information relating to quantitative and qualitative disclosures about these market risks is described below.
Interest Rate Risk
We had cash, cash equivalents, and short-term investments totaling $1.2 billion as of December 31, 2023. Such amounts included cash deposits, money market funds, U.S. treasury bills, U.S. treasury securities, U.S. agency securities, commercial paper, and corporate debt securities. The fair value of our cash, cash equivalents, and short-term investments would not be significantly affected by either an increase or decrease in interest rates due to the short-term maturities of the majority of these instruments. Because we classify our short-term investments as “available-for-sale”, no gains or losses are recognized in the Consolidated Statement of Operations and Comprehensive Loss due to changes in interest rates unless such securities are sold prior to maturity or declines in fair value are due to credit losses. We have the ability to hold all short-term investments until their maturities. A hypothetical 100 basis point increase or decrease in interest rates would not have a material effect on our financial results or financial condition.
Foreign Currency Exchange Risk
Most of our sales and operating expenses are denominated in U.S. dollars, and therefore our results of operations are not currently subject to significant foreign currency risk. As of December 31, 2023, a hypothetical 10% change in foreign currency exchange rates applicable to our business would not have had a material impact on our Consolidated Financial Statements.
60
Item 8. Financial Statements and Supplementary Data
MARQETA, INC.
FORM 10-K
INDEX TO CONSOLIDATED FINANCIAL STATEMENTS
| Page | |||||
Report of Registered Independent Public Accounting Firm (PCAOB ID: | |||||
61
Report of Independent Registered Public Accounting Firm
To the Stockholders and the Board of Directors of Marqeta, Inc.
Opinion on the Financial Statements
We have audited the accompanying consolidated balance sheets of Marqeta, Inc. (the Company) as of December 31, 2023 and 2022, the related consolidated statements of operations and comprehensive loss, redeemable convertible preferred stock and stockholders’ equity (deficit) and cash flows for each of the three years in the period ended December 31, 2023, and the related notes (collectively referred to as the “consolidated financial statements”). In our opinion, the consolidated financial statements present fairly, in all material respects, the financial position of the Company at December 31, 2023 and 2022, and the results of its operations and its cash flows for each of the three years in the period ended December 31, 2023 in conformity with U.S. generally accepted accounting principles.
We also have audited, in accordance with the standards of the Public Company Accounting Oversight Board (United States) (PCAOB), the Company’s internal control over financial reporting as of December 31, 2023, based on criteria established in Internal Control - Integrated Framework issued by the Committee of Sponsoring Organizations of the Treadway Commission (2013 framework), and our report dated February 28, 2024, expressed an adverse opinion thereon.
Basis for Opinion
These financial statements are the responsibility of the Company's management. Our responsibility is to express an opinion on the Company’s financial statements based on our audits. We are a public accounting firm registered with the PCAOB and are required to be independent with respect to the Company in accordance with the U.S. federal securities laws and the applicable rules and regulations of the Securities and Exchange Commission and the PCAOB.
We conducted our audits in accordance with the standards of the PCAOB. Those standards require that we plan and perform the audit to obtain reasonable assurance about whether the financial statements are free of material misstatement, whether due to error or fraud. Our audits included performing procedures to assess the risks of material misstatement of the financial statements, whether due to error or fraud, and performing procedures that respond to those risks. Such procedures included examining, on a test basis, evidence regarding the amounts and disclosures in the financial statements. Our audits also included evaluating the accounting principles used and significant estimates made by management, as well as evaluating the overall presentation of the financial statements. We believe that our audits provide a reasonable basis for our opinion.
Critical Audit Matters
The critical audit matters communicated below are matters arising from the current period audit of the financial statements that were communicated or required to be communicated to the audit committee and that: (1) relate to accounts or disclosures that are material to the financial statements and (2) involved our especially challenging, subjective or complex judgments. The communication of the critical audit matters does not alter in any way our opinion on the consolidated financial statements, taken as a whole, and we are not, by communicating the critical audit matters below, providing separate opinions on the critical audit matters or on the accounts or disclosures to which they relate.
62
| Revenue Share, Consideration Payable to Customers | |||||
| Description of the Matter | For the year ended December 31, 2023, the Company’s net revenue was $676.2 million, and as of December 31, 2023, the Company’s revenue share payable was $173.6 million. As described in Note 2 to the consolidated financial statements, the Company's contracts with customers typically include provisions under which the Company shares a portion of interchange fees with its customers, referred to as revenue share. Revenue share payments are incentives to customers to increase their processing volume on the Company’s platform, and is computed as a percentage of the interchange fees earned or processing volume, and is paid to customers monthly. As customers’ processing volumes increase, the customers may earn an increased percentage of revenue share. Revenue share, determined to be consideration payable to customers, is recorded as a reduction to net revenue in the consolidated statements of operations and comprehensive loss. The Company records the amount due to the customer as revenue share payable on the consolidated balance sheets. Auditing the Company’s revenue share amounts was challenging because the revenue share calculation includes a significant volume of data and multiple inputs that could be different across customers. Further, the revenue share calculation for certain customers is performed manually by the Company because of the bespoke and complex nature of certain contractual terms. | ||||
| How We Addressed the Matter in Our Audit | We performed the following audit procedures, among others, related to revenue share amounts. We independently calculated total annual revenue share for a sample of customers based on the contractual terms of the customers’ agreements and other inputs, including processing volume, interchange fees and card network and issuing bank fees using source data and compared our independent calculations of revenue share to the Company’s recorded amounts. For this same sample of customers, we inspected the underlying customer agreements and used the revenue share rates per the contract to calculate each customer’s total annual revenue share. Additionally, we performed analytical procedures to assess the revenue share for all other customers entitled to revenue share over the fiscal year and evaluated any significant deviations from developed expectations that considered contractual revenue share rates and processing volume, among other factors. We tested the completeness and accuracy of the underlying payment transaction data used in the revenue share calculation and also compared the revenue share payable as of December 31, 2023, to amounts paid in subsequent periods. | ||||
63
Valuation of an Acquired Developed Technology Intangible Asset | |||||
Description of the Matter | As discussed in Note 4 to the consolidated financial statements, the Company acquired Power Finance Inc. on February 3, 2023 for a base cash purchase price of $221.9 million. The Company accounted for this acquisition as a business combination and, accordingly, the assets acquired and liabilities assumed from Power Finance Inc. were recorded at fair value as of the acquisition date. Auditing the Company’s accounting for the acquisition of Power Finance Inc. was complex due to the estimation uncertainty in the Company’s determination of the fair value of acquired developed technology of $41.0 million, which was estimated using an income approach. The estimation uncertainty was primarily due to the determination of the underlying assumptions used in the fair value measurement of the acquired developed technology. The significant assumptions used by management included revenue and EBITDA forecasts, obsolescence rate, and discount rate. These significant assumptions are forward looking and could be affected by future economic and market conditions. | ||||
How We Addressed the Matter in Our Audit | To test the fair value of the acquired developed technology, our audit procedures included, among others, inspecting the underlying business combination agreements, and involving our valuation specialists to assist in evaluating management’s selected valuation methodology and testing the significant assumptions described above. For example, we evaluated the discount rate by comparing the rate to those of the acquired business’s weighted internal rate of return, weighted-average return on assets, and venture capital rates of return. To evaluate the assumptions used to project cash flows attributable to the acquired developed technology, we compared the significant assumptions to the Company’s historical trends and market data and performed a sensitivity analysis of the significant assumptions to evaluate the change in the fair value that would result from changes in the assumptions. | ||||
/s/ Ernst & Young LLP
We have served as the Company’s auditor since 2018.
February 28, 2024
64
Report of Independent Registered Public Accounting Firm
To the Stockholders and the Board of Directors of Marqeta, Inc.
Opinion on Internal Control Over Financial Reporting
We have audited Marqeta, Inc.'s internal control over financial reporting as of December 31, 2023, based on criteria established in Internal Control – Integrated Framework issued by the Committee of Sponsoring Organizations of the Treadway Commission (2013 framework), (the COSO criteria). In our opinion, because of the effect of the material weaknesses described below on the achievement of the objectives of the control criteria, Marqeta, Inc. (the Company) has not maintained effective internal control over financial reporting as of December 31, 2023, based on the COSO criteria.
A material weakness is a deficiency, or combination of deficiencies, in internal control over financial reporting, such that there is a reasonable possibility that a material misstatement of the company’s annual or interim financial statements will not be prevented or detected on a timely basis. The following material weaknesses have been identified and included in management’s assessment.
Management identified a material weakness related to the accounting for the Company’s acquisition of Power Finance, including a lack of sufficient precision in the performance of reviews supporting the purchase price allocation accounting, and a lack of timely oversight over third-party specialists and the reports they produced to support the accounting for the Power Finance acquisition.
Management identified a material weakness related to ineffective information technology general controls (“ITGCs”) in user access over certain information technology (“IT”) systems that support the Company’s revenue and related financial reporting processes. As a result, the related process-level IT dependent manual controls, certain change management controls, and automated application controls for certain key IT systems were also deemed ineffective.
We also have audited, in accordance with the standards of the Public Company Accounting Oversight Board (United States) (PCAOB), the consolidated balance sheets of the Company as of December 31, 2023 and 2022, and the related consolidated statements of operations and comprehensive loss, redeemable convertible preferred stock and stockholders' equity (deficit) and cash flows for each of the three years in the period ended December 31, 2023, and the related notes. These material weaknesses were considered in determining the nature, timing and extent of audit tests applied in our audit of the 2023 consolidated financial statements, and this report does not affect our report dated February 28, 2024, which expressed an unqualified opinion thereon.
Basis for Opinion
The Company’s management is responsible for maintaining effective internal control over financial reporting and for its assessment of the effectiveness of internal control over financial reporting included in the accompanying Management's Report on Internal Control Over Financial Reporting. Our responsibility is to express an opinion on the Company’s internal control over financial reporting based on our audit. We are a public accounting firm registered with the PCAOB and are required to be independent with respect to the Company in accordance with the U.S. federal securities laws and the applicable rules and regulations of the Securities and Exchange Commission and the PCAOB.
We conducted our audit in accordance with the standards of the PCAOB. Those standards require that we plan and perform the audit to obtain reasonable assurance about whether effective internal control over financial reporting was maintained in all material respects.
Our audit included obtaining an understanding of internal control over financial reporting, assessing the risk that a material weakness exists, testing and evaluating the design and operating effectiveness of internal control based on the assessed risk, and performing such other procedures as we considered necessary in the circumstances. We believe that our audit provides a reasonable basis for our opinion.
Definition and Limitations of Internal Control Over Financial Reporting
65
A company’s internal control over financial reporting is a process designed to provide reasonable assurance regarding the reliability of financial reporting and the preparation of financial statements for external purposes in accordance with generally accepted accounting principles. A company’s internal control over financial reporting includes those policies and procedures that (1) pertain to the maintenance of records that, in reasonable detail, accurately and fairly reflect the transactions and dispositions of the assets of the company; (2) provide reasonable assurance that transactions are recorded as necessary to permit preparation of financial statements in accordance with generally accepted accounting principles, and that receipts and expenditures of the company are being made only in accordance with authorizations of management and directors of the company; and (3) provide reasonable assurance regarding prevention or timely detection of unauthorized acquisition, use, or disposition of the company’s assets that could have a material effect on the financial statements.
Because of its inherent limitations, internal control over financial reporting may not prevent or detect misstatements. Also, projections of any evaluation of effectiveness to future periods are subject to the risk that controls may become inadequate because of changes in conditions, or that the degree of compliance with the policies or procedures may deteriorate.
/s/ Ernst & Young LLP
February 28, 2024
66
Marqeta, Inc.
Consolidated Balance Sheets
(in thousands, except share and per share amounts)
| As of December 31, | |||||||||||
| 2023 | 2022 | ||||||||||
| Assets | |||||||||||
| Current assets: | |||||||||||
| Cash and cash equivalents | $ | $ | |||||||||
| Restricted cash | |||||||||||
Short-term investments | |||||||||||
| Accounts receivable, net | |||||||||||
| Settlements receivable, net | |||||||||||
| Network incentives receivable | |||||||||||
| Prepaid expenses and other current assets | |||||||||||
| Total current assets | |||||||||||
| Operating lease right-of-use assets, net | |||||||||||
| Property and equipment, net | |||||||||||
Intangible assets, net | |||||||||||
Goodwill | |||||||||||
| Other assets | |||||||||||
| Total assets | $ | $ | |||||||||
| Liabilities and stockholders’ equity | |||||||||||
| Current liabilities: | |||||||||||
| Accounts payable | $ | $ | |||||||||
| Revenue share payable | |||||||||||
| Accrued expenses and other current liabilities | |||||||||||
| Total current liabilities | |||||||||||
| Operating lease liabilities, net of current portion | |||||||||||
| Other liabilities | |||||||||||
| Total liabilities | |||||||||||
Commitments and contingencies (Note 10) | |||||||||||
| Stockholders’ equity: | |||||||||||
Preferred stock, $ | |||||||||||
Common stock, $ | |||||||||||
| Additional paid-in capital | |||||||||||
Accumulated other comprehensive income (loss) | ( | ||||||||||
| Accumulated deficit | ( | ( | |||||||||
| Total stockholders’ equity | |||||||||||
| Total liabilities and stockholders’ equity | $ | $ | |||||||||
See accompanying notes to Consolidated Financial Statements.
67
Marqeta, Inc.
Consolidated Statements of Operations and Comprehensive Loss
(in thousands, except share and per share amounts)
| Year Ended December 31, | |||||||||||||||||
| 2023 | 2022 | 2021 | |||||||||||||||
| Net revenue | $ | $ | $ | ||||||||||||||
| Costs of revenue | |||||||||||||||||
| Gross profit | |||||||||||||||||
| Operating expenses: | |||||||||||||||||
| Compensation and benefits | |||||||||||||||||
| Technology | |||||||||||||||||
| Professional services | |||||||||||||||||
| Occupancy | |||||||||||||||||
| Depreciation and amortization | |||||||||||||||||
| Marketing and advertising | |||||||||||||||||
| Other operating expenses | |||||||||||||||||
| Total operating expenses | |||||||||||||||||
| Loss from operations | ( | ( | ( | ||||||||||||||
| Other income (expense), net | ( | ||||||||||||||||
| Loss before income tax expense | ( | ( | ( | ||||||||||||||
Income tax benefit | ( | ( | ( | ||||||||||||||
| Net loss | $ | ( | $ | ( | $ | ( | |||||||||||
| Net loss attributable to common stockholders | $ | ( | $ | ( | $ | ( | |||||||||||
| Other comprehensive income (loss), net of taxes: | |||||||||||||||||
| Change in foreign currency translation adjustment | $ | ( | $ | ( | $ | ( | |||||||||||
Net change in unrealized gain (loss) on short-term investments | ( | ( | |||||||||||||||
| Net other comprehensive income (loss) | ( | ( | |||||||||||||||
| Comprehensive loss | $ | ( | $ | ( | $ | ( | |||||||||||
| Net loss per share attributable to common stockholders, basic and diluted | $ | ( | $ | ( | $ | ( | |||||||||||
| Weighted-average shares used in computing net loss per share attributable to common stockholders, basic and diluted | |||||||||||||||||
See accompanying notes to Consolidated Financial Statements.
68
Marqeta, Inc.
Consolidated Statements of Redeemable Convertible Preferred Stock and Stockholders' Equity (Deficit)
(in thousands, except share amounts)
Redeemable Convertible Preferred Stock | Common Stock | Additional Paid-in Capital | Accumulated Other Comprehensive Income (loss) | Accumulated Deficit | Total Stockholders’ Equity (Deficit) | ||||||||||||||||||||||||||||||||||||||||||
| Shares | Amount | Shares | Amount | ||||||||||||||||||||||||||||||||||||||||||||
| Balance as of January 1, 2021 | ( | ( | |||||||||||||||||||||||||||||||||||||||||||||
| Issuance of common stock upon initial public offering, net of issuance costs | — | — | — | — | |||||||||||||||||||||||||||||||||||||||||||
| Conversion of redeemable convertible preferred stock to common stock upon initial public offering | ( | ( | — | — | |||||||||||||||||||||||||||||||||||||||||||
| Reclassification of redeemable convertible preferred stock warrant liabilities to common stock and additional paid-in capital upon initial public offering | — | — | — | — | — | — | |||||||||||||||||||||||||||||||||||||||||
| Issuance of common stock upon exercise of options | — | — | — | — | — | ||||||||||||||||||||||||||||||||||||||||||
| Issuance of common stock under employee stock purchase plan | — | — | — | — | — | ||||||||||||||||||||||||||||||||||||||||||
| Repurchase of early exercised stock options | — | — | ( | — | — | — | — | — | |||||||||||||||||||||||||||||||||||||||
| Issuance of common stock upon net settlement of restricted stock units | — | — | — | ( | — | — | ( | ||||||||||||||||||||||||||||||||||||||||
| Issuance of common stock upon exercise of common stock warrants | — | — | — | — | — | ||||||||||||||||||||||||||||||||||||||||||
| Vesting of common stock warrants | — | — | — | — | — | — | |||||||||||||||||||||||||||||||||||||||||
| Share-based compensation expense | — | — | — | — | — | — | |||||||||||||||||||||||||||||||||||||||||
| Change in accumulated other comprehensive income (loss) | — | — | — | — | — | ( | — | ( | |||||||||||||||||||||||||||||||||||||||
| Net loss | — | — | — | — | — | — | ( | ( | |||||||||||||||||||||||||||||||||||||||
| Balance as of December 31, 2021 | $ | $ | $ | $ | ( | $ | ( | $ | |||||||||||||||||||||||||||||||||||||||
| Issuance of common stock upon exercise of options | — | — | — | — | — | ||||||||||||||||||||||||||||||||||||||||||
| Repurchase of early exercised stock options | — | — | ( | — | — | — | — | — | |||||||||||||||||||||||||||||||||||||||
| Issuance of common stock under employee stock purchase plan | — | — | — | — | — | ||||||||||||||||||||||||||||||||||||||||||
| Issuance of common stock upon net settlement of restricted stock units | — | — | — | ( | — | — | ( | ||||||||||||||||||||||||||||||||||||||||
| Vesting of common stock warrants | — | — | — | — | — | — | |||||||||||||||||||||||||||||||||||||||||
| Share-based compensation expense | — | — | — | — | — | — | |||||||||||||||||||||||||||||||||||||||||
| Repurchase and retirement of common stock | — | — | ( | ( | ( | — | — | ( | |||||||||||||||||||||||||||||||||||||||
| Change in accumulated other comprehensive income (loss) | — | — | — | — | — | ( | — | ( | |||||||||||||||||||||||||||||||||||||||
| Net loss | — | — | — | — | — | — | ( | ( | |||||||||||||||||||||||||||||||||||||||
| Balance as of December 31, 2022 | $ | $ | $ | $ | ( | $ | ( | $ | |||||||||||||||||||||||||||||||||||||||
| Issuance of common stock upon exercise of options | — | — | — | — | |||||||||||||||||||||||||||||||||||||||||||
| Repurchase of early exercised stock options | — | — | ( | — | — | — | — | — | |||||||||||||||||||||||||||||||||||||||
| Issuance of common stock under employee stock purchase plan | — | — | — | — | — | ||||||||||||||||||||||||||||||||||||||||||
| Issuance of common stock upon net settlement of restricted stock units | — | — | ( | — | — | ( | |||||||||||||||||||||||||||||||||||||||||
| Issuance of common stock upon exercise of common stock warrants | — | — | — | — | — | — | — | ||||||||||||||||||||||||||||||||||||||||
| Vesting of common stock warrants | — | — | — | — | — | — | |||||||||||||||||||||||||||||||||||||||||
| Share-based compensation expense | — | — | — | — | — | — | |||||||||||||||||||||||||||||||||||||||||
| Repurchase and retirement of common stock, including excise tax | — | — | ( | ( | ( | — | — | ( | |||||||||||||||||||||||||||||||||||||||
| Change in accumulated other comprehensive income (loss) | — | — | — | — | — | — | |||||||||||||||||||||||||||||||||||||||||
| Net loss | — | — | — | — | — | — | ( | ( | |||||||||||||||||||||||||||||||||||||||
| Balance as of December 31, 2023 | ( | ||||||||||||||||||||||||||||||||||||||||||||||
See accompanying notes to Consolidated Financial Statements.
69
Marqeta, Inc.
Consolidated Statements of Cash Flows
(in thousands)
| Year Ended December 31, | |||||||||||||||||
| 2023 | 2022 | 2021 | |||||||||||||||
| Cash flows from operating activities: | |||||||||||||||||
| Net loss | $ | ( | $ | ( | $ | ( | |||||||||||
| Adjustments to reconcile net loss to net cash provided by operating activities: | |||||||||||||||||
| Depreciation and amortization | |||||||||||||||||
| Share-based compensation expense | |||||||||||||||||
| Non-cash operating leases expense | |||||||||||||||||
| Non-cash postcombination compensation expense | |||||||||||||||||
Amortization of premium on short-term investments | ( | ||||||||||||||||
| Gain on sale of equity method investment | ( | ||||||||||||||||
| Impairment of other financial instruments | |||||||||||||||||
| Other | |||||||||||||||||
| Changes in operating assets and liabilities: | |||||||||||||||||
| Accounts receivable | ( | ( | ( | ||||||||||||||
| Settlements receivable | ( | ( | |||||||||||||||
| Network incentives receivable | ( | ( | ( | ||||||||||||||
| Prepaid expenses and other assets | ( | ( | |||||||||||||||
| Accounts payable | ( | ||||||||||||||||
| Revenue share payable | |||||||||||||||||
| Accrued expenses and other liabilities | |||||||||||||||||
| Operating lease liabilities | ( | ( | ( | ||||||||||||||
Net cash provided by (used in) operating activities | ( | ||||||||||||||||
| Cash flows from investing activities: | |||||||||||||||||
| Purchases of property and equipment | ( | ( | ( | ||||||||||||||
Capitalization of internal-use software | ( | ||||||||||||||||
Business combination, net of cash acquired | ( | ||||||||||||||||
| Purchase of patents | ( | ||||||||||||||||
Purchases of short-term investments | ( | ( | ( | ||||||||||||||
Sales of short-term investments | |||||||||||||||||
Maturities of short-term investments | |||||||||||||||||
| Realized gain/loss on investments | ( | ||||||||||||||||
| Purchase of equity method investment and purchase option | ( | ||||||||||||||||
| Sale of equity method investment | |||||||||||||||||
| Net cash provided by (used in) investing activities | ( | ||||||||||||||||
| Cash flows from financing activities: | |||||||||||||||||
| Proceeds from initial public offering, net of underwriters’ discounts and commissions | |||||||||||||||||
| Proceeds from exercise of stock options, including early exercised stock options, net of repurchase of early exercised unvested options | |||||||||||||||||
| Payment of contingent consideration | ( | ||||||||||||||||
| Proceeds from exercise of warrants | |||||||||||||||||
| Proceeds from shares issued in connection with employee stock purchase plan | |||||||||||||||||
| Taxes paid related to net share settlement of restricted stock units | ( | ( | ( | ||||||||||||||
| Repurchase of common stock | ( | ( | |||||||||||||||
| Payment of deferred offering costs | ( | ||||||||||||||||
| Net cash (used in) provided by financing activities | ( | ( | |||||||||||||||
| (Decrease) Increase in cash, cash equivalents, and restricted cash | ( | ( | |||||||||||||||
| Cash, cash equivalents, and restricted cash - Beginning of period | |||||||||||||||||
| Cash, cash equivalents, and restricted cash - End of period | $ | $ | $ | ||||||||||||||
See accompanying notes to Consolidated Financial Statements.
70
Marqeta, Inc.
Consolidated Statements of Cash Flows
(in thousands)
| Year Ended December 31, | |||||||||||||||||
| 2023 | 2022 | 2021 | |||||||||||||||
| Reconciliation of cash, cash equivalents, and restricted cash | |||||||||||||||||
| Cash and cash equivalents | $ | $ | $ | ||||||||||||||
| Restricted cash | |||||||||||||||||
| Total cash, cash equivalents, and restricted cash | $ | $ | $ | ||||||||||||||
| Supplemental disclosures of cash flow information: | |||||||||||||||||
Cash paid for operating lease liabilities | $ | $ | $ | ||||||||||||||
| Cash paid for interest | $ | $ | $ | ||||||||||||||
| Cash paid for income taxes | $ | $ | $ | ||||||||||||||
| Supplemental disclosures of non-cash investing and financing activities: | |||||||||||||||||
| Purchase of property and equipment accrued and not yet paid | $ | $ | $ | ||||||||||||||
| Share-based compensation capitalized to internal-use software | $ | $ | $ | ||||||||||||||
| Repurchase of common stock accrued and not yet paid | $ | $ | $ | ||||||||||||||
| Vesting of early exercised stock options | $ | $ | $ | ||||||||||||||
See accompanying notes to Consolidated Financial Statements.
71
Marqeta, Inc.
Notes to Consolidated Financial Statements
(Tabular Amounts in Thousands, Except Share and Per Share Amounts, Ratios, or as Noted)
1. Business Overview and Basis of Presentation
Marqeta, Inc., (“the Company”) creates digital payment technology for innovation leaders. The Company's modern card issuing platform empowers its customers to create customized and innovative payment card programs, giving them the configurability and flexibility to build better payment experiences.
The Company provides all of its customers issuer processor services and for most of its customers it also acts as a card program manager. The Company primarily earns revenue from processing card transactions for its customers.
The Company was incorporated in the state of Delaware in 2010 and is headquartered in Oakland, California, with offices in the United States, United Kingdom, and legal entities in Australia, Brazil, Canada, Poland, and Singapore as of December 31, 2023.
Initial Public Offering
In June 2021, the Company completed an initial public offering (“IPO”), in which the Company issued and sold 52,272,727 shares of its newly authorized Class A common stock, which included 6,818,181 shares that were offered and sold pursuant to the full exercise of the underwriters’ option to purchase additional shares at a price of $27.00 per share. The Company received aggregate net proceeds of $1.3 billion after deducting underwriting discounts and commissions of $91.6 million and offering costs of $7.5 million.
Immediately prior to the completion of the IPO, the Company filed its Amended and Restated Certificate of Incorporation authorizing 1,500,000,000 shares of Class A common stock which entitles holders to one vote per share, 600,000,000 shares of Class B common stock which entitles holders to 10 votes per share, and 100,000,000 shares of undesignated preferred stock. All shares of common stock then outstanding were reclassified as Class B common stock and all redeemable convertible preferred stock then outstanding were converted into 351,844,340 shares of common stock on a one -for-one basis and reclassified into Class B common stock. In addition, 2,569,528 shares of common stock warrants were converted to an equivalent number of shares of Class B common stock warrants and 203,610 shares of convertible preferred stock warrants were converted to an equivalent number of shares of Class B common stock warrants.
Basis of Presentation
Use of Estimates
The preparation of the financial statements in conformity with GAAP requires management to make various estimates and assumptions relating to reported amounts of assets and liabilities, disclosure of contingent liabilities, and reported amounts of revenue and expenses. Significant estimates and assumptions include, but are not limited to, the fair value and useful lives of assets acquired and liabilities assumed through business combinations, the estimation of contingent liabilities, the fair value of equity awards and warrants, share-based compensation, the estimation of variable consideration in contracts with customers, the reserve for contract contingencies and processing errors, and valuation of income taxes. Actual results could differ materially from these estimates.
Business Risks and Uncertainties
The Company has incurred net losses since its inception. For the year ended December 31, 2023, the Company incurred a net loss of $223.0 million and had an accumulated deficit of $825.2 million as of December 31, 2023. The Company expects losses from operations to continue for the foreseeable future as it incurs costs and expenses related to creating new products for customers, acquiring new customers, developing its brand, expanding into new geographies and developing the existing platform infrastructure. The Company believes that its cash and cash equivalents of $981.0 million and short-term investments of $268.7 million as of December 31, 2023 are sufficient to fund its operations through at least the next twelve months from the issuance of these financial statements.
72
Marqeta, Inc.
Notes to Consolidated Financial Statements
(Tabular Amounts in Thousands, Except Share and Per Share Amounts, Ratios, or as Noted)
2. Summary of Significant Accounting Policies
Segment Information
The Company operates as a single operating segment and reporting unit. The Company's chief operating decision maker is its Chief Executive Officer, who reviews financial information presented on a consolidated basis for purposes of making operating decisions, assessing financial performance, allocating resources and evaluating the Company's financial performance.
For the years ended December 31, 2023, 2022, and 2021, net revenue outside of the United States, based on the billing address of the customer, was not material.
As of December 31, 2023 and December 31, 2022, long-lived assets located outside of the United States were not material.
Business Combinations
The Company allocates the purchase consideration for acquired companies to tangible and intangible assets acquired and liabilities assumed based on their estimated fair values as of the acquisition date, with the excess recorded to goodwill. These estimates are inherently uncertain and subject to refinement. During the measurement period, which may be up to one year from the acquisition date, the Company may record adjustments to the fair value of these tangible and intangible assets acquired and liabilities assumed with the corresponding offset to goodwill. Upon the conclusion of the measurement period or final determination of the fair value of assets acquired or liabilities assumed, whichever comes first, any subsequent adjustments are recorded to the Consolidated Statements of Operations and Comprehensive Loss. Acquisition-related expenses and postcombination integration and employee compensation costs are recognized separately from the business combination and are expensed as incurred.
Cash and Cash Equivalents
Restricted Cash
Short-term Investments
The Company's short-term investments include U.S. treasury securities, U.S. agency securities, commercial paper, asset-backed securities, and corporate debt securities. The Company's short-term investments are classified as available-for-sale and are recorded within current assets in the Consolidated Balance Sheets as the Company may sell these securities at any time for use in its operations, even prior to maturity.
The Company carries these short-term investments at fair value and periodically evaluates them for unrealized losses. For unrealized losses in securities that the Company intends to hold and will not more likely than not be required to sell before recovery, the Company further evaluates whether declines in fair value below amortized cost are due to credit or non-credit related factors. In making this assessment, the Company considers the extent to which fair value is less than amortized cost, any changes to the rating of the security by a rating agency, and any adverse conditions specifically related to the security, among other factors.
The Company considers credit related impairments to be changes in value that are driven by a change in
73
Marqeta, Inc.
Notes to Consolidated Financial Statements
(Tabular Amounts in Thousands, Except Share and Per Share Amounts, Ratios, or as Noted)
the creditor’s ability to meet its payment obligations, and records an allowance on the Consolidated Balance Sheets with a corresponding loss in Other income (expense), net in the Consolidated Statements of Operations and Comprehensive Loss when the impairment is incurred.
Unrealized non-credit related losses and unrealized gains are recorded as a separate component in Accumulated other comprehensive income (loss), a component of stockholders’ equity (deficit) until realized.
The Company records any realized gains or losses on the sale of short-term investments in Other income (expense), net in the Consolidated Statements of Operations and Comprehensive Loss.
Accounts Receivable
Settlements Receivable
Settlements receivable represent Interchange Fees earned on customers’ card transactions, net of pass through Card Network fees, and are due from Issuing Banks. Interchange Fees are typically received within one or two business days of the transaction date and are due from Issuing Banks with no historical collections issue, mitigating the associated risk of collection. No allowance has been established. The Company does not generate revenue from Issuing Banks.
Lease Obligations
The Company measures lease liabilities based on the present value of the total lease payments not yet paid discounted based on the Company’s incremental borrowing rate, which is the estimated rate the Company would be required to pay for a collateralized borrowing equal to the total lease payments over the term of the lease.
The Company measures right-of-use assets based on the corresponding lease liability adjusted for (i) payments made to the lessor at or before the commencement date, (ii) initial direct costs the Company incurs and (iii) tenant incentives under the lease. The Company begins to recognize rent expense when the lessor makes the underlying asset available to the Company.
For short-term leases, the Company records rent expense in the Consolidated Statements of Operations and Comprehensive Loss on a straight-line basis over the lease term and records variable lease payments as incurred. The Company has no finance leases.
Property and Equipment
Property and equipment is stated at cost, less accumulated depreciation and amortization. The Company uses the straight-line method of depreciation and amortization over the estimated useful lives of the assets; generally to five years for computer equipment, and furniture and fixtures. Leasehold improvements are amortized over the shorter of the lease term, excluding renewal periods, or the estimated useful life of the leasehold improvement.
The Company capitalizes internal and external direct costs incurred related to obtaining or developing internal-use software. Costs incurred during the application development stage are capitalized and are amortized using the straight-line method over the estimated useful lives of the software, generally three years commencing on the first day of the month following when the software is ready for its intended use. Costs related to planning and other preliminary project activities and post-implementation activities are
74
Marqeta, Inc.
Notes to Consolidated Financial Statements
(Tabular Amounts in Thousands, Except Share and Per Share Amounts, Ratios, or as Noted)
expensed as incurred.
Goodwill
The excess purchase price over the fair value of identifiable net assets acquired is recorded as goodwill. Goodwill amounts are not amortized.
Intangible Assets
Intangible assets with finite lives are carried at acquisition cost less accumulated amortization and are amortized over their estimated useful lives on a straight-line basis. The amortization of these assets is recorded within Depreciation and amortization expense on the Consolidated Statements of Operations and Comprehensive Loss.
Impairment
Impairment testing for goodwill is performed annually in the fourth quarter or more frequently whenever events or changes in circumstances indicate its carrying value may not be recoverable. Such testing is performed at the reporting unit level. Management has the option to first perform a qualitative assessment to determine whether it is more likely than not that the fair value of the reporting unit is less than the carrying amount, including goodwill. If it is determined that it is more likely than not that the fair value of the reporting unit is less than the carrying amount, a quantitative assessment is performed by comparing the fair value of a reporting unit with its carrying amount. An impairment charge is recognized for the amount by which the carrying amount exceeds the reporting unit’s fair value, not to exceed the total amount of goodwill allocated to that reporting unit. The Company also has the option to bypass the qualitative assessment and perform the quantitative assessment.
The Company reviews the valuation of long-lived assets, including property and equipment and finite-lived intangible assets, whenever events or changes in circumstances indicate that the carrying amount of the asset may not be recoverable. An asset is considered impaired if its carrying amount exceeds the future undiscounted cash flow the asset is expected to generate.
Based on management's assessment, the Company did not recognize any material impairment losses on its goodwill, finite-lived intangible assets or other long-lived assets during the periods presented herein.
Equity Investments and Purchase Options
The Company applies the equity method of accounting for investments in other entities when the Company exercises significant influence, but no control. Under the equity method, the Company records its share of each entity’s profit or loss in Other income (expense), net in the Consolidated Statements of Operations and Comprehensive Loss on a one quarter lag when the most recent financial information of the investee becomes available. The Company periodically reviews investments accounted for under the equity method for impairment. Investments in other entities not accounted for under the equity method of accounting, including options to purchase these entities, are accounted for at cost less impairment, if applicable. Additionally, the value of these investments may be adjusted to fair value resulting from observable transactions for identical or similar investments.
In 2021, the Company acquired a preferred equity interest in a private company that is accounted for under the equity method of accounting. Concurrent with this investment, the Company also acquired an option that gave the Company the right, but not the obligation, to purchase all of the remaining equity interests of the private company.
As of December 31, 2021, the option was reflected within prepaid expenses and other current assets in the consolidated balance sheets. The Company applied the measurement alternative to measure the option at cost, less any impairment. During the year ended December 31, 2022, the Company recorded an impairment of $11.6 million within Other income (expense), net on the Consolidated Statement of Operations and Comprehensive Loss related to the option based on the Company’s decision not to exercise the option.
75
Marqeta, Inc.
Notes to Consolidated Financial Statements
(Tabular Amounts in Thousands, Except Share and Per Share Amounts, Ratios, or as Noted)
During the year ended December 31, 2022, the Company sold its equity method investment in a private company. The carrying amount of this investment was $7.8 million as of the date of sale and the purchase price was $25.7 million. As a result, the Company recorded a gain of $17.9 million in the year ended December 31, 2022 in Other income (expense), net on the Consolidated Statement of Operations and Comprehensive Loss.
Deferred Offering Costs
Deferred offering costs consist primarily of accounting, legal, and other fees related to the IPO. Upon the completion of the IPO in June 2021, the deferred offering costs were reclassified to Stockholders’ equity (deficit) and recorded net against the proceeds from the IPO.
Revenue Recognition
Revenue is recognized when control of the promised goods or services is transferred to customers, in an amount that reflects the consideration to which the Company expects to be entitled in exchange for those goods or services.
Contracts with customers are evaluated on a contract-by-contract basis as contracts may include the transfer of multiple services. The Company’s contracts with customers typically include multiple performance obligations: 1) providing access to the Company's payment processing platform, 2) providing managed services or 3) providing card fulfillment services. The Company accounts for individual services as a separate performance obligation if they are distinct because the service is separately identifiable from other items in the arrangement and a customer can benefit from the good or service on its own or with other resources that are readily available to the customer. If these criteria are not met, the promised goods or services are accounted for as a combined performance obligation. Certain customer contracts require the Company to allocate the transaction price of the contract based on the relative stand-alone selling price of the performance obligations which are based on prices at which the Company separately sells each service or estimated using an analysis of the Company’s historical contract pricing and costs incurred to fulfill its services.
The Company generates revenue from providing platform services and other services as described below.
Platform Services
The Company delivers an integrated payment processing platform to its customers. The Company’s primary performance obligation is to provide customers continuous access to the Company’s platform used to process all customers’ transactions as needed. This obligation includes authorizing, settling, clearing and reconciling all transactions. Additionally, for certain customer arrangements, the performance obligations also include managing the interactions with Card Networks and/or the Issuing Banks on behalf of its customers or other managed services, including dispute management, fraud scoring, and cardholder support services.
The Company’s platform services revenue is derived from Interchange Fees generated by customer card transactions. The Company accounts for these Interchange Fees as revenue earned from its customers for performance obligations where the Company controls the services before delivery to the customer. The Company’s platform services revenue also includes processing and other transaction fees from transactions that are based on either a percentage of processing volume or a fee per transaction basis.
The Company’s platform services revenue primarily consists of stand-ready obligations which are satisfied over time and are accounted for as a series of distinct services that are substantially the same and have the same pattern of transfer to customers.
The Company recognizes revenue when the promised services are complete, and its performance obligations are satisfied. Platform services are considered complete when the Company has authorized the transaction, validated that the transaction has no errors, and accepted and posted the data to its records.
76
Marqeta, Inc.
Notes to Consolidated Financial Statements
(Tabular Amounts in Thousands, Except Share and Per Share Amounts, Ratios, or as Noted)
The Company allocates variable consideration to the distinct period in which the platform services are delivered. When pricing terms are not consistent throughout the entire term of the contract, the Company estimates variable consideration in its customer contracts primarily using the expected value method. The standard term of the customer contracts ranges from to five years , with automatic renewal for successive one-year periods thereafter unless either party provides written notice of its intent not to renew. The Company develops estimates of variable consideration on the basis of both historical information and current trends and does not expect or anticipate significant reversal of revenue in the future periods.
For net revenue generated from customer arrangements that involve third parties, the Company determines whether it has promised to provide the specified service itself (as principal) or to arrange for the specified service to be provided by another party (as an agent). This determination depends on the facts and circumstance of each arrangement, and in some instances, involves significant judgment. In order to deliver an integrated payment processing platform to its customers, the Company works with Issuing Banks and Card Networks in various capacities. The Company is considered the principal in customer arrangements where the Company controls the services performed by the Issuing Banks and Card Networks before delivery of the promised services to its customers, it is primarily responsible for the delivery of the services to customers, and it has discretion in vendor selection. As such, the Company records fees paid to the Issuing Banks and Card Networks as Costs of Revenue within the Consolidated Statements of Operations and Comprehensive Loss. In instances where the Company is considered an agent in providing services to the customer, fees for services paid to Issuing Banks and Card Networks, if any, are recorded within Net Revenue such that Net Revenue in the Consolidated Statements of Operations and Comprehensive Loss reflects the net amount of consideration that the Company retains.
Revenue Share
The Company’s contracts with customers typically include provisions under which the Company shares a portion of the Interchange Fees as consideration payable to its customers, referred to as Revenue Share. Revenue Share payments are incentives to customers to increase their processing volume on the Company’s platform, and is computed as a percentage of the Interchange Fees earned or processing volume and is paid to customers monthly.
The Company records Revenue Share as a reduction to net revenue in the Consolidated Statements of Operations and Comprehensive Loss. The Company records the amount due to the customer as Revenue Share payable on the Consolidated Balance Sheets.
Other Services Revenue
The Company earns revenue from customers through card fulfillment services. Card fulfillment fees are generally billed to customers upon ordering card inventory and recognized as revenue when the ordered cards are shipped to the customers. The Company offers certain customers the option to purchase physical cards at a discount. The Company has concluded that the discount does not constitute a future material right because the discount is within a range typically offered to the class of customers. Therefore, the Company accounts for the discount as a reduction to revenue when the Company delivers the ordered cards to the customers.
Contract Assets and Deferred Revenue
Contract assets, reported within Prepaid expenses and other current assets or within Other Assets in the Consolidated Balance Sheets, are primarily from upfront payments provided to certain customers and variable consideration from customer contracts where pricing terms are not consistent throughout the entire term of the contract.
Deferred revenue, reported within Accrued expenses and other current liabilities or Other liabilities in the Consolidated Balance Sheets, arises when customers pay for services in advance of the Company's revenue recognition. The Company's deferred revenue is primarily due to undelivered card fulfillment services, variable consideration from customer contracts where pricing terms are not consistent throughout the entire term of the contract, and non-refundable upfront setup fees that are billed at contract inception.
77
Marqeta, Inc.
Notes to Consolidated Financial Statements
(Tabular Amounts in Thousands, Except Share and Per Share Amounts, Ratios, or as Noted)
Arrangements that include rights to additional goods or services that are exercisable at a customer’s discretion are generally considered options. The Company assesses if these options provide a material right to the customer and if so, they are considered performance obligations. This material right is valued by estimating the discount that will be redeemed by the customer during the optional renewal period.
Reserve for Contract Contingencies and Processing Errors
Customer contracts generally contain service level agreements that can result in performance penalties payable by the Company when contractually required service levels are not met or can result in payments by the Company for processing errors. As such, the Company records a reserve for estimated performance penalties and processing errors. When providing for these reserves, the Company considers factors such as its history of incurring performance penalties and processing errors, actual contractual penalty charge rates in customer contracts, and known or estimated processing errors. These reserves are included in Accrued expenses and other current liabilities on the Consolidated Balance Sheets and the provision for contract contingencies and processing errors is included as a reduction to Net revenue on the Consolidated Statements of Operations and Comprehensive Loss.
Costs of Revenue
Costs of revenue consist of Card Network costs, Issuing Bank costs, and card fulfillment costs for customer arrangements where the Company is the principal in providing services to the customer and excludes depreciation and amortization, which is reported separately within the Consolidated Statements of Operations and Comprehensive Loss. Card Network costs are mostly equal to a specified percentage of the processing volume or a fixed amount per transaction processed through the respective Card Network. The Company incurs Card Network costs directly from contractual arrangements with the Card Networks that are passed entirely through Issuing Banks, or directly from the Card Networks. Issuing Bank costs compensate Issuing Banks for issuing cards to the Company’s customers and sponsoring the Company’s card programs with the Card Networks and are generally equal to a specified percentage of the processing volume or a fixed amount per transaction, subject to monthly minimum amounts. Card fulfillment costs include physical cards, packaging, and other fulfillment costs.
The Company has marketing and incentive arrangements with Card Networks that provide the Company with monetary incentives based on a percentage of the volume processed over the respective Card Network. Uncollected incentives are included in Network incentives receivable on the Consolidated Balance Sheets. The Company records these incentives as a reduction of Costs of revenue on the Consolidated Statements of Operations and Comprehensive Loss in customer arrangements where the Company is the principal. The Company's contracts with Card Networks and Issuing Banks typically have terms ranging from to five years which may be renewed in one-year to two-year increments as agreed by both parties.
Advertising Costs
Research and Development Costs
Research and development costs, which consist primarily of salaries, employees' benefits, share-based compensation, third-party hosting fees and software licenses were $148.0 million, $108.3 million, and $84.1 million for the years ended December 31, 2023, 2022 and 2021, respectively. Research and development costs are expensed as incurred and are included in Compensation and benefits, and Technology expenses in the Consolidated Statements of Operations and Comprehensive Loss.
Share-based Compensation
The primary types of share-based compensation utilized by the Company are restricted share units (“RSUs”) and stock options and the use of the employee stock purchase plan (“ESPP”). The Company determines compensation expense associated with RSUs based on the estimated fair value of its common stock on the date of grant. The compensation expense associated with stock options is determined based
78
Marqeta, Inc.
Notes to Consolidated Financial Statements
(Tabular Amounts in Thousands, Except Share and Per Share Amounts, Ratios, or as Noted)
on the estimated grant date fair value using the Black-Scholes option pricing model. The Company generally recognizes compensation expense using a straight-line amortization method over the respective vesting period. The Company accounts for forfeitures as they occur.
Defined Contribution Plans
Restructuring
Restructuring costs stem from employee related severance charges and include both cash and non-cash compensation. The Company generally recognizes restructuring costs upon communication of the plan to the identified employees or when payments are probable and amounts are estimable, depending on the region an employee works. Restructuring liabilities are classified in Accrued expenses and other current liabilities in the Consolidated Balance Sheets.
Income Taxes
The Company accounts for income taxes under the asset and liability method. Under this method, deferred tax assets and liabilities are determined based on the differences between the financial statements and tax bases of assets and liabilities using enacted tax rates in effect for the year in which the differences are expected to reverse. The effect of a change in tax rates on deferred tax assets and liabilities is recognized in income in the period that includes the enactment date.
The Company recognizes deferred tax assets to the extent that it believes these assets are more likely than not to be realized. In making such a determination, the Company considers the available positive and negative evidence, including future reversals of existing taxable temporary differences, projected future taxable income, tax-planning strategies, and results of recent operations. Valuation allowances are established when necessary to reduce deferred tax assets to the amounts that are more likely than not expected to be realized. If the Company determines that it is able to realize its deferred tax assets in the future in excess of the net recorded amount, the Company decreases the deferred tax asset valuation allowance, which reduces the income tax expense.
Uncertain tax positions are recognized only when the Company believes it is more likely than not that the tax position will be upheld on examination by the taxing authorities based on the merits of the position. The Company recognizes interest and penalties, if any, related to uncertain tax positions in Income tax benefit in the Consolidated Statements of Operations and Comprehensive Loss.
Net Loss Per Share Attributable to Common Stockholders
The Company presents basic and diluted net loss per share attributable to common stockholders in conformity with the two-class method required for participating securities. Prior to the completion of the IPO, all series of redeemable convertible preferred stock were considered participating securities. Immediately prior to the completion of the IPO, all shares of redeemable convertible preferred stock then outstanding were converted into shares of Class B common stock. The Company has not allocated net loss attributable to common stockholders to redeemable convertible preferred stock in any period presented because the holders of its redeemable convertible preferred stock were not contractually obligated to share in losses.
The Company calculates basic net loss per share attributable to common stockholders by dividing net loss attributable to common stockholders by the weighted-average number of shares of common stock outstanding during the period. Diluted net loss per share attributable to common stockholders gives effect to all potential shares of common stock, including common stock issuable upon conversion of redeemable convertible preferred stock and redeemable convertible preferred stock warrants, stock options, RSUs and common stock warrants to the extent these are dilutive.
79
Marqeta, Inc.
Notes to Consolidated Financial Statements
(Tabular Amounts in Thousands, Except Share and Per Share Amounts, Ratios, or as Noted)
Loss Contingencies
Fair Value Measurements
Fair value is an exit price, representing the price that would be received to sell the financial asset or paid to transfer the financial liability in an orderly transaction between market participants at the measurement date.
The fair value hierarchy includes a three-level classification, which is based on whether the inputs to the valuation methodology used for measurement are observable:
•Level 1 ‑ Inputs are quoted prices in active markets for identical assets as of the reporting date;
•Level 2 ‑ Inputs other than Level 1 that are observable, either directly or indirectly; or
•Level 3 ‑ Unobservable pricing inputs in the market.
When developing fair value measurements, the Company maximizes the use of observable inputs and minimizes the use of unobservable inputs. In instances where the Company lacks observable inputs in the market to measure the fair value of an asset or liability, the Company may use unobservable inputs which requires greater judgment in measuring fair value. In instances where there is limited or no observable market data, fair value measurements for assets and liabilities are based primarily upon the Company’s own estimates, and the measurements reflect information and assumptions that management believes a market participant would use in pricing the asset or liability.
The Company’s financial instruments consist of cash equivalents, short-term investments, accounts receivable, settlements receivable, accounts payable, accrued liabilities, and prior to the IPO, redeemable convertible preferred stock warrant liabilities. Cash equivalents are stated at amortized cost, which approximates fair value at the balance sheet dates, due to the short period of time to maturity. Short-term investments are carried at fair value. Accounts receivable, settlements receivable, accounts payable, and accrued liabilities are stated at their carrying value, which approximates fair value due to the short time to the expected receipt or payment date. The redeemable convertible preferred stock warrant liabilities were carried at fair value.
Foreign Currency
Recent Accounting Pronouncements
In December 2023, the Financial Accounting Standards Board (“FASB”) issued Accounting Standards Update No. 2023-09, “Income Taxes (Topic 740): Improvements to Income Tax Disclosures” (“ASU 2023-09”), which modifies the rules on income tax disclosures to require entities to disclose (1) specific categories in the rate reconciliation, (2) the income or loss from continuing operations before income tax expense or benefit (separated between domestic and foreign) and (3) income tax expense or benefit from continuing operations (separated by federal, state and foreign). ASU 2023-09 also requires entities to
80
Marqeta, Inc.
Notes to Consolidated Financial Statements
(Tabular Amounts in Thousands, Except Share and Per Share Amounts, Ratios, or as Noted)
disclose their income tax payments to international, federal, state and local jurisdictions, among other changes. The guidance is effective for annual periods beginning after December 15, 2024. Early adoption is permitted for annual financial statements that have not yet been issued or made available for issuance. ASU 2023-09 should be applied on a prospective basis, but retrospective application is permitted. The Company is currently evaluating the potential impact of adopting this new guidance on the consolidated financial statements and related disclosures.
3. Revenue
Disaggregation of Revenue
The following table provides information about disaggregated revenue from customers:
| Year Ended December 31, | |||||||||||||||||
| 2023 | 2022 | 2021 | |||||||||||||||
| Platform services revenue, net | $ | $ | $ | ||||||||||||||
| Other services revenue | |||||||||||||||||
| Total net revenue | $ | $ | $ | ||||||||||||||
Contract Balances
The following table provides information about contract assets and deferred revenue:
| Contract balance | Balance sheet line reference | December 31, 2023 | December 31, 2022 | |||||||||||||||||
| Contract assets - current | Prepaid expenses and other current assets | $ | $ | |||||||||||||||||
| Contract assets - non-current | Other assets | |||||||||||||||||||
| Total contract assets | $ | $ | ||||||||||||||||||
| Deferred revenue - current | Accrued expenses and other current liabilities | $ | $ | |||||||||||||||||
| Deferred revenue - non-current | Other liabilities | |||||||||||||||||||
| Total deferred revenue | $ | $ | ||||||||||||||||||
Net revenue recognized during the years ended December 31, 2023 and 2022 that was included in the deferred revenue balances at the beginning of the respective periods was $12.0 million and $13.8 million, respectively.
Remaining Performance Obligations
The Company has performance obligations associated with commitments in customer contracts for future stand-ready obligations to process transactions throughout the contractual term.
As of December 31, 2023 and 2022, the Company did not
4. Business Combination
On February 3, 2023, the Company acquired all outstanding stock of Power Finance Inc. (“Power Finance”) for a base cash purchase price of $221.9 million. The purchase price does not include a $53.1 million contingent consideration tied to performance-based goals which were expected to be achieved within 12 months from the date of acquisition. The Company determined the acquisition-date fair value of the contingent consideration liability, based on the likelihood of payment related to the contingent earn-out clauses, as part of the consideration transferred.
81
Marqeta, Inc.
Notes to Consolidated Financial Statements
(Tabular Amounts in Thousands, Except Share and Per Share Amounts, Ratios, or as Noted)
Power Finance’s cloud-based platform offers credit card program management services for companies creating new credit card programs. The acquisition of Power Finance will accelerate the Company’s credit product capabilities and allow the Company’s customers to launch a wide range of credit products and constructs.
The following table summarizes the components of the purchase consideration transferred (in thousands):
Base purchase price less contingent consideration | $ | ||||
Less: postcombination cash, non-cash expense and other purchase adjustments | |||||
| Plus: cash acquired on acquisition date | |||||
| Total purchase consideration, excluding contingent consideration | |||||
| Contingent consideration | |||||
| Purchase consideration | $ | ||||
Of the $117.6 million postcombination compensation excluded from purchase consideration, approximately $32.4 million was recognized as non-cash postcombination compensation cost at closing as a result of the vesting provisions of the employee replacement awards on the acquisition date. The remaining $85.1 million is subject to continuous employment and will be recognized as postcombination cash compensation cost over a weighted-average period of 2.2 years. Postcombination expense recognized was $36.4 million for the year ended December 31, 2023 and is included within Compensation and benefits in the Consolidated Statements of Operations and Comprehensive Loss.
The assets acquired and liabilities assumed were recorded at fair value as of the acquisition date. The final $163.6 million purchase consideration was attributed to $41.0 million of developed technology intangible assets (to be amortized over an estimated useful life of 7.0 years), $8.0 million of deferred tax liabilities, and $7.1 million of net assets acquired, with the $123.5 million excess of purchase consideration over the fair value of assets acquired and liabilities assumed recorded as goodwill. The fair value of the developed technology intangible assets was estimated using the multi-period excess earnings method (“MPEEM”), a form of the income approach. The principle behind this method is that the value of the intangible asset is equal to the present value of the after-tax cash flows attributable to the intangible asset. The Company applied judgment which involved the use of certain assumptions with respect of the revenue and EBITDA forecasts, obsolescence rate, and discount rate. The goodwill recognized was primarily attributable to the expected synergies from integrating Power Finance’s technology into the Company’s platform. Goodwill was not considered deductible for tax purposes.
The financial results of Power Finance are included in the Company’s Consolidated Financial Statements from the date of acquisition. Separate operating results and pro forma results of operations for Power Finance have not been presented as the effect of this acquisition was not material to the Company’s financial results. Acquisition-related third-party transaction costs were $3.3 million for the year ended December 31, 2023 and are included in Professional services in the Consolidated Statements of Operations and Comprehensive Loss.
82
Marqeta, Inc.
Notes to Consolidated Financial Statements
(Tabular Amounts in Thousands, Except Share and Per Share Amounts, Ratios, or as Noted)
5. Goodwill and Intangible Assets
Goodwill
Goodwill consisted of the following:
| Balance as of December 31, 2022 | $ | ||||
Goodwill from acquisition of Power Finance, Inc. | |||||
Measurement period adjustments | |||||
Balance as of December 31, 2023 | $ | ||||
Intangibles Assets, net
Intangible assets consisted of the following as of the dates presented:
| December 31, 2023 | December 31, 2022 | ||||||||||
Developed technology | $ | $ | |||||||||
Accumulated amortization | ( | ||||||||||
Intangibles, net | $ | $ | |||||||||
The amortization period for developed technology intangible assets is 7 years. Amortization expense for developed technology was $5.4 million for year ended December 31, 2023.
Expected future amortization expense for intangible assets was as follows as of December 31, 2023:
2024 | $ | ||||
2025 | |||||
2026 | |||||
2027 | |||||
2028 | |||||
| Thereafter | |||||
Total expected future amortization expense for intangible assets | $ | ||||
6. Short-term Investments
During 2023, the Company renamed the Marketable securities financial statement line item to Short-term investments in the Consolidated Balances Sheets to more accurately align with the Company’s current investment portfolio.
83
Marqeta, Inc.
Notes to Consolidated Financial Statements
(Tabular Amounts in Thousands, Except Share and Per Share Amounts, Ratios, or as Noted)
The amortized cost, unrealized gain (loss), and estimated fair value of the Company's short-term investments consisted of the following:
| December 31, 2023 | |||||||||||||||||||||||
| Amortized Cost | Unrealized Gain | Unrealized Loss | Estimated Fair Value | ||||||||||||||||||||
Short-term Investments | |||||||||||||||||||||||
| U.S. treasury securities | $ | $ | $ | ( | $ | ||||||||||||||||||
| U.S. agency securities | ( | ||||||||||||||||||||||
| Asset-backed securities | |||||||||||||||||||||||
| Corporate debt securities | ( | ||||||||||||||||||||||
| Total short-term investments | $ | $ | $ | ( | $ | ||||||||||||||||||
| December 31, 2022 | |||||||||||||||||||||||
| Amortized Cost | Unrealized Gain | Unrealized Loss | Estimated Fair Value | ||||||||||||||||||||
Short-term Investments | |||||||||||||||||||||||
| U.S. treasury securities | $ | $ | $ | ( | $ | ||||||||||||||||||
| U.S. agency securities | |||||||||||||||||||||||
| Commercial paper | |||||||||||||||||||||||
| Corporate debt securities | ( | ||||||||||||||||||||||
| Total short-term investments | $ | $ | $ | ( | $ | ||||||||||||||||||
The Company had four and thirteen separate short-term investments in unrealized loss positions as of December 31, 2023 and 2022, respectively. The Company does not intend to sell any short-term investments that have an unrealized losses at December 31, 2023, and it is not more likely than not that the Company will be required to sell such securities before any anticipated recovery of the entire amortized cost basis.
There were no
The following table summarizes the stated maturities of the Company’s short-term investments:
| December 31, 2023 | December 31, 2022 | ||||||||||||||||||||||
| Amortized Cost | Estimated Fair Value | Amortized Cost | Estimated Fair Value | ||||||||||||||||||||
| Due within one year | $ | $ | $ | $ | |||||||||||||||||||
Due after one year through five years | |||||||||||||||||||||||
| Total | $ | $ | $ | $ | |||||||||||||||||||
84
Marqeta, Inc.
Notes to Consolidated Financial Statements
(Tabular Amounts in Thousands, Except Share and Per Share Amounts, Ratios, or as Noted)
7. Fair Value Measurements
The following tables present the fair value hierarchy for assets and liabilities measured at fair value on a recurring basis:
| December 31, 2023 | |||||||||||||||||||||||
| Level 1 | Level 2 | Level 3 | Total Fair Value | ||||||||||||||||||||
| Cash equivalents | |||||||||||||||||||||||
| Money market funds | $ | $ | $ | $ | |||||||||||||||||||
| U.S. treasury bills | |||||||||||||||||||||||
Short-term investments | |||||||||||||||||||||||
| U.S. treasury securities | |||||||||||||||||||||||
| U.S. agency securities | |||||||||||||||||||||||
| Asset-backed securities | |||||||||||||||||||||||
| Corporate debt securities | |||||||||||||||||||||||
| Total assets | $ | $ | $ | $ | |||||||||||||||||||
| December 31, 2022 | |||||||||||||||||||||||
| Level 1 | Level 2 | Level 3 | Total Fair Value | ||||||||||||||||||||
| Cash equivalents | |||||||||||||||||||||||
| Money market funds | $ | $ | $ | $ | |||||||||||||||||||
Short-term investments | |||||||||||||||||||||||
| U.S. treasury securities | |||||||||||||||||||||||
| U.S. agency securities | |||||||||||||||||||||||
| Commercial paper | |||||||||||||||||||||||
| Corporate debt securities | |||||||||||||||||||||||
| Total assets | $ | $ | $ | $ | |||||||||||||||||||
The Company classifies money market funds, U.S. treasury bills, commercial paper, U.S. treasury securities, U.S. agency securities, asset-backed securities and corporate debt securities within Level 1 or Level 2 of the fair value hierarchy because the Company values these investments using quoted market prices or alternative pricing sources and models utilizing market observable inputs.
There were no transfers of financial instruments between the fair value hierarchy levels during the years ended December 31, 2023 and 2022.
85
Marqeta, Inc.
Notes to Consolidated Financial Statements
(Tabular Amounts in Thousands, Except Share and Per Share Amounts, Ratios, or as Noted)
8. Certain Balance Sheet Components
Prepaid Expenses and Other Current Assets
Prepaid expenses and other current assets consisted of the following:
| December 31, 2023 | December 31, 2022 | ||||||||||
| Prepaid expenses | $ | $ | |||||||||
| Inventory | |||||||||||
| Prepaid hosting and data costs | |||||||||||
| Accrued interest receivable | |||||||||||
| Prepaid insurance | |||||||||||
| Card program deposits | |||||||||||
| Contract assets | |||||||||||
| Other current assets | |||||||||||
| Prepaid expenses and other current assets | $ | $ | |||||||||
Property and Equipment, net
Property and equipment consisted of the following:
| December 31, 2023 | December 31, 2022 | ||||||||||
| Leasehold improvements | $ | ||||||||||
| Computer equipment | |||||||||||
| Furniture and fixtures | |||||||||||
| Internally developed and purchased software | |||||||||||
| Accumulated depreciation and amortization | ( | ( | |||||||||
| Property and equipment, net | $ | $ | |||||||||
Depreciation and amortization expense related to property and equipment was $10.7 million, $3.9 million and $3.5 million for the years ended December 31, 2023, 2022 and 2021, respectively.
The Company capitalized $16.4 million as internal-use software development costs during the year ended December 31, 2023. Internal-use software development costs during the year ended December 31, 2022 were no t material.
Other Assets
Other assets consisted of the following:
| December 31, 2023 | December 31, 2022 | ||||||||||
| Contract assets, noncurrent | $ | $ | |||||||||
| Deferred tax assets | |||||||||||
| Other noncurrent assets | |||||||||||
| Other assets | $ | $ | |||||||||
86
Marqeta, Inc.
Notes to Consolidated Financial Statements
(Tabular Amounts in Thousands, Except Share and Per Share Amounts, Ratios, or as Noted)
Accrued Expenses and Other Current Liabilities
Accrued expenses and other current liabilities consisted of the following:
| December 31, 2023 | December 31, 2022 | ||||||||||
| Accrued costs of revenue | $ | $ | |||||||||
| Accrued compensation and benefits | |||||||||||
| Deferred revenue | |||||||||||
Due to Issuing Banks | |||||||||||
| Accrued tax liabilities | |||||||||||
| Accrued professional services | |||||||||||
| Reserve for contract contingencies and processing errors | |||||||||||
| Other accrued liabilities | |||||||||||
| Accrued expenses and other current liabilities | $ | $ | |||||||||
Other Liabilities
Other liabilities consisted of the following:
| December 31, 2023 | December 31, 2022 | ||||||||||
| Deferred revenue, net of current portion | $ | $ | |||||||||
| Other long-term liabilities | |||||||||||
| Other liabilities | $ | $ | |||||||||
9. Leases
In 2016, the Company entered into a lease agreement for its corporate headquarters in Oakland, California for 19,000 square feet of office space, which was subsequently amended resulting in a total of 63,000 square feet of office space being leased. The non-cancellable operating lease expires in February 2026 and includes options to extend the lease term, generally at the then-market rates. The Company excludes extension options that are not reasonably certain to be exercised from its lease terms. The Company’s lease payments consist primarily of fixed rental payments for the right to use the underlying leased assets over the lease terms. The Company is responsible for operating expenses that exceed the amount of base operating expenses as defined in the original lease agreement.
The Company's operating lease costs are as follows:
| Year Ended December 31, | |||||||||||||||||
| 2023 | 2022 | 2021 | |||||||||||||||
| Operating lease cost | $ | $ | $ | ||||||||||||||
| Variable lease cost | |||||||||||||||||
| Short-term lease cost | |||||||||||||||||
| Total lease cost | $ | $ | $ | ||||||||||||||
The Company does not have any sublease income and the Company’s lease agreements do not contain any residual value guarantees or material restrictive covenants.
87
Marqeta, Inc.
Notes to Consolidated Financial Statements
(Tabular Amounts in Thousands, Except Share and Per Share Amounts, Ratios, or as Noted)
The weighted average remaining operating lease term and the weighted average discount rate used in the calculation of the Company's lease assets and lease liabilities were as follows:
| December 31, 2023 | December 31, 2022 | ||||||||||
| Weighted average remaining operating lease term (in years) | |||||||||||
| Weighted average discount rate | |||||||||||
Maturities of operating lease liabilities by year are as follows as of December 31, 2023:
| 2024 | ||||||||
| 2025 | ||||||||
| 2026 | ||||||||
| Total lease payments | $ | |||||||
| Less imputed interest | ( | |||||||
| $ | ||||||||
10. Commitments and Contingencies
Letters of Credit
In connection with the lease for its corporate headquarters office space, the Company is required to provide the landlord a letter of credit in the amount of $1.5 million. The Company has secured this letter of credit by depositing $1.5 million with the issuing financial institution, which deposit is classified as Restricted cash in the Consolidated Balance Sheets.
Purchase Obligations
As of December 31, 2023, the Company had non-cancellable purchase commitments with certain service providers and Issuing Banks of $187.4 million, payable over the next 3 years. These purchase obligations include $174.6 million related to minimum commitments as part of a cloud-computing service agreement. The remaining obligations are related to various service providers and Issuing Banks processing fees over the fixed, non-cancellable respective contract terms.
Defined Contribution Plans
During the years ended December 31, 2023, 2022 and 2021, the Company contributed a total of $5.5 million, $5.8 million and $3.1 million to its defined contribution plans, respectively.
Legal Contingencies
From time to time in the normal course of business, the Company may be subject to various legal matters such as threatened or pending claims or proceedings. As of December 31, 2023 and 2022, there were no legal contingency matters, either individually or in aggregate, that would have a material adverse effect on the Company’s financial position, results of operations, or cash flows. Given the unpredictable nature of legal proceedings, the Company bases its assessment on the information available at the time. As additional information becomes available, the Company reassesses the potential liability and may revise the estimate.
Settlement of Payment Transactions
Generally, customers deposit a certain amount of pre-funding into accounts maintained at Issuing Banks to settle their payment transactions. Such pre-funding amounts may only be used to settle customers’ payment transactions and are not considered assets of the Company. As such, the funds held in customers’ accounts at Issuing Banks are not reflected on the Company’s Consolidated Balance Sheets. If a customer does not have sufficient funds to settle a transaction, the Company is liable to the Issuing Bank to settle the transaction and would therefore incur losses if such amounts cannot be subsequently recovered from the customer. At December 31, 2023, we had $7.0 million in Restricted cash which included a deposit held at an Issuing Bank to provide the Issuing Bank collateral in the event that our
88
Marqeta, Inc.
Notes to Consolidated Financial Statements
(Tabular Amounts in Thousands, Except Share and Per Share Amounts, Ratios, or as Noted)
customers' funds are not deposited at the Issuing Bank in time to settle our customers' transactions with the Card Networks.
Indemnifications
In the ordinary course of business, the Company enters into agreements of varying scope and terms pursuant to which it agrees to indemnify customers, Card Networks, Issuing Banks, vendors, lessors, and other parties with respect to certain matters, including, but not limited to, losses arising out of the breach of such agreements, services to be provided by the Company or from intellectual property infringement claims made by third parties. With respect to Issuing Banks, the Company has received requests for indemnification from time to time and may indemnify the Issuing Bank for losses the Issuing Bank may incur for non-compliance with applicable law and regulation, if those losses resulted from the Company’s failure to perform under its program agreement with the Issuing Bank.
In addition, the Company has entered into indemnification agreements with its directors and certain officers and employees that will require the Company, among other things, to indemnify them against certain liabilities that may arise by reason of their status or service as directors, officers or employees. No demands have been made upon the Company to provide indemnification under such agreements and there are no claims that the Company is aware of that could have a material effect on its Consolidated Balance Sheets, Consolidated Statements of Operations and Comprehensive Loss, or Consolidated Statements of Cash Flows.
The Company also includes service level commitments to its customers warranting certain levels of performance and permitting those customers to receive credits in the event the Company fails to meet those levels.
11. Stock Incentive Plans
The Company has granted share-based awards to employees, non-employee directors, and other service providers of the Company under the Amended and Restated 2011 Equity Incentive Plan (“2011 Plan”) and the 2021 Stock Option and Incentive Plan (“2021 Plan” and, together with the 2011 Plan, the “Plans”). The 2011 Plan was terminated in June 2021 in connection with the IPO but continues to govern the terms of outstanding awards that were granted prior to the IPO. Additionally, the Company offers an ESPP, which allows employees to purchase shares of common stock at 85 % of the fair value of the Company’s Class A common stock on the first or last day of the offering period, whichever is lower. The offering periods are six months long and start in May and November of each year.
The following table presents the share-based compensation expense recognized within the following line items in the Consolidated Statement of Operations and Comprehensive Loss and Consolidated Balance Sheet in the periods presented:
| Year Ended December 31, | |||||||||||||||||
| 2023 | 2022 | 2021 | |||||||||||||||
| Restricted stock units | $ | $ | $ | ||||||||||||||
| Stock options | |||||||||||||||||
| Executive Chairman Long-Term Performance Award | |||||||||||||||||
| Employee Stock Purchase Plan | |||||||||||||||||
| Secondary sales of common stock | |||||||||||||||||
Share-based compensation recorded within Compensation and benefits | |||||||||||||||||
Property and equipment (capitalized internal-use software) | |||||||||||||||||
Total share-based compensation expense | $ | $ | $ | ||||||||||||||
89
Marqeta, Inc.
Notes to Consolidated Financial Statements
(Tabular Amounts in Thousands, Except Share and Per Share Amounts, Ratios, or as Noted)
Restricted Stock Units
Restricted Stock Units
RSUs granted prior to April 1, 2021 vest upon the satisfaction of both a service condition and a liquidity condition. The service condition for these awards is satisfied over four years . On June 8, 2021, the Company completed its IPO and the liquidity condition for these awards was satisfied and the Company recognized a cumulative share-based compensation expense of $23.1 million associated with RSUs that had service-vested as of the IPO completion date. Subsequent to the IPO, the unamortized grant date fair value of these RSUs will be recorded as share-based compensation expense over the remaining service period.
RSUs granted on or after April 1, 2021, vest upon the satisfaction of a service condition. In general, the service condition for these awards is satisfied over or four years .
The fair value of RSUs is based on the closing price of the Company’s Class A common stock on the grant date. Prior to the IPO, the fair value of RSUs was based on the fair value of the underlying common stock on the grant date as determined by the Company’s board of directors at each meeting in which RSU awards were approved.
A summary of the Company's RSUs activity under the Plans was as follows:
| Number of Restricted Stock Units | Weighted-average grant date fair value per share | ||||||||||
Balance as of December 31, 2021 | $ | ||||||||||
| Granted | |||||||||||
| Vested | ( | ||||||||||
| Canceled and forfeited | ( | ||||||||||
Balance as of December 31, 2022 | $ | ||||||||||
| Granted | |||||||||||
| Vested | ( | ||||||||||
| Canceled and forfeited | ( | ||||||||||
Balance as of December 31, 2023 | $ | ||||||||||
As of December 31, 2023, unrecognized compensation costs related to unvested RSUs was $231.4 million. These costs are expected to be recognized over a weighted-average period of 2.5 years.
Stock Options
Under the Plans, the exercise price of a stock option shall not be less than the fair market value per share of the Company’s common stock on the date of grant (and not less than 110 10 % of the total combined voting power of all classes of stock of the Company, or a 10 % stockholder). Options are exercisable over periods not to exceed ten years from the date of grant (five years for incentive stock options granted to 10 % stockholders).
90
Marqeta, Inc.
Notes to Consolidated Financial Statements
(Tabular Amounts in Thousands, Except Share and Per Share Amounts, Ratios, or as Noted)
A summary of the Company's stock option activity under the Plans is as follows:
| Number of Options | Weighted-Average Exercise Price per Share | Weighted-Average Remaining Contractual Life (Years) | Aggregate Intrinsic Value(1) | ||||||||||||||||||||
Balance as of January 1, 2021 | $ | $ | |||||||||||||||||||||
| Granted | |||||||||||||||||||||||
| Exercised | ( | ||||||||||||||||||||||
| Canceled and forfeited | ( | ||||||||||||||||||||||
Balance as of December 31, 2021 | $ | $ | |||||||||||||||||||||
| Granted | |||||||||||||||||||||||
| Exercised | ( | ||||||||||||||||||||||
| Canceled and forfeited | ( | ||||||||||||||||||||||
Balance as of December 31, 2022 | $ | $ | |||||||||||||||||||||
| Granted | |||||||||||||||||||||||
| Exercised | ( | ||||||||||||||||||||||
| Canceled and forfeited | ( | ||||||||||||||||||||||
Balance as of December 31, 2023 | $ | $ | |||||||||||||||||||||
Exercisable as of December 31, 2023(2) | $ | $ | |||||||||||||||||||||
Vested as of December 31, 2023 | $ | $ | |||||||||||||||||||||
(1) Intrinsic value is calculated based on the difference between the exercise price of in-the-money-stock options and the fair value of the common stock as of the respective balance sheet dates.
(2) The 2011 Plan allows for early exercise of stock options. Accordingly, options granted under this plan are included as exercisable stock options regardless of vesting status.
The weighted-average grant date fair value of options granted during the years ended December 31, 2023, 2022, and 2021, was $3.52 , $5.89 , and $12.10 , per share, respectively.
The total intrinsic value of options exercised during the years ended December 31, 2023, 2022, and 2021, was $12.2 million, $61.6 million, and $83.0 million, respectively.
The total grant-date fair value of options vested during the years ended December 31, 2023, 2022, and 2021, was $61.8 million, $40.0 million, and $17.6 million, respectively.
As of December 31, 2023, aggregate unrecognized compensation costs related to unvested outstanding stock options, excluding the Executive Chairman Long-Term Performance Award, was $43.3 million. These costs are expected to be recognized over a weighted-average period of 2.1 years.
The fair values of stock options granted were estimated using the Black-Scholes option pricing model and the following weighted-average assumptions:
| Year Ended December 31, | |||||||||||||||||
| 2023 | 2022 | 2021 | |||||||||||||||
| Dividend yield | |||||||||||||||||
| Expected volatility | |||||||||||||||||
| Expected term (in years) | |||||||||||||||||
| Risk-free interest rate | |||||||||||||||||
91
Marqeta, Inc.
Notes to Consolidated Financial Statements
(Tabular Amounts in Thousands, Except Share and Per Share Amounts, Ratios, or as Noted)
Executive Chairman Long-Term Performance Award
In April and May 2021, the Company’s board of directors granted the Company’s Executive Chairman and then-Chief Executive Officer equity incentive awards in the form of performance-based stock options covering 19,740,923 and 47,267 shares of the Company’s Class B common stock with an exercise price of $21.49 and $23.40 per share, respectively, (collectively, the “Executive Chairman Long-Term Performance Award,” formerly known as the CEO Long-Term Performance Award). The Executive Chairman Long-Term Performance Award vests upon the satisfaction of a service condition and the achievement of certain stock price hurdles over a seven year performance period following the expiration of the lock-up period associated with the Company’s IPO in 2021. The stock price hurdle will be achieved if the average closing price of a share of the Company’s Class A common stock during any 90 consecutive trading day period during the performance period equals or exceeds the Company stock price hurdle set forth in the table below.
The Executive Chairman Long-Term Performance Award is divided into seven equal tranches which vest upon the achievement of the following Company stock price hurdles:
| Tranche | Company Stock Price Hurdle | Number of Options Eligible to Vest | ||||||||||||
| 1 | $ | |||||||||||||
| 2 | $ | |||||||||||||
| 3 | $ | |||||||||||||
| 4 | $ | |||||||||||||
| 5 | $ | |||||||||||||
| 6 | $ | |||||||||||||
| 7 | $ | |||||||||||||
| Total | ||||||||||||||
The weighted-average grant date fair value of the seven tranches of the Executive Chairman Long-Term Performance Award was estimated to be $10.53 per option share.
As of December 31, 2023, the aggregate unrecognized compensation cost of the Executive Chairman Long-Term Performance Award was $63.8 million, which is expected to be recognized over the remaining derived service period of 2.1 years.
Secondary Sales of Common Stock
Prior to the completion of the IPO, certain economic interest holders acquired outstanding common stock from current or former employees for a purchase price greater than the Company's estimated fair value at the time of the transactions. During 2021, the Company recorded share-based compensation expense for the difference between the price paid and the estimated fair value on the date of the transaction of $11.6 million.
12. Stockholders’ Equity Transactions
Warrants to Purchase Common Stock
In 2021 and 2020, the Company issued warrants to customers to purchase up to 1,150,000 and 750,000 shares of the Company’s common stock, respectively. These warrants vest based on certain performance conditions that include issuing a specific percentage of new cards on the Company’s platform over a defined measurement period and reaching certain annual transaction count thresholds over the contract term, respectively. All warrants have an exercise price of $0.01
92
Marqeta, Inc.
Notes to Consolidated Financial Statements
(Tabular Amounts in Thousands, Except Share and Per Share Amounts, Ratios, or as Noted)
As of December 31, 2023 and 2022, 1,101,262 and 695,637 warrants were vested, respectively. The Company recorded $5.5 million and $7.3 million as a reduction of net revenue related to these warrants during the years ended December 31, 2023 and 2022, respectively. Upon vesting, the fair value of the vested warrants are recorded into the Company’s additional paid-in capital. Timing differences caused by the pattern of processing volume generated by the customer over the term of the contract and the vesting schedules of the warrants can cause differences in the amount of grant date fair value that is credited to additional paid in capital upon vesting and the amount recorded as a reduction in net revenue during any particular reporting period.
Share Repurchase Programs
On September 14, 2022, the Company’s Board of Directors authorized a share repurchase program of up to $100 million of the Company’s Class A common stock beginning September 15, 2022 (“2022 Share Repurchase Program”). Under the repurchase program, the Company was authorized to repurchase shares through open market purchases, in privately negotiated transactions or by other means, in accordance with applicable federal securities laws, including through trading plans under Rule 10b5-1 of the Securities and Exchange Act of 1934, as amended (the “Exchange Act”). The number of shares repurchased and the timing of purchases are based on general business and market conditions, and other factors, including legal requirements. The 2022 Share Repurchase Program has no set expiration date; however, repurchases under the program were complete as of March 31, 2023.
During the year ended December 31, 2023, the Company repurchased and subsequently retired 3.2 million shares for $21.0 million under the 2022 Share Repurchase Program, for an average price of $6.46 . During the year ended December 31, 2022, the Company repurchased and subsequently retired 11.7 million shares for $79.2 million under the 2022 Share Repurchase Program, for an average price of $6.77 .
On May 8, 2023, the Company’s board of directors authorized a share repurchase program of up to $200 million of the Company’s Class A common stock (“2023 Share Repurchase Program”). Under the 2023 Share Repurchase Program, the Company is authorized to repurchase shares through open market purchases, in privately negotiated transactions or by other means, in accordance with applicable federal securities laws, including through trading plans under Rule 10b5-1 of the Exchange Act. The number of shares repurchased and the timing of purchases are based on general business and market conditions, and other factors, including legal requirements. The 2023 Share Repurchase Program has no set expiration date.
During the year ended December 31, 2023, the Company repurchased and subsequently retired 31.3 million shares for $169.4 million under the 2023 Share Repurchase Program, for an average price of $5.41 . As of December 31, 2023, $32.2 million remained available for future share repurchases under the 2023 Share Repurchase Program.
13. Restructuring
During the second quarter of 2023, the Company approved a restructuring plan (the “Restructuring Plan”) intended to reduce operating expenses and improve profitability by reducing the Company’s workforce. The net restructuring charges incurred in connection with the Restructuring Plan was approximately $8.7 million, which was completed as of December 31, 2023.
The Company recorded $8.7 million in restructuring charges during the year ended December 31, 2023, which consisted of $14.6 million primarily related to one-time severance and benefit payments, as well as a net reduction of stock-based compensation of $2.9 million related to the vesting of certain equity awards and the forfeiture of certain equity awards which are accounted for as occurred. Additionally, the Company reduced previously accrued bonuses for impacted employees of $2.9 million due to the terms of the Restructuring Plan. These costs were included in Compensation and benefits in the Consolidated Statements of Operations and Comprehensive Loss.
93
Marqeta, Inc.
Notes to Consolidated Financial Statements
(Tabular Amounts in Thousands, Except Share and Per Share Amounts, Ratios, or as Noted)
The following table summarizes the Company’s restructuring liability that was included in Accrued expenses and other current liabilities on the Consolidated Balance Sheet:
| Balance as of December 31, 2022 | $ | ||||
| Restructuring charges | |||||
| Cash payments | ( | ||||
Balance as of December 31, 2023 | $ | ||||
14. Net Loss Per Share Attributable to Common Stockholders
Basic and diluted net loss per share attributable to common stockholders is as follows:
| Year Ended December 31, | |||||||||||||||||
| 2023 | 2022 | 2021 | |||||||||||||||
| Numerator | |||||||||||||||||
| Net loss attributable to Class A and Class B common stockholders | $ | ( | $ | ( | $ | ( | |||||||||||
| Denominator | |||||||||||||||||
| Weighted-average shares used in computing net loss per share attributable to Class A and Class B common stockholders, basic and diluted | |||||||||||||||||
| Net loss per share attributable to Class A and Class B common stockholders, basic and diluted | $ | ( | $ | ( | $ | ( | |||||||||||
Basic net loss per share is the same as diluted net loss per share because the Company reported a net loss for the years ended December 31, 2023, 2022 and 2021 respectively.
The rights, including the liquidation and dividend rights, of the holders of Class A common stock and Class B common stock are identical, except with respect to voting. As the liquidation and dividend rights are identical for Class A common stock and Class B common stock, the undistributed earnings are allocated on a proportionate basis and the resulting loss per share will, therefore, be the same for both Class A common stock and Class B common stock on an individual or combined basis.
Potentially dilutive securities that were excluded from the computation of diluted net loss per share because including them would have had an anti-dilutive effect were as follows:
| As of December 31, | |||||||||||||||||
| 2023 | 2022 | 2021 | |||||||||||||||
| Warrants to purchase Class B common stock | |||||||||||||||||
| Stock options outstanding, including early exercise of options | |||||||||||||||||
| Unvested RSUs outstanding | |||||||||||||||||
| Shares committed under the ESPP | |||||||||||||||||
| Stock options and RSUs available for future grants | |||||||||||||||||
| Total | |||||||||||||||||
94
Marqeta, Inc.
Notes to Consolidated Financial Statements
(Tabular Amounts in Thousands, Except Share and Per Share Amounts, Ratios, or as Noted)
15. Income Tax
The components of loss before income taxes by tax jurisdiction were as follows:
| Year Ended December 31, | |||||||||||||||||
| 2023 | 2022 | 2021 | |||||||||||||||
| United States | $ | ( | $ | ( | $ | ( | |||||||||||
| Foreign | |||||||||||||||||
| Loss before income tax expense | $ | ( | $ | ( | $ | ( | |||||||||||
The components of income tax expense (benefit) were as follows:
| Year Ended December 31, | |||||||||||||||||
| 2023 | 2022 | 2021 | |||||||||||||||
| Current: | |||||||||||||||||
| Federal | $ | $ | $ | ||||||||||||||
| State | |||||||||||||||||
| Foreign | ( | ||||||||||||||||
| ( | |||||||||||||||||
| Deferred: | |||||||||||||||||
| Federal | ( | ||||||||||||||||
| State | ( | ||||||||||||||||
| Foreign | ( | ( | |||||||||||||||
| ( | ( | ( | |||||||||||||||
| Total: | |||||||||||||||||
| Federal | ( | ||||||||||||||||
| State | ( | ||||||||||||||||
| Foreign | ( | ( | |||||||||||||||
| Income tax benefit | $ | ( | $ | ( | $ | ( | |||||||||||
The reconciliation of the Company's effective tax rate to the statutory federal rate is as follows:
| Year Ended December 31, | |||||||||||||||||
| 2023 | 2022 | 2021 | |||||||||||||||
| Taxes at federal statutory rate | % | % | % | ||||||||||||||
| State taxes, net of federal effect | % | % | % | ||||||||||||||
| Share-based compensation | ( | % | % | % | |||||||||||||
Executive compensation | ( | % | ( | % | ( | % | |||||||||||
Research and development credits | % | % | % | ||||||||||||||
Change in uncertain tax positions | ( | % | % | % | |||||||||||||
Mergers and acquisitions | % | % | % | ||||||||||||||
Nondeductible compensation | ( | % | % | % | |||||||||||||
| Other | ( | % | % | ( | % | ||||||||||||
| Change in valuation allowance | ( | % | ( | % | ( | % | |||||||||||
| Effective tax rate | % | % | % | ||||||||||||||
95
Marqeta, Inc.
Notes to Consolidated Financial Statements
(Tabular Amounts in Thousands, Except Share and Per Share Amounts, Ratios, or as Noted)
Deferred tax assets and liabilities consist of the following:
| December 31 | |||||||||||
| 2023 | 2022 | ||||||||||
| Deferred tax assets: | |||||||||||
| Federal and state net operating losses | $ | $ | |||||||||
| Research and development credits | |||||||||||
| Property and equipment | |||||||||||
| Accruals and other | |||||||||||
| Share-based compensation | |||||||||||
Research and development capitalization expenditures | |||||||||||
Reserve for contract contingencies and processing errors | |||||||||||
| Deferred revenue | |||||||||||
| Lease liability | |||||||||||
| Total deferred tax assets | |||||||||||
| Less valuation allowance | ( | ( | |||||||||
| Total deferred tax assets, net of valuation allowance | |||||||||||
| Deferred tax liabilities: | |||||||||||
Intangibles | ( | ||||||||||
| Right-of-use asset | ( | ( | |||||||||
| Total deferred tax liabilities | ( | ( | |||||||||
| Net deferred tax assets | $ | $ | |||||||||
In accordance with ASC 740 and based on all available evidence on a jurisdictional basis, the Company believes that it is more likely than not that its U.S. deferred tax assets will not be utilized and has recorded a full valuation allowance against its net deferred tax assets in the U.S. jurisdiction. The Company assesses on a periodic basis the likelihood that it will be able to recover its deferred tax assets. The Company considers all available evidence, both positive and negative, including historical levels of income or losses and expectations and risks associated with estimates of future taxable income in assessing the need for the valuation allowance. If it is not more likely than not that the Company expects to recover its deferred tax assets, the Company will increase its provision for taxes by recording a valuation allowance against the deferred tax assets that it estimates will not ultimately be recoverable. The available negative evidence at December 31, 2023 and 2022 included historical and projected future operating losses. As a result, the Company concluded that an additional valuation allowance of $29.3 million and $30.0 million was required to reflect the change in its deferred tax assets prior to valuation allowance during 2023 and 2022, respectively. As of December 31, 2023 and 2022, the Company considered it more likely than not that substantially all of its deferred tax assets would not be realized.
The Tax Cuts and Jobs Act of 2017 (TCJA) requires research and development (R&D) expenditures incurred under Section 174 for tax years beginning after December 31, 2021, to be capitalized and amortized ratably over 5 years for domestic research and 15 years for international research. The mandatory capitalization requirement had no material impact to the Company’s 2023 income tax provision due to the Company’s tax attributes carryover and full valuation allowance position.
As of December 31, 2023, the Company had net operating loss carryforwards of approximately $194.8 million and $153.1 million for federal and state tax purposes, respectively. Of the Company's federal net operating loss carryforwards as of December 31, 2023, $158.7 million can be carried forward indefinitely but is limited to 80% of taxable income. If not utilized, the federal and state net operating carryforwards will begin to expire in 2033 and 2025, respectively.
96
Marqeta, Inc.
Notes to Consolidated Financial Statements
(Tabular Amounts in Thousands, Except Share and Per Share Amounts, Ratios, or as Noted)
In addition, the Company had research and development tax credit carryforwards of approximately $27.9 million for federal income tax purposes and $11.3 million for California tax purposes. If not utilized, the federal research and development tax credit carryforwards will begin to expire in 2031. The California state research credit can be carried forward indefinitely.
Under Section 382 of the Internal Revenue Code of 1986, as amended, the Company's ability to utilize net operating loss carryforwards or other tax attributes in any taxable year may be limited if the Company has experienced an ownership change. As of December 31, 2023, the Company has concluded that it has experienced ownership changes since inception and that its utilization of net operating loss carryforwards and other tax attributes will be subject to annual limitations.
The Company files federal, state, and foreign income tax returns in jurisdictions with varying statutes of limitations. To the extent the Company has tax attributes carryforwards, the tax years in which the attribute was generated may still be adjusted upon examination by the federal, state, or foreign tax authorities to the extent utilized in a future period.
The Company made an accounting policy election to provide for the Global Intangible Low-Taxed Income (GILTI) tax expense in the year the tax is incurred as a period cost. The Company elected and applied the tax law ordering approach when considering GILTI as part of its valuation allowance.
The Company recognizes tax benefits from uncertain tax positions only if the Company believes that it is more likely than not that the tax position will be sustained on examination by the taxing authorities based on the technical merits of the position. The Company makes adjustments to the reserves in accordance with the income tax accounting guidance when facts and circumstances change, such as the closing of a tax audit or the refinement of an estimate.
A reconciliation of the total amounts of unrecognized tax benefits was as follows:
| Year Ended December 31, | |||||||||||||||||
| 2023 | 2022 | 2021 | |||||||||||||||
Beginning balance | $ | $ | $ | ||||||||||||||
Reductions of tax positions taken during previous years | |||||||||||||||||
Additions based on uncertain tax positions related to the current period | |||||||||||||||||
Additions based on uncertain tax positions related to the prior periods | |||||||||||||||||
Ending balance | $ | $ | $ | ||||||||||||||
The Company’s policy is to include interest and penalties related to unrecognized tax benefits within our tax provision for income taxes. The Company did no t accrue any interest or penalties during the year ended December 31, 2023. The Company had $9.8 million of gross unrecognized tax benefits as of December 31, 2023, which would not affect its effective tax rate if recognized due to the Company’s valuation allowance. The Company expects no significant increases or decreases to its unrecognized benefits within the next twelve months.
16. Concentration Risks and Significant Customers
Financial instruments that potentially expose the Company to concentration of credit risk consist of cash and cash equivalents, short-term investments, and accounts receivable. Cash on deposit with financial institutions may exceed federally insured limits. Cash and cash equivalents as of December 31, 2023 and December 31, 2022 included $628.0 million and $462.5 million, respectively, of investments managed by two financial institutions, which invest primarily in securities issued by the U.S. Government or U.S. Government agencies.
97
Marqeta, Inc.
Notes to Consolidated Financial Statements
(Tabular Amounts in Thousands, Except Share and Per Share Amounts, Ratios, or as Noted)
As of December 31, 2023, short-term investments were $268.7 million, and there was no concentration of securities of the same issuer with an aggregate fair value greater than 5% of this total balance, except for U.S. Treasuries and U.S. agency securities, which amounted to $255.2 million, or 95 % of the short-term investments. As of December 31, 2023, all debt securities within the Company's portfolio are investment grade.
As of December 31, 2022, short-term investments were $440.9 million, and there was no concentration of securities of the same issuer with an aggregate fair value greater than 5% of the total balance, except for U.S. Treasuries, which amounted to $407.1 million, or 92 % of the short-term investments. As of December 31, 2022, all debt securities within the Company's portfolio are investment grade.
A significant portion of the Company's payment transactions is settled through one Issuing Bank, Sutton Bank. For the years ended December 31, 2023, 2022 and 2021, 76 %, 82 % and 90 % of Total Processing Volume was settled through Sutton Bank, respectively.
A significant portion of the Company's revenue and accounts receivable is derived from a single customer. For each significant customer, net revenue as a percentage of total net revenue and customers' receivables as a percentage of total customers' receivables are as follows:
| Percent of Net Revenue for the Year Ended December 31, | |||||||||||||||||
| 2023 | 2022 | 2021 | |||||||||||||||
| Customer A | |||||||||||||||||
| Percent of Customers' Receivables as of December 31, | |||||||||||
| 2023 | 2022 | ||||||||||
| Customer B | |||||||||||
17. Related Party Transactions
The Company may enter into transactions with related parties.
The Company had an equity method investment in a private company, which was a related party up until the investment was sold in October 2022. During the years ended December 31, 2022 and 2021, the Company earned net revenue of $2.7 million and $2.8 million from the private company, respectively.
Prior to the completion of the IPO, DFS Services LLC, a holder of more than 5 % of the Company's outstanding capital stock, was a related party. During the year ended December 31, 2021, the Company incurred $30.4 million in Card Network fees, net, recorded within Costs of revenue in the Consolidated Statements of Operations and Comprehensive Loss, to PULSE Network LLC, an entity affiliated with DFS Services LLC.
98
Item 9. Changes in and Disagreements With Accountants on Accounting and Financial Disclosures
None.
Item 9A. Controls and Procedures
Evaluation of Disclosure Controls and Procedures
Our management, with the participation of our Chief Executive Officer and our Chief Financial Officer, have evaluated the effectiveness of our disclosure controls and procedures as defined in Rules 13a-15(e) and 15d-15(e) under the Exchange Act as of the end of the period covered by this Annual Report on Form 10-K. Disclosure controls and procedures are designed to provide reasonable assurance that information required to be disclosed by a company in the reports that it files or submits under the Exchange Act is recorded, processed, summarized and reported, within the time periods specified in the SEC’s rules and forms. Disclosure controls and procedures include, without limitation, controls and procedures designed to ensure that information required to be disclosed by a company in the reports that it files or submits under the Exchange Act is accumulated and communicated to the company’s management, including its principal executive and principal financial officers, or persons performing similar functions, as appropriate to allow timely decisions regarding required disclosure. Management recognizes that any controls and procedures, no matter how well designed and operated, can provide only reasonable assurance of achieving their objectives, and management necessarily applies its judgment in evaluating the cost-benefit relationship of possible controls and procedures.
Based on such evaluation, our management has concluded our disclosure controls and procedures were not effective at a reasonable assurance level as of December 31, 2023, due to the material weaknesses in internal control over financial reporting described in Management’s Report on Internal Control Over Financial Reporting below.
Management's Report on Internal Control Over Financial Reporting
Our management is responsible for establishing and maintaining adequate internal control over financial reporting (as defined in Rule 13a-15(f) under the Exchange Act). Under the supervision of and with the participation of our principal executive officer and principal financial officer, our management conducted an assessment of the effectiveness of our internal control over financial reporting based on the criteria established in “Internal Control - Integrated Framework” (2013) issued by the Committee of Sponsoring Organizations of the Treadway Commission (COSO). Based on that assessment, our management has concluded that our internal control over financial reporting as of December 31, 2023 was not effective due to the material weaknesses identified below. The effectiveness of our internal control over financial reporting as of December 31, 2023 has been audited by Ernst & Young, LLP, an independent registered public accounting firm, as stated in their report which is included in Item 8 of this Annual Report on Form 10-K.
A material weakness is a deficiency, or a combination of deficiencies, in internal control over financial reporting, such that there is a reasonable possibility that a material misstatement of the Company’s annual or interim financial statements will not be prevented or detected on a timely basis.
In the period ended March 31, 2023, management identified a material weakness related to the accounting for our acquisition of Power Finance (the “Business Combination Material Weakness”), including a lack of sufficient precision in the performance of reviews supporting the purchase price allocation accounting, and a lack of timely oversight over third-party specialists and the reports they produced to support the accounting for the Power Finance acquisition. The material weakness resulted in an error related to the allocation of merger consideration between purchase consideration and post-combination expense that was not detected on a timely basis. The error was corrected by management in the Condensed Consolidated Financial Statements as of and for the three months ended March 31, 2023.
For the period ended December 31, 2023, management identified a material weakness related to information technology general controls (“ITGCs”) (the “ITGC Material Weakness” and together with the Business Combination Material Weakness, the “2023 Material Weaknesses”) in user access over certain information technology (“IT”) systems that support the Company’s revenue and related financial reporting processes. As a result, the related process-level IT dependent manual controls, certain change management controls, and automated application controls for certain key IT systems were also deemed ineffective for the period ended December 31, 2023.
99
The 2023 Material Weaknesses did not result in any material misstatements in our Consolidated Financial Statements included in this Annual Report on Form 10-K. Our management concluded that the Consolidated Financial Statements included in this Annual Report on Form 10-K, present fairly, in all material respects, our financial position, results of operations, and cash flows for the periods presented in accordance with accounting principles generally accepted in the United States.
Management’s Plan to Remediate the Material Weaknesses
Our management is committed to maintaining a strong internal control environment. As it relates to the Business Combination Material Weakness, we have and will continue to take actions to enhance the design of our business combination controls with the level of precision required to operate them in an effective manner. We will continue to enhance our management review control activities, including the review of inputs, assumptions and reports produced by third-party specialists supporting the purchase price allocation accounting and the application of technical accounting principles.
To remediate the ITGC Material Weakness, we are enhancing the design of our ITGCs over the IT systems that support the Company’s revenue and related financial reporting processes, including, (i) developing and implementing additional training and awareness addressing ITGCs and policies, including educating control owners concerning the principles and requirements of each control, with a focus on user access; (ii) increasing the extent of oversight and verification checks included in operation of user access controls and processes; (iii) deploying additional tools to support administration of user access; and (iv) enhancing quarterly management reporting on the remediation measures to the audit committee of the board of directors. Although we intend to complete the remediation process as promptly as possible, we will not be able to fully remediate the ITGC Material Weakness until these steps have been completed and the controls are operating effectively.
Changes in Internal Control Over Financial Reporting
Except for the identification of the 2023 Material Weaknesses and related remediation efforts to date, there have been no changes in the Company’s internal control over financial reporting (as such term is defined in Rules 13a-15(d) and 15d-15(d) under the Exchange Act) during the fourth quarter of fiscal 2023 that have materially affected, or are reasonably likely to materially affect, the Company’s internal control over financial reporting.
Limitations on Effectiveness of Controls and Procedures
The effectiveness of any internal control over financial reporting is subject to inherent limitations, including the exercise of judgment in designing, implementing, operating, and evaluating the controls and procedures, and the inability to eliminate misconduct completely. Accordingly, any system of internal control over financial reporting, no matter how well designed and operated, can only provide reasonable, not absolute assurance that its objectives will be met. In addition, projections of any evaluation of effectiveness to future periods are subject to the risk that controls may become inadequate because of changes in conditions, or that the degree of compliance with the policies or procedures may deteriorate. We intend to continue to monitor and upgrade our internal controls as necessary or appropriate for our business, but cannot assure you that such improvements will be sufficient to provide us with effective internal control over financial reporting.
100
Item 9B. Other Information
Item 9C. Disclosure Regarding Foreign Jurisdictions that Prevent Inspections
Not applicable.
101
PART III
Item 10. Directors, Executive Officers, and Corporate Governance
The information required by this item is incorporated by reference to the definitive Proxy Statement for the 2024 Annual Meeting of Stockholders, which will be filed with the Securities and Exchange Commission within 120 days of our fiscal year ended December 31, 2023.
Item 11. Executive Compensation
The information required by this item is incorporated by reference to the definitive Proxy Statement for the 2024 Annual Meeting of Stockholders, which will be filed with the Securities and Exchange Commission within 120 days of our fiscal year ended December 31, 2023.
Item 12. Security Ownership of Certain Beneficial Owners and Management and Related Stockholder Matters
The information required by this item is incorporated by reference to the definitive Proxy Statement for the 2024 Annual Meeting of Stockholders, which will be filed with the Securities and Exchange Commission within 120 days of our fiscal year ended December 31, 2023.
Item 13. Certain Relationships and Related Transactions, and Director Independence
The information required by this item is incorporated by reference to the definitive Proxy Statement for the 2024 Annual Meeting of Stockholders, which will be filed with the Securities and Exchange Commission within 120 days of our fiscal year ended December 31, 2023.
Item 14. Principal Accountant Fees and Services
The information required by this item is incorporated by reference to the definitive Proxy Statement for the 2024 Annual Meeting of Stockholders, which will be filed with the Securities and Exchange Commission within 120 days of our fiscal year ended December 31, 2023.
102
PART IV
Item 15. Exhibits and Financial Statement Schedules
(a) The following documents are filed as part of this Annual Report on Form 10-K:
1. Consolidated Financial Statements
See Index to Consolidated Financial Statements at Part II, Item 8 herein.
2. Financial Statement Schedules
All schedules have been omitted because they are not required, not applicable, or not present in amounts sufficient to require submission of the schedule.
3. Exhibits
| Incorporated by Reference | ||||||||||||||||||||||||||||||||
| Exhibit Number | Description | Form | File No. | Exhibit Number | Filing Date | |||||||||||||||||||||||||||
| 3.1 | S-1/A | 333-256154 | 3.2 | May 24, 2021 | ||||||||||||||||||||||||||||
| 3.2 | S-1/A | 333-256154 | 3.4 | May 24, 2021 | ||||||||||||||||||||||||||||
| 4.1 | S-1 | 333-256154 | 4.1 | May 14, 2021 | ||||||||||||||||||||||||||||
| 4.2 | S-1 | 333-256154 | 4.2 | May 14, 2021 | ||||||||||||||||||||||||||||
| 4.3 | S-1 | 333-256154 | 4.3 | May 14, 2021 | ||||||||||||||||||||||||||||
| 4.4 | S-1 | 333-256154 | 4.4 | May 14, 2021 | ||||||||||||||||||||||||||||
| 4.5† | S-1/A | 333-256154 | 4.7 | May 24, 2021 | ||||||||||||||||||||||||||||
| 4.6† | S-1 | 333-256154 | 4.8 | May 14, 2021 | ||||||||||||||||||||||||||||
| 4.7† | S-1/A | 333-256154 | 4.9 | May 24, 2021 | ||||||||||||||||||||||||||||
| 4.8 | 10-K | 001-40465 | 4.8 | March 11, 2022 | ||||||||||||||||||||||||||||
10.1# | 10-K | 001-40465 | 10.1 | February 28, 2023 | ||||||||||||||||||||||||||||
10.2# | S-1/A | 333-256154 | 10.2 | May 14, 2021 | ||||||||||||||||||||||||||||
10.3# | S-1/A | 333-256154 | 10.3 | June 1, 2021 | ||||||||||||||||||||||||||||
10.4# | S-1/A | 333-256154 | 10.4 | June 1, 2021 | ||||||||||||||||||||||||||||
10.5# | S-1/A | 333-256154 | 10.5 | May 24, 2021 | ||||||||||||||||||||||||||||
10.6# | S-1/A | 333-256154 | 10.6 | May 24, 2021 | ||||||||||||||||||||||||||||
10.7# | 10-Q | 001-40465 | 10.1 | May 9, 2023 | ||||||||||||||||||||||||||||
10.8# | S-1 | 333-256154 | 10.12 | May 14, 2021 | ||||||||||||||||||||||||||||
10.9#* | 10-K | 001-40465 | 10.9 | February 28, 2023 | ||||||||||||||||||||||||||||
10.10# | S-1 | 333-256154 | 10.8 | May 14, 2021 | ||||||||||||||||||||||||||||
10.11# | 10-K | 001-40465 | 10.16 | March 11, 2022 | ||||||||||||||||||||||||||||
103
10.12# | 10-K | 001-40465 | 10.12 | February 28, 2023 | ||||||||||||||||||||||||||||
10.13* | ||||||||||||||||||||||||||||||||
10.14† | Master Services Agreement by and between the Registrant and Square, Inc., dated April 19, 2016, as amended on September 1, 2016, October 18, 2016, December 24, 2016, June 30, 2017, August 2, 2017, October 1, 2017, April 1, 2018, June 6, 2019, September 20, 2019, February 7, 2020, November 18, 2020, November 18, 2020, March 13, 2021, May 21, 2021, January 27, 2022, and March 1, 2023. | 10-Q | 001-40465 | 10.4 | May 9, 2023 | |||||||||||||||||||||||||||
10.15†* | ||||||||||||||||||||||||||||||||
10.16 | 10-Q | 001-40465 | 10.1 | November 8, 2023 | ||||||||||||||||||||||||||||
10.17† | 8-K/A | 001-40465 | 10.1 | August 11, 2023 | ||||||||||||||||||||||||||||
10.18† | 10-Q | 001-40465 | 10.1 | August 8, 2023 | ||||||||||||||||||||||||||||
| 21.1* | ||||||||||||||||||||||||||||||||
| 23.1* | ||||||||||||||||||||||||||||||||
| 24.1* | ||||||||||||||||||||||||||||||||
| 31.1* | ||||||||||||||||||||||||||||||||
| 31.2* | ||||||||||||||||||||||||||||||||
| 32.1** | ||||||||||||||||||||||||||||||||
| 32.2** | ||||||||||||||||||||||||||||||||
97.1* | ||||||||||||||||||||||||||||||||
99.1* | ||||||||||||||||||||||||||||||||
101.INS* | Inline XBRL Instance Document. | |||||||||||||||||||||||||||||||
101.SCH* | Inline XBRL Taxonomy Extension Schema Document. | |||||||||||||||||||||||||||||||
101.CAL* | Inline XBRL Taxonomy Extension Calculation Linkbase Document. | |||||||||||||||||||||||||||||||
101.DEF* | Inline XBRL Taxonomy Extension Definition Linkbase Document. | |||||||||||||||||||||||||||||||
101.LAB* | Inline XBRL Taxonomy Extension Labels Linkbase Document. | |||||||||||||||||||||||||||||||
101.PRE* | Inline XBRL Taxonomy Extension Presentation Linkbase Document. | |||||||||||||||||||||||||||||||
104* | Cover Page Interactive Data File (formatted as inline XBRL and contained in Exhibit 101). | |||||||||||||||||||||||||||||||
| † | Certain confidential information contained in this exhibit has been omitted because it is both (i) not material and (ii) is the type that the Registrant treats as private or confidential. | |||||||||||||||||||||||||||||||
| # | Indicates management contract or compensatory plan, contract or agreement. | |||||||||||||||||||||||||||||||
| * | Filed herewith. | |||||||||||||||||||||||||||||||
| ** | Furnished herewith. The certifications attached as Exhibits 32.1 and 32.2 that accompany this Annual Report on Form 10-K are deemed furnished and not filed with the SEC and are not to be incorporated by reference into any filing of the Company under the Securities Act or the Exchange Act, whether made before or after the date of this Annual Report on Form 10-K, irrespective of any general incorporation language contained in such filing. | |||||||||||||||||||||||||||||||
104
Item 16. Form 10-K Summary
Not applicable.
105
SIGNATURES
Pursuant to the requirements of Section 13 or 15(d) of the Securities Exchange Act of 1934, the Registrant has duly caused this report to be signed on its behalf by the undersigned thereunto duly authorized.
| MARQETA, INC. | |||||||||||
Date: February 28, 2024 | By: | /s/ Simon Khalaf | |||||||||
| Name: | Simon Khalaf | ||||||||||
| Title: | Chief Executive Officer (Principal Executive Officer) | ||||||||||
Date: February 28, 2024 | By: | /s/ Michael (Mike) Milotich | |||||||||
| Name: | Michael (Mike) Milotich | ||||||||||
| Title: | Chief Financial Officer (Principal Financial Officer and Principal Accounting Officer) | ||||||||||
POWER OF ATTORNEY
KNOW ALL PERSONS BY THESE PRESENTS, that each person whose signature appears below constitutes and appoints Simon Khalaf, Michael Milotich, and Crystal Sumner, and each of them, as his or her true and lawful attorneys-in-fact and agents, with full power of substitution and resubstitution, for him or her and in his or her name, place and stead, in any and all capacities, to sign any amendments to this Annual Report on Form 10-K, and to file the same, with all exhibits thereto, and other documents in connection therewith, with the Securities and Exchange Commission, hereby ratifying and confirming all that each of said attorneys-in-fact, or his substitute or substitutes, may lawfully do or cause to be done by virtue hereof.
Pursuant to the requirements of the Securities Exchange Act of 1934, this report has been signed by the following persons on behalf of the Registrant and in the capacities and on the dates indicated.
| Signature | Title | Date | ||||||
| /s/ Simon Khalaf | Chief Executive Officer and Director | February 28, 2024 | ||||||
| Simon Khalaf | (Principal Executive Officer) | |||||||
| /s/ Michael (Mike) Milotich | Chief Financial Officer | February 28, 2024 | ||||||
| Michael (Mike) Milotich | (Principal Financial and Accounting Officer) | |||||||
| /s/ Jason Gardner | Director | February 28, 2024 | ||||||
| Jason Gardner | ||||||||
| /s/ Martha Cummings | Director | February 28, 2024 | ||||||
| Martha Cummings | ||||||||
| /s/ Gerri Elliott | Director | February 28, 2024 | ||||||
| Gerri Elliott | ||||||||
| /s/ Helen Riley | Director | February 28, 2024 | ||||||
| Helen Riley | ||||||||
| /s/ Arnon Dinur | Director | February 28, 2024 | ||||||
| Arnon Dinur | ||||||||
| /s/ Judson Linville | Director | February 28, 2024 | ||||||
| Judson Linville | ||||||||
| /s/ Kiran Prasad | Director | February 28, 2024 | ||||||
| Kiran Prasad | ||||||||
| /s/ Godfrey Sullivan | Director | February 28, 2024 | ||||||
| Godfrey Sullivan | ||||||||
/s/ Najuma Atkinson | Director | February 28, 2024 | ||||||
Najuma Atkinson | ||||||||
106