UNITED STATES
SECURITIES AND EXCHANGE COMMISSION
Washington, D.C. 20549
FORM 10-K
(Mark One)
| ANNUAL REPORT PURSUANT TO SECTION 13 OR 15(d) OF THE SECURITIES EXCHANGE ACT OF 1934 | |||||
For the fiscal year ended December 31 , 2023
OR
| TRANSITION REPORT PURSUANT TO SECTION 13 OR 15(d) OF THE SECURITIES EXCHANGE ACT OF 1934 | |||||
Commission file number: 814-00866
(Exact Name of Registrant as Specified in its Charter)
| (State or Other Jurisdiction of Incorporation or Organization) | (I.R.S. Employer Identification No.) | |||||||
| (Address of Principal Executive Office) | (Zip Code) | |||||||
(312 ) 258-8300
(Registrant’s Telephone Number, Including Area Code)
Securities registered pursuant to Section 12(b) of the Act:
| Title of Each Class | Trading Symbol(s) | Name of Each Exchange on Which Registered | ||||||||||||
Securities registered pursuant to Section 12(g) of the Act: None
Indicate by check mark if the registrant is a well-known seasoned issuer, as defined in Rule 405 of the Securities Act. Yes o No x
Indicate by check mark if the registrant is not required to file reports pursuant to Section 13 or Section 15(d) of the Act. Yes o No x
Indicate by check mark whether the registrant: (1) has filed all reports required to be filed by Section 13 or 15(d) of the Securities Exchange Act of 1934 during the preceding 12 months (or for such shorter period that the registrant was required to file such reports), and (2) has been subject to such filing requirements for the past 90 days. Yes x No o
Indicate by check mark whether the registrant has submitted electronically every Interactive Data File required to be submitted pursuant to Rule 405 of Regulation S-T (§232.405 of this chapter) during the preceding 12 months (or for such shorter period that the registrant was required to submit such files). Yes x No o
Indicate by check mark whether the registrant is a large accelerated filer, an accelerated filer, a non-accelerated filer, a smaller reporting company, or an emerging growth company. See the definitions of “large accelerated filer,” “accelerated filer,” “smaller reporting company,” and “emerging growth company” in Rule 12b-2 of the Exchange Act.
| Large accelerated filer | o | Accelerated filer | o | ||||||||
x | Smaller reporting company | ||||||||||
| Emerging growth company | |||||||||||
If an emerging growth company, indicate by check mark if the registrant has elected not to use the extended transition period for complying with any new or revised financial accounting standards provided pursuant to Section 13(a) of the Exchange Act. o
Indicate by check mark whether the registrant has filed a report on and attestation to its management's assessment of the effectiveness of its internal control over financial reporting under Section 404(b) of the Sarbanes-Oxley Act (15 U.S.C. 7262(b)) by the registered public accounting firm that prepared or issued its audit report. o
If securities are registered pursuant to Section 12(b) of the Act, indicate by check mark whether the financial statements of the registrant included in the filing reflect the correction of an error to previously issued financial statements. o
Indicate by check mark whether any of those error corrections are restatements that required a recovery analysis of incentive-based compensation received by any of the registrant’s executive officers during the relevant recovery period pursuant to § 240.10D-1(b). o
Indicate by check mark whether the registrant is a shell company (as defined in Rule 12b-2 of the Exchange Act). Yes o No x
The aggregate market value of outstanding common stock held by non-affiliates of the registrant was $170.9 million based on the number of shares held by non-affiliates of the registrant as of June 30, 2023, which is the last business day of the registrant's most recently completed second fiscal quarter.
As of March 8, 2024, the registrant had 21,666,340 shares of common stock, $0.001 par value, outstanding.
Documents Incorporated by Reference
Portions of the registrant's definitive proxy statement to be filed with the Securities and Exchange Commission pursuant to Regulation 14A relating to the registrant's 2024 Annual Meeting of Stockholders, to be filed with the Securities and Exchange Commission within 120 days following the end of the Company's fiscal year, are incorporated by reference in Part III of this Annual Report on Form 10-K as indicated herein.
TABLE OF CONTENTS
| Page | |||||
2
CERTAIN DEFINITIONS
Except as otherwise specified in this Annual Report on Form 10-K (“Annual Report”), the terms:
•“we,” “us,” “our” and the “Company” refer to Monroe Capital Corporation, a Maryland corporation, and its consolidated subsidiaries;
•MC Advisors refers to Monroe Capital BDC Advisors, LLC, our investment adviser and a Delaware limited liability company;
•MC Management refers to Monroe Capital Management Advisors, LLC, our administrator and a Delaware limited liability company;
•Monroe Capital refers to Monroe Capital LLC, a Delaware limited liability company, and its subsidiaries and affiliates; and
•SLF refers to MRCC Senior Loan Fund I, LLC, an unconsolidated Delaware limited liability company, in which we co-invest with Life Insurance Company of the Southwest (“LSW”) primarily in senior secured loans.
FORWARD-LOOKING STATEMENTS
This Annual Report on Form 10-K contains statements that constitute forward-looking statements which are subject to the safe harbor provisions of the Private Securities Litigation Reform Act of 1995. Statements that are not historical are forward-looking statements within the meaning of Section 27A of the Securities Act of 1933 and Section 21E of the Securities Exchange Act of 1934. Some of the statements in this Annual Report on Form 10-K constitute forward-looking statements because they relate to future events or our future performance or future financial condition. These forward-looking statements are not historical facts, but rather are based on current expectations, estimates and projections about our company, our industry, our beliefs and our assumptions. The forward-looking statements contained in this Annual Report on Form 10-K involve risks and uncertainties, including statements as to:
•our future operating results;
•our business prospects and the prospects of our portfolio companies;
•the dependence of our future success on the general economy and its impact on the industries in which we invest;
•the impact of the ongoing military conflict in the Middle East and Europe and general uncertainty surrounding the financial and political stability of the United States, the United Kingdom, the European Union and China;
•the impact of a protracted decline in the liquidity of credit markets on our business;
•the impact of increased competition;
•the impact of higher interest and inflation rates and the risk of recession on our business prospects and the prospects of our portfolio companies;
•our contractual arrangements and relationships with third parties;
•the valuation of our investments in portfolio companies, particularly those having no liquid trading market;
•actual and potential conflicts of interest with MC Advisors, MC Management and other affiliates of Monroe Capital;
•the ability of our portfolio companies to achieve their objectives;
•the use of borrowed money to finance a portion of our investments;
•the adequacy of our financing sources and working capital;
•the timing of cash flows, if any, from the operations of our portfolio companies;
3
•the ability of MC Advisors to locate suitable investments for us and to monitor and administer our investments;
•the ability of MC Advisors or its affiliates to attract and retain highly talented professionals;
•our ability to qualify and maintain our qualification as a regulated investment company and as a business development company; and
•the impact of future legislation and regulation on our business and our portfolio companies.
We use words such as “anticipates,” “believes,” “expects,” “intends,” “seeks,” “plans,” “estimates,” “targets” and similar expressions to identify forward-looking statements. The forward-looking statements contained in this Annual Report on Form 10-K involve risks and uncertainties. Our actual results could differ materially from those implied or expressed in the forward-looking statements for any reason, including the factors set forth in “Part I-Item 1A. Risk Factors” in this Annual Report on Form 10-K.
Although we believe that the assumptions on which these forward-looking statements are based are reasonable, any of those assumptions could prove to be inaccurate, and as a result, the forward-looking statements based on those assumptions also could be inaccurate. Important assumptions include our ability to originate new loans and investments, certain margins and levels of profitability and the availability of additional capital. In light of these and other uncertainties, the inclusion of a projection or forward-looking statements in this Annual Report on Form 10-K should not be regarded as a representation by us that our plans and objectives will be achieved.
We have based the forward-looking statements included in this Annual Report on Form 10-K on information available to us on the date of this Annual Report on Form 10-K, and we assume no obligation to update any such forward-looking statements. Although we undertake no obligation to revise or update any forward-looking statements in this Annual Report on Form 10-K, whether as a result of new information, future events or otherwise, you are advised to consult any additional disclosures that we may make directly to you or through reports that we may file in the future with the Securities and Exchange Commission (the “SEC”), including Annual Reports on Form 10-K, Quarterly Reports on Form 10-Q and Current Reports on Form 8-K.
4
PART I
ITEM 1. BUSINESS
FORMATION OF OUR COMPANY
We are a Maryland corporation, formed February 9, 2011, for the purpose of purchasing an initial portfolio of loans from two funds managed by Monroe Capital, raising capital in our initial public offering, which was completed in October 2012 (the “Initial Public Offering”), and thereafter operating as an externally managed business development company (“BDC”) under the Investment Company Act of 1940 (the “1940 Act”), as amended. We are a closed-end, non-diversified investment company that has elected to be treated as a BDC under the 1940 Act. In addition, for tax purposes we have elected to be treated as a regulated investment company (“RIC”) under the U.S. Internal Revenue Code of 1986, as amended (the “Code”), commencing with our taxable year ended December 31, 2012.
Public Offerings of Common Stock
The Initial Public Offering consisted of the sale of 5,750,000 shares of our common stock at a price of $15.00 per share, resulting in net proceeds to us, net of underwriting discounts and commissions, of approximately $84.6 million. On July 22, 2013, we completed a public offering of an additional 4,000,000 shares of our common stock at a price of $14.05 per share. On August 20, 2013, we also sold an additional 225,000 shares of our common stock at a price of $14.05 per share pursuant to the underwriters’ partial exercise of the over-allotment option. These issuances during the year ended December 31, 2013 provided us with proceeds, net of offering and underwriting costs, of $56.0 million.
On April 20, 2015, we closed a public offering of 2,450,000 shares of our common stock at a public offering price of $14.85 per share, raising approximately $36.4 million in gross proceeds. On May 18, 2015, we completed the sale of an additional 367,500 shares of our common stock, at a public offering price of $14.85 per share, raising approximately $5.5 million in gross proceeds pursuant to the underwriters’ exercise of the over-allotment option. Aggregate underwriters’ discounts and commissions were $1.7 million and offering costs were $0.3 million, resulting in net proceeds of approximately $39.9 million.
On July 25, 2016, we closed a public offering of 3,100,000 shares of our common stock at a public offering price of $15.50 per share, raising approximately $48.1 million in gross proceeds. On August 3, 2016, we sold an additional 465,000 shares of our common stock, at a public offering price of $15.50 per share, raising approximately $7.2 million in gross proceeds pursuant to the underwriters’ exercise of the over-allotment option. Aggregate underwriters’ discounts and commissions were $2.2 million and offering costs were $0.5 million, resulting in net proceeds of approximately $52.5 million.
On June 9, 2017, we closed a public offering of 3,000,000 shares of our common stock at a public offering price of $15.00 per share, raising approximately $45.0 million in gross proceeds. On June 14, 2017, pursuant to the underwriters’ exercise of the over-allotment option, we sold an additional 450,000 shares of our common stock, at a public offering price of $15.00 per share, raising an additional $6.8 million in gross proceeds for a total of approximately $51.8 million. Aggregate underwriters’ discounts and commissions were $2.1 million and offering costs were $0.1 million, resulting in net proceeds of approximately $49.6 million.
At-the-market Securities Offering Program
On February 6, 2015, we entered into an at-the-market (“ATM”) securities offering program with MLV & Co. LLC (“MLV”) and JMP Securities LLC (“JMP”) (the “Initial ATM Program”) through which we could sell, by means of ATM offerings from time to time, up to $50.0 million of our common stock. During the year ended December 31, 2015, we sold 672,597 shares at an average price of $14.88 per share for gross proceeds of approximately $10.0 million under the Initial ATM Program. Aggregate underwriters’ discounts and commissions were $0.2 million and offering costs were $83 thousand, resulting in net proceeds of approximately $9.8 million.
5
On July 1, 2016, we amended the Initial ATM Program with MLV and JMP to replace MLV with FBR Capital Markets & Co. (“FBR”), an affiliate of MLV. On May 12, 2017, we entered into new equity distribution agreements with each of FBR and JMP (the “ATM Program”). All other material terms of the Initial ATM Program remain unchanged under the ATM Program. During the year ended December 31, 2017, we sold 173,939 shares at an average price of $15.71 per share for gross proceeds of $2.7 million under the Initial ATM Program and no shares were sold under the ATM Program. Aggregate underwriters’ discounts and commissions were $41 thousand and offering costs were $23 thousand, resulting in net proceeds of approximately $2.7 million. During the year ended December 31, 2018, we sold 182,299 shares at an average price of $13.82 per share for gross proceeds of approximately $2.5 million under the ATM Program. Aggregate underwriters’ discounts and commissions were $38 thousand and offering costs were $79 thousand, resulting in net proceeds of approximately $2.4 million. There were no stock issuances during the year ended December 31, 2019.
On May 8, 2020, we entered into an amendment to the ATM Program to extend its term. All other material terms of the ATM Program remain unchanged. During the year ended December 31, 2020, we sold 858,976 shares at an average price of $7.78 per share for gross proceeds of $6.7 million under the ATM Program. Aggregate underwriter’s discounts and commissions were $0.1 million and offering costs were $0.1 million, resulting in net proceeds of approximately $6.5 million. During the year ended December 31, 2021, we sold 362,800 shares at an average price of $11.53 per share for gross proceeds of $4.2 million under the ATM Program. Aggregate underwriter’s discounts and commissions were $63 thousand and offering costs were $27 thousand, resulting in net proceeds of approximately $4.1 million. There were no stock issuances through the ATM Program during the years ended December 31, 2023 and 2022.
Small Business Investment Company Subsidiary
On February 28, 2014, our wholly-owned subsidiary, Monroe Capital Corporation SBIC, LP (“MRCC SBIC”), a Delaware limited partnership, received a license from the Small Business Administration (“SBA”) to operate as a Small Business Investment Company (“SBIC”) under Section 301(c) of the Small Business Investment Act of 1958. MRCC SBIC commenced operations on September 16, 2013. On April 13, 2016, MRCC SBIC was approved by the SBA for an additional $75.0 million in SBA debentures for a total of $115.0 million in available SBA debentures. During the year ended December 31, 2021, MRCC SBIC began to repay its SBA debentures and $56.9 million in SBA debentures remained outstanding as of December 31, 2021. On March 1, 2022, MRCC SBIC fully repaid its outstanding SBA debentures and notified the SBA of its intent to surrender its license to operate as a SBIC. MRCC SBIC received approval from the SBA to surrender its SBIC license and on March 31, 2022, MRCC SBIC was dissolved.
OVERVIEW OF OUR BUSINESS
We are a specialty finance company focused on providing financing solutions primarily to lower middle-market companies in the United States and Canada. We provide customized financing solutions focused primarily on senior secured, junior secured and unitranche secured (a combination of senior secured and junior secured debt in the same facility in which we syndicate a “first out” portion of the loan to an investor and retain a “last out” portion of the loan) debt and, to a lesser extent, unsecured subordinated debt and equity, including equity co-investments in preferred and common stock and warrants.
Our investment objective is to maximize the total return to our stockholders in the form of current income and capital appreciation through investment in senior secured, unitranche secured and junior secured debt and, to a lesser extent, unsecured subordinated debt and equity investments. We seek to use our extensive leveraged finance origination infrastructure and broad expertise in sourcing loans to invest in primarily senior secured, unitranche secured and junior secured debt of middle-market companies. We believe that our primary focus on lending to lower middle-market companies offers several advantages as compared to lending to larger companies, including more attractive economics, lower leverage, more comprehensive and restrictive covenants, more expansive events of default, relatively small debt facilities that provide us with enhanced influence over our borrowers, direct access to borrower management and improved information flow.
Since the consummation of the Initial Public Offering, we have grown the fair value of our portfolio of investments to approximately $488.4 million at December 31, 2023. Our portfolio at December 31, 2023 consists of 96 different portfolio companies and holdings include senior secured, unitranche secured and junior secured debt and equity investments. As of December 31, 2023, we have borrowed $174.1 million under our revolving credit facility and $130.0 million in aggregate principal amount of senior unsecured notes (“2026 Notes”) outstanding.
6
Our investments will generally range between $2.0 million and $25.0 million each, although this investment size may vary proportionately with the size of our capital base. As of December 31, 2023, our portfolio included approximately 79.6% senior secured loans, 2.8% unitranche secured loans, 5.5% junior secured loans and 12.1% equity securities. We expect that the companies in which we invest may be leveraged, often as a result of leveraged buy-outs or other recapitalization transactions, and, in certain cases, will not be rated by national ratings agencies. If such companies were rated, we believe that they would typically receive a rating below investment grade (between BB and CCC under the Standard & Poor’s system) from the national rating agencies.
While our primary focus is to maximize current income and capital appreciation through debt investments in thinly traded or private U.S. companies, we may invest a portion of the portfolio in opportunistic investments in order to seek to enhance returns to stockholders. Such investments may include investments in real estate, specialty finance, litigation finance, fund finance, high-yield bonds, distressed debt, private equity or securities of public companies that are not thinly traded and securities of middle-market companies located outside of the United States. We expect that these public companies generally will have debt securities that are non-investment grade.
OUR INVESTMENT ADVISOR
Our investment activities are managed by our investment advisor, MC Advisors. MC Advisors is responsible for sourcing potential investments, conducting research and due diligence on prospective investments and their private equity sponsors, analyzing investment opportunities, structuring our investments and managing our investments and portfolio companies on an ongoing basis. MC Advisors was organized in February 2011 and is registered with the U.S. Securities and Exchange Commission (the "SEC") as an investment adviser under the Investment Advisers Act of 1940, as amended (the “Advisers Act”).
Under our investment advisory and management agreement with MC Advisors (the "Investment Advisory and Management Agreement"), we pay MC Advisors a base management fee and an incentive fee for its services. While not expected to review or approve each investment, our independent directors periodically review MC Advisors’ services and fees as well as its portfolio management decisions and portfolio performance. In connection with these reviews, our independent directors consider whether our fees and expenses (including those related to leverage) remain appropriate.
MC Advisors seeks to capitalize on the significant deal origination, credit underwriting, due diligence, investment structuring, execution, portfolio management and monitoring experience of Monroe Capital’s investment professionals. The senior management team of Monroe Capital, including Theodore L. Koenig and Lewis W. Solimene, Jr., provides investment services to MC Advisors pursuant to a staffing agreement (the “Staffing Agreement”) between MC Management, an affiliate of Monroe Capital, and MC Advisors. Messrs. Koenig and Solimene, Jr. have developed a broad network of contacts within the investment community and average more than 40 years of experience investing in debt and equity securities of lower middle-market companies. In addition, Messrs. Koenig and Solimene, Jr. have extensive experience investing in assets that constitute our primary focus and have expertise in investing throughout all periods of the economic cycle. Monroe Capital’s core team of investment professionals has an established track record in sourcing, underwriting, executing and monitoring transactions.
In addition to his roles with Monroe Capital, Mr. Koenig serves as an interested director on the Board and a member of the MC Advisors' investment committee. Mr. Koenig has approximately 40 years of experience in structuring, negotiating and closing transactions on behalf of asset-backed lenders, commercial finance companies, financial institutions and private equity investors at organizations including Monroe Capital, which Mr. Koenig founded in 2004, and Hilco Capital LP, where he led investments in over 20 companies in the lower middle-market. Mr. Solimene Jr. has more than 40 years of experience in alternative investing, corporate finance, restructuring and special situations experience at organizations including Allstate Investments, Macquarie Capital (USA), Inc., Ernst & Young Corporate Finance, LLC and Banc of America Securities, LLC. Messrs. Koenig and Solimene Jr. are joined on MC Advisors' investment committee of MC Advisors by Michael J. Egan and Jeremy T. VanDerMeid, each of whom is a senior investment professional at Monroe Capital. Mr. Egan has approximately 40 years of experience in commercial finance, credit administration and banking at organizations including Hilco Capital, The CIT Group/Business Credit, Inc., The National Community Bank of New Jersey (The Bank of New York) and KeyCorp. Mr. VanDerMeid has more than 25 years of lending and corporate finance experience at organizations including Morgan Stanley Investment Management, Dymas Capital Management Company, LLC and Heller Financial.
7
ABOUT MONROE CAPITAL
Monroe Capital, a Delaware limited liability company that was founded in 2004, is a leading lender to middle-market companies. During the year ended December 31, 2023, Monroe Capital acquired Horizon Technology Finance Management LLC ("Horizon"). Horizon is a leading investment manager of venture debt products for high-growth companies in the technology, life sciences healthcare information and services, and sustainability industries. The acquisition of Horizon augments Monroe Capital's existing platform with an experienced investment team and distinguished track record across multiple market cycles. Unless otherwise noted, all references to Monroe Capital include Horizon.
As of January 1, 2024, Monroe Capital had approximately $18.4 billion in assets under management. Over its twenty-year history, Monroe Capital has developed an established lending platform that we believe generates consistent deal flow from a network of proprietary relationships. Monroe Capital’s assets under management are comprised of a diverse portfolio of over 590 current investments that were either originated directly by Monroe Capital or sourced from Monroe Capital’s third-party relationships. From Monroe Capital’s formation in 2004 through December 31, 2023, Monroe Capital’s investment professionals invested in over 2,100 loans and related investments in an aggregate amount of over $41.3 billion. The senior investment team of Monroe Capital has developed a proven investment and portfolio management process that has performed through multiple market cycles. In addition, Monroe Capital’s investment professionals are supported by a robust infrastructure of administrative and back-office personnel focused on compliance, operations, finance, treasury, legal, accounting and reporting, marketing, information technology and office management.
INVESTMENT STRATEGY
Our investment objective is to maximize the total return to our stockholders in the form of current income and capital appreciation primarily through investments in senior, unitranche and junior secured debt and, to a lesser extent, unsecured subordinated debt and equity. We also seek to invest opportunistically in attractively priced, broadly syndicated loans, which should enhance our geographic and industry portfolio diversification and increase our portfolio’s liquidity. We do not target any specific industry, however, as of December 31, 2023, our investments in the FIRE: Real Estate, Healthcare & Pharmaceuticals and Services: Business industries represented approximately 17.4%, 14.2% and 11.6%, respectively, of the fair value of our portfolio. To achieve our investment objective, we utilize the following investment strategy:
Attractive Current Yield on Investment Portfolio. We believe our sourcing network allows us to enter into transactions with attractive yields and investment structures. Based on current market conditions and our pipeline of new investments, we expect our target directly originated senior and unitranche secured debt will have an average maturity of three to seven years and interest rates of 9% to 16%, and we expect our target directly originated junior secured debt and unsecured subordinated debt will have an average maturity of four to seven years and interest rates of 11% to 18%. In addition, based on current market conditions and our pipeline of new investments, we expect that our target debt investments will typically have a variable coupon (with a SOFR floor), may include payment-in-kind (“PIK”) interest (interest that is not received in cash, but added to the principal balance of the loan), and that we will typically receive upfront closing fees of 1% to 4%. We may also receive warrants or other forms of upside equity participation. Our transactions are generally secured and supported by a lien on all assets and/or a pledge of company stock in order to provide priority of return and to influence any corporate actions. Although we will target investments with the characteristics described in this paragraph, we cannot provide assurance that our new investments will have these characteristics and we may enter into investments with different characteristics as the market dictates. For a description of the characteristics of our current investment portfolio, see “Management’s Discussion and Analysis of Financial Condition and Results of Operations — Portfolio and Investment Activity.” Until investment opportunities can be found, we may invest our undeployed capital in cash, cash equivalents, U.S. government securities and high-quality debt investments that mature in one year or less from the date of investment. These temporary investments may have lower yields than our other investments and, accordingly, may result in lower distributions, if any, during such period.
8
Sound Portfolio Construction. We strive to exercise discipline in portfolio creation and management and to implement effective governance throughout our business. Monroe Capital and MC Advisors, which is comprised of substantially the same investment professionals who operate Monroe Capital, have been, and we believe will continue to be, conservative in the underwriting and structuring of covenant packages in order to enable early intervention in the event of weak financial performance by a portfolio company. We seek to pursue lending opportunities selectively and to maintain a diversified portfolio. We believe that exercising disciplined portfolio management through continued intensive account monitoring and timely and relevant management reporting allows us to mitigate risks in our debt investments. In addition, we have implemented rigorous governance processes through segregation of duties, documented policies and procedures and independent oversight and review of transactions, which we believe helps us to maintain a low level of non-performing loans. We believe that Monroe Capital’s proven process of thorough origination, conservative underwriting, due diligence and structuring, combined with careful account management and diversification, enabled it to protect investor capital, and we believe MC Advisors follows the same philosophy and processes in originating, structuring and managing our portfolio investments.
Predictability of Returns. Beyond conservative structuring and protection of capital, we seek a predictable exit from our investments. We seek to invest in situations where there are a number of potential exit options that can result in full repayment or a modest refinance of our investment. We seek to structure the majority of our transactions as secured loans with a covenant package that provides for full or partial repayment upon the completion of asset sales and restructurings. Because we seek to structure these transactions to provide for contractually determined, periodic payments of principal and interest, we are less likely to depend on merger and acquisition activity or public equity markets to exit our debt investments. As a result, we believe that we can achieve our target returns even in a period when public markets are depressed.
BUSINESS STRATEGY
We believe that we represent an attractive investment opportunity for the following reasons:
Deep, Experienced Management Team. We are led by our Chairman and Chief Executive Officer, Theodore L. Koenig, and Lewis W. Solimene, Jr., our Chief Financial Officer and Chief Investment Officer, who also have active roles within MC Advisors. We are managed by MC Advisors, which has access through the Staffing Agreement to Monroe Capital’s experienced team comprised of approximately 250 professionals, including seven senior partners that average more than 30 years of direct lending experience. This extensive experience includes the management of investments with borrowers of varying credit profiles and transactions completed in all phases of the credit cycle. Monroe Capital’s senior investment professionals provide us with a difficult-to-replicate sourcing network and a broad range of transactional, financial, managerial and investment skills. This expertise and experience is supported by administrative and back office personnel focused on operations, finance, legal and compliance, accounting and reporting, marketing, information technology and office management. From Monroe Capital’s formation in 2004 through December 31, 2023, Monroe Capital’s investment professionals invested in over 2,100 loans and related investments in an aggregate amount of over $41.3 billion.
Differentiated Relationship-Based Sourcing Network. We believe Monroe Capital’s senior investment professionals benefit from extensive relationships with commercial banks, private equity firms, financial intermediaries, management teams and turn-around advisors. We believe that this broad sourcing network differentiates us from our competitors and offers us a diversified origination approach that does not rely on a single channel and offers us consistent deal flow throughout the economic cycle. We also believe that this broad network allows us to originate a substantial number of non-private equity-sponsored investments.
Extensive Institutional Platform for Originating Middle-Market Deal Flow. Monroe Capital’s broad network of relationships and significant origination resources enable us to review numerous lending opportunities, permitting us to exercise a high degree of selectivity in terms of loans to which we ultimately commit. Monroe Capital estimates that it reviewed approximately 2,600 investment opportunities during 2023. Monroe Capital’s over 2,100 previously executed transactions, over 590 of which are with current borrowers, offer us another source of deal flow, as these debt investments reach maturity or seek refinancing. We are also positioned to benefit from Monroe Capital’s established brand name, strong track record in partnering with industry participants and reputation for closing deals on time and as committed. Monroe Capital’s senior investment professionals are complemented by extensive experience in capital markets transactions, risk management and portfolio monitoring.
9
Disciplined, “Credit-First” Underwriting Process. Monroe Capital has developed a systematic underwriting process that applies a consistent approach to credit review and approval, with a focus on evaluating credit first and then appropriately assessing the risk-reward profile of each loan. MC Advisors’ assessment of credit outweighs pricing and other considerations, as we seek to minimize potential credit losses through effective due diligence, structuring and covenant design. MC Advisors seeks to customize each transaction structure and financial covenant to reflect risks identified through the underwriting and due diligence process. We also seek to actively manage our origination and credit underwriting activities through personal visits and calls on all parties involved with an investment, including the management team, private equity sponsors, if any, or other lenders.
Established Credit Risk Management Framework. We seek to manage our credit risk through a well-defined portfolio strategy and credit policy. In terms of credit monitoring, MC Advisors assigns each loan to a particular portfolio management professional and maintains an internal credit rating analysis for all loans. MC Advisors then employs ongoing review and analysis, together with regular investment committee meetings to review the status of certain complex and challenging loans and a comprehensive quarterly review of all loan transactions. MC Advisors’ investment professionals also have significant turnaround and debt work-out experience, which gives them perspective on the risks and possibilities throughout the entire credit cycle. We believe this careful approach to investment and monitoring enables us to identify problems early and gives us an opportunity to assist borrowers before they face difficult liquidity constraints. By anticipating possible negative contingencies and preparing for them, we believe that we diminish the probability of underperforming assets and loan losses.
INVESTMENTS
Investment Structure
We structure our investments, which typically have maturities of three to seven years, as follows:
Senior Secured Loans. We structure senior secured loans to obtain security interests in the assets of the portfolio company borrowers that serve as collateral in support of the repayment of such loans. This collateral may take the form of first-priority liens on the assets of the portfolio company borrower. Our senior secured loans may provide for moderate loan amortization in the early years of the loan, with the majority of the amortization deferred until loan maturity.
Unitranche Secured Loans. We structure our unitranche secured loans as senior secured loans. We obtain security interests in the assets of these portfolio companies that serve as collateral in support of the repayment of these loans. This collateral may take the form of first-priority liens on the assets of a portfolio company. Generally, we syndicate a “first out” portion of the loan to an investor and retain a “last out” portion of the loan, in which case the “first out” portion of the loan will generally receive priority with respect to payments of principal, interest and any other amounts due thereunder. Unitranche structures combine characteristics of traditional first lien senior secured as well as second lien and subordinated loans and our unitranche secured loans will expose us to the risks associated with second lien and subordinated loans and may limit our recourse or ability to recover collateral upon a portfolio company’s bankruptcy. Unitranche secured loans typically provide for moderate loan amortization in the initial years of the facility, with the majority of the amortization deferred until loan maturity. Unitranche secured loans generally allow the borrower to make a large lump sum payment of principal at the end of the loan term, and there is a risk of loss if the borrower is unable to pay the lump sum or refinance the amount owed at maturity. In many cases we, together with our affiliates, are the sole or majority lender of our unitranche secured loans, which can afford us additional influence with a borrower in terms of monitoring and, if necessary, remediation in the event of underperformance.
Junior Secured Loans. We structure junior secured loans to obtain a security interest in the assets of these portfolio companies that serves as collateral in support of the repayment of such loans. This collateral may take the form of second priority liens on the assets of a portfolio company. These loans typically provide for moderate loan amortization in the initial years of the facility, with the majority of the amortization deferred until loan maturity.
Preferred Equity. We generally structure preferred equity investments to combine features of equity and debt. We may obtain a security interest in the assets of these portfolio companies that serves as collateral in support of the repayment of such preferred equity, which takes a priority to common stockholders. Preferred equity interests generally have a stated dividend rate and may not have a fixed maturity date.
10
Warrants and Equity Co-Investment Securities. In some cases, we may also receive nominally priced warrants or options to buy a minority equity interest in the portfolio company in connection with a loan. As a result, as a portfolio company appreciates in value, we may achieve additional investment return from this equity interest. We may structure such warrants to include provisions protecting our rights as a minority-interest holder, as well as a “put,” or right to sell such securities back to the issuer, upon the occurrence of specified events. In other cases, we may make a minority equity co-investment in the portfolio company in connection with a loan. Additionally, we may receive equity in our distressed portfolio companies in conjunction with amendments or additional debt fundings.
We tailor the terms of each investment to the facts and circumstances of the transaction and the prospective portfolio company, negotiating a structure that protects our rights and manages our risk while creating incentives for the portfolio company to achieve its business plan and improve its operating results. We seek to limit the downside potential of our investments by:
•selecting investments that we believe have a very low probability of loss;
•requiring a total return on our investments (including both interest and potential equity appreciation) that we believe will compensate us appropriately for credit risk; and
•negotiating covenants in connection with our investments that afford our portfolio companies as much flexibility in managing their businesses as possible, consistent with the preservation of our capital. Such restrictions may include affirmative and negative covenants, default penalties, lien protection, change of control provisions and board rights, including either observation or rights to a seat on the board of directors under some circumstances.
We expect to hold most of our investments to maturity or repayment, but we may sell some of our investments earlier if a liquidity event occurs, such as a sale, recapitalization or worsening of the credit quality of the portfolio company, or if an investment has reached its return target.
Senior Loan Fund. We have invested in SLF, which as of December 31, 2023, consisted of loans to different borrowers in industries similar to the companies in our portfolio. SLF invests primarily in senior secured loans of middle market companies. These senior secured loans are generally similar to our senior secured loans, which are secured by a first lien on some or all of the issuer’s assets and include traditional senior debt and any related revolving or similar credit facility. SLF may also invest in more liquid senior secured loans.
Investments
We seek to create a diverse portfolio that includes senior secured, unitranche secured, junior secured loans and warrants and equity co-investment securities by investing approximately $2.0 million to $25.0 million of capital, on average, in the securities of middle-market companies. This investment size may vary proportionately with the size of our capital base. Set forth below is a list of our ten largest portfolio company investments as of December 31, 2023, as well as the top ten industries in which we were invested as of December 31, 2023, in each case excluding SLF, calculated as a percentage of our total investments at fair value as of such date (in thousands):
| Portfolio Company | Fair Value of Investments | Percentage of Total Investments | ||||||||||||
HFZ Capital Group, LLC (1) | $ | 37,757 | 7.7 | % | ||||||||||
| American Community Homes, Inc. | 17,839 | 3.7 | ||||||||||||
| Security Services Acquisition Sub Corp. | 17,185 | 3.5 | ||||||||||||
| Bonterra, LLC | 15,475 | 3.2 | ||||||||||||
| NationsBenefits, LLC | 15,358 | 3.1 | ||||||||||||
| Nearly Natural, Inc. | 15,182 | 3.1 | ||||||||||||
| Planful, Inc | 14,355 | 2.9 | ||||||||||||
| Witkoff/Monroe 700 JV LLC | 11,477 | 2.3 | ||||||||||||
| HS4 Acquisitionco, Inc. | 10,317 | 2.1 | ||||||||||||
| SFR Holdco, LLC | 9,911 | 2.0 | ||||||||||||
| Total | $ | 164,856 | 33.6 | % | ||||||||||
11
______________________________________________________________
(1)Includes the associated investment in MC Asset Management (Corporate), LLC.
| Industry | Fair Value of Investments | Percentage of Total Investments | ||||||||||||
| FIRE: Real Estate | $ | 85,153 | 17.4 | % | ||||||||||
| Healthcare & Pharmaceuticals | 69,354 | 14.2 | ||||||||||||
| Services: Business | 56,655 | 11.6 | ||||||||||||
| Media: Diversified & Production | 41,897 | 8.6 | ||||||||||||
| High Tech Industries | 40,723 | 8.3 | ||||||||||||
| Media: Advertising, Printing & Publishing | 20,238 | 4.1 | ||||||||||||
| Automotive | 18,495 | 3.8 | ||||||||||||
| Services: Consumer | 16,772 | 3.4 | ||||||||||||
| FIRE: Finance | 15,388 | 3.2 | ||||||||||||
| Banking | 15,385 | 3.2 | ||||||||||||
| Total | $ | 380,060 | 77.8 | % | ||||||||||
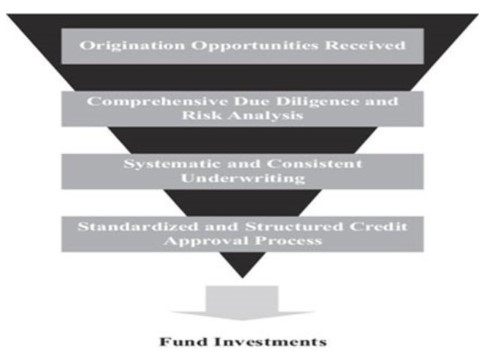
INVESTMENT PROCESS OVERVIEW
We view our investment process as consisting of the phases described below:
Origination. MC Advisors seeks to develop investment opportunities through extensive relationships with regional banks, private equity firms, financial intermediaries, management teams and other turn-around advisors. Monroe Capital has developed this network since its formation in 2004. MC Advisors manages these leads through personal visits and calls by its senior deal professionals. It is these professionals’ responsibility to identify specific opportunities, refine opportunities through due diligence regarding the underlying facts and circumstances and utilize innovative thinking and flexible terms to solve the financing issues of prospective clients. Monroe Capital’s origination professionals are broadly dispersed with ten offices across the United States and Asia. Certain of Monroe Capital’s originators are responsible for covering a specified target market based on geography and others focus on specialized industry verticals. We believe Monroe Capital’s origination professionals’ experience is vital to enable us to provide our borrowers with innovative financing solutions. We further believe that their strength and breadth of relationships across a wide range of markets will generate numerous financing opportunities and enable us to be highly selective in our lending activities. In sourcing new transactions, MC Advisors seeks opportunities to work with borrowers primarily domiciled in the United States and Canada and typically focuses on industries in which Monroe Capital has previous lending experience.
Due Diligence. For each of our investments, MC Advisors prepares a comprehensive new business presentation, which summarizes the investment opportunity and its due diligence and risk analysis, all from the perspective of strengths, weaknesses, opportunities and threats presented by the opportunity. This presentation assesses the borrower and its management, including products and services offered, market position, sales and marketing capabilities and distribution channels; key contracts, customers and suppliers, meetings with management and facility tours; background checks on key executives; customer calls; and an evaluation of exit strategies. MC Advisors’ presentation typically evaluates historical financial performance of the borrower and includes projections, including operating trends, an assessment of the quality of financial information, capitalization and liquidity measures and debt service capacity. The financial analysis also includes sensitivity analysis against management projections and an analysis of potential downside scenarios, particularly for cyclical businesses. MC Advisors seeks to also review the dynamics of the borrowers’ industry and assess the maturity, market size, competition, technology and regulatory issues confronted by the industry. Finally, MC Advisors’ new business presentation includes all relevant third-party reports and assessments, including, as applicable, analyses of the quality of earnings of the prospective borrower, a review of the business by industry experts and third-party valuations. MC Advisors also includes in this due diligence, if relevant, field exams, collateral appraisals and environmental reviews, as well as a review of comparable private and public transactions.
12
Underwriting. MC Advisors uses the systematic, consistent approach to credit evaluation developed in house by Monroe Capital with a particular focus on determining the value of a business in a downside scenario. In this process, the senior investment professionals at MC Advisors bring to bear extensive lending experience with emphasis on lessons learned from past credit cycles. We believe that the extensive credit and debt work-out experience of Monroe Capital’s senior management enables us to anticipate problems and minimize risks. Monroe Capital’s underwriting professionals work closely with its origination professionals to identify individual deal strengths, risks and any risk mitigants. MC Advisors preliminarily screens transactions based on cash flow, enterprise value and asset-based characteristics, and each of these measures is developed on a proprietary basis using thorough credit analysis focused on sustainability and predictability of cash flow to support enterprise value, barriers to entry, market position, competition, customer and supplier relationships, management strength, private equity sponsor track record and industry dynamics. For asset-based transactions, MC Advisors seeks to understand current and future collateral value, opening availability and ongoing liquidity. MC Advisors documents this preliminary analysis which is thoroughly reviewed by at least one member of its investment committee prior to proposing a formal term sheet. We believe this early involvement of the investment committee ensures that our resources and those of third parties are deployed appropriately and efficiently during the investment process and lowers execution risk for our clients. With respect to transactions reviewed by MC Advisors, we expect that only approximately 10% of our sourced deals will reach the formal term sheet stage.
Credit Approval/Investment Committee Review. MC Advisors employs a standardized, structured process developed by Monroe Capital when evaluating and underwriting new investments for our portfolio. MC Advisors’ investment committee considers its comprehensive new business presentation to approve or decline each investment. MC Advisors' investment committee includes Messrs. Koenig, Solimene Jr., Egan and VanDerMeid. The committee is committed to providing a prompt turnaround on investment decisions. Each meeting to approve an investment requires a quorum of at least three members of the investment committee, and each investment must receive unanimous approval by such members of the investment committee.
The following chart illustrates the stages of MC Advisors’ evaluation process:
Evaluation Process
Execution. We believe Monroe Capital has developed a strong reputation for closing deals as proposed, and we intend to continue this tradition. Through MC Advisors’ consistent approach to credit evaluation and underwriting, we seek to close deals as fast or faster than competitive financing providers while maintaining the discipline with respect to credit, pricing and structure necessary to ensure the ultimate success of the financing.
13
Monitoring. We benefit from the portfolio management system in place at Monroe Capital. This monitoring includes regular meetings between the responsible analyst and our portfolio company to discuss market activity and current events. MC Advisors’ portfolio management staff closely monitors all credits, with senior portfolio managers covering agented and more complex investments with the support of junior portfolio management staff. MC Advisors segregates our capital markets investments by industry. MC Advisors’ monitoring process, developed by Monroe Capital, has daily, weekly, monthly and quarterly components and related reports, each to evaluate performance against historical, budget and underwriting expectations. MC Advisors’ analysts monitor performance using standard industry software tools to provide consistent disclosure of performance. When necessary, MC Advisors updates our internal risk ratings, borrowing base criteria and covenant compliance reports.
As part of the monitoring process, MC Advisors regularly assesses the risk profile of each of our investments and rates each of them based on an internal proprietary system that uses the categories listed below, which we refer to as MC Advisors’ investment performance risk rating. For any investment rated in Grades 3, 4 or 5, MC Advisors, through its internal Portfolio Management Group (“PMG”), will increase its monitoring intensity and prepare regular updates for the investment committee, summarizing current operating results and material impending events and suggesting recommended actions. The PMG is responsible for oversight and management of any investment rated in Grades 3, 4 or 5. MC Advisors monitors and, when appropriate, changes the investment ratings assigned to each investment in our portfolio. In connection with our valuation process, MC Advisors reviews these investment performance risk ratings on a quarterly basis. The investment performance risk rating system is described as follows:
Investment Performance Risk Rating | Summary Description | |||||||
| Grade 1 | Includes investments exhibiting the least amount of risk in our portfolio. The issuer is performing above expectations or the issuer’s operating trends and risk factors are generally positive. | |||||||
| Grade 2 | Includes investments exhibiting an acceptable level of risk that is similar to the risk at the time of origination. The issuer is generally performing as expected or the risk factors are neutral to positive. | |||||||
| Grade 3 | Includes investments performing below expectations and indicates that the investment’s risk has increased somewhat since origination. The issuer may be out of compliance with debt covenants; however, scheduled loan payments are generally not past due. | |||||||
| Grade 4 | Includes an issuer performing materially below expectations and indicates that the issuer’s risk has increased materially since origination. In addition to the issuer being generally out of compliance with debt covenants, scheduled loan payments may be past due (but generally not more than six months past due). | |||||||
| Grade 5 | Indicates that the issuer is performing substantially below expectations and the investment risk has substantially increased since origination. Most or all of the debt covenants are out of compliance or payments are substantially delinquent. Investments graded 5 are not anticipated to be repaid in full. | |||||||
Our investment performance risk ratings do not constitute any rating of investments by a nationally recognized statistical rating organization or reflect or represent any third-party assessment of any of our investments.
In the event of a delinquency or a decision to rate an investment Grade 4 or Grade 5, the PMG, in consultation with the investment committee, will develop an action plan. Such a plan may require a meeting with the borrower’s management or the lender group to discuss reasons for the default and the steps management is undertaking to address the under-performance, as well as amendments and waivers that may be required. In the event of a dramatic deterioration of a credit, MC Advisors and the PMG will form a team or engage outside advisors to analyze, evaluate and take further steps to preserve our value in the credit. In this regard, we would expect to explore all options, including in a private equity sponsored investment, assuming certain responsibilities for the private equity sponsor or a formal sale of the business with oversight of the sale process by us. The PMG and the investment committee have extensive experience in running debt work-out transactions and bankruptcies.
14
The following table shows the distribution of our investments on the 1 to 5 investment performance risk rating scale as of December 31, 2023 (in thousands):
| Investment Performance Risk Rating | Investments at Fair Value | Percentage of Total Investments | ||||||||||||
| 1 | $ | — | — | % | ||||||||||
| 2 | 405,888 | 83.1 | ||||||||||||
| 3 | 74,224 | 15.2 | ||||||||||||
| 4 | 4,721 | 1.0 | ||||||||||||
| 5 | 3,553 | 0.7 | ||||||||||||
| Total | $ | 488,386 | 100.0 | % | ||||||||||
The following table shows the distribution of our investments on the 1 to 5 investment performance risk rating scale as of December 31, 2022 (in thousands):
| Investment Performance Risk Rating | Investments at Fair Value | Percentage of Total Investments | ||||||||||||
| 1 | $ | 766 | 0.1 | % | ||||||||||
| 2 | 469,772 | 86.8 | ||||||||||||
| 3 | 61,501 | 11.4 | ||||||||||||
| 4 | 8,619 | 1.6 | ||||||||||||
| 5 | 382 | 0.1 | ||||||||||||
| Total | $ | 541,040 | 100.0 | % | ||||||||||
SUMMARY RISK FACTORS
The risk factors described below are a summary of the principal risk factors associated with an investment in us. These are not the only risks we face. You should carefully consider these risk factors, together with the risk factors set forth in Item 1A. of this Annual Report on Form 10-K and the other reports and documents filed by us with the SEC.
We are subject to risks relating to our business and structure
•We depend upon MC Advisors’ senior management for our success, and upon its access to the investment professionals of Monroe Capital and its affiliates.
•There may be conflicts related to obligations that MC Advisors’ senior investment professionals and members of its investment committee have to other clients.
•Our management and incentive fee structure may create incentives for MC Advisors that are not fully aligned with the interests of our stockholders.
•Our ability to enter into transactions with our affiliates is restricted, which may limit the scope of investments available to us.
•We finance our investments with borrowed money, which magnifies the potential for gain or loss on amounts invested and may increase the risk of investing with us.
•We operate in a highly competitive market for investment opportunities, which could reduce returns and result in losses.
•We will be subject to U.S. federal income tax at corporate rates if we are unable to qualify or maintain qualification as a RIC under Subchapter M of the Code.
15
•An extended disruption in the capital markets and the credit markets could negatively affect us and our portfolio companies.
•Regulations governing our operation as a BDC affect our ability to and the way in which we raise additional capital.
•We maintain a revolving credit facility and may use other borrowed funds to make investments or fund our business operations, which exposes us to risks typically associated with leverage and increases the risk of investing in us.
•We are exposed to risks associated with changes in interest rates.
•Many of our portfolio investments are recorded at fair value as determined in good faith by our Valuation Designee and, as a result, there may be uncertainty as to the value of our portfolio investments.
•Changes in laws or regulations governing our operations may adversely affect our business or cause us to alter our business strategy.
•Our Board may change our investment objective, operating policies and strategies without prior notice or stockholder approval, the effects of which may be adverse.
•Each of MC Advisors and the Administrator can resign on 60 days’ notice, and we can provide no assurance that we could find a suitable replacement within that time, resulting in a disruption in our operations that could adversely affect our financial condition, business and results of operations.
•The failure in cybersecurity systems, as well as the occurrence of events unanticipated in our disaster recovery systems and management continuity planning, could impair our ability to conduct business effectively.
We are subject to risks relating to our investments
•Economic, political and market conditions could have a significant adverse effect on our business, financial condition and results of operations.
•Inflation may adversely affect the business, result of operations and financial condition of our portfolio companies.
•Our portfolio companies consist of and will likely continue to consist primarily of lower middle-market, privately owned companies, which may present a greater risk of loss than loans to larger companies.
•We may be subject to risks associated with our investments in senior loans, junior debt securities, “covenant-lite” loans, unitranche secured loans and securities, bank loans, and securitized products.
•The lack of liquidity in our investments may adversely affect our business.
•Price declines and illiquidity in the corporate debt markets may adversely affect the fair value of our portfolio investments, reducing our net asset value through increased net unrealized losses.
•Our portfolio companies may prepay loans, which prepayment may reduce stated yields if capital returned cannot be invested in transactions with equal or greater expected yields.
•Because we do not hold controlling equity interests in the majority of our portfolio companies, we may not be able to exercise control over our portfolio companies or to prevent decisions by management of our portfolio companies, which could decrease the value of our investments.
•Defaults by our portfolio companies will harm our operating results.
•Our portfolio companies may incur debt that ranks equally with, or senior to, our investments in such companies.
•We may not realize gains from our equity investments.
16
We are subject to risks relating to our securities
•We may not be able to pay distributions, our distributions may not grow over time and/or a portion of our distributions may be a return of capital.
•If we sell common stock at a discount to our net asset value per share, stockholders who do not participate in such sale will experience immediate dilution in an amount that may be material.
•Investing in our common stock may involve an above-average degree of risk.
•Shares of closed-end investment companies, including BDCs, often trade at a discount to their net asset value, and our shares have not traded at or above net asset value since the second quarter of 2022.
•The market price of our securities fluctuates.
•The 2026 Notes are unsecured and therefore are effectively subordinated to any secured indebtedness we have incurred or may incur in the future.
•If we default on our obligations to pay our other indebtedness, we may not be able to make payments on the 2026 Notes.
MANAGEMENT AND OTHER AGREEMENTS
MC Advisors is located at 311 South Wacker Drive, Suite 6400, Chicago, Illinois 60606. MC Advisors is a registered investment adviser under the Advisers Act. Subject to the overall supervision of our Board and in accordance with the 1940 Act, MC Advisors manages our day-to-day operations and provides investment advisory services to us. Under the terms of the Investment Advisory and Management Agreement, MC Advisors:
•determines the composition of our portfolio, the nature and timing of the changes to our portfolio and the manner of implementing such changes;
•assists us in determining what securities we purchase, retain or sell;
•identifies, evaluates and negotiates the structure of the investments we make (including performing due diligence on our prospective portfolio companies); and
•executes, closes, services and monitors the investments we make.
MC Advisors’ services under the Investment Advisory and Management Agreement are not exclusive, and it is free to furnish similar services to other entities so long as its services to us are not impaired.
Investment Advisory and Management Agreement
Under the Investment Advisory and Management Agreement with MC Advisors and subject to the overall supervision of our Board, MC Advisors provides investment advisory services to us. For providing these services, MC Advisors receives a fee from us, consisting of two components — a base management fee and an incentive fee.
On November 4, 2019, our Board approved a change to the Investment Advisory and Management Agreement to amend the base management fee structure. Effective July 1, 2019, the base management fee is calculated initially at an annual rate equal to 1.75% of average invested assets (calculated as total assets excluding cash, which includes assets financed using leverage); provided, however, the base management fee is calculated at an annual rate equal to 1.00% of our average invested assets (calculated as total assets excluding cash, which includes assets financed using leverage) that exceeds the product of (i) 200% and (ii) our average net assets. For the avoidance of doubt, the 200% is calculated in accordance with the asset coverage limitation as defined in the 1940 Act to give effect to our exemptive relief with respect to MRCC SBIC’s SBA debentures. This change has the effect of reducing our base management fee rate on assets in excess of regulatory leverage of 1:1 debt to equity to 1.00% per annum. The base management fee is payable quarterly in arrears.
17
Prior to July 1, 2019, the base management fee was calculated at an annual rate equal to 1.75% of average invested assets (calculated as total assets excluding cash, which included assets financed using leverage) and was payable quarterly in arrears.
The incentive fee consists of two parts. The first part is calculated and payable quarterly in arrears based on our pre-incentive fee net investment income for the preceding quarter subject to a total return requirement. Pre-incentive fee net investment income means interest income, dividend income and any other income (including any other fees such as commitment, origination, structuring, diligence and consulting fees or other fees that we receive from portfolio companies but excluding fees for providing managerial assistance) accrued during the calendar quarter, minus operating expenses for the quarter (including the base management fee, any expenses payable under our administration agreement between us and MC Management (the “Administration Agreement”) and any interest expense and dividends paid on any outstanding preferred stock, but excluding the incentive fee). Pre-incentive fee net investment income includes, in the case of investments with a deferred interest feature such as market discount, debt instruments with PIK interest, preferred stock with PIK dividends and zero-coupon securities, accrued income that we have not yet received in cash. MC Advisors is not under any obligation to reimburse us for any part of the incentive fee it received that was based on accrued interest that we never actually receive.
The foregoing incentive fee is subject to a total return requirement, which provides that no incentive fee in respect of our pre-incentive fee net investment income will be payable except to the extent 20.0% of the cumulative net increase in net assets resulting from operations over the then-current and 11 preceding quarters exceeds the cumulative incentive fees accrued and/or paid for the 11 preceding quarters (the “Incentive Fee Limitation”). Therefore, any ordinary income incentive fee that is payable in a calendar quarter will be limited to the lesser of (i) 20% of the amount by which our pre-incentive fee net investment income for such calendar quarter exceeds the 2% hurdle described below, subject to the “catch-up” provision, and (ii) (x) 20% of the cumulative net increase in net assets resulting from operations for the then current and 11 preceding calendar quarters minus (y) the cumulative incentive fees accrued and/or paid for the 11 preceding calendar quarters. For the foregoing purpose, the “cumulative net increase in net assets resulting from operations” is the amount, if positive, of the sum of our pre-incentive fee net investment income, base management fees, realized gains and losses and unrealized gains and losses for the then-current and 11 preceding calendar quarters.
Pre-incentive fee net investment income does not include any realized capital gains or losses or unrealized capital gains or losses. If any distributions from portfolio companies are characterized as a return of capital, such returns of capital would affect the capital gains incentive fee to the extent a gain or loss is realized. Because of the structure of the incentive fee, it is possible that we may pay an incentive fee in a quarter where we incur a loss. For example, if we receive pre-incentive fee net investment income in excess of the hurdle rate (as defined below) for a quarter, we will pay the applicable incentive fee even if we have incurred a loss in that quarter due to realized and unrealized capital losses.
Pre-incentive fee net investment income, expressed as a rate of return on the value of our net assets (defined as total assets less indebtedness and before taking into account any incentive fees payable during the period) at the end of the immediately preceding calendar quarter, is compared to a fixed “hurdle rate” of 2% per quarter (8% annually). If market interest rates rise, we may be able to invest our funds in debt instruments that provide for a higher return, which would increase our pre-incentive fee net investment income and make it easier for MC Advisors to surpass the fixed hurdle rate and receive an incentive fee based on such net investment income.
We pay MC Advisors an incentive fee with respect to our pre-incentive fee net investment income in each calendar quarter as follows:
•no incentive fee in any calendar quarter in which the pre-incentive fee net investment income does not exceed the hurdle rate of 2% (8% annually);
•100% of our pre-incentive fee net investment income with respect to that portion of such pre-incentive fee net investment income, if any, that exceeds the hurdle rate but is less than 2.5% in any calendar quarter. We refer to this portion of our pre-incentive fee net investment income (which exceeds the hurdle rate but is less than 2.5%) as the “catch-up” provision. The catch-up is meant to provide MC Advisors with 20% of the pre-incentive fee net investment income as if a hurdle rate did not apply if this net investment income exceeds 2.5% in any calendar quarter; and
•20% of the amount of our pre-incentive fee net investment income, if any, that exceeds 2.5% in any calendar quarter.
These calculations are adjusted for any share issuances or repurchases during the quarter.
18
The following is a graphical representation of the calculation of the income-related portion of the incentive fee:
Quarterly Incentive Fee Based on Pre-Incentive Fee Net Investment Income
Pre-incentive fee net investment income (expressed as a percentage of the value of net assets)
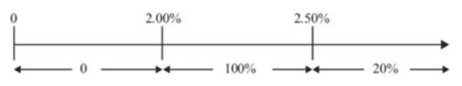
Percentage of pre-incentive fee net investment income allocated to income-related portion
of incentive fee
These calculations will be appropriately prorated for any period of less than three months and adjusted for any share issuances or repurchases during the current quarter.
The second part of the incentive fee is a capital gains incentive fee that is determined and payable in arrears as of the end of each fiscal year (or upon termination of the Investment Advisory and Management Agreement, as of the termination date), and equals 20% of our realized capital gains as of the end of the fiscal year. In determining the capital gains incentive fee payable to MC Advisors, we calculate the cumulative aggregate realized capital gains and cumulative aggregate realized capital losses since our inception, and the aggregate unrealized capital depreciation as of the date of the calculation, as applicable, with respect to each of the investments in our portfolio. For this purpose, cumulative aggregate realized capital gains, if any, equals the sum of the differences between the net sales price of each investment, when sold, and the amortized cost of such investment. Cumulative aggregate realized capital losses equals the sum of the amounts by which the net sales price of each investment, when sold, is less than the amortized cost of such investment since our inception. Aggregate unrealized capital depreciation equals the sum of the difference, if negative, between the valuation of each investment as of the applicable calculation date and the amortized cost of such investment. At the end of the applicable year, the amount of capital gains that serves as the basis for our calculation of the capital gains incentive fee equals the cumulative aggregate realized capital gains less cumulative aggregate realized capital losses, less aggregate unrealized capital depreciation, with respect to our portfolio of investments. If this number is positive at the end of such year, then the capital gains incentive fee for such year equals 20% of such amount, less the aggregate amount of any capital gains incentive fees paid in respect of our portfolio in all prior years.
Examples of Quarterly Incentive Fee Calculation
Example 1: Income Related Portion of Incentive Fee before Total Return Requirement Calculation
Alternative 1
Assumptions
Investment income (including interest, dividends, fees, etc.) = 1.25%
Hurdle rate (1) = 2%
Management fee (2) = 0.4375%
Other expenses (legal, accounting, custodian, transfer agent, etc.) = 0.2%
Pre-incentive fee net investment income (investment income – (management fee + other expenses)) = 0.6125%
Pre-incentive fee net investment income does not exceed hurdle rate, therefore there is no income-related incentive fee.
19
Alternative 2
Assumptions
Investment income (including interest, dividends, fees, etc.) = 3.0%
Hurdle rate (1) = 2%
Management fee (2) = 0.4375%
Other expenses (legal, accounting, custodian, transfer agent, etc.) = 0.2%
Pre-incentive fee net investment income (investment income – (management fee + other expenses)) = 2.3625%
Incentive fee = 100% × Pre-incentive fee net investment income (subject to “catch-up”) (3)
= 100% × (2.3625% – 2%)
= 0.3625%
Pre-incentive fee net investment income exceeds the hurdle rate, but does not fully satisfy the “catch-up” provision, therefore the income-related portion of the incentive fee is 0.3625%.
Alternative 3
Assumptions
Investment income (including interest, dividends, fees, etc.) = 3.5%
Hurdle rate (1) = 2%
Management fee (2) = 0.4375%
Other expenses (legal, accounting, custodian, transfer agent, etc.) = 0.2%
Pre-incentive fee net investment income (investment income – (management fee + other expenses)) = 2.8625%
Incentive fee = 100% × Pre-incentive fee net investment income (subject to “catch-up”) (3)
Incentive fee = 100% × “catch-up” + (20% × (Pre-incentive fee net investment income – 2.5%))
“Catch-up” = 2.5% – 2%
= 0.5%
Incentive fee = (100% × 0.5%) + (20% × (2.8625% – 2.5%))
= 0.5% + (20% × 0.3625%)
= 0.5% + 0.0725%
= 0.5725%
Pre-incentive fee net investment income exceeds the hurdle rate, and fully satisfies the “catch-up” provision, therefore the income related portion of the incentive fee is 0.5725%.
(1)Represents 8.0% annualized hurdle rate.
(2)Represents 1.75% annualized base management fee.
(3)The “catch-up” provision is intended to provide our investment advisor with an incentive fee of 20% on all pre-incentive fee net investment income as if a hurdle rate did not apply when our net investment income exceeds 2.5% in any fiscal quarter.
Example 2: Income Portion of Incentive Fee with Total Return Requirement Calculation
Assumptions
Hurdle rate (1) = 2%
Management fee (2) = 0.4375%
Other expenses (legal, accounting, transfer agent, etc.) = 0.2%
Cumulative incentive compensation accrued and/or paid for preceding 11 calendar quarters = $9 million
Alternative 1
Additional Assumptions
Investment income (including interest, dividends, fees, etc.) = 3.50%
Pre-incentive fee net investment income (investment income – (management fee + other expenses)) = 2.8625%
20.0% of cumulative net increase in net assets resulting from operations over current and preceding 11 calendar quarters = $8 million
Although our pre-incentive fee net investment income exceeds the hurdle rate of 2.0% (as shown in Alternative 3 of Example 1 above), no incentive fee is payable because 20.0% of the cumulative net increase in net assets resulting from operations over the then current and 11 preceding calendar quarters did not exceed the cumulative income and capital gains incentive fees accrued and/or paid for the preceding 11 calendar quarters.
20
Alternative 2
Additional Assumptions
Investment Income (including interest, dividends, fees, etc.) = 3.50%
Pre-incentive fee net investment income (investment income – (management fee + other expenses)) = 2.8625%
20% of cumulative net increase in net assets resulting from operations over current and preceding 11 calendar quarters = $10 million
Because our pre-incentive fee net investment income exceeds the hurdle rate of 2.0% and because 20.0% of the cumulative net increase in net assets resulting from operations over the then current and 11 preceding calendar quarters exceeds the cumulative income and capital gains incentive fees accrued and/or paid for the preceding 11 calendar quarters, an incentive fee would be payable, as shown in Alternative 3 of Example 1 above.
(1)Represents 8.0% annualized hurdle rate.
(2)Represents 1.75% annualized base management fee.
Example 3: Capital Gains Portion of Incentive Fee (*)
Alternative 1:
Assumptions
Year 1: $20 million investment made in Company A (“Investment A”), and $30 million investment made in Company B (“Investment B”)
Year 2: Investment A sold for $50 million and fair market value (“FMV”) of Investment B determined to be $32 million
Year 3: FMV of Investment B determined to be $25 million
Year 4: Investment B sold for $31 million
The capital gains portion of the incentive fee would be:
Year 1: None
Year 2: Capital gains incentive fee of $6 million — ($30 million realized capital gains on sale of Investment A multiplied by 20%)
Year 3: None — $5 million (20% multiplied by ($30 million cumulative capital gains less $5 million cumulative capital depreciation)) less $6 million (previous capital gains fee paid in Year 2)
Year 4: Capital gains incentive fee of $200,000 — $6.2 million ($31 million cumulative realized capital gains multiplied by 20%) less $6 million (capital gains incentive fee taken in Year 2)
Alternative 2
Assumptions
Year 1: $20 million investment made in Company A (“Investment A”), $30 million investment made in Company B (“Investment B”) and $25 million investment made in Company C (“Investment C”)
Year 2: Investment A sold for $50 million, FMV of Investment B determined to be $25 million and FMV of Investment C determined to be $25 million
Year 3: FMV of Investment B determined to be $27 million and Investment C sold for $30 million
Year 4: FMV of Investment B determined to be $35 million
Year 5: Investment B sold for $20 million
21
The capital gains incentive fee, if any, would be:
Year 1: None
Year 2: $5 million capital gains incentive fee — 20% multiplied by $25 million ($30 million realized capital gains on Investment A less unrealized capital depreciation on Investment B)
Year 3: $1.4 million capital gains incentive fee (1) — $6.4 million (20% multiplied by $32 million ($35 million cumulative realized capital gains less $3 million unrealized capital depreciation)) less $5 million capital gains incentive fee received in Year 2
Year 4: None
Year 5: None — $5 million (20% multiplied by $25 million (cumulative realized capital gains of $35 million less realized capital losses of $10 million)) less $6.4 million cumulative capital gains incentive fee paid in Year 2 and Year 3 (2)
*The hypothetical amounts of returns shown are based on a percentage of our total net assets and assume no leverage. There is no guarantee that positive returns will be realized, and actual returns may vary from those shown in this example.
(1)As illustrated in Year 3 of Alternative 1 above, if we were to be wound up on a date other than our fiscal year end of any year, we may have paid aggregate capital gains incentive fees that are more than the amount of such fees that would be payable if we had been wound up on the fiscal year end of such year.
(2)As noted above, it is possible that the cumulative aggregate capital gains fee received by our investment advisor ($6.4 million) is effectively greater than $5 million (20% of cumulative aggregate realized capital gains less net realized capital losses or net unrealized depreciation ($25 million)).
Payment of Our Expenses
All investment professionals of MC Advisors and/or its affiliates, when and to the extent engaged in providing investment advisory services to us, and the compensation and routine overhead expenses of personnel allocable to these services to us, are provided and paid for by MC Advisors and not by us. We bear all other out-of-pocket costs and expenses of our operations and transactions, including, without limitation:
•organization and offering;
•calculating our net asset value (including the cost and expenses of any independent valuation firm);
•fees and expenses incurred by MC Advisors payable to third parties, including agents, consultants or other advisors, in monitoring financial and legal affairs for us and in conducting research and due diligence on prospective investments and equity sponsors, analyzing investment opportunities, structuring our investment and monitoring our investments and portfolio companies on an ongoing basis (although none of MC Advisors’ duties will be subcontracted to sub-advisors);
•interest payable on debt, if any, incurred to finance our investments;
•offerings of our common stock and other securities;
•investment advisory fees;
•administration fees and expenses, if any, payable under the Administration Agreement (including payments under the Administration Agreement between us and MC Management based upon our allocable portion of MC Management’s overhead in performing its obligations under the Administration Agreement, including rent and the allocable portion of the cost of our chief financial officer and chief compliance officer, and their respective staffs);
•transfer agent, dividend agent and custodial fees and expenses;
•federal and state registration fees;
22
•all costs of registration and listing our shares on any securities exchange;
•federal, state and local taxes;
•independent directors’ fees and expenses;
•costs of preparing and filing reports or other documents required by the SEC or other regulators;
•costs of any reports, proxy statements or other notices to stockholders, including printing costs;
•fidelity bond, directors and officers/errors and omissions liability insurance, and any other insurance premiums;
•direct costs and expenses of administration, including printing, mailing, long distance telephone, copying, secretarial and other staff, independent auditors and outside legal costs;
•proxy voting expenses; and
•all other expenses incurred by us or MC Management in connection with administering our business.
Duration and Termination
Unless terminated earlier as described below, the Investment Advisory and Management Agreement will continue in effect from year to year if approved annually by our Board or by the affirmative vote of the holders of a majority of our outstanding voting securities, and, in either case, if also approved by a majority of our directors who are not “interested persons.” The Investment Advisory and Management Agreement automatically terminates in the event of its assignment, as defined in the 1940 Act, by MC Advisors and may be terminated by either party without penalty upon not less than 60 days’ written notice to the other. The holders of a majority of our outstanding voting securities may also terminate the Investment Advisory and Management Agreement without penalty. See “Risk Factors — Risks Relating to Our Business and Structure — We depend upon MC Advisors’ senior management for our success, and upon its access to the investment professionals of Monroe Capital and its affiliates” and “Risk Factors — Risks Relating to Our Business and Structure — MC Advisors can resign on 60 days’ notice, and we may not be able to find a suitable replacement within that time, resulting in a disruption in our operations that could adversely affect our financial condition, business and results of operations.”
Indemnification
The Investment Advisory and Management Agreement provides that, absent willful misfeasance, bad faith or gross negligence in the performance of its duties or by reason of the reckless disregard of its duties and obligations, MC Advisors and its affiliates’ respective officers, directors, members, managers, stockholders and employees are entitled to indemnification from us from and against any claims or liabilities, including reasonable legal fees and other expenses reasonably incurred, arising out of or in connection with our business and operations or any action taken or omitted on our behalf pursuant to authority granted by the Investment Advisory and Management Agreement, except where attributable to gross negligence, willful misconduct, bad faith or reckless disregard of such person’s duties under the Investment Advisory and Management Agreement.
Administration Agreement
Pursuant to an Administration Agreement, MC Management furnishes us with office facilities and equipment and provides us clerical, bookkeeping and record keeping and other administrative services at such facilities. Under the Administration Agreement, MC Management performs, or oversees the performance of, our required administrative services, which include, among other things, being responsible for the financial records that we are required to maintain and preparing reports to our stockholders and reports filed with the SEC. MC Management also assists us in determining and publishing our net asset value, oversees the preparation and filing of our tax returns, disseminates reports to our stockholders and generally oversees the payment of our expenses and the performance of administrative and professional services rendered to us by others. Under the Administration Agreement, MC Management also provides managerial assistance on our behalf to those portfolio companies that have accepted our offer to provide such assistance.
23
Payments under the Administration Agreement are equal to an amount based upon our allocable portion (subject to the review and approval of our Board) of MC Management’s overhead in performing its obligations under the Administration Agreement, including rent and our allocable portion of the cost of our officers, including our chief financial officer and chief compliance officer and their respective staffs. Unless terminated earlier as described below, the Administration Agreement will continue in effect from year to year with the approval of our Board. The Administration Agreement may be terminated by either party without penalty upon 60 days’ written notice to the other party.
MC Management may retain third parties to assist in providing administrative services to us. To the extent that MC Management outsources any of its functions, we pay the fees associated with such functions on a direct basis without profit to MC Management. We reimburse MC Management for the allocable portion (subject to the review and approval of our Board) of MC Management’s overhead and other expenses incurred by it in performing its obligations under the Administration Agreement, including rent, the fees and expenses associated with performing compliance functions, and our allocable portion of the cost of our chief financial officer and chief compliance officer and their respective staffs. For the years ended December 31, 2023, 2022 and 2021, we incurred $2.8 million, $3.1 million and $3.4 million in administrative expenses (included within Professional fees, Administrative service fees and General and administrative expenses on the consolidated statements of operations) under the Administration Agreement, respectively, of which $0.9 million, $1.2 million and $1.4 million, respectively, was related to MC Management overhead and salary allocation and paid directly to MC Management.
Indemnification
The Administration Agreement provides that, absent willful misfeasance, bad faith or gross negligence in the performance of its duties or by reason of the reckless disregard of its duties and obligations, MC Management and its affiliates’ respective officers, directors, members, managers, stockholders and employees are entitled to indemnification from us from and against any claims or liabilities, including reasonable legal fees and other expenses reasonably incurred, arising out of or in connection with our business and operations or any action taken or omitted on our behalf pursuant to authority granted by the Administration Agreement, except where attributable to gross negligence, willful misconduct, bad faith or reckless disregard of such person’s duties under the Administration Agreement.
License Agreement
We have entered into a license agreement with Monroe Capital under which Monroe Capital has agreed to grant us a non-exclusive, royalty-free license to use the name “Monroe Capital.” Under this agreement, we have a right to use the “Monroe Capital” name for so long as MC Advisors or one of its affiliates remains our investment advisor. Other than with respect to this limited license, we have no legal right to the “Monroe Capital” name. This license agreement will remain in effect for so long as the Investment Advisory and Management Agreement with MC Advisors is in effect.
Staffing Agreement
We do not have any internal employees. We depend on the diligence, skill and network of business contacts of the senior investment professionals of MC Advisors to achieve our investment objective. MC Advisors is an affiliate of Monroe Capital and depends upon access to the investment professionals and other resources of Monroe Capital and Monroe Capital’s affiliates to fulfill its obligations to us under the Investment Advisory and Management Agreement. MC Advisors also depends upon Monroe Capital to obtain access to deal flow generated by the professionals of Monroe Capital and its affiliates. Under the Staffing Agreement, MC Management provides MC Advisors with the resources necessary to fulfill these obligations. The Staffing Agreement provides that MC Management will make available to MC Advisors experienced investment professionals and access to the senior investment personnel of Monroe Capital for purposes of evaluating, negotiating, structuring, closing and monitoring our investments. The Staffing Agreement also includes a commitment that the members of MC Advisors’ investment committee serve in such capacity. The Staffing Agreement remains in effect until terminated and may be terminated by either party without penalty upon 60 days’ written notice to the other party. Services under the Staffing Agreement are provided to MC Advisors on a direct cost reimbursement basis, and such fees are not our obligation.
24
Board Approval of the Investment Advisory and Management Agreement and Staffing Agreement
At a meeting of our Board held on August 3, 2023, our Board, including directors who are not “interested persons” as defined in the 1940 Act, voted unanimously to approve and continue the Investment Advisory and Management Agreement for another annual period in accordance with the requirements of the 1940 Act. The approval included consideration and approval of the specific individuals provided through the Staffing Agreement between MC Advisors and MC Management that comprise our investment committee. In reaching a decision to approve and continue the Investment Advisory and Management Agreement and investment committee, the Board reviewed a significant amount of information and considered, among other things:
•Nature, Quality and Extent of Services. Our Board reviewed information about the services to be performed and the personnel performing such services under the Investment Advisory and Management Agreement and Staffing Agreement, including the specific approval of the members of the investment committee to be provided pursuant to the Staffing Agreement. Our Board considered the nature, extent and quality of the investment selection process employed by MC Advisors and the experience of the members of the investment committee. Our Board concluded that the services to be provided under the Investment Advisory and Management Agreement are consistent with those of comparable BDCs described in the available market data.
•The reasonableness of the fees paid to MC Advisors. Our Board considered comparative data based on publicly available information on other BDCs with respect to services rendered and the advisory fees (including the management fees and incentive fees) of other BDCs as well as our projected operating expenses and expense ratio compared to other BDCs. Our Board also considered the profitability of MC Advisors. Based upon its review, our Board concluded that the fees to be paid under the Investment Advisory and Management Agreement are reasonable compared to other BDCs.
•Investment Performance. Our Board reviewed our investment performance as well as comparative data with respect to the investment performance of other externally managed BDCs. Our Board concluded that MC Advisors was delivering results consistent with our investment objective over the most recently completed period.
•Economies of Scale. Our Board addressed the potential for MC Advisors to realize economies of scale in managing our assets, and determined that at this time they did not expect economies of scale to be realized by MC Advisors.
Based on the information reviewed and the discussions detailed above, our Board, including all of the directors who are not “interested persons” as defined in the 1940 Act, concluded that the investment advisory fee rates and terms are fair and reasonable in relation to the services provided and approved the Investment Advisory and Management Agreement and its continuation as being in the best interests of our stockholders. MC Advisors bears all expenses related to the services and personnel provided pursuant to the Staffing Agreement.
VALUATION PROCESS AND DETERMINATION OF NET ASSET VALUE
The net asset value per share of our outstanding shares of common stock is determined quarterly by dividing the value of total assets minus liabilities by the total number of shares outstanding. We calculate the value of our total assets in accordance with the following procedures.
For periods prior to September 30, 2022, the Board determined the fair value of our investments in good faith on a quarterly basis. On September 30, 2022, pursuant to SEC Rule 2a-5 under the 1940 Act, the Board designated MC Advisors as our valuation designee (the “Valuation Designee”). The Board is responsible for oversight of the Valuation Designee. The Valuation Designee has established a valuation committee to determine in good faith the fair value of our investments, based on input of the Valuation Designee’s management and personnel and independent valuation firms which are engaged at the direction of the valuation committee to assist in the valuation of certain portfolio investments lacking a readily available market quotation. The valuation committee determines fair values pursuant to a valuation policy approved by the Board and pursuant to a consistently applied valuation process.
25
Under the valuation policy, we value investments for which market quotations are readily available and within a recent date at such market quotations. When doing so, we determine whether the quote obtained is sufficient in accordance with generally accepted accounting principles in the United States of America to determine the fair value of the security. Debt and equity securities that are not publicly traded or whose market prices are not readily available or whose market prices are not regularly updated are valued at fair value as determined in good faith by the Valuation Designee. Because we expect that there will not be a readily available market for many of the investments in our portfolio, we expect to value many of our portfolio investments at fair value as determined in good faith by our Valuation Designee using a documented valuation policy and a consistently applied valuation process. Such determination of fair values may involve subjective judgments and estimates. Due to the inherent uncertainty of determining the fair value of investments that do not have a readily available market value, the fair value of our investments may differ significantly from the values that would have been used had a readily available market value existed for such investments, and the differences could be material. If we were required to liquidate a portfolio investment in a forced or liquidation sale, we could realize amounts that are different from the amounts presented and such differences could be material.
With respect to investments for which market quotations are not readily available, the Valuation Designee undertakes a multi-step valuation process each quarter, as described below:
•the quarterly valuation process begins with each portfolio company or investment being initially evaluated and rated by the investment professionals of the Valuation Designee responsible for the credit monitoring of the portfolio investment;
•our Valuation Designee engages an independent valuation firm to conduct independent appraisals of a selection of investments for which market quotations are not readily available. We will consult with an independent valuation firm relative to each portfolio company at least once in every calendar year, but the independent appraisals are generally received quarterly for each investment;
•to the extent an independent valuation firm is not engaged to conduct an investment appraisal on an investment for which market quotations are not readily available, the investment is valued by the Valuation Designee;
•preliminary valuation conclusions are then documented and discussed with the valuation committee of the Valuation Designee;
•the valuation conclusions are approved by the valuation committee of the Valuation Designee; and
•a report prepared by the Valuation Designee is presented to the Board quarterly to allow the Board to perform its oversight duties of the valuation process and the Valuation Designee.
The valuation technique utilized in the determination of fair value is affected by a wide variety of factors including the type of investment, whether the investment is new and not yet established in the marketplace, and other characteristics particular to the transaction. The Valuation Designee generally uses the income approach to determine fair value for loans where market quotations are not readily available, as long as it is appropriate. If there is deterioration in credit quality or a debt investment is in workout status, the Valuation Designee may consider other factors in determining the fair value, including the value attributable to the debt investment from the enterprise value of the portfolio company or the proceeds that would be received in a liquidation analysis. This liquidation analysis may also include probability weighting of alternative outcomes. The Valuation Designee generally considers our debt to be performing if the borrower is not in default, the borrower is remitting payments in a timely manner, the loan is in covenant compliance and the loan is otherwise not deemed to be impaired. In determining the fair value of the performing debt, the Valuation Designee considers fluctuations in current interest rates, the trends in yields of debt instruments with similar credit ratings, financial condition of the borrower, economic conditions and other relevant factors, both qualitative and quantitative. In the event that a debt instrument is not performing, as defined above, the Valuation Designee will evaluate the value of the collateral utilizing the same framework described above for a performing loan to determine the value of the debt instrument. See Note 4 to the accompanying consolidated financial statements for additional information on the determination of fair value.
We report our investments at fair value with changes in value reported through our consolidated statements of operations under the caption “unrealized gain (loss).” In determining fair value, we are required to assume that portfolio investments are to be sold in the principal market to market participants, or in the absence of a principal market, the most advantageous market, which may be a hypothetical market. Market participants are defined as buyers and sellers in the principal or most advantageous market that are independent, knowledgeable, and willing and able to transact. The market in which we can exit portfolio investments with the greatest volume and level activity is considered our principal market.
26
Determination of fair value involves subjective judgments and estimates. Accordingly, the notes to our consolidated financial statements express the uncertainty with respect to the possible effect of such valuations, and any change in such valuations, on our consolidated financial statements.
COMPETITION
We compete with a number of specialty and commercial finance companies to make the types of investments that we make in middle-market companies, including other BDCs, traditional commercial banks, private investment funds, regional banking institutions, small business investment companies, investment banks and insurance companies. Additionally, with increased competition for investment opportunities, alternative investment vehicles such as hedge funds may invest in areas they have not traditionally invested in or from which they had withdrawn during the recent economic downturn, including investing in middle-market companies. As a result, competition for investments in lower middle-market companies has intensified, and we expect that trend to continue. Many of our existing and potential competitors are substantially larger and have considerably greater financial, technical and marketing resources than we do. For example, some competitors may have a lower cost of funds and access to funding sources that are not available to us. In addition, some of our competitors may have higher risk tolerances or different risk assessments, which could allow them to consider a wider variety of investments and establish more relationships than us.
We use the expertise of the investment professionals of MC Advisors to assess investment risks and determine appropriate pricing and terms for investments in our loan portfolio. In addition, we expect that the relationships of the senior professionals of MC Advisors will enable us to learn about, and compete effectively for, investment opportunities with attractive middle-market companies, independently or in conjunction with the private equity clients of MC Advisors. For additional information concerning the competitive risks we face, see “Risk Factors — Risks Relating to Our Business and Structure — We operate in a highly competitive market for investment opportunities, which could reduce returns and result in losses.”
INFORMATION TECHNOLOGY
We utilize a number of industry standard practices and software packages to secure, protect, manage and back up all corporate data. We outsource portions of our information technology function to efficiently monitor and maintain our systems. Also, we conduct a daily backup of our systems to ensure the security and stability of the network.
ELECTION TO BE TAXED AS A RIC
As a BDC, we have elected to be treated as a RIC under Subchapter M of the Code. As a RIC, we generally do not have to pay corporate-level U.S. federal income taxes on any ordinary income or capital gains that we timely distribute to our stockholders as dividends. To continue to qualify as a RIC, we must, among other things, meet certain source-of income and asset diversification requirements (as described below). In addition, we must distribute to our stockholders, for each taxable year, at least 90% of our “investment company taxable income,” which is generally our net ordinary income plus the excess of realized net short-term capital gains over realized net long-term capital losses (the “Annual Distribution Requirement”). Generally, we would expect these distributions to be taxable to our stockholders as ordinary income and not to be eligible for the reduced maximum tax rates associated with qualified dividends.
TAXATION AS A RIC
If we continue to:
•qualify as a RIC; and
•satisfy the Annual Distribution Requirement;
then we will not be subject to U.S. federal income tax on the portion of our investment company taxable income and net capital gains, defined as net long-term capital gains in excess of net short-term capital losses we distribute to our stockholders.
We will be subject to U.S. federal income tax at the regular corporate rates on any net income or net capital gain not distributed (or deemed distributed) to our stockholders.
27
We will be subject to a 4% nondeductible federal excise tax on our undistributed income unless we distribute in a timely manner an amount at least equal to the sum of (a) 98% of our ordinary income for each calendar year, (b) 98.2% of our capital gain net income (both long-term and short-term) for the one-year period ending October 31 in that calendar year and (c) any income realized, but not distributed, in the preceding years (the “Excise Tax Avoidance Requirement”). For this purpose, however, any ordinary income or capital gain net income retained by us that is subject to corporate income tax for the tax year ending in that calendar year will be considered to have been distributed by year end. For the years ended December 31, 2023, 2022 and 2021, we recorded $0.5 million, $0.1 million and $0.3 million on our consolidated statements of operations for U.S. federal excise taxes.
In order to qualify as a RIC for U.S. federal income tax purposes, we must, among other things:
•meet the Annual Distribution Requirement;
•qualify to be treated as a BDC under the 1940 Act at all times during each taxable year;
•derive in each taxable year at least 90% of our gross income from dividends, interest, payments with respect to certain securities loans, gains from the sale of stock or other securities, or other income derived with respect to our business of investing in such stock or securities, and net income derived from interests in “qualified publicly traded partnerships” (partnerships that are traded on an established securities market or tradable on a secondary market, other than partnerships that derive 90% of their income from interest, dividends and other permitted RIC income) (the “90% Income Test”); and
•diversify our holdings so that at the end of each quarter of the taxable year:
•at least 50% of the value of our assets consists of cash, cash equivalents, U.S. government securities, securities of other RICs, and other securities if such other securities of any one issuer do not represent more than 5% of the value of our assets or more than 10% of the outstanding voting securities of the issuer (which for these purposes includes the equity securities of a “qualified publicly traded partnership”); and
•no more than 25% of the value of our assets is invested in the securities, other than U.S. government securities or securities of other RICs, of one issuer or of two or more issuers that are controlled, as determined under applicable tax rules, by us and that are engaged in the same or similar or related trades or businesses or in the securities of one or more qualified publicly traded partnerships (the “Diversification Tests”).
To the extent that we invest in entities treated as partnerships for U.S. federal income tax purposes (other than a “qualified publicly traded partnership”), we generally must include the items of gross income derived by the partnerships for purposes of the 90% Income Test, and the income that is derived from a partnership (other than a “qualified publicly traded partnership”) will be treated as qualifying income for purposes of the 90% Income Test only to the extent that such income is attributable to items of income of the partnership which would be qualifying income if realized by us directly. In addition, we generally must take into account our proportionate share of the assets held by partnerships (other than a “qualified publicly traded partnership”) in which we are a partner for purposes of the Diversification Tests.
In order to prevent our receipt of income that would not satisfy the 90% Income Test, we have established and may establish additional special purpose corporations to hold assets from which we do not anticipate earning dividend, interest or other qualifying income under the 90% Income Test. Any investments held through a special purpose corporation would generally be subject to U.S. federal income taxes and other taxes, and therefore would be expected to achieve a reduced after-tax yield.
We may be required to recognize taxable income in circumstances in which we do not receive a corresponding payment in cash. For example, for debt obligations that are treated under applicable tax rules as having original issue discount (such as debt instruments with PIK interest or, in certain cases, increasing interest rates or issued with warrants), we must include in income each year a portion of the original issue discount that accrues over the life of the obligation, regardless of whether cash representing such income is received by us in the same taxable year. We may also have to include in our income other amounts that we have not yet received in cash, such as deferred loan origination fees that are paid after origination of the loan or are paid in non-cash compensation such as warrants or stock. We anticipate that a portion of our income will continue to constitute original issue discount or other income required to be included in taxable income prior to receipt of cash.
28
Because any original issue discount or other amounts accrued are included in our investment company taxable income in the year of the accrual, we may be required to make a distribution to our stockholders in order to satisfy the Annual Distribution Requirement, even though we will not have received the corresponding cash amount. As a result, we may have difficulty meeting the Annual Distribution Requirement. We may have to sell some of our investments at times and/or at prices we do not consider advantageous, raise additional debt or equity capital or forgo new investment opportunities for this purpose. If we are not able to obtain cash from other sources, we may fail to qualify for RIC tax treatment and thus become subject to corporate-level U.S. federal income tax.
Gain or loss realized from warrants as well as any loss attributable to the lapse of such warrants generally will be treated as capital gain or loss. Such gain or loss generally will be long-term or short-term, depending on how long we held a particular warrant.
Our investments in non-U.S. securities may be subject to non-U.S. income, withholding and other taxes. In that case, our yield on those securities would be decreased. Stockholders will generally not be entitled to claim a credit or deduction with respect to non-U.S. taxes paid by us.
If we purchase shares in a “passive foreign investment company” (a “PFIC”), we may be subject to U.S. federal income tax on a portion of any “excess distribution” or gain from the disposition of such shares even if such income is distributed as a taxable dividend by us to our stockholders. Additional charges in the nature of interest may be imposed on us in respect of deferred taxes arising from such distributions or gains. If we invest in a PFIC and elect to treat the PFIC as a “qualified electing fund” (a “QEF”), under the Code, in lieu of the foregoing requirements, we will be required to include in income each year a portion of the ordinary earnings and net capital gain of the QEF, even if such income is not distributed to us. Alternatively, we can elect to mark-to-market at the end of each taxable year our shares in a PFIC; in that case, we will recognize as ordinary income any increase in the value of such shares and as ordinary loss any decrease in such value to the extent it does not exceed prior increases included in income. Under either election, we may be required to recognize in a year income in excess of our distributions from PFICs and our proceeds from dispositions of PFIC stock during that year, and such income will be taken into account for purposes of the Annual Distribution Requirement and the 4% federal excise tax.
Under Section 988 of the Code, gain or loss attributable to fluctuations in exchange rates between the time we accrue income, expenses, or other liabilities denominated in a foreign currency and the time we actually collect such income or pay such expenses or liabilities is generally treated as ordinary income or loss. Similarly, gain or loss on foreign currency forward contracts and the disposition of debt denominated in a foreign currency, to the extent attributable to fluctuations in exchange rates between the acquisition and disposition dates, are also treated as ordinary income or loss.
Through our use of leverage, we are subject to certain financial covenants that could limit our ability to make distributions to our stockholders. In addition, under the 1940 Act, we are not permitted to make distributions to our stockholders while our debt obligations and other senior securities are outstanding unless certain “asset coverage” tests are met. If we are unable to make sufficient distributions to satisfy the Annual Distribution Requirement, we may fail to qualify as a RIC.
Although we do not expect to do so, we are authorized (subject to our financial covenants and 1940 Act asset coverage tests) to borrow funds and to sell assets in order to satisfy the Annual Distribution Requirement and to eliminate or minimize our liability for U.S. federal income tax and the 4% federal excise tax. However, our ability to dispose of assets to make distributions may be limited by (1) the illiquid nature of our portfolio and/or (2) other requirements relating to our status as a RIC, including the Diversification Tests. If we dispose of assets in order to meet the Annual Distribution Requirement or to avoid the 4% federal excise tax, we may make such dispositions at times that, from an investment standpoint, are not advantageous.
If we fail to satisfy the Annual Distribution Requirement or otherwise fail to qualify as a RIC in any taxable year, and certain relief provisions are not available, we will be subject to tax in that year on all of our taxable income, regardless of whether we make any distributions to our stockholders. In that case, all of such income will be subject to corporate-level U.S. federal income tax, reducing the amount available to be distributed to our stockholders. See “Failure to Qualify as a RIC” below for more information.
As a RIC, we are not allowed to carry forward or carry back a net operating loss for purposes of computing our investment company taxable income in other taxable years. We generally are permitted to carry forward for an indefinite period any capital losses not used to offset capital gains. However, future transactions that we engage in may cause our ability to use any capital loss carry forwards, and unrealized losses once realized, to be limited under Section 382 of the Code.
29
Certain of our investment practices may be subject to special and complex U.S. federal income tax provisions that may, among other things: (i) disallow, suspend or otherwise limit the allowance of certain losses or deductions; (ii) convert lower taxed long-term capital gain and qualified dividend income into higher taxed short-term capital gain or ordinary income; (iii) convert an ordinary loss or a deduction into a capital loss (the deductibility of which is more limited); (iv) cause us to recognize income or gain without a corresponding receipt of cash; (v) adversely affect the time as to when a purchase or sale of stock or securities is deemed to occur; (vi) adversely alter the characterization of certain complex financial transactions; and (vii) produce income that will not be qualifying income for purposes of the 90% Income Test described above. We will monitor our transactions and may make certain tax decisions in order to mitigate the potential adverse effects of these provisions.
As described above, to the extent that we invest in equity securities of entities that are treated as partnerships for U.S. federal income tax purposes, the effect of such investments for purposes of the 90% Income Test and the Diversification Tests will depend on whether or not the partnership is a “qualified publicly traded partnership” (as defined in the Code). If the partnership is a “qualified publicly traded partnership,” the net income derived from such investments will be qualifying income for purposes of the 90% Income Test and will be “securities” for purposes of the Diversification Tests. If the partnership, however, is not treated as a “qualified publicly traded partnership,” then the consequences of an investment in the partnership will depend upon the amount and type of income and assets of the partnership allocable to us. The income derived from such investments may not be qualifying income for purposes of the 90% Income Test and, therefore, could adversely affect our qualification as a RIC. We intend to monitor our investments in equity securities of entities that are treated as partnerships for U.S. federal income tax purposes to prevent our disqualification as a RIC.
FAILURE TO QUALIFY AS A RIC
If we fail the 90% Income Test or the Diversification Tests for any taxable year or quarter of such taxable year, we may nevertheless continue to qualify as a RIC for such year if certain relief provisions of the Code apply (which, among other things may require us to pay certain corporate-level federal taxes or to dispose of certain assets). If we are unable to qualify for treatment as a RIC and are unable to cure the failure, we would be subject to U.S. federal income tax on all of our taxable income at regular corporate rates. We would not be able to deduct distributions to our stockholders, nor would they be required to be made. In the event of such a failure to qualify, distributions, including distributions of net long-term capital gain, would generally be taxable to our stockholders as ordinary dividend income to the extent of our current and accumulated earnings and profits. Subject to certain limitations under the Code, our corporate stockholders would be eligible to claim a dividend received deduction with respect to such dividend; our non-corporate stockholders would generally be able to treat such dividends as “qualified dividend income,” which is subject to reduced rates of U.S. federal income tax. Distributions in excess of our current and accumulated earnings and profits would be treated first as a return of capital to the extent of the stockholder’s tax basis, and any remaining distributions would be treated as a capital gain. In order to qualify as a RIC, in addition to the other requirements discussed above, we would be required to distribute all of our previously undistributed earnings and profits attributable to any period prior to us becoming a RIC by the end of the first year that we intend to qualify as a RIC. To the extent that we have any net built-in gains in our assets (i.e., the excess of the aggregate gains, including items of income, over aggregate losses that would have been realized with respect to such assets if we had been liquidated) as of the beginning of the first year that we qualify as a RIC, we would be subject to a corporate-level U.S. federal income tax on such built-in gains if and when recognized over the next ten years (or shorter applicable period). Alternatively, we may choose to recognize such built-in gains immediately prior to our qualification as a RIC.
If we have previously qualified as a RIC, but are subsequently unable to qualify for treatment as a RIC, and certain amelioration provisions are not applicable, we would be subject to tax on all of our taxable income (including our net capital gains) at regular corporate rates. We would not be able to deduct distributions to our stockholders, nor would they be required to be made. Distributions, including distributions of net long-term capital gain, would generally be taxable to our stockholders as ordinary dividend income to the extent of our current and accumulated earnings and profits. Subject to certain limitations under the Code, our corporate stockholders would be eligible to claim a dividend received deduction with respect to such dividend; our non-corporate stockholders would generally be able to treat such dividends as “qualified dividend income,” which is subject to reduced rates of U.S. federal income tax. Distributions in excess of our current and accumulated earnings and profits would be treated first as a return of capital to the extent of the stockholder’s tax basis, and any remaining distributions would be treated as a capital gain. In order to requalify as a RIC, in addition to the other requirements discussed above, we would be required to distribute all of our previously undistributed earnings attributable to the period we failed to qualify as a RIC by the end of the first year that we intend to requalify as a RIC. If we fail to requalify as a RIC for a period greater than two taxable years, we may be subject to regular corporate tax on any net built-in gains with respect to certain of our assets (i.e., the excess of the aggregate gains, including items of income, over aggregate losses that would have been realized with respect to such assets if we had been liquidated) that we elect to recognize on requalification or when recognized over the next five years.
30
REGULATION
We are a BDC under the 1940 Act and have elected to be treated as a RIC under the Code. The 1940 Act contains prohibitions and restrictions relating to transactions between BDCs and their affiliates (including any investment advisors), principal underwriters and affiliates of those affiliates or underwriters and requires that a majority of the directors of a BDC be persons other than “interested persons,” as that term is defined in the 1940 Act. In addition, the 1940 Act provides that we may not change the nature of our business so as to cease to be, or to withdraw our election as, a BDC unless approved by a majority of our outstanding voting securities.
We may invest up to 100% of our assets in securities acquired directly from issuers in privately negotiated transactions. With respect to such securities, we may, for the purpose of public resale, be deemed an “underwriter” as that term is defined in the Securities Act. Our intention is to not write (sell) or buy put or call options to manage risks associated with the publicly traded securities of our portfolio companies, except that we may enter into hedging transactions to manage the risks associated with interest rate fluctuations. However, we may purchase or otherwise receive warrants to purchase the common stock of our portfolio companies in connection with acquisition financing or other investments. Similarly, in connection with an acquisition, we may acquire rights to require the issuers of acquired securities or their affiliates to repurchase them under certain circumstances.
We also do not intend to acquire securities issued by any investment company that exceed the limits imposed by the 1940 Act without obtaining exemptive relief and complying with certain conditions under the 1940 Act. With regard to that portion of our portfolio invested in securities issued by investment companies, it should be noted that such investments might subject our stockholders to additional expenses. None of these policies are fundamental and may be changed to the extent permitted by law without stockholder approval.
The SBIC license allowed our subsidiary, MRCC SBIC, to obtain leverage by issuing SBA debentures, subject to the issuance of a leverage commitment by the SBA and other customary procedures. On March 1, 2022, MRCC SBIC fully repaid its outstanding SBA debentures and notified the SBA of its intent to surrender its license to operate as a SBIC. MRCC SBIC received approval from the SBA to surrender its SBIC license and on March 31, 2022, MRCC SBIC was dissolved. See “SBA Debentures” below for more information. Prior to surrendering its license, MRCC SBIC was subject to regulation and oversight by the SBA, including requirements with respect to maintaining certain minimum financial ratios and other covenants and limitations on its ability to make distributions to us.
On October 2, 2014, we received exemptive relief from the SEC which permitted us to exclude the debt of MRCC SBIC guaranteed by the SBA from the asset coverage test under the 1940 Act. The exemptive relief provided us with increased flexibility under the asset coverage test by permitting us to borrow, through MRCC SBIC, more than we would otherwise be able to absent the receipt of this exemptive relief. This provided us with increased investment flexibility but also increased our risks related to leverage. For a discussion of the risks associated with leverage, see “Risk Factors — Risks Relating to Our Business and Structure — Regulations governing our operation as a BDC affect our ability to and the way in which we raise additional capital” and “Risk Factors — Risks Relating to Our Business and Structure — We maintain a revolving credit facility and use other borrowed funds to make investments or fund our business operations, which exposes us to risks typically associated with leverage and increases the risk of investing in us.”
QUALIFYING ASSETS
Under the 1940 Act, a BDC may not acquire any asset other than assets of the type listed in Section 55(a) of the 1940 Act, which are referred to as “qualifying assets,” unless, at the time the acquisition is made, qualifying assets represent at least 70% of the company’s total assets. The principal categories of qualifying assets relevant to our business are the following:
(a)Securities purchased in transactions not involving any public offering from the issuer of such securities, which issuer (subject to certain limited exceptions) is an eligible portfolio company, or from any person who is, or has been during the preceding 13 months, an affiliated person of an eligible portfolio company, or from any other person, subject to such rules as may be prescribed by the SEC. An eligible portfolio company is defined in the 1940 Act as any issuer that:
•is organized under the laws of, and has its principal place of business in, the United States;
•is not an investment company (other than a small business investment company wholly-owned by the BDC) or a company that would be an investment company but for certain exclusions under the 1940 Act; and
31
•satisfies either of the following:
•does not have any class of securities listed on a national securities exchange or has any class of securities listed on a national securities exchange subject to a $250 million market capitalization maximum; or
•is controlled by a BDC or a group of companies including a BDC, and such BDC actually exercises a controlling influence over the management or policies of the eligible portfolio company, and, as a result, the BDC has an affiliated person who is a director of the eligible portfolio company.
(b)Securities of any eligible portfolio company which we control.
(c)Securities purchased in a private transaction from a U.S. issuer that is not an investment company or from an affiliated person of the issuer, or in transactions incident to such a private transaction, if the issuer is in bankruptcy and subject to reorganization, or, if the issuer, immediately prior to the purchase of its securities, was unable to meet its obligations as they came due without material assistance other than conventional lending or financing arrangements.
(d)Securities of an eligible portfolio company purchased from any person in a private transaction if there is no ready market for such securities and we already own 60% of the outstanding equity securities of the eligible portfolio company.
(e)Securities received in exchange for or distributed on or with respect to securities described above, or pursuant to the exercise of warrants or rights relating to such securities.
(f)Cash, cash equivalents, U.S. government securities or high-quality debt securities that mature in one year or less from the date of investment.
The regulations defining qualifying assets may change over time. We may adjust our investment focus as needed to comply with and/or take advantage of any regulatory, legislative, administrative or judicial actions in this area. Investments in the securities of companies domiciled in or with their principal places of business outside of the United States, are not qualifying assets. In accordance with Section 55(a) of the 1940 Act, we cannot invest more than 30% of our assets in non-qualifying assets.
MANAGERIAL ASSISTANCE TO PORTFOLIO COMPANIES
A BDC must have been organized and have its principal place of business in the United States and must be operated for the purpose of making investments in the types of securities described above. However, in order for portfolio securities to qualify as qualifying assets for the purpose of the 70% test, a BDC must either control the issuer of securities or must offer to make available to the issuer of the securities significant managerial assistance. However, when a BDC purchases securities in conjunction with one or more other persons acting together, one of the other persons in the group may make available such managerial assistance. Making available managerial assistance means, among other things, any arrangement whereby the BDC, through its directors, officers, employees or agents offers to provide, and, if accepted, does so provide, significant guidance and counsel concerning the management, operations or business objectives and policies of a portfolio company through monitoring of portfolio company operations, selective participation in board and management meetings, consulting with and advising a portfolio company’s officers or other organizational or financial guidance. MC Advisors or its affiliates provide such managerial assistance on our behalf to portfolio companies that request this assistance.
32
TEMPORARY INVESTMENTS
Pending investments in other types of qualifying assets, as described above, our investments may consist of cash, cash equivalents, U.S. government securities and high-quality debt investments that mature in one year or less from the date of investment, which we refer to, collectively, as temporary investments, so that 70% of our assets are qualifying assets or temporary investments. We may invest in U.S. Treasury bills or in repurchase agreements, so long as the agreements are fully collateralized by cash or securities issued by the U.S. government or its agencies. A repurchase agreement involves the purchase by an investor, such as us, of a specified security and the simultaneous agreement by the seller to repurchase it at an agreed-upon future date and at a price that is greater than the purchase price by an amount that reflects an agreed-upon interest rate. There is no percentage restriction on the proportion of our assets that may be invested in such repurchase agreements. However, if more than 25% of our total assets constitute repurchase agreements from a single counterparty, we would not meet the Diversification Tests in order to qualify as a RIC for U.S. federal income tax purposes. Accordingly, we do not intend to enter into repurchase agreements with a single counterparty in excess of this limit. MC Advisors monitors the creditworthiness of the counterparties with which we enter into repurchase agreement transactions.
SENIOR SECURITIES
We are generally permitted, under specified conditions, to issue multiple classes of indebtedness and one class of stock senior to our common stock if our asset coverage, as defined in the 1940 Act, is at least equal to 150% immediately after each such issuance. In addition, while any senior securities remain outstanding, we must make provisions to prohibit any distribution to our stockholders or the repurchase of such securities or shares unless we meet the applicable asset coverage ratios at the time of the distribution or repurchase. We may also borrow amounts up to 5% of the value of our total assets for temporary or emergency purposes without regard to asset coverage. We consolidate our financial results with all of our wholly-owned subsidiaries, including MRCC SBIC prior to its dissolution, for financial reporting purposes and measure our compliance with the leverage test applicable to BDCs under the 1940 Act on a consolidated basis. On October 2, 2014, we received exemptive relief from the SEC which permitted us to exclude the debt of our SBIC subsidiaries from our asset coverage test under the 1940 Act. This provides us with increased investment flexibility but also increases our risks related to leverage. For a discussion of the risks associated with leverage, see “Risk Factors — Risks Relating to Our Business and Structure — Regulations governing our operation as a BDC affect our ability to and the way in which we raise additional capital” and “Risk Factors — Risks Relating to Our Business and Structure — We maintain a revolving credit facility and use other borrowed funds to make investments or fund our business operations, which exposes us to risks typically associated with leverage and increases the risk of investing in us.”
CODES OF ETHICS
We and MC Advisors have each adopted a code of ethics pursuant to Rule 17j-1 under the 1940 Act that establishes procedures for personal investments and restricts certain personal securities transactions. Personnel subject to each code may invest in securities for their personal investment accounts, including securities that may be purchased or held by us, so long as such investments are made in accordance with the code’s requirements. You may access our code of ethics on our website at www.monroebdc.com. The date and substance of amendments to the code, if any, are noted on the cover page of the code of ethics. In addition, each code of ethics is attached as an exhibit to our registration statement and is available on the EDGAR Database on the SEC’s website at www.sec.gov. You may also obtain copies of each code of ethics, after paying a duplicating fee, by electronic request at the following e-mail address: publicinfo@sec.gov.
PROXY VOTING POLICIES AND PROCEDURES
We have delegated our proxy voting responsibility to MC Advisors. The proxy voting policies and procedures of MC Advisors are set out below. The guidelines are reviewed periodically by MC Advisors and our directors who are not “interested persons,” and, accordingly, are subject to change. For purposes of these proxy voting policies and procedures described below, “we,” “our” and “us” refer to MC Advisors.
Introduction
As an investment advisor registered under the Advisers Act, we have a fiduciary duty to act solely in the best interests of our clients. As part of this duty, we recognize that we must vote client securities in a timely manner free of conflicts of interest and in the best interests of our clients.
These policies and procedures for voting proxies for our investment advisory clients are intended to comply with Section 206 of, and Rule 206(4)-6 under, the Advisers Act.
33
Proxy Policies
We vote proxies relating to our portfolio securities in what we perceive to be the best interest of our clients’ stockholders. We review on a case-by-case basis each proposal submitted to a stockholder vote to determine its effect on the portfolio securities held by our clients. In most cases we will vote in favor of proposals that we believe are likely to increase the value of the portfolio securities held by our clients. Although we will generally vote against proposals that may have a negative effect on our clients’ portfolio securities, we may vote for such a proposal if there exist compelling long-term reasons to do so.
Our proxy voting decisions are made by those senior officers who are responsible for monitoring each of our clients’ investments. To ensure that our vote is not the product of a conflict of interest, we require that (a) anyone involved in the decision-making process disclose to our chief compliance officer any potential conflict that he or she is aware of and any contact that he or she has had with any interested party regarding a proxy vote and (b) employees involved in the decision making process or vote administration are prohibited from revealing how we intend to vote on a proposal in order to reduce any attempted influence from interested parties. Where conflicts of interest may be present, we will disclose such conflicts to our client, including those directors who are not interested persons and we may request guidance from such persons on how to vote such proxies for their account.
Proxy Voting Records
You may obtain information about how we voted proxies for the Company by making a written request for proxy voting information to: Monroe Capital Corporation, 311 South Wacker Drive, Suite 6400, Chicago, Illinois 60606, Attention: Chief Compliance Officer, or by calling Monroe Capital Corporation at (312) 258-8300. The SEC also maintains a website at www.sec.gov that contains such information.
COMPLIANCE POLICIES AND PROCEDURES
We and MC Advisors have adopted and implemented written policies and procedures reasonably designed to prevent violation of federal securities laws and are required to review these compliance policies and procedures annually for their adequacy and the effectiveness of their implementation. Our chief compliance officer is responsible for administering these policies and procedures.
PRIVACY PRINCIPLES
We are committed to maintaining the privacy of our stockholders and to safeguarding their nonpublic personal information. The following information is provided to help you understand what personal information we collect, how we protect that information and why, in certain cases, we may share information with select other parties.
Generally, we do not receive any nonpublic personal information relating to our stockholders, although certain nonpublic personal information of our stockholders may become available to us. We do not disclose any nonpublic personal information about our stockholders or former stockholders to anyone, except as permitted by law or as is necessary in order to service stockholder accounts (for example, to a transfer agent or third-party administrator).
We restrict access to nonpublic personal information about our stockholders to employees of MC Management and its affiliates with a legitimate business need for the information. We maintain physical, electronic and procedural safeguards designed to protect the nonpublic personal information of our stockholders.
OTHER
We are required to provide and maintain a bond issued by a reputable fidelity insurance company to protect us against larceny and embezzlement. Furthermore, as a BDC, we are prohibited from protecting any director or officer against any liability to the Company or our stockholders arising from willful misfeasance, bad faith, gross negligence or reckless disregard of the duties involved in the conduct of such person’s office.
We and MC Advisors are each required to adopt and implement written policies and procedures reasonably designed to prevent violation of relevant federal securities laws, obtain approval of the Board of these policies and procedures, review these policies and procedures annually for their adequacy and the effectiveness of their implementation and designate a chief compliance officer to be responsible for administering the policies and procedures.
34
We may also be prohibited under the 1940 Act from knowingly participating in certain transactions with our affiliates without the prior approval of our Board who are not interested persons and, in some cases, prior approval by the SEC. The SEC has interpreted the BDC prohibition on transactions with affiliates to prohibit “joint transactions” among entities that share a common investment advisor. The staff of the SEC has granted no-action relief permitting purchases of a single class of privately placed securities provided that the advisor negotiates no term other than price and certain other conditions are met. Any co-investment would be made subject to compliance with existing regulatory guidance, applicable regulations and our allocation procedures. If opportunities arise that would otherwise be appropriate for us and for another fund advised by MC Advisors to invest in different securities of the same issuer, MC Advisors will need to decide which fund will proceed with the investment. Moreover, except in certain circumstances, we are unable to invest in any issuer in which another fund advised by MC Advisors has previously invested.
On October 15, 2014, as amended on January 10, 2023, we, along with MC Advisors and certain other funds and accounts sponsored or managed by MC Advisors and its affiliates, received exemptive relief from the SEC (the "Order") that permits us greater flexibility to negotiate the terms of co-investments if our Board determines that it would be advantageous for us to co-invest with other accounts sponsored or managed by MC Advisors or its affiliates in a manner consistent with our investment objectives, positions, policies, strategies and restrictions as well as regulatory requirements and other pertinent factors.
POLICIES AND PROCEDURES FOR MANAGING CONFLICTS
As of December 31, 2023, affiliates of MC Advisors manage other assets in 13 closed-end funds, two small business investment companies, 25 private funds that also have an investment strategy focused primarily on senior, unitranche and junior secured debt and to a lesser extent, unsecured subordinated debt to lower middle-market companies and one BDC which focuses on similar investment types, but which may be backed by venture capital. In addition, MC Advisors manages a private BDC, Monroe Capital Income Plus Corporation, and it may manage other entities in the future with an investment focus similar to ours. To the extent that we compete with entities managed by MC Advisors or any of its affiliates for a particular investment opportunity, MC Advisors will allocate investment opportunities across the entities for which such opportunities are appropriate, consistent with (a) its internal conflict of interest and allocation policies, (b) the requirements of the Advisers Act and (c) certain restrictions under the 1940 Act and rules thereunder regarding co-investments with affiliates. MC Advisors’ allocation policies are intended to ensure that we may generally share equitably with other investment funds or other investment vehicles managed by MC Advisors or its affiliates in investment opportunities, particularly those involving a security with limited supply or involving differing classes of securities of the same issuer which may be suitable for us and such other investment funds or other investment vehicles.
MC Advisors and/or its affiliates may in the future sponsor or manage investment funds, accounts, or other investment vehicles with similar or overlapping investment strategies and have put in place a conflict-resolution policy that addresses the co-investment restrictions set forth under the 1940 Act. MC Advisors will seek to ensure an equitable allocation of investment opportunities when we are able to invest alongside other accounts managed by MC Advisors and its affiliates. The Order received by MC Advisors and affiliates from the SEC permits greater flexibility relating to co-investments, subject to certain conditions. Under this allocation policy, a fixed percentage of each opportunity, which may vary based on asset class and from time to time, will be offered to us and similar eligible accounts, as periodically determined by MC Advisors and approved by our Board, including a majority of our independent directors. The allocation policy provides that allocations among us and other accounts will generally be made pro rata based on each account’s capital available for investment, as determined, in our case, by our Board, including a majority of our independent directors. It is our policy to base our determinations as to the amount of capital available for investment on such factors as the amount of cash on hand, existing commitments and reserves, if any, the targeted leverage level, the targeted asset mix and diversification requirements and other investment policies and restrictions set by our Board, or imposed by applicable laws, rules, regulations or interpretations. We expect that these determinations will be made similarly for other accounts. In situations where co-investment with other entities sponsored or managed by MC Advisors or its affiliates is not permitted or appropriate, such as when there is an opportunity to invest in different securities of the same issuer, MC Advisors will need to decide whether we or such other entity or entities will proceed with the investment. MC Advisors will make these determinations based on its policies and procedures which will generally require that such opportunities be offered to eligible accounts on a basis that is fair and equitable over time.
35
AVAILABLE INFORMATION
We intend to make this Annual Report on Form 10-K, as well as our Quarterly Reports on Form 10-Q, our Current Reports on Form 8-K and, if applicable, amendments to those reports filed or furnished pursuant to Section 13(a) of the Exchange Act, publicly available free of charge as soon as reasonably practicable following our filing of such reports with the SEC. We maintain a website at www.monroebdc.com and make all of our annual, quarterly and current reports, proxy statements and other publicly filed information available, free of charge, on or through our website. Information contained on our website is not incorporated into this report, and you should not consider information on our website to be part of this report. You may also obtain such information by contacting us in writing at 311 South Wacker Drive, Suite 6400, Chicago, Illinois 60606, Attention: Investor Relations. The SEC maintains a website that contains reports, proxy and information statements and other information we file with the SEC at www.sec.gov.
ITEM 1A. RISK FACTORS
Investing in our securities involves a number of significant risks. The risks set out below are not the only risks we face. Additional risks and uncertainties not presently known to us or not presently deemed material by us may also impair our operations and performance. If any of the following events occurs, our business, financial condition and results of operations could be materially and adversely affected. In such case, our net asset value and the trading price of our securities could decline, and you may lose all or part of your investment. In addition, there will be occasions when MC Advisors and its affiliates may encounter potential conflicts of interest in connection with the Company.
Risks Relating to Our Business and Structure
We depend upon MC Advisors’ senior management for our success, and upon its access to the investment professionals of Monroe Capital and its affiliates.
We do not have any internal management capacity or employees. We depend on the investment expertise, skill and network of business contacts of the senior investment professionals of MC Advisors, who evaluate, negotiate, structure, execute, monitor and service our investments in accordance with the terms of the Investment Advisory and Management Agreement. Our success depends to a significant extent on the continued service and coordination of the senior investment professionals of MC Advisors, particularly Messrs. Koenig, Solimene Jr., Egan and VanDerMeid, who comprise the MC Advisors investment committee. These individuals may have other demands on their time now and in the future, and we cannot assure you that they will continue to be actively involved in our management. Each of these individuals is an employee of MC Management and is not subject to an employment contract. The departure of any of these individuals or competing demands on their time in the future could have a material adverse effect on our ability to achieve our investment objective.
MC Advisors evaluates, negotiates, structures, closes and monitors our investments in accordance with the terms of the Investment Advisory and Management Agreement. We can offer no assurance, however, that MC Advisors’ senior investment professionals will continue to provide investment advice to us. If these individuals do not maintain their existing relationships with Monroe Capital and its affiliates and do not develop new relationships with other sources of investment opportunities, we may not be able to grow our investment portfolio or achieve our investment objective. In addition, individuals with whom Monroe Capital’s senior investment professionals have relationships are not obligated to provide us with investment opportunities. Therefore, we can offer no assurance that such relationships will generate investment opportunities for us.
MC Advisors, an affiliate of Monroe Capital, provides us with access to Monroe Capital’s investment professionals. MC Advisors also depends upon Monroe Capital to obtain access to deal flow generated by the investment professionals of Monroe Capital and its affiliates. The Staffing Agreement provides that MC Management will make available to MC Advisors experienced investment professionals and access to the senior investment personnel of Monroe Capital for purposes of evaluating, negotiating, structuring, closing and monitoring our investments. We are not a party to this Staffing Agreement and cannot assure you that MC Management will continue to fulfill its obligations under the agreement. Furthermore, the Staffing Agreement may be terminated by either party without penalty upon 60 days’ written notice to the other party. If MC Management fails to perform or terminates the agreement, we cannot assure you that MC Advisors will enforce the Staffing Agreement or that such agreement will not be terminated by either party or that we will continue to have access to the investment professionals of Monroe Capital and its affiliates or their information and deal flow.
36
The investment committee that oversees our investment activities is provided by MC Advisors under the Investment Advisory and Management Agreement. The loss of any member of MC Advisors’ investment committee or of other Monroe Capital senior investment professionals would limit our ability to achieve our investment objective and operate as we anticipate. This could have a material adverse effect on our financial condition and results of operations.
Our business model depends to a significant extent upon strong referral relationships with financial institutions, sponsors and investment professionals. Any inability of MC Advisors to maintain or develop these relationships, or the failure of these relationships to generate investment opportunities, could adversely affect our business.
We depend upon the senior investment professionals of MC Advisors to maintain their relationships with financial institutions, sponsors and investment professionals, and we rely to a significant extent upon these relationships to provide us with potential investment opportunities. If the senior investment professionals of MC Advisors fail to maintain such relationships, or to develop new relationships with other sources of investment opportunities, we will not be able to grow our investment portfolio. In addition, individuals with whom the senior investment professionals of MC Advisors have relationships are not obligated to provide us with investment opportunities, and, therefore, we can offer no assurance that these relationships will generate investment opportunities for us in the future.
Our financial condition and results of operations depend on our ability to manage our business effectively.
Our ability to achieve our investment objective and grow depends on our ability to manage our business. This depends, in turn, on MC Advisors’ ability to identify, invest in and monitor companies that meet our investment criteria. The achievement of our investment objectives depends upon MC Advisors’ execution of our investment process, its ability to provide competent, attentive and efficient services to us and, to a lesser extent, our access to financing on acceptable terms. MC Advisors has substantial responsibilities under the Investment Advisory and Management Agreement. The senior origination professionals and other personnel of MC Advisors and its affiliates may be called upon to provide managerial assistance to our portfolio companies. These activities may distract them or slow our rate of investment. Any failure to manage our business and our future growth effectively could have a material adverse effect on our business, financial condition, results of operations and prospects. Our results of operations depend on many factors, including the availability of opportunities for investment, readily accessible short and long-term funding alternatives in the financial markets and economic conditions. Furthermore, if we cannot successfully operate our business or implement our investment policies and strategies, it could negatively impact our ability to pay dividends or other distributions and you may lose all or part of your investment.
There may be conflicts related to obligations that MC Advisors’ senior investment professionals and members of its investment committee have to other clients.
The senior investment professionals and members of the investment committee of MC Advisors serve or may serve as officers, directors or principals of entities that operate in the same or a related line of business as we do, or of investment funds, accounts or other investment vehicles sponsored or managed by MC Advisors or its affiliates. In serving in these multiple capacities, they may have obligations to other clients or investors in those entities, the fulfillment of which may not be in our best interests or in the best interest of our stockholders. For example, Messrs. Koenig, Solimene Jr., Egan and VanDerMeid, who comprise MC Advisors' investment committee, have and will continue to have management responsibilities for other investment funds, accounts or other investment vehicles sponsored or managed by affiliates of MC Advisors. In serving in these multiple capacities, they may have obligations to other clients or investors in those entities, the fulfillment of which may not be in the best interests of us or our stockholders. MC Advisors seeks to allocate investment opportunities among eligible accounts in a manner that is fair and equitable over time and consistent with its allocation policy.
As of December 31, 2023, MC Advisors manages other assets in a private BDC, and affiliates of MC Advisors manage other assets in 13 closed-end funds, two small business investment companies and 25 private funds that also have an investment strategy focused primarily on senior, unitranche and junior secured debt and, to a lesser extent, unsecured subordinated debt to lower middle-market companies and one BDC which focus on similar investment types, but which may be backed by venture capital and private equity investors. Except for the private BDC, none of these funds are registered with the SEC. In addition, MC Advisors and/or its affiliates may manage other entities in the future with an investment strategy that has the same or similar focus as ours.
37
Monroe Capital and its affiliates seek to allocate investment opportunities among the participating funds, including us, in proportion to the relative amounts of capital available for new investments, taking into account such factors as Monroe Capital may determine appropriate, including, without limitation, investment objectives, legal or regulatory restrictions, current holdings, availability of capital for investment, immediately available cash, the size of investments generally, risk-return considerations, relative exposure to market trends, maintenance of targeted leverage level, targeted asset mix, target investment return, diversification requirements, strategic objectives, specific liquidity requirements, tax consequences, limitations and restrictions on a fund’s portfolio that are imposed by such fund’s governing board or documents, or other considerations or factors that Monroe Capital deems necessary or appropriate in light of the circumstances at such time (collectively, the “Allocation Criteria”). We expect that Monroe Capital will follow the Allocation Criteria with respect to all of its funds under management, including us.
In situations where co-investment with other entities sponsored or managed by MC Advisors or its affiliates is not permitted or appropriate, such as when there is an opportunity to invest in securities of the same issuer that have different priorities or liens, MC Advisors will need to decide whether we or such other entity or entities will proceed with the investment. MC Advisors will make these determinations based on its policies and procedures that require that such opportunities be offered to eligible accounts on a basis that is fair and equitable over time. However, there can be no assurance that we will be able to participate in all investment opportunities that are suitable to us.
MC Advisors or its investment committee may, from time to time, possess material nonpublic information, limiting our investment discretion.
The managing members and the senior origination professionals of MC Advisors and the senior professionals and members of MC Advisors’ investment committee may serve as directors of, or in a similar capacity with, companies in which we invest, the securities of which are purchased or sold on our behalf. In the event that material nonpublic information is obtained with respect to such companies, or we become subject to trading restrictions under the internal trading policies of those companies or as a result of applicable law or regulations, we could be prohibited for a period of time from purchasing or selling the securities of such companies, and this prohibition may have a material adverse effect on us.
Our management and incentive fee structure may create incentives for MC Advisors that are not fully aligned with the interests of our stockholders.
In the course of our investing activities, we pay management and incentive fees to MC Advisors. Management fees are based on our total assets (which include assets financed using leverage but exclude cash and cash equivalents). As a result, investors in our common stock invest on a “gross” basis and receive distributions on a “net” basis after expenses, resulting in a lower rate of return than one might achieve through direct investments. Because these fees are based on our total assets, including financed using leverage but excluding cash and cash equivalents, MC Advisors benefits when we incur debt or otherwise use leverage. This fee structure may encourage MC Advisors to cause us to borrow money to finance additional investments or to maintain leverage when it would otherwise be appropriate to pay off our indebtedness. Under certain circumstances, the use of borrowed money may increase the likelihood of default, which would disfavor our stockholders. Our Board is charged with protecting our interests by monitoring how MC Advisors addresses these and other conflicts of interest associated with its management services and compensation. While our Board is not expected to review or approve each investment, our independent directors periodically review MC Advisors’ services and fees as well as its portfolio management decisions and portfolio performance. In connection with these reviews, our independent directors consider whether our fees and expenses (including those related to leverage) remain appropriate. As a result of this arrangement, MC Advisors or its affiliates may from time to time have interests that differ from those of our stockholders, giving rise to a conflict.
The part of the incentive fee payable to MC Advisors that relates to our net investment income is computed and paid on income that may include interest income that has been accrued but not yet received in cash. This fee structure may be considered to involve a conflict of interest for MC Advisors to the extent that it may encourage MC Advisors to favor debt financings that provide for deferred interest, rather than current cash payments of interest. MC Advisors may have an incentive to invest in PIK interest securities in circumstances where it would not have done so but for the opportunity to continue to earn the incentive fee even when the issuers of the deferred interest securities would not be able to make actual cash payments to us on such securities. This risk could be increased because MC Advisors is not obligated to reimburse us for any incentive fees received even if we subsequently incur losses or never receive in cash the deferred income that was previously accrued. In addition, the part of the incentive fee payable to MC Advisors that relates to our net investment income generally does not include any realized capital gains or losses or unrealized capital gains or losses. However, part one incentive fees are subject to Incentive Fee Limitation as described in Note 6 to the accompanying consolidated financial statements. Any net investment income incentive fee would not be subject to repayment.
38
Our incentive fee may induce MC Advisors to make certain investments, including speculative investments.
MC Advisors receives an incentive fee based, in part, upon net capital gains realized on our investments. Unlike that portion of the incentive fee based on income, there is no hurdle rate applicable to the portion of the incentive fee based on net capital gains. As a result, MC Advisors may have a tendency to invest more capital in investments that are likely to result in capital gains as compared to income producing securities. Such a practice could result in our investing in more speculative securities than would otherwise be the case, which could result in higher investment losses, particularly during economic downturns.
The Investment Advisory and Management Agreement with MC Advisors and the Administration Agreement with MC Management were not negotiated on an arm’s length basis and may not be as favorable to us as if they had been negotiated with an unaffiliated third-party.
We negotiated the Investment Advisory and Management Agreement and the Administration Agreement with related parties. Consequently, their terms, including fees payable to MC Advisors, may not be as favorable to us as if they had been negotiated with an unaffiliated third-party. In addition, we may choose not to enforce, or to enforce less vigorously, our rights and remedies under these agreements because of our desire to maintain our ongoing relationship with MC Advisors and MC Management. Any such decision, however, would breach our fiduciary obligations to our stockholders.
Our ability to enter into transactions with our affiliates is restricted, which may limit the scope of investments available to us.
We are prohibited under the 1940 Act from participating in certain transactions with our affiliates without the prior approval of our independent directors and, in some cases, of the SEC. Any person that owns, directly or indirectly, five percent or more of our outstanding voting securities is our affiliate for purposes of the 1940 Act, and we are generally prohibited from buying or selling any security from or to such affiliate, absent the prior approval of our independent directors. The 1940 Act also prohibits certain “joint” transactions with certain of our affiliates, which could include investments in the same portfolio company, without prior approval of our independent directors and, in some cases, of the SEC. We are prohibited from buying or selling any security from or to any person who owns more than 25% of our voting securities or certain of that person’s affiliates, or entering into prohibited joint transactions with such persons, absent the prior approval of the SEC. As a result of these restrictions, we may be prohibited from buying or selling any security (other than any security of which we are the issuer) from or to any portfolio company of a private equity fund managed by MC Advisors or its affiliates without the prior approval of the SEC, which may limit the scope of investment opportunities that would otherwise be available to us.
We may, however, co-invest with MC Advisors and its affiliates’ other clients in certain circumstances where doing so is consistent with applicable law and SEC staff interpretations. For example, we may co-invest with such accounts consistent with guidance promulgated by the SEC staff permitting us and such other accounts to purchase interests in a single class of privately placed securities so long as certain conditions are met, including that MC Advisors, acting on our behalf and on behalf of other clients, negotiates no term other than price. We may also co-invest with MC Advisors’ affiliates’ other clients as otherwise permissible under regulatory guidance, applicable regulations, the Order and MC Advisors’ allocation policy, which the investment committee of MC Advisors maintains in writing. The allocation policy further provides that allocations among us and these other funds are generally made in proportion to the relative amounts of capital available for new investments taking into account the Allocation Criteria. We expect that Monroe Capital will follow the Allocation Criteria with respect to all of its funds under management, including us. However, we can offer no assurance that investment opportunities will be allocated to us fairly or equitably in the short-term or over time.
In situations where co-investment with other entities sponsored or managed by MC Advisors or its affiliates is not permitted or appropriate, such as when there is an opportunity to invest in securities of the same issuer that have different priorities or liens, MC Advisors will need to decide whether we or such other entity or entities will proceed with the investment. MC Advisors will make these determinations based on its policies and procedures that require that such opportunities be offered to eligible accounts on a basis that is fair and equitable over time. Moreover, except in certain circumstances, we are unable to invest in any issuer in which a fund managed by MC Advisors or its affiliates has previously invested. Similar restrictions limit our ability to transact business with our officers or directors or their affiliates.
We may also be prohibited under the 1940 Act from knowingly participating in certain transactions with our affiliates without the prior approval of the majority of the members of our Board who are not interested persons and, in some cases, prior approval by the SEC. The SEC has interpreted the BDC regulations governing transactions with affiliates to prohibit certain “joint transactions” between entities that share a common investment adviser.
39
We operate in a highly competitive market for investment opportunities, which could reduce returns and result in losses.
We compete with a number of specialty and commercial finance companies to make the types of investments that we make in middle-market companies, including BDCs, traditional commercial banks, private investment funds, regional banking institutions, small business investment companies, investment banks and insurance companies. Additionally, with increased competition for investment opportunities, alternative investment vehicles such as hedge funds may seek to invest in areas they have not traditionally invested in or from which they had withdrawn during the economic downturn, including investing in middle-market companies. As a result, competition for investments in lower middle-market companies has intensified, and we expect that trend to continue. Many of our existing and potential competitors are substantially larger and have considerably greater financial, technical and marketing resources than we do. For example, some competitors may have a lower cost of funds and access to funding sources that are not available to us. In addition, some of our competitors may have higher risk tolerances or different risk assessments, which could allow them to consider a wider variety of investments and establish more relationships than us. These characteristics could allow our competitors to consider a wider variety of investments, establish more relationships and offer better pricing and more flexible structuring than we offer. We may lose investment opportunities if we do not match our competitors’ pricing, terms and structure. If we are forced to match our competitors’ pricing, terms and structure, however, we may not be able to achieve acceptable returns on our investments or may bear substantial risk of capital loss. A significant part of our competitive advantage stems from the fact that the lower middle-market is underserved by traditional commercial and investment banks, and generally has less access to capital. A significant increase in the number and/or the size of our competitors in this target market could force us to accept less attractive investment terms.
Furthermore, many of our competitors are not subject to the regulatory restrictions that the 1940 Act imposes on us as a BDC or the source of income, asset diversification and distribution requirements we must satisfy to maintain our RIC status. The competitive pressures we face may have a material adverse effect on our business, financial condition and results of operations. As a result of this competition, we may not be able to take advantage of attractive investment opportunities from time to time, and we may not be able to identify and make investments that are consistent with our investment objective.
40
We will be subject to U.S. federal income tax at corporate rates if we are unable to qualify or maintain qualification as a RIC under Subchapter M of the Code.
We have elected to be treated as a RIC under Subchapter M of the Code commencing with our taxable year ended December 31, 2012, have qualified in each taxable year since, and intend to continue to qualify to be treated as a RIC; however, no assurance can be given that we will be able to continue to qualify for and maintain RIC status. To receive RIC tax treatment under the Code and to be relieved of U.S. federal taxes on income and gains timely distributed to our stockholders, we must meet certain requirements, including source-of-income, asset diversification and distribution requirements. The annual distribution requirement applicable to RICs is satisfied if we distribute at least 90% of our net ordinary income and net short-term capital gains in excess of net long-term capital losses, if any, to our stockholders on an annual basis. In addition, we will be subject to a 4% nondeductible federal excise tax to the extent that we do not satisfy certain additional minimum distribution requirements on a calendar year basis. To the extent we use debt financing, we will be subject to certain asset coverage ratio requirements under the 1940 Act and may be subject to financial covenants under loan and credit agreements, each of which could, under certain circumstances, restrict us from making annual distributions necessary to receive RIC tax treatment. If we are unable to obtain cash from other sources, we may fail to be taxed as a RIC and, thus, may be subject to U.S. federal income tax at corporate rates on our entire taxable income without regard to any distributions made by us. In order to be taxed as a RIC, we must also meet certain asset diversification requirements at the end of each calendar quarter. Failure to meet these tests may result in our having to dispose of certain investments quickly in order to prevent the loss of RIC status. Because most of our investments are in private or thinly traded public companies, any such dispositions could be made at disadvantageous prices and may result in substantial losses. If we fail to be taxed as a RIC for any reason and become subject to corporate U.S. federal income tax, the resulting U.S. federal income taxes could substantially reduce our net assets, the amount of income available for distributions to stockholders and the amount of our distributions and the amount of funds available for new investments. Such a failure would have a material adverse effect on us and our stockholders.
An extended disruption in the capital markets and the credit markets could negatively affect us and our portfolio companies.
As a BDC, it is necessary for us to maintain our ability to raise additional capital for investment purposes. Without sufficient access to the capital markets or credit markets, we may be forced to curtail our business operations or we may not be able to pursue new business opportunities. The capital markets and the credit markets have experienced periods of extreme volatility and disruption and, accordingly, there has been and may in the future be uncertainty in the financial markets in general. Ongoing disruptive conditions in the financial industry, including the bankruptcy of, the acquisition of, or government intervention in the affairs of financial institutions, and the impact of new legislation in response to those conditions could restrict our business operations or the business operations of our portfolio companies and could adversely impact our results of operations and financial condition or results of operations and financial condition of our portfolio companies.
41
We access the capital markets periodically to issue debt or equity securities or borrow from financial institutions in order to obtain such additional capital. Unfavorable economic conditions could increase our funding costs, limit our access to the capital markets or result in a decision by lenders not to extend credit to us. A reduction in the availability of new capital could limit our ability to pursue new business opportunities and grow our business. In addition, we are required to distribute at least 90% of our net ordinary income and net short-term capital gains in excess of net long-term capital losses, if any, to our stockholders to qualify for the tax benefits available to RICs. As a result, these earnings will not be available to fund new investments. An inability to access the capital markets successfully could limit our ability to grow our business and execute our business strategy fully and could decrease our earnings, if any, which may have an adverse effect on the value of our securities. While most of our investments are not publicly traded, applicable accounting standards require us to assume as part of our valuation process that our investments are sold in a principal market to market participants (even if we plan on holding an investment through its maturity). As a result, volatility in the capital markets can adversely affect our investment valuations. Further, the illiquidity of our investments may make it difficult for us to sell such investments if required and to value such investments. As a result, we may realize significantly less than the value at which we will have recorded our investments.
We may need to raise additional capital to grow because we must distribute most of our income.
We may need additional capital to fund new investments and grow our portfolio of investments. We intend to access the capital markets periodically to issue debt or equity securities or borrow from financial institutions in order to obtain such additional capital. Unfavorable economic conditions could increase our funding costs, limit our access to the capital markets or result in a decision by lenders not to extend credit to us. A reduction in the availability of new capital could limit our ability to grow. In addition, in order to qualify as a RIC, we are required to distribute each taxable year an amount at least equal to 90% of our net ordinary income and net short-term capital gains in excess of net long-term capital losses, if any, to our stockholders. As a result, these earnings are not available to fund new investments. An inability to access the capital markets successfully could limit our ability to grow our business and execute our business strategy fully and could decrease our earnings, if any, which may have an adverse effect on the value of our securities.
We may have difficulty paying our required distributions if we recognize income before, or without, receiving cash representing such income.
For U.S. federal income tax purposes, we include in income certain amounts that we have not yet received in cash, such as original issue discount, or through contracted PIK interest, which represents contractual interest added to the loan balance and due at the end of the loan term. Original issue discount, which could be significant relative to our overall investment activities, or increases in loan balances as a result of contracted PIK arrangements, are included in income before we receive the corresponding cash payments. We also may be required to include in income certain other amounts that we do not receive in cash.
That part of the incentive fee payable by us that relates to our net investment income is computed and paid on income that may include interest that has been accrued but not yet received in cash, such as original issue discount and PIK interest. If we pay a net investment income incentive fee on interest that has been accrued, but not yet received in cash, it will increase the basis of our investment in that loan, which will reduce the capital gain incentive fee that we would otherwise pay in the future. Nevertheless, if we pay a net investment income incentive fee on interest that has been accrued but not yet received, and if that portfolio company defaults on such a loan, it is possible that accrued interest previously included in the calculation of the incentive fee will become uncollectible.
Because we may recognize income before or without receiving cash representing such income, we may have difficulty meeting the requirements applicable to RICs. In such a case, we may have to sell some of our investments at times and/or at prices we would not consider advantageous, raise additional debt or equity capital or reduce new investment originations and sourcings to meet these distribution requirements. If we are not able to obtain such cash from other sources, we may fail to qualify for the tax benefits available to RICs and thus be subject to U.S. federal income tax at corporate rates.
The 1940 Act allows us to incur additional leverage, which could increase the risk of investing in us.
The 1940 Act generally prohibits us from incurring indebtedness unless immediately after such borrowing we have an asset coverage for total borrowings of at least 200% (i.e., the amount of debt may not exceed half of the value of our total assets). However, under the Small Business Credit Availability Act (the “SBCAA”), which became law in March 2018, BDCs have the ability to elect to become subject to a lower asset coverage requirement of 150% (i.e., the amount of debt may not exceed two-thirds of the value of our total assets), subject to the receipt of the requisite board or stockholder approvals under the SBCAA and satisfaction of certain other conditions.
42
On June 20, 2018, our stockholders approved the application of the modified asset coverage requirements, as approved by our Board on March 27, 2018, and we became subject to the 150% minimum asset coverage ratio, effective June 21, 2018.
Leverage is generally considered a speculative investment technique and may increase the risk of investing in our securities. Leverage magnifies the potential for loss on investments in our indebtedness and on invested equity capital. As we use leverage to partially finance our investments, you will experience increased risks of investing in our securities. If the value of our assets increases, then leveraging would cause the net asset value attributable to our common stock to increase more sharply than it would have had we not leveraged. Conversely, if the value of our assets decreases, leveraging would cause net asset value to decline more sharply than it otherwise would have had we not leveraged our business. Similarly, any increase in our income in excess of interest payable on the borrowed funds would cause our net investment income to increase more than it would without the leverage, while any decrease in our income would cause net investment income to decline more sharply than it would have had we not borrowed. Such a decline could negatively affect our ability to pay distributions, scheduled debt payments or other payments related to our securities. The effects of leverage would cause any decrease in net asset value for any losses to be greater than any increase in net asset value for any corresponding gains. If we incur additional leverage, you will experience increased risks of investing in our common stock.
Regulations governing our operation as a BDC affect our ability to and the way in which we raise additional capital.
We may issue debt securities or preferred stock and/or borrow money from banks or other financial institutions, which we refer to collectively as “senior securities,” up to the maximum amount permitted by the 1940 Act. Under the provisions of the 1940 Act, we are permitted as a BDC to issue senior securities in amounts such that our asset coverage ratio, as defined in the 1940 Act, equals at least 150% (as of June 21, 2018) of total assets less all liabilities and indebtedness not represented by senior securities, immediately after each issuance of senior securities (other than the SBA debentures of an SBIC subsidiary, as permitted by exemptive relief we have been granted by the SEC). If the value of our assets declines, we may be unable to satisfy this test. If that happens, we may be required to sell a portion of our investments and, depending on the nature of our leverage, repay a portion of our indebtedness at a time when such sales may be disadvantageous. This could have a material adverse effect on our operations and we may not be able to make distributions in an amount sufficient to be subject to taxation as a RIC, or at all. In addition, issuance of securities could dilute the percentage ownership of our current stockholders in us.
No person or entity from which we borrow money will have a veto power or a vote in approving or changing any of our fundamental policies. If we issue preferred stock, the preferred stock would rank “senior” to common stock in our capital structure, preferred stockholders would have separate voting rights on certain matters and might have other rights, preferences or privileges more favorable than those of our common stockholders, and the issuance of preferred stock could have the effect of delaying, deferring or preventing a transaction or a change of control that might involve a premium price for holders of our common stock or otherwise be in your best interest. Holders of our common stock will directly or indirectly bear all of the costs associated with offering and servicing any preferred stock that we issue. In addition, any interests of preferred stockholders may not necessarily align with the interests of holders of our common stock and the rights of holders of shares of preferred stock to receive dividends would be senior to those of holders of shares of our common stock.
As a BDC, we generally are not able to issue our common stock at a price below net asset value per share without first obtaining the approval of our stockholders and our independent directors. If we raise additional funds by issuing more common stock or senior securities convertible into, or exchangeable for, our common stock, then percentage ownership of our stockholders at that time would decrease, and you might experience dilution. We have stockholder approval to sell our common stock below net asset value through June 15, 2024. We may seek further stockholder approval to sell shares below net asset value in the future.
We maintain a revolving credit facility and use other borrowed funds to make investments or fund our business operations, which exposes us to risks typically associated with leverage and increases the risk of investing in us.
We maintain a revolving credit facility, have issued debt securities and may borrow money, including through the issuance of additional debt securities or preferred stock, to leverage our capital structure, which is generally considered a speculative investment technique. As a result:
•our common stock is exposed to an increased risk of loss because a decrease in the value of our investments would have a greater negative impact on the value of our common stock than if we did not use leverage;
43
•if we do not appropriately match the assets and liabilities of our business, adverse changes in interest rates could reduce or eliminate the incremental income we make with the proceeds of any leverage;
•our ability to pay distributions on our common stock may be restricted if our asset coverage ratio, as provided in the 1940 Act, is not at least 150% and any amounts used to service indebtedness or preferred stock would not be available for such distributions;
•any credit facility is subject to periodic renewal by its lenders, whose continued participation cannot be guaranteed;
•our revolving credit facility with ING Capital LLC, as agent, is, and any other credit facility we may enter into would be, subject to various financial and operating covenants, including that our portfolio of investments satisfies certain eligibility and concentration limits as well as valuation methodologies;
•such securities would be governed by an indenture or other instrument containing covenants restricting our operating flexibility;
•we bear the cost of issuing and paying interest or distributions on such securities, which costs are entirely borne by our common stockholders; and
•any convertible or exchangeable securities that we issue may have rights, preferences and privileges more favorable than those of our common stock.
The following table illustrates the effect of leverage on returns from an investment in our common stock assuming various annual returns, net of expenses. The calculations in the table below are hypothetical and actual returns may be higher or lower than those appearing in the table below.
Assumed Return on Our Portfolio (Net of Expenses) (1) | |||||||||||||||||||||||||||||
| ‑10% | ‑5% | 0% | 5% | 10% | |||||||||||||||||||||||||
Corresponding return to common stockholder (2)(3) | ( | %) | ( | %) | ( | %) | |||||||||||||||||||||||
______________________________________________________________
(1)The assumed return on our portfolio is required by regulation of the SEC to assist investors in understanding the effects of leverage and is not a prediction of, and does not represent, our projected or actual performance.
(2)Assumes $513.2 million in total assets, $309.5 million in debt outstanding, of which $304.1 million is senior securities outstanding, $203.7 million in net assets and an average cost of funds of 6.67%, which was the weighted average interest rate of borrowing on our revolving credit facility and 2026 Notes as of December 31, 2023. The interest rate on our revolving credit facility is a variable rate. Actual interest payments may be different.
(3)In order for us to cover our annual interest payments on indebtedness, we must achieve annual returns on our December 31, 2023 total portfolio assets of at least 4.02 %.
The majority of our assets are subject to security interests under our revolving credit facility and if we default on our obligations under such facility, we may suffer adverse consequences, including foreclosure on our assets.
As of December 31, 2023, the majority of our assets (excluding, among other things, investments held in and by certain of our subsidiaries) were pledged as collateral under our revolving credit facility. If we default on our obligations under this facility, the lenders may have the right to foreclose upon and sell, or otherwise transfer, the collateral subject to their security interests or their superior claim. In such event, we may be forced to sell our investments to raise funds to repay our outstanding borrowings in order to avoid foreclosure and these forced sales may be at times and at prices we would not consider advantageous. Moreover, such deleveraging of our company could significantly impair our ability to effectively operate our business in the manner in which we have historically operated. As a result, we could be forced to curtail or cease new investment activities and lower or eliminate the distributions that we have historically paid to our stockholders.
In addition, if the lenders exercise their right to sell the assets pledged under our revolving credit facility, such sales may be completed at distressed sale prices, thereby diminishing or potentially eliminating the amount of cash available to us after repayment of the amounts outstanding under the credit facilities.
44
We are subject to risks associated with our revolving credit facility and the terms of our revolving credit facility may contractually limit our ability to incur additional indebtedness.
Our revolving credit facility, as amended, imposes certain conditions that may limit the amount of our distributions to stockholders. Distributions payable in our common stock under our dividend reinvestment plan are not limited by the revolving credit facility. Distributions in cash or property other than our common stock are generally limited to 115% of the amount of distributions required to maintain our ability to be subject to taxation as a RIC. We are required under the revolving credit facility to maintain our ability to be subject to taxation as a RIC.
The revolving credit facility requires us to comply with certain financial and operational covenants, including asset coverage ratios and a minimum net worth. For example, the revolving credit facility requires that we maintain an asset coverage ratio of at least 1.5 to 1 and a senior debt coverage ratio of at least 2 to 1 at all times. We may divert cash to pay the lenders in amounts sufficient to cause these tests to be satisfied. Our compliance with these covenants depends on many factors, some of which, such as market conditions, are beyond our control.
Our ability to sell our investments is also limited under the revolving credit facility. Under the revolving credit facility, the sale of any portfolio investment may not cause our covered debt amount to exceed our borrowing base. As a result, there may be times or circumstances during which we are unable to sell investments, pay distributions or take other actions that might be in our best interests.
Availability of borrowings under the revolving credit facility is linked to the valuation of the collateral pursuant to a borrowing base mechanism. As such, declines in the fair market value of our investments which are collateral to the revolving credit facility may reduce availability under our revolving credit facility.
To the extent we continue to use debt to finance our investments, changes in interest rates will affect our cost of capital and net investment income.
To the extent we borrow money to make investments, our net investment income depends, in part, upon the difference between the rate at which we borrow funds and the rate at which we invest those funds. As a result, we can offer no assurance that a significant change in market interest rates will not have a material adverse effect on our net investment income in the event we use debt to finance our investments. In periods of higher interest rates, our cost of funds would increase, which could reduce our net investment income. We expect that our long-term fixed-rate investments will be financed primarily with issuances of equity and long-term debt securities. We may use interest rate risk management techniques in an effort to limit our exposure to interest rate fluctuations. Such techniques may include various interest rate hedging activities to the extent permitted by the 1940 Act.
You should also be aware that a rise in the general level of interest rates typically leads to higher interest rates applicable to our debt investments. Accordingly, an increase in interest rates may result in an increase of the amount of incentive fees payable to MC Advisors.
We are subject to risks related to corporate social responsibility.
Our business faces increasing public scrutiny related to environmental, social and governance (“ESG”) activities, which are increasingly considered to contribute to the long-term sustainability of a company’s performance. A variety of organizations measure the performance of companies on ESG topics, and the results of these assessments are widely publicized. In addition, investment in funds that specialize in companies that perform well in such assessments are increasingly popular, and major institutional investors have publicly emphasized the importance of such ESG measures to their investment decisions.
We risk damage to our brand and reputation if we fail to act responsibly in a number of areas, such as environmental stewardship, corporate governance and transparency and considering ESG factors in our investment processes. Adverse incidents with respect to ESG activities could impact the value of our brand, the cost of our operations and relationships with investors, all of which could adversely affect our business and results of operations.
Additionally, new regulatory initiatives related to ESG could adversely affect our business. The SEC has adopted rules that, among other matters, establish a framework for the reporting of climate-related risks. Compliance with any new laws or regulations increases our regulatory burden and could make compliance more difficult and expensive, affect the manner in which we or our portfolio companies conduct our businesses and adversely affect our profitability.
45
We are exposed to risks associated with changes in interest rates.
Interest rate fluctuations may have a substantial negative impact on our investments, the value of our common stock and our rate of return on invested capital. A reduction in the interest rates on new investments relative to interest rates on current investments could have an adverse impact on our net investment income while an increase in interest rates could decrease the value of any investments we hold that earn fixed interest rates, including subordinated loans, senior and junior secured and unsecured debt securities and loans and high yield bonds, and also could increase our interest expense, thereby decreasing our net income.
An increase in interest rates available to investors could also make investment in our common stock less attractive unless we are able to increase our dividend rate. In periods of higher interest rates, to the extent we borrow money subject to a floating interest rate, our cost of funds would increase, which could reduce our net investment income. Further, higher interest rates could also adversely affect our performance if such increases cause our borrowing costs to rise at a rate in excess of the rate that our investments yield. Further, higher interest rates could also adversely affect our performance if we hold investments with floating interest rates, subject to specified minimum interest rates (such as a Secured Overnight Financing Rate ("SOFR") floor), while at the same time engaging in borrowings subject to floating interest rates not subject to such minimums. In such a scenario, higher interest rates may increase our interest expense, even though our interest income from investments is not increasing in a corresponding manner as a result of such minimum interest rates.
If general interest rates rise, there is a risk that the portfolio companies in which we hold floating rate investments will be unable to pay escalating interest amounts, which could result in a default under their loan documents with us. Higher interest rates could also cause portfolio companies to shift cash from other productive uses to the payment of interest, which may have a material adverse effect on their business and operations and could, over time, lead to increased defaults. In addition, higher interest rates may increase pressure on us to provide fixed rate loans to our portfolio companies, which could adversely affect our net investment income, as increases in our cost of borrowed funds would not be accompanied by increased interest income from such fixed-rate investments.
To the extent that we continue to make floating rate debt investments, a rise in the general level of interest rates would lead to higher interest rates applicable to our debt investments. Accordingly, an increase in interest rates may result in an increase in the amount of the incentive fee payable to MC Advisors.
General interest rate fluctuations may have a substantial negative impact on our investments and investment opportunities and, accordingly, may have a material adverse effect on our ability to achieve our investment objective and the rate of return on invested capital.
46
If we do not invest a sufficient portion of our assets in qualifying assets, we could fail to qualify as a BDC, which would have a material adverse effect on our business, financial condition and results of operations.
As a BDC, we may not acquire any assets other than “qualifying assets” unless, at the time of and after giving effect to such acquisition, at least 70% of our total assets are qualifying assets, as defined in Section 55(a) of the 1940 Act. See “Business — Qualifying Assets.” We believe that most of the investments that we may acquire in the future will constitute qualifying assets. However, we may be precluded from investing in what we believe are attractive investments if such investments are not qualifying assets for purposes of the 1940 Act. If we do not invest a sufficient portion of our assets in qualifying assets, we could violate the 1940 Act provisions applicable to BDCs. As a result of such violation, specific rules under the 1940 Act could prevent us, for example, from making follow-on investments in existing portfolio companies, which could result in the dilution of our position or could require us to dispose of investments at inappropriate times in order to come into compliance with the 1940 Act. If we need to dispose of investments quickly, it could be difficult to dispose of such investments on favorable terms. We may not be able to find a buyer for such investments and, even if we do find a buyer, we may have to sell the investments at a substantial loss. Any such outcomes would have a material adverse effect on our business, financial condition, results of operations, and cash flows.
Many of our portfolio investments are recorded at fair value as determined in good faith by our Valuation Designee and, as a result, there may be uncertainty as to the value of our portfolio investments.
Under the 1940 Act, we are required to carry our portfolio investments at market value, or if there is no readily available market value, at fair value as determined by MC Advisors in its capacity as our Valuation Designee. Many of our portfolio investments may take the form of securities that are not publicly traded. The fair value of securities and other investments that are not publicly traded may not be readily determinable, and we value these securities at fair value as determined in good faith by our Valuation Designee, including to reflect significant events affecting the value of our securities. As part of the valuation process, we may take into account the following types of factors, if relevant, in determining the fair value of our investments:
•a comparison of the portfolio company’s securities to publicly traded securities;
•the enterprise value of a portfolio company;
•the nature and realizable value of any collateral;
•the portfolio company’s ability to make payments and its earnings and discounted cash flow;
•the markets in which the portfolio company does business; and
•changes in the interest rate environment and the credit markets generally that may affect the price at which similar investments may be made in the future and other relevant factors.
47
We expect that most of our investments (other than cash and cash equivalents) will be classified as Level 3 in the fair value hierarchy and require disclosures about the level of disaggregation along with the inputs and valuation techniques we use to measure fair value. This means that our portfolio valuations are based on unobservable inputs and our own assumptions about how market participants would price the asset or liability in question. Inputs into the determination of fair value of our portfolio investments require significant management judgment or estimation. Even if observable market data is available, such information may be the result of consensus pricing information or broker quotes, which include a disclaimer that the broker would not be held to such a price in an actual transaction. The non-binding nature of consensus pricing and/or quotes accompanied by disclaimers materially reduces the reliability of such information. We employ the services of one or more independent service providers to conduct fair value appraisals of material investments for which market quotations are not readily available. These fair value appraisals for material investments are received at least once every calendar year for each portfolio company investment, but are generally received quarterly. The types of factors that the Valuation Designee may take into account in determining the fair value of our investments generally include, as appropriate, comparison to publicly traded securities including such factors as yield, maturity and measures of credit quality, the enterprise value of a portfolio company, the nature and realizable value of any collateral, the portfolio company’s ability to make payments and its earnings and discounted cash flow, the markets in which the portfolio company does business and other relevant factors. Because such valuations, and particularly valuations of private securities and private companies, are inherently uncertain, may fluctuate over short periods of time and may be based on estimates, our determinations of fair value may differ materially from the values that would have been used if a ready market for these securities existed. Due to this uncertainty in the value of our portfolio investments, a fair value determination may cause net asset value on a given date to materially understate or overstate the value that we may ultimately realize upon one or more of our investments. As a result, investors purchasing shares of our common stock based on an overstated net asset value would pay a higher price than the value of the investments might warrant. Conversely, investors selling shares during a period in which the net asset value understates the value of investments will receive a lower price for their shares than the value the investment portfolio might warrant.
We adjust quarterly the valuation of our portfolio to reflect the determination of our Valuation Designee of the fair value of each investment in our portfolio. Any changes in fair value are recorded in our consolidated statements of operations as net change in unrealized gain (loss) on investments.
Legislative or regulatory tax changes could adversely affect investors.
At any time, the federal income tax laws governing RICs or the administrative interpretations of those laws or regulations may be amended. The U.S. government has enacted significant changes to the existing U.S. tax rules that include, among others, a minimum tax on book income and profits of certain multinational corporations, and there are a number of proposals in the U.S. Congress that would similarly modify U.S. tax rules. The likelihood of any new legislation being enacted is uncertain. Any new laws, regulations or interpretations may take effect retroactively and could adversely affect the taxation of us or our shareholders. Therefore, changes in tax laws, regulations or administrative interpretations or any amendments thereto could diminish the value of an investment in our shares or the value or the resale potential of our investments.
Our Board may change our investment objective, operating policies and strategies without prior notice or stockholder approval, the effects of which may be adverse.
Our Board has the authority, except as otherwise prohibited by the 1940 Act, to modify or waive certain of our operating policies and strategies without prior notice and without stockholder approval. However, absent stockholder approval, we may not change the nature of our business so as to cease to be, or withdraw our election as, a BDC. Under Maryland law, we also cannot be dissolved without prior stockholder approval except by judicial action. We cannot predict the effect any changes to our current operating policies and strategies would have on our business, operating results and the price value of our common stock. Nevertheless, any such changes could adversely affect our business and impair our ability to make distributions.
48
MC Advisors can resign on 60 days’ notice under the Investment Advisory and Management Agreement, and we may not be able to find a suitable replacement within that time, resulting in a disruption in our operations that could adversely affect our financial condition, business and results of operations.
MC Advisors has the right to resign under the Investment Advisory and Management Agreement without penalty at any time upon 60 days’ written notice to us, whether we have found a replacement or not. If MC Advisors resigns, we may not be able to find a new investment advisor or hire internal management with similar expertise and ability to provide the same or equivalent services on acceptable terms within 60 days, or at all. If we are unable to do so quickly, our operations are likely to experience a disruption, our financial condition, business and results of operations as well as our ability to pay distributions are likely to be adversely affected and the market price of our securities may decline. In addition, the coordination of our internal management and investment activities is likely to suffer if we are unable to identify and reach an agreement with a single institution or group of executives having the expertise possessed by MC Advisors and its affiliates. Even if we were able to retain comparable management, whether internal or external, the integration of such management and their lack of familiarity with our investment objective may result in additional costs and time delays that may adversely affect our financial condition, business and results of operations.
MC Management can resign on 60 days’ notice from its role as our administrator under the Administration Agreement, and we may not be able to find a suitable replacement within that time, resulting in a disruption in our operations that could adversely affect our financial condition, business and results of operations.
MC Management has the right to resign under the Administration Agreement without penalty upon 60 days’ written notice to us, whether we have found a replacement or not. If MC Management resigns, we may not be able to find a new administrator or hire internal management with similar expertise and ability to provide the same or equivalent services on acceptable terms, or at all. If we are unable to do so quickly, our operations are likely to experience a disruption, our financial condition, business and results of operations as well as our ability to pay distributions are likely to be adversely affected and the market price of our shares may decline. In addition, the coordination of our internal management and administrative activities is likely to suffer if we are unable to identify and reach an agreement with a service provider or individuals with the expertise possessed by MC Management. Even if we were able to retain a comparable service provider or individuals to perform such services, whether internal or external, their integration into our business and lack of familiarity with our investment objective may result in additional costs and time delays that may adversely affect our financial condition, business and results of operations.
We may incur lender liability as a result of our lending activities.
In recent years, a number of judicial decisions have upheld the right of borrowers and others to sue lending institutions on the basis of various evolving legal theories, collectively termed “lender liability.” Generally, lender liability is founded on the premise that a lender has either violated a duty, whether implied or contractual, of good faith and fair dealing owed to the borrower or has assumed a degree of control over the borrower resulting in the creation of a fiduciary duty owed to the borrower or its other creditors or stockholders. We may be subject to allegations of lender liability, which could be time-consuming and expensive to defend and result in significant liability.
We may incur liability as a result of providing managerial assistance to our portfolio companies.
In the course of providing significant managerial assistance to certain portfolio companies, certain of our management and directors may serve as directors on the boards of such companies. To the extent that litigation arises out of investments in these companies, our management and directors may be named as defendants in such litigation, which could result in an expenditure of our funds, through our indemnification of such officers and directors, and the diversion of management time and resources.
Risks Relating to Our Investments
Economic recessions or downturns could impair our portfolio companies and harm our operating results.
Many of our portfolio companies in which we have invested or expect to make investments are likely to be susceptible to economic slowdowns or recessions and may be unable to repay our loans during such periods. These portfolio companies may face intense competition, including competition from companies with greater financial resources, more extensive research and development, manufacturing, marketing and service capabilities and greater number of qualified and experienced managerial and technical personnel. They may need additional financing that they are unable to secure and that we are unable or unwilling to provide, or they may be subject to adverse developments unrelated to the technologies they acquire.
49
Therefore, our non-performing assets are likely to increase, and the value of our portfolio is likely to decrease during these periods. Adverse economic conditions may decrease the value of collateral securing some of our loans and the value of our equity investments and could lead to financial losses in our portfolio and a corresponding decrease in revenues, net income and assets.
Unfavorable economic conditions also could increase our funding costs, limit our access to the capital markets or result in a decision by lenders not to extend credit to us. These events could prevent us from increasing our investments and harm business, financial condition, our operating results and prospects. In March 2023, the Federal Deposit Insurance Corporation (“FDIC”) took control of Silicon Valley Bank and Signature Bank and subsequently in May 2023 of First Republic Bank due to liquidity concerns and concerns have arisen regarding the stability of other banks and financial institutions. Also, the impairment or failure of one or more banks with whom the Company, its portfolio companies, and/or the Adviser transact may inhibit the ability of the Company or its portfolio companies to access depository accounts. In such cases, the Company may be forced to delay or forgo investments, resulting in lower Company performance. In the event of such a failure of a banking institution where the Company or one or more of its portfolio companies holds depository accounts, access to such accounts could be restricted and U.S. FDIC protection may not be available for balances in excess of amounts insured by the FDIC. In such instances, the Company and its affected portfolio companies would not recover such excess, uninsured amounts. To the extent that the Company or the portfolio companies are impacted, their ability to access existing cash, cash equivalents and investments, or to access existing or enter into new banking arrangements or facilities to service our portfolio companies, may be threatened.
A portfolio company’s failure to satisfy financial or operating covenants imposed by us or other lenders could lead to defaults and, potentially, acceleration of its loans and foreclosure on its assets, which could trigger cross-defaults under other agreements and jeopardize our portfolio company’s ability to meet its obligations under the debt securities that we hold. We may incur expenses to the extent necessary to seek recovery upon default or to negotiate new terms with a defaulting portfolio company. It is possible that we could become subject to a lender liability claim, including as a result of actions taken if we or MC Advisors render significant managerial assistance to the borrower. Furthermore, if one of our portfolio companies were to file for bankruptcy protection, even though we may have structured our investment as senior secured debt, depending on the facts and circumstances, including the extent to which we or MC Advisors provided managerial assistance to that portfolio company or otherwise exercise control over it, a bankruptcy court might re-characterize our debt as a form of equity and subordinate all or a portion of our claim to claims of other creditors.
Inflation may adversely affect the business, results of operations and financial condition of our portfolio companies.
Recent inflationary pressures have increased the costs of labor, energy and raw materials and have adversely affected consumer spending, economic growth and our portfolio companies’ operations. Certain of our portfolio companies may be in industries that have been, or are expected to be, impacted by inflation. If such portfolio companies are unable pass any increases in their costs along to their customers, it could adversely affect their results and impact their ability to pay interest and principal on our loans. In addition, any projected future decreases in our portfolio companies' operating results due to inflation could adversely impact the fair value of those investments. Any decreases in the fair value of our investments could result in future realized or unrealized losses and therefore reduce our net assets resulting from operations. Additionally, the Federal Reserve has raised, and may continue raising, certain benchmark interest rates in an effort to combat inflation. See “We are exposed to risks associated with changes in interest rates.”
50
Market conditions have materially and adversely affected debt and equity capital markets in the United States and around the world.
In the past, the global capital markets experienced periods of disruption resulting in increasing spreads between the yields realized on riskier debt securities and those realized on securities perceived as being risk-free and a lack of liquidity in parts of the debt capital markets, significant write-offs in the financial services sector relating to subprime mortgages and the re-pricing of credit risk in the broadly syndicated market. These events, along with the deterioration of the housing market, illiquid market conditions, declining business and consumer confidence and the failure of major financial institutions in the United States, led to a general decline in economic conditions. This economic decline materially and adversely affected the broader financial and credit markets and reduced the availability of debt and equity capital for the market as a whole and to financial firms in particular. If such a period of disruption were to occur in the future, to the extent that we wish to use debt to fund our investments, the debt capital that will be available to us, if at all, may be at a higher cost, and on terms and conditions that may be less favorable, than what we expect, which could negatively affect our financial performance and results. A prolonged period of market illiquidity may cause us to reduce the volume of loans we originate and/or fund below historical levels and adversely affect the value of our portfolio investments, which could have a material and adverse effect on our business, financial condition, and results of operations. The spread between the yields realized on riskier debt securities and those realized on securities perceived as being risk-free has remained narrow on a relative basis recently. If these spreads were to widen or if there were deterioration of market conditions, these events could materially and adversely affect our business.
We and our portfolio companies may maintain cash balances at financial institutions and exceed federally insured limits and may otherwise be materially affected by adverse developments affecting the financial services industry, such as actual events or concerns involving liquidity, defaults or non-performance by financial institutions or transactional counterparties.
Our cash is held in accounts at U.S. banking institutions that we believe are of high quality. Cash held by us and by our portfolio companies in non-interest-bearing and interest-bearing operating accounts may exceed the Federal Deposit Insurance Corporation (FDIC) insurance limits. If such banking institutions were to fail, we or our portfolio companies could lose all or a portion of those amounts held in excess of such insurance limitations. In addition, actual events involving limited liquidity, defaults, non-performance or other adverse developments that affect financial institutions, transactional counterparties or other companies in the financial services industry or the financial services industry generally, or concerns or rumors about any events of these kinds or other similar risks, have in the past and may in the future lead to market-wide liquidity problems, which could adversely affect our and our portfolio companies’ business, financial condition, results of operations, or prospects.
Although we assess our portfolio companies’ banking relationships as we believe necessary or appropriate, our and our portfolio companies’ access to funding sources and other credit arrangements in amounts adequate to finance or capitalize our respective current and projected future business operations could be significantly impaired by factors that affect us or our portfolio companies, the financial institutions with which we or our portfolio companies have arrangements directly, or the financial services industry or economy in general. These factors could include, among others, events such as liquidity constraints or failures, the ability to perform obligations under various types of financial, credit or liquidity agreements or arrangements, disruptions or instability in the financial services industry or financial markets, or concerns or negative expectations about the prospects for companies in the financial services industry. These factors could involve financial institutions or financial services industry companies with which we or our portfolio companies have financial or business relationships, but could also include factors involving financial markets or the financial services industry generally.
In addition, investor concerns regarding the U.S. or international financial systems could result in less favorable commercial financing terms, including higher interest rates or costs and tighter financial and operating covenants, or systemic limitations on access to credit and liquidity sources, thereby making it more difficult for us or our portfolio companies to acquire financing on acceptable terms or at all.
Our investments in leveraged portfolio companies may be risky, and we could lose all or part of our investment.
Investment in leveraged companies involves a number of significant risks. Leveraged companies, including lower middle-market companies, in which we invest may have limited financial resources and may be unable to meet their obligations under their debt securities that we hold. Such developments may be accompanied by a deterioration in the value of any collateral and a reduction in the likelihood of our realizing any guarantees that we may have obtained in connection with our investment. In addition, our junior secured loans are generally subordinated to senior loans. As such, other creditors may rank senior to us in the event of an insolvency.
51
Our portfolio companies consist of and will likely continue to consist primarily of lower middle-market, privately owned companies, which may present a greater risk of loss than loans to larger companies.
Our portfolio consists, and will most likely continue to consist, primarily of loans to lower middle-market, privately owned companies. Compared to larger, publicly traded firms, these companies generally have more limited access to capital and higher funding costs, may be in a weaker financial position and may need more capital to expand, compete and operate their business. In addition, many of these companies may be unable to obtain financing from public capital markets or from traditional sources, such as commercial banks. Accordingly, loans made to these types of borrowers may entail higher risks than loans made to companies that have larger businesses, greater financial resources or are otherwise able to access traditional credit sources on more attractive terms.
Investing in lower middle-market companies involves a number of significant risks, including that lower middle-market companies:
•may have shorter operating histories, narrower product lines and smaller market shares than larger businesses, which tend to render them more vulnerable to competitors’ actions and market conditions, as well as general economic downturns;
•are more likely to depend on the management talents and efforts of a small group of persons; therefore, the death, disability, resignation or termination of one or more of these persons could have a material adverse impact on our portfolio company and, in turn, on us;
•typically have more limited access to the capital markets, which may hinder their ability to refinance borrowings;
•will be unable to refinance or repay at maturity the unamortized loan balance as we structure our loans such that a significant balance remains due at maturity;
•generally have less predictable operating results, may be particularly vulnerable to changes in customer preferences or market conditions, depend on one or a limited number of major customers;
•may from time to time be parties to litigation, may be engaged in rapidly changing businesses with products subject to a substantial risk of obsolescence, and may require substantial additional capital to support their operations, finance expansion or maintain their competitive position; and
•generally have less publicly available information about their businesses, operations and financial condition. If we are unable to uncover all material information about these companies, we may not make a fully informed investment decision, and may lose all or part of our investment.
Any of these factors or changes thereto could impair a portfolio company’s financial condition, results of operation, cash flow or result in other adverse events, such as bankruptcy, any of which could limit a portfolio company’s ability to make scheduled payments on loans from us. This, in turn, may lead to their inability to make payments on outstanding borrowings, which could result in losses in our loan portfolio and a decrease in our net interest income and book value.
We may be subject to risks associated with our investments in senior secured loans.
We invest in senior secured loans. Senior secured loans are usually rated below investment grade or may also be unrated. As a result, the risks associated with senior secured loans may be considered by credit rating agencies to be similar to the risks of below investment grade fixed income instruments, although senior secured loans are senior and secured in contrast to other below investment grade fixed income instruments, which are often subordinated or unsecured. Investment in senior secured loans rated below investment grade is considered speculative because of the credit risk of their issuers. Such companies are more likely than investment grade issuers to default on their payments of interest and principal owed to us, and such defaults could have a material adverse effect on our performance. An economic downturn would generally lead to a higher non-payment rate, and a senior secured loan may lose significant market value before a default occurs. Moreover, any specific collateral used to secure a senior secured loan may decline in value or become illiquid, which would adversely affect the senior secured loan’s value.
52
There may be less readily available and reliable information about most senior secured loans than is the case for many other types of securities, including securities issued in transactions registered under the Securities Act or registered under the Exchange Act. As a result, MC Advisors will rely primarily on its own evaluation of a borrower’s credit quality rather than on any available independent sources. Therefore, we will be particularly dependent on the analytical abilities of MC Advisors.
In general, the secondary trading market for senior secured loans is not well developed. No active trading market may exist for certain senior secured loans, which may make it difficult to value them. Illiquidity and adverse market conditions may mean that we may not be able to sell senior secured loans quickly or at a fair price. To the extent that a secondary market does exist for certain senior secured loans, the market for them may be subject to irregular trading activity, wide bid/ask spreads and extended trade settlement periods.
We may be subject to risks associated with our investments in junior debt securities.
We invest in junior debt securities. Although certain junior debt securities are typically senior to common stock or other equity securities, the equity and debt securities in which we will invest may be subordinated to substantial amounts of senior debt, all or a significant portion of which may be secured. Such subordinated investments may be characterized by greater credit risks than those associated with the senior obligations of the same issuer. These subordinated securities may not be protected by all of the financial covenants, such as limitations upon additional indebtedness, typically protecting such senior debt. Holders of junior debt generally are not entitled to receive full payments in bankruptcy or liquidation until senior creditors are paid in full. Holders of equity are not entitled to payments until all creditors are paid in full. In addition, the remedies available to holders of junior debt are normally limited by restrictions benefiting senior creditors. In the event any portfolio company cannot generate adequate cash flow to meet senior debt service, we may suffer a partial or total loss of capital invested.
We may be subject to risks associated with “covenant-lite” loans.
Certain loans in which we invest may be “covenant-lite.” We use the term “covenant-lite” loans to refer generally to loans that do not have a complete set of financial maintenance covenants. Generally, “covenant-lite” loans provide borrower companies more freedom to negatively impact lenders because their covenants are incurrence-based, which means they are only tested and can only be breached following an affirmative action of the borrower, rather than by a deterioration in the borrower’s financial condition. Accordingly, to the extent we are exposed to “covenant-lite” loans, we may have a greater risk of loss on such investments as compared to investments in or exposure to loans with financial maintenance covenants.
We may be subject to risks associated with our investments in unitranche secured loans and securities.
We invest in unitranche secured loans, which are a combination of senior secured and junior secured debt in the same facility in which we syndicate a “first out” portion of the loan to an investor and retain a “last out” portion of the loan. Unitranche secured loans provide all of the debt needed to finance a leveraged buyout or other corporate transaction, both senior and junior, but generally in a first lien position, while the borrower generally pays a blended, uniform interest rate rather than different rates for different tranches. Unitranche secured debt generally requires payments of both principal and interest throughout the life of the loan. Generally, we expect these securities to carry a blended yield that is between senior secured and junior debt interest rates. Unitranche secured loans provide a number of advantages for borrowers, including the following: simplified documentation, greater certainty of execution and reduced decision-making complexity throughout the life of the loan. In some cases, a portion of the total interest may accrue or be paid in kind. Because unitranche secured loans combine characteristics of senior and junior financing, unitranche secured loans have risks similar to the risks associated with senior secured and second lien loans and junior debt in varying degrees according to the combination of loan characteristics of the unitranche secured loan.
We may be subject to risks associated with our investments in bank loans.
We intend to invest in bank loans and participations. These obligations are subject to unique risks, including:
•the possible invalidation of an investment transaction as a fraudulent conveyance under relevant creditors’ rights laws,
•so-called lender-liability claims by the issuer of the obligations,
•environmental liabilities that may arise with respect to collateral securing the obligations, and
53
•limitations on our ability to directly enforce its rights with respect to participations.
In addition, the illiquidity of bank loans may make it difficult for us to sell such investments to access capital if required. As a result, we could realize significantly less than the value at which we have recorded our investments if we were required to sell them for liquidity purposes. Compared to securities and to certain other types of financial assets, purchases and sales of loans take relatively longer to settle. This extended settlement process can (i) increase the counterparty credit risk borne by us; (ii) leave us unable to timely vote, or otherwise act with respect to, loans it has agreed to purchase; (iii) delay us from realizing the proceeds of a sale of a loan; (iv) inhibit our ability to re-sell a loan that it has agreed to purchase if conditions change (leaving us more exposed to price fluctuations); (v) prevent us from timely collecting principal and interest payments; and (vi) expose us to adverse tax or regulatory consequences. To the extent the extended loan settlement process gives rise to short-term liquidity needs, we may hold cash, sell investments or temporarily borrow from banks or other lenders.
In purchasing participations, we generally will have no right to enforce compliance by the borrower with the terms of the loan agreement, nor any rights of set-off against the borrower, and we may not directly benefit from the collateral supporting the debt obligation in which we have purchased the participation. As a result, we will assume the credit risk of both the borrower and the institution selling the participation.
In analyzing each bank loan or participation, MC Advisors compares the relative significance of the risks against the expected benefits of the investment. Successful claims by third parties arising from these and other risks will be borne by us.
Loans may become nonperforming for a variety of reasons.
A loan or debt obligation may become non-performing for a variety of reasons. Such non-performing loans may require substantial workout negotiations or restructuring that may entail, among other things, a substantial reduction in the interest rate, a substantial write-down of the principal amount of the loan and/or the deferral of payments. In addition, such negotiations or restructuring may be quite extensive and protracted over time, and therefore may result in substantial uncertainty with respect to the ultimate recovery. We may also incur additional expenses to the extent that it is required to seek recovery upon a default on a loan or participate in the restructuring of such obligation. The liquidity for defaulted loans may be limited, and to the extent that defaulted loans are sold, it is highly unlikely that the proceeds from such sale will be equal to the amount of unpaid principal and interest thereon. In connection with any such defaults, workouts or restructuring, although we exercise voting rights with respect to an individual loan, we may not be able to exercise votes in respect of a sufficient percentage of voting rights with respect to such loan to determine the outcome of such vote.
The lack of liquidity in our investments may adversely affect our business.
All of our assets may be invested in illiquid securities, and a substantial portion of our investments in leveraged companies will be subject to legal and other restrictions on resale or will otherwise be less liquid than more broadly traded public securities. The illiquidity of these investments may make it difficult for us to sell such investments when desired. In addition, if we are required to liquidate all or a portion of our portfolio quickly, we may realize significantly less than the value at which we have previously recorded these investments. As a result, we do not expect to achieve liquidity in our investments in the near-term. However, to maintain the election to be regulated as a BDC and qualify as a RIC, we may have to dispose of investments if we do not satisfy one or more of the applicable criteria under the respective regulatory frameworks. We may also face other restrictions on our ability to liquidate an investment in a portfolio company to the extent that we or MC Advisors have material nonpublic information regarding such portfolio company.
Price declines and illiquidity in the corporate debt markets may adversely affect the fair value of our portfolio investments, reducing our net asset value through increased net unrealized losses.
As a BDC, we are required to carry our investments at market value or, if no market value is ascertainable, at fair value as determined in good faith by the Valuation Designee. When an external event such as a purchase transaction, public offering or subsequent equity sale occurs, we use the pricing indicated by the external event to corroborate our valuation. We record decreases in the market values or fair values of our investments as unrealized losses. Declines in prices and liquidity in the corporate debt markets may result in significant net unrealized losses on our portfolio. The effect of all of these factors on our portfolio may reduce our net asset value by increasing net unrealized losses on our portfolio. Depending on market conditions, we could incur substantial realized losses and may suffer additional unrealized losses in future periods, which could have a material adverse effect on our business, financial condition and results of operations.
54
Our portfolio companies may prepay loans, which prepayment may reduce stated yields if capital returned cannot be invested in transactions with equal or greater expected yields.
The loans underlying our portfolio may be callable at any time, and many of them can be repaid with no premium to par. It is generally not clear and highly unpredictable when or if any loan might be called. Whether a loan is called will depend both on the continued positive performance of the portfolio company and the existence of favorable financing market conditions that allow such company the ability to replace existing financing with less expensive capital. As market conditions change frequently, it is unknown when, and if, this may be possible for each portfolio company. Risks associated with owning loans include the fact that prepayments may occur at any time, sometimes without premium or penalty, and that the exercise of prepayment rights during periods of declining spreads could cause us to reinvest prepayment proceeds in lower-yielding instruments. In the case of some of these loans, having the loan called early may reduce our achievable yield if the capital returned cannot be invested in transactions with equal or greater expected yields.
We may be subject to risks associated with real estate-related investments.
As of December 31, 2023, our investments in the FIRE: Real Estate industry represented approximately 17.4% of the fair value of our portfolio. We may invest portions of our portfolio in the real estate industry, and such investments will be subject to the risks inherent to investment in real estate-related assets generally. These risks include, but are not limited to, regional, national and international economic conditions, the supply and demand for properties, the financial resources of tenants, buyers and sellers of properties, changes in building, environmental, zoning and other laws and regulations, changes in real property tax rates, changes in interest rates and the availability of financing, which may render the sale or refinancing of properties difficult or impracticable, environmental liabilities, uninsured losses, acts of God, natural disasters, terrorist attacks, acts of war (declared and undeclared), strikes and other factors which are beyond our control. Any of these factors could lead to a significant decline in the value of our real estate-related investments, and could in turn, materially adversely affect our business, financial condition and results of operations.
We may be subject to risks associated with our investments in the technology industry.
We may invest portions of our portfolio in the technology industry. There are risks in investing in companies that target technology-related markets, including rapid and sometimes dramatic price erosion of products, the reliance on capital and debt markets to finance large capital outlays, including fabrication facilities, the reliance on partners outside of the United States, particularly in Asia, and inherent cyclicality of the technology market in general. As a result of multiple factors, access to capital may be difficult or impossible for companies in our portfolio that are pursuing these markets. The revenue, income (or losses) and valuations of technology-related companies can and often do fluctuate suddenly and dramatically. In addition, because of rapid technological change, the average selling prices of products and some services provided by technology-related sectors have historically decreased over their productive lives. As a result, the average selling prices of products and services offered by our portfolio companies that operate in technology-related sectors may decrease over time, which could adversely affect their operating results and, correspondingly, the value of any securities that we may hold. This could, in turn, materially adversely affect our business, financial condition and results of operations.
We may be subject to risks associated with our investments in the business services industry.
As of December 31, 2023, our investments in the Services: Business industry represented approximately 11.6% of the fair value of our portfolio. Portfolio companies in the business services sector are subject to many risks, including the negative impact of regulation, changing technology, a competitive marketplace and difficulty in obtaining financing. Portfolio companies in the business services industry must respond quickly to technological changes and understand the impact of these changes on customers’ preferences. Adverse economic, business, or regulatory developments affecting the business services sector could have a negative impact on the value of our investments in portfolio companies operating in this industry, and therefore could negatively impact our business and results of operations.
We may be subject to risks associated with our investments in the insurance industry.
We may invest portions of our portfolio in the insurance industry. The insurance business has historically been a cyclical industry characterized by periods of intense price competition due to excessive underwriting capacity, as well as periods when shortages of capacity permitted an increase in pricing and, thus, more favorable underwriting profits. An increase in premium levels is often offset over time by an increasing supply of insurance capacity in the form of capital provided by new entrants and existing insurers, which may cause prices to decrease. Any of these factors could lead to a significant reduction in premium rates, less favorable policy terms and fewer opportunities for our portfolio companies to underwrite insurance risks. Any of these factors could in turn, materially adversely affect our business, financial condition and results of operations.
55
We may be subject to risks associated with our investments in the finance industry.
We may invest portions of our portfolio in the finance industry. The regulatory environment in which the finance industry operates could have a material adverse effect on business and operating results for our portfolio companies. Our portfolio companies are subject to a wide variety of laws and regulations in the jurisdictions where they operate, including supervision and licensing by numerous governmental entities. These laws and regulations can create significant constraints on operations and result in significant costs related to compliance. Failure to comply with these laws and regulations could impair the ability of a portfolio company to continue operating and result in substantial civil and criminal penalties, monetary damages, attorneys’ fees and costs, possible revocation of licenses, and damage to reputation, brand and valued customer relationships. Any of these factors could in turn, materially adversely affect our business, financial condition and results of operations.
Our investments in the healthcare and pharmaceutical services industry sector are subject to extensive government regulation and certain other risks particular to that industry.
As of December 31, 2023, our investments in the Healthcare & Pharmaceuticals industry represented approximately 14.2% of the fair value of our portfolio. We invest in healthcare and pharmaceutical services companies. Our investments in portfolio companies that operate in this sector are subject to certain significant risks particular to that industry. The laws and rules governing the business of healthcare companies and interpretations of those laws and rules are subject to frequent change. Broad latitude is given to the agencies administering those regulations. Existing or future laws and rules could force our portfolio companies engaged in healthcare to change how they do business, restrict revenue, increase costs, change reserve levels and change business practices. Healthcare companies often must obtain and maintain regulatory approvals to market many of their products, change prices for certain regulated products and consummate some of their acquisitions and divestitures. Delays in obtaining or failing to obtain or maintain these approvals could reduce revenue or increase costs. Policy changes on the local, state and federal level, such as the expansion of the government’s role in the healthcare arena and alternative assessments and tax increases specific to the healthcare industry or healthcare products as part of federal health care reform initiatives, could fundamentally change the dynamics of the healthcare industry. In particular, health insurance reform, including The Patient Protection and Affordable Care Act and The Health Care and Education Reconciliation Act of 2010, or Health Insurance Reform Legislation, could have a significant effect on our portfolio companies in this industry sector. As Health Insurance Reform Legislation is implemented, our portfolio companies in this industry sector may be forced to change how they do business. We can give no assurance that these portfolio companies will be able to adapt successfully in response to these changes. Any of these factors could materially adversely affect the operations of a portfolio company in this industry sector and, in turn, impair our ability to timely collect principal and interest payments owed to us.
To the extent original issue discount and payment-in-kind interest constitute a portion of our income, we will be exposed to typical risks associated with such income being required to be included in taxable and accounting income prior to receipt of cash representing such income.
Our investments include original issue discount ("OID"), components and may include PIK interest or PIK dividend components. For the year ended December 31, 2023, PIK interest and PIK dividends comprised approximately 14.6% and 0.7% of our investment income, respectively. To the extent original issue discount constitutes a portion of our income, we are exposed to typical risks associated with such income being required to be included in taxable and accounting income prior to receipt of cash, including the following:
•We must include in income each year a portion of the OID that accrues over the life of the obligation, regardless of whether cash representing such income is received by us in the same taxable year. Because any OID or other amounts accrued will be included in investment company taxable income for the year of the accrual, we may be required to make a distribution to our stockholders in order to satisfy our annual distribution requirements, even though we will not have received any corresponding cash amount. As a result, we may have to sell some of our investments at times or at prices that would not be advantageous to us, raise additional debt or equity capital or forgo new investment opportunities;
•The higher yield of OID instruments reflect the payment deferral and credit risk associated with these instruments;
•Even if the accounting conditions for income accrual are met, the borrower could still default when our actual collection is supposed to occur at the maturity of the obligation;
•OID instruments may have unreliable valuations because their continuing accruals require continuing judgments about the collectability of the deferred payments and the value of the collateral;
56
•OID instruments generally represent a significantly higher credit risk than coupon loans;
•OID income received by us may create uncertainty about the source of our cash distributions to stockholders. For accounting purposes, any cash distributions to stockholders representing OID or market discount income are not treated as coming from paid-in capital, even though the cash to pay them comes from the offering proceeds. Thus, although a distribution of OID or market discount interest comes from the cash invested by the stockholders, Section 19(a) of the 1940 Act does not require that stockholders be given notice of this fact by reporting it as a return of capital;
•The deferral of PIK interest has a negative impact on liquidity, as it represents non-cash income that may require distribution of cash dividends to stockholders in order to maintain our RIC status. In addition, the deferral of PIK interest also increases the loan-to-value (“LTV”) ratio at a compounding rate, thus, increasing the risk that we will absorb a loss in the event of foreclosure; and
•OID and market discount instruments create the risk of non-refundable incentive fee payments to MC Advisors based on non-cash accruals that we may not ultimately realize.
We are a non-diversified investment company within the meaning of the 1940 Act, and therefore we are not limited by the 1940 Act with respect to the proportion of our assets that may be invested in securities of a single issuer.
We are classified as a non-diversified investment company within the meaning of the 1940 Act, which means that we are not limited by the 1940 Act with respect to the proportion of our assets that we may invest in securities of a single issuer. Our portfolio is and may in the future be concentrated in a limited number of portfolio companies and industries. Beyond the asset diversification requirements associated with our qualification as a RIC under the Code, we do not have fixed guidelines for diversification. Although we are classified as a non-diversified investment company within the meaning of the 1940 Act, we maintain the flexibility to operate as a diversified investment company and have done so for an extended period of time. To the extent that we operate as a non-diversified investment company in the future, we may be subject to greater risk. To the extent that we assume large positions in the securities of a small number of issuers, our net asset value may fluctuate to a greater extent than that of a diversified investment company as a result of changes in the financial condition or the market’s assessment of the issuer. We may also be more susceptible to any single economic or regulatory occurrence than a diversified investment company. As a result, the aggregate returns we realize may be significantly adversely affected if a small number of investments perform poorly or if we need to write down the value of any one investment. Additionally, while we are not targeting any specific industries, our investments may be concentrated in relatively few industries. As a result, a downturn in any particular industry in which we are invested could also significantly impact the aggregate returns we realize.
We may hold the debt securities of leveraged companies that may, due to the significant volatility of such companies, enter into bankruptcy proceedings.
Leveraged companies may experience bankruptcy or similar financial distress. The bankruptcy process has a number of significant inherent risks. Many events in a bankruptcy proceeding are the product of contested matters and adversary proceedings and are beyond the control of the creditors. A bankruptcy filing by a portfolio company may adversely and permanently affect the portfolio company. If the proceeding is converted to a liquidation, the value of the issuer may not equal the liquidation value that was believed to exist at the time of the investment. A bankruptcy or other workout often raise conflicts of interest (including, for example, conflicts over proposed waivers and amendments to debt covenants), including between investors who hold different interests in the applicable company. The duration of a bankruptcy proceeding is also difficult to predict, and a creditor’s return on investment can be adversely affected by delays until the plan of reorganization or liquidation ultimately becomes effective. The administrative costs in connection with a bankruptcy proceeding are frequently high and would be paid out of the debtor’s estate prior to any return to creditors. Because the standards for classification of claims under bankruptcy law are vague, our influence with respect to the class of securities or other obligations we own may be lost by increases in the number and amount of claims in the same class or by different classification and treatment. In the early stages of the bankruptcy process, it is often difficult to estimate the extent of, or even to identify, any contingent claims that might be made. In addition, certain claims that have priority by law (for example, claims for taxes) may be substantial.
57
Our failure to make follow-on investments in our portfolio companies could impair the value of our portfolio.
Following an initial investment in a portfolio company, we may make additional investments in that portfolio company as “follow-on” investments, in seeking to:
•increase or maintain in whole or in part our position as a creditor or equity ownership percentage in a portfolio company;
•exercise warrants, options or convertible securities that were acquired in the original or subsequent financing; or
•preserve or enhance the value of our investment.
We have discretion to make follow-on investments, subject to the availability of capital resources and the provisions of the 1940 Act. Failure on our part to make follow-on investments may, in some circumstances, jeopardize the continued viability of a portfolio company and our initial investment, or may result in a missed opportunity for us to increase our participation in a successful operation. Even if we have sufficient capital to make a desired follow-on investment, we may elect not to make a follow-on investment because we may not want to increase our level of risk, because we prefer other opportunities or because we are inhibited by compliance with BDC requirements or the desire to maintain our RIC status. Our ability to make follow-on investments may also be limited by MC Advisors’ allocation policy.
Because we do not hold controlling equity interests in the majority of our portfolio companies, we may not be able to exercise control over our portfolio companies or to prevent decisions by management of our portfolio companies, which could decrease the value of our investments.
Although we may do so in the future, we do not currently hold controlling equity positions in the majority of our portfolio companies. Our debt investments may provide limited control features such as restrictions, for example, on the ability of a portfolio company to assume additional debt, or to use the proceeds of our investment for other than certain specified purposes. “Control” under the 1940 Act is presumed at more than 25% equity ownership, and may also be present at lower ownership levels where we provide managerial assistance. When we do not acquire a controlling equity position in a portfolio company, we may be subject to the risk that a portfolio company may make business decisions with which we disagree, and that the management and/or stockholders of a portfolio company may take risks or otherwise act in ways that are adverse to our interests. Due to the lack of liquidity of the debt and equity investments that we typically hold in our portfolio companies, we may not be able to dispose of our investments in the event we disagree with the actions of a portfolio company and may therefore suffer a decrease in the value of our investments.
Defaults by our portfolio companies will harm our operating results.
A portfolio company’s failure to satisfy financial or operating covenants imposed by us or other lenders could lead to defaults and, potentially, termination of its loans and foreclosure on its assets. This could trigger cross-defaults under other agreements and jeopardize such portfolio company’s ability to meet its obligations under the debt or equity securities that we hold. We may incur expenses to the extent necessary to seek recovery upon default or to negotiate new terms, which may include the waiver of certain financial covenants, with a defaulting portfolio company.
In addition, many of our investments will likely have a principal amount outstanding at maturity, which could result in a substantial loss to us if the borrower is unable to refinance or repay.
Our portfolio companies may incur debt that ranks equally with, or senior to, our investments in such companies.
We generally seek to invest capital in senior, unitranche and junior secured loans and, to a lesser extent, unsecured subordinated debt and equity. The portfolio companies in which we invest usually have, or may be permitted to incur, other debt that ranks equally with, or senior to, the debt securities in which we invest. By their terms, such debt instruments may provide that the holders are entitled to receive payment of interest or principal on or before the dates on which we are entitled to receive payments in respect of the debt securities in which we invest. Also, in the event of insolvency, liquidation, dissolution, reorganization or bankruptcy of a portfolio company, holders of debt instruments ranking senior to our investment in that portfolio company would typically be entitled to receive payment in full before we receive any distribution in respect of our investment. After repaying senior creditors, the portfolio company may not have any remaining assets to use for repaying its obligation to us. In the case of debt ranking equally with debt securities in which we invest, we would have to share any distributions on an equal and ratable basis with other creditors holding such debt in the event of an insolvency, liquidation, dissolution, reorganization or bankruptcy of the relevant portfolio company.
58
Additionally, certain loans that we make to portfolio companies may be secured on a second-priority basis by the same collateral securing senior secured debt of such companies. The first-priority liens on the collateral will secure the portfolio company’s obligations under any outstanding senior debt and may secure certain other future debt that may be permitted to be incurred by the portfolio company under the agreements governing the loans. The holders of obligations secured by first-priority liens on the collateral will generally control the liquidation of, and be entitled to receive proceeds from, any realization of the collateral to repay their obligations in full before us. In addition, the value of the collateral in the event of liquidation will depend on market and economic conditions, the availability of buyers and other factors. There can be no assurance that the proceeds, if any, from sales of all of the collateral would be sufficient to satisfy the loan obligations secured by the second-priority liens after payment in full of all obligations secured by the first-priority liens on the collateral. If such proceeds were not sufficient to repay amounts outstanding under the loan obligations secured by the second-priority liens, then, to the extent not repaid from the proceeds of the sale of the collateral, we will only have an unsecured claim against the portfolio company’s remaining assets, if any.
The rights we may have with respect to the collateral securing the loans we make to our portfolio companies with senior debt outstanding may also be limited pursuant to the terms of one or more intercreditor agreements that we enter into with the holders of such senior debt, including in unitranche secured transactions. Under a typical intercreditor agreement, at any time that obligations that have the benefit of the first-priority liens are outstanding, any of the following actions that may be taken in respect of the collateral will be at the direction of the holders of the obligations secured by the first-priority liens:
•the ability to cause the commencement of enforcement proceedings against the collateral;
•the ability to control the conduct of such proceedings;
•the approval of amendments to collateral documents;
•releases of liens on the collateral; and
•waivers of past defaults under collateral documents.
We may not have the ability to control or direct such actions, even if our rights are adversely affected. In addition, a bankruptcy court may choose not to enforce an intercreditor agreement or other agreement with creditors.
We may also make unsecured loans to portfolio companies, meaning that such loans will not benefit from any interest in collateral of such companies. Liens on such portfolio companies’ collateral, if any, will secure the portfolio company’s obligations under its outstanding secured debt and may secure certain future debt that is permitted to be incurred by the portfolio company under its secured loan agreements. The holders of obligations secured by such liens will generally control the liquidation of, and be entitled to receive proceeds from, any realization of such collateral to repay their obligations in full before us. In addition, the value of such collateral in the event of liquidation will depend on market and economic conditions, the availability of buyers and other factors. There can be no assurance that the proceeds, if any, from sales of such collateral would be sufficient to satisfy our unsecured loan obligations after payment in full of all secured loan obligations. If such proceeds were not sufficient to repay the outstanding secured loan obligations, then our unsecured claims would rank equally with the unpaid portion of such secured creditors’ claims against the portfolio company’s remaining assets, if any.
We may also make subordinated investments that rank below other obligations of the obligor in right of payment. Subordinated investments are generally more volatile than secured loans and are subject to greater risk of default than senior obligations as a result of adverse changes in the financial condition of the obligor or in general economic conditions. If we make a subordinated investment in a portfolio company, the portfolio company may be highly leveraged, and its relatively high LTV ratio may create increased risks that its operations might not generate sufficient cash flow to service all of its debt obligations.
59
We may be subject to risks associated with syndicated loans.
From time to time, our investments may consist of syndicated loans. Under the documentation for such loans, a financial institution or other entity typically is designated as the administrative agent and/or collateral agent. This agent is granted a lien on any collateral on behalf of the other lenders and distributes payments on the indebtedness as they are received. The agent is the party responsible for administering and enforcing the loan and generally may take actions only in accordance with the instructions of a majority or two-thirds in commitments and/or principal amount of the associated indebtedness. In most cases, we do not expect to hold a sufficient amount of the indebtedness to be able to compel any actions by the agent. Accordingly, we may be precluded from directing such actions unless we act together with other holders of the indebtedness. If we are unable to direct such actions, we cannot assure you that the actions taken will be in our best interests.
There is a risk that a loan agent may become bankrupt or insolvent. Such an event would delay, and possibly impair, any enforcement actions undertaken by holders of the associated indebtedness, including attempts to realize upon the collateral securing the associated indebtedness and/or direct the agent to take actions against the related obligor or the collateral securing the associated indebtedness and actions to realize on proceeds of payments made by obligors that are in the possession or control of any other financial institution. In addition, we may be unable to remove the agent in circumstances in which removal would be in our best interests. Moreover, agented loans typically allow for the agent to resign with certain advance notice.
The disposition of our investments may result in contingent liabilities.
A significant portion of our investments involve private securities. In connection with the disposition of an investment in private securities, we may be required to make representations about the business and financial affairs of the portfolio company typical of those made in connection with the sale of a business. We may also be required to indemnify the purchasers of such investment to the extent that any such representations turn out to be inaccurate or with respect to potential liabilities. These arrangements may result in contingent liabilities that ultimately result in funding obligations that we must satisfy through our return of distributions previously made to us.
We may be subject to additional risks if we engage in hedging transactions and/or invest in foreign securities.
The 1940 Act generally requires that 70% of our investments be in issuers each of whom, in addition to other requirements, is organized under the laws of, and has its principal place of business in, any state of the United States, the District of Columbia, Puerto Rico, the Virgin Islands or any other territory of the United States. Our investment strategy does not contemplate a significant number of investments in securities of non-U.S. companies. We expect that these investments would focus on the same investments that we make in U.S. middle-market companies and, accordingly, would be complementary to our overall strategy and enhance the diversity of our holdings.
To the extent that these investments are denominated in a foreign currency, we may engage in hedging transactions. Engaging in either hedging transactions or investing in foreign securities would entail additional risks to our stockholders. We may, for example, use instruments such as interest rate swaps, caps, collars and floors, forward contracts or currency options or borrow under a revolving credit facility in foreign currencies to minimize our foreign currency exposure. In each such case, we generally would seek to hedge against fluctuations of the relative values of our portfolio positions from changes in market interest rates or currency exchange rates. Hedging against a decline in the values of our portfolio positions would not eliminate the possibility of fluctuations in the values of such positions or prevent losses if the values of the positions declined. However, such hedging could establish other positions designed to gain from those same developments, thereby offsetting the decline in the value of such portfolio positions. Such hedging transactions could also limit the opportunity for gain if the values of the underlying portfolio positions increased. Moreover, it might not be possible to hedge against an exchange rate or interest rate fluctuation that was so generally anticipated that we would not be able to enter into a hedging transaction at an acceptable price. Our ability to engage in hedging transactions may also be adversely affected by rules adopted by the U.S. Commodity Futures Trading Commission.
60
While we may enter into such transactions to seek to reduce currency exchange rate and interest rate risks, unanticipated changes in currency exchange rates or interest rates could result in poorer overall investment performance than if we had not engaged in any such hedging transactions. In addition, the degree of correlation between price movements of the instruments used in a hedging strategy and price movements in the portfolio positions being hedged could vary. Moreover, for a variety of reasons, we might not seek to establish a perfect correlation between the hedging instruments and the portfolio holdings being hedged. Any such imperfect correlation could prevent us from achieving the intended hedge and expose us to risk of loss. In addition, it might not be possible to hedge fully or perfectly against currency fluctuations affecting the value of securities denominated in non-U.S. currencies because the value of those securities would likely fluctuate as a result of factors not related to currency fluctuations.
We may not realize gains from our equity investments.
We currently hold, and we may in the future make, investments that include warrants or other equity or equity-related securities. In addition, we may from time to time make non-control, equity co-investments in companies in conjunction with private equity sponsors. Our goal is ultimately to realize gains upon our disposition of such equity interests. However, the equity interests we receive may not appreciate in value and, in fact, may decline in value. Accordingly, we may not be able to realize gains from our equity interests, and any gains that we do realize on the disposition of any equity interests may not be sufficient to offset any other losses we experience. We also may be unable to realize any value if a portfolio company does not have a liquidity event, such as a sale of the business, recapitalization or public offering, which would allow us to sell the underlying equity interests. We often seek puts or similar rights to give us the right to sell our equity securities back to the portfolio company issuer. We may be unable to exercise these put rights for the consideration provided in our investment documents if the issuer is in financial distress.
Risks Relating to Our Common Stock
We may not be able to pay distributions, our distributions may not grow over time and/or a portion of our distributions may be a return of capital.
We have paid and intend to continue to pay distributions to our stockholders out of assets legally available for distribution. We cannot assure you that we will achieve investment results that will allow us to sustain a specified level of cash distributions or make periodic increases in cash distributions. Our ability to pay distributions might be adversely affected by, among other things, the impact of one or more of the risk factors described herein. In addition, the inability to satisfy the asset coverage test applicable to us as a BDC could limit our ability to pay distributions. All distributions will be paid at the discretion of our Board and will depend on our earnings, our financial condition, maintenance of our RIC status, compliance with applicable BDC regulations and such other factors as our Board may deem relevant from time to time. We cannot assure you that we will continue to pay distributions to our stockholders.
When we make distributions, we will be required to determine the extent to which such distributions are paid out of current or accumulated earnings and profits. Distributions in excess of current and accumulated earnings and profits will be treated as a non-taxable return of capital to the extent of an investor’s adjusted tax basis in our stock and, assuming that an investor holds our stock as a capital asset, thereafter as a capital gain.
61
We may choose to pay a portion of our dividends in our own stock, in which case you may be required to pay tax in excess of the cash you receive.
We have adopted a dividend reinvestment plan that provides for reinvestment of our dividends and other distributions on behalf of our stockholders, unless a stockholder elects to receive cash pursuant to such plan. We may distribute taxable dividends that are payable in part in our stock. Taxable stockholders receiving such dividends will be required to include the full amount of the dividend as ordinary income (or as long-term capital gain or qualified dividend income to the extent such distribution is properly reported as such) to the extent of our current and accumulated earnings and profits for U.S. federal income tax purposes. The tax rate for ordinary income will vary depending on a stockholder’s particular characteristics. For individuals, the top marginal U.S. federal ordinary income tax rate is 37%. To the extent distributions paid by us to non-corporate stockholders (including individuals) are attributable to dividends from U.S. corporations and certain qualified foreign corporations, such distributions generally will be eligible for a maximum qualified dividend U.S. federal tax rate of 20%. However, in this regard, it is anticipated that distributions paid by us will generally not be attributable to such dividends and, therefore, generally will not qualify for the U.S. preferential federal tax rate. Distributions of our net capital gains (which is generally our realized net long-term capital gains in excess of realized net short-term capital losses) properly reported by us as “capital gain dividends” will be taxable to an individual U.S. stockholder as long-term capital gains currently at a maximum U.S. federal tax rate of 20%.
As a result of receiving dividends in the form of our common stock, a U.S. stockholder may be required to pay tax with respect to such dividends in excess of any cash received. If a U.S. stockholder sells the stock it receives as a dividend in order to pay this tax, the sales proceeds may be less than the amount included in income with respect to the dividend, depending on the market price of our stock at the time of the sale. Furthermore, with respect to non-U.S. stockholders, we may be required to withhold U.S. federal tax with respect to such dividends, including in respect of all or a portion of such dividend that is payable in shares of our common stock. In addition, if a significant number of our stockholders determine to sell shares of our stock in order to pay taxes owed on dividends, it may put downward pressure on the trading price of shares of our common stock.
In addition, as discussed above, our loans may contain a PIK interest provision. The PIK interest, computed at the contractual rate specified in each loan agreement, is added to the principal balance of the loan and recorded as interest income. To avoid the imposition of U.S. federal income tax at corporate rates, we will need to make sufficient distributions, a portion of which may be paid in shares of our common stock, regardless of whether our recognition of income is accompanied by a corresponding receipt of cash.
If we sell common stock at a discount to our net asset value per share, stockholders who do not participate in such sale will experience immediate dilution in an amount that may be material.
The issuance or sale by us of shares of our common stock at a price per share, after offering expenses and commission, that is a discount to net asset value poses a risk of dilution to our stockholders. In particular, stockholders who do not purchase additional shares at or below the discounted price in proportion to their current ownership will experience an immediate decrease in net asset value per share (as well as in the aggregate net asset value of their shares if they do not participate at all). These stockholders will also experience a disproportionately greater decrease in their participation in our earnings and assets and their voting power than the increase we experience in our assets, potential earning power and voting interests from such issuance or sale. In addition, such sales may adversely affect the price at which our common stock trades.
Investing in our common stock may involve an above-average degree of risk.
The investments we make in accordance with our investment objective may result in a higher amount of risk than alternative investment options and a higher risk of volatility or loss of principal. Our investments in portfolio companies may be highly speculative and aggressive and, therefore, an investment in our common stock may not be suitable for someone with lower risk tolerance.
Shares of closed-end investment companies, including BDCs, often trade at a discount to their net asset value, and our shares have not traded at or above net asset value since the second quarter of 2022.
Shares of closed-end investment companies, including BDCs, may trade at a discount from net asset value. This characteristic of closed-end investment companies and BDCs is separate and distinct from the risk that our net asset value per share may decline. Our common stock has not traded at or above net asset value since the second quarter of 2022, and we cannot predict whether our common stock will trade at, above or below net asset value.
62
Provisions of the Maryland General Corporation Law and our charter and bylaws could deter takeover attempts and have an adverse effect on the price of our common stock.
The Maryland General Corporation Law and our charter and bylaws contain provisions that may discourage, delay or make more difficult a change in control of us or the removal of our directors. We are subject to the Maryland Business Combination Act, subject to any applicable requirements of the 1940 Act. Our Board has adopted a resolution exempting from the Maryland Business Combination Act any business combination between us and any other person, subject to prior approval of such business combination by our Board, including approval by a majority of our independent directors. If the resolution exempting business combinations is repealed or our Board does not approve a business combination, the Maryland Business Combination Act may discourage third parties from trying to acquire control of us and increase the difficulty of consummating such an offer. The SEC staff has taken the position that, under the 1940 Act, an investment company may not avail itself of the Maryland Control Share Acquisition Act. As a result, we may amend our bylaws to be subject to the Maryland Control Share Acquisition Act, only if the Board determines that it would be in our best interests, including in light of the Board’s fiduciary obligations, applicable federal and state laws, and the particular facts and circumstances surrounding the Board’s decision. If such conditions are met, and we amend our bylaws to repeal the exemption from the Maryland Control Share Acquisition Act, the Maryland Control Share Acquisition Act also may make it more difficult for a third party to obtain control of us and increase the difficulty of consummating such a transaction.
We have adopted certain measures that may make it difficult for a third-party to obtain control of us, including provisions of our charter classifying our Board in three staggered terms and authorizing our Board to classify or reclassify shares of our capital stock in one or more classes or series and to cause the issuance of additional shares of our stock. These provisions, as well as other provisions of our charter and bylaws, may delay, defer or prevent a transaction or a change in control that might otherwise be in the best interests of our stockholders.
The market price of our securities fluctuates.
The market price and liquidity of the market for our securities fluctuates and may be significantly affected by numerous factors, some of which are beyond our control and may not be directly related to our operating performance. These factors may include:
•significant volatility in the market price and trading volume of securities of BDCs or other companies in our sector, which is not necessarily related to the operating performance of these companies;
•changes in regulatory policies or tax guidelines, particularly with respect to RICs or BDCs;
•loss of RIC or BDC status;
•changes or perceived changes in earnings or variations in operating results;
•changes or perceived changes in the value of our portfolio of investments;
•changes in accounting guidelines governing valuation of our investments;
•any shortfall in revenue or net income or any increase in losses from levels expected by investors or securities analysts;
•departure of MC Advisors’ key personnel;
•the occurrence of one or more natural disasters, pandemic outbreaks or other health crises;
•operating performance of companies comparable to us;
•general economic trends and other external factors; and
•loss of a major funding source.
63
Risks Relating to the 2026 Notes
The 4.75% Notes due 2026 (the “2026 Notes”) are unsecured and therefore are effectively subordinated to any secured indebtedness we have incurred or may incur in the future.
The 2026 Notes are not secured by any of our assets or any of the assets of any of our subsidiaries. As a result, the 2026 Notes are effectively subordinated to any secured indebtedness we or our subsidiaries have incurred or that we or our subsidiaries may incur in the future (or any indebtedness that is initially unsecured as to which we subsequently grant a security interest) to the extent of the value of the assets securing such indebtedness. In any liquidation, dissolution, bankruptcy or other similar proceeding, the holders of any of our existing or future secured indebtedness and the secured indebtedness of our subsidiaries may assert rights against the assets pledged to secure that indebtedness in order to receive full payment of their indebtedness before the assets may be used to pay other creditors, including the holders of the 2026 Notes. As of December 31, 2023, we had $174.1 million in outstanding indebtedness under the revolving credit facility. The indebtedness under the revolving credit facility is effectively senior to the 2026 Notes to the extent of the value of the assets securing such indebtedness.
The 2026 Notes are structurally subordinated to the indebtedness and other liabilities of our subsidiaries.
The 2026 Notes are obligations exclusively of the Company, and not of any of our subsidiaries. None of our subsidiaries is a guarantor of the 2026 Notes, and the 2026 Notes are not required to be guaranteed by any subsidiary we may acquire or create in the future. Any assets of our subsidiaries are not directly available to satisfy the claims of our creditors, including holders of the 2026 Notes. Except to the extent we are a creditor with recognized claims against our subsidiaries, all claims of creditors of our subsidiaries will have priority over our equity interests in such entities (and therefore the claims of our creditors, including holders of the 2026 Notes) with respect to the assets of such entities. Even if we are recognized as a creditor of one or more of these entities, our claims would still be effectively subordinated to any security interests in the assets of any such entity and to any indebtedness or other liabilities of any such entity senior to our claims. Consequently, the 2026 Notes are structurally subordinated to all indebtedness and other liabilities, including trade payables, of any of our existing or future subsidiaries. As of December 31, 2023, our subsidiaries did not have any outstanding indebtedness. Certain of these entities currently serve as guarantors under our revolving credit facility, and in the future our subsidiaries may incur substantial additional indebtedness, all of which is and would be structurally senior to the 2026 Notes.
The indenture under which the 2026 Notes are issued contains limited protection for holders of the 2026 Notes.
The indenture under which the 2026 Notes are issued offers limited protection to holders of the 2026 Notes. The terms of the indenture and the 2026 Notes do not restrict our or any of our subsidiaries’ ability to engage in, or otherwise be a party to, a variety of corporate transactions, circumstances or events that could have an adverse impact on investments in the 2026 Notes. In particular, the terms of the indenture and the 2026 Notes do not place any restrictions on our or our subsidiaries’ ability to:
•issue securities or otherwise incur additional indebtedness or other obligations, including (1) any indebtedness or other obligations that would be equal in right of payment to the 2026 Notes, (2) any indebtedness or other obligations that would be secured and therefore rank effectively senior in right of payment to the 2026 Notes to the extent of the values of the assets securing such debt, (3) indebtedness of ours that is guaranteed by one or more of our subsidiaries and which therefore is structurally senior to the 2026 Notes and (4) securities, indebtedness or obligations issued or incurred by our subsidiaries that would be senior to our equity interests in our subsidiaries and therefore rank structurally senior to the 2026 Notes with respect to the assets of our subsidiaries, in each case other than an incurrence of indebtedness or other obligation that would cause a violation of Section 18(a)(1)(A) as modified by Section 61(a)(2) of the 1940 Act or any successor provisions, whether or not we continue to be subject to such provisions of the 1940 Act, but giving effect, in either case, to any exemptive relief granted to us by the SEC, which generally prohibit us from incurring additional indebtedness, including through the issuance of additional debt securities, unless our asset coverage, as defined in the 1940 Act, equals at least 150% after such incurrence or issuance;
64
•pay dividends on, or purchase or redeem or make any payments in respect of, capital stock or other securities ranking junior in right of payment to the 2026 Notes, including subordinated indebtedness, except that we have agreed that, for the period of time during which the 2026 Notes are outstanding, we will not violate Section 18(a)(1)(B) as modified by (i) Section 61(a)(2) of the 1940 Act or any successor provisions thereto, whether or not we are subject to such provisions of the 1940 Act and after giving effect to any exemptive relief granted to us by the SEC and (ii) the following two exceptions: (A) we will be permitted to declare a cash dividend or distribution notwithstanding the prohibition contained in Section 18(a)(1)(B) as modified by Section 61(a)(2) of the 1940 Act or any successor provisions, but only up to such amount as is necessary for us to maintain our status as a RIC under Subchapter M of the Code; and (B) this restriction will not be triggered unless and until such time as our asset coverage has not been in compliance with the minimum asset coverage required by Section 18(a)(1)(B) as modified by Section 61(a)(2) of the 1940 Act or any successor provisions (after giving effect to any exemptive relief granted to us by the SEC) for more than six consecutive months. If Section 18(a)(1)(B) as modified by Section 61(a)(2) of the 1940 Act were currently applicable to us, these provisions would generally prohibit us from declaring any cash dividend or distribution upon any class of our capital stock, or purchasing any such capital stock if our asset coverage, as defined in the 1940 Act, were below 150% at the time of the declaration of the dividend or distribution or the purchase and after deducting the amount of such dividend, distribution or purchase;
•sell assets (other than certain limited restrictions on our ability to consolidate, merge or sell all or substantially all of our assets);
•enter into transactions with affiliates;
•create liens (including liens on the shares of our subsidiaries) or enter into sale and leaseback transactions;
•make investments; or
•create restrictions on the payment of dividends or other amounts to us from our subsidiaries.
Furthermore, the terms of the indenture and the 2026 Notes do not protect holders of the 2026 Notes in the event that we experience changes (including significant adverse changes) in our financial condition, results of operations or credit ratings, if any, as they do not require that we or our subsidiaries adhere to any financial tests or ratios or specified levels of net worth, revenues, income, cash flow, or liquidity.
Our ability to recapitalize, incur additional debt (including additional debt that matures prior to the maturity of the 2026 Notes) and take a number of other actions that are not limited by the terms of the 2026 Notes may have important consequences for you as a holder of the 2026 Notes, including making it more difficult for us to satisfy our obligations with respect to the 2026 Notes or negatively affecting the market value of the 2026 Notes.
Other debt we issue or incur in the future could contain more protections for its holders than the indenture and the 2026 Notes, including additional covenants and events of default. The issuance or incurrence of any such debt with incremental protections could affect the market for, trading levels, and prices of the 2026 Notes.
The 2026 Notes may or may not have an established trading market. If a trading market in the 2026 Notes is developed, it may not be maintained.
The 2026 Notes may or may not have an established trading market. If a trading market in the 2026 Notes is developed, it may not be maintained. If the 2026 Notes are traded, they may trade at a discount to their initial offering price depending on prevailing interest rates, the market for similar securities, our credit ratings, our financial condition or other relevant factors. Accordingly, we cannot assure you that a liquid trading market has been or will develop for the 2026 Notes, that you will be able to sell your 2026 Notes at a particular time or that the price you receive when you sell will be favorable. To the extent an active trading market does not develop or is not maintained, the liquidity and trading price for the 2026 Notes may be harmed. Accordingly, you may be required to bear the financial risk of an investment in the 2026 Notes for an indefinite period of time.
65
If we default on our obligations to pay our other indebtedness, we may not be able to make payments on the 2026 Notes.
As of December 31, 2023, we had approximately $174.1 million of indebtedness outstanding under the revolving credit facility. Any default under the agreements governing our indebtedness, including a default under the revolving credit facility or other indebtedness to which we may be a party that is not waived by the required lenders, and the remedies sought by lenders or the holders of such indebtedness could make us unable to pay principal, premium, if any, and interest on the 2026 Notes and substantially decrease the market value of the 2026 Notes. If we are unable to generate sufficient cash flow and are otherwise unable to obtain funds necessary to meet required payments of principal, premium, if any, and interest on our indebtedness, or if we otherwise fail to comply with the various covenants, including financial and operating covenants, in the instruments governing our indebtedness (including the revolving credit facility), we could be in default under the terms of the agreements governing such indebtedness, including the 2026 Notes. In the event of such default, the holders of such indebtedness could elect to declare all the funds borrowed thereunder to be due and payable, together with accrued and unpaid interest, the lenders under the revolving credit facility or other debt we may incur in the future could elect to terminate their commitment, cease making further loans and institute foreclosure proceedings against our assets, and we could be forced into bankruptcy or liquidation.
If our operating performance declines and we are not able to generate sufficient cash flow to service our debt obligations, we may in the future need to refinance or restructure our debt, including the 2026 Notes, sell assets, reduce or delay capital investments, seek to raise additional capital or seek to obtain waivers from the lenders under the revolving credit facility or other debt that we may incur in the future to avoid being in default. If we are unable to implement one or more of these alternatives, we may not be able to meet our payment obligations under the 2026 Notes and our other debt. If we breach our covenants under the revolving credit facility or any of our other debt and seek a waiver, we may not be able to obtain a waiver from the required lenders or holders thereof. If this occurs, we would be in default under the revolving credit facility or other debt, the lenders or holders could exercise their rights as described above, and we could be forced into bankruptcy or liquidation. If we are unable to repay debt, lenders having secured obligations, including the lenders under the revolving credit facility, could proceed against the collateral securing the debt. Because the revolving credit facility has, and any future credit facilities will likely have, customary cross-default provisions, if we have a default under the terms of the 2026 Notes, the obligations under the revolving credit facility or any future credit facility may be accelerated and we may be unable to repay or finance the amounts due.
We may choose to redeem the 2026 Notes when prevailing interest rates are relatively low.
The 2026 Notes are redeemable in whole or in part upon certain conditions at any time or from time to time at our option. We may choose to redeem the 2026 Notes from time to time, especially if prevailing interest rates are lower than the rate borne by the 2026 Notes. If prevailing rates are lower at the time of redemption, and we redeem the 2026 Notes, you likely would not be able to reinvest the redemption proceeds in a comparable security at an effective interest rate as high as the interest rate on the 2026 Notes being redeemed. Our redemption right also may adversely impact your ability to sell the 2026 Notes as the optional redemption date or period approaches.
66
We may not be able to repurchase the 2026 Notes upon a Change of Control Repurchase Event.
We may not be able to repurchase the 2026 Notes upon certain change in control events described in the indentures under which the 2026 Notes were issued (each, a “Change of Control Repurchase Event”) because we may not have sufficient funds. We would not be able to borrow under our revolving credit facility to finance such a repurchase of the 2026 Notes, and we expect that any future credit facility would have similar limitations. Upon a Change of Control Repurchase Event, holders of the 2026 Notes may require us to repurchase for cash some or all of the 2026 Notes at a repurchase price equal to 100% of the aggregate principal amount of the 2026 Notes being repurchased, plus accrued and unpaid interest to, but not including, the repurchase date. The terms of our revolving credit facility provide that certain change of control events will constitute an event of default thereunder entitling the lenders to accelerate any indebtedness outstanding under our revolving credit facility at that time and to terminate our revolving credit facility. In this regard, the occurrence of a Change of Control Repurchase Event enabling the holders of the 2026 Notes to require the mandatory purchase of the 2026 Notes will constitute an event of default under our revolving credit facility, entitling the lenders to accelerate any indebtedness outstanding under our revolving credit facility at that time and to terminate our revolving credit facility. As a result, we may not be able to comply with our obligations under the Change of Control Repurchase Event provisions of the indenture governing the 2026 Notes unless we were to obtain the consent of the lenders under the revolving credit facility or find another means to do so. Our and our subsidiaries’ future financing facilities may contain similar restrictions and provisions. Our failure to purchase such tendered 2026 Notes upon the occurrence of such Change of Control Repurchase Event would cause an event of default under the indenture governing the 2026 Notes and a cross-default under the agreements governing the revolving credit facility, which may result in the acceleration of such indebtedness requiring us to repay that indebtedness immediately. If the holders of the 2026 Notes exercise their right to require us to repurchase 2026 Notes upon a Change of Control Repurchase Event, the financial effect of this repurchase could cause a default under our current and future debt instruments, and we may not have sufficient funds to repay any such accelerated indebtedness.
A downgrade, suspension or withdrawal of the credit rating assigned by a rating agency to us or the 2026 Notes or change in the debt markets could cause the liquidity or market value of the 2026 Notes to decline significantly.
Our credit ratings are an assessment by rating agencies of our ability to pay our debts when due. Consequently, real or anticipated changes in our credit ratings will generally affect the market value of the 2026 Notes. These credit ratings may not reflect the potential impact of risks relating to the structure or marketing of the 2026 Notes. Credit ratings are not a recommendation to buy, sell or hold any security, and may be revised or withdrawn at any time by the issuing organization in its sole discretion. Neither we nor any underwriter undertakes any obligation to maintain our credit ratings or to advise holders of 2026 Notes of any changes in our credit ratings. There can be no assurance that our credit ratings will remain for any given period of time or that such credit ratings will not be lowered or withdrawn entirely by the rating agencies if in their judgment future circumstances relating to the basis of the credit ratings, such as adverse changes in our company, so warrant. The conditions of the financial markets and prevailing interest rates have fluctuated in the past and are likely to fluctuate in the future, which could have an adverse effect on the market prices of the Notes.
General Risk Factors
We may experience fluctuations in our quarterly operating results.
We could experience fluctuations in our quarterly operating results due to a number of factors, including our ability or inability to make investments in companies that meet our investment criteria, the interest rate payable to us on the debt securities we acquire, the default rate on such securities, the level of our expenses, including the cost of our indebtedness, variations in and the timing of the recognition of realized and unrealized gains or losses, the degree to which we encounter competition in our markets and general economic conditions. As a result of these factors, results for any period should not be relied upon as being indicative of performance in future periods.
67
Changes in laws or regulations governing our operations may adversely affect our business or cause us to alter our business strategy.
We and our portfolio companies are subject to regulation at the local, state and federal level. These laws and regulations, as well as their interpretation, may change from time to time, including as the result of interpretive guidance or other directives from the U.S. President and others in the executive branch, and new laws, regulations and interpretations may also come into effect, including those governing the types of investments we or our portfolio companies are permitted to make, any of which could have a material adverse effect on our business, and political uncertainty could increase regulatory uncertainty in the near term. The effects of legislative and regulatory proposals directed at the financial services industry or affecting taxation may negatively impact the operations, cash flows or financial condition of us or our portfolio companies, impose additional costs on us or our portfolio companies, intensify the regulatory supervision of us or our portfolio companies or otherwise adversely affect our business or the business of our portfolio companies. In addition, if we do not comply with applicable laws and regulations, we could lose any licenses that we then hold for the conduct of our business and may be subject to civil fines and criminal penalties.
Additionally, changes to the laws and regulations governing our operations, including those associated with RICs, may cause us to alter our investment strategy in order to avail ourselves of new or different opportunities or result in the imposition of corporate-level taxes on us. Such changes could result in material differences to the strategies and plans set forth herein and may shift our investment focus from the areas of expertise of MC Advisors to other types of investments in which MC Advisors may have little or no expertise or experience. Any such changes, if they occur, could have a material adverse effect on our results of operations and the value of your investment.
Over the last several years, there also has been an increase in regulatory attention to the extension of credit outside of the traditional banking sector, raising the possibility that some portion of the non-bank financial sector will be subject to new regulation. While it cannot be known at this time whether any regulation will be implemented or what form it will take, increased regulation of non-bank credit extension could negatively impact our operations, cash flows or financial condition, impose additional costs on us, intensify the regulatory supervision of us or otherwise adversely affect our business, financial condition and results of operations.
Efforts to comply with the Sarbanes-Oxley Act involve significant expenditures, and non-compliance with the Sarbanes-Oxley Act may adversely affect us and the market price of our securities.
As a publicly traded company, we incur legal, accounting and other expenses, including costs associated with the periodic reporting requirements applicable to a company whose securities are registered under the Exchange Act, as well as additional corporate governance requirements, including requirements under the Sarbanes-Oxley Act of 2002, or the Sarbanes-Oxley Act, and other rules implemented by the SEC.
We are subject to the Sarbanes-Oxley Act, and the related rules and regulations promulgated by the SEC. Under current SEC rules, our management is required to report on its internal controls over financial reporting pursuant to Section 404 of the Sarbanes-Oxley Act and rules and regulations of the SEC thereunder. We are required to review on an annual basis our internal controls over financial reporting, and on a quarterly and annual basis to evaluate and disclose changes in our internal controls over financial reporting. As a result, we expect to continue to incur associated expenses, which may negatively impact our financial performance and our ability to make distributions. This process also will result in a diversion of our management’s time and attention. We cannot be certain as to the timing of completion of our evaluation, testing and remediation actions or the impact of the same on our operations and may not be able to ensure that the process is effective or that the internal controls are or will be effective in a timely manner. There can be no assurance that our quarterly reviews and annual audits will not identify additional material weaknesses. In the event that we are unable to maintain or achieve compliance with the Sarbanes-Oxley Act and related rules, our value and results of operations may be adversely affected. As a result, we expect to incur significant associated expenses, which may negatively impact our financial performance and our ability to make distributions.
68
Terrorist attacks, acts of war, global health emergencies or natural disasters may affect any market for our common stock, impact the businesses in which we invest and harm our business, operating results and financial condition.
Terrorist acts, acts of war, including the ongoing conflicts in the Middle East and Europe, global health emergencies, including the COVID-19 pandemic or natural disasters may disrupt our operations, as well as the operations of the businesses in which we invest. Such acts have created, and continue to create, economic and political uncertainties and have contributed to global economic instability. Future terrorist activities, military or security operations, global health emergencies or natural disasters could further weaken the domestic/global economies and create additional uncertainties, which may negatively impact the businesses in which we invest directly or indirectly and, in turn, could have a material adverse impact on our business, operating results and financial condition. Losses from terrorist attacks, global health emergencies and natural disasters are generally uninsurable.
The failure in cybersecurity systems, as well as the occurrence of events unanticipated in our disaster recovery systems and management continuity planning, could impair our ability to conduct business effectively.
Cybersecurity incidents and cyber-attacks have been occurring globally at a more frequent and severe level, and will likely continue to increase in frequency in the future. The occurrence of a disaster such as a cyber-attack, a natural catastrophe, an industrial accident, a terrorist attack or war, events unanticipated in our disaster recovery systems, or a support failure from external providers, could have an adverse effect on our ability to conduct business and on our results of operations and financial condition, particularly if those events affect our computer-based data processing, transmission, storage, and retrieval systems or destroy data. If a significant number of Monroe Capital employees were unavailable in the event of a disaster, our ability to effectively conduct our business could be severely compromised.
We, and our portfolio companies, depend heavily upon computer systems to perform necessary business functions. Despite the implementation of a variety of security measures, computer systems could be subject to cyber-attacks and unauthorized access, such as physical and electronic break-ins or unauthorized tampering. Like other companies, we may experience threats to our data and systems, including malware and computer virus attacks, unauthorized access, system failures and disruptions. If one or more of these events occurs, it could potentially jeopardize the confidential, proprietary and other information processed and stored in, and transmitted through, our computer systems and networks, or otherwise cause interruptions or malfunctions in our operations, which could result in damage to our reputation, financial losses, litigation, increased costs, regulatory penalties and/or customer dissatisfaction or loss.
A disaster or a disruption in the infrastructure that supports our business, including a disruption involving electronic communications or other services used by us or third parties with whom we conduct business, or directly affecting our headquarters, could have a material adverse impact on our ability to continue to operate our business without interruption. Our disaster recovery programs may not be sufficient to mitigate the harm that may result from such a disaster or disruption. In addition, insurance and other safeguards might only partially reimburse us for our losses, if at all.
Third parties with which we do business may also be sources of cybersecurity or other technological risk. We outsource certain functions and these relationships allow for the storage and processing of our information, as well as client, counterparty, employee, and borrower information. While we engage in actions to reduce our exposure resulting from outsourcing, ongoing threats may result in unauthorized access, loss, exposure, destruction, or other cybersecurity incident that affects our data, resulting in increased costs and other consequences as described above.
Moreover, the increased use of mobile and cloud technologies due to the proliferation of remote work resulting from the COVID-19 pandemic could heighten these and other operational risks as certain aspects of the security of such technologies may be complex and unpredictable. Reliance on mobile or cloud technology or any failure by mobile technology and cloud service providers to adequately safeguard their systems and prevent cyber-attacks could disrupt our operations, the operations of a portfolio company or the operations of our or their service providers and result in misappropriation, corruption or loss of personal, confidential or proprietary information or the inability to conduct ordinary business operations. In addition, there is a risk that encryption and other protective measures may be circumvented, particularly to the extent that new computing technologies increase the speed and computing power available. Extended periods of remote working, whether by us or by our service providers, could strain technology resources, introduce operational risks and otherwise heighten the risks described above. Remote working environments may be less secure and more susceptible to hacking attacks, including phishing and social engineering attempts. Accordingly, the risks described above are heightened under current conditions.
69
We have implemented processes, procedures and internal controls to help mitigate cybersecurity risks and cyber intrusions, but these measures, as well as our increased awareness of the nature and extent of a risk of a cyber-incident, do not guarantee that a cyber-incident will not occur and/or that our financial results, operations or confidential information will not be negatively impacted by such an incident.
In addition, cybersecurity has become a top priority for regulators around the world, and some jurisdictions have enacted laws requiring companies to notify individuals of data security breaches involving certain types of personal data. Compliance with such laws and regulations may result in cost increases due to system changes and the development of new administrative processes. If we or MC Advisors or certain of its affiliates, fail to comply with the relevant laws and regulations, we could suffer financial losses, a disruption of our businesses, liability to investors, regulatory intervention or reputational damage.
A data breach could negatively impact our business and result in significant penalties.
MC Advisors is subject to numerous laws in various jurisdictions relating to privacy and the storage, sharing, use, processing, disclosure and protection of information that we and our affiliates hold. The European Union’s (the “EU”) General Data Protection Regulation, the Cayman Islands Data Protection Law, 2017, and the California Consumer Privacy Act of 2018 are recent examples of such laws, and MC Advisors anticipates new privacy and data protection laws will be passed in other jurisdictions in the future. In general, these laws introduce many new obligations on MC Advisors and its affiliates and service providers and create new rights for parties who have given us their personal information, such as investors and others.
Breach of these laws could result in significant financial penalties for MC Advisors and/or us. As interpretation of these laws evolves and new laws are passed, MC Advisors could be required to make changes to its business practices, which could result in additional risks, costs and liabilities to us and adversely affect investment returns. While MC Advisors intends to comply with its privacy and data protection obligations under the privacy and data protection laws that are applicable to it, it is possible that MC Advisors will not be able to accurately anticipate the ways in which regulators and courts will apply or interpret these laws. A violation of applicable privacy and data protection law could result in negative publicity and/or subject MC Advisors or us, to significant costs associated with litigation, settlements, regulatory action, judgments, liabilities and/or penalties.
ITEM 1B. UNRESOLVED STAFF COMMENTS
None.
ITEM 1C. CYBERSECURITY
We rely on the cybersecurity strategy and policies implemented by Monroe Capital, the parent of both MC Advisors and MC Management that also apply to the Company. Monroe Capital’s cybersecurity strategy prioritizes detection and analysis of and response to known, anticipated or unexpected threats, effective management of security risks and resilience against cyber incidents. Monroe Capital’s enterprise-wide cybersecurity program is aligned to the National Institute of Standards and Technology Cybersecurity Framework. Monroe Capital’s cybersecurity risk management processes include technical security controls, policy enforcement mechanisms, monitoring systems, tools and related services, which include tools and services from third-party providers, and management oversight to assess, identify and manage risks from cybersecurity threats. Monroe Capital has implemented and continues to implement risk-based controls designed to prevent, detect and respond to information security threats and we rely on those controls to help us protect our information, our information systems, and the information of our investors and other third parties who entrust us with their sensitive information.
Monroe Capital’s cybersecurity program includes physical, administrative and technical safeguards, as well as plans and procedures designed to help Monroe Capital prevent and timely and effectively respond to cybersecurity threats and incidents, including threats or incidents that may impact us, MC Advisors or MC Management. Monroe Capital’s cybersecurity risk management process seeks to monitor cybersecurity vulnerabilities and potential attack vectors, evaluate the potential operational and financial effects of any threat and mitigate such threats. The assessment of cybersecurity risks, including those which may impact us, our investment adviser or our administrator, is integrated into Monroe Capital’s enterprise risk management program, which is overseen by the Monroe Capital Operations and Risk Committee (“ORC”), as discussed below. In addition, Monroe Capital periodically engages with third-party consultants and key vendors to assist it in assessing, enhancing, implementing and monitoring its cybersecurity risk management programs and responding to incidents.
70
The Monroe Capital cybersecurity risk management and awareness programs include periodic identification and testing of vulnerabilities, regular phishing simulations and annual general cybersecurity awareness and data protection training including for employees of MC Advisors and MC Management. Monroe Capital also has annual certification requirements for employees, including employees who provide services to us pursuant to our Investment Advisory and Management Agreement and our Administration Agreement with respect to certain policies supporting the cybersecurity program. Monroe Capital undertakes periodic internal security reviews of our information systems and related controls, including systems affecting personal data and the cybersecurity risks of Monroe Capital’s and our critical third-party vendors and other partners. Monroe Capital also completes periodic external reviews of its cybersecurity program and practices, which include assessments of relevant data protection practices and targeted attack simulations.
In the event of a cybersecurity incident impacting us, MC Advisors or MC Management, Monroe Capital has developed an incident response plan that provides guidelines for responding to such an incident and facilitates coordination across multiple operational functions of Monroe Capital, including coordinating with the relevant employees of MC Advisors and MC Management. The incident response plan includes notification to the applicable members of cybersecurity leadership, including Monroe Capital’s Head of Information Technology, and the Computer Security Incident Response Team (“CSIRT”), as appropriate, escalation to the full ORC and/or an internal ad hoc group of senior employees, tasked with helping to manage the cybersecurity incident. Depending on their nature, incidents may also be reported to the audit committee or full board of directors of Monroe Capital, as well as to the Audit Committee (the “Audit Committee”) of our Board of Directors (the “Board”) and to our full Board, if appropriate.
Risk Management and Strategy
In the ordinary course of business, we rely on electronic communications and information systems to conduct our operations and store sensitive data. “Information systems” means electronic information resources that we own or use, including physical or virtual infrastructure controlled by these information resources, or components thereof, organized for the collection, processing, maintenance, use, sharing, dissemination, or disposition of the information necessary to maintain or support our operations. Because cybersecurity threats continue to evolve, we have been required and may continue to be required to expend significant resources to continue to implement, modify or enhance our protective measures or to investigate and remediate any information security vulnerabilities. Financial expenditures may also be required to meet regulatory changes in the information security and cybersecurity domains. Risks and exposures related to cybersecurity attacks are expected to remain high for the foreseeable future due to the rapidly evolving nature and sophistication of these threats. For additional discussion of the risks posed by cybersecurity threats, see “Item 1A. Risk Factors—General Risk Factors—The failure in cyber security systems, as well as the occurrence of events unanticipated in our disaster recovery systems and management continuity planning, could impair our ability to conduct business effectively.”
To address cybersecurity threats (defined as potential unauthorized occurrences on or conducted through our information systems that may result in adverse effects on the confidentiality, integrity, or availability of those systems or any information residing in those systems therein), we have a implemented an incident and event response program. That program is a component of our overall enterprise risk management and business continuity frameworks. We employ an in-depth, layered, defensive approach that leverages people, processes and technology to manage and maintain cybersecurity controls. We also employ a variety of preventative and detective tools to monitor, block, and provide alerts regarding suspicious activity relative to our information systems, as well as to report on any suspected advanced persistent threats. The program is designed to allow for the detection and timely and efficient recovery from cybersecurity incidents (defined as a violation or imminent threat of violation of information security policies, acceptable use policies, or standard computer security practices) and events by providing a well-defined, organized approach for handling any potential threats to the confidentiality, integrity, and/or availability of our information systems.
The CSIRT maintains overall responsibility for addressing and resolving incidents that occur at Monroe Capital. The CSIRT: (i) coordinates efforts in response to incidents; (ii) manages the assessment, recovery, and remediation efforts related to incidents; (iii) manages communication, both internal and external, regarding incidents; and (iv) manages notification of regulatory bodies as required by law in response to incidents.
We contract with a third-party vendor (oversight for which is outlined in our Vendor Risk Management Policy) who monitors our information systems for suspicious activity, such as unauthorized intrusions. Suspected or confirmed threats, incidents, or events, however, also may be reported by employees, intrusion detection systems, third-party servicers, or government entities. Once reported, cybersecurity incidents are to be brought to the attention of the Head of Information Technology, the ORC and the CSIRT, which provides status updates to the Information Security Committee (“ISC”), with the frequency of such updates depending upon the perceived threat level of the reported incident.
71
After receiving notice of a cybersecurity threat, such threats are investigated to determine whether an actual incident has occurred and, if so, whether a more thorough assessment by the entire ISC is appropriate. During these assessments, steps may be taken to isolate affected systems. Outside advisors may be employed regarding the cybersecurity threat, including to conduct legal and forensic investigations and work with other third parties who might be engaged to assist in any response and associated publicity.
During or at the conclusion of an assessment of a cybersecurity incident, we will respond to the incident. The response
will vary based upon the severity of the incident or event. The Head of Information Technology will note the classification of the information potentially impacted, paying close attention to information classified as personally identifiable information and sensitive. The Head of Information Technology and appropriate personnel will determine whether the incident is likely to affect ongoing business operations. If such is the case (e.g., contamination is widespread across production systems), Monroe Capital’s Incident Response Plan and Business Continuity Plan shall be invoked, as necessary. In determining the level of response, we have identified three criticality levels of incidents and events based upon the following criteria:
•Risk to confidential data
•Risk to business continuity
•Risk to critical systems
•Revenue impact
•Client impact
Incident and risk event levels each vary from level 3 (or low) risk to level 1 (high) risk. The determination of the incident and risk level will dictate the level of personnel that will be responsible for addressing the incident, controlling the effects of the incident and formulating the response to the incident. Responses may include, when appropriate and/or required, notification to regulatory agencies (e.g., SEC), authorities (e.g., F.B.I., Department of Justice), clients, third parties or internal personnel.
The CSIRT is responsible for incident reporting and response. The action steps taken, beyond notification, are typically accomplished with the assistance of the IT department. The Head of Information Technology or CSIRT team member will work with the appropriate personnel to respond to the incident (following written guidelines) and to ensure concurrent documentation of the same. Should a breach occur at a third party that has a material impact on Monroe Capital, the CSIRT must be notified.
Following a cybersecurity incident, and during its investigation and the formulation of a response, our processes also envision measures designed to contain and/or eradicate the incident and prevent further effects. Once it is determined that the incident has been resolved, we then work to establish appropriate controls (if applicable) to address similar future events and/or prevent another similar event from occurring in the future. To date, we have not experienced any previous cybersecurity incidents that have materially affected or are reasonably likely to materially affect our business strategy, results of operations, or financial condition.
Governance
Our cybersecurity program is managed by Monroe Capital’s dedicated internal cybersecurity team, which is responsible for enterprise-wide cybersecurity strategy, policies, standards, engineering, architecture and processes. The team is led by Monroe Capital’s Head of Information Technology, who has a bachelor’s degree in systems engineering and over 12 years of experience advising on and managing risks from cybersecurity threats as well as developing and implementing cybersecurity policies and procedures. The CSIRT includes members of Monroe Capital’s senior executive management, including its Chief Operating Officer, Chief Compliance Officer and the Head of Information Technology, who acts as chairperson of the ISC. The ISC is comprised of Monroe Capital’s Head of Information Technology, Chief Operating Officer and Chief Compliance Officer. The purpose of the ISC is to protect Monroe Capital’s technology, data and information, and the ISC is tasked with responding to technology and data security incidents. The ORC is a cross-functional committee that governs and oversees the Monroe Capital enterprise risk management program, including cybersecurity. The ORC includes members of Monroe Capital’s senior executive management, including its Chief Compliance Officer, Chief Operating Officer, Chief Credit Officer, President & Co-Portfolio Manager, Chief Financial Officer of Management Company and Chief Financial Officer of Investment Funds, who acts as chairperson of the ORC. The ORC, through regular consultation with the Monroe Capital internal cybersecurity team and employees of MC Advisors and MC Management, assesses, discusses, and prioritizes Monroe Capital’s approach to high-level risks, mitigative controls and ongoing cybersecurity efforts.
72
As part of its oversight responsibilities over risks and controls, the Board is ultimately responsible for overseeing our cyber and information security risks. The Audit Committee has primary responsibility for oversight and review of guidelines and policies with respect to risk assessment and risk management, including cybersecurity. Members of the ORC and other Monroe Capital personnel periodically report to our Audit Committee as well as our full Board, as appropriate, on cybersecurity matters. Such reporting includes updates on Monroe Capital’s cybersecurity program as it impacts us, the external threat environment, and Monroe Capital’s programs to address and mitigate the risks associated with the evolving cybersecurity threat environment. These reports also include updates on Monroe Capital’s preparedness, prevention, detection, responsiveness and recovery with respect to cybersecurity incidents.
Material Impact of Cybersecurity Risks
As of the date of this annual report on Form 10-K, we are not aware of any material risks from cybersecurity threats that have materially affected, or are reasonably likely to materially affect, the Company, including our business strategy, results of operations, or financial condition. However, future incidents could have a material impact on our business. Additional information about the cybersecurity risks that we face is discussed in Item 1A of Part I, “Risk Factors” in this annual report on Form 10-K under the heading “The failure in cybersecurity systems, as well as the occurrence of events unanticipated in our disaster recovery systems and management continuity planning, could impair our ability to conduct business effectively.”
ITEM 2. PROPERTIES
We do not own any real estate or other physical properties materially important to our operation. The principal executive offices of Monroe Capital are located at 311 South Wacker Drive, Suite 6400, Chicago, Illinois 60606. Monroe Capital and its affiliates currently have additional offices, and/or company representatives in New York, New York; Los Angeles, California; San Francisco, California; Austin, Texas; Boston, Massachusetts; Miami, Florida; Naples, Florida; Farmington, Connecticut; and Seoul, South Korea. MC Management furnishes us office space, and we reimburse it for such costs on an allocated basis.
ITEM 3. LEGAL PROCEEDINGS
Neither we nor our investment adviser is currently subject to any material legal proceedings.
ITEM 4. MINE SAFETY DISCLOSURES
Not applicable.
73
PART II
ITEM 5. MARKET FOR REGISTRANT’S COMMON EQUITY, RELATED STOCKHOLDER MATTERS AND ISSUER PURCHASES OF EQUITY SECURITIES
COMMON STOCK
Our common stock is traded on The Nasdaq Global Select Market under the ticker symbol “MRCC.” Our common stock has historically traded at prices both above and below our net asset value per share. It is not possible to predict whether our common stock will trade at, above or below net asset value.
HOLDERS
As of March 8, 2024, there were seven holders of record of our common stock. This does not include the number of stockholders that hold shares in “street name” through banks or broker-dealers.
DISTRIBUTIONS
We currently intend to make distributions to our stockholders on a quarterly basis out of assets legally available for distribution. We may also make additional distributions to our stockholders from time to time. Our quarterly and additional distributions, if any, will be determined by our board of directors.
Our revolving credit facility, as amended, imposes certain conditions that may limit the amount of our distributions to stockholders. Distributions payable in our common stock under our dividend reinvestment plan are not limited by the revolving credit facility. Distributions in cash or property other than our common stock are generally limited to 115% of the amount of distributions required to maintain our status as a RIC.
In October 2012, we adopted an “opt out” dividend reinvestment plan for our common stockholders. When we declare a distribution, our stockholders’ cash distributions will be automatically reinvested in additional shares of our common stock unless a stockholder specifically “opts out” of our dividend reinvestment plan. If a stockholder opts out, that stockholder will receive cash distributions.
74
PERFORMANCE GRAPH
The following graph compares the return on our common stock from December 28, 2018 to December 29, 2023, the last stock trading days of 2018 and 2023, respectively, with that of the Standard & Poor’s 500 Stock Index and the NASDAQ Financial 100 index. The graph assumes that on December 28, 2018, a person invested $100 in each of our common stock, the Standard & Poor’s 500 Stock Index and the NASDAQ Financial 100 index. The graph measures total stockholder return, which takes into account both changes in stock price and dividends. The graph also assumes the reinvestment of all dividends prior to any tax effect. The graph and other information furnished under this Part II Item 5 of this Annual Report on Form 10-K shall not be deemed to be “soliciting material” or to be “filed” with the SEC or subject to Regulation 14A or 14C under, or to the liabilities of Section 18 of, the Exchange Act. The stock price performance included in the below graph is not necessarily indicative of future stock performance.
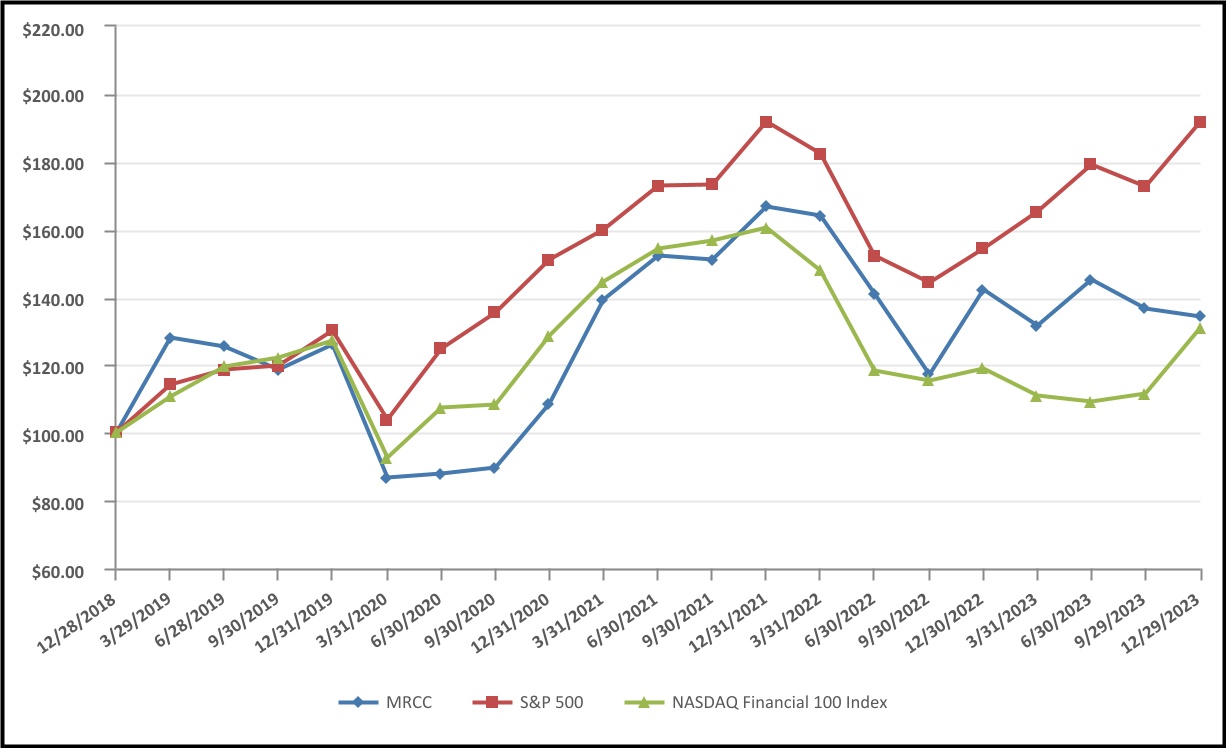
75
PRICE RANGE OF COMMON STOCK AND DISTRIBUTIONS
Our common stock began trading on The Nasdaq Global Market under the ticker symbol “MRCC” on October 25, 2012. Prior to that date, there was no established trading market for our common stock. Our common stock is now traded on the Nasdaq Global Select Market. Our common stock has historically traded both above and below net asset value (“NAV”).
The following table sets forth the high and low closing sales prices of our common stock, the closing sales price as a premium (discount) to NAV per share and the distributions declared by us since January 1, 2022:
| Closing Sales Price | Premium (Discount) of High Sales Price to NAV(2) | Premium (Discount) of Low Sales Price to NAV(2) | Declared Distributions (3)(4) | ||||||||||||||||||||||||||||||||
NAV(1) | High | Low | |||||||||||||||||||||||||||||||||
| Year ending December 31, 2023 | |||||||||||||||||||||||||||||||||||
| Fourth Quarter | $ | $ | $ | ( | % | ( | % | $ | 0.25 | ||||||||||||||||||||||||||
| Third Quarter | $ | $ | $ | ( | % | ( | % | $ | 0.25 | ||||||||||||||||||||||||||
| Second Quarter | $ | $ | $ | ( | % | ( | % | $ | 0.25 | ||||||||||||||||||||||||||
| First Quarter | $ | $ | $ | ( | % | ( | % | $ | 0.25 | ||||||||||||||||||||||||||
| Year ending December 31, 2022 | |||||||||||||||||||||||||||||||||||
| Fourth Quarter | $ | $ | $ | ( | % | ( | % | $ | 0.25 | ||||||||||||||||||||||||||
| Third Quarter | $ | $ | $ | ( | % | ( | % | $ | 0.25 | ||||||||||||||||||||||||||
| Second Quarter | $ | $ | $ | % | ( | % | $ | 0.25 | |||||||||||||||||||||||||||
| First Quarter | $ | $ | $ | % | ( | % | $ | 0.25 | |||||||||||||||||||||||||||
______________________________________________________________
(1)NAV per share is determined as of the last day in the relevant quarter and therefore may not reflect the NAV per share on the date of the high and low sales prices. The NAVs shown are based on outstanding shares at the end of each period.
(2)Calculated by taking the respective high or low closing sales price divided by the quarter end NAV and subtracting 1.
(3)Represents the distribution declared in the specified quarter. We have adopted an “opt out” dividend reinvestment plan for our common stockholders. As a result, if we declare a distribution, stockholders’ cash distributions will be automatically reinvested in additional shares of our common stock, unless they specifically “opt out” of the dividend reinvestment plan so as to receive cash distributions. See “Dividend Reinvestment Plan.”
(4)Our management monitors available taxable earnings, including net investment income and realized capital gains, to determine if a tax return of capital may occur for the year. To the extent that our taxable earnings fall below the total amount of our distributions for that fiscal year, a portion of those distributions may be deemed a tax return of capital to our stockholders. The tax character of distributions will be determined at the end of the fiscal year. There was no return of capital for tax purposes for both the years ended December 31, 2023 and 2022.
76
FEES AND EXPENSES
The following table is intended to assist you in understanding the costs and expenses that an investor in our common stock will bear directly or indirectly. We caution you that some of the percentages indicated in the table below are estimates and actual amounts and percentages may vary. Except where the context suggests otherwise, whenever this prospectus contains a reference to fees or expenses paid by “you,” “us,” “the Company” or “Monroe Capital Corporation,” or that “we” will pay fees or expenses, stockholders will indirectly bear such fees or expenses as investors in Monroe Capital Corporation.
| December 31, 2023 | ||||||||
| Stockholder transaction expenses (as a percentage of offering price): | ||||||||
| Sales load | % | (1) | ||||||
| Offering expenses | % | (2) | ||||||
| Dividend reinvestment plan expenses | Up to $ | (3) | ||||||
| Total stockholder transaction expenses | — | % | (2) | |||||
| Annual expenses (as a percentage of net assets attributable to common stock): | ||||||||
| Base management fees | % | (4) | ||||||
| Incentive fees payable under the Investment Advisory and Management Agreement | % | (5) | ||||||
| Interest payments on borrowed funds | % | (6) | ||||||
| Other expenses | % | (7) | ||||||
| Acquired fund fees and expenses | % | (8) | ||||||
| Total annual expense | % | (9) | ||||||
______________________________________________________________
(1)In the event that the securities to which this prospectus relates are sold to or through underwriters or agents, a corresponding prospectus supplement will disclose the applicable sales load.
(2)The related prospectus supplement will disclose the estimated amount of total offering expenses (which may include offering expenses borne by third parties on our behalf), the offering price and the offering expenses borne by us as a percentage of the offering price.
(3)The expenses of the dividend reinvestment plan are included in “other expenses.” The plan administrator's fees will be paid by us. There will be no brokerage charges or other charges to stockholders who participate in the plan except that, if a participant elects by written notice to the plan administrator to have the plan administrator sell part or all of the shares held by the plan administrator in the participant's account and remit the proceeds to the participant, the plan administrator is authorized to deduct a $15.00 transaction fee plus a $0.10 per share brokerage commission from the proceeds. For additional information, see “Dividend Reinvestment Plan.”
(4)Our base management fee is calculated initially at an annual rate of 1.75% of our average invested assets (calculated as total assets excluding cash, which includes assets financed using leverage); provided however, the base management fee is calculated at an annual rate equal to 1.00% of our average invested assets (calculated as total assets excluding cash, which includes assets financed using leverage) that exceeds the product of (i) 200% and (ii) our average net assets. The “base management fee” percentage is calculated as a percentage of net assets attributable to common stockholders, rather than total assets, including assets that have been funded with borrowed monies, because common stockholders bear all of this cost. The base management fee in the table above assumes the base management fee remains consistent with fees incurred for the quarter ended December 31, 2023 of $2.1 million, based on average total assets (excluding cash) for the period of $522.7 million, as a percentage of our average net assets for the period of $205.6 million. See “Management and Other Agreements — Investment Advisory and Management Agreement.”
(5)Estimated assuming that annual incentive fees earned by MC Advisors remains consistent with the incentive fees earned for the quarter ended December 31, 2023 of $1.3 million, as a percentage of our average net assets of $205.6 million for the period.
77
The incentive fee consists of two parts:
The first part of the incentive fee, payable quarterly in arrears, equals 20% of our pre-incentive fee net investment income (including interest that is accrued but not yet received in cash), subject to a 2% quarterly (8% annualized) rate of return on the value of our net assets, or hurdle rate, and a “catch-up” provision measured as of the end of each calendar quarter. Under this provision, in any calendar quarter, MC Advisors receives no incentive fee until our net investment income equals the hurdle rate of 2% but then receives, as a “catch-up,” 100% of our pre-incentive fee net investment income with respect to that portion of such pre-incentive fee net investment income, if any, that exceeds the hurdle rate but is less than 2.5%. The effect of this provision is that, if pre-incentive fee net investment income exceeds 2.5% in any calendar quarter, MC Advisors will receive 20% of our pre-incentive fee net investment income as if a hurdle rate did not apply. The first component of the incentive fee will be computed and paid on income that includes, in the case of investments with a deferred interest feature such as market discount, debt instruments with PIK interest, preferred stock with PIK dividends and zero coupon securities, accrued income that we have not yet received in cash. Since the hurdle rate is fixed, as interest rates rise, it will be easier for the MC Advisors to surpass the hurdle rate and receive an incentive fee based on net investment income. The foregoing incentive fee is subject to a total return requirement, which provides that no incentive fee in respect of our pre-incentive fee net investment income will be payable except to the extent that 20% of the cumulative net increase in net assets resulting from operations over the then current and 11 preceding calendar quarters exceeds the cumulative incentive fees accrued and/or paid for the 11 preceding calendar quarters. In other words, any ordinary income incentive fee that is payable in a calendar quarter will be limited to the lesser of (i) 20% of the amount by which our pre-incentive fee net investment income for such calendar quarter exceeds the 2% hurdle, subject to the “catch-up” provision, and (ii) (x) 20% of the cumulative net increase in net assets resulting from operations for the then current and 11 preceding calendar quarters minus (y) the cumulative incentive fees accrued and/or paid for the 11 preceding calendar quarters. For the foregoing purpose, the “cumulative net increase in net assets resulting from operations” is the sum of our pre-incentive fee net investment income, base management fees, realized gains and losses and unrealized appreciation and depreciation for the then current and 11 preceding calendar quarters.
The second part of the incentive fee, payable annually in arrears, equals 20% of our realized capital gains on a cumulative basis from inception through the end of the fiscal year, if any (or upon the termination of the Investment Advisory and Management Agreement, as of the termination date), computed net of all realized capital losses on a cumulative basis and unrealized capital depreciation, less the aggregate amount of any previously paid capital gain incentive fees. We will accrue (but not pay) an expense for potential payment of capital gain incentive fees with respect to any unrealized appreciation on our portfolio.
See “Management and Other Agreements — Investment Advisory and Management Agreement.”
(6)We may borrow funds from time to time to make investments to the extent we determine that it is appropriate to do so. The costs associated with any outstanding borrowings are indirectly borne by our investors. The table assumes borrowings are consistent with the average borrowings for the quarter ended December 31, 2023 of $317.6 million, no preferred stock issued or outstanding and average net assets of $205.6 million. For the quarter ended December 31, 2023, we had interest expense of $5.7 million (including fees for unused portions of commitments and amortization of deferred financing costs). As of December 31, 2023, the weighted average interest rate of our revolving credit facility (excluding debt issuance costs) was 8.10% and the interest rate on our senior unsecured notes was 4.75%. Although we do not have any current plans to issue debt securities or preferred stock in the next twelve months, we may issue debt securities or preferred stock, subject to our compliance with applicable requirements under the 1940 Act.
(7)Includes our estimated overhead expenses, including payments under the Administration Agreement based on our allocable portion of overhead and other expenses incurred by MC Management. The table above assumes “other expenses” remain consistent with the $1.1 million incurred during the quarter ended December 31, 2023 and average net assets for the period of $205.6 million.
(8)Our stockholders indirectly bear the expenses of our investment in SLF. SLF does not pay any fees to MC Advisors or its affiliates; however, SLF has entered into an administration agreement with MC Management, pursuant to which certain loan servicing and administrative functions are delegated to MC Management. SLF may reimburse MC Management for its allocable share of overhead and other expenses incurred by MC Management. For the quarter ended December 31, 2023, SLF incurred $55 thousand of allocable expenses. The table above assumes “acquired fund fees and expenses” remain consistent with the $1.1 million of expenses incurred for the quarter ended December 31, 2023 and average net assets for the period of $205.6 million. Future expenses for SLF may be substantially higher or lower because certain expenses may fluctuate over time.
78
(9)“Total annual expenses” as a percentage of consolidated net assets attributable to common stock are higher than the total annual expenses percentage would be for a company that is not leveraged. We borrow money to leverage our net assets and increase our total assets. We calculate the “total annual expenses” percentage as a percentage of net assets (defined as total assets less indebtedness and after taking into account any incentive fees payable during the period), rather than the total assets, including assets that have been purchased with borrowed amounts. The terms of our indebtedness may be found in “Management’s Discussion and Analysis of Financial Condition and Results of Operations — Liquidity and Capital Resources — Borrowings” incorporated by reference into this prospectus and in other documents incorporated by reference into this prospectus. If the “total annual expenses” percentage were calculated instead as a percentage of average consolidated total assets for the quarter ended December 31, 2023, our “total annual expenses” would be 8.58% of average consolidated total assets for the period of $527.9 million. With certain limited exceptions, we are only allowed to borrow amounts such that our asset coverage ratio, as defined in the 1940 Act, equals at least 150%. We have included our estimated leverage expenses (consistent with the assumptions in footnote (7)) in “total annual expenses.”
Example
The following example illustrates the projected dollar amount of total cumulative expenses over various periods with respect to a hypothetical investment in our common stock. In calculating the following expense amounts, we have assumed we would have no additional leverage, that none of our assets are cash or cash equivalents and that our annual operating expenses would remain at the levels set forth in the table above. Transaction expenses are not included in the following example:
| You would pay the following expenses on a $1,000 investment | 1 Year | 3 Years | 5 Years | 10 Years | ||||||||||||||||||||||
Assuming a 5% annual return (assumes no return from net realized capital gains or net unrealized capital appreciation) | $ | $ | $ | $ | ||||||||||||||||||||||
| Assuming a 5% annual return (assumes entire return is from realized capital gains and thus subject to the capital gains incentive fee) | $ | 205 | $ | 615 | $ | 1,028 | $ | 2,071 | ||||||||||||||||||
This table is to assist you in understanding the various costs and expenses that an investor in our common stock will bear directly or indirectly. While the example assumes, as required by the SEC, a 5% annual return, our performance will vary and may result in a return greater or less than 5%. As incentive fees vary based on the character of the 5% return, the example above provides (i) expenses assuming no return from capital gains (therefore not meeting the hurdle rate for the first part of the incentive fee) and (ii) expenses assuming the entire return is from realized capital gains (resulting in a capital gains incentive fee). For the quarter ended June 30, 2023, our return included net realized and unrealized capital losses. If we achieve sufficient returns on our investments, including through the realization of capital gains, to trigger an incentive fee of a material amount, our expenses, and returns to our investors, would be higher. In addition, while the example assumes reinvestment of all dividends and distributions at net asset value, if our board of directors authorizes and we declare a cash distribution, participants in our dividend reinvestment plan who have not otherwise elected to receive cash will receive a number of shares of our common stock, determined by dividing the total dollar amount of the distribution payable to a participant by the market price per share of our common stock at the close of trading on the valuation date for the distribution. See “Dividend Reinvestment Plan” for additional information regarding our dividend reinvestment plan.
This example and the expenses in the table above should not be considered a representation of our future expenses as actual expenses (including the cost of debt, if any, and other expenses) that we may incur in the future and such actual expenses may be greater or less than those shown.
SENIOR SECURITIES
Information about our senior securities is shown in the following table as of December 31, 2023 and for the years indicated in the table (dollars in thousands). This annual information has been derived from our audited consolidated financial statements for each respective period, which have been audited by RSM US LLP, our independent registered public accounting firm. RSM US LLP’s report on the senior securities table as of December 31, 2023 is attached as Exhibit 99.1 to this report.
79
| Class and Year | Outstanding Exclusive of Treasury Securities (1) | Asset Coverage per Unit (2) | Involuntary Liquidating Preference per Unit (3) | Asset Market Value per Unit (4) | |||||||||||||||||||||||||
| Revolving Credit Facility | |||||||||||||||||||||||||||||
| December 31, 2023 | $ | $ | — | N/A | |||||||||||||||||||||||||
| December 31, 2022 | — | N/A | |||||||||||||||||||||||||||
| December 31, 2021 | — | N/A | |||||||||||||||||||||||||||
| December 31, 2020 | — | N/A | |||||||||||||||||||||||||||
| December 31, 2019 | — | N/A | |||||||||||||||||||||||||||
| December 31, 2018 | — | N/A | |||||||||||||||||||||||||||
| December 31, 2017 | — | N/A | |||||||||||||||||||||||||||
| December 31, 2016 | — | N/A | |||||||||||||||||||||||||||
| December 31, 2015 | — | N/A | |||||||||||||||||||||||||||
| December 31, 2014 | — | N/A | |||||||||||||||||||||||||||
| 5.75% Notes due 2023 | |||||||||||||||||||||||||||||
| December 31, 2020 | $ | $ | — | $ | (5) | ||||||||||||||||||||||||
| December 31, 2019 | — | (5) | |||||||||||||||||||||||||||
| December 31, 2018 | — | (5) | |||||||||||||||||||||||||||
| 4.75% Notes due 2026 | |||||||||||||||||||||||||||||
| December 31, 2023 | $ | $ | — | N/A | |||||||||||||||||||||||||
| December 31, 2022 | — | N/A | |||||||||||||||||||||||||||
| December 31, 2021 | — | N/A | |||||||||||||||||||||||||||
Secured Borrowings (6) | |||||||||||||||||||||||||||||
December 31, 2016 (7) | $ | $ | — | N/A | |||||||||||||||||||||||||
December 31, 2015 (8) | — | N/A | |||||||||||||||||||||||||||
December 31, 2014 (9) | — | N/A | |||||||||||||||||||||||||||
______________________________________________________________
(1)Total amount of each class of senior securities outstanding at the end of the period presented.
(2)The asset coverage ratio of senior securities representing indebtedness is calculated as our consolidated total assets, less all liabilities and indebtedness not represented by senior securities, divided by senior securities representing indebtedness. This asset coverage ratio is multiplied by $1,000 to determine the Asset Coverage per Unit (including for the 5.75% Notes due 2023 and 4.75% Notes due 2026, which were issued in $25 and $2,000 increments, respectively). On October 2, 2014, we received exemptive relief from the SEC which permitted us to exclude the debt of MRCC SBIC guaranteed by the SBA from our asset coverage test under the 1940 Act.
(3)The amount to which such class of senior security would be entitled upon the involuntary liquidation of the issuer in preference to any security junior to it. The “—” in this column indicates that the SEC expressly does not require this information to be disclosed for certain types of senior securities.
(4)Not applicable, except for with respect to the 5.75% Notes due 2023, as the other senior securities are not registered for public trading.
(5)The average market value for the 5.75% Notes due 2023 is calculated as the average daily closing prices of such notes on the Nasdaq Global Select Market for the years ended December 31, 2020, 2019 and 2018, as applicable, divided by the par value per unit of such notes. This average market value is multiplied by $1,000 to determine the Average Market Value per Unit.
80
(6)Certain partial loan sales do not qualify for sale accounting under ASC Topic 860 — Transfers and Servicing because these sales do not meet the definition of a “participating interest,” as defined in the guidance, in order for sale treatment to be allowed. Participations or other partial loan sales which do not meet the definition of a participating interest remain as an investment on the accompanying consolidated statements of assets and liabilities and the portion sold is recorded as a secured borrowing in the liabilities section of the consolidated statements of assets and liabilities. Amounts presented in this table represent the par amount outstanding.
(7)The secured borrowings have a weighted average stated interest rate of 6.26%, a weighted average years to maturity of 1.0 year and a fair value as of December 31, 2016 of $1,314.
(8)The secured borrowings have a weighted average stated interest rate of 5.75%, a weighted average years to maturity of 2.0 years and a fair value as of December 31, 2015 of $2,476.
(9)The secured borrowings have a weighted average stated interest rate of 5.45%, a weighted average years to maturity of 3.0 years and a fair value as of December 31, 2014 of $4,008.
ITEM 6. [RESERVED]
81
ITEM 7. MANAGEMENT’S DISCUSSION AND ANALYSIS OF FINANCIAL CONDITION AND RESULTS OF OPERATIONS
The following discussion should be read in conjunction with our audited consolidated financial statements and related notes and other financial information appearing elsewhere in this Annual Report on Form 10-K. In addition to historical information, the following discussion and other parts of this Annual Report on Form 10-K contain forward-looking information that involves risks and uncertainties.
Please see “Risk Factors” and “Forward-Looking Statements” for a discussion of the uncertainties, risks and assumptions associated with these statements.
Overview
Monroe Capital Corporation is an externally managed, closed-end, non-diversified management investment company that has elected to be regulated as a business development company (“BDC”) under the Investment Company Act of 1940, as amended (the “1940 Act”). In addition, for U.S. federal income tax purposes, we have elected to be treated as a regulated investment company (“RIC”) under the subchapter M of the Internal Revenue Code of 1986, as amended (the “Code”). We are a specialty finance company focused on providing financing solutions primarily to lower middle-market companies in the United States and Canada. We provide customized financing solutions focused primarily on senior secured, junior secured and unitranche secured (a combination of senior secured and junior secured debt in the same facility in which we syndicate a “first out” portion of the loan to an investor and retain a “last out” portion of the loan) debt and, to a lesser extent, unsecured subordinated debt and equity, including equity co-investments in preferred and common stock, and warrants.
Our shares are currently listed on the NASDAQ Global Select Market under the symbol “MRCC”.
Our investment objective is to maximize the total return to our stockholders in the form of current income and capital appreciation through investment in senior secured, unitranche secured and junior secured debt and, to a lesser extent, unsecured subordinated debt and equity investments. We seek to use our extensive leveraged finance origination infrastructure and broad expertise in sourcing loans to invest in primarily senior secured, unitranche secured and junior secured debt of middle-market companies. Our investments will generally range between $2.0 million and $25.0 million each, although this investment size may vary proportionately with the size of our capital base. As of December 31, 2023, our portfolio included approximately 79.6% senior secured loans, 2.8% unitranche secured loans, 5.5% junior secured loans and 12.1% equity securities, compared to December 31, 2022, when our portfolio included approximately 80.2% senior secured loans, 3.8% unitranche secured loans, 4.1% junior secured loans and 11.9% equity securities. We expect that the companies in which we invest may be leveraged, often as a result of leveraged buy-outs or other recapitalization transactions, and, in certain cases, will not be rated by national ratings agencies. If such companies were rated, we believe that they would typically receive a rating below investment grade (between BB and CCC under the Standard & Poor’s system) from the national rating agencies.
While our primary focus is to maximize current income and capital appreciation through debt investments in thinly traded or private U.S. companies, we may invest a portion of the portfolio in opportunistic investments in order to seek to enhance returns to stockholders. Such investments may include investments in real estate, specialty finance, litigation finance, fund finance, high-yield bonds, distressed debt, private equity or securities of public companies that are not thinly traded and securities of middle-market companies located outside of the United States. We expect that these public companies generally will have debt securities that are non-investment grade.
On February 28, 2014, our wholly-owned subsidiary, Monroe Capital Corporation SBIC, LP (“MRCC SBIC”), a Delaware limited partnership, received a license from the Small Business Administration (“SBA”) to operate as a Small Business Investment Company (“SBIC”) under Section 301(c) of the Small Business Investment Act of 1958. MRCC SBIC commenced operations on September 16, 2013. MRCC SBIC received approval from the SBA to surrender its SBIC license and on March 31, 2022, MRCC SBIC was dissolved. See “SBA Debentures” below for more information.
82
Investment income
We generate interest income on the debt investments in portfolio company investments that we originate or acquire. Our debt investments, whether in the form of senior secured, unitranche secured or junior secured debt, typically have an initial term of three to seven years and bear interest at a fixed or floating rate. In some instances, we receive payments on our debt investments based on scheduled amortization of the outstanding balances. In addition, we receive repayments of some of our debt investments prior to their scheduled maturity date. In some cases, our investments provide for deferred interest of payment-in-kind (“PIK”) interest. In addition, we may generate revenue in the form of commitment, origination, amendment, structuring or due diligence fees, fees for providing managerial assistance and consulting fees. Loan origination fees, original issue discount and market discount or premium are capitalized, and we accrete or amortize such amounts as interest income. We record prepayment premiums and prepayment gains (losses) on loans as interest income. As the frequency or volume of the repayments which trigger these prepayment premiums and prepayment gains (losses) may fluctuate significantly from period to period, the associated interest income recorded may also fluctuate significantly from period to period. Interest and fee income are recorded on the accrual basis to the extent we expect to collect such amounts. Interest income is accrued based upon the outstanding principal amount and contractual terms of debt and preferred equity investments. Interest is accrued on a daily basis. We record fees on loans based on the determination of whether the fee is considered a yield enhancement or payment for a service. If the fee is considered a yield enhancement associated with a funding of cash on a loan, the fee is generally deferred and recognized into interest income using the effective interest method if captured in the cost basis or using the straight-line method if the loan is unfunded and therefore there is no cost basis. If the fee is not considered a yield enhancement because a service was provided, and the fee is payment for that service, the fee is deemed earned and recognized as fee income in the period the service has been completed.
Dividend income on preferred equity securities is recorded as dividend income on an accrual basis to the extent that such amounts are payable by the portfolio company and are expected to be collected. Dividend income on common equity securities is recorded on the record date for private portfolio companies. Each distribution received from limited liability company (“LLC”) and limited partnership (“LP”) investments is evaluated to determine if the distribution should be recorded as dividend income or a return of capital. Generally, we will not record distributions from equity investments in LLCs and LPs as dividend income unless there are sufficient accumulated tax-basis earnings and profits in the LLC or LP prior to the distribution. Distributions that are classified as a return of capital are recorded as a reduction in the cost basis of the investment. The frequency and volume of the distributions on common equity securities and LLC and LP investments may fluctuate significantly from period to period.
Expenses
Our primary operating expenses include the payment of base management and incentive fees to MC Advisors, under the investment advisory and management agreement (the “Investment Advisory and Management Agreement”), the payment of fees to MC Management for our allocable portion of overhead and other expenses under the administration agreement (the “Administration Agreement”) and other operating costs. See Note 6 to our consolidated financial statements and “Related Party Transactions” below for additional information on our Investment Advisory and Management Agreement and Administration Agreement. Our expenses also include interest expense on our various forms of indebtedness. We bear all other out-of-pocket costs and expenses of our operations and transactions.
Net gain (loss)
We recognize realized gains or losses on investments, foreign currency forward contracts and foreign currency and other transactions based on the difference between the net proceeds from the disposition and the cost basis without regard to unrealized gains or losses previously recognized within net realized gain (loss) on the consolidated statements of operations. We record current period changes in fair value of investments, foreign currency forward contracts, foreign currency and other transactions within net change in unrealized gain (loss) on the consolidated statements of operations.
Portfolio and Investment Activity
During the year ended December 31, 2023, we invested $21.7 million in seven new portfolio companies and $41.2 million in 48 existing portfolio companies and had $103.0 million in aggregate amount of sales and principal repayments, resulting in a net reduction in investments of $40.1 million for the year.
During the year ended December 31, 2022, we invested $59.9 million in 20 new portfolio companies and $74.4 million in 45 existing portfolio companies and had $137.8 million in aggregate amount of sales and principal repayments, resulting in a net reduction in investments of $3.5 million for the year.
83
During the year ended December 31, 2021, we invested $146.9 million in 32 new portfolio companies and $80.0 million in 33 existing portfolio companies and had $234.5 million in aggregate amount of sales and principal repayments, resulting in a net reduction in investments of $7.6 million for the year.
The following table shows portfolio yield by security type:
| December 31, 2023 | December 31, 2022 | ||||||||||||||||||||||
Weighted Average Annualized Contractual Coupon Yield (1) | Weighted Average Annualized Effective Yield (2) | Weighted Average Annualized Contractual Coupon Yield (1) | Weighted Average Annualized Effective Yield (2) | ||||||||||||||||||||
| Senior secured loans | 12.6 | % | 12.6 | % | 11.8 | % | 11.8 | % | |||||||||||||||
| Unitranche secured loans | 12.8 | 14.1 | 4.8 | 5.2 | |||||||||||||||||||
| Junior secured loans | 8.6 | 8.6 | 11.4 | 11.4 | |||||||||||||||||||
| Preferred equity securities | 2.8 | 2.8 | 2.7 | 2.7 | |||||||||||||||||||
| Total | 12.1 | % | 12.1 | % | 11.0 | % | 11.0 | % | |||||||||||||||
______________________________________________________________
(1)The weighted average annualized contractual coupon yield at period end is computed by dividing (a) the interest income on our debt investments and preferred equity investments (with a stated coupon rate) at the period end contractual coupon rate for each investment by (b) the par value of our debt investments (excluding debt investments acquired for no cost in a restructuring on non-accrual status) and the cost basis of our preferred equity investments. We exclude loans acquired for no cost in a restructuring on non-accrual status within this metric as management believes this disclosure provides a better indication of return on invested capital. As of both December 31, 2023 and 2022, there were no loans excluded from the weighted average contractual coupon yield.
(2)The weighted average annualized effective yield on portfolio investments at period end is computed by dividing (a) interest income on our debt investments and preferred equity investments (with a stated coupon rate) at the period end effective rate for each investment by (b) the par value of our debt investments (excluding debt investments acquired for no cost in a restructuring on non-accrual status) and the cost basis of our preferred equity investments. The weighted average annualized effective yield on portfolio investments is a metric on the investment portfolio alone and does not represent a return to stockholders. This metric is not inclusive of our fees and expenses, the impact of leverage on the portfolio or sales load that may be paid by stockholders.
The following table shows the composition of our investment portfolio (in thousands):
| December 31, 2023 | December 31, 2022 | ||||||||||||||||||||||
| Fair Value: | |||||||||||||||||||||||
| Senior secured loans | $ | 388,882 | 79.6 | % | $ | 434,023 | 80.2 | % | |||||||||||||||
| Unitranche secured loans | 13,877 | 2.8 | 20,633 | 3.8 | |||||||||||||||||||
| Junior secured loans | 26,594 | 5.5 | 22,193 | 4.1 | |||||||||||||||||||
| LLC equity interest in SLF | 33,122 | 6.8 | 35,509 | 6.6 | |||||||||||||||||||
| Equity securities | 25,911 | 5.3 | 28,682 | 5.3 | |||||||||||||||||||
| Total | $ | 488,386 | 100.0 | % | $ | 541,040 | 100.0 | % | |||||||||||||||
Our portfolio composition remained relatively consistent with December 31, 2022. Our effective yields at December 31, 2023 increased from December 31, 2022, driven primarily by increases in base rates on our loan portfolio as a result of the higher interest rate environment during the year.
84
The following table shows our portfolio composition by industry (in thousands):
| December 31, 2023 | December 31, 2022 | ||||||||||||||||||||||
| Fair Value: | |||||||||||||||||||||||
| Aerospace & Defense | $ | 7,876 | 1.6 | % | $ | 7,436 | 1.4 | % | |||||||||||||||
| Automotive | 18,495 | 3.8 | 16,637 | 3.1 | |||||||||||||||||||
| Banking | 15,385 | 3.2 | 19,817 | 3.7 | |||||||||||||||||||
| Beverage, Food & Tobacco | 6,098 | 1.2 | 12,470 | 2.3 | |||||||||||||||||||
| Capital Equipment | 4,893 | 1.0 | 19,012 | 3.5 | |||||||||||||||||||
| Chemicals, Plastics & Rubber | 3,987 | 0.8 | 4,445 | 0.8 | |||||||||||||||||||
| Construction & Building | 8,813 | 1.8 | 6,706 | 1.2 | |||||||||||||||||||
| Consumer Goods: Durable | 8,242 | 1.7 | 9,338 | 1.7 | |||||||||||||||||||
| Consumer Goods: Non-Durable | 2,387 | 0.5 | 3,508 | 0.6 | |||||||||||||||||||
| Environmental Industries | 5,896 | 1.2 | 6,558 | 1.2 | |||||||||||||||||||
| FIRE: Finance | 15,388 | 3.3 | 23,892 | 4.4 | |||||||||||||||||||
| FIRE: Real Estate | 85,153 | 17.4 | 82,498 | 15.2 | |||||||||||||||||||
| Healthcare & Pharmaceuticals | 69,354 | 14.2 | 59,273 | 11.0 | |||||||||||||||||||
| High Tech Industries | 40,723 | 8.3 | 52,891 | 9.8 | |||||||||||||||||||
| Hotels, Gaming & Leisure | 110 | — | 2,720 | 0.5 | |||||||||||||||||||
| Investment Funds & Vehicles | 33,122 | 6.8 | 35,509 | 6.6 | |||||||||||||||||||
| Media: Advertising, Printing & Publishing | 20,238 | 4.1 | 19,777 | 3.7 | |||||||||||||||||||
| Media: Broadcasting & Subscription | 2,217 | 0.5 | 2,691 | 0.5 | |||||||||||||||||||
| Media: Diversified & Production | 41,897 | 8.6 | 36,164 | 6.7 | |||||||||||||||||||
| Retail | 1,995 | 0.4 | 9,306 | 1.7 | |||||||||||||||||||
| Services: Business | 56,655 | 11.6 | 57,308 | 10.6 | |||||||||||||||||||
| Services: Consumer | 16,772 | 3.4 | 31,324 | 5.8 | |||||||||||||||||||
| Telecommunications | 7,508 | 1.5 | 7,595 | 1.4 | |||||||||||||||||||
| Wholesale | 15,182 | 3.1 | 14,165 | 2.6 | |||||||||||||||||||
| Total | $ | 488,386 | 100.0 | % | $ | 541,040 | 100.0 | % | |||||||||||||||
Portfolio Asset Quality
MC Advisors’ portfolio management staff closely monitors all credits, with senior portfolio managers covering agented and more complex investments. MC Advisors segregates our capital markets investments by industry. The MC Advisors’ monitoring process and projections developed by Monroe Capital both have daily, weekly, monthly and quarterly components and related reports, each to evaluate performance against historical, budget and underwriting expectations. MC Advisors’ analysts will monitor performance using standard industry software tools to provide consistent disclosure of performance. When necessary, MC Advisors will update our internal risk ratings, borrowing base criteria and covenant compliance reports.
85
As part of the monitoring process, MC Advisors regularly assesses the risk profile of each of our investments and rates each of them based on an internal proprietary system that uses the categories listed below, which we refer to as MC Advisors’ investment performance risk rating. For any investment rated in Grades 3, 4 or 5, MC Advisors, through its internal Portfolio Management Group (“PMG”), will increase its monitoring intensity and prepare regular updates for the investment committee, summarizing current operating results and material impending events and suggesting recommended actions. The PMG is responsible for oversight and management of any investments rated in Grades 3, 4, or 5. MC Advisors monitors and, when appropriate, changes the investment ratings assigned to each investment in our portfolio. In connection with our valuation process, MC Advisors reviews these investment performance risk ratings on a quarterly basis. The investment performance risk rating system is described as follows:
| Investment Performance Risk Rating | Summary Description | |||||||
| Grade 1 | Includes investments exhibiting the least amount of risk in our portfolio. The issuer is performing above expectations or the issuer’s operating trends and risk factors are generally positive. | |||||||
| Grade 2 | Includes investments exhibiting an acceptable level of risk that is similar to the risk at the time of origination. The issuer is generally performing as expected or the risk factors are neutral to positive. | |||||||
| Grade 3 | Includes investments performing below expectations and indicates that the investment’s risk has increased somewhat since origination. The issuer may be out of compliance with debt covenants; however, scheduled loan payments are generally not past due. | |||||||
| Grade 4 | Includes an issuer performing materially below expectations and indicates that the issuer’s risk has increased materially since origination. In addition to the issuer being generally out of compliance with debt covenants, scheduled loan payments may be past due (but generally not more than six months past due). | |||||||
| Grade 5 | Indicates that the issuer is performing substantially below expectations and the investment risk has substantially increased since origination. Most or all of the debt covenants are out of compliance or payments are substantially delinquent. Investments graded 5 are not anticipated to be repaid in full. | |||||||
Our investment performance risk ratings do not constitute any rating of investments by a nationally recognized statistical rating organization or reflect or represent any third-party assessment of any of our investments.
In the event of a delinquency or a decision to rate an investment Grade 4 or Grade 5, the PMG, in consultation with the investment committee, will develop an action plan. Such a plan may require a meeting with the borrower’s management or the lender group to discuss reasons for the default and the steps management is undertaking to address the under-performance, as well as amendments and waivers that may be required. In the event of a dramatic deterioration of a credit, MC Advisors and the PMG will form a team or engage outside advisors to analyze, evaluate and take further steps to preserve our value in the credit. In this regard, we would expect to explore all options, including in a private equity sponsored investment, assuming certain responsibilities for the private equity sponsor or a formal sale of the business with oversight of the sale process by us. The PMG and the investment committee have extensive experience in running debt work-out transactions and bankruptcies.
86
The following table shows the distribution of our investments on the 1 to 5 investment performance risk rating scale as of December 31, 2023 (in thousands):
| Investment Performance Risk Rating | Investments at Fair Value | Percentage of Total Investments | ||||||||||||
| 1 | $ | — | — | % | ||||||||||
| 2 | 405,888 | 83.1 | ||||||||||||
| 3 | 74,224 | 15.2 | ||||||||||||
| 4 | 4,721 | 1.0 | ||||||||||||
| 5 | 3,553 | 0.7 | ||||||||||||
| Total | $ | 488,386 | 100.0 | % | ||||||||||
The following table shows the distribution of our investments on the 1 to 5 investment performance risk rating scale as of December 31, 2022 (in thousands):
| Investment Performance Risk Rating | Investments at Fair Value | Percentage of Total Investments | ||||||||||||
| 1 | $ | 766 | 0.1 | % | ||||||||||
| 2 | 469,772 | 86.8 | ||||||||||||
| 3 | 61,501 | 11.4 | ||||||||||||
| 4 | 8,619 | 1.6 | ||||||||||||
| 5 | 382 | 0.1 | ||||||||||||
| Total | $ | 541,040 | 100.0 | % | ||||||||||
As of December 31, 2023, we had five borrowers with loans or preferred equity securities on non-accrual status (Arcstor Midco, LLC, Education Corporation of America (“ECA”), Forman Mills, Inc. ("Forman Mills"), NECB Collections, LLC (“NECB”) and Thrasio, LLC), and these investments totaled $7.5 million of fair value, or 1.5% of our total investments at fair value at December 31, 2023. As of December 31, 2022, we had four borrowers with loans or preferred equity securities on non-accrual status (BLST Operating Company, LLC, ECA, NECB and Vinci Brands LLC ("Vinci")), and these investments totaled $2.8 million of fair value, or 0.5% of our total investments at fair value at December 31, 2022.
87
Results of Operations
Operating results were as follows (in thousands):
| For the Years Ended December 31, | |||||||||||||||||
| 2023 | 2022 | 2021 | |||||||||||||||
| Total investment income | $ | 64,297 | $ | 56,566 | $ | 53,830 | |||||||||||
| Total operating expenses, net of base management fee and incentive fee waivers | 40,242 | 32,969 | 31,380 | ||||||||||||||
| Net investment income before income taxes | 24,055 | 23,597 | 22,450 | ||||||||||||||
| Income taxes, including excise taxes | 806 | 1,405 | 282 | ||||||||||||||
| Net investment income | 23,249 | 22,192 | 22,168 | ||||||||||||||
| Net realized gain (loss) on investments | (38,769) | (1,130) | (21,764) | ||||||||||||||
| Net realized gain (loss) on extinguishment of debt | — | (1,039) | (3,110) | ||||||||||||||
| Net realized gain (loss) on foreign currency forward contracts | 1,756 | 119 | (48) | ||||||||||||||
| Net realized gain (loss) on foreign currency and other transactions | (135) | (36) | (895) | ||||||||||||||
| Net realized gain (loss) | (37,148) | (2,086) | (25,817) | ||||||||||||||
| Net change in unrealized gain (loss) on investments | 15,777 | (23,782) | 34,579 | ||||||||||||||
| Net change in unrealized gain (loss) on foreign currency forward contracts | (1,507) | 726 | 894 | ||||||||||||||
| Net change in unrealized gain (loss) on foreign currency and other transactions | — | 164 | 635 | ||||||||||||||
| Net change in unrealized gain (loss) | 14,270 | (22,892) | 36,108 | ||||||||||||||
| Net increase (decrease) in net assets resulting from operations | $ | 371 | $ | (2,786) | $ | 32,459 | |||||||||||
Investment Income
The composition of our investment income was as follows (in thousands):
| For the Years Ended December 31, | |||||||||||||||||
2023 | 2022 | 2021 | |||||||||||||||
| Interest income | $ | 49,779 | $ | 41,449 | $ | 35,738 | |||||||||||
| PIK interest income | 9,407 | 6,689 | 8,320 | ||||||||||||||
Dividend income (1) | 4,188 | 4,161 | 5,712 | ||||||||||||||
Fee income (2) | (679) | 2,380 | 1,267 | ||||||||||||||
| Prepayment gain (loss) | 553 | 803 | 1,691 | ||||||||||||||
| Accretion of discounts and amortization of premiums | 1,049 | 1,084 | 1,102 | ||||||||||||||
| Total investment income | $ | 64,297 | $ | 56,566 | $ | 53,830 | |||||||||||
______________________________________________________________
(1)During the years ended December 31, 2023, 2022 and 2021, includes PIK dividends of $477, $475 and $1,164, respectively.
(2)Fee income for the year ended December 31, 2023 includes the reversal of $1,559 of previously accrued fee income associated with our former loan investment in IT Global Holding, LLC ("IT Global").
88
The increase in investment income of $7.7 million during the year ended December 31, 2023, as compared to the year ended December 31, 2022, was primarily the result of an increase in cash and PIK interest income, partially offset by a decrease in fee income. The year ended December 31, 2023 included the reversal of $1.6 million of previously accrued fee income associated with our former loan investment in IT Global and the year ended December 31, 2022 included the one-time benefit of $2.0 million in previously unrecorded interest income associated with the repayment of our former loan investment in Curion Holdings, LLC ("Curion"). Excluding these non-recurring items, investment income increased $11.3 million during the year ended December 31, 2023, as compared to the year ended December 31, 2022. This increase was primarily the result of an increase in cash and PIK interest income due to the increases in effective rates on the portfolio as a result of the higher interest rate environment,
The increase in investment income of $2.7 million during the year ended December 31, 2022, as compared to the year ended December 31, 2021, was primarily the result of an increase in interest income and fee income, partially offset by a decrease in dividend income. The increase in interest income was primarily as a result of increases in effective rates on the portfolio as a result of the higher interest rate environment and the one-time benefit from the receipt of $2.0 million in previously unrecorded interest income associated with the repayment of our loan investment in Curion. Curion had been on non-accrual status and proceeds were received in excess of the cost basis as a result of the successful sale of the portfolio company.
Operating Expenses
The composition of our operating expenses was as follows (in thousands):
| For the Years Ended December 31, | |||||||||||||||||
| 2023 | 2022 | 2021 | |||||||||||||||
| Interest and other debt financing expenses | $ | 22,847 | $ | 17,080 | $ | 16,074 | |||||||||||
Base management fees, net of base management fee waivers (1) | 8,603 | 9,000 | 9,514 | ||||||||||||||
Incentive fees, net of incentive fee waivers (2) | 5,812 | 3,602 | 2,206 | ||||||||||||||
| Professional fees | 719 | 894 | 1,013 | ||||||||||||||
| Administrative service fees | 940 | 1,163 | 1,357 | ||||||||||||||
| General and administrative expenses | 1,174 | 1,082 | 1,072 | ||||||||||||||
| Directors’ fees | 147 | 148 | 144 | ||||||||||||||
| Total operating expenses, net of fee waivers | $ | 40,242 | $ | 32,969 | $ | 31,380 | |||||||||||
______________________________________________________________
(1)During the year ended December 31, 2022, MC Advisors elected to voluntarily waive base management fees of $55. MC Advisors did not waive any base management fees during the years ended December 31, 2023 and 2021.
(2)During the years ended December 31, 2022 and 2021, MC Advisors waived part one incentive fees (based on net investment income) of $525 and $1,484, respectively. MC Advisors did not waive any part one incentive fees during the year ended December 31, 2023. Incentive fees during the years ended December 31, 2023, 2022 and 2021 were not limited by the Incentive Fee Limitation. See Note 6 in our attached consolidated financial statements for additional information on the Incentive Fee Limitation.
89
The composition of our interest and other debt financing expenses, average debt outstanding and average stated interest rates (i.e. the rate in effect plus spread) were as follows (in thousands):
| For the Years Ended December 31, | |||||||||||||||||
| 2023 | 2022 | 2021 | |||||||||||||||
| Interest expense - revolving credit facility | $ | 15,319 | $ | 8,442 | $ | 4,593 | |||||||||||
| Interest expense - 2023 Notes | — | — | 837 | ||||||||||||||
| Interest expense - 2026 Notes | 6,220 | 6,220 | 5,763 | ||||||||||||||
| Interest expense - SBA debentures | — | 292 | 2,676 | ||||||||||||||
| Amortization of deferred financing costs | 1,308 | 2,126 | 2,205 | ||||||||||||||
| Total interest and other debt financing expenses | $ | 22,847 | $ | 17,080 | $ | 16,074 | |||||||||||
| Average debt outstanding | $ | 318,884 | $ | 314,053 | $ | 332,034 | |||||||||||
| Average stated interest rate | 6.7% | 4.7% | 4.1% | ||||||||||||||
The increase in operating expenses, net of fee waivers of $7.3 million during the year ended December 31, 2023, as compared to the year ended December 31, 2022, was primarily driven by an increase in interest and other debt financing expenses, resulting from the higher interest rate environment, and an increase in incentive fees, net of incentive fee waivers, driven by stronger pre-incentive fee net investment income performance.
The increase in operating expenses, net of fee waivers of $1.6 million during the year ended December 31, 2022, as compared to the year ended December 31, 2021, was primarily the result of an increase in incentive fees, net of incentive fee waivers, and interest and other debt financing expenses, partially offset by a decrease in base management fees. The increase in interest and other debt financing expenses is primarily as a result of the increase in average stated interest rate as a result of the higher interest rate environment, partially offset by lower average debt outstanding.
Income Taxes, Including Excise Taxes
We have elected to be treated as a RIC under Subchapter M of the Code and operate in a manner so as to qualify for the tax treatment available to RICs. To maintain qualification as a RIC, we must, among other things, meet certain source-of-income and asset diversification requirements and distribute to stockholders, for each taxable year, at least 90% of our “investment company taxable income,” which is generally our net ordinary income plus the excess, if any, of realized net short-term capital gains over realized net long-term capital losses.
Depending on the level of taxable income earned in a tax year, we may choose to carry forward such taxable income in excess of current year dividend distributions from such current year taxable income into the next year and pay a 4% excise tax on such income, as required. To the extent that we determine that our estimated current year annual taxable income may exceed estimated current year dividend distributions, we accrue excise tax, if any, on estimated excess taxable income as such taxable income is earned. For the years ended December 31, 2023, 2022 and 2021, we recorded a net expense on the consolidated statements of operations of $0.5 million, $0.1 million, and $0.3 million, respectively, for U.S. federal excise tax.
Certain of our consolidated subsidiaries are subject to U.S. federal and state corporate-level income taxes. For the years ended December 31, 2023, 2022 and 2021, we recorded a net tax expense on the consolidated statements of operations of $0.3 million, $1.3 million and $4 thousand, respectively, for these subsidiaries.
Net Realized Gain (Loss)
During the years ended December 31, 2023, 2022 and 2021, we had sales or dispositions of investments resulting in ($38.8) million, ($1.1) million and ($21.8) million of net realized gain (loss), respectively. The net realized losses during the year ended December 31, 2023 were primarily related to the realization of the previously unrecorded loss on our investment in Vinci and realizations of California Pizza Kitchen, Inc. ("CPK") and Forman Mills. During 2022, the net realized loss was primarily attributable to the realization of the previously recorded unrealized loss on our investment in Toojay’s OldCo partially offset by the realization of the previously recorded unrealized gain on our investment in Rockdale Blackhawk, LLC. During 2021, the realized losses were primarily attributable to the realization of the previously recorded unrealized loss on our investments in Worth Collection, Ltd., SHI Holdings, Inc., Parterre Flooring and Surface Systems LLC and Answers Finance, LLC, partially offset by the gain on the disposition of Luxury Optical Holdings Co.
90
During the years ended December 31, 2023, 2022 and 2021, we had extinguishment of debt resulting in zero, ($1.0) million and ($3.1) million of net realized gain (loss), respectively. During 2022, the realized loss was due to the repayment of our remaining $56.9 million of SBA debentures on March 1, 2022. During 2021, the realized loss was due to our $109.0 million repayment of the 2023 Notes on February 18, 2021 and the repayment of $28.1 million of SBA debentures on March 1, 2021 and $30.0 million of SBA debentures on September 1, 2021.
We may enter into foreign currency forward contracts to reduce our exposure to foreign currency exchange rate fluctuations. During the years ended December 31, 2023, 2022 and 2021, we had $1.8 million, $0.1 million and ($48) thousand of net realized gain (loss) on foreign currency forward contracts, respectively. During the years ended December 31, 2023, 2022 and 2021, we had ($0.1) million, ($36) thousand and ($0.9) million of net realized gain (loss) on foreign currency and other transactions, respectively.
Net Change in Unrealized Gain (Loss)
For the years ended December 31, 2023, 2022 and 2021, our investments had $15.8 million, ($23.8) million and $34.6 million of net change in unrealized gain (loss), respectively. The net change in unrealized gain (loss) includes both unrealized gain on investments in our portfolio with mark-to-market gains during the years and unrealized loss on investments in our portfolio with mark-to-market losses during the years.
During the year ended December 31, 2023, the net change in unrealized gain on investments was primarily attributable to the reversal of previously recorded unrealized losses upon the disposition of certain assets during the period. The net change in unrealized gains during the year ended December 31, 2023 was primarily attributable to the realization of previously recorded unrealized losses upon the disposition of certain assets during the year. Excluding the $29.0 million reversal of previously recognized unrealized losses on our investments due to realizations during the year, we estimate approximately $12.9 million in net unrealized mark-to-market losses were primarily attributable to portfolio companies that have underlying credit performance concerns resulting in a risk rating of Grade 3,4 or 5 on our investment performance risk rating scale that were still held as of December 31, 2023 and $2.4 million in net unrealized mark-to-market losses on our investment in SLF, SLF's underlying investments, which are loans to traditional upper middle-market borrowers, experienced higher volatility in valuation than the rest of the portfolio.
During the year ended December 31, 2022, the net change in unrealized loss on investments was primarily attributable to portfolio companies that have underlying credit performance concerns resulting in a risk rating of Grade 3, 4 or 5 on our investment performance risk rating scale that were still held as of December 31, 2022 of $17.5 million. Additionally, overall market volatility and spread widening in the loan market, including approximately $6.1 million of unrealized losses attributable to our investment in SLF contributed to the net unrealized loss on investments.
The net change in unrealized gains during the year ended December 31, 2021 was primarily attributable to the realization of previously recorded unrealized losses upon the disposition of certain assets during the year. Excluding the $26.5 million reversal of previously recognized unrealized losses on our investments due to realizations during the year, we estimate approximately $9.7 million of the net unrealized gain on investments during the year ended December 31, 2021 was attributable to broad market movements and tightening of credit spreads in the loan markets. Approximately $7.9 million of these net unrealized gains were attributable to investments held in the portfolio directly, while approximately $1.8 million of these gains were attributable to our investment in SLF. This was partially offset by ($1.6) million in net unrealized losses on investments attributable to portfolio company concerns resulting in a risk rating of Grade 3, 4 or 5 on our investment performance risk rating scale.
For the years ended December 31, 2023, 2022 and 2021, our foreign currency forward contracts had ($1.5) million, $0.7 million, and $0.9 million of net change in unrealized gain (loss), respectively. For the years ended December 31, 2023, 2022 and 2021, our foreign currency borrowings had zero, $0.2 million, $0.7 million and of net change in unrealized gain (loss), respectively.
Net Increase (Decrease) in Net Assets Resulting from Operations
For the years ended December 31, 2023, 2022 and 2021, the net increase (decrease) in net assets from operations was $0.4 million, ($2.8) million and $32.5 million, respectively. Based on the weighted average shares of common stock outstanding for the years ended December 31, 2023, 2022 and 2021, our per share net increase (decrease) in net assets resulting from operations was $0.02, ($0.13) and $1.51, respectively. The $3.2 million increase during the year ended December 31, 2023, was primarily the result of lower net losses on investments and increased net investment income due to increases in effective interest rates on the portfolio as a result of the higher interest rate environment.
91
The $35.3 million decrease during the year ended December 31, 2022, was primarily the result of net unrealized mark-to-market losses on investments primarily due to market volatility and spread widening in the loan market and unrealized losses on portfolio companies that have underlying credit or fundamental performance concerns resulting in a risk rating of Grade 3, 4 or 5 on our investment performance risk rating scale during the year ended December 31, 2022, as compared to the year ended December 31, 2021, where investments in the portfolio experienced net mark-to-market gains, primarily attributable to broad market movements and the tightening of credit spreads in the loan markets and unrealized gains on certain portfolio companies that had underlying credit or fundamental performance concerns resulting in a risk rating of Grade 3, 4 or 5 on our investment performance risk rating scale.
Liquidity and Capital Resources
As of December 31, 2023, we had $5.0 million in cash, $174.1 million of total debt outstanding on our revolving credit facility and $130.0 million in 2026 Notes. We had $80.9 million available for additional borrowings on our revolving credit facility, subject to borrowing base availability. See “Borrowings” below for additional information.
In accordance with the 1940 Act, we are permitted to borrow amounts such that our asset coverage ratio, as defined in the 1940 Act, is at least 150% after such borrowing. We were granted exemptive relief from the SEC for permission to exclude the debt of MRCC SBIC guaranteed by the SBA, prior to its dissolution, from the asset coverage test under the 1940 Act. As of both December 31, 2023 and 2022, our asset coverage ratio based on aggregate borrowings outstanding was 167
Cash Flows
For the year ended December 31, 2023, we experienced a net increase (decrease) in cash and cash equivalents of ($0.5) million. During the same period operating activities provided $51.7 million, primarily as a result of sales of and principal repayments on portfolio investments, partially offset by purchases of portfolio investments. During the same period, we used ($52.2) million in financing activities, primarily as a result of distributions to stockholders and net repayments on our revolving credit facility.
For the year ended December 31, 2022, we experienced a net increase (decrease) in cash and cash equivalents of ($12.6) million. During the same period operating activities provided $14.1 million, primarily as a result of sales of and principal repayments on portfolio investments, partially offset by purchases of portfolio investments. During the same period, we used ($26.7) million in financing activities, primarily as a result of repayments on our SBA debentures and distributions to stockholders, partially offset by net borrowings on our revolving credit facility.
For the year ended December 31, 2021, we experienced a net increase (decrease) in cash and restricted cash and cash equivalents of ($14.3) million. During the same period operating activities provided $20.0 million, primarily as a result of sales of and principal repayments on portfolio investments, partially offset by purchases of portfolio investments. During the same period, we used ($34.3) million in financing activities, primarily as a result of net repayments on our revolving credit facility and distributions to stockholders, partially offset by net proceeds from shares issued under the at-the-market (“ATM”) securities offering program.
Capital Resources
As a BDC, we distribute substantially all of our net income to our stockholders and have an ongoing need to raise additional capital for investment purposes. We intend to generate additional cash primarily from future offerings of securities, future borrowings and cash flows from operations, including income earned from investments in our portfolio companies. On both a short-term and long-term basis, our primary use of funds will be to invest in portfolio companies and make cash distributions to our stockholders. We may also use available funds to repay outstanding borrowings.
As a BDC, we are generally not permitted to issue and sell our common stock at a price below net asset value (“NAV”) per share. We may, however, sell our common stock, or warrants, options or rights to acquire our common stock, at a price below the then-current NAV per share of our common stock if our board of directors (“Board”), including our independent directors, determines that such sale is in the best interests of us and our stockholders, and if our stockholders have approved such sales. On June 15, 2023, our stockholders once again voted to allow us to sell or otherwise issue common stock at a price below net asset value per share for a period of one year, subject to certain limitations. As of both December 31, 2023 and 2022, we had 21,666,340 shares outstanding.
92
On June 24, 2015, our stockholders approved a proposal to authorize us to issue warrants, options or rights to subscribe to, convert to, or purchase our common stock in one or more offerings. This is a standing authorization and does not require annual re-approval by our stockholders.
Stock Issuances: On May 12, 2017, we entered into ATM equity distribution agreements with each of JMP Securities LLC (“JMP”) and FBR Capital Markets & Co. (“FBR”) (the “ATM Program”) through which we can sell, by means of ATM offerings, from time to time, up to $50.0 million of our common stock. On May 8, 2020, we entered into an amendment to the ATM Program to extend its term. All other material terms of the ATM Program remain unchanged. During the year ended December 31, 2021, we sold 362,800 shares at an average price of $11.53 per share for gross proceeds of $4.2 million under the ATM Program. Aggregate underwriter’s discounts and commissions were $63 thousand and offering costs were $27 thousand, resulting in net proceeds of approximately $4.1 million. There were no stock issuances through the ATM Program during the years ended December 31, 2023 and 2022, respectively.
Borrowings
On December 27, 2022, we amended the revolving credit facility which extended the maturity date from March 1, 2024 to December 27, 2027, increased the advance rate against certain types of assets in our portfolio, with corresponding adjustments to the concentration limits and replaced LIBOR benchmark provisions with term SOFR benchmark provisions. The other significant terms of the credit facility remained unchanged. We incurred expenses of $1.8 million in conjunction with the amendment which have been capitalized within unamortized deferred financing costs and are amortized into interest expense over the estimated average life of the borrowings.
Our ability to borrow under the revolving credit facility is subject to availability under the borrowing base, which permits us to borrow up to 72.5% of the fair market value of our portfolio company investments depending on the type of investment we hold and whether the investment is quoted. Our ability to borrow is also subject to certain concentration limits, and continued compliance with the representations, warranties and covenants given by us under the facility. The revolving credit facility contains certain financial covenants, including, but not limited to, our maintenance of: (1) minimum consolidated total net assets at least equal to $150.0 million plus 65% of the net proceeds to us from sales of our equity securities after March 1, 2019; (2) a ratio of total assets (less total liabilities other than indebtedness) to total indebtedness of not less than 1.5 to 1; and (3) a senior debt coverage ratio of at least 2 to 1. The revolving credit facility also requires us to undertake customary indemnification obligations with respect to ING Capital LLC and other members of the lending group and to reimburse the lenders for expenses associated with entering into the credit facility. The revolving credit facility also has customary provisions regarding events of default, including events of default for nonpayment, change in control transactions at both Monroe Capital Corporation and MC Advisors, failure to comply with financial and negative covenants, and failure to maintain our relationship with MC Advisors. If we incur an event of default under the revolving credit facility and fail to remedy such default under any applicable grace period, if any, then the entire revolving credit facility could become immediately due and payable, which would materially and adversely affect our liquidity, financial condition, results of operations and cash flows.
Our revolving credit facility also imposes certain conditions that may limit the amount of our distributions to stockholders. Distributions payable in our common stock under the dividend reinvestment plan (“DRIP”) are not limited by the revolving credit facility. Distributions in cash or property other than common stock are generally limited to 115% of the amount of distributions required to maintain our status as a RIC.
93
As of December 31, 2023 and 2022, we had U.S. dollar borrowings of $174.1 million and $204.6 million, respectively, and no borrowings denominated in a foreign currency as of either date. Any borrowings denominated in a foreign currency may be positively or negatively affected by movements in the rate of exchange between the U.S. dollar and the respective foreign currency. These movements are beyond our control and cannot be predicted. Borrowings denominated in a foreign currency are translated into U.S. dollars based on the spot rate at each balance sheet date. The impact resulting from changes in foreign currency borrowings is included in net change in unrealized gain (loss) on foreign currency and other transactions on our consolidated statements of operations and totaled zero, $0.2 million, and $0.7 million for the years ended December 31, 2023, 2022 and 2021, respectively. The were no repayments of foreign currency borrowings for the year ended December 31, 2023. For the year ended December 31, 2022, we repaid borrowings denominated in Great Britain pounds of £3.4 million. As a result of this repayment, we recognized a realized gain (loss) on foreign currency and other transactions on our consolidated statements of operations ($11 ) thousand for the year ended December 31, 2022. For the year ended December 31, 2021, we repaid borrowings denominated in Great Britain pounds of £12.7. As a result of this repayment, we recognized a realized gain (loss) on foreign currency and other transactions on our consolidated statements of operations of ($0.9) million for the year ended December 31, 2021.
Borrowings under the revolving credit facility bear interest, at our election, at an annual rate of SOFR (one-month or three-month at our discretion based on the term of the borrowing) plus 2.625% or at a daily rate equal to 1.625% per annum plus the greater of 1.5%, the prime interest rate, the federal funds rate plus 0.5% or SOFR plus 1.0%, with a SOFR floor of 0.5%. In addition to the stated interest rate on borrowings under the revolving credit facility, we are required to pay a commitment fee and certain conditional fees based on usage of the expanded borrowing base and usage of the asset coverage ratio flexibility. A commitment fee of 0.5% per annum on any unused portion of the revolving credit facility if the utilized portion of the facility is greater than 35% of the then available maximum borrowing or a commitment fee of 1.0% per annum on any unused portion of the revolving credit facility if the utilized portion of the facility is less than or equal to 35% of the then available maximum borrowing. As of December 31, 2023 and 2022, the outstanding borrowings were accruing at a weighted average interest rate of 8.1 % and 7.0 %, respectively.
Distributions
Our Board will determine the timing and amount, if any, of our distributions. We intend to pay distributions on a quarterly basis. In order to avoid corporate-level tax on the income we distribute as a RIC, we must distribute to our stockholders at least 90% of our ordinary income and realized net short-term capital gains in excess of realized net long-term capital losses, if any, on an annual basis out of the assets legally available for such distributions. In addition, we also intend to distribute any realized net capital gains (i.e., realized net long-term capital gains in excess of realized net short-term capital losses) at least annually out of the assets legally available for such distributions. Distributions to stockholders for the years ended December 31, 2023, 2022 and 2021 totaled $21.7 million ($1.00 per share), $21.7 million ($1.00 per share), and $21.5 million ($1.00 per share), respectively, none of which represented a return of capital. The tax character of such distributions is determined at the end of the fiscal year.
94
In October 2012, we adopted an “opt out” DRIP for our common stockholders. When we declare a distribution, our stockholders’ cash distributions will automatically be reinvested in additional shares of our common stock unless a stockholder specifically “opts out” of our DRIP. If a stockholder opts out, that stockholder will receive cash distributions. Although distributions paid in the form of additional shares of our common stock will generally be subject to U.S. federal, state and local taxes in the same manner as cash distributions, stockholders participating in our DRIP will not receive any corresponding cash distributions with which to pay any such applicable taxes.
MRCC Senior Loan Fund I, LLC
We co-invest with Life Insurance Company of the Southwest (“LSW”) in senior secured loans through SLF, an unconsolidated Delaware LLC. SLF is capitalized as underlying investment transactions are completed, taking into account available debt and equity commitments available for funding these investments. All portfolio and investment decisions in respect to SLF must be approved by the SLF investment committee, consisting of one representative of each of us and LSW. SLF may cease making new investments upon notification of either member but operations will continue until all investments have been sold or paid-off in the normal course of business. Investments held by SLF are measured at fair value using the same valuation methodologies as described below. Our investment is illiquid in nature as SLF does not allow for withdrawal from the LLC or the sale of a member’s interest unless approved by the board members of SLF. The full withdrawal of a member would result in an orderly wind-down of SLF.
SLF’s profits and losses are allocated to us and LSW in accordance with the respective ownership interests. As of both December 31, 2023 and 2022, we and LSW each owned 50.0% of the LLC equity interests of SLF. As of both December 31, 2023 and 2022, SLF had $100.0 million in equity commitments from its members (in the aggregate), of which $85.3 million was funded.
As of both December 31, 2023 and 2022, we had committed to fund $50.0 million of LLC equity interest subscriptions to SLF. As of both December 31, 2023 and 2022, $42.7 million of our LLC equity interest subscriptions to SLF had been called and contributed, net of return of capital distributions subject to recall.
For the years ended December 31, 2023, 2022 and 2021, we received $3.6 million, $3.6 million and $4.3 million of dividend income from our LLC equity interest in SLF, respectively.
SLF has a senior secured revolving credit facility (as amended, the “SLF Credit Facility”) with Capital One, N.A., through its wholly-owned subsidiary MRCC Senior Loan Fund I Financing SPV, LLC (“SLF SPV”). The SLF Credit Facility allows SLF SPV to borrow up to $110.0 million (reduced from $175.0 million on June 9, 2023), subject to leverage and borrowing base restrictions. Borrowings on the SLF Credit Facility bear interest at an annual rate of SOFR (three-month) plus 2.10% and the SLF Credit Facility has a maturity date of November 23, 2031.
SLF does not pay any fees to MC Advisors or its affiliates; however, SLF has entered into an administration agreement with Monroe Capital Management Advisors, LLC (“MC Management”), pursuant to which certain loan servicing and administrative functions are delegated to MC Management. SLF may reimburse MC Management for its allocable share of overhead and other expenses incurred by MC Management. For the years ended December 31, 2023, 2022 and 2021, SLF incurred $0.2 million, $0.2 million, and $0.2 million of allocable expenses, respectively. There are no agreements or understandings by which we guarantee any SLF obligations.
As of December 31, 2023 and 2022, SLF had total assets at fair value of $148.4 million and $192.8 million, respectively. As of December 31, 2023 and 2022, SLF had four and one portfolio company investment on non-accrual status with a fair value of $4.3 million and $0.4 million, respectively. The portfolio companies in SLF are in industries and geographies similar to those in which we may invest directly. Additionally, as of December 31, 2023 and 2022, SLF had $3.3 million and $4.6 million, respectively, in outstanding commitments to fund investments under undrawn revolvers and delayed draw commitments.
95
Below is a summary of SLF’s portfolio, followed by a listing of the individual investments in SLF’s portfolio as of December 31, 2023 and 2022:
As of | |||||||||||
December 31, 2023 | December 31, 2022 | ||||||||||
Senior secured loans (1) | 150,674 | 197,867 | |||||||||
Weighted average current interest rate on senior secured loans (2) | 10.2% | 9.7% | |||||||||
| Number of portfolio company investments in SLF | 49 | 60 | |||||||||
Largest portfolio company investment (1) | 6,580 | 6,650 | |||||||||
Total of five largest portfolio company investments (1) | 26,415 | 27,026 | |||||||||
______________________________________________________________
(1)Represents outstanding principal amount, excluding unfunded commitments. Principal amounts in thousands.
(2)Computed as the (a) annual stated interest rate on accruing senior secured loans divided by (b) total senior secured loans at outstanding principal amount.
96
MRCC SENIOR LOAN FUND I, LLC
CONSOLIDATED SCHEDULE OF INVESTMENTS
December 31, 2023
(in thousands)
Portfolio Company (a) | Index (b) | Spread(b) | Interest Rate (b) | Maturity | Principal | Fair Value | ||||||||||||||||||||||||||||||||
| Non-Controlled/Non-Affiliate Company Investments | ||||||||||||||||||||||||||||||||||||||
| Senior Secured Loans | ||||||||||||||||||||||||||||||||||||||
| Aerospace & Defense | ||||||||||||||||||||||||||||||||||||||
| Trident Maritime Systems, Inc. | SF | 5.60 | % | 10.95 | % | 2/26/2027 | 2,414 | $ | 2,385 | |||||||||||||||||||||||||||||
| Trident Maritime Systems, Inc. | SF | 5.60 | % | 10.95 | % | 2/26/2027 | 746 | 737 | ||||||||||||||||||||||||||||||
| Trident Maritime Systems, Inc. | SF | 5.60 | % | 10.96 | % | 2/26/2027 | 188 | 186 | ||||||||||||||||||||||||||||||
| Trident Maritime Systems, Inc. (Revolver) | SF | 5.60 | % | 10.96 | % | 2/26/2027 | 319 | 315 | ||||||||||||||||||||||||||||||
| 3,667 | 3,623 | |||||||||||||||||||||||||||||||||||||
| Automotive | ||||||||||||||||||||||||||||||||||||||
| Accelerate Auto Works Intermediate, LLC | SF | 4.90 | % | 10.29 | % | 12/1/2027 | 1,358 | 1,342 | ||||||||||||||||||||||||||||||
| Accelerate Auto Works Intermediate, LLC | SF | 4.90 | % | 10.30 | % | 12/1/2027 | 388 | 383 | ||||||||||||||||||||||||||||||
Accelerate Auto Works Intermediate, LLC (Revolver) (d) | SF | 4.90 | % | 10.29 | % | 12/1/2027 | 132 | — | ||||||||||||||||||||||||||||||
| Truck-Lite Co., LLC | SF | 6.35 | % | 11.71 | % | 12/14/2026 | 1,674 | 1,670 | ||||||||||||||||||||||||||||||
| Truck-Lite Co., LLC | SF | 6.35 | % | 11.71 | % | 12/14/2026 | 248 | 248 | ||||||||||||||||||||||||||||||
| Truck-Lite Co., LLC | SF | 6.35 | % | 11.71 | % | 12/14/2026 | 42 | 42 | ||||||||||||||||||||||||||||||
| 3,842 | 3,685 | |||||||||||||||||||||||||||||||||||||
| Beverage, Food & Tobacco | ||||||||||||||||||||||||||||||||||||||
| SW Ingredients Holdings, LLC | SF | 4.75 | % | 10.21 | % | 7/3/2025 | 3,544 | 3,539 | ||||||||||||||||||||||||||||||
| 3,544 | 3,539 | |||||||||||||||||||||||||||||||||||||
| Capital Equipment | ||||||||||||||||||||||||||||||||||||||
| DS Parent, Inc. | SF | 5.75 | % | 11.21 | % | 12/8/2028 | 2,700 | 2,706 | ||||||||||||||||||||||||||||||
| MacQueen Equipment, LLC | SF | 5.51 | % | 10.86 | % | 1/7/2028 | 2,075 | 2,075 | ||||||||||||||||||||||||||||||
MacQueen Equipment, LLC (Delayed Draw) (d) | SF | 5.51 | % | 10.86 | % | 1/7/2028 | 591 | 78 | ||||||||||||||||||||||||||||||
MacQueen Equipment, LLC (Revolver) (d) | SF | 5.51 | % | 10.86 | % | 1/7/2028 | 296 | — | ||||||||||||||||||||||||||||||
| 5,662 | 4,859 | |||||||||||||||||||||||||||||||||||||
| Chemicals, Plastics & Rubber | ||||||||||||||||||||||||||||||||||||||
| Phoenix Chemical Holding Company LLC | SF | 7.11 | % | 12.47 | % | 8/2/2024 | 1,131 | 1,020 | ||||||||||||||||||||||||||||||
| TJC Spartech Acquisition Corp. | SF | 4.75 | % | 10.16 | % | 5/5/2028 | 4,210 | 4,063 | ||||||||||||||||||||||||||||||
| 5,341 | 5,083 | |||||||||||||||||||||||||||||||||||||
| Consumer Goods: Durable | ||||||||||||||||||||||||||||||||||||||
Elevate Textiles, Inc. (fka International Textile Group, Inc.) (e) | SF | 6.65 | % | 12.04 | % | 9/30/2027 | 798 | 798 | ||||||||||||||||||||||||||||||
| Runner Buyer INC. | SF | 5.61 | % | 11.00 | % | 10/23/2028 | 2,948 | 2,333 | ||||||||||||||||||||||||||||||
| 3,746 | 3,131 | |||||||||||||||||||||||||||||||||||||
| Consumer Goods: Non-Durable | ||||||||||||||||||||||||||||||||||||||
| PH Beauty Holdings III, INC. | SF | 5.00 | % | 10.35 | % | 9/26/2025 | 2,368 | 2,253 | ||||||||||||||||||||||||||||||
| 2,368 | 2,253 | |||||||||||||||||||||||||||||||||||||
97
MRCC SENIOR LOAN FUND I, LLC
CONSOLIDATED SCHEDULE OF INVESTMENTS – (continued)
December 31, 2023
(in thousands)
Portfolio Company (a) | Index (b) | Spread(b) | Interest Rate (b) | Maturity | Principal | Fair Value | ||||||||||||||||||||||||||||||||
| Containers, Packaging & Glass | ||||||||||||||||||||||||||||||||||||||
| Polychem Acquisition, LLC | SF | 5.11 | % | 10.47 | % | 3/17/2025 | 2,858 | $ | 2,855 | |||||||||||||||||||||||||||||
| PVHC Holding Corp | SF | 5.65 | % | 11.00% Cash/ 0.75% PIK | 2/17/2027 | 1,895 | 1,895 | |||||||||||||||||||||||||||||||
| 4,753 | 4,750 | |||||||||||||||||||||||||||||||||||||
| Energy: Oil & Gas | ||||||||||||||||||||||||||||||||||||||
| Offen, Inc. | SF | 5.11 | % | 10.47 | % | 6/22/2026 | 2,249 | 2,249 | ||||||||||||||||||||||||||||||
| Offen, Inc. | SF | 5.11 | % | 10.47 | % | 6/22/2026 | 858 | 858 | ||||||||||||||||||||||||||||||
| 3,107 | 3,107 | |||||||||||||||||||||||||||||||||||||
| FIRE: Finance | ||||||||||||||||||||||||||||||||||||||
| Harbour Benefit Holdings, Inc. | SF | 5.15 | % | 10.50 | % | 12/13/2024 | 2,854 | 2,852 | ||||||||||||||||||||||||||||||
| Harbour Benefit Holdings, Inc. | SF | 5.10 | % | 10.46 | % | 12/13/2024 | 61 | 61 | ||||||||||||||||||||||||||||||
| Minotaur Acquisition, Inc. | SF | 4.85 | % | 10.21 | % | 3/27/2026 | 4,806 | 4,814 | ||||||||||||||||||||||||||||||
| TEAM Public Choices, LLC | SF | 5.43 | % | 10.88 | % | 12/17/2027 | 2,925 | 2,908 | ||||||||||||||||||||||||||||||
| 10,646 | 10,635 | |||||||||||||||||||||||||||||||||||||
| FIRE: Real Estate | ||||||||||||||||||||||||||||||||||||||
Avison Young (USA) Inc. (c)(e) | SF | 6.50 | % | 11.97 | % | 1/30/2026 | 4,775 | 1,564 | ||||||||||||||||||||||||||||||
| 4,775 | 1,564 | |||||||||||||||||||||||||||||||||||||
| Healthcare & Pharmaceuticals | ||||||||||||||||||||||||||||||||||||||
Cano Health, LLC (e) | SF | 4.10 | % | 9.42 | % | 11/23/2027 | 1,950 | 857 | ||||||||||||||||||||||||||||||
| HAH Group Holding Company LLC | SF | 5.00 | % | 10.46 | % | 10/29/2027 | 2,950 | 2,942 | ||||||||||||||||||||||||||||||
| LSCS Holdings, Inc. | SF | 4.61 | % | 9.97 | % | 12/15/2028 | 1,809 | 1,786 | ||||||||||||||||||||||||||||||
| Natus Medical Incorporated | SF | 5.50 | % | 10.85 | % | 7/20/2029 | 4,950 | 4,604 | ||||||||||||||||||||||||||||||
| Paragon Healthcare, Inc. | SF | 5.85 | % | 11.25 | % | 1/19/2027 | 2,105 | 2,083 | ||||||||||||||||||||||||||||||
| Paragon Healthcare, Inc. | SF | 5.75 | % | 11.22 | % | 1/19/2027 | 363 | 359 | ||||||||||||||||||||||||||||||
Paragon Healthcare, Inc. (Revolver) (d) | SF | 5.75 | % | 11.22 | % | 1/19/2027 | 490 | — | ||||||||||||||||||||||||||||||
| Radiology Partners, Inc. | SF | 4.68 | % | 10.18 | % | 7/9/2025 | 4,737 | 3,844 | ||||||||||||||||||||||||||||||
| 19,354 | 16,475 | |||||||||||||||||||||||||||||||||||||
| High Tech Industries | ||||||||||||||||||||||||||||||||||||||
Corel Inc. (c) | SF | 5.10 | % | 10.49 | % | 7/2/2026 | 3,400 | 3,323 | ||||||||||||||||||||||||||||||
| Lightbox Intermediate, L.P. | SF | 5.26 | % | 10.61 | % | 5/11/2026 | 4,775 | 4,632 | ||||||||||||||||||||||||||||||
| TGG TS Acquisition Company | SF | 6.61 | % | 11.97 | % | 12/12/2025 | 2,885 | 2,791 | ||||||||||||||||||||||||||||||
| 11,060 | 10,746 | |||||||||||||||||||||||||||||||||||||
98
MRCC SENIOR LOAN FUND I, LLC
CONSOLIDATED SCHEDULE OF INVESTMENTS – (continued)
December 31, 2023
(in thousands)
Portfolio Company (a) | Index (b) | Spread(b) | Interest Rate (b) | Maturity | Principal | Fair Value | ||||||||||||||||||||||||||||||||
| Hotels, Gaming & Leisure | ||||||||||||||||||||||||||||||||||||||
| Excel Fitness Holdings, Inc. | SF | 5.40 | % | 10.75 | % | 4/27/2029 | 4,320 | $ | 4,308 | |||||||||||||||||||||||||||||
Excel Fitness Holdings, Inc. (Revolver) (d) | SF | 5.40 | % | 10.75 | % | 4/28/2028 | 625 | — | ||||||||||||||||||||||||||||||
| North Haven Spartan US Holdco, LLC | SF | 6.25 | % | 11.63 | % | 6/6/2025 | 2,250 | 2,241 | ||||||||||||||||||||||||||||||
| Tait LLC | SF | 4.50 | % | 10.00 | % | 3/28/2025 | 4,040 | 4,026 | ||||||||||||||||||||||||||||||
Tait LLC (Revolver) (d) | SF | 4.50 | % | 10.00 | % | 3/28/2025 | 769 | — | ||||||||||||||||||||||||||||||
| 12,004 | 10,575 | |||||||||||||||||||||||||||||||||||||
| Media: Diversified & Production | ||||||||||||||||||||||||||||||||||||||
| Research Now Group, Inc. and Survey Sampling International, LLC | SF | 5.76 | % | 11.14 | % | 12/20/2024 | 6,580 | 4,914 | ||||||||||||||||||||||||||||||
| STATS Intermediate Holdings, LLC | SF | 5.51 | % | 10.88 | % | 7/10/2026 | 4,800 | 4,684 | ||||||||||||||||||||||||||||||
| TA TT Buyer, LLC | SF | 5.00 | % | 10.35 | % | 3/30/2029 | 3,292 | 3,275 | ||||||||||||||||||||||||||||||
| 14,672 | 12,873 | |||||||||||||||||||||||||||||||||||||
| Services: Business | ||||||||||||||||||||||||||||||||||||||
| CHA Holdings, Inc | SF | 4.61 | % | 9.97 | % | 4/10/2025 | 1,939 | 1,908 | ||||||||||||||||||||||||||||||
| CHA Holdings, Inc | SF | 4.61 | % | 9.97 | % | 4/10/2025 | 409 | 402 | ||||||||||||||||||||||||||||||
| Eliassen Group, LLC | SF | 5.50 | % | 10.85 | % | 4/14/2028 | 3,218 | 3,152 | ||||||||||||||||||||||||||||||
Eliassen Group, LLC (Delayed Draw) (d) | SF | 5.50 | % | 10.86 | % | 4/14/2028 | 739 | 227 | ||||||||||||||||||||||||||||||
| Engage2Excel, Inc. | SF | 7.35 | % | 12.53 | % | 7/1/2024 | 3,918 | 3,918 | ||||||||||||||||||||||||||||||
| Engage2Excel, Inc. | SF | 7.35 | % | 12.53 | % | 7/1/2024 | 707 | 707 | ||||||||||||||||||||||||||||||
| Engage2Excel, Inc. (Revolver) | SF | 7.35 | % | 12.53 | % | 7/1/2024 | 550 | 550 | ||||||||||||||||||||||||||||||
Output Services Group, Inc. (e) | SF | 6.68 | % | 12.07 | % | 11/30/2028 | 1,042 | 1,041 | ||||||||||||||||||||||||||||||
| Secretariat Advisors LLC | SF | 5.01 | % | 10.36 | % | 12/29/2028 | 1,676 | 1,676 | ||||||||||||||||||||||||||||||
| Secretariat Advisors LLC | SF | 5.01 | % | 10.36 | % | 12/29/2028 | 267 | 267 | ||||||||||||||||||||||||||||||
| SIRVA Worldwide Inc. | SF | 5.76 | % | 11.15 | % | 8/4/2025 | 1,750 | 1,556 | ||||||||||||||||||||||||||||||
| Teneo Holdings LLC | SF | 5.35 | % | 10.71 | % | 7/11/2025 | 4,787 | 4,791 | ||||||||||||||||||||||||||||||
| 21,002 | 20,195 | |||||||||||||||||||||||||||||||||||||
| Services: Consumer | ||||||||||||||||||||||||||||||||||||||
| 360Holdco, Inc. | SF | 5.60 | % | 10.96 | % | 8/1/2025 | 2,124 | 2,124 | ||||||||||||||||||||||||||||||
| 360Holdco, Inc. | SF | 5.60 | % | 10.96 | % | 8/1/2025 | 821 | 821 | ||||||||||||||||||||||||||||||
| Laseraway Intermediate Holdings II, LLC | SF | 5.75 | % | 11.41 | % | 10/14/2027 | 2,178 | 2,153 | ||||||||||||||||||||||||||||||
| McKissock Investment Holdings, LLC | SF | 5.00 | % | 10.54 | % | 3/9/2029 | 2,456 | 2,459 | ||||||||||||||||||||||||||||||
| 7,579 | 7,557 | |||||||||||||||||||||||||||||||||||||
| Telecommunications | ||||||||||||||||||||||||||||||||||||||
| Intermedia Holdings, Inc. | SF | 6.11 | % | 11.47 | % | 7/21/2025 | 1,742 | 1,687 | ||||||||||||||||||||||||||||||
| Mavenir Systems, Inc. | SF | 5.01 | % | 10.39 | % | 8/18/2028 | 1,638 | 1,159 | ||||||||||||||||||||||||||||||
| Sandvine Corporation | SF | 4.50 | % | 9.97 | % | 10/31/2025 | 1,973 | 1,598 | ||||||||||||||||||||||||||||||
| 5,353 | 4,444 | |||||||||||||||||||||||||||||||||||||
| Transportation: Cargo | ||||||||||||||||||||||||||||||||||||||
| Keystone Purchaser, LLC | SF | 6.18 | % | 11.53 | % | 5/7/2027 | 4,905 | 4,868 | ||||||||||||||||||||||||||||||
| 4,905 | 4,868 | |||||||||||||||||||||||||||||||||||||
| Utilities: Oil & Gas | ||||||||||||||||||||||||||||||||||||||
| Dresser Utility Solutions, LLC | SF | 4.10 | % | 9.46 | % | 10/1/2025 | 1,660 | 1,602 | ||||||||||||||||||||||||||||||
| Dresser Utility Solutions, LLC | SF | 5.35 | % | 10.71 | % | 10/1/2025 | 243 | 239 | ||||||||||||||||||||||||||||||
| 1,903 | 1,841 | |||||||||||||||||||||||||||||||||||||
| Wholesale | ||||||||||||||||||||||||||||||||||||||
| HALO Buyer, Inc. | SF | 4.60 | % | 9.96 | % | 6/30/2025 | 4,723 | 3,570 | ||||||||||||||||||||||||||||||
| 4,723 | 3,570 | |||||||||||||||||||||||||||||||||||||
| Total Non-Controlled/Non-Affiliate Senior Secured Loans | 154,006 | 139,373 | ||||||||||||||||||||||||||||||||||||
99
MRCC SENIOR LOAN FUND I, LLC
CONSOLIDATED SCHEDULE OF INVESTMENTS – (continued)
December 31, 2023
(in thousands)
Portfolio Company (a) | Index (b) | Spread(b) | Interest Rate (b) | Maturity | Principal | Fair Value | ||||||||||||||||||||||||||||||||
Equity Securities (f) (g) | ||||||||||||||||||||||||||||||||||||||
| Consumer Goods: Durable | ||||||||||||||||||||||||||||||||||||||
Elevate Textiles, Inc. (fka International Textile Group, Inc.) (25,524 shares of common units) | — | — | — | — | 26 | $ | 103 | |||||||||||||||||||||||||||||||
| 26 | 103 | |||||||||||||||||||||||||||||||||||||
| Chemicals, Plastics & Rubber | ||||||||||||||||||||||||||||||||||||||
Polyventive Lender Holding Company LLC (0.84% of the equity) | — | — | — | — | — | — | ||||||||||||||||||||||||||||||||
| — | — | |||||||||||||||||||||||||||||||||||||
| Services: Business | ||||||||||||||||||||||||||||||||||||||
Output Services Group, Inc. (51,370 Class A units) | — | — | — | — | 51 | 438 | ||||||||||||||||||||||||||||||||
| 51 | 438 | |||||||||||||||||||||||||||||||||||||
| Total Non-Controlled/Non-Affiliate Equities | 77 | 541 | ||||||||||||||||||||||||||||||||||||
| TOTAL INVESTMENTS | $ | 139,914 | ||||||||||||||||||||||||||||||||||||
______________________________________________________________
(a)All investments are U.S. companies unless otherwise noted.
(b)The majority of investments bear interest at a rate that may be determined by reference to Secured Overnight Financing Rate (“SOFR” or “SF”) or Prime (“P”) which reset daily, monthly, quarterly or semiannually. We have provided the spread over SOFR or Prime and the current contractual rate of interest in effect at December 31, 2023. Certain investments may be subject to an interest rate floor or cap. Certain investments contain a PIK provision.
(c)This is an international company.
(d)All or a portion of this commitment was unfunded as of December 31, 2023. As such, interest is earned only on the funded portion of this commitment. Principal reflects the commitment outstanding.
(e)This position was on non-accrual status as of December 31, 2023, meaning that we have ceased accruing interest income on the position.
(f)Represents less than 5% ownership of the portfolio company's voting securities.
(g)Ownership of certain equity investments may occur through a holding company partnership.
100
MRCC SENIOR LOAN FUND I, LLC
CONSOLIDATED SCHEDULE OF INVESTMENTS
December 31, 2022
(in thousands)
Portfolio Company (a) | Index (b) | Spread(b) | Interest Rate (b) | Maturity | Principal | Fair Value | ||||||||||||||||||||||||||||||||
| Non-Controlled/Non-Affiliate Company Investments | ||||||||||||||||||||||||||||||||||||||
| Senior Secured Loans | ||||||||||||||||||||||||||||||||||||||
| Aerospace & Defense | ||||||||||||||||||||||||||||||||||||||
Bromford Industries Limited (c) | P | 5.25 | % | 12.75 | % | 11/5/2025 | 2,744 | $ | 2,581 | |||||||||||||||||||||||||||||
Bromford Industries Limited (c) | P | 5.25 | % | 12.75 | % | 11/5/2025 | 1,829 | 1,720 | ||||||||||||||||||||||||||||||
| Trident Maritime Systems, Inc. | L | 4.75 | % | 9.48 | % | 2/26/2027 | 2,445 | 2,443 | ||||||||||||||||||||||||||||||
| Trident Maritime Systems, Inc. | L | 4.75 | % | 9.48 | % | 2/26/2027 | 746 | 746 | ||||||||||||||||||||||||||||||
Trident Maritime Systems, Inc. (Revolver) (d) | L | 4.75 | % | 9.08 | % | 2/26/2027 | 319 | 122 | ||||||||||||||||||||||||||||||
| 8,083 | 7,612 | |||||||||||||||||||||||||||||||||||||
| Automotive | ||||||||||||||||||||||||||||||||||||||
| Accelerate Auto Works Intermediate, LLC | L | 4.50 | % | 9.23 | % | 12/1/2027 | 1,391 | 1,386 | ||||||||||||||||||||||||||||||
Accelerate Auto Works Intermediate, LLC (Delayed Draw) (d) | L | 4.50 | % | 9.23 | % | 12/1/2027 | 388 | — | ||||||||||||||||||||||||||||||
Accelerate Auto Works Intermediate, LLC (Revolver) (d) | L | 4.50 | % | 9.23 | % | 12/1/2027 | 132 | — | ||||||||||||||||||||||||||||||
| Truck-Lite Co., LLC | SF | 6.25 | % | 11.14 | % | 12/14/2026 | 1,691 | 1,690 | ||||||||||||||||||||||||||||||
| Truck-Lite Co., LLC | SF | 6.25 | % | 11.14 | % | 12/14/2026 | 251 | 250 | ||||||||||||||||||||||||||||||
| Truck-Lite Co., LLC | SF | 6.25 | % | 11.14 | % | 12/14/2026 | 43 | 43 | ||||||||||||||||||||||||||||||
| Wheel Pros, Inc. | L | 4.50 | % | 8.82 | % | 5/11/2028 | 1,932 | 1,321 | ||||||||||||||||||||||||||||||
| 5,828 | 4,690 | |||||||||||||||||||||||||||||||||||||
| Beverage, Food & Tobacco | ||||||||||||||||||||||||||||||||||||||
| CBC Restaurant Corp. | n/a | n/a | 5.00% PIK (e) | n/a | 1,066 | 415 | ||||||||||||||||||||||||||||||||
| SW Ingredients Holdings, LLC | L | 4.75 | % | 9.13 | % | 7/3/2025 | 3,581 | 3,581 | ||||||||||||||||||||||||||||||
| 4,647 | 3,996 | |||||||||||||||||||||||||||||||||||||
| Capital Equipment | ||||||||||||||||||||||||||||||||||||||
| Analogic Corporation | L | 5.25 | % | 9.66 | % | 6/24/2024 | 4,703 | 4,433 | ||||||||||||||||||||||||||||||
| DS Parent, Inc. | L | 5.75 | % | 9.92 | % | 12/8/2028 | 2,850 | 2,725 | ||||||||||||||||||||||||||||||
| MacQueen Equipment, LLC | L | 5.25 | % | 9.98 | % | 1/7/2028 | 2,096 | 2,096 | ||||||||||||||||||||||||||||||
MacQueen Equipment, LLC (Delayed Draw) (d) | L | 5.25 | % | 9.98 | % | 1/7/2028 | 592 | 69 | ||||||||||||||||||||||||||||||
MacQueen Equipment, LLC (Revolver) (d) | L | 5.25 | % | 9.98 | % | 1/7/2028 | 296 | — | ||||||||||||||||||||||||||||||
| 10,537 | 9,323 | |||||||||||||||||||||||||||||||||||||
| Chemicals, Plastics & Rubber | ||||||||||||||||||||||||||||||||||||||
| Phoenix Chemical Holding Company LLC (fka Polymer Solutions Group) | L | 7.00 | % | 11.39 | % | 6/15/2023 | 1,139 | 1,132 | ||||||||||||||||||||||||||||||
| TJC Spartech Acquisition Corp. | L | 4.75 | % | 8.53 | % | 5/5/2028 | 4,253 | 4,131 | ||||||||||||||||||||||||||||||
| 5,392 | 5,263 | |||||||||||||||||||||||||||||||||||||
| Construction & Building | ||||||||||||||||||||||||||||||||||||||
| The Cook & Boardman Group LLC | SF | 5.75 | % | 9.99 | % | 10/20/2025 | 2,879 | 2,458 | ||||||||||||||||||||||||||||||
| 2,879 | 2,458 | |||||||||||||||||||||||||||||||||||||
101
MRCC SENIOR LOAN FUND I, LLC
CONSOLIDATED SCHEDULE OF INVESTMENTS – (continued)
December 31, 2022
(in thousands)
Portfolio Company (a) | Index (b) | Spread(b) | Interest Rate (b) | Maturity | Principal | Fair Value | ||||||||||||||||||||||||||||||||
| Consumer Goods: Durable | ||||||||||||||||||||||||||||||||||||||
| International Textile Group, Inc. | L | 5.00 | % | 9.21 | % | 5/1/2024 | 1,664 | $ | 1,166 | |||||||||||||||||||||||||||||
| Runner Buyer INC. | L | 5.50 | % | 10.23 | % | 10/23/2028 | 2,978 | 2,114 | ||||||||||||||||||||||||||||||
| 4,642 | 3,280 | |||||||||||||||||||||||||||||||||||||
| Consumer Goods: Non-Durable | ||||||||||||||||||||||||||||||||||||||
| PH Beauty Holdings III, INC. | L | 5.00 | % | 9.73 | % | 9/26/2025 | 2,393 | 1,950 | ||||||||||||||||||||||||||||||
| 2,393 | 1,950 | |||||||||||||||||||||||||||||||||||||
| Containers, Packaging & Glass | ||||||||||||||||||||||||||||||||||||||
| Liqui-Box Holdings, Inc. | L | 4.50 | % | 9.23 | % | 2/26/2027 | 4,225 | 4,186 | ||||||||||||||||||||||||||||||
| Polychem Acquisition, LLC | L | 5.00 | % | 9.38 | % | 3/17/2025 | 2,888 | 2,888 | ||||||||||||||||||||||||||||||
| PVHC Holding Corp | L | 4.75 | % | 9.48 | % | 8/5/2024 | 3,184 | 3,072 | ||||||||||||||||||||||||||||||
| 10,297 | 10,146 | |||||||||||||||||||||||||||||||||||||
| Energy: Oil & Gas | ||||||||||||||||||||||||||||||||||||||
| Drilling Info Holdings, Inc. | L | 4.25 | % | 8.63 | % | 7/30/2025 | 4,469 | 4,313 | ||||||||||||||||||||||||||||||
| Offen, Inc. | L | 5.00 | % | 9.38 | % | 6/22/2026 | 2,249 | 2,249 | ||||||||||||||||||||||||||||||
| Offen, Inc. | L | 5.00 | % | 9.38 | % | 6/22/2026 | 867 | 867 | ||||||||||||||||||||||||||||||
| 7,585 | 7,429 | |||||||||||||||||||||||||||||||||||||
| FIRE: Finance | ||||||||||||||||||||||||||||||||||||||
| Harbour Benefit Holdings, Inc. | L | 5.25 | % | 9.98 | % | 12/13/2024 | 2,901 | 2,898 | ||||||||||||||||||||||||||||||
| Harbour Benefit Holdings, Inc. | L | 5.25 | % | 9.63 | % | 12/13/2024 | 61 | 61 | ||||||||||||||||||||||||||||||
| Minotaur Acquisition, Inc. | SF | 4.75 | % | 9.17 | % | 3/27/2026 | 4,857 | 4,656 | ||||||||||||||||||||||||||||||
| TEAM Public Choices, LLC | L | 5.00 | % | 9.93 | % | 12/17/2027 | 2,955 | 2,822 | ||||||||||||||||||||||||||||||
| 10,774 | 10,437 | |||||||||||||||||||||||||||||||||||||
| FIRE: Real Estate | ||||||||||||||||||||||||||||||||||||||
Avison Young (USA) Inc. (c) | SF | 5.75 | % | 10.19 | % | 1/30/2026 | 4,800 | 4,020 | ||||||||||||||||||||||||||||||
| 4,800 | 4,020 | |||||||||||||||||||||||||||||||||||||
| Healthcare & Pharmaceuticals | ||||||||||||||||||||||||||||||||||||||
| Cano Health, LLC | SF | 4.00 | % | 8.42 | % | 11/23/2027 | 1,970 | 1,572 | ||||||||||||||||||||||||||||||
| HAH Group Holding Company LLC | SF | 5.00 | % | 9.43 | % | 10/29/2027 | 2,978 | 2,847 | ||||||||||||||||||||||||||||||
| LSCS Holdings, Inc. | L | 4.50 | % | 8.88 | % | 12/15/2028 | 1,828 | 1,751 | ||||||||||||||||||||||||||||||
| Natus Medical Incorporated | SF | 5.50 | % | 8.68 | % | 7/20/2029 | 5,000 | 4,650 | ||||||||||||||||||||||||||||||
| Paragon Healthcare, Inc. | SF | 5.75 | % | 9.81 | % | 1/19/2027 | 2,127 | 2,109 | ||||||||||||||||||||||||||||||
Paragon Healthcare, Inc. (Delayed Draw) (d) | SF | 5.75 | % | 10.06 | % | 1/19/2027 | 366 | 242 | ||||||||||||||||||||||||||||||
Paragon Healthcare, Inc. (Revolver) (d) | SF | 5.75 | % | 10.26 | % | 1/19/2027 | 490 | 61 | ||||||||||||||||||||||||||||||
| Radiology Partners, Inc. | L | 4.25 | % | 8.64 | % | 7/9/2025 | 4,760 | 4,018 | ||||||||||||||||||||||||||||||
| 19,519 | 17,250 | |||||||||||||||||||||||||||||||||||||
102
MRCC SENIOR LOAN FUND I, LLC
CONSOLIDATED SCHEDULE OF INVESTMENTS – (continued)
December 31, 2022
(in thousands)
Portfolio Company (a) | Index (b) | Spread(b) | Interest Rate (b) | Maturity | Principal | Fair Value | ||||||||||||||||||||||||||||||||
| High Tech Industries | ||||||||||||||||||||||||||||||||||||||
Corel Inc. (c) | L | 5.00 | % | 9.73 | % | 7/2/2026 | 3,600 | $ | 3,365 | |||||||||||||||||||||||||||||
| Lightbox Intermediate, L.P. | L | 5.00 | % | 9.73 | % | 5/11/2026 | 4,825 | 4,656 | ||||||||||||||||||||||||||||||
| TGG TS Acquisition Company | L | 6.50 | % | 10.88 | % | 12/12/2025 | 3,190 | 3,143 | ||||||||||||||||||||||||||||||
| 11,615 | 11,164 | |||||||||||||||||||||||||||||||||||||
| Hotels, Gaming & Leisure | ||||||||||||||||||||||||||||||||||||||
| Excel Fitness Holdings, Inc. | SF | 5.25 | % | 10.29 | % | 4/27/2029 | 4,364 | 4,102 | ||||||||||||||||||||||||||||||
Excel Fitness Holdings, Inc. (Revolver) (d) | SF | 5.25 | % | 9.67 | % | 4/28/2028 | 625 | 306 | ||||||||||||||||||||||||||||||
| North Haven Spartan US Holdco, LLC | SF | 6.25 | % | 10.71 | % | 6/6/2025 | 2,280 | 2,202 | ||||||||||||||||||||||||||||||
| Tait LLC | L | 5.00 | % | 8.75 | % | 3/28/2025 | 4,083 | 3,972 | ||||||||||||||||||||||||||||||
Tait LLC (Revolver) (d) | P | 4.00 | % | 10.25 | % | 3/28/2025 | 769 | — | ||||||||||||||||||||||||||||||
| 12,121 | 10,582 | |||||||||||||||||||||||||||||||||||||
| Media: Advertising, Printing & Publishing | ||||||||||||||||||||||||||||||||||||||
| Cadent, LLC | L | 6.50 | % | 11.23 | % | 9/11/2025 | 4,237 | 4,131 | ||||||||||||||||||||||||||||||
Cadent, LLC (Revolver) (d) | L | 6.50 | % | 11.23 | % | 9/11/2025 | 167 | — | ||||||||||||||||||||||||||||||
| 4,404 | 4,131 | |||||||||||||||||||||||||||||||||||||
| Media: Diversified & Production | ||||||||||||||||||||||||||||||||||||||
| Research Now Group, Inc. and Survey Sampling International, LLC | L | 5.50 | % | 8.84 | % | 12/20/2024 | 6,650 | 5,035 | ||||||||||||||||||||||||||||||
| STATS Intermediate Holdings, LLC | L | 5.25 | % | 9.90 | % | 7/10/2026 | 4,850 | 4,498 | ||||||||||||||||||||||||||||||
| TA TT Buyer, LLC | SF | 5.00 | % | 8.98 | % | 3/30/2029 | 3,325 | 3,242 | ||||||||||||||||||||||||||||||
| 14,825 | 12,775 | |||||||||||||||||||||||||||||||||||||
| Services: Business | ||||||||||||||||||||||||||||||||||||||
| AQ Carver Buyer, Inc. | L | 5.00 | % | 9.38 | % | 9/23/2025 | 4,838 | 4,834 | ||||||||||||||||||||||||||||||
| CHA Holdings, Inc | L | 4.50 | % | 9.23 | % | 4/10/2025 | 1,960 | 1,886 | ||||||||||||||||||||||||||||||
| CHA Holdings, Inc | L | 4.50 | % | 9.23 | % | 4/10/2025 | 413 | 398 | ||||||||||||||||||||||||||||||
| Eliassen Group, LLC | SF | 5.50 | % | 10.08 | % | 4/14/2028 | 3,251 | 3,194 | ||||||||||||||||||||||||||||||
Eliassen Group, LLC (Delayed Draw) (d) | SF | 5.50 | % | 8.88 | % | 4/14/2028 | 740 | 109 | ||||||||||||||||||||||||||||||
| Engage2Excel, Inc. | L | 7.25 | % | 11.98 | % | 3/7/2023 | 4,283 | 4,242 | ||||||||||||||||||||||||||||||
| Engage2Excel, Inc. | L | 7.25 | % | 11.98 | % | 3/7/2023 | 773 | 766 | ||||||||||||||||||||||||||||||
Engage2Excel, Inc. (Revolver) (d) | P | 6.25 | % | 13.75 | % | 3/7/2023 | 554 | 509 | ||||||||||||||||||||||||||||||
| Orbit Purchaser LLC | L | 4.50 | % | 9.23 | % | 10/21/2024 | 2,406 | 2,190 | ||||||||||||||||||||||||||||||
| Orbit Purchaser LLC | L | 4.50 | % | 9.23 | % | 10/21/2024 | 1,858 | 1,691 | ||||||||||||||||||||||||||||||
| Orbit Purchaser LLC | L | 4.50 | % | 9.23 | % | 10/21/2024 | 543 | 494 | ||||||||||||||||||||||||||||||
| Output Services Group, Inc. | SF | 6.75 | % | 9.80% Cash / 1.50% PIK | 6/29/2026 | 4,807 | 3,275 | |||||||||||||||||||||||||||||||
| Secretariat Advisors LLC | L | 4.75 | % | 9.48 | % | 12/29/2028 | 1,693 | 1,634 | ||||||||||||||||||||||||||||||
| Secretariat Advisors LLC | L | 4.75 | % | 9.48 | % | 12/29/2028 | 270 | 260 | ||||||||||||||||||||||||||||||
| SIRVA Worldwide Inc. | L | 5.50 | % | 10.23 | % | 8/4/2025 | 1,800 | 1,606 | ||||||||||||||||||||||||||||||
| Teneo Holdings LLC | SF | 5.25 | % | 9.67 | % | 7/11/2025 | 4,837 | 4,668 | ||||||||||||||||||||||||||||||
| The Kleinfelder Group, Inc. | L | 5.25 | % | 9.98 | % | 11/29/2024 | 2,362 | 2,362 | ||||||||||||||||||||||||||||||
| 37,388 | 34,118 | |||||||||||||||||||||||||||||||||||||
| Services: Consumer | ||||||||||||||||||||||||||||||||||||||
| 360Holdco, Inc. | SF | 5.00 | % | 9.42 | % | 8/2/2025 | 2,145 | 2,145 | ||||||||||||||||||||||||||||||
360Holdco, Inc. (Delayed Draw) (d) | SF | 5.00 | % | 9.42 | % | 8/2/2025 | 827 | 252 | ||||||||||||||||||||||||||||||
| Laseraway Intermediate Holdings II, LLC | L | 5.75 | % | 9.76 | % | 10/14/2027 | 2,200 | 2,161 | ||||||||||||||||||||||||||||||
| McKissock Investment Holdings, LLC | SF | 5.00 | % | 8.87 | % | 3/9/2029 | 2,481 | 2,322 | ||||||||||||||||||||||||||||||
| 7,653 | 6,880 | |||||||||||||||||||||||||||||||||||||
103
MRCC SENIOR LOAN FUND I, LLC
CONSOLIDATED SCHEDULE OF INVESTMENTS – (continued)
December 31, 2022
(in thousands)
Portfolio Company (a) | Index (b) | Spread(b) | Interest Rate (b) | Maturity | Principal | Fair Value | ||||||||||||||||||||||||||||||||
| Telecommunications | ||||||||||||||||||||||||||||||||||||||
| Intermedia Holdings, Inc. | L | 6.00 | % | 10.38 | % | 7/21/2025 | 1,760 | $ | 1,360 | |||||||||||||||||||||||||||||
| Mavenir Systems, Inc. | L | 4.75 | % | 9.42 | % | 8/18/2028 | 1,654 | 1,350 | ||||||||||||||||||||||||||||||
| Sandvine Corporation | L | 4.50 | % | 8.88 | % | 10/31/2025 | 2,000 | 1,904 | ||||||||||||||||||||||||||||||
| 5,414 | 4,614 | |||||||||||||||||||||||||||||||||||||
| Transportation: Cargo | ||||||||||||||||||||||||||||||||||||||
| Keystone Purchaser, LLC | L | 5.50 | % | 10.60 | % | 5/7/2027 | 4,955 | 4,955 | ||||||||||||||||||||||||||||||
| 4,955 | 4,955 | |||||||||||||||||||||||||||||||||||||
| Utilities: Oil & Gas | ||||||||||||||||||||||||||||||||||||||
| Dresser Utility Solutions, LLC (fka NGS US Finco, LLC) | L | 4.25 | % | 8.63 | % | 10/1/2025 | 1,678 | 1,619 | ||||||||||||||||||||||||||||||
| Dresser Utility Solutions, LLC (fka NGS US Finco, LLC) | L | 5.25 | % | 9.63 | % | 10/1/2025 | 245 | 239 | ||||||||||||||||||||||||||||||
| 1,923 | 1,858 | |||||||||||||||||||||||||||||||||||||
| Wholesale | ||||||||||||||||||||||||||||||||||||||
| HALO Buyer, Inc. | L | 4.50 | % | 8.88 | % | 6/30/2025 | 4,774 | 4,219 | ||||||||||||||||||||||||||||||
| 4,774 | 4,219 | |||||||||||||||||||||||||||||||||||||
| TOTAL INVESTMENTS | $ | 183,150 | ||||||||||||||||||||||||||||||||||||
______________________________________________________________
(a)All investments are U.S. companies unless otherwise noted.
(b) The majority of investments bear interest at a rate that may be determined by reference to the London Interbank Offered Rate (“LIBOR” or “L”), Secured Overnight Financing Rate (“SOFR” or “SF”) or Prime (“P”) which reset daily, monthly, quarterly or semiannually. The Company has provided the spread over LIBOR, SOFR or Prime and the current contractual rate of interest in effect at December 31, 2022. Certain investments may be subject to an interest rate floor or cap. Certain investments contain a Payment-in-Kind ("PIK") provision.
(c) This is an international company.
(d) All or a portion of this commitment was unfunded as of December 31, 2022. As such, interest is earned only on the funded portion of this commitment. Principal reflects the commitment outstanding.
(e) This position was on non-accrual status as of December 31, 2022, meaning that the Company has ceased accruing interest income on the position.
(f) This is a demand note with no stated maturity.
104
Below is certain summarized financial information for SLF as of December 31, 2023 and 2022 and for the years ended December 31, 2023, 2022 and 2021 (in thousands):
| December 31, 2023 | December 31, 2022 | |||||||||||||
| Assets | ||||||||||||||
| Investments, at fair value | $ | 139,914 | $ | 183,150 | ||||||||||
| Cash and cash equivalents | 1,884 | 1,608 | ||||||||||||
| Restricted cash and cash equivalents | 5,265 | 6,454 | ||||||||||||
| Interest receivable | 1,380 | 1,613 | ||||||||||||
| Other assets | 6 | 5 | ||||||||||||
| Total assets | $ | 148,449 | $ | 192,830 | ||||||||||
| Liabilities | ||||||||||||||
| Revolving credit facility | 82,014 | 122,215 | ||||||||||||
| Less: Unamortized deferred financing costs | (717) | (1,518) | ||||||||||||
| Total debt, less unamortized deferred financing costs | 81,297 | 120,697 | ||||||||||||
| Interest payable | 590 | 769 | ||||||||||||
| Accounts payable and accrued expenses | 320 | 346 | ||||||||||||
| Total liabilities | 82,207 | 121,812 | ||||||||||||
| Members’ capital | 66,242 | 71,018 | ||||||||||||
| Total liabilities and members’ capital | $ | 148,449 | $ | 192,830 | ||||||||||
| For the Years Ended December 31, | ||||||||||||||||||||
| 2023 | 2022 | 2021 | ||||||||||||||||||
| Investment income: | ||||||||||||||||||||
| Interest income | $ | 18,362 | $ | 15,400 | $ | 13,164 | ||||||||||||||
| Total investment income | 18,362 | 15,400 | 13,164 | |||||||||||||||||
| Expenses: | ||||||||||||||||||||
| Interest and other debt financing expenses | 8,847 | 6,009 | 3,918 | |||||||||||||||||
| Professional fees | 757 | 814 | 647 | |||||||||||||||||
| Total expenses | 9,604 | 6,823 | 4,565 | |||||||||||||||||
| Net investment income | 8,758 | 8,577 | 8,599 | |||||||||||||||||
| Net gain (loss): | ||||||||||||||||||||
| Net realized gain (loss) | (5,119) | (3,089) | — | |||||||||||||||||
| Net change in unrealized gain (loss) | (1,216) | (10,520) | 3,734 | |||||||||||||||||
| Net gain (loss) | (6,335) | (13,609) | 3,734 | |||||||||||||||||
| Net increase (decrease) in members’ capital | $ | 2,423 | $ | (5,032) | $ | 12,333 | ||||||||||||||
Related Party Transactions
We have a number of business relationships with affiliated or related parties, including the following:
•We have an Investment Advisory and Management Agreement with MC Advisors, an investment advisor registered with the SEC, to manage our investing activities. We pay MC Advisors a fee for its services under the Investment Advisory and Management Agreement consisting of two components – a base management fee and an incentive fee. See Note 6 to our consolidated financial statements and “Significant Accounting Estimates and Critical Accounting Policies – Capital Gains Incentive Fee” for additional information.
•We have an Administration Agreement with MC Management to provide us with the office facilities and administrative services necessary to conduct our day-to-day operations. See Note 6 to our consolidated financial statements for additional information.
105
•SLF has an administration agreement with MC Management to provide SLF with certain loan servicing and administrative functions. SLF may reimburse MC Management for its allocable share of overhead and other expenses incurred by MC Management. See Note 3 to our consolidated financial statements and “Liquidity and Capital Resources – MRCC Senior Loan Fund I, LLC” for additional information.
•Theodore L. Koenig, our Chief Executive Officer and Chairman of our Board, is also a manager of MC Advisors and the Chief Executive Officer of MC Management. Lewis W. Solimene, Jr., our Chief Financial Officer and Chief Investment Officer, is also a managing director of MC Management.
•We have a license agreement with Monroe Capital LLC, under which Monroe Capital LLC has agreed to grant us a non-exclusive, royalty-free license to use the name “Monroe Capital” for specified purposes in our business.
In addition, we have adopted a formal code of ethics that governs the conduct of MC Advisors’ officers, directors and employees. Our officers and directors also remain subject to the duties imposed by both the 1940 Act and Maryland General Corporation Law.
Contractual Obligations and Off-Balance Sheet Arrangements
Contractual Obligations
The following table shows our significant contractual payment obligations for repayment as of December 31, 2023 (in thousands):
| Total | Less than 1 year | 1 – 3 years | 3 – 5 years | More than 5 years | ||||||||||||||||||||||||||||
| Revolving credit facility | $ | 174,100 | $ | — | $ | — | $ | 174,100 | $ | — | ||||||||||||||||||||||
| 2026 Notes | 130,000 | — | 130,000 | — | — | |||||||||||||||||||||||||||
Unfunded Commitments | 37,182 | 37,182 | — | — | — | |||||||||||||||||||||||||||
| Total contractual obligations | $ | 341,282 | $ | 37,182 | $ | 130,000 | $ | 174,100 | $ | — | ||||||||||||||||||||||
(1)Unfunded commitments represent all amounts unfunded, excluding our investments in SLF, as of December 31, 2023. These amounts may or may not be funded to the borrowing party now or in the future. The unfunded commitments relate to loans or equity investments with various maturity dates, but we are showing this amount in the less than one year category as this entire amount was eligible for funding to the borrowers as of December 31, 2023.
We may become a party to financial instruments with off-balance sheet risk in the normal course of our business to meet the financial needs of our portfolio companies. These instruments may include commitments to extend credit and involve, to varying degrees, elements of liquidity and credit risk in excess of the amount recognized on the consolidated statements of assets and liabilities. As of December 31, 2023 and 2022, we had outstanding commitments to fund investments under undrawn revolvers, delayed draw commitments and subscription agreements, excluding unfunded commitments in SLF, totaling $37.2 million and $63.5 million, respectively. As of both December 31, 2023 and 2022, we had unfunded commitments to SLF of $7.3 million that may be contributed primarily for the purpose of funding new investments approved by the SLF investment committee. Drawdowns of the commitments to SLF require authorization from one of our representatives on SLF’s board of managers. Additionally, we have entered into certain contracts with other parties that contain a variety of indemnifications. Our maximum exposure under these arrangements is unknown. However, we have not experienced claims or losses pursuant to these contracts and believe the risk of loss related to such indemnifications to be remote.
Off-Balance Sheet Arrangements
Other than contractual commitments and other legal contingencies incurred in the normal course of our business, we do not have any off-balance sheet financings or liabilities.
106
Market Trends
We have identified the following general trends that may affect our business:
Target Market: We believe that small and middle-market companies in the United States with annual revenues between $10.0 million and $2.5 billion represent a significant growth segment of the U.S. economy and often require substantial capital investments to grow. Middle-market companies have generated a significant number of investment opportunities for investment funds managed or advised by Monroe Capital, and we believe that this market segment will continue to produce significant investment opportunities for us.
Specialized Lending Requirements: We believe that several factors render many U.S. financial institutions ill-suited to lend to U.S. middle-market companies. For example, based on the experience of our management team, lending to U.S. middle-market companies (1) is generally more labor intensive than lending to larger companies due to the smaller size of each investment and the fragmented nature of information for such companies, (2) requires due diligence and underwriting practices consistent with the demands and economic limitations of the middle-market and (3) may also require more extensive ongoing monitoring by the lender.
Demand for Debt Capital: We believe there is a large pool of uninvested private equity capital for middle-market companies. We expect private equity firms will seek to leverage their investments by combining equity capital with senior secured loans and mezzanine debt from other sources, such as us.
Competition from Other Lenders: We believe that many traditional bank lenders, in recent years, de-emphasized their service and product offerings to middle-market businesses in favor of lending to large corporate clients and managing capital market transactions. In addition, many commercial banks face significant balance sheet constraints as they seek to build capital and meet future regulatory capital requirements. These factors may result in opportunities for alternative funding sources to middle-market companies and therefore drive increased new investment opportunities for us. Conversely, there has been a significant amount of capital raised over the past several years dedicated to middle market lending which has increased competitive pressure in the BDC and investment company marketplace for senior and subordinated debt, which in turn could result in lower yields and weaker financial covenants for new assets.
Pricing and Deal Structures: We believe that the volatility in global markets over the last several years and current macroeconomic issues including changes in bank regulations for middle-market banks has reduced access to, and availability of, debt capital to middle-market companies, causing a reduction in competition and generally more favorable capital structures and deal terms. Sizable recent capital raises in the private debt marketplace have created significantly increased competition over the last few years, reducing available pricing and creating less favorable capital structures; however, we believe that current market conditions for our target market may continue to create favorable opportunities to invest at attractive risk-adjusted returns.
Market Environment: We believe middle market investments are attractive in uncertain market environments such as the current market environment where inflationary pressure and interest rates remain elevated. Directly originated middle market loans have demonstrated the ability to outperform competing markets through varying economic cycles including downturns and prior periods of monetary policy tightening. Through the global financial crisis, the higher interest rate environment in 2005-2006, market bottom in 2008 and the subsequent recovery period, as well as throughout the COVID-19 pandemic, these investments have historically generated considerable yield premium with more favorable capital structures for lenders, resulting in higher returns when compared to the market for U.S. high yield bonds and U.S. traded loans.(1) Middle market direct lending also offers a natural hedge to higher interest rates with floating rate structures that benefit from higher interest rates, while providing broad diversification in an environment where there is a risk of increased default rate activity. We believe that direct lending volumes will continue outpacing syndicated loan transaction volumes due to capital requirements and liquidity constraints faced by banks. Since the fourth quarter of 2022, the middle market saw a consistent trend toward lower leverage and loan-to-value structures coupled with increased spreads. However, as M&A activity began to increase as the year progressed, spreads began to stabilize in certain pockets of the market.(2) That said, we note that a softening macroeconomic environment and elevated interest rates could result in increased default rates. If default rates become more prevalent, we would expect to experience decreased net interest income, lower yields and increased risk of credit loss. However, we believe that Monroe Capital’s scale, product suite, diversification, and strong historical recovery rate track record will continue to allow us to find attractive investment opportunities and navigate this uncertain market environment while generating attractive risk-adjusted returns.
______________________________________________________________
(1)As of September 30, 2023. Credit Suisse for US Traded Loans represented by the Credit Suisse Leveraged Loan Index. Bloomberg Indices for US Credit. Cliffwater for Direct Lending by the Cliffwater Direct Lending Index (CDLI). ICE, Bank of America for US High Yield represented by the ICE BofA High Yield Index.
107
(2)Refinitiv LPC’s 4Q23 Sponsored Middle Market Private Deals Analysis – January 2024.
Recent Developments
On March 5, 2024, our Board declared a quarterly distribution of $0.25 per share payable on March 29, 2024 to holders of record on March 15, 2024.
Significant Accounting Estimates and Critical Accounting Policies
Revenue Recognition
We record interest and fee income on an accrual basis to the extent that we expect to collect such amounts. For loans and debt securities with contractual PIK interest, we do not accrue PIK interest if the portfolio company valuation indicates that such PIK interest is not collectible. We do not accrue as a receivable interest on loans and debt securities if we have reason to doubt our ability to collect such interest. Loan origination fees, original issue discount and market discount or premium are capitalized, and then we amortize such amounts using the effective interest method as interest income over the life of the investment. Upon the prepayment of a loan or debt security, any unamortized premium or discount or loan origination fees are recorded as interest income. We record prepayment premiums on loans and debt securities as interest income when we receive such amounts. Interest income is accrued based upon the outstanding principal amount and contractual terms of debt and preferred equity investments. Interest is accrued on a daily basis. We record fees on loans based on the determination of whether the fee is considered a yield enhancement or payment for a service. If the fee is considered a yield enhancement associated with a funding of cash on a loan, the fee is generally deferred and recognized into interest income using the effective interest method if captured in the cost basis or using the straight-line method if the loan is unfunded and therefore there is no cost basis. If the fee is not considered a yield enhancement because a service was provided, and the fee is payment for that service, the fee is deemed earned and recognized as fee income in the period the service has been completed.
Dividend income on preferred equity securities is recorded as dividend income on an accrual basis to the extent that such amounts are payable by the portfolio company and are expected to be collected. Dividend income on common equity securities is recorded on the record date for private portfolio companies. Each distribution received from LLC and LP investments is evaluated to determine if the distribution should be recorded as dividend income or a return of capital. Generally, we will not record distributions from equity investments in LLCs and LPs as dividend income unless there are sufficient accumulated tax-basis earnings and profits in the LLC or LP prior to the distribution. Distributions that are classified as a return of capital are recorded as a reduction in the cost basis of the investment.
Valuation of Portfolio Investments
For periods prior to September 30, 2022, the Board determined the fair value of our investments in good faith on a quarterly basis. On September 30, 2022, pursuant to SEC Rule 2a-5 under the 1940 Act, the Board designated MC Advisors as our valuation designee (the “Valuation Designee”). The Board is responsible for oversight of the Valuation Designee. The Valuation Designee has established a valuation committee to determine in good faith the fair value of our investments, based on input of the Valuation Designee’s management and personnel and independent valuation firms which are engaged at the direction of the valuation committee to assist in the valuation of certain portfolio investments lacking a readily available market quotation. The valuation committee determines fair values pursuant to a valuation policy approved by the Board and pursuant to a consistently applied valuation process.
Under the valuation policy, we value investments for which market quotations are readily available and within a recent date at such market quotations. When doing so, we determine whether the quote obtained is sufficient in accordance with generally accepted accounting principles in the United States of America to determine the fair value of the security. Debt and equity securities that are not publicly traded or whose market prices are not readily available or whose market prices are not regularly updated are valued at fair value as determined in good faith by the Valuation Designee. Because we expect that there will not be a readily available market for many of the investments in our portfolio, we expect to value many of our portfolio investments at fair value as determined in good faith by our Valuation Designee using a documented valuation policy and a consistently applied valuation process. Such determination of fair values may involve subjective judgments and estimates. Due to the inherent uncertainty of determining the fair value of investments that do not have a readily available market value, the fair value of our investments may differ significantly from the values that would have been used had a readily available market value existed for such investments, and the differences could be material. If we were required to liquidate a portfolio investment in a forced or liquidation sale, we could realize amounts that are different from the amounts presented and such differences could be material.
108
With respect to investments for which market quotations are not readily available, the Valuation Designee undertakes a multi-step valuation process each quarter, as described below:
•the quarterly valuation process begins with each portfolio company or investment being initially evaluated and rated by the investment professionals of the Valuation Designee responsible for the credit monitoring of the portfolio investment;
•our Valuation Designee engages an independent valuation firm to conduct independent appraisals of a selection of investments for which market quotations are not readily available. We will consult with an independent valuation firm relative to each portfolio company at least once in every calendar year, but the independent appraisals are generally received quarterly for each investment;
•to the extent an independent valuation firm is not engaged to conduct an investment appraisal on an investment for which market quotations are not readily available, the investment is valued by the Valuation Designee;
•preliminary valuation conclusions are then documented and discussed with the valuation committee of the Valuation Designee;
•the valuation conclusions are approved by the valuation committee of the Valuation Designee; and
•a report prepared by the Valuation Designee is presented to the Board quarterly to allow the Board to perform its oversight duties of the valuation process and the Valuation Designee.
We generally use the income approach to determine fair value for loans where market quotations are not readily available, as long as it is appropriate. If there is deterioration in credit quality or a debt investment is in workout status, we may consider other factors in determining the fair value, including the value attributable to the debt investment from the enterprise value of the portfolio company or the proceeds that would be received in a liquidation analysis. This liquidation analysis may also include probability weighting of alternative outcomes. We generally consider our debt to be performing if the borrower is not in default, the borrower is remitting payments in a timely manner, the loan is in covenant compliance and the loan is otherwise not deemed to be impaired. In determining the fair value of the performing debt, we consider fluctuations in current interest rates, the trends in yields of debt instruments with similar credit ratings, financial condition of the borrower, economic conditions and other relevant factors, both qualitative and quantitative. In the event that a debt instrument is not performing, as defined above, we will evaluate the value of the collateral utilizing the same framework described above for a performing loan to determine the value of the debt instrument.
Under the income approach, discounted cash flow models are utilized to determine the present value of the future cash flow streams of our debt investments, based on future interest and principal payments as set forth in the associated loan agreements. In determining fair value under the income approach, we also consider the following factors: applicable market yields and leverage levels, credit quality, prepayment penalties, the nature and realizable value of any collateral, the portfolio company’s ability to make payments, and changes in the interest rate environment and the credit markets that generally may affect the price at which similar investments may be made.
Under the market approach, the enterprise value methodology is typically utilized to determine the fair value of an investment. There is no one methodology to estimate enterprise value and, in fact, for any one portfolio company, enterprise value is generally best expressed as a range of values, from which we derive a single estimate of enterprise value. In estimating the enterprise value of a portfolio company, we analyze various factors consistent with industry practice, including but not limited to original transaction multiples, the portfolio company’s historical and projected financial results, applicable market trading and transaction comparables, applicable market yields and leverage levels, the nature and realizable value of any collateral, the markets in which the portfolio company does business, and comparisons of financial ratios of peer companies that are public. Typically, the enterprise values of private companies are based on multiples of earnings before interest, income taxes, depreciation and amortization (“EBITDA”), cash flows, net income, revenues, or in limited cases, book value.
In addition, for certain debt investments, we may base our valuation on indicative bid and ask prices provided by an independent third-party pricing service. Bid prices reflect the highest price that we and others may be willing to pay. Ask prices represent the lowest price that we and others may be willing to accept. We generally use the midpoint of the bid/ask range as our best estimate of fair value of such investment.
109
As of December 31, 2023, our Valuation Designee determined, in good faith, the fair value of our investment portfolio in accordance with GAAP and our valuation procedures based on the facts and circumstances known by us at that time, or reasonably expected to be known at that time.
Net Realized Gain or Loss and Net Change in Unrealized Gain or Loss
We measure realized gain or loss by the difference between the net proceeds from the sale and the amortized cost basis of the investment, without regard to unrealized gain or loss previously recognized. Net change in unrealized gain or loss reflects the change in portfolio investment values during the reporting period, including any reversal of previously recorded unrealized gain or loss, when gain or loss is realized. Additionally, we do not isolate the portion of the change in fair value resulting from foreign currency exchange rate fluctuations from the changes in fair values of the underlying investment. All fluctuations in fair value are included in net change in unrealized gain (loss) on our consolidated statements of operations. The impact resulting from changes in foreign exchange rates on the revolving credit facility borrowings is included in net change in unrealized gain (loss) on foreign currency and other transactions.
Capital Gains Incentive Fee
Pursuant to the terms of the Investment Advisory and Management Agreement with MC Advisors, the incentive fee on capital gains earned on liquidated investments of our portfolio is determined and payable in arrears as of the end of each calendar year (or upon termination of the Investment Advisory and Management Agreement). This fee equals 20% of our incentive fee capital gains (i.e., our realized capital gains on a cumulative basis from inception, calculated as of the end of the applicable period, net of all realized capital losses and unrealized capital depreciation on a cumulative basis), less the aggregate amount of any previously paid capital gains incentive fees. On a quarterly basis, we accrue for the capital gains incentive fee by calculating such fee as if it were due and payable as of the end of such period.
While the Investment Advisory and Management Agreement with MC Advisors neither includes nor contemplates the inclusion of unrealized gains in the calculation of the capital gains incentive fee, pursuant to an interpretation of an American Institute for Certified Public Accountants Technical Practice Aid for investment companies, we include unrealized gains in the calculation of the capital gains incentive fee expense and related accrued capital gains incentive fee. This accrual reflects the incentive fees that would be payable to MC Advisors if our entire portfolio was liquidated at its fair value as of the balance sheet date even though MC Advisors is not entitled to an incentive fee with respect to unrealized gains unless and until such gains are actually realized.
During the years ended December 31, 2023, 2022 and 2021, we did not have any further reductions in accrued capital gains incentive fees as they were already at zero, primarily as a result of accumulated realized and unrealized losses on the portfolio.
New Accounting Pronouncements
In March 2020, the Financial Accounting Standards Board (“FASB”) issued ASU 2020-04, Reference Rate Reform (“ASU 2020-04”). The amendments in ASU 2020-04 provide optional expedients and exceptions for applying GAAP to contracts, hedging relationships, and other transactions affected by reference rate reform if certain criteria are met. The standard is effective as of March 12, 2020 through December 31, 2024. We did not utilize the optional expedients and exceptions provided by ASU 2020-04 during the year ended December 31, 2023.
ITEM 7A. QUANTITATIVE AND QUALITATIVE DISCLOSURES ABOUT MARKET RISK
We are subject to financial market risks, including valuation risk, interest rate risk, currency risk and inflation and supply chain risk. The prices of securities held by us may decline in response to certain events, including those directly involving the companies we invest in; conditions affecting the general economy; overall market changes; legislative reform; local, regional, national or global political, social or economic instability, including related to and rising inflation; and interest rate fluctuations, see Part I, Item 1A. Risk Factors, "Risks Relating to Our Business and Structure."
110
Valuation Risk
Our investments may not have readily available market quotations (as such term is defined in Rule 2a-5 under the 1940 Act), and those investments which do not have readily available market quotations are valued at fair value as determined in good faith by our Valuation Designee in accordance with our valuation policy. There is no single standard for determining fair value in good faith. As a result, determining fair value requires that judgment be applied to the specific facts and circumstances of each portfolio investment while employing a consistently applied valuation process for the types of investments we make. Due to the inherent uncertainty of determining the fair value of investments that do not have a readily available market value, the fair value of our investments may fluctuate from period to period. Because of the inherent uncertainty of valuation, these estimated values may differ significantly from the values that would have been used had a ready market for the investments existed, and it is possible that the difference could be material.
In accordance with Rule 2a-5 under the 1940 Act, our Board periodically assesses and manages material risks associated with the determination of the fair value of our investments.
Interest Rate Risk
The majority of the loans in our portfolio have floating interest rates, and we expect that our loans in the future may also have floating interest rates. These loans are usually based on a floating LIBOR or SOFR and typically have interest rate re-set provisions that adjust applicable interest rates under such loans to current market rates on a monthly or quarterly basis. The majority of the loans in our current portfolio have interest rate floors which will effectively convert the loans to fixed rate loans in the event interest rates decrease. In addition, our revolving credit facility has a floating interest rate provision, whereas our 2026 Notes have fixed interest rates until maturity. We expect that other credit facilities into which we may enter in the future may also have floating interest rate provisions.
Assuming that the consolidated statement of assets and liabilities as of December 31, 2023 was to remain constant and that we took no actions to alter our existing interest rate sensitivity, the following table shows the annualized impact of hypothetical base rate changes in interest rates (in thousands):
| Change in Interest Rates | Increase (decrease) in interest income | Increase (decrease) in interest expense | Net increase (decrease) in net investment income (1) | |||||||||||||||||
| Down 25 basis points | $ | (1,014) | $ | (435) | $ | (579) | ||||||||||||||
| Up 100 basis points | 4,045 | 1,729 | 2,316 | |||||||||||||||||
| Up 200 basis points | 8,125 | 3,470 | 4,655 | |||||||||||||||||
| Up 300 basis points | 12,205 | 5,211 | 6,994 | |||||||||||||||||
____________________________________________________
(1)Excludes the impact of income based incentive fees. See Note 6 for more information on income based incentive fees.
Although we believe that this analysis is indicative of our existing sensitivity to interest rate changes, it does not adjust for changes in the credit market, credit quality, the size and composition of the assets in our portfolio and other business developments, including borrowing under the credit facility or other borrowings that could affect net increase in net assets resulting from operations, or net income. Accordingly, we can offer no assurances that actual results would not differ materially from the analysis above.
We may in the future hedge against interest rate fluctuations by using standard hedging instruments such as futures, options and forward contracts to the extent permitted under the 1940 Act and applicable commodities laws. While hedging activities may insulate us against adverse changes in interest rates, they may also limit our ability to participate in the benefits of lower interest rates with respect to the investments in our portfolio with fixed interest rates or interest rate floors.
111
Currency Risk
We may also have exposure to foreign currencies related to certain investments. Such investments are translated into U.S. dollars based on the spot rate at each balance sheet date, exposing us to movements in the exchange rate. In order to reduce our exposure to fluctuations in exchange rates, we may borrow in foreign currency under our revolving credit facility to finance such investments or we may enter into foreign currency forward contracts. As of December 31, 2023, we held no investments in foreign currencies or foreign currency forward contracts.
Inflation and Supply Chain Risk
Economic activity has continued to accelerate across sectors and regions. Nevertheless, due to global supply chain issues, geopolitical events, a rise in energy prices and strong consumer demand as economies continue to reopen, inflation is showing signs of acceleration in the U.S. and globally. Inflation is likely to continue in the near to medium-term, particularly in the U.S., with the possibility that monetary policy may tighten in response. Persistent inflationary pressures could affect our portfolio companies’ profit margins.
ITEM 8. FINANCIAL STATEMENTS AND SUPPLEMENTARY DATA
Our consolidated financial statements are annexed to this Annual Report on Form 10-K beginning on page F-1.
ITEM 9. CHANGES IN AND DISAGREEMENTS WITH ACCOUNTANTS ON ACCOUNTING AND FINANCIAL DISCLOSURE
None.
ITEM 9A. CONTROLS AND PROCEDURES
Disclosure Controls and Procedures
In accordance with Rules 13a-15(b) and 15d-15(b) of the Securities Exchange Act of 1934, as amended (the “Exchange Act”), we, under the supervision and with the participation of our Chief Executive Officer and Chief Financial Officer, carried out an evaluation of the effectiveness of our disclosure controls and procedures (as defined in Rule 13a-15(e) and Rule 15d-15(e) of the Exchange Act). Based on that evaluation, our management, including the Chief Executive Officer and Chief Financial Officer, concluded that, at the end of the period covered by our Annual Report on Form 10-K, our disclosure controls and procedures were effective and provided reasonable assurance that information required to be disclosed in our periodic SEC filings is recorded, processed, summarized and reported within the time periods specified in the SEC’s rules and forms, and that such information is accumulated and communicated to our management, including our Chief Executive Officer and Chief Financial Officer, as appropriate, to allow timely decisions regarding required disclosure. Notwithstanding the foregoing, a control system, no matter how well designed and operated, can provide only reasonable, not absolute, assurance that it will detect or uncover failures within the Company to disclose material information otherwise required to be set forth in the Company’s periodic reports.
Management’s Annual Report on Internal Control Over Financial Reporting
The Company’s management is responsible for establishing and maintaining adequate internal control over financial reporting (as defined in Rules 13a-15(f) of the Exchange Act). Under the supervision and with participation of our Chief Executive Officer and Chief Financial Officer, the company conducted an evaluation of the effectiveness of internal control over financial reporting based on the criteria established in Internal Control – Integrated Framework (2013) issued by the Committee of Sponsoring Organizations of the Treadway Commission (COSO). Based on the Company’s evaluation under the framework in Internal Control – Integrated Framework (2013), management concluded that the Company’s internal control over financial reporting was effective as of December 31, 2023.
Changes in Internal Control Over Financial Reporting
No change occurred in our internal control over financial reporting (as defined in Rules 13a-15(f) and 15d-15(f) of the Exchange Act) during the quarter ended December 31, 2023 that has materially affected, or is reasonably likely to materially affect, our internal control over financial reporting.
112
ITEM 9B. OTHER INFORMATION
Rule 10b5-1 Trading Plans
During the quarter ended December 31, 2023, no director or officer of the Company has entered into any (i) contract, instruction or written plan for the purchase or sale of securities of the registrant intended to satisfy the alternative defense conditions of Rule 10b5-1(c) under the Exchange Act or (ii) any non-Rule 10b5-1 trading arrangement.
ITEM 9C. DISCLOSURE REGARDING FOREIGN JURISDICTIONS THAT PREVENT INSPECTIONS
Not applicable.
PART III
We will file a definitive Proxy Statement for our 2024 Annual Meeting of Stockholders with the Securities and Exchange Commission (the “SEC”), pursuant to Regulation 14A, not later than 120 days after the end of our fiscal year. Accordingly, certain information required by Part III has been omitted under General Instruction G(3) to Form 10-K. Only those sections of our definitive Proxy Statement that specifically address the items set forth herein are incorporated by reference.
ITEM 10. DIRECTORS, EXECUTIVE OFFICERS AND CORPORATE GOVERNANCE
The information required by Item 10 is hereby incorporated by reference from our definitive Proxy Statement relating to our 2024 Annual Meeting of Stockholders, to be filed with the SEC within 120 days following the end of our fiscal year.
ITEM 11. EXECUTIVE COMPENSATION
The information required by Item 11 is hereby incorporated by reference from our definitive Proxy Statement relating to our 2024 Annual Meeting of Stockholders, to be filed with the SEC within 120 days following the end of our fiscal year.
ITEM 12. SECURITY OWNERSHIP OF CERTAIN BENEFICIAL OWNERS AND MANAGEMENT AND RELATED STOCKHOLDER MATTERS
The information required by Item 12 is hereby incorporated by reference from our definitive Proxy Statement relating to our 2024 Annual Meeting of Stockholders, to be filed with the SEC within 120 days following the end of our fiscal year.
ITEM 13. CERTAIN RELATIONSHIPS AND RELATED TRANSACTIONS, AND DIRECTOR INDEPENDENCE
The information required by Item 13 is hereby incorporated by reference from our definitive Proxy Statement relating to our 2024 Annual Meeting of Stockholders, to be filed with the SEC within 120 days following the end of our fiscal year.
ITEM 14. PRINCIPAL ACCOUNTANT FEES AND SERVICES
The information required by Item 14 is hereby incorporated by reference from our definitive Proxy Statement relating to our 2024 Annual Meeting of Stockholders, to be filed with the SEC within 120 days following the end of our fiscal year.
113
PART IV
ITEM 15. EXHIBITS AND FINANCIAL STATEMENT SCHEDULES
The following exhibits are included, or incorporated by reference, in this Annual Report on Form 10-K for the year ended December 31, 2023 (and are numbered in accordance with Item 601 of Regulation S-K).
(a)(1) and (2) Consolidated Financial Statements and Schedules
See the Index to Consolidated Financial Statements at page F-1 of this report.
114
INDEX TO CONSOLIDATED FINANCIAL STATEMENTS
F-1
Report of Independent Registered Public Accounting Firm
Stockholders and the Board of Directors of
Monroe Capital Corporation and Subsidiaries
Opinion on the Financial Statements
We have audited the accompanying consolidated statements of assets and liabilities of Monroe Capital Corporation and its Subsidiaries (collectively, the Company), including the consolidated schedules of investments, as of December 31, 2023 and 2022, the related consolidated statements of operations, changes in net assets, and cash flows for each of the three years in the period ended December 31, 2023, and the related notes to the consolidated financial statements (collectively, the financial statements). In our opinion, the financial statements present fairly, in all material respects, the financial position of the Company as of December 31, 2023 and 2022, and the results of its operations, changes in net assets, and cash flows for each of the three years in the period ended December 31, 2023, in conformity with accounting principles generally accepted in the United States of America.
Basis for Opinion
These financial statements are the responsibility of the Company’s management. Our responsibility is to express an opinion on the Company’s financial statements based on our audits. We are a public accounting firm registered with the Public Company Accounting Oversight Board (United States) (PCAOB) and are required to be independent with respect to the Company in accordance with U.S. federal securities laws and the applicable rules and regulations of the Securities and Exchange Commission and the PCAOB.
We conducted our audits in accordance with the standards of the PCAOB. Those standards require that we plan and perform the audit to obtain reasonable assurance about whether the financial statements are free of material misstatement, whether due to error or fraud. The Company is not required to have, nor were we engaged to perform, an audit of its internal control over financial reporting. As part of our audits we are required to obtain an understanding of internal control over financial reporting but not for the purpose of expressing an opinion on the effectiveness of the Company’s internal control over financial reporting. Accordingly, we express no such opinion.
Our audits included performing procedures to assess the risks of material misstatement of the financial statements, whether due to error or fraud, and performing procedures that respond to those risks. Such procedures included examining, on a test basis, evidence regarding the amounts and disclosures in the financial statements. Our procedures included confirmation of investments owned as of December 31, 2023 and 2022, by correspondence with the custodians and issuers of equity securities and other appropriate procedures where replies from issuers of equity securities were not received. Our audits also included evaluating the accounting principles used and significant estimates made by management, as well as evaluating the overall presentation of the financial statements. We believe that our audits provide a reasonable basis for our opinion.
Critical Audit Matter
The critical audit matter communicated below is a matter arising from the current period audit of the financial statements that was communicated or required to be communicated to the audit committee and that: (1) relates to accounts or disclosures that are material to the financial statements and (2) involved our especially challenging, subjective, or complex judgments. The communication of critical audit matters does not alter in any way our opinion on the financial statements, taken as a whole, and we are not, by communicating the critical audit matter below, providing a separate opinion on the critical audit matter or on the accounts or disclosures to which it relates.
Fair Value of Level 3 Investments
As discussed in Notes 2 and 4 to the financial statements, the Company records substantially all of its financial instruments at fair value, which represents the price that would be received to sell the asset in an orderly transaction between market participants at the measurement date. Where available, fair value is based on observable market prices or inputs. When observable market prices or inputs are not available, management will apply valuation techniques, which involve management estimation and judgment, to estimate the fair value of the financial instrument utilizing inputs that are not observable in the market, which are classified as Level 3 investments according to the fair value hierarchy discussed in Note 4. As discussed in Note 4 to the financial statements, the fair value of the Company’s investments that were valued using techniques with inputs that were not observable in the market was $455,007 thousand as of December 31, 2023.
F-2
We identified the fair value of investments valued by management using inputs that are not observable in the market as a critical audit matter because of the management judgment necessary to select the valuation techniques used to estimate the fair value of the investments and to estimate the significant unobservable inputs used in those valuation techniques. Auditing management’s estimates and judgments involved a high degree of auditor judgement and increased audit effort, including the use of valuation specialists, due to the impact these estimates and judgments have on the estimates of fair value.
The audit procedures we performed related to investments valued by management using inputs that are not observable in the market included the following, among others:
•We selected a sample of investments and tested management’s judgments and assumptions utilized in the determination of the fair value through the performance of the following procedures:
◦We evaluated the appropriateness of the valuation techniques by reviewing the reasonableness of significant changes in those valuation techniques from the prior year-end, if applicable, and also, comparing to those used by market participants.
◦We evaluated the reasonableness of certain significant unobservable inputs, including changes to those inputs from the prior year-end, if applicable, by comparing them to external data such as the historical and forecasted operating results and the capital structure of the portfolio company, market data for comparable portfolio companies and terms of executed agreements.
◦We tested both the source information used by management in the valuation technique to determine certain significant unobservable inputs and the mathematical accuracy used to compute the significant unobservable inputs.
•For a sample of investments, we utilized valuation specialists to assist in the following:
◦Evaluating the appropriateness of the Company’s valuation techniques by comparing them to those used by market participants.
◦Developing an independent range of certain unobservable inputs such as market yield, financial performance measures, and discount rates and comparing them to the assumptions used by the Company.
•For a sample of investments, we developed an independent estimate of the fair value and compared our estimate to management’s estimate.
•We evaluated management’s ability to reasonably estimate fair value by comparing management’s historical estimates to transactions subsequent to the measurement date, considering changes in market or investment specific factors, among others, when applicable.
/s/ RSM US LLP
We have served as the Company’s auditor since 2011.
March 11, 2024
F-3
MONROE CAPITAL CORPORATION
CONSOLIDATED STATEMENTS OF ASSETS AND LIABILITIES
(in thousands, except per share data)
| December 31, 2023 | December 31, 2022 | ||||||||||
| ASSETS | |||||||||||
| Investments, at fair value: | |||||||||||
| Non-controlled/non-affiliate company investments | $ | $ | |||||||||
| Non-controlled affiliate company investments | |||||||||||
| Controlled affiliate company investments | |||||||||||
Total investments, at fair value (amortized cost of: $ | |||||||||||
| Cash and cash equivalents | |||||||||||
| Unrealized gain on foreign currency forward contracts | |||||||||||
| Interest and dividend receivable | |||||||||||
| Other assets | |||||||||||
| Total assets | |||||||||||
| LIABILITIES | |||||||||||
| Debt: | |||||||||||
| Revolving credit facility | |||||||||||
| 2026 Notes | |||||||||||
| Total debt | |||||||||||
| Less: Unamortized deferred financing costs | ( | ( | |||||||||
| Total debt, less unamortized deferred financing costs | |||||||||||
| Interest payable | |||||||||||
| Management fees payable | |||||||||||
| Incentive fees payable | |||||||||||
| Accounts payable and accrued expenses | |||||||||||
| Total liabilities | |||||||||||
| Net assets | $ | $ | |||||||||
| Commitments and contingencies (See Note 12) | |||||||||||
| ANALYSIS OF NET ASSETS | |||||||||||
Common stock, $ | $ | $ | |||||||||
| Capital in excess of par value | |||||||||||
| Accumulated undistributed (overdistributed) earnings | ( | ( | |||||||||
| Total net assets | $ | $ | |||||||||
| Net asset value per share | $ | $ | |||||||||
See Notes to Consolidated Financial Statements.
F-4
MONROE CAPITAL CORPORATION
CONSOLIDATED STATEMENTS OF OPERATIONS
(in thousands, except per share data)
| For the Years Ended December 31, | |||||||||||||||||
| 2023 | 2022 | 2021 | |||||||||||||||
| Investment income: | |||||||||||||||||
| Non-controlled/non-affiliate company investments: | |||||||||||||||||
| Interest income | $ | $ | $ | ||||||||||||||
| Payment-in-kind interest income | |||||||||||||||||
| Dividend income | |||||||||||||||||
| Fee income | ( | ||||||||||||||||
| Total investment income from non-controlled/non-affiliate company investments | |||||||||||||||||
| Non-controlled affiliate company investments: | |||||||||||||||||
| Interest income | |||||||||||||||||
| Payment-in-kind interest income | |||||||||||||||||
| Dividend income | |||||||||||||||||
| Fee income | |||||||||||||||||
| Total investment income from non-controlled affiliate company investments | |||||||||||||||||
| Controlled affiliate company investments: | |||||||||||||||||
| Dividend income | |||||||||||||||||
| Total investment income from controlled affiliate company investments | |||||||||||||||||
| Total investment income | |||||||||||||||||
| Operating expenses: | |||||||||||||||||
| Interest and other debt financing expenses | |||||||||||||||||
| Base management fees | |||||||||||||||||
| Incentive fees | |||||||||||||||||
| Professional fees | |||||||||||||||||
| Administrative service fees | |||||||||||||||||
| General and administrative expenses | |||||||||||||||||
| Directors’ fees | |||||||||||||||||
| Operating expenses before fee waivers | |||||||||||||||||
| Base management fee waivers | ( | ||||||||||||||||
| Incentive fee waivers | ( | ( | |||||||||||||||
| Total operating expenses, net of fee waivers | |||||||||||||||||
| Net investment income before income taxes | |||||||||||||||||
| Income taxes, including excise taxes | |||||||||||||||||
| Net investment income | |||||||||||||||||
| Net gain (loss): | |||||||||||||||||
| Net realized gain (loss): | |||||||||||||||||
| Non-controlled/non-affiliate company investments | ( | ( | ( | ||||||||||||||
| Non-controlled affiliate company investments | ( | ( | |||||||||||||||
| Extinguishment of debt | ( | ( | |||||||||||||||
| Foreign currency forward contracts | ( | ||||||||||||||||
| Foreign currency and other transactions | ( | ( | ( | ||||||||||||||
| Net realized gain (loss) | ( | ( | ( | ||||||||||||||
| Net change in unrealized gain (loss): | |||||||||||||||||
| Non-controlled/non-affiliate company investments | ( | ||||||||||||||||
| Non-controlled affiliate company investments | ( | ( | |||||||||||||||
| Controlled affiliate company investments | ( | ( | |||||||||||||||
| Foreign currency forward contracts | ( | ||||||||||||||||
| Foreign currency and other transactions | |||||||||||||||||
| Net change in unrealized gain (loss) | ( | ||||||||||||||||
| Net gain (loss) | ( | ( | |||||||||||||||
| Net increase (decrease) in net assets resulting from operations | $ | $ | ( | $ | |||||||||||||
| Per common share data: | |||||||||||||||||
| Net investment income per share - basic and diluted | $ | $ | $ | ||||||||||||||
| Net increase (decrease) in net assets resulting from operations per share - basic and diluted | $ | $ | ( | $ | |||||||||||||
| Weighted average common shares outstanding - basic and diluted | |||||||||||||||||
See Notes to Consolidated Financial Statements.
F-5
MONROE CAPITAL CORPORATION
CONSOLIDATED STATEMENTS OF CHANGES IN NET ASSETS
(in thousands)
| Common Stock | Capital in excess of par value | Accumulated undistributed (overdistributed) earnings | Total net assets | ||||||||||||||||||||||||||
| Number of shares | Par value | ||||||||||||||||||||||||||||
| Balances at December 31, 2020 | $ | $ | $ | ( | $ | ||||||||||||||||||||||||
| Net investment income | — | — | — | ||||||||||||||||||||||||||
| Net realized gain (loss) | — | — | — | ( | ( | ||||||||||||||||||||||||
| Net change in unrealized gain (loss) | — | — | — | ||||||||||||||||||||||||||
| Issuances of common stock, net of offering and underwriting costs | — | ||||||||||||||||||||||||||||
| Distributions to stockholders | — | — | — | ( | ( | ||||||||||||||||||||||||
| Tax reclassification of stockholders’ equity in accordance with generally accepted accounting principles | — | — | ( | — | |||||||||||||||||||||||||
| Balances at December 31, 2021 | $ | $ | $ | ( | $ | ||||||||||||||||||||||||
| Net investment income | — | $ | — | $ | — | $ | $ | ||||||||||||||||||||||
| Net realized gain (loss) | — | — | — | ( | ( | ||||||||||||||||||||||||
| Net change in unrealized gain (loss) | — | — | — | ( | ( | ||||||||||||||||||||||||
| Distributions to stockholders | — | — | — | ( | ( | ||||||||||||||||||||||||
| Tax reclassification of stockholders’ equity in accordance with generally accepted accounting principles | — | — | ( | — | |||||||||||||||||||||||||
| Balances at December 31, 2022 | $ | $ | $ | ( | $ | ||||||||||||||||||||||||
| Net investment income | — | $ | — | $ | — | $ | $ | ||||||||||||||||||||||
| Net realized gain (loss) | — | — | — | ( | ( | ||||||||||||||||||||||||
| Net change in unrealized gain (loss) | — | — | — | ||||||||||||||||||||||||||
| Distributions to stockholders | — | — | — | ( | ( | ||||||||||||||||||||||||
| Tax reclassification of stockholders’ equity in accordance with generally accepted accounting principles | — | — | ( | — | |||||||||||||||||||||||||
| Balances at December 31, 2023 | $ | $ | $ | ( | $ | ||||||||||||||||||||||||
See Notes to Consolidated Financial Statements.
F-6
MONROE CAPITAL CORPORATION
CONSOLIDATED STATEMENTS OF CASH FLOWS
(in thousands)
| For the Years Ended December 31, | |||||||||||||||||
| 2023 | 2022 | 2021 | |||||||||||||||
| Cash flows from operating activities: | |||||||||||||||||
| Net increase (decrease) in net assets resulting from operations | $ | $ | ( | $ | |||||||||||||
| Adjustments to reconcile net increase (decrease) in net assets resulting from operations to net cash provided by (used in) operating activities: | |||||||||||||||||
| Net realized (gain) loss on investments | |||||||||||||||||
| Net realized (gain) loss on extinguishment of debt | |||||||||||||||||
| Net realized (gain) loss on foreign currency forward contracts | ( | ( | |||||||||||||||
| Net realized (gain) loss on foreign currency and other transactions | |||||||||||||||||
| Net change in unrealized (gain) loss on investments | ( | ( | |||||||||||||||
| Net change in unrealized (gain) loss on foreign currency forward contracts | ( | ( | |||||||||||||||
| Net change in unrealized (gain) loss on foreign currency and other transactions | ( | ( | |||||||||||||||
| Payment-in-kind interest income | ( | ( | ( | ||||||||||||||
| Net accretion of discounts and amortization of premiums | ( | ( | ( | ||||||||||||||
| Purchases of investments | ( | ( | ( | ||||||||||||||
| Proceeds from principal payments, sales of investments and settlement of forward contracts | |||||||||||||||||
| Amortization of deferred financing costs | |||||||||||||||||
| Changes in operating assets and liabilities: | |||||||||||||||||
| Interest and dividend receivable | ( | ( | ( | ||||||||||||||
| Other assets | ( | ||||||||||||||||
| Interest payable | ( | ||||||||||||||||
| Management fees payable | ( | ( | |||||||||||||||
| Incentive fees payable | ( | ||||||||||||||||
| Accounts payable and accrued expenses | ( | ||||||||||||||||
| Net cash provided by (used in) operating activities | |||||||||||||||||
| Cash flows from financing activities: | |||||||||||||||||
| Borrowings on revolving credit facility | |||||||||||||||||
| Repayments of revolving credit facility | ( | ( | ( | ||||||||||||||
| Repayment of 2023 Notes | ( | ||||||||||||||||
| Proceeds from 2026 Notes | |||||||||||||||||
| Repayment of SBA debentures | ( | ( | |||||||||||||||
| Payments of deferred financing costs | ( | ( | ( | ||||||||||||||
| Proceeds from shares sold, net of offering and underwriting costs | |||||||||||||||||
| Stockholder distributions paid | ( | ( | ( | ||||||||||||||
| Net cash provided by (used in) financing activities | ( | ( | ( | ||||||||||||||
| Net increase (decrease) in cash and restricted cash and cash equivalents | ( | ( | ( | ||||||||||||||
| Effect of foreign currency exchange rates | ( | ( | |||||||||||||||
| Cash and restricted cash and cash equivalents, beginning of year | |||||||||||||||||
| Cash and restricted cash and cash equivalents, end of year | $ | $ | $ | ||||||||||||||
| Supplemental disclosure of cash flow information: | |||||||||||||||||
| Cash interest paid during the year | $ | $ | $ | ||||||||||||||
| Cash paid for income taxes, including excise taxes during the year | $ | $ | $ | ||||||||||||||
F-7
MONROE CAPITAL CORPORATION
CONSOLIDATED STATEMENTS OF CASH FLOWS - (continued)
(in thousands)
The following tables provide a reconciliation of cash and restricted cash and cash equivalents reported on the Consolidated Statements of Assets and Liabilities that sum to the total of the same such amounts on the Consolidated Statements of Cash Flows:
| December 31, 2023 | December 31, 2022 | December 31, 2021 | |||||||||||||||
| Cash and cash equivalents | $ | $ | $ | ||||||||||||||
| Restricted cash and cash equivalents | |||||||||||||||||
| Total cash and restricted cash and cash equivalents shown on the Consolidated Statements of Cash Flows | $ | $ | $ | ||||||||||||||
See Notes to Consolidated Financial Statements.
F-8
MONROE CAPITAL CORPORATION
CONSOLIDATED SCHEDULE OF INVESTMENTS
December 31, 2023
(in thousands, except for shares and units)
Portfolio Company (^) | Index (^^) | Spread (^^) | Interest Rate | Acquisition Date (^^^) | Maturity | Principal | Amortized Cost | Fair Value (^^^^) | % of Net Assets (^^^^^) | |||||||||||||||||||||||||||||||||||||||||||||||
| Non-Controlled/Non-Affiliate Company Investments | ||||||||||||||||||||||||||||||||||||||||||||||||||||||||
| Senior Secured Loans | ||||||||||||||||||||||||||||||||||||||||||||||||||||||||
| Automotive | ||||||||||||||||||||||||||||||||||||||||||||||||||||||||
| Born To Run, LLC | SF | % | % | 4/1/2021 | 4/1/2027 | $ | $ | % | ||||||||||||||||||||||||||||||||||||||||||||||||
| Born To Run, LLC | SF | % | % | 4/1/2021 | 4/1/2027 | % | ||||||||||||||||||||||||||||||||||||||||||||||||||
| Hastings Manufacturing Company | SF | % | % | 4/24/2018 | 12/31/2025 | % | ||||||||||||||||||||||||||||||||||||||||||||||||||
| Hastings Manufacturing Company | SF | % | % | 3/29/2023 | 12/31/2025 | % | ||||||||||||||||||||||||||||||||||||||||||||||||||
| Hastings Manufacturing Company | SF | % | % | 12/18/2023 | 12/31/2025 | % | ||||||||||||||||||||||||||||||||||||||||||||||||||
Hastings Manufacturing Company (Revolver) (*) | SF | % | % | 3/29/2023 | 12/31/2025 | % | ||||||||||||||||||||||||||||||||||||||||||||||||||
| Lifted Trucks Holdings, LLC | SF | % | % | 8/2/2021 | 8/2/2027 | % | ||||||||||||||||||||||||||||||||||||||||||||||||||
Lifted Trucks Holdings, LLC (Revolver) (*) | SF | % | % | 8/2/2021 | 8/2/2027 | % | ||||||||||||||||||||||||||||||||||||||||||||||||||
| Panda Acquisition, LLC | SF | % | % | 12/20/2022 | 10/18/2028 | % | ||||||||||||||||||||||||||||||||||||||||||||||||||
| % | ||||||||||||||||||||||||||||||||||||||||||||||||||||||||
| Banking | ||||||||||||||||||||||||||||||||||||||||||||||||||||||||
MV Receivables II, LLC (#) | SF | % | % | 7/29/2021 | 7/29/2026 | % | ||||||||||||||||||||||||||||||||||||||||||||||||||
| StarCompliance MidCo, LLC | SF | % | % | 1/12/2021 | 1/12/2027 | % | ||||||||||||||||||||||||||||||||||||||||||||||||||
| StarCompliance MidCo, LLC | SF | % | % | 10/12/2021 | 1/12/2027 | % | ||||||||||||||||||||||||||||||||||||||||||||||||||
| StarCompliance MidCo, LLC | SF | % | % | 5/31/2023 | 1/12/2027 | % | ||||||||||||||||||||||||||||||||||||||||||||||||||
StarCompliance MidCo, LLC (Revolver) (*) | SF | % | % | 1/12/2021 | 1/12/2027 | % | ||||||||||||||||||||||||||||||||||||||||||||||||||
| % | ||||||||||||||||||||||||||||||||||||||||||||||||||||||||
| Beverage, Food & Tobacco | ||||||||||||||||||||||||||||||||||||||||||||||||||||||||
| LVF Holdings, Inc. | SF | % | % | 6/10/2021 | 6/10/2027 | % | ||||||||||||||||||||||||||||||||||||||||||||||||||
| LVF Holdings, Inc. | SF | % | % | 6/10/2021 | 6/10/2027 | % | ||||||||||||||||||||||||||||||||||||||||||||||||||
LVF Holdings, Inc. (Revolver) (*) | SF | % | % | 6/10/2021 | 6/10/2027 | % | ||||||||||||||||||||||||||||||||||||||||||||||||||
| % | ||||||||||||||||||||||||||||||||||||||||||||||||||||||||
| Capital Equipment | ||||||||||||||||||||||||||||||||||||||||||||||||||||||||
| CGI Automated Manufacturing, LLC | SF | % | % | 9/9/2022 | 12/17/2026 | % | ||||||||||||||||||||||||||||||||||||||||||||||||||
| CGI Automated Manufacturing, LLC | SF | % | % | 9/30/2022 | 12/17/2026 | % | ||||||||||||||||||||||||||||||||||||||||||||||||||
| % | ||||||||||||||||||||||||||||||||||||||||||||||||||||||||
| Chemicals, Plastics & Rubber | ||||||||||||||||||||||||||||||||||||||||||||||||||||||||
| Valudor Products LLC | SF | % | 6/18/2018 | 12/31/2024 | % | |||||||||||||||||||||||||||||||||||||||||||||||||||
Valudor Products LLC (a) | SF | % | 6/18/2018 | 12/31/2024 | % | |||||||||||||||||||||||||||||||||||||||||||||||||||
| Valudor Products LLC | SF | % | % | 12/22/2021 | 12/31/2024 | % | ||||||||||||||||||||||||||||||||||||||||||||||||||
Valudor Products LLC (Revolver) (*) | SF | % | % | 6/18/2018 | 12/31/2024 | % | ||||||||||||||||||||||||||||||||||||||||||||||||||
| % | ||||||||||||||||||||||||||||||||||||||||||||||||||||||||
| Construction & Building | ||||||||||||||||||||||||||||||||||||||||||||||||||||||||
| MEI Buyer LLC | SF | % | % | 6/30/2023 | 6/29/2029 | % | ||||||||||||||||||||||||||||||||||||||||||||||||||
MEI Buyer LLC (Delayed Draw) (*) (**) | SF | % | % | 6/30/2023 | 6/29/2029 | % | ||||||||||||||||||||||||||||||||||||||||||||||||||
MEI Buyer LLC (Revolver) (*) | SF | % | % | 6/30/2023 | 6/29/2029 | % | ||||||||||||||||||||||||||||||||||||||||||||||||||
| TCFIII OWL Buyer LLC | SF | % | % | 4/19/2021 | 4/17/2026 | % | ||||||||||||||||||||||||||||||||||||||||||||||||||
| TCFIII OWL Buyer LLC | SF | % | % | 4/19/2021 | 4/17/2026 | % | ||||||||||||||||||||||||||||||||||||||||||||||||||
| TCFIII OWL Buyer LLC | SF | % | % | 12/17/2021 | 4/17/2026 | % | ||||||||||||||||||||||||||||||||||||||||||||||||||
| % | ||||||||||||||||||||||||||||||||||||||||||||||||||||||||
| Consumer Goods: Durable | ||||||||||||||||||||||||||||||||||||||||||||||||||||||||
| Independence Buyer, Inc. | SF | % | % | 8/3/2021 | 8/3/2026 | % | ||||||||||||||||||||||||||||||||||||||||||||||||||
Independence Buyer, Inc. (Revolver) (*) | SF | % | % | 8/3/2021 | 8/3/2026 | % | ||||||||||||||||||||||||||||||||||||||||||||||||||
| Recycled Plastics Industries, LLC | SF | % | 8/4/2021 | 8/4/2026 | % | |||||||||||||||||||||||||||||||||||||||||||||||||||
Recycled Plastics Industries, LLC (Revolver) (*) | SF | % | 8/4/2021 | 8/4/2026 | % | |||||||||||||||||||||||||||||||||||||||||||||||||||
| % | ||||||||||||||||||||||||||||||||||||||||||||||||||||||||
F-9
MONROE CAPITAL CORPORATION
CONSOLIDATED SCHEDULE OF INVESTMENTS - (continued)
December 31, 2023
(in thousands, except for shares and units)
Portfolio Company (^) | Index (^^) | Spread (^^) | Interest Rate | Acquisition Date (^^^) | Maturity | Principal | Amortized Cost | Fair Value (^^^^) | % of Net Assets (^^^^^) | |||||||||||||||||||||||||||||||||||||||||||||||
| Consumer Goods: Non-Durable | ||||||||||||||||||||||||||||||||||||||||||||||||||||||||
| The Kyjen Company, LLC | SF | % | 5/14/2021 | 4/3/2026 | $ | $ | % | |||||||||||||||||||||||||||||||||||||||||||||||||
| The Kyjen Company, LLC | SF | % | 9/13/2022 | 4/3/2026 | % | |||||||||||||||||||||||||||||||||||||||||||||||||||
The Kyjen Company, LLC (Revolver) (*) | SF | % | 5/14/2021 | 4/3/2026 | % | |||||||||||||||||||||||||||||||||||||||||||||||||||
| Thrasio, LLC | SF | % | 12/18/2020 | 12/18/2026 | % | |||||||||||||||||||||||||||||||||||||||||||||||||||
| % | ||||||||||||||||||||||||||||||||||||||||||||||||||||||||
| Environmental Industries | ||||||||||||||||||||||||||||||||||||||||||||||||||||||||
| Quest Resource Management Group, LLC | SF | % | % | 10/19/2020 | 10/20/2025 | % | ||||||||||||||||||||||||||||||||||||||||||||||||||
| Quest Resource Management Group, LLC | SF | % | % | 10/19/2020 | 10/20/2025 | % | ||||||||||||||||||||||||||||||||||||||||||||||||||
| Quest Resource Management Group, LLC | SF | % | % | 12/7/2021 | 10/20/2025 | % | ||||||||||||||||||||||||||||||||||||||||||||||||||
| Quest Resource Management Group, LLC | SF | % | % | 12/7/2021 | 10/20/2025 | % | ||||||||||||||||||||||||||||||||||||||||||||||||||
| % | ||||||||||||||||||||||||||||||||||||||||||||||||||||||||
| FIRE: Finance | ||||||||||||||||||||||||||||||||||||||||||||||||||||||||
| Avalara, Inc. | SF | % | % | 10/19/2022 | 10/19/2028 | % | ||||||||||||||||||||||||||||||||||||||||||||||||||
Avalara, Inc. (Revolver) (*) | SF | % | % | 10/19/2022 | 10/19/2028 | % | ||||||||||||||||||||||||||||||||||||||||||||||||||
| GC Champion Acquisition LLC | SF | % | % | 8/19/2022 | 8/18/2028 | % | ||||||||||||||||||||||||||||||||||||||||||||||||||
| GC Champion Acquisition LLC | SF | % | % | 8/19/2022 | 8/18/2028 | % | ||||||||||||||||||||||||||||||||||||||||||||||||||
| GC Champion Acquisition LLC | SF | % | % | 8/1/2023 | 8/18/2028 | % | ||||||||||||||||||||||||||||||||||||||||||||||||||
J2 BWA Funding LLC (Revolver) (*) (#) | n/a | n/a | % | 12/24/2020 | 12/24/2026 | % | ||||||||||||||||||||||||||||||||||||||||||||||||||
Liftforward SPV II, LLC (#) | SF | % | 11/10/2016 | 3/31/2024 | % | |||||||||||||||||||||||||||||||||||||||||||||||||||
W3 Monroe RE Debt LLC (#) | n/a | n/a | 2/5/2021 | 2/4/2028 | % | |||||||||||||||||||||||||||||||||||||||||||||||||||
W3 Monroe RE Debt LLC (Delayed Draw) (*) (**) (#) | n/a | n/a | 3/31/2023 | 2/4/2028 | % | |||||||||||||||||||||||||||||||||||||||||||||||||||
| % | ||||||||||||||||||||||||||||||||||||||||||||||||||||||||
| FIRE: Real Estate | ||||||||||||||||||||||||||||||||||||||||||||||||||||||||
Centaur (Palm Beach) Owner LLC and Panther National Golf Club LLC (#) | SF | % | % | 5/3/2022 | 4/30/2025 | % | ||||||||||||||||||||||||||||||||||||||||||||||||||
Centaur (Palm Beach) Owner LLC and Panther National Golf Club LLC (#) | SF | % | % | 5/3/2022 | 4/30/2025 | % | ||||||||||||||||||||||||||||||||||||||||||||||||||
Centaur (Palm Beach) Owner LLC and Panther National Golf Club LLC (Delayed Draw) (*) (**) (#) | SF | % | % | 10/6/2023 | 4/30/2027 | % | ||||||||||||||||||||||||||||||||||||||||||||||||||
Centaur (Palm Beach) Owner LLC and Panther National Golf Club LLC (Revolver) (*) (#) | SF | % | % | 5/3/2022 | 4/30/2025 | % | ||||||||||||||||||||||||||||||||||||||||||||||||||
| % | ||||||||||||||||||||||||||||||||||||||||||||||||||||||||
| Healthcare & Pharmaceuticals | ||||||||||||||||||||||||||||||||||||||||||||||||||||||||
| Bluesight, Inc. | SF | % | % | 7/17/2023 | 7/17/2029 | % | ||||||||||||||||||||||||||||||||||||||||||||||||||
Bluesight, Inc. (Revolver) (*) | SF | % | % | 7/17/2023 | 7/17/2029 | % | ||||||||||||||||||||||||||||||||||||||||||||||||||
| Brickell Bay Acquisition Corp. | SF | % | % | 2/12/2021 | 2/12/2026 | % | ||||||||||||||||||||||||||||||||||||||||||||||||||
| Caravel Autism Health, LLC | SF | % | % | 6/30/2021 | 6/30/2027 | % | ||||||||||||||||||||||||||||||||||||||||||||||||||
| Caravel Autism Health, LLC | SF | % | % | 6/30/2021 | 6/30/2027 | % | ||||||||||||||||||||||||||||||||||||||||||||||||||
Caravel Autism Health, LLC (Revolver) (*) | SF | % | % | 6/30/2021 | 6/30/2027 | % | ||||||||||||||||||||||||||||||||||||||||||||||||||
| Dorado Acquisition, Inc. | SF | % | % | 6/30/2021 | 6/30/2026 | % | ||||||||||||||||||||||||||||||||||||||||||||||||||
| Dorado Acquisition, Inc. | SF | % | % | 11/27/2022 | 6/30/2026 | % | ||||||||||||||||||||||||||||||||||||||||||||||||||
Dorado Acquisition, Inc. (Revolver) (*) | SF | % | % | 6/30/2021 | 6/30/2026 | % | ||||||||||||||||||||||||||||||||||||||||||||||||||
| INH Buyer, Inc. | SF | % | 6/30/2021 | 6/28/2028 | % | |||||||||||||||||||||||||||||||||||||||||||||||||||
| KL Moon Acquisition, LLC (fka Spectrum Science Communications, LLC) | SF | % | % | 2/1/2023 | 2/1/2029 | % | ||||||||||||||||||||||||||||||||||||||||||||||||||
KL Moon Acquisition, LLC (fka Spectrum Science Communications, LLC) (Delayed Draw) (*) (**) | SF | % | % | 2/1/2023 | 2/1/2029 | % | ||||||||||||||||||||||||||||||||||||||||||||||||||
KL Moon Acquisition, LLC (fka Spectrum Science Communications, LLC) (Revolver) (*) | SF | % | % | 2/1/2023 | 2/1/2029 | % | ||||||||||||||||||||||||||||||||||||||||||||||||||
| NationsBenefits, LLC | SF | % | % | 8/20/2021 | 8/26/2027 | % | ||||||||||||||||||||||||||||||||||||||||||||||||||
| NationsBenefits, LLC | SF | % | % | 8/26/2022 | 8/26/2027 | % | ||||||||||||||||||||||||||||||||||||||||||||||||||
| NationsBenefits, LLC | SF | % | % | 8/26/2022 | 8/26/2027 | % | ||||||||||||||||||||||||||||||||||||||||||||||||||
F-10
MONROE CAPITAL CORPORATION
CONSOLIDATED SCHEDULE OF INVESTMENTS - (continued)
December 31, 2023
(in thousands, except for shares and units)
Portfolio Company (^) | Index (^^) | Spread (^^) | Interest Rate | Acquisition Date (^^^) | Maturity | Principal | Amortized Cost | Fair Value (^^^^) | % of Net Assets (^^^^^) | |||||||||||||||||||||||||||||||||||||||||||||||
NationsBenefits, LLC (Revolver) (*) | SF | % | % | 8/20/2021 | 8/26/2027 | $ | $ | % | ||||||||||||||||||||||||||||||||||||||||||||||||
| NQ PE Project Colosseum Midco Inc. | SF | % | % | 10/4/2022 | 10/4/2028 | % | ||||||||||||||||||||||||||||||||||||||||||||||||||
NQ PE Project Colosseum Midco Inc. (Delayed Draw) (*) (**) | SF | % | % | 10/4/2022 | 10/4/2028 | % | ||||||||||||||||||||||||||||||||||||||||||||||||||
NQ PE Project Colosseum Midco Inc. (Revolver) (*) | SF | % | % | 10/4/2022 | 10/4/2028 | % | ||||||||||||||||||||||||||||||||||||||||||||||||||
| Seran BioScience, LLC | SF | % | % | 12/31/2020 | 7/8/2027 | % | ||||||||||||||||||||||||||||||||||||||||||||||||||
| Seran BioScience, LLC | SF | % | % | 7/8/2022 | 7/8/2027 | % | ||||||||||||||||||||||||||||||||||||||||||||||||||
Seran BioScience, LLC (Delayed Draw) (*) (**) | SF | % | % | 8/21/2023 | 7/8/2027 | % | ||||||||||||||||||||||||||||||||||||||||||||||||||
Seran BioScience, LLC (Revolver) (*) | SF | % | % | 12/31/2020 | 7/8/2027 | % | ||||||||||||||||||||||||||||||||||||||||||||||||||
| TigerConnect, Inc. | SF | % | % | 2/16/2022 | 2/16/2028 | % | ||||||||||||||||||||||||||||||||||||||||||||||||||
TigerConnect, Inc. (Delayed Draw) (*) (**) | SF | % | % | 2/16/2022 | 2/16/2028 | % | ||||||||||||||||||||||||||||||||||||||||||||||||||
TigerConnect, Inc. (Revolver) (*) | SF | % | % | 2/16/2022 | 2/16/2028 | % | ||||||||||||||||||||||||||||||||||||||||||||||||||
| Vero Biotech Inc. | P | % | % | 12/29/2023 | 12/28/2029 | % | ||||||||||||||||||||||||||||||||||||||||||||||||||
| Whistler Parent Holdings III, Inc. | SF | % | 6/3/2022 | 6/2/2028 | % | |||||||||||||||||||||||||||||||||||||||||||||||||||
| Whistler Parent Holdings III, Inc. | SF | % | 6/3/2022 | 6/2/2028 | % | |||||||||||||||||||||||||||||||||||||||||||||||||||
| Whistler Parent Holdings III, Inc. (Revolver) | SF | % | 6/3/2022 | 6/2/2028 | % | |||||||||||||||||||||||||||||||||||||||||||||||||||
| % | ||||||||||||||||||||||||||||||||||||||||||||||||||||||||
| High Tech Industries | ||||||||||||||||||||||||||||||||||||||||||||||||||||||||
| Amelia Holding II, LLC | SF | % | 12/21/2022 | 12/21/2027 | % | |||||||||||||||||||||||||||||||||||||||||||||||||||
Amelia Holding II, LLC (Delayed Draw) (*) (**) | SF | % | 12/21/2022 | 12/21/2027 | % | |||||||||||||||||||||||||||||||||||||||||||||||||||
Amelia Holding II, LLC (Revolver) (*) | SF | % | 12/21/2022 | 12/21/2027 | % | |||||||||||||||||||||||||||||||||||||||||||||||||||
| Arcstor Midco, LLC | SF | % | 8/29/2023 | 3/16/2027 | % | |||||||||||||||||||||||||||||||||||||||||||||||||||
| Drawbridge Partners, LLC | SF | % | % | 9/1/2022 | 9/1/2028 | % | ||||||||||||||||||||||||||||||||||||||||||||||||||
Drawbridge Partners, LLC (Delayed Draw) (*) (**) | SF | % | % | 9/1/2022 | 9/1/2028 | % | ||||||||||||||||||||||||||||||||||||||||||||||||||
Drawbridge Partners, LLC (Revolver) (*) | SF | % | % | 9/1/2022 | 9/1/2028 | % | ||||||||||||||||||||||||||||||||||||||||||||||||||
| Medallia, Inc. | SF | % | 8/15/2022 | 10/27/2028 | % | |||||||||||||||||||||||||||||||||||||||||||||||||||
| Mindbody, Inc. | SF | % | % | 2/15/2019 | 2/14/2025 | % | ||||||||||||||||||||||||||||||||||||||||||||||||||
| Mindbody, Inc. | SF | % | % | 9/22/2021 | 2/14/2025 | % | ||||||||||||||||||||||||||||||||||||||||||||||||||
Mindbody, Inc. (Revolver) (*) | SF | % | % | 2/15/2019 | 2/14/2025 | % | ||||||||||||||||||||||||||||||||||||||||||||||||||
| Planful, Inc. | SF | % | % | 12/28/2018 | 12/28/2026 | % | ||||||||||||||||||||||||||||||||||||||||||||||||||
| Planful, Inc. | SF | % | % | 9/12/2022 | 12/28/2026 | % | ||||||||||||||||||||||||||||||||||||||||||||||||||
| Planful, Inc. | SF | % | % | 1/11/2021 | 12/28/2026 | % | ||||||||||||||||||||||||||||||||||||||||||||||||||
| Planful, Inc. | SF | % | % | 2/11/2022 | 12/28/2026 | % | ||||||||||||||||||||||||||||||||||||||||||||||||||
| Planful, Inc. | SF | % | % | 4/5/2023 | 12/28/2026 | % | ||||||||||||||||||||||||||||||||||||||||||||||||||
| Planful, Inc. (Revolver) | SF | % | % | 12/28/2018 | 12/28/2026 | % | ||||||||||||||||||||||||||||||||||||||||||||||||||
| Sparq Holdings, Inc. | SF | % | % | 6/16/2023 | 6/15/2029 | % | ||||||||||||||||||||||||||||||||||||||||||||||||||
Sparq Holdings, Inc. (Delayed Draw) (*) (**) | SF | % | % | 6/16/2023 | 6/15/2029 | % | ||||||||||||||||||||||||||||||||||||||||||||||||||
Sparq Holdings, Inc. (Revolver) (*) | SF | % | % | 6/16/2023 | 6/15/2029 | % | ||||||||||||||||||||||||||||||||||||||||||||||||||
| % | ||||||||||||||||||||||||||||||||||||||||||||||||||||||||
| Media: Advertising, Printing & Publishing | ||||||||||||||||||||||||||||||||||||||||||||||||||||||||
| Destination Media, Inc. | SF | % | % | 6/21/2023 | 6/21/2028 | % | ||||||||||||||||||||||||||||||||||||||||||||||||||
Destination Media, Inc. (Delayed Draw) (*) (**) | SF | % | % | 6/21/2023 | 6/21/2028 | % | ||||||||||||||||||||||||||||||||||||||||||||||||||
Destination Media, Inc. (Revolver) (*) | SF | % | % | 6/21/2023 | 6/21/2028 | % | ||||||||||||||||||||||||||||||||||||||||||||||||||
| North Haven USHC Acquisition, Inc. | SF | % | % | 10/30/2020 | 10/30/2025 | % | ||||||||||||||||||||||||||||||||||||||||||||||||||
| North Haven USHC Acquisition, Inc. | SF | % | % | 7/29/2022 | 10/30/2025 | % | ||||||||||||||||||||||||||||||||||||||||||||||||||
| North Haven USHC Acquisition, Inc. | SF | % | % | 3/12/2021 | 10/30/2025 | % | ||||||||||||||||||||||||||||||||||||||||||||||||||
| North Haven USHC Acquisition, Inc. | SF | % | % | 9/3/2021 | 10/30/2025 | % | ||||||||||||||||||||||||||||||||||||||||||||||||||
North Haven USHC Acquisition, Inc. (Delayed Draw) (*) (**) | SF | % | % | 7/29/2022 | 10/30/2025 | % | ||||||||||||||||||||||||||||||||||||||||||||||||||
F-11
MONROE CAPITAL CORPORATION
CONSOLIDATED SCHEDULE OF INVESTMENTS - (continued)
December 31, 2023
(in thousands, except for shares and units)
Portfolio Company (^) | Index (^^) | Spread (^^) | Interest Rate | Acquisition Date (^^^) | Maturity | Principal | Amortized Cost | Fair Value (^^^^) | % of Net Assets (^^^^^) | |||||||||||||||||||||||||||||||||||||||||||||||
North Haven USHC Acquisition, Inc. (Revolver) (*) | SF | % | % | 10/30/2020 | 10/30/2025 | $ | $ | % | ||||||||||||||||||||||||||||||||||||||||||||||||
| Relevate Health Group, LLC | SF | % | % | 11/20/2020 | 11/20/2025 | % | ||||||||||||||||||||||||||||||||||||||||||||||||||
| Relevate Health Group, LLC | SF | % | % | 11/20/2020 | 11/20/2025 | % | ||||||||||||||||||||||||||||||||||||||||||||||||||
Relevate Health Group, LLC (Revolver) (*) | SF | % | % | 11/20/2020 | 11/20/2025 | % | ||||||||||||||||||||||||||||||||||||||||||||||||||
| Spherix Global Inc. | SF | % | % | 12/22/2021 | 12/22/2026 | % | ||||||||||||||||||||||||||||||||||||||||||||||||||
Spherix Global Inc. (Revolver) (*) | SF | % | % | 12/22/2021 | 12/22/2026 | % | ||||||||||||||||||||||||||||||||||||||||||||||||||
| XanEdu Publishing, Inc. | SF | % | % | 1/28/2020 | 1/28/2025 | % | ||||||||||||||||||||||||||||||||||||||||||||||||||
| XanEdu Publishing, Inc. | SF | % | % | 8/31/2022 | 1/28/2025 | % | ||||||||||||||||||||||||||||||||||||||||||||||||||
XanEdu Publishing, Inc. (Revolver) (*) | SF | % | % | 1/28/2020 | 1/28/2025 | % | ||||||||||||||||||||||||||||||||||||||||||||||||||
| % | ||||||||||||||||||||||||||||||||||||||||||||||||||||||||
| Media: Broadcasting & Subscription | ||||||||||||||||||||||||||||||||||||||||||||||||||||||||
Vice Acquisition Holdco, LLC (fka Vice Group Holding Inc.) (c) | SF | % | 7/31/2023 | 1/31/2028 | % | |||||||||||||||||||||||||||||||||||||||||||||||||||
Vice Acquisition Holdco, LLC (fka Vice Group Holding Inc.) (c) | SF | % | 7/31/2023 | 1/31/2028 | % | |||||||||||||||||||||||||||||||||||||||||||||||||||
Vice Acquisition Holdco, LLC (fka Vice Group Holding Inc.) (Delayed Draw) (*) (**) (c) | SF | % | 9/8/2023 | 1/31/2028 | % | |||||||||||||||||||||||||||||||||||||||||||||||||||
| % | ||||||||||||||||||||||||||||||||||||||||||||||||||||||||
| Media: Diversified & Production | ||||||||||||||||||||||||||||||||||||||||||||||||||||||||
| Attom Intermediate Holdco, LLC | SF | % | % | 1/4/2019 | 7/3/2025 | % | ||||||||||||||||||||||||||||||||||||||||||||||||||
| Attom Intermediate Holdco, LLC | SF | % | % | 6/25/2020 | 7/3/2025 | % | ||||||||||||||||||||||||||||||||||||||||||||||||||
| Attom Intermediate Holdco, LLC | SF | % | % | 7/1/2021 | 7/3/2025 | % | ||||||||||||||||||||||||||||||||||||||||||||||||||
| Attom Intermediate Holdco, LLC | SF | % | % | 8/4/2022 | 7/3/2025 | % | ||||||||||||||||||||||||||||||||||||||||||||||||||
| Attom Intermediate Holdco, LLC | SF | % | % | 12/22/2022 | 7/3/2025 | % | ||||||||||||||||||||||||||||||||||||||||||||||||||
Attom Intermediate Holdco, LLC (Revolver) (*) | SF | % | % | 1/4/2019 | 7/3/2025 | % | ||||||||||||||||||||||||||||||||||||||||||||||||||
| Bonterra, LLC | SF | % | % | 9/8/2021 | 9/8/2027 | % | ||||||||||||||||||||||||||||||||||||||||||||||||||
| Bonterra, LLC | SF | % | 9/28/2023 | 9/8/2027 | % | |||||||||||||||||||||||||||||||||||||||||||||||||||
Bonterra, LLC (Revolver) (*) | SF | % | % | 9/8/2021 | 9/8/2027 | % | ||||||||||||||||||||||||||||||||||||||||||||||||||
| Chess.com, LLC | SF | % | % | 12/31/2021 | 12/31/2027 | % | ||||||||||||||||||||||||||||||||||||||||||||||||||
Chess.com, LLC (Revolver) (*) | SF | % | % | 12/31/2021 | 12/31/2027 | % | ||||||||||||||||||||||||||||||||||||||||||||||||||
| Crownpeak Technology, Inc. | SF | % | % | 2/28/2019 | 2/28/2025 | % | ||||||||||||||||||||||||||||||||||||||||||||||||||
| Crownpeak Technology, Inc. | SF | % | % | 9/27/2022 | 2/28/2025 | % | ||||||||||||||||||||||||||||||||||||||||||||||||||
| Crownpeak Technology, Inc. | SF | % | % | 2/28/2019 | 2/28/2025 | % | ||||||||||||||||||||||||||||||||||||||||||||||||||
| Crownpeak Technology, Inc. | SF | % | % | 9/27/2022 | 2/28/2025 | % | ||||||||||||||||||||||||||||||||||||||||||||||||||
Crownpeak Technology, Inc. (Revolver) (*) | SF | % | % | 2/28/2019 | 2/28/2025 | % | ||||||||||||||||||||||||||||||||||||||||||||||||||
| Sports Operating Holdings II, LLC | SF | % | % | 11/3/2022 | 11/3/2027 | % | ||||||||||||||||||||||||||||||||||||||||||||||||||
Sports Operating Holdings II, LLC (Delayed Draw) (*) (**) | SF | % | % | 11/3/2022 | 11/3/2027 | % | ||||||||||||||||||||||||||||||||||||||||||||||||||
Sports Operating Holdings II, LLC (Revolver) (*) | SF | % | % | 11/3/2022 | 11/3/2027 | % | ||||||||||||||||||||||||||||||||||||||||||||||||||
| V10 Entertainment, Inc. | SF | % | % | 1/12/2023 | 1/12/2028 | % | ||||||||||||||||||||||||||||||||||||||||||||||||||
V10 Entertainment, Inc. (Revolver) (*) | SF | % | % | 1/12/2023 | 1/12/2028 | % | ||||||||||||||||||||||||||||||||||||||||||||||||||
| % | ||||||||||||||||||||||||||||||||||||||||||||||||||||||||
| Retail | ||||||||||||||||||||||||||||||||||||||||||||||||||||||||
| BLST Operating Company, LLC | SF | % | 8/28/2020 | 8/28/2025 | % | |||||||||||||||||||||||||||||||||||||||||||||||||||
| % | ||||||||||||||||||||||||||||||||||||||||||||||||||||||||
| Services: Business | ||||||||||||||||||||||||||||||||||||||||||||||||||||||||
| Aras Corporation | SF | % | 4/13/2021 | 4/13/2027 | % | |||||||||||||||||||||||||||||||||||||||||||||||||||
Aras Corporation (Revolver) (*) | P | % | % | 4/13/2021 | 4/13/2027 | % | ||||||||||||||||||||||||||||||||||||||||||||||||||
| Burroughs, Inc. | SF | % | % | 12/22/2017 | 12/20/2024 | % | ||||||||||||||||||||||||||||||||||||||||||||||||||
| Burroughs, Inc. (Revolver) | SF | % | % | 12/22/2017 | 12/20/2024 | % | ||||||||||||||||||||||||||||||||||||||||||||||||||
| HS4 Acquisitionco, Inc. | SF | % | % | 7/9/2019 | 7/9/2025 | % | ||||||||||||||||||||||||||||||||||||||||||||||||||
HS4 Acquisitionco, Inc. (Revolver) (*) | SF | % | % | 7/9/2019 | 7/9/2025 | % | ||||||||||||||||||||||||||||||||||||||||||||||||||
| iCIMS, Inc. | SF | % | % | 10/24/2022 | 8/18/2028 | % | ||||||||||||||||||||||||||||||||||||||||||||||||||
| Kingsley Gate Partners, LLC | SF | % | % | 12/9/2022 | 12/11/2028 | % | ||||||||||||||||||||||||||||||||||||||||||||||||||
F-12
MONROE CAPITAL CORPORATION
CONSOLIDATED SCHEDULE OF INVESTMENTS - (continued)
December 31, 2023
(in thousands, except for shares and units)
Portfolio Company (^) | Index (^^) | Spread (^^) | Interest Rate | Acquisition Date (^^^) | Maturity | Principal | Amortized Cost | Fair Value (^^^^) | % of Net Assets (^^^^^) | |||||||||||||||||||||||||||||||||||||||||||||||
| Kingsley Gate Partners, LLC | SF | % | % | 12/9/2022 | 12/11/2028 | $ | $ | % | ||||||||||||||||||||||||||||||||||||||||||||||||
Kingsley Gate Partners, LLC (Delayed Draw) (*) (**) | SF | % | % | 12/9/2022 | 12/11/2028 | % | ||||||||||||||||||||||||||||||||||||||||||||||||||
Kingsley Gate Partners, LLC (Revolver) (*) | SF | % | % | 12/9/2022 | 12/11/2028 | % | ||||||||||||||||||||||||||||||||||||||||||||||||||
| Prototek LLC | SF | % | 12/8/2022 | 12/8/2027 | % | |||||||||||||||||||||||||||||||||||||||||||||||||||
| Prototek LLC (Revolver) (*) | SF | % | 12/8/2022 | 12/8/2027 | % | |||||||||||||||||||||||||||||||||||||||||||||||||||
| Relativity ODA LLC | SF | % | 5/12/2021 | 5/12/2027 | % | |||||||||||||||||||||||||||||||||||||||||||||||||||
Relativity ODA LLC (Revolver) (*) | SF | % | 5/12/2021 | 5/12/2027 | % | |||||||||||||||||||||||||||||||||||||||||||||||||||
| Security Services Acquisition Sub Corp. | SF | % | % | 2/15/2019 | 9/30/2026 | % | ||||||||||||||||||||||||||||||||||||||||||||||||||
| Security Services Acquisition Sub Corp. | SF | % | % | 2/15/2019 | 9/30/2026 | % | ||||||||||||||||||||||||||||||||||||||||||||||||||
| Security Services Acquisition Sub Corp. | SF | % | % | 9/30/2021 | 9/30/2026 | % | ||||||||||||||||||||||||||||||||||||||||||||||||||
| Security Services Acquisition Sub Corp. | SF | % | % | 2/15/2019 | 9/30/2026 | % | ||||||||||||||||||||||||||||||||||||||||||||||||||
| Security Services Acquisition Sub Corp. | SF | % | % | 2/15/2019 | 9/30/2026 | % | ||||||||||||||||||||||||||||||||||||||||||||||||||
| Vhagar Purchaser, LLC | SF | % | % | 6/9/2023 | 6/8/2029 | % | ||||||||||||||||||||||||||||||||||||||||||||||||||
Vhagar Purchaser, LLC (Delayed Draw) (*) (**) | SF | % | % | 6/9/2023 | 6/8/2029 | % | ||||||||||||||||||||||||||||||||||||||||||||||||||
Vhagar Purchaser, LLC (Revolver) (*) | SF | % | % | 6/9/2023 | 6/8/2029 | % | ||||||||||||||||||||||||||||||||||||||||||||||||||
| VPS Holdings, LLC | SF | % | % | 10/5/2018 | 10/4/2024 | % | ||||||||||||||||||||||||||||||||||||||||||||||||||
| VPS Holdings, LLC | SF | % | % | 10/5/2018 | 10/4/2024 | % | ||||||||||||||||||||||||||||||||||||||||||||||||||
VPS Holdings, LLC (Revolver) (*) | SF | % | % | 10/5/2018 | 10/4/2024 | % | ||||||||||||||||||||||||||||||||||||||||||||||||||
| % | ||||||||||||||||||||||||||||||||||||||||||||||||||||||||
| Services: Consumer | ||||||||||||||||||||||||||||||||||||||||||||||||||||||||
| Express Wash Acquisition Company, LLC | SF | % | % | 7/14/2022 | 7/14/2028 | % | ||||||||||||||||||||||||||||||||||||||||||||||||||
| Express Wash Acquisition Company, LLC | SF | % | % | 7/14/2022 | 7/14/2028 | % | ||||||||||||||||||||||||||||||||||||||||||||||||||
Express Wash Acquisition Company, LLC (Revolver) (*) | SF | % | % | 7/14/2022 | 7/14/2028 | % | ||||||||||||||||||||||||||||||||||||||||||||||||||
| Kar Wash Holdings, LLC | SF | % | % | 2/28/2022 | 2/26/2027 | % | ||||||||||||||||||||||||||||||||||||||||||||||||||
| Kar Wash Holdings, LLC | SF | % | % | 2/28/2022 | 2/26/2027 | % | ||||||||||||||||||||||||||||||||||||||||||||||||||
Kar Wash Holdings, LLC (Delayed Draw) (*) (**) | SF | % | % | 8/3/2022 | 2/26/2027 | % | ||||||||||||||||||||||||||||||||||||||||||||||||||
Kar Wash Holdings, LLC (Revolver) (*) | SF | % | % | 2/28/2022 | 2/26/2027 | % | ||||||||||||||||||||||||||||||||||||||||||||||||||
| % | ||||||||||||||||||||||||||||||||||||||||||||||||||||||||
| Telecommunications | ||||||||||||||||||||||||||||||||||||||||||||||||||||||||
American Broadband and Telecommunications Company LLC (Delayed Draw) (*) (**) | P | % | 6/10/2022 | 6/10/2025 | % | |||||||||||||||||||||||||||||||||||||||||||||||||||
American Broadband and Telecommunications Company LLC (Revolver) (*) | P | % | 6/10/2022 | 6/10/2025 | % | |||||||||||||||||||||||||||||||||||||||||||||||||||
| Calabrio, Inc. | SF | % | % | 4/16/2021 | 4/16/2027 | % | ||||||||||||||||||||||||||||||||||||||||||||||||||
Calabrio, Inc. (Delayed Draw) (*) (**) | SF | % | % | 12/19/2023 | 4/16/2027 | % | ||||||||||||||||||||||||||||||||||||||||||||||||||
Calabrio, Inc. (Revolver) (*) | SF | % | % | 4/16/2021 | 4/16/2027 | % | ||||||||||||||||||||||||||||||||||||||||||||||||||
| % | ||||||||||||||||||||||||||||||||||||||||||||||||||||||||
| Wholesale | ||||||||||||||||||||||||||||||||||||||||||||||||||||||||
| Nearly Natural, Inc. | SF | % | 12/15/2017 | 3/29/2024 | % | |||||||||||||||||||||||||||||||||||||||||||||||||||
| Nearly Natural, Inc. | SF | % | 9/22/2020 | 3/29/2024 | % | |||||||||||||||||||||||||||||||||||||||||||||||||||
| Nearly Natural, Inc. | SF | % | 2/16/2021 | 3/29/2024 | % | |||||||||||||||||||||||||||||||||||||||||||||||||||
| Nearly Natural, Inc. | SF | % | 8/28/2019 | 3/29/2024 | % | |||||||||||||||||||||||||||||||||||||||||||||||||||
| Nearly Natural, Inc. (Revolver) | SF | % | 12/15/2017 | 3/29/2024 | % | |||||||||||||||||||||||||||||||||||||||||||||||||||
| % | ||||||||||||||||||||||||||||||||||||||||||||||||||||||||
| Total Non-Controlled/Non-Affiliate Senior Secured Loans | % | |||||||||||||||||||||||||||||||||||||||||||||||||||||||
Unitranche Secured Loans (~) | ||||||||||||||||||||||||||||||||||||||||||||||||||||||||
| Aerospace & Defense | ||||||||||||||||||||||||||||||||||||||||||||||||||||||||
F-13
MONROE CAPITAL CORPORATION
CONSOLIDATED SCHEDULE OF INVESTMENTS - (continued)
December 31, 2023
(in thousands, except for shares and units)
Portfolio Company (^) | Index (^^) | Spread (^^) | Interest Rate | Acquisition Date (^^^) | Maturity | Principal | Amortized Cost | Fair Value (^^^^) | % of Net Assets (^^^^^) | |||||||||||||||||||||||||||||||||||||||||||||||
| Cassavant Holdings, LLC | SF | % | % | 9/8/2021 | 9/8/2026 | $ | $ | % | ||||||||||||||||||||||||||||||||||||||||||||||||
| % | ||||||||||||||||||||||||||||||||||||||||||||||||||||||||
| Services: Business | ||||||||||||||||||||||||||||||||||||||||||||||||||||||||
| ASG II, LLC | SF | % | % | 5/25/2022 | 5/25/2028 | % | ||||||||||||||||||||||||||||||||||||||||||||||||||
ASG II, LLC (Delayed Draw) (*) (**) | SF | % | % | 5/25/2022 | 5/25/2028 | % | ||||||||||||||||||||||||||||||||||||||||||||||||||
| Onit, Inc. | SF | % | % | 12/20/2021 | 5/2/2025 | % | ||||||||||||||||||||||||||||||||||||||||||||||||||
| % | ||||||||||||||||||||||||||||||||||||||||||||||||||||||||
| Telecommunications | ||||||||||||||||||||||||||||||||||||||||||||||||||||||||
| VB E1, LLC | SF | % | % | 11/18/2020 | 11/18/2026 | % | ||||||||||||||||||||||||||||||||||||||||||||||||||
| % | ||||||||||||||||||||||||||||||||||||||||||||||||||||||||
| Total Non-Controlled/Non-Affiliate Unitranche Secured Loans | % | |||||||||||||||||||||||||||||||||||||||||||||||||||||||
| Junior Secured Loans | ||||||||||||||||||||||||||||||||||||||||||||||||||||||||
| Banking | ||||||||||||||||||||||||||||||||||||||||||||||||||||||||
MoneyLion, Inc. (#) | SF | % | % | 3/25/2022 | 3/24/2026 | % | ||||||||||||||||||||||||||||||||||||||||||||||||||
| % | ||||||||||||||||||||||||||||||||||||||||||||||||||||||||
| FIRE: Real Estate | ||||||||||||||||||||||||||||||||||||||||||||||||||||||||
Florida East Coast Industries, LLC (#) | n/a | n/a | 8/9/2021 | 6/28/2024 | % | |||||||||||||||||||||||||||||||||||||||||||||||||||
Witkoff/Monroe 700 JV LLC (#) | n/a | n/a | 7/2/2021 | 7/2/2026 | % | |||||||||||||||||||||||||||||||||||||||||||||||||||
Witkoff/Monroe 700 JV LLC (#) | n/a | n/a | 5/16/2023 | 7/2/2026 | % | |||||||||||||||||||||||||||||||||||||||||||||||||||
Witkoff/Monroe 700 JV LLC (Delayed Draw) (*) (**) (#) | n/a | n/a | 9/25/2023 | 7/22/2026 | % | |||||||||||||||||||||||||||||||||||||||||||||||||||
| % | ||||||||||||||||||||||||||||||||||||||||||||||||||||||||
| High Tech Industries | ||||||||||||||||||||||||||||||||||||||||||||||||||||||||
| Arcstor Midco, LLC | SF | % | 3/16/2021 | 3/16/2027 | % | |||||||||||||||||||||||||||||||||||||||||||||||||||
| Arcstor Midco, LLC | SF | % | 7/14/2023 | 3/16/2027 | % | |||||||||||||||||||||||||||||||||||||||||||||||||||
| % | ||||||||||||||||||||||||||||||||||||||||||||||||||||||||
| Media: Broadcasting & Subscription | ||||||||||||||||||||||||||||||||||||||||||||||||||||||||
Vice Acquisition Holdco, LLC (fka Vice Group Holding Inc.) (c) | n/a | n/a | n/a (##) | 5/2/2019 | n/a (d) | % | ||||||||||||||||||||||||||||||||||||||||||||||||||
Vice Acquisition Holdco, LLC (fka Vice Group Holding Inc.) (c) | n/a | n/a | n/a (##) | 11/4/2019 | n/a (d) | % | ||||||||||||||||||||||||||||||||||||||||||||||||||
Vice Acquisition Holdco, LLC (fka Vice Group Holding Inc.) (c) | n/a | n/a | n/a (##) | 5/2/2019 | n/a (d) | % | ||||||||||||||||||||||||||||||||||||||||||||||||||
Vice Acquisition Holdco, LLC (fka Vice Group Holding Inc.) (c) | n/a | n/a | n/a (##) | 5/2/2019 | n/a (d) | % | ||||||||||||||||||||||||||||||||||||||||||||||||||
Vice Acquisition Holdco, LLC (fka Vice Group Holding Inc.) (c) | SF | % | 7/31/2023 | 1/31/2028 | % | |||||||||||||||||||||||||||||||||||||||||||||||||||
| % | ||||||||||||||||||||||||||||||||||||||||||||||||||||||||
| Retail | ||||||||||||||||||||||||||||||||||||||||||||||||||||||||
| Forman Mills, Inc. | n/a | % | 4/27/2023 | 6/20/2028 | % | |||||||||||||||||||||||||||||||||||||||||||||||||||
| % | ||||||||||||||||||||||||||||||||||||||||||||||||||||||||
| Services: Consumer | ||||||||||||||||||||||||||||||||||||||||||||||||||||||||
| Education Corporation of America | P | % | 9/3/2015 | n/a (d) | % | |||||||||||||||||||||||||||||||||||||||||||||||||||
| % | ||||||||||||||||||||||||||||||||||||||||||||||||||||||||
| Total Non-Controlled/Non-Affiliate Junior Secured Loans | % | |||||||||||||||||||||||||||||||||||||||||||||||||||||||
Equity Securities (<) (###) | ||||||||||||||||||||||||||||||||||||||||||||||||||||||||
| Automotive | ||||||||||||||||||||||||||||||||||||||||||||||||||||||||
Born To Run, LLC ( | — | — | — (##) | 4/1/2021 | — | — | % | |||||||||||||||||||||||||||||||||||||||||||||||||
Lifted Trucks Holdings, LLC ( | — | — | — (##) | 8/2/2021 | — | — | % | |||||||||||||||||||||||||||||||||||||||||||||||||
| % | ||||||||||||||||||||||||||||||||||||||||||||||||||||||||
| Banking | ||||||||||||||||||||||||||||||||||||||||||||||||||||||||
MV Receivables II, LLC ( | — | — | — (##) | 7/29/2021 | — | — | % | |||||||||||||||||||||||||||||||||||||||||||||||||
F-14
MONROE CAPITAL CORPORATION
CONSOLIDATED SCHEDULE OF INVESTMENTS - (continued)
December 31, 2023
(in thousands, except for shares and units)
Portfolio Company (^) | Index (^^) | Spread (^^) | Interest Rate | Acquisition Date (^^^) | Maturity | Principal | Amortized Cost | Fair Value (^^^^) | % of Net Assets (^^^^^) | |||||||||||||||||||||||||||||||||||||||||||||||
MV Receivables II, LLC (warrant to purchase up to | — | — | — (##) | 7/28/2021 | 7/28/2031 | — | $ | $ | % | |||||||||||||||||||||||||||||||||||||||||||||||
| % | ||||||||||||||||||||||||||||||||||||||||||||||||||||||||
| Chemicals, Plastics & Rubber | ||||||||||||||||||||||||||||||||||||||||||||||||||||||||
Valudor Products LLC ( | n/a | n/a | 6/18/2018 | — | — | % | ||||||||||||||||||||||||||||||||||||||||||||||||||
| % | ||||||||||||||||||||||||||||||||||||||||||||||||||||||||
| Consumer Goods: Durable | ||||||||||||||||||||||||||||||||||||||||||||||||||||||||
Independence Buyer, Inc. ( | — | — | — (##) | 8/3/2021 | — | — | % | |||||||||||||||||||||||||||||||||||||||||||||||||
| % | ||||||||||||||||||||||||||||||||||||||||||||||||||||||||
| Construction & Building | ||||||||||||||||||||||||||||||||||||||||||||||||||||||||
MEI Buyer LLC ( | — | — | — (##) | 6/30/2023 | — | — | % | |||||||||||||||||||||||||||||||||||||||||||||||||
| % | ||||||||||||||||||||||||||||||||||||||||||||||||||||||||
| Environmental Industries | ||||||||||||||||||||||||||||||||||||||||||||||||||||||||
Quest Resource Management Group, LLC (warrant to purchase up to | — | — | — (##) | 10/19/2020 | 3/17/2028 | — | % | |||||||||||||||||||||||||||||||||||||||||||||||||
Quest Resource Management Group, LLC (warrant to purchase up to | — | — | — (##) | 10/19/2021 | 3/17/2028 | — | % | |||||||||||||||||||||||||||||||||||||||||||||||||
| % | ||||||||||||||||||||||||||||||||||||||||||||||||||||||||
| FIRE: Finance | ||||||||||||||||||||||||||||||||||||||||||||||||||||||||
J2 BWA Funding LLC ( | — | — | — (##) | 12/24/2020 | — | — | % | |||||||||||||||||||||||||||||||||||||||||||||||||
PKS Holdings, LLC ( | n/a | n/a | 11/30/2017 | — | — | % | ||||||||||||||||||||||||||||||||||||||||||||||||||
PKS Holdings, LLC ( | n/a | n/a | 11/30/2017 | — | — | % | ||||||||||||||||||||||||||||||||||||||||||||||||||
PKS Holdings, LLC ( | n/a | n/a | 11/30/2017 | — | — | % | ||||||||||||||||||||||||||||||||||||||||||||||||||
PKS Holdings, LLC ( | n/a | n/a | 11/30/2017 | — | — | % | ||||||||||||||||||||||||||||||||||||||||||||||||||
| % | ||||||||||||||||||||||||||||||||||||||||||||||||||||||||
| FIRE: Real Estate | ||||||||||||||||||||||||||||||||||||||||||||||||||||||||
Witkoff/Monroe 700 JV LLC ( | n/a | n/a | 7/2/2021 | — | — | % | ||||||||||||||||||||||||||||||||||||||||||||||||||
| % | ||||||||||||||||||||||||||||||||||||||||||||||||||||||||
| Healthcare & Pharmaceuticals | ||||||||||||||||||||||||||||||||||||||||||||||||||||||||
Bluesight, Inc. ( | n/a | n/a | 7/17/2023 | — | — | % | ||||||||||||||||||||||||||||||||||||||||||||||||||
Bluesight, Inc. ( | — | — | — (##) | 7/17/2023 | — | — | % | |||||||||||||||||||||||||||||||||||||||||||||||||
Dorado Acquisition, Inc. ( | — | — | — (##) | 6/30/2021 | — | — | % | |||||||||||||||||||||||||||||||||||||||||||||||||
Dorado Acquisition, Inc. ( | — | — | — (##) | 6/30/2021 | — | — | % | |||||||||||||||||||||||||||||||||||||||||||||||||
KL Moon Acquisition, LLC (fka Spectrum Science Communications, LLC) ( | — | — | — (##) | 1/31/2023 | — | — | % | |||||||||||||||||||||||||||||||||||||||||||||||||
NationsBenefits, LLC ( | n/a | n/a | 8/20/2021 | — | — | % | ||||||||||||||||||||||||||||||||||||||||||||||||||
NationsBenefits, LLC ( | — | — | — (##) | 8/20/2021 | — | — | % | |||||||||||||||||||||||||||||||||||||||||||||||||
NQ PE Project Colosseum Midco Inc. ( | — | — | — (##) | 10/4/2022 | — | — | % | |||||||||||||||||||||||||||||||||||||||||||||||||
Seran BioScience, LLC ( | — | — | — (##) | 12/31/2020 | — | — | % | |||||||||||||||||||||||||||||||||||||||||||||||||
Vero Biotech Inc. (warrant to purchase up to | — | — | — (##) | 12/29/2023 | 12/29/2033 | — | % | |||||||||||||||||||||||||||||||||||||||||||||||||
| % | ||||||||||||||||||||||||||||||||||||||||||||||||||||||||
| High Tech Industries | ||||||||||||||||||||||||||||||||||||||||||||||||||||||||
Amelia Holding II, LLC (warrant to purchase up to | — | — | — (##) | 12/21/2022 | 12/21/2032 | — | % | |||||||||||||||||||||||||||||||||||||||||||||||||
Drawbridge Partners, LLC ( | — | — | — (##) | 9/1/2022 | — | — | % | |||||||||||||||||||||||||||||||||||||||||||||||||
Planful, Inc. ( | n/a | n/a | 12/28/2018 | — | — | % | ||||||||||||||||||||||||||||||||||||||||||||||||||
Planful, Inc. ( | — | — | — (##) | 5/3/2023 | — | — | % | |||||||||||||||||||||||||||||||||||||||||||||||||
Recorded Future, Inc. ( | — | — | — (##) | 7/3/2019 | — | — | % | |||||||||||||||||||||||||||||||||||||||||||||||||
Sparq Holdings, Inc. ( | — | — | — (##) | 6/15/2023 | — | — | % | |||||||||||||||||||||||||||||||||||||||||||||||||
| % | ||||||||||||||||||||||||||||||||||||||||||||||||||||||||
| Hotels, Gaming & Leisure | ||||||||||||||||||||||||||||||||||||||||||||||||||||||||
Equine Network, LLC ( | — | — | — (##) | 12/31/2020 | — | — | % | |||||||||||||||||||||||||||||||||||||||||||||||||
| % | ||||||||||||||||||||||||||||||||||||||||||||||||||||||||
F-15
MONROE CAPITAL CORPORATION
CONSOLIDATED SCHEDULE OF INVESTMENTS - (continued)
December 31, 2023
(in thousands, except for shares and units)
Portfolio Company (^) | Index (^^) | Spread (^^) | Interest Rate | Acquisition Date (^^^) | Maturity | Principal | Amortized Cost | Fair Value (^^^^) | % of Net Assets (^^^^^) | |||||||||||||||||||||||||||||||||||||||||||||||
| Media: Advertising, Printing & Publishing | ||||||||||||||||||||||||||||||||||||||||||||||||||||||||
AdTheorent Holding Company, Inc. ( | — | — | — (##) | 12/22/2016 | — | — | $ | $ | % | |||||||||||||||||||||||||||||||||||||||||||||||
InMobi Pte, Ltd. (warrant to purchase up to | — | — | — (##) | 9/18/2015 | 9/18/2025 | — | % | |||||||||||||||||||||||||||||||||||||||||||||||||
Relevate Health Group, LLC ( | n/a | n/a | 11/20/2020 | — | — | % | ||||||||||||||||||||||||||||||||||||||||||||||||||
Relevate Health Group, LLC ( | — | — | — (##) | 11/20/2020 | — | — | % | |||||||||||||||||||||||||||||||||||||||||||||||||
Spherix Global Inc. ( | — | — | — (##) | 12/22/2021 | — | — | % | |||||||||||||||||||||||||||||||||||||||||||||||||
XanEdu Publishing, Inc. ( | n/a | n/a | 1/28/2020 | — | — | % | ||||||||||||||||||||||||||||||||||||||||||||||||||
| % | ||||||||||||||||||||||||||||||||||||||||||||||||||||||||
| Media: Broadcasting & Subscription | ||||||||||||||||||||||||||||||||||||||||||||||||||||||||
Vice Acquisition Holdco, LLC (fka Vice Group Holding Inc.) ( | — | — | — (##) | 7/31/2023 | — | — | % | |||||||||||||||||||||||||||||||||||||||||||||||||
| % | ||||||||||||||||||||||||||||||||||||||||||||||||||||||||
| Media: Diversified & Production | ||||||||||||||||||||||||||||||||||||||||||||||||||||||||
Attom Intermediate Holdco, LLC ( | — | — | — (##) | 1/4/2019 | — | — | % | |||||||||||||||||||||||||||||||||||||||||||||||||
Chess.com, LLC ( | — | — | — (##) | 12/31/2021 | — | — | % | |||||||||||||||||||||||||||||||||||||||||||||||||
V10 Entertainment, Inc. ( | — | — | — (##) | 1/12/2023 | — | — | % | |||||||||||||||||||||||||||||||||||||||||||||||||
| % | ||||||||||||||||||||||||||||||||||||||||||||||||||||||||
| Retail | ||||||||||||||||||||||||||||||||||||||||||||||||||||||||
BLST Operating Company, LLC ( | — | — | — (##) | 8/28/2020 | — | — | % | |||||||||||||||||||||||||||||||||||||||||||||||||
| % | ||||||||||||||||||||||||||||||||||||||||||||||||||||||||
| Services: Business | ||||||||||||||||||||||||||||||||||||||||||||||||||||||||
APCO Worldwide, Inc. ( | — | — | — (##) | 11/1/2017 | — | — | % | |||||||||||||||||||||||||||||||||||||||||||||||||
| % | ||||||||||||||||||||||||||||||||||||||||||||||||||||||||
| Services: Consumer | ||||||||||||||||||||||||||||||||||||||||||||||||||||||||
Education Corporation of America - Series G Preferred Stock ( | n/a | n/a | 9/3/2015 | — | — | % | ||||||||||||||||||||||||||||||||||||||||||||||||||
Express Wash Acquisition Company, LLC ( | — | — | — (##) | 11/15/2023 | — | — | % | |||||||||||||||||||||||||||||||||||||||||||||||||
Express Wash Acquisition Company, LLC ( | n/a | n/a | 11/15/2023 | — | — | % | ||||||||||||||||||||||||||||||||||||||||||||||||||
Express Wash Acquisition Company, LLC ( | — | — | — (##) | 11/15/2023 | — | — | % | |||||||||||||||||||||||||||||||||||||||||||||||||
Express Wash Acquisition Company, LLC ( | n/a | n/a | 11/15/2023 | — | — | % | ||||||||||||||||||||||||||||||||||||||||||||||||||
IDIG Parent, LLC ( | — | — | — (##) | 1/4/2021 | — | — | % | |||||||||||||||||||||||||||||||||||||||||||||||||
Kar Wash Holdings, LLC ( | — | — | — (##) | 2/28/2022 | — | — | % | |||||||||||||||||||||||||||||||||||||||||||||||||
Kar Wash Holdings, LLC - Series A Preferred Stock ( | — | — | — (##) | 6/27/2023 | — | — | % | |||||||||||||||||||||||||||||||||||||||||||||||||
| % | ||||||||||||||||||||||||||||||||||||||||||||||||||||||||
| Telecommunications | ||||||||||||||||||||||||||||||||||||||||||||||||||||||||
American Broadband and Telecommunications Company LLC (warrant to purchase up to | — | — | — (##) | 6/10/2022 | 6/10/2032 | — | % | |||||||||||||||||||||||||||||||||||||||||||||||||
| % | ||||||||||||||||||||||||||||||||||||||||||||||||||||||||
| Wholesale | ||||||||||||||||||||||||||||||||||||||||||||||||||||||||
Nearly Natural, Inc. ( | — | — | — (##) | 12/15/2017 | — | — | % | |||||||||||||||||||||||||||||||||||||||||||||||||
Nearly Natural, Inc. ( | — | — | — (##) | 8/27/2021 | — | — | % | |||||||||||||||||||||||||||||||||||||||||||||||||
| % | ||||||||||||||||||||||||||||||||||||||||||||||||||||||||
| Total Non-Controlled/Non-Affiliate Equity Securities | % | |||||||||||||||||||||||||||||||||||||||||||||||||||||||
| Total Non-Controlled/Non-Affiliate Company Investments | % | |||||||||||||||||||||||||||||||||||||||||||||||||||||||
F-16
MONROE CAPITAL CORPORATION
CONSOLIDATED SCHEDULE OF INVESTMENTS - (continued)
December 31, 2023
(in thousands, except for shares and units)
Portfolio Company (^) | Index (^^) | Spread (^^) | Interest Rate | Acquisition Date (^^^) | Maturity | Principal | Amortized Cost | Fair Value (^^^^) | % of Net Assets (^^^^^) | |||||||||||||||||||||||||||||||||||||||||||||||
Non-Controlled Affiliate Company Investments (<<) | ||||||||||||||||||||||||||||||||||||||||||||||||||||||||
| Senior Secured Loans | ||||||||||||||||||||||||||||||||||||||||||||||||||||||||
| Beverage, Food & Tobacco | ||||||||||||||||||||||||||||||||||||||||||||||||||||||||
TJ Management HoldCo LLC (Revolver) (*) | SF | % | % | 9/9/2020 | 6/28/2024 | $ | $ | % | ||||||||||||||||||||||||||||||||||||||||||||||||
| % | ||||||||||||||||||||||||||||||||||||||||||||||||||||||||
| FIRE: Real Estate | ||||||||||||||||||||||||||||||||||||||||||||||||||||||||
| American Community Homes, Inc. | SF | % | 7/22/2014 | 12/31/2026 | % | |||||||||||||||||||||||||||||||||||||||||||||||||||
| American Community Homes, Inc. | SF | % | 7/22/2014 | 12/31/2026 | % | |||||||||||||||||||||||||||||||||||||||||||||||||||
| American Community Homes, Inc. | SF | % | 5/24/2017 | 12/31/2026 | % | |||||||||||||||||||||||||||||||||||||||||||||||||||
| American Community Homes, Inc. | SF | % | 8/10/2018 | 12/31/2026 | % | |||||||||||||||||||||||||||||||||||||||||||||||||||
| American Community Homes, Inc. | SF | % | 3/29/2019 | 12/31/2026 | % | |||||||||||||||||||||||||||||||||||||||||||||||||||
| American Community Homes, Inc. | SF | % | 9/30/2019 | 12/31/2026 | % | |||||||||||||||||||||||||||||||||||||||||||||||||||
| American Community Homes, Inc. | SF | % | 12/30/2019 | 12/31/2026 | % | |||||||||||||||||||||||||||||||||||||||||||||||||||
American Community Homes, Inc. (Revolver) (*) | SF | % | 3/30/2020 | 12/31/2026 | % | |||||||||||||||||||||||||||||||||||||||||||||||||||
HFZ Capital Group LLC (#) (i) | P | % | 10/20/2017 | n/a (d) | % | |||||||||||||||||||||||||||||||||||||||||||||||||||
HFZ Capital Group LLC (#) (i) | P | % | 10/20/2017 | n/a (d) | % | |||||||||||||||||||||||||||||||||||||||||||||||||||
MC Asset Management (Corporate), LLC (#) (i) | SF | % | 1/26/2021 | 1/26/2024 | % | |||||||||||||||||||||||||||||||||||||||||||||||||||
MC Asset Management (Corporate), LLC (#) (i) | SF | % | 4/26/2021 | 1/26/2024 | % | |||||||||||||||||||||||||||||||||||||||||||||||||||
Second Avenue SFR Holdings II LLC (Revolver) (*) (#) | SF | % | % | 8/11/2021 | 8/9/2024 | % | ||||||||||||||||||||||||||||||||||||||||||||||||||
| % | ||||||||||||||||||||||||||||||||||||||||||||||||||||||||
| High Tech Industries | ||||||||||||||||||||||||||||||||||||||||||||||||||||||||
| Mnine Holdings, Inc. | SF | % | 11/2/2018 | 12/30/2024 | % | |||||||||||||||||||||||||||||||||||||||||||||||||||
| Mnine Holdings, Inc. | SF | % | 7/27/2023 | 12/30/2024 | % | |||||||||||||||||||||||||||||||||||||||||||||||||||
Mnine Holdings, Inc. (Revolver) (*) | SF | % | % | 8/9/2022 | 12/30/2024 | % | ||||||||||||||||||||||||||||||||||||||||||||||||||
| % | ||||||||||||||||||||||||||||||||||||||||||||||||||||||||
| Services: Consumer | ||||||||||||||||||||||||||||||||||||||||||||||||||||||||
NECB Collections, LLC (Revolver) (*) | L | % | 6/25/2019 | n/a (d) | % | |||||||||||||||||||||||||||||||||||||||||||||||||||
| % | ||||||||||||||||||||||||||||||||||||||||||||||||||||||||
| Total Non-Controlled Affiliate Senior Secured Loans | % | |||||||||||||||||||||||||||||||||||||||||||||||||||||||
| Junior Secured Loans | ||||||||||||||||||||||||||||||||||||||||||||||||||||||||
| FIRE: Real Estate | ||||||||||||||||||||||||||||||||||||||||||||||||||||||||
SFR Holdco, LLC (#) | n/a | n/a | % | 8/6/2021 | 7/28/2028 | % | ||||||||||||||||||||||||||||||||||||||||||||||||||
| % | ||||||||||||||||||||||||||||||||||||||||||||||||||||||||
| Total Non-Controlled Affiliate Company Junior Secured Loans | % | |||||||||||||||||||||||||||||||||||||||||||||||||||||||
Equity Securities (<<) (###) | ||||||||||||||||||||||||||||||||||||||||||||||||||||||||
| Beverage, Food & Tobacco | ||||||||||||||||||||||||||||||||||||||||||||||||||||||||
TJ Management HoldCo LLC ( | — | — | — (##) | 9/9/2020 | — | — | % | |||||||||||||||||||||||||||||||||||||||||||||||||
| % | ||||||||||||||||||||||||||||||||||||||||||||||||||||||||
| FIRE: Real Estate | ||||||||||||||||||||||||||||||||||||||||||||||||||||||||
American Community Homes, Inc. ( | — | — | — (##) | 12/29/2022 | — | — | % | |||||||||||||||||||||||||||||||||||||||||||||||||
MC Asset Management (Corporate), LLC ( | — | — | — (##) | 6/11/2019 | — | — | % | |||||||||||||||||||||||||||||||||||||||||||||||||
SFR Holdco, LLC ( | — | — | — (##) | 8/6/2021 | — | — | % | |||||||||||||||||||||||||||||||||||||||||||||||||
| % | ||||||||||||||||||||||||||||||||||||||||||||||||||||||||
| Healthcare & Pharmaceuticals | ||||||||||||||||||||||||||||||||||||||||||||||||||||||||
Ascent Midco, LLC ( | n/a | n/a | 2/5/2020 | — | — | % | ||||||||||||||||||||||||||||||||||||||||||||||||||
Familia Dental Group Holdings, LLC ( | — | — | — (##) | 4/8/2016 | — | — | % | |||||||||||||||||||||||||||||||||||||||||||||||||
| % | ||||||||||||||||||||||||||||||||||||||||||||||||||||||||
F-17
MONROE CAPITAL CORPORATION
CONSOLIDATED SCHEDULE OF INVESTMENTS - (continued)
December 31, 2023
(in thousands, except for shares and units)
Portfolio Company (^) | Index (^^) | Spread (^^) | Interest Rate | Acquisition Date (^^^) | Maturity | Principal | Amortized Cost | Fair Value (^^^^) | % of Net Assets (^^^^^) | |||||||||||||||||||||||||||||||||||||||||||||||
| High Tech Industries | ||||||||||||||||||||||||||||||||||||||||||||||||||||||||
Mnine Holdings, Inc. ( | — | — | — (##) | 6/30/2020 | — | — | $ | $ | % | |||||||||||||||||||||||||||||||||||||||||||||||
| % | ||||||||||||||||||||||||||||||||||||||||||||||||||||||||
| Services: Consumer | ||||||||||||||||||||||||||||||||||||||||||||||||||||||||
NECB Collections, LLC ( | — | — | — (##) | 6/21/2019 | — | — | % | |||||||||||||||||||||||||||||||||||||||||||||||||
| % | ||||||||||||||||||||||||||||||||||||||||||||||||||||||||
| Total Non-Controlled Affiliate Equity Securities | $ | $ | % | |||||||||||||||||||||||||||||||||||||||||||||||||||||
| Total Non-Controlled Affiliate Company Investments | $ | $ | % | |||||||||||||||||||||||||||||||||||||||||||||||||||||
Controlled Affiliate Company Investments (<<<) | ||||||||||||||||||||||||||||||||||||||||||||||||||||||||
| Equity Securities | ||||||||||||||||||||||||||||||||||||||||||||||||||||||||
| Investment Funds & Vehicles | ||||||||||||||||||||||||||||||||||||||||||||||||||||||||
MRCC Senior Loan Fund I, LLC ( | — | — | — | 10/31/2017 | — | — | $ | $ | % | |||||||||||||||||||||||||||||||||||||||||||||||
| Total Controlled Affiliate Equity Securities | $ | $ | % | |||||||||||||||||||||||||||||||||||||||||||||||||||||
| Total Controlled Affiliate Company Investments | $ | $ | % | |||||||||||||||||||||||||||||||||||||||||||||||||||||
| TOTAL INVESTMENTS | $ | $ | % | |||||||||||||||||||||||||||||||||||||||||||||||||||||
Derivative Instruments
Foreign currency forward contracts
There were no foreign currency forward contracts held as of December 31, 2023.
_______________________________________________________
(˄) All of the Company's investments are issued by eligible portfolio companies, as defined in the Investment Company Act of 1940 (the “1940 Act”), unless otherwise noted. All of the Company's investments are issued by U.S. portfolio companies unless otherwise noted.
(˄˄) The majority of the investments bear interest at a rate that may be determined by reference to the Prime Rate ("Prime" or "P"), Sterling Overnight Index Average ("SONIA" or "SN"), Canadian Dollar Offered Rate ("CDOR" or "C"), or Secured Overnight Financing Rate ("SOFR" or "SF") which reset daily, monthly, quarterly or semiannually. For each such investment, the Fund has provided the spread over the base rate and the current contractual interest rate at December 31, 2023. Certain investments may be subject to a Prime, or SOFR interest rate floor or rate cap. Certain investments contain a Payment-in-Kind ("PIK") provision."
(˄˄˄) Except as otherwise noted, all of the Company’s portfolio company investments, which as of December 31, 2023 represented 239.7 % of the Company’s net assets or 95.2 % of the Company’s total assets, are subject to legal restrictions on sales.
(˄˄˄˄) Because there is no readily available market value for these investments, the fair value of these investments is determined in good faith using significant unobservable inputs by the Valuation Designee. (See Note 4 in the accompanying notes to the consolidated financial statements.)
(˄˄˄˄˄) Percentages are based on net assets of $203,724 as of December 31, 2023.
(~) The Company structures its unitranche secured loans as senior secured loans. The Company obtains security interests in the assets of these portfolio companies that serve as collateral in support of the repayment of these loans. This collateral may take the form of first-priority liens on the assets of a portfolio company. Generally, the Company syndicates a “first out” portion of the loan to an investor and retains a "last out” portion of the loan, in which case the “first out” portion of the loan will generally receive priority with respect to payments of principal, interest and any other amounts due thereunder. Unitranche structures combine characteristics of traditional first lien senior secured as well as second lien and subordinated loans and the Company’s unitranche secured loans will expose the Company to the risks associated with second lien and subordinated loans and may limit the Company’s recourse or ability to recover collateral upon a portfolio company’s bankruptcy. Unitranche secured loans typically provide for moderate loan amortization in the initial years of the facility, with the majority of the amortization deferred until loan maturity. Unitranche secured loans generally allow the borrower to make a large lump sum payment of principal at the end of the loan term, and there is a risk of loss if the borrower is unable to pay the lump sum or refinance the amount owed at maturity. In many cases the Company, together with its affiliates, are the sole or majority lender of these unitranche secured loans, which can afford the Company additional influence with a borrower in terms of monitoring and, if necessary, remediation in the event of underperformance.
F-18
MONROE CAPITAL CORPORATION
CONSOLIDATED SCHEDULE OF INVESTMENTS - (continued)
December 31, 2023
(in thousands, except for shares and units)
(<) Represents less than 5% ownership of the portfolio company’s voting securities.
(<<) As defined in the 1940 Act, the Company is deemed to be an “Affiliated Person” of the portfolio company as it owns 5% or more of the portfolio company’s voting securities. See Note 5 in the accompanying notes to the consolidated financial statements for additional information on transactions in which the issuer was an Affiliated Person (but not a portfolio company that the Company is deemed to control).
(<<<) As defined in the 1940 Act, the Company is deemed to be both an “Affiliated Person” of and to “Control” this portfolio company as it owns more than 25% of the portfolio company’s voting securities. See Note 5 in the accompanying notes to the consolidated financial statements for additional information on transactions in which the issuer was both an Affiliated Person and a portfolio company that the Company is deemed to Control.
(#) This investment is treated as a non-qualifying investment under Section 55(a) of the 1940 Act. Under the 1940 Act, the Company may not acquire any non-qualifying asset unless, at the time the acquisition is made, qualifying assets represent at least 70 % of the Company’s total assets. As of December 31, 2023, non-qualifying assets totaled 23.6 % of the Company’s total assets.
(##) Represents a non-income producing security.
(###) Ownership of certain equity investments may occur through a holding company or partnership.
(####)Investment is held by a taxable subsidiary of the Company. See Note 2 in the accompanying notes to the consolidated financial statements for additional information on the Company’s wholly-owned taxable subsidiaries.
(*) All or a portion of this commitment was unfunded at December 31, 2023. As such, interest is earned only on the funded portion of this commitment.
(**) This delayed draw loan requires that certain financial covenants be met by the portfolio company prior to any fundings.
(***) This position was on non-accrual status as of December 31, 2023, meaning that the Company has ceased accruing interest income on the position. See Note 2 in the accompanying notes to the consolidated financial statements for additional information on the Company’s accounting policies.
(a) This investment represents a note convertible to preferred shares of the borrower.
(b) This is an international company.
(c) During the year ended December 31, 2023, the senior secured lender group of Vice Group Inc. ("Vice OldCo") established Vice Acquisition Holdco, LLC ("Vice NewCo") in order to acquire a substantial portion of the assets of Vice OldCo was a part of a bankruptcy restructuring. Vice NewCo credit bid a portion of the senior secured debt in Vice OldCo to acquire certain assets of Vice OldCo which constitute the ongoing operations of the portfolio company. The Company's outstanding senior secured debt investment in Vice OldCo was reduced and rolled into new secured debt investments and the remaining amount of the credit bid established the cost basis of its new equity investment. While the Company still has loans outstanding at Vice OldCo, the Company has valued these positions at zero as end of the period.
(d) This is a demand note with no stated maturity.
(e) As of December 31, 2023, the Company was party to a subscription agreement with a commitment to fund an additional equity investment of $16 .
(f) The fair value of this investment was valued using Level 1 inputs. See Note 4 in the accompanying notes to the consolidated financial statements.
(g) As of December 31, 2023, the company was party to a subscription agreement with a commitment to fund an additional equity investment of $189 .
(h) As of December 31, 2023, the Company was party to a subscription agreement with a commitment to fund an equity investment of $43 .
(i) The Company restructured its investments in HFZ Capital Group LLC (“HFZ”) and HFZ Member RB portfolio, LLC (“Member RB”) during 2020. As part of the restructuring of HFZ, the Company obtained a 15.9 % equity interest in MC Asset Management (Corporate), LLC (“Corporate”). As part of the Member RB restructuring, the Company exchanged its loan in Member RB for a promissory note in MC Asset Management (Industrial), LLC (“Industrial”). Corporate owns 100 % of the equity of Industrial. In conjunction with these restructurings, the Company participated $4,758 of principal of its loan to HFZ as an equity contribution to Industrial. This participation did not qualify for sale accounting under ASC Topic 860–Transfers and Servicing because the sale did not meet the definition of a “participating interest”, as defined in the guidance, in order for sale treatment to be allowed. As a result, the Company continues to reflect its full investment in HFZ but has split the loan into two investments.
n/a - not applicable
F-19
MONROE CAPITAL CORPORATION
CONSOLIDATED SCHEDULE OF INVESTMENTS
December 31, 2022
(in thousands, except for shares and units)
Portfolio Company (˄) | Index (˄˄) | Spread (˄˄) | Interest Rate | Acquisition Date (˄˄˄) | Maturity | Principal | Amortized Cost | Fair Value (˄˄˄˄) | % of Net Assets (˄˄˄˄˄) | |||||||||||||||||||||||||||||||||||||||||||||||
| Non-Controlled/Non-Affiliate Company Investments | ||||||||||||||||||||||||||||||||||||||||||||||||||||||||
| Senior Secured Loans | ||||||||||||||||||||||||||||||||||||||||||||||||||||||||
| Automotive | ||||||||||||||||||||||||||||||||||||||||||||||||||||||||
| Born To Run, LLC | L | % | % | 4/1/2021 | 4/1/2027 | $ | $ | % | ||||||||||||||||||||||||||||||||||||||||||||||||
| Born To Run, LLC | L | % | % | 4/1/2021 | 4/1/2027 | % | ||||||||||||||||||||||||||||||||||||||||||||||||||
| Hastings Manufacturing Company | L | % | % | 4/24/2018 | 4/24/2023 | % | ||||||||||||||||||||||||||||||||||||||||||||||||||
| Lifted Trucks Holdings, LLC | L | % | % | 8/2/2021 | 8/2/2027 | % | ||||||||||||||||||||||||||||||||||||||||||||||||||
Lifted Trucks Holdings, LLC (Delayed Draw) (*) (**) | L | % | % | 8/2/2021 | 8/2/2027 | % | ||||||||||||||||||||||||||||||||||||||||||||||||||
Lifted Trucks Holdings, LLC (Revolver) (*) | L | % | % | 8/2/2021 | 8/2/2027 | % | ||||||||||||||||||||||||||||||||||||||||||||||||||
| Panda Acquisition, LLC | SF | % | % | 12/20/2022 | 10/18/2028 | % | ||||||||||||||||||||||||||||||||||||||||||||||||||
| % | ||||||||||||||||||||||||||||||||||||||||||||||||||||||||
| Banking | ||||||||||||||||||||||||||||||||||||||||||||||||||||||||
MV Receivables II, LLC (#) | L | % | % | 7/29/2021 | 7/29/2026 | % | ||||||||||||||||||||||||||||||||||||||||||||||||||
| StarCompliance MidCo, LLC | L | % | % | 1/12/2021 | 1/12/2027 | % | ||||||||||||||||||||||||||||||||||||||||||||||||||
| StarCompliance MidCo, LLC | L | % | % | 10/12/2021 | 1/12/2027 | % | ||||||||||||||||||||||||||||||||||||||||||||||||||
StarCompliance MidCo, LLC (Revolver) (*) | L | % | % | 1/12/2021 | 1/12/2027 | % | ||||||||||||||||||||||||||||||||||||||||||||||||||
| % | ||||||||||||||||||||||||||||||||||||||||||||||||||||||||
| Beverage, Food & Tobacco | ||||||||||||||||||||||||||||||||||||||||||||||||||||||||
| LVF Holdings, Inc. | L | % | % | 6/10/2021 | 6/10/2027 | % | ||||||||||||||||||||||||||||||||||||||||||||||||||
| LVF Holdings, Inc. | L | % | % | 6/10/2021 | 6/10/2027 | % | ||||||||||||||||||||||||||||||||||||||||||||||||||
LVF Holdings, Inc. (Delayed Draw) (*) (**) | L | % | % | 6/10/2021 | 6/10/2027 | % | ||||||||||||||||||||||||||||||||||||||||||||||||||
LVF Holdings, Inc. (Revolver) (*) | L | % | % | 6/10/2021 | 6/10/2027 | % | ||||||||||||||||||||||||||||||||||||||||||||||||||
| LX/JT Intermediate Holdings, Inc. | SF | % | % | 3/11/2020 | 3/11/2025 | % | ||||||||||||||||||||||||||||||||||||||||||||||||||
LX/JT Intermediate Holdings, Inc. (Revolver) (*) | SF | % | % | 3/11/2020 | 3/11/2025 | % | ||||||||||||||||||||||||||||||||||||||||||||||||||
| % | ||||||||||||||||||||||||||||||||||||||||||||||||||||||||
| Capital Equipment | ||||||||||||||||||||||||||||||||||||||||||||||||||||||||
| CGI Automated Manufacturing, LLC | SF | % | % | 9/9/2022 | 12/17/2026 | % | ||||||||||||||||||||||||||||||||||||||||||||||||||
| CGI Automated Manufacturing, LLC | SF | % | % | 9/30/2022 | 12/17/2026 | % | ||||||||||||||||||||||||||||||||||||||||||||||||||
| MCP Shaw Acquisitionco, LLC | SF | % | % | 2/28/2020 | 11/28/2025 | % | ||||||||||||||||||||||||||||||||||||||||||||||||||
| MCP Shaw Acquisitionco, LLC | SF | % | % | 12/29/2021 | 11/28/2025 | % | ||||||||||||||||||||||||||||||||||||||||||||||||||
| MCP Shaw Acquisitionco, LLC | SF | % | % | 12/29/2021 | 11/28/2025 | % | ||||||||||||||||||||||||||||||||||||||||||||||||||
MCP Shaw Acquisitionco, LLC (Revolver) (*) | SF | % | % | 2/28/2020 | 11/28/2025 | % | ||||||||||||||||||||||||||||||||||||||||||||||||||
| % | ||||||||||||||||||||||||||||||||||||||||||||||||||||||||
F-20
MONROE CAPITAL CORPORATION
CONSOLIDATED SCHEDULE OF INVESTMENTS - (continued)
December 31, 2022
(in thousands, except for shares and units)
Portfolio Company (˄) | Index (˄˄) | Spread (˄˄) | Interest Rate | Acquisition Date (˄˄˄) | Maturity | Principal | Amortized Cost | Fair Value (˄˄˄˄) | % of Net Assets (˄˄˄˄˄) | |||||||||||||||||||||||||||||||||||||||||||||||
| Chemicals, Plastics & Rubber | ||||||||||||||||||||||||||||||||||||||||||||||||||||||||
| Valudor Products LLC | L | % | 6/18/2018 | 6/19/2023 | $ | $ | % | |||||||||||||||||||||||||||||||||||||||||||||||||
Valudor Products LLC (a) | L | % | 6/18/2018 | 6/19/2023 | % | |||||||||||||||||||||||||||||||||||||||||||||||||||
| Valudor Products LLC | L | % | % | 12/22/2021 | 6/19/2023 | % | ||||||||||||||||||||||||||||||||||||||||||||||||||
Valudor Products LLC (Revolver) (*) | L | % | % | 6/18/2018 | 6/19/2023 | % | ||||||||||||||||||||||||||||||||||||||||||||||||||
| % | ||||||||||||||||||||||||||||||||||||||||||||||||||||||||
| Construction & Building | ||||||||||||||||||||||||||||||||||||||||||||||||||||||||
| TCFIII OWL Buyer LLC | SF | % | % | 4/19/2021 | 4/17/2026 | % | ||||||||||||||||||||||||||||||||||||||||||||||||||
| TCFIII OWL Buyer LLC | SF | % | % | 4/19/2021 | 4/17/2026 | % | ||||||||||||||||||||||||||||||||||||||||||||||||||
| TCFIII OWL Buyer LLC | SF | % | % | 12/17/2021 | 4/17/2026 | % | ||||||||||||||||||||||||||||||||||||||||||||||||||
| % | ||||||||||||||||||||||||||||||||||||||||||||||||||||||||
| Consumer Goods: Durable | ||||||||||||||||||||||||||||||||||||||||||||||||||||||||
| Independence Buyer, Inc. | SF | % | % | 8/3/2021 | 8/3/2026 | % | ||||||||||||||||||||||||||||||||||||||||||||||||||
Independence Buyer, Inc. (Revolver) (*) | SF | % | % | 8/3/2021 | 8/3/2026 | % | ||||||||||||||||||||||||||||||||||||||||||||||||||
| Recycled Plastics Industries, LLC | L | % | % | 8/4/2021 | 8/4/2026 | % | ||||||||||||||||||||||||||||||||||||||||||||||||||
Recycled Plastics Industries, LLC (Revolver) (*) | L | % | % | 8/4/2021 | 8/4/2026 | % | ||||||||||||||||||||||||||||||||||||||||||||||||||
| % | ||||||||||||||||||||||||||||||||||||||||||||||||||||||||
| Consumer Goods: Non-Durable | ||||||||||||||||||||||||||||||||||||||||||||||||||||||||
| The Kyjen Company, LLC | SF | % | 5/14/2021 | 4/3/2026 | % | |||||||||||||||||||||||||||||||||||||||||||||||||||
| The Kyjen Company, LLC | SF | % | 9/13/2022 | 4/3/2026 | % | |||||||||||||||||||||||||||||||||||||||||||||||||||
The Kyjen Company, LLC (Revolver) (*) | SF | % | 5/14/2021 | 4/3/2026 | % | |||||||||||||||||||||||||||||||||||||||||||||||||||
| Thrasio, LLC | L | % | % | 12/18/2020 | 12/18/2026 | % | ||||||||||||||||||||||||||||||||||||||||||||||||||
| % | ||||||||||||||||||||||||||||||||||||||||||||||||||||||||
| Environmental Industries | ||||||||||||||||||||||||||||||||||||||||||||||||||||||||
| Quest Resource Management Group, LLC | L | % | % | 10/19/2020 | 10/20/2025 | % | ||||||||||||||||||||||||||||||||||||||||||||||||||
| Quest Resource Management Group, LLC | L | % | % | 10/19/2020 | 10/20/2025 | % | ||||||||||||||||||||||||||||||||||||||||||||||||||
| Quest Resource Management Group, LLC | L | % | % | 12/7/2021 | 10/20/2025 | % | ||||||||||||||||||||||||||||||||||||||||||||||||||
Quest Resource Management Group, LLC (Delayed Draw) (*) (**) | L | % | % | 12/7/2021 | 10/20/2025 | % | ||||||||||||||||||||||||||||||||||||||||||||||||||
| % | ||||||||||||||||||||||||||||||||||||||||||||||||||||||||
| FIRE: Finance | ||||||||||||||||||||||||||||||||||||||||||||||||||||||||
| Avalara, Inc. | SF | % | % | 10/19/2022 | 10/19/2028 | % | ||||||||||||||||||||||||||||||||||||||||||||||||||
Avalara, Inc. (Revolver) (*) | SF | % | % | 10/19/2022 | 10/19/2028 | % | ||||||||||||||||||||||||||||||||||||||||||||||||||
| GC Champion Acquisition LLC | SF | % | % | 8/19/2022 | 8/18/2028 | % | ||||||||||||||||||||||||||||||||||||||||||||||||||
GC Champion Acquisition LLC (Delayed Draw) (*) (**) | SF | % | % | 8/19/2022 | 8/18/2028 | % | ||||||||||||||||||||||||||||||||||||||||||||||||||
J2 BWA Funding LLC (Delayed Draw) (*) (**) (#) | n/a | n/a | % | 12/24/2020 | 12/24/2026 | % | ||||||||||||||||||||||||||||||||||||||||||||||||||
Liftforward SPV II, LLC (#) | L | % | % | 11/10/2016 | 3/31/2023 | % | ||||||||||||||||||||||||||||||||||||||||||||||||||
Oceana Australian Fixed Income Trust (#) (b) (c) | n/a | n/a | % | 6/29/2021 | 6/29/2026 | % | ||||||||||||||||||||||||||||||||||||||||||||||||||
Oceana Australian Fixed Income Trust (#) (b) (c) | n/a | n/a | % | 2/25/2021 | 2/25/2026 | % | ||||||||||||||||||||||||||||||||||||||||||||||||||
W3 Monroe RE Debt LLC (#) | n/a | n/a | 2/5/2021 | 2/4/2028 | % | |||||||||||||||||||||||||||||||||||||||||||||||||||
YS WH4 LLC (Revolver) (*) (#) | SF | % | % | 7/20/2022 | 11/20/2025 | % | ||||||||||||||||||||||||||||||||||||||||||||||||||
| % | ||||||||||||||||||||||||||||||||||||||||||||||||||||||||
| FIRE: Real Estate | ||||||||||||||||||||||||||||||||||||||||||||||||||||||||
Centaur (Palm Beach) Owner LLC and Panther National Golf Club LLC (#) | SF | % | % | 5/3/2022 | 4/30/2025 | % | ||||||||||||||||||||||||||||||||||||||||||||||||||
Centaur (Palm Beach) Owner LLC and Panther National Golf Club LLC (#) | SF | % | % | 5/3/2022 | 4/30/2025 | % | ||||||||||||||||||||||||||||||||||||||||||||||||||
Centaur (Palm Beach) Owner LLC and Panther National Golf Club LLC (Revolver) (*) (#) | SF | % | % | 5/3/2022 | 4/30/2025 | % | ||||||||||||||||||||||||||||||||||||||||||||||||||
Florida East Coast Industries, LLC (#) | n/a | n/a | % | 8/9/2021 | 6/28/2024 | % | ||||||||||||||||||||||||||||||||||||||||||||||||||
NCBP Property, LLC (#) | L | % | % | 12/18/2020 | 6/16/2023 | % | ||||||||||||||||||||||||||||||||||||||||||||||||||
F-21
MONROE CAPITAL CORPORATION
CONSOLIDATED SCHEDULE OF INVESTMENTS - (continued)
December 31, 2022
(in thousands, except for shares and units)
Portfolio Company (˄) | Index (˄˄) | Spread (˄˄) | Interest Rate | Acquisition Date (˄˄˄) | Maturity | Principal | Amortized Cost | Fair Value (˄˄˄˄) | % of Net Assets (˄˄˄˄˄) | |||||||||||||||||||||||||||||||||||||||||||||||
| % | ||||||||||||||||||||||||||||||||||||||||||||||||||||||||
| Healthcare & Pharmaceuticals | ||||||||||||||||||||||||||||||||||||||||||||||||||||||||
| Brickell Bay Acquisition Corp. | L | % | % | 2/12/2021 | 2/12/2026 | $ | $ | % | ||||||||||||||||||||||||||||||||||||||||||||||||
| Caravel Autism Health, LLC | SF | % | 6/30/2021 | 6/30/2027 | % | |||||||||||||||||||||||||||||||||||||||||||||||||||
Caravel Autism Health, LLC (Delayed Draw) (*) (**) | SF | % | 6/30/2021 | 6/30/2027 | % | |||||||||||||||||||||||||||||||||||||||||||||||||||
Caravel Autism Health, LLC (Revolver) (*) | SF | % | 6/30/2021 | 6/30/2027 | % | |||||||||||||||||||||||||||||||||||||||||||||||||||
| Dorado Acquisition, Inc. | SF | % | % | 6/30/2021 | 6/30/2026 | % | ||||||||||||||||||||||||||||||||||||||||||||||||||
| Dorado Acquisition, Inc. | SF | % | % | 11/27/2022 | 6/30/2026 | % | ||||||||||||||||||||||||||||||||||||||||||||||||||
Dorado Acquisition, Inc. (Delayed Draw) (*) (**) | SF | % | % | 6/30/2021 | 6/30/2026 | % | ||||||||||||||||||||||||||||||||||||||||||||||||||
| Dorado Acquisition, Inc. (Revolver) | SF | % | % | 6/30/2021 | 6/30/2026 | % | ||||||||||||||||||||||||||||||||||||||||||||||||||
| INH Buyer, Inc. | SF | % | 6/30/2021 | 6/28/2028 | % | |||||||||||||||||||||||||||||||||||||||||||||||||||
| NationsBenefits, LLC | SF | % | % | 8/20/2021 | 8/26/2027 | % | ||||||||||||||||||||||||||||||||||||||||||||||||||
| NationsBenefits, LLC | SF | % | % | 8/26/2022 | 8/26/2027 | % | ||||||||||||||||||||||||||||||||||||||||||||||||||
NationsBenefits, LLC (Delayed Draw) (*) (**) | SF | % | % | 8/26/2022 | 8/26/2027 | % | ||||||||||||||||||||||||||||||||||||||||||||||||||
NationsBenefits, LLC (Revolver) (*) | SF | % | % | 8/20/2021 | 8/26/2027 | % | ||||||||||||||||||||||||||||||||||||||||||||||||||
| NQ PE Project Colosseum Midco Inc. | SF | % | % | 10/4/2022 | 10/4/2028 | % | ||||||||||||||||||||||||||||||||||||||||||||||||||
NQ PE Project Colosseum Midco Inc. (Delayed Draw) (*) (**) | SF | % | % | 10/4/2022 | 10/4/2028 | % | ||||||||||||||||||||||||||||||||||||||||||||||||||
NQ PE Project Colosseum Midco Inc. (Revolver) (*) | SF | % | % | 10/4/2022 | 10/4/2028 | % | ||||||||||||||||||||||||||||||||||||||||||||||||||
Rockdale Blackhawk, LLC (d) | n/a | n/a | n/a | 3/31/2015 | n/a(e) | % | ||||||||||||||||||||||||||||||||||||||||||||||||||
| Seran BioScience, LLC | SF | % | % | 12/31/2020 | 7/8/2027 | % | ||||||||||||||||||||||||||||||||||||||||||||||||||
Seran BioScience, LLC (Delayed Draw) (*) (**) | SF | % | % | 7/8/2022 | 7/8/2027 | % | ||||||||||||||||||||||||||||||||||||||||||||||||||
Seran BioScience, LLC (Revolver) (*) | SF | % | % | 12/31/2020 | 7/8/2027 | % | ||||||||||||||||||||||||||||||||||||||||||||||||||
| TigerConnect, Inc. | SF | % | 2/16/2022 | 2/16/2028 | % | |||||||||||||||||||||||||||||||||||||||||||||||||||
TigerConnect, Inc. (Delayed Draw) (*) (**) | SF | % | 2/16/2022 | 2/16/2028 | % | |||||||||||||||||||||||||||||||||||||||||||||||||||
TigerConnect, Inc. (Revolver) (*) | SF | % | % | 2/16/2022 | 2/16/2028 | % | ||||||||||||||||||||||||||||||||||||||||||||||||||
| Whistler Parent Holdings III, Inc. | SF | % | % | 6/3/2022 | 6/2/2028 | % | ||||||||||||||||||||||||||||||||||||||||||||||||||
Whistler Parent Holdings III, Inc. (Delayed Draw) (*) (**) | SF | % | % | 6/3/2022 | 6/2/2028 | % | ||||||||||||||||||||||||||||||||||||||||||||||||||
Whistler Parent Holdings III, Inc. (Revolver) (*) | SF | % | % | 6/3/2022 | 6/2/2028 | % | ||||||||||||||||||||||||||||||||||||||||||||||||||
| % | ||||||||||||||||||||||||||||||||||||||||||||||||||||||||
F-22
MONROE CAPITAL CORPORATION
CONSOLIDATED SCHEDULE OF INVESTMENTS - (continued)
December 31, 2022
(in thousands, except for shares and units)
Portfolio Company (˄) | Index (˄˄) | Spread (˄˄) | Interest Rate | Acquisition Date (˄˄˄) | Maturity | Principal | Amortized Cost | Fair Value (˄˄˄˄) | % of Net Assets (˄˄˄˄˄) | |||||||||||||||||||||||||||||||||||||||||||||||
| High Tech Industries | ||||||||||||||||||||||||||||||||||||||||||||||||||||||||
| Amelia Holding II, LLC | SF | % | 12/21/2022 | 12/21/2027 | $ | $ | % | |||||||||||||||||||||||||||||||||||||||||||||||||
Amelia Holding II, LLC (Delayed Draw) (*) (**) | SF | % | 12/21/2022 | 12/21/2027 | % | |||||||||||||||||||||||||||||||||||||||||||||||||||
Amelia Holding II, LLC (Revolver) (*) | SF | % | 12/21/2022 | 12/21/2027 | % | |||||||||||||||||||||||||||||||||||||||||||||||||||
| Arcstor Midco, LLC | SF | % | 3/16/2021 | 3/16/2027 | % | |||||||||||||||||||||||||||||||||||||||||||||||||||
| Drawbridge Partners, LLC | SF | % | 9/1/2022 | 9/1/2028 | % | |||||||||||||||||||||||||||||||||||||||||||||||||||
| Drawbridge Partners, LLC (Delayed Draw) (*) (**) | SF | % | 9/1/2022 | 9/1/2028 | % | |||||||||||||||||||||||||||||||||||||||||||||||||||
Drawbridge Partners, LLC (Revolver) (*) | SF | % | % | 9/1/2022 | 9/1/2028 | % | ||||||||||||||||||||||||||||||||||||||||||||||||||
| MarkLogic Corporation | SF | % | % | 10/20/2020 | 10/20/2025 | % | ||||||||||||||||||||||||||||||||||||||||||||||||||
| MarkLogic Corporation | SF | % | % | 11/23/2021 | 10/20/2025 | % | ||||||||||||||||||||||||||||||||||||||||||||||||||
| MarkLogic Corporation | SF | % | % | 5/10/2022 | 10/20/2025 | % | ||||||||||||||||||||||||||||||||||||||||||||||||||
| MarkLogic Corporation | SF | % | % | 11/23/2021 | 10/20/2025 | % | ||||||||||||||||||||||||||||||||||||||||||||||||||
MarkLogic Corporation (Revolver) (*) | SF | % | % | 10/20/2020 | 10/20/2025 | % | ||||||||||||||||||||||||||||||||||||||||||||||||||
| Medallia, Inc. | L | % | 8/15/2022 | 10/27/2028 | % | |||||||||||||||||||||||||||||||||||||||||||||||||||
| Mindbody, Inc. | L | % | % | 2/15/2019 | 2/14/2025 | % | ||||||||||||||||||||||||||||||||||||||||||||||||||
| Mindbody, Inc. | L | % | % | 9/22/2021 | 2/14/2025 | % | ||||||||||||||||||||||||||||||||||||||||||||||||||
Mindbody, Inc. (Revolver) (*) | L | % | % | 2/15/2019 | 2/14/2025 | % | ||||||||||||||||||||||||||||||||||||||||||||||||||
| Newforma, Inc. | L | % | % | 6/30/2017 | 3/31/2023 | % | ||||||||||||||||||||||||||||||||||||||||||||||||||
Newforma, Inc. (Revolver) (*) | L | % | % | 6/30/2017 | 3/31/2023 | % | ||||||||||||||||||||||||||||||||||||||||||||||||||
| Planful, Inc. | SF | % | % | 12/28/2018 | 12/28/2026 | % | ||||||||||||||||||||||||||||||||||||||||||||||||||
| Planful, Inc. | SF | % | % | 9/12/2022 | 12/28/2026 | % | ||||||||||||||||||||||||||||||||||||||||||||||||||
| Planful, Inc. | SF | % | % | 1/11/2021 | 12/28/2026 | % | ||||||||||||||||||||||||||||||||||||||||||||||||||
| Planful, Inc. | SF | % | % | 2/11/2022 | 12/28/2026 | % | ||||||||||||||||||||||||||||||||||||||||||||||||||
| Planful, Inc. (Revolver) | SF | % | % | 12/28/2018 | 12/28/2026 | % | ||||||||||||||||||||||||||||||||||||||||||||||||||
| % | ||||||||||||||||||||||||||||||||||||||||||||||||||||||||
| Hotels, Gaming & Leisure | ||||||||||||||||||||||||||||||||||||||||||||||||||||||||
| Equine Network, LLC | SF | % | % | 12/31/2020 | 12/31/2025 | % | ||||||||||||||||||||||||||||||||||||||||||||||||||
| Equine Network, LLC | SF | % | % | 1/29/2021 | 12/31/2025 | % | ||||||||||||||||||||||||||||||||||||||||||||||||||
Equine Network, LLC (Delayed Draw) (*) (**) | SF | % | % | 12/31/2020 | 12/31/2025 | % | ||||||||||||||||||||||||||||||||||||||||||||||||||
Equine Network, LLC (Revolver) (*) | SF | % | % | 12/31/2020 | 12/31/2025 | % | ||||||||||||||||||||||||||||||||||||||||||||||||||
| % | ||||||||||||||||||||||||||||||||||||||||||||||||||||||||
| Media: Advertising, Printing & Publishing | ||||||||||||||||||||||||||||||||||||||||||||||||||||||||
| Destination Media, Inc. | SF | % | % | 4/7/2017 | 4/7/2023 | % | ||||||||||||||||||||||||||||||||||||||||||||||||||
Destination Media, Inc. (Revolver) (*) | SF | % | % | 4/7/2017 | 4/7/2023 | % | ||||||||||||||||||||||||||||||||||||||||||||||||||
| North Haven USHC Acquisition, Inc. | SF | % | % | 10/30/2020 | 10/30/2025 | % | ||||||||||||||||||||||||||||||||||||||||||||||||||
| North Haven USHC Acquisition, Inc. | SF | % | % | 7/29/2022 | 10/30/2025 | % | ||||||||||||||||||||||||||||||||||||||||||||||||||
| North Haven USHC Acquisition, Inc. | SF | % | % | 3/12/2021 | 10/30/2025 | % | ||||||||||||||||||||||||||||||||||||||||||||||||||
| North Haven USHC Acquisition, Inc. | SF | % | % | 9/3/2021 | 10/30/2025 | % | ||||||||||||||||||||||||||||||||||||||||||||||||||
North Haven USHC Acquisition, Inc. (Delayed Draw) (*) (**) | SF | % | % | 7/29/2022 | 10/30/2025 | % | ||||||||||||||||||||||||||||||||||||||||||||||||||
North Haven USHC Acquisition, Inc. (Revolver) (*) | SF | % | % | 10/30/2020 | 10/30/2025 | % | ||||||||||||||||||||||||||||||||||||||||||||||||||
| Relevate Health Group, LLC | SF | % | % | 11/20/2020 | 11/20/2025 | % | ||||||||||||||||||||||||||||||||||||||||||||||||||
Relevate Health Group, LLC (Delayed Draw) (*) (**) | SF | % | % | 11/20/2020 | 11/20/2025 | % | ||||||||||||||||||||||||||||||||||||||||||||||||||
Relevate Health Group, LLC (Revolver) (*) | SF | % | % | 11/20/2020 | 11/20/2025 | % | ||||||||||||||||||||||||||||||||||||||||||||||||||
| Spherix Global Inc. | SF | % | % | 12/22/2021 | 12/22/2026 | % | ||||||||||||||||||||||||||||||||||||||||||||||||||
Spherix Global Inc. (Revolver) (*) | SF | % | % | 12/22/2021 | 12/22/2026 | % | ||||||||||||||||||||||||||||||||||||||||||||||||||
| XanEdu Publishing, Inc. | SF | % | % | 1/28/2020 | 1/28/2025 | % | ||||||||||||||||||||||||||||||||||||||||||||||||||
| XanEdu Publishing, Inc. | SF | % | % | 8/31/2022 | 1/28/2025 | % | ||||||||||||||||||||||||||||||||||||||||||||||||||
XanEdu Publishing, Inc. (Revolver) (*) | SF | % | % | 1/28/2020 | 1/28/2025 | % | ||||||||||||||||||||||||||||||||||||||||||||||||||
| % | ||||||||||||||||||||||||||||||||||||||||||||||||||||||||
F-23
MONROE CAPITAL CORPORATION
CONSOLIDATED SCHEDULE OF INVESTMENTS - (continued)
December 31, 2022
(in thousands, except for shares and units)
Portfolio Company (˄) | Index (˄˄) | Spread (˄˄) | Interest Rate | Acquisition Date (˄˄˄) | Maturity | Principal | Amortized Cost | Fair Value (˄˄˄˄) | % of Net Assets (˄˄˄˄˄) | |||||||||||||||||||||||||||||||||||||||||||||||
| Media: Broadcasting & Subscription | ||||||||||||||||||||||||||||||||||||||||||||||||||||||||
| Vice Group Holding Inc. | L | % | 5/2/2019 | 5/12/2023 | $ | $ | % | |||||||||||||||||||||||||||||||||||||||||||||||||
| Vice Group Holding Inc. | L | % | 11/4/2019 | 5/12/2023 | % | |||||||||||||||||||||||||||||||||||||||||||||||||||
| Vice Group Holding Inc. | L | % | 5/2/2019 | 5/12/2023 | % | |||||||||||||||||||||||||||||||||||||||||||||||||||
| Vice Group Holding Inc. | L | % | 5/2/2019 | 5/12/2023 | % | |||||||||||||||||||||||||||||||||||||||||||||||||||
| % | ||||||||||||||||||||||||||||||||||||||||||||||||||||||||
| Media: Diversified & Production | ||||||||||||||||||||||||||||||||||||||||||||||||||||||||
| Attom Intermediate Holdco, LLC | SF | % | % | 1/4/2019 | 7/3/2025 | % | ||||||||||||||||||||||||||||||||||||||||||||||||||
| Attom Intermediate Holdco, LLC | SF | % | % | 6/25/2020 | 7/3/2025 | % | ||||||||||||||||||||||||||||||||||||||||||||||||||
| Attom Intermediate Holdco, LLC | SF | % | % | 7/1/2021 | 7/3/2025 | % | ||||||||||||||||||||||||||||||||||||||||||||||||||
| Attom Intermediate Holdco, LLC | SF | % | % | 8/4/2022 | 7/3/2025 | % | ||||||||||||||||||||||||||||||||||||||||||||||||||
| Attom Intermediate Holdco, LLC | SF | % | % | 12/22/2022 | 7/3/2025 | % | ||||||||||||||||||||||||||||||||||||||||||||||||||
Attom Intermediate Holdco, LLC (Revolver) (*) | SF | % | % | 1/4/2019 | 7/3/2025 | % | ||||||||||||||||||||||||||||||||||||||||||||||||||
| Bonterra, LLC (fka Cybergrants Holdings) | L | % | % | 9/8/2021 | 9/8/2027 | % | ||||||||||||||||||||||||||||||||||||||||||||||||||
Bonterra, LLC (fka Cybergrants Holdings) (Delayed Draw) (*) (**) | L | % | % | 9/8/2021 | 9/8/2027 | % | ||||||||||||||||||||||||||||||||||||||||||||||||||
Bonterra, LLC (fka Cybergrants Holdings) (Revolver) (*) | L | % | % | 9/8/2021 | 9/8/2027 | % | ||||||||||||||||||||||||||||||||||||||||||||||||||
| Chess.com, LLC | L | % | % | 12/31/2021 | 12/31/2027 | % | ||||||||||||||||||||||||||||||||||||||||||||||||||
Chess.com, LLC (Revolver) (*) | L | % | % | 12/31/2021 | 12/31/2027 | % | ||||||||||||||||||||||||||||||||||||||||||||||||||
| Crownpeak Technology, Inc. | SF | % | % | 2/28/2019 | 2/28/2025 | % | ||||||||||||||||||||||||||||||||||||||||||||||||||
| Crownpeak Technology, Inc. | SF | % | % | 9/27/2022 | 2/28/2025 | % | ||||||||||||||||||||||||||||||||||||||||||||||||||
| Crownpeak Technology, Inc. | SF | % | % | 2/28/2019 | 2/28/2025 | % | ||||||||||||||||||||||||||||||||||||||||||||||||||
| Crownpeak Technology, Inc. | SF | % | % | 9/27/2022 | 2/28/2025 | % | ||||||||||||||||||||||||||||||||||||||||||||||||||
Crownpeak Technology, Inc. (Revolver) (*) | SF | % | % | 2/28/2019 | 2/28/2025 | % | ||||||||||||||||||||||||||||||||||||||||||||||||||
| Spectrum Science Communications, LLC | SF | % | % | 1/25/2022 | 1/25/2027 | % | ||||||||||||||||||||||||||||||||||||||||||||||||||
Spectrum Science Communications, LLC (Revolver) (*) | SF | % | % | 1/25/2022 | 1/25/2027 | % | ||||||||||||||||||||||||||||||||||||||||||||||||||
| Sports Operating Holdings II, LLC | SF | % | % | 11/3/2022 | 11/3/2027 | % | ||||||||||||||||||||||||||||||||||||||||||||||||||
Sports Operating Holdings II, LLC (Delayed Draw) (*) (**) | SF | % | % | 11/3/2022 | 11/3/2027 | % | ||||||||||||||||||||||||||||||||||||||||||||||||||
Sports Operating Holdings II, LLC (Revolver) (*) | SF | % | % | 11/3/2022 | 11/3/2027 | % | ||||||||||||||||||||||||||||||||||||||||||||||||||
| % | ||||||||||||||||||||||||||||||||||||||||||||||||||||||||
| Retail | ||||||||||||||||||||||||||||||||||||||||||||||||||||||||
| BLST Operating Company, LLC | L | % | 8/28/2020 | 8/28/2025 | % | |||||||||||||||||||||||||||||||||||||||||||||||||||
| Forman Mills, Inc. | SF | % | 1/14/2020 | 4/30/2024 | % | |||||||||||||||||||||||||||||||||||||||||||||||||||
| Forman Mills, Inc. | SF | % | 10/4/2016 | 4/30/2024 | % | |||||||||||||||||||||||||||||||||||||||||||||||||||
| % | ||||||||||||||||||||||||||||||||||||||||||||||||||||||||
F-24
MONROE CAPITAL CORPORATION
CONSOLIDATED SCHEDULE OF INVESTMENTS - (continued)
December 31, 2022
(in thousands, except for shares and units)
Portfolio Company (˄) | Index (˄˄) | Spread (˄˄) | Interest Rate | Acquisition Date (˄˄˄) | Maturity | Principal | Amortized Cost | Fair Value (˄˄˄˄) | % of Net Assets (˄˄˄˄˄) | |||||||||||||||||||||||||||||||||||||||||||||||
| Services: Business | ||||||||||||||||||||||||||||||||||||||||||||||||||||||||
| Aras Corporation | L | % | 4/13/2021 | 4/13/2027 | $ | $ | % | |||||||||||||||||||||||||||||||||||||||||||||||||
Aras Corporation (Revolver) (*) | L | % | % | 4/13/2021 | 4/13/2027 | % | ||||||||||||||||||||||||||||||||||||||||||||||||||
| Burroughs, Inc. | SF | % | % | 12/22/2017 | 12/22/2023 | % | ||||||||||||||||||||||||||||||||||||||||||||||||||
Burroughs, Inc. (Revolver) (*) | SF | % | % | 12/22/2017 | 12/22/2023 | % | ||||||||||||||||||||||||||||||||||||||||||||||||||
| HS4 Acquisitionco, Inc. | L | % | % | 7/9/2019 | 7/9/2025 | % | ||||||||||||||||||||||||||||||||||||||||||||||||||
HS4 Acquisitionco, Inc. (Revolver) (*) | L | % | % | 7/9/2019 | 7/9/2025 | % | ||||||||||||||||||||||||||||||||||||||||||||||||||
| iCIMS, Inc. | SF | % | % | 10/24/2022 | 8/18/2028 | % | ||||||||||||||||||||||||||||||||||||||||||||||||||
| Kingsley Gate Partners, LLC | SF | % | % | 12/9/2022 | 12/11/2028 | % | ||||||||||||||||||||||||||||||||||||||||||||||||||
Kingsley Gate Partners, LLC (Delayed Draw) (*) (**) | SF | % | % | 12/9/2022 | 12/11/2028 | % | ||||||||||||||||||||||||||||||||||||||||||||||||||
Kingsley Gate Partners, LLC (Delayed Draw) (*) (**) | SF | % | % | 12/9/2022 | 12/11/2028 | % | ||||||||||||||||||||||||||||||||||||||||||||||||||
Kingsley Gate Partners, LLC (Revolver) (*) | SF | % | % | 12/9/2022 | 12/11/2028 | % | ||||||||||||||||||||||||||||||||||||||||||||||||||
| Prototek LLC | SF | % | % | 12/8/2022 | 12/8/2027 | % | ||||||||||||||||||||||||||||||||||||||||||||||||||
Prototek LLC (Delayed Draw) (*) (**) | SF | % | % | 12/8/2022 | 12/8/2027 | % | ||||||||||||||||||||||||||||||||||||||||||||||||||
Prototek LLC (Revolver) (*) | SF | % | % | 12/8/2022 | 12/8/2027 | % | ||||||||||||||||||||||||||||||||||||||||||||||||||
| Relativity ODA LLC | L | % | 5/12/2021 | 5/12/2027 | % | |||||||||||||||||||||||||||||||||||||||||||||||||||
Relativity ODA LLC (Revolver) (*) | L | % | 5/12/2021 | 5/12/2027 | % | |||||||||||||||||||||||||||||||||||||||||||||||||||
| Security Services Acquisition Sub Corp. | SF | % | % | 2/15/2019 | 9/30/2026 | % | ||||||||||||||||||||||||||||||||||||||||||||||||||
| Security Services Acquisition Sub Corp. | SF | % | % | 2/15/2019 | 9/30/2026 | % | ||||||||||||||||||||||||||||||||||||||||||||||||||
| Security Services Acquisition Sub Corp. | SF | % | % | 9/30/2021 | 9/30/2026 | % | ||||||||||||||||||||||||||||||||||||||||||||||||||
| Security Services Acquisition Sub Corp. | SF | % | % | 2/15/2019 | 9/30/2026 | % | ||||||||||||||||||||||||||||||||||||||||||||||||||
| Security Services Acquisition Sub Corp. | SF | % | % | 2/15/2019 | 9/30/2026 | % | ||||||||||||||||||||||||||||||||||||||||||||||||||
ServiceMax, Inc. (#) | L | % | 11/1/2021 | 11/1/2027 | % | |||||||||||||||||||||||||||||||||||||||||||||||||||
ServiceMax, Inc. (Revolver) (*) (#) | L | % | 11/1/2021 | 11/1/2027 | % | |||||||||||||||||||||||||||||||||||||||||||||||||||
| VPS Holdings, LLC | L | % | 10/5/2018 | 10/4/2024 | % | |||||||||||||||||||||||||||||||||||||||||||||||||||
| VPS Holdings, LLC | L | % | 10/5/2018 | 10/4/2024 | % | |||||||||||||||||||||||||||||||||||||||||||||||||||
VPS Holdings, LLC (Revolver) (*) | L | % | 10/5/2018 | 10/4/2024 | % | |||||||||||||||||||||||||||||||||||||||||||||||||||
| % | ||||||||||||||||||||||||||||||||||||||||||||||||||||||||
| Services: Consumer | ||||||||||||||||||||||||||||||||||||||||||||||||||||||||
| Express Wash Acquisition Company, LLC | SF | % | % | 7/14/2022 | 7/14/2028 | % | ||||||||||||||||||||||||||||||||||||||||||||||||||
| Express Wash Acquisition Company, LLC | SF | % | % | 7/14/2022 | 7/14/2028 | % | ||||||||||||||||||||||||||||||||||||||||||||||||||
Express Wash Acquisition Company, LLC (Revolver) (*) | SF | % | % | 7/14/2022 | 7/14/2028 | % | ||||||||||||||||||||||||||||||||||||||||||||||||||
| Kar Wash Holdings, LLC | SF | % | % | 2/28/2022 | 2/26/2027 | % | ||||||||||||||||||||||||||||||||||||||||||||||||||
| Kar Wash Holdings, LLC | SF | % | % | 2/28/2022 | 2/26/2027 | % | ||||||||||||||||||||||||||||||||||||||||||||||||||
Kar Wash Holdings, LLC (Delayed Draw) (*) (**) | SF | % | % | 8/3/2022 | 2/26/2027 | % | ||||||||||||||||||||||||||||||||||||||||||||||||||
Kar Wash Holdings, LLC (Revolver) (*) | SF | % | % | 2/28/2022 | 2/26/2027 | % | ||||||||||||||||||||||||||||||||||||||||||||||||||
| Mammoth Holdings, LLC | SF | % | % | 10/16/2018 | 10/16/2024 | % | ||||||||||||||||||||||||||||||||||||||||||||||||||
| Mammoth Holdings, LLC | SF | % | % | 10/16/2018 | 10/16/2024 | % | ||||||||||||||||||||||||||||||||||||||||||||||||||
| Mammoth Holdings, LLC | SF | % | % | 3/12/2021 | 10/16/2024 | % | ||||||||||||||||||||||||||||||||||||||||||||||||||
| Mammoth Holdings, LLC | SF | % | % | 6/15/2021 | 10/16/2024 | % | ||||||||||||||||||||||||||||||||||||||||||||||||||
Mammoth Holdings, LLC (Revolver) (*) | SF | % | % | 10/16/2018 | 10/16/2024 | % | ||||||||||||||||||||||||||||||||||||||||||||||||||
| % | ||||||||||||||||||||||||||||||||||||||||||||||||||||||||
F-25
MONROE CAPITAL CORPORATION
CONSOLIDATED SCHEDULE OF INVESTMENTS - (continued)
December 31, 2022
(in thousands, except for shares and units)
Portfolio Company (˄) | Index (˄˄) | Spread (˄˄) | Interest Rate | Acquisition Date (˄˄˄) | Maturity | Principal | Amortized Cost | Fair Value (˄˄˄˄) | % of Net Assets (˄˄˄˄˄) | |||||||||||||||||||||||||||||||||||||||||||||||
| Telecommunications | ||||||||||||||||||||||||||||||||||||||||||||||||||||||||
American Broadband and Telecommunications Company LLC (Delayed Draw) (*) (**) | P | % | 6/10/2022 | 6/10/2025 | $ | $ | % | |||||||||||||||||||||||||||||||||||||||||||||||||
American Broadband and Telecommunications Company LLC (Revolver) (*) | P | % | 6/10/2022 | 6/10/2025 | % | |||||||||||||||||||||||||||||||||||||||||||||||||||
| Calabrio, Inc. | L | % | % | 4/16/2021 | 4/16/2027 | % | ||||||||||||||||||||||||||||||||||||||||||||||||||
Calabrio, Inc. (Revolver) (*) | L | % | % | 4/16/2021 | 4/16/2027 | % | ||||||||||||||||||||||||||||||||||||||||||||||||||
| % | ||||||||||||||||||||||||||||||||||||||||||||||||||||||||
| Wholesale | ||||||||||||||||||||||||||||||||||||||||||||||||||||||||
| Nearly Natural, Inc. | SF | % | 12/15/2017 | 3/31/2024 | % | |||||||||||||||||||||||||||||||||||||||||||||||||||
| Nearly Natural, Inc. | SF | % | 9/22/2020 | 3/31/2024 | % | |||||||||||||||||||||||||||||||||||||||||||||||||||
| Nearly Natural, Inc. | SF | % | 2/16/2021 | 3/31/2024 | % | |||||||||||||||||||||||||||||||||||||||||||||||||||
| Nearly Natural, Inc. | SF | % | 8/28/2019 | 3/31/2024 | % | |||||||||||||||||||||||||||||||||||||||||||||||||||
| Nearly Natural, Inc. (Revolver) | SF | % | 12/15/2017 | 3/31/2024 | % | |||||||||||||||||||||||||||||||||||||||||||||||||||
| % | ||||||||||||||||||||||||||||||||||||||||||||||||||||||||
| Total Non-Controlled/Non-Affiliate Senior Secured Loans | % | |||||||||||||||||||||||||||||||||||||||||||||||||||||||
Unitranche Secured Loans (~) | ||||||||||||||||||||||||||||||||||||||||||||||||||||||||
| Aerospace & Defense | ||||||||||||||||||||||||||||||||||||||||||||||||||||||||
| Cassavant Holdings, LLC | L | % | % | 9/8/2021 | 9/8/2026 | % | ||||||||||||||||||||||||||||||||||||||||||||||||||
| % | ||||||||||||||||||||||||||||||||||||||||||||||||||||||||
| Consumer Goods: Non-Durable | ||||||||||||||||||||||||||||||||||||||||||||||||||||||||
| Vinci Brands LLC | n/a | n/a | 7/6/2018 | 2/6/2024 | % | |||||||||||||||||||||||||||||||||||||||||||||||||||
| Vinci Brands LLC | n/a | n/a | 3/9/2018 | 2/6/2024 | % | |||||||||||||||||||||||||||||||||||||||||||||||||||
| Vinci Brands LLC | n/a | n/a | 12/26/2014 | 2/6/2024 | % | |||||||||||||||||||||||||||||||||||||||||||||||||||
| Vinci Brands LLC | n/a | n/a | 12/26/2014 | 2/6/2024 | % | |||||||||||||||||||||||||||||||||||||||||||||||||||
| % | ||||||||||||||||||||||||||||||||||||||||||||||||||||||||
| High Tech Industries | ||||||||||||||||||||||||||||||||||||||||||||||||||||||||
| WillowTree, LLC | L | % | % | 10/9/2018 | 10/9/2023 | % | ||||||||||||||||||||||||||||||||||||||||||||||||||
| % | ||||||||||||||||||||||||||||||||||||||||||||||||||||||||
| Services: Business | ||||||||||||||||||||||||||||||||||||||||||||||||||||||||
| ASG II, LLC | SF | % | % | 5/25/2022 | 5/25/2028 | % | ||||||||||||||||||||||||||||||||||||||||||||||||||
ASG II, LLC (Delayed Draw) (*) (**) | SF | % | % | 5/25/2022 | 5/25/2028 | % | ||||||||||||||||||||||||||||||||||||||||||||||||||
| Onit, Inc. | SF | % | % | 12/20/2021 | 5/2/2025 | % | ||||||||||||||||||||||||||||||||||||||||||||||||||
| % | ||||||||||||||||||||||||||||||||||||||||||||||||||||||||
| Telecommunications | ||||||||||||||||||||||||||||||||||||||||||||||||||||||||
| VB E1, LLC | L | % | % | 11/18/2020 | 11/18/2026 | % | ||||||||||||||||||||||||||||||||||||||||||||||||||
| % | ||||||||||||||||||||||||||||||||||||||||||||||||||||||||
| Total Non-Controlled/Non-Affiliate Unitranche Secured Loans | % | |||||||||||||||||||||||||||||||||||||||||||||||||||||||
| Junior Secured Loans | ||||||||||||||||||||||||||||||||||||||||||||||||||||||||
| Banking | ||||||||||||||||||||||||||||||||||||||||||||||||||||||||
MoneyLion, Inc. (#) | SF | % | % | 3/25/2022 | 3/24/2026 | % | ||||||||||||||||||||||||||||||||||||||||||||||||||
MoneyLion, Inc. (#) | P | % | % | 8/27/2021 | 5/1/2023 | % | ||||||||||||||||||||||||||||||||||||||||||||||||||
MoneyLion, Inc. (Delayed Draw) (*) (**) (#) | SF | % | % | 3/25/2022 | 3/24/2026 | % | ||||||||||||||||||||||||||||||||||||||||||||||||||
| % | ||||||||||||||||||||||||||||||||||||||||||||||||||||||||
| FIRE: Real Estate | ||||||||||||||||||||||||||||||||||||||||||||||||||||||||
Florida East Coast Industries, LLC (#) | n/a | n/a | 8/9/2021 | 6/28/2024 | % | |||||||||||||||||||||||||||||||||||||||||||||||||||
F-26
MONROE CAPITAL CORPORATION
CONSOLIDATED SCHEDULE OF INVESTMENTS - (continued)
December 31, 2022
(in thousands, except for shares and units)
Portfolio Company (˄) | Index (˄˄) | Spread (˄˄) | Interest Rate | Acquisition Date (˄˄˄) | Maturity | Principal | Amortized Cost | Fair Value (˄˄˄˄) | % of Net Assets (˄˄˄˄˄) | |||||||||||||||||||||||||||||||||||||||||||||||
Witkoff/Monroe 700 JV LLC (Delayed Draw) (*) (**) (#) | n/a | n/a | 7/2/2021 | 7/2/2026 | $ | $ | % | |||||||||||||||||||||||||||||||||||||||||||||||||
| % | ||||||||||||||||||||||||||||||||||||||||||||||||||||||||
| Services: Consumer | ||||||||||||||||||||||||||||||||||||||||||||||||||||||||
| Education Corporation of America | L | % | 9/3/2015 | n/a (e) | % | |||||||||||||||||||||||||||||||||||||||||||||||||||
| % | ||||||||||||||||||||||||||||||||||||||||||||||||||||||||
| Total Non-Controlled/Non-Affiliate Junior Secured Loans | % | |||||||||||||||||||||||||||||||||||||||||||||||||||||||
Equity Securities (<) (###) | 1 | |||||||||||||||||||||||||||||||||||||||||||||||||||||||
| Automotive | ||||||||||||||||||||||||||||||||||||||||||||||||||||||||
Born To Run, LLC ( | — | — | — (##) | 4/1/2021 | — | — | % | |||||||||||||||||||||||||||||||||||||||||||||||||
Lifted Trucks Holdings, LLC ( | — | — | — (##) | 8/2/2021 | — | — | % | |||||||||||||||||||||||||||||||||||||||||||||||||
| % | ||||||||||||||||||||||||||||||||||||||||||||||||||||||||
| Banking | ||||||||||||||||||||||||||||||||||||||||||||||||||||||||
MV Receivables II, LLC ( | — | — | — (##) | 7/29/2021 | — | — | % | |||||||||||||||||||||||||||||||||||||||||||||||||
MV Receivables II, LLC (warrant to purchase up to | — | — | — (##) | 7/28/2021 | 7/28/2031 | — | % | |||||||||||||||||||||||||||||||||||||||||||||||||
| % | ||||||||||||||||||||||||||||||||||||||||||||||||||||||||
| Beverage, Food & Tobacco | ||||||||||||||||||||||||||||||||||||||||||||||||||||||||
California Pizza Kitchen, Inc. ( | — | — | — (##) | 8/19/2016 | — | — | % | |||||||||||||||||||||||||||||||||||||||||||||||||
| % | ||||||||||||||||||||||||||||||||||||||||||||||||||||||||
| Capital Equipment | ||||||||||||||||||||||||||||||||||||||||||||||||||||||||
MCP Shaw Acquisitionco, LLC ( | — | — | — (##) | 2/28/2020 | — | — | % | |||||||||||||||||||||||||||||||||||||||||||||||||
| % | ||||||||||||||||||||||||||||||||||||||||||||||||||||||||
| Chemicals, Plastics & Rubber | ||||||||||||||||||||||||||||||||||||||||||||||||||||||||
Valudor Products LLC ( | n/a | n/a | 6/18/2018 | — | — | % | ||||||||||||||||||||||||||||||||||||||||||||||||||
| % | ||||||||||||||||||||||||||||||||||||||||||||||||||||||||
| Consumer Goods: Durable | ||||||||||||||||||||||||||||||||||||||||||||||||||||||||
Independence Buyer, Inc. ( | — | — | — (##) | 8/3/2021 | — | — | % | |||||||||||||||||||||||||||||||||||||||||||||||||
| % | ||||||||||||||||||||||||||||||||||||||||||||||||||||||||
| Environmental Industries | ||||||||||||||||||||||||||||||||||||||||||||||||||||||||
Quest Resource Management Group, LLC (warrant to purchase up to | — | — | — (##) | 10/19/2020 | 3/19/2028 | — | % | |||||||||||||||||||||||||||||||||||||||||||||||||
Quest Resource Management Group, LLC (warrant to purchase up to | — | — | — (##) | 10/19/2021 | 3/19/2028 | — | % | |||||||||||||||||||||||||||||||||||||||||||||||||
| % | ||||||||||||||||||||||||||||||||||||||||||||||||||||||||
| FIRE: Finance | ||||||||||||||||||||||||||||||||||||||||||||||||||||||||
J2 BWA Funding LLC ( | — | — | — (##) | 12/24/2020 | — | — | % | |||||||||||||||||||||||||||||||||||||||||||||||||
PKS Holdings, LLC ( | n/a | n/a | 11/30/2017 | — | — | % | ||||||||||||||||||||||||||||||||||||||||||||||||||
PKS Holdings, LLC ( | n/a | n/a | 11/30/2017 | — | — | % | ||||||||||||||||||||||||||||||||||||||||||||||||||
PKS Holdings, LLC ( | n/a | n/a | 11/30/2017 | — | — | % | ||||||||||||||||||||||||||||||||||||||||||||||||||
PKS Holdings, LLC ( | n/a | n/a | 11/30/2017 | — | — | % | ||||||||||||||||||||||||||||||||||||||||||||||||||
| % | ||||||||||||||||||||||||||||||||||||||||||||||||||||||||
| FIRE: Real Estate | ||||||||||||||||||||||||||||||||||||||||||||||||||||||||
Witkoff/Monroe 700 JV LLC ( | n/a | n/a | 7/2/2021 | — | — | % | ||||||||||||||||||||||||||||||||||||||||||||||||||
| % | ||||||||||||||||||||||||||||||||||||||||||||||||||||||||
| Healthcare & Pharmaceuticals | ||||||||||||||||||||||||||||||||||||||||||||||||||||||||
Dorado Acquisition, Inc. ( | — | — | — (##) | 6/30/2021 | — | — | % | |||||||||||||||||||||||||||||||||||||||||||||||||
Dorado Acquisition, Inc. ( | — | — | — (##) | 6/30/2021 | — | — | % | |||||||||||||||||||||||||||||||||||||||||||||||||
1
F-27
MONROE CAPITAL CORPORATION
CONSOLIDATED SCHEDULE OF INVESTMENTS - (continued)
December 31, 2022
(in thousands, except for shares and units)
Portfolio Company (˄) | Index (˄˄) | Spread (˄˄) | Interest Rate | Acquisition Date (˄˄˄) | Maturity | Principal | Amortized Cost | Fair Value (˄˄˄˄) | % of Net Assets (˄˄˄˄˄) | |||||||||||||||||||||||||||||||||||||||||||||||
NationsBenefits, LLC ( | n/a | n/a | 8/20/2021 | — | — | $ | $ | % | ||||||||||||||||||||||||||||||||||||||||||||||||
NationsBenefits, LLC ( | — | — | — (##) | 8/20/2021 | — | — | % | |||||||||||||||||||||||||||||||||||||||||||||||||
NQ PE Project Colosseum Midco Inc. ( | — | — | — (##) | 10/4/2022 | — | — | % | |||||||||||||||||||||||||||||||||||||||||||||||||
Seran BioScience, LLC ( | — | — | — (##) | 12/31/2020 | — | — | % | |||||||||||||||||||||||||||||||||||||||||||||||||
| % | ||||||||||||||||||||||||||||||||||||||||||||||||||||||||
| High Tech Industries | ||||||||||||||||||||||||||||||||||||||||||||||||||||||||
Amelia Holding II, LLC (warrant to purchase up to | — | — | — (##) | 12/21/2022 | 12/21/2032 | — | % | |||||||||||||||||||||||||||||||||||||||||||||||||
Drawbridge Partners, LLC ( | — | — | — (##) | 9/1/2022 | — | — | % | |||||||||||||||||||||||||||||||||||||||||||||||||
MarkLogic Corporation ( | — | — | — (##) | 10/20/2020 | — | — | % | |||||||||||||||||||||||||||||||||||||||||||||||||
Planful, Inc. ( | n/a | n/a | 12/28/2018 | — | — | % | ||||||||||||||||||||||||||||||||||||||||||||||||||
Recorded Future, Inc. ( | — | — | — (##) | 7/3/2019 | — | — | % | |||||||||||||||||||||||||||||||||||||||||||||||||
| % | ||||||||||||||||||||||||||||||||||||||||||||||||||||||||
| Hotels, Gaming & Leisure | ||||||||||||||||||||||||||||||||||||||||||||||||||||||||
Equine Network, LLC ( | — | — | — (##) | 12/31/2020 | — | — | % | |||||||||||||||||||||||||||||||||||||||||||||||||
| % | ||||||||||||||||||||||||||||||||||||||||||||||||||||||||
| Media: Advertising, Printing & Publishing | ||||||||||||||||||||||||||||||||||||||||||||||||||||||||
AdTheorent Holding Company, Inc. ( | — | — | — (##) | 12/22/2016 | — | — | % | |||||||||||||||||||||||||||||||||||||||||||||||||
InMobi Pte, Ltd. (warrant to purchase up to | — | — | — (##) | 9/18/2015 | 9/18/2025 | — | % | |||||||||||||||||||||||||||||||||||||||||||||||||
Relevate Health Group, LLC ( | n/a | n/a | 11/20/2020 | — | — | % | ||||||||||||||||||||||||||||||||||||||||||||||||||
Relevate Health Group, LLC ( | — | — | — (##) | 11/20/2020 | — | — | % | |||||||||||||||||||||||||||||||||||||||||||||||||
Spherix Global Inc. ( | — | — | — (##) | 12/22/2021 | — | — | % | |||||||||||||||||||||||||||||||||||||||||||||||||
XanEdu Publishing, Inc. ( | n/a | n/a | 1/28/2020 | — | — | % | ||||||||||||||||||||||||||||||||||||||||||||||||||
| % | ||||||||||||||||||||||||||||||||||||||||||||||||||||||||
| Media: Diversified & Production | ||||||||||||||||||||||||||||||||||||||||||||||||||||||||
Attom Intermediate Holdco, LLC ( | — | — | — (##) | 1/4/2019 | — | — | % | |||||||||||||||||||||||||||||||||||||||||||||||||
Chess.com, LLC (2 Class A units) (####) | — | — | — (##) | 12/31/2021 | — | — | % | |||||||||||||||||||||||||||||||||||||||||||||||||
| % | ||||||||||||||||||||||||||||||||||||||||||||||||||||||||
| Retail | ||||||||||||||||||||||||||||||||||||||||||||||||||||||||
BLST Operating Company, LLC ( | — | — | — (##) | 8/28/2020 | — | — | % | |||||||||||||||||||||||||||||||||||||||||||||||||
Forman Mills, Inc. (warrant to purchase up to | — | — | — (##) | 1/14/2020 | 1/14/2029 | — | % | |||||||||||||||||||||||||||||||||||||||||||||||||
Luxury Optical Holdings Co. (h) | n/a | n/a | n/a (##) | 9/12/2014 | — | — | % | |||||||||||||||||||||||||||||||||||||||||||||||||
| % | ||||||||||||||||||||||||||||||||||||||||||||||||||||||||
| Services: Business | ||||||||||||||||||||||||||||||||||||||||||||||||||||||||
APCO Worldwide, Inc. ( | — | — | — (##) | 11/1/2017 | — | — | % | |||||||||||||||||||||||||||||||||||||||||||||||||
| % | ||||||||||||||||||||||||||||||||||||||||||||||||||||||||
| Services: Consumer | ||||||||||||||||||||||||||||||||||||||||||||||||||||||||
Education Corporation of America - Series G Preferred Stock ( | n/a | n/a | 9/3/2015 | — | — | % | ||||||||||||||||||||||||||||||||||||||||||||||||||
Express Wash Acquisition Company, LLC ( | n/a | n/a | 12/28/2020 | — | — | % | ||||||||||||||||||||||||||||||||||||||||||||||||||
IDIG Parent, LLC ( | — | — | — (##) | 1/4/2021 | — | — | % | |||||||||||||||||||||||||||||||||||||||||||||||||
Kar Wash Holdings, LLC ( | — | — | — (##) | 2/28/2022 | — | — | % | |||||||||||||||||||||||||||||||||||||||||||||||||
| % | ||||||||||||||||||||||||||||||||||||||||||||||||||||||||
| Telecommunications | ||||||||||||||||||||||||||||||||||||||||||||||||||||||||
American Broadband and Telecommunications Company LLC (warrant to purchase up to | — | — | — (##) | 6/10/2022 | 6/10/2032 | — | % | |||||||||||||||||||||||||||||||||||||||||||||||||
| % | ||||||||||||||||||||||||||||||||||||||||||||||||||||||||
F-28
MONROE CAPITAL CORPORATION
CONSOLIDATED SCHEDULE OF INVESTMENTS - (continued)
December 31, 2022
(in thousands, except for shares and units)
Portfolio Company (˄) | Index (˄˄) | Spread (˄˄) | Interest Rate | Acquisition Date (˄˄˄) | Maturity | Principal | Amortized Cost | Fair Value (˄˄˄˄) | % of Net Assets (˄˄˄˄˄) | |||||||||||||||||||||||||||||||||||||||||||||||
| Wholesale | ||||||||||||||||||||||||||||||||||||||||||||||||||||||||
Nearly Natural, Inc. ( | — | — | — (##) | 12/15/2017 | — | — | $ | $ | % | |||||||||||||||||||||||||||||||||||||||||||||||
Nearly Natural, Inc. ( | — | — | — (##) | 8/27/2021 | — | — | % | |||||||||||||||||||||||||||||||||||||||||||||||||
| % | ||||||||||||||||||||||||||||||||||||||||||||||||||||||||
| Total Non-Controlled/Non-Affiliate Equity Securities | % | |||||||||||||||||||||||||||||||||||||||||||||||||||||||
| Total Non-Controlled/Non-Affiliate Company Investments | % | |||||||||||||||||||||||||||||||||||||||||||||||||||||||
Non-Controlled Affiliate Company Investments (<<) | ||||||||||||||||||||||||||||||||||||||||||||||||||||||||
| Senior Secured Loans | ||||||||||||||||||||||||||||||||||||||||||||||||||||||||
| Beverage, Food & Tobacco | ||||||||||||||||||||||||||||||||||||||||||||||||||||||||
TJ Management HoldCo LLC (Revolver) (*) | L | % | % | 9/9/2020 | 6/28/2024 | % | ||||||||||||||||||||||||||||||||||||||||||||||||||
| % | ||||||||||||||||||||||||||||||||||||||||||||||||||||||||
| FIRE: Real Estate | ||||||||||||||||||||||||||||||||||||||||||||||||||||||||
| American Community Homes, Inc. | SF | % | 7/22/2014 | 12/31/2026 | % | |||||||||||||||||||||||||||||||||||||||||||||||||||
| American Community Homes, Inc. | SF | % | 7/22/2014 | 12/31/2026 | % | |||||||||||||||||||||||||||||||||||||||||||||||||||
| American Community Homes, Inc. | SF | % | 5/24/2017 | 12/31/2026 | % | |||||||||||||||||||||||||||||||||||||||||||||||||||
| American Community Homes, Inc. | SF | % | 8/10/2018 | 12/31/2026 | % | |||||||||||||||||||||||||||||||||||||||||||||||||||
| American Community Homes, Inc. | SF | % | 3/29/2019 | 12/31/2026 | % | |||||||||||||||||||||||||||||||||||||||||||||||||||
| American Community Homes, Inc. | SF | % | 9/30/2019 | 12/31/2026 | % | |||||||||||||||||||||||||||||||||||||||||||||||||||
| American Community Homes, Inc. | SF | % | 12/30/2019 | 12/31/2026 | % | |||||||||||||||||||||||||||||||||||||||||||||||||||
American Community Homes, Inc. (Revolver) (*) | SF | % | 3/30/2020 | 12/31/2026 | % | |||||||||||||||||||||||||||||||||||||||||||||||||||
HFZ Capital Group LLC (#) (j) | L | % | 10/20/2017 | n/a (e) | % | |||||||||||||||||||||||||||||||||||||||||||||||||||
HFZ Capital Group LLC (#) (j) | L | % | 10/20/2017 | n/a (e) | % | |||||||||||||||||||||||||||||||||||||||||||||||||||
MC Asset Management (Corporate), LLC (#) (j) | L | % | 1/26/2021 | 1/26/2024 | % | |||||||||||||||||||||||||||||||||||||||||||||||||||
MC Asset Management (Corporate), LLC (Delayed Draw) (*) (**) (#) (j) | L | % | 4/26/2021 | 1/26/2024 | % | |||||||||||||||||||||||||||||||||||||||||||||||||||
Second Avenue SFR Holdings II LLC (Revolver) (*) (#) | L | % | % | 8/11/2021 | 8/9/2024 | % | ||||||||||||||||||||||||||||||||||||||||||||||||||
| % | ||||||||||||||||||||||||||||||||||||||||||||||||||||||||
| Healthcare & Pharmaceuticals | ||||||||||||||||||||||||||||||||||||||||||||||||||||||||
| Ascent Midco, LLC | L | % | % | 2/5/2020 | 2/5/2025 | % | ||||||||||||||||||||||||||||||||||||||||||||||||||
Ascent Midco, LLC (Revolver) (*) | L | % | % | 2/5/2020 | 2/5/2025 | % | ||||||||||||||||||||||||||||||||||||||||||||||||||
| % | ||||||||||||||||||||||||||||||||||||||||||||||||||||||||
| High Tech Industries | ||||||||||||||||||||||||||||||||||||||||||||||||||||||||
| Mnine Holdings, Inc. | SF | % | 11/2/2018 | 12/30/2023 | % | |||||||||||||||||||||||||||||||||||||||||||||||||||
Mnine Holdings, Inc. (Revolver) (*) | SF | % | 8/9/2022 | 12/30/2023 | % | |||||||||||||||||||||||||||||||||||||||||||||||||||
| % | ||||||||||||||||||||||||||||||||||||||||||||||||||||||||
| Services: Business | ||||||||||||||||||||||||||||||||||||||||||||||||||||||||
C Parent Holdings, LLC. (fka Curion Holdings, LLC) (k) | n/a | n/a | n/a | 5/2/2017 | n/a (e) | % | ||||||||||||||||||||||||||||||||||||||||||||||||||
| % | ||||||||||||||||||||||||||||||||||||||||||||||||||||||||
| Services: Consumer | ||||||||||||||||||||||||||||||||||||||||||||||||||||||||
NECB Collections, LLC (Revolver) (*) | L | % | 6/25/2019 | n/a (e) | % | |||||||||||||||||||||||||||||||||||||||||||||||||||
| % | ||||||||||||||||||||||||||||||||||||||||||||||||||||||||
| Total Non-Controlled Affiliate Senior Secured Loans | % | |||||||||||||||||||||||||||||||||||||||||||||||||||||||
| Junior Secured Loans | ||||||||||||||||||||||||||||||||||||||||||||||||||||||||
| FIRE: Real Estate | ||||||||||||||||||||||||||||||||||||||||||||||||||||||||
SFR Holdco, LLC (#) | n/a | n/a | % | 8/6/2021 | 7/28/2028 | % | ||||||||||||||||||||||||||||||||||||||||||||||||||
| % | ||||||||||||||||||||||||||||||||||||||||||||||||||||||||
| Total Non-Controlled Affiliate Company Junior Secured Loans | % | |||||||||||||||||||||||||||||||||||||||||||||||||||||||
F-29
MONROE CAPITAL CORPORATION
CONSOLIDATED SCHEDULE OF INVESTMENTS - (continued)
December 31, 2022
(in thousands, except for shares and units)
Portfolio Company (˄) | Index (˄˄) | Spread (˄˄) | Interest Rate | Acquisition Date (˄˄˄) | Maturity | Principal | Amortized Cost | Fair Value (˄˄˄˄) | % of Net Assets (˄˄˄˄˄) | |||||||||||||||||||||||||||||||||||||||||||||||
Equity Securities (<<) (###) | ||||||||||||||||||||||||||||||||||||||||||||||||||||||||
| Beverage, Food & Tobacco | ||||||||||||||||||||||||||||||||||||||||||||||||||||||||
TJ Management HoldCo LLC ( | — | — | — (##) | 9/9/2020 | — | — | $ | $ | % | |||||||||||||||||||||||||||||||||||||||||||||||
| % | ||||||||||||||||||||||||||||||||||||||||||||||||||||||||
| FIRE: Real Estate | ||||||||||||||||||||||||||||||||||||||||||||||||||||||||
American Community Homes, Inc. ( | — | — | — (##) | 12/29/2022 | — | — | % | |||||||||||||||||||||||||||||||||||||||||||||||||
MC Asset Management (Corporate), LLC ( | — | — | — (##) | 6/11/2019 | — | — | % | |||||||||||||||||||||||||||||||||||||||||||||||||
SFR Holdco, LLC ( | — | — | — (##) | 8/6/2021 | — | — | % | |||||||||||||||||||||||||||||||||||||||||||||||||
| % | ||||||||||||||||||||||||||||||||||||||||||||||||||||||||
| Healthcare & Pharmaceuticals | ||||||||||||||||||||||||||||||||||||||||||||||||||||||||
Ascent Midco, LLC ( | n/a | n/a | 2/5/2020 | — | — | % | ||||||||||||||||||||||||||||||||||||||||||||||||||
Familia Dental Group Holdings, LLC ( | — | — | — (##) | 4/8/2016 | — | — | % | |||||||||||||||||||||||||||||||||||||||||||||||||
| % | ||||||||||||||||||||||||||||||||||||||||||||||||||||||||
| High Tech Industries | ||||||||||||||||||||||||||||||||||||||||||||||||||||||||
Mnine Holdings, Inc. ( | — | — | — (##) | 6/30/2020 | — | — | % | |||||||||||||||||||||||||||||||||||||||||||||||||
| $ | $ | % | ||||||||||||||||||||||||||||||||||||||||||||||||||||||
| Services: Business | ||||||||||||||||||||||||||||||||||||||||||||||||||||||||
C Parent Holdings, LLC. (fka Curion Holdings, LLC) ( | — | — | — (##) | 8/17/2018 | — | — | % | |||||||||||||||||||||||||||||||||||||||||||||||||
| % | ||||||||||||||||||||||||||||||||||||||||||||||||||||||||
| Services: Consumer | ||||||||||||||||||||||||||||||||||||||||||||||||||||||||
NECB Collections, LLC ( | — | — | — (##) | 6/21/2019 | — | — | % | |||||||||||||||||||||||||||||||||||||||||||||||||
| % | ||||||||||||||||||||||||||||||||||||||||||||||||||||||||
| Total Non-Controlled Affiliate Equity Securities | % | |||||||||||||||||||||||||||||||||||||||||||||||||||||||
| Total Non-Controlled Affiliate Company Investments | $ | $ | % | |||||||||||||||||||||||||||||||||||||||||||||||||||||
Controlled Affiliate Company Investments (<<<) | ||||||||||||||||||||||||||||||||||||||||||||||||||||||||
| Equity Securities | ||||||||||||||||||||||||||||||||||||||||||||||||||||||||
| Investment Funds & Vehicles | ||||||||||||||||||||||||||||||||||||||||||||||||||||||||
MRCC Senior Loan Fund I, LLC ( | — | — | — | 10/31/2017 | — | — | $ | $ | % | |||||||||||||||||||||||||||||||||||||||||||||||
| Total Controlled Affiliate Equity Securities | % | |||||||||||||||||||||||||||||||||||||||||||||||||||||||
| Total Controlled Affiliate Company Investments | $ | $ | % | |||||||||||||||||||||||||||||||||||||||||||||||||||||
| TOTAL INVESTMENTS | $ | $ | % | |||||||||||||||||||||||||||||||||||||||||||||||||||||
F-30
MONROE CAPITAL CORPORATION
CONSOLIDATED SCHEDULE OF INVESTMENTS - (continued)
December 31, 2022
(in thousands, except for shares and units)
Derivative Instruments
Foreign currency forward contracts
| Description | Notional Amount to be Purchased | Notional Amount to be Sold | Counterparty | Settlement Date | Unrealized Gain (Loss) | |||||||||||||||||||||||||||
| Foreign currency forward contract | $ | AUD | Bannockburn Global Forex, LLC | 1/18/2023 | $ | |||||||||||||||||||||||||||
| Foreign currency forward contract | $ | AUD | Bannockburn Global Forex, LLC | 2/16/2023 | ||||||||||||||||||||||||||||
| Foreign currency forward contract | $ | AUD | Bannockburn Global Forex, LLC | 3/16/2023 | ||||||||||||||||||||||||||||
| Foreign currency forward contract | $ | AUD | Bannockburn Global Forex, LLC | 4/20/2023 | ||||||||||||||||||||||||||||
| Foreign currency forward contract | $ | AUD | Bannockburn Global Forex, LLC | 5/16/2023 | ||||||||||||||||||||||||||||
| Foreign currency forward contract | $ | AUD | Bannockburn Global Forex, LLC | 6/19/2023 | ||||||||||||||||||||||||||||
| Foreign currency forward contract | $ | AUD | Bannockburn Global Forex, LLC | 7/18/2023 | ||||||||||||||||||||||||||||
| Foreign currency forward contract | $ | AUD | Bannockburn Global Forex, LLC | 8/16/2023 | ||||||||||||||||||||||||||||
| Foreign currency forward contract | $ | AUD | Bannockburn Global Forex, LLC | 9/18/2023 | ||||||||||||||||||||||||||||
| Foreign currency forward contract | $ | AUD | Bannockburn Global Forex, LLC | 10/18/2023 | ||||||||||||||||||||||||||||
| Foreign currency forward contract | $ | AUD | Bannockburn Global Forex, LLC | 11/16/2023 | ||||||||||||||||||||||||||||
| Foreign currency forward contract | $ | AUD | Bannockburn Global Forex, LLC | 12/18/2023 | ||||||||||||||||||||||||||||
| Foreign currency forward contract | $ | AUD | Bannockburn Global Forex, LLC | 1/17/2024 | ||||||||||||||||||||||||||||
| Foreign currency forward contract | $ | AUD | Bannockburn Global Forex, LLC | 2/16/2024 | ||||||||||||||||||||||||||||
| Foreign currency forward contract | $ | AUD | Bannockburn Global Forex, LLC | 3/18/2024 | ||||||||||||||||||||||||||||
| $ | ||||||||||||||||||||||||||||||||
______________________________________________________________
(˄) All of the Company's investments are issued by eligible portfolio companies, as defined in the Investment Company Act of 1940 (the “1940 Act”), unless otherwise noted. All of the Company's investments are issued by U.S. portfolio companies unless otherwise noted.
(˄˄) The majority of the investments bear interest at a rate that may be determined by reference to the London Interbank Offered Rate (“LIBOR” or “L”), Prime Rate (“Prime” or “P”), or Secured Overnight Financing Rate ("SOFR" or "SF") which reset daily, monthly, quarterly, or semiannually. For each such investment, the Company has provided the spread over LIBOR, Prime, or SOFR and the current contractual interest rate in effect at December 31, 2022 . Certain investments may be subject to an interest rate floor or rate cap. Certain investments contain a Payment-in-Kind (“PIK”) provision.
(˄˄˄) Except as otherwise noted, all of the Company’s portfolio company investments, which as of December 31, 2022. represented 240.4 % of the Company’s net assets or 95.8 % of the Company’s total assets, are subject to legal restrictions on sales.
(˄˄˄˄) Because there is no readily available market value for these investments, the fair value of these investments is determined in good faith using significant unobservable inputs by the Valuation Designee. (See Note 4 in the accompanying notes to the consolidated financial statements.)
(˄˄˄˄˄)Percentages are based on net assets of $225,019 as of December 31, 2022.
(~) The Company structures its unitranche secured loans as senior secured loans. The Company obtains security interests in the assets of these portfolio companies that serve as collateral in support of the repayment of these loans. This collateral may take the form of first-priority liens on the assets of a portfolio company. Generally, the Company syndicates a “first out” portion of the loan to an investor and retains a "last out” portion of the loan, in which case the “first out” portion of the loan will generally receive priority with respect to payments of principal, interest and any other amounts due thereunder. Unitranche structures combine characteristics of traditional first lien senior secured as well as second lien and subordinated loans and the Company’s unitranche secured loans will expose the Company to the risks associated with second lien and subordinated loans and may limit the Company’s recourse or ability to recover collateral upon a portfolio company’s bankruptcy. Unitranche secured loans typically provide for moderate loan amortization in the initial years of the facility, with the majority of the amortization deferred until loan maturity. Unitranche secured loans generally allow the borrower to make a large lump sum payment of principal at the end of the loan term, and there is a risk of loss if the borrower is unable to pay the lump sum or refinance the amount owed at maturity. In many cases the Company, together with its affiliates, are the sole or majority lender of these unitranche secured loans, which can afford the Company additional influence with a borrower in terms of monitoring and, if necessary, remediation in the event of underperformance.
(<) Represents less than 5% ownership of the portfolio company’s voting securities.
F-31
MONROE CAPITAL CORPORATION
CONSOLIDATED SCHEDULE OF INVESTMENTS - (continued)
December 31, 2022
(in thousands, except for shares and units)
(<<) As defined in the 1940 Act, the Company is deemed to be an “Affiliated Person” of the portfolio company as it owns 5% or more of the portfolio company’s voting securities. See Note 5 in the accompanying notes to the consolidated financial statements for additional information on transactions in which the issuer was an Affiliated Person (but not a portfolio company that the Company is deemed to control).
(<<<) As defined in the 1940 Act, the Company is deemed to be both an “Affiliated Person” of and to “Control” this portfolio company as it owns more than 25% of the portfolio company’s voting securities. See Note 5 in the accompanying notes to the consolidated financial statements for additional information on transactions in which the issuer was both an Affiliated Person and a portfolio company that the Company is deemed to Control.
(#) This investment is treated as a non-qualifying investment under Section 55(a) of the 1940 Act. Under the 1940 Act, the Company may not acquire any non-qualifying asset unless, at the time the acquisition is made, qualifying assets represent at least 70 % of the Company’s total assets. As of December 31, 2022, non-qualifying assets totaled 24.7 % of the Company’s total assets.
(##) Represents a non-income producing security.
(###) Ownership of certain equity investments may occur through a holding company or partnership.
(####) Investment is held by a taxable subsidiary of the Company. See Note 2 in the accompanying notes to the consolidated financial statements for additional information on the Company’s wholly-owned taxable subsidiaries.
(*) All or a portion of this commitment was unfunded at December 31, 2022. As such, interest is earned only on the funded portion of this commitment.
(**) This delayed draw loan requires that certain financial covenants be met by the portfolio company prior to any fundings.
(***) This position was on non-accrual status as of December 31, 2022, meaning that the Company has ceased accruing interest income on the position. See Note 2 in the accompanying notes to the consolidated financial statements for additional information on the Company’s accounting policies.
(a) This investment represents a note convertible to preferred shares of the borrower.
(b) This loan is denominated in Australian dollars and is translated into U.S. dollars as of the valuation date.
(c) This is an international company.
(d) During 2020, an arbitrator issued a final award in favor of the estate of Rockdale Blackhawk, LLC (the “Estate”) in the legal proceeding between the Estate and a national insurance carrier. The Company's share of the net proceeds from the award exceeded the contractual obligations due to the Company as a result of the Company’s right to receive excess proceeds pursuant to the terms of a sharing agreement between the lenders and the Estate. This investment is a non-income producing security.
(e) This is a demand note with no stated maturity.
(f) As of December 31, 2022, the Company was party to a subscription agreement with a commitment to fund an additional equity investment of $16 .
(g) The fair value of this investment was valued using Level 1 inputs. See Note 4 in the accompanying notes to the consolidated financial statements.
(h) During 2021, the Company sold its investment in Luxury Optical Holdings Co. The remaining fair value at December 31, 2022 represents the remaining expected escrow proceeds associated with the sale.
(i) As of December 31, 2022, the Company was party to a subscription agreement with a commitment to fund an equity investment of $43 .
(j) The Company restructured its investments in HFZ Capital Group LLC (“HFZ”) and HFZ Member RB portfolio, LLC (“Member RB”) during 2020. As part of the restructuring of HFZ, the Company obtained a 15.9 % equity interest in MC Asset Management (Corporate), LLC (“Corporate”). As part of the Member RB restructuring, the Company exchanged its loan in Member RB for a promissory note in MC Asset Management (Industrial), LLC (“Industrial”). Corporate owns 100 % of the equity of Industrial. In conjunction with these restructurings, the Company participated $4,758 of principal of its loan to HFZ as an equity contribution to Industrial. This participation did not qualify for sale accounting under ASC Topic 860–Transfers and Servicing because the sale did not meet the definition of a “participating interest”, as defined in the guidance, in order for sale treatment to be allowed. As a result, the Company continues to reflect its full investment in HFZ but has split the loan into two investments.
(k) During the year ended December 31, 2022, Curion Holdings, LLC (“Curion”) sold the underlying operating company and repaid the Company’s debt investment. The remaining fair value at December 31, 2022 represents the remaining expected escrow proceeds associated with the sale. The Company continues to hold an equity investment in Curion that is valued at zero at December 31, 2022. This investment is a non-income producing security.
(l) As of December 31, 2022, the Company was party to a subscription agreement with a commitment to fund an additional equity investment of $183 .
n/a - not applicable
F-32
MONROE CAPITAL CORPORATION
NOTES TO CONSOLIDATED FINANCIAL STATEMENTS
(in thousands, except share and per share data)
Note 1. Organization and Principal Business
Monroe Capital Corporation (together with its subsidiaries, the “Company”) is an externally managed, non-diversified, closed-end management investment company and has elected to be regulated as a business development company (“BDC”) under the Investment Company Act of 1940, as amended (the “1940 Act”). The Company’s investment objective is to maximize the total return to its stockholders in the form of current income and capital appreciation through investment in senior secured, junior secured and unitranche secured (a combination of senior secured and junior secured debt in the same facility in which the Company syndicates a “first out” portion of the loan to an investor and retains a “last out” portion of the loan) debt and, to a lesser extent, unsecured subordinated debt and equity co-investments in preferred and common stock and warrants. The Company is managed by Monroe Capital BDC Advisors, LLC (“MC Advisors”), a registered investment adviser under the Investment Advisers Act of 1940, as amended. In addition, for U.S. federal income tax purposes, the Company has elected to be treated as a regulated investment company (“RIC”) under Subchapter M of the Internal Revenue Code of 1986, as amended (the “Code”).
On February 28, 2014, the Company’s wholly-owned subsidiary, Monroe Capital Corporation SBIC, LP (“MRCC SBIC”), a Delaware limited partnership, received a license from the Small Business Administration (“SBA”) to operate as a Small Business Investment Company (“SBIC”) under Section 301(c) of the Small Business Investment Act of 1958, as amended. MRCC SBIC commenced operations on September 16, 2013. MRCC SBIC received approval from the SBA to surrender its SBIC license and on March 31, 2022, MRCC SBIC was dissolved. See Note 7 for additional information.
Note 2. Summary of Significant Accounting Policies
Basis of Presentation
Use of Estimates
The preparation of the consolidated financial statements in conformity with GAAP requires the Company to make estimates and assumptions that affect the reported amounts of assets and liabilities and the disclosure of contingent assets and liabilities as of the date of the consolidated financial statements and the reported amounts of revenue and expenses during the reporting period. Actual results could differ from those estimates.
Consolidation
F-33
Fair Value of Financial Instruments
The Company applies fair value to substantially all of its financial instruments in accordance with ASC Topic 820 — Fair Value Measurements and Disclosures (“ASC Topic 820”). ASC Topic 820 defines fair value, establishes a framework used to measure fair value, and requires disclosures for fair value measurements, including the categorization of financial instruments into a three-level hierarchy based on the transparency of valuation inputs. See Note 4 for further discussion regarding the fair value measurements and hierarchy.
ASC Topic 820 requires disclosure of the fair value of financial instruments for which it is practical to estimate such value. The Company believes that the carrying amounts of its other financial instruments such as cash, receivables and payables approximate the fair value of such items due to the short maturity of such instruments.
Revenue Recognition
The Company’s revenue recognition policies are as follows:
Investments and related investment income: Interest and dividend income is recorded on the accrual basis to the extent that the Company expects to collect such amounts. Interest income is accrued based upon the outstanding principal amount and contractual terms of debt and preferred equity investments. Interest is accrued on a daily basis. The Company records fees on loans based on the determination of whether the fee is considered a yield enhancement or payment for a service. If the fee is considered a yield enhancement associated with a funding of cash on a loan, the fee is generally deferred and recognized into interest income using the effective interest method if captured in the cost basis or using the straight-line method if the loan is unfunded and therefore there is no cost basis. If the fee is not considered a yield enhancement because a service was provided, and the fee is payment for that service, the fee is deemed earned and recognized as fee income in the period the service has been completed.
Dividend income on preferred equity securities is recorded as dividend income on an accrual basis to the extent that such amounts are payable by the portfolio company and are expected to be collected. Dividend income on common equity securities is recorded on the record date for private portfolio companies. Each distribution received from limited liability company (“LLC”) and limited partnership (“LP”) investments is evaluated to determine if the distribution should be recorded as dividend income or a return of capital. Generally, the Company will not record distributions from equity investments in LLCs and LPs as dividend income unless there are sufficient accumulated tax-basis earnings and profits in the LLC or LP prior to the applicable distribution. Distributions that are classified as a return of capital are recorded as a reduction in the cost basis of the investment. For the years ended December 31, 2023, 2022 and 2021, the Company received return of capital distributions from its equity investments of zero , $290 and $1,177 , respectively.
The Company has certain investments in its portfolio that contain a payment-in-kind (“PIK”) provision, which represents contractual interest or dividends that are added to the principal balance and recorded as income. The Company stops accruing PIK interest or PIK dividends when it is determined that PIK interest or PIK dividends are no longer collectible. To maintain RIC tax treatment, and to avoid incurring corporate U.S. federal income tax, substantially all of this income must be paid out to stockholders in the form of distributions, even though the Company has not yet collected the cash.
Loan origination fees, original issue discount and market discount or premiums are capitalized, and the Company then amortizes such amounts using the effective interest method as interest income over the life of the investment. Unamortized discounts and loan origination fees totaled $3,806 and $4,701 as of December 31, 2023 and 2022, respectively. Upfront loan origination and closing fees received for the years ended December 31, 2023, 2022 and 2021 totaled $1,116 , $3,475 and $3,752 , respectively. Upon the prepayment of a loan or debt security, any unamortized premium or discount or loan origination fees are recorded as interest income.
F-34
The components of the Company’s investment income were as follows:
| For the Years Ended December 31, | |||||||||||||||||
| 2023 | 2022 | 2021 | |||||||||||||||
| Interest income | $ | $ | $ | ||||||||||||||
| PIK interest income | |||||||||||||||||
Dividend income (1) | |||||||||||||||||
Fee income (2) | ( | ||||||||||||||||
| Prepayment gain (loss) | |||||||||||||||||
| Accretion of discounts and amortization of premiums | |||||||||||||||||
| Total investment income | $ | $ | $ | ||||||||||||||
______________________________________________________________
(1) Includes PIK dividends of $477 , $475 and $1,164 , respectively.
(2) Fee income for the year ended December 31, 2023 includes the reversal of $1,559 of previously accrued fee income associated with the Company's former loan investment in IT Global Holding, LLC.
Investment transactions are recorded on a trade-date basis. Realized gains or losses on portfolio investments are calculated based upon the difference between the net proceeds from the disposition and the amortized cost basis of the investment, without regard to unrealized gains or losses previously recognized. Realized gains and losses are recorded within net realized gain (loss) on investments on the consolidated statements of operations. Changes in the fair value of investments from the prior period, as determined through the application of the Company’s valuation policy, are included within net change in unrealized gain (loss) on investments on the consolidated statements of operations.
Distributions
Distributions to common stockholders are recorded on the applicable record date. The amount, if any, to be distributed to common stockholders is determined by the Board each quarter and is generally based upon the Company’s earnings estimated by management. Net realized capital gains, if any, are generally distributed at least annually.
The determination of the tax attributes for the Company’s distributions is made annually, based upon its taxable income for the full year and distributions paid for the full year. Ordinary dividend distributions from a RIC do not qualify for the preferential tax rate on qualified dividend income from domestic corporations and qualified foreign corporations, except to the extent that the RIC received the income in the form of qualifying dividends from domestic corporations and qualified foreign corporations. The tax attributes for distributions will generally include both ordinary income and capital gains, but may also include qualified dividends or return of capital.
F-35
Segments
In accordance with ASC Topic 280 — Segment Reporting, the Company has determined that it has a single reporting segment and operating unit structure.
Cash and Cash Equivalents
Cash, including cash denominated in foreign currencies, primarily consists of cash, money market funds and short-term, highly liquid investments with original maturities of three months or less. The Company deposits its cash in a financial institution and, at times, such balances may be in excess of the Federal Deposit Insurance Corporation insurance limits. The Company’s deposits are held in high-quality financial institutions and management believes that risk of loss with any uninsured balance is remote.
Unamortized Deferred Financing Costs
Offering Costs
Offering costs include, among other things, fees paid in relation to legal, accounting, regulatory and printing work completed in preparation of debt and equity offerings. Offering costs from equity offerings are charged against the proceeds from the offering within the consolidated statements of changes in net assets. Offering costs from debt offerings are reclassified to unamortized deferred financing costs on the consolidated statements of assets and liabilities as noted above. As of December 31, 2023 and 2022, other assets on the consolidated statements of assets and liabilities included $262 and $184 , respectively, of deferred offering costs, which will be charged against the proceeds from future debt or equity offerings when completed.
Investments Denominated in Foreign Currency
As of December 31, 2023, the Company held no investments denominated in foreign currency. As of December 31, 2022, the Company held investments in one portfolio company that was denominated in Australian dollars.
At each balance sheet date, portfolio company investments denominated in foreign currencies are translated into U.S. dollars using the spot exchange rate on the last business day of the period. Purchases and sales of foreign portfolio company investments, and any income from such investments, are translated into U.S. dollars using the rates of exchange prevailing on the respective dates of such transactions.
Although the fair values of foreign portfolio company investments and the fluctuation in such fair values are translated into U.S. dollars using the applicable foreign exchange rates described above, the Company does not isolate the portion of the change in fair value resulting from foreign currency exchange rates fluctuations from the change in fair value of the underlying investment. All fluctuations in fair value are included in net change in unrealized gain (loss) on investments on the Company’s consolidated statements of operations.
Investments denominated in foreign currencies and foreign currency transactions may involve certain consideration and risks not typically associated with those of domestic origin, including unanticipated movements in the value of the foreign currency relative to the U.S. dollar.
Derivative Instruments
The Company may enter into foreign currency forward contracts to reduce the Company’s exposure to foreign currency exchange rate fluctuations. In a foreign currency forward contract, the Company agrees to receive or deliver a fixed quantity of one currency for another, at a pre-determined price at a future date. Foreign currency forward contracts are marked-to-market based on the difference between the forward rate and the exchange rate at the current period end. Unrealized gain (loss) on foreign currency forward contracts is recorded on the Company’s consolidated statements of assets and liabilities by counterparty on a net basis.
F-36
The Company does not utilize hedge accounting and as such values its foreign currency forward contracts at fair value with the change in unrealized gain or loss recorded in net change in unrealized gain (loss) on foreign currency forward contracts and the realized gain or loss recorded in net realized gain (loss) on foreign currency forward contracts on the Company’s consolidated statements of operations.
Income Taxes
The Company has elected to be treated as a RIC under Subchapter M of the Code and operates in a manner so as to qualify for the tax treatment available to RICs. To maintain qualification as a RIC, the Company must, among other things, meet certain source-of-income and asset diversification requirements and distribute to stockholders, for each taxable year, at least 90% of the Company’s “investment company taxable income,” which is generally the Company’s net ordinary income plus the excess, if any, of realized net short-term capital gains over realized net long-term capital losses. If the Company qualifies as a RIC and satisfies the annual distribution requirement, the Company will not have to pay corporate-level federal income taxes on any income that the Company distributes to its stockholders. The Company intends to make distributions in an amount sufficient to maintain RIC status each year and to avoid any federal income taxes on income. The Company is also subject to nondeductible federal excise taxes if the Company does not distribute at least 98% of net ordinary income, 98.2% of any capital gain net income, if any, and any recognized and undistributed income from prior years for which it paid no federal income taxes. To the extent that the Company determines that its estimated current year annual taxable income may exceed estimated current year dividend distributions, the Company accrues excise tax, calculated as 4 % of the estimated excess taxable income, if any, as taxable income is earned. For the years ended December 31, 2023, 2022 and 2021, the Company recorded a net expense (benefit) on the consolidated statements of operations of $485 , $94 , and $278 , respectively, for U.S. federal excise tax. As of December 31, 2023 and 2022, the Company had payables for excise taxes of $247 and $1 , respectively, which were included in accounts payable and accrued expenses on the Company’s consolidated statements of assets and liabilities.
The Company’s consolidated Taxable Subsidiaries may be subject to U.S. federal and state corporate-level income taxes. For the years ended December 31, 2023, 2022 and 2021, the Company recorded a net tax expense of $321 , $1,311 and $4 , respectively, on the consolidated statements of operations for these subsidiaries. As of both December 31, 2023 and 2022, the Company did not
The Company accounts for income taxes in conformity with ASC Topic 740 — Income Taxes (“ASC Topic 740”). ASC Topic 740 provides guidelines for how uncertain tax positions should be recognized, measured, presented and disclosed in the consolidated financial statements. ASC Topic 740 requires the evaluation of tax positions taken in the course of preparing the Company’s tax returns to determine whether the tax positions are “more-likely-than-not” to be sustained by the applicable tax authority. Tax benefits of positions not deemed to meet the more-likely-than-not threshold would be recorded as a tax expense in the current year. It is the Company’s policy to recognize accrued interest and penalties related to uncertain tax benefits in income tax expense. The Company did not take any material uncertain income tax positions through December 31, 2023. The 2020 through 2023 tax years remain subject to examination by U.S. federal and state tax authorities.
Subsequent Events
The Company has evaluated the need for disclosures and/or adjustments resulting from subsequent events through the date the consolidated financial statements were issued. There have been no subsequent events that occurred during such period that would require disclosure in this Form 10-K or would be required to be recognized in the consolidated financial statements as of and for the year ended December 31, 2023, except as disclosed in Note 14.
Recent Accounting Pronouncements
In March 2020, the FASB issued ASU 2020-04, Reference Rate Reform (“ASU 2020-04”). The amendments in ASU 2020-04 provide optional expedients and exceptions for applying GAAP to contracts, hedging relationships, and other transactions affected by reference rate reform if certain criteria are met. The standard is effective as of March 12, 2020 through December 31, 2024. The Company did not utilize the optional expedients and exceptions provided by ASU 2020-04 during the year ended December 31, 2023.
F-37
Note 3. Investments
The following tables show the composition of the Company’s investment portfolio, at amortized cost and fair value (with corresponding percentage of total portfolio investments):
| December 31, 2023 | December 31, 2022 | ||||||||||||||||||||||
| Amortized Cost: | |||||||||||||||||||||||
| Senior secured loans | $ | $ | |||||||||||||||||||||
| Unitranche secured loans | |||||||||||||||||||||||
| Junior secured loans | |||||||||||||||||||||||
| LLC equity interest in SLF | |||||||||||||||||||||||
| Equity securities | |||||||||||||||||||||||
| Total | $ | $ | |||||||||||||||||||||
| December 31, 2023 | December 31, 2022 | ||||||||||||||||||||||
| Fair Value: | |||||||||||||||||||||||
| Senior secured loans | $ | $ | |||||||||||||||||||||
| Unitranche secured loans | |||||||||||||||||||||||
| Junior secured loans | |||||||||||||||||||||||
| LLC equity interest in SLF | |||||||||||||||||||||||
| Equity securities | |||||||||||||||||||||||
| Total | $ | % | $ | % | |||||||||||||||||||
The following tables show the composition of the Company’s investment portfolio by geographic region, at amortized cost and fair value (with corresponding percentage of total portfolio investments). The geographic composition is determined by the location of the corporate headquarters of the portfolio company, which may not be indicative of the primary source of the portfolio company’s business:
| December 31, 2023 | December 31, 2022 | ||||||||||||||||||||||
| Amortized Cost: | |||||||||||||||||||||||
| International | $ | % | $ | % | |||||||||||||||||||
| Midwest | |||||||||||||||||||||||
| Northeast | |||||||||||||||||||||||
| Southeast | |||||||||||||||||||||||
| Southwest | |||||||||||||||||||||||
| West | |||||||||||||||||||||||
| Total | $ | % | $ | % | |||||||||||||||||||
| December 31, 2023 | December 31, 2022 | ||||||||||||||||||||||
| Fair Value: | |||||||||||||||||||||||
| International | $ | $ | |||||||||||||||||||||
| Midwest | |||||||||||||||||||||||
| Northeast | |||||||||||||||||||||||
| Southeast | |||||||||||||||||||||||
| Southwest | |||||||||||||||||||||||
| West | |||||||||||||||||||||||
| Total | $ | $ | |||||||||||||||||||||
F-38
The following tables show the composition of the Company’s investment portfolio by industry, at amortized cost and fair value (with corresponding percentage of total portfolio investments):
| December 31, 2023 | December 31, 2022 | |||||||||||||||||||||||||
| Amortized Cost: | ||||||||||||||||||||||||||
| Aerospace & Defense | $ | $ | ||||||||||||||||||||||||
| Automotive | ||||||||||||||||||||||||||
| Banking | ||||||||||||||||||||||||||
| Beverage, Food & Tobacco | ||||||||||||||||||||||||||
| Capital Equipment | ||||||||||||||||||||||||||
| Chemicals, Plastics & Rubber | ||||||||||||||||||||||||||
| Construction & Building | ||||||||||||||||||||||||||
| Consumer Goods: Durable | ||||||||||||||||||||||||||
| Consumer Goods: Non-Durable | ||||||||||||||||||||||||||
| Environmental Industries | ||||||||||||||||||||||||||
| FIRE: Finance | ||||||||||||||||||||||||||
| FIRE: Real Estate | ||||||||||||||||||||||||||
| Healthcare & Pharmaceuticals | ||||||||||||||||||||||||||
| High Tech Industries | ||||||||||||||||||||||||||
| Hotels, Gaming & Leisure | ||||||||||||||||||||||||||
| Investment Funds & Vehicles | ||||||||||||||||||||||||||
| Media: Advertising, Printing & Publishing | ||||||||||||||||||||||||||
| Media: Broadcasting & Subscription | ||||||||||||||||||||||||||
| Media: Diversified & Production | ||||||||||||||||||||||||||
| Retail | ||||||||||||||||||||||||||
| Services: Business | ||||||||||||||||||||||||||
| Services: Consumer | ||||||||||||||||||||||||||
| Telecommunications | ||||||||||||||||||||||||||
| Wholesale | ||||||||||||||||||||||||||
| Total | $ | $ | ||||||||||||||||||||||||
F-39
| December 31, 2023 | December 31, 2022 | ||||||||||||||||||||||
| Fair Value: | |||||||||||||||||||||||
| Aerospace & Defense | $ | $ | |||||||||||||||||||||
| Automotive | |||||||||||||||||||||||
| Banking | |||||||||||||||||||||||
| Beverage, Food & Tobacco | |||||||||||||||||||||||
| Capital Equipment | |||||||||||||||||||||||
| Chemicals, Plastics & Rubber | |||||||||||||||||||||||
| Construction & Building | |||||||||||||||||||||||
| Consumer Goods: Durable | |||||||||||||||||||||||
| Consumer Goods: Non-Durable | |||||||||||||||||||||||
| Environmental Industries | |||||||||||||||||||||||
| FIRE: Finance | |||||||||||||||||||||||
| FIRE: Real Estate | |||||||||||||||||||||||
| Healthcare & Pharmaceuticals | |||||||||||||||||||||||
| High Tech Industries | |||||||||||||||||||||||
| Hotels, Gaming & Leisure | |||||||||||||||||||||||
| Investment Funds & Vehicles | |||||||||||||||||||||||
| Media: Advertising, Printing & Publishing | |||||||||||||||||||||||
| Media: Broadcasting & Subscription | |||||||||||||||||||||||
| Media: Diversified & Production | |||||||||||||||||||||||
| Retail | |||||||||||||||||||||||
| Services: Business | |||||||||||||||||||||||
| Services: Consumer | |||||||||||||||||||||||
| Telecommunications | |||||||||||||||||||||||
| Wholesale | |||||||||||||||||||||||
| Total | $ | $ | |||||||||||||||||||||
MRCC Senior Loan Fund I, LLC
The Company co-invests with Life Insurance Company of the Southwest (“LSW”) in senior secured loans through SLF, an unconsolidated Delaware LLC. SLF is capitalized as underlying investment transactions are completed, taking into account available debt and equity commitments available for funding these investments. All portfolio and investment decisions in respect to SLF must be approved by the SLF investment committee, consisting of one representative from the Company and one representative from LSW. SLF may cease making new investments upon notification of either member but operations will continue until all investments have been sold or paid-off in the normal course of business. Investments held by SLF are measured at fair value using the same valuation methodologies as described in Note 4. The Company’s investment is illiquid in nature as SLF does not allow for withdrawal from the LLC or the sale of a member’s interest unless approved by the board members of SLF. The full withdrawal of a member would result in an orderly wind-down of SLF.
SLF’s profits and losses are allocated to the Company and LSW in accordance with their respective ownership interests. As of both December 31, 2023 and 2022, the Company and LSW each owned 50.0 100,000 85,300
As of both December 31, 2023 and 2022, the Company had committed to fund $50,000 42,650
For the years ended December 31, 2023, 2022 and 2021, the Company received $3,600 , $3,600 and $4,325 of dividend income from its LLC equity interest in SLF, respectively.
F-40
SLF has a senior secured revolving credit facility (as amended, the “SLF Credit Facility”) with Capital One, N.A., through its wholly-owned subsidiary MRCC Senior Loan Fund I Financing SPV, LLC (“SLF SPV”). The SLF Credit Facility allows SLF SPV to borrow up to $110,000 , (reduced from $175,000 on June 9, 2023), subject to leverage and borrowing base restrictions. Borrowings on the SLF Credit Facility bear interest at an annual rate of SOFR (three-month) plus 2.10 % and the SLF Credit Facility has a maturity date of November 23, 2031.
SLF does not pay any fees to MC Advisors or its affiliates; however, SLF has entered into an administration agreement with Monroe Capital Management Advisors, LLC (“MC Management”), pursuant to which certain loan servicing and administrative functions are delegated to MC Management. SLF may reimburse MC Management for its allocable share of overhead and other expenses incurred by MC Management. For the years ended December 31, 2023, 2022 and 2021, SLF incurred $209 , $237 , and $211 , of allocable expenses, respectively. There are no agreements or understandings by which the Company guarantees any SLF obligations.
As of December 31, 2023 and 2022, SLF had total assets at fair value of $148,449 and $192,830 , respectively. As of December 31, 2023 and 2022, SLF had four and one portfolio company investments on non-accrual status with a fair value of $4,260 and $415 , respectively. The portfolio companies in SLF are in industries and geographies similar to those in which the Company may invest directly. Additionally, as of December 31, 2023 and 2022, SLF had $3,332 and $4,579 , respectively, in outstanding commitments to fund investments under undrawn revolvers and delayed draw commitments.
Below is a summary of SLF’s portfolio, followed by a listing of the individual investments in SLF’s portfolio as of December 31, 2023 and 2022:
| December 31, 2023 | December 31, 2022 | ||||||||||
Senior secured loans (1) | |||||||||||
Weighted average current interest rate on senior secured loans (2) | % | % | |||||||||
| Number of portfolio company investments in SLF | |||||||||||
Largest portfolio company investment (1) | |||||||||||
Total of five largest portfolio company investments (1) | |||||||||||
______________________________________________________________
(1) Represents outstanding principal amount, excluding unfunded commitments.
(2) Computed as the (a) annual stated interest rate on accruing senior secured loans divided by (b) total senior secured loans at outstanding principal amount.
F-41
Portfolio Company (a) | Index (b) | Spread(b) | Interest Rate (b) | Maturity | Principal | Fair Value | ||||||||||||||||||||||||||||||||
| Non-Controlled/Non-Affiliate Company Investments | ||||||||||||||||||||||||||||||||||||||
| Senior Secured Loans | ||||||||||||||||||||||||||||||||||||||
| Aerospace & Defense | ||||||||||||||||||||||||||||||||||||||
| Trident Maritime Systems, Inc. | SF | % | % | 2/26/2027 | $ | |||||||||||||||||||||||||||||||||
| Trident Maritime Systems, Inc. | SF | % | % | 2/26/2027 | ||||||||||||||||||||||||||||||||||
| Trident Maritime Systems, Inc. | SF | % | % | 2/26/2027 | ||||||||||||||||||||||||||||||||||
| Trident Maritime Systems, Inc. (Revolver) | SF | % | % | 2/26/2027 | ||||||||||||||||||||||||||||||||||
| Automotive | ||||||||||||||||||||||||||||||||||||||
| Accelerate Auto Works Intermediate, LLC | SF | % | % | 12/1/2027 | ||||||||||||||||||||||||||||||||||
| Accelerate Auto Works Intermediate, LLC | SF | % | % | 12/1/2027 | ||||||||||||||||||||||||||||||||||
Accelerate Auto Works Intermediate, LLC (Revolver) (d) | SF | % | % | 12/1/2027 | ||||||||||||||||||||||||||||||||||
| Truck-Lite Co., LLC | SF | % | % | 12/14/2026 | ||||||||||||||||||||||||||||||||||
| Truck-Lite Co., LLC | SF | % | % | 12/14/2026 | ||||||||||||||||||||||||||||||||||
| Truck-Lite Co., LLC | SF | % | % | 12/14/2026 | ||||||||||||||||||||||||||||||||||
| Beverage, Food & Tobacco | ||||||||||||||||||||||||||||||||||||||
| SW Ingredients Holdings, LLC | SF | % | % | 7/3/2025 | ||||||||||||||||||||||||||||||||||
| Capital Equipment | ||||||||||||||||||||||||||||||||||||||
| DS Parent, Inc. | SF | % | % | 12/8/2028 | ||||||||||||||||||||||||||||||||||
| MacQueen Equipment, LLC | SF | % | % | 1/7/2028 | ||||||||||||||||||||||||||||||||||
MacQueen Equipment, LLC (Delayed Draw) (d) | SF | % | % | 1/7/2028 | ||||||||||||||||||||||||||||||||||
MacQueen Equipment, LLC (Revolver) (d) | SF | % | % | 1/7/2028 | ||||||||||||||||||||||||||||||||||
| Chemicals, Plastics & Rubber | ||||||||||||||||||||||||||||||||||||||
| Phoenix Chemical Holding Company LLC | SF | % | % | 8/2/2024 | ||||||||||||||||||||||||||||||||||
| TJC Spartech Acquisition Corp. | SF | % | % | 5/5/2028 | ||||||||||||||||||||||||||||||||||
| Consumer Goods: Durable | ||||||||||||||||||||||||||||||||||||||
Elevate Textiles, Inc. (fka International Textile Group, Inc.) (e) | SF | % | % | 9/30/2027 | ||||||||||||||||||||||||||||||||||
| Runner Buyer INC. | SF | % | % | 10/23/2028 | ||||||||||||||||||||||||||||||||||
| Consumer Goods: Non-Durable | ||||||||||||||||||||||||||||||||||||||
| PH Beauty Holdings III, INC. | SF | % | % | 9/26/2025 | ||||||||||||||||||||||||||||||||||
| Containers, Packaging & Glass | ||||||||||||||||||||||||||||||||||||||
| Polychem Acquisition, LLC | SF | % | % | 3/17/2025 | ||||||||||||||||||||||||||||||||||
| PVHC Holding Corp | SF | % | 2/17/2027 | |||||||||||||||||||||||||||||||||||
| Energy: Oil & Gas | ||||||||||||||||||||||||||||||||||||||
| Offen, Inc. | SF | % | % | 6/22/2026 | ||||||||||||||||||||||||||||||||||
| Offen, Inc. | SF | % | % | 6/22/2026 | ||||||||||||||||||||||||||||||||||
F-42
MRCC SENIOR LOAN FUND I, LLC
CONSOLIDATED SCHEDULE OF INVESTMENTS - (continued)
December 31, 2023
Portfolio Company (a) | Index (b) | Spread(b) | Interest Rate (b) | Maturity | Principal | Fair Value | ||||||||||||||||||||||||||||||||
| FIRE: Finance | ||||||||||||||||||||||||||||||||||||||
| Harbour Benefit Holdings, Inc. | SF | % | % | 12/13/2024 | $ | |||||||||||||||||||||||||||||||||
| Harbour Benefit Holdings, Inc. | SF | % | % | 12/13/2024 | ||||||||||||||||||||||||||||||||||
| Minotaur Acquisition, Inc. | SF | % | % | 3/27/2026 | ||||||||||||||||||||||||||||||||||
| TEAM Public Choices, LLC | SF | % | % | 12/17/2027 | ||||||||||||||||||||||||||||||||||
| FIRE: Real Estate | ||||||||||||||||||||||||||||||||||||||
Avison Young (USA) Inc. (c)(e) | SF | % | % | 1/30/2026 | ||||||||||||||||||||||||||||||||||
| Healthcare & Pharmaceuticals | ||||||||||||||||||||||||||||||||||||||
Cano Health, LLC (e) | SF | % | % | 11/23/2027 | ||||||||||||||||||||||||||||||||||
| HAH Group Holding Company LLC | SF | % | % | 10/29/2027 | ||||||||||||||||||||||||||||||||||
| LSCS Holdings, Inc. | SF | % | % | 12/15/2028 | ||||||||||||||||||||||||||||||||||
| Natus Medical Incorporated | SF | % | % | 7/20/2029 | ||||||||||||||||||||||||||||||||||
| Paragon Healthcare, Inc. | SF | % | % | 1/19/2027 | ||||||||||||||||||||||||||||||||||
| Paragon Healthcare, Inc. | SF | % | % | 1/19/2027 | ||||||||||||||||||||||||||||||||||
Paragon Healthcare, Inc. (Revolver) (d) | SF | % | % | 1/19/2027 | ||||||||||||||||||||||||||||||||||
| Radiology Partners, Inc. | SF | % | % | 7/9/2025 | ||||||||||||||||||||||||||||||||||
| High Tech Industries | ||||||||||||||||||||||||||||||||||||||
Corel Inc. (c) | SF | % | % | 7/2/2026 | ||||||||||||||||||||||||||||||||||
| Lightbox Intermediate, L.P. | SF | % | % | 5/11/2026 | ||||||||||||||||||||||||||||||||||
| TGG TS Acquisition Company | SF | % | % | 12/12/2025 | ||||||||||||||||||||||||||||||||||
| Hotels, Gaming & Leisure | ||||||||||||||||||||||||||||||||||||||
| Excel Fitness Holdings, Inc. | SF | % | % | 4/27/2029 | ||||||||||||||||||||||||||||||||||
Excel Fitness Holdings, Inc. (Revolver) (d) | SF | % | % | 4/28/2028 | ||||||||||||||||||||||||||||||||||
| North Haven Spartan US Holdco, LLC | SF | % | % | 6/6/2025 | ||||||||||||||||||||||||||||||||||
| Tait LLC | SF | % | % | 3/28/2025 | ||||||||||||||||||||||||||||||||||
Tait LLC (Revolver) (d) | SF | % | % | 3/28/2025 | ||||||||||||||||||||||||||||||||||
| Media: Diversified & Production | ||||||||||||||||||||||||||||||||||||||
| Research Now Group, Inc. and Survey Sampling International, LLC | SF | % | % | 12/20/2024 | ||||||||||||||||||||||||||||||||||
| STATS Intermediate Holdings, LLC | SF | % | % | 7/10/2026 | ||||||||||||||||||||||||||||||||||
| TA TT Buyer, LLC | SF | % | % | 3/30/2029 | ||||||||||||||||||||||||||||||||||
| Services: Business | ||||||||||||||||||||||||||||||||||||||
| CHA Holdings, Inc | SF | % | % | 4/10/2025 | ||||||||||||||||||||||||||||||||||
| CHA Holdings, Inc | SF | % | % | 4/10/2025 | ||||||||||||||||||||||||||||||||||
| Eliassen Group, LLC | SF | % | % | 4/14/2028 | ||||||||||||||||||||||||||||||||||
Eliassen Group, LLC (Delayed Draw) (d) | SF | % | % | 4/14/2028 | ||||||||||||||||||||||||||||||||||
| Engage2Excel, Inc. | SF | % | % | 7/1/2024 | ||||||||||||||||||||||||||||||||||
| Engage2Excel, Inc. | SF | % | % | 7/1/2024 | ||||||||||||||||||||||||||||||||||
| Engage2Excel, Inc. (Revolver) | SF | % | % | 7/1/2024 | ||||||||||||||||||||||||||||||||||
Output Services Group, Inc. (e) | SF | % | % | 11/30/2028 | ||||||||||||||||||||||||||||||||||
| Secretariat Advisors LLC | SF | % | % | 12/29/2028 | ||||||||||||||||||||||||||||||||||
| Secretariat Advisors LLC | SF | % | % | 12/29/2028 | ||||||||||||||||||||||||||||||||||
| SIRVA Worldwide Inc. | SF | % | % | 8/4/2025 | ||||||||||||||||||||||||||||||||||
| Teneo Holdings LLC | SF | % | % | 7/11/2025 | ||||||||||||||||||||||||||||||||||
F-43
MRCC SENIOR LOAN FUND I, LLC
CONSOLIDATED SCHEDULE OF INVESTMENTS - (continued)
December 31, 2023
Portfolio Company (a) | Index (b) | Spread(b) | Interest Rate (b) | Maturity | Principal | Fair Value | ||||||||||||||||||||||||||||||||
| Services: Consumer | ||||||||||||||||||||||||||||||||||||||
| 360Holdco, Inc. | SF | % | % | 8/1/2025 | $ | |||||||||||||||||||||||||||||||||
| 360Holdco, Inc. | SF | % | % | 8/1/2025 | ||||||||||||||||||||||||||||||||||
| Laseraway Intermediate Holdings II, LLC | SF | % | % | 10/14/2027 | ||||||||||||||||||||||||||||||||||
| McKissock Investment Holdings, LLC | SF | % | % | 3/9/2029 | ||||||||||||||||||||||||||||||||||
| Telecommunications | ||||||||||||||||||||||||||||||||||||||
| Intermedia Holdings, Inc. | SF | % | % | 7/21/2025 | ||||||||||||||||||||||||||||||||||
| Mavenir Systems, Inc. | SF | % | % | 8/18/2028 | ||||||||||||||||||||||||||||||||||
| Sandvine Corporation | SF | % | % | 10/31/2025 | ||||||||||||||||||||||||||||||||||
| Transportation: Cargo | ||||||||||||||||||||||||||||||||||||||
| Keystone Purchaser, LLC | SF | % | % | 5/7/2027 | ||||||||||||||||||||||||||||||||||
| Utilities: Oil & Gas | ||||||||||||||||||||||||||||||||||||||
| Dresser Utility Solutions, LLC | SF | % | % | 10/1/2025 | ||||||||||||||||||||||||||||||||||
| Dresser Utility Solutions, LLC | SF | % | % | 10/1/2025 | ||||||||||||||||||||||||||||||||||
| Wholesale | ||||||||||||||||||||||||||||||||||||||
| HALO Buyer, Inc. | SF | % | % | 6/30/2025 | ||||||||||||||||||||||||||||||||||
| Total Non-Controlled/Non-Affiliate Senior Secured Loans | ||||||||||||||||||||||||||||||||||||||
Equity Securities (f) (g) | ||||||||||||||||||||||||||||||||||||||
| Consumer Goods: Durable | ||||||||||||||||||||||||||||||||||||||
Elevate Textiles, Inc. (fka International Textile Group, Inc.) ( | — | — | — | — | ||||||||||||||||||||||||||||||||||
| Chemicals, Plastics & Rubber | ||||||||||||||||||||||||||||||||||||||
Polyventive Lender Holding Company LLC ( | — | — | — | — | ||||||||||||||||||||||||||||||||||
| Services: Business | ||||||||||||||||||||||||||||||||||||||
Output Services Group, Inc. ( | — | — | — | — | ||||||||||||||||||||||||||||||||||
| Total Non-Controlled/Non-Affiliate Equities | ||||||||||||||||||||||||||||||||||||||
| TOTAL INVESTMENTS | $ | |||||||||||||||||||||||||||||||||||||
F-44
MRCC SENIOR LOAN FUND I, LLC
CONSOLIDATED SCHEDULE OF INVESTMENTS - (continued)
December 31, 2023
______________________________________________________________
(a)All investments are U.S. companies unless otherwise noted.
(b)The majority of investments bear interest at a rate that may be determined by reference to the Secured Overnight Financing Rate (“SOFR” or “SF”) or Prime (“P”) which reset daily, monthly, quarterly or semiannually. The Company has provided the spread over SOFR or Prime and the current contractual rate of interest in effect at December 31, 2023. Certain investments may be subject to an interest rate floor or cap. Certain investments contain a PIK provision.
(c)This is an international company.
(d)All or a portion of this commitment was unfunded as of December 31, 2023. As such, interest is earned only on the funded portion of this commitment. Principal reflects the commitment outstanding.
(e)This position was on non-accrual status as of December 31, 2023, meaning that we have ceased accruing interest income on the position.
(f)Represents less than 5% ownership of the portfolio company's voting securities.
F-45
Portfolio Company (a) | Index (b) | Spread(b) | Interest Rate (b) | Maturity | Principal | Fair Value | ||||||||||||||||||||||||||||||||
| Non-Controlled/Non-Affiliate Company Investments | ||||||||||||||||||||||||||||||||||||||
| Senior Secured Loans | ||||||||||||||||||||||||||||||||||||||
| Aerospace & Defense | ||||||||||||||||||||||||||||||||||||||
Bromford Industries Limited (c) | P | % | % | 11/5/2025 | $ | |||||||||||||||||||||||||||||||||
Bromford Industries Limited (c) | P | % | % | 11/5/2025 | ||||||||||||||||||||||||||||||||||
| Trident Maritime Systems, Inc. | L | % | % | 2/26/2027 | ||||||||||||||||||||||||||||||||||
| Trident Maritime Systems, Inc. | L | % | % | 2/26/2027 | ||||||||||||||||||||||||||||||||||
Trident Maritime Systems, Inc. (Revolver) (d) | L | % | % | 2/26/2027 | ||||||||||||||||||||||||||||||||||
| Automotive | ||||||||||||||||||||||||||||||||||||||
| Accelerate Auto Works Intermediate, LLC | L | % | % | 12/1/2027 | ||||||||||||||||||||||||||||||||||
Accelerate Auto Works Intermediate, LLC (Delayed Draw) (d) | L | % | % | 12/1/2027 | ||||||||||||||||||||||||||||||||||
Accelerate Auto Works Intermediate, LLC (Revolver) (d) | L | % | % | 12/1/2027 | ||||||||||||||||||||||||||||||||||
| Truck-Lite Co., LLC | SF | % | % | 12/14/2026 | ||||||||||||||||||||||||||||||||||
| Truck-Lite Co., LLC | SF | % | % | 12/14/2026 | ||||||||||||||||||||||||||||||||||
| Truck-Lite Co., LLC | SF | % | % | 12/14/2026 | ||||||||||||||||||||||||||||||||||
| Wheel Pros, Inc. | L | % | % | 5/11/2028 | ||||||||||||||||||||||||||||||||||
| Beverage, Food & Tobacco | ||||||||||||||||||||||||||||||||||||||
| CBC Restaurant Corp. | n/a | n/a | n/a | |||||||||||||||||||||||||||||||||||
| SW Ingredients Holdings, LLC | L | % | % | 7/3/2025 | ||||||||||||||||||||||||||||||||||
| Capital Equipment | ||||||||||||||||||||||||||||||||||||||
| Analogic Corporation | L | % | % | 6/24/2024 | ||||||||||||||||||||||||||||||||||
| DS Parent, Inc. | L | % | % | 12/8/2028 | ||||||||||||||||||||||||||||||||||
| MacQueen Equipment, LLC | L | % | % | 1/7/2028 | ||||||||||||||||||||||||||||||||||
MacQueen Equipment, LLC (Delayed Draw) (d) | L | % | % | 1/7/2028 | ||||||||||||||||||||||||||||||||||
MacQueen Equipment, LLC (Revolver) (d) | L | % | % | 1/7/2028 | ||||||||||||||||||||||||||||||||||
| Chemicals, Plastics & Rubber | ||||||||||||||||||||||||||||||||||||||
| Phoenix Chemical Holding Company LLC (fka Polymer Solutions Group) | L | % | % | 6/15/2023 | ||||||||||||||||||||||||||||||||||
| TJC Spartech Acquisition Corp. | L | % | % | 5/5/2028 | ||||||||||||||||||||||||||||||||||
| Construction & Building | ||||||||||||||||||||||||||||||||||||||
| The Cook & Boardman Group LLC | SF | % | % | 10/20/2025 | ||||||||||||||||||||||||||||||||||
| Consumer Goods: Durable | ||||||||||||||||||||||||||||||||||||||
| International Textile Group, Inc. | L | % | % | 5/1/2024 | ||||||||||||||||||||||||||||||||||
| Runner Buyer INC. | L | % | % | 10/23/2028 | ||||||||||||||||||||||||||||||||||
| Consumer Goods: Non-Durable | ||||||||||||||||||||||||||||||||||||||
| PH Beauty Holdings III, INC. | L | % | % | 9/26/2025 | ||||||||||||||||||||||||||||||||||
| Containers, Packaging & Glass | ||||||||||||||||||||||||||||||||||||||
| Liqui-Box Holdings, Inc. | L | % | % | 2/26/2027 | ||||||||||||||||||||||||||||||||||
| Polychem Acquisition, LLC | L | % | % | 3/17/2025 | ||||||||||||||||||||||||||||||||||
| PVHC Holding Corp | L | % | % | 8/5/2024 | ||||||||||||||||||||||||||||||||||
F-46
MRCC SENIOR LOAN FUND I, LLC
CONSOLIDATED SCHEDULE OF INVESTMENTS - (continued)
December 31, 2022
Portfolio Company (a) | Index (b) | Spread(b) | Interest Rate (b) | Maturity | Principal | Fair Value | ||||||||||||||||||||||||||||||||
| Energy: Oil & Gas | ||||||||||||||||||||||||||||||||||||||
| Drilling Info Holdings, Inc. | L | % | % | 7/30/2025 | $ | |||||||||||||||||||||||||||||||||
| Offen, Inc. | L | % | % | 6/22/2026 | ||||||||||||||||||||||||||||||||||
| Offen, Inc. | L | % | % | 6/22/2026 | ||||||||||||||||||||||||||||||||||
| FIRE: Finance | ||||||||||||||||||||||||||||||||||||||
| Harbour Benefit Holdings, Inc. | L | % | % | 12/13/2024 | ||||||||||||||||||||||||||||||||||
| Harbour Benefit Holdings, Inc. | L | % | % | 12/13/2024 | ||||||||||||||||||||||||||||||||||
| Minotaur Acquisition, Inc. | SF | % | % | 3/27/2026 | ||||||||||||||||||||||||||||||||||
| TEAM Public Choices, LLC | L | % | % | 12/17/2027 | ||||||||||||||||||||||||||||||||||
| FIRE: Real Estate | ||||||||||||||||||||||||||||||||||||||
| Avison Young (USA) Inc. (c) | SF | % | % | 1/30/2026 | ||||||||||||||||||||||||||||||||||
| Healthcare & Pharmaceuticals | ||||||||||||||||||||||||||||||||||||||
| Cano Health, LLC | SF | % | % | 11/23/2027 | ||||||||||||||||||||||||||||||||||
| HAH Group Holding Company LLC | SF | % | % | 10/29/2027 | ||||||||||||||||||||||||||||||||||
| LSCS Holdings, Inc. | L | % | % | 12/15/2028 | ||||||||||||||||||||||||||||||||||
| Natus Medical Incorporated | SF | % | % | 7/20/2029 | ||||||||||||||||||||||||||||||||||
| Paragon Healthcare, Inc. | SF | % | % | 1/19/2027 | ||||||||||||||||||||||||||||||||||
Paragon Healthcare, Inc. (Delayed Draw) (d) | SF | % | % | 1/19/2027 | ||||||||||||||||||||||||||||||||||
Paragon Healthcare, Inc. (Revolver) (d) | SF | % | % | 1/19/2027 | ||||||||||||||||||||||||||||||||||
| Radiology Partners, Inc. | L | % | % | 7/9/2025 | ||||||||||||||||||||||||||||||||||
| High Tech Industries | ||||||||||||||||||||||||||||||||||||||
Corel Inc. (c) | L | % | % | 7/2/2026 | ||||||||||||||||||||||||||||||||||
| Lightbox Intermediate, L.P. | L | % | % | 5/11/2026 | ||||||||||||||||||||||||||||||||||
| TGG TS Acquisition Company | L | % | % | 12/12/2025 | ||||||||||||||||||||||||||||||||||
| Hotels, Gaming & Leisure | ||||||||||||||||||||||||||||||||||||||
| Excel Fitness Holdings, Inc. | SF | % | % | 4/27/2029 | ||||||||||||||||||||||||||||||||||
Excel Fitness Holdings, Inc. (Revolver) (d) | SF | % | % | 4/28/2028 | ||||||||||||||||||||||||||||||||||
| North Haven Spartan US Holdco, LLC | SF | % | % | 6/6/2025 | ||||||||||||||||||||||||||||||||||
| Tait LLC | L | % | % | 3/28/2025 | ||||||||||||||||||||||||||||||||||
Tait LLC (Revolver) (d) | P | % | % | 3/28/2025 | ||||||||||||||||||||||||||||||||||
| Media: Advertising, Printing & Publishing | ||||||||||||||||||||||||||||||||||||||
| Cadent, LLC | L | % | % | 9/11/2025 | ||||||||||||||||||||||||||||||||||
Cadent, LLC (Revolver) (d) | L | % | % | 9/11/2025 | ||||||||||||||||||||||||||||||||||
| Media: Diversified & Production | ||||||||||||||||||||||||||||||||||||||
| Research Now Group, Inc. and Survey Sampling International, LLC | L | % | % | 12/20/2024 | ||||||||||||||||||||||||||||||||||
| STATS Intermediate Holdings, LLC | L | % | % | 7/10/2026 | ||||||||||||||||||||||||||||||||||
| TA TT Buyer, LLC | SF | % | % | 3/30/2029 | ||||||||||||||||||||||||||||||||||
F-47
MRCC SENIOR LOAN FUND I, LLC
CONSOLIDATED SCHEDULE OF INVESTMENTS - (continued)
December 31, 2022
Portfolio Company (a) | Index (b) | Spread(b) | Interest Rate (b) | Maturity | Principal | Fair Value | ||||||||||||||||||||||||||||||||
| Services: Business | ||||||||||||||||||||||||||||||||||||||
| AQ Carver Buyer, Inc. | L | % | % | 9/23/2025 | $ | |||||||||||||||||||||||||||||||||
| CHA Holdings, Inc | L | % | % | 4/10/2025 | ||||||||||||||||||||||||||||||||||
| CHA Holdings, Inc | L | % | % | 4/10/2025 | ||||||||||||||||||||||||||||||||||
| Eliassen Group, LLC | SF | % | % | 4/14/2028 | ||||||||||||||||||||||||||||||||||
Eliassen Group, LLC (Delayed Draw) (d) | SF | % | % | 4/14/2028 | ||||||||||||||||||||||||||||||||||
| Engage2Excel, Inc. | L | % | % | 3/7/2023 | ||||||||||||||||||||||||||||||||||
| Engage2Excel, Inc. | L | % | % | 3/7/2023 | ||||||||||||||||||||||||||||||||||
Engage2Excel, Inc. (Revolver) (d) | P | % | % | 3/7/2023 | ||||||||||||||||||||||||||||||||||
| Orbit Purchaser LLC | L | % | % | 10/21/2024 | ||||||||||||||||||||||||||||||||||
| Orbit Purchaser LLC | L | % | % | 10/21/2024 | ||||||||||||||||||||||||||||||||||
| Orbit Purchaser LLC | L | % | % | 10/21/2024 | ||||||||||||||||||||||||||||||||||
| Output Services Group, Inc. | SF | % | 6/29/2026 | |||||||||||||||||||||||||||||||||||
| Secretariat Advisors LLC | L | % | % | 12/29/2028 | ||||||||||||||||||||||||||||||||||
| Secretariat Advisors LLC | L | % | % | 12/29/2028 | ||||||||||||||||||||||||||||||||||
| SIRVA Worldwide Inc. | L | % | % | 8/4/2025 | ||||||||||||||||||||||||||||||||||
| Teneo Holdings LLC | SF | % | % | 7/11/2025 | ||||||||||||||||||||||||||||||||||
| The Kleinfelder Group, Inc. | L | % | % | 11/29/2024 | ||||||||||||||||||||||||||||||||||
| Services: Consumer | ||||||||||||||||||||||||||||||||||||||
| 360Holdco, Inc. | SF | % | % | 8/2/2025 | ||||||||||||||||||||||||||||||||||
360Holdco, Inc. (Delayed Draw) (d) | SF | % | % | 8/2/2025 | ||||||||||||||||||||||||||||||||||
| Laseraway Intermediate Holdings II, LLC | L | % | % | 10/14/2027 | ||||||||||||||||||||||||||||||||||
| McKissock Investment Holdings, LLC | SF | % | % | 3/9/2029 | ||||||||||||||||||||||||||||||||||
| Telecommunications | ||||||||||||||||||||||||||||||||||||||
| Intermedia Holdings, Inc. | L | % | % | 7/21/2025 | ||||||||||||||||||||||||||||||||||
| Mavenir Systems, Inc. | L | % | % | 8/18/2028 | ||||||||||||||||||||||||||||||||||
| Sandvine Corporation | L | % | % | 10/31/2025 | ||||||||||||||||||||||||||||||||||
| Transportation: Cargo | ||||||||||||||||||||||||||||||||||||||
| Keystone Purchaser, LLC | L | % | % | 5/7/2027 | ||||||||||||||||||||||||||||||||||
| Utilities: Oil & Gas | ||||||||||||||||||||||||||||||||||||||
| Dresser Utility Solutions, LLC (fka NGS US Finco, LLC) | L | % | % | 10/1/2025 | ||||||||||||||||||||||||||||||||||
| Dresser Utility Solutions, LLC (fka NGS US Finco, LLC) | L | % | % | 10/1/2025 | ||||||||||||||||||||||||||||||||||
| Wholesale | ||||||||||||||||||||||||||||||||||||||
| HALO Buyer, Inc. | L | % | % | 6/30/2025 | ||||||||||||||||||||||||||||||||||
| TOTAL INVESTMENTS | $ | |||||||||||||||||||||||||||||||||||||
F-48
MRCC SENIOR LOAN FUND I, LLC
CONSOLIDATED SCHEDULE OF INVESTMENTS - (continued)
December 31, 2022
______________________________________________________________
(a) All investments are U.S. companies unless otherwise noted.
(b) The majority of investments bear interest at a rate that may be determined by reference to the London Interbank Offered Rate (“LIBOR” or “L”), Secured Overnight Financing Rate (“SOFR” or “SF”) or Prime (“P”) which reset daily, monthly, quarterly or semiannually. The Company has provided the spread over LIBOR, SOFR or Prime and the current contractual rate of interest in effect at December 31, 2022. Certain investments may be subject to an interest rate floor or cap. Certain investments contain a PIK provision.
(c) This is an international company.
(d) All or a portion of this commitment was unfunded as of December 31, 2022. As such, interest is earned only on the funded portion of this commitment. Principal reflects the commitment outstanding.
(e) This position was on non-accrual status as of December 31, 2022, meaning that the Company has ceased accruing interest income on the position.
(f) This is a demand note with no stated maturity.
F-49
Below is certain summarized financial information for SLF as of December 31, 2023 and 2022 and for the years ended December 31, 2023, 2022 and 2021:
| December 31, 2023 | December 31, 2022 | ||||||||||
| Assets | |||||||||||
| Investments, at fair value | $ | $ | |||||||||
| Cash and cash equivalents | |||||||||||
| Restricted cash and cash equivalents | |||||||||||
| Interest receivable | |||||||||||
| Other assets | |||||||||||
| Total assets | $ | $ | |||||||||
| Liabilities | |||||||||||
| Revolving credit facility | |||||||||||
| Less: Unamortized deferred financing costs | ( | ( | |||||||||
| Total debt, less unamortized deferred financing costs | |||||||||||
| Interest payable | |||||||||||
| Accounts payable and accrued expenses | |||||||||||
| Total liabilities | |||||||||||
| Members’ capital | |||||||||||
| Total liabilities and members’ capital | $ | $ | |||||||||
| For the Years Ended December 31, | ||||||||||||||||||||
| 2023 | 2022 | 2021 | ||||||||||||||||||
| Investment income: | ||||||||||||||||||||
| Interest income | $ | $ | $ | |||||||||||||||||
| Total investment income | ||||||||||||||||||||
| Expenses: | ||||||||||||||||||||
| Interest and other debt financing expenses | ||||||||||||||||||||
| Professional fees | ||||||||||||||||||||
| Total expenses | ||||||||||||||||||||
| Net investment income | ||||||||||||||||||||
| Net gain (loss): | ||||||||||||||||||||
| Net realized gain (loss) | ( | ( | ||||||||||||||||||
| Net change in unrealized gain (loss) | ( | ( | ||||||||||||||||||
| Net gain (loss) | ( | ( | ||||||||||||||||||
| Net increase (decrease) in members’ capital | $ | $ | ( | $ | ||||||||||||||||
Note 4. Fair Value Measurements
Investments
The Company values all investments in accordance with ASC Topic 820. ASC Topic 820 requires enhanced disclosures about assets and liabilities that are measured and reported at fair value. As defined in ASC Topic 820, fair value is the price that would be received to sell an asset or paid to transfer a liability in an orderly transaction between market participants at the measurement date. Where available, fair value is based on observable market prices or parameters, or derived from such prices or parameters. Where observable prices or inputs are not available, valuation models are applied. These valuation models involve some level of management estimation and judgment, the degree of which is dependent on the price transparency for the assets or liabilities or market and the assets’ or liabilities’ complexity.
F-50
ASC Topic 820 establishes a hierarchical disclosure framework which prioritizes and ranks the level of market price observability of inputs used in measuring investments at fair value. Market price observability is affected by a number of factors, including the type of investment and the characteristics specific to the investment. Investments with readily available active quoted prices or for which fair value can be measured from actively quoted prices generally will have a higher degree of market price observability and a lesser degree of judgment used in measuring fair value.
Based on the observability of the inputs used in the valuation techniques, the Company is required to provide disclosures on fair value measurements according to the fair value hierarchy. The fair value hierarchy ranks the observability of the inputs used to determine fair values. Investments carried at fair value are classified and disclosed in one of the following three categories:
•Level 1 – Valuations based on unadjusted quoted prices in active markets for identical assets or liabilities at the measurement date.
•Level 2 – Valuations based on inputs other than quoted prices in active markets, including quoted prices for similar assets or liabilities, which are either directly or indirectly observable.
•Level 3 – Valuations based on inputs that are unobservable and significant to the overall fair value measurement. This includes situations where there is little, if any, market activity for the assets or liabilities. The inputs into the determination of fair value are based upon the best information available and may require significant management judgment or estimation.
In certain cases, the inputs used to measure fair value may fall into different levels of the fair value hierarchy. In such cases, an asset’s or liability’s categorization within the fair value hierarchy is based on the lowest level of input that is significant to the fair value measurement. The Company’s assessment of the significance of a particular input to the fair value measurement in its entirety requires judgment, and considers factors specific to the asset or liability.
For periods prior to September 30, 2022, the Board determined the fair value of the Company’s investments. On September 30, 2022, pursuant to SEC Rule 2a-5 of the 1940 Act, the Board designated MC Advisors as the Company’s valuation designee (the “Valuation Designee”). The Board is responsible for oversight of the Valuation Designee. The Valuation Designee has established a valuation committee to determine in good faith the fair value of the Company’s investments, based on input of the Valuation Designee’s management and personnel and independent valuation firms which are engaged at the direction of the valuation committee to assist in the valuation of certain portfolio investments lacking a readily available market quotation. The valuation committee determines fair values pursuant to a valuation policy approved by the Board and pursuant to a consistently applied valuation process.
With respect to investments for which market quotations are not readily available, the Valuation Designee undertakes a multi-step valuation process each quarter, as described below:
•the quarterly valuation process begins with each portfolio company or investment being initially evaluated and rated by the investment professionals of Valuation Designee responsible for the credit monitoring of the portfolio investment;
•the Valuation Designee engages an independent valuation firm to conduct independent appraisals of a selection of investments for which market quotations are not readily available. The Company will consult with an independent valuation firm relative to each portfolio company at least once in every calendar year, but the independent appraisals are generally received quarterly for each investment;
•to the extent an independent valuation firm is not engaged to conduct an investment appraisal on an investment for which market quotations are not readily available, the investment will be valued by the Valuation Designee;
•preliminary valuation conclusions are then documented and discussed with the valuation committee of the Valuation Designee;
•the valuation conclusions are approved by the valuation committee of the Valuation Designee; and
•a report prepared by the Valuation Designee is presented to the Board quarterly to allow the Board to perform its oversight duties of the valuation process and the Valuation Designee.
F-51
The accompanying consolidated schedules of investments held by the Company consist primarily of private debt instruments (“Level 3 debt”). The Company generally uses the income approach to determine fair value for Level 3 debt where market quotations are not readily available, as long as it is appropriate. If there is deterioration in credit quality or a debt investment is in workout status, the Company may consider other factors in determining the fair value, including the value attributable to the debt investment from the enterprise value of the portfolio company or the proceeds that would be received in a liquidation analysis. This liquidation analysis may include probability weighting of alternative outcomes. The Company generally considers its Level 3 debt to be performing if the borrower is not in default, the borrower is remitting payments in a timely manner; the loan is in covenant compliance or is otherwise not deemed to be impaired. In determining the fair value of the performing Level 3 debt, the Company considers fluctuations in current interest rates, the trends in yields of debt instruments with similar credit ratings, financial condition of the borrower, economic conditions and other relevant factors, both qualitative and quantitative. In the event that a Level 3 debt instrument is not performing, as defined above, the Company will evaluate the value of the collateral utilizing the same framework described above for a performing loan to determine the value of the Level 3 debt instrument.
Under the income approach, discounted cash flow models are utilized to determine the present value of the future cash flow streams of its debt investments, based on future interest and principal payments as set forth in the associated loan agreements. In determining fair value under the income approach, the Company also considers the following factors: applicable market yields and leverage levels, credit quality, prepayment penalties, the nature and realizable value of any collateral, the portfolio company’s ability to make payments, and changes in the interest rate environment and the credit markets that generally may affect the price at which similar investments may be made.
Under the market approach, the enterprise value methodology is typically utilized to determine the fair value of an investment. There is no one methodology to estimate enterprise value and, in fact, for any one portfolio company, enterprise value is generally best expressed as a range of values, from which the Company derives a single estimate of enterprise value. In estimating the enterprise value of a portfolio company, the Company analyzes various factors consistent with industry practice, including but not limited to original transaction multiples, the portfolio company’s historical and projected financial results, applicable market trading and transaction comparables, applicable market yields and leverage levels, the nature and realizable value of any collateral, the markets in which the portfolio company does business, and comparisons of financial ratios of peer companies that are public. Typically, the enterprise values of private companies are based on multiples of earnings before interest, income taxes, depreciation and amortization (“EBITDA”), cash flows, net income, revenues, or in limited cases, book value.
In addition, for certain debt investments, the Company may base its valuation on indicative bid and ask prices provided by an independent third-party pricing service. Bid prices reflect the highest price that the Company and others may be willing to pay. Ask prices represent the lowest price that the Company and others may be willing to accept. The Company generally uses the midpoint of the bid/ask range as its best estimate of fair value of such investment.
As of December 31, 2023, the Valuation Designee determined, in good faith, the fair value of the Company’s portfolio investments in accordance with GAAP and the Company’s valuation procedures based on the facts and circumstances known by the Company at that time, or reasonably expected to be known at that time.
Foreign Currency Forward Contracts
The valuation for the Company’s foreign currency forward contracts is based on the difference between the exchange rate associated with the forward contract and the exchange rate at the current period end. Foreign currency forward contracts are categorized as Level 2 in the fair value hierarchy.
F-52
Fair Value Disclosures
The following tables present fair value measurements of investments and foreign currency forward contracts, by major class according to the fair value hierarchy:
| Fair Value Measurements | |||||||||||||||||||||||
| December 31, 2023 | Level 1 | Level 2 | Level 3 | Total | |||||||||||||||||||
| Investments: | |||||||||||||||||||||||
| Senior secured loans | $ | $ | $ | $ | |||||||||||||||||||
| Unitranche secured loans | |||||||||||||||||||||||
| Junior secured loans | |||||||||||||||||||||||
| Equity securities | |||||||||||||||||||||||
Investments measured at NAV (1) (2) | — | — | — | ||||||||||||||||||||
| Total investments | $ | $ | $ | $ | |||||||||||||||||||
| Fair Value Measurements | |||||||||||||||||||||||
| December 31, 2022 | Level 1 | Level 2 | Level 3 | Total | |||||||||||||||||||
| Investments: | |||||||||||||||||||||||
| Senior secured loans | $ | $ | $ | $ | |||||||||||||||||||
| Unitranche secured loans | |||||||||||||||||||||||
| Junior secured loans | |||||||||||||||||||||||
| Equity securities | |||||||||||||||||||||||
Investments measured at NAV (1) (2) | — | — | — | ||||||||||||||||||||
| Total investments | $ | $ | $ | $ | |||||||||||||||||||
| Foreign currency forward contracts asset (liability) | $ | $ | $ | $ | |||||||||||||||||||
______________________________________________________________
(1) Certain investments that are measured at fair value using the NAV have not been categorized in the fair value hierarchy. The fair value amounts presented in this table are intended to permit reconciliation of the fair value hierarchy to the amounts presented on the consolidated statements of assets and liabilities.
(2) Represents the Company’s investment in LLC equity interests in SLF. The fair value of this investment has been determined using the NAV of the Company’s ownership interest in SLF’s members’ capital.
Senior secured loans, unitranche secured loans and junior secured loans are collateralized by tangible and intangible assets of the borrowers. These investments include loans to entities that have some level of challenge in obtaining financing from other, more conventional institutions, such as a bank. Interest rates on these loans are either fixed or floating, and are based on current market conditions and credit ratings of the borrower. Excluding loans on non-accrual, the contractual interest rates on the loans ranged from 7.47 % to 20.50 % at December 31, 2023 and 8.00 % to 19.50 % at December 31, 2022. The maturity dates on the loans outstanding at December 31, 2023 range between January 2024 and December 2029.
F-53
The following tables provide a reconciliation of the beginning and ending balances for investments at fair value that use Level 3 inputs for the years ended December 31, 2023 and 2022:
| Investments | |||||||||||||||||||||||||||||
| Senior Secured Loans | Unitranche Secured Loans | Junior Secured Loans | Equity Securities | Total Level 3 Investments | |||||||||||||||||||||||||
| Balance as of December 31, 2022 | $ | $ | $ | $ | $ | ||||||||||||||||||||||||
| ( | ( | ( | ( | ||||||||||||||||||||||||||
| ( | ( | ( | |||||||||||||||||||||||||||
Purchases of investments and other adjustments to cost (1) | |||||||||||||||||||||||||||||
Proceeds from principal payments and sales of investments (2) | ( | ( | ( | ( | ( | ||||||||||||||||||||||||
Reclassifications (3) | ( | ||||||||||||||||||||||||||||
| Balance as of December 31, 2023 | $ | $ | $ | $ | $ | ||||||||||||||||||||||||
| Investments | |||||||||||||||||||||||||||||
| Senior Secured Loans | Unitranche Secured Loans | Junior Secured Loans | Equity Securities | Total Level 3 Investments | |||||||||||||||||||||||||
| Balance as of December 31, 2021 | $ | $ | $ | $ | $ | ||||||||||||||||||||||||
| ( | ( | ( | ( | ||||||||||||||||||||||||||
| ( | ( | ( | ( | ||||||||||||||||||||||||||
Purchases of investments and other adjustments to cost (1) | |||||||||||||||||||||||||||||
Proceeds from principal payments and sales of investments (2) | ( | ( | ( | ( | |||||||||||||||||||||||||
| Balance as of December 31, 2022 | $ | $ | $ | $ | $ | ||||||||||||||||||||||||
_____________________________________________________________
(1) Includes purchases of new investments, effects of refinancing and restructurings, premium and discount accretion and amortization and PIK interest.
(2) Represents net proceeds from investments sold and principal paydowns received.
(3) Represents non-cash reclassification of investment type due to a restructuring.
The total net change in unrealized gain (loss) on investments included on the for the year ended December 31, 2023, attributable to Level 3 investments still held at December 31, 2023 was ($10,413 ). The total net change in unrealized gain (loss) on investments included on the for the year ended December 31, 2022, attributable to Level 3 investments still held at December 31, 2022 was ($15,399 ). Reclassifications impacting Level 3 of the fair value hierarchy are reported as transfers in or out of Level 3 as of the beginning of the period in which the reclassifications occur. There were no transfers among Levels 1, 2 and 3 during both the years ended December 31, 2023 and 2022.
Significant Unobservable Inputs
ASC Topic 820 requires disclosure of quantitative information about the significant unobservable inputs used in the valuation of assets and liabilities classified as Level 3 within the fair value hierarchy. Disclosure of this information is not required in circumstances where a valuation (unadjusted) is obtained from a third-party pricing service and the information regarding the unobservable inputs is not reasonably available to the Company and as such, the disclosures provided below exclude those investments valued in that manner. The tables below are not intended to be all-inclusive, but rather to provide information on significant unobservable inputs and valuation techniques used by the Company.
F-54
The valuation techniques and significant unobservable inputs used in recurring Level 3 fair value measurements of assets as of December 31, 2023 were as follows:
| Fair Value | Valuation Technique | Unobservable Input | Weighted Average Mean | Range | |||||||||||||||||||||||||||||||
Minimum | Maximum | ||||||||||||||||||||||||||||||||||
| Assets: | |||||||||||||||||||||||||||||||||||
| Senior secured loans | $ | Discounted cash flow | EBITDA multiples | ||||||||||||||||||||||||||||||||
| Market yields | |||||||||||||||||||||||||||||||||||
| Senior secured loans | Discounted cash flow | Revenue multiples | |||||||||||||||||||||||||||||||||
| Market yields | |||||||||||||||||||||||||||||||||||
| Senior secured loans | Enterprise value | Book value multiples | |||||||||||||||||||||||||||||||||
| Senior secured loans | Liquidation | Probability weighting of alternative outcomes | |||||||||||||||||||||||||||||||||
| Senior secured loans | Enterprise value | Revenue multiples | |||||||||||||||||||||||||||||||||
| Senior secured loans | Enterprise value | EBITDA multiples | |||||||||||||||||||||||||||||||||
| Unitranche secured loans | Discounted cash flow | Market yields | |||||||||||||||||||||||||||||||||
| Unitranche secured loans | Discounted cash flow | Revenue multiples | |||||||||||||||||||||||||||||||||
| Market yields | |||||||||||||||||||||||||||||||||||
| Junior secured loans | Discounted cash flow | Market yields | |||||||||||||||||||||||||||||||||
| Junior secured loans | Enterprise value | Revenue multiples | |||||||||||||||||||||||||||||||||
| Junior secured loans | Liquidation | Probability weighting of alternative outcomes | |||||||||||||||||||||||||||||||||
| Junior secured loans | Discounted cash flow | Revenue multiples | |||||||||||||||||||||||||||||||||
| Market yields | |||||||||||||||||||||||||||||||||||
| Equity securities | Enterprise value | EBITDA multiples | |||||||||||||||||||||||||||||||||
| Equity securities | Enterprise value | Revenue multiples | |||||||||||||||||||||||||||||||||
| Equity securities | Option pricing model | Volatility | |||||||||||||||||||||||||||||||||
| Equity securities | Discounted cash flow | EBITDA multiples | |||||||||||||||||||||||||||||||||
| Market yields | |||||||||||||||||||||||||||||||||||
| Total Level 3 Assets | $ | (1) | |||||||||||||||||||||||||||||||||
_____________________________________________________________
(1) Excludes investments of $1,040 at fair value where valuation (unadjusted) is obtained from a third-party pricing service or broker quote for which such disclosure is not required.
F-55
The valuation techniques and significant unobservable inputs used in recurring Level 3 fair value measurements of assets as of December 31, 2022 were as follows:
| Fair Value | Valuation Technique | Unobservable Input | Weighted Average Mean | Range | |||||||||||||||||||||||||||||||
Minimum | Maximum | ||||||||||||||||||||||||||||||||||
| Assets: | |||||||||||||||||||||||||||||||||||
| Senior secured loans | $ | Discounted cash flow | EBITDA multiples | ||||||||||||||||||||||||||||||||
| Market yields | |||||||||||||||||||||||||||||||||||
| Senior secured loans | Discounted cash flow | Revenue multiples | |||||||||||||||||||||||||||||||||
| Market yields | |||||||||||||||||||||||||||||||||||
| Senior secured loans | Enterprise value | Book value multiples | |||||||||||||||||||||||||||||||||
| Senior secured loans | Enterprise value | Revenue multiples | |||||||||||||||||||||||||||||||||
| Senior secured loans | Liquidation | Probability weighting of alternative outcomes | |||||||||||||||||||||||||||||||||
| Senior secured loans | Enterprise value | EBITDA multiples | |||||||||||||||||||||||||||||||||
| Unitranche secured loans | Discounted cash flow | EBITDA multiples | |||||||||||||||||||||||||||||||||
| Market yields | |||||||||||||||||||||||||||||||||||
| Unitranche secured loans | Discounted cash flow | Revenue multiples | |||||||||||||||||||||||||||||||||
| Market yields | |||||||||||||||||||||||||||||||||||
| Junior secured loans | Discounted cash flow | Market yields | |||||||||||||||||||||||||||||||||
| Junior secured loans | Liquidation | Probability weighting of alternative outcomes | |||||||||||||||||||||||||||||||||
| Equity securities | Enterprise value | EBITDA multiples | |||||||||||||||||||||||||||||||||
| Equity securities | Enterprise value | Revenue multiples | |||||||||||||||||||||||||||||||||
| Equity securities | Option pricing model | Volatility | |||||||||||||||||||||||||||||||||
| Equity securities | Discounted cash flow | EBITDA multiples | |||||||||||||||||||||||||||||||||
| Total Level 3 Assets | $ | (1) | |||||||||||||||||||||||||||||||||
_____________________________________________________________
(1) Excludes investments of $2,257 at fair value where valuation (unadjusted) is obtained from a third-party pricing service or broker quote for which such disclosure is not required.
F-56
The significant unobservable input used in the income approach of fair value measurement of the Company’s investments is the discount rate used to discount the estimated future cash flows expected to be received from the underlying investment, which include both future principal and interest payments. Increases (decreases) in the discount rate would result in a decrease (increase) in the fair value estimate of the investment. Included in the consideration and selection of discount rates are the following factors: risk of default, rating of the investment and comparable investments, and call provisions.
The significant unobservable inputs used in the market approach of fair value measurement of the Company’s investments are the market multiples of EBITDA or revenue of the comparable guideline public companies. The Company selects a population of public companies for each investment with similar operations and attributes of the portfolio company. Using these guideline public companies’ data, a range of multiples of enterprise value to EBITDA or revenue is calculated. The Company selects percentages from the range of multiples for purposes of determining the portfolio company’s estimated enterprise value based on said multiple and generally the latest twelve months EBITDA or revenue of the portfolio company (or other meaningful measure). Increases (decreases) in the multiple will result in an increase (decrease) in enterprise value, resulting in an increase (decrease) in the fair value estimate of the investment.
Other Financial Assets and Liabilities
F-57
Note 5. Transactions with Affiliated Companies
An affiliated company is a company in which the Company has an ownership interest of 5% or more of its voting securities. A controlled affiliate company is a company in which the Company has an ownership interest of more than 25% of its voting securities. Please see the Company’s consolidated schedule of investments for the type of investment, principal amount, interest rate including the spread, and the maturity date. Transactions related to the Company’s investments with affiliates for the years ended December 31, 2023 and 2022 were as follows:
| Fair value at December 31, 2022 | Transfers in (out) | Purchases (cost) | Sales and paydowns (cost) | PIK interest (cost) | Discount accretion | Net realized gain (loss) | Net unrealized gain (loss) | Fair value at December 31, 2023 | ||||||||||||||||||||||||||||||||||||||||||||||||
| Non-Controlled affiliate company investments: | ||||||||||||||||||||||||||||||||||||||||||||||||||||||||
| American Community Homes, Inc. | $ | $ | $ | $ | $ | $ | $ | $ | ( | $ | ||||||||||||||||||||||||||||||||||||||||||||||
| American Community Homes, Inc. | ( | |||||||||||||||||||||||||||||||||||||||||||||||||||||||
| American Community Homes, Inc. | ( | |||||||||||||||||||||||||||||||||||||||||||||||||||||||
| American Community Homes, Inc. | ( | |||||||||||||||||||||||||||||||||||||||||||||||||||||||
| American Community Homes, Inc. | ( | |||||||||||||||||||||||||||||||||||||||||||||||||||||||
| American Community Homes, Inc. | ( | |||||||||||||||||||||||||||||||||||||||||||||||||||||||
| American Community Homes, Inc. | ( | |||||||||||||||||||||||||||||||||||||||||||||||||||||||
| American Community Homes, Inc. (Revolver) | ||||||||||||||||||||||||||||||||||||||||||||||||||||||||
American Community Homes, Inc. ( | ||||||||||||||||||||||||||||||||||||||||||||||||||||||||
| ( | ||||||||||||||||||||||||||||||||||||||||||||||||||||||||
| Ascent Midco, LLC | ( | ( | ||||||||||||||||||||||||||||||||||||||||||||||||||||||
| Ascent Midco, LLC (Revolver) | ||||||||||||||||||||||||||||||||||||||||||||||||||||||||
Ascent Midco, LLC ( | ( | |||||||||||||||||||||||||||||||||||||||||||||||||||||||
| ( | ( | |||||||||||||||||||||||||||||||||||||||||||||||||||||||
| C Parent Holdings, LLC. | ( | |||||||||||||||||||||||||||||||||||||||||||||||||||||||
C Parent Holdings, LLC. ( | ||||||||||||||||||||||||||||||||||||||||||||||||||||||||
| ( | ||||||||||||||||||||||||||||||||||||||||||||||||||||||||
Familia Dental Group Holdings, LLC ( | ( | |||||||||||||||||||||||||||||||||||||||||||||||||||||||
| ( | ||||||||||||||||||||||||||||||||||||||||||||||||||||||||
| HFZ Capital Group LLC | ||||||||||||||||||||||||||||||||||||||||||||||||||||||||
| HFZ Capital Group LLC | ||||||||||||||||||||||||||||||||||||||||||||||||||||||||
| MC Asset Management (Corporate), LLC | ||||||||||||||||||||||||||||||||||||||||||||||||||||||||
| MC Asset Management (Corporate), LLC | ||||||||||||||||||||||||||||||||||||||||||||||||||||||||
MC Asset Management (Corporate), LLC ( | ( | |||||||||||||||||||||||||||||||||||||||||||||||||||||||
| Mnine Holdings, Inc. | ( | |||||||||||||||||||||||||||||||||||||||||||||||||||||||
| Mnine Holdings, Inc. | ( | |||||||||||||||||||||||||||||||||||||||||||||||||||||||
| Mnine Holdings, Inc. | ||||||||||||||||||||||||||||||||||||||||||||||||||||||||
| Mnine Holdings, Inc. (Revolver) | ( | |||||||||||||||||||||||||||||||||||||||||||||||||||||||
Mnine Holdings, Inc. ( | ||||||||||||||||||||||||||||||||||||||||||||||||||||||||
| ( | ( | |||||||||||||||||||||||||||||||||||||||||||||||||||||||
| NECB Collections, LLC (Revolver) | ||||||||||||||||||||||||||||||||||||||||||||||||||||||||
NECB Collections, LLC, LLC ( | ||||||||||||||||||||||||||||||||||||||||||||||||||||||||
Second Avenue SFR Holdings II LLC (Revolver) (3) | ( | |||||||||||||||||||||||||||||||||||||||||||||||||||||||
| ( | ||||||||||||||||||||||||||||||||||||||||||||||||||||||||
| SFR Holdco, LLC (Junior secured loan) | ( | |||||||||||||||||||||||||||||||||||||||||||||||||||||||
SFR Holdco, LLC ( | ||||||||||||||||||||||||||||||||||||||||||||||||||||||||
| TJ Management HoldCo LLC (Revolver) | ( | |||||||||||||||||||||||||||||||||||||||||||||||||||||||
TJ Management HoldCo LLC ( | ||||||||||||||||||||||||||||||||||||||||||||||||||||||||
| ( | ||||||||||||||||||||||||||||||||||||||||||||||||||||||||
| Total non-controlled affiliate company investments | $ | $ | $ | $ | ( | $ | $ | $ | $ | ( | $ | |||||||||||||||||||||||||||||||||||||||||||||
| Controlled affiliate company investments: | ||||||||||||||||||||||||||||||||||||||||||||||||||||||||
| MRCC Senior Loan Fund I, LLC | $ | $ | $ | $ | $ | $ | $ | $ | ( | $ | ||||||||||||||||||||||||||||||||||||||||||||||
| $ | $ | $ | $ | $ | $ | $ | $ | ( | $ | |||||||||||||||||||||||||||||||||||||||||||||||
| Total Controlled affiliate company investments | $ | $ | $ | $ | $ | $ | $ | $ | ( | $ | ||||||||||||||||||||||||||||||||||||||||||||||
F-58
| Fair value at December 31, 2021 | Transfers in (out) | Purchases (cost) | Sales and paydowns (cost) | PIK interest (cost) | Discount accretion | Net realized gain (loss) | Net unrealized gain (loss) | Fair value at December 31, 2022 | ||||||||||||||||||||||||||||||||||||||||||||||||
| Non-Controlled affiliate company investments: | ||||||||||||||||||||||||||||||||||||||||||||||||||||||||
| American Community Homes, Inc. | $ | $ | $ | $ | $ | $ | $ | $ | ( | $ | ||||||||||||||||||||||||||||||||||||||||||||||
| American Community Homes, Inc. | ( | |||||||||||||||||||||||||||||||||||||||||||||||||||||||
| American Community Homes, Inc. | ( | |||||||||||||||||||||||||||||||||||||||||||||||||||||||
| American Community Homes, Inc. | ( | |||||||||||||||||||||||||||||||||||||||||||||||||||||||
| American Community Homes, Inc. | ( | |||||||||||||||||||||||||||||||||||||||||||||||||||||||
| American Community Homes, Inc. | ( | |||||||||||||||||||||||||||||||||||||||||||||||||||||||
| American Community Homes, Inc. | ( | |||||||||||||||||||||||||||||||||||||||||||||||||||||||
| American Community Homes, Inc. (Revolver) | ||||||||||||||||||||||||||||||||||||||||||||||||||||||||
American Community Homes, Inc. ( | ||||||||||||||||||||||||||||||||||||||||||||||||||||||||
American Community Homes, Inc. (warrant to purchase up to | ( | |||||||||||||||||||||||||||||||||||||||||||||||||||||||
| ( | ||||||||||||||||||||||||||||||||||||||||||||||||||||||||
| Ascent Midco, LLC | ( | ( | ||||||||||||||||||||||||||||||||||||||||||||||||||||||
| Ascent Midco, LLC (Revolver) | ||||||||||||||||||||||||||||||||||||||||||||||||||||||||
Ascent Midco, LLC ( | ( | |||||||||||||||||||||||||||||||||||||||||||||||||||||||
| ( | ( | |||||||||||||||||||||||||||||||||||||||||||||||||||||||
| C Parent Holdings, LLC. (fka Curion Holdings, LLC) | ( | |||||||||||||||||||||||||||||||||||||||||||||||||||||||
| C Parent Holdings, LLC. (fka Curion Holdings, LLC) (Revolver) | ( | ( | ||||||||||||||||||||||||||||||||||||||||||||||||||||||
| C Parent Holdings, LLC. (fka Curion Holdings, LLC) (Junior secured loan) | ( | |||||||||||||||||||||||||||||||||||||||||||||||||||||||
| C Parent Holdings, LLC. (fka Curion Holdings, LLC) (Junior secured loan) | ||||||||||||||||||||||||||||||||||||||||||||||||||||||||
C Parent Holdings, LLC. (fka Curion Holdings, LLC) ( | ||||||||||||||||||||||||||||||||||||||||||||||||||||||||
| ( | ( | |||||||||||||||||||||||||||||||||||||||||||||||||||||||
Familia Dental Group Holdings, LLC ( | ||||||||||||||||||||||||||||||||||||||||||||||||||||||||
| HFZ Capital Group, LLC | ||||||||||||||||||||||||||||||||||||||||||||||||||||||||
| HFZ Capital Group, LLC | ||||||||||||||||||||||||||||||||||||||||||||||||||||||||
| MC Asset Management (Corporate), LLC | ||||||||||||||||||||||||||||||||||||||||||||||||||||||||
| MC Asset Management (Corporate), LLC (Delayed Draw) | ||||||||||||||||||||||||||||||||||||||||||||||||||||||||
MC Asset Management (Corporate), LLC ( | ||||||||||||||||||||||||||||||||||||||||||||||||||||||||
| Mnine Holdings, Inc. | ( | ( | ||||||||||||||||||||||||||||||||||||||||||||||||||||||
| Mnine Holdings, Inc. (Revolver) | ( | |||||||||||||||||||||||||||||||||||||||||||||||||||||||
Mnine Holdings, Inc. ( | ||||||||||||||||||||||||||||||||||||||||||||||||||||||||
| ( | ( | |||||||||||||||||||||||||||||||||||||||||||||||||||||||
| NECB Collections, LLC (Revolver) | ( | |||||||||||||||||||||||||||||||||||||||||||||||||||||||
NECB Collections, LLC, LLC ( | ||||||||||||||||||||||||||||||||||||||||||||||||||||||||
| ( | ||||||||||||||||||||||||||||||||||||||||||||||||||||||||
Second Avenue SFR Holdings II LLC (Revolver) (3) | ( | |||||||||||||||||||||||||||||||||||||||||||||||||||||||
| ( | ||||||||||||||||||||||||||||||||||||||||||||||||||||||||
| SFR Holdings, LLC (Junior secured loan) | ||||||||||||||||||||||||||||||||||||||||||||||||||||||||
SFR Holding, LLC ( | ||||||||||||||||||||||||||||||||||||||||||||||||||||||||
| TJ Management HoldCo, LLC (Revolver) | ||||||||||||||||||||||||||||||||||||||||||||||||||||||||
TJ Management HoldCo, LLC ( | ( | |||||||||||||||||||||||||||||||||||||||||||||||||||||||
| ( | ||||||||||||||||||||||||||||||||||||||||||||||||||||||||
| Total non-controlled affiliate company investments | $ | $ | $ | $ | ( | $ | $ | $ | ( | $ | ( | $ | ||||||||||||||||||||||||||||||||||||||||||||
| Controlled affiliate company investments: | ||||||||||||||||||||||||||||||||||||||||||||||||||||||||
| MRCC Senior Loan Fund I, LLC | $ | $ | $ | $ | $ | $ | $ | $ | ( | $ | ||||||||||||||||||||||||||||||||||||||||||||||
| ( | ||||||||||||||||||||||||||||||||||||||||||||||||||||||||
| Total Controlled affiliate company investments | $ | $ | $ | $ | $ | $ | $ | $ | ( | $ | ||||||||||||||||||||||||||||||||||||||||||||||
F-59
______________________________________________________________
(1) On December 29, 2022, the Company exercised the American Community Homes, Inc. (“ACH”) warrants held by the Company. The Company acquired 4,940 shares of ACH’s common stock, or 22.3 % of the equity, in exchange for a nominal exercise price in accordance with the terms of the warrant.
(2) During the year ended December 31, 2022, C Parent Holdings, LLC (fka Curion Holdings, LLC) (“Curion”) sold the underlying operating company and repaid the Company’s debt investment. The remaining fair value at December 31, 2022 represented the remaining expected escrow proceeds associated with the sale. During 2023, all expected proceeds associated with the sale were received. The Company no longer holds an equity investment in Curion as of December 31, 2023.
(3) Second Avenue SFR Holdings II LLC is a related entity to SFR Holdco, LLC and is being presented as a non-controlled affiliate for that reason.
F-60
| For the Years Ended December 31, | ||||||||||||||||||||||||||||||||||||||
| 2023 | 2022 | |||||||||||||||||||||||||||||||||||||
| Portfolio Company | Interest Income | Dividend Income | Fee Income | Interest Income | Dividend Income | Fee Income | ||||||||||||||||||||||||||||||||
| Non-controlled affiliate company investments: | ||||||||||||||||||||||||||||||||||||||
| American Community Homes, Inc. | $ | $ | $ | $ | $ | $ | ||||||||||||||||||||||||||||||||
| American Community Homes, Inc. | ||||||||||||||||||||||||||||||||||||||
| American Community Homes, Inc. | ||||||||||||||||||||||||||||||||||||||
| American Community Homes, Inc. | ||||||||||||||||||||||||||||||||||||||
| American Community Homes, Inc. | ||||||||||||||||||||||||||||||||||||||
| American Community Homes, Inc. | ||||||||||||||||||||||||||||||||||||||
| American Community Homes, Inc. | ||||||||||||||||||||||||||||||||||||||
| American Community Homes, Inc. (Revolver) | ||||||||||||||||||||||||||||||||||||||
| American Community Homes, Inc. (Common stock) | ||||||||||||||||||||||||||||||||||||||
| Ascent Midco, LLC | ||||||||||||||||||||||||||||||||||||||
| Ascent Midco, LLC (Revolver) | ||||||||||||||||||||||||||||||||||||||
| Ascent Midco, LLC (Class A units) | ||||||||||||||||||||||||||||||||||||||
| C Parent Holdings, LLC. | ||||||||||||||||||||||||||||||||||||||
| C Parent Holdings, LLC. (Revolver) | ||||||||||||||||||||||||||||||||||||||
| C Parent Holdings, LLC. (Common stock) | ||||||||||||||||||||||||||||||||||||||
| Familia Dental Group Holdings, LLC (Class A units) | ||||||||||||||||||||||||||||||||||||||
| HFZ Capital Group, LLC | ||||||||||||||||||||||||||||||||||||||
| HFZ Capital Group, LLC | ||||||||||||||||||||||||||||||||||||||
| MC Asset Management (Corporate), LLC | ||||||||||||||||||||||||||||||||||||||
| MC Asset Management (Corporate), LLC (Delayed Draw) | ||||||||||||||||||||||||||||||||||||||
| MC Asset Management (Corporate), LLC (LLC interest) | ||||||||||||||||||||||||||||||||||||||
| Mnine Holdings, Inc. | ||||||||||||||||||||||||||||||||||||||
| Mnine Holdings, Inc. | ||||||||||||||||||||||||||||||||||||||
| Mnine Holdings, Inc. (Revolver) | ||||||||||||||||||||||||||||||||||||||
| Mnine Holdings, Inc. (Class B units) | ||||||||||||||||||||||||||||||||||||||
| NECB Collections, LLC (Revolver) | ||||||||||||||||||||||||||||||||||||||
| NECB Collections, LLC (LLC units) | ||||||||||||||||||||||||||||||||||||||
| Second Avenue SFR Holdings II LLC (Revolver) | ||||||||||||||||||||||||||||||||||||||
| SFR Holdco, LLC (Junior secured loan) | ||||||||||||||||||||||||||||||||||||||
| SFR Holdco, LLC (LLC interest) | ||||||||||||||||||||||||||||||||||||||
| TJ Management HoldCo, LLC (Revolver) | ||||||||||||||||||||||||||||||||||||||
| TJ Management HoldCo, LLC (Common stock) | ||||||||||||||||||||||||||||||||||||||
| Total non-controlled affiliate company investments | $ | $ | $ | $ | $ | $ | ||||||||||||||||||||||||||||||||
| Controlled affiliate company investments: | ||||||||||||||||||||||||||||||||||||||
| MRCC Senior Loan Fund I, LLC | $ | $ | $ | $ | $ | $ | ||||||||||||||||||||||||||||||||
| Total controlled affiliate company investments | $ | $ | $ | $ | $ | $ | ||||||||||||||||||||||||||||||||
F-61
Note 6. Transactions with Related Parties
The Company has entered into an investment advisory and management agreement with MC Advisors (the “Investment Advisory and Management Agreement”), under which MC Advisors, subject to the overall supervision of the Board, provides investment advisory services to the Company. The Company pays MC Advisors a fee for its services under the Investment Advisory and Management Agreement consisting of two components - a base management fee and an incentive fee. The cost of both the base management fee and the incentive fee are borne by the Company’s stockholders, unless such fees are waived by MC Advisors.
The base management fee is calculated initially at an annual rate equal to 1.75 % of average invested assets (calculated as total assets excluding cash, which includes assets financed using leverage); provided, however, the base management fee is calculated at an annual rate equal to 1.00 % of the Company’s average invested assets (calculated as total assets excluding cash, which includes assets financed using leverage) that exceeds the product of (i) 200 % and (ii) the Company’s average net assets. For the avoidance of doubt, the 200 % is calculated in accordance with the asset coverage limitation as defined in the 1940 Act to give effect to the Company’s exemptive relief with respect to MRCC SBIC’s SBA debentures during the period they were outstanding. This has the effect of reducing the Company’s base management fee rate on assets in excess of regulatory leverage of 1 :1 debt to equity to 1.00 % per annum. The base management fee is payable quarterly in arrears.
Base management fees for the years ended December 31, 2023, 2022 and 2021 were $8,603 , $9,055 and $9,514 , respectively. MC Advisors elected to voluntarily waive zero , $55 , and zero of such base management fees for the years ended December 31, 2023, 2022, and 2021, respectively.
The incentive fee consists of two parts. The first part is calculated and payable quarterly in arrears and equals 20 % of “pre-incentive fee net investment income” for the immediately preceding quarter, subject to a 2 % (8 % annualized) preferred return, or “hurdle,” and a “catch up” feature. The foregoing incentive fee is subject to a total return requirement, which provides that no incentive fee in respect of pre-incentive fee net investment income will be payable except to the extent that 20 % of the cumulative net increase in net assets resulting from operations over the then current and 11 preceding calendar quarters exceeds the cumulative incentive fees accrued and/or paid for the 11 preceding calendar quarters (the “Incentive Fee Limitation”). Therefore, any ordinary income incentive fee that is payable in a calendar quarter will be limited to the lesser of (1) 20 % of the amount by which pre-incentive fee net investment income for such calendar quarter exceeds the 2 % hurdle, subject to the “catch-up” provision, and (2) (x) 20 % of the cumulative net increase in net assets resulting from operations for the then current and 11 preceding calendar quarters minus (y) the cumulative incentive fees accrued and/or paid for the 11 preceding calendar quarters. For the foregoing purpose, the “cumulative net increase in net assets resulting from operations” is the sum of pre-incentive fee net investment income, realized gains and losses and unrealized gains and losses for the then current and 11 preceding calendar quarters. The second part of the incentive fee is determined and payable in arrears as of the end of each fiscal year in an amount equal to 20 % of realized capital gains, if any, on a cumulative basis from inception through the end of the year, computed net of all realized capital losses on a cumulative basis and unrealized depreciation, less the aggregate amount of any previously paid capital gain incentive fees.
The composition of the Company’s incentive fees was as follows:
| For the Years Ended December 31, | |||||||||||||||||
| 2023 | 2022 | 2021 | |||||||||||||||
Part one incentive fees (1) | $ | $ | $ | ||||||||||||||
Part two incentive fees (2) | |||||||||||||||||
Incentive fees, excluding the impact of the incentive fee waiver | |||||||||||||||||
Incentive fee waiver (3) | ( | ( | |||||||||||||||
Total incentive fees, net of incentive fee waiver | $ | $ | $ | ||||||||||||||
______________________________________________________________
(1) Based on pre-incentive fee net investment income.
(2) Based upon net realized and unrealized gains and losses, or capital gains. The Company accrues, but does not pay, a capital gains incentive fee in connection with any unrealized capital appreciation, as appropriate. If, on a cumulative basis, the sum of net realized gain (loss) plus net unrealized gain (loss) decreases during a period, the Company will reverse any excess capital gains incentive fee previously accrued such that the amount of capital gains incentive fee accrued is no more than 20 % of the sum of net realized gain (loss) plus net unrealized gain (loss).
(3) Represents part one incentive fees waived by MC Advisors.
F-62
The Company has entered into an administration agreement with MC Management (the “Administration Agreement”), under which the Company reimburses MC Management, subject to the review and approval of the Board, for its allocable portion of overhead and other expenses, including the costs of furnishing the Company with office facilities and equipment and providing clerical, bookkeeping, record-keeping and other administrative services at such facilities, and the Company’s allocable portion of the cost of the chief financial officer and chief compliance officer and their respective staffs. To the extent that MC Management outsources any of its functions, the Company will pay the fees associated with such functions on a direct basis, without incremental profit to MC Management. For the years ended December 31, 2023, 2022 and 2021, the Company incurred $2,833 , $3,139 and $3,442 , respectively, in administrative expenses (included within Professional fees, Administrative service fees and General and administrative expenses on the consolidated statements of operations) under the Administration Agreement, of which $940 , $1,163 and $1,357 , respectively, was related to MC Management overhead and salary allocation and paid directly to MC Management. As of both December 31, 2023 and 2022, $255
The Company has entered into a license agreement with Monroe Capital LLC under which Monroe Capital LLC has agreed to grant the Company a non-exclusive, royalty-free license to use the name “Monroe Capital” for specified purposes in its business. Under this agreement, the Company has the right to use the “Monroe Capital” name at no cost, subject to certain conditions, for so long as MC Advisors or one of its affiliates remains its investment adviser. Other than with respect to this limited license, the Company has no legal right to the “Monroe Capital” name or logo.
As of both December 31, 2023 and 2022, the Company had accounts payable to members of the Board of zero
Note 7. Borrowings
In accordance with the 1940 Act, the Company is permitted to borrow amounts such that its asset coverage ratio, as defined in the 1940 Act, is at least 150% after such borrowing. The Company has been granted exemptive relief from the SEC for permission to exclude the debt of MRCC SBIC guaranteed by the SBA, prior to its dissolution, from the asset coverage test under the 1940 Act. As of both December 31, 2023 and 2022, the Company’s asset coverage ratio based on aggregate borrowings outstanding was 167
Revolving Credit Facility: The Company has a $255,000 revolving credit facility with ING Capital LLC, as agent. The revolving credit facility has an accordion feature which permits the Company, under certain circumstances to increase the size of the facility up to $400,000 . The Company may make draws under the revolving credit facility to make or purchase additional investments through December 27, 2026 and for general working capital purposes until December 27, 2027, the maturity date of the revolving credit facility.
On December 27, 2022, the Company amended the revolving credit facility which extended the maturity date from March 1, 2024 to December 27, 2027, increased the advance rate against certain types of assets in the Company’s portfolio, with corresponding adjustments to the concentration limits and replaced LIBOR benchmark provisions with term SOFR benchmark provisions. The other significant terms of the credit facility remained unchanged. The Company incurred expenses of $1,765 in conjunction with the amendment which have been capitalized within unamortized deferred financing costs and are amortized into interest expense over the estimated average life of the borrowings.
F-63
The Company’s ability to borrow under the revolving credit facility is subject to availability under the borrowing base, which permits the Company to borrow up to 72.5 % of the fair market value of its portfolio company investments depending on the type of investment the Company holds and whether the investment is quoted. The Company’s ability to borrow is also subject to certain concentration limits, and continued compliance with the representations, warranties and covenants given by the Company under the facility. The revolving credit facility contains certain financial covenants, including, but not limited to, the Company’s maintenance of: (1) minimum consolidated total net assets at least equal to $150,000 plus 65 % of the net proceeds to the Company from sales of its equity securities after March 1, 2019; (2) a ratio of total assets (less total liabilities other than indebtedness) to total indebtedness of not less than 1.5 to 1; and (3) a senior debt coverage ratio of at least 2 to 1. The revolving credit facility also requires the Company to undertake customary indemnification obligations with respect to ING Capital LLC and other members of the lending group and to reimburse the lenders for expenses associated with entering into the credit facility. The revolving credit facility also has customary provisions regarding events of default, including events of default for nonpayment, change in control transactions at both Monroe Capital Corporation and MC Advisors, failure to comply with financial and negative covenants, and failure to maintain the Company’s relationship with MC Advisors. If the Company incurs an event of default under the revolving credit facility and fails to remedy such default under any applicable grace period, if any, then the entire revolving credit facility could become immediately due and payable, which would materially and adversely affect the Company’s liquidity, financial condition, results of operations and cash flows.
The Company’s revolving credit facility also imposes certain conditions that may limit the amount of the Company’s distributions to stockholders. Distributions payable in the Company’s common stock under the DRIP are not limited by the revolving credit facility. Distributions in cash or property other than common stock are generally limited to 115 % of the amount of distributions required to maintain the Company’s status as a RIC.
As of December 31, 2023 and 2022, the Company had U.S. dollar borrowings of $174,100 and $204,600 , respectively, and no borrowings denominated in a foreign currency as of either date. Any borrowings denominated in a foreign currency may be positively or negatively affected by movements in the rate of exchange between the U.S. dollar and the respective foreign currency. These movements are beyond the control of the Company and cannot be predicted. Borrowings denominated in a foreign currency are translated into U.S. dollars based on the spot rate at each balance sheet date. The impact resulting from changes in foreign currency borrowings is included in net change in unrealized gain (loss) on foreign currency and other transactions on the Company’s consolidated statements of operations and totaled zero , $157 and $660 for the years ended December 31, 2023, 2022 and 2021, respectively. There were no repayments of foreign currency borrowings for the year ended December 31, 2023. For the year ended December 31, 2022, the Company repaid borrowings denominated in Great Britain pounds of £3,433 . As a result of this repayment, the Company recognized a realized gain (loss) on foreign currency and other transactions on the Company’s consolidated statements of operations of ($11 ) for year ended December 31, 2022. For the year ended December 31, 2021, the Company repaid borrowings denominated in Great Britain pounds of £12,667 . As a result of this repayment, the Company recognized a realized gain (loss) on foreign currency and other transactions on the Company's consolidated statements of operations of ($866 ) for the year ended December 31, 2021.
Borrowings under the revolving credit facility bear interest, at the Company’s election, at an annual rate of SOFR (one-month or three-month at the Company’s discretion based on the term of the borrowing) plus 2.625 % or at a daily rate equal to 1.625 % per annum plus the greater of 1.5 %, the prime interest rate, the federal funds rate plus 0.5 % or SOFR plus 1.0 %, with a SOFR floor of 0.5 %. In addition to the stated interest rate on borrowings under the revolving credit facility, the Company is required to pay a commitment fee and certain conditional fees based on usage of the expanded borrowing base and usage of the asset coverage ratio flexibility. A commitment fee of 0.5 % per annum on any unused portion of the revolving credit facility if the utilized portion of the facility is greater than 35 % of the then available maximum borrowing or a commitment fee of 1.0 % per annum on any unused portion of the revolving credit facility if the utilized portion of the facility is less than or equal to 35 % of the then available maximum borrowing. As of December 31, 2023 and 2022, the outstanding borrowings were accruing at a weighted average interest rate of 8.1 % and 7.0 %, respectively.
2023 Notes: On February 18, 2021, the Company redeemed $109,000 in aggregate principal amount of the 2023 Notes. The redemption was accounted for as a debt extinguishment in accordance with ASC Subtopic 470-50, Debt – Modifications and Extinguishments (“ASC 470-50”), which resulted in a realized loss of $2,335 (primarily comprised of the unamortized deferred financing costs at the time of the redemption) recorded in net gain (loss) on extinguishment of debt on the Company’s consolidated statements of operations. The 2023 Notes were delisted from the Nasdaq Global Select Market in conjunction with the redemption.
F-64
2026 Notes: As of both December 31, 2023 and 2022, the Company had $130,000 4.75 % payable semi-annually on February 15 and August 15. The Company may redeem the 2026 Notes in whole or in part at any time or from time to time at the Company’s option at par plus a “make-whole” premium, if applicable. The 2026 Notes are general, unsecured obligations and rank equal in right of payment with all of the Company’s existing and future unsecured indebtedness.
SBA Debentures: On March 1, 2022, MRCC SBIC fully repaid its outstanding debentures utilizing a borrowing on the revolving credit facility and the restricted cash and cash equivalents at MRCC SBIC. This repayment was accounted for as a debt extinguishment in accordance with ASC 470-50, which resulted in a realized loss of $1,039 (primarily comprised of the unamortized deferred financing costs at the time of the repayment) recorded in net gain (loss) on extinguishment of debt on the Company’s consolidated statements of operations. MRCC SBIC received approval from the SBA to surrender its SBIC license and on March 31, 2022, MRCC SBIC was dissolved.
Components of interest expense: The components of the Company’s interest expense and other debt financing expenses, average debt outstanding balances and average stated interest rates (i.e. the rate in effect plus spread) were as follows:
| For the Years Ended December 31, | |||||||||||||||||
| 2023 | 2022 | 2021 | |||||||||||||||
| Interest expense - revolving credit facility | $ | $ | $ | ||||||||||||||
| Interest expense - 2023 Notes | |||||||||||||||||
| Interest expense - 2026 Notes | |||||||||||||||||
| Interest expense - SBA debentures | |||||||||||||||||
| Amortization of deferred financing costs | |||||||||||||||||
| Total interest and other debt financing expenses | $ | $ | $ | ||||||||||||||
| Average debt outstanding | $ | $ | $ | ||||||||||||||
| Average stated interest rate | |||||||||||||||||
Note 8. Derivative Instruments
The Company enters into foreign currency forward contracts from time to time to help mitigate the impact that an adverse change in foreign exchange rates would have on future interest cash flows from the Company’s investments denominated in foreign currencies. As of December 31, 2023, the Company held no foreign currency forward contracts. As of December 31, 2022, the counterparty to these foreign currency forward contracts was Bannockburn Global Forex, LLC. Net unrealized gain or loss on foreign currency forward contracts are included in net change in unrealized gain (loss) on foreign currency forward contracts and net realized gain or loss on forward currency forward contracts are included in net realized gain (loss) on foreign currency forward contracts on the accompanying consolidated statements of operations.
Certain information related to the Company's foreign currency forward contracts is presented below as of December 31, 2022.
F-65
| As of December 31, 2022 | ||||||||||||||||||||||||||||||||
| Description | Notional Amount to be Sold | Settlement Date | Gross Amount of Unrealized Gain | Gross Amount of Unrealized Loss | Balance Sheet location of Net Amounts | |||||||||||||||||||||||||||
| Foreign currency forward contract | AUD | 1/18/2023 | $ | $ | Unrealized gain on foreign currency forward contracts | |||||||||||||||||||||||||||
| Foreign currency forward contract | AUD | 2/16/2023 | Unrealized gain on foreign currency forward contracts | |||||||||||||||||||||||||||||
| Foreign currency forward contract | AUD | 3/16/2023 | Unrealized gain on foreign currency forward contracts | |||||||||||||||||||||||||||||
| Foreign currency forward contract | AUD | 4/20/2023 | Unrealized gain on foreign currency forward contracts | |||||||||||||||||||||||||||||
| Foreign currency forward contract | AUD | 5/16/2023 | Unrealized gain on foreign currency forward contracts | |||||||||||||||||||||||||||||
| Foreign currency forward contract | AUD | 6/19/2023 | Unrealized gain on foreign currency forward contracts | |||||||||||||||||||||||||||||
| Foreign currency forward contract | AUD | 7/18/2023 | Unrealized gain on foreign currency forward contracts | |||||||||||||||||||||||||||||
| Foreign currency forward contract | AUD | 8/16/2023 | Unrealized gain on foreign currency forward contracts | |||||||||||||||||||||||||||||
| Foreign currency forward contract | AUD | 9/18/2023 | Unrealized gain on foreign currency forward contracts | |||||||||||||||||||||||||||||
| Foreign currency forward contract | AUD | 10/18/2023 | Unrealized gain on foreign currency forward contracts | |||||||||||||||||||||||||||||
| Foreign currency forward contract | AUD | 11/16/2023 | Unrealized gain on foreign currency forward contracts | |||||||||||||||||||||||||||||
| Foreign currency forward contract | AUD | 12/18/2023 | Unrealized gain on foreign currency forward contracts | |||||||||||||||||||||||||||||
| Foreign currency forward contract | AUD | 1/17/2024 | Unrealized gain on foreign currency forward contracts | |||||||||||||||||||||||||||||
| Foreign currency forward contract | AUD | 2/16/2024 | Unrealized gain on foreign currency forward contracts | |||||||||||||||||||||||||||||
| Foreign currency forward contract | AUD | 3/18/2024 | Unrealized gain on foreign currency forward contracts | |||||||||||||||||||||||||||||
| $ | $ | |||||||||||||||||||||||||||||||
For the years ended December 31, 2023, 2022 and 2021, the Company recognized net change in unrealized gain (loss) on foreign currency forward contracts of ($1,507 ), $726 and $894 , respectively. For the years ended December 31, 2023, 2022 and 2021, the Company recognized net realized gain (loss) on foreign currency forward contracts of $1,756 , $119 and ($48 ), respectively.
Note 9. Income Taxes
The Company has elected to be treated as a RIC under Subchapter M of the Code. As a RIC, the Company is not taxed on any investment company taxable income or capital gains which it distributes to stockholders. The Company intends to distribute all of its investment company taxable income and capital gains annually. Accordingly, no provision for federal income tax has been made in the consolidated financial statements.
Dividends from net investment income and distributions from net realized capital gains are determined in accordance with U.S. federal tax regulations, which may differ from amounts in accordance with U.S. GAAP and those differences could be material. These book-to-tax differences are either temporary or permanent in nature. Reclassifications due to permanent book-to-tax differences have no impact on net assets.
F-66
The following permanent differences were reclassified for tax purposes:
| For the Years Ended December 31, | |||||||||||||||||
| 2023 | 2022 | 2021 | |||||||||||||||
| Increase (decrease) in capital in excess of par value | $ | ( | $ | $ | ( | ||||||||||||
| Increase (decrease) in accumulated undistributed (overdistributed) earnings | ( | ||||||||||||||||
Taxable income generally differs from net increase (decrease) in net assets resulting from operations for financial reporting purposes due to temporary and permanent differences in the recognition of income and expenses and generally excludes unrealized gain (loss) on investments as investment gains and losses are not included in taxable income until they are realized.
Capital losses in excess of capital gains earned in a tax year may generally be carried forward and used to offset capital gains, subject to certain limitations. Under the Regulated Investment Company Modernization Act of 2010, capital losses incurred after September 30, 2011 are not subject to expiration and retain their character as either short-term or long-term capital losses. As of both December 31, 2023 and 2022, the Company had no 84,972 and $43,370 , respectively.
The following table reconciles net increase in net assets resulting from operations to taxable income:
| For the Years Ended December 31, | |||||||||||||||||
| 2023 | 2022 | 2021 | |||||||||||||||
| Net increase (decrease) in net assets resulting from operations | $ | $ | ( | $ | |||||||||||||
| Net change in unrealized (gain) loss for book but not tax | ( | ( | |||||||||||||||
| Other realized gain (loss) for tax but not book | ( | ||||||||||||||||
| Other income (loss) for tax but not book | ( | ( | ( | ||||||||||||||
| Other deductions for book in excess of deductions for tax | |||||||||||||||||
| Expenses not currently deductible | |||||||||||||||||
| Net capital loss carryforward | |||||||||||||||||
| Taxable Income before deductions for distributions | $ | $ | $ | ||||||||||||||
For income tax purposes, distributions paid to stockholders are reported as ordinary income, return of capital, long term capital gains or a combination thereof. The following table provides the tax character of distributions paid:
| For the Years Ended December 31, | |||||||||||||||||
| 2023 | 2022 | 2021 | |||||||||||||||
| Ordinary income | $ | $ | $ | ||||||||||||||
| Long-term capital gains | |||||||||||||||||
| Total | $ | $ | $ | ||||||||||||||
The Company’s consolidated Taxable Subsidiaries are subject to U.S. federal and state income taxes. For the years ended December 31, 2023, 2022 and 2021, the Company recorded a net tax expense of approximately $321 , $1,311 and $4 , respectively, for these Taxable Subsidiaries.
As of December 31, 2023, the estimated cost basis of investment for U.S. federal income tax purposes was $508,344 , resulting in estimated net unrealized loss of $19,959 , comprised of estimated gross unrealized gains and losses of $20,002 and $39,961 , respectively. As of December 31, 2022, the estimated cost basis of investment for U.S. federal income tax purposes was $579,604 , resulting in estimated net unrealized loss of $38,563 , comprised of estimated gross unrealized gains and losses of $20,104 and $58,667 , respectively.
F-67
Note 10. Distributions
The Company’s distributions are recorded on the record date. The following table summarizes distributions declared during the years ended December 31, 2023, 2022 and 2021:
| Date Declared | Record Date | Payment Date | Amount Per Share | Cash Distribution | DRIP Shares Issued | DRIP Shares Value | DRIP Shares Purchased in the Open Market | Cost of DRIP Shares Purchased | ||||||||||||||||||||||||||||||||||||||||||
| Year ended December 31, 2023: | ||||||||||||||||||||||||||||||||||||||||||||||||||
| March 1, 2023 | March 15, 2023 | March 31, 2023 | $ | $ | $ | $ | ||||||||||||||||||||||||||||||||||||||||||||
| June 2, 2023 | June 15, 2023 | June 30, 2023 | ||||||||||||||||||||||||||||||||||||||||||||||||
| September 1, 2023 | September 15, 2023 | September 29, 2023 | ||||||||||||||||||||||||||||||||||||||||||||||||
| December 1, 2023 | December 15, 2023 | December 29, 2023 | ||||||||||||||||||||||||||||||||||||||||||||||||
| Total distributions declared | $ | $ | $ | $ | ||||||||||||||||||||||||||||||||||||||||||||||
| Year ended December 31, 2022: | ||||||||||||||||||||||||||||||||||||||||||||||||||
| March 2, 2022 | March 16, 2022 | March 31, 2022 | $ | $ | $ | $ | ||||||||||||||||||||||||||||||||||||||||||||
| June 1, 2022 | June 15, 2022 | June 30, 2022 | ||||||||||||||||||||||||||||||||||||||||||||||||
| September 1, 2022 | September 15, 2022 | September 30, 2022 | ||||||||||||||||||||||||||||||||||||||||||||||||
| December 5, 2022 | December 15, 2022 | December 30, 2022 | ||||||||||||||||||||||||||||||||||||||||||||||||
| Total distributions declared | $ | $ | $ | $ | ||||||||||||||||||||||||||||||||||||||||||||||
| Year ended December 31, 2021: | ||||||||||||||||||||||||||||||||||||||||||||||||||
| March 2, 2021 | March 16, 2021 | March 31, 2021 | $ | $ | $ | $ | ||||||||||||||||||||||||||||||||||||||||||||
| June 2, 2021 | June 16, 2021 | June 30, 2021 | ||||||||||||||||||||||||||||||||||||||||||||||||
| September 2, 2021 | September 16, 2021 | September 30, 2021 | ||||||||||||||||||||||||||||||||||||||||||||||||
| December 2, 2021 | December 16, 2021 | December 31, 2021 | ||||||||||||||||||||||||||||||||||||||||||||||||
| Total distributions declared | $ | $ | $ | $ | ||||||||||||||||||||||||||||||||||||||||||||||
None of the distributions declared during the years ended December 31, 2023, 2022 and 2021 represented a return of capital for tax purposes.
Note 11. Stock Issuances and Repurchases
Stock Issuances: On May 12, 2017, the Company entered into at-the-market (“ATM”) equity distribution agreements with each of JMP Securities LLC (“JMP”) and FBR Capital Markets & Co. (“FBR”) (the “ATM Program”) through which the Company could sell, by means of ATM offerings, from time to time, up to $50,000 of the Company’s common stock. On May 8, 2020, the Company entered into an amendment to the ATM Program to extend its term. All other material terms of the ATM Program remain unchanged. There were no
Note 12. Commitments and Contingencies
Commitments: As of December 31, 2023 and 2022, we had outstanding commitments to fund investments under undrawn revolvers, delayed draw commitments and subscription agreements, excluding unfunded commitments in SLF, totaling $37,182 and $63,450 , respectively. As described in Note 3, the Company had unfunded commitments of $7,350
Indemnifications: In the normal course of business, the Company enters into contracts and agreements that contain a variety of representations and warranties that provide general indemnifications. The Company’s maximum exposure under these agreements is unknown, as these involve future claims that may be made against the Company but that have not occurred. The Company expects the risk of any future obligations under these indemnifications to be remote.
F-68
Concentration of credit and counterparty risk: Credit risk arises primarily from the potential inability of counterparties to perform in accordance with the terms of the contract. In the event that the counterparties do not fulfill their obligations, the Company may be exposed to risk. The risk of default depends on the creditworthiness of the counterparties or issuers of the instruments. It is the Company’s policy to review, as necessary, the credit standing of each counterparty.
Market risk: The Company’s investments and borrowings are subject to market risk. Market risk is the potential for changes in the value due to market changes. Market risk is directly impacted by the volatility and liquidity in the markets in which the investments and borrowings are traded.
Legal proceedings: In the normal course of business, the Company may be subject to legal and regulatory proceedings that are generally incidental to its ongoing operations. While there can be no assurance of the ultimate disposition of any such proceedings, the Company is not currently aware of any such proceedings or disposition that would have a material adverse effect on the Company’s consolidated financial statements.
Note 13. Financial Highlights
The financial highlights for the Company are as follows:
| For the Years Ended December 31, | ||||||||||||||||||||||||||||||||
| 2023 | 2022 | 2021 | 2020 | 2019 | ||||||||||||||||||||||||||||
| Per share data: | ||||||||||||||||||||||||||||||||
| Net asset value at beginning of year | $ | $ | $ | $ | $ | |||||||||||||||||||||||||||
Net investment income (1) | ||||||||||||||||||||||||||||||||
Net gain (loss) (1) | ( | ( | ( | ( | ||||||||||||||||||||||||||||
Net increase (decrease) in net assets resulting from operations (1) | ( | |||||||||||||||||||||||||||||||
| Stockholder distributions – income | ( | ( | ( | ( | ( | |||||||||||||||||||||||||||
| Stockholder distributions – capital gains | ||||||||||||||||||||||||||||||||
| Stockholder distributions – return of capital | ||||||||||||||||||||||||||||||||
Effect of share issuance above (below) NAV (2) | ( | |||||||||||||||||||||||||||||||
Effect of share repurchases (2) | ||||||||||||||||||||||||||||||||
Other (2) | ( | |||||||||||||||||||||||||||||||
| Net asset value at end of year | $ | $ | $ | $ | $ | |||||||||||||||||||||||||||
| Net assets at end of year | $ | $ | $ | $ | $ | |||||||||||||||||||||||||||
| Shares outstanding at end of year | ||||||||||||||||||||||||||||||||
| Per share market value at end of year | $ | $ | $ | $ | $ | |||||||||||||||||||||||||||
Total return based on market value (3) | ( | % | ( | % | % | ( | % | % | ||||||||||||||||||||||||
Total return based on average net asset value (4) | % | ( | %) | % | % | % | ||||||||||||||||||||||||||
Ratio/Supplemental data: (5) | ||||||||||||||||||||||||||||||||
| Ratio of net investment income to average net assets | % | % | % | % | % | |||||||||||||||||||||||||||
| Ratio of total expenses, net of base management fee and incentive fee waivers, to average net assets | % | % | % | % | % | |||||||||||||||||||||||||||
| Portfolio turnover | % | % | % | % | % | |||||||||||||||||||||||||||
F-69
| For the Years Ended December 31, | |||||||||||||||||||||||||||||
| 2018 | 2017 | 2016 | 2015 | 2014 | |||||||||||||||||||||||||
| Per share data: | |||||||||||||||||||||||||||||
| Net asset value at beginning of year | $ | $ | $ | $ | $ | ||||||||||||||||||||||||
Net investment income (1) | |||||||||||||||||||||||||||||
Net gain (loss) (1) | ( | ( | ( | ( | |||||||||||||||||||||||||
Net increase (decrease) in net assets from operations (1) | |||||||||||||||||||||||||||||
| Stockholder distributions – income | ( | ( | ( | ( | ( | ||||||||||||||||||||||||
| Stockholder distributions – capital gains | ( | ( | |||||||||||||||||||||||||||
| Stockholder distributions – return of capital | |||||||||||||||||||||||||||||
Effect of share issuance above (below) NAV (2) | |||||||||||||||||||||||||||||
Effect of share repurchases (2) | |||||||||||||||||||||||||||||
Other (2) | |||||||||||||||||||||||||||||
| Net asset value at end of year | $ | $ | $ | $ | $ | ||||||||||||||||||||||||
| Net assets at end of year | $ | $ | $ | $ | $ | ||||||||||||||||||||||||
| Shares outstanding at end of year | |||||||||||||||||||||||||||||
| Per share market value at end of year | $ | $ | $ | $ | $ | ||||||||||||||||||||||||
Total return based on market value (3) | ( | % | ( | % | % | ( | % | % | |||||||||||||||||||||
Total return based on average net asset value (4) | % | % | % | % | % | ||||||||||||||||||||||||
Ratio/Supplemental data: (5) | |||||||||||||||||||||||||||||
| Ratio of net investment income to average net assets | % | % | % | % | % | ||||||||||||||||||||||||
| Ratio of total expenses, net of base management fee and incentive fee waivers, to average net assets | % | % | % | % | % | ||||||||||||||||||||||||
| Portfolio turnover | % | % | % | % | % | ||||||||||||||||||||||||
______________________________________________________________
(1)Calculated using the weighted average shares outstanding during the years presented.
(2)Includes the effect of share issuances above (below) net asset value and the impact of different share amounts used in calculating per share data as a result of calculating certain per share data based on weighted average shares outstanding during the period and certain per share data based on shares outstanding as of a period end or transaction date.
(3)Total return based on market value is calculated assuming a purchase of common shares at the market value on the first day and a sale at the market value on the last day of the periods reported. Distributions, if any, are assumed for purposes of this calculation to be reinvested at prices obtained under the Company’s DRIP. Total return based on market value does not reflect brokerage commissions.
(4)Total return based on average net asset value is calculated by dividing the net increase (decrease) in net assets resulting from operations by the average net asset value.
(5)The following is a schedule of supplemental ratios for the years presented.
F-70
| For the Years Ended December 31, | |||||||||||||||||||||||||||||
| 2023 | 2022 | 2021 | 2020 | 2019 | |||||||||||||||||||||||||
| Ratio of total investment income to average net assets | % | % | % | % | % | ||||||||||||||||||||||||
| Ratio of interest and other debt financing expenses to average net assets | % | % | % | % | % | ||||||||||||||||||||||||
| Ratio of total expenses (without base management fee waivers and incentive fees) to average net assets | % | % | % | % | % | ||||||||||||||||||||||||
Ratio of incentive fees, net of incentive fee waivers, to average net assets (6) | % | % | % | % | % | ||||||||||||||||||||||||
| For the Years Ended December 31, | |||||||||||||||||||||||||||||
| 2018 | 2017 | 2016 | 2015 | 2014 | |||||||||||||||||||||||||
| Ratio of total investment income to average net assets | % | % | % | % | % | ||||||||||||||||||||||||
| Ratio of interest and other debt financing expenses to average net assets | % | % | % | % | % | ||||||||||||||||||||||||
| Ratio of total expenses (without base management fee waivers and incentive fees) to average net assets | % | % | % | % | % | ||||||||||||||||||||||||
Ratio of incentive fees, net of incentive fee waivers, to average net assets (6) | % | % | % | % | % | ||||||||||||||||||||||||
______________________________________________________________
(6)The ratio of waived incentive fees to average net assets was zero , 0.22 %, 0.61 %, 0.31 %, 0.46 %, zero , 0.12 %, 0.13 %, zero and zero for the years presented.
Note 14. Subsequent Events
The Company has evaluated subsequent events through March 11, 2024, the date on which the consolidated financial statements were issued.
On March 5, 2024, the Board declared a quarterly distribution of $0.25 per share payable on March 29, 2024 to holders of record on March 15, 2024.
F-71
(a)(3) Exhibits
| Exhibit Number | Description of Document | |||||||
| 3.1 | ||||||||
| 3.2 | ||||||||
| 4.1 | ||||||||
| 4.2 | ||||||||
| 4.3 | ||||||||
| 4.4 | ||||||||
| 4.5 | ||||||||
| 10.1 | ||||||||
| 10.2 | ||||||||
| 10.3 | ||||||||
| 10.4 | ||||||||
| 10.5 | ||||||||
116
| 10.6 | ||||||||
| 10.7 | ||||||||
| 10.8 | ||||||||
| 10.9 | ||||||||
| 10.10 | ||||||||
| 10.11 | ||||||||
| 10.12 | ||||||||
| 10.13 | ||||||||
| 21.1 | ||||||||
| 23.1 | ||||||||
| 31.1 | ||||||||
| 31.2 | ||||||||
| 32.1 | ||||||||
117
| 97.1 | ||||||||
| 99.1 | ||||||||
| 101.INS | Inline XBRL Instance Document (filed herewith) | |||||||
| 101.SCH | Inline XBRL Taxonomy Extension Schema Document (filed herewith) | |||||||
| 101.DEF | Inline XBRL Taxonomy Extension Definition Linkbase Document (filed herewith) | |||||||
| 101.LAB | Inline XBRL Taxonomy Extension Labels Linkbase Document (filed herewith) | |||||||
| 101.PRE | Inline XBRL Taxonomy Extension Presentation Linkbase Document (filed herewith) | |||||||
| 104 | Cover Page Interactive Data File (Embedded within the Inline XBRL document and included in Exhibit) | |||||||
118
ITEM 16. FORM 10-K SUMMARY
None.
119
SIGNATURES
Pursuant to the requirements of Section 13 or 15(d) of the Securities Exchange Act of 1934, the registrant has duly caused this Annual Report on Form 10-K to be signed on its behalf by the undersigned, thereunto duly authorized.
Date: March 11, 2024 | |||||
Monroe Capital Corporation | |||||
By: | /s/ Theodore L. Koenig | ||||
| Theodore L. Koenig | |||||
| Chairman, Chief Executive Officer and Director | |||||
| (Principal Executive Officer) | |||||
By: | /s/ Lewis W. Solimene, Jr. | ||||
| Lewis W. Solimene, Jr. | |||||
| Chief Financial Officer and Chief Investment Officer | |||||
| (Principal Financial and Accounting Officer) | |||||
Pursuant to the requirements of the Securities Exchange Act of 1934, this report has been signed below by the following persons on behalf of the registrant and in the capacities and on the dates indicated.
| Signature | Title | Date | ||||||||||||
| /s/ Theodore L. Koenig | Chairman, Chief Executive Officer and Director | March 11, 2024 | ||||||||||||
| Theodore L. Koenig | (Principal Executive Officer) | |||||||||||||
| /s/ Lewis W. Solimene, Jr. | Chief Financial Officer and Chief Investment Officer | March 11, 2024 | ||||||||||||
| Lewis W. Solimene, Jr. | (Principal Financial and Accounting Officer) | |||||||||||||
| /s/ Thomas J. Allison | Director | March 11, 2024 | ||||||||||||
| Thomas J. Allison | ||||||||||||||
| /s/ Caroline Davidson | Director | March 11, 2024 | ||||||||||||
| Caroline Davidson | ||||||||||||||
| /s/ Jeffrey A. Golman | Director | March 11, 2024 | ||||||||||||
| Jeffrey A. Golman | ||||||||||||||
| /s/ Jorde M. Nathan | Director | March 11, 2024 | ||||||||||||
| Jorde M. Nathan | ||||||||||||||
| /s/ Robert S. Rubin | Director | March 11, 2024 | ||||||||||||
| Robert S. Rubin | ||||||||||||||
| /s/ Jeffrey D. Steele | Director | March 11, 2024 | ||||||||||||
| Jeffrey D. Steele | ||||||||||||||
120