UNITED STATES
SECURITIES AND EXCHANGE COMMISSION
Washington, D.C. 20549
FORM 20-F
OR
For the fiscal year ended December 31 , 2023
OR
OR
Commission file number 001-35788
(Exact name of Registrant as specified in its charter)
N/A
(Translation of Registrant’s name into English)
(Jurisdiction of incorporation or organization)
(Address of principal executive offices)
(Name, Telephone, E-mail and/or Facsimile number and Address of Company Contact Person)
Securities registered or to be registered pursuant to Section 12(b) of the Act:
| Title of each class | Trading Symbol(s) | Name of each exchange on which registered | ||||||
Securities registered or to be registered pursuant to Section 12(g) of the Act:
None
Securities for which there is reporting obligation pursuant to Section 15(d) of the Act:
None
Indicate the number of outstanding shares of the issuer’s classes of capital or common stock as of the close of the period covered by the annual report:
Ordinary Shares
Indicate by check mark if the registrant is a well-known seasoned issuer, as defined in Rule 405 of the Securities Act.
If this report is an annual or transition report, indicate by check mark if the registrant is not required to file reports pursuant to Section 13 or 15(d) of the Securities Exchange Act of 1934.
Yes ☐ No ☒
Indicate by check mark whether the registrant (1) has filed all reports required to be filed by Section 13 or 15(d) of the Securities Exchange Act of 1934 during the preceding 12 months (or for such shorter period that the registrant was required to file such reports), and (2) has been subject to such filing requirements for the past 90 days.
Indicate by check mark whether the registrant has submitted electronically every Interactive Data File required to be submitted pursuant to Rule 405 of Regulation S‐T (§232.405 of this chapter) during the preceding 12 months (or for such shorter period that the registrant was required to submit such files).
Indicate by check mark whether the registrant is a large accelerated filer, an accelerated filer, a non-accelerated filer or an emerging growth company. See definition of “large accelerated filer," "accelerated filer" and "emerging growth company” in Rule 12b-2 of the Exchange Act.
If an emerging growth company that prepares its financial statements in accordance with U.S. GAAP, indicate by check mark if the registrant has elected not to use the extended transition period for complying with any new or revised financial accounting standards† provided pursuant to Section 13(a) of the Exchange
Act. ☐
† The term “new or revised financial accounting standard” refers to any update issued by the Financial Accounting Standards Board to its Accounting Standards Codification after April 5, 2012.
Indicate by check mark whether the registrant has filed a report on and attestation to its management’s assessment of the effectiveness of its internal control over financial reporting under Section 404(b) of the Sarbanes-Oxley Act (15 U.S.C. 7262(b)) by the registered public accounting firm that prepared or issued its audit report. ☒
If securities are registered pursuant to Section 12(b) of the Act, indicate by check mark whether the financial statements of the registrant included in the filing reflect the correction of an error to previously issued financial statements. ☐
Indicate by check mark whether any of those error corrections are restatements that required a recovery analysis of incentive-based compensation received by any of the registrant’s executive officers during the relevant recovery period pursuant to §240.10D-1(b). ☐
Indicate by check mark which basis of accounting the registrant has used to prepare the financial statements included in this filing:
U.S. GAAP ☐ International Financial Reporting Standards as issued by the International Accounting Standards
Board ☒ Other ☐
If “Other” has been checked in response to the previous question, indicate by check mark which financial statement item the registrant has elected to follow.
Item 17 ☐ Item 18 ☐
If this is an annual report, indicate by check mark whether the registrant is a shell company (as defined in Rule 12b-2 of the Exchange Act).
Yes ☐ No ☒
Table of contents
| Management report | Page | ||||
| Introduction | |||||
| Company overview | |||||
| History and development of the Company | |||||
| Cautionary Statement regarding forward-looking statements | |||||
Key transactions and events in 2023 | |||||
Sustainable development highlights - striving to be a leader in the decarbonization of the steel industry | |||||
Risk Factors and Control | |||||
| Business overview | |||||
| Business strategy | |||||
| Research and development | |||||
| Sustainable development | |||||
| Products | |||||
| Sales and marketing | |||||
| Intellectual property | |||||
| Government regulations | |||||
| Organizational structure | |||||
| Properties and capital expenditures | |||||
| Property, plant and equipment | |||||
| Capital expenditures | |||||
Mineral reserves and resources | |||||
| Operating and financial review | |||||
| Key factors affecting results of operations | |||||
| Operating results | |||||
| Liquidity and capital resources | |||||
| Disclosures about market risk | |||||
| Outlook | |||||
| Management and employees | |||||
| Directors and senior management | |||||
| Compensation | |||||
| Employees | |||||
| Corporate governance | |||||
| Shareholders and markets | |||||
| Major shareholders | |||||
| Related party transactions | |||||
| Markets | |||||
| New York Registry Shares | |||||
| Dividend distributions | |||||
| Purchases of equity securities by the issuer and affiliated purchasers | |||||
| Share capital | |||||
| Additional information | Page | ||||
| Memorandum and Articles of Association | |||||
| Material contracts | |||||
| Exchange controls and other limitations affecting security holders | |||||
| Taxation | |||||
| Evaluation of disclosure controls and procedures | |||||
| Management’s report on internal control over financial reporting | |||||
| Principal accountant fees and services | |||||
| Glossary - definitions, terminology and principal subsidiaries | |||||
| Exhibits | |||||
| Signature | |||||
Reports of Independent Registered Public Accounting Firms ( (Deloitte Audit S.à r.l., PCAOB ID | |||||
| Consolidated financial statements | |||||
| Consolidated statements of operations | |||||
| Consolidated statements of other comprehensive income | |||||
| Consolidated statements of financial position | |||||
| Consolidated statements of changes in equity | |||||
| Consolidated statements of cash flows | |||||
| Notes to the consolidated financial statements | |||||
Form 20-F Cross Reference Guide
| Item | Form 20-F Caption | Reference in current report | Page | ||||||||
| Glossary - definitions, terminology and principal subsidiaries | |||||||||||
Cautionary statement regarding forward-looking statements | Cautionary statement regarding forward-looking statements | ||||||||||
Part I | |||||||||||
Item 1. | Identity of Directors, Senior Management and Advisers | Not applicable | |||||||||
Item 2. | Offers Statistics and Expected Timetable | Not applicable | |||||||||
Item 3. | Key Information | ||||||||||
A. | [Reserved] | Not applicable | |||||||||
B. | Capitalization and indebtedness | Not applicable | |||||||||
C. | Reasons for the offer and use of proceeds | Not applicable | |||||||||
Risk Factors and Control | |||||||||||
Item 4. | Information on the Company | ||||||||||
History and development of the Company, Key transactions and events in 2023, Recent Developments, Sustainable development highlights - striving to be a leader in the decarbonization of the steel industry, Capital expenditures, Raw materials, Sources and uses of cash | |||||||||||
| Business strategy, Market information, Competitive strengths, Sustainable development, Products, Sales and marketing, Insurance, Intellectual property, Government regulations, Risk management process | |||||||||||
| Organizational structure | |||||||||||
| Property, plant and equipment, Capital expenditures, Reserves and Resources (iron ore and coal) | |||||||||||
Item 4A. | Unresolved staff comments | None | |||||||||
Item 5. | Operating and Financial Review and Prospects | ||||||||||
| Key factors affecting results of operations, Operating results | |||||||||||
| Liquidity and capital resources | |||||||||||
C. | Research and development, patents and licenses, etc. | Competitive strengths, Research and development | |||||||||
| Outlook and Key factors affecting results of operations | |||||||||||
E. | Critical Accounting Estimates | Critical accounting policies and use of judgments and estimates | |||||||||
Item 6. | Directors, Senior Management and Employees | ||||||||||
| Directors and senior management | |||||||||||
| Compensation | |||||||||||
| Corporate governance, Directors and senior management | |||||||||||
| Employees | |||||||||||
| Management share ownership, Compensation | |||||||||||
| F. | Disclosure of a registrant’s action to recover erroneously awarded compensation. | Not applicable | |||||||||
Item 7. | Major Shareholders and Related Party Transactions | ||||||||||
| Major shareholders | |||||||||||
| Related party transactions | |||||||||||
C. | Interest of experts and counsel | Not applicable | |||||||||
Item 8. | Financial Information | ||||||||||
A. | Consolidated statements and other financial information | Consolidated financial statements as of and for the year ended December 31, 2023, Export sales, Legal proceedings, Dividend distribution | |||||||||
B. | Significant changes | Not applicable | |||||||||
Item 9. | The Offer and Listing | ||||||||||
A. | Offer and listing details | Markets | |||||||||
B. | Plan of distribution | Not applicable | |||||||||
| Markets | |||||||||||
D. | Selling shareholders | Not applicable | |||||||||
E. | Dilution | Not applicable | |||||||||
F. | Expenses of the issue | Not applicable | |||||||||
Item 10. | Additional Information | ||||||||||
| Share capital | |||||||||||
| Memorandum and Articles of Association | |||||||||||
| Material contracts | |||||||||||
| Exchange controls and other limitations affecting security holders | |||||||||||
| Taxation | |||||||||||
F. | Dividends and paying agents | Paying agents and Earnings distribution | |||||||||
G. | Statements by experts | Reserves and Resources (iron ore and coal) and Exhibits 15.1, 15.2, 15.3, 15.4, 15.5, 15.6, 15.7, 15.8, 15.9, 15.10, 15.11 and 15.12 | |||||||||
H. | Documents on display | History and development of the Company | |||||||||
I. | Subsidiary information | Not applicable | |||||||||
| J. | Annual Report to Security Holders | Not applicable | |||||||||
Item 11. | Disclosures about market risk | ||||||||||
Item 12. | Description of Securities Other Than Equity Securities | ||||||||||
A. | Debt Securities | Not applicable | |||||||||
B. | Warrants and Rights | Not applicable | |||||||||
C. | Other Securities | Not applicable | |||||||||
| New York Registry Shares | |||||||||||
Part II | |||||||||||
Item 13. | Defaults, Dividend Arrearages and Delinquencies | None | |||||||||
Item 14. | Material Modifications to the Rights of Security Holders and Use of Proceeds | None | |||||||||
Item 15. | Controls and Procedures | Evaluation of disclosure controls and procedures, Management’s report on internal control over financial reporting and Internal control procedures | |||||||||
Item 16A. | Audit committee financial expert | Corporate governance | |||||||||
Item 16B. | Code of Ethics | Corporate governance — Code of Business Conduct | |||||||||
Item 16C. | Principal Accountant Fees and Services | Principal accountant fees and services | |||||||||
Item 16D. | Exemptions from the Listing Standards for Audit Committees | None | |||||||||
Item 16E. | Purchases of equity securities by the issuer and affiliated purchasers | ||||||||||
Item 16F. | Change in Registrant’s Certifying Accountant | Not applicable | |||||||||
Item 16G. | Corporate Governance | Corporate governance | |||||||||
| Item 16H. | Mine Safety Disclosure | Not applicable | |||||||||
| Item 16I. | Disclosure Regarding Foreign Jurisdictions that Prevent Inspections | Not applicable | |||||||||
Item 16J. | Insider Trading Policies | Not applicable | |||||||||
Item 16K | Cybersecurity | Risk Factors and Control — Cybersecurity | |||||||||
Part III | |||||||||||
Item 17. | Financial statements | Consolidated financial statements | |||||||||
Item 18. | Financial statements | Consolidated financial statements | |||||||||
Item 19. | Exhibits | Exhibits | |||||||||
| Management report | ||
INTRODUCTION
Company overview
ArcelorMittal is one of the world’s leading integrated steel and mining companies. ArcelorMittal is the largest steel producer in Europe and among the largest in the Americas, and a growing presence in Asia including India through its joint venture AMNS India.
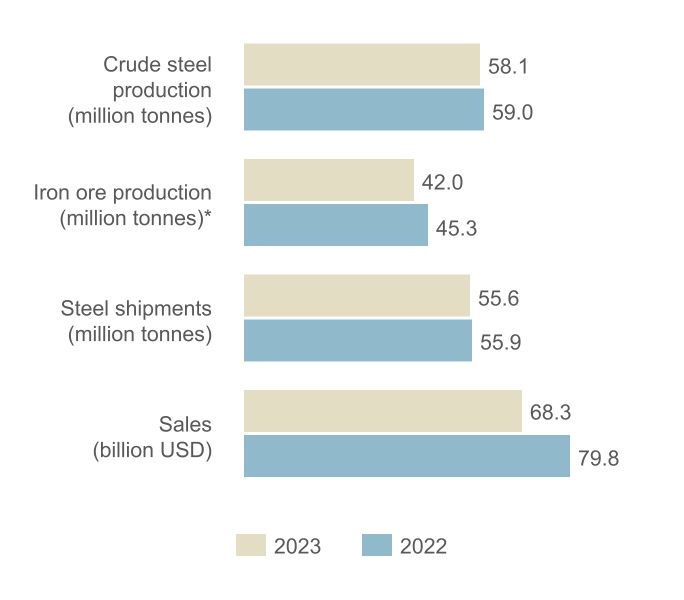
*Iron ore production includes production from ArcelorMittal Mining Canada G.P. and ArcelorMittal Infrastructure G.P. ("AMMC"), ArcelorMittal Liberia and captive mines.
ArcelorMittal has steel-making operations in 15 countries, including 37 integrated and mini-mill steel-making facilities. As of December 31, 2023, ArcelorMittal had approximately 126,756 employees.
ArcelorMittal produces a broad range of high-quality finished and semi-finished steel products ("semis"). Specifically, ArcelorMittal produces flat products, including sheet and plate, and long products, including bars, rods and structural shapes. It also produces pipes and tubes for various applications. ArcelorMittal sells its products primarily in local markets and to a diverse range of customers in approximately 140 countries, including the automotive, appliance, engineering, construction and machinery industries. ArcelorMittal’s mining operations produce various types of mining products including iron ore lump, fines, concentrate, pellets, sinter feed and coking coal.
As a global steel producer, the Company is able to meet the needs of different markets. Steel consumption and product requirements clearly differ between developed markets and developing markets. Steel consumption in developed economies is weighted towards flat products and a higher value-added mix, while developing markets utilize a higher proportion of long
products and commodity grades. To meet these diverse needs, the Company maintains a high degree of product diversification and seeks opportunities to increase the proportion of higher value-added products in its product mix.
History and development of the Company
ArcelorMittal results from the merger in 2007 of its predecessor companies Mittal Steel Company N.V. and Arcelor, each of which had grown through acquisitions over many years. Since its creation ArcelorMittal has experienced periods of external growth as well as consolidation and deleveraging (including through divestment).
ArcelorMittal's success is built on its core values of sustainability, safety, quality and leadership and the entrepreneurial boldness that has empowered its emergence as the first truly global steel and mining company. Acknowledging that a combination of structural issues and macroeconomic conditions will continue to challenge returns in its sector, the Company has adapted its footprint to the new demand realities, redoubled its efforts to control costs and repositioned its operations with a view toward outperforming its competitors. ArcelorMittal’s research and development capability is strong and includes several major research centers as well as strong academic partnerships with universities and other scientific bodies.
Against this backdrop, ArcelorMittal's strategy is to leverage four distinctive attributes that will enable it to capture leading positions in the most attractive areas of the steel industry’s value chain, from mining at one end to distribution and first-stage processing at the other: global scale and scope; superior technical capabilities; a diverse portfolio of steel and related businesses, one of which is mining; and financial capabilities. The Company’s strategy is further detailed under “Business overview—Business strategy”.
ArcelorMittal’s steel-making operations have a high degree of geographic diversification. In 2023, approximately 39%
of its crude steel was produced in the Americas, approximately 50% was produced in Europe and approximately 11% was produced in other countries, such as South Africa and Ukraine. In addition, ArcelorMittal’s sales of steel products are spread over both developed and developing markets, which have different consumption characteristics. ArcelorMittal’s mining operations, including captive mines are present in North America, South America, Africa, Europe and the CIS region. Captive mines are integrated into the Company's global steel-making facilities.
3
| Management report | ||
Competitive strengths
As shown by the following graph, ArcelorMittal has a diversified portfolio of steel and mining products to meet a wide range of customer needs across many steel-consuming sectors, including automotive, appliance, engineering, construction, energy and machinery and via distributors.
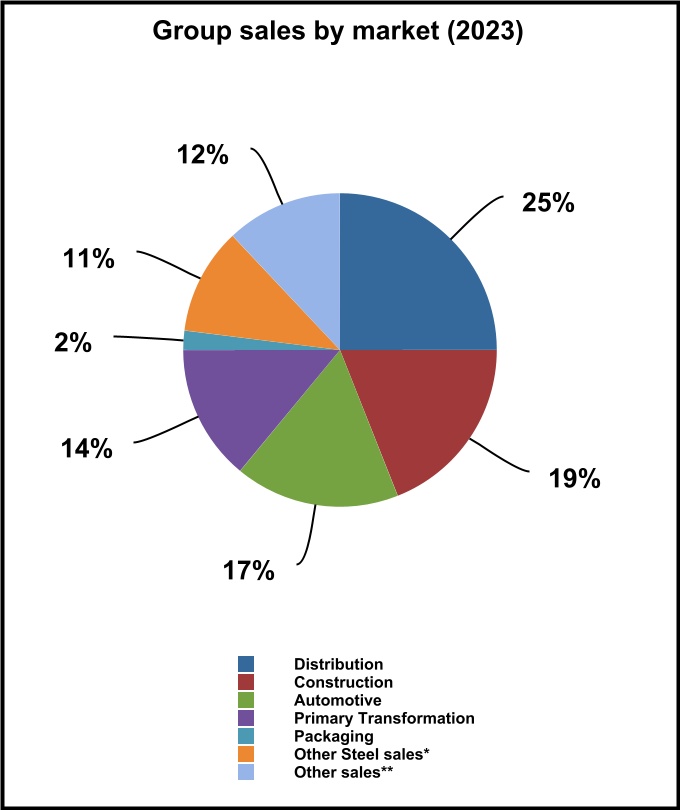
* Other steel sales mainly represent metal processing, machinery, electrical equipment and domestic appliances
**Other sales mainly represent mining, chemicals & water, slag, waste, sale of energy and shipping
The Company believes that the following factors contribute to ArcelorMittal’s success in the global steel and mining industry:
Market leader in steel. ArcelorMittal had annual achievable production capacity of approximately 81.0 million tonnes of crude steel for the year ended December 31, 2023. Steel shipments for the year ended December 31, 2023 totaled 55.6 million tonnes. ArcelorMittal has significant operations in many countries which are described in "Properties and capital expenditures". In addition, many of ArcelorMittal’s operating units have access to developing markets that are expected to experience, over time, above-average growth in steel consumption (such as Central and Eastern Europe, South America, India, Africa, CIS and Southeast Asia).
The Company sells its products in local markets and through a centralized marketing organization to customers in approximately 140 countries. ArcelorMittal’s diversified product offering, together with its distribution network and research and development (“R&D”) programs, enable it to build strong relationships with customers, which include many of the world’s major automobile and appliance manufacturers. The Company is a strategic partner to many major original equipment manufacturers (“OEMs”) and has the capability to build long-term contractual relationships with them based on early vendor involvement, contributions to global OEM platforms and common value-creation programs.
A world-class mining business. ArcelorMittal has a global portfolio of 9 (following the disposal of Kazakhstan iron ore and coal mining operations) operating units with mines in operation and development and is among the largest iron ore producers in the world. In 2023, ArcelorMittal sourced a large portion of its raw materials from its own mines and facilities including leases. The table below reflects ArcelorMittal's self-sufficiency through its mining operations in 2023.
| Millions of metric tonnes | Consumption | Sourced from own mines/facilities2, 3 | Self-sufficiency % | ||||||||||||||||||||
| Iron ore | 74.1 | 42.0 | 57% | ||||||||||||||||||||
PCI & coal1 | 29.9 | 2.0 | 7% | ||||||||||||||||||||
| Coke | 17.3 | 17.0 | 98% | ||||||||||||||||||||
| Scrap & DRI | 26.1 | 15.5 | 59% | ||||||||||||||||||||
1.Includes coal only for the steelmaking process and excludes steam coal for power generation. ArcelorMittal's consumption of PCI and coal was 5.8 million tonnes and 24.1 million tonnes, respectively, for the year ended December 31, 2023.
2.Assumes 100% consumption of ArcelorMittal's iron ore and coal shipments.
3.Includes Kazakhstan iron ore and coal mining operations, which were sold on December 7, 2023. Iron ore and coal production is included in the table through the transaction closing date. See "Properties and capital expenditures—Mineral reserve and resources" and "Introduction—Key transactions and events in 2023".
The Company has iron ore mining activities in Brazil, Bosnia, Canada, Liberia, Mexico, Ukraine, South Africa and through its joint venture in India and associate in Canada (Baffinland). On December 7, 2023, the Company divested its mining operations in Kazakhstan in the context of the sale of ArcelorMittal Temirtau, see "—Key transactions and events in 2023". ArcelorMittal’s main mining products include iron ore lump, fines, concentrate, pellets and sinter feed. In addition, ArcelorMittal produces substantial amounts of direct reduced iron ("DRI") which is a scrap substitute used in its mini-mill facilities to supplement external metallic purchases and also a vital material for the production of steel through the electric arc furnace ("EAF") route which will grow substantially in the context of decarbonization. As of December 31, 2023, ArcelorMittal’s iron ore reserves (including reserves at mines where ArcelorMittal owns less than 100%, based on ArcelorMittal's
4
| Management report | ||
ownership percentage even if ArcelorMittal is entitled to mine all the reserves, and including reserves for which use is restricted) were estimated at 3,937 million tonnes run of mine. See “Properties and capital expenditures—Mineral reserves and resources” for a detailed list of the entities with mineral reserves and resources and ownership structure. The Company’s long-life iron ore reserves and resources provide a measure of security of supply and an important natural hedge against raw material volatility and global supply constraints. The seaborne iron ore mining business is managed as a separate segment which enhances ArcelorMittal’s ability to optimize capital allocation.
ArcelorMittal’s facilities have good access to shipping facilities, including through ArcelorMittal’s own, or partially owned, 17 deep-water port facilities and linked railway sidings.
Market-leading automotive steel business. ArcelorMittal has a leading market share (approximately 15% of the worldwide market) in automotive, and is a leader in the fast-growing advanced high-strength steels ("AHSS") segment, specifically for flat products. ArcelorMittal is the first steel company in the world to embed its own engineers within an automotive customer to provide engineering support. The Company begins working with OEMs as early as five years before a vehicle reaches the showroom, to provide generic steel solutions, co-engineering and help with the industrialization of the project. These relationships are founded on the Company’s continuing investment in R&D and its ability to provide well-engineered solutions that help make vehicles lighter, safer and more fuel-efficient.
In 2023, ArcelorMittal extended the S-in Motion® catalog according to the automotive market trends. The S-in Motion® battery electric vehicles ("BEV") catalog of steel solutions has been adapted to include specific products for BEV's including new designs focused on battery protection. Advanced and especially ultra-high strength steels, innovative press hardened steels, and laser welded blanks are especially highlighted as key solutions for optimal performance (passenger safety/lightweighting) and battery protection. The growth of various types of electric vehicles will impact design and manufacturing leading to demand for different materials and steel grades, and more AHSS for battery protection. For instance, both the battery box and body structure have to protect the battery in the event of a crash. AHSS products are among the most affordable solutions on the market for these specific applications. In a context where the supply of electric vehicles, and especially BEVs, is expected to grow quickly.
Recently, the automotive industry’s priority has turned towards the simplification of the vehicle manufacturing complexity linked to the rising importance of electrical vehicles. ArcelorMittal’s response is the ArcelorMittal Multi-Part Integration™ ("MPI")
concept integrating a large number of parts into one single component combining PHS (Usibor®) and laser welding technology. On top of further lightweighting opportunities, the new solutions offer concepts to simplify operations by optimizing the amount of robots, by reducing the shop floor size, and by cutting the hours of labor per vehicle in the assembly shop by up to 30%. These achievements were mainly possible with the combination of extra-large laser welded blanks and the new generation of Press Hardening steels Usibor® 2000 and Ductibor® 1000.
In the automotive industry, ArcelorMittal mainly supplies the geographic markets where its production facilities are located, which are Europe, North and South America, South Africa and China through Valin ArcelorMittal Automotive Steel Co., Ltd (“VAMA”), a joint venture with Hunan Valin. VAMA’s product mix is oriented toward higher value products and mainly toward the OEMs to which the Company sells tailored solutions based on its products. With sales and service offices worldwide and production facilities in North and South America, South Africa, Europe and China, ArcelorMittal believes that it is uniquely positioned to supply global automotive customers with the same products worldwide. The Company has multiple joint ventures and has also developed a global downstream network of partners through its distribution solutions activities. This provides the Company with a proximity advantage in virtually all regions where its global customers are present.
Examples of MPI are the rear H-Frame and the double door ring. Following the launch of H-frame project in China with Dongfeng Voyah in 2022, the Company launched several new projects in 2023 (including designing and structure strengthening projects) for OEMs. Furthermore, after the initial success of MPI Door-Ring concepts in the U.S. and China with both legacy and newcomer OEMs, in 2023, the Company succeeded in a breakthrough of the Door-Ring concept with several OEMs in Europe as well. As of December 31, 2023, more than 50 different vehicles are designed by ArcelorMittal with the Door-Ring concept and approximately 100 projects are currently in progress.
Sustainability (with focus on CO2 emission reduction in the supply chain) has become a key requirement in the automotive industry linked to the importance of sustainability in the holistic electrical vehicle marketing concept. In 2021, ArcelorMittal launched two solutions under the XCarb™ brand: XCarb™ green steel certificates and XCarb™ recycled and renewably produced ("RRP"), which was well received in automotive industry and markets. The first XCarb® RRP steels were successfully launched in Europe and in North America, exhibiting potential for reduction in CO2 emissions. In 2023, the Company entered into an agreement with General Motors for supplying XCarb® RRP steels in North America.
5
| Management report | ||
For further details on the new products under development, see "Business overview—Research and development”.
Diversified and efficient producer. As a global steel manufacturer with a leading position in many markets, ArcelorMittal benefits from scale and production cost efficiencies in various markets and a measure of protection against the cyclicality of the steel industry and raw materials prices.
•Diversified production process. In 2023, approximately 43.2 million tonnes of crude steel were produced through the basic oxygen furnace process ("BOF") and approximately 14.9 million tonnes through the electric arc furnace ("EAF") process. This provides ArcelorMittal with greater flexibility in its raw material and energy use, and increased ability to meet varying customer requirements in the markets it serves.
•Product and geographic diversification. By operating a portfolio of assets diversified across product segments and geographic areas, ArcelorMittal benefits from a number of natural hedges. As a global steel producer with a broad range of high-quality finished and semi-finished steel products, ArcelorMittal is able to meet the needs of diverse markets. Steel consumption and product requirements vary between mature economy markets and developing economy markets. Steel consumption in mature economies is largely from flat products and a higher value-added mix, while developing markets utilize a higher proportion of long products and commodity grades. As developing economies mature and markets evolve, local customers will require increasingly advanced steel products. To meet these diverse needs, ArcelorMittal maintains a high degree of product diversification and seeks opportunities to increase the proportion of its product mix consisting of higher value-added products.
•Upstream integration. ArcelorMittal believes that its own raw material production provides it with a competitive advantage over time. Additionally, ArcelorMittal benefits from the ability to optimize its steel-making facilities’ efficient use of raw materials, its global procurement strategy and the implementation of Company-wide knowledge management practices with respect to raw materials. Certain of the Company’s operating units also have access to infrastructure, such as deep-water port facilities, railway sidings and engineering workshops that lower transportation and logistics costs.
•Downstream integration. ArcelorMittal’s downstream integration, primarily through its Europe segment for distribution solutions, enables it to provide customized steel solutions to its customers more effectively. The
Company’s downstream assets have cut-to-length, slitting and other processing facilities, which provide value additions and help it to maximize operational efficiencies.
Dynamic responses to market challenges and opportunities. ArcelorMittal’s management team has a strong track record and extensive experience in the steel and mining industries.
In 2020, the Company successfully reduced fixed costs, including through temporary measures, in line with lower production resulting from the impacts of the COVID-19 pandemic. These savings limited the increase in fixed costs as activity and production levels recovered, thus leading to lower fixed costs per tonne. In total, $1.0 billion of structural cost improvements were identified within this fixed cost reduction program. In 2021, the Company achieved $0.6 billion of fixed cost savings relating to its previously announced $1.0 billion structural improvement plan. Savings were achieved through productivity gains and footprint optimization (following closures at Kraków, coke plant in Florange, and Saldanha); and SG&A savings including a 20% reduction in corporate office costs including headcount reduction. The Company did not make progress on its plan related to repairs and maintenance following the decision taken to maintain such expenditures at higher levels to ensure operational reliability.
In February 2022, the Company announced a new three-year $1.5 billion value plan ($1.4 billion scope adjusted for the sale of ArcelorMittal Temirtau operations on December 7, 2023) focused on creating value through well-defined commercial and operational initiatives. This plan did not include the impact of strategic capital expenditure projects (which are followed separately). The plan includes commercial initiatives, including volume/mix improvements and operational improvements (primarily in variable costs). The plan aims at protecting operating income potential of the business from rising inflationary pressures, improving its relative competitive position vis-à-vis its peers and supporting sustainably higher profits. The plan progressed during 2023, and the actions taken in 2022 and 2023 have so far yielded cumulative benefits of $0.8 billion (approximately 60% of the scope adjusted target). These include $0.3 billion of commercial initiatives, $0.3 billion of variable costs savings and $0.2 billion of fixed and logistic cost savings. With the ongoing focus to execute and deliver the value plan initiatives, the Company expects to achieve the remainder of the targets as planned in 2024.
Proven expertise in acquisitions
ArcelorMittal’s management team has proven expertise in successfully acquiring and subsequently integrating operations. The Company takes a disciplined approach to investing and uses teams with diverse areas of expertise from different
6
| Management report | ||
business units across the Company to evaluate opportunities, conduct due diligence and monitor integration and post-acquisition performance. The Company introduces focused capital expenditure programs, implements Company-wide best practices, balances working capital, ensures adequate management resources and introduces safety and environmental improvements at acquired facilities. ArcelorMittal believes that these operating and financial measures have improved the operating performance and the quality of steel produced at such facilities.
In recent years, the Company has focused on portfolio optimization including assets disposals and strategic M&A activity (see also "— Key transactions and events in 2023"). In 2022, ArcelorMittal acquired a 80% interest in voestalpine's world-class Hot Briquetted Iron ("HBI") plant in Texas and in 2023, the Company completed the acquisition of Companhia Siderúrgica do Pecém ("CSP") renamed ArcelorMittal Pecém in Brazil, a world-class operation, producing high-quality slab at a globally competitive cost. To further support its decarbonization strategy, ArcelorMittal completed the acquisitions of Riwald Recycling and Italpannelli Germany, which complement the Company's existing geographic presence and strengthen the product portfolio of ArcelorMittal Downstream Solutions' construction business.
Sustainability leadership.
ArcelorMittal is committed to leading the industry’s efforts to decarbonize, and to being part of the solution to the world reaching net-zero by 2050. As a milestone to its 2050 net-zero target, the Company has set a group target of reducing its CO2 emissions intensity by 25% by 2030, and in its European operations, by 35% by 2030 (scope 1 and 2 emissions). As innovation is central to the Company's success given the onus it places on research and development ("R&D") with the goal of ensuring ArcelorMittal is at the forefront of the evolution of steelmaking processes and products, the Company has developed the industry’s broadest and most flexible suite of low-emissions steelmaking technologies and has integrated them into two pathways, Smart Carbon and Innovative-DRI, both of which hold the potential to deliver carbon-neutral steelmaking.
Other information
ArcelorMittal is a public limited liability company (société anonyme) that was incorporated for an unlimited period under the laws of the Grand Duchy of Luxembourg on June 8, 2001. ArcelorMittal is registered at the R.C.S. Luxembourg under number B 82.454.
The mailing address and telephone number of ArcelorMittal’s registered office are:
| ArcelorMittal | ||
| 24-26, Boulevard d’Avranches | ||
| L-1160 Luxembourg | ||
| Grand Duchy of Luxembourg | ||
| Telephone: +352 4792-1 | ||
ArcelorMittal’s agent for U.S. federal securities law purposes is:
| ArcelorMittal Sales & Administration LLC | ||
| 833 W. Lincoln Highway, Suite 200E, | ||
| Schererville, IN 46375 | ||
| Telephone: +219 256 7303 | ||
Internet site
ArcelorMittal maintains an Internet site at www.arcelormittal.com. Information contained on or otherwise accessible through this Internet site is not a part of this annual report. All references in this annual report to this Internet site and to any other Internet sites (other than to specific documents furnished to or filed with the SEC and specifically incorporated by reference herein) are inactive textual references and are for information only. The SEC maintains an internet site that contains reports, proxy and information statements, and other information regarding issuers that file electronically with the SEC at www.sec.gov.
ArcelorMittal produces a range of publications to inform its shareholders. These documents are available in various formats: they can be viewed online or downloaded. Please refer to www.arcelormittal.com, where they can be located within the Investors menu, under Financial Reports, or within the Corporate Library. Any request for documents may be sent to: company.secretary@arcelormittal.com or ArcelorMittal’s registered office.
Sustainable development
ArcelorMittal’s sustainable development information is detailed in the Integrated Annual Review available within the Corporate Library on www.arcelormittal.com. The 2023 information is expected to be published during the second quarter of 2024. For further information, please refer to the section "Sustainable Development".
ArcelorMittal as parent company of the ArcelorMittal group
ArcelorMittal, incorporated under the laws of Luxembourg, is the parent company of the ArcelorMittal group and is expected to continue this role during the coming years. The Company has no branch offices.
Listings
ArcelorMittal’s shares (also referred to as "ordinary shares" or "common shares" throughout this report) are traded on several exchanges: New York (MT), Amsterdam (MT), Paris (MT), Luxembourg (MT) and on the Spanish Stock Exchanges of
7
| Management report | ||
Barcelona, Bilbao, Madrid and Valencia (MTS). Its primary stock exchange regulator is the Luxembourg CSSF ("Commission de Surveillance du Secteur Financier"). ArcelorMittal’s CSSF issuer number is E-0001.
On May 19, 2023, ArcelorMittal's outstanding 5.50% Mandatorily Convertible Subordinated Notes ("MCNs") matured and were converted into shares, leaving no MCNs outstanding or listed on the NYSE.
Indexes
ArcelorMittal is a member of more than 145 indices including: STOXX Europe 600, S&P Europe 350, CAC40, MSCI Pan-Euro, Bloomberg World Index, IBEX 35, Euronext Paris CAC Basic Materials Index, DAXglobal Steel EUR Price and Euronext
Amsterdam AEX Basic Materials Index. Recognized for its commitments to sustainable development, ArcelorMittal is also included in the FTSE4Good Index, Euronext Vigeo Europe 120 and the Euronext Most Advanced Benelux 20. Furthermore, ArcelorMittal has been participating in the Carbon Disclosure Project since 2005 and the United National Global Compact since 2003.
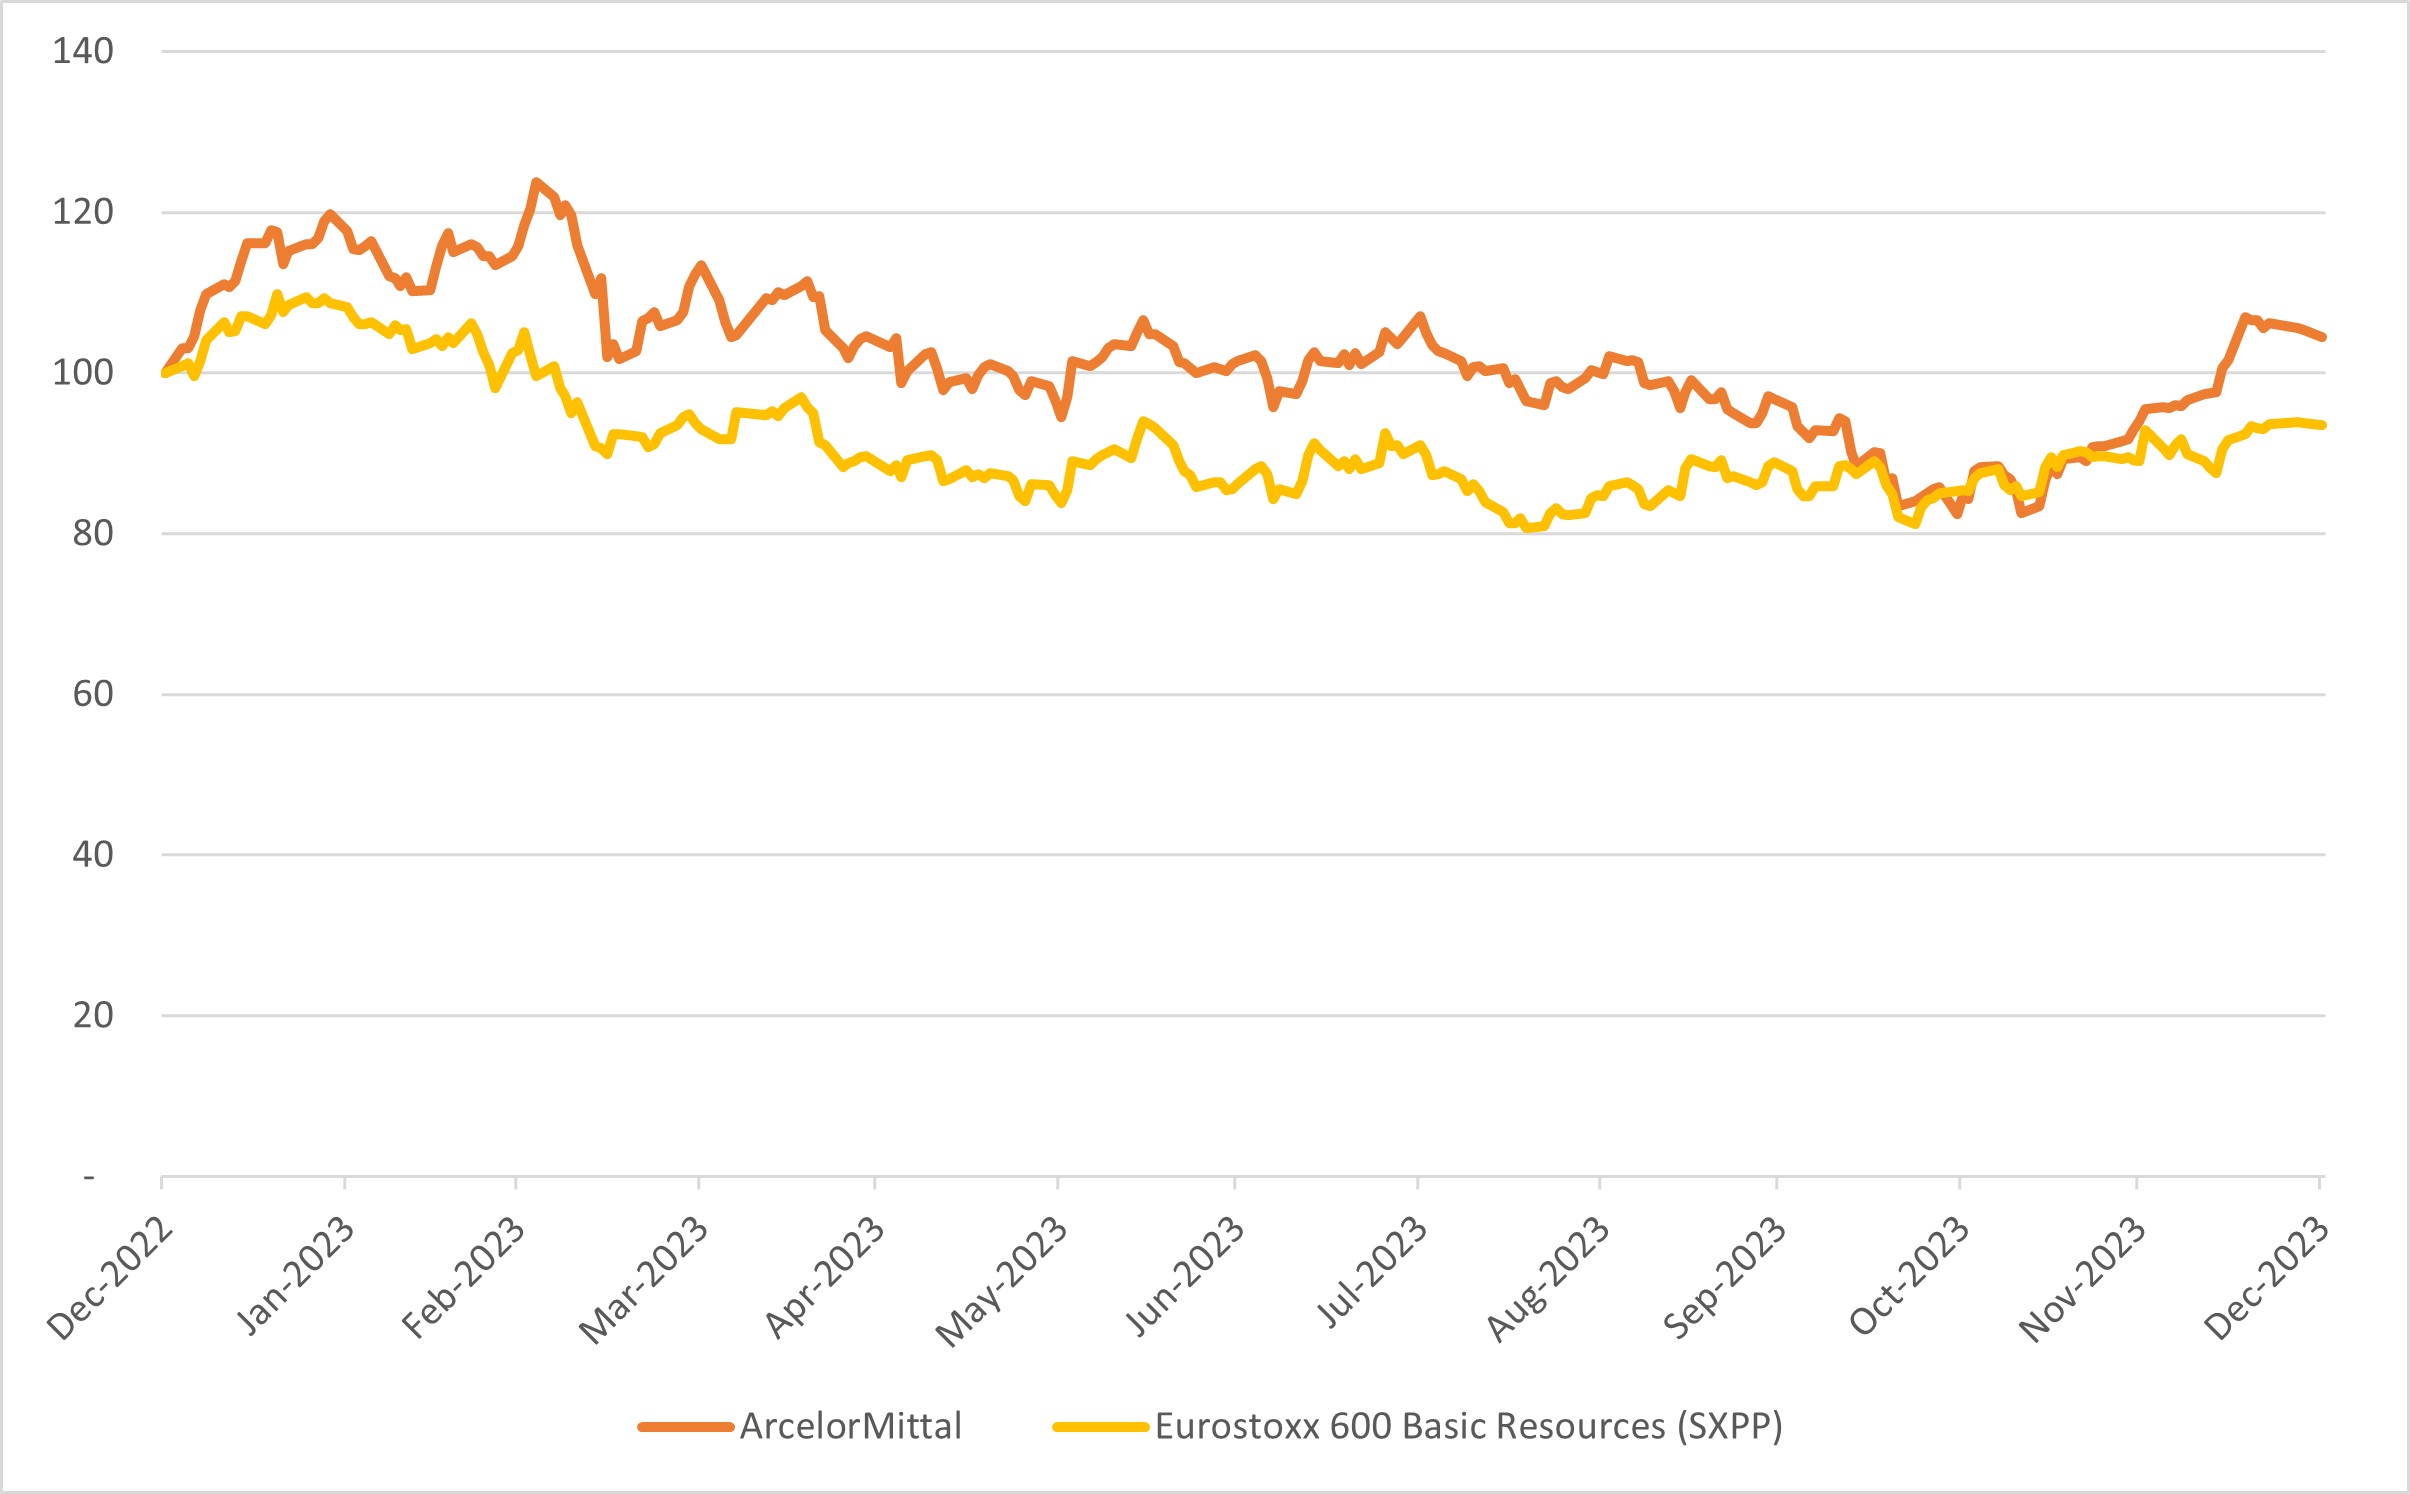
Share price performance
During 2023, the price of ArcelorMittal shares increased by 8.2% in dollar terms compared to 2022 year on year; the chart below shows a comparison between the performance of ArcelorMittal’s shares and the Eurostoxx600 Basic Resource (SXPP).
Capital return policy
On May 2, 2023, at the annual general meeting of shareholders ("AGM"), the shareholders approved the dividend of $0.44 per share proposed by the Board of Directors. The dividend amounted to $369 million and payment included two installments; the first installment of $185 million was paid on June 15, 2023 and the second installment of $184 million was paid on December 7, 2023.
In accordance with its capital return policy, the Company expects to pay a base annual dividend (to be progressively
increased over time). In addition, a minimum of 50% of the amount of free cash flow (calculated as net cash provided by operating activities less purchases of property, plant and equipment and intangibles ("capital expenditures") less dividends paid to non-controlling shareholders) remaining after paying the base annual dividend is allocated to a share buyback program. Should the ratio of net debt to operating income (loss) less depreciation, impairment and special items be greater than 1.5x then the share buyback will not be made.
8
| Management report | ||
During 2023, as part of its capital return policy and pursuant to the authorization given by the annual general meeting of shareholders on May 4, 2022, ArcelorMittal completed a share buyback program on March 31, 2023. On May 5, 2023, the Company announced another share buyback program pursuant to the authorization of the AGM held on May 2, 2023, which remains outstanding as of the date of this annual report. Including the $8.6 billion from share buyback programs that were completed from 2020 to 2022 and $1.2 billion from shares repurchased during 2023, the Company returned in total $12 billion to shareholders under the above-mentioned capital return policy. Additional buybacks under the outstanding buyback program announced in May 2023 will be allocated to the 2024 capital return (targeting 50% of post-dividend free cash flow as per the policy). For further information on buybacks, see "Purchases of equity securities by the issuer and affiliated purchasers".
In February 2024, the Board of Directors recommended a 14% increase of the base annual dividend to $0.50/share (from $0.44/share paid in 2023) to be paid in two equal installments in June 2024 and December 2024, subject to the approval of shareholders at the annual general meeting of shareholders in April 2024.
Investor relations
ArcelorMittal has a dedicated investor relations team at the disposal of analysts and investors. By implementing high standards of financial information disclosure and providing clear, regular, transparent and even-handed information to all its shareholders, ArcelorMittal aims to be the first choice for investors in the sector.
To meet this objective and provide information to fit the needs of all parties, ArcelorMittal implements an active and broad investor communications policy: conference calls, road shows with the financial community, regular participation at investor conferences, plant visits and meetings with individual investors.
ArcelorMittal’s senior management plans to meet investors and shareholder associations in such events throughout 2024.
Investors may use the following e-mails or contact numbers to reach the investor relations team:
| investor.relations@arcelormittal.com | +44 203 214 2893 | ||||
| creditfixedincome@arcelormittal.com | +33 1 7192 1026 | ||||
Sustainable responsible investors
The Investor Relations team is also a source of information for the growing sustainable responsible investment community. The team organizes special events on ArcelorMittal’s corporate responsibility strategy and answers all requests for information
sent to the Group at investor.relations@arcelormittal.com or may be contacted at +44 7435 192 206.
Financial calendar
The schedule is available on ArcelorMittal’s website www.arcelormittal.com under Investors, Financial calendar.
| Financial results*: | |||||
| Results for the 1st quarter 2024 | May 2, 2024 | ||||
| Results for the 2nd quarter 2024 and 6 months 2024 | August 1, 2024 | ||||
| Results for the 3rd quarter 2024 | November 7, 2024 | ||||
| Meeting of shareholders: | |||||
| Annual general meeting of shareholders | April 30, 2024 | ||||
* Earnings results are issued before the opening of the stock exchanges on which ArcelorMittal is listed.
Cautionary Statement Regarding Forward-Looking Statements
This annual report contains forward-looking statements based on estimates and assumptions. This annual report contains forward-looking statements within the meaning of the Private Securities Litigation Reform Act of 1995. Forward-looking statements include, among other things, statements concerning the business, future financial condition, results of operations and prospects of ArcelorMittal, including its subsidiaries. These statements usually contain the words “believes”, “plans”, “expects”, “anticipates”, “intends”, “estimates” or other similar expressions. For each of these statements, you should be aware that forward-looking statements involve known and unknown risks and uncertainties. Although it is believed that the expectations reflected in these forward-looking statements are reasonable, there is no assurance that the actual results or developments anticipated will be realized or, even if realized, that they will have the expected effects on the business, financial condition, results of operations or prospects of ArcelorMittal.
These forward-looking statements speak only as of the date on which the statements were made, and no obligation has been undertaken to publicly update or revise any forward-looking statements made in this annual report or elsewhere as a result of new information, future events or otherwise, except as required by securities and other applicable laws and regulations. A detailed discussion of principal risks and uncertainties which may cause actual results and events to differ materially from such forward-looking statements is included in the section titled “Risk factors”.
All information that is not historical in nature and disclosed under “Operating and financial review” is deemed to be a forward-looking statement.
9
| Management report | ||
Market information
This annual report includes industry data and projections about the Company’s markets obtained from industry surveys, market research, publicly available information and industry publications. Statements on ArcelorMittal’s competitive position contained in this annual report are based primarily on public sources including, but not limited to, published information from the Company's competitors. Industry publications generally state that the information they contain has been obtained from sources believed to be reliable but that the accuracy and completeness of such information is not guaranteed and that the projections they contain are based on a number of significant assumptions. The Company has not independently verified this data or determined the reasonableness of such assumptions. In addition, in many cases the Company has made statements in this annual report regarding its industry and its position in the industry based on internal surveys, industry forecasts and market research, as well as the Company’s experience. While these statements are believed to be reliable, they have not been independently verified.
Financial information
This annual report contains the audited consolidated financial statements of ArcelorMittal and its consolidated subsidiaries, including the consolidated statements of financial position as of December 31, 2023 and 2022, and the consolidated statements of operations, other comprehensive income, changes in equity and cash flows for each of the years ended December 31, 2023, 2022 and 2021. ArcelorMittal’s consolidated financial statements were prepared in accordance with International Financial Reporting Standards (“IFRS”) as issued by the International Accounting Standards Board (“IASB”).
The financial information and certain other information presented in a number of tables in this annual report have been rounded to the nearest whole number or the nearest decimal. Therefore, the sum of the numbers in a column may not conform exactly to the total figure given for that column. In addition, certain percentages presented in the tables in this annual report reflect calculations based upon the underlying information prior to rounding and, accordingly, may not conform exactly to the percentages that would be derived if the relevant calculations were based on the rounded numbers. This annual report includes net debt, operating working capital, gearing and free cash flow, which are non-GAAP financial measures. ArcelorMittal believes net debt, operating working capital, gearing and free cash flow to be relevant to enhance the understanding of its financial position and provides additional information to investors and management with respect to the Company’s operating cash flows, capital structure and credit assessment. In addition, it refers to “special” items in its capital return policy which will be used to determine if the base dividend will be paid. “Special” items relate to events or charges that the
Company does not consider to be part of the normal income generating potential of the business. Items may qualify as “special” although they may have occurred in prior years or are likely to recur in following years. Non-GAAP financial measures should be read in conjunction with and not as an alternative for, ArcelorMittal’s financial information prepared in accordance with IFRS. Such non-GAAP measures may not be comparable to similarly titled measures applied by other companies.
Key transactions and events in 2023
During 2023, ArcelorMittal completed several financing and liability management transactions. Please refer to "Operating and financial review—Liquidity and capital resources—Financings" of this report for a summary of these transactions.
•On April 3, 2023, the Company announced that it had completed the 60,431,380 shares buyback program announced on July 29, 2022 under the authorization given by the annual general meeting of shareholders of May 4, 2022.
•On April 28, 2023, the Company announced that 25 million treasury shares were cancelled to keep the number of treasury shares the Company holds within appropriate levels.
•On May 5, 2023, ArcelorMittal announced the commencement of a new buyback program of up to 85 million shares under the authorization given by the annual general meeting of shareholders of May 2, 2023, to be completed by May 2025. The actual amount of shares that will be repurchased pursuant to this program will depend on the level of post-dividend free cash flow generated over the period (the Company’s defined policy is to return a minimum of 50% of post-dividend annual free cash flow), the continued authorization by shareholders, and market conditions.
•On May 19, 2023, the Company delivered a total of 57,057,991 treasury shares upon mandatory conversion of the 24,290,025 outstanding 5.50% mandatorily convertible subordinated notes due May 18, 2023.
•On October 28, 2023, ArcelorMittal confirmed that earlier in the day, a tragic accident occurred at its Kostenko coal mine which resulted ultimately in 46 fatalities. No words can adequately convey the devastation the Company feels following this accident. ArcelorMittal and the government of Kazakhstan signed a preliminary agreement for a transaction that would transfer ownership to the Republic of Kazakhstan, and on December 8, 2023, ArcelorMittal announced the completion of the sale of ArcelorMittal Temirtau to Qazaqstan Investment Corporation ("QIC"), a state-controlled direct investment fund. Under the terms of the transaction, on closing ArcelorMittal received
10
| Management report | ||
consideration of $286 million and a further $250 million as repayment of outstanding intra-group dues. ArcelorMittal will also receive an additional sovereign-fund guaranteed payment of $450 million, paid in four equal annual installments, as repayment of an intra-group loan. All ArcelorMittal Temirtau assets were transferred on an ‘as is’ operational basis, meaning QIC assumed control and accountability for ArcelorMittal Temirtau’s operations, which were subsequently renamed.
•On December 22, 2023, ArcelorMittal announced that it had engaged dss+, a leading provider of sustainable operations management consulting services, to conduct a Company-wide audit of its safety practices.
In addition, the Company completed the following additional acquisitions:
•On January 3, 2023 and March 10, 2023, ArcelorMittal completed the acquisition of Riwald Recycling ("Riwald"), a state-of-the-art ferrous scrap metal recycling business based in the Netherlands in the framework of its decarbonization strategy and Italpannelli Germany, a German insulation panel manufacturer which complements the existing geographic presence and strengthens the product portfolio of ArcelorMittal Downstream Solutions' construction business, respectively. The total cash consideration paid for both acquisitions was €144 million ($154 million).
•On March 9, 2023, ArcelorMittal announced that following receipt of customary regulatory approvals it had completed the acquisition of Companhia Siderúrgica do Pecém (‘CSP’) (renamed ArcelorMittal Pecém) in Brazil for an enterprise value of approximately $2.2 billion. CSP is a world-class operation, producing high-quality slab at a globally competitive cost. Its facility, located in the state of Ceará in northeast Brazil was commissioned in 2016. It operates a three-million tonne capacity blast furnace and has access via conveyors to the Port of Pecém, a large-scale, deepwater port located 10 kilometers from the plant. The acquisition offers significant operational and financial synergies and brings with it the potential for further expansions, such as the option to add primary steelmaking capacity (including direct reduced iron) and rolling and finishing capacity. Given its location, CSP also presents an opportunity to create a new low-carbon steelmaking hub, capitalizing on the state of Ceará’s ambition to develop a low-cost green hydrogen hub in Pecém.
Recent Developments
•On February 20, 2024, ArcelorMittal announced the decision of Italian Government to place Acciaierie d’Italia SpA (‘ADI’) into extraordinary administration subsequent to the request of Invitalia, thereby passing
control of the company from its current shareholders, ArcelorMittal and Invitalia, to government appointed commissioners. This ends ArcelorMittal’s involvement in ADI, which started in 2018. Since 2018, ArcelorMittal has been fully committed to the people and assets of ADI, then known as Ilva, investing over €2 billion. This very significant investment enabled ADI to complete an extensive €800 million environmental program on time that ensured compliance with the Integrated Environmental Authorization set out by the Italian Government, as well as invested €1.2 billion in upgrading equipment at all sites. ADI also benefited from hundreds of millions of euros of credit through the provision of raw materials by ArcelorMittal. ArcelorMittal had been keen to address the significant discrepancy in capital investment into ADI by the two shareholders. In recent discussions, ArcelorMittal put forward pragmatic proposals to address this while continuing the public-private partnership with Invitalia that was established in April 2021. When the shareholders were not able to agree on acceptable terms, ArcelorMittal also offered to sell its shareholding in ADI to Invitalia. The discussions, despite ArcelorMittal’s best efforts, were not successful. This situation could have been avoided if ADI had been able (after April 2021) to access traditional debt financing and been able to raise the working capital required to fund its ongoing needs, rather than relying on equity injections from its shareholders as its sole source of capital. Unfortunately, the conditions precedent to allow ADI to convert its lease of the assets into a formal purchase – conditions that ADI has no control over, were originally set to be completed before May 2022, and subsequently extended to May 2024, remain unsatisfied as of date. ADI’s financial situation has been further impacted by the Italian Government delivering less than one-third of the €2 billion of support measures it offered to ADI, at the time the public-private partnership with Invitalia was established.
Sustainable development highlights - striving to be a leader in the decarbonization of the steel industry
•On January 27, 2023, ArcelorMittal announced it invested $36 million in Boston Metal. The transaction was the Company’s largest single initial investment to date through its XCarb® Innovation Fund. ArcelorMittal’s investment led a $120 million Series C fundraising round undertaken by Boston Metal. Other participants in the round include Microsoft’s Climate Innovation Fund and Site Ground Capital, who joined Boston Metal’s existing shareholder register which includes Breakthrough Energy Ventures,
11
| Management report | ||
mining majors Vale and BHP, BMW i Ventures and several cleantech venture capital funds.
•On April 18, 2023, ArcelorMittal announced that ArcelorMittal Brasil, would form the joint venture partnership Ventos de Santo Antonio Comercializadora de Energia S.A. ("VdSA") with Casa dos Ventos, one of Brazil’s largest developers and producers of renewable energy projects, to develop a 554 MW wind power project. ArcelorMittal Brasil holds a 55% stake in the joint venture, with Casa dos Ventos holding the remaining 45%. The transaction was approved by the Brazilian antitrust authority, CADE, on April 13 and was completed on May 5, 2023. The $0.8 billion project aims to secure and decarbonize a considerable proportion of ArcelorMittal Brasil’s future electricity needs and is estimated to provide 38% of ArcelorMittal’s Brasil’s total electricity needs in 2030. VdSA is equity accounted, and ArcelorMittal’s total equity investment will be $0.15 billion. The project is located in the central region of Bahia, north-east Brazil. The site location has been selected due to several competitive advantages, including high-capacity forecast load factors (in excess of 50%) and a short distance (23 kilometers) to connect to the national electricity grid. There is also the potential to expand the capacity of the project by adding a further 100 MW of solar power. Environmental and regulatory permitting is in the process of finalization; construction work started in 2023 with operational commissioning expected in 2025. ArcelorMittal Brasil will enter into a 20-year power purchase agreement with VdSA for the supply of electricity.
•On June 14, 2023, ArcelorMittal and LanzaTech Global Inc. announced the successful commencement of production from ArcelorMittal’s commercial flagship carbon capture and utilization ("CCU") facility in Ghent, Belgium. The €200 million ‘Steelanol’ facility is a first of its kind for the European steel industry, deploying technology developed by leading carbon utilization company LanzaTech. This is the first step toward full operation of a commercial scale facility that will capture carbon-rich waste gases from steelmaking and biologically convert them into advanced ethanol through LanzaTech’s biobased process. Unlike traditional fermentation, the process ferments gases instead of sugars and uses a biocatalyst instead of yeast. The facility was inaugurated in December 2022, with cold commissioning taking place thereafter. The biocatalyst has now been introduced into the facility (a process called inoculation) to begin growth and verify production of new molecules. In May 2023, the first gases from the steel mill’s blast furnace were safely introduced to LanzaTech’s biocatalyst. After a successful inoculation, initial samples that contained ethanol were produced during the second week of June 2023, demonstrating that the carbon in the gases is being converted into new chemical products.
Commercial-scale ethanol production from the bioreactors commenced in November 2023, and further ramp-up of production is ongoing. This advanced ethanol can then be used as a building block to produce a variety of products, including sustainable transport fuels, packaging materials, apparel, and even cosmetic fragrances, hence helping to advance the decarbonization efforts of the global chemical sector. The ethanol will be jointly marketed by ArcelorMittal and LanzaTech under the Carbalyst® brand name. The Steelanol plant has the annual capacity to produce 80 million liters of ethanol, around half of the total current demand in Belgium. It expects to reduce carbon emissions from the Ghent plant by 125,000 tonnes annually, thereby advancing the EU’s 2030 Climate Target Plan to reduce greenhouse gas ("GHG") emissions by 55% by the end of the decade. Project partners include Primetals Technologies and E4tech with support from CINEA, the European Climate, Infrastructure and Environment Executive Agency. The product samples from the facility mark an important step toward the circular use of carbon and the end of single-use carbon, whereby gases are no longer regarded as waste but as raw materials. In addition, the recycling of carbon means Steelanol’s process of Carbalyst® ethanol production does not compete in any way with food crops, as is the case for traditional methods of ethanol production. The LanzaTech process implemented at the Ghent site is fully flexible: not only can it use industrial gases from today’s steel production methods but it can also adapt as industry transitions to future steel production technologies with increased green hydrogen input. This versatility enables the carbon recycling application to evolve with available residue, waste streams, and green H2. LanzaTech’s process is already employed by three operational commercial facilities, and LanzaTech launched two additional commercial facilities in Asia in 2023. Funding for the commercial Steelanol facility was obtained from various sources, including the Flemish government, the Belgian federal government and the European Union’s Horizon 2020 research and innovation program under grant agreement No 656437. Part of the funding was also secured with a loan from the European Investment Bank. The Steelanol facility reached full operational capacity in November 2023.
•On June 14, 2023, ArcelorMittal and John Cockerill announced plans to develop an industrial scale low temperature, iron electrolysis plant. The Volteron™ (a carbon free, cold direct electrolysis process that extracts iron from iron ore using electricity; on a pilot scale plant, the process has proved to be highly efficient using standard iron ore; the iron plates created during the electrolysis process are then processed into steel in an electric arc furnace) plant is targeted in a first phase to produce
12
| Management report | ||
between 40,000 and 80,000 tonnes a year of iron plates and to start production in 2027. Once the technology has been proven at this scale, the intention is to increase the plant’s annual capacity to between 300,000 and 1,000,000 tonnes.
•On June 16, 2023, ArcelorMittal confirmed its plan to invest €67 million in a new EAF at its Belval site. This investment is part of a series of projects that were the subject of an MoU signed in September 2022 between ArcelorMittal Luxembourg and the Ministry of the Economy. The MoU confirmed the willingness of the Luxembourg government to financially support this type of strategic investment, through the various applicable aid mechanisms.
•On June 19, 2023, ArcelorMittal and SEKISUI CHEMICAL announced that their carbon recycling project achieved target ahead of schedule. Both companies have been partnering on a project to capture and reuse CO2 emitted during steelmaking. As part of this partnership, ArcelorMittal and SEKISUI CHEMICAL have been supported by the New Energy and Industrial Technology Development Organization (NEDO), Japan’s national research and development agency, and have launched an “International collaboration on CCU for circular carbon in Steelmaking” (hereafter, the NEDO project), scheduled for three years from 2021. One of the research topics is to develop a fundamental technology for Synthesis Gas (carbon monoxide and hydrogen) production using SEKISUI CHEMICAL’s unique chemical looping technology.
•On June 21, 2023, the Labour Inspectorate of the French government ordered the temporary administrative closure of part of the Fos-sur-Mer site due to dust and crystalline silica at the Company's steel works. The decision was subsequently suspended after being reviewed by the Marseille Administrative Court. ArcelorMittal's action plan to strengthen health protection measures has been accelerated (in consultation with the Labour Inspectorate and Trade Unions). The plan contains more than 80 actions including the search for a product to replace crystalline silica used in continuous casting with the support of our R&D team, an intensive industrial cleaning campaign. All dust collection, ventilation and capture systems are being reviewed and improved where necessary. In addition, intensive awareness-raising and training initiatives are continuing, in particular as part of the accelerated introduction of ventilated breathing masks (by the end of July 2023, 687 of such masks were distributed to all relevant employees at the steel mill).
•On July 20, 2023, the European Commission approved €850 million state aid for ArcelorMittal's Dunkirk site for the construction of a 2.5 million tonne DRI facility and 2 new EAFs. This followed the European Commission approval on
June 22, 2023, of €280 million in state aid to be provided by the Belgian authorities for the Company's DRI – EAF decarbonization project in Belgium (2.5 million tonne DRI and 2 new EAFs). The overall support that ArcelorMittal will receive from the Belgian and French authorities is commensurate with the Company's broader ask to its host governments for its decarbonization projects. Funding approval decisions for the Company's German project remain outstanding.
•On July 11, 2023, ArcelorMittal announced that its XCarb™ Innovation Fund was launching an accelerator program to fund and support the next wave of breakthrough ideas on decarbonization emerging from India. With the XCarb™ India Accelerator Program, ArcelorMittal, collaborating with the Indian Institute of Technology Madras, whose pedigree in nurturing ideas and mentoring will be applied to support start-ups or early stage companies selected, enables them to scale their technologies and business models from lab to the market. The program will also be supported by ArcelorMittal’s joint venture AMNS India which is actively developing its own decarbonization strategy and initiatives for lower emissions domestic steel manufacturing. Successful participants will have access to expertise, resources and advice from ArcelorMittal and AMNS India.
•On November 15, 2023, ArcelorMittal announced its entry into the additive manufacturing (AdM) market as a steel powder supplier. The Company is building an industrial-scale inert gas atomizer in Aviles, Spain, to produce steel powders for AdM technologies such as laser powder bed fusion (LPBF), binder jetting (BJ) and direct energy deposition (DED). The atomizer, which started production in January 2024, will have a large batch-size production capability, from 200 kg to 3 tonnes, and an initial annual capacity of 1,000 tonnes. This will enable ArcelorMittal to supply significant volumes of steel powders with consistent quality, reliability and traceability, meeting the high standards and specifications of the AdM industry. In line with ArcelorMittal's sustainability and decarbonization efforts, the Company is committed to advancing the sustainability of additive manufacturing.
•On November 15, 2023, ArcelorMittal and Schneider Electric, a leader in the digital transformation of energy management and automation, announced a partnership whereby ArcelorMittal will supply Schneider Electric with XCarb® recycled and renewably produced steel for its electrical cabinets and enclosures. Produced at ArcelorMittal’s site in Sestao, Spain, XCarb® recycled and renewably produced steel is made using a very high proportion of recycled steel in an electric arc furnace, powered with 100% renewable electricity. This results in CO₂ emissions which are close to 70% lower than the same product made without XCarb® recycled and renewably
13
| Management report | ||
produced steel. ArcelorMittal’s XCarb® recycled and renewably produced steel will be used by Schneider Electric to manufacture the new PanelSeT SFN floor-standing enclosures built to protect large electrical panels for industrial automation, power distribution and electronic applications. As these enclosures are built to withstand tough operating environments, the XCarb® recycled and renewably produced steel is also coated with Magnelis®, a metallic coating offering high corrosion protection. The partnership is the result of several months of technical partnership and collaboration between ArcelorMittal Steel Services Centre Europe and Schneider Electric to find the right grade of steel and coating for the project.
•On November 28, 2023, ArcelorMittal announced that ArcelorMittal Asturias had signed a contract with industrial engineering company Sarralle, to build a new electric EAF in Gijón, as part of the company’s decarbonization plan for Spain. Civil works on the site will start early 2024. Once the new 1.1 million tonne EAF is operational, the site will be able to switch to producing low carbon-emissions steel for the long products sector, specifically rails and wire rod, making the site highly competitive, in particular for sectors with stringent carbon criteria for public procurement contracts. Currently, these products are made via the blast furnace route. In addition, a de-dusting system and waste heat recovery unit will be installed by Sarralle, as part of the project and in order to maximize energy efficiency in the new EAF. The project is part of ArcelorMittal Europe’s commitment to reduce CO2 emissions by 35% by 2030.
•On December 20, 2023, ArcelorMittal Belgium commissioned its Torero plant, which converts waste wood into bio-coal for use in the blast furnace at its Ghent steelmaking site. The first bio-coal made in the Torero plant, through a process known as torrefaction, was successfully used in a blast furnace in Ghent on December 18, 2023. The project will reduce annual carbon emissions from the plant by 112,500 tonnes, by reducing the use of fossil coal in the blast furnace. The Torero industrial-scale demonstration plant will convert 88,000 tonnes of waste wood into 37,500 tonnes of bio-coal annually. The use of bio-coal in the blast furnace process will result in the production of bio-gas, which will be captured and transformed into ethanol by ArcelorMittal Ghent’s Steelanol facility.
Recent Developments
•On January 3, 2024, ArcelorMittal announced that it had established a partnership with the Indian Institute of Technology Madras ("IIT Madras") and is working closely with IIT Madras’ Hyperloop Technology teams - Avishkar Hyperloop, student team and TuTr Hyperloop, a start-up incubated at IIT Madras, which are developing cost-
effective Hyperloop technologies for passenger and cargo mobility at scale.
•On January 15, 2024, Bruno Le Maire, the French Minister for Economy and Finance was welcomed to the Company's Dunkirk steelworks by Eric Niedziela, Chairman, ArcelorMittal France, and members of the French executive management team. The visit was designed to update Mr Le Maire on the decarbonization plans and progress at ArcelorMittal's French steelmaking operations. ArcelorMittal’s decarbonization plans in France have also received a boost through a letter of intent signed on the same date with French state-owned energy supplier EDF Energy for the long-term supply of low-carbon electricity to its French steelmaking sites in Dunkirk and Fos-sur-Mer.
•On January 16, 2024, ArcelorMittal announced that it has established a partnership with Vestas, the energy industry’s global partner on sustainable energy solutions, to launch a low carbon-emissions steel offering that significantly reduces the lifetime carbon dioxide emissions from the production of wind turbine towers. The low carbon-emissions steel is produced using 100% steel scrap which is melted in an electric arc furnace powered by 100% wind energy at the ArcelorMittal steel mill, Industeel Charleroi, in Belgium. The steel slabs are then transformed into heavy plates used for the manufacture of wind turbine towers, at ArcelorMittal’s heavy plate mill in Gijón, Spain. These heavy plates, made with XCarb® recycled and renewably produced heavy plate steel, are initially suitable for the entire onshore wind turbine towers and the top section of offshore wind turbine towers.
14
Risk Factors and Control
Risk factors
ArcelorMittal’s business, financial condition, results of operations, reputation or prospects could be materially and adversely affected by one or more of the risks and uncertainties described below.
I. Risks related to the global economy and the mining and steel industry
Prolonged low steel and (to a lesser extent) iron ore prices and/or low steel demand would have an adverse effect on ArcelorMittal’s results of operations.
As an integrated producer of steel and iron ore, ArcelorMittal’s results of operations are sensitive to the market prices of, and demand for, steel and iron ore in its markets and globally. The impact of market steel prices on its results is direct while the impact of market iron ore prices is both direct and indirect, as ArcelorMittal sells iron ore on the market to third parties (in which case it benefits from higher iron ore market prices), and indirect, as iron ore is a principal raw material used in steel production and fluctuations in its market price are typically and eventually (with the timing dependent on steel market conditions) passed through to steel prices (with any lags in passing on higher prices “squeezing” steel margins, as discussed below). Steel and iron ore prices are affected by supply and demand trends and inventory cycles. In terms of demand, steel and iron ore prices are sensitive to trends in cyclical industries, such as the automotive, construction, appliance, machinery, equipment and transportation industries, which are significant markets for ArcelorMittal’s products (with automotive being particularly significant). More generally, steel and iron ore prices are sensitive to macroeconomic fluctuations in the global economy which are impacted by many factors ranging from trade and geopolitical tensions to global and regional monetary policy to specific disruptive events such as pandemics, wars and natural disasters. In the past, substantial price decreases during periods of economic weakness have not always been offset by commensurate price increases during periods of economic strength. In addition, as further discussed below, excess supply relative to demand for steel in local markets generally results in increased exports and drives down regional or global prices. In terms of inventory, steel stocking and destocking cycles affect apparent demand for steel and hence steel prices and steel producers’ profitability. For example, steel distributors may accumulate substantial steel inventories in periods of low prices and, in periods of rising real demand for steel from end-users, steel distributors may sell steel from inventory (destock), thereby delaying the effective implementation of steel price increases. Conversely, steel price decreases can sometimes develop their own momentum, as customers adopt a “wait and see” attitude and destock in the expectation of further price decreases.
As a result of these factors, steel and iron ore prices fluctuate substantially and have come under pressure at various points in recent periods. See “Operating and financial review—Key factors affecting results of operations”.
More specifically in terms of near to mid-term risks for the Company in this respect, the fall in international spot steel prices in 2022 and 2023 stemmed from a broader trend in slowing steel demand. Macroeconomic conditions are fragile and uncertain, including due to geopolitical developments, particularly Russia’s invasion of Ukraine and the Israel-Hamas conflict, and actions taken by central banks to combat inflation (in particular raising interest rates sharply in 2022 and 2023). As interest rates remain high, the risk of a global recession remains. Significant energy supply and cost issues in Europe increase the risk of manufacturers being unable to operate at full capacity, potentially lowering demand for steel and straining steel prices. Many steel customers began to destock and adopt a “wait and see” approach in the summer of 2022, and steel demand, particularly in Europe, continued to decline during the second half of 2023, causing steel users to destock further, resulting in a second consecutive year of destocking. The fragility of the Chinese economy, which suffered from the negative effects of repeated strict lockdowns that ran until December 2022 and more recently from a weak real estate sector, slowing economic growth, accelerating deflation and general uncertainty also add to risks of a global slowdown and lower global steel demand and prices. Prior recessions have generally resulted in lower steel demand and steel prices, with consequential material adverse impacts on steel companies’ results. Any significant decline in steel prices also increases the risk of inventory-related charges, such as those that ArcelorMittal recorded in 2019 and 2022. In addition, the impact of lower steel prices on ArcelorMittal’s results is subject to a lag effect (due to its contracts), and therefore the impact is felt beyond the duration of any decline in spot steel prices.
The trajectory of steel demand and prices going forward, in particular in 2024, is difficult to predict due to such variables as the duration of the ongoing conflict in Ukraine, the Israel-Hamas conflict and the risk of additional conflicts in the region, related risks on global energy supply and hence on industrial production and consequentially demand for steel, import volumes (in particular from China given trends in domestic supply and demand) and tariff levels and inventories. Any economic downturn globally or in certain regions may result in lower steel demand and lower steel and iron ore prices. A scenario of
15
| Management report | ||
prolonged low steel and (to a lesser extent or if simultaneous) iron ore prices, whether or not combined with low steel demand, would have a material adverse effect on ArcelorMittal’s results of operations and financial condition.
Volatility in the supply and prices of raw materials, energy and transportation, and volatility in steel prices or mismatches between steel prices and raw material prices could adversely affect ArcelorMittal’s results of operations.
As a producer and seller of steel, the Company is directly exposed to fluctuations in the market price for steel, iron ore, coking coal and other raw materials, energy and transportation. In particular, steel production consumes substantial amounts of raw materials including iron ore, coking coal and coke, and the production of direct reduced iron, the production of steel in EAF and the re-heating of steel involve the use of significant amounts of energy, making steel companies dependent on the price of and their reliable access to supplies of raw materials and energy. In the fourth quarter of 2021 and throughout 2022, the Company became subject to increasing inflationary cost pressures, in particular with the prices of electricity, natural gas and CO2 all increasing significantly, putting pressure on steel price spreads in an initially high steel price environment and then deflationary steel price environment, resulting in a compression of steel spreads, which started in the second quarter of 2022. As a result of this pressure and the decrease in demand, the Company reduced or ceased production at certain plants, in particular in Europe, including measures to cut higher cost capacity and reduce European gas consumption. While there has been some easing of energy costs since the fourth quarter of 2022 and the Company began gradually resuming capacity in certain locations in early 2023, the Company continued to face compression of spreads throughout 2023 as steel prices declined in the second half, and the pace of the decline in steel prices has been greater than the reduction in the raw material basket. In the fourth quarter of 2023, the Company again cut production at certain sites in Europe.
The Company incurs operating costs when production capacity is idled and/or increased costs to resume production at idled facilities. Idling can also impact the long-term health of assets, despite steps taken to protect them.
Although ArcelorMittal has substantial sources of iron ore from its own mines (the Company’s self-sufficiency rate was 57% for iron ore in 2023), it nevertheless remains exposed to volatility in the supply and price of iron ore and coking coal given that it obtains a significant portion of such raw materials under supply contracts from third parties. For additional details on ArcelorMittal’s raw materials supply and self-sufficiency, see “Business overview—Products—Mining products” and “Business overview—Products—Other raw materials and energy.” The prices of steel, iron ore, coking coal and scrap have been highly volatile in recent years. Volatility in steel and
raw material prices can result from many factors including: trends in demand for iron ore in the steel industry itself, and particularly from Chinese steel producers (as the largest group of producers); industry structural factors (including the oligopolistic nature of the seaborne iron ore industry and the fragmented nature of the steel industry); the expectation or imposition of corrective trade measures such as tariffs; massive stocking and destocking activities (sudden drops in prices can lead end-users to delay orders pushing prices down further); speculation; new laws or regulations; changes in the supply of iron ore, in particular due to new mines coming into operation; business continuity of suppliers; changes in pricing models or contract arrangements; expansion projects of suppliers; worldwide production, including interruptions thereof by suppliers; capacity-utilization rates; accidents or disruptions at suppliers’ premises or along the supply chain as occurred in 2019, 2021, 2022 and 2023; wars, natural disasters, public health epidemics (such as the COVID-19 pandemic which substantially depressed demand for steel for an extended period in 2020), political disruption and other similar events; fluctuations in exchange rates; the bargaining power of raw material suppliers and the availability and cost of transportation. Industry and overall decarbonization efforts may also result in increased and/or volatile prices, in particular, higher energy and CO2 prices as well as scrap prices (due in particular to an industry shift to EAF production). For further information on the movement of raw material prices in recent years, see “Operating and financial review—Key factors affecting results of operations—Raw materials”.
Furthermore, while steel and raw material (in particular iron ore and coking coal) price trends have historically been correlated, a lack of correlation or an abnormal lag in the corollary relationship between raw material and steel prices also occurs regularly, resulting in a “price-cost effect” in the steel industry. ArcelorMittal has experienced negative price-cost effects (or “squeezes”) at various points in recent years, including in 2021, 2022 and 2023, and will likely continue to do so as this is a structural feature. In some of ArcelorMittal’s segments, in particular Europe and NAFTA, there is a lag of several months between raw material purchases and sales of steel products incorporating those materials, rendering them particularly susceptible to price-cost effects. For example, coking coal sourced from Australia takes several weeks to reach Europe (e.g. approximately four weeks sailing time, plus loading/unloading time at ports), creating a structural lag. Sudden spikes in raw materials, such as coking coal, have occurred in the past and may occur in the future. Because ArcelorMittal sources a substantial portion of its raw materials through long-term contracts with quarterly (or more frequent) formula-based or negotiated price adjustments and as a steel producer sells a substantial part of its steel products at spot prices, it faces the risk of adverse differentials between its own production costs,
16
| Management report | ||
which are affected by global raw materials and scrap prices, on the one hand, and trends for steel prices in regional markets, on the other hand. The price-cost dynamic in the most recent periods can be summarized as follows: The significant increase in steel prices in the fourth quarter of 2020 resulted in a multi-year high in steel spreads (which was not fully reflected in the Company’s performance due to lag effect). This trend continued through the third quarter of 2021 before prices came off their highest levels in the fourth quarter of 2021, while high raw material and energy costs put increasing pressure on margins. The trend then shifted in the second half of 2022, as energy costs continued to increase while steel prices declined. Negative price-cost effects continued in 2023, as the pace of the decline in steel prices was greater than the reduction in the raw material basket. More generally and in sum, the relationship between input (and in particular raw material) costs and steel selling prices and the time lag between them structurally subjects the profitability of steel manufacturers in general and ArcelorMittal in particular to the risk of a negative price-cost effect.
ArcelorMittal’s other principal input costs that affect its level of profitability are energy and transportation. Energy expenses are sensitive to changes in electricity, energy transportation and fuel prices, including diesel fuel, natural gas and industrial gas. Prices for electricity, natural gas and fuel oils can fluctuate widely with availability and demand levels from other users, including fluctuations caused by the impact of the COVID-19 pandemic. During periods of peak usage, although some operations have contractual arrangements in place whereby they receive certain offsetting payments in exchange for electricity load reduction, supplies of energy in general may be curtailed and the Company may not be able to purchase them at historical rates. A disruption in the transmission of energy, inadequate energy transmission infrastructure, or the termination of any of the Group’s energy supply contracts could interrupt energy supply and adversely affect operations. While the Group has some long-term contracts with electrical, natural gas and industrial gas suppliers, it is exposed to fluctuations in energy, natural gas and industrial gas costs that can affect its production costs. Energy prices rose substantially in various markets in 2021 and 2022, with attendant impacts on margins and in extreme cases production at certain sites in Europe (e.g., the Company curtailed production at some of its Spanish plants during “peak hours” due to high electricity prices). Europe experienced an energy crisis in 2022, due to the consequences of Russia’s invasion of Ukraine as well as other supply issues. While the Company generally hedges its energy costs on a six-month rolling basis, its results were impacted by the high energy prices. The energy crisis involved significant supply risk, with gas supplies through the Nord Stream pipeline having been substantially reduced and gas supplies being suspended periodically for other reasons, including “maintenance” and invoicing disputes and explosions in September 2022. In 2023,
the Israel-Hamas conflict and the risk of contagion in the region also contributed to the risk of global and regional energy supply and price issues. Significant cuts in energy supplies or a collapse in demand due to supply issues or otherwise may result in the Company having to cut production regionally or globally. Indirectly, if steel-using customers are unable to source the energy supplies needed for their operations, they will be unable to operate and their demand for steel will decline.
Transportation costs include shipping, road and rail. These costs, and in particular shipping, also rose substantially in 2021 due to the post-lockdown demand recovery and logistic constraints, but then declined again in 2022 as economies normalized. While there have been increased costs associated with the geopolitics surrounding the Red Sea, this has been much smaller than the increases in 2021 and has predominately impacted container costs on Europe-Asia routes, whereas other shipping costs have increased by much less. Any increase in or a sustained high level of transportation costs not offset by continued high steel selling prices would directly and mechanically weigh on ArcelorMittal’s profitability (although it would make imports into its markets less competitive). In light of reduced global steel production, the outlook on freight rates in the near future is to a large degree dependent on developments in China. If China cannot significantly raise infrastructure spending in the near future, economic recovery is likely to be stunted, further impacting iron ore demand, and by extension freight rates on key iron ore routes.
Excess capacity and oversupply in the steel industry and in the iron ore mining industry have in the past and may continue in the future to weigh on the profitability of steel producers, including ArcelorMittal.
The steel industry is affected by global and regional production capacity and fluctuations in steel imports and exports, which are themselves affected by the existence and amounts of tariffs and customer and distributor stocking and destocking cycles. The steel industry has historically suffered from structural overcapacity globally, and the current global steelmaking capacity exceeds the current global consumption of steel, especially for long products. This overcapacity is affected by global macroeconomic trends and amplified during periods of global or regional economic weakness, leading to weaker global or regional demand. In particular, China is both the largest global steel consumer and the largest global steel producer by a large margin, and the balance between its domestic production and consumption has been an important factor influencing global steel prices. At various points in recent years, reduced Chinese steel demand has not been fully offset by reduced Chinese steel production, which has led to a flood of Chinese steel exports into various regional markets, including the Company’s principal markets again weighing on demand, and indeed depressing market prices. While most recently
17
| Management report | ||
constraints imposed on Chinese steel production have tempered the risk of excess production, such risk remains, along with the risk of increased exports, in particular if there is a global recession or a Chinese slowdown. See “Unfair trade practices, import tariffs and/or barriers to free trade could negatively affect steel prices and ArcelorMittal’s results of operations in various markets.” Exports by steel producers in other developing countries and regions (such as the CIS, Turkey and India) into the Company’s principal markets are also a market feature. The extent of them depends on the demand/production balance in the producer’s home market as well as regional market pricing differentials (including any applicable import tariffs). The European steel market is particularly sensitive to the import threat due to remaining structural overcapacity. For example, lower demand and high imports led to low steel prices in Europe in the first half of 2019, to which steel producers (including the Company) responded with production cuts.
Market prices for iron ore also underpin those of steel (as its principal input component) to some extent, and iron ore prices depend both on supply and demand conditions. Excess iron ore supply relative to demand has led to depressed prices at various points in recent years and could recur, with potentially a corollary effect on steel prices. No assurance can be given that iron ore prices will not decline further, particularly if there is a recession, Chinese steel demand declines, worldwide capacity increases due to new mines coming online or steel demand declines again due, for example, to impacts from the negative effects from the continuing Russia/Ukraine conflict, the Israel-Hamas conflict or other regional conflicts, in particular on energy supply and prices. A renewed phase of steel and iron ore oversupply would likely have a material adverse effect on ArcelorMittal’s results of operations and financial condition.
Unfair trade practices, import tariffs and/or barriers to free trade could negatively affect steel prices and ArcelorMittal’s results of operations in various markets.
ArcelorMittal is exposed to the effects of “dumping” and other unfair trade and pricing practices by competitors. Moreover, government subsidies to the steel industry remain widespread in certain countries, particularly those with centrally controlled economies such as China. In periods of lower global demand for steel, there is an increased risk of additional volumes of unfairly-traded steel exports into various markets, including Europe, North America and other markets such as Brazil and South Africa, in which ArcelorMittal produces and sells its products. Such imports have had and could in the future have the effect of reducing prices and demand for ArcelorMittal’s products.
Exports of low-cost steel products from developing countries, along with a lack of effective remedial trade policies, can depress steel prices in various markets globally, including in ArcelorMittal’s key markets. Conversely, ArcelorMittal is exposed to the effects of import tariffs, other trade barriers and
protectionist policies more generally due to the global nature of its operations. Various countries have instituted, and may institute import tariffs and barriers that could, depending on the nature of the measures adopted, adversely affect ArcelorMittal’s business by limiting the Company’s access to or competitiveness in steel markets. While such protectionist measures can help the producers in the adopting country, they may be ineffective, raise the risk of exports being directed to markets where no such measures are in place or are less effective and/or result in retaliatory measures. Moreover, absent government intervention, European steel producers who will bear increasingly high costs to reduce carbon emissions (or pay for allowances) will be at a competitive disadvantage versus importers from developing countries with lower environmental standards. While certain changes in Chinese policy in recent periods led to decreased exports from China, the risk of increased exports from China remains, due to changes in Chinese policy, economic conditions or otherwise. For example, in 2023, with weak domestic demand and a large price gap to ex-China, Chinese steel producers were incentivized to maintain production and push exports to overseas markets resulting in a strong increase in Chinese finished steel exports to approximately 91 million tonnes from 67.4 million tonnes in 2022. A significant increase of Chinese exports, if continued, will likely lead to rising inventory levels in steel markets outside of China and downward pressure on prices and spreads, negatively affecting the Company’s profitability.
More generally, the current state of trade relations globally with trade disputes leading to the imposition of tariffs and then retaliatory measures, as seen in recent years in various markets (U.S./China, U.S./Europe, etc.) has and could continue to directly (in the case of tariffs) or indirectly (in the case of economic growth generally) have a significant adverse effect on demand for and the price of steel and hence on ArcelorMittal’s results of operations and financial condition.
In addition, the ETS and CBAM regulations in Europe will impact the carbon emissions allowances from the second trading period of Phase IV (i.e., 2026-2030) onwards, resulting in additional costs, with the risk of a loss of competitiveness of EU exports due to higher EU prices as a result. See “Laws and regulations restricting emissions of greenhouse gases could force ArcelorMittal to incur increased capital and operating costs and could have a material adverse effect on ArcelorMittal’s results of operations, financial condition and reputation.”
Russia’s invasion of Ukraine, international reaction to it (in particular in the form of sanctions) and any regional or global escalation of the conflict, could adversely affect the Company’s business, results of operations and financial condition.
The Company has significant operations in Ukraine, consisting of a steel plant and (captive) mines. See "Properties and capital
18
| Management report | ||
expenditures—Property, plant and equipment—ACIS". After operating at various levels of capacity in 2022/2023 affected by various difficulties, ArcelorMittal Kryvyi Rih ("AMKR") is currently operating its mining and steel facilities at 45% and 30%, respectively. The Company cannot predict the duration of the idling or of lower production as it will depend on the remaining course of the conflict and the establishment of safe and stable operating and logistical conditions thereafter, as well as potential repairs of any damages sustained. The Russian army has also blocked ports in Odessa, complicating and increasing the cost of exports (including steel and iron ore) from Ukraine. The ongoing conflict, its impact on demand, logistics (with respect to both supply and delivery) and costs and any resulting further reduced production, sales and income at its Ukrainian operations caused the Company to record a $1.0 billion impairment charge in 2022 with respect to such operations; the related property, plant and equipment had a carrying value of $0.7 billion on the Company’s balance sheet at December 31, 2023. For further information on these risks, see notes 1.3 and 5.3 to the consolidated financial statements.
The imposition of extensive sanctions on Russia by the EU, the U.S., the UK and other countries could affect the Company’s sourcing of raw materials from sanctioned countries. More generally, any business conducted in Russia and with Russian counterparties carries the risk of non-compliance with economic sanctions (and the attendant financial and reputational adverse consequences), despite best efforts to comply.
More generally the conflict could have a further material adverse effect on the overall macroeconomic environment. Although energy prices have fallen back through 2023, the impact on energy supplies in Europe has been significant and increased the risk of a recession in the region. Both the conflict itself and the sanctions imposed (and further sanctions that may be imposed), as well as potential Russian reactions, have had and could have further destabilizing effects on financial markets. The conflict, which has substantially exacerbated tensions between NATO and Russia, could escalate militarily both regionally and globally; any substantial escalation would have a material adverse effect on macroeconomic conditions. In addition, sanctions may remain in place beyond the duration of any military conflict and have a long-lasting impact on the region and could adversely impact the Company’s results of operations and financial condition.
Competition from other materials and alternative steel-based technologies could reduce market prices and demand for steel products and thereby reduce ArcelorMittal’s cash flows and profitability.
In many applications, steel competes with other materials that may be used as substitutes, such as aluminum, concrete, composites, glass, plastic and wood. In particular, as a result of increasingly stringent regulatory requirements, as well as
developments in alternative materials, designers, engineers and industrial manufacturers, especially those in the automotive industry have increased their use of lighter weight and alternative materials, such as aluminum and plastics in their products.
A loss of market share to substitute materials, increased government regulatory initiatives favoring the use of alternative materials, as well as the development of additional new substitutes for steel products could significantly reduce market prices and demand for steel products and thereby reduce ArcelorMittal’s cash flows and profitability.
Additive manufacturing or new technologies such as carbon free steelmaking could also result in a loss of market share if competitors develop and deploy this kind of technology before, or more effectively than ArcelorMittal. In addition, to the extent regulatory requirements and/or customer demand for low carbon or carbon neutral steel increase, competition with respect to low CO2 steel technologies may become more significant, leading to substantial input cost increases.
II. Risks related to ArcelorMittal's operations
The Group’s carbon emissions intensity reduction targets are based on current assumptions with respect to the costs, government and societal support for the reduction of carbon emissions in particular regions and the advancement of technology and infrastructure related to the reduction of carbon emissions over time. Future developments may affect such assumptions, and this may render the achievement of ArcelorMittal’s targets more difficult, or even impossible, to achieve for cost or other reasons.
To achieve its 2030 global carbon emissions intensity reduction target of 25% covering the Scope 1 and 2 emissions attributable to the Company’s operations measured in accordance with the Greenhouse Gas (“GHG”) Protocol, ArcelorMittal has estimated the gross capital cost required to be approximately $10 billion, with the expectation that 35% of these capital expenditures will be deployed up to 2025 and the remainder in the second part of the decade. In addition, the Company’s decarbonization strategy includes the objective of carbon neutrality by 2050; since 2021, this has also been a legal obligation for its operations in the EU and Canada following the adoption of the European Climate Law and the Canadian Net-Zero Emissions Accountability Act, respectively. These targets and estimates are based on numerous assumptions, including the costs of green hydrogen (meaning hydrogen produced exclusively from renewable sources) and its evolution over time, the construction of DRI and EAF facilities, the development of carbon capture, utilization and storage (“CCUS”) infrastructure and the timing of the introduction of GHG reduction requirements and supportive policies in applicable jurisdictions. The Company expects that
19
| Management report | ||
low emissions technologies will become more competitive over time as more stringent GHG reduction requirements and/or carbon prices are introduced and increased in each jurisdiction, alongside the introduction of effective policies to secure a level playing field, and the decarbonization technologies themselves become more mature and efficient. However, in the transition period (and through at least 2030), its investments in decarbonization will require support from host countries, first and foremost from the European Union and its member states, through supportive policies designed to avoid “carbon leakage” and provide compensation for the significantly higher costs, while at the same time maintaining a fair and competitive landscape. In particular, ArcelorMittal’s expectation is that public funding covers 50% of the total cost of decarbonization (capital expenditures and higher operating expenses) so that the Company and industry are not rendered uncompetitive during this transition period. The Company believes this expectation is reasonable (and funding from certain governments has been approved), but such funding is subject to changes in government and policy, among other factors, and may not be achieved. See “Business overview—Sustainable development—Climate change and decarbonization". A lack of governmental and societal support could make the Company’s targets more costly, more difficult or even impossible to achieve. If the Company is unable to make the necessary investments to decarbonize and reach its 2030 decarbonization targets due to the design of governmental policy in Europe or other jurisdictions where it operates (see “—Changes in assumptions underlying the carrying value of certain assets, including as a result of adverse market conditions, could result in the impairment of such assets, including intangible assets such as goodwill” below), it may negatively affect its competitiveness, profitability, cash flows, financing costs (due to the inclusion, as from 2021, of ESG KPI-based margin adjustment clauses in its principal bank financing facility), results of operations and financial condition, as well as harm its reputation.
ArcelorMittal could experience labor disputes that may disrupt its operations and its relationships with its customers and its ability to rationalize operations and reduce labor costs in certain markets may be limited in practice or encounter implementation difficulties.
A majority of the employees of ArcelorMittal and of its contractors are represented by labor unions and are covered by collective bargaining or similar agreements, which are subject to periodic renegotiation. Strikes or work stoppages could occur prior to, or during, negotiations preceding new collective bargaining agreements, during wage and benefits negotiations or during other periods for other reasons, in particular in connection with any announced intentions to adapt the footprint. ArcelorMittal may experience strikes and work stoppages at various facilities. Prolonged strikes or work stoppages could have an adverse effect on the operations and financial results of
ArcelorMittal. In recent years ArcelorMittal has experienced significant strikes affecting operations at various plants, particularly in Mexico, South Africa, France, Spain and Canada, relating to various causes, often in connection with labor contract renewal negotiations or claims for salary increases because of rising inflation.
Disruptions to ArcelorMittal’s manufacturing processes and mining operations caused for example by equipment failures, natural disasters, accidents, explosions, epidemics or pandemics, geopolitical conflicts or extreme weather events could adversely affect its operations, customer service levels and financial results and liabilities.
Steel manufacturing processes are dependent on critical steel-making equipment, such as furnaces, continuous casters, rolling mills and electrical equipment (such as transformers), and such equipment may incur downtime as a result of unanticipated failures or other events, such as fires, explosions, furnace breakdowns or as a result of natural disasters, accidents, epidemics or pandemics or severe weather conditions. ArcelorMittal’s manufacturing plants and mines have experienced, and may in the future experience, plant shutdowns or periods of reduced production as a result of such events, for example, fire outbreaks at blast furnace A at Gijón (Spain) and blast furnace #4 at Dunkirk (France) in March 2023.
ArcelorMittal’s mining operations, in particular, are subject to the hazards and risks usually associated with the exploration, development and production of natural resources through either open-pit or underground mining operations, any of which could result in production shortfalls or damage to persons or property, delay production, increase production costs and result in death or injury to persons, damage to property and liability for ArcelorMittal, some or all of which may not be covered by insurance, as well as substantially harm ArcelorMittal’s reputation, both as a Company focused on ensuring the health and safety of its employees and more generally. ArcelorMittal’s mining operations have experienced several explosions, including in Kazakhstan, an explosion in the Abayskaya mine in November 2021, a roof collapse at Temirtau in June 2022, an explosion in the Lenina coal mine in November 2022 and an explosion at the Kostenko coal mine in October 2023. Certain of these incidents have resulted or may result in fatalities (including the last one noted, which resulted in 46 fatalities), production stoppages, governmental investigations or proceedings and/or in costs and liabilities and negatively impact the Company’s reputation or the operations of the affected facilities. Such incidents could also lead to loss of key personnel, loss of key assets, or put at risk our employees (and those of sub-contractors and suppliers) or persons living near affected sites. Following the accidents in Kazakhstan, the Company sold its Kazakh steel and mining operations in December 2023. See also"—Key transactions and events in
20
| Management report | ||
2023", “—ArcelorMittal is subject to strict environmental, health and safety laws and regulations that could give rise to a significant increase in costs and liabilities” and “—ArcelorMittal is subject to economic policy, military, political, social and legal risks and uncertainties in the emerging markets in which it operates or proposes to operate, and these uncertainties may have a material adverse effect on ArcelorMittal’s business, financial condition, results of operations or prospects”. Conflicts may also cause interruptions to operations; see “—Russia’s invasion of Ukraine, international reaction to it (in particular in the form of sanctions) and any regional or global escalation of the conflict, could adversely affect the Company’s business, results of operations and financial condition”.
In addition, natural disasters and severe weather conditions could lead to significant damage at ArcelorMittal’s production facilities and general infrastructure or cause shutdowns. For example, ArcelorMittal Mexico’s production facilities located in Lázaro Cárdenas, Michoacán, Mexico are located in or close to areas prone to earthquakes. The Lázaro Cárdenas area has, in addition, been subject to a number of tsunamis in the past. The site of the joint venture AM/NS Calvert (“Calvert”) in the United States is located in an area subject to tornados and hurricanes. ArcelorMittal also has assets in locations subject to bush fires, specifically in South Africa, and to Arctic freeze, specifically in Baffinland. More generally, changing weather patterns and climatic conditions in recent years, possibly due to climate change, have added to the unpredictability and frequency of natural disasters.
Severe weather conditions can also affect ArcelorMittal’s operations in particular due to the long supply chain for certain of its operations and the location of certain operations in areas subject to harsh winter conditions (i.e., Canada) or areas that are susceptible to droughts (i.e., South Africa, Mexico and Brazil). Water in particular is crucial to the steelmaking process, and the risk that the authorities may restrict license to withdraw water as a result of chronic drought could increase operating costs and reduce production capacity. Flooding has also affected ArcelorMittal’s operations, for example AMMC at Mont Wright, Canada in September 2022, and, more regularly, in Liberia, when heavy rains during the wet season have caused handling and logistic constraints that impacted shipment volumes. Damage to ArcelorMittal production facilities due to natural disasters and severe weather conditions could, to the extent that lost production cannot be compensated for by unaffected facilities, adversely affect its business, results of operations or financial condition. More generally, these severe weather conditions could increase in frequency and severity due to climate change.
ArcelorMittal’s reserve and resource estimates may materially differ from mineral quantities that it may be able to actually recover; ArcelorMittal’s estimates of mine life
may prove inaccurate; and changes in iron ore prices, operating and capital costs and other assumptions used to calculate these estimates may render certain reserves and resources uneconomical to mine.
There is a degree of uncertainty attributable to the estimation of mineral reserves and resources. Until mineral reserves and resources are actually mined and processed, the quantity of metal and grades must be considered as estimates only and no assurance can be given that the indicated levels of metals will be produced. In making determinations about whether to advance any of its projects to development, ArcelorMittal must rely upon estimated calculations for the mineral reserves and mineral resources and grades of mineralization on the Company’s properties.
The estimation of mineral reserves and resources is a subjective process that is partially dependent upon the judgment of the qualified persons preparing such estimates. The process relies on the quantity and quality of available data and is based on knowledge, mining experience, statistical analysis of drilling and sampling results and industry practices. Valid estimates made at a given time may significantly change when new information becomes available.
ArcelorMittal’s estimates of mineral reserves and resources are based on interpretation of geological data and statistical inferences or assumptions drawn from the results of drilling and sampling analysis made as of the date of such estimates.
ArcelorMittal periodically updates its mineral reserve and resources estimates based on the conclusions of the relevant qualified persons with respect to new data generated from exploratory and infill drilling campaigns, results from technical studies and the experience acquired during the operation of the mine and metallurgical processing, as well as changes to the assumptions used to calculate these estimates. Additional data generated may not be consistent with the data on which previous mineral resources and mineral reserves were based. Therefore, estimates may change from period to period or may need to be revised, and there can be no assurance that the mineral resources or mineral reserves in this report will be recovered at the grade, quality or quantities presented.
There can be uncertainty in the assumptions used that may materially impact and result in significant changes to the Company’s current estimates. The assumptions that can fluctuate may include, but are not limited to: market prices including long-term forecasts; operating and capital costs; changes to estimation input parameters and techniques; and changes to cut-off grades, mining, and metallurgical recovery rates. These changes may also render some or all of our current proven and probable mineral reserves and measured and indicated mineral resources uneconomic to exploit and may
21
| Management report | ||
ultimately result in a reduction of mineral reserves and resources.
Mineral resources are subject to further exploration and evaluation of material factors such as operating costs, grades, and recoveries, further engineering, legal and economic feasibility that would allow for the conversion to mineral reserves. Consequently, no assurance can be given that mineral resources will become recoverable proven and probable mineral reserves in the future.
In addition, inferred mineral resources have a great amount of uncertainty as to their existence and their economic and legal feasibility. Readers should not assume that any part of an inferred mineral resource will be upgraded to a higher category or that any of the mineral resources not already classified as mineral reserves will be reclassified as mineral reserves.
If a project proves not to be economically feasible by the time ArcelorMittal is able to exploit it, ArcelorMittal may incur substantial losses and be obliged to recognize impairments. In addition, potential changes or complications involving metallurgical and other technological processes that arise during the life of a project may result in delays and cost overruns that may render the project not economically feasible. In addition, ArcelorMittal faces rising extraction costs over time as reserves deplete.
ArcelorMittal’s reputation and business could be materially harmed as a result of data breaches, data theft, unauthorized access or successful hacking.
ArcelorMittal’s operations depend on the secure and reliable performance of its information technology systems. An increasing number of companies, including ArcelorMittal, have experienced intrusion attempts or even breaches of their information technology security, some of which have involved sophisticated and highly targeted attacks on their computer networks. Phishing, ransomware and virus attacks have been increasing in more recent years. For example, in 2023, several instances of malicious activity were detected on certain of the Company’s servers and systems, including in Spain, Brazil, Germany and Venezuela. See "—Cybersecurity".
Adverse consequences of technological advances like Industry 4.0, Cloud Computing, Internet of Things, GenAi and Blockchain may increase threats or cause damage to ArcelorMittal, for example by impacting shop-floor systems supporting production and maintenance and thereby forcing plant operations to revert to manual mode with loss of production, resulting in new risks to ArcelorMittal’s operations and systems. Because the techniques used to obtain unauthorized access, disable or degrade service or sabotage systems change frequently and often are not recognized until launched against a target, the Company may be unable to anticipate these techniques or to implement in a
timely manner effective and efficient countermeasures. Although ArcelorMittal performs annual cyber maturity assessments in many of its business units, which are supplemented by in-depth cyber audits and penetration testing exercises performed by ArcelorMittal Global Assurance, the risk of significant data breaches, data theft, unauthorized access or successful hacking cannot be eliminated. There may also be an increased risk of cybersecurity breaches due to ongoing geopolitical tensions involving Russia. See also "—Cybersecurity".
If unauthorized parties attempt or manage to bring down the Company’s website or force access into its information technology systems, they may be able to misappropriate personal and confidential information, cause interruptions in the Company’s operations, damage its computers or process control systems or otherwise damage its reputation and business. In such circumstances, the Company could be held liable or be subject to regulatory or other actions for breaching confidentiality and personal data protection rules including the EU’s General Data Protection Regulation (“GDPR”). Any compromise of the security of the Company’s information technology systems could result in a loss of confidence in the Company’s security measures and subject it to litigation, civil or criminal penalties, and adverse publicity that could adversely affect its reputation, financial condition and results of operations.
III. Risks related to ArcelorMittal’s acquisitions and investments
ArcelorMittal has grown through acquisitions and may continue to do so. Failure to manage external growth and difficulties completing planned acquisitions or integrating acquired companies could harm ArcelorMittal’s future results of operations, financial condition and prospects.
The Company was formed and subsequently grew through mergers and acquisitions. After a pause, the Company made several large acquisitions in the recent period. To the extent ArcelorMittal continues to pursue significant acquisitions, financing of such acquisitions may (depending on the structure) result in increased debt, leverage and gearing. Acquisitions also entail increased operating costs, as well as greater allocation of management resources away from daily operations. Managing acquisitions requires the continued development of ArcelorMittal’s financial and management information control systems, the integration of acquired assets with existing operations, the adoption of manufacturing best practices, handling any labor disruptions that may arise, attracting and retaining qualified management and personnel as well as the continued training and supervision of such personnel, and the ability to manage the risks and liabilities associated with the acquired businesses. Acquisitions may also result in subsequent disputes or financial liabilities, including in respect of put options granted to selling shareholders over a retained minority stake. For example, Votorantim S.A. is contesting the exercise price of the put option it had over its stake in ArcelorMittal Brasil,
22
| Management report | ||
representing substantial financial exposure for the Company. In addition, acquisitions may entail future capital expenditures, either as a condition or in order to realize synergies, operational efficiencies or strategic benefits. Such capital expenditure may not provide the anticipated return on investment. More generally, failure to manage acquisitions could have a material adverse effect on ArcelorMittal’s business, financial condition, results of operations or prospects.
ArcelorMittal faces further risks in relation to its interest in Acciaierie d'Italia (“ADI”), which has been placed in a special form of insolvency proceedings (extraordinary administration).
In 2017 the Company entered into an agreement with the Italian-government appointed commissioners managing Ilva for the lease and subsequent conditional purchase of the business of Ilva (the “Ilva Agreement”) and started to operate the business as a lessee in November 2018. In March 2020 the parties signed an amendment to the Ilva Agreement settling litigation between them around an intervening change in applicable law and envisaging a public-private partnership. Accordingly, in December 2020 ArcelorMittal and Invitalia, an Italian state-owned company, agreed that Invitalia would invest up to an agreed amount of equity in ADI in two tranches. Invitalia made the first equity investment in April 2021 but did not make the second as certain conditions precedent were not met; instead, it (along with ArcelorMittal) made a convertible loan to ADI in February 2023 in light of the adverse effect on ADI’s financial situation of the spike in energy costs resulting from the conflict in Ukraine.
In the fourth quarter of 2023, notwithstanding such shareholder contributions, ADI’s financial condition deteriorated due in particular to the repeal of relief measures for energy-intensive companies. ArcelorMittal, the Italian Government and Invitalia discussed the terms and conditions of a possible support to ADI to address its short-term cash needs and the funding requirements to enable it to complete the acquisition of Ilva’s business units. The parties were not able to reach agreement on addressing ADI’s funding needs.
On January 18, 2024 the Italian Government adopted a Decree-Law (the “EA Decree-Law”) which, in particular, further amended the rules ordinarily applicable for the opening of “extraordinary administration” proceedings (“EA”). EA is a form of insolvency proceeding reserved to large strategic companies where the board and shareholders are stripped of any power and replaced by commissioners appointed by the Italian Government. Normally, only the debtor company (based on a resolution of its board) is entitled to seek access to this type of EA. However, as a result of the EA Decree-Law and a Decree-Law passed in January 2023 a 30% or greater shareholder of such a company may request to the Italian Government the admission of such a company to EA proceedings and (a) thereafter no alternative
restructuring proceedings (including a “composition” (as described below)) may be initiated by the debtor and (b) if at the time of such application any such restructuring proceeding (including a Concordato (as described below)) is pending, it must be dismissed and terminated.
On January 15, 2024, ADI applied to the Chamber of Commerce of Milan for the opening of so-called out-of-court composition (composizione negoziata della crisi; “Composition”) proceedings under the Italian Code on Distress and Insolvency, requesting in particular the appointment of an expert to facilitate negotiations with creditors. ADI simultaneously applied to the Court of Milan to be granted certain protective measures. The Court of Milan rejected ADI’s requests by means of two orders dated January 31 and February 16, 2024. Accordingly, on February 16, 2024, ADI withdrew the Composition and filed instead for concordato preventivo, a court-supervised composition with creditors (“Concordato”), again before the Court of Milan. Pending this proceeding, ADI would benefit from a stay on enforcement actions and ascertainment of ADI’s insolvency (which is a prerequisite for the opening of insolvency proceedings).
On February 18, 2024, however, Invitalia applied to the Italian Government to place ADI in extraordinary administration, exercising the special power that was granted to it under the EA Decree-Law. On February 20, 2024, the Italian Government issued a decree placing ADI in EA and naming an extraordinary commissioner. To date, the court of Milan has not ascertained ADI’s insolvency, which is a further prerequisite for the EA proceeding to be definitively opened. If it does, ArcelorMittal will in practice be stripped of its rights as an indirect shareholder of ADI.
ArcelorMittal recorded a $1.4 billion impairment charge in its 2023 financial statements with respect to its investment in ADI due to a downward revision of expected future cash flows and the then-uncertainty regarding its future. The subsequent placement of ADI in EA, an onerous and unprecedented procedure in this context, could lead to further disputes.
ArcelorMittal’s greenfield, brownfield and other investment projects are subject to financing, execution and completion risks.
The Company has announced a number of greenfield or brownfield development projects as well as other significant investment projects which are capital intensive. See “Properties and capital expenditures—Property, plant and equipment—Investments in joint ventures” and “Properties and capital expenditures—Capital expenditures” for further information on projects the Company has announced.
To the extent these projects go forward, they would entail substantial capital expenditures, and their timely completion and successful operation may be affected by factors beyond the
23
| Management report | ||
control of ArcelorMittal. These factors include receiving financing on reasonable terms, obtaining or renewing required regulatory approvals and licenses, securing and maintaining adequate property rights to land and mineral resources, local opposition to land acquisition or project development, managing relationships with or obtaining consents from other shareholders, revision of economic viability projections, demand for the Company’s products, local environmental or health-related conditions, and general economic conditions. Any of these factors may cause the Company to delay, modify or forego some or all aspects of its development projects. For investment projects that the Company expects to fund primarily through internal sources, these sources may prove insufficient depending on the amount of internally generated cash flows and other uses of cash, and the Company may need to choose between incurring external financing or foregoing the investment. The Company cannot guarantee that it will be able to execute its greenfield, brownfield or other investment projects, and to the extent that they proceed, that it will be able to complete them on schedule, within budget, or achieve an adequate return on its investment. Conversely, should the Company decide to postpone or cancel development projects, it could incur various negative consequences such as litigation or impairment charges, as well as loss of anticipated strategic benefits.
ArcelorMittal faces risks associated with its investments in joint ventures and associates.
ArcelorMittal has investments in numerous joint ventures and associates for a total carrying amount of $10.1 billion at December 31, 2023. See “Properties and capital expenditures—Property, plant and equipment—Investments in joint ventures” and note 2.4 to the consolidated financial statements. In particular, it has structured significant growth transactions in recent years, including Calvert, AMNS India and VdSA as joint ventures.These joint ventures subject ArcelorMittal to several types of risks.
First, risks that are endemic to joint ventures generally due to their nature as entities over which control is shared. These include the risk of dead-lock and/or coordination issues affecting the implementation of strategy. To the extent joint ventures and associates are controlled and managed by partners, they may not fully comply with ArcelorMittal’s standards, controls and procedures, including ArcelorMittal’s health, safety, environment and community standards; this could lead to higher costs, reduced production or environmental, health and safety incidents or accidents, which could adversely affect ArcelorMittal’s results and reputation.
Second, joint ventures may be the source of substantial expenditures and financial exposure. Although ArcelorMittal’s joint ventures are responsible for their own debt repayment and it does not consolidate their indebtedness, ArcelorMittal may make substantial cash contributions to extend loans to and/or
guarantee the debt or contractual obligations of its joint ventures. This may particularly be the case for joint ventures that are strategic and that are expanding and developing, such as AMNS India and Calvert (see "Property and Capital expenditures—Investments in joint ventures” and "Property and Capital expenditures—Capital expenditures"). AMNS India, in particular, has large-scale and ambitious projects to expand its operations and further improve operational profitability, which may either not come to fruition or require greater than anticipated investments or expenditures. AMNS India has also made significant acquisitions in recent years that it has financed with its own cash and drawings under existing financings (including ones guaranteed by its shareholders). The Company currently expects that any future acquisitions would likely be similarly financed. Moreover, the joint venture has announced $7.4 billion in projected capital expenditure requirements that it expects to finance similarly (subject to potential cost overruns). The risks in this respect are compounded to an extent by the fact that AMNS India is owned and operated by a joint venture with attendant risks around strategic alignment, potential discord and deadlock.
As of December 31, 2023, ArcelorMittal had given $5.0 billion of guarantees on behalf of associates and joint ventures see notes 2.4.1, 2.4.2 and 9.4 to ArcelorMittal’s consolidated financial statements. Such amounts may also increase as noted above. Other sureties, first demand guarantees, letters of credit, pledges and other collateral included $319 million and $375 million of commitments given on behalf of associates as of December 31, 2023 and 2022, respectively, and $313 million and $598 million of commitments given on behalf of joint ventures as of December 31, 2023 and 2022, respectively.
Third, joint ventures and associates may experience financial difficulties. In such circumstances, ArcelorMittal may choose to restructure the joint venture, to contribute additional equity or to guarantee additional financing. The Company also may be exposed to loss of its investment or calls on existing guarantees.
Finally, ArcelorMittal’s investments in joint ventures and associates may result in impairments as discussed above for ADI.
IV. Risks related to ArcelorMittal’s financial position and organizational structure
Changes in assumptions underlying the carrying value of certain assets, including as a result of adverse market conditions, could result in the impairment of such assets, including intangible assets such as goodwill.
At each reporting date, in accordance with the Company’s accounting policy described in note 5.3 to the consolidated financial statements, ArcelorMittal reviews the carrying amounts of its tangible and intangible assets (goodwill is reviewed
24
| Management report | ||
annually or whenever changes in circumstances indicate that the carrying amount may not be recoverable) to determine whether there is any indication that the carrying amount of those assets may not be recoverable through continuing use. If any such indication exists, the recoverable amount of the asset (or cash-generating unit) is reviewed in order to determine the amount of the impairment, if any.
If certain of management’s estimates change during a given period, such as the discount rate, capital expenditures, expected changes to average selling prices, growth rates, shipments and direct costs, the estimate of the recoverable amount of goodwill or the asset could fall significantly and result in impairment. While impairment does not affect reported cash flows, the decrease of the estimated recoverable amount and the related non-cash charge in the consolidated statements of operations could have a material adverse effect on ArcelorMittal’s results of operations. For example, in 2023, the Company recognized $0.9 billion of impairment charges in connection with the sale of its operations in Kazakhstan and $0.1 billion related to its Long business in South Africa. Substantial amounts of goodwill and tangible and intangible assets remain recorded on the Company’s consolidated statement of financial position. As of December 31, 2023, the Company’s balance sheet included $3.9 billion of goodwill.
More generally, no assurance can be given as to the absence of significant further impairment losses in future periods, particularly if market conditions deteriorate. In particular, changes in key assumptions used in the Group’s impairment tests, due to market conditions, regulations (including environmental regulations) or other reasons may result in additional impairment losses being recognized in the future. In addition, for operations in jurisdictions where a legal obligation of carbon neutrality has been established (i.e., EU and Canada) the Company’s assumptions include the significant long-term investments necessary to reach the Group’s announced carbon emissions goals. With respect to operations in other jurisdictions where decarbonization will occur at a different pace and which may not yet be subject to a legal obligation of carbon neutrality, a result of which future decarbonization capital expenditures may not be included in their value in use calculations, the Company increased risk premiums included in their discount rates until they are able to accelerate their decarbonization strategy to meet the 2050 carbon neutrality objective and a legal obligation arises in the relevant jurisdiction. The Company’s assumptions for future cash flows also include an estimate for costs that the Company expects to incur to acquire emission allowances, which primarily impacts the flat steel operations in the EU under the ETS scheme and in Canada. The assumption for carbon emission cost is based on historical experience, implementation of decarbonization strategies to mitigate or otherwise offset such future costs and information available in
respect of future regulatory or operational changes. Due to economic developments, uncertainties over the pace of transition to and available public funding support to implement low-emission technologies, political and environmental actions that will be taken to meet the carbon reduction goals, regulatory changes and emissions activity arising from climate-related matters, the Company’s assumptions used in the recoverable amount calculations, such as capital expenditures, carbon emission costs and other assumptions are inherently uncertain and may ultimately differ from actual amounts. For further information on these risks, see notes 1.3 and 5.3 to the consolidated financial statements.
ArcelorMittal’s indebtedness could have an adverse impact on its results of operations and financial position, and the market’s perception of ArcelorMittal’s leverage may affect its share price.
As of December 31, 2023, ArcelorMittal had total debt outstanding of $10.7 billion, $7.8 billion of cash and cash equivalents and restricted cash, and $5.4 billion available to be drawn under existing credit facilities. The Company also relies on its true sale of receivables programs ($4.5 billion of trade receivables sold at December 31, 2023), as a way to manage its working capital cycle.
While ArcelorMittal’s indebtedness has decreased significantly in recent years, were it to increase substantially in the future, this could contribute to the Company’s vulnerability to adverse economic and competitive pressures in its industry, limit flexibility in planning for, or reacting to, changes in its business and industry; limit its ability to borrow additional funds on terms that are acceptable to the Company or at all. More generally, a deterioration of market conditions may impact ArcelorMittal’s ability to refinance its indebtedness on acceptable conditions or at all.
Credit rating agencies could downgrade ArcelorMittal’s ratings either due to factors specific to ArcelorMittal, a prolonged cyclical downturn in the steel industry and mining industries, macroeconomic trends (such as global or regional recessions or economic shocks) or trends in credit and capital markets more generally. While ArcelorMittal’s long-term credit ratings were affirmed by Standard & Poor's (in June 2023) and by Moody's (in February 2024), any future downgrades could lead to an increase in its cost of borrowing. The margin under ArcelorMittal’s principal credit facilities and certain of its outstanding bonds is subject to adjustment in the event of a change in its long-term credit ratings, and downgrades that occurred in the past resulted in increased interest expense.
ArcelorMittal’s principal credit facilities contain restrictive covenants. These covenants limit, inter alia, encumbrances on the assets of ArcelorMittal and its subsidiaries, the ability of ArcelorMittal’s subsidiaries to incur debt and the ability of
25
| Management report | ||
ArcelorMittal and its subsidiaries to dispose of assets in certain circumstances. These restrictive covenants could limit ArcelorMittal’s operating and financial flexibility. Failure to comply with any covenant would enable the lenders to accelerate ArcelorMittal’s repayment obligations. Moreover, ArcelorMittal’s debt facilities have provisions whereby certain events relating to other borrowers within the ArcelorMittal group could, under certain circumstances, lead to acceleration of debt repayment under the credit facilities. Any invocation of these cross-acceleration clauses could cause some or all of the other debt to accelerate, creating liquidity pressures. In addition, the mere market perception of a potential breach of any financial covenant, to the extent in effect, could have a negative impact on ArcelorMittal’s ability to refinance its indebtedness on acceptable conditions.
In addition to the foregoing specific risks relating to ArcelorMittal’s indebtedness, its share price is affected by the markets’ perception of its leverage.
ArcelorMittal could also, in order to increase its financial flexibility and strengthen its balance sheet, implement capital raising measures such as equity offerings which could (depending on how they are structured) dilute the interests of existing shareholders or require them to invest further funds to avoid such dilution.
For further information on ArcelorMittal’s indebtedness see “Operating and financial review—Liquidity and capital resources,” “Operating and financial review—Operating results” and note 6.1.2 to the consolidated financial statements.
ArcelorMittal’s ability to fully utilize its recognized deferred tax assets depends on its profitability and future cash flows.
At December 31, 2023, ArcelorMittal had $9.5 billion recorded as deferred tax assets on its consolidated statement of financial position, representing a $0.9 billion increase as compared to December 31, 2022. In 2023, the Company recorded deferred tax benefits of $0.8 billion mainly due to the recognition of deferred tax assets following increase of future profit expectation in a number of jurisdictions, mainly in Luxembourg. The deferred tax benefits of $0.4 billion recorded in 2022 related mainly to recognition of deferred tax assets in Luxembourg following an increase in the future taxable income expectation on unrealized gains on derivative instruments. The deferred tax assets can be utilized only if, and only to the extent that, ArcelorMittal’s operating subsidiaries generate adequate levels of taxable income in future periods to offset the tax loss carry forwards and reverse the temporary differences prior to expiration. At December 31, 2023, the amount of future income required to recover ArcelorMittal’s deferred tax assets of $9.5 billion was at least $41.5 billion at certain operating subsidiaries.
ArcelorMittal’s ability to generate taxable income is subject to general economic, financial, competitive, legislative, regulatory and other factors that are beyond its control. If ArcelorMittal generates lower taxable income than the amount it has assumed in determining its deferred tax assets, then the value of deferred tax assets will be reduced. In addition, assumptions regarding the future recoverability of deferred tax assets depend on management’s estimates of future taxable income in accordance with the tax laws applicable to ArcelorMittal’s subsidiaries in the countries in which they operate. If in the course of its assessments management determines that the carrying amount of any of its deferred tax assets may not be recoverable pursuant to such prevailing tax laws, the recoverable amount of such deferred tax assets may be impaired.
Underfunding of pension and other post-retirement benefit plans at some of ArcelorMittal’s operating subsidiaries could require the Company to make substantial cash contributions to pension plans or to pay for employee healthcare, which may reduce the cash available for ArcelorMittal’s business.
ArcelorMittal’s principal operating subsidiaries in Brazil, Canada, Europe and South Africa provide defined benefit pension and other post-retirement benefit plans to their employees. Some of these plans are currently underfunded, see note 8.2 to the consolidated financial statements for the total value of plan assets and any deficit.
ArcelorMittal’s funding obligations depend upon future asset performance, which is tied to equity and debt markets to a substantial extent, the level of interest rates used to discount future liabilities, actuarial assumptions and experience, benefit plan changes and government regulation. Because of the large number of variables that determine pension funding requirements, which are difficult to predict, as well as any legislative action, future cash funding requirements for ArcelorMittal’s pension plans and other post-employment benefit plans could be significantly higher than current estimates. Increases in the general life expectancy assumption have contributed to increases in the defined benefit obligation. In these circumstances, funding requirements could have a material adverse effect on ArcelorMittal’s business, financial condition, results of operations or prospects.
ArcelorMittal’s results of operations could be affected by fluctuations in foreign exchange rates, particularly the euro to U.S. dollar exchange rate, as well as by exchange controls imposed by governmental authorities in the countries where it operates.
ArcelorMittal operates and sells products globally and as a result, its business, financial condition, results of operations or prospects could be adversely affected by fluctuations in exchange rates. A substantial portion of ArcelorMittal’s assets,
26
| Management report | ||
liabilities, operating costs, sales and earnings are denominated in currencies other than the U.S. dollar (ArcelorMittal’s reporting currency). Accordingly, its results of operations are subject to translation risk (i.e., the U.S. dollar value of revenue and profits generated in other currencies and its debt denominated in other currencies) and transaction risk (i.e., a mismatch between the currency of costs and revenue). For example, the Company had recorded in equity $1.5 billion of cumulative foreign exchange translation losses in relation to ArcelorMittal Temirtau; this amount was reclassified to the consolidated statements of operations upon its disposal.
Moreover, ArcelorMittal operates in several countries whose currencies are, or have in the past been, subject to limitations imposed by those countries’ central banks, or which have experienced sudden and significant devaluations. In emerging countries where ArcelorMittal has operations and/or generates substantial revenue, such as Argentina, Brazil, India, South Africa, Venezuela and Ukraine, the risk of significant currency devaluation is high. For example, the Argentinian peso has continued to substantially depreciate since 2018.
Currency devaluations, the imposition of new exchange controls or other similar restrictions on currency convertibility, or the tightening of existing controls in the countries in which ArcelorMittal operates could adversely affect its business, financial condition, results of operations or prospects. See “Business overview— Government regulations—Key currency regulations and exchange controls” and “Operating and financial review—Key factors affecting results of operations—Impact of exchange rate movements.”
The Significant Shareholder has the ability to exercise significant influence over the outcome of shareholder votes.
At December 31, 2023, a trust (HSBC Trustee (C.I.) Limited, as trustee), of which Mr. Lakshmi N. Mittal, Mrs. Usha Mittal and their children are the beneficiaries (referred to as the “Significant Shareholder”), beneficially owned (within the meaning of Rule 13d-3 under the Securities Exchange Act of 1934, as amended) ordinary shares amounting to 340,014,215 in the aggregate (when aggregated with ordinary shares of ArcelorMittal held directly by Mr. Lakshmi N. Mittal and Mrs. Usha Mittal) , representing 41.50% of ArcelorMittal’s then outstanding shares. As a result, the Significant Shareholder has the ability to significantly influence the decisions adopted at the ArcelorMittal general meetings of shareholders, including matters involving mergers or other business combinations, the acquisition or disposition of assets, issuances of equity and obtaining funding through debt. The Significant Shareholder also has the ability to significantly influence a change of control of ArcelorMittal. For further information on the Company’s major shareholders, see “Shareholders and markets—Major shareholders”.
V. Legal and regulatory risks
ArcelorMittal is subject to strict environmental, health and safety laws and regulations that could give rise to a significant increase in costs and liabilities.
ArcelorMittal is subject to a broad range of environmental, health and safety laws and regulations in each of the jurisdictions in which it operates. These laws and regulations impose increasingly stringent standards regarding general health and safety, air emissions, discharges of wastewater, the use, handling and transportation of hazardous, toxic or dangerous materials, waste disposal practices and the remediation of environmental contamination, and health and safety matters, among other things. The costs of complying with, and the imposition of liabilities pursuant to these laws and regulations can be significant, and compliance with new and more stringent obligations may require additional capital expenditures or modifications in operating practices. Failure to comply can result in civil and or criminal penalties being imposed, the suspension of permits, requirements to curtail or suspend operations and lawsuits by third parties.
In the EU, the Industrial Emissions Directive (“IED”) defines the so called Best Available Techniques (“BAT”) and sets the ranges of values that need to be established as limits in the environmental permits. The BAT are also used in other regions as reference, and are periodically reviewed (in theory, an eight-year cycle) to ensure a continuous improvement of environmental performance. In November 2023, a provisional agreement was reached between the institutions on the revised IED setting stricter rules to define limits and requirements in the permits as well as tighter compliance and control rules with additional enforcement provisions, supported by growing general concerns about the effects of pollution on the environment and human health.
Despite ArcelorMittal’s efforts to comply with environmental, health and safety laws and regulations, and monitor and reduce accidents at its facilities, health, safety and environmental incidents or accidents, including those involving serious injury or death, have occurred and may in the future occur. Such accidents could include explosions or gas leaks, fires or collapses in underground mining operations, crushing incidents, vehicular accidents, falls while working at heights, and other accidents involving mobile equipment, or exposure to radioactive or other potentially hazardous, toxic or dangerous materials, which could have significant adverse consequences for the Company’s workers and facilities, as well as the environment. For example, the Company’s previous operations in Kazakhstan suffered several fatal accidents, culminating most recently in the disastrous explosion at the Kostenko mine on October 28, 2023, which resulted in 46 deaths. Accidents such as these have occurred despite the Company’s intensified focus over the past two years on improving safety across the Group.
27
| Management report | ||
Certain of these incidents may result in costs and liabilities and negatively impact the Company’s reputation or the operations of the affected facilities. Such accidents could lead to production stoppages, loss of personnel, loss of key assets, or put at risk the Company’s employees (and those of sub-contractors and suppliers) or persons living near affected sites. In addition, any gap between community and worker expectations and ArcelorMittal’s environmental, health and safety perceived performance, as a result of any accidents, safety incidents or even the perception of potential safety or environmental issues, may negatively impact community relations, labor relations, customer relations and the Company’s reputation and result in disruptions to the Company’s operations.
In addition, accidents may arise from the usage of certain types of equipment or from the adoption of operating practices that prove to be insufficiently safe or the failure to follow the Company’s standard operating procedures. Accidents may also be caused by human error, the lack of knowledge by its employees on what to do in a given situation or the inability of its employees to follow the prescribed protocols in a given situation. Working in remote or hazardous conditions, where it may be more difficult to mitigate the consequences of an accident or put in place certain preventative measures, may further increase such risks. In the past, the Company’s ability to conduct certain in-person health and safety training sessions for its employees was impeded by restrictions resulting from the COVID-19 pandemic, which had negative effects on ArcelorMittal’s health and safety record. The occurrence of an accident may also lead to legal claims that seek to hold the Company liable, and it may not be successful in defending against such claims.
ArcelorMittal also incurs costs and liabilities associated with the assessment and remediation of contaminated sites, and in its mining activities, those resulting from tailings and sludge disposal, effluent management, and rehabilitation of land disturbed during mining processes. In addition to the impact on current facilities and operations, environmental remediation obligations can give rise to substantial liabilities in respect of divested assets and past activities. This may also be the case for acquisitions when liabilities for past acts or omissions are not adequately reflected in the terms and price of the acquisition. ArcelorMittal could become subject to further remediation obligations in the future, as additional contamination is discovered or clean-up standards become more stringent.
ArcelorMittal could become subject to unidentified liabilities in the future, such as those relating to uncontrolled tailings breaches or other future events or to underestimated emissions of polluting substances. It has incurred such liabilities in the recent past in relation to the tailing dam at the Serra Azul mine in Brazil.
ArcelorMittal’s operations may also be located in areas where individuals or communities could regard its activities as having a detrimental effect on their natural environment and conditions of life. Any actions taken by such individuals or communities in response to such concerns could compromise ArcelorMittal’s profitability or, in extreme cases, the viability of an operation or the development of new activities in the relevant region or country.
For further information, see “Business overview—Government regulations—Health and safety laws and regulations” and “Business overview—Government regulations—Environmental laws and regulations” and note 9.1 to the consolidated financial statements.
Laws and regulations restricting emissions of greenhouse gases could force ArcelorMittal to incur increased capital and operating costs and could have a material adverse effect on ArcelorMittal’s results of operations, financial condition and reputation.
Compliance with new and more stringent environmental obligations relating to GHG emissions may require additional capital expenditures or modifications in operating practices, as well as additional reporting obligations. The integrated steel process involves carbon and generates substantial carbon dioxide (“CO2”). The EU has established GHG regulations and adopted new legislation as part of the “Fit for 55” package, see “Business Overview – Government Regulations—Environmental laws and regulations—Climate Change".
The new laws are all interconnected, and they combine: tightening and extending the existing ETS; increased use of renewable energy; greater energy efficiency; a faster roll-out of low emission transport modes and the infrastructure and fuels to support them; an alignment of taxation policies with the European Green Deal objectives; a carbon border adjustment mechanism (“CBAM”) to prevent carbon leakage; and tools to preserve and grow natural carbon sinks. Of particular relevance are the ETS and CBAM regulations that will impact the carbon emissions allowances from the second trading period of Phase IV (i.e., 2026-2030) onwards. ArcelorMittal will likely incur additional costs in future periods to acquire emissions allowances beginning in 2026 due to the planned phase-out of the free allocation of CO2 emissions as from such date. The financial impact on ArcelorMittal, in particular the extent of margin squeeze, will depend on many factors, including actual CO2 market prices, hedging, the pace of ArcelorMittal's decarbonization of its European steel production, the effectiveness of the CBAM and the amount of premiums customers may be willing to pay for decarbonized steel.
Similar regulations have been implemented to date in several jurisdictions and additional measures may well be enacted in the
28
| Management report | ||
future in other jurisdictions, further increasing the complexity of compliance with environmental laws and regulations.
Whether in the form of a national or international cap-and-trade emissions permit system, a carbon tax or acquisition of emission rights at market prices, emissions controls, reporting requirements, or other regulatory initiatives, such environmental regulations could have a negative effect on ArcelorMittal’s production levels, income and cash flows. These laws could also negatively affect the Company’s suppliers and customers, which could translate into higher costs and lower sales. In particular, the European Commission’s decision to further reduce the allocation of CO2 emission rights to companies (as discussed above) could negatively impact the global steel industry, as the amount of such rights is currently insufficient to satisfy technically achievable operating conditions. CO2 emissions regulations have already resulted in increased costs in Europe, and ArcelorMittal expects costs will continue to increase with the implementation of Phase IV of the ETS that started in 2021 and that has seen EU allowances prices increase significantly compared to 2020 levels, with expectations that prices will continue to increase, despite recent volatility. In addition, the COVID-19 pandemic and its economic consequences caused a decline in production at most EU sites in 2020. Given that, under Phase IV rules, the activity levels from 2020 have an effect on the calculation of the allocations in 2021 and 2022 and also on the second trading period of Phase IV (2026-2030), lower production levels might lead to reduced allocations.
Furthermore, many developing nations have not yet instituted significant GHG regulations, and the Paris Agreement specifically recognizes that GHG emissions will peak later in developing countries. As the Intended Nationally Determined Contributions (“INDC”) for developing nations under the Paris Agreement may be less stringent than for developed nations in light of different national circumstances, ArcelorMittal may be at a competitive disadvantage relative to steelmakers having more or all of their production in developing countries. Depending on the extent of the difference between the requirements in developed regions (such as Europe) and developing regions (such as China or the CIS), this competitive disadvantage could be severe and render production in the developed region structurally unprofitable. High carbon costs in combination with weakening demand, rising imports, high energy costs and high iron ore prices was one of the factors underlying the Company’s decision to implement production cuts in Europe in 2019, in the second half of 2022 and in the fourth quarter of 2023. To address the resulting competitive disadvantage compared to imports, which is expected to increase in the future absent government intervention, the Company has been advocating vis-à-vis the European Commission to introduce a CBAM to the safeguard measures on steel imports in order to ensure that
imports into Europe face the same carbon costs as producers in Europe. The CBAM established a transition period of October 1, 2023 to December 31, 2025, during which there will be no financial obligation besides the possibility of penalties being imposed for failures to report. As from 2026 free allocation of CO2 emissions allowances will be progressively phased out, with no free allocation to be granted as from 2034.
This would contribute to a very significant shortage in free allocation in the later years of the second trading period of Phase IV. This could result in the Company incurring significant additional costs to acquire emissions allowances, the purchase of which may or may not be effectively hedged in the future. The financial impact will also depend on the evolution of the allowances price and the Company’s parallel progress in decarbonization, the cost of which may also be higher than currently expected. In addition, the effectiveness of the CBAM proposal against carbon leakage is untested, the provisions to address circumvention risks, including resource shuffling and cost absorption, seem insufficient, and no solution for exports has been yet considered. In addition, CBAM will be set up to equalize the price of carbon paid for EU products operating under the EU ETS and for imported goods by requiring companies that import into the EU to purchase so-called CBAM certificates to pay the difference between the carbon price paid in the country of production and the price of carbon allowances in the EU ETS.
In addition, as regulators and investors increasingly focus on climate change issues, the Company is exposed to the risk of frameworks and regulations being adopted that are ill-adapted to its operations. For example, the most established framework for carbon pricing and emissions trading schemes is currently the European Union’s ETS discussed above. As mentioned above, the Company has highlighted the importance that a CBAM be included in this system in order to avoid competitive distortions such as European steel becoming overpriced due to European carbon policy, prompting the market to outsource its steel from other regions where carbon is less expensive. The European Climate Law requires the Commission to present a legislative proposal of a Union 2040 target within six months of the global stocktake, expected in the first quarter of 2024. Preparatory works have started and the Scientific Advisory Board has advised a 2040 target range of a 90-95% reduction of emissions compared to 1990. In February 2024, the Commission presented a communication recommending a 90% reduction in net emissions by 2040 compared to 1990. The legal proposal to table the 2040 climate target will be the responsibility of the next Commission, following the European elections and the debates and dialogue which will take place. It is expected that such a target would trigger a further review of the ETS cap, likely leading to a tightened market that might drive higher prices for allowances. With respect to investors, the
29
| Management report | ||
European Union has reached a political agreement on a package of measures to implement key actions with respect to its sustainable finance plan. In June 2020, the European Commission published the EU Taxonomy for Sustainable Finance, a unified classification system to define what can be considered an environmentally sustainable economic activity, as a step in the efforts to channel investments into sustainable activities by making it clearer which economic activities most contribute to meeting the EU’s environmental objectives. In addition to the Taxonomy Delegated Act for the environmental objectives on climate mitigation and adaptation effective as of January 1, 2022. Delegated Acts for the four other environmental objectives have been published but do not include manufacturing of steel as an eligible activity. In addition, in November 2022, the European Council adopted the Corporate Sustainability Reporting Directive (“CSRD”), which will require extensive and detailed sustainability information based on reporting standard published in July 2023 (see "Business overview—Government regulations—Environmental laws and regulations" and Business overview—Sustainable development"). The SEC has also proposed new climate change disclosure requirements. If based on the information that will be disclosed, financial institutions or other stakeholders, including the public, begin to view investments in steel and mining as undesirable, it may become more difficult and/or more expensive for the Company to obtain financing. While the Company has taken significant steps and continues to adapt its operations in light of climate change and the need for sustainability, such steps may not be in line with future frameworks or regulations or market views of investment suitability. Moreover, the Company may in the future face increasing shareholder activism and/or litigation in relation to sustainability matters. See also “The Group’s carbon emissions intensity reduction targets are based on current assumptions with respect to the costs, government and societal support for the reduction of carbon emissions in particular regions and the advancement of technology and infrastructure related to the reduction of carbon emissions over time, which may not correspond in the future to ArcelorMittal’s current assumptions and may render its targets more costly, more difficult, or even impossible, to achieve.”
For further information on environmental laws and regulations and how they affect the Company’s operations, see “Business overview—Government regulations—Environmental laws and regulations” and note 9.1 to the consolidated financial statements.
The income tax liability of ArcelorMittal may substantially increase if the tax laws and regulations in countries in which it operates change or become subject to adverse interpretations or inconsistent enforcement.
Taxes payable by companies in many of the countries in which ArcelorMittal operates are substantial and include value-added
tax, excise duties, profit taxes, payroll-related taxes, property taxes, mining taxes and other taxes. Tax laws and regulations in some of these countries may be subject to frequent change, varying interpretation and inconsistent enforcement. Ineffective tax collection systems and national or local government budget requirements may increase the likelihood of the imposition of arbitrary or onerous taxes and penalties, which could have a material adverse effect on ArcelorMittal’s financial condition and results of operations. In addition to the usual tax burden imposed on taxpayers, these conditions create uncertainty as to the tax implications of various business decisions. This uncertainty could expose ArcelorMittal to significant fines and penalties and to enforcement measures despite its best efforts at compliance, and could result in a greater than expected tax burden. See note 10 to the consolidated financial statements.
In addition, many of the jurisdictions in which ArcelorMittal operates have adopted transfer pricing legislation. If tax authorities impose significant additional tax liabilities as a result of transfer pricing adjustments, it could have a material adverse effect on ArcelorMittal’s financial condition and results of operations.
It is possible that tax authorities in the countries in which ArcelorMittal operates will introduce additional revenue raising measures. The introduction of any such provisions may affect the overall tax efficiency of ArcelorMittal and may result in significant additional taxes becoming payable. Any such additional tax exposure could have a material adverse effect on the Company’s financial condition and results of operations.
ArcelorMittal may face a significant increase in its income taxes if tax rates increase or the tax laws or regulations in the jurisdictions in which it operates, or treaties between those jurisdictions, are modified in an adverse manner. This may adversely affect ArcelorMittal’s cash flows, liquidity and ability to pay dividends.
ArcelorMittal is subject to economic policy, military, political, social and legal risks and uncertainties in the markets (including emerging ones) in which it operates or proposes to operate, and these uncertainties may have a material adverse effect on ArcelorMittal’s business, financial condition, results of operations or prospects.
ArcelorMittal operates globally including in a large number of emerging markets. In recent years, many of these countries have implemented measures aimed at improving the business environment and providing a stable platform for economic development. ArcelorMittal’s business strategy has been developed partly on the assumption that this modernization, restructuring and upgrading of the business climate and physical infrastructure will continue, but this cannot be guaranteed. Any slowdown in the development of these economies could have a material adverse effect on ArcelorMittal’s business, financial
30
| Management report | ||
condition, results of operations or prospects, as could insufficient investment by government agencies or the private sector in physical infrastructure. For example, the failure of a country to develop reliable electricity and natural gas supplies and networks, and any resulting shortages or rationing, could lead to disruptions in ArcelorMittal’s production.
Moreover, some of the countries in which ArcelorMittal operates have been undergoing substantial political transformations from centrally controlled command economies to market-oriented systems or from authoritarian regimes to democratically elected governments and vice-versa. Political, economic and legal reforms necessary to complete such transformation may not progress sufficiently. On occasion, ethnic, religious, historical and other divisions have given rise to tensions and, in certain cases, wide-scale civil disturbances and military conflict. The political systems in these countries are vulnerable to their populations’ dissatisfaction with their government, reforms or the lack thereof, social and ethnic unrest and changes in governmental policies, any of which could have a material adverse effect on ArcelorMittal’s business, financial condition, results of operations or prospects and its ability to continue to do business in these countries. The prospect of further unrest and resulting political or economic destabilization cannot be ruled out. Furthermore, certain of ArcelorMittal’s operations are also located in areas where acute drug-related violence (including executions and kidnappings of non-gang civilians) occurs and the largest drug cartels operate, such as the states of Michoacán, Sinaloa and Sonora in Mexico.
Certain emerging markets where ArcelorMittal has operations have experienced or are experiencing particularly difficult operating conditions. Many emerging markets are also at risk of economic crises (be it external debt, currency, domestic corporate, household or public debt crises) usually brought on by an economic or political shock which can exacerbate existing domestic structural imbalances. Crises in Argentina and Turkey have had negative impacts on the Company's core markets in Brazil and the EU, respectively.
Finally, ArcelorMittal’s operations in certain countries may be affected by military conflicts. The current situation in Ukraine, where the Company has substantial operations, is an example. See “—Russia’s invasion of Ukraine, international reaction to it (in particular in the form of sanctions) and any regional or global escalation of the conflict, could adversely affect the Company’s business, results of operations and financial condition.”
Moreover, the legal systems in some of the countries in which ArcelorMittal operates remain less than fully developed, particularly with respect to the independence of the judiciary, property rights, the protection of foreign investment and bankruptcy proceedings, generally resulting in a lower level of legal certainty or security for foreign investment than in more
developed countries. ArcelorMittal may encounter difficulties in enforcing court judgments or arbitral awards in some countries in which it operates because, among other reasons, those countries may not be parties to treaties that recognize the mutual enforcement of court judgments. Assets in certain countries where ArcelorMittal operates could also be at risk of expropriation or nationalization, and compensation for such assets may be below fair value. For example, in December 2023, the sale of ArcelorMittal Temirtau to QIC had a $2.4 billion negative impact on the Company's net income (see also note 2.3 to the consolidated financial statements). In addition, the Venezuelan government has implemented a number of selective nationalizations of companies operating in the country to date. Most recently, ADI was placed in extraordinary administration by the Italian Government in February 2024, thereby passing control from its shareholders (including ArcelorMittal) to government-appointed commissioners. Although ArcelorMittal believes that the long-term growth potential in emerging markets is strong, and intends them to be the focus of the majority of its near-term growth capital expenditures, legal obstacles could have a material adverse effect on the implementation of ArcelorMittal’s growth plans and its operations in such countries.
ArcelorMittal is subject to an extensive, complex and evolving regulatory framework which may expose it and its subsidiaries, joint ventures and associates to investigations by governmental authorities, litigation and fines, in relation, among other things, to antitrust and compliance matters. The resolution of such matters could negatively affect the Company’s strategy, operations, profitability and cash flows in a particular period or harm its reputation.
ArcelorMittal’s business encompasses multiple jurisdictions and complex regulatory frameworks, including in relation to antitrust, and economic sanctions, anti-corruption and anti-money laundering matters. Laws and regulations in these areas are complex and constantly evolving and enforcement of them continues to increase. ArcelorMittal may as a result become subject to increasing limitations on its business activities and to the risk of fines or other sanctions for non-compliance. From time to time, the Company is subject to review by authorities that monitor market power in any of the markets in which it operates. To the extent that ArcelorMittal is deemed by relevant authorities to exhibit significant market power, it can be subject to various regulatory obligations and restrictions, such as disposing of assets or granting access to its operations to third parties or being prevented from completing acquisitions, which could thereby adversely affect its results of operations and profitability. As a result of its position in the steel industry and its historical growth through acquisitions, ArcelorMittal could be subject to governmental investigations and lawsuits by private parties based on antitrust laws. These could require significant expenditures and result in liabilities or governmental orders that
31
| Management report | ||
could have a material adverse effect on ArcelorMittal’s business, operating results, financial condition and prospects. An adverse ruling in such type of proceedings could subject ArcelorMittal to substantial administrative penalties and/or civil damages. No assurance can be given that the Company will not be identified as having significant market power in any relevant markets in the future and that it will not be subject to additional regulatory requirements.
ArcelorMittal’s governance and compliance processes, which include the review of internal controls over financial reporting as well as a Code of Business Conduct and other rules and protocols for the conduct of business, may not prevent breaches of laws and regulations or internal policies relating to compliance matters at ArcelorMittal or its subsidiaries, as well as to instances of non-compliant behavior by its employees, contractors or other agents. This risk is also present at ArcelorMittal’s joint ventures and associates where ArcelorMittal has a non-controlling stake and does not control governance practices or accounting and reporting procedures.
Unfavorable outcomes in current and potential future litigation and investigations relating to antitrust and compliance matters could reduce ArcelorMittal’s liquidity and negatively affect its profitability, cash flows, results of operations and financial condition, as well as harm its reputation.
ArcelorMittal is currently and in the future may be subject to legal proceedings or product liability claims, the resolution of which could negatively affect the Company’s profitability and cash flows in a particular period. ArcelorMittal’s profitability or cash flows in a particular period could be affected by adverse rulings in current and future legal proceedings against the Company. See note 9.3 to the consolidated financial statements.
In addition, ArcelorMittal sells products to major manufacturers engaged in manufacturing and selling a wide range of end products, including products used in certain safety-critical applications, such as, for example, pipes used in gas or oil pipelines and in automotive applications. ArcelorMittal also from time to time offers advice to these manufacturers. There could be significant consequential damages resulting from the use of or defects in such products. While ArcelorMittal has a limited amount of product liability insurance coverage, a major claim for damages related to ArcelorMittal products sold and, as the case may be, advice given in connection with such products, could leave ArcelorMittal uninsured against a portion or the entirety of such an award and materially harm its financial condition and future operating results.
U.S. investors may have difficulty enforcing civil liabilities against ArcelorMittal and its directors and senior management.
ArcelorMittal is incorporated under the laws of the Grand Duchy of Luxembourg with its principal executive offices and corporate headquarters in Luxembourg. The majority of ArcelorMittal’s directors and senior management are residents of jurisdictions outside of the United States. The majority of ArcelorMittal’s assets and the assets of these persons are located outside the United States. As a result, U.S. investors may find it difficult to effect service of process within the United States upon ArcelorMittal or these persons or to enforce outside the United States judgments obtained against ArcelorMittal or these persons in U.S. courts, including actions predicated upon the civil liability provisions of the U.S. federal securities laws. Likewise, it may also be difficult for an investor to enforce in U.S. courts judgments obtained against ArcelorMittal or these persons in courts in jurisdictions outside the United States, including actions predicated upon the civil liability provisions of the U.S. federal securities laws. It may also be difficult for a U.S. investor to bring an original action in a Luxembourg court predicated upon the civil liability provisions of the U.S. federal securities laws against ArcelorMittal’s directors and senior management and non-U.S. experts named in this annual report.
ArcelorMittal has identified a material weakness in internal control over financial reporting as of December 31, 2023, resulting from internal control deficiencies at one of the Company’s Canadian subsidiaries, that could, if not remediated, result in material inaccuracies in the Company’s consolidated financial statements.
As described in “Additional Information—Management’s report on internal control over financial reporting", management has concluded that, as of December 31, 2023, ArcelorMittal’s internal control over financial reporting was ineffective due to a material weakness that has been identified and which results from internal control deficiencies at one of the Company’s Canadian subsidiaries. The material weakness relates to information technology general controls (“ITGCs”) in the areas of user access and program change management over certain information technology (“IT”) systems that support the recognition of sales and cost of sales, ineffective business process controls (automated and manual IT-dependent) due to the dependency on such ITGCs, and other ineffective business process controls supporting the recognition of sales and cost of sales.
Management and the Company’s Board of Directors are committed to maintaining a strong internal control environment. Management, with the oversight of the Audit & Risk Committee of the Board of Directors, evaluated the material weakness identified as of December 31, 2023, and is implementing a remediation plan to address the material weakness resulting
32
| Management report | ||
from internal control deficiencies at the Company's Canadian subsidiary and enhance the Company’s control environment. The remediation plan will enhance identification of IT applications relevant to internal control over financial reporting, appropriately implement and operate ITGCs and continue to train Company personnel and clearly communicate control responsibilities. The Company cannot be certain that the measures it has taken, and expects to take, will be sufficient to correct the deficiencies identified to ensure that its internal control over financial reporting is effective or that additional material weaknesses in the Company's internal control over financial reporting will not be identified in the future. In addition, while ArcelorMittal is taking steps to address these material weaknesses, any gaps or deficiencies in its internal control over financing reporting may result in the Company being unable to provide required financial information in a timely and reliable manner and/or incorrectly reporting financial information, which could reduce confidence in the Company's published information, impact access to capital markets, impact the trading price of its securities or subject it to potential regulatory investigations and sanctions. Any of the foregoing could materially and adversely affect its business, results of operations and financial condition.
Risk management process
Management is responsible for internal control in the Company and has implemented on an ongoing basis a robust short, medium and long-term risk – including ESG and climate-related risks – management and control system, which is designed to ensure its business is focused on achieving its objectives and that significant risks are identified and mitigated. The system is also designed to ensure compliance with relevant laws and regulations.
The Company’s risk management and internal control system is designed to determine risks in relation to the achievement of business objectives and appropriate risk responses. The establishment and maintenance of a risk identification and management process is the responsibility of site/segment/ corporate function management. Risks are owned and monitored by management. Risk officers designated by management facilitate the conversations and help monitoring the action plans. Critical risks are escalated through existing reporting lines. Critical risk decisions are not dissociated from the other decisions. Risks are analyzed by building models and developing scenarios to understand potential financial impacts. Short-term risks (within a 12-month time frame) are identified through a bottom-up process by respective management teams. Risks are identified through a defined process by respective management teams. Business segments and corporate functions consolidate the identified risks and report the top ones as part of the periodic reporting to key internal stakeholders. The Company uses a risk management framework based on a
blend of a COSO 2013, ISO 31000 and an in-house model. Sites assess risks, including ESG and climate related risks, by assigning them a probability of occurrence, potential financial impact and/or non-financial consequences. Global trends, and the risks and opportunities identified as arising from them, are used to inform the Company’s strategic outlook and planning.
Based on management reviews, reviews of the design and implementation of the Company’s risk management approach and business and functional risk committees, management provides an assessment each year, as required by law, of the effectiveness of the Company’s risk management process.
It should be noted, however, that the above does not imply that these systems and procedures provide certainty as to the realization of operational and financial business objectives, nor can they prevent all misstatements, inaccuracies, errors, fraud and non-compliance with rules and regulations.
The Audit & Risk Committee assists the Board of Directors with the oversight of risks to which the ArcelorMittal group is exposed and in the monitoring and review of the risk-management framework and process.
The Global Assurance Department facilitates the risk management process and provides support enabling business as well as corporate functions to identify these risks and opportunities to the business based on social, environmental, regulatory, workforce, stakeholder, resource, technological and other trends, and specify mitigation actions. A consolidated report is shared on a half-yearly basis with the key stakeholders.
With respect to climate, the work is coordinated by ArcelorMittal’s executive officer for corporate business optimization in consultation with segment CEOs; discussed on a regular basis by the Group Management Committee; and overseen by the Executive Office, which provides leadership and guidance. The Company’s climate strategy financial risks are brought to the attention of the Group Management Committee and where financially significant at a group level, are addressed at the Corporate Finance and Tax Committee. Central to the Company's approach is its work to advocate for policy support strategy to ensure that ArcelorMittal can respond to rising carbon prices with viable investments in decarbonization technologies. At the same time, all of ArcelorMittal's business segments are required to prepare carbon emission reduction plans to reach net zero by 2050 as part of the annual planning cycle.
With respect to security, the Company has put in place means to ensure the security of its people, assets and intellectual property by supporting business units on security governance, security risk management, operational security, strategy and continuous improvement. It develops and promotes security policies,
33
| Management report | ||
procedures, tools and processes to support security process owners with identifying and assessing security risks, related to people, assets and intellectual property. It also identifies gaps, and implements appropriate leading practice security controls to promote more secure and resilient business environments.
As regards risks relating to the security of information systems, ArcelorMittal has developed governance and security rules which describe the recommended organization, infrastructure and operating procedures. These provisions are applied across the Company under the responsibility of the business segments. The Group Chief Information Security Office defines cyber security policies available and applicable for all segments/units globally and develops general directives in cyber security reflecting mission, goals and values of ArcelorMittal. The cyber security policy focuses on protecting information systems against disclosure to unauthorized users (confidentiality), improper modification (integrity) and non-access when required (availability). In addition, cyber maturity assessments are performed annually in many business units and supplemented by in-depth cyber audits and penetration testing exercises performed by Global Assurance. For more detailed information regarding the Company's cybersecurity risk management and strategy, see "Cybersecurity" below.
Regarding risks relating to changes in the regulatory environment and business ethics, the Legal, Compliance & Company Secretary Department ("LCCSD") reporting to the Chief Financial Officer establishes the Company's legal policy. It provides effective advice to assist in identification and monitoring of legal, regulatory and governance risks. The LCCSD is supported by regional and segment general counsels located across the business, who are further supported by unit or country general counsels. The Compliance structure is headed by Group Compliance and the Data Protection Officer who report to Group Head of Legal. The Group Compliance and Data Protection Officer is supported by a Corporate Compliance team and a Group-wide compliance network.
Insurance
ArcelorMittal maintains insurance policies to cover physical loss or damage to its property and equipment on a reinstatement basis arising from a number of specified risks, including certain natural disasters, such as earthquakes, floods or windstorms, acts of terrorism and certain consequential losses, including business interruption arising from the occurrence of an insured event under the said policies.
ArcelorMittal also purchases worldwide third-party public and product liability insurance coverage for all of its subsidiaries.
Various other types of insurance are also maintained, such as comprehensive construction and contractor insurance for its greenfield and major capital expenditures projects, directors and
officers liability, transport, and charterers’ liability, as well as other customary policies such as car insurance, travel assistance and medical insurance.
Operating subsidiaries of ArcelorMittal maintain various local insurance policies, including policies that may be mandatory at the local level, such as employer liability, workers compensation and auto liability, as well as specific insurance such as public or pollution liability to comply with local regulations.
In addition, ArcelorMittal maintains trade credit insurance on receivables from selected customers, subject to limits that it believes are consistent with those in the industry, in order to protect it against the risk of non-payment due to customers’ insolvency or other causes. Not all of ArcelorMittal’s customers are or can be insured, and even when insurance is available, it may not fully cover the exposure.
ArcelorMittal believes that its insurance coverage is in line with industry practice and sufficient to cover normal risks in its operations. Notwithstanding the insurance coverage that ArcelorMittal and its subsidiaries carry, the occurrence of an event that causes losses in excess of limits specified under the relevant policy, or losses arising from events not covered by insurance policies, could materially harm ArcelorMittal’s financial condition and future operating results.
Internal control procedures
ArcelorMittal's internal control framework is based on the Committee of Sponsoring Organizations of the Treadway Commission ("COSO") 2013. It includes the following five components: control environment, risk assessment, control activity, information and communication and monitoring activities.
ArcelorMittal's internal controls aim to provide reasonable assurance but not absolute assurance because of the inherent limitations around effectiveness and efficiency of business operations, reliability of financial information, compliance with laws and regulations and compliance with policies and procedures. The organization of ArcelorMittal's internal control is aligned with group organization following which business segments and operational entities are directly accountable for establishing and maintaining effective and adequate internal controls and procedures that conform to the regulatory framework. The principles of control fit into the framework of the rules of corporate governance. In particular, these rules task the Audit & Risk Committee with monitoring the effectiveness of the internal control and risk management systems and of the internal audit, particularly as regards the procedures for preparing and dealing with accounting, financial and non-financial reporting.
34
| Management report | ||
Control environment
ArcelorMittal's control environment is primarily based on its Code of Business Conduct and supported by a comprehensive framework of policies and procedures in areas such as human rights, anti-corruption and insider dealing. These documents reflect the principles and concepts of the UN Global Compact, the OECD Guidelines on Multinational Enterprises and UN Sustainable Development Goal 16: peace, justice and strong institutions. The Company’s Code of Business Conduct defines what acting with integrity means in practice. It applies to all directors, officers and employees of ArcelorMittal worldwide. To maintain knowledge about the Code of Business Conduct and other aspects of compliance, employees take part in training programs based on a matrix system covering economic sanctions, prevention of corruption, insider dealing regulation, fraud awareness and prevention, anti-trust issues, human rights, data protection and the Code of Business Conduct every three years.
The Board of Directors, with the support of its Committees, ensures that internal control functions operate properly. The Audit & Risk Committee monitors the effectiveness of internal control and risk management systems implemented by the Board of Directors and management. As part of its role to foster open communication, the Audit & Risk Committee meets at least annually with management, the head of Global Assurance and the Company’s independent accountants in separate executive sessions to discuss any matters that the Audit & Risk Committee or each of these persons believe should be discussed privately. Management's responsibility is to ensure that the organizational structure plans, executes, controls and periodically assesses the Company's activities. It regularly reviews the relevance of the organizational structures so as to be in a position to adapt them swiftly to changes in the activities and in the environment in which they are carried out. The business segments' and operational entities' management are responsible for the internal control and risk management system within their scope of responsibility.
ArcelorMittal has defined responsibilities that cover the three dimensions of internal control: operational management, which is responsible for implementing internal control, support functions such as Finance, Legal, Treasury or Human Resources, which prescribe the internal control systems, verify their implementation and effectiveness and assist operational employees, and Global Assurance who, through their audit reports, provide recommendations to improve the effectiveness of the systems.
Following a risk-based approach, business processes and/ or management systems may be the subject of an internal audit performed by the Global Assurance Department reporting to both the Audit & Risk Committee Chair and the Group Executive Chairman in accordance with the international framework of the
internal audit and its Code of Ethics. The audit plan, which is risk based, is submitted annually to the Audit & Risk Committee. The Global Assurance department presents its results to the management of operational entities and business segments and reports to the Audit & Risk Committee, Executive Office and Group CFO.
The design and effectiveness of the key operational, financial and information technology controls related to internal control over financial reporting, are regularly examined and assessed in compliance with the Sarbanes-Oxley Act.
Cybersecurity
Risk management and strategy
The Group Chief Information Security Officer and Head of Cyber Strategy (“CISO”) follows the Group risk management program as defined by the Global Assurance team in the management of risks relating to the security of information systems. For further information on the Global Assurance team, see “Corporate governance—Sustainability committee—Global Assurance”. The CISO is an experienced Information Technology/Operation Technology strategist. He has many years of experience in IT and the cybersecurity field, has been with the Group for the last 2 years and was earlier at AMNS India (previously ESIL) for over 19 years heading various functions including CIO of that entity for 8 years. He holds a bachelor’s degree in electrical engineering from Sardar Vallabhbhai National Institute of Technology in India and a masters in business administration from the Dayalbagh Educational Institute in India.
On a quarterly basis, the Group CISO provides a cybersecurity risk report to the Group’s Audit & Risk Committee based on risks identified at the segment level, which in turn reports to and assists the Board of Directors in fulfilling its oversight responsibilities with respect to legal and regulatory requirements, including cybersecurity. Risks identified in the report are considered potential risks that may affect all functions and departments across the Group. The office of the CISO has identified the following four key risk areas:
1.Large-scale cyber-attacks or malware causing economic damage and/or reputational harm to ArcelorMittal.
2.Dependency risks and increased vulnerability to outages of critical systems (applications or infrastructure) causing significant disruption to ArcelorMittal.
3.Adverse consequences of technological advances such as Artificial Intelligence (“AI”), cloud-based programs or systems, Internet of Things (“IoT”) and Blockchain which may cause harm to ArcelorMittal.
4.Wrongful exploitation of personal information causing regulatory liabilities (e.g., GDPR or similar laws) or of
35
| Management report | ||
business data causing contractual or other legal liabilities (e.g., relating to IP, R&D or customers) that would have significant impacts on ArcelorMittal.
As part of the risk management process, the Group’s local IT teams and segment CISOs also identify local cyber risks and report to local risk committees.
The office of the CISO defines policies and procedures related to cyber and information security as well as to permissible and secure uses of cloud, operational technology (“OT”) and IoT within the Company. ArcelorMittal follows the National Institute of Standards and Technology Cybersecurity Framework ("NIST CSF"). The Group’s cybersecurity policies focus on protecting information systems against disclosure to unauthorized users (confidentiality), improper modification (integrity) and non-access when required (availability). These polices are implemented across the Group and tracked and reported on a quarterly basis. Additionally, the Company has in place a global incident and crisis process with special procedures for ransomware and data privacy (e.g., to increase protection and address breaches). Most Group entities undergo periodic security penetration testing exercises led by the ArcelorMittal Global Assurance team or external third parties throughout the year.
The Company engages a wide range of third parties as part of the implementation and operationalization of its cybersecurity policies, cyber defense strategies and general cyber risk management, including specialist assessors, security consultants, IT auditors, forensic analysts, malware analysts and other third-party specialists. All third-party security providers that handle Company data or otherwise have access to ArcelorMittal’s network and systems are required to complete a rigorous risk assessment program in an online platform, which includes checks for data and cloud security, access, incident reporting and physical protection in accordance with the NIST CSF as well as applicable Company cybersecurity policies.
In addition, Cyber Maturity Assessments are performed annually by an external consultant across many entities and segments for both IT and OT. Assessments are evidence-based exercises focusing on many key cyber processes, such as Vulnerability and Incident Management, Patching and Change Management, Malware Protection, Network Monitoring, Business Continuity and Disaster Recovery, and Software Security. Global Assurance also performs in-depth cyber reviews, audits and penetration tests at least once annually.
ArcelorMittal has been a long-standing customer of the BitSight rating service and has defined specific target levels and KPIs for cybersecurity in the BitSight platform. These risk measures are monitored daily and reported quarterly to the Data Protection Committee, led by the Group Data Protection Officer with representation from Group Compliance, Group HR and the
Group CISO. BitSight also reports ArcelorMittal’s risk profile to Glass-Lewis for purposes of investor reporting.
The office of the CISO has put in place an extensive online dashboard that tracks various metrics related to cybersecurity risks across various operating units. Such measures include:
1.BitSight External Cyber Ratings and Risk Factors
2.AntiMalware compliance levels
3.Active Directory security posture
4.Cloud Security cyber score and framework adoption
5.Ransomware Exploitable Vulnerability remediation status
6.Externally Facing Web Application Vulnerability levels
7.Cyber Awareness Education and Training
8.OS Level and Patching posture
9.Mobile security compliance
10.Security Baselines (IT and OT) quarterly assessments
11.Expired user account risk
12.Cyber attack simulation effectiveness
Cyber Related Events in 2023
In 2023, ArcelorMittal did not experience any cyber-attacks, cybersecurity threats or other information security incidents that materially affected or were reasonably likely to materially affect the Company’s business strategy, results of operations or financial condition. Several instances of malicious activity were detected on certain of the Company’s servers and systems, including in Spain, Brazil, Germany and Venezuela. In each case, the Company deployed defenses against these attacks and conducted forensic analysis in coordination with third-party providers in order to successfully prevent the exfiltration of data, contain or neutralize the ransomware from spreading to additional sites or servers and recover data from backup servers. The Company also installed additional technologies and software with the goal of ensuring the affected systems were clear of any continuing threats. See "Risk factors and control—ArcelorMittal’s reputation and business could be materially harmed as a result of data breaches, data theft, unauthorized access or successful hacking”.
Governance
ArcelorMittal implements a distributed organizational model. At the Group level, the Group CISO defines the global cybersecurity strategy and roadmap.
The global cybersecurity strategy and roadmap is informed by the ArcelorMittal Security Incident Classification and Escalation Procedures as well as the ArcelorMittal Cyber Crisis Management Procedures (collectively, the “Cybersecurity Procedures”). The Cybersecurity Procedures define the core
36
| Management report | ||
principles of security risk management and the procedures for security management, including the roles and responsibilities of key personnel, strategy and measures to cope with information security breaches and related communication procedures.
Every cybersecurity occurrence or threat that rises to a specific level defined in the Cybersecurity Procedures is reviewed in the various security councils set out below and communicated to the appropriate committees as defined in the Cybersecurity Procedures. Any such cyber incident is promptly reported by the Group CISO to (a) the Audit & Risk Committee, which in turn reports to the Board, in order to initiate the prescribed remedial measures and (b) the Group CFO and Disclosure Committee for decision-making regarding external communication to regulators or investors.
In fulfilling its oversight responsibilities, the Board oversees cyber risks and incidents via the Audit & Risk Committee and approves proposals or modifications to the Cybersecurity Procedures. The Audit & Risk Committee relies on information provided from Global Assurance, to which the Group CFO provides information about risks. The Group CFO provides information to both the Audit & Risk Committee and the Group CEO.
The following teams are organized under and report to the Group CISO:
•the Group Chief Information Officer (“CIO”) Council (headed by the Group CISO and made up of segment CIOs and other specialists) leads and manages the different business segments, which are responsible for the implementation and management of security controls, processes and technology within their respective business segments.
•the Group Cybersecurity (“CS”) Leadership team led by the Group CISO and consisting of security officers from each segment, is responsible for decision-making relating to all security topics, defining roadmaps and execution of strategies and protection within their respective segments.
•the Global Ransomware Crisis Committee made up of various heads of leadership functions such as Legal, IT, Treasury, Communication, Investor Relations and Global Assurance, with the assistance of a third-party service provider acting as the Company’s ransomware negotiator and advising partner, is responsible for advancing and implementing the decision-making processes in the event of a ransomware outbreak across the Company and any demands for ransom payments.
•the Data Protection Committee consisting of Group Compliance, Group HR and Group CISO, and led by
the Group’s Data Privacy Officer, meets quarterly to review any incidents or risks involving data privacy matters, and its recommended actions are implemented across the Group.
•the Cyber Expert Committee (“EC”) led by the CISO and made up of various subject matter experts and segment security officers, works as a centralized team to address common global issues and risks, recommend technologies and risk solutions across the Group and prepare technical security proposals to be reviewed by CS Leadership and approved and adopted by the CIO Council.
•the IT Security Council and OT Security Council operating across the Group and comprised of security leads from each segment for their respective areas (IT or OT), as well as from Global Assurance are used for purposes of information sharing, feedback sessions for the CS Leadership Group and sounding boards for new proposals coming from CS or EC.
BUSINESS OVERVIEW
Business strategy
ArcelorMittal’s success is built on its core values of safety, sustainability, quality and leadership and the entrepreneurial boldness that has empowered its emergence as the first truly global steel and mining company. Acknowledging that a combination of structural issues and macroeconomic conditions will continue to challenge returns in its sector, the Company has adapted its footprint to the new demand realities, intensified its efforts to control costs and repositioned its operations to outperform its competitors. The Company also continues to develop and implement plans aimed at decarbonizing its steel and mining assets in a competitive manner and achieving carbon neutrality by 2050.
Against this backdrop, ArcelorMittal's strategy is to leverage four distinctive attributes in aiming to capture leading positions in the most attractive areas of the steel industry value chain, from mining at one end to distribution and first-stage processing at the other:
•Global scale and scope
•Unmatched technical capabilities
•Diverse portfolio of steel and related businesses, particularly mining
•Financial capability.
Three themes
Steel. ArcelorMittal looks to expand its leadership role in attractive markets and segments by leveraging the Company’s technical capabilities and its global scale and scope. These are
37
| Management report | ||
critical differentiators for sophisticated customers that value the distinctive technical and service capabilities the Company offers. Such customers are typically found in the automotive, energy, infrastructure and a number of smaller markets where ArcelorMittal is a market leader. In addition, the Company is present in, and will further develop, attractive steel businesses that benefit from favorable market structures or geographies. In developing attractive steel businesses, ArcelorMittal’s goal is to be the supplier of choice by anticipating customers’ requirements and exceeding their expectations. It will invest to develop and grow these businesses and enhance its ability to serve its customers. Given the volatile nature of the industry, these investments will be highly disciplined, leveraging advanced project management capabilities, balancing financial and sustainable considerations with targeted strategic opportunities. Commodity steel markets will inevitably remain an important part of ArcelorMittal’s steel portfolio. Here, a lean cost structure should limit the downside in weak markets while allowing the Company to capture the upside in strong markets. Finally, ArcelorMittal is developing a strategic response to the challenges and opportunities posed by decarbonization, which it believes will fundamentally change the market structure of the steel industry.
Mining. ArcelorMittal is working to continue to create value from its world-class mining business. Mining forms part of the steel value chain but typically enjoys a number of structural advantages, such as a steeper cost curve. The Company's strategy is to create value from its most significant assets, through selective expansion and de-bottlenecking, by controlling cost and capital expenditure, and by supplying products that are highly valued by steel producers. ArcelorMittal's financial capability has allowed it to continue to invest in key mining assets (in particular AMMC as well as ArcelorMittal Liberia and Serra Azul), while the diversity of its steel and mining portfolio facilitates the ability of the mining business to optimize the value of its products in the steelmaking process. The Company's mining business aspires to be the supplier of choice for a balanced mix of both internal and external customers, while at the same time providing a natural hedge against market volatility for its steel operations. The mining business should also support the decarbonization of the steel footprint through optimization of mining product mix by supplying raw materials needed for the low emissions footprints.
All operations. ArcelorMittal strives to achieve best-in-class competitiveness. Operational excellence, including health and safety, the number one priority, is at the core of the Company's strategy in both steel and mining. The Company steadily optimizes its asset base to ensure it is achieving high operating rates with its best assets. Its technical capabilities and the diversity of its portfolio of businesses underpin a strong commitment to institutional learning and continuous
improvement through measures such as benchmarking and best-practice sharing. Innovation in products and processes also plays an important role while supporting overall competitiveness. In addition, pursuant to the Company's July 2021 announcement to target a global reduction of 25% in carbon emissions intensity (both scope 1 and 2) by 2030, the Group is progressing on various pathways to competitively reduce carbon emissions across its asset base.
Five key strategic enablers
Critical to implementing this strategy are five key enablers:
A clear license to operate. Many of ArcelorMittal's businesses are located in regions that are in the early stages of economic development. Practically all are resource-intensive. The Company recognizes that it has an obligation to act responsibly towards all stakeholders. ArcelorMittal's commitment to sustainability and safety is outlined below. See "Business overview—Sustainable development" and Government regulations—Health and safety laws and regulations". Sustainability and safety are core values that underly ArcelorMittal's efforts to be both the world’s safest steel and mining company and a responsible environmental steward.
A strong balance sheet. The Company maintains a strong balance sheet with credit metrics consistent with investment grade credit rating. This provides a strong foundation for its balanced capital allocation: to invest in organic growth, consistently reward shareholders, and maintain the flexibility, on a selective basis, to pursue acquisitive growth opportunities.
A decentralized organizational structure. ArcelorMittal's scale and scope are defining characteristics that give it a competitive advantage. They also introduce complexity and the risks of inefficiency, bureaucracy and diffuse accountability. To manage these risks, the Company favors a structure in which the responsibility for profit and loss is focused on business units aligned with markets.
Active portfolio management. Throughout the Company's history, it has sought to grow and strengthen the business through acquisitions. That remains the case. The acquisition of existing assets and businesses is typically seen as a more attractive growth path than greenfield investment. The Company is, however, also willing to dispose of businesses that cannot meet its performance standards or that have more value to others.
The best talent. ArcelorMittal's success will depend on the quality of its people, and its ability to engage, motivate and reward them. As detailed below, the Company is committed to investing in its people and ensuring a strong leadership pipeline. See "Management and Employees—Employees—Employee
38
| Management report | ||
development". It will continue to improve its processes to attract, develop and retain the best talent.
Research and development
The Company’s Global Research and Development ("R&D" or "Global R&D") division provides the technical foundation for the sustainability and commercial success of the Company by stimulating innovative thinking and the continuous improvement of products and processes.
ArcelorMittal believes it possesses leading R&D capabilities among steel producers and is committed to maintaining and extending this advantage by anticipating and responding to major technological, sustainability and social trends, while also making a significant contribution towards achieving the Company’s 10 Sustainable Development Outcomes (see “— Sustainable development” below).
To support this commitment, the Company operates 14 research sites in 9 countries around the world, including a new German based R&D unit which started activities during 2022. In 2023, ArcelorMittal’s R&D expense was $299 million (compared to $286 million and $270 million in 2022 and 2021, respectively).
In addition, the Company capitalized $26 million of research and development expenses in 2023 (compared to $28 million in 2022).
Among its R&D initiatives, ArcelorMittal has developed over 15 years of expertise and tripled its resources in Life Cycle Assessment ("LCA"), which analyzes the environmental impact of products during their production, use and disposal. In 2023, the Company undertook a total of 63 LCA studies related to steel products and the processes used to produce them, all guided by the relevant standards (ISO 14040-44).
The Company’s expertise in LCA is an important asset in all of its global markets. For example, LCA is a requirement of Environmental Product Declarations ("EPD") for construction products in Europe, Brazil and North America, and contributes to increasing the Company’s competitiveness in the construction sector. For automotive solutions, LCA studies are conducted on components of vehicles for improved environmental performance and sustainable supply chains with customers.
ArcelorMittal's product improvements with regards to their environmental impact and information are facilitated by collecting data from all sites for upstream and downstream activities including energy use. These evaluations are updated and reviewed on an annual basis, facilitating LCA at product level.
In 2022, ArcelorMittal renewed its support for the CIRAIG International Consortium on Lifecycle by committing to a new five-year mandate. The consortium is an international reference
center for the lifecycle of products, processes and services. It identifies and develops complex modelling to support sustainable transitions, including GHG emissions, biodiversity, water use and social aspects.
ArcelorMittal’s R&D strategy focuses on six main pillars:
Maintaining the competitiveness of the Company’s steel among its unique automotive customer base.
R&D continually drives innovation that enables the Company’s strategic focus on higher-added-value products. A key focus area is products designed to meet the complex and changing needs of the automotive industry.
ArcelorMittal continuously develops its S-in motion® range of solutions, which showcases the benefits of AHSS grades and manufacturing processes. These projects assist automotive customers in meeting demanding targets for fuel economy, and thereby drive improvements in CO2 emissions.
Currently, S-in motion® projects focus on BEVs with solutions for B-Segment SUV, C-Segment and mid-size SUV to address specific needs of local markets. A deeper focus on BEV is needed to, amongst others on a shorter front module, protect batteries against impact due to accidents, lowering the center of gravity and the additional weight due to batteries. These specificities require rethinking crash management. The S-in Motion® BEV catalogue of steel solutions is adapted to this new type of vehicle. Advanced and especially ultra-high strength steels, innovative press hardened steels, and laser welded blanks are especially highlighted as key solutions for an optimal performance (safety/weight) and battery safety. The growth of various types of electric vehicles will impact design and manufacturing. As an example, both the battery box and body structure must protect the battery in the event of a crash. AHSS products are among the most affordable solutions on the market for these specific applications. In a context where the supply of electric vehicles, and especially BEVs, are expected to grow quickly.
The S-in Motion® Multi Part Integration® project was recently released where new and innovative solutions are being rolled out to address the expected simplification of car manufacturers. On top of further reducing weight, the new solutions offer concepts to simplify operations by reducing the amount of robots needed by reducing the shop floor size and cutting the hours of labor per vehicle in the assembly shop by up to 30%. These achievements are made possible by the combination of extra-large laser welded blanks and the new generation of Press Hardening steels Usibor® 2000 and Ductibor® 1000.
As far as product development is concerned, several new products have been commercialized, including in particular additional martensitic grades and multiphase MP grades which
39
| Management report | ||
are now in ArcelorMittal’s catalogue. In addition to these product developments, a number of XCarb® RRP products have been developed while utilizing the Company's existing EAF production route.
Creating a robust and diverse portfolio of niche non-automotive steel products to serve customers across multiple sectors.
Customers in many sectors share the automotive industry’s demand for innovative products and processes. The Company aims to deliver similar breakthrough advances in these sectors by creating differentiated products and unique engineering solutions, all designed to ensure that steel is the customer's material of choice.
ArcelorMittal is fully involved in the development of solutions dedicated to the Global Energy Transition. The Company has developed and patented corrosion resistant steels for use in wind towers or solar mounting systems. Notably, Magnelis® advanced coating combined with Hyper® high strength steels has become a material of choice for light weight solar structures.
Extension of the solutions to heavy coating weights (ZM800) has been industrialized over a large range of sizes (thin & thick gauges), and even heavier weights are in the trial phase. These solar steel solutions are being deployed globally in Europe, North and South America and Asia. Additionally, the Company is working on the development of solutions suitable for the hydrogen economy, electricity grids, carbon capture, storage & use and bioenergy. Hymatch® steel offer is being developed in order to provide steel grades suitable for H2-linepipes.
Furthermore, a complete range of low-CO2 steels has been developed, known as XCarb® RRP steels, aimed at applications in the renewable energy segment, notably S355J2 heavy plates for wind towers and Magnelis® coated structural steels for solar mounting systems or heat pumps. The production of these products, while utilizing a renewable electricity and employing high recycled scrap content, allows for a reduction in carbon footprint by up to 65%.
Packaging is, in the Company’s view, another important opportunity. ArcelorMittal continues to respond to the need to meet evolving health and safety regulations, to achieve lightweight, cost-saving design, and to develop new functionalities. Chromium-free passivation for tinplate has been fully industrialized with multiple applications and as per customer quality requirements. High strength and thin gauge steels have been developed for Easy Open End, twist-off caps, and aerosol lightweight applications. BPANI (Bisphenol A non-intent) lacquered steel for aerosol valves has been successfully developed and introduced to the market. The Company's innovation efforts were recognized at the Aerosol & Dispensing Forum in Paris in January 2023. At this forum, ArcelorMittal
received the Sustainable Development certificate for its steel solutions in packaging, an award that recognizes environmentally friendly alternatives to plastics.
Construction equipment, agricultural machinery, and heavy transportation is another important segment for which a full range of Ultra-High-Strength steels has been developed. These Amstrong® steels allow customers to lightweight their equipment, increase payload and reduce fuel consumption and CO2 emissions. Dimensional range for the Amstrong 700MCT family has been extended towards thinner and thicker gauges, making these products unique on the market. In addition, the Company's Amstrong 960MCL High Elongation is being developed with customers, targeting light weight machinery, with higher grades targeted for the future.
ArcelorMittal is committed to sustainable development, continuously striving to reduce greenhouse gases in the construction industry. An important component of this work is to improve products as to enable designers to reduce the tonnage of material required for buildings, while simultaneously ensuring high reuse and recycling at the end-of-life.
In addition to ArcelorMittal's roadmap to decarbonize steel making, other initiatives are in progress to lower CO2 emissions of products for construction by acting on downstream processes. As an example, a new generation of color-coated steels has been developed at industrial scale based on solvent-free technology using Electron Beam curing; this is the first industrial production line in the world.
The tied-arch bridge, as an example, is a design used extensively in the past, but which has undergone considerable transformation as not to be only functioning as a bridge, but also as an aesthetic landmark. Tied-arch bridges are also more cost efficient than other solutions (e.g. cable stayed bridges), when considering the span range. The use of structural heavy shapes as arches for a span range of between 50 and 120 meters has been a recent innovation for tied-arch bridges. The use of high-strength steel for the arches permits significant weight savings, and therefore lower environmental impact.
In 2023, R&D launched 14 new products and solutions to accelerate sustainable lifestyles, while also progressing further on 15 such product development programs.
In addition, in 2023, R&D launched 24 products and solutions to support sustainable construction, infrastructure and energy generation, while also progressing further on 16 such product development programs.
Fully capitalizing on the capacity of Steligence® - a holistic platform for environmentally-friendly, cost-effective construction - to create higher-added-value products and
40
| Management report | ||
solutions for the construction market is being deployed in a variety of markets.
Construction is one of the key sectors for ArcelorMittal. The Company’s R&D effort is focused on providing higher-added value products that meet customer needs, including their sustainable development objectives.
Steligence® highlights the innovations the Company’s steel has to offer in the design and performance of a building, and to support its customers in their use of its products. Steligence® adds value through its holistic approach of helping specialists in the architectural and engineering disciplines to meet the increasing demand for sustainability, flexibility, creativity and cost in high-performance building design by harnessing the credentials of steel through its potential for recyclability and the reduction of materials used.
A key concept within Steligence® is to make buildings easier to assemble and dismantle. As a result, buildings become quicker to construct, leading to significant efficiencies and cost savings while also creating the potential for re-use. This reflects ArcelorMittal’s wider interest in modularization and the potential re-use of steel components - a field it is discussing with customers and in its LCA assessments.
Due to XCarb® RRP, the Company is able to offer steel produced with a CO2 footprint as low as 0.33 tonne of CO2 per tonne for sections and 0.37 tonne of CO2 per tonne for merchant bars, i.e. EcoSheetPile™ Plus brand. With these two EPDs, the Company is capable of supporting the construction industry to meet tougher requirements to reduce the carbon footprint of buildings and infrastructure.
Developing breakthrough process innovations to deliver cost reduction, sustainability benefits to meet current and emerging environmental challenges, and new product development.
The creation of unique processes creates value for the Company and its stakeholders by increasingly enabling environmental improvements, including carbon reductions and improvements in air, land and water; promoting process-driven product development and enhancing the performance of operations through cost efficiency and improved product quality.
Process improvements contribute decisively to the future of the Company, both helping to preserve its license to operate and ensuring its financial sustainability through important management gains.
By-products and circular economy. Work in this area includes the re-use of slag as a valuable product for many applications, which reduces waste while avoiding the ecosystem disruption that can result from the extraction of other materials such as natural stone or sand. For example, the Company is making innovative re-use of slag in the following applications: cement,
civil construction (e.g. roads and asphalt), a fertilizer source for agriculture and new innovative applications like ballast in offshore wind turbine foundations to replace natural ballast; a construction material for building protection walls to reduce noise and dust; and the potential re-use of slag from furnaces in water filtration and greenhouse gas capture. The Company also recycles most dust and sludges internally. With the help of an EU-funded project that started in 2020, R&D is working on agglomeration solutions that are expected to enable further use of these materials as alternatives to currently used raw materials. In 2023, tests at laboratory scale were successfully validated to meet industrial requirements for valorization in the blast furnace. In 2024, industrial trials will be conducted to validate their industrial feasibility.
ArcelorMittal is developing the new valorization routes of the steel by-products (dust, sludges, scale, slags) in the new decarbonization steel making routes, with goals of 100% efficient use of raw materials, zero waste and increased availability of the critical minerals needed for the green transformation. In 2023, R&D simulated several footprint scenarios characterizing future steel by-products quality. Based on this information, in 2024, the Company will continue to investigate applications of these by-products and treatments to improve their quality.
Other circular economy initiatives include working on the use of mining tailings as a secondary raw material, either by finding marketable solutions or generating valuable products to be used in-house and in construction. Development of other applications for utilizing high grade silica tailings in the chemical industry are ongoing.
Other developments include improving the quality of the scrap the Company uses, as well as exploring automated sorting processes for treating scrap.
Improvement in air, land, water. Work in this area includes research in technology for cleaning fumes from stacks, reducing dust diffusive emissions, cleaning water discharges, and solving water scarcity issues. ArcelorMittal is working to transform its existing facilities and steel making production to create more efficient technologies to reduce air pollution, make more efficient use of the water and develop new steel making routes to be carbon neutral and near zero emissions. In 2023, R&D completed the algorithm calculation tool of PM diffuse dust emissions based on internationally recognized calculation methodologies and emission factors derived from measurement within the Group. Algorithm tools were deployed at all ArcelorMittal plants. In 2024, plants will start using these tools and R&D will continue to enhance calculations and develop new techniques to identify, track and mitigate dust emissions (including diffuse sources and chimney sources).
41
| Management report | ||
Progress against air pollution. In 2022, for the first time, ArcelorMittal implemented an extensive sensor monitoring network at Tubarão. In 2023, the Company used advanced artificial intelligence ("AI") tools to analyze all the data captured by the sensors to have a better understanding of emission sources and factors that can have an impact both on generation and mitigation of meteorological conditions.
Advanced sensors are used and algorithms tested to calculate the accuracy of measurements in monitoring areas adapting them to industrial conditions. Particular advances are being made in detection through laser and AI-powered video surveillance with the ultimate goal of defining what emissions are being released, in what volumes, from where and with what trajectory and diffusion, so that they can be stopped, removed or mitigated. In 2023, the technology was tested in four of the Company's plants as a step to deploying tailored solutions across ArcelorMittal's operations. ArcelorMittal intends to continue progressing in the industrialization of advanced filtration technologies to reduce stack emissions and gases such as NOx, SOx, etc.
ArcelorMittal’s large and global footprint will require several decarbonization technologies in the short, medium and long term. R&D's role is to help generate sustainable differential intellectual property solutions in these domains, to accelerate decarbonization while preserving the Company’s product quality and cost competitiveness. In 2023, R&D continued developing the H2 DRI-EAF based steel production route. Progress was made both in the DRI modelling (energy and mass balance when using hydrogen for reduction) and the behavior of hydrogen DRI pellets in the EAF. Tools for better control and management of scrap were also developed. In 2023, the SIDERWIN funded project was concluded and the Company launched the next phase for future industrialization, VOLTERON™. In this regard, ArcelorMittal signed an agreement with John Cockerill in June 2023 to develop an industrial scale low temperature, iron electrolysis plant (see "Introduction—Sustainable development highlights - striving to be a leader in the decarbonization of the steel industry"). Another important activity in 2023 has been the analysis of the Company's technology roadmap for decarbonization of the blast furnace. In 2023, R&D reinforced activities in the Carbon Capture and CO2 transformation domains. Several proofs of concepts are being done at the Company's R&D labs such as SEKISUI and CASOH publicly funded projects.
R&D continues supporting ArcelorMittal’s three decarbonization paths for primary activities:
In 2023, ArcelorMittal has continued working on the decarbonization of finishing operations and has launched several research initiatives to prepare for future industrial investments focusing on reheating and annealing furnaces which are the main sources of CO2 emissions in finishing.
Technologies specifically related to hydrogen burners, induction heating and electrical resistance heating are being tested, including in laboratory pilots and testing installations to determine the impact on steel products.
In 2023, solutions were industrialized to reduce natural gas consumption through models to reduce energy needs and the replacement of natural gas with steelmaking gases. In 2024, R&D will continue with the development of solutions to reduce natural gas consumption, replacing it with steelmaking gases and testing burners capable of replacing 70-90% of natural gas with blast furnace gas, reducing the NOx emissions by 50%.
Process research and development for Products differentiation:
•Electrical steels: R&D contributed to the strong progress in reliability and quality at the Company's Saint-Chély (France) electrical steel plant while supporting the new investment in Mardyck (France).
•Optigal® and Magnelis® metallic coatings were rolled out at Avilés and Montataire sites and will be rolled out next at Swietocholowice. Process adaptations have been made to support the ramp-up of chrome-free passivation.
•Progress was made in developing a new generation of HSS products. Support full industrialization of Cr-free passivation in some of our tinplate assets.
Process research and developments for products quality: In 2023, the Global Product Quality System ("GPQS") solution was running on 45 lines and has received several improvements. The deployment of five additional lines began in 2023.
Mining Process Improvement: In order to assist with the decarbonization of the Group, the Mining segment and Global R&D are investing significantly in the decarbonization of pellets production. By reducing the temperature of pellets curing, and therefore modifying the pelletizing process, CO2 emissions from the mining business will be drastically reduced. These strategic developments are structured in programs such as cold bounded products, in other words pellets, briquettes and extruded products, which are further complemented by the development of new energy sources for the pelletizing process such as hydrogen and biomass.
In addition, during 2023 as in the previous year, Global R&D participated in the expansion of a risk assessment for all ArcelorMittal tailings facilities worldwide. ArcelorMittal's dedication to safety and environment is further reinforced with the creation of programs for supporting ArcelorMittal Mining in mine closure strategy. R&D is also developing its own surveillance platform to monitor in real time conditions and the impact on planned activities regarding safety and audits at the Company's tailings dams.
42
| Management report | ||
With respect to the expansion of the Company's mining operations in Liberia, Global R&D has also been critical in providing modifications that allowed higher recovery rates, reduction of tailings volume and keeping the high-grade concentrate. In 2022, Global R&D started developing the dry stacking tailings program for the project which continues, in compliance with the Company's tailings management standard.
Fully capitalizing on opportunities from the digital economy.
ArcelorMittal envisages itself as a fully digital enterprise where everything is connected. ArcelorMittal invested early and significantly in automation systems, and for decades the Company has been a pioneer in the introduction and use of artificial neural networks. ArcelorMittal is currently fully committed to a total digital transformation and is progressively becoming a data-driven company, including significant advances in a number of fields and relies on the secure and reliable performance of its digital technology platforms, information technology systems, continuously updating its security measures to avoid data breaches or data theft (see also "Introduction—Risk factors and control—ArcelorMittal’s reputation and business could be materially harmed as a result of data breaches, data theft, unauthorized access or successful hacking.").
In 2023, in addition to internal awards, Global R&D received several external recognitions in the AI domain:
•National Computer Engineering Award by the Spanish Association of Computer Engineers.
•On top of several R&D engineers teaching in different universities, two of the Company's R&D Leaders were invited to provide guest lecturers at Columbia Business School on Digital Disruption and Digital Transformation changing the perception of the steel industry and how much technology and AI is involved.
•ArcelorMittal's Global R&D Chief Digital Officer has been awarded as Engineer of the Year in Asturias – Spain.
•Global R&D has been selected as one of the 20 companies in the world to assess GPT Science Engine with one of the software giants as a result of previous collaborations.
The Company is focusing its efforts on:
•Data-driven culture, establishing a product-thinking approach to data;
•Continuous evolution of the Global platforms (Cloud, Edge, Collaborative Digital Product Development);
•Manufacturing digitalization (Production, Quality and Maintenance); and
•Business digitalization (Procurement, Commercial, Supply Chain, Strategy, Finance).
The Global platforms are a key element both from a technical and organizational standpoint, providing a standard approach to data infrastructure as a platform, where cloud capacity, open-source technologies and commercial solutions have been engineered to build a standard distributed data ecosystem. In a company of ArcelorMittal's size, having a common and standard governance is of paramount importance when dealing with distributed and decentralized data.
In its digital strategy, the Company makes use of solutions that are directly acquired in the market (digital commodities), solutions that are co-developed with technology suppliers, and solutions that are fully developed internally to take advantage of the rich knowledge interfaces the Company has (process, product, AI, math optimization). This combination leads to algorithms with performance superiority to what is available in the market for the Company's core business and is thoroughly benchmarked.
The main driver for digitalization at ArcelorMittal is a competitive advantage, with new technologies and especially developing cutting-edge AI and mathematical optimization algorithms.
In 2023, the Company has continued with significant advances aligned with its digital plan and strategy, including the following highlights:
•Complete design and development of ArcelorMittal Primary Portal, single entry point to access many of the Company's primary facilities for process supervision and action recommendation. In addition to blast furnaces, ArcelorMittal successfully connected the first DRI facilities.
•New advanced models for scrap management aligned with the Company's decarbonization efforts:
◦Multi-plant data-driven machine learning models to mitigate the impact of scrap residuals on the quality of several high added value products.
◦Scrap density monitoring models for systematic inspection and control of scrap deliveries, e.g. quality, quantity, density have been implemented in North European operations.
◦Automatic scrap classification at reception. The first version has been online since July 2023 at the Dunkirk plant.
•An increased number of decision-based tasks for ArcelorMittal's workforce are made by AI algorithms
43
| Management report | ||
improving results and efficiency. As an example, the GPQS, in-house development widely implemented at the Company has been extended to electrical steels and implemented in Saint-Chély, ready for future implementations for these kind of products and markets. The underlying technology transitioned to full machine learning in a pilot plant and will be further updated in all the Company's units to achieve enhanced performance.
•Global R&D has invested time and effort in mastering new mathematical techniques combined with AI to better deal with uncertainty management. The Company has enlarged the application of these techniques beyond the first successful case on strategic raw material inventory, the second to better predict electricity consumption peaks in a geographical area reducing operating costs while controlling risk, now being implemented for optimal scrap loading into the Company's EAFs dealing with uncertainty of residuals in the scraps
•ArcelorMittal's web sales platforms now offer additional material available for immediate purchase and short lead-time. This has been very well received by customers in Europe who already interact with the new system without any human intervention, while the Company is deploying the system to additional regions. Together with ArcelorMittal’s commercial workforce, the R&D division has developed additional specific algorithms and recommendation systems that are implemented in new IT commercial platforms adding value to ArcelorMittal's customers, who are also increasing the digital nature of their activities and ways of doing business.
•The Company, through the transformation of its Global R&D division, started to adopt the new Collaborative Digital Product Development platform for the design of new steel products much faster. Several of the AI and mathematical techniques are being used as well to speed up the development of new powders to serve the Company's new Business Unit delivering metal powders for the Additive Manufacturing Industry – ArcelorMittal Powders.
While the implementation of large-scale digital and industry 4.0 projects is challenging in a company of ArcelorMittal’s size, once implemented these projects bring major benefits and value because of the Company’s scale and global footprint.
ArcelorMittal’s approach is to work with a broad range of entities, thus maximizing the knowledge transference into its capabilities. This has led to the development of new algorithms using internal expert knowledge, cloud and edge capabilities
providing an agile and scalable way of solving problems in ways that were not possible before.
Seizing the potential of additive manufacturing. ArcelorMittal expects significant potential in additive manufacturing ("AdM") and 3D printing. In the first quarter of 2024, following the strategy to become a key player in AdM, ArcelorMittal will commission an atomizer with a large batch-size production capacity, to be able to supply significant volumes of steel powders (1000T/year) at the required quality levels. This is done by leveraging internal know-how developed by R&D and was launched to industrialize and commercialize these developments through ArcelorMittal Powders.
R&D, taking advantage of its extensive knowledge of metallurgy of steels, has been working to create a portfolio of unique powders. R&D can support its customers in the right use of the Company's powders at every step of the value chain of additive manufacturing: selecting and customizing material, design of parts and printing optimization.
In parallel to powders, R&D is progressing in the wires AdM domain, highlighting the successful printing of high-quality large parts by DED (Direct Energy Deposition) technology. Remarkable progress in printing productivity and surface quality has been achieved in 2023. ArcelorMittal wants to be a leader in both powders and wires supply for AdM.
Sustainable development
Sustainability governance
The Company’s governance structure relating to sustainability is based around the following supervisory bodies:
The 3 Board of Directors Committees:
•Audit and Risk Committee
•Appointments, Remuneration and Corporate Governance Committee ("ARCG Committee") and
•Sustainability Committee.
Management Committees and Panels: Management Committee, Corporate Finance and Tax Committee ("CFTC"), Investment Allocation Committee ("IAC"), Global Health and Safety Committee, Climate Change Panel, Sustainable Development Panel, and Group Diversity and Inclusion Panel.
The Board of Directors Committees
For a comprehensive description of the structure and responsibilities of the Audit and Risk Committee, ARCG Committee and Sustainability Committee, please refer to "Management and employees—Corporate governance—Board of Directors committees".
44
| Management report | ||
Management Committees and Panels
Management Committee
The Management Committee comprises senior managers with responsibility for various business divisions and functions in ArcelorMittal. For more information see the ArcelorMittal's Internet site at www.arcelormittal.com.
Corporate Finance and Tax Committee ("CFTC")
The CFTC defines the principles for the ArcelorMittal finance community and presents and supports financial and business solutions for the ArcelorMittal Group by providing the expertise, excellence in execution and stability for continuous, sustainable and competitive development of the Group while developing and promoting its people. The responsibilities of the CFTC extend across all finance and tax activities in the Group and are not limited only to activities at corporate level. The CFTC is chaired by the CFO and Executive Vice President, Mr. Genuino Christino, and has main responsibilities covering treasury, funding, taxation, accounting and performance management, SOX and insurance.
Investment Allocations Committee ("IAC")
It is chaired by Mr. Aditya Mittal, CEO of ArcelorMittal. The IAC authorizes large capital expenditure projects, including those designed to deliver safety, carbon and environmental improvements, and reviews the carbon emissions impact of all proposals. Committee members include the CFO, Mr. Genuino Christino; Executive Vice President and head of corporate business optimization, Mr. Brad Davey (vice-chairman of IAC), Chief Technology Officer ("CTO"), Mr. Pinakin Chaubal; and Vice President Head of Corporate Strategy, Mr. David Clarke.
Global Health and Safety Committee ("GHSC")
The GHSC is responsible for overseeing the Group's health and safety governance. It is an executive level committee chaired by Mr. Robin Paulmier, General Manager Head of Health and Safety and member of the Group Management Committee. The GHSC is responsible for the development of a Group-wide safety plan, implementing the recently updated safety policy, identifying safety gaps across the Group, sharing best practice; preparing detailed action plans to ensure quality and consistency in the application of safety measures, including pairing high-performing sites with those that need more help. It also ensures the achievement of minimum requirements for in-house safety training and carrying out close follow-up on leading Key Performance Indicators ("KPIs") to ensure ongoing improvement.
Climate Change Panel ("CCP")
The CCP discusses and coordinates ArcelorMittal’s approach and response to climate change. The CCP is chaired by Mrs. Nicola Davidson, Vice President Communications and Sustainable Development, and a member of the Group Management Committee. It consists of senior managers from
relevant corporate functions and key operations across the Group. It guides engagement and advocacy with external stakeholders on climate change and decarbonization and supports the business in understanding the risks and opportunities associated with the transition to a low carbon economy. The CCP meets on a nominally quarterly basis. Key issues identified by the CCP are raised with the Executive Office and recommended topics are brought forward for discussion and action with the Group Management Committee.
Sustainable Development Panel ("SDP")
The purpose of the SDP is to discuss and coordinate the Company's approach to environmental and social issues. It consists of senior managers from relevant corporate functions and key operations across the Group It guides engagement on issues relating to double materiality, stakeholder engagement, compliance and performance on environmental (non-climate), human rights and social performance issues. The SDP meets on a nominally quarterly basis. The Panel is chaired by Mr. James Streater, General Manager Sustainable Development.
Sustainability outcomes
ArcelorMittal’s 10 Sustainability Development (SD) outcomes articulate the priorities the Company believes it needs to pursue if it is to bring optimal long-term value to all its stakeholders and drive its transformation into the steel company of the future. They are aligned with the 17 United Nations Sustainable Development Goals ("SDGs"), widely regarded as the benchmark in global sustainability policy and action.
| ArcelorMittal's 10 SD Outcomes | |||||
| 1 | Safe, healthy, quality working lives for ArcelorMittal’s people | ||||
| 2 | Products that accelerate more sustainable lifestyles | ||||
| 3 | Products that create sustainable infrastructure | ||||
| 4 | Efficient use of resources and high recycling rates | ||||
| 5 | Trusted user of air, land and water | ||||
| 6 | Responsible energy user that helps create a lower-carbon future | ||||
| 7 | Supply chains that ArcelorMittal’s customers trust | ||||
| 8 | Active and welcomed member of the community | ||||
| 9 | A pipeline of talented scientists and engineers for tomorrow | ||||
| 10 | ArcelorMittal’s contribution to society measured, shared and valued | ||||
Materiality
The starting point for the Company’s sustainability reporting and planning is to assess the issues that are most material in their impacts for external and internal stakeholders, against the issues seen by the Company as having the most actual or potential impact on its business and value. This allows the Company to identify priority issues to address and those that are increasing or decreasing in importance. It provides the basis for the Company's sustainability planning and programs and serves as a benchmark to assess progress.
45
| Management report | ||
The Company undertook its materiality assessment process in 2021, using a ‘double materiality’ approach. The issues are grouped under the three core pillars of People, Planet and Products & Supply Chain. Within these pillars are eight themes:
People
•Safety: the physical safety of ArcelorMittal employees
•Work and life: the health and fulfillment of the Company's employees
•Gender: the equal representation, development and remuneration of women
•Community: the approval of the Company's communities and its perception as a welcome member of the community
Planet
•Climate: the extent to which the Company strives to play a leading role in the steel sector’s competitive decarbonization, and the drive to a more stable climate/reduction in global warming/Paris Agreement
•Nature: acting as a steward of air, land, water, biodiversity and ecosystems
Products and supply chain
•Products: the value of ArcelorMittal products to a low carbon, circular economy
•Customer reassurance: supply chains that are responsible and that meet customer expectations
A new double materiality assessment following CSRD guidance will be undertaken in the first quarter of 2024.
Reporting
The Company is committed to reporting on its governance, strategy, risks and performance relating to each of its material issues in its key publications including the Integrated Annual Review ("IAR"), the annual report on Form 20-F, its Climate Action Reports and Annual Reports.
Climate Action Reports in particular serve as ArcelorMittal’s response to the recommendations of the Task Force on Climate-Related Financial Disclosures ("TCFD") as well as the Climate Action 100 Net Zero benchmark, for which the Company is working towards full disclosure. In 2023, the Company has continued to assess the resilience of the business against different transition and physical climate scenarios, so that it can consider the potential financial implications in more detail, inform its strategy and manage its transition and physical climate risk exposure.
In 2023, alongside making disclosures to the Carbon Disclosure Project ("CDP") on climate change and water, and conducting
numerous investor and customer surveys, the Company published several country sustainability reports.
The Company periodically publishes the results of its engagements through its climate advocacy reports on ArcelorMittal’s website.
The Company also released its Report on Payments to Governments in Respect of Extractive Activities for the year ended December 31, 2022.
The Company publishes a special disclosure report in compliance with the US Dodd Frank Act Section 1502 and has been working to meet the requirements of the EU's conflict minerals regulation.
Health and Safety
61 colleagues lost their lives in accidents at the Company’s operations in 2023. 46 of these fatalities happened in October 2023, when a devastating explosion occurred at ArcelorMittal’s Kostenko mine in Kazakhstan. The Company, its employees and local communities in Kazakhstan have been devastated by this loss, and made every effort to support the affected employees and families. Subsequent to this tragic incident, ArcelorMittal completed the sale of ArcelorMittal Temirtau to the Qazaqstan Investment Corporation (‘QIC’) but the tragedy emphasized the urgency of intensifying all efforts to become a fundamentally safer company. As such ArcelorMittal has commissioned a comprehensive independent audit of its safety policies and practices worldwide which was launched in December 2023.
It is expected that the audit will be completed by September 2024 and the key recommendations will be published externally as the Company recognizes the significant interest its stakeholders have in ensuring that ArcelorMittal improves safety performance across the Group. The Company is completely committed and focused on accelerating and intensifying all aspects of its safety improvement program and while the Company expects the audit to make several recommendations in this regard it is already taking steps to close any gaps.
Safety strategy – focus on safety culture and risk management
In 2022, in seeking to improve its safety performance, the Company developed and implemented a new safety strategy based on the twin pillars of changing the safety culture within the Group and changing its approach to risk management. The strategy involves moving from what has, in its most challenged locations, been a ‘find-and-fix’ culture to a ‘predict-and-prevent’ culture, where the working practices and assessment of risk identify and mitigate potentially harmful events before they happen. It has been recognized that proactively identifying and removing potential hazard events can enable far safer outcomes and performance; and the Company has therefore been transitioning to use the identification of Potential Serious Injury
46
| Management report | ||
and Fatality events ("PSIFs") as its key safety KPI in the place of the more reactive KPI of Lost Time Injury Frequency Rate ("LTIFR").
ArcelorMittal’s health and safety policy, standards and lifesaving golden rules were refreshed and implemented across the Group in 2022 and 2023. Key elements of the policy are as follows:
•Placing more focus on the role management must play while at the same time reinforcing how all employees need to be actively involved in health and safety management.
•Making clear that working safely is a condition of employment for everybody at ArcelorMittal.
•Explicitly stating that everyone is empowered to take action and stop work if they see a situation which they deem to be unsafe.
•Stressing the need to report and analyze all incidents, so that employees and management learn from them across the Company.
•Highlighting the role effective systems management and sharing of best practices has in driving continuous improvements.
In April 2023, the Company launched a Group-wide safety perception survey, led by independent consultants DSS+, a leading provider of sustainable operations management consulting services, covering 220,000 personnel and contractors across the Group, and assessing all operations against the safety culture maturity model (known as the Bradley Curve) – leading to bespoke action plans and strategies for the different parts of the business.
Alongside the publication of its third quarter financial results on November 9, 2023, the Company said it would commission a comprehensive independent third-party safety audit of its operations to identify gaps and strengthen its safety actions, processes and culture to help prevent serious accidents. On December 22, 2023, ArcelorMittal announced that it engaged DSS+ to conduct a group-wide audit of its safety practices. Few firms have the capabilities to carry out work of this complexity and scale, and the appointment was made following a competitive tender process, on the basis of DSS+’s deep domain expertise and its ability to operate across the full breadth of ArcelorMittal’s international footprint, which comprises over 350 sites. Work has started immediately and will comprise, inter alia:
•Comprehensive Fatality Prevention Standards audits for the three main occupational risks leading to serious injuries and fatalities.
•Expert input into the Company’s planned CTO-led process risk management safety audits of its highest priority countries and assets.
•In depth assessments of all health and safety systems, processes, structures and capabilities; governance and assurance processes; and systems and data management.
The audit is expected to take up to nine months with the main recommendations to be published in September 2024.
Leaders have been required to demonstrate more progress in safety culture maturity, with greater mandatory leadership shop floor presence.
The Company has intensified training/coaching programs, including with external support, to improve the quality of leadership’s safety routines (i.e. shop floor interactions) as well as increased cross training to benchmark and align best practices.
There has been an intense emphasis on Fatality Prevention Standards ("FPS") with a particular focus on the highest-risk circumstances that have been responsible previously for the most fatalities. FPS will now be externally audited.
The Company has also enforced a quarantining across the Group, whereby the occurrence of PSIFs injuries trigger a quarantining process, requiring management’s shop floor presence to be doubled, a detailed assessment and response to the event, and an increase in the number of management shop floor interactions.
Risk control and mitigation strategies
Risks and risk events vary across the Group according to the nature of local operations, assets and working culture. The Company is working closely with DSS+ to better understand the interaction of risks arising from behavior, working with machinery and from asset integrity, in terms of their respective contributions to serious injuries and fatalities, so that it can develop better controls and mitigation actions.
Currently, aside from the gas explosion incidents in Kazakhstan, the top three more typical causes of fatalities within the Group, representing 54% of fatal events (2017-2023) include:
•Crushed or rolled by vehicle
•Crushed by moving machinery or other mobile equipment
•Falling from height
47
| Management report | ||
Top causes of fatality 2017-2023 | Measures to address these | |||||||
| 1 | Crushed or rolled by vehicle | Focus on proactive PSIF detection, strengthening the effectiveness of controls as part of the Company’s risk management, modification and update of the FPS relating to vehicles and driving, mandatory alarms for safety belts and parking brakes, mandatory proximity detectors for specified industrial vehicles, and improved procedures relating to wheel and tire maintenance. | ||||||
| 2 | Crushed by moving machinery or other mobile equipment | Focus on proactive PSIF detection, focus on isolation FPS, strengthening the effectiveness of controls as part of the risk management, review of the global Hazard Identification and Risk Assessment (HIRA) tool on an annual basis, with adaptation at site level for local conditions and mandatory ‘Stop, Think & Act’ measures and implementing control measures before any unusual/nonstandard task or job. | ||||||
| 3 | Fall from height | Focus on proactive PSIF detection, strengthening the effectiveness of the controls as part of risk management, modification and update of FPS relating to working at height, strengthening requirements for roofing activities, integrating learning points from related fatalities, and integrating fatality prevention requirements for dock. Reinforced rules on fixed ladders, banned rope ladders, and aligned rules related to floor installation and repairs at the same level as the ones concerning roof repairs | ||||||
The updated safety policy places a renewed emphasis on addressing these top three causes of fatalities. Specific mitigation measures are being put in place to minimize these events occurring. These include machine upgrades, asset integrity improvements and tailored training and coaching. Also, during 2023, sites have reassessed themselves against the FPSs related to the top risks. They will build or strengthen on-field training with certification on the top risks. FPS will now be externally audited.
Intensified coaching and training program
The Company has been rolling out intensive training and coaching programs in the regions with poorer safety
performance. Working with the external safety consultant, the Company conducted pilot studies at selected plants where their personnel are assisting and coaching management and teams for periods of six months, and then these sessions are repeated across all relevant personnel.
These programs, comprising highly focused on-the-job coaching, cover integrated risk and culture governance, management accountability, shop floor interactions, effective implementation of the FPs and other management routines fundamental to improve safety performance. These are supported through the developed leading KPIs.
Performance in 2023
57 of the 61 fatalities in 2023 were in the CIS region. The intensive efforts that have been made to improve safety performance across the Group have not delivered the progress for which the Company had hoped.
The Group’s steel operations (excluding CIS) were fatality-free amongst its own employees in 2023, and reported a fatality frequency rate (FFR) of 0.010 that is 50 per cent lower than the record level achieved by the World Steel Association in 2022. LTIFR was at 0.92 (0.70 excluding Kazakhstan) compared with 0.70 in 2022 (0.68 excluding Kazakhstan). NAFTA and Mining have reached lowest ever levels of LTIFR in 2023, 0.22 and 0.10 respectively.
In the context of the business’ new focus on PSIFs as a key leading indicator, the Company detected and treated proactively (before anyone being injured) 12,820 of these events in 2023, a 122% increase as compared to 2022, which demonstrates that more risk precursors are being identified and correspondingly measures are being put in place to minimize or mitigate their potential impacts.
| For the year ended December 31 | LTIFR 2022 | LTIFR 2023 | Fatalities 2022 | Fatalities 2023 | PSIFs 2022 | PSIFs 2023 | ||||||||||||||
| Mining | 0.84 | 0.10 | 2.00 | 0.00 | 12.06 | 13.17 | ||||||||||||||
| NAFTA | 0.25 | 0.22 | 0.00 | 1.00 | 13.86 | 15.76 | ||||||||||||||
Brazil | 0.10 | 0.26 | 1.00 | 0.00 | 18.19 | 22.02 | ||||||||||||||
| Europe | 1.11 | 1.30 | 2.00 | 2.00 | 14.02 | 15.28 | ||||||||||||||
| ACIS | 0.74 | 1.43 | 17.00 | 58.00 | 11.44 | 18.78 | ||||||||||||||
| TOTAL | 0.70 | 0.92 | 22.00 | 61.00 | 12.76 | 16.64 | ||||||||||||||
48
| Management report | ||
Strengthened governance and scrutiny
Given its critical importance, governance of safety is overseen at the most senior level by the CEO of ArcelorMittal, supported by the Sustainability Committee. The latter reviews safety performance on a quarterly basis, with additional safety focused meetings scheduled between regular meetings as required.
The Head of Corporate Health and Safety, who is also a member of the Group Management Committee, reports to the Executive Vice President, Head of Corporate Business Optimization, who in turns reports to the CEO of ArcelorMittal. Further oversight of safety is provided by GHSC which shares and promotes best practice and is chaired by the Head of Corporate Health and Safety.
ArcelorMittal business units CEOs, full leadership team and safety departments manage and implement the Group's best practice procedures and standards at the local level. Further, ArcelorMittal has fully supported and initiated to have units obtain external experts' help in closing any gaps in the Group's safety performance.
In line with the Group’s move to focus more on leading KPI indicators, the executive Short-Term Incentive Plan ("STIP") changed in June 2022 to be linked to the frequency of proactive PSIFs, and is not linked to the lagging KPI of LTIFR anymore. The proportion of bonuses linked under this scheme to safety was increased from 10% to 15% in 2021. Safety also represents 10% of the Long-Term Incentive Plan.
Climate change and decarbonization
Decarbonizing the global economy and adapting to the impacts of climate change are at the heart of ArcelorMittal’s sustainable development strategy. Aside from safety, climate is the Company’s most material sustainability issue, and the business strives to be an industry leader in terms of target setting, performance and disclosure.
The Company is adopting a multi-faceted approach to decarbonization, having developed a broad range of low-emissions steelmaking technologies and is integrating them into Innovative-DRI and Smart Carbon pathways, and direct electrolysis of iron.
The Company has made considerable progress in developing the two first more immediately viable routes, and is moving
towards their implementation. Support will be required in the transition period, enabling the balancing of required capital spend against the longer-term returns. Due to this reason, the Company is asking for public funding support for around half of its estimated $10 billion capital expenditure program to achieve its 2030 Group target, as well as support for operating costs in the short to medium term.
In 2023, the Company made progress towards its 2030 target of reducing carbon emissions intensity by 35% in Europe and 25% across the Company's steel and mining operations. Both targets cover Scope 1 and 2. Its biggest decarbonization projects, for DRI/EAF operations in Canada, Spain, France, Belgium and Germany, are progressing through FEED ("Front End Engineering and Design") stages. During the first half of 2023, the Company received European Commission approval for the funding of four of its projects in Spain, Hamburg, France and Belgium. The Company welcomes the support to date, and is engaging with the relevant country governments on energy costs, and to provide clarity on the pathway towards green hydrogen that will enable these projects to move to the next phase of development. More than 200 dedicated employees are currently working intensively on decarbonization projects, and the Company is investing considerably in both decarbonization infrastructure and low carbon technologies.
Developing technology that is capable of taking the industry to net-zero
The Company’s roadmap to achieving net-zero emissions by 2050 is based on the following sets of actions and initiatives that act as stepping-stones toward that goal:
•Transforming the business’ steelmaking assets
•Transforming the energy used in steelmaking and reducing and capturing carbon emissions
•Increasing the proportion of scrap used in the steelmaking process
•Investing in clean electricity
•Offsetting residual emissions
49
| Management report | ||
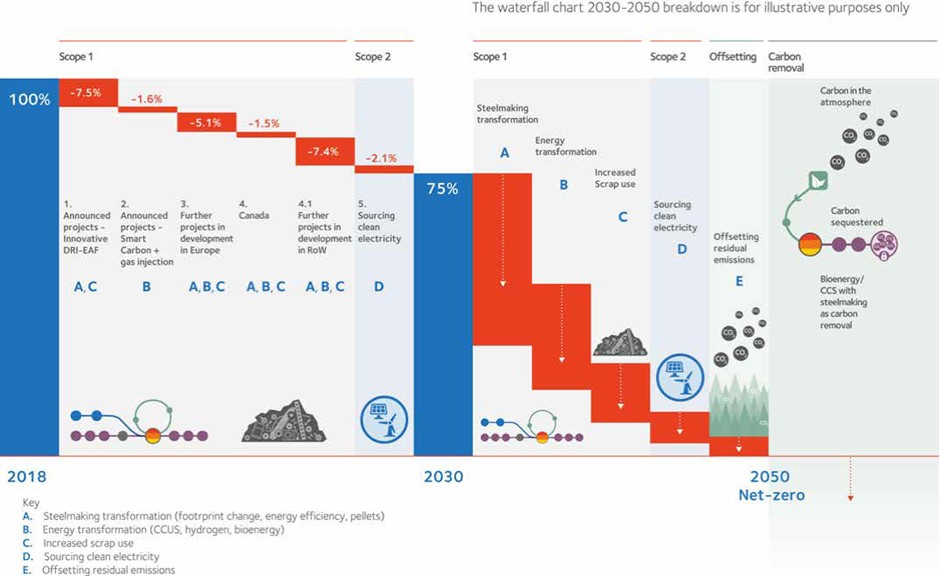
Transforming the business’ steelmaking assets
In order to achieve net-zero targets, the global steel industry is facing a significant transformation of its asset base and a revolution in the technology used to make steel. These changes include switching ironmaking from the traditional Blast Furnace-Basic Oxygen Furnace ("BF-BOF") route to the DRI route, and from iron ore preparation in the sinter plant (using heat or pressure to compact a material) to the pellet plant (which compresses or moulds the iron material into the shape of a pellet). Ironmaking with pellets in the DRI is usually coupled with an EAF where pellets are molten with scrap. These changes also include using best in class technology with the potential for carbon capture and utilization ("CCU") or carbon storage techniques ("CCS").
High gas prices have previously limited the adoption of DRI-EAF operations, but with the increasing cost of carbon and the requirement to reduce emissions, moving to natural-gas based DRI-EAF is being seen as a first step with a proven technology that will transition to using green hydrogen as this technology matures and availability of green hydrogen develops.
Part of this transition will require access to high quality ore-based metallics. ArcelorMittal is pursuing this objective through the development of DRI-ready pellet plants and DRI modules, including HBI, and is assessing options including building its
own facilities, acquiring facilities and developing partnerships and joint ventures with iron ore suppliers.
ArcelorMittal is taking a pragmatic and considered approach to transitioning away from its existing BF-BOF assets. Clearly, older assets which are near their end of life, with lower efficiency and higher emissions, are more conducive to replacement with new, lower carbon DRI-EAF facilities. However, the economic, environmental and social policy circumstances are important factors in taking these decisions for each significant site and set of assets. Where BF-BOF assets still have a significant useful life or the policy environment is not conducive, the Company is to ensure that any new blast furnaces are using best in class technology with the potential for CCU or CCS.
The Company is accelerating its DRI-EAF investments through the following projects:
Hamilton, Canada
On October 13, 2022, ArcelorMittal together with the governments of Canada and Ontario, broke ground on its investment decarbonization project at the ArcelorMittal Dofasco plant in Hamilton, Ontario, Canada. The governments of Canada and Ontario have committed CAD$400 million and CAD$500 million, respectively, to the overall project cost. The
50
| Management report | ||
project includes a 2.5 million tonnes per year capacity DRI furnace will initially operate on natural gas but will be constructed ‘hydrogen ready’ so it can transition to green hydrogen when a sufficient and cost-effective supply becomes available and one EAF. The new manufacturing processes will contribute to a considerable reduction of CO2 emissions and deliver other positive environmental impacts including the elimination of emissions and flaring from coke making and ironmaking operations.
ArcelorMittal Canada, Contrecoeur
ArcelorMittal’s existing DRI plant in Quebec produces 1.7 million tonnes of DRI each year. In 2022, the Company successfully tested the use of green hydrogen in the production of DRI. The objective of the test was to assess the ability to replace the use of natural gas with green hydrogen in the iron ore reduction process. The green hydrogen used in the test was produced by a third-party owned electrolyzer (device that produces green hydrogen from electricity and water) and was then transported to Contrecoeur. This is a major step forward since the iron ore reduction process alone contributes to more than 75% of ArcelorMittal Long Products Canada ("AMLPC") overall CO2 emissions. AMLPC is evaluating the possibility of carrying out further tests by increasing the use of green hydrogen at the DRI plant, which could eventually reduce CO2 emissions in Contrecoeur by several hundred thousand tonnes per year. The potential use of electrolyzers to produce green hydrogen in Contrecoeur will depend on certain criteria, particularly the availability of sufficient electricity to power the units.
ArcelorMittal Texas HBI, USA
In 2022, the Company secured high-quality metallic feedstock and purchased a majority shareholding in a world-class HBI plant in Texas. HBI is a high-quality feedstock made through the direct reduction of iron ore which is used to produce high-quality steel grades in an EAF, but which can also be used in blast furnaces, resulting in lower coke consumption.
Across Europe ArcelorMittal has a range of decarbonization projects it is pursuing. During 2023 and early 2024, the European Commission approval for funding was received for several of these projects, which is a positive development. The Company continues to progress the pre-engineering and design work across these projects as it seeks to secure the additional conditions required to take these investments to final investment decision. This includes the availability of low-carbon energy. These projects include
Gijón and Sestao, Spain
ArcelorMittal is planning to invest €1 billion in the Company's plant in Gijón including the construction of a 2.3 million-tonne hydrogen DRI plant. In February 2023, the Company received the European Commission's approval of €450 million in state aid for the DRI plant. This was followed in November 2023 with the
signing of a contract with industrial engineering company Sarralle to build a new EAF in Gijón for the Longs business. New DRI and EAF installations in Gijón will reduce carbon emissions at the Company’s Spanish operations by approximately 50%. Around 1 million tonnes per year of DRI would be supplied to Sestao to be used as feedstock for the plant’s two EAFs.
Hamburg H2 project, Germany
In Germany, ArcelorMittal already operates Europe’s only DRI-EAF plant in Hamburg. The Company is planning to test the ability of hydrogen DRI on an industrial scale, as well as testing carbon-free DRI in the EAF steelmaking process. The European Commission approved €55 million of funding support from the German Federal Government towards the plant’s construction, which is half of the estimated €110 million total capital expenditure required.
Bremen and Eisenhüttenstadt, Germany
ArcelorMittal is developing a project to build a large-scale industrial plant for the DRI based steelmaking at its site in Bremen, as well as EAFs in Bremen and in Eisenhüttenstadt, following the announcement of the planned expansion of Germany’s hydrogen infrastructure and alongside its existing H2 Hamburg project. In February 2024, the Company received the European Commission's approval of €1.3 billion in state aid.
Dunkirk, France
ArcelorMittal intends to build a 2.5 million tonnes per year DRI unit and two EAFs in Dunkirk. On July 20, 2023, approval of €850 million in state aid for this project was received from the European Commission.
A letter of intent was signed in January, 2024 with French state-owned energy supplier EDF Energy for the long-term supply of low-carbon electricity to ArcelorMittal French steelmaking sites in Dunkirk and Fos-sur-Mer. See "Introduction—Sustainable development highlights - striving to be a leader in the decarbonization of the steel industry".
ArcelorMittal and quarried materials group SigmaRoc have entered into a strategic joint venture agreement to create a new company that will produce lime, an essential purifying additive used in steel production as well as numerous other industrial applications. This joint venture will produce 900,000 tonnes a year of a high-quality material reusing heat recovered from ArcelorMittal plant in Dunkirk and using biofuels to replace the use of natural gas in the production process. This should allow a significant reduction of CO2 emissions, allowing the Company to offer net-zero lime. The operations will be located close to Dunkirk’s harbor and the ArcelorMittal steelworks, who will be the main consumer of the lime produced. Its strategic location will allow the joint venture to be a part of Dunkirk’s CO2 hub.
51
| Management report | ||
Ghent, Belgium
ArcelorMittal Belgium is developing plans for a 2.5 million tonnes per year DRI plant and 2 EAF facilities at its Ghent site. The DRI plant and EAF facilities would operate alongside Ghent’s state-of-the-art blast furnace that is ready to take waste wood and plastic as a substitute for fossil carbon. On June 22, 2023, approval of €280 million in state aid for this project was received from the European Commission see also "Sustainable development highlights - striving to be a leader in the decarbonization of the steel industry".
ArcelorMittal has also started a feasibility study for the Ghent Carbon Hub project in partnership with North Sea Port and energy infrastructure group Fluxys. The Ghent Carbon Hub will be an open- access hub to transport and liquefy CO2 from emitters, provide buffer storage and load the CO2 onto ships for onward permanent storage. The project should have the capacity to process 6 million tonnes of CO2 a year – equivalent to around 15% of Belgium’s industrial CO2 emissions. North Sea Port, a 60 kilometer long cross border port in Belgium and the Netherlands, is home to a cluster of energy intensive industries with a significant CO2 footprint. In late 2022, the project was awarded a €9.6 million grant from the EU Commission’s Connecting Europe Facility for Energy (CEF-E) funding program.
Transforming the energy used steelmaking and reducing and capturing carbon emissions
Considerable progress has been made in efficiency of energy use in BF-BOF steelmaking in recent years. Innovations are continuing aimed particularly at reducing carbon emissions, such as the use of coke oven gas in the tuyeres of the blast furnace and drawing on the rich hydrogen content of the gas. However, despite these advances, BF-BOF operations still rely heavily on fossil fuels, and as outlined above there are rapidly growing pressures to shift steel production to cleaner forms of energy. The three main alternative routes for making this shift are: clean electricity (which could be in the form of green hydrogen); continued use of fossil carbon coupled with CCU and CCS to remove carbon emissions; and use of circular carbon either through natural or synthetic carbon cycles. Such use of renewable energy technology is broadly referred to as Smart Carbon.
Natural carbon cycles include use of sustainable forestry and agriculture residues, to produce bioenergy. Emissions from use of this bioenergy will be captured by the regrowth of biomass in forestry and agriculture creating a closed circle, ideally with limited or no carbon ‘leakage’. Synthetic carbon cycles rely on the use of waste plastics as an energy source, transforming the carbon in waste gases through CCU into equivalent new plastics, and similarly aiming to ensure that there are limited or no emissions. It is hoped that new technology and innovations
will gradually close off any remaining net emissions from these cycles.
The Company is constructing several commercial-scale projects to test and prove a range of Smart Carbon technologies:
Torero
ArcelorMittal has built an industrial-scale demonstration plant that converts waste wood into renewable energy through a process called torrefaction. This source of waste wood is considered hazardous material if burnt in an incinerator as it emits harmful gasses. However, in a blast furnace no such pollutants can be formed. At the Ghent plant, two reactors will each produce 40,000 tonnes of bio-coal annually that can be used in the blast furnace as a substitute for coal. Construction of the €55 million project started in 2018; the first reactor started production in 2023. The project is expected to reduce annual carbon emissions from the Ghent plant in Belgium by approximately 112,500 tonnes per year by reducing the use of coal in the blast furnace. The Torero industrial-scale demonstration plant will convert 88,000 tonnes of waste wood into 37,500 tonnes of bio-coal annually. The Torero project is supported by European funding from the European Union’s Horizon 2020 research and Innovation Framework Program. Implementation of Carbalyst smart carbon technologies at Ghent, when combined with two Torero reactors, is expected to achieve 0.3 million tonnes of CO2 savings per year.
Steelanol CCU plant
In June 2023, the Company commenced ethanol production from its CCU project at its steel plant in Ghent, Belgium, see "Sustainable development highlights - striving to be a leader in the decarbonization of the steel industry".
3D
A pilot project in Dunkirk aims to capture CO2 off-gases at a rate of 0.5 metric tonnes of CO2 per hour for transport and storage. The process uses low temperature heat available across the plant to separate CO2 from other off-gases from the blast furnace to create a pure low-pressure CO2 gas stream suitable for internal reuse or piping for storage. This process could significantly lower CO2 capture costs versus alternative technologies. Regional infrastructure would be requested for all local industrial companies in order to optimize usage and efficiency of the solution. Parametric tests have been performed. Steady operation with high capture rates has been demonstrated. Project continues with detailed long-term test run associated with gas analysis along 2024.
This carbon capture technology has the potential to be adopted across the business’ blast furnace footprint, but scaling will be highly dependent on development of CO2 transport and storage infrastructure in the regions where the Company operates. It is
52
| Management report | ||
already actively engaged in carbon transport and storage at several locations in Europe and exploring the possibility in other regions. Deployment of the 3D technology will be linked to the development of CO2 pipeline infrastructure, as well as deployment of CO2 re-use technologies in the Company's blast furnaces.
MHIENG carbon capture collaboration
ArcelorMittal, Mitsubishi Heavy Industries Engineering (MHIENG), a pioneer in carbon capture technology, leading global resources company, BHP, along with Mitsubishi Development Pty Ltd are collaborating on a multi-year trial of MHIENG’s carbon capture technology with ArcelorMittal, following the signing of a funding agreement between the parties. The companies will also conduct a feasibility and design study to investigate the commercial application of MHIENG’s technology in separating and capturing CO2 top gas from the Ghent blast furnace.
Partnering with SEKISUI CHEMICAL
On June 19, 2023, ArcelorMittal and SEKISUI CHEMICAL announced that their carbon recycling project achieved target ahead of schedule See "Sustainable development highlights - striving to be a leader in the decarbonization of the steel industry".
Direct electrolysis
The Company is also making considerable progress in commercializing direct electrolysis technology. In June 2023, ArcelorMittal and John Cockerill announced plans to construct the world's first industrial scale low temperature iron electrolysis plant see "Sustainable development highlights - striving to be a leader in the decarbonization of the steel industry".
Carbon reduction through mining initiatives
Along with steelmaking initiatives, the Company’s mining operations are also developing different solutions to reduce GHG emissions.
AMMC in Canada continues to study and trial low-emissions iron ore pellet production. In 2021, it announced a CAD$205 million investment with support from the Quebec government, enabling AMMC to convert its entire 10 million tonnes per year pellet production to DRI pellets by the end of 2025. It is expected to become one of the world’s largest producers of DRI pellets, the raw material feedstock for iron-making in a DRI furnace. The project includes the implementation of a flotation system that is expected to enable a significant reduction of silica in the iron ore pellets, facilitating the production of very high-quality pellets. It is also expected to deliver a direct annual carbon emissions reduction of approximately 200,000 tonnes at AMMC’s Port-Cartier pellet plant, equivalent to over 20% of the pellet plant’s total annual carbon emissions. This reduction in
carbon emissions is expected to be achieved through a reduction in the energy required during the pelletizing process.
ArcelorMittal Liberia is exploring opportunities to reduce its GHG emissions by switching from largely diesel power to the new West African ‘green power grid’.
ArcelorMittal Mining will also act as an enabler for ArcelorMittal’s current steelmaking transition from blast furnace processes to cleaner DRI-based EAF processes by increasing the ratio of DRI pellet production capacity.
Increasing the proportion of scrap in the steelmaking process
In addition to using scrap in EAF operations, the business can increase the use of low-quality scrap in the BF-BOF steelmaking process by improving steel scrap sorting and classification, installing scrap pre-melting technology and adjusting the steelmaking process to accommodate scrap. It is expected that scrap availability globally will increase as the amount of steel in circulation increases, thereby demonstrating the inherent circularity of steel. The acquisition of John Lawrie in Scotland and Alba International Recycling in Germany in 2022 and Riwald Recycling in the Netherlands in 2023 are good examples of how the Company is working to increase its access to scrap steel to lower its carbon emissions from steelmaking.
Investing in clean electricity
Reducing the business’ Scope 2 emissions means mainly focusing on sourcing low-carbon electricity. This will be an increasing challenge as the Company launches projects to transition from BF-BOF technology to scrap and DRI-EAF technology. This will result in electricity becoming a greater part of the energy mix it uses to make steel. The Company plans to look for more and varied opportunities in the renewables sector to provide sufficient access to clean electricity at affordable prices, purchase renewable energy certificates and make more use of direct power purchase agreements ("PPA") with suppliers from renewables projects.
The $0.6 billion investment in the 975MW renewable energy project launched in 2022 between ArcelorMittal and Greenko Group combining solar and wind power and supported by Greenko's hydro pumped storage project, which helps to overcome the intermittent nature of wind and solar power generation, is an example of how the business can directly ensure increased availability of green electricity in India. The project is owned and funded by ArcelorMittal. AMNS India will enter into a 25 year off-take agreement with ArcelorMittal to purchase 250 MW of renewable electricity annually from the project, resulting in over 20% of the electricity requirement at AMNS India’s Hazira plant coming from renewable sources, reducing carbon emissions by approximately 1.5 million tonnes per year. Over 50% of solar modules and 35% of wind turbines
53
| Management report | ||
have been installed. The project commissioning is expected by the first half of 2024. The Company is studying various options to develop subsequent phases to further increase renewable electricity capacity in India.
Separately, in May 2023, ArcelorMittal Brasil formed a joint venture partnership with Casa dos Ventos, one of Brazil’s largest developers and producers of renewable energy projects, to develop a wind power project see "Sustainable development highlights - striving to be a leader in the decarbonization of the steel industry".
The acquisition of CSP in March 2023 in Brazil brings several strategic benefits to ArcelorMittal, including the potential to capitalize on the significant planned third-party investment to form a clean electricity and green hydrogen hub in Pecém. The Pecém Green Hydrogen Hub, a partnership between the Pecém Complex and Linde, is a large- scale green hydrogen project at the Port of Pecém which is targeting to produce up to 5GW of renewable energy and 900 thousand tonnes per year of green hydrogen in a series of phases. The first phase, which the partnership currently expects to be completed over the course of the next five years, targets the construction of 100-150MW of renewable energy capacity.
Offsetting residual emissions
While ArcelorMittal aims ultimately to achieve net-zero carbon emissions from its operations, residual emissions may remain for which either there will be no feasible technological solution, or the solution involves excessively high economic, environmental, or social costs. For these residual emissions, which the Company estimates will be 5-10% of existing emissions, it plans to buy high-quality and high-integrity offsets or develop projects to generate high-quality carbon credits that would not have happened without the Company’s intervention. Given the justifiable criticism that many early offset schemes have received, the business is working diligently on developing its own voluntary carbon offset strategy, to ensure that it has access to robust, credible and verifiable offsetting and to develop a portfolio approach considering nature and technology-based offsets.
Whilst full mitigation of carbon emissions is the Company’s overarching priority, some customers are interested in offering net-zero products currently while the technology still does not exist for the business to abate its emissions fully. In response to such requests, the Company is investigating options to offset any remaining net emissions related to that product manufacture after it has reduced its emissions to the extent it can with existing technology. The Company plans to document and publicly disclose any such offsets should it proceed.
Investing in low carbon solutions and innovative technologies
The Company is committed to developing its proprietary strategic low carbon brand, XCarb®. It brings together all of
ArcelorMittal’s reduced, low and near-zero carbon- emission products and steelmaking activities, as well as wider initiatives and green innovation projects, into a single effort focused on achieving demonstrable progress towards net-zero steel.
The three XCarb® branded initiatives launched to date include: XCarb® green steel certificates, XCarb® recycled and renewably produced products and the XCarb® innovation fund (see below).
XCarb® green steel certificates
The Company’s progress in driving down emissions enables it to pass the benefit of carbon emission reductions on to customers for the first time via an independently audited certification scheme.
The scheme provides for an independent auditor to verify the metric tonnes of carbon savings achieved, in accordance with the GHG Protocol Project Accounting standard. These savings can then be passed on to customers in the form of verified certificates. Customers can use such certificates to report an equivalent reduction in their Scope 3 emissions.
XCarb® recycled and renewably produced
XCarb® recycled and renewably produced ("RRP") products are made via the EAF route using scrap steel and 100% renewable energy. By using only scrap steel and renewable energy, XCarb® RRP products have an extremely low CO2 footprint that can be as low as approximately 300kg of CO2 per tonne of finished steel when the metallics are 100% scrap. The electricity used in the steelmaking process is independently verified so that it may obtain a ‘Guarantee of Origin’ that it is from renewable sources.
XCarb® innovation fund
ArcelorMittal is committing considerable investment in innovation in breakthrough decarbonization technologies, beyond its own R&D and strategic partnership activities. It is undertaking this investment through the XCarb® Innovation Fund and the XCarb® Accelerator programs.
Through the ArcelorMittal XCarb® Innovation Fund, the Company invests in companies developing technologies with the potential to support and accelerate the transition to net-zero carbon steelmaking. Since the launch of this Fund in March 2021, ArcelorMittal has committed to investments in seven companies covering a range of decarbonization technologies – renewable energy, long-term battery storage, carbon capture and re-use, hydrogen electrolysis, nuclear energy and direct electrolysis. This Fund is also an anchor partner in Bill Gates’ Breakthrough Energy’s Catalyst program, having committed to invest $100 million over a five-year period.
CHAR technologies
CHAR Technologies was selected as the winner of the inaugural XCarb® Accelerator Program, securing a $5 million investment
54
| Management report | ||
through ArcelorMittal’s Xcarb® Innovation Fund. Based in Ontario, Canada, CHAR is developing a high temperature pyrolysis ("HTP") technology that transforms organic waste streams into one of two valuable energy outputs: a high-calorific value and hydrogen-rich syngas that can be used as a replacement for natural gas or to make green hydrogen; and biocarbon, made from the remaining solids after the HTP process which can be used as a biochar fertilizer to improve soil health, a pollutant filter or as biocarbon to replace fossil coal in industrial processes.
ArcelorMittal’s Canadian flat steel operation, ArcelorMittal Dofasco, has been collaborating with CHAR to test the use of its biocarbon as a partial replacement for fossil coal in its steelmaking processes, with encouraging results. CHAR’s biocarbon enables an approximate 91% reduction in GHG compared to metallurgical coal and has been tested by ArcelorMittal Dofasco since 2021. ArcelorMittal Dofasco has therefore signed a memorandum of understanding with CHAR for the purchase of biocarbon from CHAR’s Thorold, Ontario facility that will enable larger scale trials in the coming years.
Heliogen – unlocking the power of sunlight to replace fossil fuels
ArcelorMittal invested an initial $20 million in renewable energy technology company Heliogen. Heliogen’s technology will harness solar energy by using a field of mirrors which will act as a multi-acre magnifying glass to concentrate and capture sunlight. The sunlight will then be subsequently converted into heat (HelioHeatTM), electricity (HelioPowerTM) or clean fuels (HelioFuelTM). All three Heliogen products have the potential to be applicable to the steelmaking process and support the steel industry’s transition to net-zero.
Form Energy – scaling low-cost and reliable battery technology
ArcelorMittal invested an initial $25 million, serving as the lead investor in Form Energy’s $200 million Series D financing round. In October 2022, ArcelorMittal invested a further $17.5 million. Form Energy, which was founded in 2017, is working to accelerate the development of its breakthrough low-cost energy storage technology to enable a reliable, secure, and fully-renewable electric grid year-round. It has recently unveiled a new iron-air battery which is low cost (approximately one-tenth the cost of lithium-ion battery technology), has multi-day reliability (100-hour duration hence overcomes the intermittent nature of renewable energy generation), is scalable; and can be sited anywhere.
Breakthrough Energy’s Catalyst program – driving adoption of next-generation clean technologies
ArcelorMittal is an anchor partner in Breakthrough Energy’s Catalyst program and has committed to an equity investment of $100 million over the next five years. Founded by Bill Gates, Breakthrough Energy is committed to scaling the technologies the world needs to reach net-zero emissions by 2050.
Breakthrough Energy’s efforts include investment vehicles, philanthropic programs, policy advocacy, and other initiatives, including Catalyst. Catalyst is a new model for how companies, governments, and private philanthropy can finance, produce, and ensure widespread adoption of next-generation clean technologies. The program will initially focus on four decarbonization technologies: direct air capture, green hydrogen, long-duration energy storage and sustainable aviation fuel.
LanzaTech-Carbon recycling
In 2021, the Company announced an expansion of its partnership with carbon recycling company, LanzaTech, with a $30 million investment. In June 2023, the Company commenced ethanol production from its flagship CCU project at its steel plant in Ghent, Belgium.
Disruptive hydrogen production technology – H2Pro
The Company invested $5 million in H2Pro as part of a $75 million Series B fundraise, with other investors including Temasek, Horizons Ventures, Breakthrough Energy Ventures and Yara. H2Pro is developing a disruptive way of producing hydrogen from water. Similar to electrolysis, its technology uses electricity to split water into hydrogen and oxygen. Unlike conventional electrolysis however, hydrogen and oxygen are generated separately in different steps – an electrochemical step and a thermally-activated chemical step. It is expected to prove more cost-effective than traditional electrolysis, with capital expenditure costs anticipated to be broadly halved, alongside lower operational costs.
TerraPower-Breakthrough nuclear power
ArcelorMittal invested $50 million in nuclear innovation company TerraPower, as part of an $830 million equity raise, which is the largest private raise among advanced nuclear companies. Its flagship technology Natrium™, featuring a cost-competitive sodium fast reactor combined with a molten salt energy storage system, will provide clean, flexible energy and integrate seamlessly into power grids with high penetrations of renewables. TerraPower is currently building its first Natrium™ reactor, as part of the U.S. Department of Energy’s Advanced Reactor Demonstration Program (ARDP). The facility will feature a 345 MWe sodium fast reactor alongside an energy storage system that can boost output to 500 MWe during peak demand.
Boston Metal- Investment in steel decarbonization disruptor
ArcelorMittal invested $36 million in Boston Metal in January 2023, see "Sustainable development highlights - striving to be a leader in the decarbonization of the steel industry".
XCarb® India Accelerator Program
In recognition of India’s ambition, capabilities, and unique challenges in supporting the global energy transition the Company has launched a new, dedicated XCarb® Accelerator
55
| Management report | ||
Program targeted at the country’s deep ecosystem of technology start-ups. For the XCarb® India Accelerator Program, ArcelorMittal is collaborating with the Indian Institute of Technology Madras ("IIT Madras"), whose pedigree in nurturing ideas and mentoring will be applied to support start-ups or early stage companies selected, enabling them to scale their technologies and business models from lab to the market. The program has received an overwhelmingly positive response, with over 50 start-ups and R&D projects submitting applications across a range of technology domains. The shortlisted applicants will all have the opportunity to attend an 8-week workshop at IIT Madras after which the finalists will be selected with the aim to conclude in the first quarter of 2024.
Setting ambitious targets given supportive policy
Decarbonization is at the heart of the Company’s climate action strategy, aiming to have a leadership position within the steel industry in terms of target- setting, performance and disclosure. In 2021, the Company set out its current targets to reduce carbon emissions intensity by 25% globally by 2030, and by 35% in Europe. Both targets cover Scopes 1 and 2 for steel and mining per tonne of crude steel.
The Company's funding and capital expenditure objectives contain key assumptions:
•The cost of green hydrogen will become increasingly competitive over the next decade but will still require government support in ArcelorMittal’s countries of operation.
•CCUS infrastructure will take time to be built at scale. While Europe is expected to take the lead, CCUS infrastructure has the potential to expand quickly in the U.S. and Canada – providing some potential upside to the business’ assumptions.
•Different regions of the world will continue to move at different paces and climate initiatives will differ between jurisdictions at any given time.
•The introduction of climate-friendly policies in other regions will be 5-10 years behind Europe and the U.S.
The Group's 2030 carbon emissions intensity reduction targets reflect the unequal pace of change of the world’s decarbonization journey. In Europe and Canada, where the promise of supportive policy is more advanced, the Company can be more ambitious. In other regions, the pace of change is likely to be slower as the regulatory system is less evolved. Policymaking has a crucial role to play, and the Company will continue to advocate for policies that support the acceleration of this transition.
To achieve its 2030 global carbon emissions intensity reduction target of 25%, covering the Scope 1 and 2 emissions
attributable to the Company’s operations, ArcelorMittal has estimated the gross capital cost required to be approximately $10 billion, with the expectation that public funding covers 50% of the total cost of decarbonization, addressing both capital expenditures and the higher operating expenditures, so that the Company and the industry are not rendered uncompetitive during this transition period.
Engaging with policy makers and other stakeholders
Due to the size and scale of transformation required in the global economy, not least in heavy industry, in order to achieve net-zero, national and international policy making has a critical role in both setting timelines and the pace and nature of change. There are enormous considerations around achieving a just transition that does not unfairly impact certain social groups or geographies, but equally there is a need for governments to facilitate the huge investments required through incentivization of markets and through funding and economic support. ArcelorMittal has actively engaged and continues to do so with governments, policy makers and related organizations and interest groups, to build the appropriate policies and economic and social conditions to achieve the changes required in a commercially viable manner.
A fundamental requirement is to address not just the significant capital expenditure needed to transition to net-zero carbon technologies, but also the considerably higher operating costs associated with these technologies in their early stages of implementation, before they have achieved efficiencies of scale or viability.
ArcelorMittal believes that policy instruments need to deliver five market conditions to ensure that low- and zero- carbon emissions steelmaking is at least as competitive as higher carbon-emissions steel:
•Measures to incentivize the transition to low and zero carbon-emissions steelmaking
•A fair competitive landscape that accounts for the global nature of the steel market, ensuring domestic production and imports are subject to equivalent GHG reduction regulations and incentives, such as a fairly and internationally applied Emissions Trading Scheme (ETS)
•Financial support to innovate and make long- term investments and neutralize the higher operating costs of low and zero carbon- emissions steelmaking
•Access to sufficient clean energies at affordable price levels
•Incentives to encourage the consumption of low- and zero-carbon emissions steel over higher carbon emissions steel.
56
| Management report | ||
The global investor community is playing a key role in providing the support and finance for the net-zero transition. Climate is a key part of ESG governance that is causing a greater focus on and scrutiny of key performance data such as carbon emissions reduction. Investors are increasingly aligning their portfolios with the goals of the Paris Agreement, often using third-party ratings and proxies to do so. These include initiatives such as Climate Action 100+ ("CA100+") Net Zero Benchmark, the Sustainable Steel Principles ("SSP"), Climate Bonds Initiative ("CBI"), the annual CDP climate survey and the Science Based Targets initiative ("SBTi"). ArcelorMittal continues to engage with such initiatives to ensure that the challenges and opportunities of competitively transitioning multiple steelmaking assets across multiple regions into a low carbon economy are clearly understood and that the approaches adopted are realistic and pragmatic.
The Company is focused on engaging with numerous other important strategic initiatives that gather key stakeholders to identify the main challenges and requirements for the steel sector’s transition. These include the Energy Transition Commission (ETC), the World Economic Forum (WEF), Rocky Mountain Institute (RMI), Mission Possible Partnership (MPP), the International Energy Agency (IEA), Industry Transition Accelerator (ITA), World Business Council for Sustainable Development (WBCSD), Organization for Economic Cooperation and Development (OECD), World Trade Organization (WTO), World Steel Association, American Iron and Steel Institute (AISI), ResponsibleSteelTM, the United Nations Industrial Development Organization (UNIDO), and the Industrial Deep Decarbonization Initiative (IDDI), amongst others.
ArcelorMittal also actively engages with trade associations to advocate for climate policies and conditions that will enable steel to accelerate and achieve its net-zero transition globally while remaining competitive. The Company publishes the results of its engagements through its climate advocacy reports on its website.
Driving demand for low-carbon emissions steel
In line with its intention to lead developments in decarbonization, ArcelorMittal published a concept for a low-carbon emissions steel standard in June 2022 to help incentivize the decarbonization of steelmaking globally and support the creation of market demand for physical steel products which would be classified as lower, and ultimately near-zero, carbon emissions steel. The concept involves:
•A dual scoring system which provides customers with a life cycle assessment ("LCA") value alongside a rating system which measures a company’s progress towards near-zero
•Incentivizing the decarbonization of both primary and secondary steelmaking
•Providing transparency and consistency across steel products for customers
•Supporting the development of markets for low-carbon emissions steel
The Company believes that the creation of clear definitions for low-carbon emissions physical steel is an important component of ‘demand pull’ and ‘supply push’ mechanisms that are required to support the steel industry in its transition to net-zero by 2050. Clear definitions will also help inform targeted policy to support the scale-up and commercialization of these near-zero technologies.
At the heart of the concept for a low-carbon emissions steel standard are three core principles:
1.It must include a dual score system comprising an LCA value for finished products (and an environmental protection declaration for construction products) alongside a decarbonization rating system which categorizes low and near-zero carbon emissions per tonne of hot rolled steel and rewards producers as they decarbonize from their starting point.
2.It must be designed in such a way that incentivizes the decarbonization of all methods of steel production through technology shifts to ensure a global decrease of emissions, rather than simply through increasing scrap rates using existing technology. This can be done by using a sliding scale based on the percentage of scrap used in production, a system which is also at the heart of the ResponsibleSteel™ and International Energy Agency ("IEA") low-carbon emissions steel models.
3.It must include a clearly defined boundary from which carbon emissions are counted for the decarbonization rating system.
The concept is designed to be complementary to methods for rewarding virtual low-carbon steel, at least until significant amounts of physical low-carbon steel are available.
Climate governance and risk management
Structures and decision-making
ArcelorMittal’s climate-related activity and progress continues to be overseen by a robust governance structure that includes an executive-level Climate Change Committee and Board-level Sustainability Committee chaired by an independent non- executive director. Having set a 2030 Group target on carbon emissions reduction, the Board also decided to link executive remuneration to the achievement of this objective. Since 2021, decarbonization targets are part of the performance criteria for
57
| Management report | ||
vesting of the performance share units in the long-term incentive plan.
In terms of investment decision-making, each major capital expenditure project proposal is required to demonstrate its carbon impact to the IAC. The IAC makes all necessary considerations to maximize the business’ chances of achieving its targets while ensuring each project is economically justifiable and earns its cost of capital. It is a crucial part of the Company’s strategy to manage risk and deliver long-term growth.
TCFD-aligned risk management
In 2021, ArcelorMittal reviewed and reported on the Company’s climate risks and opportunities in its second Climate Action Report which is its response to the recommendations of the TCFD.
In 2022, the Company engaged further expert advice to better understand the exposure to transition and physical climate-related risks, assess the resilience of the business and inform its broader strategy. In line with the TCFD recommendations, ArcelorMittal developed four climate scenarios, including a below 2°C degrees and a 1.5°C degrees. Some of the scenarios selected are externally designed, based on plausible assumptions or TCFD recommendations, and others are customized publicly available scenarios with some improved assumptions for greater alignment with ArcelorMittal’s modelling and market expectations.
The scenarios selected were the following:
1.5°C scenario | Central (base case) scenario | Stated Policies | High Emissions | |||||||||||
| Temperature by 2100 | 1.5°C | Below 2°C | >2°C | 4.4°C | ||||||||||
| External reference scenarios | IEA NZE | IPCC SSP1-2.6 (Similarities with IEA SDS) | Similarities with IEA STEPS | IPCC SSP5-8.5 | ||||||||||
| Selection Rationale | (1) Aligns with the TCFD recommendation to consider a 1.5°C scenario for the ‘2°C or lower’ scenario, and (2) and recognized by investors as an external, reputable scenario. | (1) Possible decarbonization path for the steel sector considering forward looking technology, market and policy developments, and (2) meets the TCFD recommendations for considering ‘2°C or lower’ scenario. | (1) Assesses performance in a context where decarbonization policies do not progress beyond current levels, and (2) incorporates other uncertainties such as energy security priorities. | (1) SSP5-8.5 is considered by the TCFD to be best-practice scenario to understand stressed exposure to plausible physical risks. | ||||||||||
| Description | Holds warming to approximately 1.5°C, aligned with the Paris Agreement. Advanced economies reach net zero in advance of others and the scenario accounts for SDGs. Global steel emissions fall to around 0.22Gt by 2050. | Below 2°C scenario, exploring regional variations in low-carbon policies. Europe, U.S. and Canada are ahead of the decarbonization trend; China achieves carbon neutrality by 2060; India by 2070, Russia follows limited climate targets. | Scenario aligned with current policies, assuming limited additional policy support for decarbonization of the steel sector. | A high reference scenario with no additional climate policy – current CO2 levels double by 2050. | ||||||||||
| Used for physical risks/opportunities assessment | No | Yes | No | Yes | ||||||||||
| Used for transition risks/opportunities assessment | Yes | Yes | Yes | No | ||||||||||
These scenarios were used to conduct screenings to qualitatively identify material climate-related risks and opportunities. For transition risks, the analysis was done at the segment-level and for physical risks, the analysis was done at site-level. Main results are summarized below:
Physical risks
The scope of the analysis was ArcelorMittal’s whole value chain, including 89 operational assets, 7 supply assets and 4 customer regions, with focus on construction and automotive sectors due to its high relevance to the business and its potential exposure to physical impacts of climate change. The screening was done against the base case and the high emissions scenarios, but results are shown only for the latter, in order to align with
international best practice to review ‘stressed exposure’ to impacts over a time horizon relevant to the asset lifetimes and the business.
Across the Group, all operational assets may be negatively impacted by acute strategic implications, impacting steel production capacity. Rainfall flooding and wildfires present the highest risk, with negative implications that may include reduced asset working capacity, and thus the amount of product being supplied to market. In terms of positive strategic implications, improving resilience of infrastructure to cope with a higher frequency and severity of landslides and tropical cyclones could increase ArcelorMittal’s revenue driven by increased steel demand.
58
| Management report | ||
| Physical risk item | Strategic Implication | Strategic Importance by 2050 | |||||||||
| Acute | Flooding, landslides, wildfires and storms | Disrupting supply and value chain transport routes | High (negative) | ||||||||
| Damaging equipment and infrastructure | High (negative) | ||||||||||
| Disrupting operations and causing production delays or shutdowns | High (negative) | ||||||||||
| Extreme weather events | Posing risk to personnel and impacting operations | Medium (negative) | |||||||||
| Chronic | Coastal flooding, extreme heat and extreme cold | Impacting supply and value chains | Medium (negative) | ||||||||
Water stress & drought | Impacting operations | Medium (negative) | |||||||||
| Impacting access to raw materials | Medium (negative) | ||||||||||
| Acute and chronic | Increased severity and frequency of destructive climate events | Increasing customer demand for steel to strengthen buildings | Medium (positive) | ||||||||
Transition risks
For the transition screening assessment, the Company used three scenarios: 1.5°C, below 2°C and the stated policies scenario to stress-test the exposure to transition climate risks, as per TCFD guidance.
A summary of the items of the highest strategic importance across ArcelorMittal’s business is listed below. The results are for 2030 under the ‘Central’ and the ‘1.5C’ scenarios, as these capture the most significant transition impacts.
•Policy & Legal: Main risk is related to carbon regulations not being equally applied to all market participants (e.g. ineffective Carbon Border Adjustment Mechanism "CBAM"), reducing the cost competitiveness of steel produced in regions with a higher cost of carbon. On the other hand, there is an opportunity to use policy support to reduce the cost of green energy and decarbonize ahead of competitors.
•Technology: Restrictions on clean energy scalability, increasing decarbonization costs in some regions (e.g. Europe).
•Reputation: Inability to meet stakeholder expectations either due to delayed decarbonization or lack of commitment to climate justice, eroding trust of customers, regulators, governments and investors.
•Market: Decrease of steel demand compared to business as usual, due to material efficiency and longer product lifetime. In contrast, there could be higher sales volumes or increased revenue due to increased demand and price premium for low carbon steel, as well as demand for steel products supporting the decarbonization of other sectors (e.g. automotive). There are also significant opportunities for lower cost of capital (higher capital availability) for low carbon steel projects.
In 2023, the focus has been on developing methodologies to move from this qualitative assessment to a financial quantification of the impacts of these risk and opportunities. The
approach for physical risks has been to expand the screening of Company's assets, key joint ventures and suppliers using best-available climate models against a more comprehensive list of climate hazards, to align with the EU Taxonomy requirements. Using suitable materiality thresholds, the Company has identified sites at material risk, and is conducting site-level assessments to have more accurate data in order to develop suitable, EU taxonomy-aligned adaptation solutions. The Company is also working with experts to quantify potential financial impacts on key metrics (revenue, capex, etc) from hazards like flooding, wildfires and extreme heat.
For transition risks, ArcelorMittal is developing a site-level financial model to test its business resilience against market, policy and technology-related climate risks, like changes in steel demand from increased circularity, changes in raw material costs, timely introduction of favorable climate policies and availability of breakthrough technologies.
EU Taxonomy
The EU Taxonomy Regulation requires ArcelorMittal to report on the Taxonomy-alignment of its activities. The EU Taxonomy-eligible activities identified can be classified as Taxonomy-aligned if they make a substantial contribution to climate change mitigation and do no significant harm ("DNSH") to other environmental objectives and, at the same time, ensure minimum social safeguards. ArcelorMittal has identified a substantial contribution to climate change mitigation for the manufacture of iron and steel under the technical screening criteria. However, the Company’s alignment with the EU Taxonomy was 0% in 2022 due to some gaps (the Company issued the report in April 2023). The main one relates to the “Do no significant harm” to climate adaptation criterion, which is applicable to all activities considered eligible and sets specific requirements for the identification of physical climate risks and vulnerability assessments. Although this area has benefited from the TCFD physical risk assessment that ArcelorMittal carried out in 2022, the TCFD exercise does not fully overlap with the requirements of the EU Taxonomy on this matter, as it excludes
59
| Management report | ||
several physical climate hazards from the risk screening process. ArcelorMittal is working towards closing these gaps.
Carbon performance (based on 2022 data)
In 2022, the Company’s adjusted group intensity target KPI was 2.00 tonnes of CO2 emissions per tonne of crude steel ("tCO2e/tcs"). Significant reductions are only likely to be made with the successful deployment of steelmaking and energy transformation projects. In order to view the trend for CO2e intensity of steel only, the Company also reports this data since 2018 in the table, adjusted for structural changes to its portfolio
to enable a like for like annual comparison. This shows a reduction of 4.3% since 2018, from 2.07tCO2e/tcs to 1.98tCO2e/tcs. The Company saw a 1.8% improvement in 2022, down to 1.67tCO2e/tcs from the 2018 baseline of 1.70tCO2e/tcs for its European adjusted target KPI – CO2e intensity of its steel operations (Scopes 1 and 2). The adjusted absolute emissions that correspond to the Company’s global target KPI (Scope 1 and 2, steel and mining) decreased by 22.2% compared with 2018.
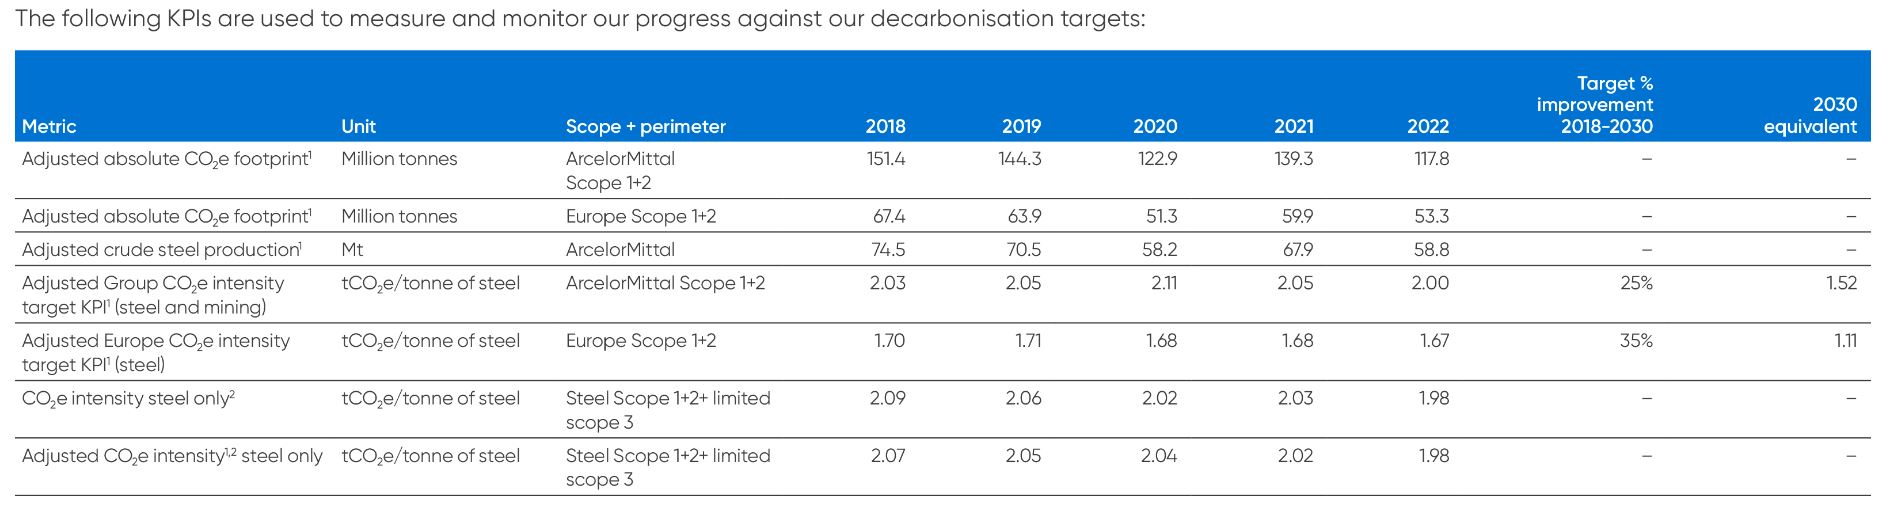
1.These figures have been adjusted for structural changes to the ArcelorMittal portfolio in the previous 12 months, and reflect emissions and production for ArcelorMittal's site portfolio as at December 2022 to enable a like for like annual comparison.
2.This indicator includes those emissions from purchased goods that a steelmaker would normally be expected to produce, such as coke, slabs, burnt lime in order to maintain a consistent system boundary and so a like for like comparison.
Environment and Biodiversity
The Company’s overarching aim in relation to the environment and biodiversity is to strive to be a trusted user of resources and the natural environment, and a responsible steward of the land and ecosystems around its operations. The Company seeks to minimize environmental impacts, mitigate any residual effects and where possible to deliver a net environmental benefit.
Globally, the regulatory backdrop to environmental compliance in industry is developing rapidly and becoming more stringent, notably through the roll-out of the CSRD reporting and preparation for Task Force on Nature-related Financial Disclosure ("TNFD"). Environmental impacts such as that of air emissions are coming under greater scrutiny as evidenced by the updated air quality guidelines issued by the World Health Organization ("WHO") in September 2021, that has triggered the ongoing review of the EU Ambient Air Quality Standards, the ongoing revision of the Industrial Emissions Directive (the EU’s instrument regulating pollutant emissions from industrial installations in the EU), and the updated Best Available Techniques Reference Document ("BREF") for the Ferrous Metals Processing Industry.
These changes will result in stricter environmental norms concerning pollution (emissions to air, water and land), broader impacts on natural environments, habitats and biodiversity, and
energy efficiency and resource efficiency, as well as promoting more sustainable industrial production (part of the European Commission’s Green Deal for a climate-neutral continent) and increased transparency of information available to public.
This has continued to bring sustainability and the environment right to the heart of the Company’s operational and strategic thinking, and to reflect this, during 2022 and 2023 it has continued to strengthen its overall environmental strategy, investment and governance. In 2023, the IAC approved expected capital expenditures totaling $291 million for 26 projects with environmental benefits. The Company is developing a more robust measurement and monitoring management system.
Strengthened Board and management oversight and compliance
In addition to the Sustainability Committee's role mentioned in the governance section, the environmental performance is also discussed at the executive level Sustainable Development Panel and with the Executive Office during quarterly Business Area Reviews.
As part of its environmental goals and preparation for new reporting regulations, the Company updated its environmental
60
| Management report | ||
policy at the end of 2022, which was launched in February 2023, and is applicable to all operations.
The policy provides the environmental framework by which all parts of the business are expected to abide. The key principles promoted by the policy are:
•Compliance with all relevant environmental laws and regulations
•Implementation of environmental management systems including ISO 14001 certification for all production facilities
•Conducting environmental impact assessments for major capital projects in accordance with good international industry practice
•Continuous improvement in environmental performance, taking advantage of systematic monitoring and aiming at pollution prevention, and use of Best Available Techniques ("BAT")
•Implementing a long-term GHG emissions reduction strategy to achieve net-zero
•Development of low impact, environmental production methods and local sourcing
•Development and manufacture of environmentally friendly products with a focus on end-of-life recycling or reuse
•Supplier and contractor awareness and respect for the company’s policy
•Employee commitment and responsibility in environmental performance
•Respecting protected areas and managing adverse impacts on biodiversity and ecosystem services in accordance with good international industry practice
•Efficient use of natural resources, raw materials, energy, land and water
•Open communication and dialogue with all affected stakeholders.
The Company has also established an Environmental Compliance Methodology that covers the identification, investigation and mitigation of environmental non-compliances and associated risks. It is based on ISO 14001 and covers environmental compliance at all steel and mining operations across the Group, relating to air, water, soil, residues, noise, permits, landfills, monitoring and reporting, among others. At each site, the segment CEO is responsible for ensuring that the site environmental manager or designated person implements the methodology correctly. At the Group level, the corporate environment team handles environmental compliance reporting and is responsible for regularly reviewing and updating the methodology as needed.
Preparing for the CSRD
At the end of November 2022, the European Council granted final approval to the the CSRD. This directive introduces more detailed reporting requirements and mandates that large companies and small and medium-sized enterprises report on sustainability matters. It is designed to address gaps in the existing rules on sustainability information.
The European Financial Reporting Advisory Group (“EFRAG”) has developed draft standards incorporating requested information on ESG aspects. According to these standards, companies must disclose their activities related to environmental matters, including climate change, pollution, water, marine resources, biodiversity, ecosystems, and the circular economy; social matters, encompassing policies, practices, material impacts, opportunities, and risks related to their workforce, workers in their value chain, potentially affected communities, and consumers and end users; and governance matters, such as corporate culture, business policies and practices related to corruption, bribery, lobbying, business conduct, and payment.
On July 31, 2023, the European Commission adopted the European Sustainability Reporting Standards (“ESRS”), the first set of corporate sustainability reporting standards under the CSRD. The CSRD entered into force in January 2023 and went into effect on January 1, 2024. All companies subject to CSRD are required to issue annual sustainability statement according to the ESRS.
ArcelorMittal has taken several steps in preparation for publishing its first sustainability statement under CRSD in 2025. In 2023, a CSRD project management office was set up under the sponsorship of CFO and reports to the CSRD Compliance Steering Committee. The CSRD Steering Committee consists of members from the executive team and is responsible for overseeing and guiding the project implementation. The PMO and the Steering Committee are supported by the CSRD working group consisting of representatives from ArcelorMittal business segments and various group functions. Further, ArcelorMittal has since implemented various initiatives to update its global ESG management and reporting processes, systems and tools in alignment with financial reporting processes in order to meet the reporting deadline.
In preparation, specifically in relation to the natural environment, ArcelorMittal is developing its capacity to collect information on its interface with nature, and developing methodologies for the assessment of nature-related impacts, dependencies, risks and opportunities, with the aim of proactively managing nature-related themes.
Part of this is development of a methodology for the assessment of nature-related risks and opportunities, in line with the recommendations of the TNFD, as set out in the draft European
61
| Management report | ||
Sustainability Reporting Standards ("ESRS"). The methodology is being developed and tested as part of two mining and steel operations pilots, ArcelorMittal Liberia and ArcelorMittal Bremen. The objective is to develop the methodology for site-level assessment for use in the Group more widely, notably in priority sites where risks and opportunity may be most material.
In parallel, for the identification of priority sites, the Company is developing a methodology that allows it to combine and leverage the wide array of tools suggested by the TNFD that incorporate different data layers on matters such as biodiversity, water and ecosystem services.
SEC climate change disclosure
Second, in March 2022, the U.S. Securities and Exchange Commission (“SEC”) issued a proposed rule that, if adopted, would enhance and standardize climate disclosure requirements provided by public companies. The new regulation would require organizations to provide detailed reports on their climate-related risks, emissions, and net-zero transition plans. These would include climate-related financial impact and expenditure metrics, as well as a discussion of climate-related impacts on financial estimates and assumptions in the financial statements. These disclosures would also be subject to management’s internal control over financial reporting and external audit. The proposed rule would apply to foreign private issuers which file annual reports on Form 20-F with the SEC, such as ArcelorMittal. The 2022 proposal would have required large companies to disclose most of this information starting from the fiscal year 2024, with filings due in the year 2025; this implementation schedule now seems unlikely given that the final rules have not yet been adopted. The SEC is now expected to act on the proposed climate-related disclosures by April 2024.
Upgrading the environmental data management system
The Company’s existing environmental data management system needs to be strengthened significantly to meet the increase in reporting demands. Enhanced systems and tools are required to put the appropriate monitoring and action plans in place. A new technology platform went live in the third quarter of 2023 and will be connected with environmental databases of sites across the Group, either existing or under deployment. It will provide ongoing environmental data reporting requirements. This combination will enhance the Company’s data acquisition, provide greater quality control, enable automated data gathering and drive more timely reporting.
Building greater expertise in EIA, LCA and EPD
Under the Company’s new environmental policy, Environmental Impact Assessments (EIAs) are mandatory for all major capital projects, so that the likely effects are identified at the earliest possible stage, and negative impacts can be avoided, reduced or offset. To support this, the Company is building up its specialist expertise and personnel in this area.
LCAs and Environmental Product Declarations (EPDs) are also increasingly necessary for the specification and validation of the Company’s products, particularly for key customer sectors, such as automotive and construction, as these assessments are regarded as transparent and objective evaluations of the potential impact of products on people and planet. The business’ expertise in these areas is an important asset and the Company intends to continue building greater knowledge and experience in EIAs, LCAs and EPDs. In 2023, the Company undertook a total of 63 LCA studies related to steel products and the processes used to produce them, all guided by the relevant standards (ISO 14040-44). In addition, the Company issued 24 EPDs in 2023, and expects this to continue to build over the coming years.
Reducing air emissions
Air emissions remain one of the Company’s greatest environmental challenges, and one that is naturally of particular concern to local communities. It was the most highly ranked environmental issue for both stakeholders and the Company in its most recent materiality assessment. The Company is dedicating significant resources to tackle air emissions in investment plans for each business unit and site, particularly around ducted dust, SOx and NOx emissions.
Across the sites, in line with its Group Environmental Policy, the Company is investing in more robust monitoring systems and where possible, using the best available technology to further improve environmental performance.
The Company is also making significant progress in understanding sources of emissions, characterizing them, predicting their appearance and movement, and creating mitigating solutions. Particular advances are being made in detection through laser and AI powered video surveillance, with the ultimate goal of defining what emissions are being released, from where, and with what trajectory and diffusion, such that they can be arrested, removed or mitigated.
The Company is running pilot programs to test the effectiveness of automated monitoring equipment, including advanced sensors technology, aimed at giving better oversight of dust emissions and ad hoc emission events, with the intention of rolling this capability out across priority sites. LIDAR (laser imaging, detecting and scanning) helps to detect diffuse air emission sources and to predict how they may develop due to changes in production, meteorological conditions, and other variables.
This enhances the selection of appropriate preventive or mitigating measures to be put in place. LIDAR has so far been tested at sites in Fos-sur-Mer, Asturias, Ghent and Tubarão. Video monitoring of emissions is also proving very effective and
62
| Management report | ||
the roll-out of cameras is underway across a range of sites enabling 24-hour dust emission detection.
The Company is also progressing in the industrialization of advanced filtration technologies to reduce emissions at stacks. For diffuse dust emissions, R&D has developed a methodology to calculate technical requirements to capture the filtration requirements based in advanced CFD simulations, visual camera and measurements. It enables the correct dimensioning of equipment in critical hotspots such as the sinter coolers.
Each ArcelorMittal site is implementing an air quality improvement plan. For example, ArcelorMittal has been investing in an extensive program at Fos-sur-Mer, France to reduce emissions from steelmaking operations since 2010. Dust emissions consequently reduced by 70% between 2010 and 2020. An additional €50 million investment in environmental improvements over the 2021 to 2023 with a specific focus on water and dust emissions will further increase environmental improvement. The projects include an air emissions filter installed at the Fos sinter plant with a filtration area of 20,000m2, aimed at reducing dust emissions by 40% and overall channelled dust emissions by 15%. A de-dusting system was also commissioned in 2023. In addition, the construction of a ladle furnace with dust removal and water treatment station is scheduled for commissioning in 2024.
Protecting and conserving water resources
Water management is ranked highly as an important issue for the Company and stakeholders in its materiality assessment. The Company is determined to continue improvements in reducing its water consumption and enhancing water quality across its operations. Unlike carbon emissions, which are a global challenge, water use, availability and quality are more local, requiring the business to work closely with local municipalities, water authorities, non-profit organizations and communities.
In pursuing these goals, the Company is investing significantly in innovative techniques for water recovery, water treatment, establishing alternative water sources and reduced energy usage.
In the Company’s mining operations, some sites are recycling as much as 98% of their water. AMMC invested $52 million in a water treatment plant to prevent heavy metals dissolving out of excavated waste rock piles from entering adjacent surface waters.
The Newcastle site in South Africa has invested $8 million in a water treatment project by constructing a 460,000m3 stormwater runoff dam and reducing the plant’s overall water demand. It includes increased capacity stormwater interceptors integrated
with existing water treatment facilities. It was completed in May 2023.
Protecting biodiversity and ecosystems
The COP15 Biodiversity Conference in Montreal, at the end of 2022, highlighted the ongoing damage to species biodiversity around the world. The impending onset of TNFD reporting is also demanding much greater corporate awareness and action to record, monitor and mitigate impacts on nature.
Limiting the Company’s land use and its impacts, reducing emissions to air and water, and minimizing resource consumption, all contribute to reducing biodiversity impacts, but the Company recognizes that its involvement and work needs to go beyond the boundaries of its sites, and extend into engagement with local communities. Like many other companies, ArcelorMittal needs to increase its capabilities in measuring and monitoring key biodiversity and ecological indicators, so it can develop the appropriate mitigatory or beneficial actions to protect its surrounding environments, ecosystems and species. This will involve internalizing substantial additional resource, knowledge, expertise and systems. The Company plans to enhance its management approach in this area to align with the proposed TNFD approach.
Perhaps the most challenging location for the Company in protecting biodiversity is its mining operations in the Nimba county of northern Liberia. Located to the east of its mining operations, the Eastern Nimba mountain range extends from Liberia into Guinea and the Ivory Coast, an area which is protected by conservation measures such as the East Nimba Nature Reserve (ENNR) in Liberia. Both Eastern and the Western range have global conservation value and are home to a remarkable diversity of species and habitats, many of which are highly threatened.
As part of developing a biodiversity transition plan to meet the CSRD requirements, the Company participated in the ICMM TNFD pilot program with a study on its Liberian mining operations. The study:
•built awareness of nature-related impacts, dependencies, risks and opportunities
•helped to shape and organize future TNFD disclosure
•provided the Company with helpful insights ahead of the release of the final TNFD framework for application elsewhere in the Group
ArcelorMittal has developed a sustainable supply and management model at its BioFlorestas project in the south-eastern state of Minas Gerais, Brazil. The project has an area of 100,000 hectares of planted eucalyptus forests and 40,000
63
| Management report | ||
hectares of permanent conservation and legal reserve. From the eucalyptus forestry the Company produces charcoal that is used as a biofuel for its furnaces in Juiz de Fora and to exchange for pig iron with local producers. It is seeking to set a template in the adoption of sustainable management models focused on socio-environmental responsibility.
BioFlorestas is certified by international standards such as the Forest Stewardship Council ("FSC") for planting, forestry development, harvesting and charcoal production. Its Forestry Research and Improvement Center includes a study of forest genetic improvement with the objective of obtaining genetically superior seeds, pollen and grafts.
Protecting land, reducing waste and using by-products in the circular economy
With growing and competing demands for land both nationally and internationally, there are increasing pressures on remaining natural ecosystems. For land that is in use, particularly in and around heavy industry, ecosystems have suffered biodiversity loss and land degradation through transport, infrastructure, noise, pollution and overall disturbance.
ArcelorMittal is determined to reduce its impacts on the land that it occupies and in neighboring areas. The growth of waste storage sites has been a traditional issue for steel and other natural resource companies. There is now a much closer focus on such sites in relation to safety of local communities and employees, the accumulation of pollution from waste metals and compounds, and more simply the wastage and degradation of precious land areas. The Company is seeking to reduce unnecessary waste storage through innovative uses of slags, dust and sludges. Slag can be used in cement and asphalt for construction, fertilizer for agriculture, and ballast in offshore wind turbine foundations. Blast furnace slag has been reused as a raw material in cement production, saving million tonnes of CO2 emissions per year. Additional attention is being paid to capturing dusts and sludges created through operations, and recycling these where possible.
Ongoing focus on tailings dam safety
Tailings dam safety and structural integrity is a critical issue for all mining companies, in order to protect the safety of local communities and employees, and to protect the environment from pollution and flooding.
The Company has developed a tailings strategy based on the leading industry guidelines from the Mining Association of Canada (MAC), the Canadian Dam Association (CDA) and the Global Industry Standard for Tailings Management (GISTM). The aim is to ensure that all Group tailings facilities are structurally sound and safe, with all efforts directed at minimizing risk, including independent audits benchmarked against these international guidelines.
The Company has 16 tailings storage facilities (TSFs) including conventional, paste, dry-stack and in-pit facilities, of which 11 are active, 5 are inactive and one is closed. To ensure their ongoing safety, a formal assurance process is in place that includes internal and external audits. This is supported by a continuous improvement program that reduces the Company's risk of existing conventional operations by promoting reduced moisture disposal methodologies (e.g. high-density thickened tailings or filtered tailings where appropriate) and proven new technologies (e.g. high-precision radar, InSAR satellite monitoring and remote instrumentation) to monitor facilities globally in real time. The Company is assessing all its mining operations for transition in line with these principles and developing customized design solutions for non-conventional tailings system management.
Tailings thickening steps have been implemented in assets in Mexico, reduced moisture disposal methodologies in Brazil and Canada, and further studies are ongoing across a range of operations.
Responsible value chains
Customers increasingly expect to buy products that are responsibly sourced and sustainable. They, together with broader stakeholders, are exerting pressure across value chains to ensure that they are committed to ensuring the respect of human rights and the environment, as well as addressing climate change. These expectations are reflected in the onset of transformational legislation e.g. CSRD, Corporate Sustainability Due Diligence Directive (CS3D), etc.
The Company’s aim is to operate responsibly across the whole value chain to meet its stakeholders' expectations and earn its license to operate. The strategic actions the Company is taking towards this objective include:
•Strengthening the Human Rights policy
▪Certifying the Company’s operations to leading third-party industry multi-stakeholder standards e.g., ResponsibleSteel™.
•Encouraging key raw material suppliers to certify to industry leading ESG standards
•Responding to sustainability due diligence legislation.
Governance of value chain responsibility and sustainability
Governance of the Company's value chain is covered by the Sustainability Committee and SDP. Where deemed relevant, key issues are raised with the Executive Office for discussion and action.
Governance of the Company’s value chain is also covered under its existing sustainability and responsibility policies and procedures, such as Human Rights, Anti-Corruption, Conflict
64
| Management report | ||
Minerals, Code of Business Conduct, Code of Responsible Sourcing, Whistleblower, Health and Safety, and Environment.
Strengthening the Human Rights policy
ArcelorMittal has strengthened its Human Rights policy to better align with best practice and increase its focus on the areas that have been identified as priorities for the business. The Company strives to respect all internationally recognized human rights, including, but not limited to, those covered under the International Bill of Human Rights, the ILO Declaration on Fundamental Rights at Work, and implementing the UN Guiding Principles on Business and Human Rights ("UNGPs"). In addition, the Company voluntarily seeks to uphold and align with other international standards including the OECD Guidelines for Multinational Enterprises, the International Finance Corporation’s Environmental and Social Performance Standards, the Voluntary Principles on Security and Human Rights, and other relevant voluntary conventions and Standards applicable to its operations.
The purpose of the Human Rights policy is to set out the guiding principles for the Company’s attitude, decision-making, actions and behavior in relation to human rights. The policy and associated practices will strengthen as the Company’s operating procedures create an environment where human rights are fully respected, and will also help to prevent the Company from engaging in activities that directly or indirectly violate human rights.
ArcelorMittal expects all its business partners to share its commitment to promote human rights and environmental protection requiring suppliers (including subcontractors) to adhere to its policies including Human Rights and Responsible Sourcing policies.
The policy forms the basis for how the Company manages human rights in all aspects of the business and guides all other policies and codes of conduct.
ArcelorMittal is determined to avoid causing or contributing to adverse human rights impacts, ensure it is not complicit in their violations by implementing ongoing due diligence processes that aim to prevent, avoid, mitigate, and remedy human rights impacts the Company could impose on its employees, contractors, workers within the Company's value chain, members of communities where the Company operates, and any other people whose human rights may be adversely impacted by its activities.
Certifying the Company’s operations to third-party, industry leading multi-stakeholder standards
Assurance, certification and compliance is about taking a more outward-looking view of the Company’s business, how it operates and how it impacts the society and environment
around it. The Company takes the view that this strategic perspective helps it make better long-term decisions and thereby build and protect value for the future.
With the increased level of scrutiny and compliance, the Company believes it to be important to work with recognized, respected, third-party institutions to achieve and be certified for exacting standards of responsibility. ResponsibleSteelTM and the Initiative for Responsible Mining Assurance (IRMA) are two of the leading industry bodies promoting responsibility in the steel and mining industries respectively. ArcelorMittal is working with both bodies as part of its approach to strengthening its sustainable value chain and legal compliance.
ArcelorMittal was a founding member of ResponsibleSteelTM and has a seat on the board representing business members. The Company also has a steering committee seat at IRMA. The values and missions of both organizations correspond closely to the Company’s own purpose and its desire to minimize risk, improve performance and meet stakeholders’ expectations. There is also an alignment with the increasing legislative developments to reassure stakeholders that the Company is working to operate responsibly. The key strategic actions on certification include:
•continuing to self-assess and certify the Company’s major steelmaking sites to ResponsibleSteelTM standards; and
•completing IRMA self-assessments at the Company’s iron ore mining operations.
ResponsibleSteelTM published its first certification standard for steelmaking sites in 2019 based on 12 ESG principles. The standard involves a rigorous audit process covering over 400 criteria and can take over a year. Members using the standard are able to reassure customers and other stakeholders of the credibility of social and environmental management of their steel operations.
As of the end of 2023, the Company had achieved certification at the 33 sites listed below:
•ArcelorMittal Belgium (Geel, Genk, Ghent, and Liège)
•ArcelorMittal Belval and Differdange in Luxembourg (Esch-Belval, Differdange and Rodange)
•ArcelorMittal Bremen and ArcelorMittal Eisenhüttenstadt in Germany
•ArcelorMittal España (Asturias, Etxebarri, Lesaka and Sagunto)
•ArcelorMittal Méditerranée in France (Fos-sur-Mer and Saint-Chély-d’Apcher)
65
| Management report | ||
•ArcelorMittal France, Cluster North (Dunkerque, Mardyck, Desvres, Montataire, Florange, Mouzon, Basse Indre)
•ArcelorMittal Poland (Dąbrowa Górnicza, Kraków, Zdzieszowice, Świętochłowice, Sosnowiec, Chorzów)
•ArcelorMittal Warszawa Sp. z o.o., Poland
•ArcelorMittal Brasil (ArcelorMittal Tubarão, Monlevade, Vega)
•ArcelorMittal Tailored Blanks Zaragoza S.L.
Further sites in Europe, Brazil and NAFTA have commenced the audit process. The Company’s short-term goal is to see steelmaking sites in half of ArcelorMittal’s operating countries being certified by 2025.
Most of the Company’s iron ore mining operations are working towards certification with IRMA, and the organization is recognized by several of the business’ major customers, which have also joined the initiative. Like ResponsibleSteelTM, IRMA certification is demanding, and draws from wide-ranging sources and standards such as the OECD, UN, IFC, ILO and IUCN.
The Company’s iron ore mining operations in Canada, Liberia, Brazil, and Mexico are aiming to achieve the first level of IRMA certification (IRMA Transparency) by the end of 2025 and are currently completing a self-assessment against IRMA’s standards.
As an additional form of assurance for its Canadian mines, the Company seeks to comply with the Mining Association of Canada’s Towards Sustainable Mining (TSM). AMMC has implemented TSM protocols since 2004 and is both TSM-assured and five-star rated.
Both IRMA and TSM have been formally recognized by ResponsibleSteelTM as meeting the criteria for its ‘Certified Steel’ responsible sourcing requirements.
Encouraging key raw materials suppliers to certify to industry-leading ESG standards
The supply chain is clearly a fundamental part of the overall value chain, and ArcelorMittal recognizes that it must play its part in encouraging its suppliers to adopt and achieve higher sustainability standards to facilitate its own certification of ResponsibleSteelTM, IRMA and TSM standards. The Company is doing this by setting an example, engaging with suppliers, and setting standards in its procurement requirements, namely through its Code for Responsible Sourcing.
Responding to sustainability due diligence legislation
Legislation on sustainability due diligence is mounting as governments, investors and civil society enact mechanisms to ensure that companies are putting in place sustainable and just value chains.
This is reflected in legislative developments, namely the French Duty of Vigilance Law (2017) and the adoption of the German Supply Chain Due Diligence Act 2022, which both focus on the supply chain; and the impending EU-wide Corporate Sustainability Due Diligence Directive (CS3D) which is expected to be adopted in 2024 and proposes to extend due diligence requirements to the whole value chain. The CS3D addresses a wide set of sustainability due diligence requirements, including in relation to human rights, environmental impacts and climate change in companies’ own operations, subsidiaries and value chain. The CS3D requirements are also reflected in the reporting requirements of the CSRD.
During 2023, the Company worked on a set of key strategic actions to strengthen its existing compliance and procurement and sales processes for its value chains including:
•Establishing an overall management system approach to value chain sustainability due diligence
•Building internal capacity for corporate sustainability due diligence including responsible sourcing
•Adding digital ESG risk assessment solutions
•Mapping value chain partners and prioritizing high risk value chains
•Implementing a progressive, ESG risk-based assessment process across all the Company’s value chains
•Reviewing, and updating where appropriate, the processes the Company uses to manage ESG issues within its own operations
•Extending the Company’s End-User Declaration process to include wider ESG considerations
•Reviewing, and updating where appropriate, ESG due diligence processes for investments and potential acquisitions.
The Company is focusing on implementing its plans and managing actual and potential adverse impacts on human rights and environment across the Company’s complex value chain, which comprises over 40,000 direct suppliers across the globe. Developing and implementing management systems to achieve full coverage, and engaging suppliers to adopt higher standards could take several years to achieve.
Mapping the full value chain is a complex process and needs to be conducted on a risk-prioritized basis to establish areas of high environmental, social and governance (ESG) risk. This will initially need to focus on value chain partners with direct business relationships before moving up and down the value chain as the understanding of ESG risk is increasingly developed.
66
| Management report | ||
Communities and a Just Transition
ArcelorMittal is determined to make a positive contribution to its local communities and wider civil society as part of its purpose. Communities are a material stakeholder as they provide the Company’s major operations with a social license to operate. The Company must demonstrate that it listens to their needs and concerns and creates value for them.
The transition to a low carbon economy will lead to all companies, and society in general, needing to make adjustments in the skills they need, resources they use and technologies they deploy. Companies should consider how they can soften the impacts of these adjustments across their value chains in a just and equitable way.
Governance of community engagement
In addition to the role of the BS (described in the governance section above), the Executive-level Sustainable Development Panel (SDP) is a forum to discuss Company’s engagement with and impact on communities. Where deemed relevant, key issues are raised with the Executive Office for discussion and action.
The Global HR Panel (GHRP) is also involved in governance around the issues of employment, recruitment, skills, resourcing and training.
The Company’s audit and certification process with ResponsibleSteelTM and IRMA places considerable emphasis on the business’ interaction with communities and provides assurance to stakeholders of its standards and commitments in this regard.
Governance of the Company’s policies related to communities and society is also covered under its existing sustainability and responsibility policies and procedures, such as Human Rights, Code of Business Conduct, Whistleblower, Health and Safety, and Environment.
The Company’s operating units are accountable for implementing and applying the Group’s policies, standards and guidance.
Strategic actions - Listening, respecting and protecting communities
The Company perceives a growing interest and concern from local communities around the impacts of industry, business, infrastructure, transport and other activities on their physical, natural and social environments and resources. This is being driven by a range of factors, including greater inherent visibility, transparency and scrutiny, as a result of democratization of information, the prevalence of social media and changes in socio-economic standards and expectations. The Company’s reputation and license to operate with local communities and broader civil society is based on the trust it builds with local,
national and international stakeholders. It recognizes that there is an increasing need to engage regularly and openly with communities and stakeholders to build mutual understanding and trust.
The Company’s strategy on engagement is based around the following actions:
•Launching a revised Human Rights policy
•Investing in its local communities through improving its processes for stakeholder engagement and grievance management
•Preparing the Company for increased levels of mandatory community and human rights disclosures (e.g., as required by CSRD and CS3D legislation)
•Developing a Just Transition management approach
Launching a revised Human Rights policy
ArcelorMittal has revised its Human Rights policy to focus on the areas that have been identified as priorities for the business and seeks to uphold the fundamental human rights in those countries in which it operates. The Company is committed to respecting all internationally recognized human rights, including, but not limited to, those covered under the International Bill of Human Rights, the ILO Declaration on Fundamental Rights at Work, and implementing the UN Guiding Principles on Business and Human Rights (‘UNGPs’).
In addition, the Company voluntarily upholds and aligns with other international standards including the OECD Guidelines for Multinational Enterprises, the International Finance Corporation’s Environmental and Social Performance Standards, the Voluntary Principles on Security and Human Rights, and other relevant voluntary conventions and Standards applicable to its operations.
The purpose of the policy is to set out the guiding principles for the Company’s attitude, decision-making, actions and behavior in relation to human rights. The policy forms the basis for how the Company manages human rights in all aspects of the business and guides all other policies and codes of practice in relation to human rights e.g., Code of Business Conduct, Responsible Sourcing policy and code, Health and Safety policy, Environmental policy, Tax policy, human resources policies, and others.
ArcelorMittal is committed to proactively acting to avoid causing or contributing to adverse human rights impacts, ensuring it is not complicit in their violations by implementing ongoing due diligence processes that aim to prevent, avoid, mitigate, and remedy human rights impacts the Company could impose on its employees, contractors, workers within Company's value chain, members of communities where the Company operates, and
67
| Management report | ||
any other people whose human rights may be adversely impacted by its activities.
In 2023, along with the update of the Human Rights policy, the Company conducted a corporate level saliency assessment aligned to best practice. The aim of this assessment was to raise awareness of the most salient human rights issues for the Group and to inform ArcelorMittal’s human rights priorities, strategy, and disclosures. The actual and potential risks identified will be assessed and prioritized based on the severity of impact on people and following the UNGPs criteria. The Company has finalized the recommendations for improvement and once approved they will inform ArcelorMittal’s human rights strategy and roadmap.
Investing in local communities through better stakeholder engagement, needs assessment and grievance management
The communities and localities within which the Company operates provide the Company with its license to operate; they provide the skills, know-how and labour to produce its products; and the local infrastructure, goods and services the business needs to keep its operations running. The Company values their support and in return it has a responsibility to keep them informed of its strategy and plans that might affect them.
The Company continues working on improving its policies, guidance and frameworks to better ensure that it is listening carefully to the communities affected by its operations, investing in what they care about and effectively investigating any grievances they may have.
ArcelorMittal’s community outreach work is driven largely by local teams, which are best placed to understand the needs of those who live near its operations. Some examples include:
Ukraine
Following the Russian invasion of Ukraine in February 2022, the Company's operations have been substantially impacted, and its employees have suffered greatly.
The Company has continued to support its people in whatever ways it could, not least through channelling donations from ArcelorMittal employees worldwide via the United Nations humanitarian effort coordinated by UNICEF, with the Company matching donations made by employees. As of December 31, 2023, approximately €5.2 million has been donated under this initiative. Wider initiatives included the provision of ambulances for evacuation around Kryvyi Rih, donation of food aid and surgical equipment and medical supplies for local hospitals.
Brazil
ArcelorMittal Brasil prioritizes its community investment in the areas of education, culture, sport, corporate philanthropy and the creative economy, and bases its engagement on open
dialogue with local communities about their needs. Initiatives include:
•The ‘Steel saves lives’ campaign (#AçoSalvaVidas) mobilized employees, customers and the community, and raised more than R$1.2 million, an amount that was doubled by ArcelorMittal Brazil and Belgo Bekaert, to R$2.4 million. The support benefited more than 120,000 people in the communities around the Company’s sites and in other locations throughout Brazil.
•The ArcelorMittal Environment Award: created to encourage the school community to propose scientific and innovative solutions to environmental issues, in addition to raising awareness of sustainability.
Liberia
ArcelorMittal founded and operates a Vocational Training Centre at Nimba to help local young people to develop skills to provide them with opportunities that otherwise they would not have. By end of 2023, 95 apprentices graduated from the three-year residential program.
ArcelorMittal Liberia also launched a training and development program for high-potential Liberian employees to gain work experience and knowledge in ArcelorMittal Mining operations globally. The employees will receive advanced training in the fields of mining production, operation optimization, plant maintenance, planning and execution, plant electrical operation systems, and electrical maintenance. Over 100 students are undergoing skills training to become technicians for Phase 2 expansion project, and the center will be expanded to a second site at Grand Bassa.
There is also a 3-year Housing and Accommodation plan to support construction workers at Buchanan and Yekepa. Employees without housing are provided housing allowances at competitive rates; employees’ children and dependents are provided cost-free primary and secondary school education, with free access to recreational and sporting facilities including volleyball, basketball and football fields.
Spain
In Spain, as in many other countries, there is a substantial gap between training in STEM disciplines and the demand from companies for STEM trained graduates, and this gap is expected to continue growing. To address this gap, ArcelorMittal Spain has invested 45% of its total budget in community investments dedicated to strengthening STEM training for students. This involves a number of initiatives:
•Scholarships – recognition for students for their final degree projects and best projects focused on the steel industry.
68
| Management report | ||
•Industry immersion programs – offering visits by secondary and university education students to plants to visualize the work environment of the future.
•Training practices in industrial environments – in most of the Company’s plants in Spain, a mixed program is deployed that includes internships for university students and adherence to Dual Professional Training.
•Incentives to continue higher technical and scientific STEM-related studies – this includes a local investment plan of donations to provide high-specification equipment in vocational training centres. The challenge is especially pronounced among the female population with enrollment for technical careers decreasing by 40% among women. The incorporation of young people, but especially women, to this field of study is an absolute priority.
Turkey
In February 2023, ArcelorMittal donated $5 million to support the humanitarian relief program in Turkey and Syria, following the devastating earthquake in the region. The Company has a business presence in Turkey through its sales office and joint-venture partners. ArcelorMittal donated $2.5 million to the Disasters Emergency Committee (DEC) and a further $2.5 million to Médecins Sans Frontières (MSF) to support the relief efforts in both countries.
Preparing for increasing levels of mandatory community and human rights disclosures
New legislations such as the EU CSRD and CS3D will require a much higher level of disclosure on all sustainability issues, not least on how companies impact their communities and how those communities influence companies’ activities. In preparation for this new reporting landscape, ArcelorMittal has reviewed its existing reporting processes to identify gaps with the requirements, establish clear guidelines on data to be collected and how to proactively identify, manage and report on community-related impacts, risks and opportunities. As a result, the Company conducted the saliency assessment mentioned above, to identify and prioritize the most severe risks and impacts for communities. The Company is also working on updating guidance on stakeholder engagement, grievance mechanisms, human rights risk assessment and community investment guidelines.
Developing and implementing a Just Transition management approach
The transition to a low-carbon, climate-resilient economy, meeting the goals of the Paris Agreement, has the potential to trigger a new dimension of inequalities and vulnerabilities in
society, which in turn build social injustice and unrest. For these reasons, the European Union has developed a Green Deal package of policy initiatives aimed at achieving a positive transformation to a fair and prosperous society with a sustainable and competitive economy. In line with this aim, ArcelorMittal has developed a framework and guidance for its operations to manage their transitions in a just way.
The framework sets out:
•What the "Just Transition" means to ArcelorMittal
•The Company’s "Just Transition" principles
•An asset level methodology to help manage the Framework implementation at asset and plant level
•Overarching governance to monitor and measure progress.
ArcelorMittal’s "Just Transition" foundational principles and commitments
ArcelorMittal defines "Just Transition" as a principles-based systematic, ongoing process which aims to ensure an effective and inclusive transition to a low-carbon economy, while adapting and building resilience of Company's business to climate change.
•Achieving net zero GHG emissions and improving its environmental footprint
•Investing in skills for the future (e.g. sustainability, STEM and Industry 4.0)
•Providing decent (safe, healthy, clean, inclusive) work
•Investing in smarter steel products and innovative solutions
•Procuring goods and services in a sustainable, responsible and ethical manner
•Striving for tax transparency and making a transparent and fair contribution to society
•Implementing an ongoing human rights due diligence program
•Enabling climate change adaptation opportunities and building climate change resilience
•Promoting social dialogue and meaningful engagement with key stakeholders
•Engaging with governments and regulators for public funding and to support economic and social policies for carbon reduction, clean energy and fair transition
•Maintaining access to global capital and responsible investment opportunities.
69
| Management report | ||
Products
Information regarding segment sales by geographic area and sales by type of products can be found in note 3 to ArcelorMittal’s consolidated financial statements.
ArcelorMittal has a high degree of product diversification relative to other steel companies. Its plants manufacture a broad range of finished and semi-finished steel products with different specifications, including many complex and highly technical and sophisticated products that it sells to demanding customers for use in high-end applications.
ArcelorMittal’s principal steel products include:
•semi-finished flat products such as slabs;
•finished flat products such as plates, hot- and cold-rolled coils and sheets, hot-dipped and electro-galvanized coils and sheets, tinplate and color coated coils and sheets;
•semi-finished long products such as blooms and billets;
•finished long products such as bars, wire-rods, structural sections, rails, sheet piles and wire-products; and
•seamless and welded pipes and tubes.
ArcelorMittal’s main mining products include iron ore lump, fines, concentrate, pellets and sinter feed.
Steel-making process
Historically, primary steel producers have been divided into “integrated” and “mini-mill” producers. Over the past few decades, a third type of steel producer has emerged that combines the strengths of both the integrated and the mini-mill processes. These producers are referred to as “integrated mini-mill producers”.
Integrated steel-making
In integrated steel production, coal is converted to coke in a coke oven, and then combined in a blast furnace with iron ore and fluxes to produce hot metal. This is then combined with scrap in a converter, which is also referred to as basic oxygen furnace ("BOF"), to produce raw or liquid steel. Once produced, the liquid steel is metallurgically refined and then transported to a continuous caster for casting into a slab, bloom or billet or cast directly as ingots. The cast steel is then further shaped or rolled into its final form. Various finishing or coating processes may follow this casting and rolling. Recent modernization efforts by integrated steel producers have focused on cutting costs through eliminating unnecessary production steps, reducing manning levels through automation, and decreasing waste generation. Integrated mills are substantially dependent upon iron ore and coking coal which, due to supply and demand imbalances, shortening of contract durations and the linkage
between contract prices and spot prices, have been characterized by price volatility in recent years.
Mini-mills
A mini-mill employs an electric arc furnace to directly melt scrap and/or scrap substitutes such as direct reduced iron, thus entirely replacing all of the steps up to and including the energy-intensive blast furnace. A mini-mill incorporates the melt shop, ladle metallurgical station, casting, and rolling into a unified continuous flow. The quality of steel produced by mini-mills is primarily limited by the quality of the metallic raw materials used in liquid steel-making, which in turn is affected by the limited availability of high-quality scrap or virgin ore-based metallics for use in the electric arc furnaces. Mini-mills are substantially dependent on scrap, which has been characterized by price volatility in recent years, and the cost of electricity.
Integrated mini-mills
Integrated mini-mills are mini-mills that produce their own metallic raw materials consisting of high-quality scrap substitutes, such as DRI. Unlike most mini-mills, integrated mini-mills are able to produce steel with the quality of an integrated producer, since scrap substitutes, such as DRI, are derived from virgin iron ore, which has fewer impurities. The internal production of scrap substitutes as the primary metallic feedstock provides integrated mini-mills with a competitive advantage over traditional scrap-based mini-mills by insulating the integrated mini-mills from their dependence on scrap, which continues to be subject to price volatility. The internal production of metallic feedstock also enables integrated mini-mills to reduce handling and transportation costs. The high percentage use of scrap substitutes such as DRI also allows the integrated mini-mills to take advantage of periods of low scrap prices by procuring a wide variety of lower-cost scrap grades, which can be blended with the higher-purity DRI charge. Integrated mini-mills are substantially dependent upon iron ore which, due to supply and demand imbalances, shortening of contract durations and the linkage between contract prices and spot prices, have been characterized by price volatility in recent years. In addition, because the production of direct reduced iron involves the use of significant amounts of natural gas, integrated mini-mills are more sensitive to the price of natural gas also than are mini-mills using scrap.
Key steel products
Steel-makers primarily produce two types of steel products: flat products and long products. Flat products, such as sheet or plate, are produced from slabs. Long products, such as bars, rods and structural shapes, are rolled from blooms and/or billets.
Flat products
Slab. A slab is a semi-finished steel product obtained by the continuous casting of steel or rolling ingots on a rolling mill and cutting them into various lengths. A slab has a rectangular
70
| Management report | ||
cross-section and is used as a starting material in the production process of other flat products (e.g., hot-rolled sheet, plates). Slabs are typically between 200 and 250mm thick.
Hot-rolled sheet. Hot-rolled sheet is minimally processed steel that is used in the manufacture of various non-surface critical applications, such as automobile suspension arms, frames, wheels, and other unexposed parts in auto and truck bodies, agricultural equipment, construction products, machinery, tubing, pipe and guard rails. All flat-rolled steel sheet is initially hot-rolled, a process that consists of passing a cast slab through a multi-stand rolling mill to reduce its thickness to typically between 2 and 25 millimeters, depending on the final product. Flat-rolled steel sheet that has been wound is referred to as “coiled”. Alternatively, hot-rolled sheet can be produced using the thin slab casting and rolling process, where the hot-rolled sheet thickness produced can be less than one millimeter. This process is generally used in a flat products mini-mill, but some integrated examples exist as well.
Cold-rolled sheet. Cold-rolled sheet is hot-rolled sheet that has been further processed through a pickle line, which is an acid bath that removes scaling from steel’s surface, and then successively passed through a rolling mill without reheating until the desired gauge, or thickness, and other physical properties have been achieved. Cold-rolling reduces gauge and hardens the steel and, when further processed through an annealing furnace and a temper mill, improves uniformity, ductility and formability. Cold-rolling can also impart various surface finishes and textures. Cold-rolled steel is used in applications that demand higher surface quality or finish, such as exposed automobile and appliance panels. As a result, the prices of cold-rolled sheet are higher than the prices of hot-rolled sheet. Typically, cold-rolled sheet is coated or painted prior to sale to an end-user.
Coated sheet. Coated sheet is generally cold-rolled steel that has been coated with zinc, aluminum or a combination thereof to render it corrosion-resistant and to improve its paintability. Hot-dipped galvanized, electro-galvanized and aluminized products are types of coated sheet. These are also the highest value-added sheet products because they require the greatest degree of processing and tend to have the strictest quality requirements. Coated sheet is used for many applications, often where exposed to the elements, such as automobile exteriors, major household appliances, roofing and siding, heating and air conditioning equipment, air ducts and switch boxes, as well as in certain packaging applications, such as food containers.
Plates. Plates are produced by hot-rolling either reheated slabs or ingots. The principal end uses for plates include various structural products such as for bridge construction, storage vessels, tanks, shipbuilding, line pipe, industrial machinery and equipment.
Tinplate. Tinplate is a light-gauge, cold-rolled, low-carbon steel usually coated with a micro-thin layer of tin. Tinplate is usually between 0.14 millimeters and 0.84 millimeters thick and offers particular advantages for packaging, such as strength, workability, corrosion resistance, weldability and ease in decoration. Food and general line steel containers are made from tinplate.
Electrical steels. There are two principal types of electrical steel: non-grain oriented fully processed steels and non-grain oriented semi-processed steels. Non-grain oriented fully processed steels are iron-silicon alloys with varying silicon contents and have similar magnetic properties in all directions in the plane of the sheet. They are principally used for motors, generators, alternators, ballasts, small transformers and a variety of other electromagnetic applications. A wide range of products, including a newly developed thin gauge material for high frequency applications, are available. Non-grain oriented semi-processed steels are largely non-silicon alloys sold in the not finally annealed condition to enhance punchability. Low power loss and good permeability properties are developed after final annealing of the laminations.
Long products
Billets/Blooms. Billets and blooms are semi-finished steel products. Billets generally have square cross-sections up to 180 millimeters by 180 millimeters, and blooms generally have square or rectangular cross-sections greater than 180 millimeters by 180 millimeters. These products are either continuously cast or rolled from ingots and are used for further processing by rolling to produce finished products like bars, wire rod and sections.
Bars. Bars are long steel products that are rolled from billets. Merchant bar and reinforcing bar (rebar) are two common categories of bars. Merchant bars include rounds, flats, angles, squares, and channels that are used by fabricators to manufacture a wide variety of products such as furniture, stair railings, and farm equipment. Rebar is used to strengthen concrete in highways, bridges and buildings.
Special bar quality (“SBQ”) steel. SBQ steel is the highest quality steel long product and is typically used in safety-critical applications by manufacturers of engineered products. SBQ steel must meet specific applications’ needs for strength, toughness, fatigue life and other engineering parameters. SBQ steel is the only bar product that typically requires customer qualification and is generally sold under contract to long-term customers. End-markets are principally the automotive, heavy truck and agricultural sectors, and products made with SBQ steel include axles, crankshafts, transmission gears, bearings and seamless tubes.
71
| Management report | ||
Wire rods. Wire rod is ring-shaped coiled steel with diameters ranging from 5.5 to 42 millimeters. Wire rod is used in the automotive, construction, welding and engineering sectors.
Wire products. Wire products include a broad range of products produced by cold reducing wire rod through a series of dies to improve surface finish, dimensional accuracy and physical properties. Wire products are used in a variety of applications such as fasteners, springs, concrete wire, electrical conductors and structural cables.
Structural sections. Structural sections or shapes are the general terms for rolled flanged shapes with at least one dimension of their cross-section of 80 millimeters or greater. They are produced in a rolling mill from reheated blooms or billets. Structural sections include wide-flange beams, bearing piles, channels, angles and tees. They are used mainly in the construction industry and in many other structural applications.
Rails. Rails are hot-rolled from a reheated bloom. They are used mainly for railway rails but they also have many industrial applications, including rails for construction cranes.
Seamless tubes. Seamless tubes have outer dimensions of approximately 25 millimeters to 508 millimeters. They are produced by piercing solid steel cylinders in a forging operation in which the metal is worked from both the inside and outside. The final product is a tube with uniform properties from the surface through the wall and from one end to the other.
Steel sheet piles. Steel sheet piles are hot rolled products used in civil engineering for permanent and temporary retaining structures. Main applications are the construction of quay walls, jetties, breakwaters, locks and dams, river reinforcements and channel embankments, as well as bridge abutments and underpasses. Temporary structures like river cofferdams are made with steel sheet piles. A special combination of H beams and steel sheet piles are sometimes used for the construction of large container terminals and similar port structures.
Welded pipes and tubes. Welded pipes and tubes are manufactured from steel sheet that is bent into a cylinder and welded either longitudinally or helically.
Mining products
ArcelorMittal’s principal mining products for steel operations include iron ore and metallurgical coal (on December 7, 2023, ArcelorMittal divested its coal operations following the sale of ArcelorMittal Temirtau).
ArcelorMittal’s mining and raw materials supply strategy consists of:
•Acquiring and expanding production of raw materials, in particular iron ore but as well some other specific
products crucial to the Company's steel operations such as refractory and lime (in partnership with companies who are leaders in these domains), while keeping the cost under control;
•Exploiting its global purchasing reach, pursuing the lowest unit price available based on the principles of total cost of ownership and value-in-use through aggregated purchasing, supply chain and consumption optimization; and
•Leveraging local and low cost advantages on a global scale.
ArcelorMittal’s priority is to optimize output and production from its existing sources focused mainly on iron ore.
ArcelorMittal is a party to contracts with other mining companies that provide long-term, stable sources of raw materials. The Company plans to extend its largest iron ore supply contracts with Vale (which currently expires in 2024) to cover its requirements for the EU units and for its Tubarao steelmill (ArcelorMittal Pecém, ArcelorMittal Brasil, being covered by a specific long-term agreement). ArcelorMittal's principal international iron ore suppliers include Vale in Brazil, Luossavaara-Kirunavaara AB in Sweden, Baffinland Iron Mines Corporation ("BIM") in Canada, IOC (Rio Tinto Ltd.) in Canada, Samarco in Brazi, Anglo-American (Sishen in South Africa and Minas Rio in Brazil), Metinvest in Ukraine.
ArcelorMittal’s principal coal suppliers include the BHP Billiton Mitsubishi Alliance (“BMA”), Anglo Coal, Peabody, Glencore in Australia, Contura and Warrior in the United States, Teck Coal in Canada, and JSW in Poland.
ArcelorMittal believes that its portfolio of mining assets and long-term supply contracts can play an important role in preventing disruptions in the production process. (see “Operating and financial review—Key factors affecting results of operations—Raw materials”).
Iron ore
ArcelorMittal sources significant portions of its iron ore needs from its own mines in Ukraine, Bosnia, Canada, Mexico, Liberia and Brazil, and, before the sale of ArcelorMittal Temirtau on December 7, 2023, in Kazakhstan. Several of ArcelorMittal’s steel plants also have in place off-take arrangements with suppliers located near its production facilities.
For further information on Mining segment iron ore production, see “Operating and financial review—Operating results”. For further information on each of ArcelorMittal’s principal iron ore mining operations including total mining production of iron ore and coal, see “Properties and capital expenditures—Property, plant and equipment” and "Properties and capital expenditures
72
| Management report | ||
—Property, plant and equipment— Mineral reserves and resources".
Metallurgical coal
As with iron ore, prior to sale of ArcelorMittal Temirtau on December 7, 2023, ArcelorMittal sourced a percentage of its metallurgical coal from its own coal mines in Kazakhstan. The Company’s mines in Kazakhstan supplied substantially all of the requirements for the steelmaking operations at ArcelorMittal Temirtau.
For further information on metallurgical coal mining production, see "—Property, plant and equipment— Mineral reserves and resources".
Other raw materials and energy
Metallics (scrap)
ArcelorMittal procures the majority of its scrap requirements locally and regionally, optimizing transport costs. Typically, scrap purchases are made in the spot market on a monthly/weekly basis or with short-term contracts.
Alloys
ArcelorMittal purchases its requirements of bulk and noble alloys from a number of global, regional and local suppliers on contracts that are linked to generally-accepted indices or negotiated on a quarterly basis.
Base metals
The majority of the Company’s base metal needs, including zinc, tin, aluminum and nickel are purchased under annual volume contracts. Pricing is based on the market-accepted indices. Material is sourced from both local and global producers.
Electricity
ArcelorMittal generally procures its electricity through tariff-based systems in regulated areas such as parts of the United States and South Africa, through direct access to markets in most of its European mills or through bilateral contracts elsewhere. The duration of these contracts varies significantly depending on the area and type of arrangement.
For integrated steel mills, plant off-gases from various process steps are utilized to generate a significant portion of the plant’s electricity requirements and lower the purchase volumes from the grid. This is either produced by the plant itself or with a partner in the form of a co-generation contract.
Natural gas
ArcelorMittal procures much of its natural gas requirements for its Canadian and Mexican operations from the natural gas spot market or through short-term contracts entered into with local suppliers, with prices fixed either by contract or tariff-based spot market prices. For its European and Ukrainian operations, with a
contractual mix of “all-in” bilateral supply and direct access to the market, ArcelorMittal sources its natural gas requirements under the prevailing mix of oil-based pricing systems or European short term/spot-indexed supply contracts. The remainder of ArcelorMittal’s natural gas consumption is generally sourced from regulated markets.
Industrial gases
Most of ArcelorMittal’s industrial gas requirements are produced and supplied under long-term contracts with various suppliers in different geographical regions.
Coke
ArcelorMittal has its own coke-making facilities at most of its integrated mill sites, including in Bosnia, Canada, Mexico, Brazil, Spain, France, Germany, Belgium, Poland, South Africa and Ukraine. While ArcelorMittal meets most of its own coke requirements, certain of ArcelorMittal’s operating subsidiaries buy coke from mostly domestic or regional sources to optimize cost savings from transport efficiencies, and certain of its subsidiaries occasionally sell excess coke at market prices to third parties. The remainder of the spot purchases of coke are sourced from China, the U.S., Japan, Australia and Colombia.
Shipping
ArcelorMittal Shipping ("AM Shipping") provides ocean transportation solutions to ArcelorMittal’s manufacturing subsidiaries and affiliates. AM Shipping determines cost-efficient and timely approaches for the transport of raw materials, such as iron ore, coal, coke and scrap, and semi-finished and finished products. AM Shipping is also responsible for providing shipping services to the Company’s sales organizations. It provides complete logistics solutions from plants to customer locations using various modes of transport.
In 2023, AM Shipping arranged transportation for approximately 49.19 million tonnes of raw materials and about 7.31 million tonnes of finished products. The key objectives of AM Shipping are to ensure cost-effective and timely shipping services to all units. AM Shipping also acts as the coordinator for Global Chartering Ltd., the Company's joint venture with DryLog Ltd., a Monaco based shipping company.
Purchasing
ArcelorMittal has implemented a global procurement process for its major procurement requirements, including raw materials, capital expenditure items, energy and shipping. ArcelorMittal’s centralized procurement teams also provide services such as optimization of contracts and the supply base, logistics and optimizing different qualities of materials suitable for different plants and low cost sourcing.
By engaging in these processes, ArcelorMittal seeks to benefit from economies of scale in a number of ways, including by
73
| Management report | ||
establishing long-term relationships with suppliers that sometimes allow for advantageous input pricing, pooling its knowledge of the market fundamentals and drivers for inputs and deploying specialized technical knowledge. This enables ArcelorMittal to achieve a balanced supply portfolio in terms of diversification of sourcing risk in conjunction with the ability to benefit from a number of its own raw materials sources.
ArcelorMittal has institutionalized the “total cost of ownership” methodology as its way of conducting its procurement activities across the Group. This methodology focuses on the total cost of ownership for decision making, with the goal of lowering the total cost of production through minimization of waste, improved input material recovery rates and higher rates of recycling.
Sustainability principles are embedded into ArcelorMittal general procurement conditions, purchasing contracts, in the onboarding process and supplier performance management in the area of safety, health, environment, human rights, and employee relations.
Sales and marketing
In 2023, ArcelorMittal sold 55.6 million tonnes of steel products.
Sales
The majority of steel sales from ArcelorMittal are destined for domestic markets. For these domestic markets, sales are usually approached as a decentralized activity that is managed either at the business unit or at the production unit level. For certain specific markets, such as automotive, there is a global approach offering similar products manufactured in different production units around the world. In instances where production facilities are in relatively close proximity to one another, and where the market requirements are similar, the sales function is aggregated to serve a number of production units. In the EU and in South America, ArcelorMittal owns a large number of service and distribution centers. Depending on the level of complexity of the product, or the level of service required by the customer, the service center operations form an integral part of the supply chain to ArcelorMittal’s customers. Distribution centers provide access to ArcelorMittal’s products to smaller customers that cannot or do not want to buy directly from the operating facility.
The Group prefers to sell exports through its international network of sales agencies to ensure that all ArcelorMittal products are presented to the market in a cost-efficient and coordinated manner.
Sales are executed at the local level, but are conducted in accordance with the Group’s sales and marketing and code of conduct policies.
For some global industries with customers in more than one of the geographical areas that ArcelorMittal serves, the Company has established customized sales and service functions. This is particularly the case for the automotive industry. Sales through this channel are coordinated at the Group level with respect to contract, price and payment conditions.
Marketing
Marketing follows the sales activity very closely and is by preference executed at the local level. In practice, this leads to a focus on regional marketing competencies, particularly where there are similarities among regional markets in close geographical proximity. Local marketing provides guidance to sales on forecasting and pricing. At the global level, the objective is to share marketing intelligence with a view towards identifying new opportunities, either in new products or applications, new product requirements or new geographical demand. Where a new product application is involved, the in-house research and development unit of ArcelorMittal is involved in developing the appropriate products.
An important part of the marketing function at ArcelorMittal is to develop short-range outlooks that provide future perspectives on the state of market demand and supply. These outlooks are shared with the sales team in the process of finalizing the sales strategy for the immediate future and with senior management when market conditions call for production adjustments.
Globally, sales and marketing activities are coordinated to ensure a harmonized approach to the market. The objective is to provide similar service experiences to all customers of ArcelorMittal in each market.
Intellectual property
ArcelorMittal owns and maintains a patent portfolio covering processes and steel products, including uses and applications that it creates, develops and implements in territories throughout the world. Such patents and inventions primarily relate to steel solutions with new or enhanced properties, as well as new technologies that generate greater cost-efficiencies.
ArcelorMittal also owns trademarks, both registered and unregistered, relating to the names and logos of its companies and the brands of its products. ArcelorMittal has policies and systems in place to monitor and protect the confidentiality of its know-how and proprietary information. The Company applies a general policy for patenting selected new inventions, and its committees organize an annual patent portfolio screening by individuals from the Company’s R&D and business sectors in order to optimize the global efficiency of the Company’s patent portfolio. The Company’s patent portfolio includes more than 12,870 patents and patent applications, mostly recent and medium-term, for more than 831 patent families, with 103 inventions newly-protected in 2023. Because of this constant
74
| Management report | ||
innovation, the Company does not expect the lapse of patents that protect older technology to materially affect current revenue.
In addition to its patent portfolio, ArcelorMittal is constantly developing technical know-how and other unpatented proprietary information related to design, production process, decarbonization solutions for steel production and use of high quality steel products, leading to development of new applications or to improvement of steel solutions proposed to its customers, such as the ones aiming at weight reduction for vehicles. ArcelorMittal has also been granted licenses for technologies developed by third parties in order to allow it to propose comprehensive steel solutions to customers. ArcelorMittal is not aware of any pending lawsuits alleging infringement of others’ intellectual property rights that could materially harm its business.
Government regulations
ArcelorMittal’s operations are subject to various regulatory regimes in the regions in which it conducts its operations. The following is an overview of the principal features of the Company's regulatory regimes, as of December 31, 2023, that affect or are likely to affect the Company's operations.
See also “Introduction—Risk factors and Control” and note 9.3 to ArcelorMittal’s consolidated financial statements.
Environmental laws and regulations
ArcelorMittal’s operations are subject to a broad range of laws, directives and regulations relating to air emissions, surface and groundwater protection, wastewater storage, treatment and discharges, the use and handling of hazardous or toxic materials, waste management, recycling, treatment and disposal practices, the remediation of environmental contamination, the protection of soil, biodiversity and ecosystems or rehabilitation (including in mining).
As environmental laws and regulations in the European Union (“EU”) stemming from the Green Deal and other jurisdictions continue to become more stringent, ArcelorMittal expects to spend substantial resources, including operating and capital expenditures, to achieve or maintain ongoing compliance. Further details regarding specific environmental proceedings involving ArcelorMittal, including provisions to cover environmental remedial activities and liabilities, decommissioning and asset retirement obligations are described in note 9.1 to ArcelorMittal’s consolidated financial statements.
On November 29, 2023, a provisional agreement on the IED was reached between the European Parliament and the Council. The revised Directive will require stricter rules to define limits and permit requirements as well as tighter compliance and control rules with additional enforcement provisions. The
European Commission expects that, once adopted and applied, the new law will more effectively limit polluting emissions from industrial installations. The operators of industrial installations will need to develop transformation plans to achieve the EU's 2050 zero pollution, circular economy, and decarbonization goals. The updated law will focus on resource use performance levels, as well as lower chemical pollution through requirements for a reduced use of toxic chemicals. The new EU Industrial Emissions Portal will enhance public access to information related to industrial emissions. The European Parliament and the Council must formally adopt the revised IED and the new Industrial Emissions Portal Regulation in line with the agreement reached, and then the text will be formally adopted, tentatively by early 2024.
Two different regulations will impact ArcelorMittal in the supply chain, as described below.
First, in Germany, the German Supply Chain Due Diligence Act 2022 ("Lieferkettensorgfaltspflichtengesetz") intends to improve international human rights by defining requirements for companies for responsible supply chain management. This law provides a legal framework for fulfilling human rights due diligence obligations and requires that German companies undertake due diligence in their supply chains and motivate their contract partners abroad to protect internationally recognized human rights and environmental standards. ArcelorMittal implemented measures in 2023 to fully comply with this new regulation which came into force in January 2023, among them, revising policies and designing due diligence systems for its supply chain.
Second, in December 2022, the European Council adopted its negotiating position and general approach on the European Commission’s proposal for the CS3D. In December 2023, a "trialogue" deal on the CS3D was announced. This deal represents a provisional political agreement. One of the main goals of the CS3D is to establish a framework of human rights obligations businesses should respect in their operating environments and value chains by identifying, preventing, mitigating, and accounting for their adverse human rights, and environmental impacts, including by having adequate governance, management systems, and measures in place to these ends. The proposal aims to foster sustainable and responsible corporate behavior throughout global value chains. Companies will be required to identify and, where necessary, prevent, end, or mitigate adverse impacts of their activities on human rights and the environment. ArcelorMittal is preparing itself by putting policies in place and updating its current ones; assessing risks by identifying them with regards to negative impacts on human rights within the Company's value chain; dealing with negative impacts by taking preventive measures to minimize and remedy potential impacts; following up on the
75
| Management report | ||
progress of these measures; communicating the results to its stakeholders and setting up appropriate complaint mechanisms.
Environmental requirements impacting industrial operations are also becoming more stringent in various jurisdictions.
In this regard, in 2023, the Company has approved 26 multi-year projects with identified environmental benefits and involving capital expenditures of $291 million; and 46 projects identified with energy benefits, involving capital expenditures of $1,716 million (including renewable energy projects in India). This also includes 23 projects specifically targeting decarbonization involving capital expenditures of $729 million. Actual capital expenditures on decarbonization initiatives for the year ended December 31, 2023 amounted to $0.2 billion and are expected to increase to between $0.3-$0.6 billion (net of government support) in 2024. See also further information on key environmental projects in “— Sustainable development”, "Introduction — Sustainable development highlights — striving to be a leader in the decarbonization of the steel industry" and “Properties and Capital expenditures — Capital expenditures”.
Air emissions
In Canada, Environment and Climate Change Canada (“ECCC”), a department of the Government of Canada, updated the Base-Level Industrial Emissions Requirements (“BLIERs”) under the federal Air Quality Management System, resulting in the need for substantial investments to comply with emission regulations. Provincial regulations in Ontario and Quebec will also require additional emissions reductions.
In Ontario, the BLIER requires ArcelorMittal Dofasco to install a full coke oven gas desulphurization by the end of December 2025. In 2023, ArcelorMittal Dofasco received an exemption from the ECCC due to its ongoing decarbonization efforts. Currently, on a plant-wide basis, ArcelorMittal Dofasco’s facility is meeting its BLIERs objective. Moreover, the decarbonization project will impact ArcelorMittal Dofasco’s overall Nitrogen Oxide (“NOx”) emissions.
In Quebec, pursuant to the Quebec Clean Air Regulation (Règlement sur l'assainissement de l'atmosphère) regulating air emissions, a post combustion chamber was built at AMLPC’s Contrecoeur East facility. Additionally, the existing canopy hood configuration was modified and put into operation. Further analysis continues for the modification of the canopy at the Contrecoeur West facility to improve dust capturing from 45% to 75%, at an estimated cost of around CAD$6 million.
In 2021, the Ukrainian Parliament adopted the Strategy of the State Environmental Policy of Ukraine for the Period until 2030 and its Action Plan 2023-2025, that set more ambitious targets for pollution reduction and more efficient use of natural resources. The updated Nationally Determined Contribution
(“NDC”) commits the country to reduce GHG emissions until 2030. Plans to conclude coal mining in a socially responsible manner have been launched, accompanied by efforts to improve the energy efficiency of buildings. Ukraine has also made substantial progress in partially liberalizing gas tariffs and reducing environmentally harmful fossil-fuel subsidies. The country is also establishing comprehensive systems to measure progress in implementing environmental policies and making the Ukrainian economy “greener”. International partners, including the OECD, provide policy support to Ukraine's efforts to shift to a greener economy. As part of the IED implementation in Ukraine, the industrial emissions law will introduce a concept of Best Available Techniques (“BATs”), mandatory for application by the largest facilities. Most large industrial companies have been building their investment strategies upon BATs while planning modernization or new construction projects. In October 2023, the Law on the National Register of Emissions and Transfer of Pollutants, determining the maximum openness of information and interaction with the public of enterprises-pollutants, came into force. During 2023, Ukraine adopted several legislative acts related to waste management, including the Law of Ukraine on Waste Management, the Procedure for Development of Regional Waste Management Plans, and the Resolution of the Cabinet of Ministers of Ukraine on Some Issues of Declaration of Waste Status Termination. In addition, the Resolution of the Cabinet of Ministers of Ukraine approved the Procedure of Waste Classification and the National List of Wastes. Waste is classified as a group, subgroup and type of waste taking into account: source of origin of waste; properties that make waste hazardous; presence of components containing hazardous substances in the waste, exceeding the concentration limits of which may lead to the recognition of the waste as hazardous. Regarding implementation, Ukraine approved the procedure for maintaining the National Pollutant Release and Transfer Register, the forms of the Protocol on violation by the operator of the requirements of the legislation regarding registration of pollutant release and transfer and waste, as well as resolutions on consideration of cases on offenses. To provide public information on emissions of pollutants into the atmospheric air, the Ukrainian government approved in January 2023 the procedure for submission and publicizing the enterprise's report on compliance with the conditions of the emission permit and implementation of measures to control compliance with the established maximum permissible emissions of pollutants. On March 28, 2023, Ukraine approved a procedure for the implementation of mandatory automated systems for the control of pollutant emissions. This procedure defines the mechanism for implementing mandatory automated systems for controlling the volume and parameters of pollutant emissions emitted into the atmospheric air by organized stationary sources.
76
| Management report | ||
In March 2023, Ukraine enacted the Law on Amendments to Environmental Monitoring Legislation, expanding environmental information support and introducing administrative penalties for non-compliance. The law, effective six months after the end of martial law (in force since February 24, 2022) resulting from the Russian invasion, mandates monitoring of all environmental components. Simultaneously, the Ukrainian Ministry of Environment is formulating a national plan to reduce emissions from industrial enterprises. Under Ministry Order No. 174 (March 27, 2023), current emission standards for specified industrial processes are under review, considering wartime economic challenges and enterprise modernization difficulties.
Water
On August 7, 2023, Ukraine's Law on Wastewater Disposal and Treatment took effect, aiming to provide citizens with quality sewage services and address environmental concerns. The law aligns with EU standards, specifically Council Directive 91/271/EEC, and outlines requirements for local wastewater regulations. The implementation follows an approved three-year action plan.
In South Africa, the National Water Act of 1998 is undergoing amendment, among which the Draft Water Amendment Bill seeks in particular to further provide for the protection of water source areas, the reallocation of water, and the enactment of regulations and additional controlled activities. The proposed new definition of "waste," which expanded its scope by including any substance with no further use for the manufacturer, was endorsed by the National Council of Provinces Select Committee without public discussion. This definition, along with related terms like "trade in" and "commercial value," was challenged by various parties, including ArcelorMittal South Africa, in a case involving The South African Iron and Steel Institute. The argument was that these definitions should be declared unconstitutional as they were introduced after the parliamentary public participation process had concluded, violating the duty to reintroduce substantial amendments for public input. The Constitutional Court agreed with this perspective.
In March 2022, Mexico published a new standard on wastewater discharges, reducing the maximum permissible limits and introducing new parameters for quarterly monitoring and reporting to the National Water Commission (“CONAGUA”). ArcelorMittal internally defined a preliminary action plan to enhance wastewater quality discharges in line with the requirement of the standard through operational controls. In April 2023, with prior authorization from CONAGUA, ArcelorMittal submitted an action plan outlining milestones to bring wastewater discharges in compliance with the new standard. This program is scheduled to conclude in February 2027, with progress reports required to update on the program’s milestones. Concerning new rules on the measurement for the
use of national waters effective from July 1, 2022, CONAGUA allowed the submission by the end of 2023 of a milestone plan to achieve compliance with these rules. This extension was granted primarily due to a shortage of authorized companies capable of implementing the required changes and installing new continuous monitoring measurement systems. However, considering the technical complexity of the works required on the 60-inch water pipe, an amended milestone program was submitted to CONAGUA to complete the implementation by September 2024.
Mining activities
In Liberia, ArcelorMittal holds a mining concession, inclusive of 250 kilometers of rail and port facilities. The Environment Protection Agency (“EPA”) in Liberia has heightened its enforcement of environmental standards, supported by its dedicated laboratories. The nearby presence of ArcelorMittal Liberia (“AML”) installations has fueled local communities' environmental awareness, increasing pressure on AML from stakeholders.
Guided by the Environmental Protection Agency Act (2002) and the Environment Protection and Management Law (2002), comprehensive Environmental Impact Assessments (“EIAs”) are mandatory for projects affecting the environment. In adherence to these regulations, ArcelorMittal has developed an Environmental and Social Standards Manual ("SSM"), approved by the Liberian EPA, governing all activities within the existing Liberia mining project. The SSM is regularly updated with external consultants' input, and the SSM surpasses local environmental requirements. ArcelorMittal's mining concession falls within the purview of the National Forestry Reform Law (2006), the National Forestry Law (2000), and the Act Creating the Forestry Development Authority (2000). These laws govern both commercial and community use of forests, and some territories within the concession are subject to these regulations. The Community Rights Law regarding Forest Lands (2009) has notably empowered communities in forest management. The Phase 2 project (“Concentrator Ore Project”) in Liberia showcases ArcelorMittal's environmental commitment, with a substantial environmental offset program and an extensive mine closure plan, potentially exceeding $100 million. The stringent conditions attached to existing environmental permits reflect the Company's dedication to sustainable operations. In 2023, all environmental permits were renewed, covering Yuelliton mining activities, TSF construction, a new sewage plant, and the rehabilitation of rail and port facilities, has elevated requirements for sediment control, water discharge, and biodiversity conservation. In tandem, ArcelorMittal Liberia has initiated a climate change risk assessment and is participating in the TNFD studies. These initiatives underscore the Company's proactive approach to potential environmental impacts and its commitment to future-proofing operations.
77
| Management report | ||
In Mexico, due to the recent reform of the National Mining Regulation ("NMR"), several significant changes were included in the regulation, which includes changes in relevant environmental laws, the national water law, and waste management law. These changes are primarily related to the possibility of using water within the mining process for iron ore transportation. Constitutional claims against the NMR were submitted by ArcelorMittal México, and final rulings are expected over the course of 2024.
In Brazil, regulations from the National Mining Agency (“ANM”) primarily aim to simplify procedures for requesting research or mining, revising existing standards concerning mining companies’ obligations related to the safety of mining dams, including monitoring activities, compliance and operability assessments, and dam emergency action plans. Additionally, the Mine Closure Plan and decommissioning requests (ANM Resolution No. 68, April 30, 2021) were standardized. As from January 2023, the National Mining Agency expanded the range of infractions and associated fines, now calculated as a percentage of mineral production without limitation. Furthermore, environmental standards for tailings disposal and dams have become more stringent.
In 2023, noteworthy developments in Brazil include: (i) Federal Law No. 11.310/2022, addressing inspection activities and federal governance of the National Dam Safety Policy, establishing the Interministerial Dam Safety Committee; (ii) Ordinance No. 525/2023 of the Ministry of the Environment and Climate Change, establishing the National Commission for Federal Extractive Reserves – CONAREX; and (iii) Ordinance No. 61/2023 of the Ministry of Mines and Energy, establishing the Management Protocol and Crisis Management Committee for the prevention and safety of electricity, fuel, and mining installations.
The State of Minas Gerais in Brazil adopted several norms regarding dam safety in 2023. These include the State Policy for People Affected by Dams, guidelines for presenting the Emergency Action Plan, rules for accrediting independent external auditors for technical safety audits under the State Policy for Dam Safety, as well as the process for registering and classifying dams subject to the State Policy for Dam Safety. Notable updates in 2023 include Resolution No. 3.181/2022, which established guidelines for presenting the Emergency Action Plan for dams covered by Law No. 23.291/2019. It also determined procedures for those responsible for these dams during emergencies and outlined measures to be taken in the event of an incident, accident, or rupture.
In Canada, the Company is in negotiations for depollution attestations applicable to AMMC facilities. Specifically in the mining sector, some objectives for dust, NOx, and Sulfur Dioxide
("SO2") were identified, and a draft agreement was prepared, but there has been no further progress as of February 2024.
In the province of Quebec, the renewal requests for depollution attestations for AMMC's Mont Wright operations, Fire Lake, and Port-Cartier pellet plant are currently in the analysis stage by environmental authorities. They aim to apply the same standards to all mines. These permits establish targets for water, air, soil, and waste management, as well as the monitoring and reporting frequencies and requirements for each target.
Furthermore, the Contrecoeur West depollution attestation was scheduled to be renewed in 2023; the renewal application was filed in June 2023, awaiting further input from the Government. Also, starting January 1, 2024, royalty rates will be payable for contaminated soils for landfilling (CAD$10/t) or treating (CAD$5/t).
Quebec’s government expanded the scope of the regulation related to compensation for adverse effects on wetlands and bodies of water. It will apply to projects conducted in Port-Cartier, Mont Wright, and Fire Lake and might extend to AMLPC’s future projects.
Also in Quebec, the regulation respecting royalties payable for the use of water was amended to increase, as of January 1, 2024, the royalty rates from CAD$2.5 per million liters (“CAD$/ML”) of water to CAD$35/ML, and from CAD$70/ML to CAD$ 150/ML. The applicable rate will vary according to the use of the resource. These rates will then be indexed by 3% per year.
The ECCC, the Iron Ore Company of Canada, and AMMC have entered into an environmental performance agreement effective from January 5, 2018 until June 1, 2026. The agreement is designed to facilitate the implementation of BLIERs developed for the iron ore pellet sector. Specifically, it outlines the composition, timelines, and objectives of the NOx Working Group. The agreement aims to ensure compliance with BLIERs limits for Particulate Matter ("PM") 2.5 and SO2 while also overseeing the implementation of the approach to studying NOx.
Climate change
In December 2015, 195 countries participating in the United Nations Framework Convention on Climate Change (“UNFCC”), at its COP21 held in Paris, adopted a global agreement on the reduction of climate change (the “Paris Agreement”). The Paris Agreement sets a goal to limit the increase in the global average temperature to well below 2 degrees Celsius and pursues efforts to limit the increase to 1.5 degree Celsius, to be achieved by getting global GHG emissions to peak as soon as possible. The Paris Agreement consists of two elements: first, a legally binding commitment by each participating country to set an emissions reduction target, referred to as nationally determined
78
| Management report | ||
contributions (“NDCs”), with a review of the NDCs that could lead to updates and enhancements every five years beginning in 2023 (Article 4), and second, a transparency commitment requiring participating countries to disclose in full their progress (Article 13). Most countries have issued their intended NDCs.
The United Nations Climate Change Conference COP 28 reached a deal for transitioning away from fossil fuels in energy systems, in a just, orderly, and equitable manner, as well as on tripling renewable energy capacity globally by 2030, speeding up efforts to reduce coal use, and accelerating technologies such as CCUS that can decrease emissions of hard-to-abate industries. By 2025, countries must present their updated NDCs aimed at being aligned with the 1.5 degree Celsius limit.
On July 14, 2021, the European Commission adopted the Fit for 55 Package with a view to adapting climate and energy legislation to the 2030 ambition set by the European Climate Law. The EU also committed internationally to its 55% reduction target except for the Energy Taxation Directive (“ETD”), for which the legislative process has not yet been completed. Certain initiatives of the Fit for 55 Package have been adopted as of December 31, 2023, amending several pieces of legislation that were already applicable to ArcelorMittal, such as the EU Emissions Trading Scheme (“EU-ETS”), the Renewable Energy Directive (“RED”), the Energy Efficiency Directive (“EED”), and Energy Taxation Directive ("ETD") and has newly introduced the CBAM. Several implementation rules stemming from the ETS and CBAM are currently under preparation. See also “Risk Factors and Control—Laws and regulations restricting emissions of greenhouse gases could force ArcelorMittal to incur increased capital and operating costs and could have a material adverse effect on ArcelorMittal’s results of operations, financial condition and reputation.” ArcelorMittal’s activities in the 27 member states of the EU are subject to the EU-ETS, which was launched in 2005 pursuant to European Directive 2003/87/EC, relating to GHG emissions. The EU-ETS is based on a cap-and-trade principle, setting a cap on GHG emissions from covered installations that is then reduced over time. Within this cap, companies receive emission allowances which they can sell to or buy from one another as needed. The limit on the total number of allowances available ensures that they have a value. The EU is currently implementing its more stringent Phase 4 EU-ETS for the 2021 to 2030 period in a manner that may require ArcelorMittal to incur additional costs to acquire emissions allowances. In order to achieve the EU 2030 55% reduction ambition, the ETS requires sectors under ETS to reduce their emissions by 62%. As required by the EU Climate Law, the Commission has begun to define a Europe-wide 2040 target, with scientific bodies advising a reduction of 90 to 95% of the GHG emissions. It is expected that the Commission will present a proposal in the first quarter of 2024. Upcoming implementation rules for trading period 4.2 (2026-2030) are
expected to further reduce current benchmark values, although the agreed approach will prevent a large disruptive decrease of the hot metal benchmark. Still, the resulting shortage in free allocation levels would put the European steel industry at a significant disadvantage versus global competition (see note 9.1 to the consolidated financial statements). To prevent such disadvantages, a CBAM has been established for a limited number of sectors, including steel, with a transitional period that started in October 2023 and runs until the end of December 2025, with the initiation of CBAM payments in 2026. In the case of steel, only direct emissions will be covered, at least until 2025, allowing access to indirect cost compensation. On the other hand, free allocation to covered sectors will be progressively phased out as follows: 2026: 97.5%, 2027: 95%, 2028: 90%, 2029: 77.5%, 2030: 51.5%, 2031: 39%, 2032: 26.5%, 2033: 14%, and 0% as from 2034. The agreement does not include a solution for exports but requires the European Commission to prepare an assessment and report by 2025. Several implementing acts to supplement the CBAM regulation are still to be developed.
Moreover, the revised Renewable Energy Directive (“RED”) was adopted in November 2023, increasing the current EU-level target of at least 32% of renewable energy sources in the overall energy mix to at least 42.5% by 2030. Member States must also collectively endeavor to increase the share of energy from renewable sources in the EU’s gross final consumption of energy in 2030 to 45%. The RED aims to deploy renewables across all sectors, particularly in sectors where progress in integrating renewables had been slower.
Additionally, the revised Energy Efficiency Directive (“EED”) raised the EU energy efficiency target, making it binding for EU countries to collectively ensure an additional 11.3% reduction in energy consumption by 2030 compared to the 2020 reference scenario projections. In addition, the revised Land Use, Land Use Change and Forestry (“LULUCF”) sets a target for net GHG removals at 310 million tonnes of CO2 equivalent as a sum of the values of the GHG net emissions and removals by Member States in 2030. The LULUCF sector is connected to all ecosystems and economic activities that rely on the land and the services it provides, thus directly impacting ArcelorMittal’s sites.
Furthermore, the Eco-design for Sustainable Product Regulation (“ESPR”) is a cornerstone in the European Green Deal for more environmentally sustainable and circular products. The new regulation acts as a framework and complements existing product regulation. The regulation is implemented following a workplan through secondary legislation by Delegated Acts. The Joint Research Centre (“JRC”) started in November 2023 a preparatory study on Iron and Steel Products as part of the new Commission work plan. "Digital Product Passports" must ensure
79
| Management report | ||
relevant environmental information is transferred along the supply chain on a need-to-know basis.
GHG emissions regulations
South Africa has a comprehensive and constantly evolving environmental regulatory framework to regulate the carbon footprint of the steel industry in the form of carbon pricing mechanisms and emission thresholds, as well as to address climate change and decarbonization. The Carbon Tax Act to tax carbon dioxide emissions was adopted and came into effect in 2019. Following the Taxation Laws Amendments Act 20 of 2022, the Carbon Tax Act 15 of 2019 was amended in January 2023. The amendment includes the annual carbon tax rates per tonne of CO2 equivalent from 2023 until 2030 expressed in Rand (“ZAR”) value. The rates of tax may be adjusted by the amount announced by the Minister in the National annual budget contemplated in section 27(1) of the Public Finance Management Act, 1999 (Act No.1 of 1999) in 2025 and thereafter at three-year intervals to consider the impact of exchange rate movements on the comparability of the rate to global carbon pricing. Although, some aspects of the carbon tax were clarified, uncertainty remains in terms of the phase-down pace of tax-free allowances. On October 24, 2023, the Climate Change Bill (the “Bill”) successfully passed through the National Assembly (“NA”) and has now been forwarded to the National Council of Provinces (“NCOP”) for concurrence. A public commenting process will follow before the Bill undergoes parliamentary debate, allowing for potential amendments if deemed necessary. The final step involves the Bill's approval by both the NA and the NCOP before it reaches the President for assent, ultimately leading to its enactment. The timing is dependent on the NCOP concurrence process, and the timeline may be impacted by the National and Provincial elections in South Africa. During the NA review process, the NA included notable additions to the Bill, including specific offenses, outlining penalties such as fines or imprisonment upon conviction for failure to submit required information or for providing falsified data in adherence to the Climate Change reporting requirements. Furthermore, the NA integrated critical aspects such as key concepts and definitions, the regulation of powers and functions of the Presidential Climate Commission (“PCC”), and the establishment of a finance mechanism to support South Africa’s climate change response.
ArcelorMittal South Africa has been granted a carbon budget for the extended voluntary phase covering the five-year period from January 2021 to December 2025. The mandatory carbon budget allowances are currently in the developmental phase under the auspices of the Department of Forestry, Fisheries, and the Environment (“DFFE”). Implementation of the Carbon Budget is anticipated to commence in January 2026, aligning with the initiation of Carbon Tax Phase II. Further clarity on these matters is anticipated following the formal enactment of the Climate
Change Bill. The National Treasury is actively engaged in formulating the design framework to address future penalties associated with non-compliance to the carbon budget allocations.
South Africa has enacted the National Environmental Laws Amendment Bill (“NEMLAA4”), which was launched on June 24, 2022, and brought into operation on June 30, 2023. Notable changes introduced by NEMLAA4 include modifications to the rectification process prescribed under section 24G of the National Environmental Management Act (“NEMA”) and section 22A of the National Environmental Management: Air Quality Act 39 of 2004 (“NEMAQA”) concerning the commencement of activities without the required authorizations and licenses in place. These changes encompass mandatory stoppage, the extension of enforcement powers, and the potential extension of the requirement for financial provisioning to high-impact industries.
Following the update of South Africa's NDC regarding its GHG emission contributions as per the Paris Agreement commitments, the final Just Transition Framework for South Africa was released in July 2022. This framework aims to guide the transition away from fossil-fuel-based energy towards a low-emissions and climate-resilient economy. The steel sector has been identified as an industry significantly affected by the transition away from coal. Additionally, there are several hydrogen and green hydrogen policy developments underway. South Africa's next NDC update is due in 2025.
The following climate change developments are not part of legislation or regulations but are linked to the NDC and National Development Plan (“NDP”): The South African Just Energy Transition Investment Plan (“JET IP”) for the five-year period 2023-2027, launched in 2022, lays out the scale of need and the investments required to achieve the decarbonization commitments indicated in the South African NDC. This provides a perspective on the country’s fair contribution to the Paris Agreement and the pace at which South Africa intends to reduce its GHG emissions.
The South African Department of Mineral Resources and Energy has released the South African Renewable Energy Masterplan (SAREM) for stakeholder input, aiming to align with National Development Plan objectives. SAREM focuses on industrializing the renewable energy value chain, fostering inclusive participation in the energy transition, and contributing to economic revival.
In Canada, carbon pricing regulations have become increasingly stringent. For example, the Order Amending Schedule 3 to the GHG Pollution Pricing Act: Statutory Orders and Regulation (“SOR”)/2022-210 introduces amendments to set the royalty amounts per tonne of GHG emitted for the years 2023 to 2030.
80
| Management report | ||
As from January 1, 2022, ArcelorMittal Dofasco and Ontario industries have been regulated on carbon pricing under the Ontario Emissions Performance Standards (“EPS”), transitioning out of the Federal output-based pricing system (“OBPS”). The Federal government intends to ensure provincial GHG programs are rigorous enough to meet Federal carbon reduction targets (40 - 45% lower than in 2005 by 2030).
In March 2023, Ontario published changes to the carbon tax between 2023 and 2030, which includes (i) changes to carbon pricing from CAD$50/t CO2e to CAD$65/t in 2023 and increasing CAD$15/t annually up to CAD$170/t CO2e by 2030, and (ii) changes to the stringency factors: -2.4% in 2023 and -1.5% annually from 2024 to 2030.
As part of the Ontario EPS program, the Ontario provincial authority signaled a recognition of the significant transformation in the steel sector as some large steel producers are expected to make the transition to clean steel production in the coming years. In consideration of the changes at these facilities, stringency factors would be set equal to one for the transition period up to 2030; thus, exemptions will be considered for first movers in the steel sector. Final details will be provided before the Director's official issuance notice in the first quarter of 2024.
The development of an approach to address facility-specific emissions targets for the innovative DRI facilities has been completed, often based on three years of performance following the start-up of a facility. Detailed discussions concluded in 2023, and the final Director’s order is expected in the first quarter of 2024. The proposed approach to address ArcelorMittal Dofasco’s decarbonization program during the transformation periods has also been developed. The final Director’s order is expected in March 2024. Compliance is to be achieved by reducing GHGs as well as additional first-mover considerations by the regulator.
In Quebec, the 2030 Plan for a Green Economy sets a 37.5% GHG emission reduction target by 2030 compared with 1990 levels, with the goal that Quebec reaches carbon neutrality by 2050. Separate consultations by the government of Quebec are underway with large GHG emitters regarding the cap-and-trade program regulation for the second and subsequent compliance periods from 2021 to 2030. Quebec completed the consultations for the 2021 to 2023 compliance period. For the period 2024 to 2030, negotiations are still in progress to minimize the financial impact of regulatory changes on ArcelorMittal’s operating subsidiaries in Canada.
Furthermore, the Quebec Regulation amending the Regulation respecting the cap-and-trade system for GHG emission rights sets out the rules for free allocations for the period 2024-2030, including a reduction in the level of free allocation, accompanied by a mechanism for consigning part of the emission units
resulting from the reduction in free allocation. The proceeds from the auctioning of these emission units will be earmarked on behalf of these companies, to accelerate their investments in their climate transition. The regulation also clarifies the registration process for the GHG Cap-and-Trade System (“SPEDE”), as well as the terms and conditions of the Minister's auctions and private sales.
In Quebec, at the DRI reduction plant, a test was conducted to evaluate the possibility of replacing the use of natural gas with green hydrogen in the process. In the first test, 6.8% of the natural gas was replaced by green hydrogen over a 24-hour period, contributing to a significant reduction in CO2 emissions. AMLPC will evaluate the possibility of conducting further tests by increasing the use of hydrogen at its reduction plant.
As part of Canada’s climate plan to reduce emissions and accelerate the use of clean technologies and fuels, in June 2022, the final Clean Fuel Regulations (“CFR”) under the Canadian Environmental Protection Act 1999 (“CEPA”) were registered, bringing the 2017 Clean Fuel Standard (“CFS”) into law. It came into force upon registration, except for two sections repealing the pre-existing Renewable Fuels Regulations (“RFRs”), which will come into force on September 30, 2024. The CFS establishes lifecycle carbon intensity requirements separately for liquid, gaseous, and solid fuels that are used in transportation, industry, and buildings. This performance-based approach, intended to incentivize innovation, development, and use of a broad range of lower-carbon fuels, alternative energy sources, and technologies, only requires liquid fuel (e.g., gasoline, diesel, home heating oil) suppliers to reduce the carbon intensity of their fuels. Gaseous and solid fossil fuels have been eliminated from the scope. The Regulations will increase production costs for primary suppliers, which would increase prices for liquid fuel consumers.
In 2022, Brazil launched Resolution No. 433/2021 establishing the National Policy of the Judiciary for the Environment, establishing the monitoring of climate actions and mandating that indemnities for environmental damages include the impact on global climate change, as well as diffuse damage to affected peoples and communities. In September 2023, the Plenary of the Brazilian National Council of Justice approved a Normative Act recommending the adoption of a new protocol for the trial of environmental damage actions by Brazilian courts. This aims to enhance the effectiveness of judgments in environmental cases, providing guidelines on the use of evidence obtained by sensors and satellites. The focus is on preventing and combating environmental externalities, particularly concerning climate change and collective damage.
Brazil has progressed in the regulation of the carbon market by establishing the Interministerial Committee on Climate Change (“CIM”) through Decree No. 11.550/2023, published in June
81
| Management report | ||
2023. This committee monitors the implementation of actions and public policies within the federal executive branch related to the National Policy on Climate Change (“PNMC”). The decree revoked the former National System for the Reduction of Emissions of Greenhouse Gases (“SINARE”), previously established by Decree No. 11.075/2022.
A regulatory proposal to implement the National Carbon Market passed a vote in the senate on October 4, 2023, subject to approval by the parliament. The proposal is based on a minimum emissions threshold rather than specific sectors. Installations emitting above 10 thousand tonnes of CO2 per year per source or installation must report their emissions. Installations emitting more than 25 thousand tonnes of CO2 per year, in addition to mandatory reporting, must carry out periodic reconciliation of obligations. The regulation would apply equally to all sectors of the economy, except for primary agricultural production which was expressly excluded.
In Brazil, noteworthy standards released in 2023 include: (i) NBR ISO 14090:2023, a technical standard on adaptation to climate change, covering principles, requirements, and guidelines; (ii) Federal Resolution No. 1/2023, approving the Internal Regulations of the CIM; (iii) Decree No. 11.548/2023 establishing the national commission for reducing GHG emissions from deforestation and forest degradation, conservation of forest carbon stocks, sustainable management of forests, and increasing forest carbon stocks (“REDD+”); and (iv) Ordinance No. 56/2022, providing for the Decarbonization Credit (“CBIO”) bookkeeping service.
The state of Ceará published the Law No. 18,458/2023, instituting the state policy for green, sustainable hydrogen and its derivatives within the scope of the state of Ceará and creating the state council for governance and development of the production of green, sustainable hydrogen and its derivatives.
Argentina's goal is to achieve carbon neutrality by 2050, and it has outlined its NDCs compromises for 2030, reinforcing them through participation in COP 28. During 2023, the Argentinian government established two key strategies: one for the Carbon Trade Market (Resolution N° 385/2023) and another for Hydrogen Economy Development (presented in September 2023, pending official publication).
Additionally, the Renewable Energy Law has set mandatory national targets for electricity consumption from renewable energy sources: 8% in 2018; 12% in 2019/20; 16% in 2021/22; 18% in 2023/24; and 20% in 2025. All energy-intensive industries must contribute to these mandatory national targets, but no significant impact on the Company is expected. Acindar has outlined its renewable energy business plan as follows: (i) for the Villa Constitución Site, targets are being met by
purchasing renewable energy from Cammesa. From 2024 onwards, demand will be contracted through a private Power Purchase Agreement with no additional financial impact; (ii) for the Tablada Site, demand has been provided by a private PPA since 2019, with no additional financial impact; and (iii) the annual Acindar demand is 1.3 Terawatt-hour per year.
In Mexico, the federal government has initiated a comprehensive climate policy review, encompassing the framework for an ETS to fulfil its commitments under the Paris Agreement. On October 1, 2019, the government published rules and principles for an emissions trading system applicable to entities generating more than 100,000 tons of CO2 per year. Since 2020, a pilot of the ETS has been implemented for ArcelorMittal México Long and Flat Segments and Services areas (“SERSIINSA”), along with other relevant companies. This pilot stage concluded on December 31, 2022, and the operational stage is expected to commence in 2024. New rules are anticipated to be issued by the first quarter of 2024. During the three-year pilot stage, ArcelorMittal México consistently adhered to the environmental authority's ("SEMARNAT") emission calculation and reporting criteria for the Emissions Trading System. ArcelorMittal's CO2 emissions reports have consistently showed zero deficits. Despite the initial plan for the operational stage to start in 2023, the rules remain undefined, and only proposals have been presented. Rules are expected to be finalized in 2024. The authority has not officially defined operational stage rules, but an unofficial final proposal is expected soon.
Ukraine is progressing towards the establishment of a national ETS. In 2024, Ukraine aims to enact a framework law that aligns with European carbon emission reduction standards and outlines the concept of an ETS. The prerequisites for launching the ETS include the establishment of a functional system for monitoring, reporting, and verifying greenhouse gas emissions (“MRV”) in Ukraine, along with the approval of an updated NDC to the Paris Agreement.
ArcelorMittal closely monitors local, national, and international negotiations, and regulatory and legislative developments, and endeavors to reduce its emissions where appropriate.
Health and safety laws and regulations
ArcelorMittal’s operations are subject to a broad range of laws and regulations relating to the protection of human health and safety. As these laws and regulations in the United States, the EU and other jurisdictions continue to become more stringent, ArcelorMittal expects to expend substantial amounts to achieve or maintain compliance. See “Introduction—Risk Factors and Control—Legal and regulatory risks—ArcelorMittal is subject to strict environmental, health and safety laws and regulations that could give rise to a significant increase in costs and liabilities.” ArcelorMittal has established health and safety guidelines
82
| Management report | ||
requiring each of its business units and sites to comply with all applicable laws and regulations. Compliance with such laws and regulations and monitoring changes to them are addressed primarily at the business unit level. ArcelorMittal has a clear and strong health and safety policy, aimed at reducing on a continuing basis the severity and frequency of accidents; through its Health & Safety Council and Management Committee, the Company reinforces the penetration of the safety culture in the Company. The effective policy outlines the commitment ArcelorMittal has made to the health and safety of all employees and reinforces the accountability of the local management and encourages the continuous improvement in health and safety performance at unit level, which permits the Health & Safety Council and Management Committee to define and track performance targets and monitor results from every business unit and site. See "Business overview—Sustainable development—Health and safety" for further information.
Foreign trade
ArcelorMittal has manufacturing operations in many countries and sells its products worldwide. In 2023, certain countries and communities, such as Canada, the EU, Mexico, Turkey and the U.S. continued or launched investigations into whether to impose or continue imposing trade remedies (usually anti-dumping or safeguard measures) against injury, or the threat thereof, caused by increasing steel imports originating from various steel producing countries.
Under both international agreements and the domestic trade laws of most countries, trade remedies are available to domestic industries where imports are “dumped” or “subsidized” and such imports cause injury, or a threat thereof, to a domestic industry. Although there are differences in how trade remedies are assessed, such laws have common features established in accordance with World Trade Organization (“WTO”) standards. Dumping involves exporting a product at a price lower than that at which the same or similar product is sold in the home market of the exporter, or where the export prices are lower than a value that typically must be at or above the full cost of production (including sales and marketing costs) plus a reasonable amount for profit. Subsidies from governments (including, among others, grants and loans at artificially low interest rates) are similarly actionable under certain circumstances. The trade remedies available are typically (i) an anti-dumping duty order where injurious dumping is found and (ii) a countervailing duty order or suspension agreement where injurious subsidization is found. Normally, the duty is equal to the amount of dumping or subsidization that is generally imposed on the imported product (other than in the EU where the lesser duty rule is applied). Accordingly, such orders and suspension agreements do not prevent the importation of a product, but rather require that either the product be priced at a non-dumped level or without the benefit of subsidies, or that the
importer pays the difference between such dumped or subsidized price and the actual price to the government as a duty.
Safeguard measures are addressed more generally to a particular product, irrespective of its country of origin, to protect domestic production against serious injury caused by unforeseen, sharp and sudden increase of imports.
All WTO members are required to review anti-dumping duty and countervailing duty orders every five years to determine if they should be maintained, revised or revoked. This requires a review of whether the dumping or subsidization is likely to continue or recur if the order/suspension agreement is revoked and whether a domestic industry in the country is likely to suffer the continuation or recurrence of the injury within the reasonably foreseeable future if the orders are revoked. If the government finds dumping or subsidization and the injury is likely to continue or recur, then the orders continue. In the case of safeguard measures enduring for greater than three years, all WTO members are required to review the imposed measures in the mid-term of the relevant measure. After a review, safeguard measures may be extended if they continue to be required, but the total period for the application of safeguard measures may not exceed eight years.
In a number of markets in which ArcelorMittal has manufacturing operations, it may be the beneficiary of trade actions intended to address trade distortions consistent with WTO regulations, such as the examples mentioned above. In other situations, certain operations of ArcelorMittal may be a respondent to anti-dumping and countervailing duty cases and its exported products might be subject to anti-dumping and countervailing duties or other trade restrictions, for example anti-dumping duties imposed in 2017 by the Egyptian government against rebar imports from Ukraine, Turkey and China affecting exports from ArcelorMittal operations in Ukraine.
USA Section 232:
On March 23, 2018, after a section 232 national security investigation with respect to steel imports, the Trump Administration imposed tariffs of 25% on steel products from all but a select list of countries, with a temporary suspension applied for Canada, Mexico, Argentina, South Korea, Brazil and the EU until May 1, 2018. Subsequently, Australia obtained a full exemption, and imports from Argentina, Brazil and South Korea became subject to annual quotas. Tariffs on imports of steel products from Canada and Mexico were eliminated on May 17, 2019, which led to positive impacts in the Company’s NAFTA business units; imports from Canada and Mexico were
83
| Management report | ||
monitored to identify whether imported volumes surged meaningfully beyond historic levels.
On October 31, 2021, the U.S. and EU announced that they had reached a two-year agreement to modify the section 232 measures on U.S. steel imports from the EU, which was further extended for another two years in December 2023. Effective January 1, 2022, the U.S. replaced the existing Section 232 tariffs on EU steel with a Tariff-rate Quota ("TRQ") consistent with pre-Section 232 trade volumes in return for the EU dropping the threat of retaliatory tariffs. The total annual import volume under the TRQ is set at 3.3 million tonnes allocated by product category and on an EU member state basis. Only steel “melted and poured” in the EU is eligible for duty-free treatment. Imports above the TRQ volumes will continue to be subject to the 25% tariff. An additional 1.1 million tonnes of products previously excluded from Section 232 tariffs will also be allowed to continue duty-free. Subsequently, the U.S. reached similar agreements with Japan and the UK, also replacing the 25% section 232 tariffs with tariff-rate quotas. Those agreements took effect on April 1, 2022 (Japan) and June 1, 2022 (UK).
The USA Section 232 tariffs triggered concerns of trade deflection worldwide and several countries initiated domestic remediation measures. On July 19, 2018, the EU Commission imposed provisional measures based on global tariff quotas with a 100% quota based on average imports over the past three years on 23 product categories. Imports that exceeded the above quotas would face a 25% tariff but certain 'developing' countries were exempt when their respective import shares were below 3%. The EU’s provisional safeguard measures were replaced by definitive safeguard measures on February 2, 2019, which cover the full steel product scope, setting country-based quotas for larger importers on all product categories, except for hot rolled (global), and quarterly quota calculations for residual volumes of all products. The measures also included annual quota relaxations, adaptable to market conditions. Countries subject to quotas have an incentive to front-load the consumption of their national quota in order to benefit from the residual quotas in the final quarter of the period, thus ensuring full quota consumption. In 2019 and 2020, the EU commission completed review investigations of these safeguard measures and implemented various technical modifications, such as capping the HRC quota to 30% per exporting country.
In 2021, the EU Commission carried out a review into extending the safeguard measures to consider whether the situation justified prolonging the tariff-rate quota. On June 18, 2021, EU member states voted in favor of a three-year extension prolonging the measures until June 30, 2024. There were no changes to the quota modalities, however it was agreed to carry out a review of the quota levels after one year and a review of the measures in general after two years. The first of these reviews took place in 2022 and a further review in 2023
confirmed the measures until June 2024. On February 9, 2024, the European Commission initiated a review that will consider whether or not to prolong the measures past June 2024.
Separately, from April 1, 2022, all Russian and Belarusian quota volumes were redistributed across other country-specific quotas and the residual quota based on 2021 imports.
Anti-dumping duties on Hot-Rolled Coil entering the EU from China, Brazil, Russia and Iran have been in place since 2017 and were renewed in 2023 for an additional 5 years. In addition, China is subject to anti-subsidy measures.
During 2023, the Commission concluded expiry reviews into anti-dumping measures on imports of Chinese Heavy Plate and Belarusian Rebar, reconfirming the measures for a further 5 years.
An expiry review is currently ongoing into anti-dumping measures on corrosion-resistant steel from China.
In response to the measures adopted by the United States and the EU, Turkey opened a safeguard investigation on May 2, 2018 with provisional measures effective as of October 17, 2018. Turkey’s safeguard investigation on iron and steel products, which was supposed to be concluded by January 26, 2019, was extended for six months, i.e., until July 26, 2019, with provisional safeguard measures that remained in effect until May 5, 2019. The investigation covered hot-rolled, cold-rolled, coated, hot-dipped galvanized, bars and rods, angles, shapes and sections, wire rod, rails, tubes and hollow profiles and stainless steel and the provisional measures were in the form of a free tariff quota with 25% duties. The investigation was terminated on May 7, 2019 without permanent safeguard measures being imposed. In January 2021, Turkey opened an investigation into HRC coming from the EU and South Korea. The investigation led to a 10.9% duty being applied to imports from ArcelorMittal as from July 7, 2022. In 2023, Turkey opened a safeguard investigation into Wire Rod imports, imposing provisional measures while the investigation is ongoing.
In 2022, the U.S. completed reviews of anti-dumping and countervailing duty measures in place on corrosion-resistant, cold-rolled, and hot-rolled steel, and cut-to-length steel plate, continuing most duties for another 5 years.
In January 2023, the U.S. initiated an anti-dumping investigation regarding tin mill products from 8 countries, including Canada. ArcelorMittal Dofasco was named as a respondent in the case. In February 2024, a final decision confirmed that no measures will be imposed on any of the 8 countries targeted.
In Canada, as a result of the opening of a safeguard investigation on certain flat and long products, provisional measures were put in place on October 25, 2018 in the form of
84
| Management report | ||
quotas and a 25% tariff on steel imports. Final safeguard measures were subsequently implemented in relation to plate and stainless wire, but not rebar, hot rolled, prepaint, wire rod and energy tubulars. In addition, thirteen cold-rolled and corrosion-resistant anti-dumping and countervailing duty measures were implemented between 2018-2020. In 2021, anti-dumping and countervailing duty measures were initiated for hot-rolled from China, Brazil, Ukraine and India under a five-year review. As of 2022, the measures remained in place for all countries except Ukraine. For rebar, nineteen anti-dumping and countervailing duty measures were implemented between 2015 to 2021, with 10 measures continued in two separate 5-year reviews in 2020 and 2022.
In February 2024, the Canadian government announced implementation of a “Country of Melted and Poured” steel import monitoring system, with mandatory reporting effective November 2024.
The Eurasian economic union led by Russia also opened a safeguard investigation on August 7, 2018 covering some flat steel products only and on August 8, 2019, safeguard measures covering hot-rolled steel were put in place, imposing 20% tariffs above relevant quotas.
Key currency regulations and exchange controls
As a holding company, ArcelorMittal is dependent on the industrial franchise fees from, earnings and cash flows of, and dividends and distributions from, its operating subsidiaries to pay expenses, meet its debt service obligations, pay any cash dividends or distributions on its ordinary shares or conduct share buy-backs. Significant cash or cash equivalent balances may be held from time to time at subsidiaries where repatriation of funds may be affected by tax and foreign exchange policies, including in Argentina, Brazil, China, Kazakhstan, South Africa, Ukraine and Venezuela. Such policies are briefly summarized below; however, none of these are currently significant in the context of ArcelorMittal’s overall liquidity.
Argentina
The Argentinian foreign exchange market is regulated by the Argentine Central Bank ("BCRA"). The BCRA implemented a crawling foreign exchange regime in 2021, resulting in the steady appreciation of the Real Effective Exchange Rate ("REER"). The BCRA allows the local currency to free-float against the USD, however, capital controls have reduced volatility in an effort to provide stability to the currency and fight inflation. The Argentinian peso (“ARS”) is not fully convertible and is most commonly traded as a non-deliverable forward ("NDF"), both onshore and offshore. An account in local currency cannot be held offshore. As of July 1, 2018, Argentina has been considered as a hyperinflationary economy. Since the re-imposition of capital controls in September 2019, local restrictions on obtaining foreign currencies have tightened,
requiring the BCRA's approval for all foreign currency transactions and all transfers to and from the local market for companies and for financial outflows, such as dividend payments. These restrictive measures to access the foreign exchange market are, according to the BCRA, essential to mitigating the inflationary crisis and the worsening of the balance of payments. The BCRA has set a limit of 5 days for exporters to convert foreign currency, while institutions will need authorization of the bank to buy USD in the foreign exchange market, except in the case of foreign trade, according to a statement from the BCRA. In September 2020, the BCRA intensified foreign currency exchange regulation once again, instituting a 30% tax on purchases made abroad and restricting withdrawals to $200 per month. In addition, a 0.06% fixed charge has been imposed on all current bank accounts (debit and credit). As from October 2020, non-residents’ investment repatriation is allowed so long as the repatriation takes place at least two years following the initial capital contribution and settlement in the foreign currency exchange market. See also note 2.2.2 to the consolidated financial statements. Some non-official change rates exist in Argentina, the “dollar blue” which is exchanged on the street and the “blue chip swaps” rate. In late 2023, the government of Argentina issued a resolution based on which exporters would be able to convert 50% of their revenues in U.S. dollars using official foreign currency rates and 50% at Blue Chip Swap rates, which improves the final net rate exporters can access in the foreign exchange market.
In December 2023 the government devalued the ARS against the U.S. dollar to establish an official exchange rate of around 800 pesos per U.S. dollar. The adjustment of the exchange rate will serve as a supplementary anchor for inflation expectations. Based on the current situation the exchange rate devaluation path is currently set at 2% per month by the government.
Brazil
The Central Bank of Brazil ("BCB") operates, consistent with the inflation targeting rate, a free floating foreign exchange regime that aims to reduce excessive volatility, although intervention has become more regular in recent years. The BCB regulates all currency inflows and outflows in Brazil, and the country's foreign exchange regime does not permit free convertibility of the currency. Nevertheless, the BCB does not intervene in the foreign exchange market to determine the exchange rate. The Brazilian Real is fully deliverable onshore (i.e., physical settlement of the designated currency at maturity), but is non-deliverable offshore. As a result, foreign currency transactions must be executed with an institution authorized by the BCB to carry out such transactions, which is responsible for ensuring compliance with the local foreign exchange regulation. With proper documentation, the repatriation of registered invested capital and remittance of profits do not require prior approval
85
| Management report | ||
from the BCB. Profits can be freely remitted as dividends or as interest on capital to foreign shareholders or portfolio investors.
China
China’s foreign exchange regime has undergone significant liberalization in recent years. The People’s Bank of China ("PBOC") maintains the Chinese renminbi in a managed float with reference to a basket of currencies. The CNY, which refers to the Chinese renminbi on the onshore market, is partially convertible and has a non-deliverable offshore market. CNY foreign currency spot transactions under $50,000 per year do not require supporting documents. All onshore transactions involving foreign exchange are strictly controlled by the State Administration of Foreign Exchange. The foreign currency exchange fixing rate is announced every morning at 9:15 Beijing time, and the interbank market is only allowed to trade within 2% of the fixing rate for onshore CNY versus U.S. dollar. Since 2021, repatriating capital or profits out of China includes increased layers of inspection and security from the government. The PBOC has decided to increase the amount of foreign-currency deposits that financial institutions need to hold as reserves, as from June 2021, in order to curb sell-offs of foreign currencies after the renminbi's value climbed to a record high. The CNH, which is the Chinese renminbi traded offshore, became deliverable in Hong Kong in July 2010. The CNH can generally be transferred freely between offshore accounts and interaction with the onshore market is growing, although transfers of CNH from Hong Kong to onshore China are subject to regulations and approval by the PBOC. Moreover, in July 2020, integration of the interbank and exchange bond markets, as well as wider participation in the treasury bond futures market, suggest that more progress is likely to be made by the PBOC to move toward increased internalization of the Chinese market.
India
The Reserve Bank of India ("RBI") maintains the Indian rupee (“INR”) in a managed floating regime. The INR is partially convertible and has a non-deliverable offshore market. Onshore deliverable forwards are also available out to 10 years. The most common tenor with the best liquidity in the forwards market is one year or less. The RBI monitors the value of the INR against the REER. The INR exchange rate is determined in the interbank foreign exchange market. The INR is convertible for exports and imports of goods and services as well as unilateral transfers, including repatriating profits from foreign-funded companies, as well as for daily recurring transactions in the ordinary course of business. However, the INR is restricted on capital accounts (purchase and sale transactions of foreign assets and liabilities) and there are specific transactions that have to be authorized by the RBI or other relevant government departments for routine capital account transactions, e.g. foreign currency borrowings under the approval route or foreign direct
investments that are not permitted under the automatic route. A daily benchmark fixing is published by the Financial Benchmark of India Limited for INR against U.S. dollar, €, JPY and GBP. Other permitted capital account transactions that are allowed, subject to compliance with local applicable regulations, include foreign direct investment, foreign currency loans and bonds, securities and equity investments overseas. In April 2020, the RBI issued final guidelines on “Hedging of foreign exchange risk by Residents and Non-Residents”. The simplified guidelines are expected to have a positive material impact on product suite, procedures and requirements for hedging requests which will impact both local and global franchises.
South Africa
The South African Reserve Bank ("SARB") operates a managed floating exchange rate system. The South African rand (“ZAR”) is deliverable and largely convertible, and the SARB is gradually relaxing exchange rate controls. The currency is deliverable and traded out to 10 years, although liquidity is highest in tenors of two years or less. Since January 1, 2014, companies may apply for approval to establish a holding company to hold their offshore investments. Subject to certain conditions, listed companies may place ZAR 3 billion per year with such holding companies, which can be transferred offshore without exchange control approval, and unlisted companies may transfer ZAR 2 billion per year. All funds transferred into or out of South Africa must be declared to the SARB. Active currency hedging with maturity of more than 12 months requires documentary evidence of firm and ascertainable commitment. In most cases, there are no restrictions on capital inflows. However, all incoming loans are subject to the SARB’s approval and institutions’ overseas investments are restricted to 25% of retail assets for retirement funds and long-term insurers.
Ukraine
The National Bank of Ukraine ("NBU") is responsible for the country’s monetary policy. Due to the ongoing geopolitical conflict with Russia since the end of February 2022, on shore liquidity on Ukrainian Hryvnya ("UAH") has been significantly reduced, leading to the NBU implementing strong regulation to control foreign exchange transactions. Thus, legal entities must first use foreign currencies they have at their disposal and then access the foreign exchange market of Ukraine. The NBU has fixed the official UAH rate against the U.S. dollar at 36.57 since July 2022, and switched to a managed floating exchange rate in early October 2023. Transacting in offshore non-deliverable forwards is not possible, except in extremely limited circumstances.
Venezuela
Venezuela’s foreign exchange regime has been characterized by governmental devaluation and legislative changes. DICOM is the country’s official exchange rate. On August 20, 2018, the bolivar soberano ("VES") replaced the bolivar fuerte ("VEF") at a
86
| Management report | ||
rate of 1 VES to 100,000 VEF. The only way to convert the VES is through the DICOM rate, which sets an exchange limit of €340,000 per month for domestic legal entities. Since September 7, 2018, currency purchase and sale transactions can be freely converted by direct agreement between the parties, provided they do so through the exchange operators of the Central Bank, however, the Central Bank of Venezuela can intervene in these operations whenever it deems necessary to avoid distortions of the exchange value of the national currency. Local banks are allowed to provide accounts in U.S. dollars and other convertible currencies as well as the transfer of funds between banks. Since this regime's effective date, the foreign exchange market has been characterized by limited existence of customers and transactions for insignificant amounts. Transactions are allowed on a non-deliverable offshore market, but liquidity is very limited. On October 1, 2021, Venezuela's Government launched its second monetary overhaul in three years by cutting six zeros from the bolivar currency in response to hyperinflation. Consequently, the currency has been renamed from VES to VED.
Disclosure pursuant to Section 219 of the Iran Threat Reduction & Syria Human Rights Act (ITRA) ArcelorMittal’s business with customers in Iran
Section 219 of the Iran Threat Reduction and Syria Human Rights Act of 2012 added Section 13(r) to the U.S. Securities Exchange Act of 1934, as amended (the Exchange Act). Section 13(r) requires an issuer to disclose in its annual reports whether it or any of its affiliates knowingly engaged in certain activities, transactions or dealings relating to Iran. Disclosure is required even where the activities, transactions or dealings are conducted outside the United States by non-US persons in compliance with applicable law, and whether or not the activities are sanctionable under US law.
In 2023, neither ArcelorMittal nor any of its affiliates engaged in activities, transactions or dealings relating to Iran triggering disclosure under Section 13(r).
ArcelorMittal continues to monitor developments in this area, in particular the status of U.S. Sanctions, the Joint Comprehensive Plan of Action ("JCPOA") and EU Sanctions, and the expansion of the EU Blocking Regulation (Council Regulation (EC) 2271/96). ArcelorMittal carefully monitors political risk and sanctions exposure and has procedures and systems in place intended to manage those risks.
However, ArcelorMittal’s business is subject to an extensive, complex and evolving regulatory framework. It is possible that ArcelorMittal may face conflicting obligations or risks under U.S. direct and secondary sanctions and the EU Blocking Regulation, or other conflicting instruments. Despite its governance, compliance policies and procedures and continuous efforts to comply with all applicable sanctions regimes, its systems and
procedures may not always prevent the occurrence of violations which may lead to regulatory penalties or cause reputational harm to operating subsidiaries, joint ventures or associates. See “Introduction—Risk Factors and Control.”
87
| Management report | ||
Organizational structure
ArcelorMittal is a holding company with no business operations of its own. All of ArcelorMittal’s significant operating subsidiaries are indirectly owned by ArcelorMittal through intermediate holding companies. The following chart represents the operational structure of the Company, including ArcelorMittal’s significant operating subsidiaries and not its legal or ownership structure.
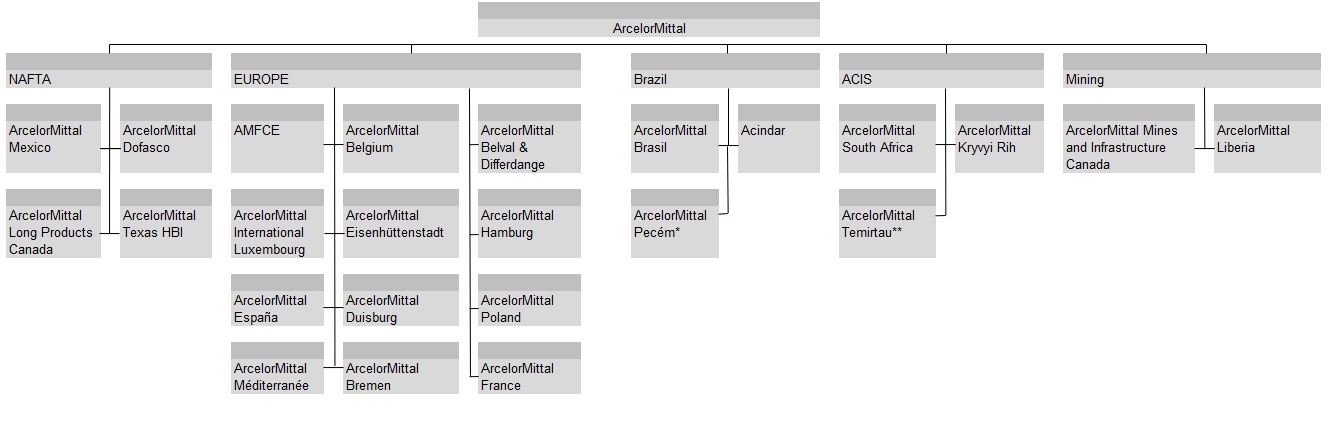
• On March 9, 2023, ArcelorMittal completed the acquisition of ArcelorMittal Pecém. See "Introduction—Key transactions and events in 2023" and note 2.2.4 to the consolidated financial statements.
** On December 7, 2023, the Company completed the sale of ArcelorMittal Temirtau, its Kazakh steel and mining operation. See "Introduction—Key transactions and events in 2023" and note 2.3 to the consolidated financial statements.
88
| Management report | ||
Please refer to the "Glossary—definitions, terminology and principal subsidiaries" for a listing of the Company’s principal subsidiaries, including country of incorporation. Please refer to note 2.2.1 of the consolidated financial statements for the ownership percentages of these subsidiaries. Unless otherwise stated, the subsidiaries as listed have share capital consisting solely of ordinary shares, which are held directly or indirectly by the Company and the proportion of ownership interests held equals to the voting rights held by the Company.
Investments accounted for under the equity method ArcelorMittal has investments in entities accounted for under the equity method as detailed in note 2.4 to ArcelorMittal’s consolidated financial statements. The Company's key investments in joint ventures are AMNS India, Acciaierie d'Italia, Calvert and VAMA for which the Company holds 60%, 62%, 50% and 50%, respectively. See section “Property, plant and equipment—Investments in joint ventures” for further details.
Reportable segments
ArcelorMittal reports its business in the following five reportable segments corresponding to continuing activities: NAFTA, Brazil, Europe, ACIS and Mining.
As from April 1, 2021, ArcelorMittal implemented changes to its organizational structure whereby primary responsibility for captive mining operations whose output is mainly consumed by their respective steel segments was transferred to such segments. The Mining segment retains primary responsibility for the operation of the seaborne oriented operations at AMMC and ArcelorMittal Liberia Ltd, and will continue to provide technical support to all mining operations within the Company. Only the seaborne-oriented operations of AMMC and ArcelorMittal Liberia Ltd are reported within the Mining segment. The results of all other mines are accounted for within the steel segment that they primarily supply.
NAFTA produces flat, long and tubular products. Flat products include slabs, hot rolled coil, cold rolled coil, coated steel products and plate and are sold primarily to customers in the following sectors: automotive, energy, construction packaging and appliances and via distributors and processors. Flat product facilities are located at two integrated and mini-mill sites located in two countries. Long products include wire rod, sections, rebar, billets, blooms and wire drawing. Long production facilities are located at two integrated and mini-mill sites located in two countries. In 2023, shipments from NAFTA totaled 10.6 million tonnes. The raw material supply of the NAFTA operations includes sourcing from iron ore captive mines in Mexico to supply the steel facilities.
Brazil produces flat, long and tubular products. Flat products include slabs, hot rolled coil, cold rolled coil and coated steel. Long products comprise sections, wire rod, bar and rebars,
billets and wire drawing. In 2023, shipments from Brazil totaled 13.7 million tonnes. The raw material supply of the Brazil operations includes sourcing from iron ore captive mines in Brazil.
Europe produces flat, long and tubular products. Flat products include hot rolled coil, cold rolled coil, coated products, tinplate, plate and slab. These products are sold primarily to customers in the automotive, general industry and packaging sectors. Flat product facilities are located at 11 integrated and mini-mill sites located in five countries. Long products include sections, wire rod, rebar, billets, blooms and wire drawing. Long product facilities are located at 10 integrated and mini-mill sites in seven countries. In addition, Europe includes downstream solutions, which provides primarily distribution of long and flat products as well as value-added and customized steel solutions through further processing to meet specific customer requirements. In 2023, shipments from Europe totaled 28.1 million tonnes. The raw material supply of Europe operations includes sourcing from iron ore captive mines in Bosnia & Herzegovina.
ACIS produces a combination of flat, long and tubular products. It has five flat and long production facilities in three countries. In 2023, shipments from ACIS totaled 6.0 million tonnes, with shipments made on a worldwide basis. The raw material supply of the ACIS operations includes sourcing from iron ore captive mines in Kazakhstan (before the Company's disposal of mining operations there, as discussed below) and Ukraine, and coal captive mines in Kazakhstan (before the Company's disposal of mining operations there, as discussed below). On December 7, 2023, ArcelorMittal completed the sale of its steel and mining operations in Kazakhstan. See "Introduction—Key transactions and events in 2023". As a result of this transaction, as of December 31, 2023, the ACIS segment had four flat and long production facilities in two countries, South Africa and Ukraine.
Mining provides the Company's steel operations with high quality and low-cost iron ore reserves and also sells mineral products to third parties. Mining segment iron ore mines are located in North America and Africa. In 2023, iron ore production in the mining segment totaled approximately 26.0 million tonnes.
As from January 1, 2024, ArcelorMittal implemented changes to its organizational structure. India and joint ventures will be reported as a new operating segment including the joint ventures AMNS India, VAMA and Calvert as well as other associates, joint ventures and other investments. The segment Sustainable Solutions will be composed of a number of high-growth, niche, capital light businesses playing an important role in supporting climate action (including renewables, special projects and construction business). They are currently reported within the Europe segment and will be reported as a separate operating segment. The NAFTA segment will be renamed North America. Finally, following the sale of the Company’s operations
89
| Management report | ||
in Kazakhstan, the remaining parts of the former ACIS segment will be assigned to Others. These changes will be presented with the earnings release for the first quarter of 2024.
PROPERTIES AND CAPITAL EXPENDITURES
Property, plant and equipment
ArcelorMittal has steel production facilities, as well as iron ore mining operations, in North and South America, Europe, Asia (on December 7, 2023, ArcelorMittal completed the sale of its steel and mining operations in Kazakhstan) and Africa.
All of ArcelorMittal's operating subsidiaries are substantially owned by ArcelorMittal through intermediate holding companies, and are grouped into the five reportable segments as described above. Unless otherwise stated, ArcelorMittal owns all of the assets described in this section. Regarding ArcelorMittal's iron ore mines, see also "—Mineral reserves and resources" below,
where information is provided in accordance with SEC Regulation S-K, Subpart 1300 (“S-K 1300”).
For further information on environmental issues that may affect ArcelorMittal’s utilization of its assets, see “Business overview—Government regulations”, "Business overview—Sustainable development" and notes 1.2 and 9.1 to ArcelorMittal’s consolidated financial statements.
Steel production facilities of ArcelorMittal
The following table provides an overview by type of steel facility of the principal production units of ArcelorMittal’s operations. While all of the Group’s facilities are shown in the tables, only the facilities of significant subsidiaries are described textually for each segment. The facilities included in the tables are listed from upstream to downstream in the steel-making process.
| Facility | Number of Facilities 3 4 | Capacity (in million tonnes per year)1,3,4 | Production in 2023 (in million tonnes)2,3,4 | |||||||||||||||||
| Coke Oven Battery | 50 | 26.5 | 17.0 | |||||||||||||||||
| Sinter Plant | 22 | 79.6 | 42.4 | |||||||||||||||||
| Blast Furnace | 35 | 66.1 | 41.3 | |||||||||||||||||
| Basic Oxygen Furnace (including Tandem Furnace) | 46 | 70.0 | 43.8 | |||||||||||||||||
| DRI/HBI Plant | 13 | 10.6 | 7.8 | |||||||||||||||||
| Electric Arc Furnace | 30 | 24.9 | 15.4 | |||||||||||||||||
| Continuous Caster—Slabs | 29 | 62.6 | 40.4 | |||||||||||||||||
| Hot Rolling Mill | 14 | 53.8 | 32.8 | |||||||||||||||||
| Pickling Line | 21 | 24.6 | 10.6 | |||||||||||||||||
| Tandem Mill | 25 | 28.3 | 16.8 | |||||||||||||||||
| Annealing Line (continuous / batch) | 28 | 12.4 | 5.3 | |||||||||||||||||
| Skin Pass Mill | 18 | 11.2 | 4.1 | |||||||||||||||||
| Plate Mill | 5 | 1.7 | 0.9 | |||||||||||||||||
| Continuous Caster—Bloom / Billet | 32 | 31.5 | 17.4 | |||||||||||||||||
| Breakdown Mill (Blooming / Slabbing Mill) | 1 | 6.0 | 0.3 | |||||||||||||||||
| Billet Rolling Mill | 3 | 2.6 | 1.0 | |||||||||||||||||
| Section Mill | 22 | 12.2 | 5.1 | |||||||||||||||||
| Bar Mill | 18 | 7.8 | 5.5 | |||||||||||||||||
| Wire Rod Mill | 16 | 10.5 | 5.8 | |||||||||||||||||
| Hot Dip Galvanizing Line | 39 | 15.6 | 12.1 | |||||||||||||||||
| Electro Galvanizing Line | 8 | 1.6 | 0.8 | |||||||||||||||||
| Tinplate Mill | 12 | 2.4 | 0.8 | |||||||||||||||||
| Color Coating Line | 16 | 2.6 | 1.4 | |||||||||||||||||
| Seamless Pipes | 3 | 0.4 | 0.1 | |||||||||||||||||
| Welded Pipes | 98 | 4.1 | 1.0 | |||||||||||||||||
1.Reflects design capacity and does not take into account other constraints in the production process (such as, upstream and downstream bottlenecks and product mix changes). As a result, in some cases, design capacity may be different from the current achievable capacity.
2.Production facility details include the production numbers for each step in the steel-making process. Output from one step in the process is used as input in the next step in the process. Therefore, the sum of the production numbers does not equal the quantity of sellable finished steel products.
90
| Management report | ||
3.On December 7, 2023, ArcelorMittal completed the sale of ArcelorMittal Temirtau, its steel and mining operation in Kazakhstan, with the integrated steel plant including six coke oven batteries, three sinter plants, three blast furnaces, three basic oxygen furnaces, three continuous casters, one hot rolling mill and 21 downstream facilities. See note 2.3 to the consolidated financial statements and "Introduction—Key transactions and events in 2023". The number of lines and their respective capacities, as well as their production through the transaction closing date are included in the table above.
4.On March 9, 2023, ArcelorMittal completed the acquisition of Companhia Siderúrgica do Pecém in Brazil subsequently renamed ArcelorMittal Pecém. See note 2.2.4 to the consolidated financial statements and "Introduction—Key transactions and events in 2023". The above table includes the number of lines and their respective capacities, as well as their production since the date of acquisition of ArcelorMittal Pecém.
Crude steel production by process and segment in 2023 (in million tonnes) | |||||||||||
| Segment | Basic oxygen furnace | Electric arc furnace | Total | ||||||||
| NAFTA | 3.1 | 5.6 | 8.7 | ||||||||
| Brazil | 10.3 | 3.7 | 14.0 | ||||||||
| Europe | 23.2 | 5.6 | 28.8 | ||||||||
| ACIS | 6.5 | — | 6.5 | ||||||||
| Total | 43.1 | 14.9 | 58.1 | ||||||||
| Blast furnace and electric arc furnace facilities | ||||||||
| Segment | Blast furnaces | Electric arc furnaces | ||||||
| NAFTA | 3 | 8 | ||||||
| Brazil | 7 | 8 | ||||||
| Europe | 15 | 13 | ||||||
ACIS1 | 10 | 1 | ||||||
| Total | 35 | 30 | ||||||
1.Including ArcelorMittal Temirtau's assets, in particular three blast furnaces, prior to sale in December 2023.
| NAFTA | Crude Steel | |||||||||||||||||||||||||
| Unit | Country | Locations | Production in 2023 (in million tonnes per year)1 | Type of plant | Products | |||||||||||||||||||||
| ArcelorMittal Dofasco | Canada | Hamilton | 3.1 | Integrated, Mini-mill | Flat | |||||||||||||||||||||
| ArcelorMittal Texas HBI | USA | Corpus Christi | n/a | Iron-Making | Hot briquetted iron | |||||||||||||||||||||
| ArcelorMittal Mexico | Mexico | Lázaro Cárdenas, Celaya | 3.8 | Mini-mill, Integrated, and Downstream | Flat, Long/ Bar, Wire Rod | |||||||||||||||||||||
| ArcelorMittal Long Products Canada | Canada | Contrecoeur East, West | 1.8 | Mini-mill | Long/ Wire Rod, Bars, Slabs | |||||||||||||||||||||
| ArcelorMittal Tubular Products | Canada | Brampton | n/a | Downstream | Pipes and Tubes | |||||||||||||||||||||
| ArcelorMittal Tubular Products | Canada | London | n/a | Downstream | Pipes and Tubes | |||||||||||||||||||||
| ArcelorMittal Tubular Products | Canada | Woodstock | n/a | Downstream | Pipes and Tubes | |||||||||||||||||||||
| ArcelorMittal Tubular Products | Canada | Hamilton | n/a | Downstream | Pipes and Tubes | |||||||||||||||||||||
| ArcelorMittal Tubular Products | USA | Shelby | n/a | Downstream | Pipes and Tubes | |||||||||||||||||||||
| ArcelorMittal Tubular Products | USA | Marion | n/a | Downstream | Pipes and Tubes | |||||||||||||||||||||
| ArcelorMittal Tubular Products ² | Mexico | Monterrey | n/a | Downstream | Pipes and Tubes | |||||||||||||||||||||
| Captive mining operations | ||||||||||||||||||||||||||||||||
| Unit | Country | Locations | ArcelorMittal Interest (%) | Type of Mine | Product | |||||||||||||||||||||||||||
| ArcelorMittal Mexico (excluding Peña Colorada) | Mexico | Sonora, Sinaloa and Michoacán | 100.0 | Iron Ore Mine (open pit) | Concentrate, lump and fines | |||||||||||||||||||||||||||
| ArcelorMittal Mexico Peña Colorada | Mexico | Minatitlán | 50.0 | Iron Ore Mine (open pit) | Concentrate and pellets | |||||||||||||||||||||||||||
1.n/a = not applicable (no crude steel production)
2.ArcelorMittal Tubular Products launched a new welded pipe mill #5 at its Monterrey plant in the second half of 2023.
91
| Management report | ||
ArcelorMittal Dofasco
ArcelorMittal Dofasco (“Dofasco”) is a leading North American steel solution provider and Canada’s largest manufacturer of flat rolled steels. Dofasco’s steel-making plant in Hamilton, Ontario is adjacent to water, rail and highway transportation. The plant uses both integrated and EAF-based steelmaking processes. Its products include hot rolled coils, cold rolled coils, galvanized steels and tinplate. Dofasco supplies these products to the automotive, construction, packaging, manufacturing, pipe and tube and steel distribution markets.
Dofasco has a CAD$1.8 billion investment project in a low-carbon emissions steelmaking facility at its plant in Hamilton involving the construction of a 2.4 million tonnes DRI facility and one EAF. The project is currently progressing through FEED stage. See “Business overview—Sustainable development—Climate change and decarbonization".
Following the completion in 2022 of the hot strip mill modernization project (to install two new state-of-the-art coilers and runout tables to replace three end-of-life coilers as well as to upgrade the strip cooling system) and the #5 CGL conversion to AluSi® project (addition of up to 160,000 tonnes per year Aluminum Silicon (AluSi®) coating capability to #5 Hot-Dip Galvanizing Line for the production of Usibor® steels), product commercialization and ramp-up are in progress as of the end of 2023; the first commercialized coil was delivered in the second half of 2023.
ArcelorMittal Texas HBI
On June 30, 2022, ArcelorMittal completed the acquisition of an 80% shareholding in voestalpine’s HBI plant located near Corpus Christi, Texas. The state-of-the-art plant, which was opened in October 2016, is one of the largest of its kind in the world and produces Hot Briquetted Iron ("HBI"), a high quality feedstock made through the direct reduction of iron ore which is used to produce high-quality steel grades in an EAF, but it can also be used in blast furnaces, resulting in lower coke consumption. The plant has an annual capacity of two million tonnes of HBI, which is a premium, compacted form of DRI developed to overcome issues associated with shipping and handling DRI. The transaction enhances ArcelorMittal’s ability to produce the high-quality input materials required for low carbon emissions steelmaking, and reinforces the Company’s position as a world leader in DRI production. The facility includes its own deep-water port and unused land on the site which provides options for further development.
ArcelorMittal Mexico
ArcelorMittal Mexico produces both flat and long steel products and operates an integrated route and EAF route using DRI. It produces higher quality slabs for use in specialized steel applications in the automotive, line pipe manufacturing, shipbuilding and appliance industries. It is also one of the
largest single rebar and wire rod production facilities in Mexico and mainly uses the integrated route for steelmaking. The facility is located in Lázaro Cárdenas in the Michoacán state by the Pacific coast and is highly accessible by ocean, rail, and other means. It also operates a rebar mill at Celaya with billets sourced from the Lazaro facility.
The new hot strip mill project which commenced in the fourth quarter of 2017 produced its first coils in December 2021. Ramp-up is underway and is on track with capacity utilization having reached approximately 60% as of the end of 2023.
ArcelorMittal Mexico Mining Assets
ArcelorMittal Mexico operates three iron ore mines in Mexico, the San José and Las Truchas mines and Consorcio Minero Benito Juarez Peña Colorada, S.A. de C.V. ("Peña Colorada"), a 50/50 joint operation between ArcelorMittal and Ternium S.A ("Ternium"). ArcelorMittal continues to operate certain parts of the El Volcan facilities with material coming from the San José mine (as further described below). For further details on Mexico mines production and other information, see "—Mineral reserves and resources".
Peña Colorada
Peña Colorada operates an open pit mine in the province of Minatitlán in the northwestern part of the State of Colima, Mexico. It also operates a concentrating facility and a two-line pelletizing facility. The beneficiation plant is located at the mine, whereas the pelletizing plant is located in Manzanillo. The magnetite concentrate produced at the mine is shipped from Manzanillo to ArcelorMittal Mexico, as well as to Ternium’s steel plants by ship and by rail.
El Volcan & San José
ArcelorMittal operates the San José and El Volcan mines in the state of Sonora, Mexico. The El Volcan mine stopped production in 2019 due to depletion of reserves, but mining has continued at the San José mine located approximately 40 kilometers from Culiacán City, in the south of the Sinaloa State.
The El Volcan facilities which continue to be used with materials from the San José mine include the concentration plant and port installations. Concentrate produced is transported by rail to the Pacific port of Guaymas and then shipped to the steel plant in Lázaro Cárdenas.
Las Truchas
ArcelorMittal operates the Las Truchas mine located approximately 27 kilometers southeast of the town of Lázaro Cárdenas in the State of Michoacán, Mexico. The concentrated ore is pumped from the mine site through a slurry pipeline to the steel plant facility in Lázaro Cárdenas.
ArcelorMittal has progressed on its project to increase pellet feed production at Las Truchas mine to 2.3 million tonnes per
92
| Management report | ||
annum with DRI concentrate grade capability. This project will enable concentrate production for the BF route and DRI route, with the goal of supplying ArcelorMittal Mexico's steel operations with high quality feed. Production is expected to start in the second half of 2025. See "—Capital expenditures".
For further details on ArcelorMittal Mexico mining assets production and other information, see "—Mineral reserves and resources".
AMLPC
AMLPC is the largest mini-mill in Canada and has the flexibility to use either DRI or scrap, depending on their respective
economics. It produces wire rods, wire products and bars, primarily sold in Canada and the United States and principally serves the automotive, appliance, transportation, machinery and construction industries. It also produces slabs that are used within ArcelorMittal.
In 2022, AMLPC successfully tested the use of green hydrogen in the production of DRI at its steel plant in Contrecoeur, Quebec. See “Business overview—Sustainable development—Climate change and decarbonization".
| BRAZIL | Crude Steel | |||||||||||||||||||||||||||||||
| Unit | Country | Locations | Production in 2023 (in million tonnes per year) 1 | Type of plant | Products | |||||||||||||||||||||||||||
| Sol | Brazil | Vitoria | n/a | Coke-Making | Coke | |||||||||||||||||||||||||||
ArcelorMittal Tubarão | Brazil | Vitoria | 6.6 | Integrated | Flat | |||||||||||||||||||||||||||
| ArcelorMittal Vega | Brazil | São Francisco do Sul | n/a | Downstream | Flat | |||||||||||||||||||||||||||
ArcelorMittal Brasil | Brazil | João Monlevade | 1.1 | Integrated | Long/ Wire Rod | |||||||||||||||||||||||||||
| ArcelorMittal Brasil | Brazil | Juiz de Fora, Piracicaba | 1.9 | Mini-mill | Long/ Bar, Wire Rod | |||||||||||||||||||||||||||
ArcelorMittal Brasil | Brazil | Barra Mansa, Resende | 0.7 | Mini-mill | Long/Rebar, Wire rod, Bars, Sections, Wires | |||||||||||||||||||||||||||
ArcelorMittal Pecém 2 | Brazil | Pecém | 2.5 | Integrated | Flat | |||||||||||||||||||||||||||
| Acindar | Argentina | Villa Constitucion | 1.1 | Mini-mill | Long/ Wire Rod, Bar | |||||||||||||||||||||||||||
| ArcelorMittal Costa Rica | Costa Rica | Costa Rica | n/a | Downstream | Long/ Wire Rod | |||||||||||||||||||||||||||
| Industrias Unicon | Venezuela | Barquisimeto, Matanzas, La Victoria | n/a | Downstream | Pipes and Tubes | |||||||||||||||||||||||||||
| Captive mining operations | ||||||||||||||||||||||||||||||||
| Unit | Country | Locations | ArcelorMittal Interest (%) | Type of Mine | Product | |||||||||||||||||||||||||||
| ArcelorMittal Brasil Andrade Mine | Brazil | State of Minas Gerais | 100.0 | Iron Ore Mine (open pit) | Fines | |||||||||||||||||||||||||||
| ArcelorMittal Mineração Serra Azul | Brazil | State of Minas Gerais | 100.0 | Iron Ore Mine (open pit) | Lump and fines | |||||||||||||||||||||||||||
1.n/a = not applicable (no crude steel production).
2.In March 2023, ArcelorMittal concluded the acquisition of CSP’, subsequently renamed ArcelorMittal Pecém. The table above includes the production from ArcelorMittal Pecém since acquisition. See note 2.2.4 to the consolidated financial statements and "Introduction—Key transactions and events in 2023".
ArcelorMittal Brasil
ArcelorMittal Brasil produces both flat and long steel products. Flat products are manufactured at ArcelorMittal Tubarão and ArcelorMittal Vega. Its products include slabs, hot rolled coil, cold rolled coil and galvanized steel, and serve customers in automotive, appliances, construction and distribution segments. The Tubarão complex uses the integrated steelmaking route to produce slabs and rolling hot rolled coils and is strategically located with access to the Praia Mole Marine Terminal as well as road and railway systems. The Vega facility has cold rolling and coating facilities and easy access to the port of São
Francisco do Sul. The expansion project is under execution; see "—Capital expenditures".
ArcelorMittal Brasil’s long products include wire rod and wire, sections, merchant bars, special bars and rebars, for use in civil construction, industrial manufacturing, agricultural and distribution sectors. It produces transformed products including, among others, welded mesh, trusses, annealed wire and nails. It owns upstream and downstream steel facilities in Monlevade, Juiz de Fora, Piracicaba, Barra Mansa and Resende and operates an extensive distribution network across the country selling to retail customers. It owns interests in two subsidiaries,
93
| Management report | ||
Belgo Bekaert Arames Ltda. ("BBA"), which manufactures wire products for agricultural and industrial end-users, and Belgo-Mineira Bekaert Artefatos de Arame Ltda., which produces steel cords used in the tire industry. ArcelorMittal Brasil also owns forests, and its subsidiary ArcelorMittal Bioflorestas produces charcoal from eucalyptus forestry operations that is used to fuel its furnaces in Juiz de Fora and to exchange for pig iron with local producers.
The Monlevade upstream expansion project recommenced in late 2021; see "—Capital expenditures".
On March 9, 2023, ArcelorMittal completed the acquisition of CSP subsequently renamed ArcelorMittal Pecém; see note 2.2.4 to the consolidated financial statements and "Introduction—Key transactions and events in 2023".
A new investment in a sections mill at Barra Mansa commenced in the first quarter of 2022; see "—Capital expenditures".
Acindar
Acindar is the largest long steel producer in Argentina. It manufactures and distributes products to meet the needs of the construction, industrial, and agricultural sectors. It produces rebars, square, round, drawn and flat bars, meshes, nails, preassembled and welded cages, structural sections, piles, wire rod and barbed wire. It has an in-house distribution network that serves end-users across Argentina.
ArcelorMittal Brasil - Andrade Mine
ArcelorMittal Brasil operates the Andrade mine located approximately 80 kilometers east of Belo Horizonte in the Minas Gerais State of Brazil. In addition to the open pit mine, ArcelorMittal operates a crushing and screening facility. Fine material produced at the mine is transported to the Monlevade plant through a private railway line.
ArcelorMittal Brasil - Serra Azul Mine
ArcelorMittal Brasil operates the Serra Azul mine located approximately 50 kilometers southwest of the town of Belo Horizonte in the Minas Gerais State of Brazil. ArcelorMittal operates an open pit mine and a concentrating facility at the site. Iron ore product is shipped mainly to the ArcelorMittal Brasil integrated plants and to the local Brazilian market.
In 2021, ArcelorMittal launched an investment at Serra Azul mine to construct new facilities to produce 4.5 million tonnes per annum of DRI quality pellet feed; see "—Capital expenditures".
For further details on Brazil mines production and other related information, see "—Mineral reserves and resources".
94
| Management report | ||
| EUROPE | Crude Steel | |||||||||||||||||||||||||||||||
| Unit | Country | Locations | Production in 2023 (in million tonnes per year) 1 | Type of plant | Products | |||||||||||||||||||||||||||
ArcelorMittal Bremen2 | Germany | Bremen, Bottrop | 2.9 | Integrated | Flat, Coke | |||||||||||||||||||||||||||
| ArcelorMittal Eisenhüttenstadt | Germany | Eisenhüttenstadt | 1.9 | Integrated | Flat | |||||||||||||||||||||||||||
ArcelorMittal Belgium3 | Belgium | Ghent, Geel, Genk, Liège | 4.3 | Integrated and Downstream | Flat | |||||||||||||||||||||||||||
ArcelorMittal France 4 | France | Dunkirk, Mardyck, Montataire, Desvres, Florange, Mouzon, Basse-Indre | 3.9 | Integrated and Downstream | Flat | |||||||||||||||||||||||||||
ArcelorMittal Méditerranée 5 | France | Fos-sur-Mer, Saint-Chély | 2.4 | Integrated and Downstream | Flat | |||||||||||||||||||||||||||
ArcelorMittal España 6 | Spain | Avilés, Gijón, Etxebarri, Lesaka, Sagunto | 3.2 | Integrated and Downstream | Flat, Long/ Rails, Wire Rod, Plates | |||||||||||||||||||||||||||
| ArcelorMittal Avellino & Canossa | Italy | Avellino | n/a | Downstream | Flat | |||||||||||||||||||||||||||
ArcelorMittal Poland | Poland | Kraków, Swietochlowice, Dabrowa Gornicza, Chorzow, Sosnowiec, Zdzieszowice | 3.1 | Integrated and Downstream | Flat, Coke, Long/ Sections, Wire Rod, Sheet Piles, Rails | |||||||||||||||||||||||||||
| ArcelorMittal Sestao | Spain | Bilbao | 0.3 | Mini-mill | Flat | |||||||||||||||||||||||||||
| Industeel | France, Belgium | Charleroi, Le Creusot, Chateauneuf, Saint-Chamond, Dunkirk | 0.4 | Mini-mill and Downstream | Flat | |||||||||||||||||||||||||||
| ArcelorMittal Belval & Differdange | Luxembourg | Esch-Belval, Differdange, Rodange | 1.9 | Mini-mill | Long/ Sheet Piles, Rails, Sections & Special Sections | |||||||||||||||||||||||||||
| ArcelorMittal Olaberria-Bergara | Spain | Olaberría, Bergara | 1.0 | Mini-mill | Long/ Sections | |||||||||||||||||||||||||||
| ArcelorMittal Gandrange | France | Gandrange | n/a | Downstream | Long/ Wire Rod, Bars | |||||||||||||||||||||||||||
| ArcelorMittal Warszawa | Poland | Warsaw | 0.5 | Mini-mill | Long/ Bars | |||||||||||||||||||||||||||
ArcelorMittal Hamburg | Germany | Hamburg | 0.7 | Mini-mill | Long/ Wire Rods | |||||||||||||||||||||||||||
| ArcelorMittal Duisburg | Germany | Ruhrort, Hochfeld | 1.0 | Integrated | Long/ Billets, Wire Rod | |||||||||||||||||||||||||||
| ArcelorMittal Hunedoara | Romania | Hunedoara | 0.2 | Mini-mill | Long/ Sections | |||||||||||||||||||||||||||
| Sonasid | Morocco | Nador, Jorf Lasfar | 0.6 | Mini-mill | Long/ Wire Rod, Bars, Rebars in Coil | |||||||||||||||||||||||||||
| ArcelorMittal Zenica | Bosnia and Herzegovina | Zenica | 0.6 | Mini-mill / Integrated | Long/ Wire Rod, Bars | |||||||||||||||||||||||||||
ArcelorMittal Tubular Products Roman SA | Romania | Roman | n/a | Downstream | Pipes and Tubes | |||||||||||||||||||||||||||
| ArcelorMittal Tubular Products Iasi SA | Romania | Iasi | n/a | Downstream | Pipes and Tubes | |||||||||||||||||||||||||||
ArcelorMittal Tubular Products Karvina a.s. 7 | Czech Republic | Karvina | n/a | Downstream | Pipes and Tubes | |||||||||||||||||||||||||||
95
| Management report | ||
| EUROPE (continued) | Crude Steel | |||||||||||||||||||||||||||||||
| Unit | Country | Locations | Production in 2023 (in million tonnes per year) 1 | Type of plant | Products | |||||||||||||||||||||||||||
ArcelorMittal Tubular Products Kraków 8 | Poland | Kraków | n/a | Downstream | Pipes and Tubes | |||||||||||||||||||||||||||
| ArcelorMittal Tubular Products Hautmont | France | Hautmont | n/a | Downstream | Pipes and Tubes | |||||||||||||||||||||||||||
| ArcelorMittal Tubular Products Vitry | France | Vitry | n/a | Downstream | Pipes and Tubes | |||||||||||||||||||||||||||
| ArcelorMittal Tubular Products Chevillon | France | Chevillon | n/a | Downstream | Pipes and Tubes | |||||||||||||||||||||||||||
| ArcelorMittal Tubular Products Lexy | France | Lexy, Rettel, Vincey, Fresnoy-le-Grand | n/a | Downstream | Pipes and Tubes | |||||||||||||||||||||||||||
ArcelorMittal Tubular Products Legutio | Spain | Legutiano | n/a | Downstream | Pipes and Tubes | |||||||||||||||||||||||||||
ArcelorMittal Tubular Products Zalain | Spain | Zalain-Lesaka | n/a | Downstream | Pipes and Tubes | |||||||||||||||||||||||||||
ArcelorMittal Berrioplano 9 | Spain | Berrioplano | n/a | Downstream | Pipes and Tubes | |||||||||||||||||||||||||||
ArcelorMittal Tubular Products Altensteig | Germany | Altensteig-Walddorf | n/a | Downstream | Pipes and Tubes | |||||||||||||||||||||||||||
| Captive mining operations | ||||||||||||||||||||||||||||||||
| Unit | Country | Locations | ArcelorMittal Interest (%) | Type of Mine | Product | |||||||||||||||||||||||||||
| ArcelorMittal Prijedor | Bosnia and Herzegovina | Prijedor | 51.0 | Iron Ore Mine (open pit) | Concentrate and lump | |||||||||||||||||||||||||||
1.n/a = Not applicable (no crude steel production).
2.Due to planned maintenance, BF#2 at Bremen (Germany) was stopped in October 2023 and restarted in early December 2023
3.Reline of BF#A at Gent (Belgium) was executed in September 2023 and restarted in early December 2023
4.Blast furnace #4 at Dunkirk site was temporarily stopped at the end of March 2023 due to a fire outbreak; it was restarted in July 2023 following repairs.
5.Blast furnace #1 at Fos-sur-Mer was most recently temporarily idled in September 2023 due to low market demand.
6.Blast furnace A in Gijón was temporarily stopped in September 2022 in response to market conditions and was restarted in February 2023. Blast furnace A was stopped again at the end of March 2023 due to a fire outbreak, but was restarted in July 2023 following repairs.
7.ArcelorMittal Tubular Products Karvina decommissioned its pipe mill #08 in 2023.
8.In November 2023, ArcelorMittal Tubular Products Kraków announced its plan to stop production at Kraków plant from the first quarter of 2024 due to weaker macroeconomic conditions and high carbon costs.
9.ArcelorMittal Tubular Products Berrioplano decommissioned and disposed off its mills #02 (M-22 Yoder) and #11 (M-04 Perfrisa) in 2023.
ArcelorMittal France
ArcelorMittal France has locations in Dunkirk, Mardyck, Montataire, Desvres, Florange, Mouzon and Basse-Indre. The sites of ArcelorMittal France produce and market a wide range of flat steel products, including slabs, hot rolled and pickled coils, as well as high-value finished products, such as cold rolled, hot dip galvanized, aluminized and organic coated material, tinplate, draw wall ironed tinplate ("DWI") and tin free steel. ArcelorMittal France’s products are sold principally in the regional market in France and Western Europe. Certain of its products are designed for the automotive market, such as Ultragal®, Extragal®, Galfan, Usibor® (hot dip galvanized), while others are designed for the consumer goods and appliances market, such as Solfer® (cold rolled) for enameling applications, as well as packaging market.
The Dunkirk site has primary facilities and produces slabs as well as hot rolled coils for other ArcelorMittal France sites.
The Mardyck site has finishing facilities and supplies the hot dip coating lines of Montataire.
The Florange site supplies through its hot strip mill and 2 cold rolling mills: the 2 hot dip coating lines of Florange (GALSA 1 and 2), the continuous annealing line of Florange, the hot dip coating lines of Mouzon, as well as the tinplate facilities of Florange and Basse-Indre. Mouzon is specialized in finishing hot dip coating operations. The site of Basse-Indre specializes in packaging activities.
96
| Management report | ||
ArcelorMittal intends to build a 2.5 million tonnes per year DRI unit and two EAFs in Dunkirk see “Business overview—Sustainable development—Climate change and decarbonization".
ArcelorMittal plans to create a new production unit for electrical steels at its Mardyck site in the north of France; see "—Capital expenditures".
Blast furnace #2 at the Dunkirk site was temporarily stopped in July 2022, in response to market conditions and was idled permanently in the fourth quarter of 2022. Blast furnace #4 at Dunkirk site was temporarily stopped at the end of March 2023, due to a fire outbreak at the plant, and was restarted in July 2023 after undergoing repairs.
ArcelorMittal Belgium
ArcelorMittal Ghent
ArcelorMittal Ghent is a fully integrated steel plant which is located along the Ghent-Terneuzen canal, approximately 17 kilometers from the Terneuzen sea lock, which links the works directly with the North Sea. The canal is of the Panamax type and can accommodate ships of up to 65,000 tonnes. ArcelorMittal Ghent produces high added-value flat steel products. A significant part of the production is coated, either by hot dip galvanizing, electro galvanizing or organic coating. ArcelorMittal Ghent also includes one organic coating line located in Geel and one electro galvanizing line located in Genk. ArcelorMittal Ghent’s products are mainly used in the automotive industry and in household appliances, tubes, containers, radiators and construction.
ArcelorMittal has finalized the construction of two industrial scale plants at its site in Ghent in the framework of the Carbalyst and Torero projects which are leveraging breakthrough smart carbon technologies to enable the use of circular carbon. See “Business overview—Sustainable development—Climate change and decarbonization".
Additionally, ArcelorMittal Belgium has commissioned its Torero plant, which converts waste wood into bio-coal for use in the blast furnace at its Gent steelmaking site; see “Business overview—Sustainable development—Climate change and decarbonization".
ArcelorMittal Belgium is planning to reduce carbon emissions by 3.0 million tonnes per year by 2030 by building a 2.5 million-tonnes per year DRI plant and 2 EAF facilities at its Ghent site. The project is currently progressing through FEED stage; see “Business overview—Sustainable development—Climate change and decarbonization".
ArcelorMittal Liège
The finishing facilities of ArcelorMittal Liège are located west of Liège. ArcelorMittal Liège produces a wide range of innovative products to meet the demanding needs of companies in the automotive industry and industrial domestic appliances. The operating assets in Liège include the continuous annealing line 1, hot dip galvanizing line 7 and line 8 (Eurogal), the electrogalvanizing line 5 and the two organic coating lines, line 2 and line 7 (combiline with hot dip galvanizing line 7). It also includes the Jet Vapor Deposition ("JVD") line, a world-class innovative line coats moving strips of steel in a vacuum chamber by vaporizing zinc onto the steel at high speed to produce coated steels for automotive and other industrial applications.
During 2023, BF#A at Ghent was stopped for a reline from September 15, 2023 to December 10, 2023.
ArcelorMittal Bremen
ArcelorMittal Bremen is situated on the bank of the Weser River north of Bremen, Germany. ArcelorMittal Bremen produces and sells a wide range of products including slab, hot rolled, pickled, cold rolled and hot dip galvanized rolls to the automotive and primary transformation sectors.
ArcelorMittal is planning to build a large-scale industrial plant for the DRI based steelmaking at its site in Bremen, as well as EAFs in Bremen and in Eisenhüttenstadt. The projects are currently progressing through FEED stage; see “Business overview—Sustainable development—Climate change and decarbonization".
During 2023, BF#2 at Bremen was stopped for planned maintenance from beginning October to early December 2023.
ArcelorMittal Méditerranée
ArcelorMittal Méditerranée operates a flat carbon steel plant in Fos-sur-Mer. It also operates a finishing facility for electrical steel located in Saint-Chély d’Apcher, 300 kilometers northwest of Fos-sur-Mer. The Fos-sur-Mer plant is located 50 kilometers west of Marseille on the Mediterranean Sea.
ArcelorMittal Méditerranée’s products include coils to be made into wheels, pipes for energy transport and coils for finishing facilities for exposed and non-exposed parts of car bodies, as well as for the construction, home appliance, packaging, pipe and tube, engine and office material industries. About 69% of its products are shipped from a private wharf, in part through a
97
| Management report | ||
shuttle system, and 24% of its products are shipped by rail, with the remaining amount transported by truck.
The Saint-Chély d’Apcher plant produces electrical steel (with up to 3.2% silicon content), mainly for electrical motors.
Blast furnace #2 at the Fos-sur-Mer site was temporarily idled in December 2022 in response to market conditions and was subsequently restarted in April 2023. Blast furnace #1 at Fos-sur-Mer was temporarily idled in September 2023 due to low market demand.
ArcelorMittal España
ArcelorMittal España includes the two main facilities of Avilés and Gijón, which are connected by ArcelorMittal España’s own railway system. These two facilities operate as a single integrated steel plant. The product range of ArcelorMittal España includes rail, wire rod, heavy plates and hot rolled coil, as well as more highly processed products such as hot dip and electro galvanized sheet, tinplate and organic coated sheet. The facilities are also connected by rail to the region’s two main ports, Avilés and Gijón. Raw materials are received at the port of Gijón, where they are unloaded at a dedicated dry-bulk terminal, which is linked to steel-making facilities by conveyor belt. A variety of products are shipped through the Avilés port facilities to other units of the Group and to ArcelorMittal España’s customers.
ArcelorMittal is planning to invest €1 billion in decarbonization technologies at ArcelorMittal Asturias’ plant in Gijón, which includes the construction of a 2.3 million tonne hydrogen DRI. The Company is also planning to construct a new EAF for long products, for which ArcelorMittal España signed a contract with industrial engineering company Sarralle in November 2023. See “Business overview—Sustainable development—Climate change and decarbonization".
Blast furnace A in Gijón was temporarily stopped in September 2022 in response to market conditions and was restarted in February 2023. However, it was stopped again at the end of March 2023 due to a fire at the Gijón plant, and was restarted in July 2023 after undergoing repairs.
ArcelorMittal Poland
ArcelorMittal Poland is the largest steel producer in Poland and includes six plants located in Silesia, Malopolska and Opolskie province. ArcelorMittal Poland’s Zdzieszowice coke plant produces and supplies coke to ArcelorMittal subsidiaries and third parties.
ArcelorMittal Poland produces a wide range of steel products, including both long and flat products such as slabs, billets, blooms, sections, sheet piles, rails up to 120 meters long, railway accessories, mining supports sections, hot rolled coils, sheets and strips, cold rolled coils, sheets and strips, hot dip
galvanized coils and sheets, wire rods and organic coated sheets and coils. Products are mainly sold in the domestic Polish market, while the remainder is exported, primarily to customers located in other EU member states. ArcelorMittal Poland’s principal customers are in the construction, engineering, transport, mining and automotive industries. Following the permanent closure in November 2020 of its blast furnace and steel plant in Kraków, the coke plant continued to operate, as did its downstream operations (two rolling mills, the hot dip galvanizing line and the new organic coating line). The slabs for the rolling mills in Kraków are supplied mainly from the steel shop in Dabrowa Górnicza where the Company is investing in debottlenecking projects and to produce special grades for further processing into grain-oriented steel.
In November 2023, ArcelorMittal Poland announced its decision to adjust coke production levels to the difficult economic conditions. The company is going to hot idle the coke oven battery in Kraków due to low demand and coke pricing dynamics.
Blast furnace #3 at Dąbrowa Górnicza site was temporarily stopped in September 2022 in response to market conditions. It was subsequently restarted in January 2023 as preparation for maintenance outage of blast furnace #2, which was completed in the third quarter of 2023.
ArcelorMittal Eisenhüttenstadt
ArcelorMittal Eisenhüttenstadt is situated on the Oder river near the German-Polish border, 110 kilometers southeast of Berlin. ArcelorMittal Eisenhüttenstadt is a fully integrated and highly-automated flat steel producing plant. The facility runs with one medium-sized blast furnace.
ArcelorMittal Eisenhüttenstadt produces and sells a wide range of flat steel products, including hot rolled, cold rolled, electrical and hot dip galvanized and organic coated coils to automotive, distribution, metal processing, construction and appliances industry customers in Germany, Central and Eastern Europe.
ArcelorMittal has plans for an innovative DRI pilot plant and an EAF in Eisenhüttenstadt; see "ArcelorMittal Bremen" above.
ArcelorMittal Belval & Differdange
ArcelorMittal Belval & Differdange produces a wide range of sections and sheets piles which are sold to the local European construction market as well as for export. With its Rodange facilities, it also produces a wide range of rails, special sections and heavy angles.
On October 21, 2021, a floating solar farm installed on a former cooling pond belonging to ArcelorMittal Differdange was commissioned. It consists of 25,000 square meters of solar panels, with a surface area of 5.7 hectares. Since October 2021, the floating solar farm has been producing 3 GWh/year of
98
| Management report | ||
electricity and powers nearly 800 local homes, which represents the approximate annual electricity usage of 3,200 people. The electricity produced on the floating solar farm is fed into the Creos’s local grid and contributes to Luxembourg’s energy self-sufficiency.
On June 16, 2023, ArcelorMittal confirmed its plan to invest €67 million in a new EAF at its Belval site. This investment is part of a series of projects that were the subject to a MoU signed in September 2022 between ArcelorMittal Luxembourg and the Ministry of the Economy. The MoU confirmed the willingness of the Luxembourg government to financially support this type of strategic investment through the various applicable aid mechanisms. For this project in particular, the subsidies made available by the Luxembourg State amount to approximately €15 million. The new Belval EAF is one of the flagship projects of this MoU. It will offer improved energy efficiency and an increase in steel production capacity in Luxembourg of almost 15%, reaching 2.5 million tonnes of steel per year. With this new facility replacing the current EAF which has been in operation since 1997 and with additional investments to be made in other areas of the Belval steel plant, ArcelorMittal Luxembourg plants will be self-sufficient in crude steel production capacity to cover the needs of finished rolled products in Luxembourg. In particular, Mill A at the ArcelorMittal Rodange site will henceforth be supplied exclusively by this new installation for the production of its numerous ranges of rails and niche products. The installation of the new electric furnace in Belval began in the fourth quarter of 2023, with commissioning expected in 2025. See "Introduction—Sustainable development highlights - striving to be a leader in the decarbonization of the steel industry".
ArcelorMittal Hamburg
ArcelorMittal Hamburg produces billet and high quality wire rod and its products are mainly sold in the European market, primarily to automotive and engineering customers.
The Hamburg site already operates Europe’s only DRI-EAF plant. ArcelorMittal Hamburg has a project underway to construct a demonstration plant in order to test the ability of hydrogen to reduce iron ore into DRI on an industrial scale, and to test carbon-free DRI in the EAF steelmaking process; see “Business overview—Sustainable development—Climate change and decarbonization".
The DRI plant at the Hamburg site was temporarily stopped in September 2022 in response to market conditions and for general repair and maintenance and restarted operations in May 2023 until early October 2023 in order to utilize the existing iron ore pellet stock and free up storage capacity for new incoming DRI supplies. Revamping of the DRI plant began in October 2023 and production is expected to restart in early May 2024.
ArcelorMittal Olaberria-Bergara
The Olaberría-Bergara facilities produce billets and sections. The Olaberría facility's products are sold to the local construction market as well as to export markets, while the Bergara facility’s products are sold primarily to the local European construction market.
ArcelorMittal Duisburg
ArcelorMittal Duisburg produces blooms, billets, bars and high quality wire rod and its products are mainly sold in the European market primarily to automotive, railway and engineering customers.
ArcelorMittal Downstream Solutions ("AMDS")
The Europe segment also includes AMDS, which primarily covers the downstream activities of ArcelorMittal in Europe. It provides distribution of long and flat products as well as value-added and customized steel solutions through further processing to meet specific customer requirements. In addition, specific solutions are dispatched through other business lines, primarily ArcelorMittal Construction, ArcelorMittal Projects, ArcelorMittal Tubular Products, ArcelorMittal Wire Solutions and ArcelorMittal International.
AMDS also includes Industeel, with facilities in Belgium and in France. Industeel Belgium and Industeel Creusot are designed to produce special steel plates, ranging from 5 to 180 millimeters in thickness, including stainless steel products, while Industeel Loire is dedicated to extra heavy gauge products of alloyed carbon steel. Euroform operates hot forming facilities, mainly to transform extra heavy gauge products received from Industeel Loire. The R&D center in Le Creusot, France is fully dedicated to special plate products development.
Furthermore, AMDS includes the scrap recycling activity combining 3 specialist scrap metal recycler assets acquired in 2022 (John Lawrie Metals, ALBA) and 2023 (Riwald) with 1.3 million tonnes scrap processing capacity which will enhance the Company's scrap supply security and sufficiency in the framework of its decarbonization strategy. See "Introduction—Key transactions and events in 2023".
99
| Management report | ||
In November 2023, ArcelorMittal announced its entry into the additive manufacturing market as a steel powder supplier. The Company is currently building an industrial scale inert gas atomizer in Aviles, Spain to produce steel powders for additive manufacturing ("AdM") technologies such as laser powder bed fusion (LPBF), binder jetting (BJ) and direct energy deposition (DED). The atomizer started production in the first quarter of 2024, will have a large batch-size production capability, from 200 kg to 3 tonnes, and an initial annual capacity of 1000 tonnes. This will enable ArcelorMittal to supply significant volumes of steel powders with consistent quality, reliability and traceability, meeting the high standards and specifications of the AdM industry. A new business unit, ArcelorMittal Powders, has been established to commercialize the output of the atomizer. See "Introduction—Sustainable development highlights - striving to be a leader in the decarbonization of the steel industry".
In November 2023, ArcelorMittal Tubular Products Europe announced its plans to stop producing pipes at its Kraków plant
as from the first quarter of 2024 in response to market volatility and the intention to reduce its carbon footprint.
ArcelorMittal Prijedor
ArcelorMittal Prijedor is an iron ore open pit mining operation located in Bosnia and Herzegovina, near the town of Prijedor. The mine is a joint venture in which ArcelorMittal owns 51% and the other 49% is owned by the local iron ore mine Ljubija. The ore is excavated at the Omarska mine and processed in the processing plant. The mine supplies its final product, iron ore lumps and concentrate, to ArcelorMittal's steel plant, ArcelorMittal Zenica, located approximately 250 kilometers from Prijedor in central Bosnia.
For further details on ArcelorMittal Prijedor mine production and other information, see "—Mineral reserves and resources".
| ACIS | Crude Steel | |||||||||||||||||||||||||||||||
| Unit | Country | Locations | Production in 2023 (in million tonnes per year) 1 | Type of plant | Products | |||||||||||||||||||||||||||
ArcelorMittal Temirtau JSC 2 | Kazakhstan | Temirtau | 2.8 | Integrated | Flat, Long, Pipes and Tubes | |||||||||||||||||||||||||||
AMKR | Ukraine | Kryvyi Rih | 1.0 | Integrated | Long | |||||||||||||||||||||||||||
ArcelorMittal South Africa 3, 4, | South Africa | Vanderbijlpark, Saldanha, Newcastle, Vereeniging, Pretoria | 2.8 | Integrated Mini-mill Downstream | Flat, Long, Pipes and Tubes | |||||||||||||||||||||||||||
| JSC ArcelorMittal Tubular Products Aktau | Kazakhstan | Aktau | n/a | Downstream | Pipes and Tubes | |||||||||||||||||||||||||||
| Captive mining operations | ||||||||||||||||||||||||||||||||
| Unit | Country | Locations | ArcelorMittal Interest (%) | Type of Mine | Product | |||||||||||||||||||||||||||
AMKR | Ukraine | Kryvyi Rih | 95.1 | Iron Ore Mine (open pit and underground) | Concentrate, lump and sinter feed | |||||||||||||||||||||||||||
ArcelorMittal Temirtau2 | Kazakhstan | Lisakovsk, Kentobe, Atasu, Atansor | 100.0 | Iron Ore Mine (open pit and underground) | Concentrate, lump and fines | |||||||||||||||||||||||||||
ArcelorMittal Temirtau2 | Kazakhstan | Karaganda | 100.0 | Coal Mine (underground) | Metallurgical coal | |||||||||||||||||||||||||||
1.n/a = not applicable (no crude steel production).
2.On December 7, 2023, ArcelorMittal completed the sale of ArcelorMittal Temirtau, its steel and mining operation in Kazakhstan. See note 2.3 to the consolidated financial statements and "Introduction—Key transactions and events in 2023". ArcelorMittal Temirtau's production is included in the table through the transaction closing date.
3.Blast furnace C at Vanderbijlpark plant in ArcelorMittal South Africa was idled in early November 2022 due to weaker market conditions, and was subsequently restarted in early February 2023 once order book improved commercially.
4.On November 28, 2023, ArcelorMittal South Africa announced its plans to wind down its Longs Business, subject to due diligence and consultation processes.
ArcelorMittal South Africa
ArcelorMittal South Africa is one of the largest steel producers in Africa and is listed on the JSE Limited in South Africa.
ArcelorMittal South Africa has four main steel production facilities. Vanderbijlpark, Newcastle and Vereeniging (melt shop placed under care and maintenance at the end of October 2022)
100
| Management report | ||
are located inland, while Saldanha (under care and maintenance since the second quarter of 2020 due to the depressed economic environment) is close to a deep-water port. A metallurgical by-products division (Coke and Chemicals) was reorganized (after closure of coke oven battery #5 in Pretoria in the fourth quarter of 2020) and is now split into two coke-making and by-products operations at the steel production facilities (Vanderbijlpark and Newcastle).
ArcelorMittal South Africa has a diversified range of products and includes hot rolled plates and sheet in coil form, cold rolled sheet, coated sheet, wire rod and sections, as well as forgings. During 2023, 79% of its products were sold in the South African domestic market, while Africa is its largest export market. It also sells into Asia and sells minor tonnage into Europe and the Americas.
Following restart of the Newcastle blast furnace in August 2022 after planned repairs, the EAF at Vereeniging was placed under care and maintenance at the end of October 2022.
Further, the blast furnace C at Vanderbijlpark was idled in early November 2022 and was subsequently restarted in early February 2023 following increased demand in the market.
On November 28, 2023, ArcelorMittal South Africa announced its plans to wind down its Newcastle works and the broader long steel products business subject to due diligence and consultation processes. Since then, the Company has been in discussions with government representatives to determine the extent of state support that could be provided to mitigate or prevent the closure of these operations.
Thabazimbi Iron Ore Mine
The Thabazimbi Iron Ore Mine (Pty) Ltd, located at Thabazimbi, in the Limpopo Province of South Africa, was acquired by ArcelorMittal South Africa in 2018. Thabazimbi Iron Ore Mine currently processes existing stockpiles of iron ore from a run of mine (unbeneficiated) and old plant discard dumps with recoverable iron, with the aim of supplying product to the Vanderbijlpark Steel Works. For further details on Thabazimbi mine, see "—Mineral reserves and resources".
ArcelorMittal Kryvyi Rih
AMKR’s product range includes billets, rebars and wire rods, light sections (angles) and merchant bars (rounds, squares and strips). Its products are sold to a range of industries, such as hardware, construction, re-rolling and fabrication. The markets for its products include Ukraine, CIS, Europe, North Africa, Middle East, North America, South East Asia and Australia.
In addition, AMKR includes an export sales network which supplies a complete range of steel products not only from Kryvyi Rih but also from other plants of the Group to customers outside of their respective home markets.
AMKR also has iron ore captive mines located roughly within the borders of the city of Kryvyi Rih, Ukraine. AMKR operates a concentrating facility, along with two open pit sites and one underground iron ore mine. The iron ore extracted from the Kryvyi Rih mining operations is processed to concentrate, sinter feed and lumps and supplied primarily to the AMKR steel plant, with some concentrate being shipped to other ArcelorMittal entities in Eastern Europe, as well as to third parties. For further details on Ukraine mines production, see "—Mineral reserves and resources".
During 2023, with respect to its steelmaking operations in Kryvyi Rih, the Company continued to ramp up operations and has been operating two of three blast furnaces following the restart of blast furnace No.8 on April 14, 2023. On June 6, 2023, following the destruction of the Nova Kakhovka reservoir's dam, AMKR temporarily suspended steelmaking and production of rolled products to reduce water consumption. As a result, the Company shut down blast furnace No.6 earlier than planned for major planned repairs but continued to operate blast furnace No.8. In July 2023, AMKR announced that it had completed the construction of a new pumping station and four kilometers of pipeline to supply water to the city and to ensure coverage of its production needs. AMKR is currently operating its mining facilities at 60% of capacity and steel facilities at 30% of capacity.
ArcelorMittal Temirtau
On December 7, 2023, ArcelorMittal completed the sale of ArcelorMittal Temirtau; see note 2.3 to the consolidated financial statements and "Introduction—Key transactions and events in 2023".
ArcelorMittal Temirtau’s product range of flat and long steel products included pig iron, continuous caster slabs, continuous caster billets, hot and cold rolled coils and sheets, black plates, covers, tin plates, hot dipped galvanized products, color coated products, welded pipes and rebars. ArcelorMittal Temirtau sold steel products to a range of industries, including the tube and pipe-making sectors, as well as manufacturers of consumer goods and appliances. The main markets for its products included Kazakhstan, CIS, Russia and South-East Asia.
For details on former Kazakhstan mining operations, see "—Mineral reserves and resources".
Mining
ArcelorMittal’s Mining segment has iron ore production facilities in Canada and Liberia. The following table provides an overview of the principal mining operations of ArcelorMittal’s Mining segment. For detailed information regarding ArcelorMittal's Mining segment see "—Mineral reserves and resources".
101
| Management report | ||
| Unit | Country | Locations | ArcelorMittal Interest (%) | Type of Mine | Product | |||||||||||||||||||||||||||
| Iron Ore | ||||||||||||||||||||||||||||||||
| AMMC | Canada | Mt Wright, Fire Lake and Port Cartier, Qc | 85.0 | Iron Ore Mine (open pit), pellet plant, railway and port | Concentrate and pellets | |||||||||||||||||||||||||||
| AML | Liberia | Yekepa | 85.0 | Iron Ore Mine (open pit) | Fines | |||||||||||||||||||||||||||
| Investments in joint ventures | ||||||||||||||||||||||||||||||||
| Unit | Country | Locations | Capacity in 2023 (in million tonnes per year) | Type of plant | Products | |||||||||||||||||||||||||||
| AMNS India | India | Hazira, Gujarat | 8.8 1 | Integrated | Flat | |||||||||||||||||||||||||||
| Acciaierie d'Italia | Italy | Taranto, Genova, Novi Ligure, Socova, Raconiggi, Salerno | 7.8 1, 2 | Integrated and Downstream | Flat, Pipes and Tubes | |||||||||||||||||||||||||||
| AMNS Calvert | United States | Calvert | 5.3 3 | Steel processing | Steel finishing | |||||||||||||||||||||||||||
| VAMA | China | Loudi, Hunan | 2.0 4 | Steel processing | Automotive steel finishing | |||||||||||||||||||||||||||
| Captive mining operations | ||||||||||||||||||||||||||||||||
| Unit | Country | Locations | ArcelorMittal Interest (%) | Type of Mine | Product | |||||||||||||||||||||||||||
| Thakurani Iron Ore Mine | India | Odisha | 60.0 | Iron Ore Mine (open pit) | Lump and fines | |||||||||||||||||||||||||||
Ghoraburhani-Sagasahi | India | Odisha | 60.0 | Iron Ore Mine (open pit) | Lump and fines | |||||||||||||||||||||||||||
1.Crude steel capacity.
2.Reflects design production capacity.
3.Flat-rolled steel products production capacity.
4.Cold rolled coils, aluminized coils, hot dip galvanized coils production capacity.
AMNS India
AMNS India is an integrated flat carbon steel manufacturer - from iron ore to ready-to-market products with achievable crude steel capacity of 8.8 million tonnes per annum. Its manufacturing facilities comprise iron making, steelmaking and downstream facilities spread across India.
In 2019, ArcelorMittal and Nippon Steel Corporation ("NSC"), Japan’s largest steel producer and the third largest steel producer in the world, created a joint venture to own and operate AMNS India with ArcelorMittal holding a 60% interest and NSC holding 40%. Through the agreement, both ArcelorMittal and NSC are guaranteed equal board representation and participation in all significant financial and operating decisions.
AMNS India’s main steel manufacturing facility is located at Hazira, Gujarat in western India. It also has:
–two iron ore beneficiation plants close to the mines in Kirandul and Dabuna, with slurry pipelines that then transport the beneficiated iron ore slurry to the pellet plants in the Kirandul-Vizag and Dabuna-Paradeep systems;
–downstream facilities in Pune, Khopoli and Gandhidham; and
–six service centers in the industrial clusters of Hazira, Indore, Bahadurgarh, Chennai, Kolkata and Pune. It has a complete range of flat rolled steel products, including value added products, and significant iron ore pellet capacity with two main pellet plant systems in Kirandul-Vizag and Dabuna-Paradeep, which have the potential for expansion. Its facilities are located close to ports with deep draft for movement of raw materials and finished goods.
In terms of iron ore pellet capacity, the Kirandul-Vizag system has 8 million tonnes of annual pellet capacity; and the Dabuna-Paradeep system has 12 million tonnes of annual pellet capacity, following completion of expansion early September 2021. This expansion brings pellet capacity above AMNS India’s own requirements and provide the opportunity to improve operating income by fully utilizing such pellet capacity. AMNS India has also made acquisitions of certain ancillary assets including Odisha Slurry Pipeline Infrastructure Limited in July 2020 which secured an important infrastructure asset for raw material supply to the Paradeep pellet plant and Hazira steel plant and a captive power plant at Paradeep in Odisha in January 2021.
102
| Management report | ||
On March 4, 2021, AMNS India and the Odisha government signed a memorandum of understanding for setting up a 12 million tonne integrated steel plant and a jetty in Kendrapara district of Odisha with an investment of INR 50,000 Crore, subject to several pre-conditions, including making provisions for land and iron ore mines. AMNS India is currently engaged in further studies and clearances.
On November 10, 2022, AMNS India completed the acquisition of Uttam Galva Steels Limited subsequently renamed AMNS Khopoli Limited ("AMNSK"), a downstream steel manufacturer in Maharashtra following the approval of the resolution plan by the National Company Law Tribunal ("NCLT") on October 14, 2022.
On August 26, 2022, AMNS India announced that it had reached definitive agreement to acquire port, power plants and other logistics and infrastructure assets in India from the Essar Group for a net value of approximately $2.4 billion. On October 19, 2022, AMNS India completed the acquisition of Essar Power Hazira Limited, corresponding to a 270 MW multi-fuel power plant at Hazira which has a long-term power purchase agreement with AMNS India. On November 15, 2022, AMNS India completed the acquisition of Essar Bulk Terminal Limited, corresponding to a 25 million-tonne per annum jetty at the all-weather, deep draft bulk port terminal at Hazira, Gujarat, captive and adjacent to AMNS India’s flagship steel plant and Essar Bulk Terminal Paradeep Limited, corresponding to a 12 million-tonne per annum deep-water jetty at Paradeep, Odisha along with a dedicated conveyor that handles 100% of pellet shipments from AMNS India’s Paradeep pellet plant.
On March 7, 2023, AMNS India completed the acquisition of a 515 MW gas-based power plant for a cash consideration of $125 million, along with allied land that can be utilized for AMNS India’s expansion plans at Hazira.
On May 6, 2023, AMNS India completed the acquisition of Indian Steel Corporation Limited subsequently renamed AMNS Gandhidham Limited for a cash consideration of $99 million, a downstream steel manufacture in Gandhidham, Gujarat following the approval of the resolution plan by the National Company Law Tribunal (‘’NCLT’’) on April 13, 2023.
AMNS India also expects to complete the acquisition of certain remaining assets subject to receipt of regulatory approvals. Such assets include:
–a 16 million tonne per annum all-weather, deep draft terminal at Visakhapatnam, Andhra Pradesh along with an integrated conveyor connected to AMNS India’s 8 million-tonne per annum iron ore pellet plant in the port city.
–a 100-kilometer Gandhar - Hazira transmission line, connecting AMNS India’s steelmaking complex with the central electricity grid.
The resolution plan submitted for the acquisition of AMNS India in 2018 included a capital expenditure plan of approximately $2.6 billion to be implemented in two stages over six years. The first stage involves investments which increase production of finished steel goods to 7.6 million tonnes per annum. It includes capital expenditure projects with respect to third line CSP caster (completed), Paradeep pellet plant (completed), as well as coke oven, second sinter plant and Dabuna beneficiation plant (in progress). The first stage also includes investment in maintenance to restore current assets, the implementation of an environmental management plan and the implementation of ArcelorMittal’s best practices on raw material sourcing, plant operations, sales and product mix (in particular through greater sophistication of the quality and markets of the steel produced with a focus on developing sales to the automotive industry), people management and health & safety. The second stage involving capital expenditure projects to increase the production of finished steel goods from 7.6 million tonnes per annum to 8.6 million tonnes per annum is now included in the expansion investment plan launched in October 2022 as described in below paragraph.
AMNS India intends to further debottleneck existing operations (steel shop and rolling parts) in the medium term. The first phase of expansion represents capital expenditures of approximately $7.4 billion ($0.8 billion for debottlenecking, $1.0 billion for downstream projects and $5.6 billion for upstream projects) and started in October 2022. It aims to increase production at the Hazira facility to 15 million tonnes of rolled products by the first half of 2026 (Phase 1A) following the construction of two blast furnaces (blast furnace 2 to start in 2025 and blast furnace 3 in 2026), the capacity increase of the existing blast furnace 1 from 2.2 to 2.8 million tonnes per annum and it includes also a CRM2 complex and galvanizing and annealing line, steel shop, hot strip mill and ancillary equipment (including coke, sinter, networks, power, gas, oxygen plant, etc.) and raw material handling. Continuous galvanizing line No. 4 was commissioned in December 2023, which will enable AMNS India to launch the Magnelis product for the growing renewable energy sector. Feasibility studies are ongoing to further increase production in a second phase from 15 to 20 million tonnes per annum (Phase 1B) with greenfield options being explored to further increase to beyond 40 million tonnes.
In terms of mining assets, AMNS India operates the Thakurani mine in the Keonjhar district of Odisha and the Ghoraburhani-Sagasahi mine in the Sudargarh district of Odisha. The Thakurani mine is operating at full 5.5 million tonnes per annum capacity and concentrated material is transported by pipeline from the Dabuna plant to the Paradeep pellet plant, located on the coast at Bay of Bengal. AMNS India commenced the operations at the Ghoraburhani-Sagasahi iron ore mine in September 2021. The mine is set up to gradually ramp up
103
| Management report | ||
production until 2026 to a rated capacity of 7.2 million tonnes per annum. The iron ore final product is supplied to the beneficiation plant in Dabuna from where the feed reaches the pellet plant at Paradeep and contributes significantly to meeting AMNS India’s long-term raw material requirements. For further details on Indian mines production and other information, see " —Mineral reserves and resources".
Acciaierie d'Italia
Acciaierie d'Italia, a joint venture between the Company and Invitalia-Agenzia nazionale per l'attrazione degli investimenti e lo sviluppo d'impresa SpA ("Invitalia"), an Italian state-owned company, is the leading steel producer in Italy, Europe’s second largest steel consuming economy. Acciaierie d'Italia produces high-quality and sustainable steel to be used in a range of vital industry sectors across the domestic steel market such as construction, energy, automotive, home appliances, packaging and transport and for international export. Acciaierie d'Italia has operations across various structurally linked operating sites including Europe’s biggest single-site integrated steel facility in Taranto and rolling mills in Genoa and Novi Ligure. Genoa is also an important hub in terms of intermodal logistics.
On April 14, 2021, pursuant to the investment agreement of December 10, 2020 (the "Investment Agreement") forming a public-private partnership between Invitalia and AM InvestCo Italy SpA ("AM InvestCo", thereupon renamed Acciaierie d'Italia Holding), ArcelorMittal's subsidiary party to the lease and purchase agreement for the Ilva business (the "Ilva Agreement"), Invitalia invested €400 million ($476 million) of new equity into AM InvestCo, providing Invitalia with a 38% shareholding, equal (50%) voting and governance rights and therefore joint control. Accordingly, as of April 14, 2021, the Company derecognized assets and liabilities of Acciaierie d'Italia Holding ("ADI Holding") and its subsidiaries from its consolidated statement of financial position and accounted for its 62% interest in the joint venture under the equity method. The investment agreement stipulated a second equity injection by Invitalia, of up to €680 million, to fund the completion of the purchase of Ilva’s business by Acciaierie d'Italia Holding, subject to certain conditions precedent to be met initially by May 2022.
Certain of these conditions precedent (in particular due to the existence of various judicial measures encumbering the Taranto plant) were not fulfilled by May 31, 2022. Accordingly, on May 31, 2022, the parties entered into amendments to the Ilva Agreement and the Investment Agreement to, among other changes, extend the longstop date for the fulfillment of the conditions precedent (and, therefore, the term of the lease of the Ilva business) as well as the second equity injection by Invitalia to May 31, 2024. At the end of December 2022, in order to address the financial consequences on the Acciaierie d’Italia group of the unprecedented spike in energy costs caused by the Ukraine crisis, ArcelorMittal, the Italian Government and Invitalia
agreed, among other things, to accelerate the funding originally envisaged to occur in connection with the acquisition of Ilva’s assets, consisting in particular of €680 million from Invitalia and €70 million from ArcelorMittal (corresponding to an equivalent amount of receivables towards the Acciaierie d’Italia Group), in the form of a convertible shareholder loan made available on February 14, 2023, as a result of which, upon conversion, Invitalia’s stake in ADI Holding would be increased to 60% and ArcelorMittal’s would reduce to 40%.
On February 20, 2024, the Italian Government issued a decree placing Acciaierie d’Italia into extraordinary administration subsequent to the request of Invitalia, thereby passing control of the company from its current shareholders, ArcelorMittal and Invitalia, to government appointed commissioners. This ended ArcelorMittal’s strategic involvement in Acciaierie d’Italia. See "Introduction—Risk factors—ArcelorMittal faces risks in relation to its interest in ArcelorMittal Italia (renamed Acciaierie d'Italia) (“ADI”), which has been placed in a special form of insolvency proceedings (extraordinary administration)."
Calvert
AMNS Calvert ("Calvert"), a joint venture between the Company and NSC, is a steel processing plant in Calvert, Alabama, United States. Its 2,500 acre property layout allows for optimal product flow and room to expand. It has a HSM with 5.3 million tonnes capacity, pickling and cold rolling facilities with 3.6 million tonnes capacity and finishing facilities with a total capacity of 2.1 million tonnes. Calvert had a 6-year agreement to purchase 2 million tonnes of slabs annually from ThyssenKrupp Steel USA ("TK CSA"), subsequently acquired by Ternium S.A. in December 2017, an integrated steel mill complex located in Rio de Janeiro, Brazil, using a market-based price formula. The slab purchase agreement with Ternium was finished with last purchases concluded in May 2021. The remaining slabs for Calvert's operations are sourced from ArcelorMittal plants in Brazil and Mexico and from ArcelorMittal USA, which following the divestment to Cleveland-Cliffs, entered on December 9, 2020 into a new five-year agreement with Calvert (with an automatic three-year extension unless either party provides notice of intent to terminate) for 1.5 million tons annually for the initial term and 0.55 million tons annually under the extension and which, in each case, can be reduced with a six-month notice. ArcelorMittal is principally responsible for marketing the product on behalf of the joint venture. Calvert serves the automotive, construction, pipe and tube, service center and appliance/ HVAC industries.
Calvert plans to invest approximately $1 billion for an on-site steelmaking facility through a 1.5 million tonnes capacity EAF (producing slabs for the existing operations and replacing part of the purchased slabs). Construction commenced in March 2021 after obtaining all environmental permits, and the facility is expected to start in the second half of 2024 (extended mainly due to enlarged scope). Equipment erection is in progress and
104
| Management report | ||
commissioning of utilities is being planned. The plan includes an option to add further capacity of 1.5 million tonnes at lower capital expenditure intensity.
VAMA
Valin ArcelorMittal Automotive Steel (“VAMA”) is a joint venture between ArcelorMittal and Hunan ValinSteel Co., Ltd which produces steel (1.5 million tonne capacity) for high-end applications in the automotive industry. VAMA supplies international automakers and first-tier suppliers as well as Chinese car manufacturers and their supplier networks. It is well positioned to take advantage of the growing electric vehicle market, and in February 2021 a project was launched to increase its capacity by 40% to 2 million tonnes with self-funded expansion involving capital expenditures of $195 million. The capital expenditures related to new continuous hot galvanizing line ("CGL") capacity of 450 thousand tonnes per year to reach 1.6 million tonnes per year in CGL/CAL combined capacity and 2.0 million tonnes per year in pickling line and tandem cold mill ("PLTCM"). First commercial coil was produced on January 3, 2023 and commercial production began in April 2023. The project is currently at an advanced stage of implementation. Equipment is currently in the ramp-up phase which is expected to be completed by the second half of 2024.
ZAM (Zinc Aluminium and Magnesium) pot installment was completed in the second quarter of 2023 and is ready for commissioning once TLC (technology license contract) with ArcelorMittal is completed. The leadership of ArcelorMittal and HNIS reached another agreement for HRC substrate pricing and TLC in January 2024. The working team will finalize the agreement in the first quarter or 2024, which will earmark licensing of new products and coatings including Magnelis®.
Ventos de Santo Antonio
On April 18, 2023, ArcelorMittal announced that ArcelorMittal Brasil, would form the joint venture partnership Ventos de Santo Antonio Comercializadora de Energia S.A. ("VdSA") with Casa dos Ventos, one of Brazil’s largest developers and producers of renewable energy projects, to develop a 554 MW wind power project. ArcelorMittal Brasil holds a 55% stake in the joint venture, with Casa dos Ventos holding the remaining 45%. The transaction was approved by the Brazilian antitrust authority, CADE, on April 13 and was completed on May 5, 2023. The $0.8 billion project aims to secure and decarbonize a considerable proportion of ArcelorMittal Brasil’s future electricity needs and is estimated to provide 38% of ArcelorMittal’s Brasil’s total electricity needs in 2030 pursuant to a 20-year power purchase agreement to be entered into with the JV for the supply of electricity. The project would benefit from the attractive tax incentives in Brazil especially for renewable projects which supports improved return on investment. VdSA is equity accounted and ArcelorMittal’s total equity investment will be $0.15 billion. The project is located in the central region of Bahia, in north-east Brazil. The site location has been selected due to several competitive advantages, including high-capacity forecast load factors (in excess of 50%) and a short distance (23 kilometers) to connect to the national electricity grid. There is also the potential to expand the capacity of the project by adding a further 100 MW of solar power. Environmental and regulatory permitting is in the process of finalization; construction work started in 2023 with operational commissioning expected in 2025. See "Introduction-Key transactions and events in 2023".
Capital expenditures
The Company’s capital expenditures were $4.6 billion, $3.5 billion and $3.0 billion for the years ended December 31, 2023, 2022 and 2021, respectively. The following table summarizes the Company’s principal growth and optimization projects involving significant capital expenditures that are currently ongoing. In 2024, capital expenditures are expected to be in the range of $4.5 to 5.0 billion of which $1.4 to $1.5 billion is expected as strategic growth capital expenditure. ArcelorMittal expects to fund these capital expenditures primarily through internal sources. See “Operating and financial review—Liquidity and capital resources—Sources and uses of cash—Net cash used in investing activities” and note 3.1 to the consolidated financial statements for further information, including capital expenditures by segment.
105
| Management report | ||
| Ongoing Projects* | ||||||||||||||||||||||||||||||||
| Segment | Site / Unit | Project | Capacity / particulars | Key date / Forecast completion | Note # | |||||||||||||||||||||||||||
| Brazil | ArcelorMittal Vega Do Sul | Expansion project | Increase hot dipped / cold rolled coil capacity and construction of a new 700 thousand tonne continuous annealing line ("CAL") and continuous galvanizing line ("CGL") combiline | First half 2024 | a | |||||||||||||||||||||||||||
| Brazil | Monlevade | Sinter plant, blast furnace and melt shop | Increase in liquid steel capacity by 1 million tonnes per year; sinter feed capacity of 2.25 million tonnes per year | Second half 2026 | b | |||||||||||||||||||||||||||
| Brazil | Serra Azul mine | 4.5 million tonnes per year direct reduction pellet feed plant | Facilities to produce 4.5 million tonnes per year DRI quality pellet feed by exploiting compact itabirite iron ore | Second half 2024 | c | |||||||||||||||||||||||||||
| Brazil | Barra Mansa | Section mill | Increase capacity of HAV bars and sections by 0.4 million tonnes per year | Second half 2024 | d | |||||||||||||||||||||||||||
| Europe | Mardyck (France) | New Electrical Steels production facilities | Facilities to produce 170 thousand tonnes non-grain oriented electrical steels (of which 145 thousand tonnes for auto applications) consisting of annealing and pickling line (APL), reversing mill (REV) and annealing and varnishing (ACL) lines | Second half 2024 (ACL) | e | |||||||||||||||||||||||||||
| Europe | Gijón (Spain) | 1.1 million tonnes EAF project | Construction of a new 1.1 million tonnes per year EAF to enable the production of low carbon-emissions steel for the long products sector, specifically rails and wire rod | First half 2026 | f | |||||||||||||||||||||||||||
| NAFTA | Las Truchas mine (Mexico) | Revamping and capacity increase to 2.3 million tonnes per year | Revamping project with 1 million tonnes per year pellet feed capacity increase (to 2.3 million tonnes per year) with DRI concentrate grade capability | Second half 2025 | g | |||||||||||||||||||||||||||
| Mining | Liberia | Phase 2 premium product expansion project | Increase production capacity targeting 15 million tonnes per year | Fourth quarter 2024 (first concentrate) | h | |||||||||||||||||||||||||||
Others | Andhra Pradesh (India) | Renewable energy project | 975 MW of nominal capacity solar and wind power | First half 2024 | i | |||||||||||||||||||||||||||
Joint ventures | ||||||||||||||||||||||||||||||||
AMNS India | Hazira (Gujarat) | Expansion project | Debottlenecking existing assets; AMNS India medium-term plans are to expand and grow initially to approximately 15 million tonnes per year by early 2026 in Hazira (phase 1A); ongoing downstream projects; (Phase 1B to 20 million tonnes per year planned; plans for expansion to 24 million tonnes per year (including 1.5 million tonnes per year long capacity) under preparation; additional greenfield opportunities under development | First half 2026 | j | |||||||||||||||||||||||||||
AMNS Calvert (US) | Calvert | New 1.5 million tonnes EAF and caster | New 1.5 million tonnes per year EAF and caster | Second half 2024 | k | |||||||||||||||||||||||||||
*Ongoing projects refer to projects for which construction has begun (excluding various projects that are under development), even if such projects have been placed on hold pending improved operating conditions.
a.The Vega Do Sul expansion project aims to serve the growing domestic market. The approximately $0.35 billion investment program (and the option to add approximately 100 thousand tonnes organic coating line to serve construction and appliance segments) will upon completion strengthen ArcelorMittal’s position in the fast growing automotive and industry markets through AHSS products. The pickling line and tandem cold mill produced their first coil in June 2023 while continuous galvanizing and continuous annealing lines are expected to be completed in the first half of 2024.
b.The Monlevade upstream expansion project has recommenced in late 2021. Capital expenditure is estimated at $0.8 billion.
c.The project represents an investment of approximately $350 million. The DRI quality pellet feed is expected to primarily supply ArcelorMittal Mexico steel operations. All administrative buildings are delivered; industrial civil works and mechanical assembly are in progress.
d.The aim of the $0.25 billion investment in sections mill at Barra Mansa (Brazil) is to deliver higher added value products ("HAV") (merchant bar and special bars) to increase domestic market share in HAV products and to enhance profitability.
e.ArcelorMittal, with the support of the French government, is creating a new production unit for electrical steels at its Mardyck site in the north of France. This new unit will specialize in the production of electrical steels for the engines of electric vehicles and which complements ArcelorMittal’s existing electrical steels plant in Saint-Chély
106
| Management report | ||
d’Apcher, in the south of France. The completion of the $0.5 billion investment program will occur in 2 steps: the commissioning and start of ramp-up of the end-of-streamline (annealing and coating line and related installations) is expected in the second half of 2024; the start-up of the APL and the REV is expected to occur in the second quarter of 2025.
f.See “Business overview—Sustainable development—Climate change and decarbonization".
g.The approximately $0.15 billion investment project will enable concentrate production to the blast furnace route (2.0 million tonnes per year) and DRI route (0.3 million tonnes per year) for a total of 2.3 million tonnes per year. Primary target is to supply ArcelorMittal Mexico steel operations with high quality feed. Due to delay in equipment delivery and construction works, production is expected to start in the second half of 2025.
h.ArcelorMittal Liberia has been operating at 5 million tonnes of direct shipping ore ("DSO") since 2011 (Phase 1). The Company restarted construction of a concentrator and associated infrastructure (Phase 2) that targets 15 million tonnes per annum of premium iron ore product. Deliveries of key equipment, structure, concentrator/material handling systems and construction is progressing to plan. Capital expenditure required to conclude the project sustaining an extended mine life producing 65% grade product is expected at $1.4 billion. Large resource supports a potential future increase in capacity; in this respect a plan for the phased development of up to 30 million tonnes per year capacity is being studied (including part or full DRI quality concentrate production). Subsequently to first concentrate, full completion is expected to occur in fourth quarter of 2025.
i.See “Business overview—Sustainable development—Climate change and decarbonization".
j.See “—Investments in joint ventures".
k.See “—Investments in joint ventures".
In addition, in 2023, the Company approved 26 multi-year projects with identified environmental benefits and involving capital expenditures of $291 million and 46 multi-year projects with identified energy benefits and involving capital expenditure of $1,716 million (including renewable energy projects in India). The latter also includes 23 multi-year projects specifically targeted to decarbonization involving capital expenditures of $729 million. Capital expenditures related to decarbonization initiatives amounted to $0.2 billion for the year ended December 31, 2023 and are expected to increase to between $0.3 to $0.4
billion in 2024. See also further information on key environmental projects in "Business overview—Sustainable development".
ArcelorMittal's joint ventures have also announced significant capital expenditure projects. See "Property, plant and equipment—Investments in joint ventures" and "Property, plant and equipment—Capital expenditures".
Mineral reserves and resources
ArcelorMittal has iron ore production facilities in Canada, Mexico, South America, Europe, Africa, Ukraine and in India through its joint venture AMNS India. ArcelorMittal also operated iron ore and coal production facilities in Kazakhstan, which were sold on December 7, 2023. See "Introduction— Key transactions and events in 2023" and note 2.3 to the consolidated financial statements for further information. The Company has two categories of mining operations, namely captive mines, and seaborne oriented operations. Captive mines, whose production is mainly consumed by their respective steel segments, form part of such segments. The seaborne iron ore mining operations at AMMC and AML correspond to the Mining segment.
ArcelorMittal considers its iron ore mining operations in aggregate to be material to its business.
The following table provides an overview of ArcelorMittal’s principal mining operations. The production of Run of Mine ("ROM") iron ore and coal is that which is attributable to ArcelorMittal, based on ArcelorMittal's ownership interest in the mining operations. All production figures below are stated as wet tonnages.
107
| Management report | ||
| Operations/Projects | Segment | % of Ownership Interest | Type of Ownership Interest | In Operation Since | ||||||||||||||||||||||
| Iron Ore | ||||||||||||||||||||||||||
| Mexico (Excluding Peña Colorada) | NAFTA | 100.0 | subsidiary | 1976 | ||||||||||||||||||||||
| Peña Colorada - Mexico | NAFTA | 50.0 | joint operation | 1974 | ||||||||||||||||||||||
| Brazil | Brazil | 100.0 | subsidiary | 1944 | ||||||||||||||||||||||
| Bosnia | Europe | 51.0 | subsidiary | 2008 | ||||||||||||||||||||||
| AMKR Open Pit | ACIS | 95.1 | subsidiary | 1959 | ||||||||||||||||||||||
| AMKR Underground | ACIS | 95.1 | subsidiary | 1933 | ||||||||||||||||||||||
Kazakhstan Open Pit1 | ACIS | 100.0 | subsidiary | 1976 | ||||||||||||||||||||||
Kazakhstan Underground1 | ACIS | 100.0 | subsidiary | 1956 | ||||||||||||||||||||||
| AML | Mining | 85.0 | subsidiary | 2011 | ||||||||||||||||||||||
| AMMC | Mining | 85.0 | subsidiary | 1976 | ||||||||||||||||||||||
| India | Not Consolidated | 60.0 | joint venture | 1961 | ||||||||||||||||||||||
| Baffinland | Not Consolidated | 25.2 | associate | 2014 | ||||||||||||||||||||||
2021 aggregate ROM iron ore production, millions of tonnes | 115.1 | |||||||||||||||||||||||||
2022 aggregate ROM iron ore production, millions of tonnes | 102.5 | |||||||||||||||||||||||||
2023 aggregate ROM iron ore production, millions of tonnes1 | 98.4 | |||||||||||||||||||||||||
| Coal | ||||||||||||||||||||||||||
| Karaganda - Kazakhstan | ACIS | 100.0 | subsidiary | 1956 | ||||||||||||||||||||||
2021 aggregate ROM coal production, millions of tonnes | 8.3 | |||||||||||||||||||||||||
2022 aggregate ROM coal production, millions of tonnes | 7.0 | |||||||||||||||||||||||||
2023 aggregate ROM coal production, millions of tonnes1 | 5.8 | |||||||||||||||||||||||||
Summary of ArcelorMittal’s Mining Operations
ArcelorMittal's iron ore mining operations include the captive mines of the NAFTA, Brazil, Europe and ACIS segments and AMMC and AML in the Mining segment. ArcelorMittal has either 100%, equal or majority interest in these mining operations. In addition, the Company owns a 60% interest in the AMNS India joint venture and has a 25.23% non-controlling interest in Baffinland. ArcelorMittal's mining operations included full ownership of the captive iron ore and coal mines in Kazakhstan forming part of the ACIS segment, until the sale of ArcelorMittal Temirtau.
108
| Management report | ||
Iron ore operations
NAFTA
ArcelorMittal Mexico Mining Assets
ArcelorMittal Mexico operates three iron ore mines in Mexico, the San José and Las Truchas mines, and through a joint
operation with Ternium, the Peña Colorada mine. In 2019, the El Volcan mine was closed and ArcelorMittal continues to operate certain parts of the El Volcan facilities to process material coming from the San José mine.
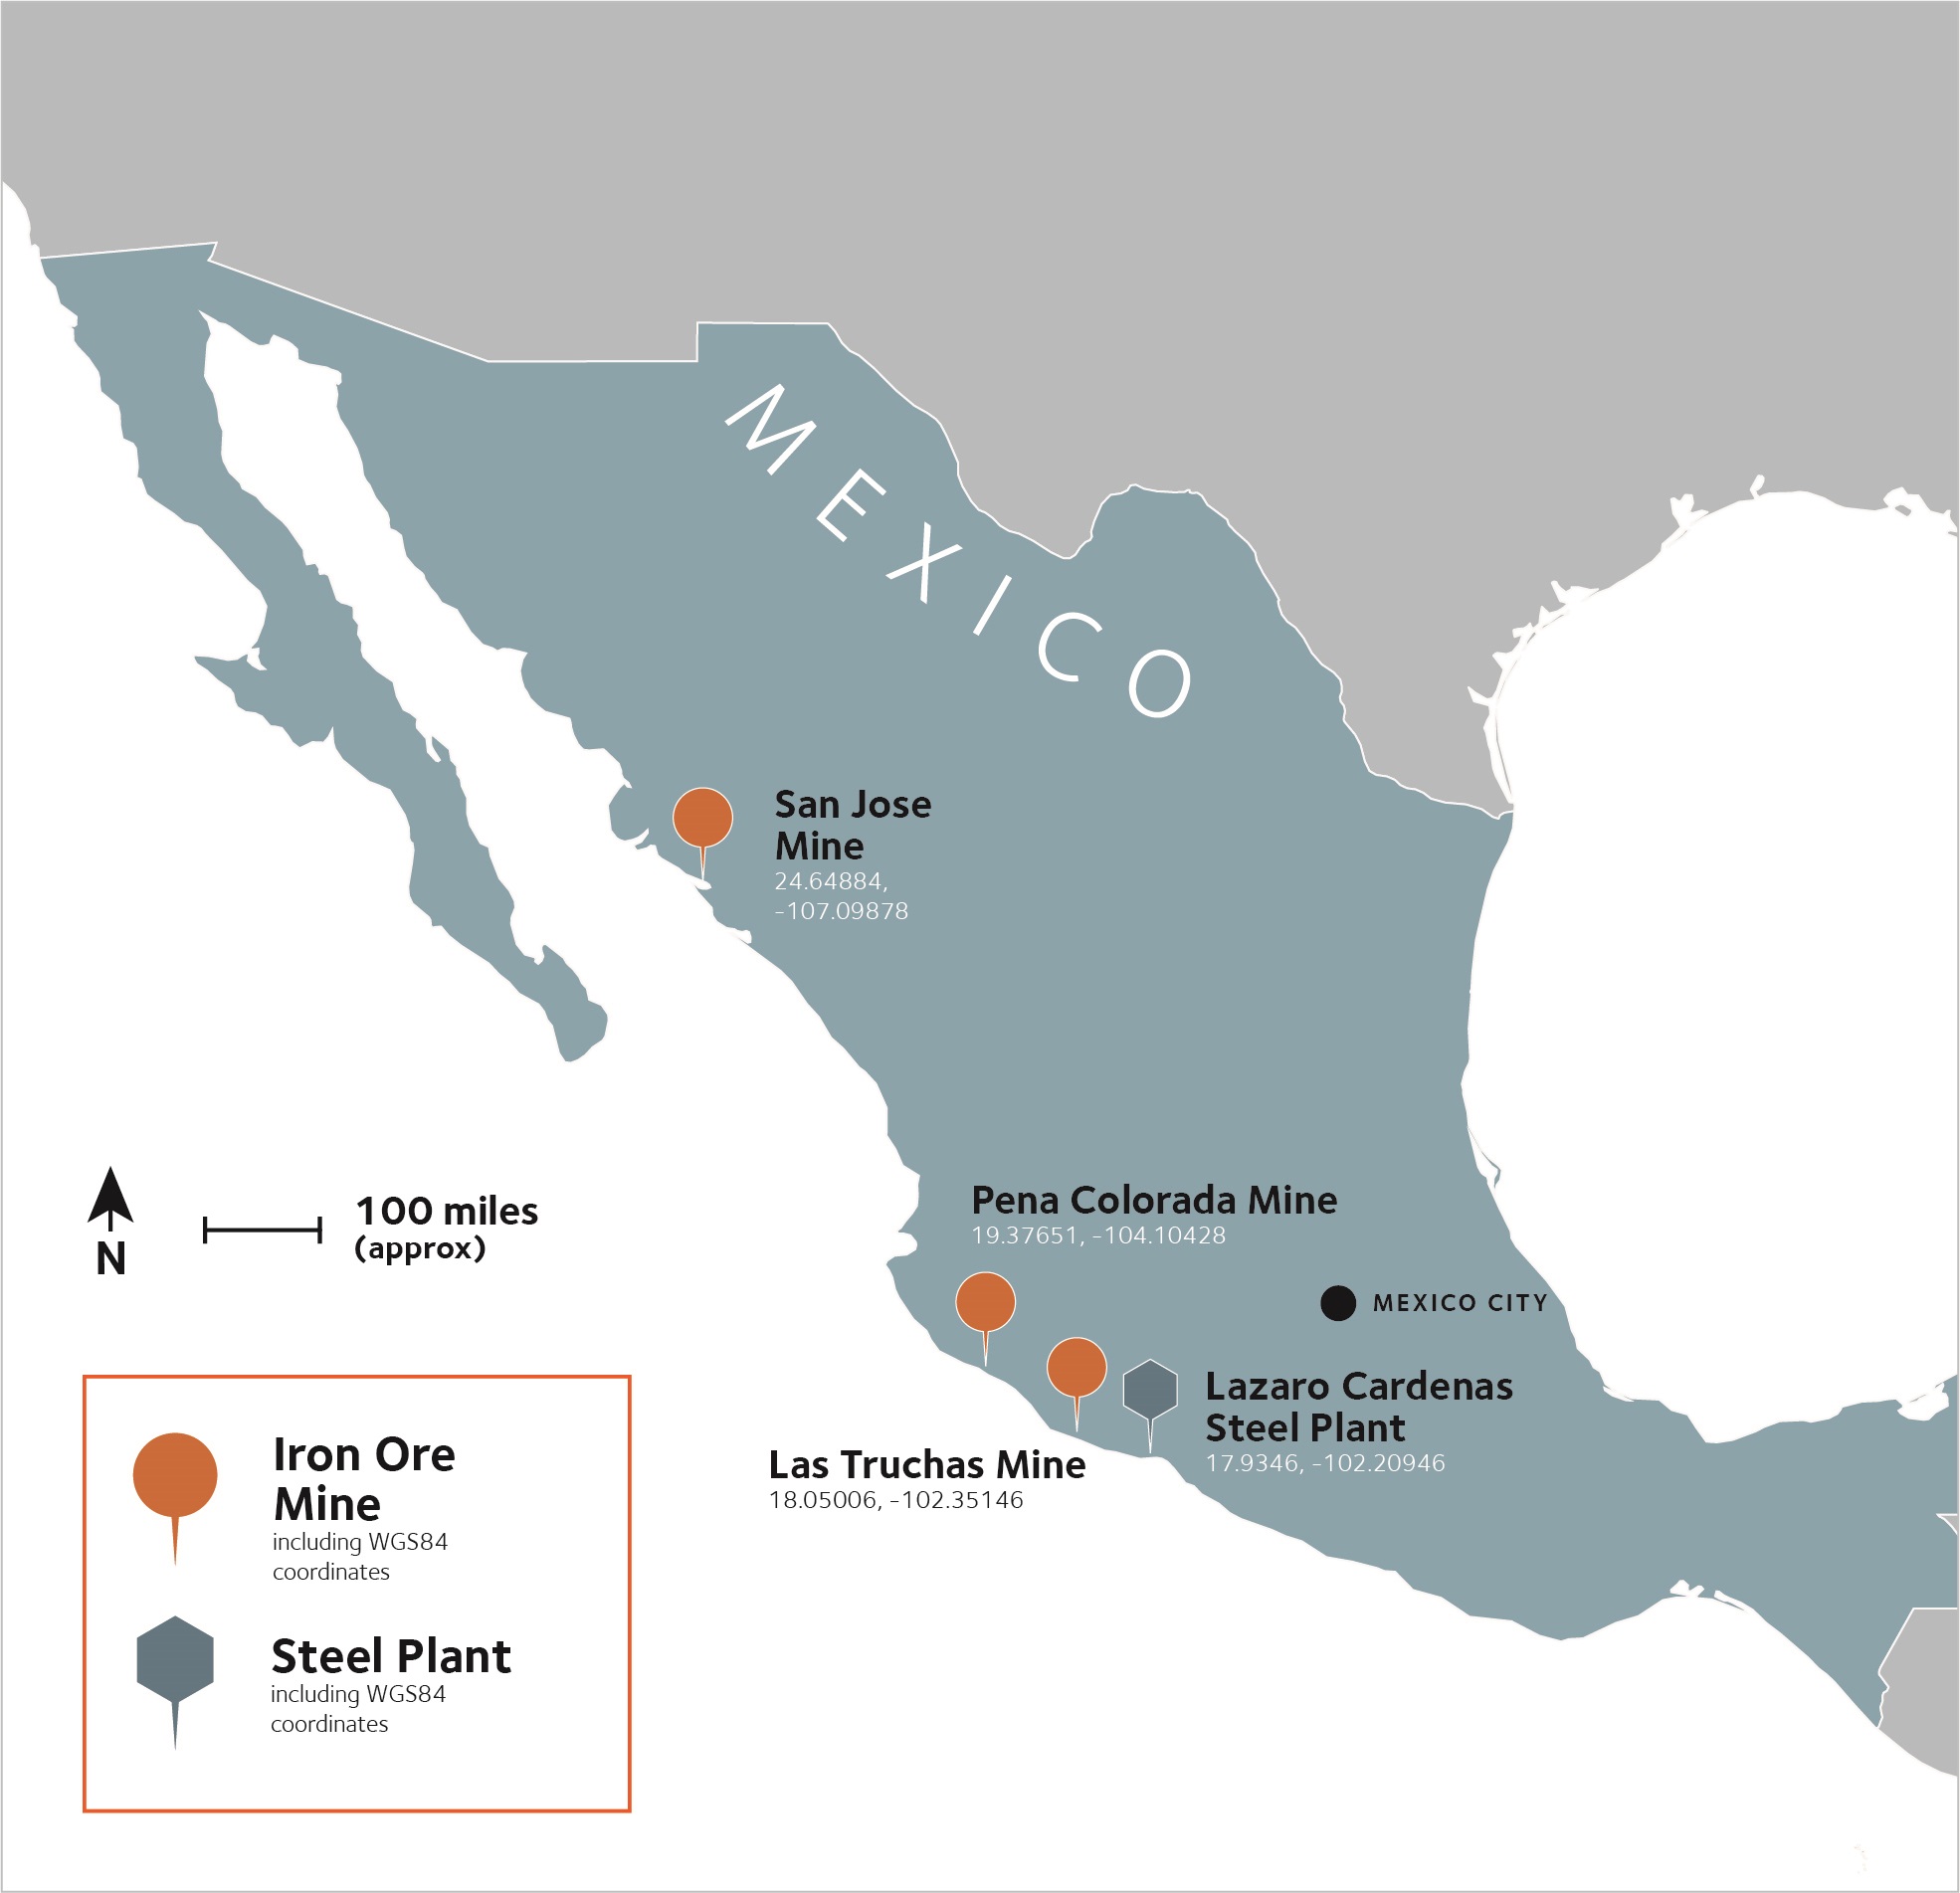
LOCATION MAP - NAFTA
| % of Ownership Interest | 2023 | 2022 | 2021 | ||||||||||||||||||||
| ROM Millions of Tonnes | Product Millions of Tonnes | ROM Millions of Tonnes | Product Millions of Tonnes | ROM Millions of Tonnes | Product Millions of Tonnes | ||||||||||||||||||
Peña Colorada - Mexico | 50.0 | ||||||||||||||||||||||
| At 100% | 12.8 | 4.1 | 13.5 | 4.1 | 11.8 | 4.1 | |||||||||||||||||
| At ownership interest (50%) | 6.4 | 2.05 | 6.75 | 2.05 | 5.9 | 2.05 | |||||||||||||||||
Mexico (Excluding Peña Colorada) | 100.0 | ||||||||||||||||||||||
| Las Truchas | 3.0 | 1.4 | 4.2 | 1.4 | 4.4 | 1.5 | |||||||||||||||||
| San Jose/El Volcan | 1.4 | 0.7 | 2.4 | 1.0 | 3.0 | 1.3 | |||||||||||||||||
| NAFTA, (100% basis) | 17.2 | 6.2 | 20.1 | 6.5 | 19.2 | 6.9 | |||||||||||||||||
| NAFTA, (ArcelorMittal ownership basis) | 10.8 | 4.15 | 13.4 | 4.5 | 13.3 | 4.8 | |||||||||||||||||
109
| Management report | ||
Peña Colorada
Peña Colorada is the operator of a production stage surface iron ore mine, located 60 kilometers to the north-east of the port city of Manzanillo, in the province of Minatitlán in the north-western part of the State of Colima, Mexico. ArcelorMittal holds 50% of Peña Colorada through a joint operation with Ternium, who owns the other 50% interest.
Peña Colorada controls a total of 3,834 hectares of surface rights and holds mineral rights over 39,977 hectares (98,782 acres) across 20 concessions. Government concessions are granted by the Mexican federal government for a period of 50 years and are renewable. The expiration dates of the current mining concessions range from 2043 to 2062.
Peña Colorada is a complex polyphase iron ore deposit. The iron mineralization at Peña Colorada consists of banded to massive concentrations of magnetite within breccia zones and results from several magmatic, metamorphic and hydrothermal mineralization stages with associated skarns, dykes and late faults sectioning the entire deposit.
Peña Colorada operates an open pit mine as well as a concentrating facility and a two-line pelletizing facility. The ore is mined by truck and shovel/loader method. The beneficiation plant and the pelletizing plant are located at the mine and in Manzanillo, respectively. Major processing facilities include a primary crusher, a dry cobbing plant, two autogenous mills, three horizontal and two vertical ball mills and several stages of magnetic separation. The concentrate is sent as a pulp through a pipeline from the mineral processing plant to the pelletizing facilities. The magnetite concentrate and pellets are transported from Manzanillo to ArcelorMittal Mexico, as well as to Ternium’s steel plants, by ship and by rail.
Las Truchas
Las Truchas is a production stage mine located approximately 27 kilometers north-west of the town of Lázaro Cárdenas in the State of Michoacán, Mexico. ArcelorMittal holds a 100% interest.
ArcelorMittal Mexico holds mineral rights over 53,812 hectares, of which 4,261 support the Las Truchas operations in Mexico. Government concessions are granted by the Mexican federal government for a period of 50 years and are renewable. The expiration dates of the current mining concessions range from 2044 to 2059.
The Las Truchas deposits consist of massive concentrations of magnetite of irregular morphology. The main Las Truchas deposits occur along a geological trend that is about seven kilometers long and about two kilometers wide. The Las Truchas mineral deposits have been classified as hydrothermal deposits, which may have originated from late-stage plutonic activity
injecting through older sedimentary rocks. The mineralization of the Las Truchas iron deposits occurs in disseminated and irregular massive concentrations of magnetite within metamorphic rocks and skarns. The mineralization also occurs as fillings of faults, breccia zones, and fractures.
Mining activities consist of open pit mining, crushing, dry cobbing to generate pre-concentrate, and a concentration plant.
The concentrator includes two primary crushers, two secondary crushers and three tertiary crushers, two ball mills, two bar mills and two wet magnetic separation circuits. The concentrated ore is pumped from the mine site through a 26 kilometer slurry pipeline to the steel plant facility in Lázaro Cárdenas.
ArcelorMittal Mexico launched a project to increase pellet feed production to 2.3 million tonnes per annum and improve concentrate grade in Las Truchas; see "—Capital expenditures".
San José
The San José Mine is a production stage iron ore mine located approximately 40 kilometers South-East of the town of Culiacán, the capital of the State of Sinaloa, México. Mining at San José began in 1946 and was handled by multiple owners until 2019, when ArcelorMittal secured a lease agreement and commenced mining and pre-concentration operations. ArcelorMittal’s interest in the San José mine is 100%.
ArcelorMittal Mexico holds mineral concessions for 30 hectares supporting the San José mining and pre-concentration operations. Additionally, ArcelorMittal Mexico holds mineral rights over 1,053 hectares which previously supported its now closed El Volcan operations, located approximately 68 kilometers northwest of the city of Obregon. The El Volcan processing facilities, including the concentration plant and port installations, continue to operate by processing ores from the San José mine.
ArcelorMittal Mexico has a lease agreement secured from Ejido Las Flechas, for both the land and the San José facilities, which is in place for a period of ten years and is valid until 2028. Previous mine operators have secured surface rights to the project from the Ejido in the past and it is reasonable to assume that ArcelorMittal Mexico can continue to secure surface rights beyond 2028.
San José is a metasomatic deposit, produced by hydrothermal replacement, with epidote-garnet skarns located in the contact zone between a Cretaceous limestone unit and a granodioritic intrusive. The mineralization is primarily composed of magnetite, with minor hematite. Accessory sulfide minerals including pyrite and chalcopyrite are also present.
110
| Management report | ||
Ore is mined from the open pit using conventional mining methods and processed into a pre-concentrate by a crushing and screening circuit with dry magnetic separation. The pre-concentration facilities at the mine include one primary crusher, one secondary crusher, a dry cobbing high-intensity magnetic pulley and one tertiary crusher. The pre-concentrate is then shipped 30 kilometers by road to a rail head located in Quila, where it is railed 450 kilometers to the El Volcan concentrator. The concentration plant at El Volcan includes two ball mills, a magnetic separation circuit, flotation systems, a belt conveyor filter and a disposal area for tailings. The major port installations include a tippler for railroad cars, a conveyor, transfer towers and two ship loading systems. At El Volcan, the pre-concentrate is milled and concentrated via wet magnetic separation to produce the final concentrate, which is transported 150 kilometers by rail to the Port of Guaymas where it is loaded onto ships and sent 1,400 kilometers to the Port of Lazaro Cardenas.
BRAZIL
ArcelorMittal Brasil operates the Andrade mine and Serra Azul Mineração mines.
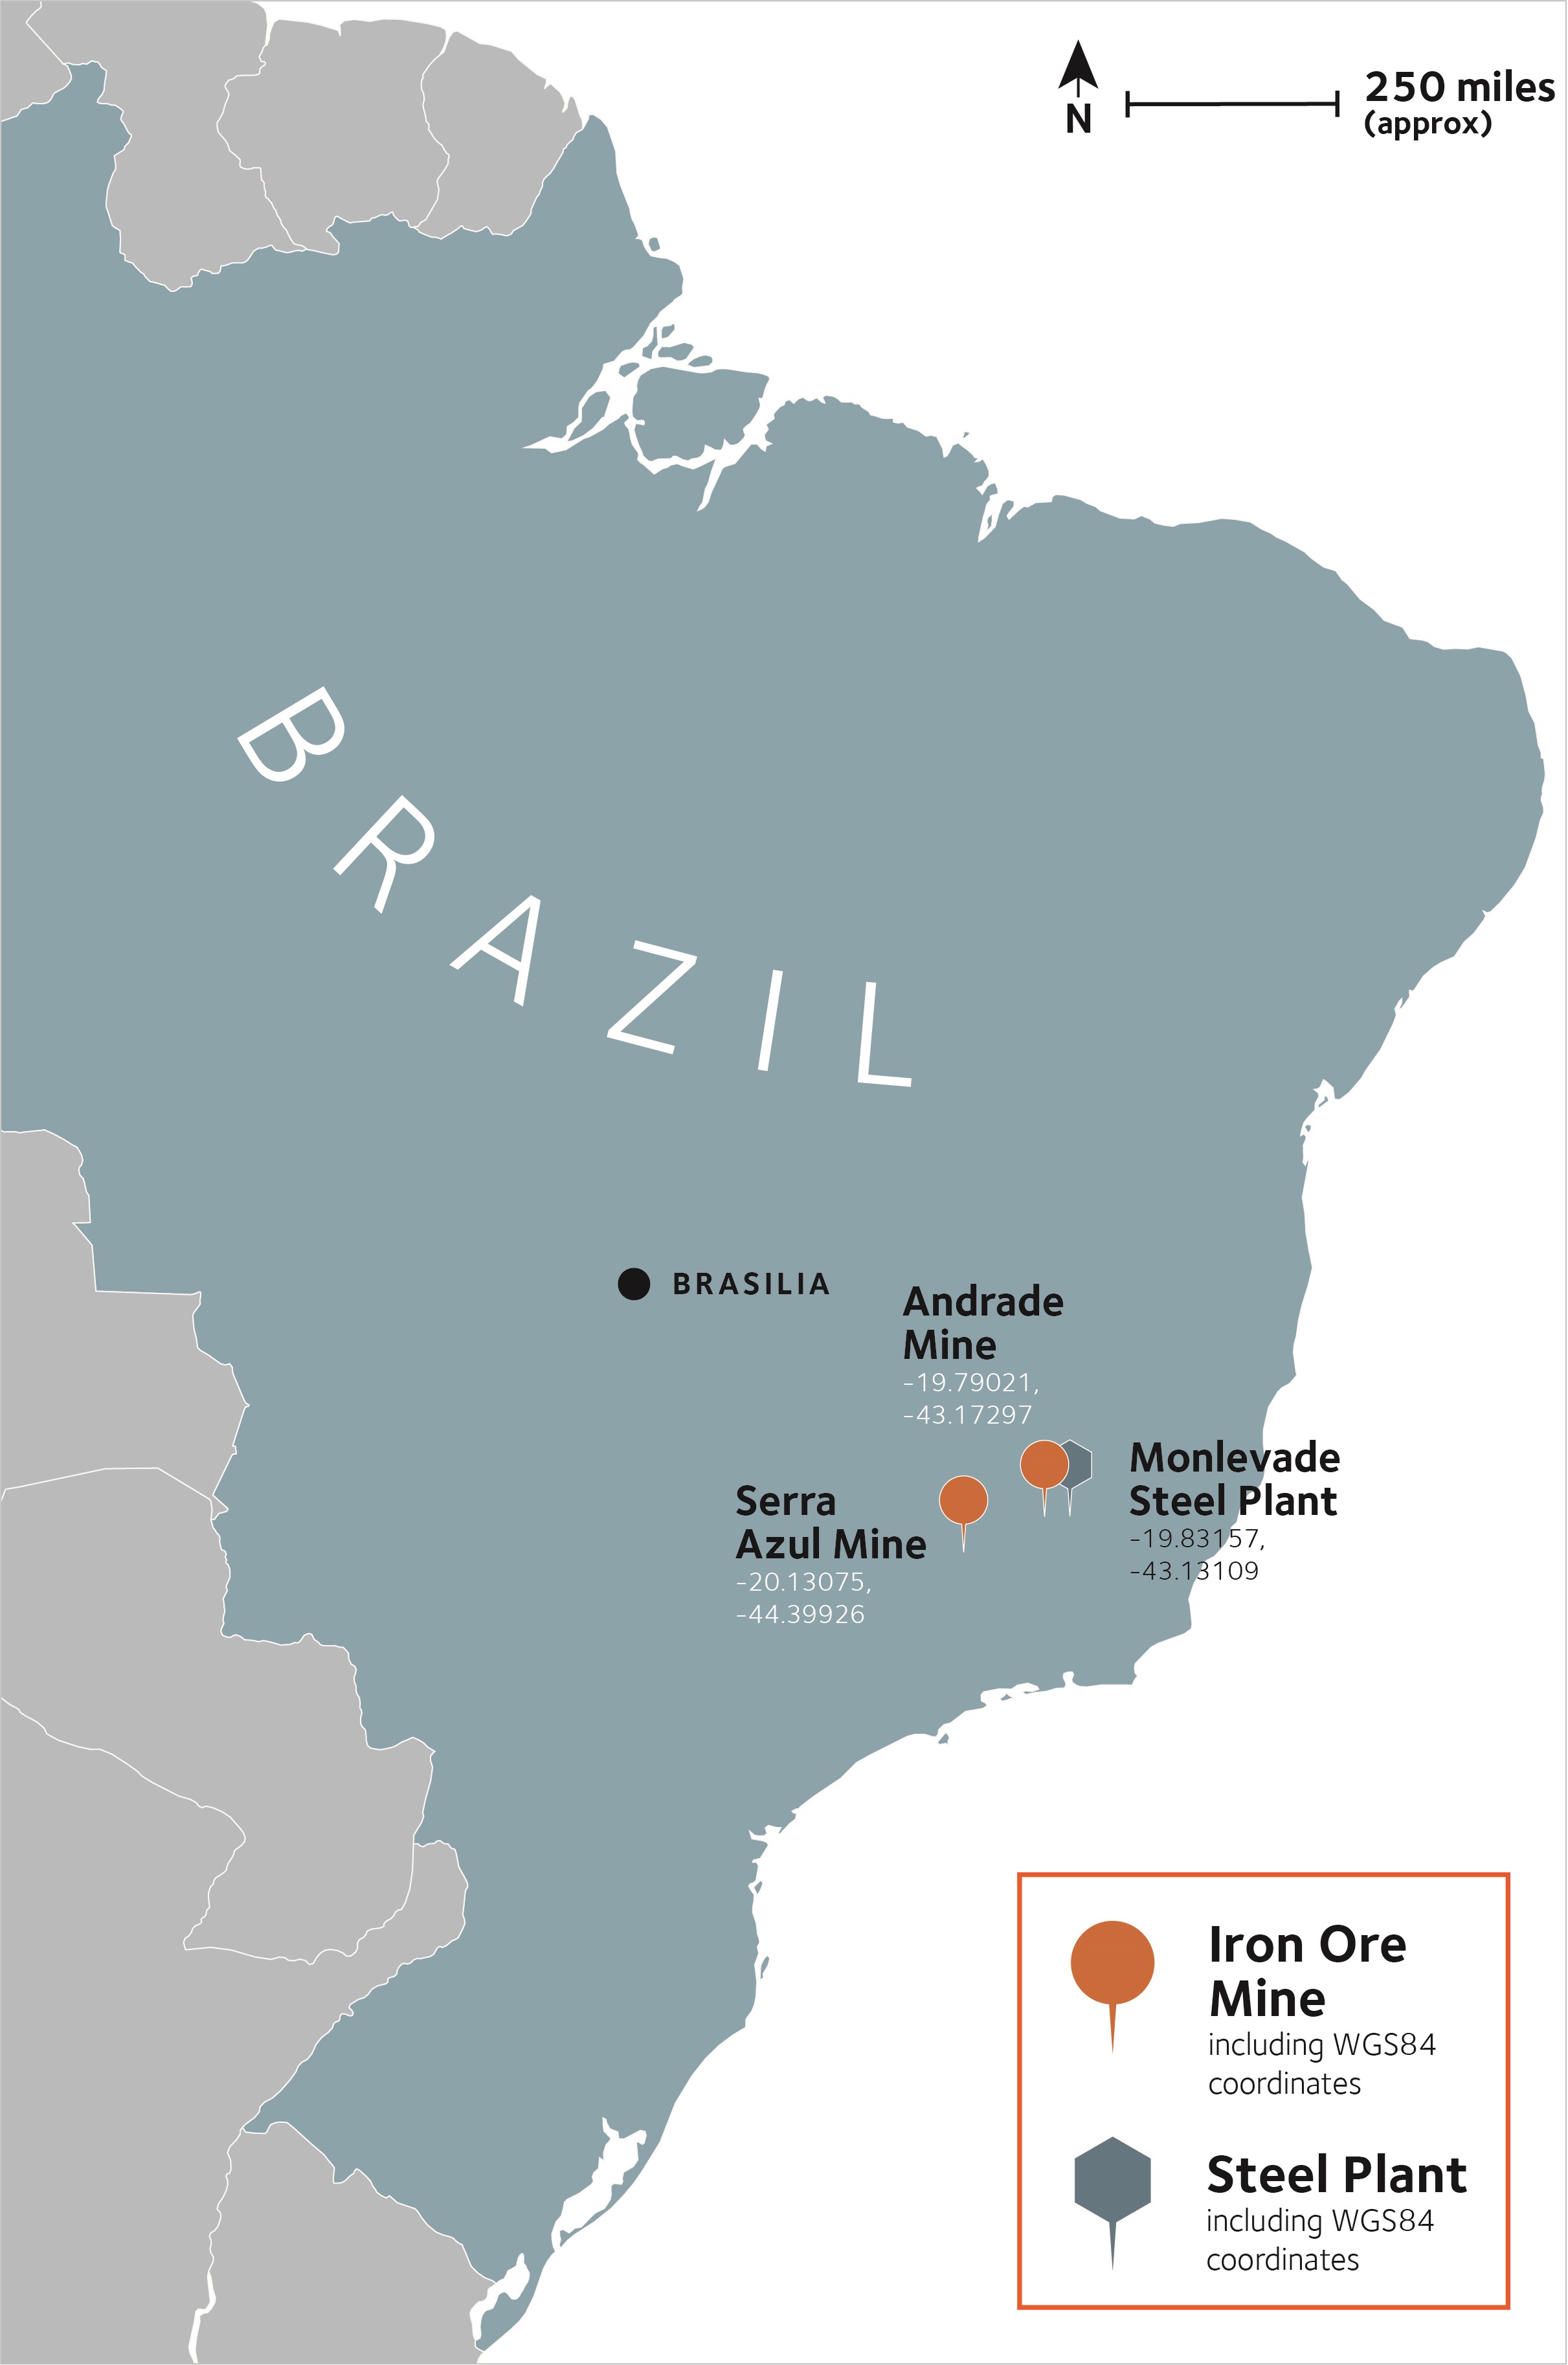
LOCATION MAP - BRAZIL Mining Operations
| % of Ownership Interest | 2023 | 2022 | 2021 | ||||||||||||||||||||||||||||||||
| ROM Millions of Tonnes | Product Millions of Tonnes | ROM Millions of Tonnes | Product Millions of Tonnes | ROM Millions of Tonnes | Product Millions of Tonnes | ||||||||||||||||||||||||||||||
| Andrade | 100 | 2.4 | 2.0 | 2.3 | 1.8 | 2.1 | 1.8 | ||||||||||||||||||||||||||||
| Serra Azul | 100 | 2.7 | 1.5 | 2.6 | 1.5 | 2.6 | 1.6 | ||||||||||||||||||||||||||||
| Brazil | 5.1 | 3.5 | 4.9 | 3.3 | 4.7 | 3.4 | |||||||||||||||||||||||||||||
Andrade Mine
The Andrade Mine is a production stage open pit iron ore mine, located 5 kilometers away from the town of João Monlevade and 80 kilometers east of Belo Horizonte in the Brazilian state of Minas Gerais. The Andrade mine is 100% owned and operated
by the Long products division of ArcelorMittal Brasil, with all production supplying the Monlevade steel plant.
ArcelorMittal’s operations control all of the mineral rights and surface rights needed to mine and process its estimated iron ore reserves, dominated by directly shippable hematite ore.
111
| Management report | ||
ArcelorMittal Brasil holds mineral rights of over 2,421 hectares and land lease over 3,347 hectares to support its current operation. Mining legislation in Brazil does not predetermine the duration of mineral rights and as such these rights are considered valid to the point of mine exhaustion.
The Andrade deposit is located in the north-eastern portion of the Iron Quadrangle. The base stratigraphic section consists of quartzites and sericite-quartzites of the Moeda formation, followed by schists of the Batatal formation, both forming the Caraça group. The iron rich mineral bodies are part of the overlying Cauê formation, which represents the base of the Itabira Group. The Caraça and Itabira groups compose the base of the Paleoproterozoic Minas Supergroup. The Cauê formation rocks are covered by dolomites and marbles, and sometimes weathered phylites and schists, belonging to the Gandarela formation.
In addition to the open pit mine, the Andrade mine operates a crushing and screening facility, as well as a concentration plant used to improve the quality of the sinter feed to the Monlevade plant. This concentration plant commenced production in early 2020 and concentrates the itabirite ores, enabling mixing with the higher-grade hematite ores. The concentrated iron ore product is transported to the Monlevade steel plant through a private railway line.
In 2022, the resource model of Andrade has been updated, resulting in a new pit optimization and mine schedule, with updated Life of Mine schedule for the Itabirite and Hematite ores. The new life of mine extends to 2054, with increased annual ROM capacity up to 4.5 million tonnes after 2027.
Serra Azul Mine
ArcelorMittal Mineração Serra Azul mine is a production stage open pit iron ore mine located approximately 50 kilometers southwest of Belo Horizonte in the Minas Gerais State of Brazil. The mine is 100% owned and operated by ArcelorMittal Brasil.
ArcelorMittal Brasil controls all of the mineral and surface rights needed to mine and process its iron ore reserves. ArcelorMittal Brasil holds mineral rights over the Central and East claims of the Serra Azul deposit of over 375 hectares and surface rights over 281 hectares. Mining legislation in Brazil does not predetermine the duration of mineral rights and as such these rights are considered valid to the point of mine exhaustion.
The Serra Azul mine is located in the North-Eastern portion of the Iron Quadrangle, in the iron rich Cauê Formation of the Itabira Group. The mineralization occurs as friable, semi compact and compact itabirites and banded hematite-silica rocks, with varying degrees of weathering and oxidation. Currently, Serra Azul mines and processes the friable itabirite with the Serra Azul expansion project (see "—Capital
expenditures") contemplating the mining and processing of semi-compact and compact ores.
The Serra Azul mine also operates a processing plant consisting of a crushing facility and a three-line concentration facility, including screening, magnetic separation, spirals separators and jigging. Iron ore product is transported by truck to two railway terminals located 35 and 50 kilometers from the mine site for distribution to local purchasers of sinter feed or for export through third-party port facilities located in the Rio de Janeiro State.
In 2021, an updated resource model was generated, incorporating the results of a 1,508 meter drilling program completed in late 2020. The drilling program targeted further definition of the friable itabirite ("IF") ore bodies and the updated model has been used to reassess the mine life for the current IF phase of the Serra Azul Mine. This resulted in a revised life of mine for the IF phase, with mining operations extended until 2024. No additional drilling occurred in 2022 and 2023.
Following the integration of the Serra Azul Mine into ArcelorMittal Brasil in 2020, an expansion project for the Serra Azul Mine has been approved, extending the mine's life until 2057. The project considers producing 4.5 million tonnes per annum of DRI quality pellet feed by processing compact itabirite ("IC") and semi-compact itabirite ("ISC") material. The IC and ISC processing plant operations are scheduled to start in the second half of 2024 (see also "—Capital expenditures).
In February 2019, the Company decided to implement the evacuation plan related to its dormant Serra Azul tailing dam. The community situated downstream to the dam was evacuated as a precautionary measure based on an updated stability report following incidents in the Brazilian mining sector. This was done to enable further testing and implementation of any additional mitigating measures. As a result, the Company has executed an agreement with the Federal and State Public Prosecutors Offices and affected families to provide temporary assistance to the families and set technical measures required to re-establish factor of safety standards. Such agreement was extended in February 2020 and negotiations regarding compensation continued in 2021, during which a Complementary Agreement Term was signed with new guidelines for compensation parameters for the impacts caused by preventive evacuation. As of December 31, 2023, the Company had entered into 584 indemnification agreements with the affected families. The agreement contemplates the construction of a check dam structure by 2025 and the tailing dam deconstruction by 2032.
EUROPE
ArcelorMittal Prijedor is the only captive mining operation within the Europe segment.
112
| Management report | ||
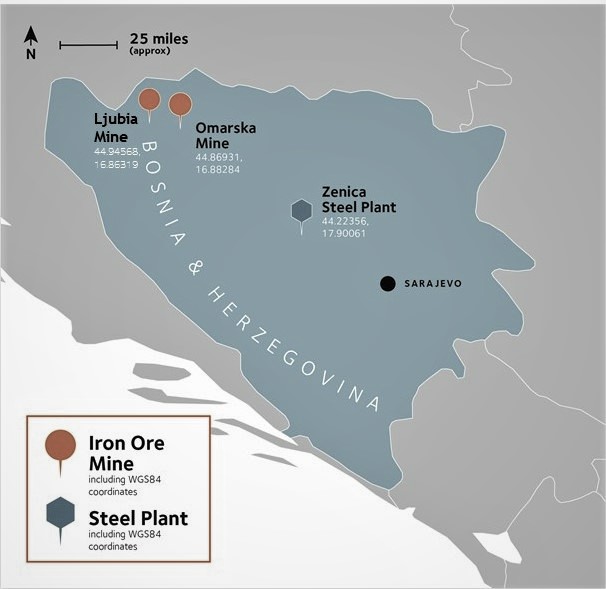
LOCATION MAP - EUROPE Mining Operation
| % of Ownership Interest | 2023 | 2022 | 2021 | ||||||||||||||||||||||||||||||||
| ROM Millions of Tonnes | Product Millions of Tonnes | ROM Millions of Tonnes | Product Millions of Tonnes | ROM Millions of Tonnes | Product Millions of Tonnes | ||||||||||||||||||||||||||||||
| ArcelorMittal Prijedor | 51.0 | ||||||||||||||||||||||||||||||||||
| At 100% basis | 1.7 | 1.2 | 1.7 | 1.3 | 1.8 | 1.6 | |||||||||||||||||||||||||||||
| At ownership interest (51%) | 0.9 | 0.6 | 0.8 | 0.7 | 0.9 | 0.8 | |||||||||||||||||||||||||||||
ArcelorMittal Prijedor
The Omarska mine is a production stage surface iron ore mine in Bosnia and Herzegovina, operated by ArcelorMittal Prijedor. The mine is located 25 kilometers south-east of the town of Prijedor, where the ArcelorMittal Prijedor headquarters are based. ArcelorMittal Prijedor was founded in 2004 as a partnership between ArcelorMittal (at the time LNM Holdings) with a 51% controlling interest and local mining company Iron Ore Mine Ljubija owning the remaining 49% stake. ArcelorMittal Prijedor is a captive mine of the Europe segment and supplies all of its iron ore production to the ArcelorMittal Zenica steel plant.
In 2022, ArcelorMittal Prijedor acquired additional mining and land rights and started iron ore mining on a trial basis at Ljubija Mine with a plan for full production to be reached in 2025. Product from Ljubija mine is blended with the product from Omarska mine and is supplied to ArcelorMittal Zenica steel plant.
The Omarska mine’s current concession was signed in 2018 for a period of 6 years. The property comprises 1,946 hectares of land and mineral rights. The Ljubija mine’s current concession was signed in 2022 for a period of 6 years. The property comprises 739 hectares of land and mineral rights. ArcelorMittal
113
| Management report | ||
Prijedor is the registered holder of the mining rights at the Omarska mine exploitation field. Land tenure and mineral rights issued to ArcelorMittal Prijedor are indefinite and considered to be of sufficient duration to enable all reported mineral reserves on the properties to be mined in accordance with current life of mine production schedules.
The Buvac deposit at the Omarska mine is located within Carboniferous clastic (shale and sandstones) and carbonate (limestone, dolomite, and ankerite) sequences, with massive siderite-limonite mineralization forming an integral part of the formation. Iron ore from the Buvac deposit is predominantly limonite-goethite with associated quartz, carbonates, and silicates of the illite type. The limonite-goethite mineralization was formed during the oxidization of the upper parts of the primary siderite bodies.
The ore body is asymmetrical, lens-shape and elongated in a northeast - southwest direction, dipping at about 8° toward the north-east from the surface to a depth of 210 meters. The deposit is approximately 1.5 kilometer long and 1.0 kilometer wide.
The Ljubija deposit is located within Carboniferous and Permian-Triassic formation rocks which are partly covered by thin Quaternary rocks. The ore within these formations is primarily composed of siderite and ankerite with secondary limonite iron facies.
The ore is excavated from the Omarska and Ljubija deposits by traditional truck and shovel open pit mining methods. At the Omarska mine, after a primary stage of crushing within the pit, the ore is transported to a processing plant via a conveyor. The processing plant on site performs crushing, screening, gravity separation, magnetic separation and filtration. At the Ljubia mine, ore is crushed and screened and sent to the Omarska mine processing plant for product blending.
ACIS
Iron ore mining operations forming part of the ACIS segment include AMKR open pit and underground mines in Ukraine and Thabazimbi mine in South Africa. ArcelorMittal Temirtau Orken open pit and underground iron ore mines in Kazakhstan were part of the ACIS segment until the sale of ArcelorMittal Temirtau.
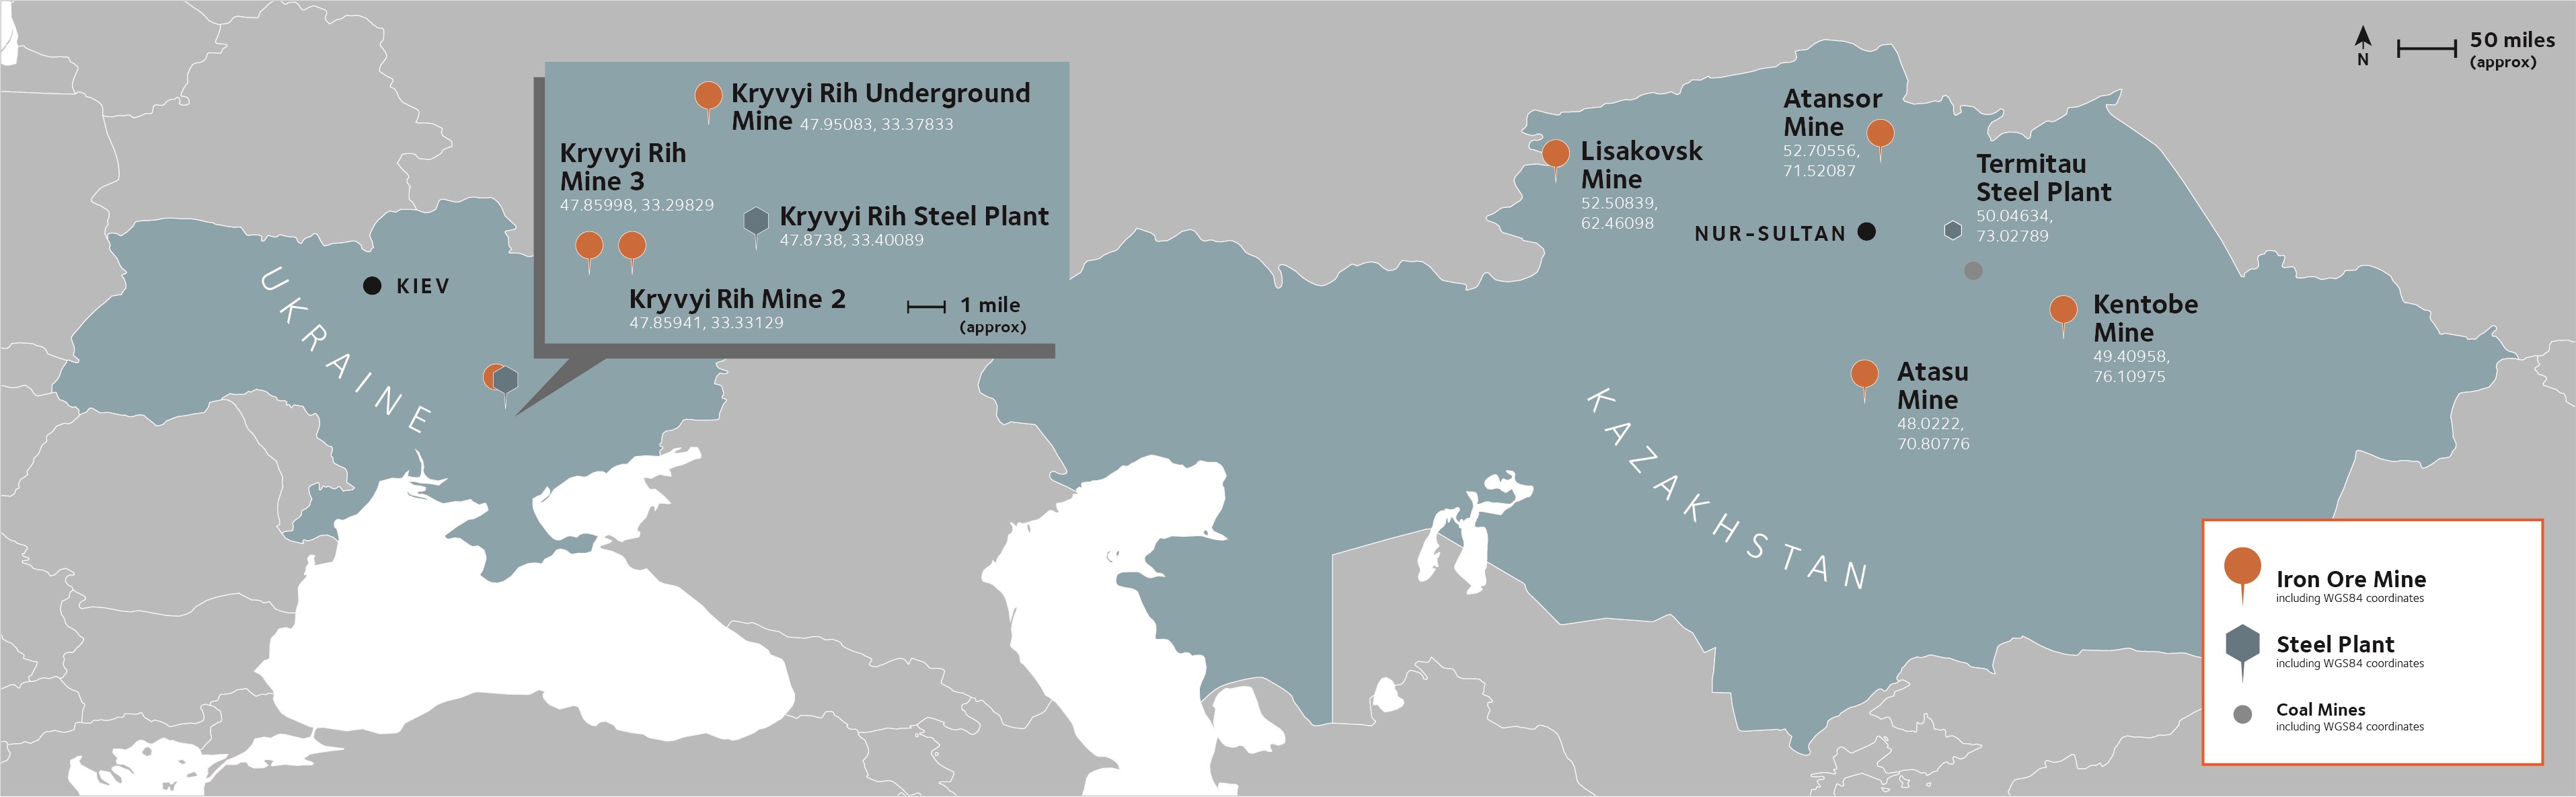
114
| Management report | ||
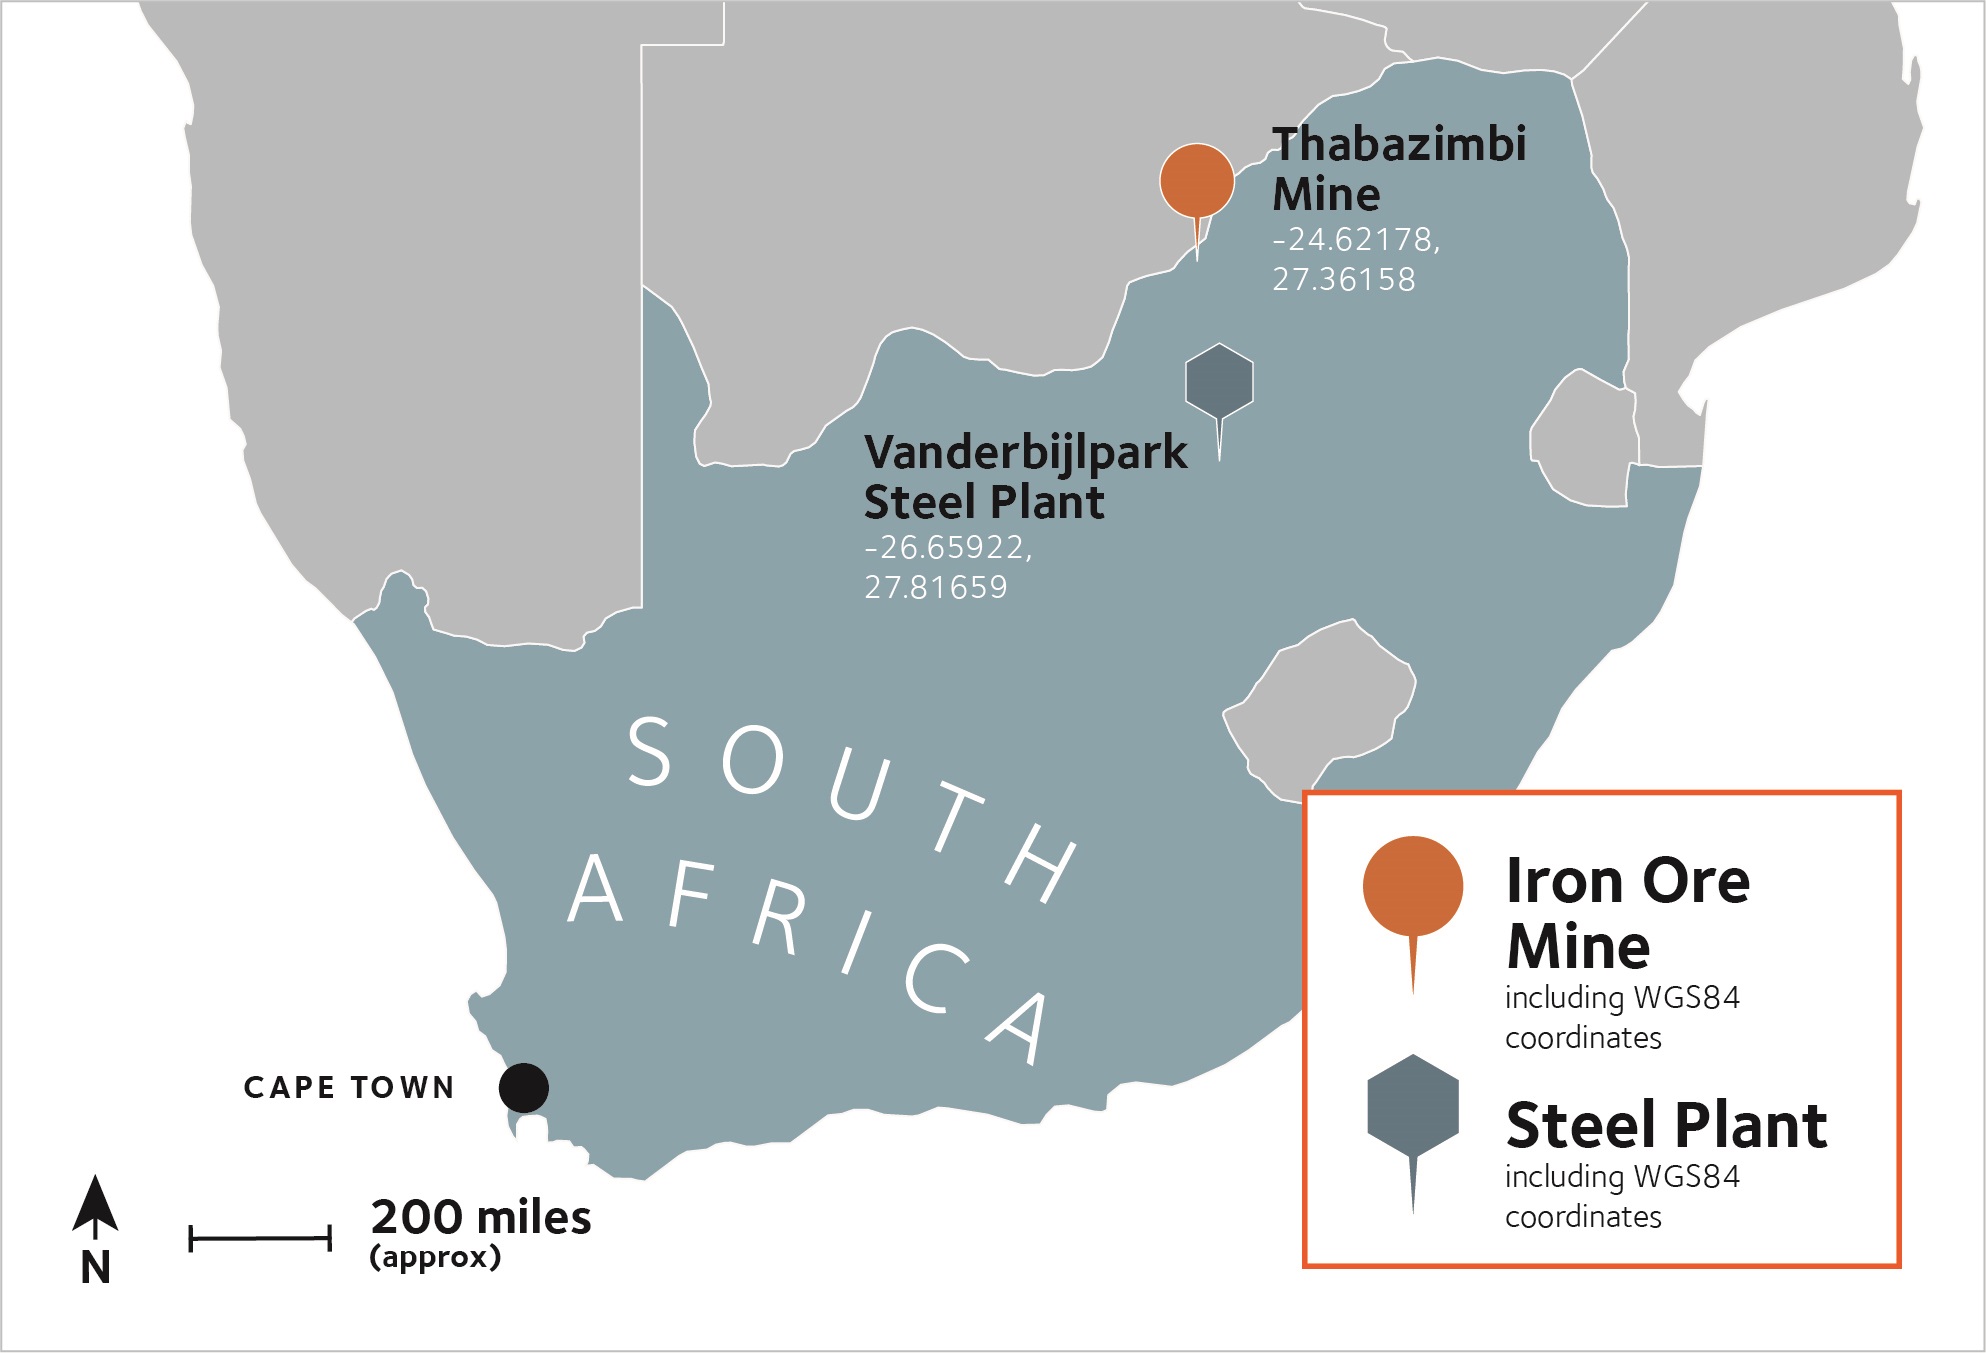
LOCATION MAPS - ACIS Mining Operations
| % of Ownership Interest | 2023 | 2022 | 2021 | ||||||||||||||||||||||||||||||||
ROM Millions of Tonnes1 | Product Millions of Tonnes1 | ROM Millions of Tonnes | Product Millions of Tonnes | ROM Millions of Tonnes | Product Millions of Tonnes | ||||||||||||||||||||||||||||||
AMKR Open Pit | 95.1 | ||||||||||||||||||||||||||||||||||
| At 100% basis | 11.1 | 4.6 | 11.3 | 4.5 | 25.7 | 11.0 | |||||||||||||||||||||||||||||
| At the ownership interest | 10.6 | 4.4 | 10.7 | 4.3 | 24.4 | 10.5 | |||||||||||||||||||||||||||||
AMKR Underground | 95.1 | ||||||||||||||||||||||||||||||||||
| At 100% basis | 0.3 | 0.3 | 0.4 | 0.4 | 0.7 | 0.7 | |||||||||||||||||||||||||||||
| At the ownership interest | 0.3 | 0.3 | 0.3 | 0.4 | 0.7 | 0.7 | |||||||||||||||||||||||||||||
ArcelorMittal Temirtau Open Pit (Lisakovsk, Kentobe and Atansor)1 | 100.0 | ||||||||||||||||||||||||||||||||||
| At 100% basis | 2.2 | 1.4 | 2.5 | 1.4 | 3.6 | 1.8 | |||||||||||||||||||||||||||||
ArcelorMittal Temirtau Underground (Atasu)1 | 100.0 | ||||||||||||||||||||||||||||||||||
| At 100% basis | 1.6 | 1.0 | 2.0 | 1.3 | 1.8 | 1.5 | |||||||||||||||||||||||||||||
| ACIS at 100% basis | 15.2 | 7.3 | 16.2 | 7.6 | 31.7 | 14.9 | |||||||||||||||||||||||||||||
| ACIS at the ownership interest | 14.7 | 7.1 | 15.5 | 7.4 | 30.5 | 14.4 | |||||||||||||||||||||||||||||
ArcelorMittal Kryvyi Rih
AMKR is a production stage iron ore mining complex located predominantly within the borders of the city of Kryvyi Rih, 150 kilometers southwest of Dnipro, Ukraine. The mine is 95.1% owned by ArcelorMittal and is integrated into the ArcelorMittal Kryvyi Rih steel business as a captive mine. ArcelorMittal acquired the operations in 2005.
AMKR operates two open pits over the Novokryvorizke (Mine 2 on the map) and Valyavkinske (Mine 3 on the map) deposits, and an underground mine at the high-grade iron ore deposit of Kirova. Operations began at the Kryvyi Rih open pit mines in 1959 and at the Kryvyi Rih underground mine in 1933.
AMKR's operations control all of the mineral rights and surface rights needed to mine and process its estimated iron ore
115
| Management report | ||
reserves, holding mineral rights over 775 hectares and surface rights over 4,827 hectares to support its surface operations, and 57.9 hectares of mineral and 160 hectares of surface rights for the underground mine operation. The subsoil use permits for the underground mine were renewed in 2021 for the next 20 years, and for the surface pits, mineral rights are due to expire in 2038, with the land lease agreements being valid until 2060 and 2061, respectively.
The iron ore deposits are located within the southern part of the Krivorozhsky iron-ore basin. The iron mineralization at Novokryvorizke and Valyavkinske deposits is hosted by early Proterozoic rocks containing multiple altered ferruginous quartzite strata with shale layers. The major iron ore bearing units in the open pit mines have a carbonate-silicate-magnetite composition. In addition, oxidized, iron-rich quartzite is mined simultaneously with primary ore and is stored separately for possible future processing. Only the magnetite mineralization is included in the 2023 open pit iron ore reserve estimates. The high-grade iron ore of the Kirova deposit is hosted by a ferruginous quartzite with martite and jaspilite.
Along with the two open pit sites and an underground mine, AMKR operates a concentrating facility and a crushing facility to produce its final product. The iron ore extracted from the open pits is crushed at the mine site through primary crushing, loaded on a rail-loading facility and transported to the concentrator. The concentration facility includes crushing, grinding, classification, magnetic separation and filtering. The iron ore is extracted from the underground mine by a modified sub-level caving method and is crushed and screened at surface into lump and sinter ore, before being transported by rail to the steel plant. The AMKR steel plant is the main consumer of the mine’s products.
As a result of the ongoing war in Ukraine, iron ore production was planned according to the consumption at AMKR steel plant and logistics availability. In 2023, the production was maintained stable at approximately 45% of its maximum capacity. Mining at open pit continued without stoppages in 2023. There was a temporary stoppage at the underground mine in the first quarter of 2023 and again in December 2023, due to lower demand for sinter ore. In 2022, iron ore production was approximately at 55% of capacity during the first half. During the third quarter, iron ore production was temporarily suspended due to weaker demand and logistic constraints but restarted at the beginning of October 2022, approximately at 25% level.
ArcelorMittal Temirtau Iron Ore Mining Assets
ArcelorMittal Temirtau had four iron ore mining operations in Kazakhstan, out of which three open pit mines, Lisakovsk, Kentobe and Atansor, and one underground mine, Atasu. Until the sale of ArcelorMittal Temirtau on December 7, 2023, the mines were 100% owned by ArcelorMittal and integrated into and operated by ArcelorMittal Temirtau steel business as captive
mines. Final iron ore products were transported to the ArcelorMittal Temirtau steel plant by railway.
South Africa
The Thabazimbi mine in the Limpopo Province of South Africa is an exploration stage captive mine of ArcelorMittal South Africa ("AMSA") steel. AMSA took full ownership of the Thabazimbi operations from Kumba Iron Ore in November 2018.
Open pit operations at Thabazimbi ceased in 2016, and the mine is currently only engaged in the rehandling of iron ore from stockpiles of ROM material from historical production.
The Thabazimbi mine holds surface rights over 10,952.8 hectares and mineral rights over 8,662.3 hectares, valid until 2039.
In 2023, mining consultancy VBKOM was contracted to update a pre-feasibility study and estimate the remaining in-situ mineral resources for Vanderbijl deposit, which are reported in this report. A decision related to further studies to define mineral reserves and the life of the mine will be taken in 2024.
The Vanderbijl iron ore deposit at Thabazimbi, for which the resources are estimated, is located on the northern margin of the Transvaal sub-basin. The Transvaal Supergroup was deposited in an open marine sedimentary basin developed on the Kaapvaal Craton within fluvial, deltaic to marine depositional environments. The iron ore deposits are developed at or close to the transitional contact zone of the combined footwall dolomites and upper transitional shale beds (including the overlying an approximately 15 meter thick chert-rich shale layer) of the Malmani Subgroup and the overlying BIFs of the Penge Formation.
116
| Management report | ||
MINING
Iron ore mining operations forming part of the Mining segment include AMMC in Canada and AML in Liberia.
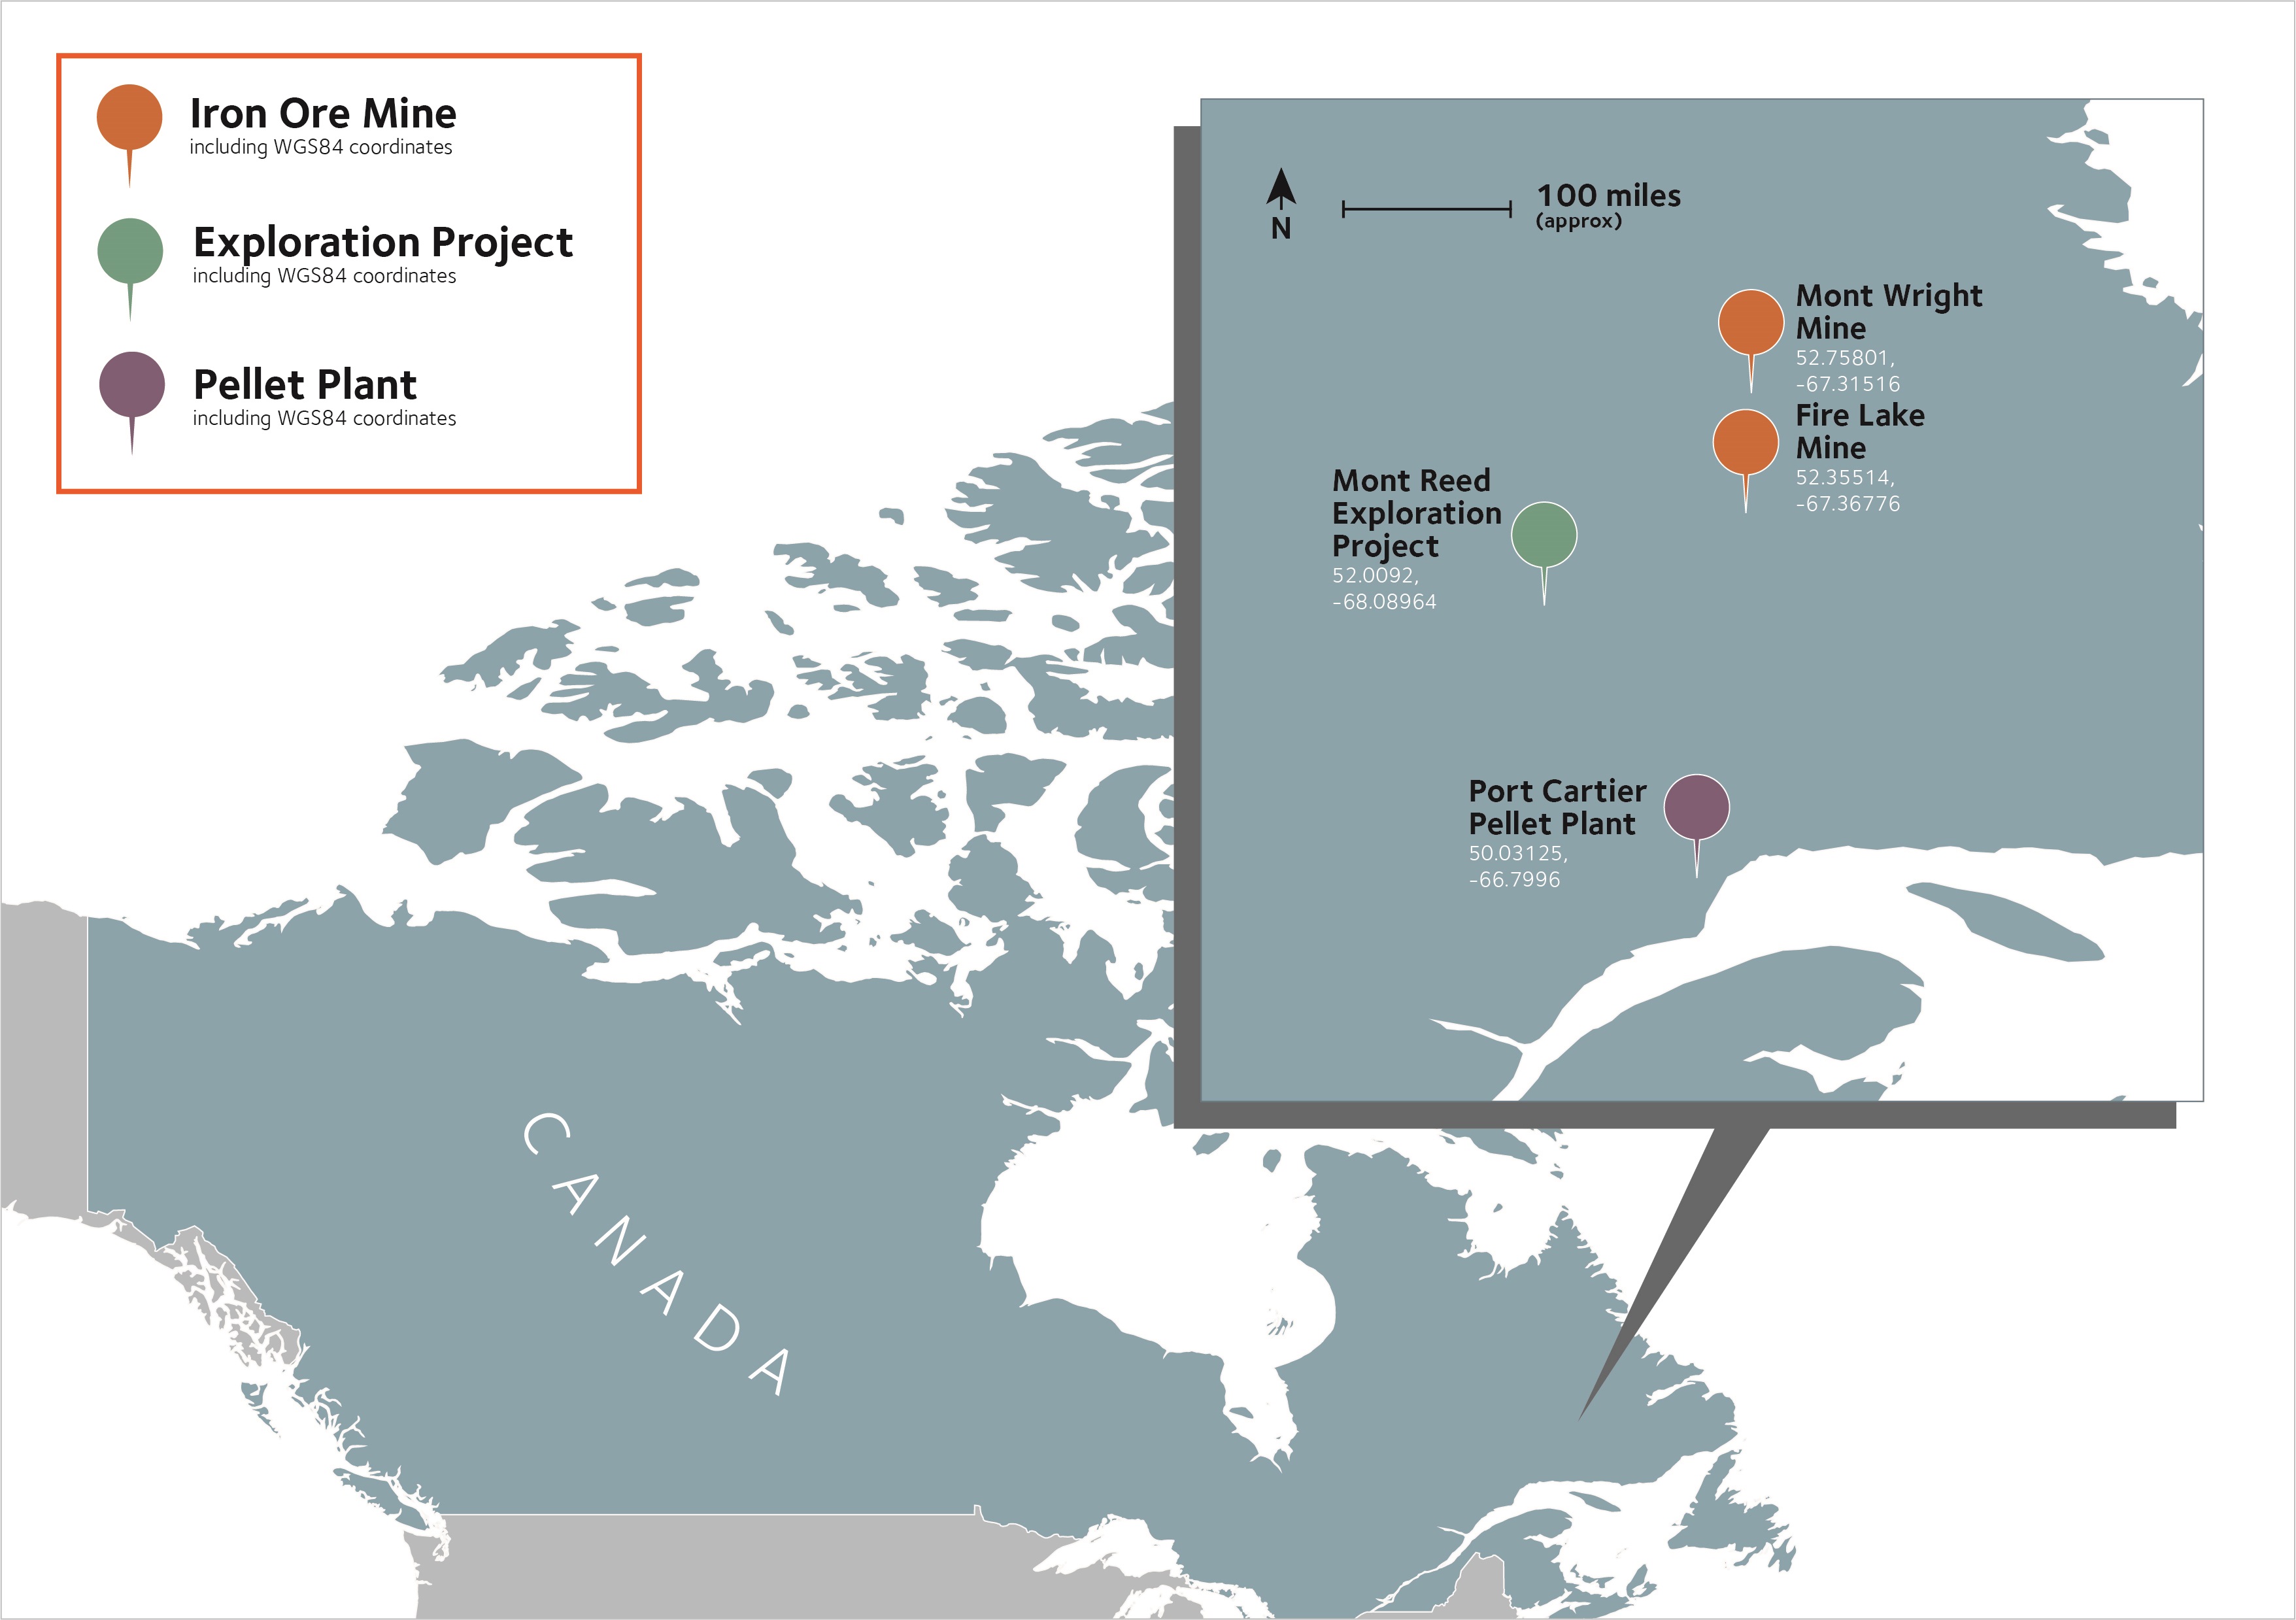
LOCATION MAP - AMMC
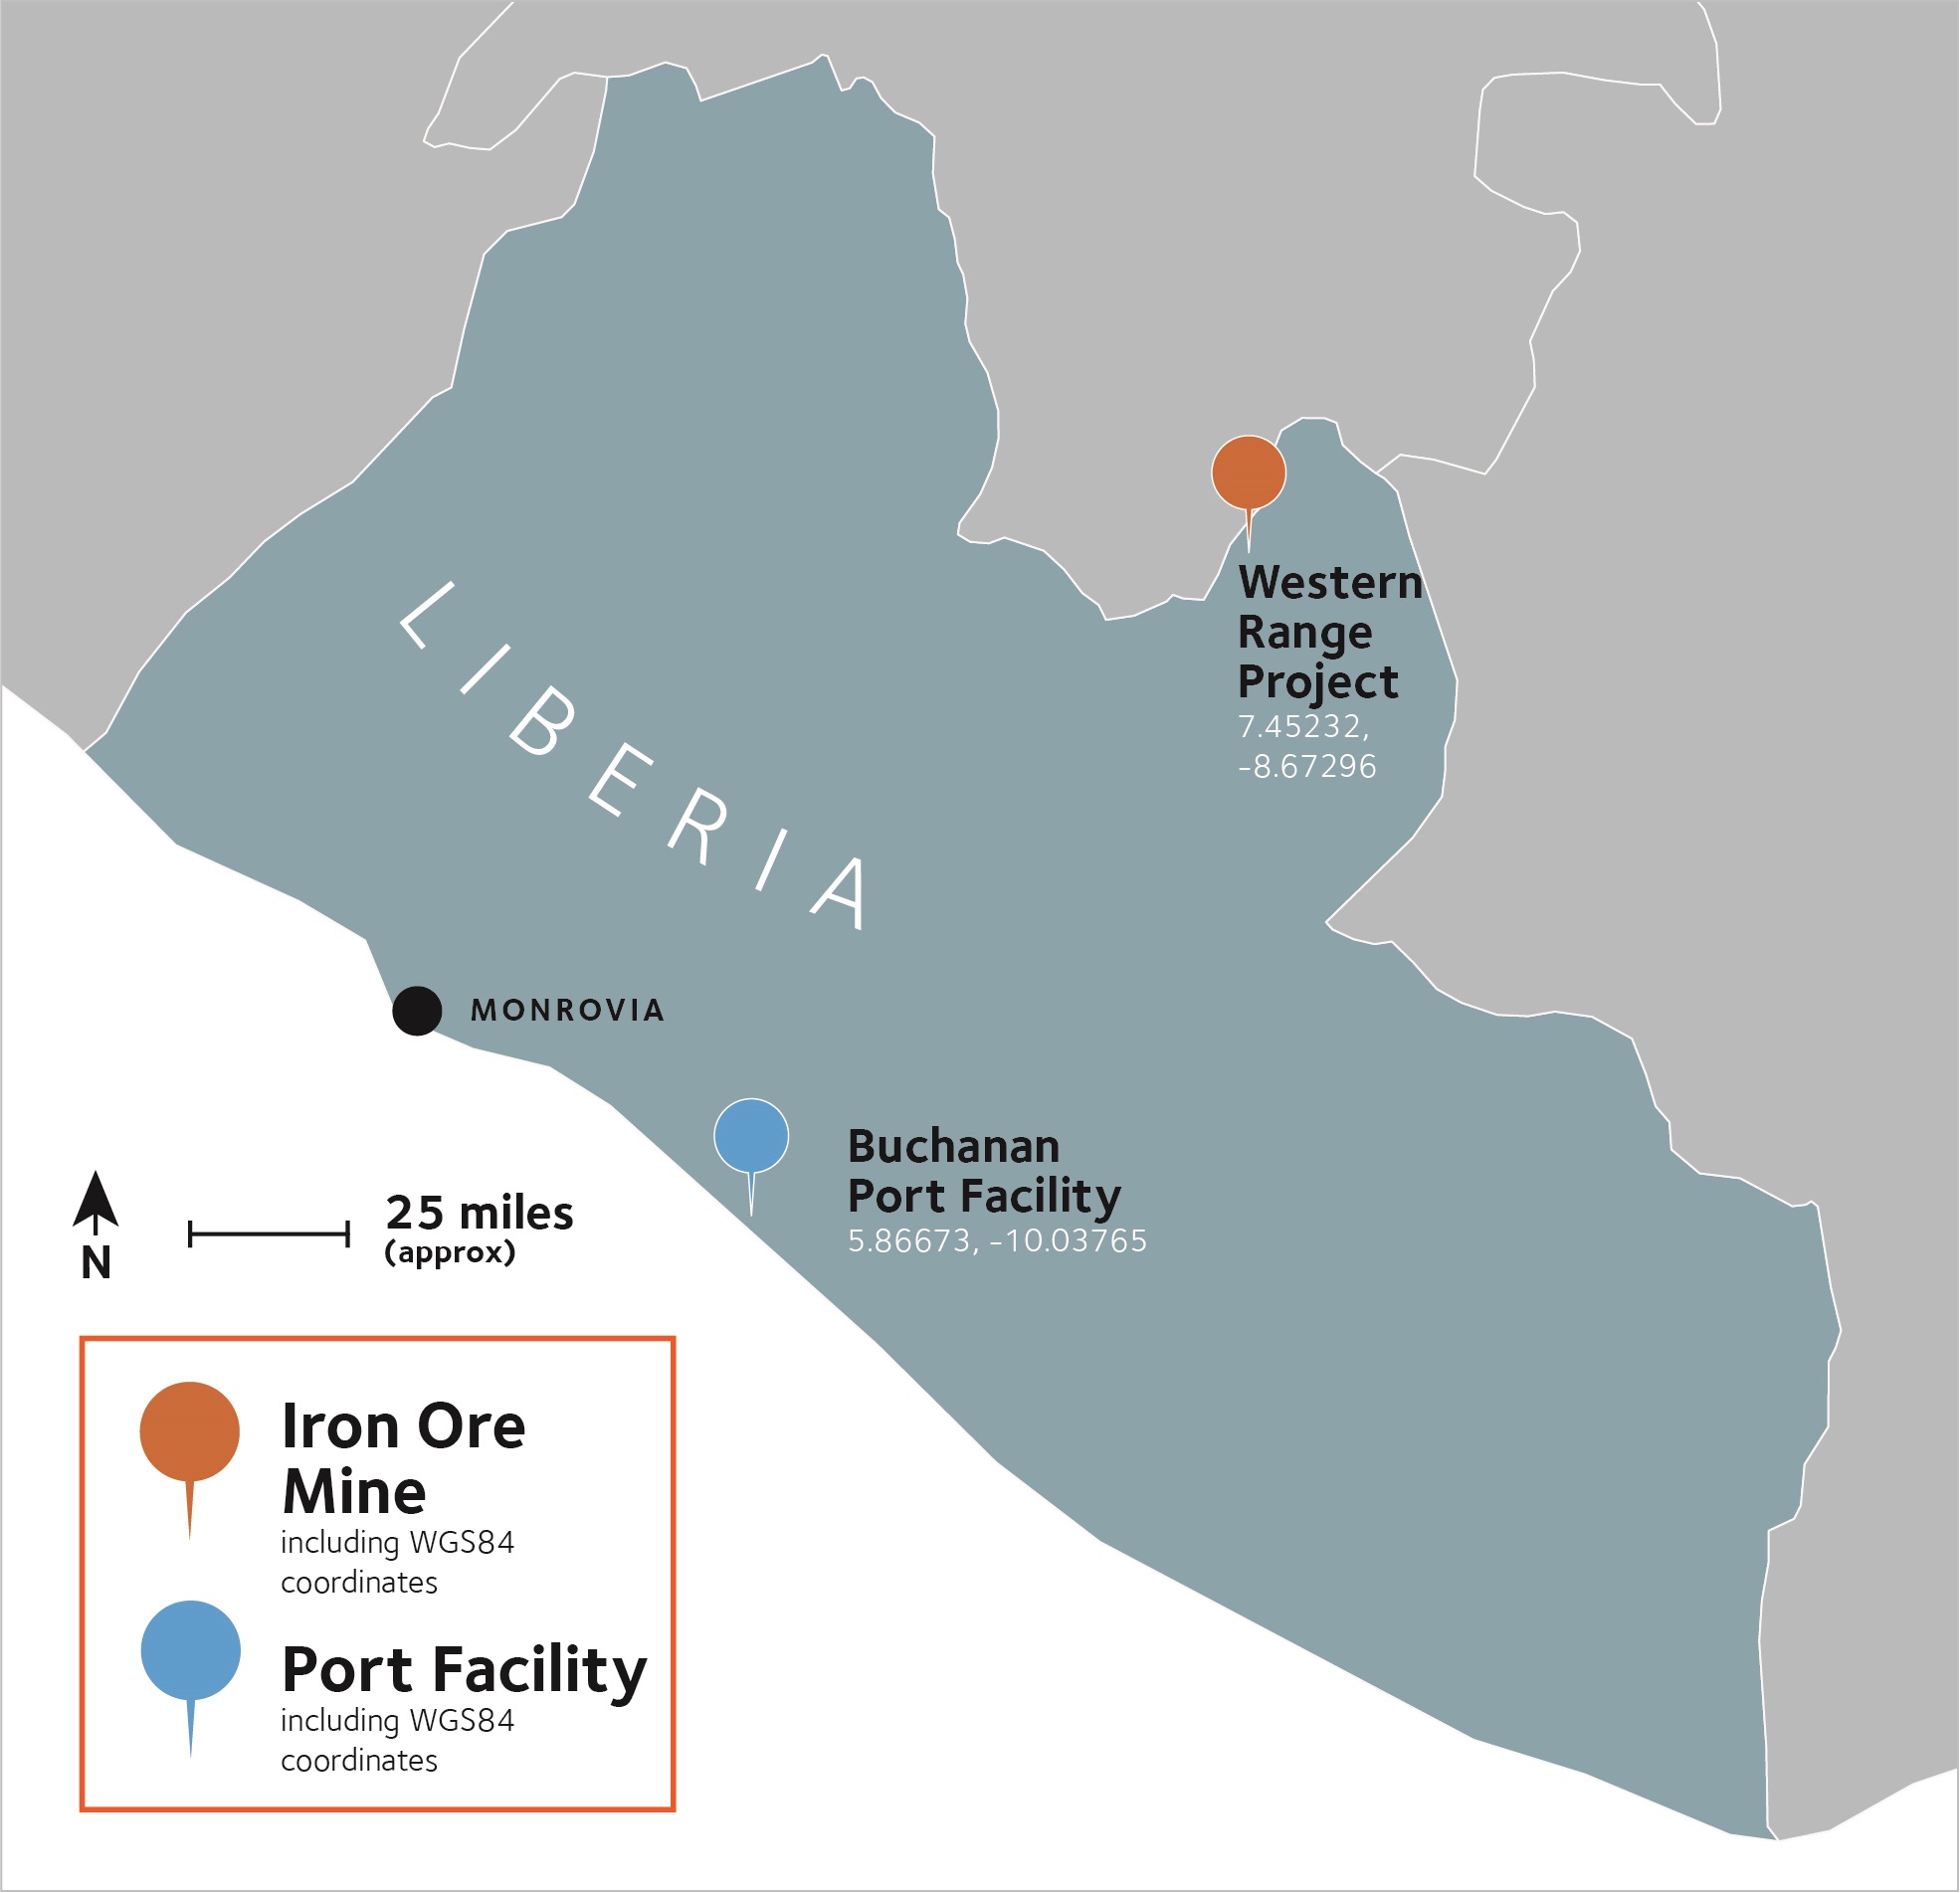
LOCATION MAP - AML
117
| Management report | ||
| % of Ownership Interest | 2023 | 2022 | 2021 | ||||||||||||||||||||||||||||||||
| ROM Millions of Tonnes | Product Millions of Tonnes | ROM Millions of Tonnes | Product Millions of Tonnes | ROM Millions of Tonnes | Product Millions of Tonnes | ||||||||||||||||||||||||||||||
| AMMC | 85.0 | ||||||||||||||||||||||||||||||||||
| At 100% basis | 65.3 | 22.4 | 66.9 | 24.1 | 65.6 | 22.0 | |||||||||||||||||||||||||||||
| At ownership interest (85%) | 55.5 | 19.0 | 56.9 | 20.5 | 55.8 | 18.7 | |||||||||||||||||||||||||||||
| AML | 85.0 | ||||||||||||||||||||||||||||||||||
| At 100% basis | 3.9 | 3.6 | 4.3 | 4.4 | 4.6 | 4.2 | |||||||||||||||||||||||||||||
| At ownership interest (85%) | 3.3 | 3.0 | 3.6 | 3.8 | 3.9 | 3.6 | |||||||||||||||||||||||||||||
Mining segment at 100% basis | 69.2 | 26.0 | 71.2 | 28.5 | 70.2 | 26.2 | |||||||||||||||||||||||||||||
| Mining segment at the ownership interest | 58.8 | 22.0 | 60.5 | 24.3 | 59.7 | 22.3 | |||||||||||||||||||||||||||||
AMMC
AMMC is structured in two partnerships ArcelorMittal Mining Canada G.P. and ArcelorMittal Infrastructure Canada G.P., which are both held at 85% by ArcelorMittal with a 15% non-controlling interest held by 9404-5515 Québec Inc., a consortium constituted, among others, of POSCO, South Korean Steel Company and China Steel Corporation.
AMMC is a production stage property, including two deposits at Mont-Wright and Fire Lake, and another deposit at Mont-Reed. The mines at Mont-Wright and Fire Lake are operated by AMMC and are both open-pit producing mines, consolidated in one production schedule and life of mine supporting the AMMC property's disclosed mineral reserves. The deposit at Mont-Reed is currently in an exploration stage.
The Mont-Wright and Fire Lake deposits are located in Québec, Canada. Mont-Wright is located near Fermont, and Fire Lake is located 85 kilometers south-east of Fermont. The Mont-Reed deposit is located approximately 130 kilometers southwest of Mont-Wright. Along with the Mont-Wright and Fire Lake mines, AMMC operates an ore processing plant located on-site at Mont-Wright, as well as a pelletizing plant located at the Port-Cartier port.
Headquarters of the mines are based in Greater Montreal. Fermont, the town site built to support the mining operations, is located 16 kilometers east of the Mont-Wright mining complex and is connected by Highway 389 to Baie-Comeau, which is 570 kilometers away. The Mont-Wright and Fire Lake mines are located approximately 400 kilometers north of the city of Port-Cartier and approximately 1,000 kilometers north-east of Montreal.
AMMC mining property comprises 38,748 hectares of mineral rights across six mining leases, five patented parcels and 698 map designated claims. Patented parcels have no expiration dates or lease fees whereas active leases are valid for a period of ten years. All current leases expire between 2025 and 2033
and can be renewed as needed, with reports on material moved disclosed to the government on a yearly basis.
The Mont-Wright, Fire Lake and Mont-Reed deposits are all Lake Superior–type banded iron formations, the metamorphic equivalent to other iron formations within the Labrador Trough iron district. While Mont-Wright and Fire Lake are hematite-rich deposits, Mont-Reed has a greater ratio of magnetite.
Mont-Wright and Fire Lake are surface pit producing mines, with the mining operations carried out in conventional large-scale open pits employing industry standard technology and equipment to mine ore with grades averaging approximately 29% Fe.
All mined ore from Mont-Wright and Fire Lake is processed at the Mont-Wright processing plant, with material from Fire Lake brought in by train. Feed ore material is fed through the crusher and concentrated in the processing plant in Mont-Wright using a gravity separation method. Concentrate is shipped to Port-Cartier, Québec, Canada, via private railroad, to the pelletizing facilities and port operations. The main products sold are concentrate and a variety of pellets.
AML
AML is an open pit production stage property and has been mining direct shipping ore ("DSO") from the Mt. Tokadeh, Mt. Gangra, and Mt Yuelliton deposits in northern Liberia, since 2011. ArcelorMittal’s ownership of AML is 85%, with the remaining 15% owned by the Liberia Government. The construction of the mine commenced in 1960 by a group of Swedish companies, which ultimately became the Liberian American-Swedish Minerals Company (“LAMCO”), and production commenced at the Nimba deposit in 1963. After LAMCO ceased production in 1992, AML signed a Mineral Development Agreement (MDA) in 2005 with the Liberian Government. On December 28, 2006, AML signed the First Amendment to the MDA with the Liberian Government. On
118
| Management report | ||
January 23, 2013, the parties signed the Second Amendment to the MDA.
Under the MDA, AML is currently developing three deposits located approximately 300 kilometers northeast of Monrovia, Liberia. Three deposits within the MDA are grouped under the name “Western Range Project”, which includes the Mt. Tokadeh, Mt. Gangra and Mt Yuelliton deposits. The MDA, which is valid until 2030, grants a concession area to AML of approximately 51,342 hectares within which AML has the rights to explore or mine iron ore. Within the concession area, AML has a Class A mining license for the Mt. Tokadeh, Mt. Gangra and Mt Yuelliton deposits and a Mineral Exploration License for Mt. Blei and Mt Detton. In addition to the rights to explore and mine iron ore, the Liberian Government has granted the right to develop, use, operate and maintain the Buchanan to Yekepa railroad and the Buchanan port, along with an area at Buchanan for township and industrial facilities for material handling and workshops.
The Nimba range consists of itabirites in a 250 to 450-meter-thick recrystallized iron formation. Although the iron deposits at Mt. Tokadeh, Mt. Gangra and Mt Yuelliton fit the general definition of itabirite as laminated metamorphosed oxide-facies iron formation, they are of lower iron grade than the ore previously mined at the Nimba deposit. Tropical weathering effects have caused the decomposition of the rock forming minerals resulting in enrichment in the iron content that is sufficient to support a DSO operation and accordingly, currently, only high-grade ore reserves of oxidized iron ore are mined. This ore only requires crushing and screening to make it suitable for export. The materials-handling operation consists of stockyards at both the mine and port areas, which are linked by a 250-kilometer single track railway running from Mt. Tokadeh to the port of Buchanan. The facilities at the port consist of tail pulley platforms, a conveyor system, a quayside including bays for iron ore storage, a fuel quayside jetty, an equipment workshop and the final product storage. The final product is primarily supplied to ArcelorMittal's steel plants in Europe, and any product balance is shipped to the external European market.
In 2013, AML began construction of a Phase 2 project that targeted 15 million tonnes per annum of concentrate sinter fines. This project was, however, suspended due to the onset of Ebola in West Africa and the subsequent force majeure declaration by the onsite contracting companies. AML completed a revised feasibility study, which was updated in 2019-2020, to apply best available technology and replace wet with dry stack tailings treatment. The Phase 2 expansion includes the construction of a concentrator plant with the ability to beneficiate oxidized and transitional ores and that targets 15 million tonnes per annum of premium iron ore product. An ongoing metallurgical program is in place to optimize the mass recovery of the oxide and transitional material. The concentrator phase, which is to be
constructed in modules, will transition AML to a premium product category (high grade concentrate) asset while achieving a low FOB and CIF-China cost position (with the economies of scale projected to more than offset the cost of concentration). The expansion project, which encompasses processing, rail and port facilities, will be one of the largest mining projects in West Africa. It is effectively a brownfield expansion, with 90% of the procurement already completed (with the equipment on site) and the civil works are scheduled to be completed by the end of the first quarter of 2024, with structural, mechanical, piping and platework well progressed. First concentrate is expected at the end of the fourth quarter of 2024. The revised feasibility study also contemplates a future change to the processing infrastructure to enable the production of high-quality concentrate from the magnetite dominant fresh ores (Phase 3). See also "—Capital expenditures".
JOINT VENTURES AND ASSOCIATES
AMNS India is a joint venture in which ArcelorMittal and NSC hold a 60% and 40% interest, respectively.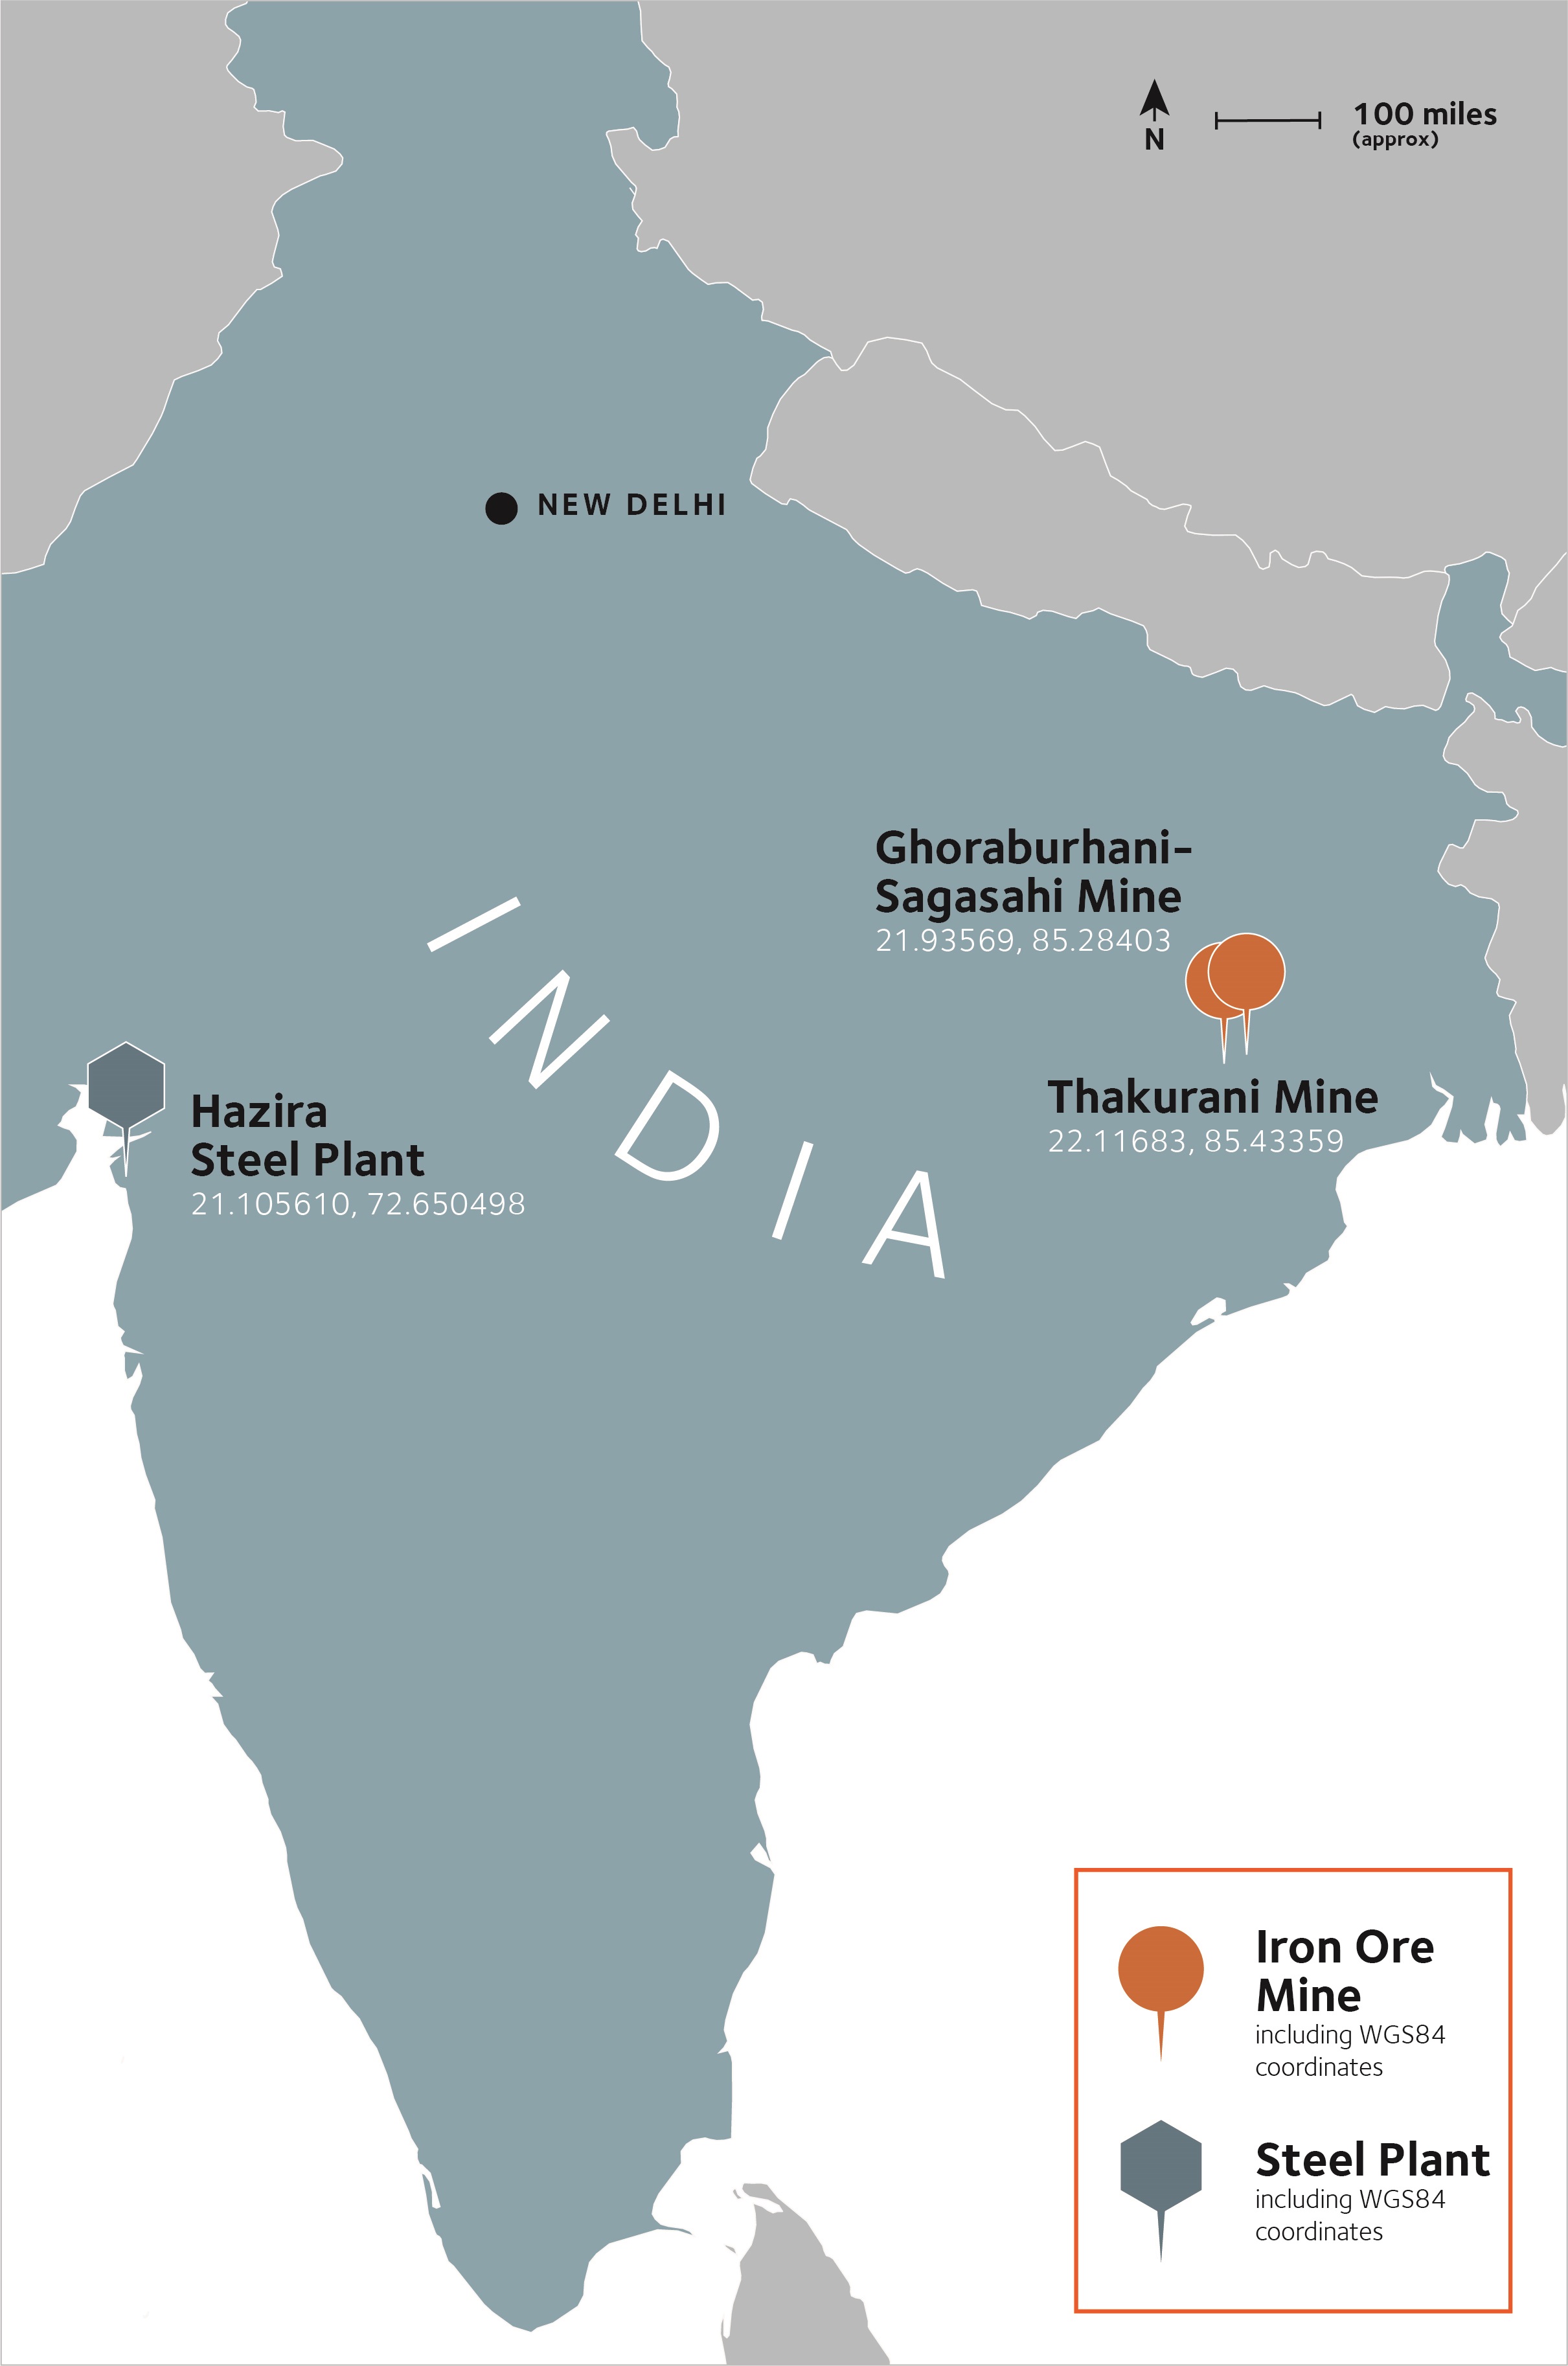
LOCATION MAP - INDIA
119
| Management report | ||
| % of Ownership Interest | 2023 | 2022 | 2021 | |||||||||||||||||||||||||||||
| ROM Millions of Tonnes | Product Millions of Tonnes | ROM Millions of Tonnes | Product Millions of Tonnes | ROM Millions of Tonnes | Product Millions of Tonnes | |||||||||||||||||||||||||||
| AMNS India | 60.0 | |||||||||||||||||||||||||||||||
| At 100% basis | 10.8 | 10.7 | 9.1 | 8.9 | 7.4 | 6.8 | ||||||||||||||||||||||||||
| At ownership interest (60%) | 6.5 | 6.4 | 5.4 | 5.3 | 4.5 | 4.1 | ||||||||||||||||||||||||||
Thakurani mine
AMNS India's Thakurani iron ore mine is a production stage open pit mine in the Odisha state of India. AMNS India holds surface and mineral rights over 228 hectares to support its Thakurani operations, located 320 kilometers to the north of the Odisha's capital Bhubaneswar and 4 kilometers east of the town of Barbil.
The operation and mining rights to the Thakurani operations were obtained by AMNS India in February 2020 through the Indian Government Mining Block auction scheme. The Thakurani open pit mine has been operated since 1961 and has both mature mining pits and undeveloped resource areas. AMNS India commenced mining operations in mid-2020, following the demobilization of the previous claim holder, Kaypee Enterprises.
AMNS India has a permit in place for 5.5 million tonnes per annum of ore production. The ramp-up to a capacity of 5 million tonnes per annum was completed in 2021. The mining lease deed was granted in 2020 for a period of 50 years. Until June 2021, all production from the mine had to be consumed by specified AMNS India end use plants, after which up to 25% of production may be sold to a third party. The permitted production rate was increased to 7.99 million tonnes per year from 2023 after a submission approved by the Indian Bureau of Mines in late 2020.
The Thakurani operations lie in the south eastern part of the Singhbhum-Keonjhar-Bonai iron ore belt, a narrow NNE-SSW directional trending folded syncline that runs through northern Odisha, India and southern Jharkhand, India. The Precambrian horseshoe shaped belt is a well-known iron ore province hosting many iron ore deposits. The enriched sequence is a traditional Banded Iron Formation that has been subject to significant weathering that has enriched the iron ore deposits. Ore is generally of the friable hematite type, however more competent hematite ores and friable goethite ores are also present.
The current mining operation at Thakurani is being carried out by conventional mining methods using excavators and trucks for ore transportation to a mobile crushing facility. Ore from the Thakurani operation is crushed and screened on site before being transported by road to the Dabuna beneficiation plant located approximately 40 kilometers to the south. Beneficiated
material is then transported by slurry pipeline to the pelletizing plant at Paradip, located on the coast of Bay of Bengal.
Ghoraburhani – Sagasahi mine
The Ghoraburhani – Sagasahi mine is a production stage open pit iron ore mine, located in the Sundargarh district of Odisha, state of India. The operation and mining rights to the Ghoraburhani – Sagasahi operations were obtained through the AMNS India takeover of Essar Steel India Limited (ESIL) in December 2019. The mining lease deed was granted in 2021, for a period of 50 years and permits production of up to 7.16 million tonnes per annum of ore primarily for captive usage. AMNS India holds surface and mineral rights over 139 hectares at the Ghoraburhani – Sagasahi mine.
The Ghoraburhani – Sagasahi operations lie in the south- western part of the Singhbhum-Keonjhar-Bonai iron ore belt. The enriched sequence is a traditional Banded Iron Formation that has been subject to significant weathering and deformation that has enriched the iron ore deposits. Ore is generally of lateritic iron ore/hard laminated ore on the top followed by soft laminated ore and friable hematite with intercalations of friable shaly ore and limonitic ore are also present.
Ore mining commenced at the Ghoraburhani – Sagasahi mine in 2021 by conventional mining methods, using excavators and trucks for ore transportation to a mobile screening & crushing facility, where ore is crushed and screened on site before being transported by road to the Dabuna beneficiation plant located approximately 28 kilometers to the south east. Beneficiated material is then transported by 253 kilometers slurry pipeline to the pelletizing plant at Paradip.
120
| Management report | ||
Baffinland
ArcelorMittal has a non-controlling interest at the associate Baffinland iron ore mine.
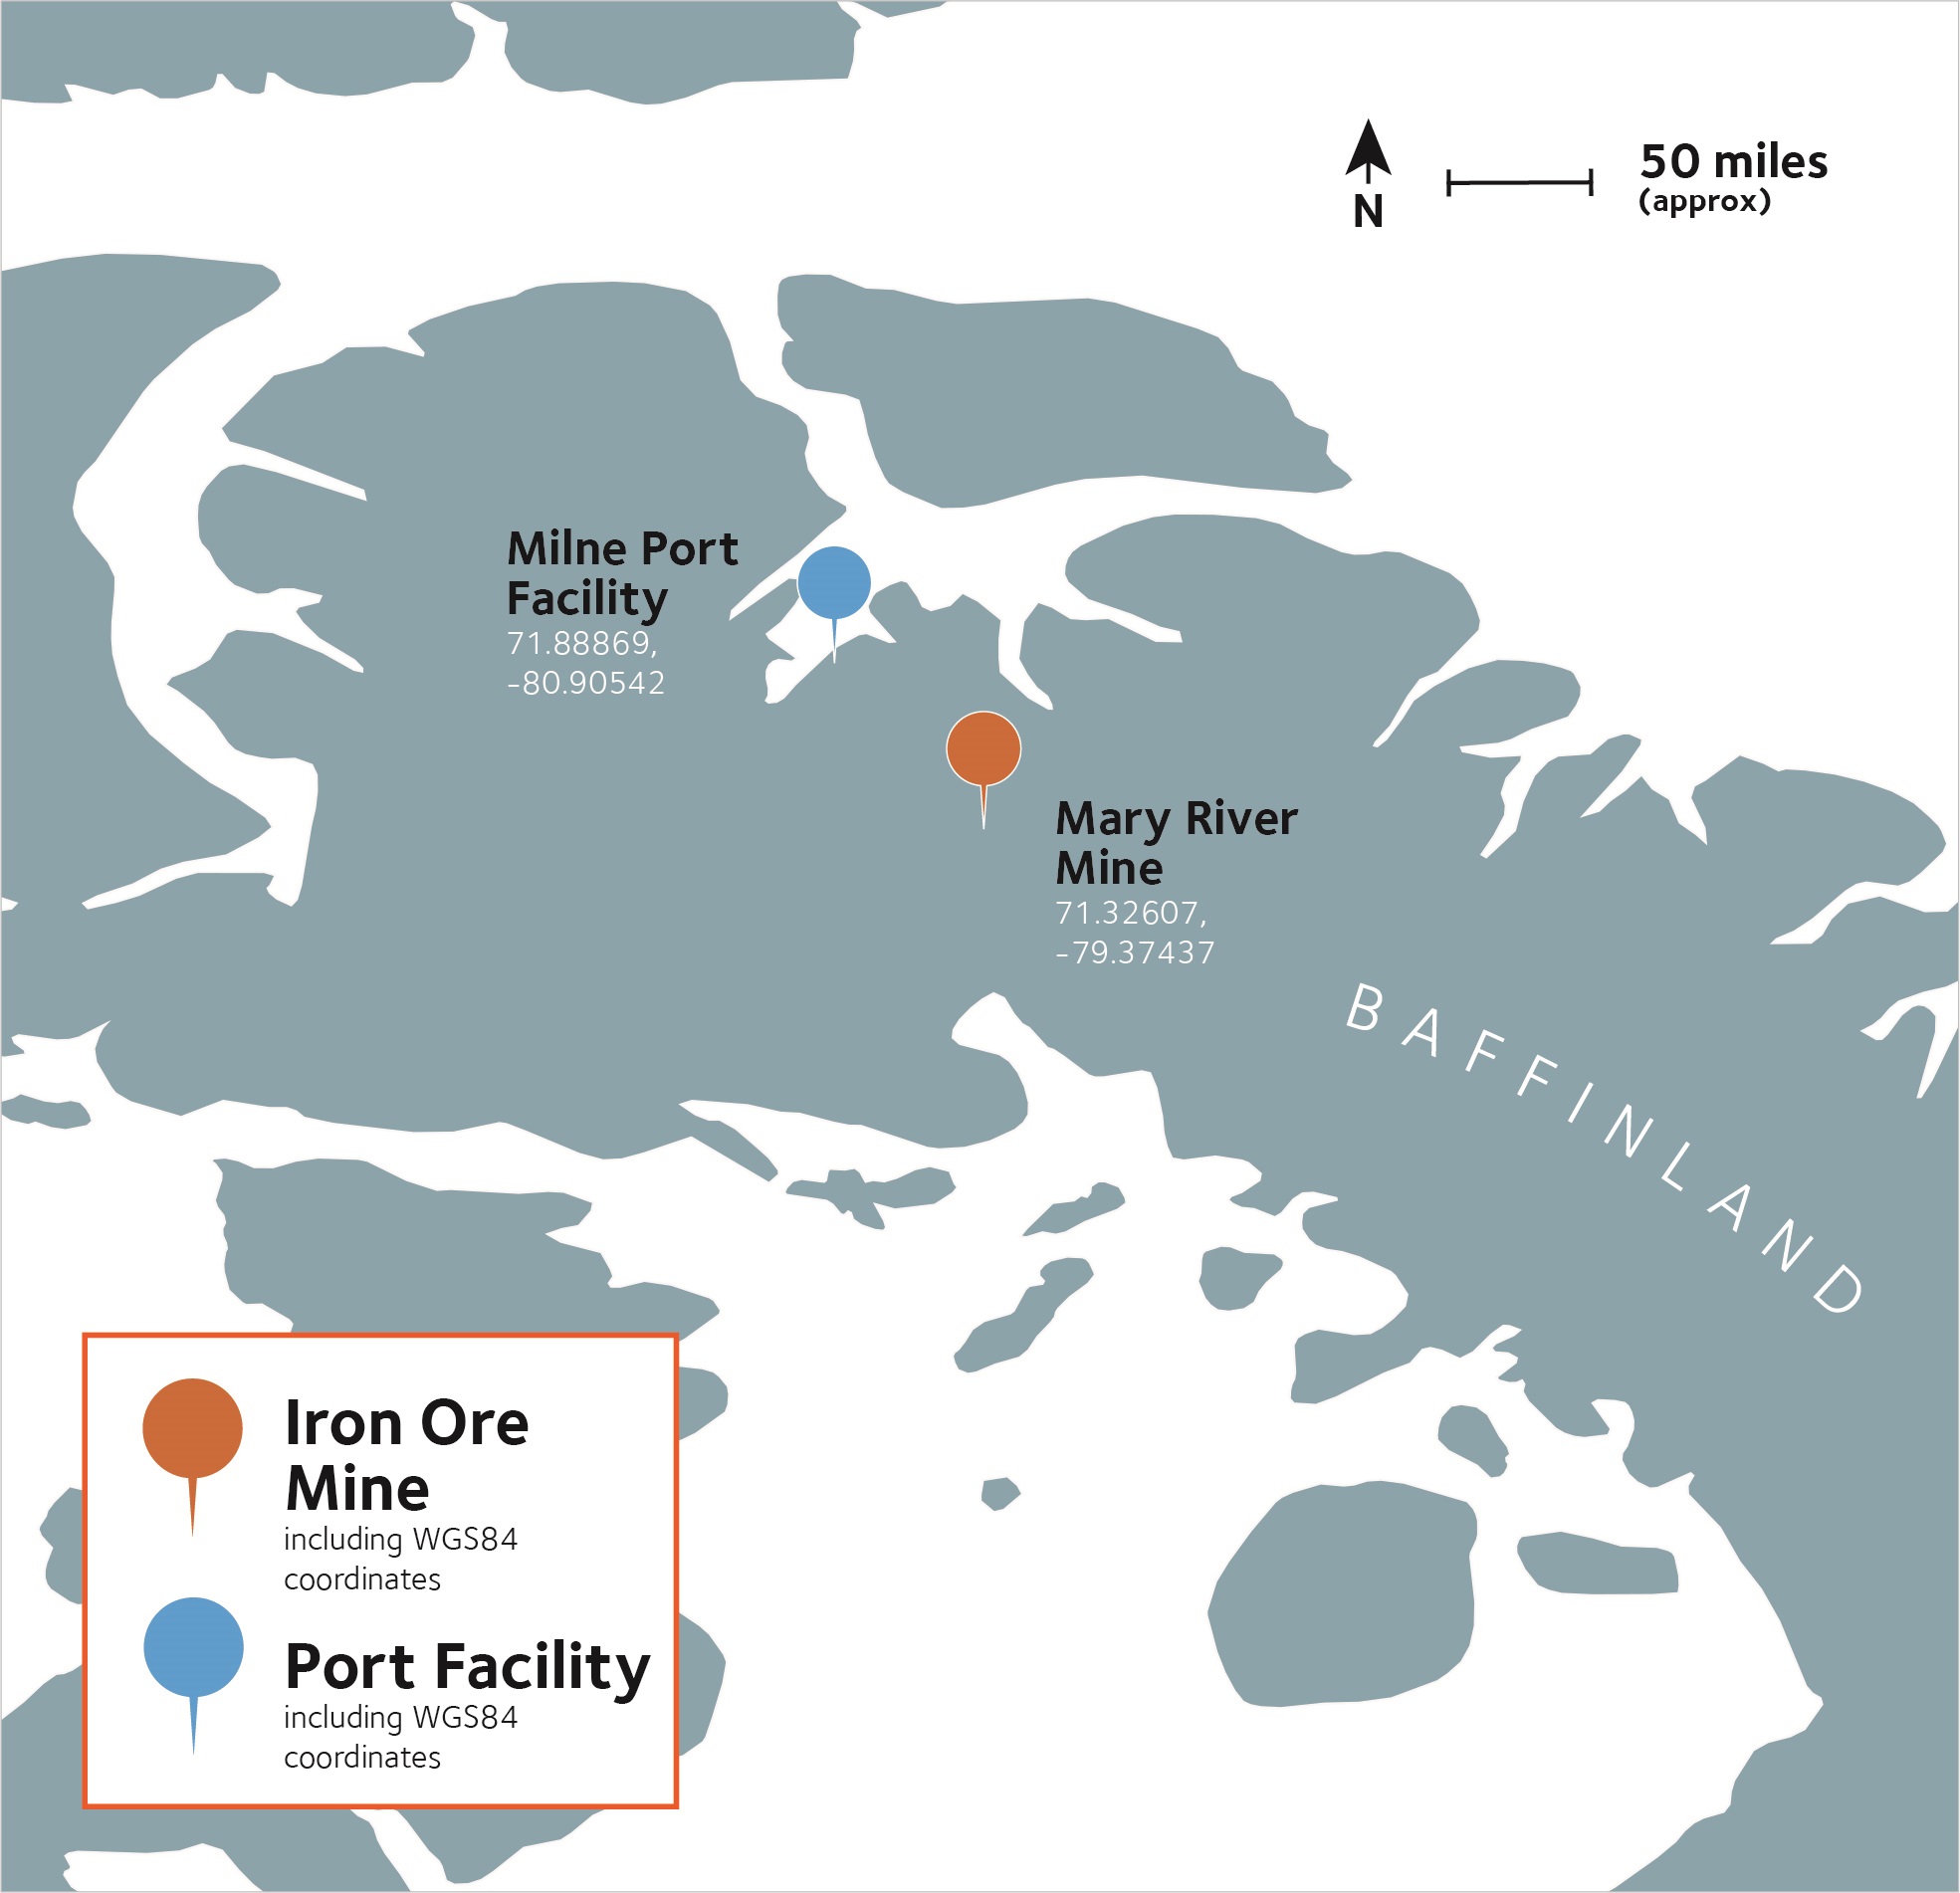
LOCATION MAP - BAFFINLAND
| % of Ownership Interest | 2023 | 2022 | 2021 | ||||||||||||||||||||||||||||||||
| ROM Millions of Tonnes | Product Millions of Tonnes | ROM Millions of Tonnes | Product Millions of Tonnes | ROM Millions of Tonnes | Product Millions of Tonnes | ||||||||||||||||||||||||||||||
| Baffinland | 25.23 | ||||||||||||||||||||||||||||||||||
| At 100% basis | 6.2 | 5.6 | 7.2 | 5.9 | 6.3 | 5.5 | |||||||||||||||||||||||||||||
| At ownership interest (25.23%) | 1.6 | 1.4 | 1.8 | 1.5 | 1.6 | 1.4 | |||||||||||||||||||||||||||||
The Mary River mine is a production stage open pit high-grade iron ore mine. The mine is operated by Baffinland Iron Mines Corporation, a privately owned Canadian mining company.
The Mary River property is located within the Arctic Circle on north Baffin Island, in the Qikiqtani Region of Nunavut, Canada, approximately 1,000 kilometers (620 miles) northwest of Iqaluit, the capital of Nunavut. It comprises five high grade deposits and six prospects, which represent high grade examples of Algoma-type iron formation consisting of magnetite, hematite and specular hematite mineralization. The project began commercial production on Deposit No. 1 in 2014.
In March 2011, ArcelorMittal acquired 70% of the Mary River mine project, with Nunavut Iron Ore Inc. (“NIO”), an affiliate of The Energy and Minerals Group (“EMG”), owning the remaining 30%. In February 2013, ArcelorMittal and NIO entered into a joint arrangement and equalized their shareholdings at 50/50. Subsequently, following equity funding commitments and conversion of preferred shares into equity, both exercised by NIO only, ArcelorMittal’s share over time decreased to 25.70% as of December 31, 2019 and 25.23% as of December 31, 2020. In September 2020, the corporate structure was reorganized whereby NIO became the sole parent company of
121
| Management report | ||
Baffinland, while ArcelorMittal together with EMG became shareholders of NIO. Following this reorganization, ArcelorMittal retained its participation in the project and as of December 31, 2023, holds a 25.23% interest in NIO.
Baffinland’s total mineral tenures (including mining leases, mineral claims and mineral exploration agreements) cover an area of approximately 271,282 hectares (671,701 acres). Of this, approximately 14% is subject to mining leases (being leased claims under the Nunavut Mining Regulations), 79% is covered by mineral claims (being recorded claims under the Nunavut Mining Regulations) and the rest by mineral exploration agreements.
Baffinland has two main operating locations – the mine site at Mary River and Milne Port, located approximately 86 kilometers north-west of the mine site. The Mary River mine is self-sustaining and is equipped with an airstrip and aerodrome. It is a conventional open pit truck and shovel operation. Ore is delivered to crushers before the crushed product is transported via the 100 kilometer Tote road to Milne Port. Milne Port has been fully developed to accommodate a 5 million-tonne ore stockpile, an ore dock, maintenance facility, and associated infrastructure for the operation of the port facilities. Baffinland can only ship during the open water season (typically July to October), but may conduct haulage of ore to the port throughout the year.
In 2023, Baffinland operated within an approved Early Revenue Phase, which permitted up to 6.0 million tonnes per annum to be hauled to and shipped from Milne Port. The current permitting limit on trucking and shipping is 4.2 million tonnes per annum. In September 2023, Baffinland obtained continued approval for an increase to 6 million tonnes per annum for 2024.
Baffinland had approved a project involving the construction of a railway to replace the existing truck-haul operation for the transport of iron ore from Mary River to Milne Inlet, as well as the expansion of mining, crushing and screening operations and port ship loading capacity (the "Northern Rail Expansion"),
On May 13, 2022, the Nunavut Impact Review Board (“NIRB”) formally recommended that Baffinland’s proposed Northern Rail Expansion not move forward at this time, citing potential environmental impact concerns on the local wildlife and culture, among other things. On November 16, 2022, the Minister of Northern Affairs accepted the NIRB's recommendation, and rejected Northern Rail Expansion.
Beginning in 2023, Baffinland’s expansion activities and related capital expenditures have been primarily directed toward expanding the mining and processing operations at the Mary River mine site and connecting the mine site south to the Steensby port (for which it has already obtained the major
permits) (the “Steensby Expansion”). Baffinland continues to advance the financing plans for the Steensby Expansion and expects the overall financing process to conclude in the second half of 2024.
122
| Management report | ||
Coal Operations
ArcelorMittal Temirtau had eight underground coal mines located in and around Karaganda in Kazakhstan: Kostenko, Kuzembaeva, Saranskaya, Abayskaya, Kazakhstanskaya,
Lenina, Shakhtinskaya and Tentekskaya. Until the sale of ArcelorMittal Temirtau on December 7, 2023, the mines were 100% owned by ArcelorMittal and integrated into and operated by ArcelorMittal Temirtau steel business as captive mines.
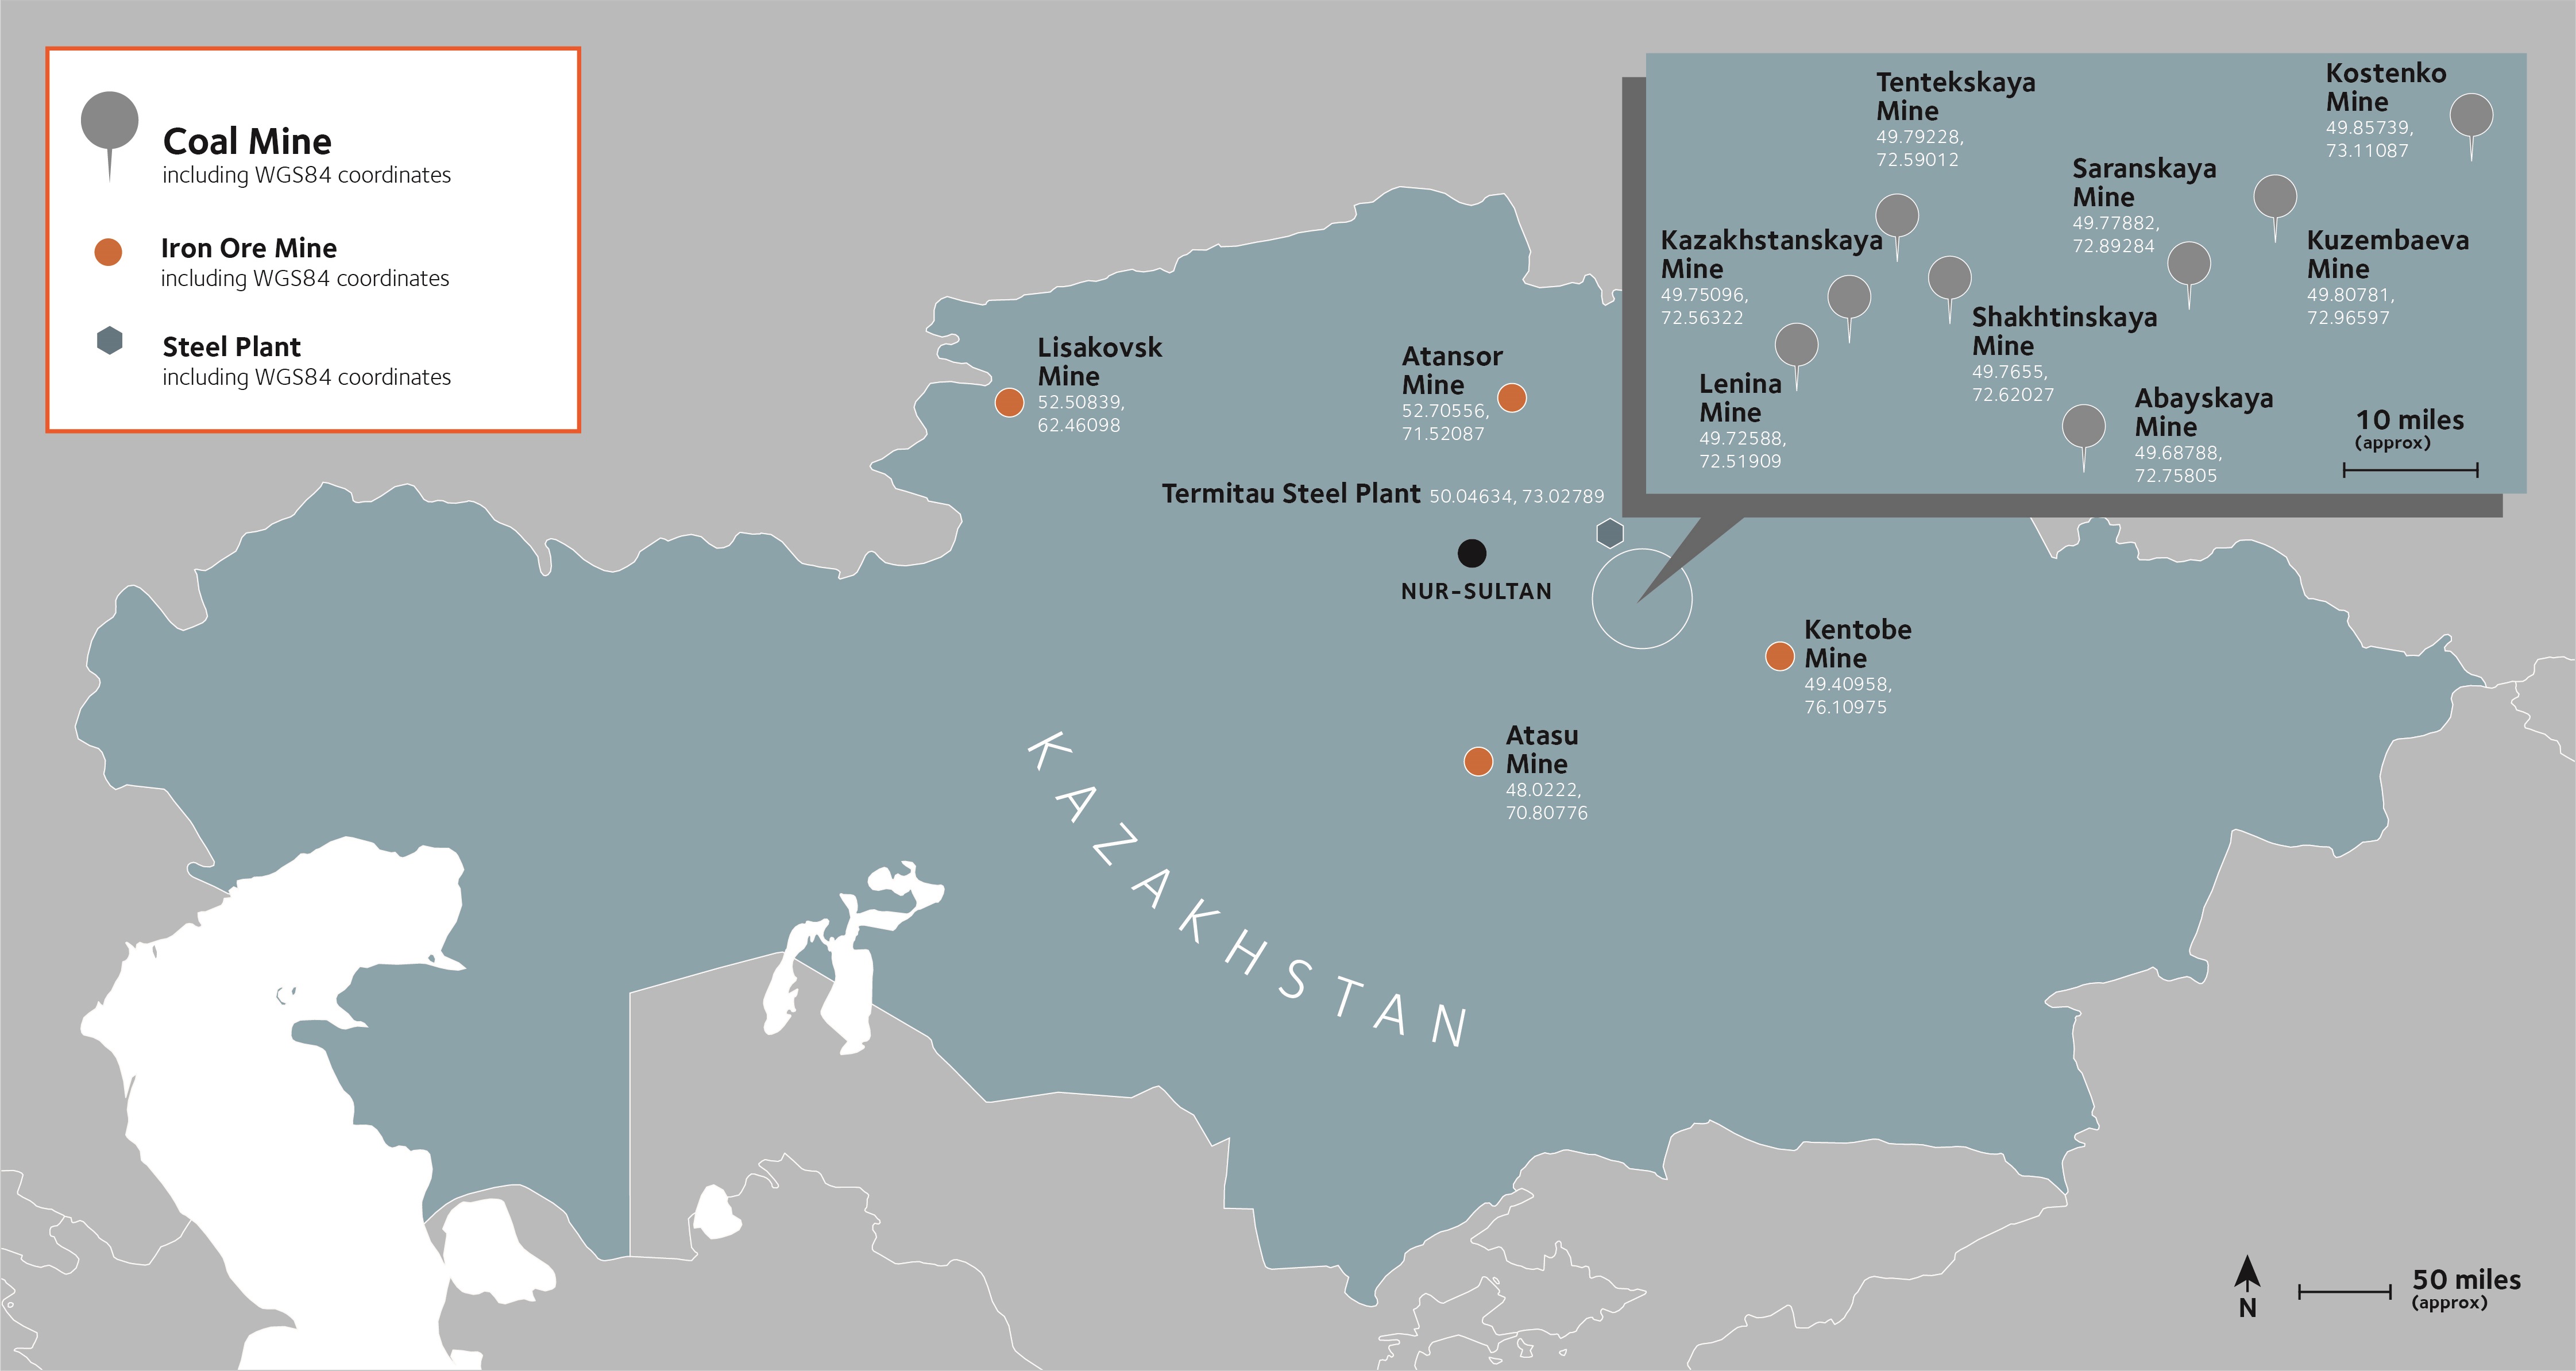
LOCATION MAP - ArcelorMittal Temirtau Coal
| % of Ownership Interest | 2023 | 2022 | 2021 | ||||||||||||||||||||||||||||||||
ROM Millions of Tonnes1 | Product Millions of Tonnes1 | ROM Millions of Tonnes | Product Millions of Tonnes | ROM Millions of Tonnes | Product Millions of Tonnes | ||||||||||||||||||||||||||||||
| Karaganda - Kazakhstan | 100.0 | 5.8 | 2.0 | 7.0 | 2.6 | 8.3 | 3.3 | ||||||||||||||||||||||||||||
| 1. The total production related to ArcelorMittal Temirtau is included in the table through the transaction closing date on December 7, 2023. | |||||||||||||||||||||||||||||||||||
Estimates of Iron Ore Mineral Reserves and Mineral Resources
For the meanings of certain technical terms used in this annual report, see “Glossary - definitions, terminology and principal subsidiaries”.
The estimates of mineral resources and mineral reserves at the Company’s mines and projects and the estimates of the mine life included in this report have been prepared by qualified persons, in accordance with the guidelines for mining property disclosure requirements in accordance with S-K 1300. Qualified persons are either employees of ArcelorMittal, or they are third parties or employees of a third party who are not affiliates of ArcelorMittal and neither such third parties or their employers has an ownership, royalty or other interest in the property for which they have estimated mineral reserves or mineral
resources. No qualified persons have been employed on a contingent basis. For additional information about the qualified persons identified below, please see the exhibits to this annual report.
Only measured and indicated mineral resources, where the level of geological certainty associated was sufficient to allow a qualified person to apply modifying factors in sufficient detail to support mine planning and evaluation of the economic viability of the deposit, were converted to proven or probable mineral reserves for each of the mineral properties under the summary disclosure.
123
| Management report | ||
The 2023 mineral resource and mineral reserve estimates at the AMMC mining property have been prepared by qualified persons who are employees of ArcelorMittal.
The 2023 mineral resource and reserve estimates for the Las Truchas and San José mines (consolidated as Mexico, excluding Peña Colorada in the tables below) were prepared by qualified persons of SLR Consulting (Canada) Ltd. Peña Colorada also contracted SLR Consulting (Canada) Ltd. to provide the 2023 mineral resource and reserve estimates for the Peña Colorada mine, with the support of the Peña Colorada team.
The 2023 mineral resource and reserve estimates for the Andrade and Serra Azul mines (consolidated as Brazil in the tables below) were prepared by qualified persons of the GE21 Consultoria Mineral, with the support of the ArcelorMittal Brazil local team.
The mineral resource and reserve estimates for the AMKR (Ukraine) open pit and underground operations as of December 31, 2023 were prepared by LLC "KAI".
For 2023, mineral resource and reserve estimates for the Thakurani and Ghoraburhani – Sagasahi mines (India in the tables below) were prepared by a qualified person of BMRC Geomining Solutions LLP.
AML's 2023 mineral resources and mineral reserves were estimated by qualified persons who are employees of ArcelorMittal. In 2023, a qualified person of VBKOM (Pty) Ltd updated the mineral resources estimate for the Vanderbijl pit at Thabazimbi (South Africa in tables below). Estimates of mineral reserves are not reported in 2023 for ArcelorMittal South Africa iron ore operation Thabazimbi. Mineral resources and mineral reserves as of December 31, 2023 for ArcelorMittal Prijedor (Bosnia in the tables below) were prepared by an independent qualified person. The mineral resources and reserves for the Mary River Mine (Baffinland in the tables below) as of December 31, 2023 were estimated by a qualified person of SLR Consulting (Canada) Ltd, with the support of the Baffinland team.
Following the sale of the ArcelorMittal Temirtau operations on December 7, 2023, mineral reserves and resources for iron ore surface mines (previously consolidated as Kazakhstan Open Pit), underground iron ore mine (previously Kazakhstan Underground) and coal mines (previously Kazakhstan-Karaganda) are no longer reported by ArcelorMittal.
The point of reference of reporting all of ArcelorMittal's mineral resources and reserves in the tables below is in situ for resources and the point of delivery of the ROM material to the processing plant for reserves. All material is reported on a wet
basis and grades on a dry basis. The effective date for reporting of all mineral resources and reserves is December 31, 2023.
For each of the mining operations under the summary disclosure, economic viability of the declared mineral reserves has been determined by the qualified persons using a discounted cash flow analysis, demonstrating that extraction of the mineral reserve is economically viable under reasonable investment and market assumptions. The estimated mine life reported in this table corresponds to the duration of the production schedule of each operation based on the 2023 year-end iron ore reserve estimates only. The production varies for each operation during the mine life and as a result the mine life is not the total reserve tonnage divided by the 2023 production. Mine life of each operation is derived from the life of mine plans and corresponds to the duration of the mine production scheduled from mineral reserve estimates only. The demonstration of economic viability is established through the application of a life of mine plan for each operation or project providing a positive net present value on a cash-forward looking basis, considering the entire value chain. Economic viability is demonstrated using forecasts of operating and capital costs based on historical performance, with forward adjustments based on planned process improvements, changes in production volumes and in fixed and variable proportions of costs, and forecasted fluctuations in costs of raw material, supplies, energy and wages. Mineral reserve estimates are updated annually in order to reflect new geological information and current mine plan and business strategies. The Company’s reserve estimates are of in-place material after adjustments for mining depletion and mining losses and recoveries, with no adjustments made for metal losses due to processing. For a description of risks relating to reserves and reserve estimates, see “Introduction—Risk factors—Risks related to ArcelorMittal’s mining activities".
The reported iron ore reserves contained in this report do not exceed the quantities that the Company estimates could be extracted economically if future prices were at similar levels to the average contracted price for the three years ended December 31, 2023. The Company establishes optimum design and future operating cut-off grade based on its forecast of commodity prices, adjusted for local market conditions, freight, inland logistics costs, and final product value in use premiums/penalties, and operating and sustaining capital costs. The cut-off grade varies from operation to operation and during the life of each operation in order to optimize cash flow, return on investments and the sustainability of the mining operations. Such sustainability in turn depends on expected future operating and capital costs. Estimates of reserves and resources can vary from year to year due to the revision of mine plans in response to market and operational conditions, in particular market price. See “Introduction—Risk factors—Risks related to ArcelorMittal’s
124
| Management report | ||
mining activities—ArcelorMittal’s reserve and resource estimates may materially differ from mineral quantities that it may be able to actually recover; ArcelorMittal’s estimates of mine life may prove inaccurate; and market price fluctuations and changes in operating and capital costs may render certain ore reserves uneconomical to mine.”
To ensure that mineral resource estimates for all mines satisfy the requirements for reasonable prospects for economic extraction ("RPEE") requirement, reasonable technical and economic factors were considered by qualified persons in the process of derivation of the ultimate mineral resource pit shells or underground constraining wireframes and other spatial controls used to constrain the mineralization. Factors used are current, considered to be reasonably developed, and are based on generally accepted industry practice and experience.
Tonnage and grade estimates are reported as ‘Run of Mine’. Tonnage is reported on a wet metric basis. Metallurgical recoveries are accounted for in the concentrate tonnes calculation based on historical processing data and are variable as a function of head grade.
ArcelorMittal owns less than 100% of certain mining operations; mineral reserve and mineral resource estimates have been
adjusted to reflect ownership interests and therefore reflect the portion of total estimated mineral reserves and resources of each mine attributable to ArcelorMittal as per the Company’s ownership interest in each mine at December 31, 2023.
The classification of the iron ore reserve estimates as proven or probable reflects the variability in the mineralization at the selected cut-off grade, the mining selectivity and the production rate and ability of the operation to blend the different ore types that may occur within each deposit.
The following table summarizes ArcelorMittal’s mineral reserves as of the end of the fiscal year ended December 31, 2023 in the aggregate, and by commodity and country and for each property containing 10% of more of ArcelorMittal’s combined mineral reserves. Mineral reserve quantities are rounded to million tonnes. Unless indicated otherwise below, for the purpose of determining iron ore mineral reserves, ArcelorMittal has used a long-term iron ore reference price of $70 per tonne for 62% Fe fines, based on supply/demand fundamentals and industry cost curve adjusted upwards or downwards for mine specific factors and further adjusted for grade, logistics, and other adjustments.
Iron Ore | % of Ownership Interest12 | Proven Mineral Reserves | Probable Mineral Reserves | Total Mineral Reserves | |||||||||||||||||||||||||||||||
| Millions of Tonnes | % Fe 1 | Millions of Tonnes | % Fe 1 | Millions of Tonnes | % Fe 1 | ||||||||||||||||||||||||||||||
| Canada | 1,881 | 30.8 | 104 | 55.0 | 1,985 | 32.1 | |||||||||||||||||||||||||||||
AMMC2 | 85.0 | 1,790 | 29.1 | 28 | 31.1 | 1,818 | 29.1 | ||||||||||||||||||||||||||||
Baffinland3 | 25.2 | 91 | 64.4 | 76 | 63.8 | 167 | 64.1 | ||||||||||||||||||||||||||||
| Mexico | 46 | 22.3 | 176 | 25.7 | 222 | 25.0 | |||||||||||||||||||||||||||||
Mexico (Excluding Peña Colorada)4 | 100.0 | — | 39.3 | 107 | 29.1 | 107 | 29.2 | ||||||||||||||||||||||||||||
Peña Colorada - Mexico5 | 50.0 | 46 | 22.2 | 69 | 20.4 | 115 | 21.1 | ||||||||||||||||||||||||||||
Brazil6 | 100.0 | 176 | 46.6 | 251 | 37.3 | 427 | 41.1 | ||||||||||||||||||||||||||||
Bosnia7 | 51.0 | 4 | 46.3 | 2 | 33.6 | 6 | 42.1 | ||||||||||||||||||||||||||||
| Ukraine | 70 | 35.3 | 444 | 34.3 | 514 | 34.4 | |||||||||||||||||||||||||||||
Ukraine Open Pit8 | 95.1 | 65 | 33.9 | 431 | 33.7 | 496 | 33.7 | ||||||||||||||||||||||||||||
Ukraine Underground9 | 95.1 | 5 | 54.6 | 13 | 54.6 | 18 | 54.6 | ||||||||||||||||||||||||||||
South Africa | 100.0 | — | — | — | — | — | — | ||||||||||||||||||||||||||||
Liberia10 | 85.0 | 39 | 46.8 | 660 | 42.7 | 699 | 42.9 | ||||||||||||||||||||||||||||
India11 | 60.0 | 6 | 62.5 | 78 | 62.2 | 84 | 57.5 | ||||||||||||||||||||||||||||
| Total Iron Ore | 2,222 | 32.4 | 1,715 | 39.6 | 3,937 | 35.4 | |||||||||||||||||||||||||||||
1.Unless stated otherwise, % Fe represents total Fe content for all sites except Peña Colorada where it represents magnetic Fe content only.
125
| Management report | ||
2.Mineral reserves for AMMC are estimated at a cut-off grade of 15% and a mass recovery of 33.0%, for a life of mine of 28 years.
3.Mineral reserves for Baffinland are estimated based on a long-term iron ore price of $102.8 per tonne for 62% Fe fines CFR North China, at a cut-off grade of 55% and a mass recovery of 100%, for a life of mine of 24 years.
4.Mineral reserves for Las Truchas are estimated at a cut-off grade of 10% Fe magnetic, and reserves for San José are reported at a cut-off grade of 25% Fe. The Fe recovery of Fe magnetic is 90% is considered in Las Truchas, and at San José Fe recovery considered is 75%. Life of mine of Las Truchas is 15 years and San José has a life of mine of 1 year.
5.Mineral reserves for Peña Colorada are estimated at the cut-off grade of 15% Fe magnetic. Fe recovery at the mineral reserve average head grade is 89.3% of Fe magnetic, for the life of mine of 16 years.
6.Mineral reserves for Serra Azul are estimated at 40% Fe cut-off grade and a mass recovery of 52.8% for friable material, and 29% Fe cut-off grade and a mass recovery varying from 33% to 45% for compact material, for a life of mine of 34 years. Mineral reserves for Andrade are reported at a cut-off grade of 20% Fe and 81.3% mass recovery at average, for a life of mine of 31 years.
7.Mineral reserve for ArcelorMittal Prijedor is estimated based on a price of $39.9 per tonne of product calculated based on assumptions of a non-marketable material supplied to its integrated steel plant, at 32% Fe cut-off grade and mass recovery of 75%, for the life of mine of 6 years.
8.Mineral reserve for Ukraine Open Pit is estimated at an average mass recovery of 65.3%. Cut-off grade applied at Novokryvorizke deposit is 12% Fe, and at Valyavkinske deposit 16% Fe. Life of mine considered for the two pits combined is 22 years.
9.Mineral reserve for Ukraine Underground mine is estimated based on a price of $39.3 per tonne of product calculated based on assumptions of a non-marketable material supplied to its integrated steel plant, at cut-off grade of 48% Fe and a mass recovery of 100%, for a life of mine of 22 years.
10.Mineral reserve for Liberia are estimated at a cut-off grade of 38% Fe for Mt. Tokadeh, and at a cut-off grade of 40% Fe for Mt. Gangra and Mt. Yuelliton, with a mass recovery of 49.7% for the oxide and transitional material, and at a 30% Fe cut-off grade and a mass recovery of 43.2% for all fresh material, for a life of mine of 30 years.
11.Mineral reserves for Thakurani and Ghoraburhani – Sagasahi are estimated using a long-term iron ore price of $42 per tonne based on IBM (Indian Bureau of Mines) three years average, Mineral reserves for Thakuranii are estimated at 55% Fe cut-off grade and a mass recovery of 98%, for the life of mine of 11 years. Mineral reserves for Ghoraburhani – Sagasahi are estimated at 55% Fe cut-off grade and a mass recovery of 88.49%, for the life of mine of 13 years.
12.As per S-K 1300, reported mineral reserves as of December 31, 2023 reflect ArcelorMittal's ownership interest at each individual business unit.
The following table summarizes ArcelorMittal’s mineral resources as of the end of the fiscal year ended December 31, 2023 in the aggregate, and by commodity and country and for each property containing 10% or more of ArcelorMittal’s combined measured and indicated mineral resources. Mineral resource quantities are rounded to million tonnes. The reported mineral resources reflect ArcelorMittal's ownership interest at each individual business unit and are reported, exclusive of
mineral reserves, on a wet basis. Mineral resource quantities are rounded to million tonnes. Iron ore mineral resources are estimated based on the same long-term price forecast used for reserves, adjusted based on the applicable revenue factor and adjusted upwards or downwards for mine specific factors and further adjusted for grade, logistics and other modifying factors.
| Iron Ore | % of Ownership Interest13 | Measured Mineral Resources | Indicated Mineral Resources | Measured & Indicated Mineral Resources | Inferred Mineral Resources | |||||||||||||||||||||||||||||||||||||||
| Millions of Tonnes | % Fe 1 | Millions of Tonnes | % Fe1 | Millions of Tonnes | % Fe1 | Millions of Tonnes | % Fe1 | |||||||||||||||||||||||||||||||||||||
| Canada | 1,524 | 28.2 | 1,569 | 29.1 | 3,093 | 28.7 | 1,617 | 29.7 | ||||||||||||||||||||||||||||||||||||
AMMC2 | 85.0 | 1,524 | 28.2 | 1,566 | 29.1 | 3,090 | 28.6 | 1,534 | 27.8 | |||||||||||||||||||||||||||||||||||
Baffinland3 | 25.2 | — | 62.0 | 3 | 63.0 | 3 | 62.9 | 83 | 64.3 | |||||||||||||||||||||||||||||||||||
| Mexico | 17 | 25.5 | 86 | 30.4 | 103 | 29.6 | 20 | 32.1 | ||||||||||||||||||||||||||||||||||||
Mexico (Excluding Peña Colorada)4 | 100 | — | — | 64 | 33.2 | 64 | 33.2 | 20 | 32.1 | |||||||||||||||||||||||||||||||||||
Peña Colorada - Mexico5 | 50.0 | 17 | 25.5 | 22 | 22.2 | 39 | 23.6 | — | 21.0 | |||||||||||||||||||||||||||||||||||
Brazil6 | 100 | 89 | 51.0 | 187 | 48.0 | 276 | 49.0 | 105 | 40.4 | |||||||||||||||||||||||||||||||||||
Bosnia7 | 51.0 | — | 29.7 | 3 | 28.5 | 3 | 28.6 | 2 | 32.4 | |||||||||||||||||||||||||||||||||||
| Ukraine | 80 | 33.4 | 405 | 34.5 | 485 | 34.3 | 42 | 52.9 | ||||||||||||||||||||||||||||||||||||
Ukraine Open Pit8 | 95.1 | 77 | 32.5 | 387 | 33.5 | 464 | 33.3 | 6 | 36.7 | |||||||||||||||||||||||||||||||||||
Ukraine Underground9 | 95.1 | 3 | 56.0 | 18 | 55.6 | 21 | 55.6 | 36 | 55.6 | |||||||||||||||||||||||||||||||||||
South Africa10 | 100 | — | — | 38 | 54.4 | 38 | 54.4 | 43 | 54.9 | |||||||||||||||||||||||||||||||||||
Liberia11 | 85.0 | — | — | 1,116 | 29.3 | 1,116 | 29.3 | 767 | 38.2 | |||||||||||||||||||||||||||||||||||
India12 | 60.0 | 1 | 50.3 | 57 | 59.8 | 58 | 59.0 | 56 | 61.3 | |||||||||||||||||||||||||||||||||||
| Total Iron Ore | 1,711 | 29.6 | 3,461 | 31.6 | 5,172 | 31.0 | 2,652 | 34.0 | ||||||||||||||||||||||||||||||||||||
1.Unless stated otherwise, % Fe represents total Fe content for all sites except Peña Colorada where it represents magnetic Fe content only.
2.Mineral resources for AMMC are estimated at a cut-off grade applied for all deposits is 15% Fe with a mass recovery of 32.5.%
3.Mineral resources for Baffinland are estimated at the cut-off grade of 55% and a mass recovery of 100%.
126
| Management report | ||
4.Mineral resources for Last Truchas are estimated at a cutoff grade of 10% Fe magnetic and Fe recovery of 90%, and mineral resources for San José are reported at a cutoff grade of 25% Fe and Fe recovery of 75%.
5.Mineral resources for Peña Colorada are estimated at the cut-off grade of 10% Fe magnetic. Fe recovery at the mineral resource average head grade is 90.7%.
6.Mineral resources for Serra Azul are estimated at 40% Fe cut-off grade and a mass recovery of 52.8% for friable material, and 29% Fe cut-off grade and a mass recovery varying from 33% to 45% for compact material. Mineral resources for Andrade are reported at a cutoff grade of 20% Fe and variable a mass recovery of 70.6% at average.
7.Mineral resources for ArcelorMittal Prijedor are estimated based on assumptions of a non-marketable material supplied to its integrated steel plant, at 30% Fe cut-off grade and mass recovery of 75%.
8.Mineral resources for Ukraine Open Pit are estimated at a cut-off grade applied at Novokryvorizke deposit is 12% Fe, and at Valyavkinske deposit 16% Fe, at an average mass recovery of 65.3%.
9.Mineral resources for Ukraine Underground mine are estimated based on assumptions of a non-marketable material supplied to its integrated steel plant, at a cut-off grade of 48% Fe and a mass recovery of 100%.
10.Mineral resources for Thabazimbi are estimated at a 40% Fe cut-off grade and metallurgical recovery of 60%.
11.Mineral resources for Liberia are estimated at a cut-off grade of 38% Fe for Mt. Tokadeh, and at a cut-off grade of 40% Fe for Mt. Gangra and Mt. Yuelliton, with a mass recovery of 49.7% for the oxide and transitional material, and at a 30% Fe cut-off grade and mass recovery of 43.2% for all fresh material.
12.Mineral resources for Thakurani are estimated at a 45% Fe cut-off grade and a mass recovery of 98%, and for Ghoraburhani – Sagasahi mine are estimated at a 45% Fe cut-off grade and a mass recovery of 85%.
13.As per S-K 1300, reported mineral resources as of December 31, 2023 reflect ArcelorMittal's ownership interest at each individual business unit.
Cautionary note concerning mineral reserve and mineral resource estimates: With regards to ArcelorMittal’s reported resources, investors are cautioned not to assume that any or all of ArcelorMittal’s mineral deposits that constitute either ‘measured mineral resources’, ‘indicated mineral resources’ or ‘inferred mineral resources’ (estimated in accordance with S-K 1300) will ever be converted into mineral reserves. There is a reasonable level of uncertainty as to the existence of ‘inferred mineral resources’ and their economic and legal feasibility, and it should not be assumed that any or all of an ‘inferred mineral resource’ will be upgraded to a higher category.
Internal Controls
ArcelorMittal mining and exploration properties employ robust quality control and quality assurance processes and procedures to ensure the validity and integrity of data utilized in the estimation of mineral resources and mineral reserves.
ArcelorMittal has developed an Orebody Knowledge and Management Framework, comprising a comprehensive set of internal guidelines and management standards that govern the resource and mining activities conducted at its properties. The framework and its associated documents describe the systems and processes to be developed and implemented at ArcelorMittal properties to effectively manage activities and data for the estimation and mining of its mineral resources and reserves. This framework and its associated documents are compiled and managed by a centralized corporate team of experienced and qualified technical experts and are reviewed and updated on a regular basis.
To increase rigor over internal controls and ensure integrity of its reported mineral resource and mineral reserve disclosures, in 2023, ArcelorMittal implemented K2fly’s Mineral Resource Governance and Model Manager platforms globally. This will enable enhanced control over the consolidation of the Company’s mineral resource and reserves disclosures. The K2fly solutions are deployed in a Dry Run in 2023 reporting,
following the platform configuration for the ArcelorMittal global mining portfolio.
Databases are compiled and managed by experienced personnel engaged directly by the operating entities and business units, following documented procedures. Sample data derived from activities such as, but not limited to, exploration drilling and field sampling, is subject to thorough sample security and integrity protocols, field and laboratory quality assurance and quality control processes, and data validation procedures.
Field quality control processes and procedures will vary based on the specific nature of the drilling or sampling program, but will nominally include the use of duplicate samples, blank control samples and certified reference materials. Samples processed and analyzed at internal and external laboratories are subject to additional laboratory quality control processes including, but not limited to, duplicate samples and certified reference materials. Data verification workflows are employed for each program to ensure the quality and integrity of all data incorporated into the databases.
Historical data is subject to rigorous verification processes prior to inclusion in resource estimation databases. These procedures can include, but are not limited to, external database validation by independent parties, internal database audits, and spatial and statistical analyses. Where historical data cannot be verified to the satisfaction of the relevant qualified person, it is excluded from the databases used in the estimation processes.
Where applicable, all mineral resource and mineral reserve estimates are reconciled against mine production data and operational results. Geological interpretations and estimation parameters are updated, and modifying factors, cost and price assumptions validated and adjusted.
There are inherent risks associated with all mineral resource and mineral reserve estimations see "Introduction—Risk Factors—Risks associated with ArcelorMittal's Mining Activities".
127
| Management report | ||
OPERATING AND FINANCIAL REVIEW
Key factors affecting results of operations
Overview
The steel industry, and the iron ore and coal mining industries, which provide its principal raw materials, have historically been highly cyclical. They are significantly affected by general economic conditions, consumption trends as well as by worldwide production capacity and fluctuations in international steel trade and tariffs. This is due to the cyclical nature of the automotive, construction, machinery and equipment and transportation industries that are the principal consumers of steel. In recent years, the COVID-19 pandemic caused a sudden and sharp decline in economic activity and steel consumption on a global scale during 2020 in the Company's core developed markets, followed in 2021 by a significant recovery in most industries, constrained to some extent by supply chain issues. In 2022, the global economy was adversely affected by supply chain issues, high inflation, consequential tightening of monetary policy and Russia’s invasion of Ukraine (itself aggravating inflationary pressures, particularly in the energy sector). All these shocks weighed on growth in ArcelorMittal’s core developed markets (EU, U.S.), with a negative impact on steel demand and pricing.
During the first half of 2023, resilient demand and less destocking in the Company's core markets led to both apparent demand and steel prices increasing from the low levels seen during the second half of 2022. However, the lagged impact of monetary tightening and declining real steel demand, weighed on prices in most markets from May until October 2023, negatively impacting ArcelorMittal’s profitability.
In the first half of 2021, steel demand rebounded from the sharp reductions seen in the first part of 2020 as developed economies reopened, but despite continued strong consumer demand for goods and robust order levels at manufacturers, output (especially automotive) was constrained by supply bottlenecks in the second half of 2021. The inability of steel end-users to raise output due to supply chain issues led to weaker than expected real steel demand in the Company’s core markets and to steel inventory increasing through the supply chain. This high level of inventory began to weigh on pricing during 2022, despite the temporary support from supply disruption due to the war in Ukraine. This was particularly true in the EU where the increase in energy costs, exacerbated by the fear of the need for gas rationing, negatively impacted real demand as the European economy slowed considerably in the second half of 2022. While the economy and underlying real demand were stronger in the U.S. during the first half of 2022, the Federal Reserve raised interest rates aggressively to slow growth and dampen heightened inflationary pressure. Although economic growth was stronger than expected during 2023
(supported by continued growth in consumer expenditure), the impact of tighter credit conditions and elevated interest rates negatively impacted output of interest rate sensitive sectors (e.g., machinery and residential construction). The European market heavily impacts the Company's prospects and while in Europe output held up better than expected over the winter months of 2022-2023 as the risk of energy rationing subsided, economic growth stagnated during the first half of 2023. However, sentiment weakened through the second half of the year after the European Central Bank increased policy rates to over 4%, to combat elevated inflation. This has negatively affected the manufacturing and construction sectors that drive steel demand, with new orders and backlogs weakening and real steel demand declining during the second half of 2023. However, automotive demand has held up better, as weakening underlying demand was offset by a rebound in supply following shortages through 2021 and 2022, leading to rising output during 2023. While steel demand in both the U.S. and Europe continues to be well below pre-pandemic levels, steel consumption is expected to be supported over the next few years by the American Jobs Plan (“AJP”) and the Inflation Reduction Act (“IRA”) in the U.S. and by the Next Generation EU (“NGEU”) stimuli plans in the EU.
Despite the Company’s sales and profitability being significantly affected in developing markets in 2020, demand in some markets, such as Brazil and Turkey, rebounded strongly during the first half of 2021, to well above pre-pandemic levels, before reverting back to trend during the second half of 2021. As a result of the above trend economic and steel demand growth in 2021, many economies suffered from high inflation, which began to impact consumer spending in 2022. In Brazil, interest rates were raised sharply throughout 2022 to a peak of 13.75%, to combat high inflation, and steel demand declined over 10% year-on-year in 2022 as real demand weakened and as steel users reduced excessive inventory levels. While many emerging markets are better placed to deal with crises than in the past, economic risks remained high in 2023 for many countries including sovereign debt sustainability in Brazil and external foreign currency debt risk in Turkey. This is especially true against a backdrop of tightening external financing conditions, concerns about global growth and weaker investor sentiment. In Brazil, the new 2024 fiscal framework is more relaxed with respect to public spending than the previous framework, adding to downside risks of a public debt crisis in the medium-term. However, while the Company expects the country to experience a technical recession in early 2024, due to the lagged impact of elevated interest rates, growth is expected to pick-up in late 2024, following the expected normalization of inflation and real wage growth through 2024. In Turkey, the lira has depreciated significantly against the U.S. dollar, causing inflationary pressure to re-accelerate during the second half of 2023 and forcing the
128
| Management report | ||
central bank to increase interest rates to over 40%, causing a downturn in the economy into 2024.
Historically, demand dynamics in China have also substantially affected the global steel business, mainly due to significant changes in net steel exports. Steel demand in China weakened sharply in 2021 after policy support had inflated demand in 2020, declining year-on-year in the second half of the 2021. While the combination of high vaccination and booster rates and lower severity of COVID-19 variants led to an ending of restrictions in most countries during 2022, China was a major exception. Lower vaccination rates, especially among the elderly, a less developed health service and strict adherence to a dynamic zero-COVID policy resulted in significant lockdowns in many cities, with Shanghai suffering a two-month citywide lockdown in April and May 2022. This not only impacted internal supply chains but also exacerbated the downturn in the real estate market, with housing sales and new housing starts both declining sharply. This sharp reduction in underlying real demand, coupled by a smaller reduction in steel production, led to a push for more exports before a weakening of global steel demand led to net Chinese steel exports falling back during the second half of 2022. An earlier-than-expected re-opening saw economic growth accelerate to 4.5% year-on-year in the first quarter of 2023, driven by transport, retail and hospitality industries. Steel demand was also supported by strong growth in infrastructure, due to the front-loading of special government bonds issued to local governments. However, the reopening rebound stalled during the second quarter of 2023 as private firms have little appetite for expansion, leaving investment spending increasingly dependent on the state and underscoring the need for further policy support. Housing sales, which temporarily rebounded after re-opening, resumed their decline through the remainder of 2023, due to low confidence on the part of households. Private firms are especially cautious of many real estate developers, who are highly leveraged and have concentrated on completing stalled projects, with new starts continuing to fall through 2023 and little likelihood of a recovery of developer new starts during 2024. The renewed weakness of Chinese steel demand, coupled with ample domestic supply has seen net Chinese finished flat steel exports increase from 3.4 million tonnes per month during 2022, to 3.8 million per month during January and February 2023 to 5.4 million tonnes during March to December 2023. Moreover, the Company continues to expect Chinese steel demand to decline in the medium-term, as infrastructure spending has been front-loaded and real estate demand is expected to weaken structurally due to lower levels of rural-urban migration. If the expected decline in demand does not coincide with renewed capacity closures, this could lead to further increases in steel exports from China and have a negative impact on global steel prices and spreads. See “Introduction—Risk Factors and Control—Risks related to the global economy and the mining
and steel industry—Excess capacity and oversupply in the steel industry and in the iron ore mining industry have in the past and may continue in the future to weigh on the profitability of steel producers, including ArcelorMittal".
Unlike many commodities, steel is not completely fungible due to wide differences in its shape, chemical composition, quality, specifications and application, all of which affect sales prices. Accordingly, there is still limited exchange trading and uniform pricing of steel, whereas there is increased trading of steel raw materials, particularly iron ore. Commodity spot prices can vary, which causes sales prices from exports to fluctuate as a function of the worldwide balance of supply and demand at the time sales are made.
ArcelorMittal’s sales are made based on shorter-term purchase orders as well as some longer-term contracts to certain industrial customers, particularly in the automotive industry. Steel price surcharges are often implemented on steel sold pursuant to long-term contracts to recover increases in input costs. However, longer term contracts with low steel prices will not reflect increases in spot steel prices that occur after contract negotiation. Spot market steel, iron ore and coal prices and short-term contracts are more driven by market conditions.
One of the principal factors affecting the Company’s operating profitability is the relationship between raw material prices and steel selling prices. Profitability depends in part on the extent to which steel selling prices exceed raw material prices, and specifically the extent to which changes in raw material prices are passed through to customers in steel selling prices. Complicating factors include the extent of the time lag between (a) the raw material price change and the steel selling price change and (b) the date of the raw material purchase and of the actual sale of the steel product in which the raw material was used (average cost basis). In recent periods, steel selling prices have not always been correlated with changes in raw material prices, although steel selling prices may also be impacted quickly due in part to the tendency of distributors to increase purchases of steel products early in a rising cycle of raw material prices and to hold back from purchasing as raw material prices decline. With respect to (b), as average cost basis is used to determine the cost of the raw materials incorporated, inventories must first be worked through before a decrease in raw material prices translates into decreased operating costs. In some of ArcelorMittal’s segments, in particular Europe and NAFTA, there are several months between raw material purchases and sales of steel products incorporating those materials. Although this lag has been reduced in recent years by changes to the timing of pricing adjustments in iron ore contracts, it cannot be eliminated and exposes these segments’ margins to changes in steel selling prices in the interim (known as a “price-cost squeeze”). This lag can result in inventory write-downs, as occurred in 2015, 2019
129
| Management report | ||
and the third quarter of 2022 due to sharp declines in steel prices. In addition, decreases in steel prices may outstrip decreases in raw material costs in absolute terms, as has occurred numerous times over the past few years, for example throughout 2019 as well as the fourth quarters of 2015, 2016 and 2018. In the fourth quarter of 2020 and through the first half of 2021, global steel prices surged toward historical highs in many markets, due in part to increased demand and a slower increase in supply, resulting in increased steel spreads and higher profitability. During the second half of 2021, despite strong underlying demand, a lack of inputs (e.g. semi-conductors) caused real steel demand to stagnate while steel supply continued to increase. This led steel prices to decline, faster than any decline in raw material costs leading to spread compression. During the first half of 2022, this was partially offset by an increase in the average price of annual automotive contracts and temporary steel price support due to disruption to supply from the war in Ukraine. Subsequently, steel spreads, especially in Europe, were compressed by elevated energy prices, particularly gas, and destocking at stockers and end-users through the second half of 2022, adversely impacting the Company's deliveries and profitability. Steel prices declined faster than raw material prices in both the third and fourth quarters of 2022, with significant compression of spreads. However, the fourth quarter of 2022 was the peak of the destocking cycle and inventory levels across ArcelorMittal’s main markets fell to low levels. As destocking began to end during the first quarter of 2023, apparent demand improved from the lows of the fourth quarter of 2022 and led to a recovery in steel prices and spreads. However, with economic growth weakening across the Company's core developed markets, due to the lagged impact of interest rate rises, elevated steel prices and spreads unwound during the second and third quarters of 2023, negatively impacting the results of the third and fourth quarters of 2023, due to the significant lag between transactions and deliveries, especially for flat products. However, prices and spreads in the Company's core markets bottomed out in early fourth quarter of 2023 and have since improved, especially in the United States.
The Company’s operating profitability has been particularly sensitive to fluctuations in raw material prices. Volatility on steel margins aside, the results of the Company’s Mining segment (which sells externally as well as internally) are directly impacted by iron ore prices. Robust recovery of steel demand and production following the initial shocks of the COVID-19 pandemic continued in the first quarter of 2021 with iron ore prices rising further to an average of $167/t. In the second quarter of 2021, the seaborne iron ore price jumped to over $200/t as rising steel production in China coincided with tight supply, significantly increasing the profitability of ArcelorMittal’s mining operations. Since mid-2021, iron ore prices have fallen back to an average of $111/t in the fourth quarter of 2021 as
Chinese crude steel production declined. Iron ore prices then rebounded during early 2022 on supply disruption, with prices rising to over $150/t in March/April before falling back to an average of $101/t in the second half of 2022 and a low of $81/t as Chinese production was cut in response to low domestic real demand and rising inventory levels. Although iron ore prices rebounded to $125/t average in the first quarter of 2023, they fell back during the second and third quarters to an average of $113/t. Iron ore prices have since rebounded to average $137/t in December 2023 supported by rising sentiment due to increased stimulus in China. However, the Company believes current prices are unsustainable over the medium term, if as expected, Chinese steel demand weakens, this would lead to further falls in iron ore prices and would negatively impact ArcelorMittal’s revenues and profitability. See “Introduction—Risk factors and control—Risks related to the global economy and the mining and steel industry—Prolonged low steel and (to a lesser extent) iron ore prices and/or low steel demand would have an adverse effect on ArcelorMittal’s results of operations.”
Economic environment
Following a strong rebound in economic activity in 2021 globally as most major economies removed COVID-19 pandemic restrictions, the global economy experienced persistent and broad-base inflationary pressures, particularly in developed economies, exacerbated by sharp spikes in energy prices caused by the Russian invasion of Ukraine. High inflation, and subsequent rapid and synchronized increases in interest rates, caused global GDP growth to slow to 3% in 2022 from 6% in 2021. In 2023, while energy prices declined and inflationary pressure started to dissipate, lagged impacts of high interest rates and tighter financial conditions in developed economies continued to constrain activity. By the end of 2023, interest rates in major economies, such as in the U.S. and EU, have risen to the highest levels since the Global Financial Crisis of 2008. Across much of the world ex-China, tighter financial conditions have also weighed on interest-sensitive expenditures, particularly in residential construction sector. However, total household consumption has held up better-than-expected, as spending has been supported by tight labor markets, with job growth remaining sufficiently strong to keep unemployment rates near historic lows in many countries. In several economies, most notably the U.S., household spending was also sustained by the continued low level of household saving rates, with excess savings from the 2019 of the pandemic being consumed over 2021 and 2022. While high interest rates negatively impacted ex-China, Chinese economic activity also slowed during the second half of 2023 as the reopening rebound waned, while weakness in real estate sector grew. As a result, global GDP growth slowed to 2.3% in 2023.
In the U.S., GDP growth slowed sharply in 2022 to 2% after a strong rebound with growth of 6% in 2021, post COVID-19. This
130
| Management report | ||
was due to the impact of high inflation, eroding real incomes and curtailing household consumption on business activities. In 2023, while headline inflation decreased to just over 3% by year-end (from a peak of 9.1% in June 2022), inflationary pressures remained, as core inflation (excluding volatile items such as food and energy) was still 4.0% by year-end (from a 6.6% peak in September 2022). This is due to continued price pressure in the service sector as consumption patterns rotated away from goods, with core services inflation of 5.5% overall in 2023 (from above 7% in first quarter of 2023) while core goods inflation fell to 0% (from a peak of more than 10% in early 2022). Persistent inflationary pressures led to continued tightening of monetary policy, with the Federal Reserve raising interest rates to peak levels in the 5.25% to 5.5% range, from 0 to 0.25% at the beginning of 2022. Housing investment declined further, in 2023, partly reflecting the further tightening in financial conditions due to the lagged impact of recent interest rate hikes. While labor markets remained tight during the first half of the 2023, with continued robust aggregate employment gains, this was less apparent in interest-rate sensitive sectors such as construction and manufacturing. However, despite the impact of high interest rates and persistent inflation, the economy was more resilient, mainly due to household spending, which was supported by a rundown of excess savings made during COVID-19. This offset the decline in real disposable income, resulting in GDP growth at approximately 2.4% in 2023.
After a strong rebound in 2021 post COVID-19, particularly in service sectors, European economic growth slowed significantly in late 2022 due to a sharp spike in energy prices, especially natural gas, following the Russian invasion of Ukraine. Indeed, GDP growth in EU27 countries (Europe excluding UK) slowed to 1.7% in the fourth quarter of 2022, after growing 6% year-on-year in 2021. In 2023, though energy costs remained higher than pre-invasion levels and continued to negatively impact energy-intensive industries (e.g. chemical sector), Europe avoided a more severe scenario of widespread curtailments across industry which had been feared in the event of a lack of available gas. This was due to reduced demand for gas, as consumption fell, due to mild weather conditions during the winter, coupled with significant substitution of gas by industrial companies. At the same time, continued inflows of liquified natural gas into Europe led to seasonally elevated levels of inventory post-winter, which drove down gas prices. As a result, Eurozone headline inflation moderated to 3% year-on-year by the end of 2023, from more than 10% at its peak in October 2022. However, core inflation was more persistent, only declining to 3.4% at year-end after peaking at 5.5% on an average in the first half of 2023. Labor markets remained tight, with the eurozone unemployment rate at a historic low of 6.4% in November 2023. As a result of persistent inflation and to reduce tightness in labor markets, the European Central Bank ("ECB") raised the main refinancing interest rate to 4% in
September 2023, from 2% at the beginning of the year. The negative impact of high interest rates, coupled with persistent inflation, caused activity to slow further during the second half of 2023, with GDP declining quarter-on-quarter in the third quarter of 2023 and estimated to have declined further in the fourth quarter of 2023, which means that the economy suffered a technical recession. Industrial sectors have been in recession for some time, with the Eurozone manufacturing Purchasing Managers' Index ("PMI") being below 50 since July 2022 and at 44.4 in December 2023, close to the lowest levels (ex-COVID-19 pandemic April to May 2020) since 2009. The services PMI also fell below 50 over the fourth quarter of 2023, pushing the economy into recession. Overall, EU27 GDP stagnated through 2023, with year-on-year growth averaging only 0.4%, with Germany being one of the worst performers, with GDP declining year-on-year in 2023 (-0.3%).
While the Chinese economy fared relatively well in both 2020 and 2021, activity deteriorated markedly in 2022 due to COVID-19 related restrictions, which weakened confidence and exacerbated the ongoing stress in the real estate sector, leading to lower consumption, production, and residential investment. In 2023, economic activity rebounded during the first half of the year, as the lifting of COVID-19 restrictions led to a strong recovery in the service sector, offsetting continued weakness in the real estate sector. In the second half of 2023, the growth momentum started to fade, as the post-restriction rebound started to wane, while weakness in the real estate sector persisted. Property developers faced severe funding constraints due to the downturn in the sector, with both sales and new starts declining to a low level and house prices continuing to decrease. Despite a government push to force property developers to complete presold homes, home buyer confidence remained low, deepening the downturn. By the end of 2023, sales and new starts were still significantly down year-on-year, compared to already depressed 2022 levels. Along with post-restriction rebound, another main offset also came from front-loading of infrastructure spending in early 2023 supported by special bonds backed by the central government, as local governments were financially strained by lower land sales. While property-support measures, such as the easing of home-buying restrictions and minimum down-payment requirements, gradually improved sales, new starts are only expected to rebound with a 6 to 9 month lag, meaning any material recovery in real estate will more likely be in 2025. Therefore, the central government, announced further continued support for infrastructure spending by issuing an additional 1 trillion RMB bonds in December 2023, which will support activity in 2024. In 2023, China's official GDP growth picked up slightly to an estimated 5.1% year-on-year, but mainly on a weak base of 2022 (+3% year-on-year), due to the negative impact of COVID-19 restrictions and city-wide lockdowns.
131
| Management report | ||
In Brazil, economic activity rebounded strongly in the first half of 2023, driven by an exceptional agricultural harvests and resilient household consumption. Despite inflation remaining at elevated levels, the declining inflation trend throughout the year allowed the central bank to ease monetary policy, reducing the policy rate from 13.75% in July to 12.25% by November 2023. Meanwhile, growth was also driven by expansionary fiscal policy by an increase in social transfers. However, lagged impact of high interest rates led to lower growth in the second half of 2023. GDP is estimated to have grown by 2.9% year-on-year. However, over the medium-term, downside risks remain elevated due to the risk of high public debt as the new 2024 fiscal framework is more relaxed with respect to public spending than the previous framework. While the current tax reform proposal to simplify the tax system has long-term potential to boost productivity and growth, the near-term benefit is unlikely. In Turkey, despite earthquake-induced effects, economic activity remained strong in the first half of 2023. High growth was driven by strong domestic demand supported by overly accommodative monetary and fiscal policy to support reconstruction effort. However, activity started to moderate during the second half of 2023, as inflation remained persistently high, rising above 60% by the end of 2023, driven by higher input costs, strong demand, and the depreciation of the lira, which lost almost one-third of its value since the beginning of the year. As a result, since June 2023, the central bank tightened its monetary policy to restore price stability. The policy interest rate has been lifted from 8.5% in June to 40% in November 2023 accompanied by strong signaling of further increases until inflation is under control. While GDP in 2023 increased by 4% year-on-year, growth is expected to slow down going forward.
Prior to Russia’s invasion of Ukraine and China’s zero-COVID lockdowns, global manufacturing output was recovering as supply constraints impacting 2021 output gradually eased. However, these shocks caused manufacturing output to fall in the second quarter of 2022, before recovering slightly in the third quarter of 2022 and then weakening toward the end of the year as economic growth in developed markets waned. Growth in global manufacturing output continued to weaken in 2023, to under 1.5% year-on-year from over 3% growth in 2022. In China, manufacturing output was more resilient, and increased by over 4% year-on-year. The resilience of Chinese manufacturing sectors was supported by improving, albeit from weak-levels, demand for Chinese goods from overseas, and domestically, due to policy support for various high-tech manufacturing sectors (e.g. electric vehicles). Outside China, manufacturing output decreased, mainly in developed markets where output declined by approximately 2% year-on-year in 2023, offsetting 1.7% growth in developing markets ex-China. The weakness in manufacturing in developed markets is primarily driven by lower consumer demand for goods, due to
the impact of high inflation and elevated interest rate levels. As demand in the U.S. was more resilient than in the EU, manufacturing output in the U.S. broadly stagnated (-0.5% year-on-year), while EU output declined more sharply (-2% year-on-year). In addition, while energy prices moderated, they still remained at a level above pre-Russian invasion and as a result, output in energy-intensive manufacturing sectors persisted at a weaker level than total manufacturing through 2023.
Global apparent steel consumption (“ASC”) increased by over 3% in 2021, as the global economy rebounded post-pandemic, before declining by over 2% year-on-year in 2022, as stringent lockdowns in China caused ASC to decline by approximately 3% year-on-year. ASC also declined in world ex-China by approximately 2% despite resilient real demand for steel, as the inventory cycle turned toward a sharp destock during the second half of 2022. In China, following an earlier-than-expected reopening in late 2022, coupled with the government’s front-loading of infrastructure spending, ASC grew strongly in early 2023, supported by stronger real demand. However, persistent weakness in the real estate sector saw real steel demand weaken through the year in China. As a result, ASC is estimated to have broadly stagnated in 2023. Meanwhile, despite slow recovery in real demand, a recovery in steel production due to the need to rebuild inventory supported growth in ex-China ASC, estimated to be approximately 2% year-on-year, with growth in developing ex-China offset by a further decline in demand from developed markets. Within developed markets, ASC in the U.S. continued to decline year-on-year by over 2%, primarily driven by long product demand as the construction sector was mostly impacted by higher interest rates, as well as pipe and tube demand, while flat steel product demand grew marginally year-on-year in 2023. Elsewhere in North America, demand fell in Canada while it rose strongly in Mexico. In the EU, real demand followed similar trends as in the US but was even weaker. Overall ASC in Europe is estimated to have declined by over 5% despite flat steel product demand being supported by less destocking, with long steel product demand being especially weak, falling over 10% year-on-year in 2023. Meanwhile, steel demand in developing markets was driven by robust growth in India, estimated at approximately 11%. ASC also increased in ASEAN (4% year-on-year) and CIS (3% year-on-year). ASC also increased strongly in Turkey by 18% year-on-year due to steel demand to rebuild infrastructure after the earthquake in early 2023. In Latin America, ASC broadly stagnated, as Brazilian demand grew around 1% offset by declining demand in Argentina, Colombia and Peru.
Source: GDP and industrial production data and estimates sourced from Oxford Economics January 24, 2024. ASC data for U.S. from American Iron and Steel Institute (AISI) to November 2023, estimates for December 2023. ASC data for Brazil from Brazilian Steel Institute to November 2023, estimates for December 2023. ASC data for EU27 from Eurofer to October 2023, estimates for November and December 2023. ASC data for India from JPC to December 2023. All estimates are internal ArcelorMittal estimates.
132
| Management report | ||
Steel production
After world steel production stagnated in 2020 at 1.86 billion tonnes as a result of demand disruptions caused by the global COVID-19 pandemic, production increased to 1.93 billion tonnes, as vaccination progress allowed economies to reopen and the global economy to recover. However, in 2022, world steel production declined by 5% in 2022, to 1.84 billion tonnes, driven by lower production in world ex-China, where production fell by approximately 8%, whereas production only declined by approximately 3% in China. The decline was mainly in developed markets, where the production fell in the second half of 2022 because of high energy costs, as well as in CIS region due to Russian invasion of Ukraine. As a result, ex-China steel inventory was low at the beginning of 2023, supporting production rebounding through the year, with average production at a level approximately 5% above the second half of 2022. Relative to production levels in 2022, ex-China steel production in 2023 was broadly stable, with production declining in developed markets offset by a slight increase in production in developing markets ex-China. In China, for 2022, steel demand was negatively impacted by lockdowns as the government pursued a “dynamic-zero” COVID-19 policy to curb infections, exacerbating the downturn in the real estate market, leading to steel production declining by 3% year-on-year. With an early reopening in December 2022, steel production in China continued to increase as demand recovered, rising by approximately 4% year-on-year in 2023. While steel demand from real estate sectors remained weak, this was offset by higher infrastructure supported by front-loaded special government bonds, leading to stable domestic demand. Therefore, rising steel production led to a surge in Chinese net steel exports. Overall, world steel production in 2023 increased marginally, up approximately 0.3% year-on-year. China’s share of global steel production was stable at 54.8% (2022: 54.7%), followed by India who saw their share of global output increasing to 7.8% (2022: 6.8%). Other regions mostly saw their share decline slightly, including East Asia (9.4% from 9.6% in 2022), EU27 and UK combined (6.8% from 7.4% in 2022), NAFTA (5.9% from 6% in 2022), while share of CIS increased slightly to 4.7%, it remained below their 5.5% share, prior to the Russian invasion of Ukraine.
Outside of China, steel production in world ex-China was stable, due to a significant decline in Europe being offset by growth in developing markets, most notably India, as well as the CIS region, where production partially recovered. In Europe, steel production in EU27 and the UK decreased again, by approximately. 7% year-on-year, after a 15% year-on-year decline in 2022. This was driven by capacity idling, as real steel demand weakened, due to lagged impacts of persistent inflation and higher interest rates while destocking continued, albeit at a slower pace than in 2022. By contrast, steel production in India continued to increase strongly, rising by approximately 12%
year-on-year in 2023, after 6% growth the year before. While production in CIS remained below pre-war levels, data from the World Steel Association indicated that Russia steel production had recovered significantly from the decline in 2022. Production in Ukraine, though weak, remained stable through 2023. In Turkey, despite strong domestic demand and resumption of steel mills after the earthquake in early 2023, production was down by approximately 4% year-on-year as a lot of exports from Asia Pacific flowed to Turkey. Elsewhere, production is either stable or only down marginally from 2022 levels. Indeed, in North America where production was marginally down by 1.4% year-on-year to 109 million tonnes (2022: 111 million tonnes), this was largely due to a 10% year-on-year decline in Mexico while both U.S. and Canadian production were stable (at approximately 81 and 12 million tonnes, respectively). In Developed Asia, production also declined slightly by 1.8% year-on-year to 173 million tonnes (2022: 176 million tonnes), with Japan down to 87 million tonnes (2022: 89 million tonnes) while South Korea output was stable at approximately 66 million tonnes. ASEAN (approximately -2% year-on-year) and Latin America (approximately -5% year-on-year) continued to see production decline, after both declined in 2022, though partially offset by a 5% year-on-year increase in production in the Middle East.
Source: Steel production data are compiled using World Steel data for 61 countries for which monthly data is available (which together account for 97% of World production). 61 Countries Include: Austria, Belgium, Finland, France, Germany, Greece, Italy, Luxembourg, Netherlands, Spain, Sweden, United Kingdom, Turkey, Norway, Canada, Mexico, United States, Argentina, Brazil, Chile, Colombia, Ecuador, Peru, Venezuela, Egypt, South Africa, Libya, Kazakhstan, Russia, Ukraine, Iran, Saudi Arabia, United Arab Emirates, Japan, South Korea, Taiwan, China, India, Pakistan, Thailand, Vietnam, Australia and New Zealand. Production data is available for till December 2023, with some World Steel estimates for missing data
Trade and import competition
Europe
There has been a trend of imports growing more strongly than domestic demand in the EU since 2012. ASC increased approximately 13% between 2012 and 2019, while finished steel imports increased by approximately 70%, taking market share from domestic producers. Over this period total finished imports have risen from almost 14 million tonnes in 2012 to over 23 million tonnes in 2019, causing import penetration to rise to 17% in 2019 from 11% in 2012.
After import penetration fell slightly to 16% in 2020 as the COVID-19 pandemic led to a sharp decline in imports, import penetration increased back to 19% in 2021 despite a strong rebound in ASC, as supply-side constraints led to elevated steel prices, which attracted a sharp increase in steel imports. In 2022, the Russian invasion of Ukraine in February triggered an energy crisis in Europe, causing both ASC and imports to decline sharply during the second half of 2022. As a result, import penetration only rose marginally to 20% in 2022.
133
| Management report | ||
During the first half of 2023, ASC declined by approximated 10% year-on-year, while imports fell even further declining by approximately 19% year-on-year (flat steel product -18%, long steel product -20%), pushing import penetration down to 18% during the first half of 2023. During the second half of 2023, however, on a year-on-year basis, both ASC and imports declined marginally and import penetration recovered to rate of the second half of 2022, approximately 19%. Overall, as imports declined more than ASC in 2023, import penetration for the whole year decreased to approximately 19%. However, during the second half of 2023, imports were much weaker in long steel products (-23% year-on-year), than in flat steel products, which rose an estimated 9% year-on-year, mainly due to weaker underlying demand, particularly in construction.
Traditionally, imports into EU27 have come from CIS, China, Turkey, Developed Asia and the UK, with these regions accounting for approximately 75% of imports between 2015 and 2020. While CIS had a large share of EU imports, accounting for approximately 25% of imports in 2020 and 2021, the war in Ukraine and EU’s subsequent sanctions against Russia have resulted in a sharp decline in imports from CIS fell sharply, particularly during the second half of 2022, and the share of imports from CIS decreased to 11% in 2022. In 2023, with finished steel imports from Russia banned, the share of imports from CIS fell further to approximately 6%. The share of imports share from Turkey also fell significantly in 2023 due to the impact of the earthquake leading to a disruption of domestic Turkish production in February 2023 and then an increase in domestic demand for rebuilding work. As a result, the share of imports from Turkey decreased to 11% in 2023, from 17% in 2022. Lower import share from CIS and Turkey were partially offset by higher import share from Asia Pacific, especially from Developed Asia, where import share increased from approximately 14% between 2017 and 2021 to 21% in 2022 and further to 27% in 2023. Import share from ASEAN and India also rose, to 12% (from 8% in 2022) and 11% (from 9% in 2022) respectively. Elsewhere, import shares remained broadly similar to 2022 levels (China: 10% share, Africa: 8% and UK: 7%). See “Business overview—Government regulations—Foreign trade” and “Introduction—Risk Factors and Control—Risks related to the global economy and the mining and steel industry—Unfair trade practices, import tariffs and/or barriers to free trade could negatively affect steel prices and ArcelorMittal’s results of operations in various markets.”
Source: Eurostat imports and Eurofer ASC data to October 2023, internal company estimates for November and December 2023. All historical data now refers to EU27 after UK left the European Union.
United States
Finished steel imports declined to approximately 18 million tonnes in 2019 (or an import penetration of 19%), after section 232 was implemented in 2018, adding a 25% tariff on most
imports outside USMCA (United States-Mexico-Canada Agreement). In 2020, the decline in real steel demand due to the COVID -19 pandemic pushed finished steels imports to fall by 23% year-on-year to approximately 14.1 million tonnes, with import penetration declining to 18%. In 2021, a combination of a strong post-pandemic steel demand recovery and elevated steel prices relative to global levels helped imports grow 41% year-on-year to 19.9 million tonnes, far stronger than ASC growth (21% year-on-year), leading to import penetration increasing to approximately 21% in 2021 from 18% in 2020. Steel imports continued to increase strongly during 2022, particularly during the first half of the year before moderating during the second half as demand weaken due to destocking. As a result, in 2022, the increase in imports (10% year-on-year) coupled with a decline in steel demand led to import penetration increasing to over 23%. The weakening trend in imports since late 2022 continued through 2023, with imports falling by approximately 14% year-on-year. Meanwhile, with the pace of destocking slowing, ASC only declined by approximately 2.5% year-on-year, the much sharper decline in imports pushed import penetration down to approximately 21%
Traditionally, only around one-third of U.S. finished steel imports come from within USMCA, but since 2019 imports from Canada and Mexico have increased their share to approximately 40%, mainly at the expense of Europe, whose import share fell. However, in 2022, after section 232 tariffs were removed, the EU import share returned to pre-2019 levels at approximately 14% in 2022, from 11% in 2021, while import share from Developed Asia remained approximately 20%. In 2023, the breakdown of imports into the U.S. was largely stable. Import share from USMCA remained stable at approximately 40%, while import shares from EU27 remained at approximately 14%. The main exception is from Developed Asia, whose import share decreased to approximately 18% from 20% in 2022.
Source: American Iron and Steel Association total/regional imports data and ASC data to November 2023, internal Company estimate for December 2023.
China
Chinese finished steel exports increased to 66.9 million tonnes in 2021, up 24% year-on-year from 53.7 million tonnes in 2020 due to strong demand post-pandemic in world ex-China. In 2022, finished steel exports rose by only 0.8% year-on-year to 67.4 million tonnes, with exports increasing from only 4.4 million tonnes per month in the first quarter to 6.8 million tonnes in the second quarter as major lockdowns in China (e.g. Shanghai in April/May) caused a weakening of domestic steel demand. Despite the early reopening in December 2022 and the front-loading of infrastructure spending, Chinese domestic steel demand remained subdued as the real estate sector declined further. With continued weak demand in China through 2023 and a large price gap to ex-China, Chinese steel producers were incentivized to maintain production and push exports to
134
| Management report | ||
overseas markets. As a result, Chinese finished steel exports increased strongly in 2023, to approximately 91 million tonnes, significantly higher than 67.4 million tonnes in 2022 and reaching the highest level since 2016 (109 million tonnes). Furthermore, with import share falling to 8 million tonnes in 2023 from 11 million in 2022, net exports increased even more sharply to 84 million tonnes from 57 million in 2022, an increase of 47%. However, most Chinese exports are delivered to regions which are not core to the Company’s business, due to the protection of trade measures. Indeed, exports to EU28 (Europe including UK) and North America declined marginally in 2023, with the share of Chinese exports to EU28 and North America falling from 10% in 2022 to 7% in 2023. In contrast, while exports to other regions increased strongly year-on-year, the relative export shares were relatively stable, with ASEAN the largest share of Chinese exports remaining at approximately 30%. Developed Asia’s share fell slightly to 14% (15% in 2022), as did Africa’s share to 11% (12% in 2022), while the share from India was stable at 6%. Elsewhere import shares increased marginally to Latin America at 11% (from 10%), to Turkey at 4% (3%) and CIS at 3% (2%) and others to 14% (from 12%). See “Business overview—Government regulations—Foreign trade” and “Introduction—Risk Factors and Control—Risks related to the global economy and the mining and steel industry—Unfair trade practices, import tariffs and/or barriers to free trade could negatively affect steel prices and ArcelorMittal’s results of operations in various markets.”
Source: General Administration of Customs of the People's Republic of China.
Steel prices
Flat products
Economic recovery on the European continent was robust following the peak of the second wave of COVID-19, at the end of 2020. Demand for steel rebounded more strongly than anticipated and at a more rapid pace than domestic steel supply. This resulted in extended lead times at mills, while lower deliveries to customers led to the depletion of end-users’ steel inventories to historically low levels. The domestic supply-demand tightness was further worsened by limited import offers into Europe, due to the EU safeguard measures. At the same time, global demand and pricing (excl. Europe) was also strong, creating similar pressure in most markets. Hence, import lead times and prices were not competitive enough to alleviate the domestic situation in Europe (worsened by increasing freight rates and strengthening raw material prices). This drove domestic HRC pricing to record high levels up to July 2021.
The price rally, which started in the second half of 2020, continued through the first half of 2021. In the first quarter of 2021, European HRC references stood at an average of €739/t in Northern Europe and €727/t in Southern Europe.
During the second quarter of 2021, prices averaged at €1060/t in Northern Europe and €1,046/t in Southern Europe. The first half of 2021 registered record high prices for both Northern and Southern European HRC references, respectively at €900/t and €887/t. Overall, European HRC prices doubled during the second half of 2021.
The strong upward price movement recorded over the prior 12 months (since mid-2020) started reversing in the second half of 2021. In July 2021, HRC reference in Northern Europe was at €1,173/t, its peak for the year, while the HRC reference in Southern Europe was at €1,091/t (having its peak at €1,135/t, in June 2021). Despite the start of a declining trend, the average for the third quarter of 2021 was still at a higher level versus the previous quarter; namely, HRC reference in Northern Europe averaged €1,141/t and in Southern Europe €1,051/t, being respectively €81/t and €5/t higher over the second quarter of 2021. In the fourth quarter of 2021, the HRC reference in Northern Europe and Southern Europe moved further down to €988/t and €897/t, respectively, confirming a quarter on quarter decline of over €150/t in each of the two regions.
This price retreat was determined, among others, by surging imports into the European Union. Particularly, the fourth quarter of 2021 started with the European HRC safeguard quota being exhausted immediately by one of its core importers – India. Further downward pressure on steel prices came from the automotive sector’s weakening demand, in light of the continued global shortage of microchips.
In the second half of 2021, HRC prices averaged €1,065/t in Northern Europe and €974/t in Southern Europe, respectively €571/t and €492/t higher than the second half of 2020.
After the continuous month on month price decline from late 2021, the downward spiral reached its bottom in January 2022 (at €927/t in Northern Europe and €837/t in Southern Europe), and then started to increase until the peak in April 2022 (at €1,346/t in Northern Europe and €1,279/t in Southern Europe). Overall, the first quarter of 2022 averaged €1,070/t for HRC price in Northern Europe (a €82/t increase quarter on quarter) and €1,005/t in Southern Europe (a €108/t increase quarter on quarter). The price increase in the first quarter of 2022 was driven by the effects of the war in Ukraine (started at the end of February 2022), which led to a temporary halt of material supplies from Russia and Ukraine, as well as an increase in energy costs given the risk of oil and gas supply reduction.
The beginning of the second quarter of 2022 continued with the high pricing environment, as the April reference price topped the March reference price. European HRC reached €1,346/t in Northern Europe and €1,279/t in Southern Europe during April. However, the trend from the first quarter of 2022 reversed in May and June and then continued to decline throughout the rest
135
| Management report | ||
of 2022. The second quarter of 2022 averaged €1,115/t in Northern Europe (up by €45/t quarter on quarter) and €1,050/t in Southern Europe (up by €45/t) above the first quarter pricing. Thus, average HRC prices for the first half of 2022 were at €1,093/t in Northern Europe and at €1,028/t in Southern Europe.
The soaring inflation rate in Europe, in particular driven by higher energy costs, recessionary concerns along with weakening demand and uncertainty caused by the Russia-Ukraine war, all contributed to falling steel prices throughout the second half of 2022. In the third quarter of 2022, North European HRC prices reached €789/t, which was a €326/t drop as compared to the second quarter of 2022; the South European HRC prices dropped to €757/t, a €293/t decrease quarter on quarter. The decline continued through the fourth quarter of 2022, when the price references settled at €653/t and €651/t, respectively, indicating further quarter-on-quarter decline by €136/t and €106/t, respectively. The average HRC prices for the second half of 2022 were at €721/t for Northern Europe and at €704/t for the Southern Europe.
Following the consistent month-on-month price decrease since late May 2022, the decline reached its minimum in November 2022 (at €628/t in Northern Europe and €619/t in Southern Europe). However, HRC prices started to turn around in early 2023. Overall, the average HRC prices for the first quarter of 2023 were at €786/t for Northern Europe (a €133/t increase quarter on quarter) and at €767/t in Southern Europe (a €116/t increase quarter on quarter).
The second quarter of 2023 followed a similar trend as in 2022. In the first half of 2023, HRC prices peaked in April 2023 (at €843/t in Northern Europe and €836/t in Southern Europe), and started declining afterwards. HRC prices in Northern Europe dropped in the second quarter of 2023 by €22/t quarter on quarter, reaching a low of €764/t, while HRC prices in Southern Europe dropped by €30/t, down to €737/t in the second quarter of 2023. The average HRC prices for the first half of 2023 were at €775/t for Northern Europe and at €752/t for Southern Europe.
During the third quarter of 2023, HRC prices in Europe continued to decline reaching their lowest price in September 2023 (at €638/t in Northern Europe and €623/t in Southern Europe). Overall, average HRC prices for the third quarter of 2023 were at €649/t for Northern Europe (a €115/t decrease quarter on quarter) and at €636/t in Southern Europe (a €101/t decrease quarter on quarter).
In the fourth quarter of 2023, HRC prices began to recover, reaching their highest price in December 2023 (at €687/t in Northern Europe and €682/t in Southern Europe); the average HRC prices for the fourth quarter of 2023 were at €650/t for Northern Europe and at €639/t in Southern Europe. The
average HRC prices for the second half of 2023 were at €649/t for Northern Europe and at €638/t for the Southern Europe.
In the United States, domestic HRC prices continued their upward trend from 2020. Overall, prices in the first quarter of 2021 averaged $1,317/t, while in the second quarter of 2021 prices increased by another $382/t to $1,699/t. Similar to Europe, steel demand rebounded faster than supply, resulting in domestic supply-demand pressures. Demand pressure led to record long lead times at mills, with supply still being limited (COVID-19 related restrictions, domestic capacity constraints, import limitations). Flow of steel imports into the U.S. continued to be heavily controlled in line with Section 232 (25% tariff on most imports), but also given the tightness in supply across all regions. Additionally, severe weather conditions in the United States resulted in various logistical constraints. All of these factors put together determined spiraling domestic HRC prices throughout the first half of 2021.
The spiraling effect continued through the third quarter of 2021, when the U.S. domestic Midwest HRC price reported its peak for the year, in September, at $2,156/t, averaging the quarter at a record high of $2,086/t. The robust demand environment, coupled with a still limited supply, domestically and from imports (high lead-times), transportation congestions, skyrocketing shipping costs, all maintained the price reference at a high level.
The last quarter of 2021 brought the U.S. domestic Midwest HRC price to an average of $1,973/t, a drop of $113/t versus the previous quarter. The price inflection was reported in October 2021, at $2,121/t, declining by $35/t month on month. This was a reflection of the pressure coming from rising imports and increasing capacity utilization of domestic mills. Furthermore, the automotive industry (with its steel demand) continued to be subdued in light of the global microchip shortage. The second half of 2021 averaged $2,030/t.
The price decline, which started in October 2021, continued until February 2022, bottoming out at $1,214/t. The first quarter of 2022 averaged at $1,373/t, $600/t lower quarter on quarter. This downward pressure on prices was driven by customers’ decisions to sit on the sidelines, postponing purchases and depleting inventories, further deepening the price correction. Various industries (automotive, appliances) were facing constraints in parts’ supplies, as well as labor force shortages, generating weakening demand.
After the low of February, the second quarter of 2022 experienced an increase in U.S. domestic Midwest HRC price, peaking in April 2022 at $1,617/t. This price increase was a repercussion of the war in Ukraine, amid fears of disruptions in supply chains. The second quarter of 2022 averaged at $1,434/t, up by $61/t quarter on quarter, which brought the first half of 2022 at an average of $1,404/t.
136
| Management report | ||
After the April increase, the U.S. domestic Midwest HRC price declined throughout the rest of the year, bottoming in November 2022 at $715/t, while December 2022 closed the year at $749/t. The slight increase in U.S. domestic Midwest HRC price at the end of the year might have been influenced by expectations that China would relax its nationwide COVID-19 restrictions, which was expected to improve consumer demand. In the second half of 2022, the U.S. domestic Midwest HRC price averaged at $840/t, lower by $564/t than the first half of 2022.
U.S. domestic Midwest HRC price increased during the first quarter of 2023 averaging $1,021/t (a quarter-on-quarter increase of $254/t). In the second quarter of 2023, the U.S. Midwest domestic HRC price registered its peak across the first six months of the year, in April 2023 at $1,291/t. In May and June 2023, the price started to deteriorate. The average for the second quarter of 2023 was at $1,161/t which brought the first half of 2023 at an average of $1,091/t. The price evolution throughout the first half of 2023 was strongly influenced by the limited domestic supply, particularly given the lower import levels, which have driven lead times to be longer than typical, but also the occurrence of several domestic mill outages (planned for maintenance activity).
In the third quarter of 2023, U.S. Midwest HRC price averaged $867/t as prices continued to decline month-on-month, reaching its lowest level in September 2023 at $789/t. After experiencing low HRC prices in September 2023, the fourth quarter of 2023 experienced an increase in U.S. domestic Midwest HRC prices, ending the year with $1,200/t in December 2023, bringing the second half of 2023 at an average of $938/t, which was still lower than the first half of 2023 by $153/t.
In China, at the beginning of 2021, steel prices continued their upward trend which started in September 2020. In the first quarter of 2021, HRC prices averaged $650/t VAT excluded. The average of the first half of 2021 reached $711/t. Domestic prices continued an upward trend until May 2021, reaching the peak at $812 /t, VAT excluded. In June 2021, prices slightly weakened to $755/t, VAT excluded, a $57/t drop month on month. This change came as a result of the abolition of export rebates announced by the Chinese Government from May 2021 onwards, a measure that was intended to discourage steel exports, and accordingly keep steel prices under check.
The third quarter of 2021 continued at an elevated level of $789/t for the HRC in China, VAT excluded, with the peak of the year reached in October at $865/t. The increasing environmental regulations imposed in China, enforcing steel production cuts in such regions as Jiangsu and Tangshan, particularly in the second half of the year, along with tensions in the limited supply of raw materials have all pushed the Chinese domestic HRC price upwards. Additional pressure came with the introduction of
energy supply control measures in the middle of September 2021, in an attempt to curb the short supply.
In November 2021, there was however a sharp decline in the Chinese HRC price, VAT excluded, reported at $666/t (a $166/t drop month on month), which was a direct effect of the Chinese Government’s intervention in loosening the electricity supply and relaxing the control on coal prices. Downstream demand for steel products was reported sluggish by the end of the year, given the seasonality and the uncertain epidemic situation domestically.
In the fourth quarter of 2021, the Chinese domestic HRC, VAT excluded, ended at an average of $699/t, a $90/t decrease quarter on quarter, but still $136/t up from the last quarter of 2020. The Chinese price reference was reported for the second half of 2021 at $744/t, up $33/t compared to the first half of 2021.
After the November 2021 $666/t low, the Chinese HRC price, VAT excluded, started gradually to rehabilitate, reaching a level of $717/t, VAT excluded, in March 2022, the highest reported level for 2022. In the first quarter of 2022, the Chinese HRC price averaged $701/t, VAT excluded, $2/t higher quarter on quarter. From April onwards, the HRC price showed a month-on-month decline till November 2022 leading to the following quarterly averages: $650/t, VAT excluded, in the second quarter of 2022 ($50/t decrease quarter on quarter), $512/t, VAT excluded, in the third quarter of 2022 ($139/t decrease quarter on quarter) and $488/t, VAT excluded, in the fourth quarter of 2022 ($24/t decrease quarter on quarter).
The HRC price performance in China was deeply affected by the multiple COVID-19 pandemic outbreaks which paralyzed various parts of the country from March 2022 onwards. The Chinese economy has been crippled by disrupted manufacturing activity, by paralyzed distribution in the supply chains, and subsequent weakened demand, all following the lockdowns imposed since the end of the first quarter of 2022. However, by the end of 2022, given expectations that lockdown requirements were to be lifted following societal pressure, a slight increase in the Chinese HRC price was recorded in December 2022, up by $43/t month on month, to $514/t, VAT excluded. The half yearly averages reached $676/t in first half of 2022 and $500/t in the second half of 2022, VAT excluded.
The price increase reported in December 2022 continued throughout the first quarter of 2023, when the Chinese HRC price, VAT excluded, reached an average of $551/t (a $63/t increase quarter on quarter). The following quarter recorded a reversal of trend, Chinese HRC price, VAT excluded weakened to $499/t (a $52/t decrease quarter on quarter). In the early months of 2023, steel demand in China (particularly from real estate and infrastructure sectors) was still slow in building
137
| Management report | ||
momentum to support stronger price increases. At the same time, on the supply side, the recovery in domestic steel production was stronger than the recovery in demand, thus generating market imbalances. Price-wise, the first half of 2023 averaged at $525/t, VAT excluded, strengthening by $25/t as compared to the second half of 2022.
During the third quarter of 2023, prices in China experienced a continuous decline, with the Chinese HRC price, VAT excluded, averaging $482/t. Although the Chinese HRC price hit a low of $466/t, VAT excluded in October 2023, it began to rise and reached $503/t, VAT excluded, by December 2023. The average price for the second half of 2023 was $483/t, VAT excluded, reflecting a $42/t decrease compared to the first half of 2023.
| Flat products | ||||||||||||||
Source: S&P Global Commodity Insights (Platts) | Northern Europe | Southern Europe | United States | China | ||||||||||
| Spot HRC average price per tonne | Spot HRC average price per tonne | Spot HRC average price per tonne | Spot HRC average price per tonne, VAT excluded | |||||||||||
| Q1 2021 | €739 | €727 | $1,317 | $650 | ||||||||||
| Q2 2021 | €1,060 | €1,046 | $1,699 | $773 | ||||||||||
| Q3 2021 | €1,141 | €1,051 | $2,086 | $789 | ||||||||||
| Q4 2021 | €988 | €897 | $1,973 | $699 | ||||||||||
| Q1 2022 | €1,070 | €1,005 | $1,373 | $701 | ||||||||||
| Q2 2022 | €1,115 | €1,050 | $1,434 | $650 | ||||||||||
| Q3 2022 | €789 | €757 | $913 | $512 | ||||||||||
| Q4 2022 | €653 | €651 | $767 | $488 | ||||||||||
Q1 2023 | € 786 | € 767 | $1,021 | $551 | ||||||||||
Q2 2023 | € 764 | € 737 | $1,161 | $499 | ||||||||||
Q3 2023 | € 649 | € 636 | $867 | $482 | ||||||||||
Q4 2023 | € 650 | € 639 | $1,010 | $485 | ||||||||||
Long products
Steel prices for long products in Europe started in January 2021 at a level of €723/t for the medium sections and €625/t for rebar. By March 2021, prices strengthened by €5/t and €8/t, respectively, reaching €727/t for medium sections and €633/t for rebar. The average prices for the first quarter of 2021 were reported at €722/t for medium sections and at €629/t for rebar. In the second quarter of 2021, prices continued to strengthen, reaching an average of €860/t for the medium sections and €710/t for rebar, up by €138/t and €81/t accordingly versus the first quarter.
The continued upward price movement over the first half of 2021 was defined by the recovering domestic economies in
Europe with strengthening consumer demand, hand in hand with a limited supply of steel, domestically, and resulting long lead times. In this context, EU steel safeguard measures (in place on steel products since 2019) have only put additional strain on domestic markets and limited imports. In the first half of 2021, the price reference in Europe for medium sections stood at €785/t and for rebar at €670/t.
The favorable pricing environment continued through the third quarter of 2021, peaking in August at €1,050/t for medium sections and €845/t for rebar, which almost doubled over a year. The average price for the third quarter was reported at a record high level of €1,039/t for medium sections and €826/t for rebar. Strong demand, increasing freight costs and ports congestions all reinforced the elevated price levels in Europe up to that point in time.
However, from September 2021 onwards, domestic prices started changing direction. The fourth quarter of 2021 started with October at a level of €1,000/t for medium sections and €799/t for rebar (down by roughly €50/t each since the peak in August) and ended at a lower point, in December, at €991/t and €790/t, respectively. The quarterly average was reported for medium sections at €995/t and rebar at €795/t. This decline over the last four months of the year was determined by the rebalancing of the European demand-supply situation, with domestic mills reporting strong production figures throughout the year.
The average price references in the second half of 2021 were recorded at €1,017/t for medium sections and €811/t for rebar, almost double as compared to the second half of 2020.
In the first quarter of 2022 prices continued to increase in Europe, with medium sections averaging at €1,172/t and rebar at €928/t. This upward trend continued until April 2022, when each of the two price references hit the yearly peak at €1,500/t and €1,313/t, respectively. As in the case of European HRC price fluctuation, medium sections and rebar pricing in Europe was affected by the war in Ukraine, which altered and delayed the standard flow of semi-finished and finished steel products in Europe, pushing buyers to panic purchases in the early part of 2022.
From May onwards, throughout the rest of the year, medium sections and rebar prices in Europe started weakening, both references hitting the bottom in December 2022, at €985/t and €749/t, respectively. The global supply disruptions caused by the war, the looming fears of a recession in Europe driven in part by soaring energy costs, and weakening domestic demand, all pushed medium sections and rebar pricing on a downward spiral through most of 2022. The quarterly averages of the two price references were thus in a free-fall since the second quarter of 2022, when reported at €1,426/t for medium sections and
138
| Management report | ||
€1,220/t for rebar, ending in the fourth quarter of 2022 at €1,072/t (a €354/t decrease over the last three quarters) and at €814/t (a €406/t decrease over the last three quarters). Prices in the first half of 2022 were reported at €1,299/t for medium sections and at €1,074/t for rebar, and at €1,141/t for medium sections and €898/t for rebar in the second half of 2022.
In the first half of 2023, steel prices in Europe for medium sections and rebar continued their downward trend (started in the second quarter of 2022), weakening month by month, and reaching €820/t and €593/t, respectively, in June 2023. The medium sections price decreased over the first half of 2023 by €168/t, from the January 2023 level of €988/t; while the rebar price weakened by €158/t over the same period, being in January 2023 at €751/t.
Overall, the European rebar market was showed unstable signs throughout the first half of 2023, with an imbalance between demand and supply of steel. In spite of energy and shipping costs gradually coming down in Europe, lowering pressure on mills, consumption on the market remained at low levels, preventing sustained pricing. Prices in the first quarter of 2023 averaged €964/t for medium sections and €722/t for rebar, while in the second quarter of 2023, these averages dropped to €889/t for medium sections and €649/t for rebar, a decrease of €75/t and €73/t, respectively.
In the third quarter of 2023, prices for medium sections averaged €805/t and rebar €577/t, a quarterly €84/t and €72/t decrease, respectively. In the fourth quarter of 2023, medium sections prices continued to decline reaching the lowest level of €758/t in November 2023. Even though the prices improved in December 2023 averaging €765/t, the average prices for the fourth quarter of 2023 were still lower than in the third quarter of 2023. On the other hand, rebar prices recovered as they reached an average of €606/t in the fourth quarter of 2023, with the highest price in December 2023 at €620/t. Prices in the first half of 2023 averaged €927/t for medium sections and at €685/t for rebar as compared to average prices at €785/t for medium sections and €591/t for rebar in the second half of 2023.
In Turkey, rebar export prices started strongly at $630/t in January 2021, ending the first quarter of 2021 $2/t below at $628 /t. At the end of March 2021, the construction season was only starting and demand for steel was growing more strongly than anticipated, COVID-19 vaccination programs were progressing, and market sentiment was improving after the second wave of COVID-19 infections. Therefore, the second quarter of 2021 continued the upward trend, with April 2021 recording an export price of $639/t for Turkish rebar, and ending in June at $726/t, representing a $87/t price increase over three months.
The average for the second quarter of 2021 stood at $703/t, driving an average for the first half of 2021 at $662/t (a $190/t increase compared to the second half of 2020 and a $246/t increase compared to the first half of 2020).
After the peak in export price registered in May 2021 at $744/t for Turkish rebar FOB, it started to weaken in the following months, reaching the yearly low of $665/t in September 2021. Export prices have been decreasing on account of weakening long steel demand and dropping scrap costs. Furthermore, Turkey continued to be heavily hit by the domestic financial turmoil with high inflation/interest rates and destabilized domestic currency.
In the third and fourth quarter of 2021, Turkish rebar for export was priced at $691/t and $713/t FOB, respectively, ending the second half of the year at $702/t ($230/t higher year on year).
In the first half of 2022, Turkish rebar price for export gradually expanded to a high of $936/t FOB in April 2022, a level above all previously reported prices since 2008, and the peak in 2022. From May onwards, Turkish rebar reference prices started to decline, reaching a first “seasonal” low in August 2022, at $644/t FOB, and then one more low in November, at $637/t FOB. The slight increase in pricing during September and October was a direct result of increasing manufacturing costs, after the latest increase in power and gas prices domestically.
Overall, the evolution of the Turkish rebar price for export was driven up in the first half of the year, mainly by rising cost components, such as the imported scrap HMS 80/20 which peaked in March 2022 at $641/t, as well as soaring electricity costs. On its downward trend from May 2022, Turkish rebar for export was strongly impacted by the war in Ukraine, as well as a global softening demand. The Turkish market had to absorb increased volumes of Russian material, Turkey being among the few global markets that did not have sanctions against Russia.
After a strong second quarter of 2022, when the Turkish rebar for export was reported at $808/t FOB ($13/t increase quarter on quarter), the subsequent periods went into decline, with the third quarter of 2022 reported at $665/t FOB and the fourth quarter of 2022 $5/t below, at $660/t FOB. Thus, the first half of 2022 reached an average of $802/t FOB and the second half of 2022 at $663/t FOB.
After the lows of November 2022 (at $637/t FOB), the Turkish rebar price for export started to gradually strengthen in the first quarter of 2023, reaching a peak value in March 2023, at $727/t FOB. The first quarter of 2023 averaged $708/t FOB, up by $48/t FOB over the last quarter of 2022. From April onwards, Turkish rebar price for export reversed its upward trend, averaging $637/t FOB in the second quarter of 2023, a $71/t decrease quarter-over-quarter. The global demand recovery for steel
139
| Management report | ||
products did not see strong movement throughout the first half of 2023, given the extended looming fears of recessions in different parts of the world, as well as the inflationary struggles of economies. Similar to the first half of 2023, the third quarter and fourth quarter of 2023 experienced further declines in prices, at $569/t FOB and $574/t FOB, respectively. Thus, the first and second half of 2023 averaged $673/t FOB and $571/t FOB, respectively.
| Long products | |||||||||||
Source: S&P Global Commodity Insights (Platts) | Europe medium sections | Europe rebar | Turkish rebar | ||||||||
| Spot average price per tonne | Spot average price per tonne | Spot FOB average price per tonne | |||||||||
| Q1 2021 | €722 | €629 | $621 | ||||||||
| Q2 2021 | €860 | €710 | $703 | ||||||||
| Q3 2021 | €1,039 | €826 | $691 | ||||||||
| Q4 2021 | €995 | €795 | $713 | ||||||||
| Q1 2022 | €1,172 | €928 | $795 | ||||||||
| Q2 2022 | €1,426 | €1,220 | $808 | ||||||||
| Q3 2022 | €1,210 | €981 | $665 | ||||||||
| Q4 2022 | €1,072 | €814 | $660 | ||||||||
Q1 2023 | € 964 | € 722 | 708 | ||||||||
Q2 2023 | € 889 | € 649 | 637 | ||||||||
Q3 2023 | € 805 | € 577 | 569 | ||||||||
Q4 2023 | € 766 | € 606 | 574 | ||||||||
Raw materials
The primary raw material inputs for a steelmaker are iron ore, coking coal, solid fuels, metallics (e.g., scrap), alloys, electricity, natural gas and base metals. ArcelorMittal is exposed to price volatility in each of these raw materials with respect to its purchases in the spot market and under its long-term supply contracts. In the longer term, demand for raw materials is expected to continue to correlate closely with the steel market, with prices fluctuating according to supply and demand dynamics. Since most of the minerals used in the steelmaking process are finite resources, their prices may also rise in response to any perceived scarcity of remaining accessible supplies, combined with the evolution of the pipeline of new exploration projects to replace depleted resources.
As for pricing mechanisms, since 2012, quarterly and monthly pricing systems have been the main type of contract pricing mechanisms, but spot purchases also appear to have gained a greater share as steelmakers have developed strategies to benefit from increasing spot market liquidity and volatility. The trend for using shorter-term pricing cycles has continued since 2020. Pricing is generally linked to market price indexes and uses a variety of mechanisms, including current spot prices and
average prices over specified periods. Therefore, there may not be a direct correlation between market reference prices and actual selling prices in various regions at a given time.
Iron ore
In 2021, iron ore market reference prices averaged $159.89/t (up 46.6% as compared to 2020), driven by post-pandemic fiscal stimulus packages launched in main economies, which boosted global demand for steel and iron ore and by increased crude steel production in China in the first half of the year as steel mills were driven by high steel profits. At the same time, iron ore supply recovered rather slowly due to global epidemic bringing shortages in labor and ports congestion.
In 2022, iron ore market reference prices decreased to an average of $120.03/t, down by 24.9% compared to an average of $159.89/t in 2021, mainly due to collapsing market confidence as China implemented strict lockdowns across the country starting in mid-March, boycotts from homebuyers in China resulting from failures to meet construction schedules which weighed further on the crisis-stricken real estate sector, harsh weather conditions in the summer and the US Federal Reserve’s tightening of its monetary policy.
In 2023, iron ore market reference prices averaged $119.58/t, relatively stable compared to an average of $120.03/t in 2022. The first quarter of 2023 began with an increase in reference prices mainly driven by prevailing bolstered sentiment on scrap of COVID control in China, which was later counteracted by the disappointing actual economy recovery, largely dragged by its real estate woes and sliding exports. By the end of 2023, iron ore market reference prices increased to $141.92/t on December 27, a record high for the period dating back to June 9, 2022, driven by lower port inventory, stimulus anticipation and strong demand outlook for Chinese economy in the first quarter of 2024, following the deposits rate cut by Chinese commercial banks on December 22, 2023.
In the first quarter of 2021, the seaborne iron ore price averaged $167.40/t, up 25.5% compared to the previous quarter. Post-pandemic fiscal stimulus packages launched in main economies as well as easing monetary policies significantly boosted global demand for steel and indirectly for iron ore. Meanwhile, iron ore supply recovered rather slowly due to the global pandemic causing shortages in labor and port congestion as well as due to weather disruption in major iron ore producing countries and mine safety and environmental inspection in China.
In the second quarter of 2021, the seaborne iron ore price skyrocketed to $219.26/t on June 7, 2021 and stayed high until the end of the quarter, averaging the record $200.47/t. The price increase was fueled by high demand from China as its steel mills increased crude steel production, motivated by high steel profits. Concerns on tight supply were further increased on
140
| Management report | ||
account of a flood accident at Dahongcai mine on June 10, 2021 in the Shanxi province.
In the third quarter of 2021, the seaborne iron ore price started to decline and averaged $163.39/t, having lost $37/t compared to the previous quarter. Seaborne supply remained stable, while the demand dropped significantly in China mainly due to heightened efforts by the government to cut 2021 crude steel production below 2020 levels and stringent carbon emission controls. Meanwhile, the real estate sector, which is the largest steel consuming sector, showed weakening due to China’s property deleveraging campaign starting in the beginning of 2021.
In the fourth quarter of 2021, the seaborne iron ore price averaged $110.59/t reaching the lowest point of $87.27 of the year on November 18. China steel production further reduced due to a national wide power shortage, inspection on crude steel cut and air quality control during heating season. Weakening of the Chinese economy due to shrinking consumption, supply shock, weakening exports and uncertainties on Covid-19 lead to bearish market sentiment. In addition, the Evergrande crisis together with crises at other property developers, such as the Fantasia Group, weighed further on an already debt-laden real estate sector.
In the first quarter of 2022, after an initial increase in seaborne iron ore prices to $161.65/t in early March mainly driven by bullish sentiment that Chinese steel production would ramp-up after the government announced a 5.5% GDP growth target for 2022 and a stimulus packages targeted at the construction and infrastructure sectors, iron ore prices dropped to $136.19/t in mid-March following a sudden COVID -19 outbreak in China and the implementation of strict lockdowns.
In the second quarter of 2022, seaborne iron ore prices in China again rebounded to $160.69/t in early April driven by supply concerns due to low shipments and intensifying war between Russia and Ukraine. However, iron ore prices dropped to $108.98/t in June with collapsing market confidence due to a severely hampered Chinese economy with repeated lockdowns across the country. Steel demand deteriorated as a result of lukewarm downstream activities, historic high steel inventory levels both in mills and traders’ warehouses, and inclement weather conditions. Ex-China demand also weakened with rising inflation and the US Federal Reserve’s tightening monetary policy.
In the third quarter of 2022, growing global recession fears coupled with a new COVID-19 pandemic outbreak and continued weakness in China’s property sector dampened world steel and iron ore demand. Seaborne iron ore prices dropped to $96.04/t on July 15, 2022 due to a cross-country homebuyers mortgage boycott to protest developers’ failure to meet
construction schedules and disappointing GDP growth in the second quarter (0.4%). Though prices recovered to $119.74/t on July 28 based in part on the Chinese government's announcement that China would launch a real estate relief fund of up to CNY300 billion ($44 billion) to help property developers resolve a crippling debt crisis, as well as expectation of mills’ production ramp-up with improving margins, seaborne iron ore prices were again on a downward trend from August 2022 due to COVID-19 related lockdowns and harsh weather conditions.
In the fourth quarter of 2022, seaborne iron ore prices decreased to the lowest level of $79.06/t in late October as the market anticipated President Xi's succession would return China to its Maoist ideology-policies and stick to its strict zero-COVID control. However, easing of measures of COVID control announced on November 10, and December 7 and the complete withdrawal of COVID controls announced on December 27, 2022, effective January 8, 2023, signaling a market reopening and boosting sentiment, pushed iron ore prices to $117.82/t at the end of December 2022. Meanwhile, Brazil received early-than-expected rainfall in December, which reduced the supply to seaborne market, adding on Vale's already stagnating shipment performance ultimately below its initial yearly guidance.
In the first quarter of 2023, seaborne iron ore prices soared to an average of $125.28/t, an increase of $26.63/t as compared to the fourth quarter of 2022, primarily driven by boosted market sentiment after China announced lifting of COVID controls on December 27, 2022. The market sentiment remained firm in China throughout the first quarter of 2023 due to strong demand recovery expectations in the second quarter of 2023 amid a slew of relaxing policies announced in the real estate sector and easing monetary policies. Meanwhile, the U.S. Central Bank also slowed its rate hike pace. Crude steel output during the first quarter of 2023 in China reached 264 million tonnes, an increase of 18 million tonnes, or 7%, as compared to the first quarter of 2022, a new record despite weak fundamentals in the steel industry with low downstream demand, high steel inventory and poor steel mills’ margins. On the other hand, iron ore seaborne supply for the first quarter of 2023 was sufficient, mainly due to benign weather conditions in Australia. During the first quarter of 2023, seaborne iron ore imports in China surged to 294 million tonnes, a 26 million tonnes or 10% increase of as compared to the first quarter of 2022, a new record for this period.
In the second quarter of 2023, seaborne iron ore prices dropped to an average of $110.57/t, a $14.71/t decrease as compared to the first quarter of 2023 while China's stronger than expected recovery in GDP growth during the first quarter of 2023 was unsustainable and market participants turned to bearish mood. However, the China hot metal output level remained elevated during the same period. During the second quarter of 2023, China's average daily hot metal output was 2.43 million tonnes,
141
| Management report | ||
a 2.3% increase year-on-year. Meanwhile, Chinese steel exports soared to 43.9 million tonnes during the first six months of 2023, a 10.4 million tonne or 31% increase as compared to the first half of 2022, which largely absorbed the steel supply surplus. On the other hand, during the second quarter of 2023, average seaborne supply from Australia and Brazil increased by 1% as compared to the second quarter of 2022, adding pressure on iron ore prices.
In the third quarter of 2023, seaborne iron ore prices increased to an average of $114.00/t, a gain of $3.57 as compared to the second quarter of 2023, primarily supported by boosted sentiment following a slew of supportive policies from monetary, real estate and fiscal fronts in China. China has gradually scrapped home purchase limits across the country since the end of August 2023. Furthermore, seaborne iron ore prices dropped to $102.97/t on August 3 due to concerns around potential cuts on steel production in China and lack of strong stimulus policies to boost economy. Seaborne iron ore prices then soared to $126.20/t on September 15 driven by pre-China National Holiday stock replenishment and PBoC’s reserve requirement ratio (RRR) cut. Seaborne iron ore imports in China surged to 301 million tonnes, an increase of 19 million tonnes as compared to the second quarter of 2023, a new record for the past three years.
In the fourth quarter of 2023, seaborne iron ore prices increased to an average of $128.27/t, an increase of $14.27/t compared to the third quarter of 2023. Prices strengthened primarily due to low Chinese port inventory, year-end mills' stock replenishment, relatively elevated hot metal output, stronger-than-expected performance from sectors of auto, shipping, and renewable energy, coupled with bolstered sentiment stemmed from a slew of economy-favorable policies. Iron ore seaborne prices reached $141.92/t on December 27 ahead of 2024 due to low port inventory, stimulus anticipation and strong demand outlook for the Chinese economy in the first quarter of 2024, following Chinese commercial banks’ deposits rate cut on December 22.
Coking coal
Coking coal prices in 2021 averaged $227.29/t as compared to $123.46/t in 2020. Metallurgical coal prices were at historic highs for several months, as supply shortages met strong Chinese demand and rebounding global industrial production. China’s informal import restrictions on Australian exports obliged the country’s steel mills to draw in supply from non-Australian sources. On balance, Chinese metallurgical coal imports dropped significantly in 2021. India, Japan, South Korea and the EU have all switched to Australian-sourced imports in response.
Coking coal prices in 2022 averaged $364.22/t as compared to $227.29/t in 2021, driven by a faster than expected demand recovery, tight global supply situation and geopolitical tensions. Australia was confronted with both heavy rainfall, which affected
production and logistics in Queensland, and a severe rise in COVID-19 pandemic cases. Russia’s invasion of Ukraine sent prices to new records in March 2022. Prices increased in December 2022 as China neared lifting its ban on Australian coal imports.
Coking coal prices in 2023 averaged $295.97/t as compared to $364.22/t in 2022. Although, the metallurgical coal prices for 2023 decreased slightly, they still remained at a historic high at year end. The supply disruption in Australia, caused by the wet season, port maintenance, higher vessel queues, and lower production from BHP, South 32, and Anglo due to longwall issues, coupled with the strong demand from India and China, kept the prices at an elevated level. In the Chinese market, continuous mine accidents and safety checks resulted in increased domestic coking coal prices.
In the first quarter of 2021, the average coking coal price rose to $128.22/t (Metal Bulletin Premium HCC FOB Australia index), a 17% increase as compared to the previous quarter, effectively reversing the fall which followed China’s informal restrictions on Australian metallurgical coal imports in October 2020. Suppliers locked into new demand sources and buyers and sellers reorganized supply chains. Prices were also boosted by fears over weather disruptions at Queensland ports, with cyclone season often peaking in the late summer.
In the second quarter of 2021, the average price rose by an additional 8% to $138.78/t, supported by improving global industrial production and economic activity.
Metallurgical coal prices surged in September 2021 and the average price for the third quarter of 2021 increased to $264.25/t, driven by tight spot supply from major producers in Queensland, Australia and rising demand from ex-China regions. The diversion of Australian coal from China to other markets was effectively complete, with the previous surplus of Australian supply largely redirected.
In October and November, metallurgical coal prices levelled out and the average price for the fourth quarter of 2021 was settled at 369.81$/t. Cuts in crude steel production in China did not lead to any easing in prices but may have curbed further upward momentum.
In the first quarter of 2022, metallurgical coal prices reached historic highs and averaged $487.09/t amid a faster than expected demand recovery, a tight global supply situation and geopolitical tensions. Australia was confronted with both heavy rainfall (which affected production and logistics in Queensland), and a severe rise in COVID-19 cases, which disrupted workforces at mining operations. In addition, the Russian invasion of Ukraine pushed prices to new records in March 2022 as uncertainty over coal shipping prevailed in the market.
142
| Management report | ||
In the second quarter of 2022, metallurgical coal prices decreased to an average of $445.95/t with markets evaluating the uncertainty of the war in Ukraine. In Australia, lower rainfall during June 2022 supported exports and put downward pressure on prices.
Coking coal prices were down in the third quarter of 2022 at $250.96/t. The decrease initially appeared to be a correction following the increase in prices in response to the war in Ukraine and was then sustained by weaker demand from steel producers. As announced in April 2022, on August 10, 2022, the EU enforced its ban on coal imports from Russia.
In the fourth quarter of 2022, unfavorable weather conditions hindered the expansion of coal-mine output in Australia and the metallurgical coal prices averaged at $279.23/t compared to $369.81/t in the fourth quarter of 2021. The anticipated end of China's ban on Australian coal imports increased the price to $315.05/t at the end of the year. Despite a bearish global economic outlook, the coking coal spot market remained tight, aggravated by the inversion of the met-thermal pricing relation.
In the first quarter of 2023, metallurgical coal prices averaged at $342.52/t as compared to $279.23/t in the fourth quarter of 2022. The prices increased due to a mixture of supply disruptions and strong coking coal demand. In Australia, severe rainfall during the rainy season, with the La Nina pattern persisting, impacted the major mining region in Queensland. In January 2023, cyclone Ellie disrupted portside operations at Abbot Point, Hay Point and DBCT and negatively affected production at coal mines due to floods. Additionally, a train derailment occurred in January 2023 on a major rail line in Queensland resulted in a number of rail service cancellations and consequent delayed shipments. Coking coal prices remained at elevated levels during the first quarter of 2023, fueled by coal trade resumption between Australia and China and by strong demand from other major Asian economies for Australian coals.
In the second quarter of 2023, metallurgical coal prices came down to an average of $240.93/t, driven by an improvement on the supply side and a lackluster demand side. Production at major Australian mines was stable with no major accident or weather related event reported. On the demand side, the major steel producing economies remained muted with India being the exception. Tepid Ex-China demand led to a closer correlation between China domestic pricing and Australian price index, based on fundamentals. Hence, 10 rounds of price cuts in China, due to weak domestic steel demand and poor steel profitability, also contributed to a decline of the Australian price index.
In the third quarter of 2023, metallurgical coal prices increased to an average of $264.37/t, $23.44/t higher than the second
quarter of 2023. The price increase was mainly due to the supply disruptions caused by low quarterly production by majors producers, e.g., BHP, South 32 etc., and port maintenance at Hay Point, DBCT, and Abbot. The price hike was also driven by the strong post-monsoon demand in India. China’s domestic coking coal prices increased due to continuous mine accidents, resulting in a closer price correlation between China’s domestic pricing and the Australian price index.
In the fourth quarter of 2023, metallurgical coal prices increased to an average of $335.07/t, a further increase of $70.7/t as compared to the third quarter of 2023. Price increase is mainly driven by an uptick demand from India and China. Furthermore, China was facing temporary mine closures due to accidents mainly in Shanxi, which lead to enhanced safety inspections from government authorities. Meanwhile Australian supply was tight due to BHP’s port maintenance at the end of November and fear of potential strikes at its coal mines in Queensland in December. The shipment delays in Australia during the wet season were lower due to the El Nino pattern this year. As a result, spot liquidity was tight, which helped in driving up the coking coal prices.
ArcelorMittal has continued to leverage its iron ore and coking coal supply chain and diversified supply portfolio as well as the flexibility provided by contractual terms to mitigate regional supply disruptions and also mitigate part of the market price volatility.
| Iron ore | Coking coal | |||||||
| Source: Metal Bulletin | average price per tonne (Delivered to China, Metal Bulletin index, 62% Fe) | average price per tonne (premium hard coking coal FOB Australia index) | ||||||
| Q1 2021 | 167.40 | 128.22 | ||||||
| Q2 2021 | 200.47 | 138.78 | ||||||
| Q3 2021 | 163.39 | 264.25 | ||||||
| Q4 2021 | 110.59 | 369.81 | ||||||
| Q1 2022 | 141.61 | 487.09 | ||||||
| Q2 2022 | 137.57 | 445.95 | ||||||
| Q3 2022 | 103.47 | 250.96 | ||||||
| Q4 2022 | 98.65 | 279.23 | ||||||
Q1 2023 | 125.28 | 342.52 | ||||||
Q2 2023 | 110.43 | 240.93 | ||||||
Q3 2023 | 114.00 | 264.37 | ||||||
Q4 2023 | 128.27 | 335.07 | ||||||
Scrap
The Company considers the German suppliers’ index (“BDSV”) Delivered at Place (“DAP”) as market reference.
143
| Management report | ||
During 2023, the BDSV for reference grade E3 started in January and February at €377/t and €381/t, respectively. Until April, prices continued to increase reaching €413/t. Thereafter, prices started to decline from May 2023 and reached at €325/t in August 2023, the lowest in 2023. However, prices reached €365/t in December 2023, the highest level in the second half of 2023.
The average index price for 2023 was €365/t as compared to €409/t in 2022, a €44/t or 11% decrease compared to 2022. The average index price in 2021 was €395/t.
Turkey’s scrap imports decreased by 14% to 15.5 million tonnes in the first ten months of 2023 compared to the same period of 2022. Turkey remains the main scrap buying country in the international market. Turkey’s total crude steel output reached 30.5 million tonnes for the first eleven months of 2023, down by 6.15% as compared to 32.5 million tonnes produced in the same period of 2022.
Scrap Index HMS 1&2 CFR Turkey, North Europe origin, started January 2023 at $407/t and then continuously increased until reaching $451/t in March 2023. From April 2023 onwards, the index declined reaching the lowest level of 2023 at $357/t in October 2023. Thereafter, the index started to increase again reaching $415/t in December 2023.
In 2023, the average prices for European domestic scrap price of grade 3 was at $395/t, a $3/t higher than the export price of HMS 1&2 CFR Turkey, North Europe origin. In 2022, average European domestic scrap prices of grade 3 were at 434$/t, 3$/t lower as compared to export prices of HMS 1&2 CFR Turkey, North Europe origin.
In the domestic U.S. market, HMS 1 delivered Midwest index in 2023 was $38/t lower than the 2022. The Midwest Index decreased from an average of $387/t in 2022 to $349/t in 2023.
On the export market, HMS export FOB New York average prices for 2023 were at $364/t, a decrease of $34/t compared to 2022.
Ferro alloys and base metals
Ferro alloys
The underlying price driver for manganese alloys is ordinarily the price of manganese ore, which was at the level of $5.22 per dry metric tonne unit (“dmt”) (for 44% lump ore) on Cost, Insurance and Freight (“CIF”) China for 2023, representing a 12.6% decrease from $5.97/dmt in 2022 ($5.27/dmt in 2021). Decrease in steel production activity entailed lesser demand for manganese and higher manganese ore stocks in China toward the end of 2023. Manganese ore prices followed the downward trend throughout the 2023 responding to the surplus in the market.
High carbon ferro manganese prices decreased by 39% from $2,042/t in 2022 to $1,244/t in 2023 ($1,803/t in 2021), silicon manganese decreased by 40% from $2,123/t in 2022 to $1266/t in 2023 ($1,819/t in 2021) and medium carbon ferro manganese prices decreased by 45% from $3,332/t in 2022 to $1,832/t in 2023 ($2,861/t in 2021). Demand for manganese alloys was low and is expected to continue declining, particularly in Europe, with inventories still high for most products including the standard alloys.
Base metals
Base metals used by ArcelorMittal are zinc, tin and aluminum for coating, aluminum for deoxidization of liquid steel and nickel for producing stainless or special steels. ArcelorMittal partially hedges its exposure to its base metal inputs in accordance with its risk management policies.
The average price of zinc for 2023 was $2,649/t, representing a 24.0% decrease as compared to the 2022 average price of $3,485/t (the 2021 average was $3,005/t). Stocks registered at the London Metal Exchange (“LME”) warehouses stood at 224,825 tonnes as of December 31, 2023, representing around 602% increase compared to December 31, 2022 when registered stocks stood at 32,025 tonnes (199,575 tonnes on December 31, 2021).
The average price of tin for 2023 was $25,895/t, 16.7% lower than the 2022 average of $31,102/t (2021 average was $32,678/t).
The average price of aluminum for 2023 was $2,252/t, representing a 16.8% decrease compared to the 2022 average of $2,707/t (the 2021 average was $2,475/t).
The average price of nickel for 2023 was $21,474/t, representing a 16.1% decrease compared to the 2022 average of $25,604/t (the 2021 average was $18,487/t).
Energy market
Solid fuels, electricity and natural gas are some of the primary energy inputs for a steelmaker. ArcelorMittal is exposed to price volatility in each of these energy types with respect to its purchases in the spot market and under its long-term supply contracts.
Oil
In 2021, oil prices recovered strongly. In early January, Brent crude oil traded slightly below $55 per barrel ("bbl") and rose to over $86/bbl at its highest by the end of November. In 2021, Brent crude oil averaged $70.95/bbl as compared to $43.20/bbl in 2020. The strong price increase was fueled by optimism around the mass vaccine roll out and a strong economic recovery.
144
| Management report | ||
In 2022, oil prices were exacerbated by the war in Ukraine. Brent crude oil peaked at almost $140/bbl early March and traded range-bound between $100-$125/bbl until end of July, and only periodically breaking the $100/bbl mark. Fundamentally, the market was torn between the Organization of Petroleum Exporting Countries ("OPEC") and its allies struggling to meet their rising output quotas, embargoes on Russian oil and concerns over an overall negative economic outlook. Brent crude oil averaged $99/bbl in 2022, an increase of $28/bbl compared to the previous year.
The prospect of stronger demand from China supported prices during this first quarter of 2023 leading to an average of $82/bbl, strengthened by easing of stringent COVID-19 measures and by the Chinese National People’s Congress declaring a target of 5% GDP growth for 2023. Furthermore, the year started with a Russian crude oil partial embargo from the West and a cap price on Russian crude oil of $60/bbl. Oil prices increased further after EU and G7 countries agreed on a deal to cap Russian oil products at $100/bbl. In response, Russia announced that it would reduce the oil production.
Towards the end of the first quarter of 2023, Brent crude oil prices plummeted down to $73/bbl due to economic turmoil as a result of banking failures at Silicon Valley Bank and Signature Bank in the U.S., and consequent fallout of Europe-based Credit Suisse Group ending the first quarter of 2023 at an average of $82.10/bbl. During the second quarter of 2023, OPEC announced production cuts which supported markets and prices reached above $80/bbl which were then quickly offset by several interest rate hikes by the U.S. Federal Reserve and a potential debt default in the U.S. impacting oil prices by lowering them to the $75/bbl range. Brent crude oil prices averaged $77.73/bbl during the second quarter of 2023.
In the third quarter of 2023, Brent crude oil prices experienced a significant increase from $75/bbl in the beginning of July to $95/bbl at the end of September 2023, ending the third quarter of 2023 at an average of $85.92/bbl. One of the main driver for such an increase was production cuts by Saudi Arabia and Russia which led to anticipated supply constraints and potential supply shortages.
In the fourth quarter of 2023, Brent crude oil prices dropped from $91/bbl in the beginning of October to $77/bbl at the end of December 2023 ending the fourth quarter with an $82.85/bbl average. China’s economic recovery remained below expectations and the U.S. Central Bank’s hawkish stance over monetary policy, reduced global oil demand expectations and drove the prices down. Brent crude oil price averaged at $82.15/bbl in 2023, a decrease of $16.9/bbl compared to the previous year which averaged at $99.05/bbl.
The following table shows quarterly average prices of oil and CO2 for the past three years:
| Commodities | ||||||||
| Source: Thomson Reuters | Brent crude oil spot average price $ per barrel | European Union allowance average price € per ton of CO2e | ||||||
Q1 2021 | 61.32 | 37.65 | ||||||
Q2 2021 | 69.08 | 50.17 | ||||||
Q3 2021 | 73.23 | 57.12 | ||||||
Q4 2021 | 79.66 | 68.83 | ||||||
Q1 2022 | 97.90 | 83.21 | ||||||
Q2 2022 | 111.98 | 83.85 | ||||||
Q3 2022 | 97.70 | 80.04 | ||||||
Q4 2022 | 88.63 | 77.95 | ||||||
Q1 2023 | 82.10 | 89.92 | ||||||
Q2 2023 | 77.73 | 88.57 | ||||||
Q3 2023 | 85.92 | 85.69 | ||||||
Q4 2023 | 82.85 | 76.85 | ||||||
CO2
The integrated steel process involves carbon reduction which leads to CO2 emissions, which distinguishes integrated steel producers from mini-mills and many other industries where CO2 generation is primarily linked to energy use. Launched in 2005, the EU-ETS is currently in its fourth phase, stretching from January 2021 to December 2030. On June 22, 2022, the European Parliament agreed on its position regarding the EU-ETS reform (main elements: 2030 emission reduction target, CBAM and end of free allocation). On April 25, 2023, the EU adopted five pieces of legislation as part of the “Fit for 55” package, including a revision of the ETS Directive, a revision of the ETS Aviation Directive, an amendment of the monitoring, reporting, and verification shipping regulation, the adoption of a regulation establishing a Social Climate Fund and the adoption of a regulation establishing a carbon border adjustment mechanism (“CBAM”). The CBAM Regulation entered into force on May 17, 2023 and the other regulations entered into force on June 5, 2023. ArcelorMittal will likely incur additional costs in future periods to acquire emissions allowances beginning in 2026 due to the planned phase-out of the free allocation of CO2 emissions as from such date. ArcelorMittal targets a 35% and 25% reduction in emissions (scope 1 and 2) by 2030 in Europe and Group-wide, respectively, and has plans to become carbon neutral by 2050. ArcelorMittal Europe is investing in two routes to carbon neutrality, Smart Carbon and DRI-based route). See also "Business Overview—Sustainable Development—Climate change and decarbonization" and "Business Overview—Government Regulations—Environmental laws and regulations".
145
| Management report | ||
On January 1, 2021, Phase 4 of the EU-ETS started, which delayed the hand-out of free allocation. At the same time the UK left the scheme and set up its own, with trading starting in May. The EU Commission proposed its "Fit for 55" package and hence various changes to the EU-ETS to reduce future supply and drive decarbonization. Those events led to uncertainty and hectic trading behavior. Exacerbated by the economic recovery, the CO2 price went on a sharp rally. The market started the year below €35/tCO2e (tons of carbon dioxide (CO2) equivalent) and ended above €80/tCO2e, while the average carbon price throughout 2021 was €68/tCO2e. The highest point of the year was on December 8, 2021 when carbon prices broke the €90/tCO2e mark.
During the first quarter of 2022, the price for carbon continued its upward trend trading at a new all-time high of €98.5/tCO2e on February 8, 2022. However, the Russian invasion of Ukraine lead to a price drop of 42% in just 5 days and left the market trading at a 5-month low of €55/tCO2e. In the following weeks, the CO2 price regained much of its losses and climbed back up to above €80/tCO2e by the end of April 2022. During May and June, CO2 traded directionless between €80-€90/tCO2e, only briefly breaching the range on either side. Fundamentally, the market was stuck between recession fears and bullish policy changes which may restrict supply in the future and further push toward energy transition. In August, a month known for its low auction volume and thin liquidity, the price for carbon was particularly volatile as CO2 broke the range in both directions and made a push towards €100/tCO2e. However, it started to decline in September 2022 (dropping more than €30/tCO2e) amid tensions on the gas market and a bleak economic outlook. This outlook started to improve in October 2022 and with it the price of CO2, finishing the year on a strong note of around €90/tCO2e. The average price for one tonne of CO2 emitted in 2022 increased by more than 50% compared to the previous year.
During the first quarter of 2023, the price for carbon increased from €80/tCO2e levels to all-time high levels above €100/tCO2e on February 21, 2023, primarily driven by compliance buying and expectations for cooler temperatures. In the second quarter of 2023, weaker natural gas prices forced coal power plants out of the European power mix and declining demand pushed carbon prices down. From April to May 2023, carbon prices dropped from €95/tCO2e levels to below €80/tCO2e. During June 2023, carbon prices saw a rally on the back of a market squeeze and technical buying, and prices recovered back to €95/tCO2e levels in June 2023. The market ended the second quarter of 2023 below €90/tCO2e.
Carbon prices followed a decreasing trend during the third and fourth quarters of 2023. In the third quarter of 2023, carbon prices dropped to €82/tCO2e and in the fourth quarter of 2023 dropped further to €80/tCO2e. In the second half of the 2023 lower carbon prices were mainly driven by the decreasing
natural gas prices which resulted in power generation structure switching from coal to gas power plants (due to weak power demand amid mild temperatures) and weak CO2 demand from industry. The average price for one tonne of CO2 emitted in 2023 increased by 4.9% compared to the previous year.
Because the integrated steel process leads to substantial CO2 emissions, costs related to European Union Allowance Certificates ("EUA") and the fluctuations in EUA prices can significantly affect the Company’s costs of production. The Company recognized a CO2 emission obligation provision of $29 million at December 31, 2023 with respect to its shortfall. See note 9.1 to the consolidated financial statements. The Company also uses derivative financial instruments to manage its exposure to fluctuations in prices of emission rights allowances. As of December 31, 2023, the Company had a net notional position of $164 million with a net positive fair value of $18 million. See note 6.3 to the consolidated financial statements for further information.
Natural gas - Europe
In 2021, TTF (the price for natural gas, which is traded on a virtual trading platform located in the Netherlands) spot price (the price for natural gas to be delivered the next day) continued its upward trend, which started in the second half of 2020. The low point of slightly below €16 per Megawatt hour ("€/MWh") was reached at the end of February. While the high point was hit just before Christmas (€182/MWh). This marked a more than 1000% increase in price, amid the need to refill historical low storages, the battle for liquified natural gas ("LNG") with Asia, poor Russian piped supply into Northern Europe, and tension around the controversial Nord Stream 2 pipeline. The average price for TTF in 2021 was €45.9/MWh.
While the first half of 2021 averaged €21.8/MWh, it was only a fifth of the first half of 2022's average at €96.8/MWh.
During January 2022 and until February 24, 2022, the TTF Spot Price traded between €65-€100/MWh without clear direction. The invasion of Ukraine immediately provoked a price reaction as Europe feared for its gas supply and at the same time, the German government decided not to go ahead with the Russian-backed Nord Stream 2 project. The spot price surged on March 7, 2022 to almost €214/MWh, only to plummet back down to below €100/MWh one week later. Until mid-June 2022, TTF spot prices traded between €80-€120/MWh. When the Nord Stream 1 pipeline project (feeding Germany with Russian gas) was reduced to 40% capacity ahead of the yearly maintenance in July 2022, and later reduced to 20%, prices started to climb again, and overall market tensions grew around gas supplies, particularly in August 2022, after Russia announced a 3-day maintenance where the pipeline would be completely shut off. Market fears were realized when it was announced that the Nord Stream 1 pipeline would not come back online in 2022,
146
| Management report | ||
leading to a price surge up to €313/MWh on August 26, 2022, marking a new historical maximum for the TTF Spot Price. Traders and politicians (who were still working on price capping measures) across Europe again were afraid of not being able to fill up storage and a potential supply crunch for winter. However, continuous strong LNG arrivals and pipeline flows contributed to market confidence and price declines. The steadfast commitment allowed the filling of European storage ahead of their October (80% fullness) and November (90% fullness) targets. Storage was 83% filled by the end of 2022, considerably above the historical average primarily due to mild temperatures and oversupply of the European gas network.
The mild weather continued throughout the first quarter of 2023, and storage levels for natural gas remained healthy. Additionally, Freeport LNG, an important LNG export facility in the U.S. and key provider to Europe strategically located in the U.S. Gulf Coast, came back online in the first quarter of 2023 after a fire in June 2022, further easing the supply-demand balance. Gas prices at this time (between February and March 2023) were in the €40-50/MWh range. The European Market Correction Mechanism came into force on February 15, 2023, establishing a gas price cap at €180/MWh on the front-month TTF should some conditions be met, although it seems unlikely that these levels will be seen again. In early March 2023, French LNG regasification was halted amid strikes in France on pension reform. Despite the strikes, prices slid dropped to around €40/MWh due to mild weather as well as strong storage levels. Storage levels were at 56% at the end of March 2023 (which is 30% higher as compared to the end of March 2022), helping to start off the filling season in a favorable situation.
During the second quarter of 2023, persistent weak demand, healthy supply, and head start in storage levels weighed down on European gas prices (despite heavy maintenance from Norwegian supply starting in May 2023). Prices slumped to a 7-month low of €23/MWh in early June 2023. The low-price streak was interrupted by Norwegian gas supply outages extensions lifting prices back to €35-40/MWh. Nevertheless, the first half of 2023 ended with healthy storage levels at 77%.
In the second half of 2023 European gas prices experienced a volatile period. Extended maintenance at Norway's Nyhamna gas processing facility negatively affected the European gas market. In addition, reliability issues in Norway, along with the prospect of increased demand for LNG in Asia, especially China, led to a strained market balance at the start of the third quarter of 2023. Later in the third quarter of 2023, EU gas storage facilities reached to 93% levels, a notable increase compared to previous year (83% at the end of September 2022). This surge in storage levels led to apprehensions regarding a possible oversupply as the quarter progressed. In the third quarter of 2023, European gas prices increased to €43/MWh and later declined to €37/MWh by the end of third quarter
of 2023 due to the reason discussed above. The European gas prices averaged at €33/MWh in the third quarter of 2023.
In October 2023, the Israel-Hamas conflict raised uncertainties over Israeli production and its ability to export gas, particularly to Egypt which could have reduced LNG flows from Egypt to Europe. Market’s reaction was severe; the TTF spot price spiked from €29/MWh to €54/MWh within a week. Later in the fourth quarter of 2023, geopolitical uncertainties receded, and gas markets returned to the fundamental drivers where prices followed a decreasing trend with healthy LNG supply, reduced residential demand amid mild temperatures and high storage levels. At the end of the fourth quarter of 2023, the TTF spot price dropped to €32/MWh levels and average of the fourth quarter of 2023 was €41.01/MWh. Overall, in 2023, natural gas prices reduced to €40.8/MWh, a 66.4% decrease in comparison to previous year.
Natural gas - United States
In North America, natural gas prices (see table below) trade independently of oil prices and are set by spot and future contracts, traded on the NYMEX exchange or over-the-counter.
Henry Hub (the main gas hub in Louisiana) experienced a less severe price increase than other commodities in 2021, from averaging $2.7 per million British thermal units ("MMBtu") in the first quarter of 2021 up to averaging $4.8/MMBtu in the fourth quarter of 2021. In between, prices increased to $6.3/MMBtu in early October in anticipation of colder weather and the global thirst for U.S. LNG exports. As more liquefaction trains went online, the global gas market had a stronger impact on the U.S. natural gas price.
On January 27, 2022, Henry Hub reached an all-time high of $7.4/MMBtu due to the Texas Big Freeze, a wintry blast which hit Texas particularly hard, caused power failure and disrupted gas production as well as LNG exports. The invasion of Ukraine did not have an immediate impact on U.S. gas prices but over the months Henry Hub increased from $3.9/MMBtu mid-February 2022 to $9.6/MMBtu by mid-June 2022. Continuous supply side issues, low domestic storage and strong LNG export demand were the main drivers for this sharp increase. A fire at the Freeport LNG facility mid-June and a resulting drop in LNG export demand led to a price drop to below $5.5/MMBtu by the end of June 2022. However, the U.S. reacted to supply needs from Europe amid Russian gas halts and reached a new all-time high of $9.9/MMbtu on August 22, 2022. In the third quarter of 2022, prices dropped due to high production which allowed high storage levels before the winter heating started. With increased European LNG and domestic natural gas demand, Henry Hub price averaged $6.4/MMbtu in 2022, the highest price average since the financial crisis in 2008.
147
| Management report | ||
Freeport LNG was supposed to partially restart in mid-December 2022 but was delayed to January 2023 due to the pending regulatory approvals. Despite the plant not coming back online in 2022, the U.S. established itself as a key supplier to Europe amid the energy crisis.
A significant reversal was seen during the first quarter of 2023, when warmer than average temperatures in January and February 2023 led to reduced consumption in the residential and commercial sectors, which was the lowest natural gas consumption in the U.S. over the prior seven years during the same period. Mild temperatures also led to lower withdrawals of natural gas from underground storage. Prices increased to $2.8/MMBtu at the end of February 2023 after operations at Freeport LNG liquefaction plant restarted (following the fire in June 2022). However, prices dropped again throughout the month of March 2023. The first quarter of 2023 ended with average natural gas prices at $2.7/MMBtu.
During the second and the third quarters of 2023, natural gas prices followed an increasing trend, averaging $2.3/MMBtu and $2.7/MMBtu respectively. Also, 2023 filling season (from April 2023 to October 2023) started with relatively high storage volumes. Natural gas injections into storage during summer exceeded the five-year average. In the third quarter of 2023, extreme temperatures across the U.S. with heatwave in Texas and the Gulf Coast, and cooler temperatures than usual in the Northeast maintained strong gas demand despite an unprecedentedly high supply. Despite lower natural gas prices, production remained at high levels in 2023. The gas (supply-demand) balance, initially indicated an oversupply, which shifted towards a bullish trend with the summer heat. In 2023, U.S. natural gas inventories at the start of the winter heating season were at their highest level since 2020. In the fourth quarter of 2023, natural gas prices reached $3.6/MMBtu and then declined to $2.5/MMBtu at the end of the year. Overall, in 2023, Henry Hub average natural gas prices fell to $2.7/MMBtu, a 59.2% decrease in comparison to previous year.
Natural gas - Asia
Driven by cold weather in Asia, the Japan Korea Marker ("JKM") - the LNG benchmark price assessment for spot physical cargoes delivered ex-ship into Japan, South Korea, China and Taiwan, front-month contract exploded in the first few weeks of 2021. By mid-January, it traded at $20/MMBtu, a new record. In February and March, the market had cooled down again and was trading between $7 - $9/MMBtu. However, the sharp rally started in mid-April and lasted throughout the entire year, not giving the market time to breathe. Prices reached almost $50/MMBtu just before Christmas, breaking the record set in the first quarter of 2021. The price increase was fueled by the global need to refill depleted gas storage and a fierce battle between Europe and Asia to attract cargoes.
Similar to its European counterpart, the JKM traded range-bound until the Russian government launched its invasion of Ukraine. On March 7, 2022, the JKM reached an all-time high of $52/MMBtu. Throughout the first half of 2022, the JKM showed a great correlation to TTF, but kept trading at a discount, as Asian buyers were still well stocked and in general more linked to long-term contracts. On August 25, 2022, the JKM reached a new historical maximum of $70/MMbtu, striving to secure gas for the winter period. Many price-sensitive Asian markets could not compete with these high prices and switched to oil and domestic gas consumption. Meanwhile, China, the largest spot buyer, was struggling with re-emerging COVID-19 pandemic outbreaks and the implementation of zero-Covid measures largely muted Chinese demand for "LNG", freeing up spot cargoes for Europe to lock. Prices during the fourth quarter of 2022 followed Europe, which at the time was benefiting from mild weather during the early winter months, delaying the heating season and easing prices further. The JKM averaged $31.2/MMbtu during the fourth quarter. Overall, it was a year of great volatility in prices and the annual JKM average was $34/MMbtu in 2022, 90% higher than in 2021.
During the first quarter of 2023, the JKM front-month contract corrected down from high prices seen in 2022, despite the easing of COVID-19 measures by the Chinese government. In the first quarter of 2023, the JKM traded at an average of $18.1/MMbtu, 41% lower as compared to the first quarter of 2022.
Prices continued their downtrend led by healthy supply-demand balance in global markets, particularly in Europe as well as slow demand recovery from China. The average spot price for the second quarter of 2023, stood at $11.1/MMBtu, representing a 59% price discount to the same quarter of 2022, a level close to the estimated price for oil-indexed Asian LNG contracts. This prompted South Asian and Southeast Asian countries to return to the spot market. However, demand in the region remained relatively muted particularly due to slow Chinese industrial revival and high LNG inventories across North Asia.
In the third and fourth quarter of 2023, two major price spikes occurred in Asian markets. In August and October 2023, workers at Australia’s biggest LNG terminals (a major source for Asian LNG demand) voted for a strike action, threatened a total of 54 bcm/y (billion cubic meters per year) LNG supply capacity. Such a possible supply disturbance created a panic environment in the markets and in one day the JKM price jumped from $11.2/MMBtu to $14.3/MMBtu on August 16, 2023, and from $14.4/MMBtu to $17.7/MMBtu on October 16, 2023. Overall, weak LNG demand in Asia and lack of a major competition with Europe over spot LNG cargos, led prices to fall in the fourth quarter of 2023. In 2023 JKM average prices slumped to $14.4/MMBtu, a 57.7% decrease in comparison to previous year.
148
| Management report | ||
The following table shows quarterly average spot prices of natural gas for the past three years:
| Natural gas | EEX PEGAS | Reuters | Reuters | ||||||||
Period | TTF Spot average price € per MWh | Henry Hub Spot average price $ per MMBtu | JKM Spot average price $ per MMBtu | ||||||||
| Q1 2021 | 18.60 | 2.72 | 8.85 | ||||||||
| Q2 2021 | 25.06 | 2.98 | 9.71 | ||||||||
| Q3 2021 | 47.79 | 4.32 | 17.80 | ||||||||
| Q4 2021 | 92.14 | 4.84 | 34.95 | ||||||||
| Q1 2022 | 95.10 | 4.59 | 30.83 | ||||||||
| Q2 2022 | 98.55 | 7.50 | 27.18 | ||||||||
| Q3 2022 | 198.19 | 7.95 | 46.84 | ||||||||
| Q4 2022 | 94.27 | 6.09 | 31.23 | ||||||||
Q1 2023 | 53.31 | 2.74 | 18.07 | ||||||||
Q2 2023 | 35.29 | 2.33 | 11.08 | ||||||||
Q3 2023 | 33.49 | 2.66 | 12.59 | ||||||||
Q4 2023 | 41.01 | 2.92 | 15.82 | ||||||||
Electricity - Europe
Due to the regional nature of electricity markets, prices follow mainly local drivers (i.e., energy mix of the respective country, power generation from renewables, country specific energy policies, etc.).
In 2021, electricity prices continued to increase quarterly in line with the increasing fuel prices and renewable power could not provide the needed relief. In the second half of 2021, easing COVID-19 pandemic restrictions and reopening economies increased power demand and global fuel prices. The combination of high natural gas prices and increasing power demand in the fourth quarter of 2021 led to the highest prices ever recorded up until that time.
In the first half of 2022, electricity prices marginally increased as compared to levels during the fourth quarter of 2021 but were more than three times higher than in the first half of 2021. Rising fuel prices (i.e., thermal coal and natural gas) as well as elevated CO2 prices lifted the marginal cost of hard coal and natural gas power plants, which provides the floor and ceiling for the power market. Power output from renewables was not particularly strong for the first half of 2022, while hydro reservoirs took a hit amid a lack of water. In the second half of 2022, low nuclear power availability in France put further stress on the system. In 2022, electricity prices reached new highs amid high natural gas prices. The third quarter of 2022 experienced the highest prices ever recorded; four to five times higher than 2021. In the last quarter of 2022, electricity prices declined with decreasing natural gas prices and lower power demand amid mild weather conditions in Northwest Europe.
Similar to historical trends, in 2023 power prices mainly followed the same trend as natural gas prices. Marginal cost of power generation from gas power plants became the key indicator for electricity prices. There were four key trends in 2023: nuclear phase out of Germany, high nuclear power availability and high hydro levels in France and overall low demand for electricity due to reduced industrial power demand and mild temperatures in the first and fourth quarters of 2023.
The following table shows quarterly average spot prices of electricity in Germany, France and Belgium for the past three years:
| Electricity | |||||||||||
Source: EEX | Germany Baseload spot average price € per MWh | France Baseload spot average price € per MWh | Belgium Baseload spot average price € per MWh | ||||||||
| Q1 2021 | 49.57 | 53.02 | 50.94 | ||||||||
| Q2 2021 | 60.27 | 63.85 | 62.28 | ||||||||
| Q3 2021 | 97.15 | 96.42 | 97.28 | ||||||||
| Q4 2021 | 178.97 | 221.78 | 204.34 | ||||||||
| Q1 2022 | 184.62 | 232.19 | 208.02 | ||||||||
| Q2 2022 | 186.98 | 225.99 | 193.92 | ||||||||
| Q3 2022 | 375.75 | 429.73 | 372.27 | ||||||||
| Q4 2022 | 192.84 | 214.15 | 202.62 | ||||||||
Q1 2023 | 115.80 | 130.33 | 127.40 | ||||||||
Q2 2023 | 92.29 | 91.58 | 92.81 | ||||||||
Q3 2023 | 90.78 | 85.71 | 87.14 | ||||||||
Q4 2023 | 82.27 | 81.22 | 82.36 | ||||||||
Ocean freight
Throughout 2021, the dry bulk market remained firm but was extremely volatile, particularly in the second half of the year with the third quarter being the strongest quarter. The Baltic Dry Index (“BDI”) average was at 2,943 points in 2021. The Capesize and Panamax index reached a $33,333/day and $26,898/day average in 2021, respectively. Supramax rates hit multiyear highs in 2021, with the Baltic TC average peaking at $39,860/day in October from $11,305/day at the start of 2021 (+253%), before ending at $25,188/day (+$13,883 /day +123% as compared to the start of 2021). The weighted average Supramax rate was $26,767/day in 2021.
Fleet growth across all segments was relatively moderate in 2021, with an increase of 3.6% with the average dry bulk demolition age climbing to 28.55 years, naturally driven by far stronger market conditions.
While 2021 was very much a year of recovery, with the dry bulk market getting back on track after the COVID-19 pandemic, the year 2022 was largely impacted by the conflict in Ukraine and
149
| Management report | ||
the associated challenges that followed. The BDI average was at 1,934 points in 2022 compared to 2,943 points in 2021, highlighting the general response to the forced change in trading patterns which the conflict and subsequent sanctions created. The Capesize index decreased by 51.4% year-on-year to an average of $16,177/day in 2022 compared to $33,333/day in 2021. The Panamax index decreased by 22.9% to an average of $20,736/day as compared to $26,898/day in 2021. In 2022, the Supramax index was in steady decline, averaging $22,152/day as compared to $26,767/day, a 17.2% decline.
Among the changes resulting from the Ukraine conflict, a reshuffling of some established trade routes involving Russia led to an increase in tonne mileage which provided some support to the market, particularly as alternative sources for Ukrainian grain was sought in the early days of the conflict. An easing of the high congestion levels seen at Chinese ports also freed up a significant amount of capacity putting negative pressure on the market.
Overall bulk carrier contracting in 2022 was 51.2% lower than in 2021 by number of vessels and 53.63% lower in terms of deadweight, suggesting lower appetite for risk among investors as the global financial market faces inflationary pressures and increased uncertainty ahead.
While 2023 started off with a deeper than usual seasonal slump in dry cargo freight market, there was positive year-on-year data coming out of China in the first quarter, initially signalling economic growth. Though encouraging in the near-term, the effect of positive trade data proved not to be particularly long lasting as data points suggested a loss of momentum in, among other sectors, China’s property market. While all sectors saw a rapid uptick in rates during end-February 2023 to mid-March 2023, the Supramax and Panamax segments saw relatively steady declines in rates after that. Capesize rates were far more volatile, but fluctuated around the $15,000/day mark on a Time Charter Equivalent basis during first half of 2023. However, the fourth quarter of 2023 saw a dramatic increase in freight rates, particularly in the Capesize market. This was culmination of a multitude of factors, amounting to somewhat of a perfect storm, with increased demand coming out of China, coinciding with poor weather, and positional tonnage deficits relative to demand in both the Atlantic and Pacific basins.
The BDI average was at 1,378 points in 2023 compared to 1,934 points in 2022. The Capesize index increased by 1.31% year-on-year to an average of $16,389/day in 2023 compared to $16,177/day in 2022. The Panamax index decreased by 38.01% to an average of $12,854/day as compared to $20,736/day in 2022. In 2023, the Supramax index fell to an average of $11,240/day as compared to $22,152/day in 2022, a 49.26% decline.
Adding to the complexity of the global market, the conflict in Gaza that began in October 2023 has prompted a violent response from Houthi Rebels targeting commercial shipping in the red sea off the coast of Yemen. This has dramatically increased insurance premiums for vessels passing via the Suez canal, prompting many owners to re-route their vessels via Cape of Good Hope. Meanwhile, 2023 also saw water levels in the Panama Canal draw down to historic lows due to environmental factors, resulting in very limited throughput and an auction system where at peak owners paid $1.3 million for a slot. This resulted in a sharp reduction of vessels going via Panama, with traffic routing via Magellan instead. Both factors above have had the effect of reducing available supply and maintaining relatively firm rates into 2024.
The new ETS regulations that entered into force are also starting to have an impact as average vessel speeds dropped, to comply with the stricter environmental requirements and to limit costs. Furthermore, while there is a robust growth in dry bulk trade, particularly in grains and minor bulks, challenges in the steel and coal sectors influence the overall trade environment.
Sources: Baltic Index, Clarksons Platou
Impact of exchange rate movements
Because a substantial portion of ArcelorMittal’s assets, liabilities, sales and earnings are denominated in currencies other than the U.S. dollar (its reporting currency), ArcelorMittal has exposure to fluctuations in the values of these currencies relative to the U.S. dollar. These currency fluctuations, especially the fluctuation of the U.S. dollar relative to the euro, as well as fluctuations in the currencies of the other countries in which ArcelorMittal has significant operations and sales, can have a material impact on its results of operations. For example, ArcelorMittal’s subsidiaries may purchase raw materials, including iron ore and coking coal, in U.S. dollars, but may sell finished steel products in other currencies. Consequently, an appreciation of the U.S. dollar will increase the cost of raw materials; thereby having a negative impact on the Company’s operating margins, unless the Company is able to pass along the higher cost in the form of higher selling prices. In order to minimize its currency exposure, ArcelorMittal enters into hedging transactions to lock-in a set exchange rate, as per its risk management policies.
Since April 1, 2018, the Company has designated a portfolio of euro denominated debt (€3.6 billion as of December 31, 2023) as a hedge of certain euro denominated investments (€8.6 billion as of December 31, 2023) in order to mitigate the foreign currency risk arising from certain euro denominated subsidiaries net assets. The risk arises from the fluctuation in spot exchange rates between the euro and U.S. dollar, which causes the amount of the net investments to vary. See also note 6.3 to the
150
| Management report | ||
consolidated financial statements. As a result of the hedge designation, foreign exchange gains and losses related to the portfolio of euro denominated debt are recognized in other comprehensive income.
As of December 31, 2023, the Company is mainly subject to foreign exchange exposure relating to the euro, Brazilian real, Canadian dollar, Indian rupee, South African rand, Mexican peso, Polish zloty, Argentinian peso and Ukrainian hryvnia against the U.S. dollar resulting from its payables, receivables or foreign operations denominated in such currencies.
In 2023, the euro appreciated against the U.S. dollar from 1.0666 on December 31, 2022 to 1.1050 on December 31, 2023. This appreciation is largely explained by the decrease in interest rate differential, with markets anticipating the end of hiking cycles by central banks and the start of rate cuts during 2024, expected to occur in the U.S. before the European Union.
The Polish zloty appreciated against the U.S dollar throughout 2023 from 4.39 on December 31, 2022 to 3.93 on December 31, 2023, benefiting from a high interest rate differential and relatively better macro-economic conditions.
In 2023, the Ukrainian hryvnia value depreciated against the U.S. dollar from 36.5686 on December 31, 2022, to 37.9824 on December 31, 2023. Since October 2023 the National Bank of Ukraine ("NBU") has abandoned the fixed official UAH rate against U.S. dollar at 36.5686 (implemented since July 2022 due to geopolitical situation with Russia) and switched to a controlled exchange rate. To do so, the NBU is being very active on the foreign exchange market, using its foreign currency reserves to manage the value of its currency.
The Indian rupee depreciated against the U.S. dollar from 82.67 on December 31, 2022 to 83.17 on December 31, 2023 due to interest rate differential with the United States, inflow of capital and India’s high dependency on energy imports in a context of surging prices.
The South African rand depreciated against the U.S. dollar from 16.96 on December 31, 2022 to 18.55 on December 31, 2023 in the context of high inflation and energy supply disruptions in the country.
The Canadian dollar appreciated in 2023 compared to 2022 against the U.S. dollar, from 1.35 on December 31, 2022 to 1.32 on December 31, 2023 mainly as a result of the yield differential between U.S. and Canada.
The Mexican peso appreciated in 2023 against the U.S. dollar from 19.55 on December 31, 2022 to 16.94 on December 31, 2023 due to high real interest rates in Mexico and a resilient U.S. economy which leads to high remittances and provides a favorable external balance to support the currency.
In 2023, Brazilian real appreciated against the U.S. dollar, from 5.22 on December 31, 2022 to 4.84 on December 31, 2023, due to the relative high interest rate differential.
The Argentinian peso depreciated sharply against the U.S. dollar from 177.16 on December 31, 2022 to 808.45 on December 31, 2023 in connection with poor economic conditions in the country and hyperinflation.
Critical accounting policies and use of judgments and estimates
Management’s discussion and analysis of ArcelorMittal’s operational results and financial condition is based on ArcelorMittal’s consolidated financial statements, which have been prepared in accordance with IFRS. The preparation of financial statements in conformity with IFRS recognition and measurement principles and, in particular, making the critical accounting judgments highlighted below require the use of estimates and assumptions that affect the reported amounts of assets, liabilities, revenues and expenses. Management reviews its estimates on an ongoing basis using currently available information. Changes in facts and circumstances or obtaining new information or more experience may result in revised estimates, and actual results could differ from those estimates.
An overview of ArcelorMittal's critical accounting policies under which significant judgments, estimates and assumptions are made may be found in note 1.3 to the consolidated financial statements.
Export sales
Because ArcelorMittal’s customers are mainly based outside its home country of Luxembourg, all of its sales are considered to be export sales. Annual sales to a single individual customer did not exceed 5% of sales in any of the periods presented.
Legal proceedings
ArcelorMittal is currently and may in the future be involved in litigation, arbitration or other legal proceedings. Provisions related to legal and arbitration proceedings are recorded in accordance with the accounting policies described in note 9.1 to ArcelorMittal’s consolidated financial statements. Please refer to note 9.3 for a description of contingencies, including legal proceedings.
Operating results
The following discussion and analysis should be read in conjunction with ArcelorMittal’s consolidated financial statements included in this annual report.
ArcelorMittal reports its operations in five reportable segments: NAFTA, Brazil, Europe, ACIS and Mining. The key performance indicators that ArcelorMittal’s management uses to analyze operations are sales, average steel selling prices, crude steel production, steel shipments, iron ore production and operating
151
| Management report | ||
income. Management’s analysis of liquidity and capital resources is driven by net cash flow from operations less capital expenditures.
As from April 1, 2021, ArcelorMittal implemented changes to its organizational structure whereby primary responsibility for captive mining operations whose output is mainly consumed by their respective steel segments has been transferred to such segments. The Mining segment retains primary responsibility for the operation of the seaborne oriented operations at AMMC and AML and continues to provide technical support to all mining operations within the Company. Accordingly, the Company
modified the structure of its segment information in order to reflect changes in its approach to managing its operations and segment disclosures have been recast to reflect this new segmentation. Only the seaborne-oriented operations of AMMC and AML are reported within the Mining segment. The results of all other mines are henceforth accounted for within the steel segment that it primarily supplies.
As from January 1, 2024, ArcelorMittal implemented changes to its organizational structure; see "Business overview—Organizational structure".
Years ended December 31, 2023, 2022 and 2021
Sales, operating income, crude steel production, steel shipments, average steel selling prices and mining production
The following tables provide a summary of ArcelorMittal’s performance by reportable segment for the years ended December 31, 2023, 2022 and 2021:
Sales for the year ended December 31,1 | Operating income (loss) for the year ended December 31,2 | ||||||||||||||||||||||||||||||||||
2023 | 2022 | 2021 | 2023 | 2022 | 2021 | ||||||||||||||||||||||||||||||
| Segment | (in $ millions) | (in $ millions) | (in $ millions) | (in $ millions) | (in $ millions) | (in $ millions) | |||||||||||||||||||||||||||||
| NAFTA | 12,978 | 13,774 | 12,530 | 1,917 | 2,818 | 2,800 | |||||||||||||||||||||||||||||
| Brazil | 13,163 | 13,732 | 12,856 | 1,461 | 2,775 | 3,798 | |||||||||||||||||||||||||||||
| Europe | 38,305 | 47,263 | 43,334 | 1,104 | 4,292 | 5,672 | |||||||||||||||||||||||||||||
| ACIS | 5,422 | 6,368 | 9,854 | (3,021) | (930) | 2,705 | |||||||||||||||||||||||||||||
| Mining | 3,077 | 3,396 | 4,045 | 1,144 | 1,483 | 2,371 | |||||||||||||||||||||||||||||
| Others and eliminations | (4,670) | (4,689) | (6,048) | (265) | (166) | (370) | |||||||||||||||||||||||||||||
| Total | 68,275 | 79,844 | 76,571 | 2,340 | 10,272 | 16,976 | |||||||||||||||||||||||||||||
1.Amounts are prior to inter-segment eliminations (except for total) and sales include non-steel sales.
2.Others and eliminations to segment operating income reflects certain adjustments made to operating income of the segments to reflect corporate costs, income from non-steel operations (e.g. energy, logistics and shipping services) and the elimination of stock margins between segments. See table below.
| Others and eliminations - operating (loss) income | Year ended December 31, | ||||||||||||||||
2023 | 2022 | 2021 | |||||||||||||||
| (in $ millions) | (in $ millions) | (in $ millions) | |||||||||||||||
Corporate and shared services 1 | (296) | (234) | (201) | ||||||||||||||
| Financial activities | (24) | (19) | (21) | ||||||||||||||
| Shipping and logistics | 5 | 12 | 15 | ||||||||||||||
| Intragroup stock margin eliminations | 91 | 110 | (123) | ||||||||||||||
| Depreciation and impairment | (42) | (35) | (40) | ||||||||||||||
| Total adjustments to segment operating income and other | (266) | (166) | (370) | ||||||||||||||
1.Includes primarily staff and other holding costs and results from shared service activities.
Shipments and average steel selling price
ArcelorMittal steel shipments remained relatively stable at 55.6 million tonnes for the year ended December 31, 2023 as compared to steel shipments of 55.9 million tonnes for the year ended December 31, 2022.
On a comparable basis, excluding the shipments from ArcelorMittal Pecém (consolidated from March 9, 2023) and ArcelorMittal Temirtau (sold on December 7, 2023), steel shipments in 2023 were impacted by production cuts and
outages during the year in Europe, offset in part by improved NAFTA volumes, and declined by 4.5% as compared to 2022.
Steel shipments decreased 3.6% to 28.7 million tonnes in the first half of 2023 as compared to 29.7 million tonnes for the first half of 2022. Excluding the shipments of ArcelorMittal Pecém (consolidated from March 9, 2023), steel shipments in the first half of 2023 declined by 6.8% as compared to the first half of 2022 (impacted by outages in Europe and lower demand in
152
| Management report | ||
Brazil, including exports). Steel shipments increased 2.9% to 27.0 million tonnes in the second half of 2023 compared to 26.2 million tonnes in the second half of 2022, mainly due to the shipments of ArcelorMittal Pecém and improved shipments from NAFTA segment. Excluding the shipments from ArcelorMittal Pecém, steel shipments in the second half of 2023 declined by 2.9% as compared to the second half of 2022 (mainly impacted by the lower demand in Europe).
ArcelorMittal had steel shipments of 55.9 million tonnes for the year ended December 31, 2022 as compared to steel shipments of 62.9 million tonnes for the year ended December 31, 2021, representing a 11.2% decrease. On a comparable basis, excluding the shipments of ArcelorMittal Italia, deconsolidated as from April 14, 2021 and excluding the shipments of Ukraine (in both periods), steel shipments decreased by 4.5%.
While NAFTA shipments remained stable, the following segments experienced year on year shipment declines in 2022: Europe 9.0% (6.2% on a comparable basis excluding shipments of ArcelorMittal Italia), Brazil 1.5%, ACIS 38.4% (9.4% on a comparable basis excluding shipments of Ukraine in both periods).
Steel shipments decreased 8.7% to 29.7 million tonnes in the first half of 2022 compared to 32.6 million tonnes for the first half of 2021. On a comparable basis excluding the impact of ArcelorMittal Italia (deconsolidated as from April 14, 2021), steel shipments decreased by 5.8% in the first half of 2022 as compared to the first half of 2021. The decrease in steel shipments was mainly due to the lower shipments in ACIS segment (39.0% primarily due to the conflict between Russia and Ukraine) and in NAFTA segment (3.7%). Steel shipments decreased 13.7% to 26.2 million tonnes in the second half of 2022 compared to 30.3 million tonnes in the second half of 2021, due to the ongoing war in Ukraine and lower apparent demand driven by weaker macroeconomic conditions and significant destocking in all other regions.
Average steel selling prices decreased by 13.5% for the year ended December 31, 2023 as compared to the year ended December 31, 2022 in line with international steel selling prices. Average steel selling prices decreased by 14.7% in the first half of 2023, as compared to the first half of 2022, when prices benefited from restocking demand following the outbreak of war in Ukraine. Average steel selling prices decreased by 11.8% in the second half of 2023, as compared to the second half of 2022, in line with international prices.
Average steel selling prices increased by 16.6% for the year ended December 31, 2022 as compared to the year ended December 31, 2021 in line with the sharp increase in international steel selling prices in the first half of 2022, following the start of the Russia-Ukraine conflict: average steel selling
prices increased by 37.7% in the first half of 2022 as compared to the first half of 2021 and decreased by 1.9% in the second half of 2022 in line with international prices, as compared to the second half of 2021.
Sales
ArcelorMittal had sales of $68.3 billion for the year ended December 31, 2023, representing a 14.5% decrease from sales of $79.8 billion for the year ended December 31, 2022, primarily due to 13.5% lower average steel selling prices. In the first half of 2023, sales were $37.1 billion, decreasing from $44.0 billion in the first half of 2022, primarily due to lower steel shipments and 15% lower average steel selling prices. In the second half of 2023, sales of $31.2 billion represented a 13.1% decrease as compared to sales of $35.9 billion in the second half of 2022, primarily driven by an 11.8% decrease in average steel selling prices, a negative currency translation impact offset in part by 2.9% higher steel shipments.
ArcelorMittal had sales of $79.8 billion for the year ended December 31, 2022, representing a 4.3% increase from sales of $76.6 billion for the year ended December 31, 2021, primarily due to 16.6% higher average steel selling prices partly offset by 11.2% lower steel shipments. In the first half of 2022, sales were $44.0 billion increasing from $35.5 billion in the first half of 2021, primarily due to 37.7% higher average steel selling prices partly offset by 8.7% lower steel shipments, In the second half of 2022, sales of $35.9 billion represented a 12.6% decrease as compared to sales of $41.0 billion in the second half of 2021, primarily driven by a 1.9% decrease in average steel selling prices and 13.7% lower steel shipments.
Cost of sales
Cost of sales consists primarily of purchases of raw materials necessary for steel-making (iron ore, coke and coking coal, scrap and alloys), energy, repair and maintenance costs, as well as direct labor costs, depreciation and impairment. Cost of sales for the year ended December 31, 2023 was $63.5 billion as compared to $67.3 billion for the year ended December 31, 2022, mainly driven by lower coal and energy costs (see below for more details). Cost of sales for the year ended December 31, 2023 included $1.5 billion foreign exchange translation losses and impairment charges of $0.9 billion in connection with the sale of ArcelorMittal Temirtau, the Company's steel and mining operations in Kazakhstan, of which $0.7 billion impairment of property, plant and equipment and $0.2 billion impairment of ACIS goodwill. Cost of sales for the year ended December 31, 2023 also included $0.1 billion impairment of property, plant and equipment of the Long operations of ArcelorMittal South Africa.
For the years ended December 31, 2023, 2022, and 2021, cost of sales included the following energy costs:
153
| Management report | ||
| in millions of USD | 2023 | 2022 | 2021 | ||||||||
| Electricity for production | 3,129 | 4,360 | 3,289 | ||||||||
| Natural and other gases | 1,887 | 3,326 | 2,242 | ||||||||
| Other energy and utilities | 1,799 | 1,902 | 1,323 | ||||||||
| Total | 6,815 | 9,588 | 6,854 | ||||||||
Energy costs represented 11%, 14% and 12% of cost of sales for the years ended December 31, 2023, 2022, and 2021, respectively. ArcelorMittal has taken cost mitigating actions including hedging a part of its future energy consumption (in accordance with the Group's commodity price hedging policy) as well as operational savings. In the case of natural gas, the Company has taken several actions to minimize the consumption of natural gas throughout its production process, including optimization of the reuse of blast furnace gases and coke oven battery gases, and enhancement of oxygen enrichment combustion for reheating furnaces.
Cost of sales for the year ended December 31, 2022 was $67.3 billion as compared to $57.3 billion for the year ended December 31, 2021, mainly driven by higher raw material and energy costs offset in part by lower shipments. Cost of sales for the year ended December 31, 2022 included a $1.0 billion impairment charge relating to ArcelorMittal Kryviy Rih’s property, plant and equipment and intangibles due to the significant uncertainty about the evolution of the geopolitical context in Ukraine and the timing and ability for the Company to resume operations to a normal level.
Apart from the impairment charge mentioned above, cost of sales for the year ended December 31, 2022 also included $0.5 billion of inventory related charges to reflect the net realizable value of inventory with declining market prices in Europe, partially offset by a $0.1 billion bargain purchase gain on the acquisition of ArcelorMittal Texas HBI and a $0.1 billion gain following the settlement of a claim by ArcelorMittal for a breach of a supply contract.
Depreciation for the year ended December 31, 2023, was $2.7 billion, slightly higher as compared to $2.6 billion for the year ended December 31, 2022 primarily due to the acquisition of ArcelorMittal Texas HBI on June 30, 2022 and ArcelorMittal Pecém on March 9, 2023. In 2022, depreciation for the year ended December 31, 2022 was $2.6 billion, slightly higher as compared to $2.5 billion for the year ended December 31, 2021 primarily driven by changes in useful lives estimates for certain assets in Europe and Canada due to decarbonization projects.
Selling, general and administrative expenses
Selling, general and administrative expenses ("SG&A") were $2.4 billion for the year ended December 31, 2023 as compared to $2.3 billion for the year ended December 31, 2022 and $2.3 billion for the year ended December 31, 2021. SG&A as a
percentage of sales increased for the year ended December 31, 2023 (3.5%) as compared to 2022 (2.8%) and 2021 (2.9%).
Operating income
ArcelorMittal’s operating income for the year ended December 31, 2023 was $2.3 billion as compared to $10.3 billion for the year ended December 31, 2022, primarily driven by negative price-cost effect (predominantly on account of lower average steel selling prices (13.5%) driving a decline in steel spreads with the pace of the decline in steel prices being greater than the reduction in the raw material basket and energy costs. Operating income for the year ended December 31, 2023 included a $2.4 billion charge relating to the disposal of ArcelorMittal Temirtau including $0.9 billion of impairment of property, plant and equipment and goodwill and $1.5 billion cumulative foreign exchange translation losses (previously recognized in equity) recycled through the consolidated statements of operations.
ArcelorMittal’s operating income for the year ended December 31, 2022 was $10.3 billion as compared to $17.0 billion for the year ended December 31, 2021, primarily driven by a negative price-cost effect, including in particular higher coal and energy costs, lower steel shipments, negative translation effect and the impairment charge, inventory related charges, bargain purchase gain and gain resulting from a litigation settlement, totaling $1.3 billion.
| NAFTA | |||||||||||||||||
| Performance for the year ended December 31, | |||||||||||||||||
| (in millions of USD unless otherwise shown) | 2023 | 2022 | 2021 | ||||||||||||||
| Sales | 12,978 | 13,774 | 12,530 | ||||||||||||||
| Depreciation | (535) | (427) | (325) | ||||||||||||||
| Operating income | 1,917 | 2,818 | 2,800 | ||||||||||||||
| Crude steel production (thousand tonnes) | 8,727 | 8,271 | 8,487 | ||||||||||||||
| Flat product shipments | 8,220 | 7,121 | 6,879 | ||||||||||||||
| Long product shipments | 2,734 | 2,739 | 3,088 | ||||||||||||||
| Others and eliminations | (390) | (274) | (381) | ||||||||||||||
| Total steel shipments (thousand tonnes) * | 10,564 | 9,586 | 9,586 | ||||||||||||||
| Average steel selling price (USD/tonne) | 1,024 | 1,215 | 1,128 | ||||||||||||||
* NAFTA steel shipments include slabs sourced by NAFTA from Group subsidiaries (primarily from Brazil) and sold to the Calvert joint venture which are then eliminated on consolidation. These shipments, which vary between periods due to slab sourcing mix and timing of vessels in a period, amounted to 1,660,000 tonnes, 1,173,000 tonnes and 1,152,000 tonnes in 2023, 2022 and 2021, respectively.
Crude steel production, steel shipments and average steel selling price
Crude steel production for the NAFTA segment increased 5.5% to 8.7 million tonnes for the year ended December 31, 2023 as
154
| Management report | ||
compared to 8.3 million tonnes for the year ended December 31, 2022. Crude steel production increased 7.3% to 4.4 million tonnes in the first half of 2023 as compared to 4.1 million tonnes the first half of 2022, which was impacted by labor actions in Mexico and in Long Products Canada and maintenance in Canada. Crude steel production increased 3.8% to 4.3 million tonnes in the second half of 2023 as compared to 4.1 million tonnes in the second half of 2022, which was impacted by planned maintenance.
Crude steel production for the NAFTA segment decreased 2.5% to 8.3 million tonnes for the year ended December 31, 2022 as compared to 8.5 million tonnes for the year ended December 31, 2021. Crude steel production declined 7.3% in the first half of 2022 as compared to the first half of 2021 primarily due to lower flat and long production resulting from labor actions in Mexico and at AMLPC. Crude steel production increased 2.7% in the second half of 2022 as compared to the second half of 2021 which had been impacted by operational disruptions (including the impact of hurricane Ida in the third quarter of 2021) in Mexico.
Steel shipments in the NAFTA segment increased by 10.2% for the year ended December 31, 2023 to 10.6 million tonnes as compared to the 9.6 million tonnes for the year ended December 31, 2022. Steel shipments increased 10.9% to 5.4 million tonnes for the first half of 2023, from 4.9 million tonnes for the first half of 2022 primarily due to higher slab shipments sourced from the Brazil segment for Calvert and higher steel shipments in Mexico. Steel shipments increased by 9.4% to 5.1 million tonnes in the second half of 2023, as compared to the 4.7 million tonnes in the second half of 2022, primarily due to the higher slab shipments sourced from Brazil and sold to the Calvert joint venture, and higher steel shipments in Mexico.
Steel shipments in the NAFTA segment remained stable for the year ended December 31, 2022 as compared to the year ended December 31, 2021. Steel shipments decreased 3.7% to 4.9 million tonnes for the first half of 2022, from 5.1 million tonnes for the first half of 2021 primarily due to the labor actions in Mexico and at AMLPC as described above and lower demand for flat products in Canada. Steel shipments increased by 4.3% in the second half of 2022 as compared to the second half of 2021 which had been impacted by weaker demand in North America, including automotive, and lower production due to operational disruptions as mentioned above.
Average steel selling prices in NAFTA segment decreased 15.7% for the year ended December 31, 2023 as compared to the year ended December 31, 2022. In the first half of 2023, average steel selling prices were 20.2% lower than in the first half of 2022, in line with the trend in market prices. Average steel selling prices in the second half of 2023 were 10.0% lower
as compared to the second half of 2022, in line with the trend in market prices.
Average steel selling prices in NAFTA segment increased 7.8% for the year ended December 31, 2022 as compared to the year ended December 31, 2021. In the first half of 2022, average steel selling prices were 37.8% higher than in the first half of 2021, in line with the trend in market prices and the positive impact of automotive contract resets. Average steel selling prices in the second half of 2022 were 16.3% lower as compared to the second half of 2021, in line with the trend in market prices.
Sales
Sales in the NAFTA segment were $13.0 billion for the year ended December 31, 2023, representing a 5.8% decrease as compared to the year ended December 31, 2022. Sales in the NAFTA segment decreased 7.6% to $6.8 billion for the first half of 2023 as compared to $7.4 billion for the first half of 2022, mainly due to 20.2% lower average steel selling prices, offset in part by 10.9% higher steel shipment volumes and the impact of consolidation of ArcelorMittal Texas HBI. Sales in the NAFTA segment in the second half of 2023 decreased by 3.6% as compared to the second half of 2022, mainly due to 10.0% lower average steel selling prices, partially offset by the 9.4% increase in steel shipments.
Sales in the NAFTA segment were $13.8 billion for the year ended December 31, 2022, representing a 9.9% increase as compared to the year ended December 31, 2021. Sales in the NAFTA segment increased 28.3% to $7.4 billion for the first half of 2022 as compared to $5.8 billion for the first half of 2021, mainly due to 37.8% higher average steel selling prices offset in part by 3.7% lower steel shipment volumes. Sales in the NAFTA segment in the second half of 2022 decreased by 5.8% as compared to the second half of 2021, mainly due to the sharp decline in average steel selling prices, partially offset by the increase in steel shipments.
Operating income
Operating income for the NAFTA segment decreased by 32.0% to $1.9 billion for the year ended December 31, 2023, compared to $2.8 billion for the year ended December 31, 2022, mainly due to negative price-cost effect driven by lower average steel selling prices offset in part by higher steel shipments. In the first half of 2023, operating income for the NAFTA segment was $1,117 million, as compared to $1,871 million in the first half of 2022, mainly driven by a significant negative price-cost effect offset in part by higher steel shipments and the contribution from ArcelorMittal Texas HBI. Operating income for the NAFTA segment in the second half of 2023 decreased by 15.5%, as compared to the second half of 2022, mainly due to negative price-cost effect partially offset by an increase in steel shipments.
155
| Management report | ||
Operating income for the NAFTA segment was stable at $2.8 billion for the year ended December 31, 2022 and December 31, 2021. In the first half of 2022, operating income for the NAFTA segment was $1,871 million, as compared to $936 million in the first half of 2021, mainly driven by a significant positive price-cost effect, despite higher costs associated with the labor actions in Mexico (approximately $120 million) and lower steel shipments. Operating income for the NAFTA segment in the second half of 2022 decreased by 49.2%, as compared to the second half of 2021, mainly due to a negative price-cost effect partially offset by an increase in steel shipments, a $0.1 billion bargain purchase gain on the acquisition of ArcelorMittal Texas HBI and a $0.1 billion gain following the settlement of a claim by ArcelorMittal for a breach of a supply contract.
| Brazil | |||||||||||||||||
| Performance for the year ended December 31, | |||||||||||||||||
| (in millions of USD unless otherwise shown) | 2023 | 2022 | 2021 | ||||||||||||||
| Sales | 13,163 | 13,732 | 12,856 | ||||||||||||||
| Depreciation | (341) | (246) | (228) | ||||||||||||||
| Operating income | 1,461 | 2,775 | 3,798 | ||||||||||||||
| Crude steel production (thousand tonnes) | 13,986 | 11,877 | 12,413 | ||||||||||||||
| Flat product shipments | 8,833 | 6,423 | 6,425 | ||||||||||||||
| Long product shipments | 4,905 | 5,179 | 5,332 | ||||||||||||||
| Others and eliminations | (57) | (86) | (62) | ||||||||||||||
| Total steel shipments (thousand tonnes) | 13,681 | 11,516 | 11,695 | ||||||||||||||
| Average steel selling price (USD/tonne) | 939 | 1,114 | 1,030 | ||||||||||||||
Crude steel production, steel shipments and average steel selling price
Crude steel production for the Brazil segment increased 17.8% to 14.0 million tonnes for the year ended December 31, 2023 as compared to 11.9 million tonnes for the year ended December 31, 2022 primarily due to the consolidation of ArcelorMittal Pecém from March 9, 2023. On a scope adjusted basis excluding the impact of ArcelorMittal Pecém, crude steel production was 3.6% lower in 2023 compared to 2022, primarily due to lower demand. Crude steel production in the Brazil segment increased 10.8% to 6.8 million tonnes in the first half of 2023 as compared to 6.1 million tonnes for the first half of 2022, primarily due to the consolidation of ArcelorMittal Pecém from March 9, 2023. On a scope adjusted basis excluding the impact of ArcelorMittal Pecém, crude steel production for the first half of 2023 was 5.3% lower as compared to the first half of 2022, due to lower demand including exports (in particular in the first quarter of 2023). Crude steel production in the Brazil segment increased 25.2% to 7.2 million tonnes for the second half of 2023 as compared to 5.8 million tonnes for the second half of
2022, primarily due to the consolidation of ArcelorMittal Pecém (as discussed above). On a scope adjusted basis excluding the impact of ArcelorMittal Pecém, crude steel production for the second half of 2023 was 1.7% lower as compared to the second half of 2022, primarily due to lower demand in Argentina.
Crude steel production for the Brazil segment decreased 4.3% to 11.9 million tonnes for the year ended December 31, 2022 as compared to 12.4 million tonnes for the year ended December 31, 2021. Crude steel production in the Brazil segment decreased marginally 0.9% to 6.1 million tonnes in the first half of 2022 as compared to 6.2 million tonnes for the first half of 2021. Crude steel production in the Brazil segment decreased 7.7% to 5.8 million tonnes for the second half of 2022 as compared to 6.2 million tonnes for the second half of 2021, primarily due to lower demand from export markets.
Steel shipments increased 18.8% to 13.7 million tonnes for the year ended December 31, 2023 as compared to 11.5 million tonnes for the year ended December 31, 2022. On a scope adjusted basis excluding the impact of ArcelorMittal Pecém, steel shipments decreased 2.8% in 2023 as compared to 2022. Steel shipments increased 8.0% to 6.5 million tonnes in the first half of 2023 as compared to 6.0 million tonnes for the first half of 2022, primarily due to the impact of ArcelorMittal Pecém. On a scope adjusted basis excluding the impact of ArcelorMittal Pecém, steel shipments for the first half of 2023 were 7.9% lower as compared to the first half of 2022 due to lower demand including exports. Steel shipments in the second half of 2023 increased 30.8% as compared to the second half of 2022, primarily due to due to the impact of ArcelorMittal Pecém. On a scope adjusted basis excluding the impact of ArcelorMittal Pecém, steel shipments for the second half of 2023 were 2.9% higher as compared to the second half of 2022.
Steel shipments decreased 1.5% to 11.5 million tonnes for the year ended December 31, 2022 as compared to 11.7 million tonnes for the year ended December 31, 2021. Steel shipments increased 3.6% to 6.0 million tonnes in the first half of 2022 as compared to 5.8 million tonnes for the first half of 2021 primarily due to higher export volumes. Steel shipments in the second half of 2022 decreased 6.6% as compared to the second half of 2021, primarily due to lower export volumes with domestic shipments up slightly year on year.
Average steel selling prices decreased 15.7% for the year ended December 31, 2023 as compared to the year ended December 31, 2022, in line with the trend in market prices. Average steel selling prices decreased 12.8% in the first half of 2023 compared to the first half of 2022 in line with the trend in market prices. Average steel selling prices decreased 18.1% in second half of 2023 as compared to the second half of 2022, in line with the trend in market prices.
156
| Management report | ||
Average steel selling prices increased 8.1% for the year ended December 31, 2022 as compared to the year ended December 31, 2021, in line with the trend in market prices. Average steel selling prices increased 21.0% in the first half of 2022 compared to the first half of 2021, in line with the trend in market prices but decreased 2.8% in the second half of 2022 compared to the second half of 2021, in line with market trends in particular for export markets.
Sales
In the Brazil segment, sales decreased 4.1% to $13.2 billion for the year ended December 31, 2023 as compared to $13,7 billion for the year ended December 31, 2022, primarily due to 15.7% lower average steel selling prices offset in part by 18.8% higher steel shipments, mainly due to the impact of ArcelorMittal Pecém. In the first half of 2023, sales decreased 6.2% to $6.9 billion as compared to $7.4 billion for the first half of 2022 primarily due to 12.8% lower average steel selling prices offset in part by 8.0% higher steel shipments (including ArcelorMittal Pecém). In the second half of 2023, sales decreased 1.8% to $6.3 billion as compared to $6.4 billion for the second half of 2022, driven by an 18.1% decrease in average steel selling prices and the devaluation of the Argentinian peso, offset by a 30.8% increase in shipments.
In the Brazil segment, sales increased 6.8% to $13.7 billion for the year ended December 31, 2022 as compared to the year ended December 31, 2021, primarily due to 8.1% higher average steel selling prices offset in part by 1.5% lower steel shipments. In the first half of 2022, sales increased 26.8% to $7.4 billion as compared to $5.8 billion for the first half of 2021 primarily due to 21.0% higher average steel selling prices with higher domestic and export prices and 3.6% higher steel shipments. In the second half of 2022, sales decreased 9.6% to $6.4 billion as compared to $7.1 billion for the second half of 2021, driven by a 6.6% decrease in shipments and 2.8% decrease in average steel selling prices.
Operating income
Operating income for the Brazil segment was $1.5 billion for the year ended December 31, 2023, representing a 47.3% decrease as compared to the year ended December 31, 2022, primarily due to a negative price-cost effect and the impact of the devaluation of the Argentinian peso offset in part by the contribution from ArcelorMittal Pecém. Operating income in the first half of 2023 was $876 million as compared to $1,875 million in the first half of 2022. Operating income decreased 53.3% primarily driven by negative price-cost effect, partly offset by higher steel shipments (including the contribution from ArcelorMittal Pecém). Operating income decreased 35.0% to $585 million in the second half of 2023 from $901 million in the second half of 2022, mainly due to a negative price-cost effect,
and the impact of the devaluation of the Argentinian peso, partially offset by the contribution from ArcelorMittal Pecém.
Operating income for the Brazil segment was $2.8 billion for the year ended December 31, 2022, representing a 26.9% decrease as compared to the year ended December 31, 2021 as a result of negative factors in the second half of 2022 as described below. Operating income in the first half of 2022 was $1,875 million as compared to $1,742 million in the first half of 2021, primarily driven by higher steel shipments, partly offset by the negative mix effect of a higher share of exports, and a gain of $0.2 billion related to PIS/COFINS tax credits related to scrap purchases for prior periods. Operating income in the second half of 2022 was $901 million as compared to $2,056 million in the second half of 2021, mainly due to a negative price-cost effect and lower shipments.
| Europe | |||||||||||||||||
| Performance for the year ended December 31, | |||||||||||||||||
| (in millions of USD unless otherwise shown) | 2023 | 2022 | 2021 | ||||||||||||||
| Sales | 38,305 | 47,263 | 43,334 | ||||||||||||||
| Depreciation | (1,241) | (1,268) | (1,252) | ||||||||||||||
Net impairment reversal | — | — | 218 | ||||||||||||||
Operating income | 1,104 | 4,292 | 5,672 | ||||||||||||||
| Crude steel production (thousand tonnes) | 28,827 | 31,904 | 36,795 | ||||||||||||||
| Flat product shipments | 19,570 | 21,387 | 23,485 | ||||||||||||||
| Long product shipments | 8,001 | 8,321 | 9,236 | ||||||||||||||
| Others and eliminations | 500 | 474 | 461 | ||||||||||||||
| Total steel shipments (thousand tonnes) | 28,071 | 30,182 | 33,182 | ||||||||||||||
| Average steel selling price (USD/tonne) | 1,039 | 1,191 | 986 | ||||||||||||||
Crude steel production, steel shipments and average steel selling price
Crude steel production for the Europe segment decreased 9.6% to 28.8 million tonnes for the year ended December 31, 2023 as compared to 31.9 million tonnes for the year ended December 31, 2022, mainly due to lower demand and outages of blast furnaces. In the first quarter of 2023, the Company gradually restarted previously curtailed crude steel capacity to meet demand as apparent demand conditions improved following the aggressive destock in the second half of 2022 but in late March 2023, the Company was impacted by incidents that temporarily disabled blast furnaces at Gijón, Spain (blast furnace A) and at Dunkirk, France (blast furnace #4). These blast furnaces were restarted in mid-July 2023 but crude steel production was still negatively impacted by slow ramp up in third quarter of 2023. Crude steel production in the fourth quarter of 2023 was negatively impacted by a reline of blast furnace A at Ghent (Belgium) and planned maintenance of blast furnace #2 at
157
| Management report | ||
Bremen (Germany), both of which restarted in early December 2023, and production cuts at blast furnace #1 in Fos-sur-Mer (France). Crude steel production decreased 13.1% to 14.7 million tonnes in the first half of 2023 from 16.9 million tonnes in the first half of 2022 and 5.7% to 14.1 million tonnes in the second half of 2023 from 15.0 million tonnes in the second half of 2022 for the above-mentioned reasons.
Crude steel production for the Europe segment decreased 13.3% to 31.9 million tonnes for the year ended December 31, 2022 as compared to 36.8 million tonnes for the year ended December 31, 2021, mainly due to significantly lower apparent demand driven by destocking and adjustment of production in line with demand as a consequence, and the impact of the deconsolidation of ArcelorMittal Italia as described below. Crude steel production decreased 11.2% to 16.9 million tonnes in the first half of 2022 from 19.1 million tonnes in the first half of 2021. Operations relating to ArcelorMittal Italia were included until April 14, 2021 and then accounted for under the equity method following the formation of a public-private partnership (renamed Acciaierie d’Italia) between Invitalia and ArcelorMittal. Excluding the impact of the Acciaierie d’Italia deconsolidation, steel production in the Europe segment in the first half of 2022 decreased by 5.4% compared to the first half of 2021, due to the adjustment of production following the decline in apparent demand and the impact of responses to higher energy prices. Crude steel production decreased 15.6% to 15.0 million tonnes in the second half of 2022 from 17.7 million tonnes in the second half of 2021. Given the weaker macroeconomic conditions and order book, high energy and carbon costs and rising imports, during the third and fourth quarters of 2022, the Company curtailed production and temporarily idled steel making and finishing asset in France, Spain, Germany and Poland to bring supply in line with addressable demand. As apparent demand conditions were showing signs of improvement early 2023, the Company gradually restarted capacity.
Steel shipments were 28.1 million tonnes for the year ended December 31, 2023, representing a 7.0% decrease from steel shipments of 30.2 million tonnes for the year ended December 31, 2022, primarily due to lower production as discussed above and weaker demand (including weaker construction-related demand). Steel shipments decreased 7.8% to 15.0 million tonnes in the first half of 2023, from 16.3 million tonnes in the first half of 2022 mainly due to lower production as discussed above and weaker demand. Steel shipments decreased 6.0% in the second half of 2023 compared to the second half of 2022, primarily due to curtailed production in light of continued weak apparent demand driven by destocking and construction-related demand.
Steel shipments were 30.2 million tonnes for the year ended December 31, 2022, representing a 9.0% decrease from steel shipments of 33.2 million for the year ended December 31, 2021. Excluding the impact of Acciaierie d'Italia, shipments decreased 6.1% as compared to 2021. Steel shipments decreased 5.8% to 16.3 million tonnes in the first half of 2022, from 17.3 million tonnes in the first half of 2021 mainly due to the deconsolidation of ArcelorMittal Italia as described above. Excluding the impact of the Acciaierie d’Italia deconsolidation, steel shipments in Europe segment remained stable. Steel shipments decreased 12.6% in the second half of 2022 compared to the second half of 2021, primarily due to weaker apparent demand, as discussed earlier.
Average steel selling prices decreased 12.7% for the year ended December 31, 2023 as compared to the year ended December 31, 2022. Average steel selling prices decreased 14.2% in the first half of 2023 as compared to the first half of 2022 in line with the trend in market prices. Average steel selling prices decreased by 10.8% during the second half of 2023 as compared to the second half of 2022, in line with the trend in market prices.
Average steel selling prices increased 20.8% for the year ended December 31, 2022 as compared to the year ended December 31, 2021. Average steel selling prices increased 42.9% during the first half of 2022 as compared to the first half of 2021 in line with the trend in market prices and supported by the positive impact of annual contract price resets, offset in part by a negative translation impact due to euro depreciation. Average steel selling prices increased marginally by 1.3% during the second half of 2022 as compared to the second half of 2021.
Sales
Sales in the Europe segment were $38.3 billion for the year ended December 31, 2023, representing a 19.0% decrease as compared to sales of $47.3 billion for the year ended December 31, 2022, primarily due to a 12.7% decrease in average steel selling prices and 7.0% lower steel shipments. In the first half of 2023, sales decreased by 19.1% to $21.4 billion as compared to $26.5 billion in the first half of 2022, primarily due to a 14.2% decrease in average steel selling prices and 7.8% lower steel shipments. In the second half of 2023, sales decreased by 18.7% to $16.9 billion as compared to $20.8 billion in the second half of 2022, primarily due to a 10.8% decrease in average steel selling prices and 6.0% lower steel shipments.
158
| Management report | ||
Sales in the Europe segment were $47.3 billion for the year ended December 31, 2022, representing a 9.1% increase as compared to sales of $43.3 billion for the year ended December 31, 2021, primarily due to a 20.8% increase in average steel selling prices offset in part by 9.0% decrease in steel shipments. In the first half of 2022, sales increased by 32.3% to $26.5 billion as compared to $20.0 billion in the first half of 2021. In the second half of 2022, sales decreased by 10.9% to $20.8 billion as compared to $23.3 billion in the second half of 2021.
Operating income
Operating income for the Europe segment for the year ended December 31, 2023 was $1,104 million as compared to operating income of $4,292 million for the year ended December 31, 2022. Operating income was lower in 2023 primarily due to a negative price-cost effect and lower shipments offset in part by lower energy costs. Operating income was $933 million for the first half of 2023 as compared to $4,144 million for the first half of 2022, primarily due to a negative price-cost effect and lower shipments offset in part by lower energy costs. Operating income was marginally higher at $171 million for the second half of 2023 as compared to $148 million for the second half of 2022, which had been impacted by $0.5 billion inventory-related charges.
Operating income for the Europe segment for the year ended December 31, 2022 was $4.3 billion as compared to operating income of $5.7 billion for the year ended December 31, 2021. Operating income was lower in 2022 mainly due to lower shipments, higher coal and energy costs, inventory related charges of $0.5 billion and a negative translation impact due to euro depreciation, partly offset by higher selling prices. Operating income was $4.1 billion for the first half of 2022 as compared to $1.9 billion for the first half of 2021, primarily due to a positive price-cost effect, including the impact of annual contract pricing resets, partly offset by a negative translation effect due to euro depreciation. Operating income decreased to $0.2 billion for the second half of 2022 (with an operating loss in the fourth quarter of 2022) as compared to $3.8 billion for the second half of 2021 primarily due to a negative price cost-effect, lower shipments, inventory related charges of $0.5 billion in the third quarter of 2022 (to reflect the net realizable value of inventory due to declining market prices in Europe), and higher energy costs. Operating income for the second half of 2021 also included impairment reversal of $218 million and provision for early retirement of $55 million.
| ACIS | |||||||||||||||||
| Performance for the year ended December 31, | |||||||||||||||||
| (in millions of USD unless otherwise shown) | 2023 | 2022 | 2021 | ||||||||||||||
| Sales | 5,422 | 6,368 | 9,854 | ||||||||||||||
| Depreciation | (278) | (369) | (450) | ||||||||||||||
| Impairment | (1,038) | (1,026) | — | ||||||||||||||
Operating (loss) income | (3,021) | (930) | 2,705 | ||||||||||||||
| Crude steel production (thousand tonnes) | 6,527 | 6,949 | 11,366 | ||||||||||||||
| CIS | 3,615 | 4,221 | 7,883 | ||||||||||||||
| Africa | 2,412 | 2,160 | 2,473 | ||||||||||||||
| Others and eliminations | (9) | (3) | 4 | ||||||||||||||
| Steel shipments (thousand tonnes) | 6,018 | 6,378 | 10,360 | ||||||||||||||
| Average steel selling price (USD/tonne) | 706 | 817 | 780 | ||||||||||||||
Crude steel production, steel shipments and average steel selling price
On December 7, 2023, the Company completed the sale of ArcelorMittal Temirtau (its Kazakhstan steel and mining operations) to QIC.
Crude steel production for the ACIS segment decreased 6.1% to 6.5 million tonnes for the year ended December 31, 2023 from 6.9 million tonnes for the year ended December 31, 2022. On a scope adjusted basis, i.e. excluding Kazakhstan, steel production increased by 3.9% in 2023 as compared to 2022. In the first half of 2023, crude steel production decreased 12.4% to 3.3 million tonnes as compared to 3.7 million tonnes in the first half of 2022, primarily due to lower steel production in Ukraine driven by the ongoing war. In the second half of 2023, crude steel production marginally increased 1.3% to 3.3 million tonnes as compared to 3.2 million tonnes in the second half of 2022, primarily due to increased production in Ukraine offset in part by the effect of the sale of ArcelorMittal Temirtau operations. On a scope adjusted basis, i.e. excluding Kazakhstan, steel production increased by 21% in the second half of 2023 as
159
| Management report | ||
compared to the second half of 2022, mainly due to the increased production in Ukraine.
Crude steel production for the ACIS segment decreased 38.9% to 6.9 million tonnes for the year ended December 31, 2022 from 11.4 million tonnes for the year ended December 31, 2021. In the first half of 2022, crude steel production decreased 34.4% to 3.7 million tonnes as compared to 5.7 million tonnes in the first half of 2021, primarily due to the ongoing reduction of production in Ukraine. At the onset of the war in Ukraine, the Company suspended operations to protect people and assets. Since then, the Company slowly restarted operations, and has been operating one of three blast furnaces. Blast furnace No.6 (approximately 20% of AMKR capacity) was restarted on April 11, 2022 (to resume low levels of pig iron production). Iron ore production was approximately at 55% of capacity during the first half of 2022. Furthermore, the second quarter of 2022 was also impacted by a two-week labor action and logistic issues in South Africa.
In the second half of 2022, crude steel production decreased 43.4% to 3.2 million tonnes from 5.7 million tonnes in the second half of 2021. Apart from the impact of lower crude steel production in Ukraine due to the ongoing conflict, the second half of 2022 was also impacted by power availability in Kazakhstan and planned maintenance in South Africa. During the third quarter of 2022, iron ore production in Ukraine was temporarily suspended due to weaker demand and logistic constraints and then restarted in early October 2022 at approximately 25% level.
Steel shipments for the year ended December 31, 2023 decreased by 5.7% to 6.0 million tonnes as compared to 6.4 million tonnes for the year ended December 31, 2022. On a scope adjusted basis, i.e. excluding Kazakhstan, steel shipments increased by 1.9% in 2023 as compared to 2022. In the first half of 2023, steel shipments in the ACIS segment decreased 8.9% to 3.0 million tonnes from 3.3 million tonnes for the first half of 2022, primarily due to the ongoing war in Ukraine. In the second half of 2023, steel shipments marginally decreased by 2.2% to 3.0 million tonnes from 3.1 million tonnes for the second half of 2022, primarily due to the sale of ArcelorMittal Temirtau.
Steel shipments for the year ended December 31, 2022 decreased by 38.4% to 6.4 million tonnes as compared to 10.4 million tonnes for the year ended December 31, 2021, due to lower production for the above-mentioned reasons. In the first half of 2022, steel shipments in the ACIS segment decreased 39.0% to 3.3 million tonnes from 5.4 million tonnes for the first half of 2021. In the second half of 2022, steel shipments decreased to 3.1 million tonnes from 5.0 million tonnes for the second half of 2021.
Average steel selling prices decreased 13.6% for the year ended December 31, 2023 as compared to the year ended December 31, 2022 in line with the market trends. Average steel selling prices decreased 16.7% and 9.3% in the first and second half of 2023 as compared to the first and second half of 2022, respectively.
Average steel selling prices increased 4.7% for the year ended December 31, 2022 as compared to the year ended December 31, 2021 in line with the higher market prices during the first half of 2022. Average steel selling prices increased 20.7% and decreased 10.4% in the first and second half of 2022 as compared to the first and second half of 2021, respectively.
Sales
Sales in the ACIS segment were $5.4 billion for the year ended December 31, 2023, representing a 14.9% decrease as compared to the year ended December 31, 2022, primarily due to a 5.7% decrease in steel shipments due to the ongoing war in Ukraine and the sale of ArcelorMittal Temirtau operations as discussed above and 13.6% lower average steel selling prices. In the first half of 2023, sales decreased 20.6% to $2.8 billion as compared to $3.6 billion in the first half of 2022, primarily due to 8.9% lower steel shipments and 16.7% lower average steel selling prices. In the second half of 2023, sales decreased by 7.5% to $2.6 billion as compared to $2.8 billion in the second half of 2022 primarily due to 9.3% lower average steel selling prices.
Sales in the ACIS segment were $6.4 billion for the year ended December 31, 2022, representing a 35.4% decrease as compared to the year ended December 31, 2021, primarily due to a 38.4% decrease in steel shipments due to the ongoing war in Ukraine. In the first half of 2022, sales decreased by 27.1% to $3.6 billion as compared to $4.9 billion in the first half of 2021. In the second half of 2022, sales decreased by 43.6% to $2.8 billion as compared to $5.0 billion in the second half of 2021.
Operating (loss) income
Operating loss for the ACIS segment was $3.0 billion for the year ended December 31, 2023 as compared to $0.9 billion for the year ended December 31, 2022. Besides the continuing impact of the conflict between Russia and Ukraine, lower average steel selling prices and lower steel shipments, operating loss for the year ended December 31, 2023 included a $2.4 billion charge relating to the disposal on December 7, 2023 of ArcelorMittal Temirtau, the Company's steel and mining operations in Kazakhstan, including $0.7 billion of impairment of property, plant and equipment, $0.2 billion impairment of ACIS goodwill (see note 5.3 to the consolidated financial statements) and $1.5 billion cumulative foreign exchange translation losses (previously recognized in equity) recycled through the consolidated statements of operations. Operating loss for the year ended December 31, 2023 also included $0.1 billion
160
| Management report | ||
impairment with respect to the Long operations of ArcelorMittal South Africa (see note 5.3 to the consolidated financial statements). Operating loss for the first half of 2023 was $0.2 billion as compared to operating income of $0.3 billion for the first half of 2022, primarily due to lower steel shipments, lower average steel selling prices and the impact of the war in Ukraine. In the second half of 2023, operating loss of the ACIS segment amounting to $2.8 billion included the above-mentioned charges related to ArcelorMittal Temirtau and the Long business of ArcelorMittal South Africa, as compared to operating loss of $1.3 billion for the second half of 2022 (which was negatively impacted by a $1.0 billion impairment charge relating to ArcelorMittal Kryviy Rih’s property, plant and equipment and intangibles, as described below).
Operating loss for the ACIS segment was $0.9 billion for the year ended December 31, 2022 as compared to $2.7 billion operating income for the year ended December 31, 2021. Besides the impact of the Russia-Ukraine conflict, lower steel shipments and a negative price-cost effect, operating loss in 2022 was also negatively impacted by a $1.0 billion impairment charge relating to ArcelorMittal Kryviy Rih’s property, plant and equipment and intangibles due to the decrease in value in use resulting from the significant uncertainty about the evolution of the geopolitical context in Ukraine and therefore the timing and ability of the Company to resume operations to a normal level. Operating income for the first half of 2022 decreased to $0.3 billion as compared to $1.5 billion for the first half of 2021, primarily due to the impact of the Russia-Ukraine conflict, lower steel shipments and higher costs. In the second half of 2022, operating loss of the ACIS segment amounted to $1.3 billion including the above-mentioned impairment charge as compared to operating income of $1.2 billion for the second half of 2021, impacted by the same factors that drove the decline in the first half of 2022.
| Mining | ||||||||||||||||||||
| Performance for the year ended December 31, | ||||||||||||||||||||
| (in millions of USD unless otherwise shown) | 2023 | 2022 | 2021 | |||||||||||||||||
| Sales | 3,077 | 3,396 | 4,045 | |||||||||||||||||
| Depreciation | (238) | (234) | (228) | |||||||||||||||||
| Operating income | 1,144 | 1,483 | 2,371 | |||||||||||||||||
| Iron ore production (million tonnes) | 26.0 | 28.6 | 26.2 | |||||||||||||||||
| Iron ore shipments (million tonnes) | 26.4 | 28.0 | 26.0 | |||||||||||||||||
| Note | For the year ended December 31, | |||||||||||||||||||
| Iron ore production (million metric tonnes) | 1 | Type | Product | 2023 | 2022 | 2021 | ||||||||||||||
| AMMC | Open pit | Concentrate, lump, fines and pellets | 22.4 | 24.2 | 22.0 | |||||||||||||||
| AML | Open pit / Underground | Fines | 3.6 | 4.4 | 4.2 | |||||||||||||||
| Total iron ore production | 26.0 | 28.6 | 26.2 | |||||||||||||||||
1.Total of all finished production of fines, concentrate, pellets and lumps.
Production
The Mining segment had iron ore production of 26.0 million tonnes for the year ended December 31, 2023, a 9.1% decrease compared to the year ended December 31, 2022. Iron ore production of 13.1 million tonnes decreased 7.9% for the first half of 2023 compared to 14.2 million tonnes in the first half of 2022 reflecting primarily lower iron ore production in AMMC due to unplanned maintenance. Iron ore production decreased 10.6% in the second half of 2023 compared to the second half of 2022 primarily due to lower production in Liberia where the rail operations were severely impacted by damages to a rail bridge in early November 2023.
The Mining segment had iron ore production of 28.6 million tonnes for the year ended December 31, 2022, a 9.1% increase compared to the year ended December 31, 2021. Iron ore production of 14.2 million tonnes increased 16.9% for the first half of 2022 compared to 12.2 million tonnes in the first half of 2021 primarily as a result of recovery in the second quarter of 2022 of production in AMMC following seasonally lower production driven by severe weather conditions in the first quarter of 2022, while the second quarter of 2021 had been negatively impacted by a four week labor action at AMMC. Iron ore production increased 3.1% in the second half of 2022 compared to the second half of 2021, which had been negatively impacted by locomotive incidents in Liberia.
Sales
Sales in the Mining segment were $3.1 billion for the year ended December 31, 2023, representing a 9.4% decrease as compared to $3.4 billion for the year ended December 31, 2022 as a result of 5.8% decrease in shipments following above-mentioned lower production. Sales in the first half of 2023 decreased 18.3% to $1.6 billion compared to $1.9 billion for the same period in 2022 primarily due to 15.6% lower iron ore reference prices and 1.9% lower iron ore shipments. Sales in the second half of 2023 and 2022 remain stable at $1.5 billion as the increase in iron ore reference prices was largely offset by lower shipments.
161
| Management report | ||
Sales in the Mining segment were $3.4 billion for the year ended December 31, 2022, representing a 16.0% decrease as compared to $4.0 billion for the year ended December 31, 2021. Sales in the first half of 2022 decreased 6.3% to $1.9 billion compared to $2.1 billion for the same period in 2021 primarily due to 24.1% lower iron ore reference prices partly offset by 18.7% higher iron ore shipments. Sales in the second half of 2022 were 26.3% lower at $1.5 billion compared to $2.0 billion for the same period in 2021, largely reflecting the effect of lower iron ore reference prices and lower shipments at AMMC due to adverse affects of exceptionally heavy rains in September 2022 and poor weather conditions in December 2022, offset by a recovery in Liberia, which was impacted by rail incidents in the second half of 2021.
Sales to external customers were $1.2 billion for the year ended December 31, 2023, representing a decrease of 10.3% as compared to the year ended December 31, 2022 due to lower selling prices.
Iron ore shipments to external customers were 10.0 million tonnes for the year ended December 31, 2023, representing an 8.4% decrease as compared to 10.9 million tonnes for the year ended December 31, 2022, primarily due to lower production in AMMC and Liberia.
Sales to external customers were $1.3 billion for the year ended December 31, 2022, representing a decrease of 20.4% as compared to the year ended December 31, 2021 due to lower selling prices partly offset by higher shipments.
Iron ore shipments to external customers were 10.9 million tonnes for the year ended December 31, 2022, representing an increase of 7.7% as compared to 10.1 million tonnes for the year ended December 31, 2021, primarily driven by higher shipments from AMMC.
The average reference iron ore price was $119.5 per tonne in 2023, $120.3 per tonne in 2022 and $159.9 per tonne in 2021 (delivered to China, normalized to Qingdao and 62% Fe US $ per tonne, Metal Bulletin). However, there may not be a direct correlation between reference prices and actual selling prices in various regions at a given time. See also quarterly reference prices in "Raw materials" above.
Operating income
Operating income for the Mining segment was 22.9% lower at $1,144 million for the year ended December 31, 2023 as compared to $1,483 million for the year ended December 31, 2022, primarily driven by lower quality premia, lower shipments and higher costs partly offset by lower freight. Operating income decreased to $599 million in the first half of 2023 compared to $974 million in the first half of 2022, primarily due to lower seaborne iron ore reference prices, lower shipments as
discussed above and lower quality premia partially offset by lower freight costs. Operating income increased by 7.1% to $545 million in the second half of 2023 as compared to $509 million in the second half of 2022 primarily due to 19.9% higher seaborne iron ore prices in the second half of 2023 compared to the second half of 2022, offset in part by lower shipments and lower quality premia.
Operating income for the Mining segment was 37.5% lower at $1.5 billion for the year ended December 31, 2022 as compared to $2.4 billion for the year ended December 31, 2021, primarily driven by the decrease in iron ore reference prices, partly offset by higher quality premia, lower freight costs and higher shipments. Operating income decreased to $1.0 billion in the first half of 2022 compared to $1.3 billion in the first half of 2021, primarily due to lower seaborne iron ore reference prices and higher freight costs, partly offset by higher shipments as discussed above and higher quality premia. Operating income decreased to $0.5 billion in the second half of 2022 as compared to $1.1 billion in the second half of 2021 primarily due to lower iron ore reference prices, lower quality premia and lower shipments partly offset by lower freight costs.
Income or loss from and impairments of investments in associates, joint ventures and other investments
Income from investments in associates, joint ventures and other investments was relatively stable at $1.2 billion for the year ended December 31, 2023, compared to $1.3 billion for the year ended December 31, 2022.
Income from investments in associates, joint ventures and other investments benefited from higher contributions from AMNS India and Chinese investees in 2023. Income from investments in associates, joint ventures and other investments included the annual dividend from Erdemir of $117 million in 2022, with no such dividend received in 2023.
Income from investments in associates, joint ventures and other investments was lower at $711 million for the first half of 2023, as compared to $1,137 million for the first half of 2022, primarily due to lower contributions from AMNS Calvert and European investees, which experienced similar dynamics to those affecting the Company, partially offset by the higher contribution from AMNS India.
AMNS India
AMNS India production increased by 11.5% from 6.7 million tonnes in 2022 to 7.5 million tonnes in 2023 and shipments increased by 12.1% from 6.5 million tonnes in 2022 to 7.3 million tonnes in 2023. Crude steel production and steel shipments of AMNS India increased by 4.7% and 8.2%, respectively, from 3.4 million tonnes in the first half of 2022 to 3.6 million tonnes in the first half of 2023 and from 3.2 million tonnes in the first half of 2022 to 3.5 million tonnes in the first
162
| Management report | ||
half of 2023, respectively. Crude steel production and steel shipments of AMNS India increased by 18.8% and 15.7%, respectively, from 3.3 million tonnes in the second half of 2022 to 3.9 million tonnes in the second half of 2023 and from 3.2 million tonnes in the second half of 2022 to 3.7 million tonnes in the second half of 2023, respectively. AMNS India’s results in the second half of 2023 also reflected the unwinding of a natural gas hedges.
AMNS Calvert
Hot strip mill production1 for AMNS Calvert increased by 7.7% from 4.3 million tonnes in 2022 to 4.7 million tonnes in 2023 and shipments2 increased by 5.7% from 4.2 million tonnes in 2022 to 4.5 million tonnes in 2023. AMNS Calvert's production1 increased by 7.7% from 2.3 million tonnes in the first half of 2022 to 2.4 million tonnes in the first half of 2023 while steel shipments2 remained stable at 2.3 million tonnes in the first half of 2022 and 2023. AMNS Calvert is constructing a new 1.5 million tonnes EAF and caster whose estimated completion has been extended to the second half of 2024 (previously second half of 2023) largely due to enlarged scope and inflation. The joint venture is to invest approximately $1 billion. An option to add a further 1.5 million tonnes EAF at lower capital expenditure intensity is being studied. AMNS Calvert's production1 increased by 7.8% from 2.1 million tonnes in the second half of 2022 to 2.2 million tonnes in the second half of 2023 while steel shipments2 increased by 10.7% from 1.9 million tonnes in the second half of 2022 to 2.1 million tonnes in the second half of 2023. Increased production and shipments were due to improved demand conditions. AMNS Calvert’s results were negatively impacted in the second half of 2023 by negative price cost effect, weaker product mix and higher maintenance costs.
Income in the first half of 2022 included also the annual dividend received from Erdemir of $117 million with no such dividend received in the first half of 2023. Income from investments in associates, joint ventures and other investments was higher at $473 million for the second half of 2023, as compared to $180 million for the second half of 2022, primarily due to higher contributions from AMNS India and Chineese investees, partially offset by the lower contribution from European investees.
Income from investments in associates, joint ventures and other investments was $1.3 billion for the year ended December 31, 2022, compared to $2.2 billion for the year ended December 31, 2021. Income in 2022 was lower mainly due to the lower contributions from AMNS India and AMNS Calvert.
AMNS India
AMNS India production decreased by 9.6% from 7.4 million tonnes in 2021 to 6.7 million tonnes in 2022 and shipments decreased by 6.4% from 6.9 million tonnes in 2021 to 6.5 million tonnes in 2022. AMNS India's crude steel production and steel shipments decreased by 7.0% and 5.3%, respectively, from 3.7
million tonnes in the first half of 2021 to 3.4 million tonnes in the first half of 2022 and from 3.4 million tonnes in the first half of 2021 to 3.2 million tonnes in the first half of 2022, respectively. AMNS India's operating income was negatively impacted by the introduction of the export duty during the second quarter of 2022 despite the positive contribution from external sale of pellets from the newly commissioned Odisha plant during the second quarter of 2022. AMNS India's crude steel production and steel shipments decreased by 12.1% and 7.7%, respectively, from 3.7 million tonnes in the second half of 2021 to 3.3 million tonnes in the second half of 2022 and from 3.5 million tonnes in the second half of 2021 to 3.2 million tonnes in the second half of 2022, respectively. AMNS india production in the second half of 2022 was impacted by planned maintenance and lower exports following the imposition of export duties on steel exports from India in the second quarter of 2022 (export duties removed from the end of November 2022).
AMNS Calvert
Hot strip mill production1 for AMNS Calvert decreased by 10.0% from 4.8 million tonnes in 2021 to 4.3 million tonnes in 2022 and shipments2 decreased by 7.0% from 4.5 million tonnes in 2021 to 4.2 million tonnes in 2022. AMNS Calvert's hot strip mill production1 decreased by 9.8% from 2.5 million tonnes in the first half of 2021 to 2.3 million tonnes in the first half of 2022 while steel shipments2 remained stable at 2.3 million tonnes in the first half of 2021 and 2022. During the third quarter of 2022, AMNS Calvert was impacted by a negative price-cost effect and with lagged cost of slab inventory that does not reflect prevailing slab market prices. AMNS Calvert's hot strip mill production1 decreased by 10.3% from 2.3 million tonnes in the second half of 2021 to 2.1 million tonnes in the second half of 2022 following a planned maintenance in the second half of 2022. Steel shipments2 decreased by 14.2% from 2.3 million tonnes in the second half of 2021 to 1.9 million tonnes in the second half of 2022, due to the reason discussed above.
Income in 2022 was positively impacted by the higher contribution from European investees (including $0.1 billion income for Acciaierie d'Italia arising from recognition of a deferred tax asset in the second quarter of 2022). Income from investments in associates, joint ventures and other investments in 2022 also included $117 million annual dividend received from Erdemir as compared to $89 million in 2021.
Income in the first half of 2022 included improved contribution from European investees (including $0.1 billion income for Acciaierie D'Italia arising from recognition of a deferred tax asset in the second quarter of 2022) offset in part by lower contributions from AMNS India.
Income in the first half of 2022 included also the annual dividend received from Erdemir of $117 million as compared to $89 million in the first half of 2021. Income in the second half of 2022
163
| Management report | ||
was lower on account of lower contributions from AMNS India, AMNS Calvert and European investees offset in part by improved contributions from Chinese investees in the fourth quarter of 2022. During the third quarter of 2022, European investees were impacted by a negative price-cost effects.
1.Production: all production of the hot strip mill including processing of slabs on a hire work basis for ArcelorMittal group entities and third parties, including stainless steel slabs.
2.Shipments: all shipments including shipments of finished products processed on a hire work basis for ArcelorMittal group entities and third parties, including stainless steel products.
Impairments of investments in joint ventures, associates and other investments were $1.4 billion in the year ended December 31, 2023 with respect to Acciaierie d'Italia due to a downward revision of expected future cash flows together with the uncertainty regarding its future, see also note 2.3 to consolidated financial statements. No such impairments were recorded in 2022 or 2021.
Financing costs-net
Financing costs-net include net interest expense, revaluation of financial instruments, net foreign exchange income/expense (i.e., the net effects of transactions in a foreign currency other than the functional currency of a subsidiary) and other net financing costs (which mainly include bank fees, accretion of defined benefit obligations and other long-term liabilities).
Net financing costs were lower at $0.9 billion for the year ended December 31, 2023 as compared to $0.3 billion for the year ended December 31, 2022. Net interest expense (interest expense less interest income) was lower at $145 million for the year ended December 31, 2023 as compared to $213 million for the year ended December 31, 2022, due to higher interest income in Argentina from investments in currency-protected funds.
Foreign exchange losses were $48 million as compared to foreign exchange gains of $191 million for the years ended December 31, 2023 and 2022, respectively.
Other net financing costs (including expenses related to true sale of receivables ("TSR"), bank fees, interest on pensions and fair value adjustments of the call option of the mandatorily convertible bond and derivative instruments) were $0.7 billion for the year ended December 31, 2023 compared to $0.3 billion for the year ended December 31, 2022. 2022 included mark-to-market losses related to the mandatory convertible bond call option totaling $16 million.
Net financing costs were lower at $0.3 billion for the year ended December 31, 2022 as compared to $1.2 billion for the year
ended December 31, 2021. Net interest expense (interest expense less interest income) was lower at $213 million for the year ended December 31, 2022 as compared to $278 million for the year ended December 31, 2021, due to higher interest income, although net interest expense increased in the fourth quarter of 2022 compared to the third quarter of 2022, due to the issuance in the third and fourth quarters of 2022 of new bonds bearing higher interest rates.
Foreign exchange losses were $48 million as compared to foreign exchange gains of $191 million and foreign exchange losses of $155 million for the years ended December 31, 2023, 2022 and 2021, respectively.
Other net financing costs (including expenses related to true sale of receivables, bank fees, interest on pensions and fair value adjustments of the call option of the mandatorily convertible bond and derivative instruments) were $0.3 billion for the year ended December 31, 2022 compared to $0.7 billion for the year ended December 31, 2021, and included mark-to-market losses related to the mandatory convertible bond call option totaling $16 million as compared to $44 million for the year ended December 31, 2021.
Income tax expense (benefit)
ArcelorMittal recorded an income tax expense of $0.2 billion for the year ended December 31, 2023 as compared to $1.7 billion for the year ended December 31, 2022 reflecting overall lower taxable income. See note 10.1 to the consolidated financial statements.
ArcelorMittal recorded an income tax expense of $1.7 billion for the year ended December 31, 2022 as compared to $2.5 billion for the year ended December 31, 2021 reflecting overall lower taxable income.
ArcelorMittal’s consolidated income tax expense (benefit) is affected by the income tax laws and regulations in effect in the various countries in which it operates and the pre-tax results of its subsidiaries in each of these countries, which can change from year to year. ArcelorMittal operates in jurisdictions, mainly in Eastern Europe and Asia, which have a structurally lower corporate income tax rate than the statutory tax rate as enacted in Luxembourg (24.94%), as well as in jurisdictions, mainly in Brazil and Mexico, which have a structurally higher corporate income tax rate.
164
| Management report | ||
The statutory income tax expense (benefit) and the statutory income tax rates of the countries that most significantly resulted in the tax expense (benefit) at statutory rate for each of the years ended December 31, 2023, 2022 and 2021 are as set forth below:
| 2023 | 2022 | 2021 | |||||||||||||||||||||||||||||||||
| Statutory income tax | Statutory income tax rate | Statutory income tax | Statutory income tax rate | Statutory income tax | Statutory income tax rate | ||||||||||||||||||||||||||||||
| Argentina | 80 | 35.00 | % | 100 | 35.00 | % | 103 | 35.00 | % | ||||||||||||||||||||||||||
| Belgium | (12) | 25.00 | % | 238 | 25.00 | % | 149 | 25.00 | % | ||||||||||||||||||||||||||
| Brazil | 153 | 34.00 | % | 698 | 34.00 | % | 943 | 34.00 | % | ||||||||||||||||||||||||||
| Canada | 470 | 25.90 | % | 747 | 25.90 | % | 835 | 25.90 | % | ||||||||||||||||||||||||||
| France | (116) | 25.82 | % | 158 | 25.82 | % | 231 | 25.82 | % | ||||||||||||||||||||||||||
| Germany | (154) | 30.30 | % | 82 | 30.30 | % | 134 | 30.30 | % | ||||||||||||||||||||||||||
| Italy | 3 | 24.00 | % | (14) | 24.00 | % | (8) | 24.00 | % | ||||||||||||||||||||||||||
| Kazakhstan | (69) | 20.00 | % | 26 | 20.00 | % | 149 | 20.00 | % | ||||||||||||||||||||||||||
| Liberia | (18) | 25.00 | % | — | 25.00 | % | 16 | 25.00 | % | ||||||||||||||||||||||||||
| Luxembourg | 806 | 24.94 | % | 633 | 24.94 | % | 660 | 24.94 | % | ||||||||||||||||||||||||||
| Mexico | 49 | 30.00 | % | 148 | 30.00 | % | 238 | 30.00 | % | ||||||||||||||||||||||||||
The Netherlands | (627) | 25.80 | % | (9) | 25.80 | % | (13) | 25.80 | % | ||||||||||||||||||||||||||
| Poland | (71) | 19.00 | % | 49 | 19.00 | % | 155 | 19.00 | % | ||||||||||||||||||||||||||
| South Africa | (58) | 27.00 | % | 47 | 27.00 | % | 136 | 28.00 | % | ||||||||||||||||||||||||||
| Spain | (1) | 25.00 | % | 26 | 25.00 | % | 70 | 25.00 | % | ||||||||||||||||||||||||||
| Ukraine | (56) | 18.00 | % | (267) | 18.00 | % | 202 | 18.00 | % | ||||||||||||||||||||||||||
| United States | 83 | 21.00 | % | 103 | 21.00 | % | 58 | 21.00 | % | ||||||||||||||||||||||||||
| Others | (8) | 53 | 88 | ||||||||||||||||||||||||||||||||
| Total | 454 | 2,818 | 4,146 | ||||||||||||||||||||||||||||||||
Note: The statutory tax rates are the (future) rates enacted or substantively enacted by the end of the respective period.
Non-controlling interests
Net income attributable to non-controlling interests was $103 million, $236 million and $609 million for the years ended December 31, 2023, 2022 and 2021, respectively. Net income attributable to non-controlling interests decreased in 2023 compared to 2022 and in 2022 compared to 2021 primarily as a result of lower operating performance.
Net income attributable to equity holders of the parent
ArcelorMittal’s net income attributable to equity holders of the parent was $0.9 billion, $9.3 billion and $15.0 billion for the years ended December 31, 2023, 2022 and 2021, respectively.
Liquidity and capital resources
ArcelorMittal’s principal sources of liquidity are cash generated from its operations and its credit facilities at the corporate level.
Because ArcelorMittal is a holding company, it is dependent upon the earnings and cash flows of, as well as dividends and distributions from, its operating subsidiaries to pay expenses and meet its debt service obligations. Cash and cash equivalents are primarily centralized at the parent level and are managed by ArcelorMittal Treasury SNC, although from time to
time cash or cash equivalent balances may be held at the Company’s international subsidiaries or its holding companies. Some of these operating subsidiaries have debt outstanding or are subject to acquisition agreements that impose restrictions on such operating subsidiaries’ ability to pay dividends, but such restrictions are not significant in the context of ArcelorMittal’s overall liquidity. Repatriation of funds from operating subsidiaries may also be affected by tax and foreign exchange policies in place from time to time in the various countries where the Company operates, though none of these policies is currently significant in the context of ArcelorMittal’s overall liquidity.
In management’s opinion, ArcelorMittal’s credit facilities are adequate for its present requirements.
As of December 31, 2023, ArcelorMittal’s cash and cash equivalents and restricted cash amounted to $7.8 billion (including restricted cash of $97 million, of which $54 million relating to various environmental obligations, true sales of receivables programs and letter of credits issued in ArcelorMittal South Africa) as compared to $9.4 billion (including restricted
165
| Management report | ||
cash of $114 million, of which $52 million relating to various environmental obligations and true sales of receivables programs in ArcelorMittal South Africa) as of December 31, 2022. In addition, ArcelorMittal had available borrowing capacity of $5.4 billion under its $5.5 billion revolving credit facility as of December 31, 2023 compared to $5.5 billion as of December 31, 2022. For information on the currencies of cash and cash equivalents and restricted cash, see note 6.1.4 to the consolidated financial statements.
As of December 31, 2023, ArcelorMittal’s total debt, which includes long-term debt and short-term debt was $10.7 billion, compared to $11.7 billion as of December 31, 2022.
Net debt (defined as long-term debt ($8.4 billion) plus short-term debt ($2.3 billion), less cash and cash equivalents, restricted cash and other restricted funds ($7.8 billion)) was $2.9 billion as of December 31, 2023, up from $2.2 billion at December 31, 2022, comprised of long-term debt ($9.1 billion) plus short-term debt ($2.6 billion), less cash and cash equivalents and restricted cash ($9.4 billion). Most of the external debt is borrowed by the parent company on an unsecured basis and bears interest at varying levels based on a combination of fixed and variable interest rates. Gearing (defined as net debt divided by total equity) at December 31, 2023 and 2022 was 5% and 4%, respectively. See note 6.3 to the consolidated financial statements.
The margin applicable to ArcelorMittal’s principal credit facilities ($5.5 billion revolving credit facility and certain other credit facilities) and the coupons on certain of its outstanding bonds are subject to adjustment in the event of a change in its long-term credit ratings. ArcelorMittal's long-term credit rating was upgraded on August 9, 2021 by Moody's to 'Baa3' and its outlook was changed to positive by Moody's on February 19, 2024. On June 16, 2023, Standard & Poor's revised its outlook on ArcelorMittal to positive on expected strengthening of the business and affirmed a long-term credit rating of 'BBB-'. See "Introduction—Risk Factors and Controls—Risks related to ArcelorMittal's financial position and organizational structure—ArcelorMittal's indebtedness could have an adverse impact on its results of operations and financial position, and the market's perception of ArcelorMittal's leverage may affect its share price."
ArcelorMittal's $5.5 billion revolving credit facility (see "—Financings—Principal credit facilities" below) contains restrictive covenants, which among other things, limit encumbrances on the assets of ArcelorMittal and its subsidiaries, the ability of ArcelorMittal’s subsidiaries to incur debt and the ability of ArcelorMittal and its subsidiaries to dispose of assets in certain circumstances.
On April 27, 2021, the revolving credit facility was amended so that the margin payable would be increased or decreased
depending on the Company’s performance against two metrics measured annually against pre-defined targets with respect to its environmental and sustainability performance (CO2 intensity of the Company’s European operations and the number of facilities which have been certified by ResponsibleSteel™). The Facility may be used for general corporate purposes and was fully available as of December 31, 2023.
Non-compliance with the covenants in the Company’s borrowing agreements entitles the lenders under such facilities to accelerate the Company’s repayment obligations. The Company was in compliance with the financial covenants in the agreements related to all of its borrowings as of December 31, 2023.
As of December 31, 2023, ArcelorMittal had guaranteed $234 million of debt of its operating subsidiaries compared to $92 million as of December 31, 2022. See also note 9.4 to the consolidated financial statements for a description of guarantees by ArcelorMittal for joint ventures indebtedness of $5.0 billion as of December 31, 2023 including $3.5 billion issued on behalf of AMNS India, $421 million issued on behalf of Calvert, $480 million in relation to outstanding lease liabilities for vessels operated by Global Chartering and $208 million on behalf of Al Jubail. ArcelorMittal’s debt facilities have provisions whereby the acceleration of the debt of another borrower within the ArcelorMittal group could, under certain circumstances, lead to acceleration under such facilities.
In particular, with respect to joint ventures, on March 16, 2020, the parent company of AMNS India entered into a $5.1 billion ten-year term loan agreement with Japan Bank for International Cooperation ("JBIC"), MUFG Bank LTD., Sumitomo Mitsui Banking Corporation, Mizuho Bank Europe N.V., and Sumitomo Mitsui Trust Bank, Limited (London Branch) in connection with the acquisition of AMNS India. The obligations under the term loan agreements are both guaranteed by ArcelorMittal and NSC in proportion to their interests in the joint venture, 60% and 40%. On April 28, 2021, the syndicate of Japanese banks amended the agreement and agreed that the Leverage Ratio financial covenant would fall away in the event that the Company obtains an investment grade long-term credit rating (with a stable outlook) from two rating agencies (which occurred in 2021).
On March 30, 2023, AMNS Luxembourg entered into an additional $5 billion loan agreement ("JBIC co-financing loan") with the same syndicate of Japanese banks. As for the above-mentioned loan, the obligations of AMNS Luxembourg under the term loan agreement are guaranteed by ArcelorMittal and NSC in proportion to their interests in the joint venture, 60% and 40%, respectively. The proceeds obtained through the JBIC co-financing loan will be used to finance the expansion of AMNS India’s steelmaking capacity at its Hazira plant from 8.6 million tonnes to 15 million tonnes. In addition to the primary
166
| Management report | ||
steelmaking capacity expansion, the project includes the development of downstream rolling and finishing facilities that will enhance AMNS India’s ability to produce value-added steels for sectors including defense, automotive and infrastructure.
The following table summarizes the repayment schedule of ArcelorMittal’s outstanding indebtedness, which includes short-term and long-term debt, as of December 31, 2023.
| Repayment amounts per year (in billions of $) | ||||||||||||||||||||||||||
Type of indebtedness as of December 31, 2023 | 2024 | 2025 | 2026 | 2027 | 2028 | >2028 | Total | |||||||||||||||||||
| Bonds | 0.9 | 1.0 | 1.1 | 1.2 | — | 2.6 | 6.8 | |||||||||||||||||||
| Commercial paper | 0.7 | — | — | — | — | — | 0.7 | |||||||||||||||||||
| Lease liabilities and other loans | 0.7 | 0.7 | 0.2 | 0.5 | 0.2 | 0.9 | 3.2 | |||||||||||||||||||
| Total gross debt | 2.3 | 1.7 | 1.3 | 1.7 | 0.2 | 3.5 | 10.7 | |||||||||||||||||||
The average debt maturity of the Company was 5.7 years as of December 31, 2023 and December 31, 2022.
Further information regarding ArcelorMittal’s outstanding short-term and long-term indebtedness as of December 31, 2023, including the breakdown between fixed rate and variable rate debt, is set forth in note 6 to the consolidated financial statements. Further information regarding ArcelorMittal’s use of financial instruments for hedging purposes is set forth in note 6 to the consolidated financial statements.
Financings
ArcelorMittal’s principal credit facilities are described below, for further information on its existing credit facilities and several debt financing and repayment transactions completed during 2023, please refer to note 6 to the consolidated financial statements.
Principal credit facilities
On December 19, 2018, ArcelorMittal signed an agreement for a $5.5 billion revolving credit facility (the "Facility") which incorporated a single tranche of $5.5 billion. On November 27, 2019 and on November 26, 2020, ArcelorMittal exercised the option to extend the Facility's maturity by one year to December 19, 2024 and to December 19, 2025 respectively. The commitments consist of $5.4 billion until December 19, 2025 ($5.5 billion until December 19, 2023). As of December 31, 2023, $5.4 billion was fully available under the Facility.
On July 27, 2022, the Company entered into a $2.2 billion bridge term facility agreement with a financial institution. The facility may be applied toward the purchase price for the intended acquisition of CSP, as well as the refinancing of its existing indebtedness and the payment of related fees, costs and expenses. The facility was available for 12 months from signing with two extension options of 6 months each at the borrower's discretion. On December 8, 2022, an amount of $1.76 billion was cancelled, following the bond issuances completed on September 20, 2022 and November 29, 2022. After the cancellation, the remaining available amount under the bridge facility was $444 million. On January 31, 2023, the
remaining available amount under the bridge facility of $444 million was cancelled.
On September 30, 2010, ArcelorMittal entered into a $500 million revolving multi-currency letter of credit facility (the “Letter of Credit Facility”). The Letter of Credit Facility is used by the Company and its subsidiaries for the issuance of letters of credit and other instruments. The terms of the letters of credit and other instruments contain certain restrictions as to duration. The Letter of Credit Facility was subsequently amended to reduce its amount to $350 million. On July 31, 2019, the Company refinanced its Letter of Credit Facility by entering into a $350 million revolving multi-currency letter of credit facility, which initially matured on July 31, 2022. On August 5, 2020, the maturity of the Letter of Credit Facility was extended to July 31, 2023. On November 25, 2020, the amount of the Letter of Credit Facility was increased to $395 million. On June 25, 2021, the maturity of the Letter of Credit Facility was extended to July 31, 2024.
Mandatory convertible bond
On March 14, 2023, the Company through its wholly-owned subsidiary Hera Ermac made an early repayment of 226,666 of the 666,666 outstanding unsecured and unsubordinated bonds mandatorily convertible into preferred shares of such subsidiary for a total cash consideration of $340 million. See notes 6.3 and 11.2 to the consolidated financial statements. On December 21, 2023, the Company extended the conversion date of its bonds mandatorily convertible into preferred shares to January 30, 2026.
Mandatory convertible notes
On May 19, 2023, upon mandatory conversion of the remaining 24,290,025 outstanding mandatorily convertible subordinated notes ("MCN") due May 18, 2023, ArcelorMittal delivered a total of 57,057,991 treasury shares (of which 9,396,120 to the Significant Shareholder). See note 11.2 to the consolidated financial statements.
167
| Management report | ||
Working capital management
The Company makes drawdowns from and repayments on the Facility in the framework of its cash management. In addition, the Company has established a number of programs for sales without recourse of trade accounts receivable to various financial institutions (referred to as true sale of receivables (“TSR”)). As of December 31, 2023, the total amount of trade accounts receivables sold amounted to $4.5 billion. Through the TSR programs, certain operating subsidiaries of ArcelorMittal surrender the control, risks and benefits associated with the accounts receivable sold; therefore, the amount of receivables sold is recorded as a sale of financial assets and the balances are removed from the consolidated statements of financial position at the moment of sale.
As part of the Company’s ongoing efforts to improve its working capital position, it continually engages with its customers and suppliers with the aim of improving overall terms, including pricing, quality, just in time delivery, discounts and payment terms. Trade accounts payable have maturities from 15 to 180 days depending on the type of material, the geographic area in which the purchase transaction occurs and the various contractual agreements. The Company’s average outstanding number of trade payable days amounted to 81 over the last 5 years. The ability of suppliers to provide payment terms may be dependent on their ability to obtain funding for their own working capital needs and or their ability to early discount their receivables at their own discretion (the Company estimates that about $2.9 billion of trade payables were subject to early discount by its suppliers in 2023 as compared to $2.8 billion in 2022). Given the nature and large diversification of its supplier base the Company does not expect any material impact to its own liquidity position as a result of suppliers not having access to liquidity. As of December 31, 2023, a 5-day reduction in trade payable days would result in a trade payables decrease by $693 million.
ArcelorMittal's material cash requirements in the near and medium term
The Company's cash requirements in the near and medium term are primarily driven by the current commitments, obligations and other arrangements in place as of December 31, 2023. ArcelorMittal has various purchase commitments for materials, supplies and capital expenditure incidental to the ordinary course of business. As of December 31, 2023, ArcelorMittal had various outstanding obligations mostly related to:
•Guarantees, pledges and other collateral related to financial debt and credit lines given on behalf of third parties and joint ventures,
•Capital expenditure commitments mainly related to commitments associated with investments in expansion and improvement projects by various subsidiaries,
•Other commitments comprising mainly commitments incurred for gas supply to electricity suppliers.
These commitments, obligations and other arrangements will become due in 2024 and beyond. These various purchase commitments and long-term obligations will have an effect on ArcelorMittal’s future liquidity and capital resources. For further details on commitments and obligations, please refer to note 9.4 to the consolidated financial statements. ArcelorMittal also has various environmental commitments and asset retirement obligations as of December 31, 2023. For further details on environmental commitments and asset retirement obligations, please refer to note 9.1 to the consolidated financial statements.
The Company expects to service its cash requirements in the near and medium-term with net cash provided by operating activities. In the future, the Company may enter into additional financing facilities if required. For additional information on near and medium term cash requirements, see "—Outlook".
Earnings distribution
ArcelorMittal held 33.5 million shares in treasury as of December 31, 2023, as compared to 72.5 million shares as of December 31, 2022. As of December 31, 2023, the number of shares held by the Company in treasury represented approximately 3.93% of the Company’s total issued share capital. On January 14, 2022, ArcelorMittal cancelled 45 million treasury shares to keep the number of treasury shares within appropriate levels. Following this cancellation, the aggregate number of shares issued and fully paid up decreased from 982,809,772 to 937,809,772. On May 18, 2022, ArcelorMittal cancelled 60 million treasury shares to keep the number of treasury shares within appropriate levels. Following this cancellation, the aggregate number of shares issued and fully paid up decreased from 937,809,772 to 877,809,772. On April 28, 2023, ArcelorMittal cancelled 25 million treasury shares to keep the number of treasury shares within appropriate levels. Following this cancellation, the aggregate number of shares issued and fully paid up decreased from 877,809,772 to 852,809,772.
Following the achievement of the Group’s net debt target, and in line with its previous statements, the Board of Directors approved during the first quarter of 2021 a new capital return policy. See "Introduction—History and development of the Company—Capital return policy". According to this policy, the Board recommended a $0.30/share base dividend, subject to the approval of shareholders, which was given at the annual general meeting of shareholders on June 8, 2021. The dividend amounted to $325 million ($312 million net of dividends paid to subsidiaries holding treasury shares) and was paid on June 15,
168
| Management report | ||
2021. After paying this base dividend, the Company has also implemented share buyback programs and MCN repurchases as part of its capital return policy.
In February 2022, the Board of Directors recommended an increase of the base annual dividend to $0.38/share, from $0.30/share, subject to the approval of shareholders, which was given at the annual general meeting of shareholders on May 4, 2022. The dividend amounted to $332 million and was paid on June 10, 2022. In addition, during 2022, ArcelorMittal completed two consecutive share buyback programs for a total amount of €1.9 billion ($2.0 billion) pursuant to an authorization by the annual general meeting of shareholders on June 8, 2021 and May 4, 2022.
In February 2023, the Board proposed to increase the annual base dividend to shareholders to $0.44/share. On May 2, 2023 at the annual general meeting of shareholders, the shareholders approved the Board’s proposed dividend of $0.44 per share. The dividend amounted to $369 million and payment included two installments; the first installment of $185 million was paid on June 15, 2023 and the second installment of $184 million was paid on December 7, 2023. In addition, on March 31, 2023, ArcelorMittal completed a share buyback program for a total amount of €1.4 billion ($1.5 billion) pursuant to an authorization given by the annual general meeting of shareholders on May 4, 2022. On May 5, 2023, the Company announced a new share buy back program of up to 85 million shares to be completed by May 2025 (subject to market conditions) under the authorization given by the annual general meeting of shareholders of May 2, 2023.
In February 2024, the Board of Directors recommended an increase of the base annual dividend to $0.50/share (from $0.44/share paid in 2023) to be paid in two equal installments in June 2024 and December 2024, subject to the approval of shareholders at the annual general meeting of shareholders in April 2024.
Additional buybacks under the outstanding buyback program announced in May 2023 will be allocated to the 2024 capital return (targeting 50% of post-dividend free cash flow as per the policy). Share buybacks will continue as per the Company's defined policy to return 50% of post-dividend free cash flow to shareholders.
Pension/OPEB liabilities
The defined benefit liabilities for employee benefits increased by $0.1 billion to $2.7 billion as of December 31, 2023, as compared to $2.6 billion as of December 31, 2022 mainly due to an increase in interest on pension (due to the increase in discount rates in euro zone). For additional information with respect to the Company’s pension plan and OPEB liabilities,
including a breakdown by region and by type of plan, see note 8.2 to the consolidated financial statements.
Sources and uses of cash
Years ended December 31, 2023, 2022 and 2021
The following table presents a summary of cash flow of ArcelorMittal:
| Summary of cash flow | For the year ended December 31, | ||||||||||||||||
| (in $ millions) | 2023 | 2022 | 2021 | ||||||||||||||
| Net cash provided by operating activities | 7,645 | 10,203 | 9,905 | ||||||||||||||
| Net cash used in investing activities | (5,848) | (4,483) | (340) | ||||||||||||||
| Net cash used in financing activities | (3,666) | (477) | (10,898) | ||||||||||||||
Net cash provided by operating activities
For the year ended December 31, 2023, net cash provided by operating activities decreased to $7.6 billion as compared with $10.2 billion for the year ended December 31, 2022. Net cash provided by operating activities included an operating working capital release of $1.6 billion as compared to an operating working capital investment of $1.3 billion in 2022, including an inflow from inventories and trade accounts receivable of $1.6 billion and $0.3 billion, respectively, partially offset by an outflow for trade accounts payable of $0.3 billion. The operating working capital release was driven primarily by lower accounts receivable (due to lower prices and lower volumes, including the impact of normal seasonality at year end), and lower inventories (primarily due to reduced inventory volumes) in the fourth quarter of 2023.
For the year ended December 31, 2022, net cash provided by operating activities increased to $10.2 billion as compared with $9.9 billion for the year ended December 31, 2021. The increase in net cash provided by operating activities included an operating working capital investment of $1.3 billion, an outflow for inventories and trade accounts payable of $2.1 billion and $0.3 billion, respectively, partially offset by an inflow for trade accounts receivable of $1.1 billion. The investment in operating working capital was mainly driven by elevated raw material and energy prices although in the fourth quarter of 2022; net cash provided by operating activities included a $2.4 billion operating working capital release, including an inflow for inventories and trade accounts receivable of $1.7 billion and $1.1 billion, respectively, partially offset by an outflow of trade accounts payable of $0.4 billion. The release of operating working capital was mainly driven by lower investment in accounts receivable (price and volume) and lower inventories due to the impact of lower production costs and reduced inventory volumes.
169
| Management report | ||
For the year ended December 31, 2021, net cash provided by operating activities totaled to $9.9 billion. It included an operating working capital investment of $6.4 billion composed of an outflow for inventories of $8.6 billion and an outflow for trade accounts receivable of $2.5 billion, partially offset by an inflow for trade accounts payable of $4.8 billion. The investment in operating working capital was mainly driven by elevated raw material prices, relatively robust finished steel prices and lower than anticipated inventory reduction.
Net cash used in investing activities
Net cash used in investing activities was $5.8 billion for the year ended December 31, 2023 as compared to $4.5 billion for the year ended December 31, 2022. Capital expenditures were $4.6 billion for the year ended December 31, 2023 as compared to $3.5 billion for the year ended December 31, 2022. Capital expenditures for the year ended December 31, 2023 were broadly consistent with the initial guidance (in the mid-point range between $4.5 billion to $5.0 billion). Similar to 2023, the Company expects 2024 capital expenditures to be in the range of $4.5 to $5.0 billion with decarbonization capital expenditures expected to increase to between $0.3 to $0.4 billion (as compared to $0.2 billion in 2023) and capital expenditures outside of strategic capital expenditures and decarbonization projects (which includes cost reduction plans and environment projects as well as general maintenance capital expenditures) are expected to be similar to 2023 ($3.0 billion) in the range of $2.8 billion to $3.1 billion. The previously announced strategic capital expenditure envelope has $2.5 billion outstanding to be completed by 2026. The Company expects strategic projects capital expenditures to be in the range of $1.4 to $1.5 billion in 2024 as compared to $1.4 billion in 2023, largely due to catch up on previously announced projects. See “Properties and capital expenditures—Capital expenditures” and "—Outlook" below.
ArcelorMittal’s major capital expenditures in 2023 included the following projects: ArcelorMittal Vega Do Sul expansion, Serra Azul mine direct reduction pellet feed plant, ArcelorMittal Liberia mine phase 2 premium product expansion, Andra Pradesh (India) renewable energy project, Barra Mansa section mill, Mardyck (France) new electrical steels production facilities, Las Truchas mines (Mexico) revamping and capacity increase, Monlevade sinter plant, blast furnace and melt shop. See also “Properties and capital expenditures—Capital expenditures—Completed and Ongoing projects”.
Net cash used in other investing activities for the year ended December 31, 2023 included a cash outflow of $2,193 million in connection with the acquisition of Companhia Siderúrgica do Pecém, a cash outflow of $152 million (net of $4 million of cash acquired) for two acquisitions relating to ArcelorMittal Downstream Solutions within the Europe reportable segment, outflows of $36 million and $25 million for investments in Boston
Metal and TerraPower, respectively, through the Company's XCarb® Innovation Fund and a $73 million equity contribution into the joint venture with Casa dos Ventos, partly offset by cash inflows of $626 million following the sale of 265 million shares in Ereĝli Demir ve Çelik Fabrikalari T.A.S. (“Erdemir”) and $254 million (net of $24 million cash disposed) related to the sale of ArcelorMittal Temirtau.
Net cash used in investing activities was $4.5 billion for the year ended December 31, 2022 as compared to $0.3 billion for the year ended December 31, 2021. Capital expenditures were $3.5 billion for the year ended December 31, 2022 as compared to $3.0 billion for the year ended December 31, 2021. Capital expenditures for the year ended December 31, 2022 were consistent with the latest guidance provided after the third quarter of 2022 but lower than the initial guidance of $4.5 billion, which had been reduced to reflect some moderate delays to certain strategic and decarbonization spending plans due to project mobilization/contractors as well as a $0.2 billion reduction from foreign exchange effects relative to the initial 2022 budget. The previously announced strategic pipeline (2021-2024) increased by $0.5 billion to $4.2 billion, with the addition of a new production unit for electrical steels at the Mardyck site in the north of France, with an outflow of $0.9 billion as of the end of 2022.
ArcelorMittal’s major capital expenditures in 2022 included the following projects: ArcelorMittal Vega Do Sul expansion, Serra Azul mine direct reduction pellet feed plant, ArcelorMittal Liberia mine phase 2 premium product expansion, ArcelorMittal Mexico new hot strip mill, Steelanol project in Ghent, as well as the hot strip mill modernization and #5 CGL conversion to AluSi® in ArcelorMittal Dofasco (completed in the second and third quarter of 2022 respectively). Capital expenditures on strategic projects and decarbonization projects totaled $0.7 billion and $0.2 billion, respectively, in 2022. Capital expenditures outside of strategic projects and decarbonization projects (which includes cost reduction plans and environment projects as well as general maintenance capital expenditures) amounted to $2.6 billion in 2022.
Net cash provided by other investing activities for the year ended December 31, 2022 included $1.0 billion cash outflow in connection with several acquisitions, including mainly an 80% interest in voestalpine’s world-class Hot Briquetted Iron ("HBI") plant located in Corpus Christi, Texas ($805 million net of cash acquired of $12 million), the UK based scrap recycling business John Lawrie Metals Limited ($43 million net of cash acquired of $5 million), Architectural Steel Limited, a UK based manufacturer of bespoke metal fabrications and flashings for building envelopes ($39 million net of cash acquired of $6 million) and three companies (ALBA Metall Süd Rhein-Main GmbH, ALBA Electronics Recycling GmbH and ALBA Metall Süd Franken GmbH) active in ferrous and non-ferrous metal
170
| Management report | ||
recycling in Germany ($45 million net of cash acquired of $9 million). Net cash used in other investing activities for the year ended December 31, 2022 included also $25 million investment in nuclear innovation company TerraPower and $17.5 million in Form Energy Inc. through the Company's XCarb® Innovation Fund.
Net cash used in investing activities was $0.3 billion for the year ended December 31, 2021. Capital expenditures were $3.0 billion for the year ended December 31, 2021. Capital expenditures for the year ended December 31, 2021 were marginally above the initial guidance of $2.8 billion but slightly below the revised guidance of $3.2 billion provided after the third quarter of 2021.
ArcelorMittal’s major capital expenditures in 2021 included the following projects: ArcelorMittal Mexico new hot strip mill, the hot strip mill modernization in ArcelorMittal Dofasco, new pellet plant in AMKR and Steelanol project in Ghent. Capital expenditures included $0.1 billion related to ArcelorMittal Italia which has been deconsolidated from April 14, 2021 onwards.
Net cash provided by other investing activities of $2.7 billion for the year ended December 31, 2021 included mainly $2.7 billion proceeds from the sale of common shares and redemption of preferred shares of Cleveland-Cliffs and refund of $0.3 billion cash collateral related to the ArcelorMittal USA disposal (see below) offset by other investments including $80 million investments through the XCarb™ innovation fund and $25m for the acquisition of the remaining 67% interest in Condesa.
Net cash used in financing activities
Net cash used in financing activities was $3.7 billion for the year ended December 31, 2023, as compared to $0.5 billion for the year ended December 31, 2022. In 2023, net cash used in financing activities included primarily a €1,117 million ($1,207 million) outflow related to repayment of euro denominated notes at maturity, a $1,208 million outflow relating to share buybacks, and a $340 million outflow related to the partial redemption of mandatory convertible bonds. Net cash used in financing activities for the year ended December 31, 2023 also included $531 million in dividend payments (see below) and $253 million for lease payments and other financing activities. For further details related to capital markets, liability management transactions and debt repayments in 2023, see note 6.1.2 to the consolidated financial statements.
Net cash used in financing activities was $0.5 billion for the year ended December 31, 2022, as compared to $10.9 billion for the year ended December 31, 2021. In 2022, net cash used in financing activities mainly included a $2.9 billion outflow with respect to the Company's two completed (and the third one ongoing) share buyback programs and an outflow of €486 million ($551 million) for the repayment of outstanding bonds at
maturity. Such outflows were partly offset by an inflow from issuance of bonds for a total amount of $2.8 billion including $2.2 billion USD notes with two tranches (five-year $1.2 billion tranche at 6.55% and a ten-year $1.0 billion tranche at 6.80%) and €600 million ($580 million) four-year notes at 4.875%, an inflow from offering of five Schuldschein loans for a total amount of €725 million ($755 million) with maturities of 3 and 5 years, an inflow pursuant to drawdown on European Investment Bank facility of €280 million ($291 million) and a net inflow of $335 million from commercial paper. Net cash used in financing activities for the year ended December 31, 2022 also included $663 million in dividend payments (see below) and $160 million for lease payments and other financing activities.
Net cash used in financing activities was $10.9 billion for the year ended December 31, 2021. In 2021, net cash used in financing activities included a $5.2 billion outflow with respect to the Company's five share buyback programs, $3.6 billion of net payments relating to short and long-term debt (including $2.3 billion in payments of long-term debt and $1.7 billion in payments of short-term debt), $1.2 billion for the early redemption of certain MCNs, $572 million of dividend payments (of which $312 million paid to ArcelorMittal shareholders and $260 million paid to non-controlling shareholders) and $398 million for lease payments and other financing activities.
Dividend payments during the year ended December 31, 2023 of $531 million included $369 million paid to ArcelorMittal shareholders and $162 million paid to non-controlling shareholders in subsidiaries. Dividend payments during the year ended December 31, 2022 of $663 million included $332 million paid to ArcelorMittal shareholders and $331 million paid to non-controlling shareholders in subsidiaries. Dividends during the year ended December 31, 2021 of $572 million included $312 million paid to ArcelorMittal shareholders and $260 million were paid to non-controlling shareholders in subsidiaries.
Equity
Equity attributable to the equity holders of the parent increased to $54.0 billion as of December 31, 2023 from $53.2 billion as of December 31, 2022 primarily due to net income attributable to the equity holders of the parent of $0.9 billion and $2.4 billion foreign exchange gains, partly offset by $0.1 billion actuarial loses, $1.2 billion decrease due to share buyback programs, and $0.4 billion dividend payments. See note 11 to ArcelorMittal’s consolidated financial statements for the year ended December 31, 2023.
Equity attributable to the equity holders of the parent increased to $53.2 billion as of December 31, 2022 from $49.1 billion as of December 31, 2021 primarily due to net income attributable to the equity holders of the parent of $9.3 billion and $0.6 billion actuarial gains, partly offset by a $2.9 billion decrease due to share buyback programs, $2.6 billion foreign exchange losses
171
| Management report | ||
and $0.3 billion dividend payments. See note 11 to ArcelorMittal’s consolidated financial statements for the year ended December 31, 2022.
Disclosures about market risk
ArcelorMittal is exposed to a number of different market risks arising from its normal business activities. Market risk is the possibility that changes in raw materials prices, foreign currency exchange rates, interest rates, base metal prices (zinc, nickel, aluminum and tin) and energy prices (oil, natural gas and power) will adversely affect the value of ArcelorMittal’s financial assets, liabilities or expected future cash flows.
The fair value information presented below is based on the information available to management as of the date of the consolidated statements of financial position. Although ArcelorMittal is not aware of any factors that would significantly affect the estimated fair value amounts, such amounts have not been comprehensively revalued for purposes of this annual report since that date, and therefore, the current estimates of fair value may differ significantly from the amounts presented. The estimated fair values of certain financial instruments have been determined using available market information or other valuation methodologies that require considerable judgment in interpreting market data and developing estimates.
See note 6 to ArcelorMittal’s consolidated financial statements for quantitative information about risks relating to financial instruments, including financial instruments entered into pursuant to the Company’s risk management policies.
Risk management
ArcelorMittal has implemented strict policies and procedures to manage and monitor financial market risks. Organizationally, supervisory functions are separated from operational functions, with proper segregation of duties. Financial market activities are overseen by the CEO and CFO, the Corporate Finance and Tax Committee and the Executive Office.
All financial market risks are managed in accordance with the Treasury and Financial Risk Management Policy. These risks are managed centrally through Group Treasury by a group specializing in foreign exchange, interest rate, commodity, internal and external funding and cash and liquidity management.
All financial market hedges are governed by ArcelorMittal’s Treasury and Financial Risk Management Policy, which includes a delegated authority and approval framework, sets the boundaries for all hedge activities and dictates the required approvals for all Treasury activities. Hedging activity and limits are monitored on an ongoing basis. ArcelorMittal enters into transactions with numerous counterparties, mainly banks and
financial institutions, as well as brokers, major energy producers and consumers.
As part of its financial risk management activities, ArcelorMittal uses derivative instruments to manage its exposure to changes in interest rates, foreign exchange rates and commodities prices. These instruments are principally interest rate, currency and commodity swaps, spots and forwards. ArcelorMittal may also use futures and options contracts.
Counterparty risk
ArcelorMittal has established detailed counterparty limits to mitigate the risk of default by its counterparties. The limits restrict the exposure ArcelorMittal may have to any single counterparty. Counterparty limits are calculated taking into account a range of factors that govern the approval of all counterparties. The factors include an assessment of the counterparty’s financial soundness and its ratings by the major rating agencies, which must be of a high quality. Counterparty limits are monitored on a periodic basis.
All counterparties and their respective limits require the prior approval of the Corporate Finance and Tax Committee. Standard agreements, such as those published by the International Swaps and Derivatives Association, Inc. (ISDA) are negotiated with all ArcelorMittal trading counterparties.
Currency exposure
ArcelorMittal seeks to manage each of its entities’ exposure to its operating currency. For currency exposure generated by activities, the conversion and hedging of revenues and costs in foreign currencies is typically performed using currency transactions on the spot market and forward market. For some of its business segments, ArcelorMittal hedges future cash flows.
Because a substantial portion of ArcelorMittal’s assets, liabilities, sales and earnings are denominated in currencies other than the U.S. dollar (its reporting currency), ArcelorMittal has exposure to fluctuations in the values of these currencies relative to the U.S. dollar. These currency fluctuations, especially the fluctuation of the value of the U.S. dollar relative to the euro, the Canadian dollar, Brazilian real, South African rand, Argentine peso, Indian rupee, Polish zloty and Ukrainian hryvnia, as well as fluctuations in the currencies of the other countries in which ArcelorMittal has significant operations and/or sales, could have a material impact on its results of operations.
ArcelorMittal faces transaction risk, where its businesses generate sales in one currency but incur costs relating to that revenue in a different currency. For example, ArcelorMittal’s subsidiaries may purchase raw materials, including iron ore and coking coal, in U.S. dollar, but may sell finished steel products in other currencies. Consequently, an appreciation of the U.S.
172
| Management report | ||
dollar will increase the cost of raw materials, thereby negatively impacting the Company’s operating margins, unless the Company is able to pass along the higher cost in the form of higher selling prices.
ArcelorMittal faces foreign currency translation risk, which arises when ArcelorMittal translates the financial statements of its subsidiaries, denominated in currencies other than the U.S. dollar for inclusion in ArcelorMittal’s consolidated financial statements.
The tables below illustrate the impact of an appreciation and a depreciation of the U.S. dollar of 10% against the euro, on the conversion of the net debt of ArcelorMittal into U.S. dollar as of December 31, 2023 and December 31, 2022. The impact on net debt denominated in a currency different than the euro, is computed based on historical data of how such currency would move against the U.S. dollar when the U.S. dollar appreciates/depreciates 10% against the euro. A positive sign means an increase in the net debt.
| Currency | Impact on net debt translation of a 10% appreciation of the U.S. dollar against the euro | Impact on net debt translation of a 10% depreciation of the U.S. dollar against the euro | ||||||||||||
In 2023 | in $ equivalent (in millions) | in $ equivalent (in millions) | ||||||||||||
| Argentine peso | (57) | 46 | ||||||||||||
| Brazilian real | 5 | (7) | ||||||||||||
| Euro | 93 | (93) | ||||||||||||
| Indian rupee | — | — | ||||||||||||
| Moroccan dirham | 7 | (9) | ||||||||||||
| Polish zloty | (33) | 48 | ||||||||||||
| Other | 7 | (8) | ||||||||||||
| Currency | Impact on net debt translation of a 10% appreciation of the U.S. dollar against the euro | Impact on net debt translation of a 10% depreciation of the U.S. dollar against the euro | ||||||||||||
In 2022 | in $ equivalent (in millions) | in $ equivalent (in millions) | ||||||||||||
| Argentine peso | 55 | (78) | ||||||||||||
| Brazilian real | 1 | (1) | ||||||||||||
| Euro | 68 | (68) | ||||||||||||
| Indian rupee | 5 | (5) | ||||||||||||
| Moroccan dirham | 7 | (9) | ||||||||||||
| Polish zloty | (9) | 12 | ||||||||||||
| Other | — | — | ||||||||||||
Derivative instruments
ArcelorMittal uses derivative instruments to manage its exposure to movements in interest rates, foreign exchange rates and commodity prices. Changes in the fair value of derivative
instruments are recognized in the consolidated statements of operations or in equity according to nature and effectiveness of the hedge.
Derivatives used are non-exchange-traded derivatives such as over-the-counter swaps, options and forward contracts.
For the Company’s tabular presentation of information related to its market risk sensitive instruments, please see note 6 to the consolidated financial statements.
Interest rate sensitivity
Cash balances, which are primarily composed of euros and U.S. dollar, are managed according to the short-term (up to one year) guidelines established by senior management on the basis of a daily interest rate benchmark, primarily through short-term currency swaps, without modifying the currency exposure.
Interest rate risk on debt
ArcelorMittal’s policy consists of incurring debt at fixed and floating interest rates, primarily in U.S. dollar and euros according to general corporate needs. Interest rate and currency swaps are utilized to manage the currency and/or interest rate exposure of the debt.
For the Company’s tabular presentation of the fair values of its short and long term debt, please see note 6 to the consolidated financial statements.
Commodity price risk
ArcelorMittal utilizes a number of exchange-traded commodities in the steel-making process. In certain instances, ArcelorMittal is the leading consumer worldwide of certain commodities. In some businesses and in certain situations, ArcelorMittal is able to pass this exposure on to its customers. The residual exposures are managed as appropriate.
Financial instruments related to commodities (base metals, energy, freight and emission rights) are utilized to manage ArcelorMittal’s exposure to price fluctuations.
Hedges in the form of swaps and options are utilized to manage the exposure to commodity price fluctuations.
In case of natural gas, ArcelorMittal has a portfolio of steelmaking assets with approximately 80% of steel being produced through the BF-BOF route which means resulting by-product gases are recycled and utilized as a substitute for natural gas covering a large part of the Company's needs. Overall, the Company has a policy of hedging a portion of its natural gas requirements with other strategic long term hedges in place.
With respect to emission rights, in 2023, the Company has fulfilled its shortfall requirements through the utilization of some
173
| Management report | ||
of its hedges and through some spot purchases by strategically buying certificates in a planned manner.
For the Company’s tabular presentation of information related to its market risk sensitive instruments, please see note 6 to the consolidated financial statements.
In respect of non-exchange traded commodities, ArcelorMittal is exposed to volatility in the prices of raw materials such as iron ore (which is generally correlated with steel prices with a time lag) and coking coal. This exposure is almost entirely managed through long-term contracts, however some hedging of iron ore exposures is made through derivative contracts. For a more detailed discussion of ArcelorMittal’s iron ore and coking coal purchases, see “Operating and financial review —Key factors affecting results of operations—Raw materials”.
Outlook
As anticipated, apparent demand conditions are now showing signs of improvement as the destocking phase reaches maturity. Despite continued headwinds to real demand, in countries outside of China, ASC is expected to grow by 3.0% to 4.0% in 2024 as compared to 2023.
ArcelorMittal expects the following demand dynamics by key region:
•In the U.S., although real demand growth is expected to remain lackluster due to the lagged impact of higher interest rates and the destocking that impacted apparent demand in 2023, it is not expected to continue in 2024. As a result, ASC of flat products is expected to grow within the range of 1.5% to 3.5% in 2024;
•In Europe, while the Company assumes a marginal decline in real demand, mainly construction, the destocking that the impacted apparent demand in 2023 is not expected to continue in 2024. As a result, apparent demand for flat products is expected to improve, with growth within a range of 2.0% to 4.0% in 2024;
•In Brazil, the Company expects a gradual rebound in real steel consumption in 2024 to support an ASC growth within a range of 0.5% to 2.5%;
•In India, the Company expects another strong year with ASC growth within the range of 6.5% to 8.5%;
•In China, economic growth is expected to weaken. Despite continued weakness in real estate, the impact of announced stimulus is expected to support offsetting demand growth from infrastructure spending. As a result, steel consumption is expected to be relatively stable/slightly positive (between 0% to 2.0%).
The Company remains positive on the medium/long-term steel demand outlook and, supported by its strong financial position remains focused on executing its strategy of growth with capital returns.
Capital expenditure is expected to remain within the range of $4.5 billion to $5.0 billion (of which $1.4 billion to $1.5 billion is expected as strategic growth capital expenditure).
All information that is not historical in nature and disclosed under “Operating and financial review”, and in particular in this Outlook section, is deemed to be a forward-looking statement. A detailed discussion of principal risks and uncertainties which may cause actual results and events to differ materially from such forward-looking statements is included in the section “Risk factors”.
MANAGEMENT AND EMPLOYEES
Directors and senior management
Board of Directors
ArcelorMittal places a strong emphasis on corporate governance. The Board of Directors is composed of ten directors, of which six are independent directors. Mrs. Karyn Ovelmen is the Lead Independent Director. The Board of Directors has three committees: The Audit & Risk Committee, the Appointment, Remuneration and Corporate Governance Committee ("ARCG Committee") and the Sustainability Committee. Prior to July 28, 2021, the former ARCG and Sustainability Committee carried out the roles of both of the current Appointments, Remuneration and Corporate Governance Committee and the Sustainability Committee. The ARCG Committee and the Audit & Risk Committee are comprised exclusively of independent directors. There are two independent directors on the Sustainability Committee.
The annual general meeting of shareholders on May 2, 2023 acknowledged the expiration of the terms of office of Mr. Lakshmi N. Mittal, Mr. Aditya Mittal, Mr. Michel Wurth and Mr. Etienne Schneider. At the same meeting, the shareholders re-elected Mr. Lakshmi N. Mittal, Mr. Aditya Mittal, Mr. Michel Wurth and Mr. Etienne Schneider and elected Mrs. Patricia Barbizet for a new term of three years each.
In the most recent assessment of the Company’s leadership structure, the ARCG Committee reviewed the key duties and responsibilities of the Company’s Executive Chairman and its Lead Independent Director as follows:
174
| Management report | ||
| Executive Chairman | Lead Independent Director | ||||
| * Chairs the Board of Directors' and shareholders' meetings | * Provides independent leadership to the Board of Directors | ||||
| * Works with the Lead Independent Director to set agenda for the Board of Directors and reviews the schedule of the meetings | * Presides at executive sessions of independent directors | ||||
| * Serves as a public face of the Board of Directors and of the Company | * Advises the Executive Chairman of any decisions reached and suggestions made at the executive sessions, as appropriate | ||||
| * Serves as a resource for the Board of Directors | * Coordinates the activities of the other independent directors | ||||
| * Guides discussions at the Board of Directors meetings and encourages directors to express their positions | * Oversees Board of Directors' governance processes, including succession planning and other governance-related matters | ||||
| * Communicates significant business developments and time-sensitive matters to the Board of Directors | * Liaison between the Executive Chairman and the other independent directors | ||||
| * Is responsible for managing day-to-day business and affairs of the Company | * Calls meetings of the independent directors when necessary and appropriate | ||||
* Interacts with the CEO within the Executive Office of the Company and frequently meets stakeholders and provides feedback to the Board of Directors | * Leads the Board of Directors’ self-evaluation process and such other duties as are assigned from time to time by the Board of Directors | ||||
The members of the Board of Directors are set out below. Henk Scheffer is the Company Secretary and, accordingly, acts as secretary of the Board of Directors.
| Name | Age5 | Date of joining the Board6 | End of Term | Position within ArcelorMittal5 | ||||||||||||||||||||||
| Lakshmi N. Mittal | 73 | May 1997 | May 2026 | Executive Chairman of the Board of Directors | ||||||||||||||||||||||
Aditya Mittal8 | 47 | June 2020 | May 2026 | Director and Chief Executive Officer | ||||||||||||||||||||||
Vanisha Mittal Bhatia7 | 43 | December 2004 | May 2025 | Director | ||||||||||||||||||||||
Tye Burt2, 3, 4 | 66 | May 2012 | May 2024 | Director | ||||||||||||||||||||||
Michel Wurth3 | 69 | May 2014 | May 2026 | Director | ||||||||||||||||||||||
Karyn Ovelmen1, 2, 4 | 60 | May 2015 | May 2024 | Lead Independent Director | ||||||||||||||||||||||
Karel de Gucht1, 4 | 69 | May 2016 | May 2025 | Director | ||||||||||||||||||||||
Etienne Schneider1, 4 | 52 | June 2020 | May 2026 | Director | ||||||||||||||||||||||
Clarissa Lins2, 3, 4 | 56 | June 2021 | May 2024 | Director | ||||||||||||||||||||||
Patricia Barbizet1, 4 | 68 | May 2023 | May 2026 | Director | ||||||||||||||||||||||
1.Member of the Audit & Risk Committee.
2.Member of the ARCG Committee.
3.Member of the Sustainability Committee.
4.Non-executive and independent director.
5.Age and position as of December 31, 2023.
6.Date of joining the Board of ArcelorMittal or, if prior to 2006, its predecessor Mittal Steel Company NV.
7.Ms. Vanisha Mittal Bhatia is the daughter of Mr. Lakshmi N. Mittal and sister of Mr. Aditya Mittal.
8.Mr. Aditya Mittal is the son of Mr. Lakshmi N. Mittal and brother of Ms. Vanisha Mittal Bhatia.
175
| Management report | ||
 | Lakshmi N. Mittal Executive Chairman | |||||||
73 years old Nationality: Indian Date of first election: May 1997 Term start date: May 2023 Term end date: May 2026 | Expertise and experience Lakshmi N. Mittal is the Executive Chairman of ArcelorMittal since February 2021. He was previously the Chairman and Chief Executive Officer of ArcelorMittal. He is a renowned global businessman who serves on the boards of various companies and advisory councils. He is an active philanthropist engaged in the fields of education and child health. Mr. Mittal was born in Sadulpur in Rajasthan in 1950. He graduated from St Xavier’s College in Kolkata, where he received a Bachelor of Commerce degree. He has received numerous awards for his contribution to the steel industry over the years and recently, in April 2018, Mr. Mittal was awarded by the American Iron and Steel Institute with the Gary medal award recognizing his great contribution to the steel industry. He is widely recognized for successfully integrating many company acquisitions in North America, South America, Europe, South Africa and the CIS. Mr. Mittal is Chairman of the board of Aperam and a member of the board of Goldman Sachs. He previously sat on the board of Airbus N.V. He is a member of the Foreign Investment Council in Kazakhstan, the National Investment Council of Ukraine, the Global CEO Council of the Chinese People’s Association for Friendship with Foreign Countries, the World Economic Forum’s International Business Council, the World Steel Association’s Executive Committee, the European Round Table of Industrialists, the Indian School of Business and a member of the board of Trustees of Cleveland Clinic. Mr. Mittal is the father of Aditya Mittal (who is Chief Executive Officer and a non-independent Director of ArcelorMittal) and Vanisha Mittal Bhatia (who is a Non-independent Director of ArcelorMittal). Mr. Mittal is married to Mrs. Usha Mittal. Mr. Mittal is a citizen of India. | |||||||
 | Aditya Mittal Chief Executive Officer ("CEO") | |||||||
47 years old Nationality: Indian Date of first election: June 2020 Term start date: May 2023 Term end date: May 2026 | Expertise and experience Aditya Mittal is the Chief Executive Officer since February 2021 and Director of ArcelorMittal. He was previously the President and Chief Financial Officer ("CFO") of ArcelorMittal. Following the formation of ArcelorMittal in 2006, Aditya held various senior leadership roles, including managerial oversight of the Group’s flat carbon steel businesses in the Americas and Europe, in addition to his role as CFO and membership of the Group Management Board. He sees climate change as ArcelorMittal’s top strategic issue and wants the Company to lead the decarbonization of the steel industry. He is an active philanthropist with a particular interest in child health. Together with his wife Megha, he is a significant supporter of the Great Ormond Street Children’s Hospital in London, having funded the Mittal Children’s Medical Centre, and in India, the couple work closely with UNICEF, having funded the first ever country-wide survey into child nutrition, the results of which are being used by the Government of India to inform relevant policy. Aditya serves on the boards of ArcelorMittal, Aperam, and Iconiq Capital and is Chairman of ArcelorMittal Nippon Steel India and Chairman of HMEL. He is also a trustee at Brookings Institution, a member of Harvard University’s Global Advisory Council. He holds a Bachelor’s degree in Economics with concentrations in Strategic Management and Corporate Finance from the Wharton School in Pennsylvania, United States. He is the son of Mr. Lakshmi N. Mittal and brother of Ms. Vanisha Mittal Bhatia. Mr. Aditya Mittal is a citizen of India. | |||||||
176
| Management report | ||
 | Vanisha Mittal Bhatia Non-independent Director | |||||||
43 years old Nationality: Indian Date of first election: December 2004 Term start date: May 2022 Term end date: May 2025 | Expertise and experience Vanisha Mittal Bhatia is a non-independent Director of ArcelorMittal. She was appointed as a member of the LNM Holdings Board of Directors in June 2004. Ms. Vanisha Mittal Bhatia was appointed to Mittal Steel’s Board of Directors in December 2004, where she worked in the Procurement department leading various initiatives including "total cost of ownership program". She joined Aperam in April 2011 and since has held the position of Chief Strategy Officer. She has a Bachelor of Sciences from the European Business School. Ms. Vanisha Mittal Bhatia is a citizen of India. Ms. Vanisha Mittal Bhatia is the daughter of Mr. Lakshmi N. Mittal and the sister of Mr. Aditya Mittal. | |||||||
 | Tye Burt Non-executive and independent Director | |||||||
66 years old Nationality: Canadian Date of first election: May 2012 Term start date: June 2021 Term end date: May 2024 | Expertise and experience Tye Burt, is a non-executive and independent Director of ArcelorMittal and a member of the ARCG Committee as well as of the Sustainability Committee. He was appointed President and Chief Executive Officer of Kinross Gold Corporation in March 2005. He held this position until August 1, 2012. Kinross is listed on the New York Stock Exchange and the Toronto Stock Exchange. Mr. Burt was also a member of the board of directors of Kinross, where he had overall responsibility for the health and safety program, now contributing this expertise on health and safety to the ArcelorMittal’s Board of Directors. Mr. Burt has broad experience in the global mining industry, specializing in corporate finance, business strategy and mergers and acquisitions. Prior to joining Kinross, he held the position of Vice Chairman and Executive Director of Corporate Development at Barrick Gold Corporation. He was President of the Cartesian Capital Group from 2000 to 2002; Chairman of Deutsche Bank Canada and Deutsche Bank Securities Canada; Global Managing Director of Global Metals and Mining for Deutsche Bank AG from 1997 to 2000; and Managing Director and Co-Head of the Global Mining Group at BMO Nesbitt Burns from 1995 to 1997, holding various other positions at BMO Nesbitt Burns from 1986 to 1995. Mr. Burt is the Chair and Principal at Carbon Arc Capital Investments Corp. and was the Life Sciences Research Campaign Chair of the University of Guelph's Better Planet Project. Mr. Burt is a member of the Board of Directors of Boart Longyear, a global leader in the drilling services and equipment industry. He is a graduate of Osgoode Hall Law School, a member of the Law Society of Ontario, and he holds a Bachelor of Arts degree from the University of Guelph. Mr. Burt is a citizen of Canada. | |||||||
177
| Management report | ||
 | Michel Wurth Non-independent Director | |||||||
69 years old Nationality: Luxembourgish Date of first election: May 2014 Term start date: May 2023 Term end date: May 2026 | Expertise and experience Michel Wurth is a non-independent Director of ArcelorMittal and a member of the Sustainability Committee. He joined Arbed in 1979 and held a variety of functions before joining the Arbed Group Management Board and becoming its chief financial officer in 1996. The merger of Aceralia, Arbed and Usinor, leading to the creation of Arcelor in 2002, led to Mr. Wurth’s appointment as Senior Executive Vice President and Chief Financial Officer of Arcelor. He became a member of ArcelorMittal’s Group Management Board in 2006, responsible for Flat Carbon Europe, Global R&D, Distribution Solutions and Long Carbon Worldwide respectively. Michel Wurth retired from the GMB in April 2014 and was elected to ArcelorMittal’s board of directors in May 2014. He holds a Law degree from the University of Grenoble, France, and a degree in Political Science from the Institut d’Études Politiques de Grenoble as well as a Master’s of Economics from the London School of Economics, UK. Mr. Wurth is also doctor of laws honoris causa of the Sacred Heart University, Luxembourg. Mr. Wurth is Chairman of ArcelorMittal Luxembourg S.A. (a wholly owned subsidiary of ArcelorMittal) as well as Vice Chairman of the supervisory board of Dillinger Hütte AG and Dillinger Hütte Saarstahl AG (associates of ArcelorMittal). Mr. Wurth is a Board member of Orion Engineered Carbon S.A. a global company active in the black carbon industry, listed on the NASDAQ. Mr. Wurth served as Chairman of the Luxembourg Chamber of Commerce between May 2004 and May 2019 and is a member of the Council of the Central Bank of Luxembourg. He is also non-executive Chairman of Paul Wurth Real Estate S.A. and member of the supervisory board of SMS Group (the controlling shareholder of Paul Wurth Real Estate S.A.), as well as non-executive Chairman of BIP Investment Partners S.A. and BIP Capital Partners S.A., and non-executive Board member of Brasserie Nationale. SMS Group is a leading family owned equipment and engineering supplier for the steel and non-ferrous metal producing industry. BIP Investment Partners and BIP Capital Partners S.A. are Luxembourg based companies organized as investment funds investing in small and mid-cap private equity and Brasserie Nationale is a privately owned brewery based in Luxembourg. Mr. Wurth is vice-chairman of the Luxembourg Red Cross. Mr. Wurth is a citizen of Luxembourg. | |||||||
 | Karyn Ovelmen Non-executive and independent Director | |||||||
60 years old Nationality: USA Date of first election: May 2015 Term start date: June 2021 Term end date: May 2024 | Expertise and experience Karyn Ovelmen is Lead Independent Director of ArcelorMittal as well as the Chairwoman of the Audit & Risk Committee and of the ARCG Committee. From January 2019 to December 31, 2019, Mrs. Ovelmen was the Gas Power Transformation Leader for the General Electric Company. Prior to that, she served as Executive Vice President and Chief Financial Officer of Flowserve, a position that she held from June 2015 to February 2017. Previously, she also served as Chief Financial Officer and Executive Vice President of LyondellBasell Industries NV from 2011 to May 2015, as Executive Vice President and Chief Financial Officer of Petroplus Holdings AG from May 2006 to September 2010 and as Executive Vice President and Chief Financial Officer of Argus Services Corporation from 2005 to 2006. Prior to that, she was Vice President of External Reporting and Investor Relations for Premcor Refining Group Inc. She also spent 12 years with PricewaterhouseCoopers, primarily serving energy industry accounts. Mrs. Ovelmen is a member of the Hess Corporation Board of Directors and a member of the Audit Committee as of November 4, 2020. She is also CFO of Newmont, a company listed on the New York Stock Exchange, as of May 18, 2023. Mrs. Ovelmen was a member of the Gates Industrial Corporation plc. Board of Directors as a non-executive director and was a member of their Audit Committee from December 2017 to March 2019. Mrs. Ovelmen holds a Bachelor of Arts degree from the University of Connecticut, USA, and is a Certified Public Accountant ("CPA"). Mrs. Ovelmen is a citizen of the United States of America. | |||||||
178
| Management report | ||
 | Karel de Gucht Non-executive and independent Director | |||||||
69 years old Nationality: Belgian Date of first election: May 2016 Term start date: May 2022 Term end date: May 2025 | Expertise and experience Karel de Gucht is a non-executive and independent Director and a member of the Audit & Risk Committee. Mr. De Gucht is a Belgian Minister of State. He was the European Commissioner for Trade in the 2nd Barroso Commission from 2010 to 2014 and for Development and Humanitarian Aid in the first Barroso Commission from 2009 to 2010. Previously, Mr. De Gucht served as Belgium's Minister of Foreign Affairs from 2004 to 2009 and Vice Prime Minister of Belgium from 2008 to 2009. In addition, in 2006, he was the Chairman in Office of the Organization for Security and Cooperation in Europe (OSCE) and Member of the Security Council of the United Nations from 2007 to 2008. Since 1991, Mr. De Gucht has been a Professor of Law at the VUB (the Dutch-speaking Free University Brussels). He is currently a member of the European Advisory Board of CVC Capital Partners, a member of the board of directors of the listed company Proximus NV and the president of the Brussels School of Governance at the VUB (Free University Brussel), a leading learning and research institute. Karel De Gucht is a member of the Board of Directors of nv EnergyVision, a non-listed company active in renewables. In the course of 2021, Mr. De Gucht has been nominated Chairman of the Board of YOUSTON NV, a non-listed Belgian company specialized in archiving, digitalization and processing. Mr. De Gucht holds a Master of Law degree from the VUB and is a Belgian citizen. | |||||||
 | Etienne Schneider Non-executive and independent Director | |||||||
52 years old Nationality: Luxembourgish Date of first election: June 2020 Term start date: May 2023 Term end date: May 2026 | Expertise and experience Etienne Schneider is a non-executive and independent Director and a member of the Audit & Risk Committee. Etienne Schneider joined the government of Luxembourg in 2012 as Minister of the Economy and Foreign Trade before being appointed Deputy Prime Minister, Minister of the Economy, Minister of Internal Security and Minister of Defense in 2013. In 2018, Mr. Schneider became Deputy Prime Minister, Minister of the Economy and Minister of Health and in February 2020 retired from politics. He has previously filled several positions as a senior civil servant, such as a research assistant at the European Parliament in Brussels, economist for the LSAP parliamentary group in the Chamber of Deputies and project leader with NATO in Brussels. He also served as a government advisor responsible for various Directorates. Mr. Schneider became a member of the executive board of several companies, such as the Société électrique de l’Our (SEO), Enovos International SA, Enovos Deutschland AG and the National Credit and Investment Company (SNCI). Upon being appointed minister in 2012, he resigned from all of these positions. In 2021, Mr. Schneider became president of the board of LuxTP, a Luxembourgish affilate of the Belgian construction company Besix Group in which he holds a position as independent board member since 2020. In 2022, Mr. Schneider became a board member of the non-listed Luxemburgish company Mikro Kapital where he has served as member of the supervisory board since January 2022. Mr. Schneider holds a degree from the Institut Catholique des Hautes Etudes Commerciales (ICHEC) in Brussels and from Greenwich University in London in commercial and financial sciences. Mr. Schneider is a citizen of Luxembourg. | |||||||
179
| Management report | ||
 | Clarissa Lins Non-executive and independent Director | |||||||
56 years old Nationality: Brazilian Date of first election: June 2021 Term start date: June 2021 Term end date: May 2024 | Expertise and experience Clarissa Lins is a non-executive and independent Director of ArcelorMittal as well as the Chairwoman of the Sustainability Committee. Mrs. Lins is a senior executive with consolidated experience in strategy, sustainability, and corporate governance. With a distinguished education background in economy, she worked on relevant projects in the public sector at the beginning of her career - she was part of Brazil’s Ministry of Finance team that produced the economic stabilization program known as the Real Plan in 1994, under President Cardoso. She also served as an Advisor to the President of Brazil’s BNDES Development Bank, participating in the structuring of the country’s large-scale privatization projects from 1995 to 1999. She was head of Corporate Strategy at Petrobras from 1999 to 2002, when the state-owned oil and gas company shifted its strategy and improved its corporate governance practices while doing an IPO at the NYSE. Mrs. Lins moved her focus more specifically towards Sustainability in 2004, when she joined the FBDS Fundação Brasileira para o Desenvolvimento Sustentável (Brazilian Foundation for Sustainable Development). In 2013, she founded the consultancy Catavento, advising corporations in the areas of strategy and sustainability. Mrs. Lins was the President of the Brazilian Institute of Petroleum and Gas (IBP) from November 2019 till March 2021, after serving as Executive Director for more than 3 years. She serves on Boards and Committees of leading companies operating in Brazil - including Suzano's Sustainability Committee (the world’s largest producer of market pulp), the Board of Directors of Votorantim Cimentos and Vibra Energia (listed at the Brazilian stock exchange). Other companies in which she has held relevant Board Committee positions include Shell, Vale and Petrobras. Mrs. Lins is a citizen of Brazil. | |||||||
 | Patricia Barbizet Non-executive and independent Director | |||||||
68 years old Nationality: French Date of first election: May 2023 Term start date: May 2023 Term end date: May 2026 | Expertise and experience Mrs. Patricia Barbizet is a non-executive and independent Director and a member of the Audit & Risk Committee. Mrs. Barbizet is Chief Executive Officer of Temaris & Associés, lead independent director of Pernod Ricard (listed company). In addition, she is chairwoman of AFEP (Association française des entreprises privées) and a member of the Board of Directors of CMA CGM. She started her career as International Treasurer in Renault Véhicules Industriels, and then as Chief Financial Officer of Renault Crédit International. In 1989, Mrs. Barbizet joined the Groupe Pinault as Chief Financial Officer. She was Chief Executive Officer of Artémis, the investment company of the Pinault family, from 1992 to 2018. Mrs. Barbizet was Chief Executive Officer and chairwoman of Christie’s International from 2014 to 2016, served as a qualified independent member on the Boards of PSA Peugeot-Citroen, Air France-KLM, Groupe Bouygues, FNAC-DARTY, AXA, Total, as well as chairwoman of the Investment Committee of the “Fond Stratégique d’Investissement” from 2008 until 2013, and chairwoman of the "Comité de surveillance des investissements d'avenir" of the Secrétariat Général pour l'Investissement (SGPI) until 2023. Mrs. Barbizet graduated from the École Supérieure de Commerce de Paris (ESCP Business School). Mrs. Barbizet is a citizen of France. | |||||||
180
| Management report | ||
Senior management
As of December 31, 2023, ArcelorMittal’s senior management was comprised of the Executive Office supported by nine other Executive Officers. ArcelorMittal’s Executive Office was comprised of the Executive Chairman, Mr. Lakshmi N. Mittal and the CEO, Mr. Aditya Mittal. Together, the Executive Officers are
responsible for the implementation of the Company strategy, overall management of the business and all operational decisions.
| Name | Age | Position | ||||||||||||
Lakshmi N. Mittal1 | 73 | Executive Chairman of ArcelorMittal | ||||||||||||
Aditya Mittal1 | 47 | Chief Executive Officer of ArcelorMittal | ||||||||||||
Genuino Christino1 | 52 | Chief Financial Officer of ArcelorMittal | ||||||||||||
Stefan Buys1 | 52 | Executive Vice President, CEO ArcelorMittal Mining | ||||||||||||
Jefferson de Paula1 | 65 | Executive Vice President, CEO ArcelorMittal South America Long | ||||||||||||
Geert Van Poelvoorde1 | 58 | Executive Vice President, CEO ArcelorMittal Europe | ||||||||||||
John Brett1 | 58 | Executive Vice President, CEO ArcelorMittal North America | ||||||||||||
Bradley Davey1 | 59 | Executive Vice President and Head of Corporate Business Optimization | ||||||||||||
Vijay Goyal1 | 52 | Executive Vice President, CEO CIS | ||||||||||||
Dilip Oommen1 | 65 | Executive Vice President, CEO AMNS India | ||||||||||||
Stephanie Werner-Dietz1 | 51 | Executive Vice President, Head of HR | ||||||||||||
1.Age and position as of December 31, 2023.
Lakshmi N. Mittal (See “—Board of Directors”).
Aditya Mittal (See "—Board of Directors").
 | Genuino M. Christino Member of the Group management committee, Chief Financial Officer. | |||||||
52 years old Nationality: Brazilian | Expertise and experience Genuino M. Christino is the Chief Financial Officer and Executive Vice President of ArcelorMittal since February 2021. He is a member of the Group management committee since 2016. Prior to Mr. Christino’s appointment as Chief Financial Officer, he was the Group Head of Finance since 2016. As Chief Financial Officer, Mr. Christino is responsible for all of the Company’s financial functions, including treasury, corporate finance, accounting, performance management, insurance and investor relations. In addition, Mr. Christino oversees Group's Merger & Acquisitions, Legal and IT activities and is a member of the Company’s Investment Allocation Committee. Mr. Christino also heads the Company’s Corporate Finance and Tax Committee where all key financial transactions of the Group are reviewed and approved. Prior to joining the ArcelorMittal in 2003, Mr. Christino had spent ten years at KPMG in Brazil and in the United Kingdom, as an auditor and a consultant. Mr. Christino holds a bachelor’s degree in accounting and business administration from the Universidade Paulista in São Paolo, Brazil and has also completed an Executive MBA Program from the Dom Cabral Foundation in Belo Horizonte, Brazil. Mr. Christino is a citizen of Brazil. | |||||||
181
| Management report | ||
 | Stefan Buys Member of the Group management committee, CEO of ArcelorMittal Mining. | |||||||
52 years old Nationality: Australia and South Africa | Expertise and experience Stefan Buys is a member of the Group management committee and the CEO of ArcelorMittal Mining. He joined the group on October 1, 2021. He has more than 28 years’ experience in the mining and minerals industry, starting his career in 1994 at Iscor Vanderbijlpark in South Africa. He joined Xstrata in 1995 and led various operational units, with his last role being Chief Operating Officer of Xstrata Copper North Chile. In 2010, he joined BHP as Asset President Olympic Dam and later served as Project Director Organization Design. In 2018, he joined RioTinto as Managing Director Pilbara Mines, leading the iron ore mining operations in the Pilbara. He holds a bachelor’s degree in metallurgical engineering from the University of Pretoria, a post graduate diploma in management from the University of South Africa and a post graduate diploma in teaching from the University of Western Australia. Mr. Buys holds dual citizenship in Australia and South Africa. | |||||||
 | Jefferson de Paula Member of the Group management committee, President of ArcelorMittal Brasil, CEO of ArcelorMittal Long LATAM and Mining Brazil. | |||||||
65 years old Nationality: Brazilian | Expertise and experience Jefferson de Paula is a member of the Group management committee, President of ArcelorMittal Brazil, CEO of ArcelorMittal Long LATAM and Mining Brazil. Counting over 36 years of work in the steel industry, Mr. De Paula has been with the Group since 1991, occupying several executive positions in Brazil, Argentina, Americas and Europe. He is Vice President of the Federation of Industries of the State of Minas Gerais (FIEMG), Chairman of Brazil Steel Institute (IABr), a member of the Board of Directors of the Latin American Steel Association (ALACERO). Mr. De Paula is graduated in metallurgical engineering from Universidade Federal Fluminense (Brazil) and has attended to senior executive courses from Insead (France) and from Kellogg - Northwestern University (USA). Mr. de Paula is a citizen of Brazil. | |||||||
182
| Management report | ||
 | Geert Van Poelvoorde Member of the Group management committee. CEO ArcelorMittal Europe | |||||||
58 years old Nationality: Belgian | Expertise and experience Geert Van Poelvoorde is a member of the Group management committee. He started his career in 1989 as a project engineer at the Sidmar Ghent hot strip mill, where he held several senior positions in the automation and process computer department. He moved to Stahlwerke Bremen in 1995 as senior project manager. Between 1998 and 2002, he headed a number of departments, and in 2003 he was appointed director of Stahlwerke Bremen, responsible for operations and engineering. In 2005, Mr. Van Poelvoorde returned to ArcelorMittal Ghent to take up the position of Chief Operating Officer. In 2008, he became CEO of ArcelorMittal Ghent with direct responsibility for primary operations. He was appointed CEO of the Business Division North within Flat Carbon Europe in 2009. In January 2014, he was appointed CEO of Flat Carbon Europe and Purchasing and in February 2021, he became CEO of ArcelorMittal Europe. Since November 2015, he is a member of the executive committee of Eurofer (as president between 2015 and the end of 2022), the European steel federation and is serving on several boards. He graduated from the University of Ghent with a degree in civil engineering and electronics. Mr. Van Poelvoorde is a citizen of Belgium. | |||||||
 | John Brett Member of the Group management committee, Chief Executive Officer of ArcelorMittal North America. | |||||||
58 years old Nationality: USA | Expertise and experience John Brett, is a member of the Group management committee, an Executive Vice-President and the Chief Executive Officer of ArcelorMittal North America. He joined the group at former Inland Steel in 1988 as an associate accountant, and progressed to become a manager specializing in financial analysis and systems in 1997. In 1998, Mr. Brett took on the role of controller for Ispat Inland Steel and in 2005, he was promoted to vice president, finance and planning and controller for Mittal Steel USA. In 2012, Mr. Brett was appointed executive vice president finance, planning and procurement for ArcelorMittal USA. Prior to becoming CEO of ArcelorMittal North America in January 2021, Mr. Brett was CEO of ArcelorMittal USA. Mr. Brett holds an MBA from the University of Chicago and is a graduate in economics from DePauw University. Mr. Brett is a citizen of the United States of America. | |||||||
183
| Management report | ||
 | Bradley Davey Member of the Group management committee, Head of Corporate Business Optimization. | |||||||
59 years old Nationality: Canadian | Expertise and experience Bradley Davey is a member of the Group management committee, Executive Vice President and Head of Corporate Business Optimization. He joined Dofasco in 1986 as a project engineer in the central maintenance department, joined assigned maintenance in 1989, and then the hot strip mill ("HSM") in 1990. He held various positions in the HSM before becoming a Business Unit Manager in 1996. He gained international manufacturing experience through this role by leading two separate multi-year technical exchanges and through leading Dofasco’s HSM modernization project. In 2002, he changed careers to marketing as a Manager Strategic Marketing, led Dofasco’s Marketing process redesign project before becoming General Manager of Marketing in 2005, then to Director of Industry Sales in 2007, and then Vice President Commercial in 2008. In 2014, he added CMO North America Automotive, then became CMO North America Flat Rolled later in 2014. In 2016, he became CMO of Global Automotive along with CMO North America. In 2018, Mr. Davey became CEO of ArcelorMittal North America and held this position until his nomination to Head of Corporate Business Optimization early April 2021. Currently based in Canada, Mr. Davey has responsibility for Global Automotive, R&D, CTO, Corporate Health and Safety, Commercial Coordination, Corporate Capital Goods Procurement, Corporate Communications and Corporate Responsibility, Automotive, JV’s in China and India, Tailored Blanks Americas, and is Vice Chairman of the Investment Allocation Committee. Mr. Davey holds a mechanical engineering degree from McMaster University, Canada. Mr. Davey is a citizen of Canada. | |||||||
 | Vijay Goyal Member of the Group management committee, Chief Executive Officer of ArcelorMittal CIS. | |||||||
52 years old Nationality: Indian | Expertise and experience Vijay Goyal is a member of the Group management committee and the Chief Executive Officer of ArcelorMittal CIS (ArcelorMittal Kryvyi Rih, Ukraine and recently divested ArcelorMittal Temirtau, Kazakhstan). The joint venture ArcelorMittal Tubular Products Jubail is also part of his scope. After having started his career as an internal auditor at ITC Ltd in India, he joined Mittal Steel in 1999 and held various positions in the finance function. In 2007, he was nominated as CFO and Head of Strategy for Long Carbon Europe, followed by his appointment as CFO and Head of central supply chain of Flat Carbon Europe in 2008. From 2014 to 2016, he was CFO of ArcelorMittal Europe, additionally in charge of legal, IT and the Shared Service Center Europe before being appointed CEO of ArcelorMittal Downstream Solutions and member of the Group Management Committee in October 2016. During 2019, he focused on the leadership of strategic projects for ArcelorMittal, primarily with respect to the acquisition of ESIL with the Company's joint venture partner NSC to create AMNS India, prior to his appointment as CEO of ArcelorMittal CIS from January 2020 onwards. Mr. Goyal is a graduate from St. Xavier’s College, Calcutta. He is a chartered accountant and cost and works accountant from the respective institutes in India. In 2021, he was recognized with the “Global Achiever” award by The Institute of Chartered Accountants of India. He has also completed executive education programs at Wharton Business School. Mr. Goyal is a citizen of India. | |||||||
184
| Management report | ||
 | Dilip Oommen Member of the Group management committee, Chief Executive Officer of AMNS India. | |||||||
65 years old Nationality: Indian | Expertise and experience Dilip Oommen is a member of the Group management committee. He was appointed CEO of AMNS India in December 2019 after the acquisition of ESIL. He has more than 40 years of experience in the steel industry. Mr. Oommen joined ESIL in 2003 as chief operating officer, before moving to senior leadership positions within the company. He was appointed Managing director and Chief Executive Officer of ESIL in 2019. Prior to joining ESIL, Mr. Oommen had worked in various leadership roles in Hadeed (SABIC), both in Long and Flat Product divisions. In 2020, Mr. Oommen was elected President of the Indian Steel Association, the industry body that represents major public and private sector steel companies in India. He has also served in the past as Co-Chair of the Federation of Indian Chambers of Commerce & Industry’s ("FICCI") Steel Committee, one of several industry leadership roles he has taken on during his career. He is also a member of the Advisory Committee of the Steel Ministry of India. Mr. Oommen is a metallurgical engineer from the Indian Institute of Technology, Kharagpur. He has attended several management and technical programs across the globe. Mr. Oommen is a citizen of India. | |||||||
 | Stephanie Werner-Dietz Member of the Group management committee. Head of HR | |||||||
51 years old Nationality: German | Expertise and experience Stephanie Werner-Dietz is a member of the Group management committee. She was appointed head of human resources on September 1, 2022. She joined ArcelorMittal with a long ranging HR experience of almost 25 years at Nokia, which she joined in 1998. Throughout her career, Mrs. Werner-Dietz has held different HR leadership positions in various countries. She held multiple HR business partner and expert roles across the company, and she was chief people officer of Nokia, based in Finland from January 2020 until her arrival at ArcelorMittal. Mrs. Werner-Dietz is a graduate in applied business languages (Chinese) and international business studies from the University of Applied Sciences of Bremen, Germany. Mrs. Werner-Dietz is a citizen of Germany. | |||||||
185
| Management report | ||
Compensation
| Content | |||||
| Annual statement from the Chairman of ARCG Committee | |||||
| Board of Directors | |||||
| Remuneration at a glance - senior management | Overview of the Company's remuneration policy and rationale of each performance metric | ||||
Remuneration at a glance - 2023 pay outcomes | Comparison of pay outcomes 2023 vs. 2022 vs. 2021 vs. 2020 vs. 2019 Explanation of results for 2022 short-term incentives paid in 2023 | ||||
| Remuneration | |||||
| Remuneration strategy | Explanation of what informs the ARCG's decision on pay | ||||
| Remuneration policy | Explanation of policies applied to senior management | ||||
| Remuneration mix | Overview of the remuneration mix for senior management | ||||
2023 Total remuneration | Overview of 2023 outcomes | ||||
| Short-term incentives | Description of short-term incentives plan ("STI") | ||||
| ArcelorMittal Equity Incentive Plan | Description of long-term incentive plan ("LTIP" or "LTI"s) | ||||
| Other benefits | Description of other benefits | ||||
Clawback | |||||
| Abbreviations | |||||
| EBITDA | Operating income plus depreciation, impairment expenses and exceptional items | ||||
| FCF | Free cash flow | ||||
| STI | Short-term incentives | ||||
| LTI/LTIP | Long-term incentives (plans) | ||||
| EPS | Earnings per share | ||||
| ESG | Environment, social and governance | ||||
| PSU | Performance share units | ||||
| RSU | Restricted share units | ||||
| ROCE | Return on capital employed | ||||
| TSR | Total shareholder return | ||||
186
| Management report | ||
Annual statement from the Chairwoman of ARCG Committee
Dear Shareholders,
In my capacity of Appointments, Remuneration & Corporate Governance Committee (“ARCG”) chair I would like to provide you with a summary of the Committee’s major focus and with an overview of the main actions taken, and to be taken, in the field of Health and Safety, people strategy, remuneration, successions and nominations.
Health and Safety
In recent years, we have intensified our focus on safety considerably and have benefitted from the positive interaction with the Board’s Sustainability Committee. However, in 2023, 61 colleagues have lost their lives in accidents in the Company’s operations, and we cannot conclude that we are where we would like to be on health and safety. We were shocked by the tragic accident at our Kostenko coal mine in Kazakhstan on October, 28 2023, in this terrible accident a total of 46 employees have lost their lives. No words can adequately convey the devastation we feel following this accident. Everything that can be done was done to support the families in Kazakhstan who have lost loved ones through this deeply painful time. Assistance to bereaved families includes all funeral and memorial expenses, a one-off payment equivalent to ten years’ salary, purchasing housing, repaying personal loans, and the covering of all education fees for children up to the age of 23.
On December 7, 2023, ArcelorMittal closed the transaction with the Government of Kazakhstan for the sale of its Kazakhstan business. This followed discussions that have taken place over several months, during which both parties have been focused on securing the best possible future for the company and its people. It is a matter of great regret that our departure from Kazakhstan followed so closely on the tragic recent accident at Kostenko. We aligned together many months ago on this change of ownership being in the best interests of the asset, its people, its wider communities and indeed all stakeholders.
The focus now is to identify any gaps that existed in the health and safety approach and strengthen existing safety actions to reach our target of zero fatalities and severe injuries. The audit of the Company’s safety practices has now commenced and will support our pathway to zero serious injuries and fatalities. The external consultant will be focused on three key areas:
•Comprehensive Fatality Prevention Standards audits for the three main occupational risks leading to Serious Injuries and Fatalities.
•Expert input into our planned CTO-led process risk management safety audits of our highest priority countries and assets.
•In depth assessments of all health and safety systems, processes, structures, and capabilities; governance and assurance processes; and systems and data management.
While the audit is ongoing, the Company has been reinforcing many of the safety actions that have been underway based on the twin pillar of risk management and cultural change. There are indications that the actions taken are working. Excluding the Kazakhstan operations, the safety performance in our steel business was 25% lower than the best ever result achieved by the World Steel Association, and this is an excellent achievement by any standards, although until that number reaches zero, we can take no satisfaction.
Business and results
We have delivered a strong set of financials in 2023, which reflects the structural improvement that we have made to our cost base, asset portfolio and balance sheet in recent years. We have all worked hard in recent years to enable the Company to thrive and generate cash in all market conditions. We have demonstrated again in 2023 — resilient cash flow, despite the operating environment becoming more challenging as the year progressed. This supported by 2023 profitability per tonne being above average levels achieved in the 2012- 2022 period. Net debt in 2023 stood comfortably at $2.9 billion. As such, the Board proposes to increase the annual base dividend to shareholders to $0.50/share and will continue to return a minimum 50% of post-dividend free cash flow to shareholders through the buyback programs.
It is clear that our results focused Long-term and Short-term Incentive Plans and the challenging targets set by our Committee are a major factor in driving these results.
People strategy, Remuneration, nomination, and governance
During the annual general meeting of shareholder held in May 2023, Mrs. Patricia Barbizet was elected as a new member of the Board of Directors for a three-year mandate that will expire on the date of the annual general meeting of shareholders to be held in 2026. The same day at the Board of Directors’ meeting Mrs. Barbizet was appointed as member of the Audit & Risk Committee and I was appointed as new Lead Independent Director and chair of the ARCG Committee, succeeding Mr. Bruno Lafont whose mandate has ended.
During 2023, the ARCG Committee conducted the Annual Self-Assessment of the Board of directors, which has shown that the Company continues to place a ubiquitous focus on the Health and Safety improvement (including fatality reduction), decarbonization and other ESG measures, but also on deployment of capital in the long term and for the interests of investors. The Committee reviewed the long-term incentive plans for Executive Officers and ArcelorMittal equity plan for 2024.
187
| Management report | ||
The Committee had requested benchmarking of ArcelorMittal Health & Safety related incentives with other steel and mining companies, and we found that we are well aligned with industry best practice.
As for the succession plan, the Committee is annually reviewing the succession plan for our Executive Office and Executive Vice Presidents and this review was conducted in the second half of 2023. The Committee was working on the search for a non-executive Director to be appointed at the annual general meeting on April 30, 2024. This process is ongoing.
Climate and Sustainability
As we grow, we must simultaneously progress towards net zero. A transformation of the scale and depth we need to undertake is complex and challenging. Our existing capabilities in low-carbon metallics and EAF steel- making provide a unique competitive advantage as we offer an increasingly broad range of low- carbon intensity steel products to our customers.
Going forward and closing remarks
Safety will be the number one focus for 2024. As the audit completes, the key recommendations are published, and we work to progress towards our target of zero serious injuries and fatalities.
At the same time, we are now in a position where we have a strong balance sheet, we are increasing the dividend to shareholders and many of the strategic growth projects are due to complete this year. The Company is well positioned to take advantage of a market which has early signs of a more constructive industry backdrop.
Yours Sincerely,
Karyn Ovelmen
188
| Management report | ||
Board of Directors
Directors’ fees
The ARCG Committee of the Board of Directors prepares proposals on the remuneration to be paid annually to the members of the Board of Directors.
At the May 2, 2023 annual general meeting of shareholders, the shareholders approved the annual remuneration for non-executive directors for the 2022 financial year, based on the following annual fees (euro denominated amounts are translated into U.S. dollar as of December 31, 2022):
•Basic director’s remuneration: €158,095 ($168,624);
•Lead Independent Director’s remuneration: €222,985 ($237,836);
•Additional remuneration for the Chair of the Audit & Risk Committee: €30,675 ($32,718);
•Additional remuneration for the other Audit & Risk Committee members: €18,877 ($20,134);
•Additional remuneration for the Chairs of the other committees: €17,697 ($18,876); and
•Additional remuneration for the members of the other committees: €11,798 ($12,584).
•Additional remuneration for the Chair of the special committee: €12,500 ($13,333)
•Additional remuneration for the members of the special committee: €10,000 ($10,666).
The total annual remuneration of the members of the Board of Directors for their service for the last five financial years was as follows:
| Year ended December 31, | ||||||||||||||||||||
| (Amounts in $ thousands except Long-term incentives information) | 2023 | 2022 | 2021 | 2020 | 2019 | |||||||||||||||
Base salary1 | 3,214 | 3,199 | 3,483 | 2,635 | 1,569 | |||||||||||||||
| Director fees | 1,658 | 1,676 | 1,784 | 1,706 | 1,554 | |||||||||||||||
Short-term performance-related bonus1 | — | 6,388 | 5,133 | 935 | 3,198 | |||||||||||||||
Long-term incentives 1, 2 | 141,973 | 141,564 | 109,143 | 148,422 | 89,933 | |||||||||||||||
1Includes Executive Chairman and CEO in 2023, 2022 and 2021, Chairman and CEO and President and CFO in 2020 and Chairman and CEO in 2019. Slight differences between the years are possible, due to foreign currency effects.
2See “Management and employees—Compensation—Remuneration—ArcelorMittal Equity Incentive Plan.”
The annual remuneration for the last five financial years to the current and former members of the Board of Directors for services in all capacities in the years in which they were Directors was as follows:
| (Amounts in $ thousands) | 20231 | 20221 | 20211 | 20201 | 20191 | |||||||||||||||
| Lakshmi N. Mittal | 1,536 | 1,529 | 1,700 | 1,374 | 1,569 | |||||||||||||||
| Aditya Mittal | 1,678 | 1,670 | 1,783 | 1,261 | — | |||||||||||||||
| Vanisha Mittal Bhatia | 175 | 169 | 176 | 186 | 171 | |||||||||||||||
| Suzanne P. Nimocks | — | 76 | 189 | 200 | 183 | |||||||||||||||
| Bruno Lafont | 96 | 277 | 302 | 306 | 280 | |||||||||||||||
| Tye Burt | 201 | 194 | 194 | 200 | 183 | |||||||||||||||
| Karyn Ovelmen | 269 | 201 | 221 | 223 | 204 | |||||||||||||||
| Jeannot Krecké | — | — | — | 78 | 171 | |||||||||||||||
| Michel Wurth | 188 | 181 | 181 | 186 | 171 | |||||||||||||||
| Karel de Gucht | 196 | 189 | 208 | 209 | 191 | |||||||||||||||
| Etienne Schneider | 196 | 189 | 197 | 118 | — | |||||||||||||||
| Clarissa Lins | 207 | 200 | 116 | — | — | |||||||||||||||
Patricia Barbizet | 130 | — | — | — | — | |||||||||||||||
| Total | 4,872 | 4,875 | 5,267 | 4,341 | 3,123 | |||||||||||||||
1.Remuneration for non-executive Directors with respect to 2023 will be paid in 2024 subject to Board of Directors proposal and to the shareholder approval at the annual general meeting to be held on April 30, 2024. Remuneration for non-executive Directors with respect to 2022, 2021, 2020 and 2019 was paid in 2023, 2022, 2021 and 2020, respectively, following the shareholder approval at the annual general meetings held on May 2, 2023, on May 4, 2022, June 8, 2021 and June 13, 2020, respectively. Slight differences between the years are possible, due to foreign currency effects.
189
| Management report | ||
Except for the Executive Chairman and the CEO, members of the Board of Directors have not received any remuneration from any subsidiary of the Group in 2023.
The annual remuneration for the last five financial years on a full-time equivalent basis of employees of ArcelorMittal S.A. was as follows:
| (Amounts in $ thousands) | 2023 | 20221 | 20211 | 20201 | 20191 | ||||||||||||
| Average Remuneration | 502 | 446 | 446 | 412 | 389 | ||||||||||||
1.The annual remuneration is calculated for approximately 14 employees with a labor contract with ArcelorMittal S.A (not including any employees employed by other entities within the Group).
ArcelorMittal has performed a benchmarking on remuneration with its selected peers and fixed the remuneration of the employees and Directors based on the outcome of that exercise.
The policy of the Company is not to grant any share-based remuneration to members of the Board of Directors who are not executives of the Company. As of December 31, 2023, ArcelorMittal did not have any loans or advances outstanding to
members of its Board of Directors and ArcelorMittal had not given any guarantees in favor of any member of its Board of Directors. None of the members of the Board of Directors, other than the CEO, benefit from an ArcelorMittal pension plan. Short-term incentives paid to executive directors (including the current CEO beginning in 2020) were as follows for the last five financial years:
| Short-term Incentives | ||||||||||||||||||||
| 2023 | 2022 | 2021 | 2020 | 2019 | ||||||||||||||||
| Lakshmi N. Mittal | — | 3,053 | 2,908 | — | 3,198 | |||||||||||||||
| Aditya Mittal | — | 3,335 | 2,226 | 935 | — | |||||||||||||||
The following tables provide a summary of the PSUs granted (long-term incentives) to the executive directors on the Board of Directors (including the current CEO beginning in 2020), as of
December 31, 2023. There were no outstanding stock options as of December 31, 2023.
PSUs granted in 2023 | PSUs granted in 2022 | PSUs granted in 2021 | PSUs granted in 2020 | PSUs granted in 2019 | |||||||||||||
| Lakshmi N. Mittal | 67,857 | 67,662 | 52,166 | 77,372 | 89,933 | ||||||||||||
| Aditya Mittal | 74,116 | 73,902 | 56,977 | 71,050 | — | ||||||||||||
| Term (in years) | 3 | 3 | 3 | 3 | 3 | ||||||||||||
Vesting date1 | January 1, 2027 | January 1, 2026 | January 1, 2025 | January 1, 2024 | January 1, 2023 | ||||||||||||
1.See “Management and employees—Compensation—Remuneration—ArcelorMittal Equity Incentive Plan", for vesting conditions.
190
| Management report | ||
Remuneration at a glance - senior management
The following table provides a brief overview of the Company’s remuneration policy for senior management. Additional information is provided below.
| ArcelorMittal's Remuneration Policy | ||||||||||||||
| Remuneration | Period | Strategy | Characteristic | |||||||||||
| Salary | 2023 | Recruitment and retention | l | Reviewed annually by the ARCG Committee considering market data | ||||||||||
| l | Increases based on the Company performance and individual performance | |||||||||||||
| STI | 2023 | Delivery of strategic priorities and financial success | l | Maximum STI award of 270% of base salary for the Executive Chairman, and the CEO and in general 157.5% of base salary for other Executive Officers | ||||||||||
| l | 100% STI paid in cash | |||||||||||||
| l | ArcelorMittal's first priority Health and Safety is part of the STI | |||||||||||||
| l | Overperformance towards competition | |||||||||||||
| LTIP | 2024-2026 | Encourages long term shareholder return | l | Performance share units granted with a face value of 120% of base salary for the Executive Chairman and CEO Performance share units / Restricted share units granted with a face value of 100%-120% of base salary as a guideline for other Executive Officers depending on the region | ||||||||||
| l | Shares vest after a three-year performance period for Performance share units and after a three-year period for Restricted share units | |||||||||||||
| l | Performance related vesting and/or employment related vesting | |||||||||||||
Key Performance Metrics from 2023 | |||||||||||
| Metrics | Scheme | Rationale | |||||||||
| EBITDA | STI | l | Demonstrates growth and operational performance of the underlying businesses | ||||||||
| FCF | STI | ||||||||||
| Gap to competition | STI / LTIP | l | Outperform peers | ||||||||
| Health & Safety | STI / LTIP | l | Employee health and safety is a core value for the Company | ||||||||
| ESG | LTIP | l | Improve health & safety outcome, achieve decarbonization and diversity & inclusion targets | ||||||||
| EPS | LTIP | l | Links reward to delivery of underlying equity returns to shareholders | ||||||||
| TSR | LTIP | l | Creates a direct link between executive pay and shareholder value | ||||||||
| l | Comparison with a peer group of companies | ||||||||||
191
| Management report | ||
Remuneration at a glance - 2023 Pay outcomes
The following graphics present in thousands of U.S. dollar the compensation paid to the Executive Chairman (CEO until February 11, 2021) in 2023, 2022, 2021, 2020 and 2019 and to the CEO (President and CFO until February 11, 2021) in 2023, 2022, 2021 and 2020. Amounts presented for the CFO and other Executive Officers relate to the former President and CFO (Aditya Mittal) and other Executive Officers until February 11, 2021 and to the CFO and other Executive Officers thereafter. Information with respect to total remuneration paid is provided under “—Remuneration—2023 Total remuneration” below.
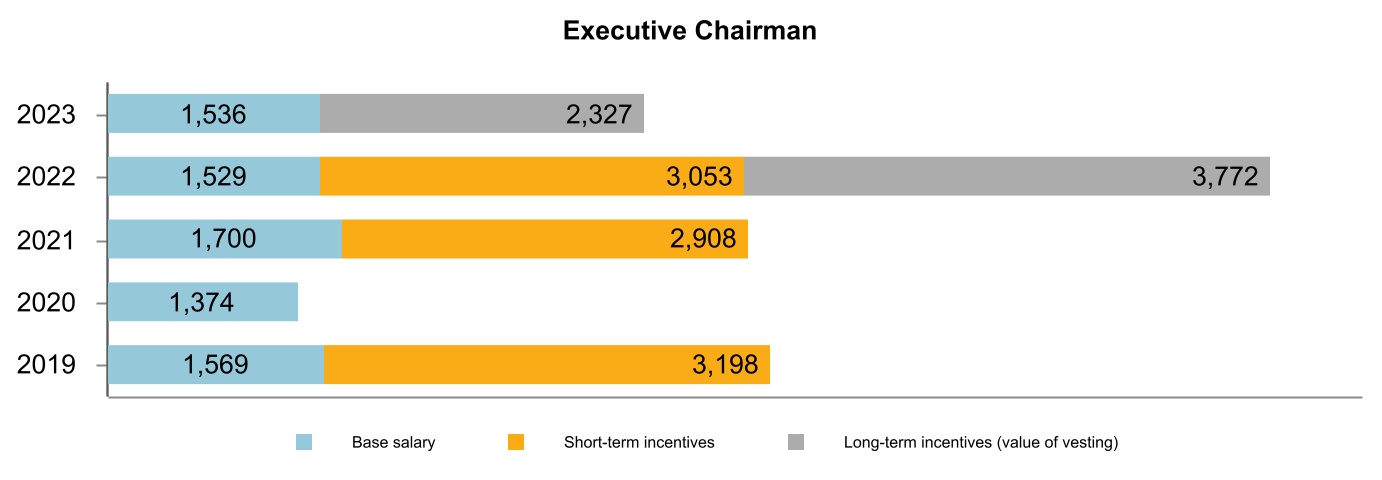
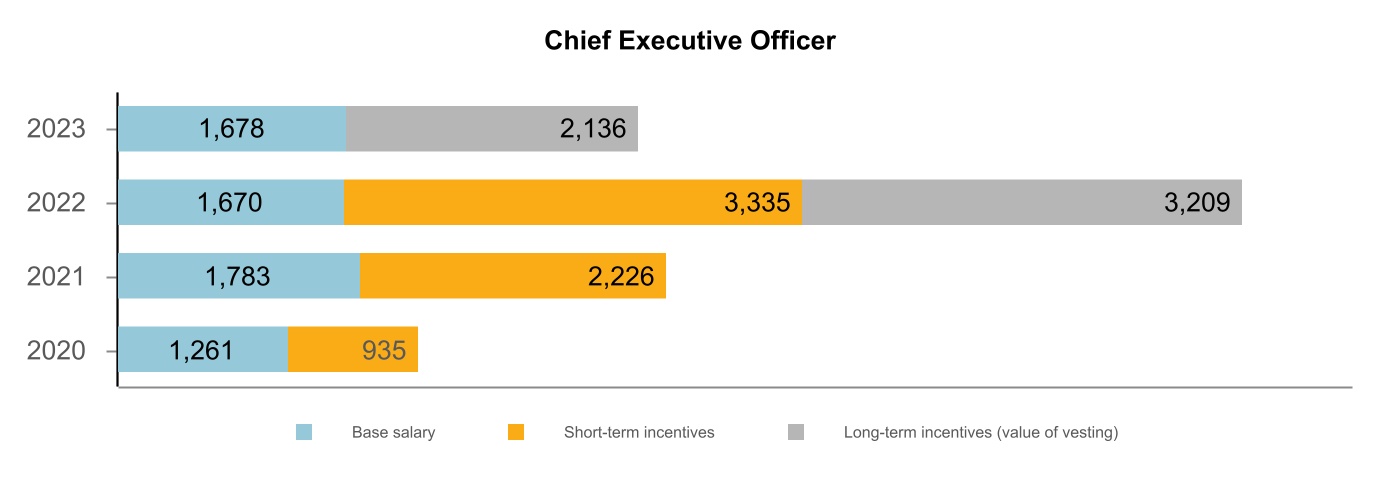
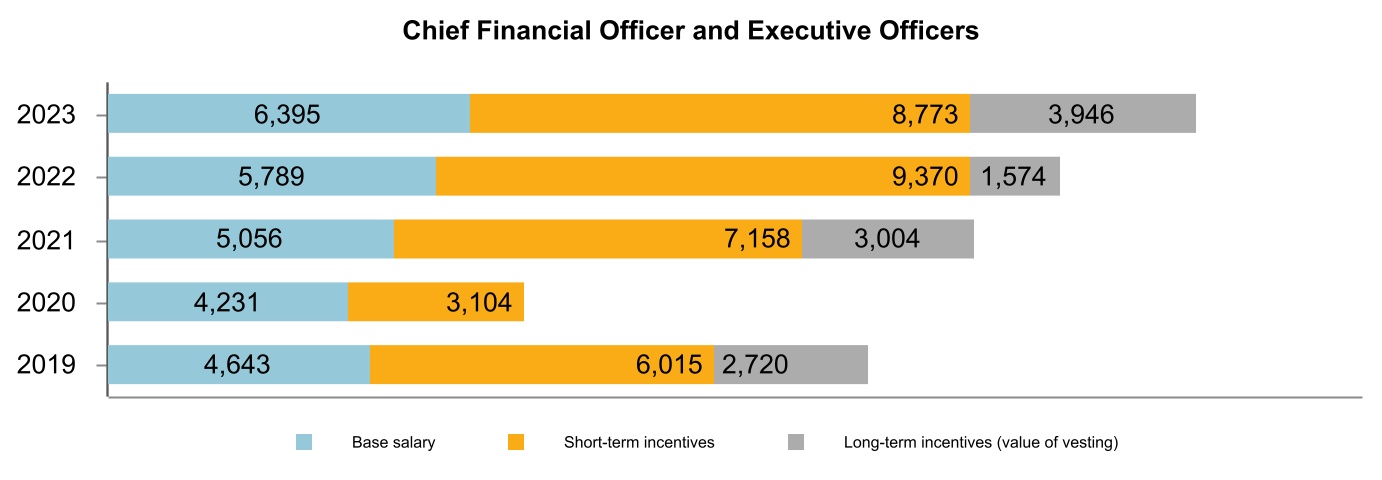
192
| Management report | ||
2022 short-term incentives paid in 2023
| Business Units | Executive | Realization as % of business target | ||||||
Executive Office | Lakshmi N. Mittal Aditya Mittal | Executive office renounced their short-term incentive | ||||||
Mining* | Stefan Buys | 75% | ||||||
| NAFTA | John Brett | 107% | ||||||
| Corporate* | Genuino Christino | 114% | ||||||
| Corporate* | Bradley Davey | 114% | ||||||
Corporate* | Stephanie Werner-Dietz | 114% | ||||||
| CIS* | Vijay Goyal | 96% | ||||||
AMNS India* | Dilip Oommen | 95% | ||||||
Flat Carbon Europe | Geert van Poelvoorde | 124% | ||||||
| Long Carbon South America | Jefferson de Paula | 150% | ||||||
Note: Individual performance not included in the percent of realization.
*Health & Safety part of the bonus was nil due to the number of fatalities.
Long-term incentives vesting in 2023
Executive office
In 2023, the following long-term incentives vested:
| Vehicle | Date of vesting | Date of grant | Number of PSUs granted to Executive office and outstanding | Number of shares acquired by Executive office | ||||||||||
| PSUs | January 1, 2023 | December 16, 2019 | 172,517 | 160,699 | ||||||||||
CFO and Other Executive Officers
In 2023, the following long-term incentives vested:
| Vehicle | Date of vesting | Date of grant | Number of PSUs and RSUs granted to CFO and other Executive officers and outstanding | Number of shares acquired by CFO and other Executive officers | ||||||||||
| PSUs | January 1, 2023 Performance approved by the ARCG Committee on March 16, 2023 | December 16, 2019 | 77,800 | 77,800 | ||||||||||
RSU | May 7, 2023 | May 7, 2021 | 22,500 | 22,500 | ||||||||||
RSU | December 14, 2023 | December 14, 2020 | 44,200 | 44,200 | ||||||||||
Remuneration
Remuneration strategy
The ARCG Committee assists the Board of Directors to maintain a formal and transparent procedure for setting policy on senior management's remuneration and to determine an appropriate remuneration package for senior management. The ARCG Committee should ensure that remuneration arrangements
support the strategic aims of the business and enable the recruitment, motivation and retention of senior executives while complying with applicable rules and regulations.
Board oversight
To this end, the Board of Directors has established the ARCG Committee to assist it in making decisions affecting employee remuneration. All members of the ARCG Committee are required to be independent under the Company’s corporate
193
| Management report | ||
governance guidelines, the NYSE standards and the 10 Principles of Corporate Governance of the Luxembourg Stock Exchange.
The members are appointed by the Board of Directors each year after the annual general meeting of shareholders. The members have relevant expertise or experience relating to the purposes of the ARCG Committee. The ARCG Committee makes decisions by a simple majority with no member having a casting vote and is chaired by Ms. Karyn Ovelmen, Lead Independent Director.
Appointments, remuneration and corporate governance committee
Regarding compensation, the objective of the ARCG Committee is to assist the Board of Directors with respect to the following:
•review and approve corporate goals and objectives regarding remuneration relevant to the Executive Office and Executive Officers and other members of executive management as deemed appropriate by the committee, and assess performance against goals and objectives;
•make recommendations to the Board of Directors with respect to incentive remuneration plans and equity-based plans;
•submit proposals to the Board of Directors on the remuneration of the members of the Executive Office and Executive Officers:
•make recommendations to the Board of Directors in respect of the Company’s framework of remuneration for the members of the Executive Office and Executive Officers and such other members of the executive management as designated by the committee. In making such recommendations, the committee may take into account factors that it deems necessary. This may include a member’s total cost of employment (factoring in equity/long term incentives, any perquisites and benefits in kind and pension contributions).
Individual remuneration is discussed by the ARCG Committee without the person concerned being present. The ARCG Committee Chair presents her decisions and findings to the Board of Directors after each ARCG Committee meeting.
See also "Corporate governance—Board of Directors committees"' for further details and additional responsibilities of the ARCG Committee.
Remuneration policy
The ARCG Committee set policies applied to senior management on base salary, short-term incentives and long-
term incentives. According to the Shareholders Right Directive II, that was transposed into Luxembourg law in August 1, 2019, the remuneration policies must be approved at the Annual General Meeting of shareholders at least every 4 years and whenever there is a material change.
Scope
ArcelorMittal’s remuneration philosophy and framework apply to the following groups of senior management:
•the Executive Chairman and the CEO; and
•the CFO and other Executive Officers.
The remuneration philosophy and governing principles also apply, with certain limitations, to a wider group of employees including Executive Vice Presidents, Vice Presidents, General Managers and Managers.
Remuneration philosophy
ArcelorMittal’s remuneration philosophy for its senior management is based on the following principles:
•provide total remuneration competitive with executive remuneration levels of peers of similar size, scope and industry:
–Korn Ferry (KF) and WillisTowersWatson (WTW) provide benchmarking services to ArcelorMittal for all Management Committee members, an average between KF and WTW data is performed;
–For the Steel division: Large industry - industrial segment including metals, chemicals, mining, transport, energy & utilities, upper revenues range;
–For the Mining division: Large companies with a significant mining divisions or companies similar to ArcelorMittal Mining division;
–Data are linked to each local market.
•encourage and reward performance that will lead to long-term enhancement of shareholder value; and
•promote internal pay equity by providing base pay and total remuneration levels that reflect the role, job size and responsibility as well as the performance and effectiveness of the individual.
Remuneration framework
The ARCG Committee develops proposals for senior management remuneration annually for the Board of Directors' consideration. Such proposals include the following components:
•fixed annual salary;
•short-term incentives (i.e., performance-based bonus); and
194
| Management report | ||
•long-term incentives (i.e., stock options (prior to May 2011), RSUs and/or PSUs (after May 2011) depending on the grant year).
The Company does not have any deferred compensation plans for senior management, including the Executive Chairman and CEO.
The following table provides an overview of the remuneration policy applied by the ARCG:
| Remuneration component and link to strategy | Operational and performance framework | Opportunity | ||||||
| Fixed annual salary Competitive base salary to attract and retain high-quality and experienced senior executives | * Base salary levels are reviewed annually with effect from April 1 (except promotion) compared to the market to ensure that ArcelorMittal remains competitive with market median base pay levels * Reviews are based on market information obtained but not led by benchmarking to comparable roles, changes in responsibility and general economic conditions | The ARCG does not set a maximum salary, instead when determining any salary increases it takes into account a number of reference points including salary increases across the Company | ||||||
| Benefits Competitive level to ensure coverage of the executives | * May include costs of health insurance, death and disability insurances, company car, tax return preparation, etc. * Relocation benefits may be provided where a change of location is made at Company’s request | The cost to the Company of providing benefits can change from year to year. The level of benefit provided is intended to remain competitive | ||||||
| Pension Competitive level of post-employment benefit to attract and retain executives | * Local benchmark of pension contributions for comparable roles | |||||||
| Short term incentives (STI) Motivate the senior executives to achieve stretch performance on strategic priorities | * Scorecard is set at the commencement of each financial year * Measures and relative weights are chosen by the ARCG Committee to drive overall performance for the coming year * STI calculations for each executive reflect the performance of ArcelorMittal and /or the performance of the relevant business units, the achievement of specific objectives of the department and the individual executive’s overall performance * No STI is paid for a performance below threshold 80% for each criteria; 100% STI payout for performance achieved at 100% for each criteria; 150% STI payout for performance achieved at 120% or above for each criteria | Range for Executive Chairman and CEO: 0 to 270% with a target at 120% of base salary Range for CFO and Executive Officers: 0 to 157.5% with a target at 70% of base salary in general | ||||||
| LTIP Sustain shareholder wealth creation in excess of performance of a peer group and incentivize executives to achieve strategy | Executive Office LTIP * The vesting is subject to a relative TSR (Total Shareholder Return) and to a relative EPS compared to a peer group and to ESG targets over a three year- period *The peer group is determined by the ARCG Committee * No vesting will occur below the weighted average of the peer group or the target for ESG * Performance is determined by the ARCG Committee CFO and Executive Officers LTIP *The vesting is subject to two or three measures depending on the business units or group, Gap to competition, TSR vs. weighted average of the peer group and ESG *Vesting will occur if the performance is reached *Performance is determined by the ARCG Committee | Maximum value at grant: 120% of base salary for Executive Chairman and CEO Guideline: 100%-120% of base salary for CFO and Executive Officers depending on region | ||||||
Remuneration mix
The total remuneration target of the Executive Chairman, CEO and CFO is structured to attract and retain executives; the amount of the remuneration received is dependent on the achievement of superior business and individual performance and on generating sustained shareholder value from relative performance.
The following remuneration charts, which illustrate the various elements of the Executive Chairman, CEO, CFO and the other
Executive Officers' compensation, are applicable for 2023 as percentage of base salary. For each of the charts below, the columns on the left, middle and on the right, respectively, reflect the breakdown of compensation if targets are not met, met and exceeded.
195
| Management report | ||
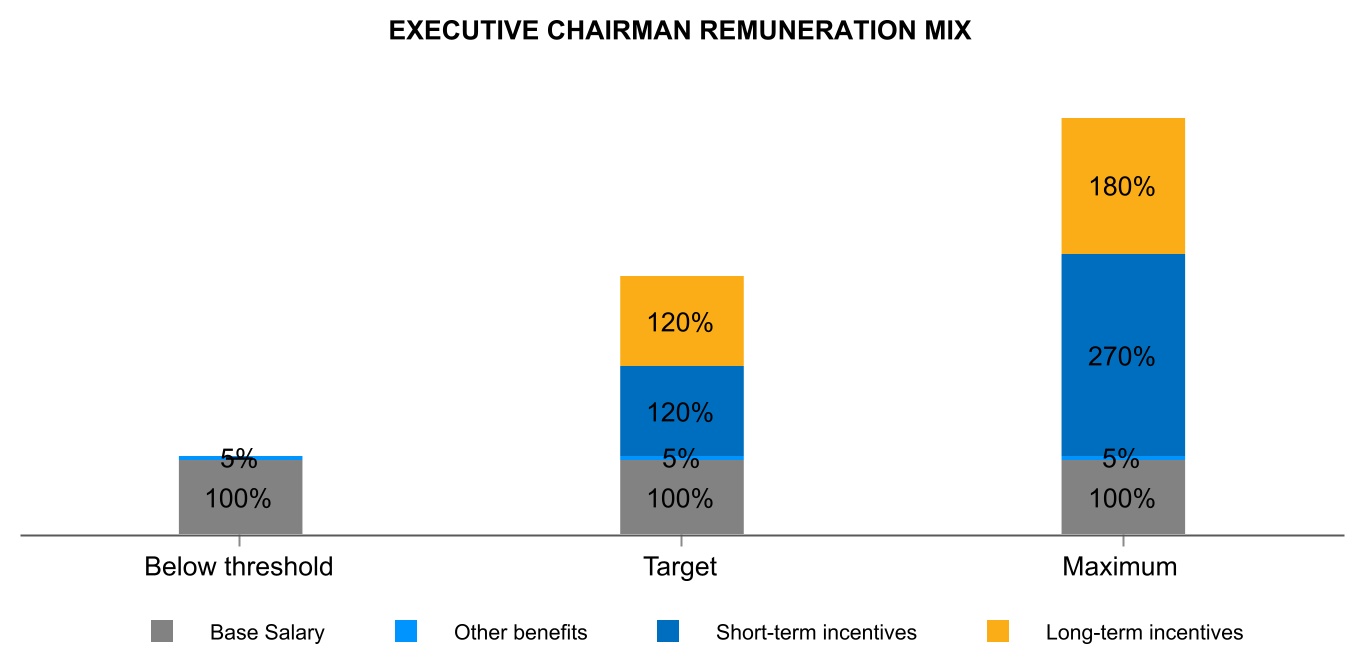
Note: no pension contribution
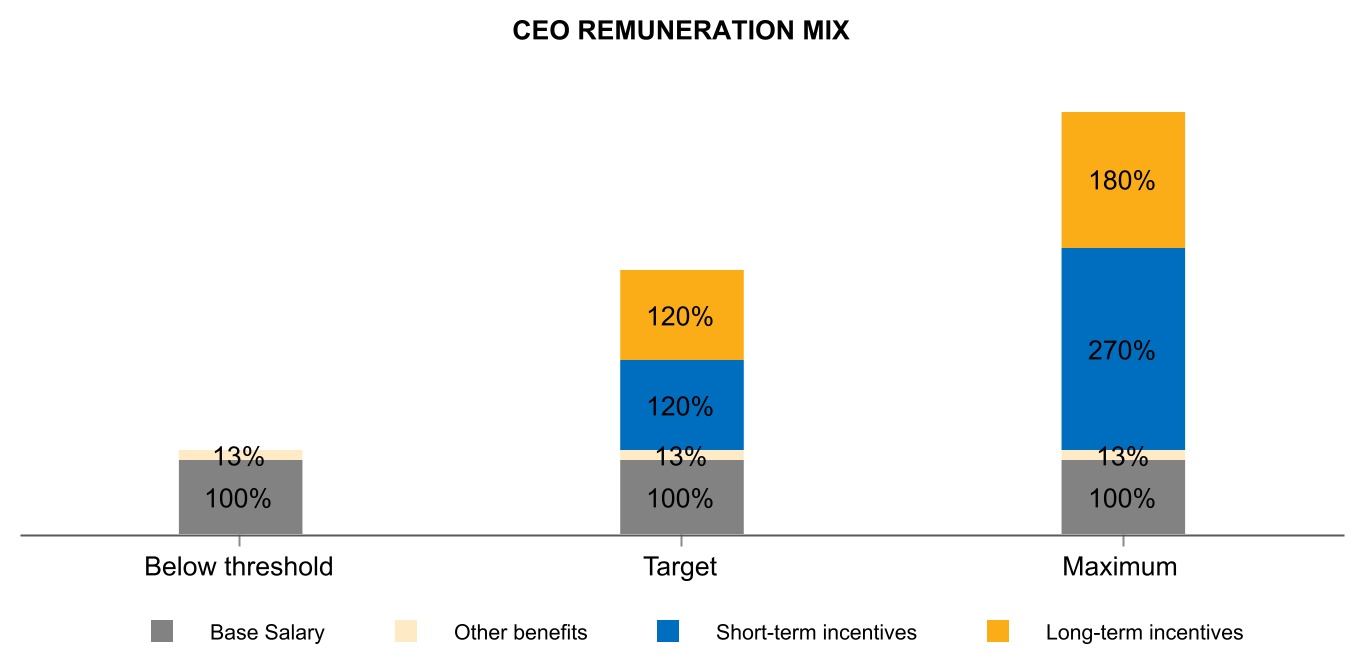
196
| Management report | ||
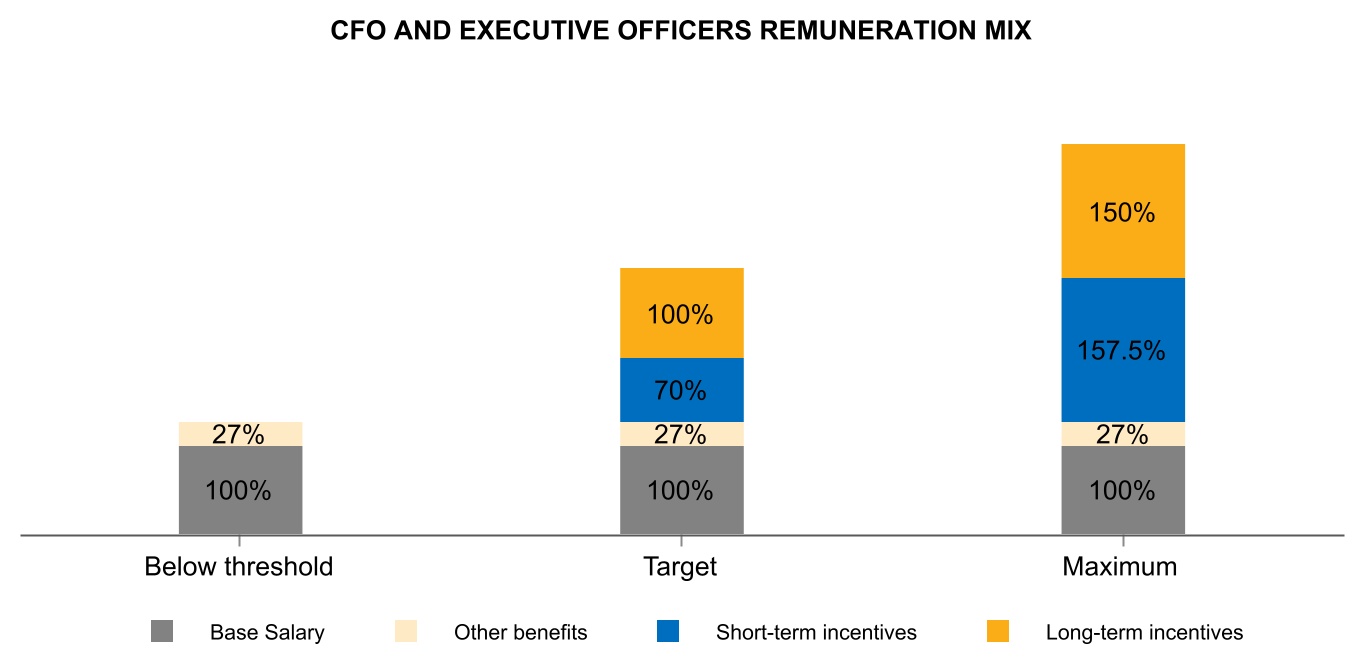
Note: Other benefits, as shown above, do not include international mobility incentives that may be provided.
2023 Total remuneration
The total remuneration paid in 2023 to members of ArcelorMittal’s senior management listed in “Management and employees—Directors and senior management” (including Mr. Lakshmi N. Mittal in his capacity as Executive Chairman and Mr. Aditya Mittal as CEO) was $10.4 million in base salary and other benefits paid in cash (such as health, other insurances, lunch allowances, financial services, gasoline and car allowance) and $8.8 million in short-term performance-related variable remuneration consisting of a short-term incentive linked to the Company’s 2022 results. During 2023, approximately $1.2 million was accrued by ArcelorMittal to provide pension benefits to senior management (other than Mr. Lakshmi N. Mittal).
No loans or advances to ArcelorMittal’s senior management were made during 2023, and no such loans or advances were outstanding as of December 31, 2023.
The following table shows the remuneration received by the Executive Chairman, CEO, CFO and the other Executive Officers as determined by the ARCG Committee in relation to the five most recent financial years including all remuneration components:
197
| Management report | ||
Executive Chairman7 | CEO6 | Chief Financial Officer and Executive Officers 5 | |||||||||||||||||||||||||||||||||||||||||||||
| (Amounts in $ thousands except for Long-term incentives) | 2023 | 2022 | 2021 | 2020 | 2019 | 2023 | 2022 | 2021 | 2020 | 2023 | 2022 | 20218 | 2020 | 2019 | |||||||||||||||||||||||||||||||||
Base salary1 | 1,536 | 1,529 | 1,700 | 1,374 | 1,569 | 1,678 | 1,670 | 1,783 | 1,261 | 6,395 | 5,790 | 5,056 | 2,970 | 4,643 | |||||||||||||||||||||||||||||||||
| Retirement benefits | — | — | — | — | — | 168 | 167 | 178 | 146 | 1,041 | 1,066 | 1,348 | 555 | 698 | |||||||||||||||||||||||||||||||||
Other benefits2 | 80 | 72 | 66 | 45 | 47 | 44 | 39 | 38 | 33 | 674 | 599 | 237 | 144 | 223 | |||||||||||||||||||||||||||||||||
Short-term incentives3 | — | 3,053 | 2,908 | — | 3,198 | — | 3,335 | 2,226 | 935 | 8,773 | 9,370 | 7,158 | 2,169 | 6,015 | |||||||||||||||||||||||||||||||||
| Long-term incentives | - fair value in $ thousands4 | 1,391 | 1,520 | 1,419 | 1,407 | 1,339 | 1,519 | 1,661 | 1,550 | 1,292 | 6,544 | 3,838 | 4,396 | 1,834 | 3,096 | ||||||||||||||||||||||||||||||||
| - number of share units | 67,857 | 67,662 | 52,166 | 77,372 | 89,933 | 74,116 | 73,902 | 56,977 | 71,050 | 287,900 | 155,400 | 146,600 | 90,069 | 183,084 | |||||||||||||||||||||||||||||||||
1.After the salary decrease applied in 2020, the base salaries of the CEO and President and Chief Financial Officer were set back to the original amounts in 2021. In 2023, a salary increase of 8.5% including the promotions was applied for the Executive Officers only.
2.Other benefits comprise benefits paid in cash such as lunch allowances, financial services, gasoline and car allowances. Health insurance and other insurances are also included.
3.Short-term incentives are entirely performance-based and are fully paid in cash. The short-term incentive for a given year relates to the Company’s results in the previous year.
4.Fair value determined at the grant date is recorded as an expense using the straight line method over the vesting period and adjusted for the effect of non-market based vesting conditions.
5.President and Chief Financial Officer included in 2019.
6.Amounts presented for 2021 and 2020 reflect the compensation as President and Chief Financial Officer until February 11, 2021 and as CEO thereafter.
7.Amounts presented reflect the compensation as CEO until February 11, 2021 and as Executive Chairman thereafter.
8.Brian Aranha was included until March 31, 2021. Simon Wandke was included until September 30, 2021. New executive officers were included as of their respective nomination date.
Short-term incentives
Targets associated with ArcelorMittal’s 2023 Annual Performance Bonus Plan were aligned with the Companies’ strategic objectives of improving health and safety performance and overall business performance and competitiveness.
For the Executive Chairman and the CEO, the 2023 annual performance bonus formula is based on the achievement of the following performance targets:
•EBITDA targets at Group level: 40% (acts as circuit breaker for financial measures EBITDA and FCF);
•FCF targets at Group level: 25%;
•Gap to competition targets at Group level: 20%; and
•Health and safety performance targets at Group level: 15%. In order to help focus attention, energy and resources on detecting and eliminating the causes of serious injury or fatality precursors, the Company has moved to a target of potential severe injury or fatality. To emphasize this priority, the fatality frequency rate acts as a circuit breaker for the Health & Safety component. The circuit breaker is set at 90% of the World Steel Association average, excluding ArcelorMittal and excluding those members within CIS countries. Safety performance must be better than this
benchmark for the Health & Safety component to be awarded.
For the Executive Chairman and CEO, 100% achievement of the agreed performance targets results in an annual performance bonus which equals 120% of base salary.
For the CFO and other Executive Officers, the 2023 annual performance bonus formula has been tailored for their respective positions and is generally based on the following performance targets:
•EBITDA targets at Group, segment or Business unit level (acts as circuit breaker for financial measures EBITDA and FCF);
•FCF targets at Group, segment or Business unit level;
•Gap to competition targets at Group level, segment or Business unit level;
•Health and safety performance targets at Group, Segment or Business unit level (fatalities act as circuit breaker for this component).The circuit breaker is set at 90% of the World Steel Association average, excluding ArcelorMittal and excluding those members within CIS countries. Safety performance must be better than this
198
| Management report | ||
benchmark for the Health & Safety component to be awarded.
For the CFO and other Executive Officers, 100% achievement of the agreed performance targets results in an annual performance bonus which equals 70% of base salary in general.
For the calculation of the annual performance bonus, the achievement level of every performance target is calculated separately, and these are added up.
Individual performance and assessment ratings define the individual annual performance bonus multiplier that will be applied to the annual performance bonus calculated based on actual performance against the performance measures. Those individuals who consistently perform at expected levels will have
an individual multiplier of 1. For outstanding performers, an individual multiplier of up to 1.5 may cause the annual performance bonus pay-out to be higher than 150% of the target annual performance bonus, up to 270% of the target annual performance bonus being the absolute maximum for the Executive Chairman and the CEO. Similarly, a reduction factor will be applied for those at the lower end.
In exceptional circumstances, the ARCG Committee can exercise discretion in the final determination of the annual performance bonus.
The achievement level of performance for the annual performance bonus for the Executive Chairman, the CEO, the CFO and the other Executive Officers is summarized as follows:
| Functional level | Target achievement threshold @ 80% | Target achievement @ 100% | Target achievement ≥ ceiling @ 120% | |||||||||||||||||
| Executive Chairman and CEO | 60% of base pay | 120% of base pay | 180% of base pay | |||||||||||||||||
| CFO and Executive Officers | 35% of base pay | 70% of base pay | 105% of base pay | |||||||||||||||||
ArcelorMittal Equity Incentive Plan
ArcelorMittal operates a long-term incentive plan ("the ArcelorMittal Equity Incentive Plan") to incentivize shareholder wealth creation in excess of performance of a peer group and incentivize executives to achieve strategy. The ArcelorMittal Equity Incentive Plan is intended to align the interests of the Company’s shareholders and eligible employees by allowing them to participate in the success of the Company. The ArcelorMittal Equity Incentive Plan provides for the grant of RSUs and PSUs to eligible employees of the Company (including the Executive Officers) and is designed to incentivize employees, improve the Company’s long-term performance and retain key employees.
The maximum number of PSUs and RSUs available for grant during any given year is subject to the prior approval of the Company’s shareholders at the annual general meeting. The 2020, 2021, 2022 and 2023 Caps for the number of PSUs/RSUs that may be allocated to the Executive Office and other retention and performance based grants below the Executive Office level, were approved at the annual general meetings on June 13, 2020, June 8, 2021, May 4, 2022 and on May 2, 2023, respectively, at a maximum of 4,250,000 shares, 3,500,000 shares, 3,500,000 shares and 3,500,000 shares, respectively.
RSUs granted under the ArcelorMittal Equity Incentive Plan are designed to provide a retention incentive to beneficiaries. RSUs are subject to “cliff vesting” after three years, with 100% of the grant vesting on the third anniversary of the grant contingent upon the continued active employment of the beneficiary within the Company.
Awards in connection with PSUs are subject to the fulfillment of performance criteria such as ROCE, TSR, EPS and gap to competition (until 2022). Since 2021, the performance criteria for the PSUs for the Executive Office and Executive Officers include an ESG criteria comprised of a health & safety, a climate action and a diversity & inclusion ("D&I") target. For health & safety, the target is to halve the fatality frequency rate versus a defined baseline (the baseline is the adjusted average frequency rate over 5 years before the grant). For D&I, the target is to reduce the gap between the Company's 2030 target of having 25% women in management and 2020 baseline. For climate, the CO2 emission target has been set to be reached by the end of the vesting period.
199
| Management report | ||
Conditions of the 2023 grant were as follows:
| Executive Office | Executive Officers | ||||||||||||||||||||||||||||||||||
2023 Grant | l | PSUs with a three year performance period | l | PSUs with a three year performance period | |||||||||||||||||||||||||||||||
| l | Value at grant 120% of base salary for the Executive Chairman and the CEO | ||||||||||||||||||||||||||||||||||
| l | Vesting conditions: | l | Vesting conditions | ||||||||||||||||||||||||||||||||
| Target | Stretch | Threshold | Target | Stretch | |||||||||||||||||||||||||||||||
| TSR vs. peer group (50%) / EPS vs. peer group (20%) | 100% vs. weighted average | ≥120% vs. weighted average | TSR vs. peer group (40%) | - | 100% weighted average | ≥120% weighted average | |||||||||||||||||||||||||||||
| Vesting percentage | 100% | 150% | Vesting percentage | - | 100% | 150% | |||||||||||||||||||||||||||||
ROCE (40%) | 2/3 of target | 100% of target | 4/3 of target | ||||||||||||||||||||||||||||||||
ESG (30%): H&S 10%, Climate action 10% and D&I: 10% | 100% of target | 120% of target | Vesting percentage | 50% | 100% | 150% | |||||||||||||||||||||||||||||
| Vesting percentage | 100% | 150% | ESG (20%): H&S 10%, Climate action 5% and D&I 5% | - | 100% of target | 120% of target | |||||||||||||||||||||||||||||
| Vesting percentage | - | 100% | 150% | ||||||||||||||||||||||||||||||||
| l | RSUs with a three year vesting period | ||||||||||||||||||||||||||||||||||
Awards made in 2020 through 2022
The Company's Equity Incentive Plan for senior management including Executive Officers follows the Company's strategy.
In addition to the 2023 grant, the summary of outstanding plans as of December 31, 2023 is as follows:
| Executive Office | Executive Officers | |||||||||||||||||||||||||||||||
| 2020 Grant | l | PSUs with a three year performance period | l | PSUs with a three year performance period | ||||||||||||||||||||||||||||
| l | Value at grant 100% of base salary for the Executive Chairman and the CEO | |||||||||||||||||||||||||||||||
| l | Vesting conditions: | l | Vesting conditions | |||||||||||||||||||||||||||||
| Threshold | Target | Threshold | Target | |||||||||||||||||||||||||||||
| TSR/EPS vs. peer group | 100% median | ≥120% median | TSR/EPS vs. peer group | 100% median | ≥120% median | |||||||||||||||||||||||||||
| Vesting percentage | 50% | 100% | ||||||||||||||||||||||||||||||
| Gap to competition (where applicable) | 100% target 100% vesting | |||||||||||||||||||||||||||||||
| TSR vs. S&P 500 | Performance equal to Index | ≥Performance equal to Index + 2% p.a. outperformance | Vesting percentage | 0% | 100% | |||||||||||||||||||||||||||
| Vesting percentage | 50% | 100% | l | |||||||||||||||||||||||||||||
200
| Management report | ||
| Executive Office | Executive Officers | |||||||||||||||||||||||||||||||
| 2021 Grant | l | PSUs with a three year performance period | l | PSUs with a three year performance period | ||||||||||||||||||||||||||||
| l | Value at grant 100% of base salary for the Executive Chairman and the CEO | |||||||||||||||||||||||||||||||
| l | Vesting conditions: | l | Vesting conditions: | |||||||||||||||||||||||||||||
| Threshold | Target | Target | Stretch | |||||||||||||||||||||||||||||
| TSR vs. peer group (50%) / EPS vs. peer group (20%) | 100% median | ≥120% median | TSR vs. peer group (40%) | 100% weighted average | ≥120% weighted average | |||||||||||||||||||||||||||
| Vesting percentage | 50% | 100% | Vesting percentage | 100% | 150% | |||||||||||||||||||||||||||
| Gap to competition (40%) | 100% of target | 120% of target | ||||||||||||||||||||||||||||||
| ESG (30%) | 100% of target | Vesting percentage | 100% | 150% | ||||||||||||||||||||||||||||
| ESG (20%) | 100% of target | 120% of target | ||||||||||||||||||||||||||||||
| 100% | 150% | |||||||||||||||||||||||||||||||
| Vesting percentage | 100% | l | RSUs with a three year vesting period | |||||||||||||||||||||||||||||
| Executive Office | Executive Officers | |||||||||||||||||||||||||||||||
| 2022 Grant | l | PSUs with a three year performance period | l | PSUs with a three year performance period | ||||||||||||||||||||||||||||
| l | Value at grant 120% of base salary for the Executive Chairman and the CEO | |||||||||||||||||||||||||||||||
| l | Vesting conditions: | l | Vesting conditions | |||||||||||||||||||||||||||||
| Target | Stretch | Target | Stretch | |||||||||||||||||||||||||||||
| TSR vs. peer group (50%) / EPS vs. peer group (20%) | 100% vs. weighted average | ≥120% vs. weighted average | TSR vs. peer group (40%) | 100% weighted average | ≥120% weighted average | |||||||||||||||||||||||||||
| Vesting percentage | 100% | 150% | Vesting percentage | 100% | 150% | |||||||||||||||||||||||||||
| Gap to competition (40%) | 100% of target | 120% of target | ||||||||||||||||||||||||||||||
ESG (30%): H&S 10%, Climate action 10% and D&I: 10% | 100% of target | 120% of target | Vesting percentage | 100% | 150% | |||||||||||||||||||||||||||
| Vesting percentage | 100% | 150% | ESG (20%): H&S 10%, Climate action 5% and D&I 5% | 100% of target | 120% of target | |||||||||||||||||||||||||||
| Vesting percentage | 100% | 150% | ||||||||||||||||||||||||||||||
| l | RSUs with a three year vesting period | |||||||||||||||||||||||||||||||
See note 8.3 to the consolidated financial statements for further details on RSUs/PSUs.
Other benefits
In addition to the remuneration described above, other benefits may be provided to senior management and, in certain cases, other employees. These other benefits can include insurance, housing (in cases of international transfers), car allowances and tax assistance.
SOX 304 and clawback policy
Under Section 304 of the Sarbanes-Oxley Act, the SEC may seek to recover remuneration from the CEO and CFO of the Company in the event that it is required to restate accounting information due to any material misstatement thereof or as a result of misconduct in respect of a financial reporting
201
| Management report | ||
requirement under the U.S. securities laws (the “SOX Clawback”).
Under the SOX Clawback, the CEO and the CFO may have to reimburse ArcelorMittal for any short-term incentive or other incentive-based or equity-based remuneration received during the 12-month period following the first public issuance or filing with the SEC (whichever occurs first) of the relevant filing, and any profits realized from the sale of ArcelorMittal securities during that 12-month period.
In October 2022, the SEC adopted final rules implementing the Dodd-Frank requirement for issuers to recover incentive-based compensation erroneously paid to current and former executive officers due to an accounting restatement. These clawback rules required listing exchanges, such as the NYSE, to adopt clawback standards as from the fourth quarter of 2023, with issuers required to implement and disclose “no fault” clawback policies that meet strict recovery standards for restatements, within 60 days thereafter.
The Board of Directors, through its ARCG Committee, adopted its own clawback policy in 2012, which was updated in 2023 (the "Clawback Policy"), to reflect the Company’s structural changes and comply with the new rules.
The Clawback Policy applies to all Executive Officers and covers cash short-term incentives and any other incentive-based or equity-based remuneration, as well as profits from the sale of the Company’s securities ("Covered Compensation") received during the three completed fiscal years of the Company immediately preceding a the Restatement Date (as defined in the policy) and any transition period (that results from a change in the Company’s fiscal year) of less than nine months within or immediately following those three completed fiscal years. Compensation is deemed to be received in the Company’s fiscal period during which the Financial Reporting Measure specified in the Incentive-based Compensation award is attained.
Under the Clawback Policy, ArcelorMittal will recover reasonably promptly erroneously paid Covered Compensation in the event it is required to prepare an accounting restatement due to the material noncompliance of ArcelorMittal with any financial reporting requirement under the U.S. securities laws, including any required accounting restatement to correct an error in a previously issued financial statement that is material to the previously issued financial statement, or that would result in a material misstatement if the error were corrected in the current period or left uncorrected in the current period.
Employees
As of December 31, 2023, ArcelorMittal employed approximately 126,756 full time equivalents ("FTE") employees directly, as well
as a large number of contractors.
The table below sets forth the number of FTE employees respectively by segment as of the end of each of the past three years.
| As of December 31, | |||||||||||
| Segment | 2023 | 2022 | 2021 | ||||||||
| NAFTA | 14,418 | 14,270 | 13,410 | ||||||||
| Brazil | 22,042 | 19,644 | 19,450 | ||||||||
| Europe | 62,073 | 61,305 | 60,525 | ||||||||
ACIS1 | 21,450 | 52,725 | 58,438 | ||||||||
| Mining | 4,473 | 4,626 | 4,426 | ||||||||
| Other activities | 2,300 | 1,782 | 1,660 | ||||||||
| Total | 126,756 | 154,352 | 157,909 | ||||||||
1. ArcelorMittal Temirtau is only included as of December 31, 2022 and 2021
A new people strategy
Recognizing the importance of meeting the evolving need of ArcelorMittal's employees in a post-pandemic world, at the backdrop of an increasing competitive job market and accelerated economic, technological and cultural shifts, the Company launched a new people strategy in 2022. The strategy is based around ArcelorMittal's fundamental purpose to create smarter steels for people and the planet. It is founded on three pillars: ‘Leadership that inspires excellence’, ‘Talent to thrive for the future’, and ‘Diversity and inclusion that engages everyone’. This strategy seeks to boost the Company's approach to boost talent and creating a base to establish a safety-first, people-driven culture that ensures sustainable performance and allows the Company to deliver on its purpose.
Employee development
Attracting, developing and retaining the right people continues to be a strategic priority for ArcelorMittal in maintaining a high- performing organization.
There continues to be strong demand for the best talent and ArcelorMittal wants to ensure it is considered as an aspirational place to work. That means ensuring employees feel safe, respected and valued. It also means building a culture that constantly keeps employees committed, motivated, encouraged to learn and eager to perform at their best. In 2023, to attract diverse talents, the Company refreshed its Employee Value Proposition by launching new talent attraction and retention messaging and materials to better communicate the benefits, value and impact of working at ArcelorMittal. This effort led to an increase in visitors to the external career page on the corporate website. Internally, the Company launched new communications initiatives to increase the visibility of global career opportunities, which gave a boost to internal job applications throughout the year.
202
| Management report | ||
Employee development, including succession planning and the development of young talent, is also crucial in building a high-performing organization. The Company aims to have a clear career pathway for employees, supported with ongoing initiatives to build their technical capabilities through training. ArcelorMittal has programs designed to spot people with potential and manage the succession of key roles, as part of its overall strategic workforce planning process, which is overseen by the ARCG Committee. Strategic workforce planning is a key element of business unit quarterly reviews.
In 2023, the Company continued to harness skills and resources and has stepped up its efforts to identify and accelerate the development and readiness of its High Potential employees ("HiPos") to take on increased responsibilities. This has been achieved by having the right people in the right place at the right time; identifying people for key succession plans; anticipating and filling vacancies; ensuring a healthy and diverse leadership pipeline; nurturing internally the generations of tomorrow and preparing future leaders; encouraging individual performance and making sustainable performance gains; and ensuring the retention of HiPos, through acknowledgement, empowerment, motivation and challenges.
An effective succession planning process is based on open career discussions with HiPos. Every HiPo has a career counselling discussion with his/her manager and HR, which focuses on the ‘right casting for the role’ to determine fit, readiness and match with individual drivers and motivations. The outcome of this discussion is used in the succession planning process. To continue accelerating the development of HiPos, the Company in 2023 strengthened the quality of its succession planning to ensure better alignment between the nomination of potential successors and their career aspirations. The Company also redesigned its Leadership Pipeline learning journeys, to better adapt to its evolving business needs following the COVID-19 pandemic. The programs are partly personalized, based on assessments. They are customized and delivered through a blended format of face-to-face (when available) and digital.
ArcelorMittal's Talent Acceleration Pool ("TAP"), an accelerated development program for HiPos with the potential to reach at least Manager level, also provides consistent and structured development opportunities. TAP 2, which was launched in 2021, was successfully concluded in 2023, with a revised approach for the two-year program management. The program included 78 participants from 21 nationalities, of which 23 were women (30%).
Since shifting its learning and development approach in response to COVID-19 pandemic, the Company has continued to see significant growth in 2023 in active virtual learning
throughout ArcelorMittal University, further expanding its global community. Across the Group, employees invested an average of 5.9 hours each, a 15% increase year-on-year. More than 101,000 active learners dedicated more than 600,000 online learning hours (an increase of 64% year-on-year) to digital learning. A large proportion of these hours were dedicated specifically to Health & Safety ("H&S"), with more than 320,000 course completions across various H&S learning programs.
The Company continued to offer world class leadership programs to its talents and future leaders as part of the Leadership Pipeline learning journeys. This year, more than 280 HiPos graduated from these flagship journeys. Across all ten cohorts of learners, 29% of participants were women.
Another important program is the ArcelorMittal's Group Mentoring Program, which is designed to provide all ArcelorMittal employees an opportunity to participate in a mentoring relationship with a group mentor. By the end of 2023, there were more than 2,400 mentoring hours invested, demonstrating an increase of 70% year-to-year. As of December 31, 2023, 36% of active mentors and mentees were women.
In addition, the Company deployed a global Human Capital Management system which provides unification of the Company's employee systems around recruitment, performance, succession planning, career development and learning. This provides enhanced infrastructure necessary to analyze data and identify areas for continuous improvement at ArcelorMittal. Continued progress was achieved with implementation of various modules globally: 10 rollout projects completed for Recruitment and three for Onboarding. Moreover, rollouts and pilots for other modules were initiated: five roll-out projects for Recruitment, four for Learning, one pilot for Total Rewards and one pilot for Performance.
Speak Up +, the new global employee survey
For the past few years, the ArcelorMittal's Speak Up + survey (which was formerly called Speak Up!) has been the Group’s flagship employee engagement survey, designed to assess professionals and leadership opinion regarding how they feel about working at ArcelorMittal, what the Company does well and, if there are areas where they believe it falls short, how they can be improved.
In 2023, ArcelorMittal listened to employees' voices through the Speak Up + surveys, which serve as the ongoing vehicle to support the Company’s leaders in closely keeping a finger on the pulse of the organization, in a rapidly changing environment. The goal is to understand how the engagement of ArcelorMittal people worldwide evolves by regularly
203
| Management report | ||
listening to their aspirations and concerns and to empower leaders to spot and resolve potential issues quickly.
The survey occurs a few times throughout the year and includes questions related to engagement, health & safety, well-being, values and diversity & inclusion. The outcomes from each Speak Up + survey are compared to multiple benchmarks, internally and over time, and externally against industry peers. This enables the Company’s leaders to spot specific strengths and risks, e.g. attrition risk, and to define actions to improve employee engagement.
Concrete actions to address employees’ concerns are continuously defined and implemented across the Group based on the outcomes of the Speak Up + survey rounds to effectively drive employee engagement.
Diversity and inclusion
ArcelorMittal values diversity as a way of bringing fresh perspectives and experiences to the business and as part of its ambition to be an employer of choice. The Company has a presence in over 60 countries and employees from many more and its diversity & inclusion policy aims to encompass different cultures, generations, genders, ethnic groups, nationalities, abilities, and social backgrounds.
ArcelorMittal’s senior management is committed to building a more inclusive culture and recruiting, retaining, and promoting more diverse talent, focusing first on gender parity given the steel industry has historically been male dominated. The Company also recognizes the increasing expectations of stakeholders, including employees and investors, to report on progress in this area. In 2020, the Company benchmarked its diversity & inclusion policies against other companies to identify gaps and opportunities, engaged with several stakeholders on this topic and developed a strategy to make improvements. The topic was thoroughly discussed at the ARCG Committee and had the full attention and support of both the Executive Chairman and the CEO. As a result of this initiative, the Company announced new plans to double the number of women at leadership positions within the next decade. By 2030, the aim is to reach 25% management positions held by women.
To achieve this figure, the Company continuously reviews its policies and HR practices to build an inclusive culture that empowers all diverse talents; address unconscious bias and discrimination through learning programs; and maintain gender balance in its recruitment shortlists (either internal or external) for all professional and leadership positions. To improve the gender balance in its leadership positions, the Company's Executive Office oversees an annual career development planning process, which includes the target minimum of one woman in every senior management
succession plan. The Diversity and Inclusion Panel, formerly called the Diversity and Inclusion Council, steers the Group Diversity and Inclusion ("D&I") performance and progress. In 2022, the Company defined a clear roadmap to improve and transform on D&I. One of the key initiatives launched was the D&I maturity assessment; wave one representing 50% of the Group's segments, concluded in 2022, and wave two covering the remaining segments concluded in 2023. The maturity assessment supports the Company's identification of key areas of improvement in two spheres (behavioral and structural) and into five perspectives (compliance, awareness, talent integration, operation integration and market integration).
In 2023, 17.3% of management positions were held by women across the Group, a 1.6% increase as compared to 2022, and 59% of key positions have at least one woman assigned as successor - those who are expected to take over senior manager positions at the General Manager level and above.
In line with the worldwide effort to increase gender diversity at the board of directors level, ArcelorMittal surpassed its goal of increasing the number of women on the Board of Directors to at least three by the end of 2015. In 2023, four of the ten positions on the Board of Directors were held by women.
A number of programs are in place to develop women and other diverse talents as leaders. These are supported by various initiatives including training programs for women employees, mentoring and coaching, networking, and role model involvement. This is aligned with a commitment to support future leaders in science, technology, engineering and mathematics ("STEM"). In 2023, the Company continued to run initiatives in all segments, including participation in the TopWomenTech in Europe and partnerships with universities and schools, campaigns and job fairs focused on attracting women applicants with STEM backgrounds.
In 2023, ArcelorMittal University continued to make Diversity, Equity and Inclusion ("DE&I") a priority with dedicated live global and local training sessions, digital courses covering topics like unconscious bias and embracing equity, and inclusive leadership trainings to help managers to manage interactions between different cultural perspectives and communication styles. Additionally, a virtual program celebrating International Women’s Day registered over 830 attendees.
ArcelorMittal's initiatives in a number of countries support people with disabilities in the workplace. In Brazil, there is a robust D&I program, which is governed by the Executive
204
| Management report | ||
Committee, National D&I Committee and a Committee per each key area (Gender, People with Disabilities, Racial, LGBTI+). Brazil strengthened its project PertenSER (Belong) by introducing a masculinity class in 2023. Another initiative in Brazil focuses on the need for humanized communication with deaf colleagues at workplace using LIBRAS, which is a gestural-visual language, used by the Brazilian deaf community. South Africa runs a Women of Steel initiative to support HiPo women working in critical positions or on succession plans by providing them with additional development training opportunities and finding time for them to engage with senior leaders. In Europe, ArcelorMittal continued its D&I campaign, expanded its Women Interviewing Women podcast, participated in career fairs and engaged with universities and schools for multiple learning activities, including providing the inclusive leadership training to segment management committee. In North America, ArcelorMittal increased its engagement with the community - internally as well as externally, by participating in and sponsoring local events; promoting careers in manufacturing business and STEM careers; and sponsoring Diversity, Equity and Inclusion actions in the local community among others.
Collective Labor Agreements ("CLAs")
In multiple regions globally, ArcelorMittal employees are represented by trade unions and the Company actively engages in collective bargaining agreements with employee organizations at specific locations. The description below provides an overview of the current status of specific agreement and relationships.
The Company is committed to open, respectful and transparent social dialogue at all of its operations, to maintain strong employee relations, and to provide a safe, healthy and quality working lives for all its workers.
In the current inflationary environment, the Company understands that salary increases for workers is a question of high sensitivity. ArcelorMittal is respecting its commitment to social dialogue and all entities have regular discussions and negotiations on salary policy with their respective unions. Several salary negotiations were conducted in 2023 and resulted in social agreements including salary increases, for instance, in South America and in South Africa. In some countries like Belgium and Luxembourg, indexation linked to inflation is legally foreseen. In countries with extremely high inflation such as Argentina and Turkey, several salary reviews were implemented during 2023.
The Joint Global Health and Safety Agreement between the Company and IndustriALL global trade union, signed in 2008, remained in effect in 2023. This agreement recognizes the vital role played by trade unions in improving health and safety. It
sets out minimum standards for every site where the Company operates with the objective of achieving world-class performance. As a result of this agreement, the Joint Global H&S Committee, composed of 12 representatives in 2023 (14 in 2022) of management and the unions was created to identify areas for improvement and harmonize safety performance across the Group. The Joint Global H&S Committee only deals with issues related to H&S and does not act as a negotiation committee on behalf of unions or management. One of its primary priorities is centered around overseeing deployment and monitoring the compliance of local joint H&S panels. This involves developing guidelines to progress and training programs, conducting site visits to assess implementation and offering suggestions for improvement. Additionally, the Joint Global H&S Committee provides recommendations on transversal and global topics to enhance overall safety measures.
In 2023, one virtual meeting was organized at the Group level to discuss transversal specific topics with regard to H&S. In addition, other safety training and coaching programs, including the "Safety Leadership" and "Take Care" Trainings as well as a dss+ lead “Area of Transformation” program continued to be rolled out in 2023 in order to support the “Journey to Zero” program aimed at reducing the amount of injuries and fatalities in the Company to zero. See “Business overview—Sustainable development—Health and Safety.”
In 2023, several entities and countries engaged in entering or renewal of collective labor agreements (“CLAs”).
At AMLPC, unionized employees at Contrecoeur West continue to work under an agreement with the United Steel Workers ("USW") renewed in July 2020 and expiring in July 2026. The unionized employees at Contrecoeur East and Longueuil continue to work under a six-year agreement with the USW that renewed in February 2022 and will expire in January 2028. The CLA with USW covering the Contrecoeur Scrap Recycling Center employees signed in 2022 is valid for a six-year term, expiring in May 2028. The collective agreement with USW at Hamilton-East Wire which was renewed in July 2021 for a five-year term is still valid and it will expire on May 30, 2026. The agreement with USW at St-Patrick Wire expired in December 2023 and is currently under negotiations.
ArcelorMittal Mexico and the National Miners Union agreed to a new one-year contract effective August 1, 2023. ArcelorMittal Mexico continues to explore opportunities with the union to improve workforce productivity, efficiency and competitiveness.
ArcelorMittal Tubular Products Shelby continues to work under an agreement with the USW which was renewed in November 2021 and will expire on October 31, 2025.
205
| Management report | ||
ArcelorMittal Tubular Products Woodstock continues to work under an agreement with UNIFOR which was renewed in February 2021 and will expire on April 1, 2024.
ArcelorMittal Tubular Products Brampton continues to work under an agreement with the USW which was renewed in December 2021 and will expire in September 2025.
At ArcelorMittal Tubular Products Monterrey, the collective agreement with the National Federation of Independent Unions was renewed effective February 2023 for a one-year period. Negotiations with the union for the new period started in February 2024 and are still ongoing.
At ArcelorMittal USA Research, a new three-year agreement was signed in 2022 with USW and remains valid.
In Brazil, the inflation rate remained relatively low compared to previous years, despite economic uncertainties during the first year of President Lula’s government. Out of the 53 collective agreements negotiated in 2022, 14 were specifically designed to adjust salaries based on the inflation rate which fluctuated between 3.83% and 4.51%.
In Argentina, blue-collar employees from Acindar were granted a substantial salary increase of 183.9% aligning with the inflation rate up to December 2023 (211.2%). Despite this, the inflation has remained persistently high and projections suggest that it could reach 180% for the entire year. The country is currently navigating through challenging macroeconomic trends, complicated by a recent change in government. After experiencing a considerable devaluation and heightened inflation by December 2023, ongoing discussions with trade unions regarding a new agreement are still underway, reflecting the need for adaptive measures in this complex economic context.
In Costa Rica, the government maintained its projected inflation rate for 2023. However, a significant exchange effect occurred, resulting in the local currency strengthening against the U.S. dollar. Despite a stable political situation in the country, there is an ongoing struggle between the different factions opposing President Chavez of Venezuela. On the labor front, there is a measure of stability and employees from ArcelorMittal Costa Rica were granted a 7% adjustment, in alignment with the inflation rate of 7.26%).
In Europe, four meetings were conducted in 2023 to inform the European Works Council ("EWC") representatives about the H&S and business scenario within the Company's European operations. Throughout the year, three meetings with the Select Committee were held, alongside a Plenary Assembly in December 2023. H&S remained a prominent focus, with members of the dedicated working group undergoing training on the golden rule pertaining to working at height (to prevent
accidental falls injuring employees). Concurrently, negotiations aiming at revising certain aspects of the EWC agreement are expected to reach a resolution in the first quarter of 2024.
In France, a one-year salary agreement for 2024 was successfully negotiated and signed with unions in December 2023, covering most of the legal entities. Concurrently, ongoing negotiations or discussions for salary agreement are underway in certain entities, with anticipated resolutions in the first quarter of 2024. Regular meetings with national representatives of major trade unions have been conducted to facilitate the exchange of information on ArcelorMittal's activities and to address key challenges confronting the steel industry. Furthermore, the introduction of the new national collective bargaining in the metal sector has necessitated a complete restructuring of job classifications. This adjustment came into effect in January 2024. In parallel, numerous social negotiations either at the country or at local level, have been conducted to accommodate the implications of this new collective bargaining in the metal sector.
In Luxembourg, the CLA underwent a renegotiation process resulting in the signing of a new agreement in September 2023. This agreement was finalized in collaboration with representatives from the two unions associated with the Company. Key highlights for 2023 included the continued monitoring of the on-going Job Retention Plan involving the Government and the unions. This plan is primarily centered on commitments related to investments, unemployment management and pre-retirement initiatives. Furthermore, during the year, initiatives were launched to strengthen H&S culture through dedicated coaching programs. Moreover, a significant emphasis was placed on on diversity, inclusion and well-being. This commitment was concretized in the introduction of programs such as the First Mental Aid program, resulting in the certification of 140 individuals. Additionally, a harassment prevention program was implemented with full participation from the workforce in Luxembourg.
In Belgium, the negotiations with trade unions for the new CLA framework for 2023-2024 were successfully concluded. Despite inflation pressures, expectations were optimistic, largely attributed to the highly competitive labor market. The negotiations were smoothly finalized in the first round, with significant social actions.
In Germany, the first half of 2023 experienced favorable market conditions but a shift occurred in the second half. Despite persistent high energy prices, lower inflation contributed to weakened market conditions. Hamburg, in particular, faced economic unemployment. However, other plants successfully navigated the challenges. CLA negotiations were successfully concluded in December 2023 with the agreement set to last until September 30, 2025. In addition, there was a commitment to
206
| Management report | ||
develop a collective agreement on job security in the transformation by June 30, 2024, alongside a legally-based agreement for retirement. H&S measures have been integrated into daily operations with the implementation of take-care-trainings, especially the `TAKE-CARE III' campaign and the SAFE-campaign. The social partners engaged in two meetings within the social dialogue group, one digitally and one in person. In September 2023, representatives from all work councils in Germany met in Eisenhüttenstadt. Throughout the year, the union actively supported the Company in its transformation plans within an evolving political landscape. There were several union protests (with a major event held in front of the Finance Ministry in November 2023), advocating for essential frame conditions, clarification on outstanding state aid and the implementation of industry electricity price policies.
In 2023, the commitment to fostering social dialogue at ArcelorMittal Poland remained a key focus. One crucial objective was to address the well being of employees undergoing business transformations, using agreed rules with trade unions to mitigate the social impacts of restructuring processes. The agreement specifically outlined protocols for supporting employees in reduced positions. Collaboration extended to adapting to changes in the production landscape prompted by market demands. This involved changing the employee work systems and reassigning individuals to new roles, with ongoing cooperation through H&S forums and shop floor meetings to enhance understanding and cultivate a cultured centered around H&S goals among social partners. In response to decreased coke production leading to the idling of the coke plant in Kraków, ArcelorMittal Poland negotiated an agreement on the Rules of Conduct with trade unions. This agreement outlined procedures for transferring affected employees to other positions and managing remaining holidays or periods of economical unemployment. A CLA for 2023 was successfully negotiated, and social fund regulations for 2023 and 2024 were agreed with trade unions. CLA negotiations for 2024 were initiated in December 2023. Throughout the year, regular meetings with trade unions occurred to collaborate on various fronts, including workers protection, production considerations and effective communication during crises, notably those arising from the uncertainties due to the war in Ukraine and other market conditions. Leadership involvement was characterized with CEO proximity meetings held in plants and monthly interactions with trade union leaders. The cooperation with trade unions extended nationally to contribute to the transformation of the steel industry. Although not legally required, the management of ArcelorMittal Poland continued to invite 2 members from the trade union leadership to the Supervisory Board, fostering constructive social dialogue at the highest levels of company management and reflecting a commitment to transparency and inclusive decision-making processes.
In Spain, as in the rest of the world, 2023 marked a period of consolidation following the COVID -19 pandemic, with many business indicators returning to pre-pandemic levels. However, the repercussions of conflicts in Ukraine, Palestine and the Red Sea in the last weeks of 2023 hindered a complete recovery. As a consequence, adjustments to resources in various Spanish companies were necessary due to a decline in demand. A temporary layoff plan was collaboratively agreed and signed with the legal representatives of the employees in the fourth quarter of 2023. Moreover, after several months of negotiations, a framework agreement governing labor relations across all legal entities in Spain was successfully signed with the majority of unions in May 2023. Lastly, in alignment with the Memorandum of Understanding established between ArcelorMittal and the Spanish government in July 2021 to promote decarbonization, ongoing discussions with unions persisted to address the labor implications of this strategic initiative. At the end of 2023, notable social challenges emerged in this context.
The situation in Ukraine remained difficult from employees' perspective in 2023 because of the war with Russia. The martial law imposed by the government in the country starting February 2022 which among other things restricted labor rights of employees and trade unions (e.g. a right to strike; a right for vacation etc.) remains in force. In 2023 more than 2,900 AMKR employees were conscripted into the army and another 157 died in war. AMKR maintained jobs and salaries for 22,000 of its employees; however, approximately 10,000 thousand employees are on downtime and were paid only two-thirds of their wages.
In South Africa, out of the 6,617 employees at ArcelorMittal South Africa ("AMSA"), 4,519 employees form part of the bargaining unit and are covered by a deferred CLA concluded in March 2023 with the recognized unions, NUMSA and Solidarity. This CLA will expire in March 2026. From April 2023 to March 2024, the agreement comprised a range of provisions encompassing a 6.5% remuneration adjustment for all employees within the bargaining unit. It further incorporated an ex-gratia premium, enhancements to the medical aid subsidy and a 6.5% increase in all allowances excluding retention and protected allowances. For the second and third years until March 2026, there will be incremental increases in wages, medical aid subsidies and all allowances. These increases will be tied to the Consumer Price Index (CPI) with a cap set at 6.5%. Moreover, the company’s contribution to medical aid will progressively rise, reaching 70% by 2026 while the employee’s contribution will decrease to 30%. On November 28, 2023, AMSA announced the possible winding down of operations including iron making Newcastle and Long Steel products as well as the potential reorganization of support services and management levels across the company. Subsequent to the
207
| Management report | ||
announcement there have been numerous engagements with Government representatives inter alia Ministers of Economic Development, Public Enterprises and Finance including the Provincial and Regional Structures with a view to see to which extent some support could be provided by the State to mitigate or prevent the closure of these operations. As a result of these discussions and consultation sessions, on February 8, 2024, an announcement was made to defer the winding down of the Long Steel products business for a period of up to six months. In parallel to these discussions, engagements with organized labour have also continued. Discussions under Section 189 with organized labour in accordance with Labour Relations Act began in December 2023 with the aim to be concluded by the end of February 2024. The consultation process with labour is continuing with the objective of reaching an agreement, while alternative options are further explored.
Throughout 2023, ArcelorMittal Mining maintained a productive engagement with its trade unions and communities where it operates. Following the industrial action in ArcelorMittal Liberia in May 2023, the mining segment's relationship with trade unions in Liberia has been improved. The current agreement is expiring in the second quarter of 2024. A negotiation priority was established and a negotiation team was formed. The negotiations are planned to start in March 2024 with an aim to conclude by the end of the second quarter of 2024.
Corporate governance
This section describes the corporate governance practices of ArcelorMittal for the year ended December 31, 2023.
Board of Directors and senior management
ArcelorMittal is governed by a Board of Directors and managed by the senior management. As described in "Directors and senior management" above, ArcelorMittal’s senior management is comprised of the Executive Office - comprising the Executive Chairman, Mr. Lakshmi N. Mittal and the CEO, Mr. Aditya Mittal. The Executive Office is supported by a team of nine other Executive Officers, who together encompass the key regions and corporate functions.
A number of corporate governance provisions in the Articles of Association of ArcelorMittal reflect provisions of the Memorandum of Understanding signed on June 25, 2006 (prior to Mittal Steel Company N.V.’s merger with Arcelor), amended in April 2008 and which mostly expired on August 1, 2009. For more information about the Memorandum of Understanding, see “Additional information—Material contracts—Memorandum of Understanding”.
ArcelorMittal fully complies with the 10 Principles of Corporate Governance of the Luxembourg Stock Exchange. This is explained in more detail in “—Other corporate governance practices” below. ArcelorMittal also complies with the New York
Stock Exchange Listed Company Manual as applicable to foreign private issuers. There are no significant differences between the corporate governance practices of ArcelorMittal and those required of a U.S. domestic issuer under the Listed Company Manual of the New York Stock Exchange.
Board of Directors
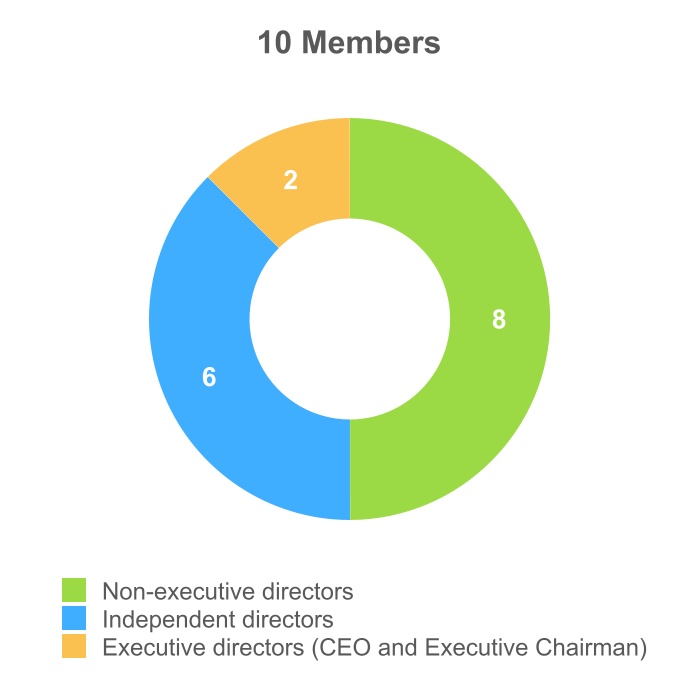
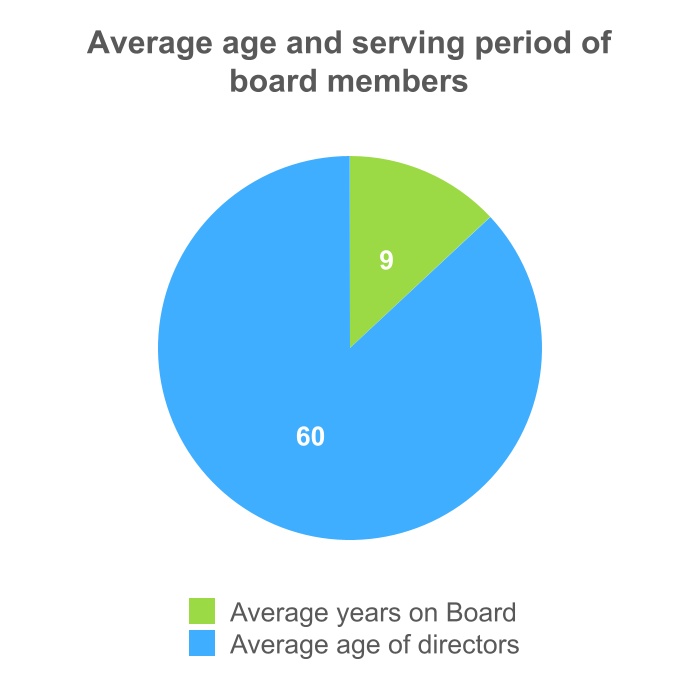
208
| Management report | ||
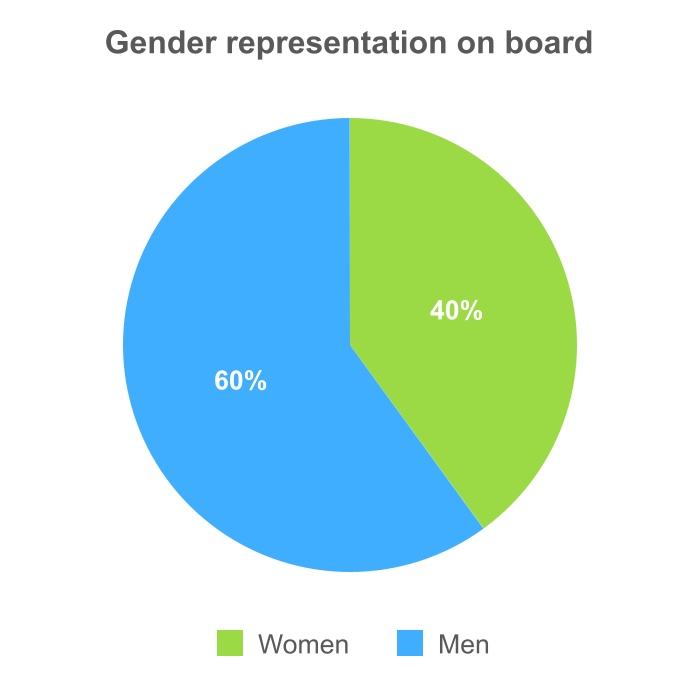
The Board of Directors is in charge of the overall governance and direction of ArcelorMittal. It is responsible for the performance of all acts of administration necessary or useful in furtherance of the corporate purpose of ArcelorMittal, except for matters reserved by Luxembourg law or the Articles of Association to the general meeting of shareholders. The Articles of Association provide that the Board of Directors is composed of a minimum of 3 and a maximum of 18 members.
The Articles of Association provide that directors are elected and removed by the general meeting of shareholders by a simple majority of votes cast. Other than as set out in the Company’s Articles of Association, no shareholder has any specific right to nominate, elect or remove directors. Directors are elected by the general meeting of shareholders for three-year terms. In the event that a vacancy arises on the Board of Directors for any
reason, the remaining members of the Board of Directors may by a simple majority elect a new director to temporarily fulfill the duties attaching to the vacant post until the next general meeting of the shareholders.
For further information on the composition of the Board of Directors, including the expiration of each Director’s term and the period during which each Director has served, see section "—Directors and senior management " above.
Mr. Lakshmi N. Mittal was elected Chairman of the Board of Directors on May 13, 2008. Mr. Lakshmi N. Mittal was also ArcelorMittal’s CEO until February 11, 2021. Mr. Lakshmi N. Mittal was re-elected to the Board of Directors for a three-year term at the annual general meeting of shareholders on May 2, 2023.
A director is considered “independent” if:
(a)he or she is independent within the meaning of the New York Stock Exchange Listed Company Manual, as applicable to foreign private issuers,
(b)he or she is unaffiliated with any shareholder owning or controlling more than two percent of the total issued share capital of ArcelorMittal, and
(c)the Board of Directors makes an affirmative determination to this effect.
For these purposes, a person is deemed affiliated to a shareholder if he or she is an executive officer, a director who also is an employee, a general partner, a managing member or a controlling shareholder of such shareholder. The 10 Principles of Governance of the Luxembourg Stock Exchange, which constitute ArcelorMittal's domestic corporate governance code, require ArcelorMittal to define the independence criteria that apply to its directors, which are described in article 8.1 of its Articles of Association.
Specific characteristics of the director role
Required share ownership Lead Independent Director - minimum of 6,000 ordinary shares Non-executive directors - minimum of 4,000 ordinary shares | Maximum 12 year service (independent directors) | May not serve on the boards of directors of more than four publicly listed companies (non-executive directors) | Required to sign the Company’s Code of Business Conduct and confirm their adherence annually | ||||||||
The Company’s Articles of Association do not require directors to be shareholders of the Company. The Board of Directors nevertheless adopted a share ownership policy on October 30, 2012, that was amended on November 7, 2017, considering that
it is in the best interests of all shareholders for all non-executive directors to acquire and hold a minimum number of ArcelorMittal ordinary shares in order to better align their long-term interests with those of ArcelorMittal’s shareholders. The Board of
209
| Management report | ||
Directors believes that this share ownership policy will result in a meaningful holding of ArcelorMittal shares by each non-executive director, while at the same time taking into account the fact that the share ownership requirement should not be excessive in order not to unnecessarily limit the pool of available candidates for appointment to the Board of Directors. Directors must hold their shares directly or indirectly, and as sole or joint beneficiary owner (e.g., with a spouse or minor children), at the latest within three years of his or her election to the Board of Directors. Each director will hold the shares acquired on the basis of this policy for so long as he or she serves on the Board of Directors. Directors purchasing shares in compliance with this policy must comply with the ArcelorMittal Insider Dealing Regulations and, in particular, refrain from trading during any restricted period, including any such period that may apply immediately after the Director’s departure from the Board of Directors for any reason.
On October 30, 2012, the Board of Directors also adopted a policy that places limitations on the terms of independent directors as well as the number of directorships that directors may hold in order to align the Company’s corporate governance practices with best practices in this area (as highlighted in the table above). Nevertheless, the Board of Directors may, by way of exception to this rule, make an affirmative determination, on a case-by-case basis, that a Director may continue to serve beyond the 12-year rule if the Board of Directors considers it to be in the best interest of the Company based on the contribution of the Director involved taking into consideration the balance between the knowledge, skills, experience of the director and the need for renewal of the Board.
As membership of the Board of Directors represents a significant time commitment, the policy requires both executive and non-executive directors to devote sufficient time to the discharge of their duties as a Director of ArcelorMittal. Directors are therefore required to consult with the Chairman and the Lead Independent Director before accepting any additional commitment that could conflict with or impact the time they can devote to their role as a Director of ArcelorMittal. A non-executive Director’s service on the board of directors of any subsidiary or affiliate of ArcelorMittal or of any non-publicly listed company is not taken into account for purposes of complying with the service limitation.
Although non-executive directors of ArcelorMittal who change their principal occupation or business association are not necessarily required to leave the Board of Directors, the policy requires each non-executive director, in such circumstances, to promptly inform the Board of Directors of the action he or she is contemplating. Should the Board of Directors determine that the contemplated action would generate a conflict of interest, such non-executive director would be asked to tender his or her
resignation to the Chairman of the Board of Directors, who would decide to accept the resignation or not.
None of the members of the Board of Directors, including the executive directors, have entered into service contracts with ArcelorMittal or any of its subsidiaries that provide for any form of remuneration or for benefits upon the termination of their term. All non-executive Directors of the Company signed the Company’s Appointment Letter, which confirms the conditions of their appointment by the General Meeting of the Shareholders including compliance with certain non-compete provisions, the 10 Principles of Corporate Governance of the Luxembourg Stock Exchange and the Company’s Code of Business Conduct.
The remuneration of the members of the Board of Directors is determined on a yearly basis by the annual general meeting of shareholders.
Share transactions by management
In compliance with laws prohibiting insider dealing, the Board of Directors of ArcelorMittal has adopted insider dealing regulations, which apply throughout the ArcelorMittal group. These regulations are designed to ensure that insider information is treated appropriately within the Company and avoid insider dealing and market manipulation. Any breach of the rules set out in this procedure may lead to criminal or civil charges against the individuals involved, as well as disciplinary action by the Company.
Operation
General
The Board of Directors and the Board committees may engage the services of external experts or advisers as well as take all actions necessary or useful to implement the Company’s corporate purpose. The Board of Directors (including its three committees) has its own budget, which covers functioning costs such as external consultants, continuing education activities for directors and travel expenses.
Meetings
The Board of Directors meets when convened by the Chairman of the Board or any two members of the Board of Directors. The Board of Directors holds physical meetings at least on a quarterly basis as five regular meetings are scheduled per year. The Board of Directors holds additional meetings if and when circumstances require, in person or by teleconference and can take decisions by written circulation, provided that all members of the Board of Directors agree.
In 2023, the Board of Directors held 8 meetings with 100% of the average attendance rate.
210
| Management report | ||
8 meetings (2023) | 100% Average attendance rate | ||||
In order for a meeting of the Board of Directors to be validly held, a majority of the directors must be present or represented, including at least a majority of the independent directors. In the absence of the Chairman, the Board of Directors will appoint a chairman by majority vote for the meeting in question. The Chairman may decide not to participate in a Board of Directors’ meeting, provided he has given a proxy to one of the directors who will be present at the meeting. For any meeting of the Board of Directors, a director may designate another director to represent him or her and vote in his or her name, provided that the director so designated may not represent more than one of his or her colleagues at any time.
Each director has one vote and none of the directors, including the Chairman, has a casting vote. Decisions of the Board of Directors are made by a majority of the directors present and represented at a validly constituted meeting, except for the decisions of the Board of Directors relating to the issue of any financial instruments carrying or potentially carrying a right to equity pursuant to the authorization conferred by article 5.5 of the Articles of Association, which shall be taken by a majority of two-thirds of the directors present or represented at a validly constituted meeting.
Lead Independent Director
Mrs. Karyn Ovelmen was elected by the Board of Directors as ArcelorMittal's Lead Independent Director at the board meeting held on May 2, 2023.
The agenda of each meeting of the Board of Directors is decided jointly by the Chairman of the Board of Directors and the Lead Independent Director.
Separate meetings of independent directors
The independent members of the Board of Directors may schedule meetings outside the presence of non-independent directors. Three meetings of the independent directors outside the presence of management were held in 2023.
Annual self-evaluation
The Board of Directors decided in 2008 to start conducting an annual self-evaluation of its functioning in order to identify potential areas for improvement. The first self-evaluation process was carried out in early 2009. The self-evaluation process includes structured interviews between the Lead Independent Director and each director and covers the overall performance of the Board of Directors, its relations with senior management, the performance of individual directors, and the
performance of the committees. The process is supported by the Company Secretary under the supervision of the Chairman and the Lead Independent Director. The findings of the self-evaluation process are examined by the ARCG Committee and presented with recommendations from the ARCG Committee to the Board of Directors for adoption and implementation. Suggestions for improvement of the Board of Directors’ process based on the prior year’s performance and functioning are implemented during the following year.
The 2023 Board of Directors’ self-evaluation was completed by the Board on February 7, 2024. The Board of Directors was of the opinion that it and the management had cooperated successfully during 2023. Strong focus has continued to be given on health and safety, decarbonization, sustainability, on joint venture performance and structure, on shareholders returns including share buyback, on policies including incorporation of ESG criteria, but also on deployment of capital in the long term future. The Board of Directors reviewed the practical implementation of the governance structure and thought it was working well. The Board set new priorities for discussion and review and identified a number of priority topics for 2024.
The Board of Directors believes that its members have the appropriate range of skills, knowledge and experience, as well as the degree of diversity necessary to enable it to effectively govern the business. The Board of Directors composition is reviewed on a regular basis and additional skills and experience are actively searched for in line with the expected development of ArcelorMittal’s business as and when appropriate.
Required skills, experience and other personal characteristics
Diverse skills, backgrounds, knowledge, experience, geographic location, nationalities and gender are required in order to effectively govern a global business the size of the Company’s operations. The Board of Directors and its committees are therefore required to ensure that the Board has the right balance of skills, experience, independence and knowledge necessary to perform its role in accordance with the highest standards of governance.
The Company’s directors must demonstrate unquestioned honesty and integrity, preparedness to question, challenge and critique constructively, and a willingness to understand and commit to the highest standards of governance. They must be committed to the collective decision-making process of the Board of Directors and must be able to debate issues openly and constructively, and question or challenge the opinions of others. Directors must also commit themselves to remain actively involved in Board decisions and apply strategic thought to matters at issue. They must be clear communicators and good listeners who actively contribute to the Board in a collegial manner. Each director must also ensure that no decision or
211
| Management report | ||
action is taken that places his or her interests before the interests of the business. Each director has an obligation to protect and advance the interests of the Company and must refrain from any conduct that would harm it.
In order to govern effectively, non-executive directors must have a clear understanding of the Company’s strategy, and a thorough knowledge of the ArcelorMittal group and the industries in which it operates. Non-executive directors must be sufficiently familiar with the Company’s core business to effectively contribute to the development of strategy and monitor performance.
With specific regard to the non-executive directors of the Company, the composition of the group of non-executive directors should be such that the combination of experience, knowledge and independence of its members allows the Board to fulfill its obligations towards the Company and other stakeholders in the best possible manner.
The ARCG Committee ensures that the Board of Directors is comprised of high-caliber individuals whose background, skills, experience and personal characteristics enhance the overall profile of the Board and meets its needs and diversity aspirations by nominating high quality candidates for election to the Board by the general meeting of shareholders.
Board profile
The key skills and experience of the directors, and the extent to which they are represented on the Board of Directors and its committees, are set out below. In summary, the non-executive directors contribute:
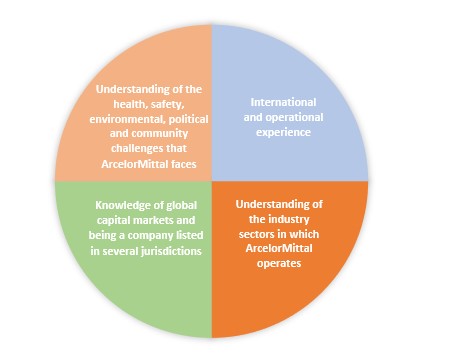
Renewal
The Board of Directors plans for its own succession, with the assistance of the ARCG Committee. In doing this, the Board of Directors:
•considers the skills, backgrounds, knowledge, experience and diversity of geographic location, nationality and gender necessary to allow it to meet the corporate purpose;
•assesses the skills, backgrounds, knowledge, experience and diversity currently represented;
•identifies any inadequate representation of those attributes and agrees the process necessary to ensure a candidate is selected who brings them to the Board of Directors; and
•reviews how Board performance might be enhanced, both at an individual director level and for the Board as a whole.
The Board believes that orderly succession and renewal is achieved through careful planning and by continuously reviewing the composition of the Board.
When considering new appointments to the Board, the ARCG Committee oversees the preparation of a position specification that is provided to an independent recruitment firm retained to conduct a global search, taking into account, among other factors, geographic location, nationality and gender. In addition to the specific skills, knowledge and experience required of the candidate, the specification contains the criteria set out in the ArcelorMittal Board profile.
Diversity
In line with the worldwide effort to increase gender diversity on the boards of directors of listed and unlisted companies, the Board met its goal of increasing the number of women on the Board to at least three by the end of 2015 with the election of Mrs. Karyn Ovelmen in May 2015. Out of 10 members of the Board of Directors, women represented 40% in 2023. The ArcelorMittal Board’s diversity not only relates to gender, but also to the region, background and industry of its members.
Director induction, training and development
The Board considers that the development of the directors’ knowledge of the Company, the steel-making and mining industries, and the markets in which the Company operates is an ongoing process. To further bolster the skills and knowledge of directors, the Company set up a continuous development program in 2009.
Upon his or her election, each new non-executive director undertakes an induction program specifically tailored to his or her needs and includes ArcelorMittal’s long-term vision centered on the concept of “Safe Sustainable Steel”.
The Board’s development activities include the provision of regular updates to directors on each of the Company’s products
212
| Management report | ||
and markets. Non-executive directors may also participate in training programs designed to maximize the effectiveness of the directors throughout their tenure and link in with their individual performance evaluations. The training and development program may cover not only matters of a business nature, but also matters falling into the environmental, social and governance area.
Structured opportunities are provided to build knowledge through initiatives such as visits to plants and mine sites and business briefings provided at Board meetings. Non-executive directors also build their Company and industry knowledge through the involvement of the Executive Office and other senior employees in Board meetings. Business briefings, site visits and development sessions underpin and support the Board’s work in monitoring and overseeing progress towards the corporate purpose of creating long-term shareholder value through the development of the ArcelorMittal business in steel and mining. The Company therefore continuously builds directors’ knowledge to ensure that the Board remains up-to-date with developments within the Company’s segments, as well as developments in the markets in which the Company operates.
During the year, non-executive directors participated in the following activities:
•comprehensive business briefings intended to provide the directors with a deeper understanding of the Company’s activities, environment, key issues and strategy of the Company’s segments. These briefings are provided to the Board of Directors by senior executives, including Executive Office members. The briefings provided during the course of 2023 covered many areas. In particular, a strong emphasis has been given to health and safety processes, fatality prevention, environment and climate change. Specific major acquisitions were reviewed. In addition, cyber security, risk management, corporate responsibility, carbon reduction strategy in steelmaking, capital allocation process and strategy were covered. Business briefings took place at Board and committee meetings;
•briefing meetings with the Company executives in charge of specific business segments or markets;
•site visits of directors to plants and R&D centers.
•development sessions on specific topics of relevance, such as health and safety, commodity markets, HR, investor relations, accounting, the world economy, changes in corporate governance standards, directors’ duties and shareholder feedback.
The ARCG Committee oversees director training and development. This approach allows induction and learning
opportunities to be tailored to the directors’ committee memberships, as well as the Board of Directors' specific areas of focus. In addition, this approach ensures a coordinated process in relation to succession planning, Board renewal, training, development and committee composition, all of which are relevant to the ARCG Committee’s role in securing the supply of talent to the Board.
Board of Directors committees
The Board of Directors has three committees:
•the Audit & Risk Committee,
•the ARCG Committee, and
•the Sustainability Committee.
Audit & Risk Committee
4 members (100% independent) | 6 meetings (2023) | ||||
In 2023, 6 meetings of the Audit & Risk Committee were held with an attendance rate of 100%.
The primary function of the Audit & Risk Committee is to assist the Board in fulfilling its oversight responsibilities by reviewing:
•the integrity of the financial reports and other financial information provided by the Company to any governmental body or the public;
•the Company’s compliance with legal and regulatory requirements;
•the registered public accounting firm’s (Independent Auditor) qualifications and independence;
•the Company’s system of internal control regarding finance, accounting, legal compliance, ethics and risk management that management and the Board have established;
•the Company’s auditing, accounting and financial reporting processes generally;
•the identification and management of risks to which the ArcelorMittal group is exposed; and
•conducting investigations into any matters, including whistleblower complaints, within its scope of responsibility and obtaining advice from outside legal, accounting, or other advisers, as necessary, to perform its duties and responsibilities.
The Audit & Risk Committee must be composed solely of independent members of the Board of Directors. The members
213
| Management report | ||
are appointed by the Board of Directors each year after the annual general meeting of shareholders. The Audit & Risk Committee is comprised of four members, all of whom must be independent under the Company’s corporate governance guidelines, the New York Stock Exchange (NYSE) standards as applicable to foreign private issuers and the 10 Principles of Corporate Governance of the Luxembourg Stock Exchange. The Audit & Risk Committee makes decisions by a simple majority with no member having a casting vote.
At least one member must qualify as an "audit committee financial expert” as defined by the SEC and determined by the Board.
At least one member must qualify as an Audit & Risk Committee “risk management expert” having experience in identifying, assessing, and managing risk exposures of large, complex companies.
The Audit & Risk Committee currently consists of 4 members: Mrs. Karyn Ovelmen, Mrs. Patricia Barbizet, Mr. Karel de Gucht and Mr. Etienne Schneider, each of whom is an independent Director according to the NYSE standards and the 10 Principles of Corporate Governance of the Luxembourg Stock Exchange. The Chairman of the Audit & Risk Committee is Mrs. Karyn Ovelmen who is an “audit committee financial expert” as defined by the SEC. Please see “—–Directors and senior management—–Board of Directors” above for Mrs. Ovelmen's experience.
According to its charter, the Audit & Risk Committee is required to meet at least four times a year. The Audit & Risk Committee performs an annual self-evaluation and completed its 2023 self-evaluation on February 7, 2024. The charter of the Audit & Risk Committee is available from ArcelorMittal upon request.
Appointments, Remuneration and Corporate Governance Committee
3 members (100% independent) | 6 meetings (2023) | ||||
In 2023, 6 meetings of the ARCG Committee were held, with an attendance rate of 100%.
The ARCG Committee is comprised of three directors, each of whom is independent under the New York Stock Exchange standards as applicable to foreign private issuers and the 10 Principles of Corporate Governance of the Luxembourg Stock Exchange.
The members are appointed by the Board of Directors each year after the annual general meeting of shareholders. The
ARCG Committee makes decisions by a simple majority with no member having a casting vote.
The Board of Directors has established the ARCG Committee to:
•determine, on its behalf and on behalf of the shareholders within agreed terms of reference, ArcelorMittal’s compensation framework, including short and long term incentives for the CEO, the Executive Chairman and for the nine other Executive Officers;
•review and approve succession and contingency plans for key managerial positions at the level of the Executive Officers;
•consider any candidate for appointment or reappointment to the Board of Directors at the request of the Board of Directors and provide advice and recommendations to it regarding the same;
•evaluate the functioning of the Board of Directors and monitor the Board of Directors’ self-evaluation process;
•assess the roles of the Chairman and CEO and deliberate on the merits of the Board’s leadership structure to ensure that the most efficient and appropriate structure is in place; and
•develop, monitor and review corporate governance principles and corporate responsibility policies applicable to ArcelorMittal, as well as their application in practice.
During its meeting of July 27, 2021, the Appointment, Remuneration, Corporate Governance and Sustainability Committee became again ARCG Committee and the new Sustainability Committee was created. As a result, ArcelorMittal complies with the new Principle 9 on companies' corporate social responsibility introduced subsequently to the revision of the 10 Principles of the Luxembourg Stock Exchange. According to Recommendation 9.3 under the Principles, the Board shall regularly consider the Company's non-financial risks, including social and environmental risks.
The ARCG Committee’s principal criteria in determining the compensation of executives is to encourage and reward performance that will lead to long-term enhancement of shareholder value. The ARCG Committee may seek the advice of outside experts.
The three members of the ARCG Committee are Mrs. Karyn Ovelmen, Mrs. Clarissa Lins and Mr. Tye Burt, each of whom is independent in accordance with the NYSE standards applicable to foreign private issuers and the 10 Principles of Corporate
214
| Management report | ||
Governance of the Luxembourg Stock Exchange. The Chairman of the ARCG Committee is Mrs. Karyn Ovelmen.
The ARCG Committee is required to meet at least three times a year. The ARCG Committee performs an annual self-evaluation and completed its 2023 self-evaluation on February 7, 2024. The charter of the ARCG Committee is available from ArcelorMittal upon request.
Succession management
Succession management at ArcelorMittal is a systematic, structured process for identifying and preparing employees with potential to fill key organizational positions, should the position become vacant. This process applies to all ArcelorMittal key positions up to and including the Executive Office. Succession management aims to ensure the continued effective performance of the organization by providing for the availability of experienced and capable employees who are prepared to assume these roles as they become available. For each position, candidates are identified based on performance, potential and an assessment of leadership capabilities and their “years to readiness”. Development needs linked to the succession plans are discussed, after which “Personal Development Plans” are put in place, to accelerate development and prepare candidates. Regular reviews of succession plans are conducted at different levels of the organization to ensure that they are accurate and up to date, leading to at least once a year formal review by the Executive Office, of all key positions. Succession management is a necessary process to reduce risk of vacant positions or skill gap transitions, create a pipeline of future leaders, ensure smooth business continuity and improve employee motivation and engagement. This process has been in place for several years and reinforced, widened and made more systematic in all regions of the organization. The responsibility to review and approve succession plans and contingency plans at the highest level rests with the Board’s ARCG Committee.
Sustainability Committee
3 members (67% independent) | 6 meetings (2023) | ||||
In 2023, 6 meetings of Sustainability Committee were held, with an attendance rate of 100%.
The Sustainability Committee ("SC") is comprised of three members, of whom two are independent. The SC makes decisions by simple majority with no member having a casting vote.
The primary function of the SC is to assist the Board of Directors on the following areas:
•review Group level frameworks, policies, standards, and guidelines in sustainability matters;
•review the Company's sustainable development plan and associated management systems and ensure the Group is well positioned to meet the evolving expectations of stakeholders, including investors, customers, regulators, employees, and communities;
•review the effectiveness of the process for assessing and managing catastrophic risks;
•coordinate the SC’s risk management work with the Audit and Risk Committee, in relation to reporting to the Board;
•review the findings of important climate action report and the management response;
•support and provide guidance to management in developing and updating policies and procedures relating to employee health & safety, environment, climate change and community relations;
•monitor any current, pending or threatened legal actions with respect to safety, climate change, environment, and community relations;
•review and recommend to the Board of Directors on the adequacy of the reporting on sustainability opportunities, risks and issues in the annual report, Sustainability Report, and other relevant public documents;
•make recommendations to the Board of Directors with respect to trends in results and programs in all covered areas;
•ensure that the SC Chair (or in their absence, an alternative member) of the SC attends the Company’s Annual General Meeting to answer questions concerning sustainability and their development and/or implementation;
•oversee any investigation and/or undertake any thorough analysis which is within its scope.
The three members of the SC are Mrs. Clarissa Lins, Mr. Tye Burt and Mr. Michel Wurth. Mrs. Lins and Mr. Burt are independent in accordance with the Company’s corporate governance guidelines, the NYSE standards and the 10 Principles of Corporate Governance of the Luxembourg Stock Exchange. The Chairman of the SC is Mrs. Lins.
The members have relevant expertise or experience relating to the objective of the SC. The responsible senior managers pertaining to their respective areas of responsibility - health and
215
| Management report | ||
safety, environment, climate change, for community relations - are permanent invitees to the meetings of the SC. The Chairman of the SC makes a verbal report of the SC’s decisions and findings to the Board of Directors after each SC meeting.
Other corporate governance practices
ArcelorMittal is committed to adhering to best practices in terms of corporate governance in its dealings with shareholders and aims to ensure good corporate governance by applying rules on transparency, quality of reporting and the balance of powers. ArcelorMittal continually monitors U.S., EU and Luxembourg legal requirements and best practices in order to make adjustments to its corporate governance controls and procedures when necessary, as evidenced by the policies adopted by the Board of Directors in 2012.
ArcelorMittal complies with the 10 Principles of Corporate Governance of the Luxembourg Stock Exchange in all respects.
Ethics and conflicts of interest
Ethics and conflicts of interest are governed by ArcelorMittal’s Code of Business Conduct, which establishes the standards for ethical behavior that are to be followed by all employees and directors of ArcelorMittal in the exercise of their duties, including the Company's CEO and CFO. Each employee of ArcelorMittal is required to sign and acknowledge the Code of Conduct upon joining the Company. This also applies to the members of the Board of Directors of ArcelorMittal, who signed the Company’s Appointment Letter in which they acknowledged their duties and obligations. Any new member of the Board of Directors must sign and acknowledge the Code of Conduct upon appointment.
Employees must always act in the best interests of ArcelorMittal and must avoid any situation in which their personal interests conflict, or could conflict, with their obligations to ArcelorMittal. Employees are prohibited from acquiring any financial or other interest in any business or participating in any activity that could deprive ArcelorMittal of the time or the attention needed to devote to the performance of their duties. Any behavior that deviates from the Code of Business Conduct is to be reported to the employee’s supervisor, a member of the management, the head of the legal department or the head of the Global Assurance department.
Code of Business Conduct
Conduct training is offered throughout ArcelorMittal on a regular basis in the form of face-to-face trainings, webinars and online trainings. Employees are periodically trained about the Code of Business Conduct in each location where ArcelorMittal has operations. The Code of Business Conduct is available in the “Corporate Governance-Our Policies-Code of Business Conduct” section of ArcelorMittal’s website at www.arcelormittal.com and has been disseminated through Company-wide communications.
In addition to the Code of Business Conduct, ArcelorMittal has developed a Human Rights Policy and a number of other compliance policies in more specific areas, such as antitrust, anti-corruption, economic sanctions, insider dealing and data protection. In all these areas, specifically targeted groups of employees are required to undergo specialized compliance training. Furthermore, ArcelorMittal’s compliance program also includes a quarterly compliance certification process covering all business segments and entailing reporting to the Audit & Risk Committee.
ArcelorMittal intends to disclose any amendment to or waiver from the Code of Business Conduct applicable to any of ArcelorMittal’s directors, its CEO, CFO or any other person who is an Executive Officer of ArcelorMittal on ArcelorMittal’s website at www.arcelormittal.com.
Process for Handling Complaints on Accounting Matters
As part of the procedures of the Board of Directors for handling complaints or concerns about accounting, internal controls and auditing issues, ArcelorMittal’s Anti-Fraud Policy and Code of Business Conduct encourage all employees to bring such issues to the Audit & Risk Committee’s attention on a confidential basis. In accordance with ArcelorMittal’s Anti-Fraud and Whistleblower Policy, concerns with regard to possible fraud or irregularities in accounting, auditing or banking matters or bribery within ArcelorMittal or any of its subsidiaries or other controlled entities may also be communicated through the “—Corporate Governance—Whistleblower” section of the ArcelorMittal website at www.arcelormittal.com, where ArcelorMittal’s Anti-Fraud Policy and Code of Business Conduct are also available in each of the main working languages used within the Group. In recent years, ArcelorMittal has implemented local whistleblowing facilities, as needed.
Global Assurance
ArcelorMittal has a Global Assurance function that, through its Head of Global Assurance, reports to the Audit & Risk Committee. The function is staffed by full-time professional staff located within each of the principal operating subsidiaries and at the corporate level. Recommendations and matters relating to internal control and processes are made by the Global Assurance function and their implementation is regularly reviewed by the Audit & Risk Committee.
Independent auditors
The appointment and determination of fees of the independent auditors is the direct responsibility of the Audit & Risk Committee. The Audit & Risk Committee is further responsible for obtaining, at least once each year, a written statement from the independent auditors that their independence has not been impaired. The Audit & Risk Committee has also obtained a confirmation from ArcelorMittal’s principal independent auditors to the effect that none of its former employees are in a position
216
| Management report | ||
within ArcelorMittal that may impair the principal auditors’ independence.
Measures to prevent insider dealing and market manipulation
The Board of Directors of ArcelorMittal has adopted Insider Dealing Regulations (“IDR”), which are updated when necessary (most recently in January 2019) and in relation to which training is conducted throughout the Group. The IDR’s most recent version has been updated in light of the new Market Abuse Regulation and is available on ArcelorMittal’s website, www.arcelormittal.com.
The IDR apply to the worldwide operations of ArcelorMittal. The compliance and data protection officer of ArcelorMittal is also the IDR compliance officer and answers questions that members of senior management, the Board of Directors, or employees may have about the IDR’s interpretation. The IDR compliance officer maintains a list of insiders as required by Regulation No 596/2014 of the European Parliament and the Council dated 16 April 2014 on market abuse or “MAR” and the Commission Implementing Regulation 2016/347 of 10 March 2016 laying down technical standards with regard to the precise format of insider lists and for updating insider lists in accordance with MAR. The IDR compliance officer may assist senior executives and directors with the filing of notices required by Luxembourg law to be filed with the Luxembourg financial regulator, the CSSF (Commission de Surveillance du Secteur Financier). Furthermore, the IDR compliance officer has the power to conduct investigations in connection with the application and enforcement of the IDR, in which any employee or member of senior management or of the Board of Directors is required to cooperate.
Selected new employees of ArcelorMittal are required to participate in a training course about the IDR upon joining ArcelorMittal and every three years thereafter. The individuals who must participate in the IDR training include the members of senior management, employees who work in finance, legal, sales, mergers and acquisitions and other areas that the Company may determine from time to time. In addition, ArcelorMittal’s Code of Business Conduct contains a section on “Trading in the Securities of the Company” that emphasizes the prohibition to trade on the basis of inside information. An online interactive training tool based on the IDR is currently deployed across the group through ArcelorMittal’s intranet, with the aim to enhance the staff’s awareness of the risks of sanctions applicable to insider dealing. The importance of the IDR is again reiterated in the Group's internal Group Policies and Procedures Manual.
SHAREHOLDERS AND MARKETS
Major shareholders
The following table sets out information as of December 31, 2023 with respect to the beneficial ownership of ArcelorMittal ordinary shares by each person who is known to be the beneficial owner of more than 5% of the shares and all directors and senior management as a group.
| ArcelorMittal Ordinary Shares | |||||||||||
| Number | % | ||||||||||
Significant Shareholder1 | 340,014,215 | 39.87 | % | ||||||||
Treasury Shares2 | 33,538,016 | 3.93 | % | ||||||||
| Other Public Shareholders | 479,257,541 | 56.20 | % | ||||||||
| Total | 852,809,772 | 100.00 | % | ||||||||
Of which: BlackRock inc.5 | 48,794,511 | 5.72 | % | ||||||||
Of which: Directors and Senior Management3 | 430,925 | 0.05 | % | ||||||||
| Significant Shareholder voting rights (outstanding shares) | 41.50 | % | |||||||||
1For purposes of this table, ordinary shares owned directly by Mr. Lakshmi N. Mittal and his wife, Mrs. Usha Mittal, are aggregated with those ordinary shares beneficially owned by the Significant Shareholder. At December 31, 2023, Mr. Lakshmi Mittal and his wife, Mrs. Usha Mittal, had direct ownership of ArcelorMittal ordinary shares and beneficial ownership (within the meaning set forth in Rule 13d-3 of the Exchange Act), through the Significant Shareholder, of the outstanding equity of two holding companies that own ArcelorMittal ordinary shares—Nuavam Investments S.à. r.l. (“Nuavam”) and Lumen Investments S.à r.l. (“Lumen”). Nuavam, a limited liability company organized under the laws of Luxembourg, was the owner of 63,658,348 ArcelorMittal ordinary shares. Lumen, a limited liability company organized under the laws of Luxembourg, was the owner of 275,840,595 ArcelorMittal ordinary shares. Mr. Lakshmi N. Mittal was the direct owner of 489,772 ArcelorMittal ordinary shares. Mrs. Mittal was the direct owner of 25,500 ArcelorMittal ordinary shares. Mr. Lakshmi N. Mittal, Mrs. Mittal and the Significant Shareholder shared beneficial ownership of 100% of the outstanding equity of each of Nuavam and Lumen (within the meaning set forth in Rule 13d-3 of the Exchange Act). Accordingly, Mr. Lakshmi N. Mittal was the beneficial owner of 339,988,715 ArcelorMittal ordinary shares, Mrs. Mittal was the beneficial owner of 339,524,443 ordinary shares, and the Significant Shareholder (when aggregated with ordinary shares of ArcelorMittal held directly by Mr. and Mrs. Mittal) was the beneficial owner of 340,014,215 ordinary shares. As of December 31, 2023 and 2022, the Significant Shareholder (together with Mr. Lakshmi N. Mittal and Mrs. Mittal) held 39.87% and 37.65% of the Company’s ordinary shares respectively.
2Represents ArcelorMittal ordinary shares repurchased pursuant to share repurchase programs, fractional shares returned in various transactions, and the use of treasury shares in various transactions.
3Includes shares beneficially owned by directors and members of senior management listed in section "Management and employees—Directors and senior managers" of this annual report; excludes shares beneficially owned by Mr. Lakshmi N. Mittal. Note that ordinary shares included in this item are included in “Other Public Shareholders” above.
4Note that ordinary shares included in this item are included in “Other Public Shareholders” above.
5On October 31, 2023, BlackRock, Inc. provided notifications to the Company stating that it beneficially owned 5.72% of ArcelorMittal’s issued shares as of October 30, 2023. The number of shares shown in this table is based on this notification.
217
| Management report | ||
Aditya Mittal is the direct owner of 298,781 ArcelorMittal ordinary shares, representing less than 0.1% of the ArcelorMittal ordinary shares outstanding. Aditya Mittal holds a total of 276,045 PSUs of which 71,050 may vest in 2024, 56,977 may vest in 2025, 73,902 may vest in 2026 and 74,116 in 2027. As the vesting of PSUs is dependent on the Company's performance criteria not fully within the control of the PSU holder, Aditya Mittal does not beneficially own ArcelorMittal ordinary shares by virtue of his ownership of the PSUs. Aditya Mittal is the son of Mr. Lakshmi N. Mittal and Mrs. Mittal and is CEO and non-independent director of ArcelorMittal. Vanisha Mittal Bhatia is the direct owner of 8,500 ArcelorMittal ordinary shares, representing less than 0.1% of the ArcelorMittal ordinary shares outstanding. Vanisha Mittal Bhatia is the daughter of Mr. Lakshmi N. Mittal and Mrs. Mittal and a member of the Company’s Board of Directors.
The ArcelorMittal ordinary shares may be held in registered form on the Company’s register only. Registered shares are fully fungible and may consist of:
a.ArcelorMittal Registry Shares, which are registered directly on ArcelorMittal’s Luxembourg shareholder register,
b.shares traded on Euronext Amsterdam, Euronext Paris, the regulated market of the Luxembourg Stock Exchange and the Spanish Stock Exchanges, which are held in Euroclear, or
c.shares traded on the NYSE, the ("New York Registry Shares"), which are registered (including in the name of the nominee of DTC) in a New York Share Register kept on behalf of ArcelorMittal by Citibank N.A., its New York transfer agent.
On February 5, 2021, BlackRock, Inc. filed a Schedule 13G with the SEC stating that it beneficially owned 57,171,259 shares or 5.2% of ArcelorMittal’s issued shares as of December 31, 2020.
On March 10, 2021, BlackRock, Inc. filed a Schedule 13G/A with the U.S. Securities and Exchange Commission stating that it beneficially owned 51,468,777 shares or 4.7% of ArcelorMittal’s issued shares as of February 28, 2021.
On January 19, 2022, BlackRock, Inc. provided a notification to the Company stating that it beneficially owned 49,166,064 shares or 5.24% of ArcelorMittal’s issued shares as of January 18, 2022.
On February 4, 2022, BlackRock, Inc. filed a Schedule 13G/A with the U.S. Securities and Exchange Commission stating that it beneficially owned 52,460,418 shares or 5.3% of ArcelorMittal’s issued shares as of December 31, 2021.
On March 18, 2022, BlackRock, Inc. provided a notification to the Company stating that it beneficially owned less than 5% of ArcelorMittal’s issued shares as of March 15, 2022.
On May 24, 2022, BlackRock, Inc. provided a notification to the Company stating that it beneficially owned 5.27% of ArcelorMittal’s issued shares as of May 18, 2022.
On July 1, 2022, BlackRock, Inc. provided a notification to the Company stating that it beneficially owned less than 5% of ArcelorMittal’s issued shares as of June 30, 2022.
On August 9, 2022, BlackRock, Inc. filed a Schedule 13G/A with the U.S. Securities and Exchange Commission stating that it beneficially owned 43,446,535 shares or 4.9% of ArcelorMittal’s issued shares as of July 31, 2022.
On April 25, 2023, BlackRock, Inc. provided a notification to the Company stating that it beneficially owned 5% of ArcelorMittal’s issued shares as of April 21, 2023.
On August 25, 2023, BlackRock, Inc. provided a notification to the Company stating that it beneficially owned 5.68% of ArcelorMittal’s issued shares as of August 23, 2023.
On September 18, 2023, BlackRock, Inc. provided notifications to the Company stating that it beneficially owned 5.82% of ArcelorMittal’s issued shares as of September 18, 2023.
On September 19, 2023, BlackRock, Inc. provided notifications to the Company stating that it beneficially owned 5.83% of ArcelorMittal’s issued shares as of September 19, 2023.
On October 31, 2023, BlackRock, Inc. provided notifications to the Company stating that it beneficially owned 5.72% of ArcelorMittal’s issued shares as of October 30, 2023.
On February 1, 2024, BlackRock, Inc. filed a Schedule 13G/A with the U.S. Securities and Exchange Commission stating that it beneficially owned 47,017,241 shares or 5.5% of ArcelorMittal’s issued shares as of December 31, 2023.
There were notifications from Société Générale SA on June 22, on November 12, 19 and 24, on December 18 and 30, 2020 and on January 4, 6 and 25, 2021 with a closing percentage on December 31, 2020 of 4.75% subsequently increasing to 5.18% on January 4, 2021 and decreasing to 4.79% on January 21, 2021.
There were notifications from Société Générale SA on January 4, 6 and 25, 2021, on March 8, 12, 25 and 31, 2021, on May 5 and 19, 2021, on June 7, 2021, on August 6 and 16, 2021, on September 6, 2021, on October 29, 2021, on November 10, 2021 and on December 1, 6 and 29 with a closing percentage on December 31, 2021 of 5.04%.
218
| Management report | ||
On January 26, 2022, there was a notification from Société Générale SA stating that it beneficially owned 44,777,728 shares or 4.88% of ArcelorMittal’s issued shares as of January 21, 2022.
These notifications are available in the Luxembourg Stock Exchange’s OAM electronic database on www.bourse.lu and on the Company’s website corporate.arcelormittal.com under “Investors - Corporate Governance - Shareholding structure”. The notifications were published in reference to the Luxembourg law and the Grand Ducal regulation of January 11, 2008, on transparency requirements for issuers of securities ("Transparency Law") in view of a shareholding notification going above or below the 5% voting rights threshold.
Under Luxembourg law, the ownership of registered shares is evidenced by the inscription of the name of the shareholder, the number of shares held by such shareholder and the amount paid up on each share in the shareholder register of ArcelorMittal.
At December 31, 2023, 2,479 shareholders other than the Significant Shareholder, holding an aggregate of 13,774,020 ArcelorMittal ordinary shares, were registered in ArcelorMittal’s shareholder register, representing approximately 1.62% of the ordinary shares issued (including treasury shares).
At December 31, 2023, there were 153 registered shareholders holding an aggregate of 66,396,511 New York Registry Shares, representing approximately 7.79% of the ordinary shares issued (including treasury shares). ArcelorMittal’s knowledge of the number of New York Registry Shares held by U.S. holders is based solely on the records of its New York transfer agent regarding registered ArcelorMittal ordinary shares.
At December 31, 2023, 443,779,374 ArcelorMittal ordinary shares were held through the Euroclear/Iberclear clearing system in The Netherlands, France, Luxembourg and Spain, representing approximately 52.04% of the ordinary shares issued (including treasury shares).
Voting rights
Each share entitles the holder to one vote at the general meeting of shareholders, and no shareholder benefits from
special voting rights. For more information relating to ArcelorMittal shares, see “Additional information—Memorandum and Articles of Association—Voting and information rights”.
Management share ownership
As of December 31, 2023, the aggregate beneficial share ownership of ArcelorMittal directors and senior management (19 individuals) totaled 430,925 ArcelorMittal shares (excluding shares beneficially owned by the Significant Shareholder, Mr. Lakshmi N. Mittal) representing 0.05% of the total issued share capital of ArcelorMittal. Other than Mr. Lakshmi N. Mittal, each director and member of senior management beneficially owns less than 1% of ArcelorMittal’s shares. See "—Major shareholders” for the beneficial share ownership of the Significant Shareholder, Mr. Aditya Mittal and Ms. Vanisha Mittal Bhatia.
On April 27, 2015, ArcelorMittal adopted share ownership guidelines for its CEO. The share ownership policy aims to demonstrate to ArcelorMittal’ shareholders, the investing public and the Company’s employees, the commitment of the CEO to the Company and directly aligns his interests with those of the Company’s shareholders. Accordingly, the CEO should, within five years of the end of the current calendar year, own shares of the Company’s common shares at least equal to three times his annual salary and hold the purchased shares for so long as he serves the Company.
In accordance with the Luxembourg Stock Exchange’s 10 Principles of Corporate Governance, independent non-executive members of ArcelorMittal's Board of Directors do not receive share options, RSUs or PSUs, and the policy of the Company is not to grant any share-based remuneration to members of the Board of Directors who are not executives of the Company.
See “Management and employees—Compensation” for a description of options, RSUs and PSUs held by members of ArcelorMittal’s senior management, including the Executive Chairman and CEO.
The following tables summarize outstanding PSUs and RSUs granted to the members of the Executive Office and Executive Officers of ArcelorMittal for the last five years.
PSUs granted in 2023 | PSUs granted in 2022 | PSUs granted in 2021 | PSUs granted in 2020 | |||||||||||
| Executive Office | 141,973 | 141,564 | 109,143 | 148,422 | ||||||||||
| Term (in years) | 3 | 3 | 3 | 3 | ||||||||||
Vesting date1 | January 1, 2027 | January 1, 2026 | January 1, 2025 | January 1, 2024 | ||||||||||
219
| Management report | ||
1See “Management and employees—Compensation—Remuneration—Long-term incentives plans”, for vesting conditions.
RSUs granted in December 2023 | PSUs granted in December 2023 | RSUs granted in December 2022 | PSUs granted in December 2022 | RSUs granted in December 2021 | PSUs granted in 2021 | |||||||||||||||
| CFO and Other Executive Officers | 54,800 | 233,100 | 41,500 | 113,900 | 32,400 | 89,200 | ||||||||||||||
| Term (in years) | 3 | 3 | 3 | 3 | 3 | 3 | ||||||||||||||
Vesting date1 | December 8, 2026 | January 1, 2027 | December 13, 2025 | January 1, 2026 | December 16, 2024 | January 1, 2025 | ||||||||||||||
1See note 8.3 to the consolidated financial statements, for vesting conditions.
See note 8.3 of the consolidated financial statements for a description of ArcelorMittal’s equity-settled share-based payments to certain employees, including stock options, RSUs and PSUs.
Related party transactions
ArcelorMittal engages in certain commercial and financial transactions with related parties, including associates and joint ventures of ArcelorMittal. Please refer to note 12 to the consolidated financial statements. Further information related to required disclosure of related party transactions under the Shareholders’ Rights Law of August 1, 2019 implementing the European Union's Shareholders' Rights Directive in Luxembourg (the "Shareholders' Rights Law") is included in “Memorandum and Articles of Association—Voting and information rights”.
Shareholder’s Agreement
Mr. Lakshmi Mittal and ArcelorMittal are parties to a shareholder and registration rights agreement (the “Shareholder’s Agreement”) dated August 13, 1997. Pursuant to the Shareholder’s Agreement and subject to the terms and conditions thereof, ArcelorMittal shall, upon the request of certain holders of restricted ArcelorMittal shares, use its reasonable efforts to register under the Securities Act of 1933, as amended, the sale of ArcelorMittal shares intended to be sold by those holders. By its terms, the Shareholder’s Agreement may not be amended, other than for manifest error, except by approval of a majority of ArcelorMittal’s shareholders (other than the Significant Shareholder and certain permitted transferees) at a general shareholders’ meeting.
Memorandum of Understanding
The Memorandum of Understanding entered into in connection with the Mittal Steel acquisition of Arcelor, certain provisions of which expired in August 2009 and August 2011, is described under “Additional information—Material contracts—Memorandum of Understanding”.
Agreements with Aperam SA post-Stainless Steel Spin-Off
In connection with the spin-off of its stainless steel division into a separately focused company, Aperam SA (“Aperam”), which was completed on January 25, 2011, ArcelorMittal entered into several agreements with Aperam and/ or certain Aperam subsidiaries which are still in force: a purchasing services agreement for negotiation services from ArcelorMittal Purchasing (the “Purchasing Services Agreement”) as well as certain commitments regarding cost-sharing in Brazil and certain other ancillary arrangements governing the relationship between Aperam and ArcelorMittal following the spin-off, as well as certain agreements relating to financing.
The parties agreed to renew a limited number of services where expertise and bargaining power created value for each party. ArcelorMittal will continue to provide in 2024 (similar to 2023) certain services relating to areas including environmental and technical support.
In the area of research and development at the time of the spin-off, Aperam entered into a framework agreement with ArcelorMittal in 2011, and as amended in 2015 to establish a structure for future cooperation in relation to certain ongoing or new research and development programs. Currently, few but valuable research and development supports are implemented through this agreement. New exchanges about breakthrough technologies or possible technical developments interesting both companies were launched in 2021, 2022 and 2023 and are still ongoing.
In Europe, Aperam purchased most of its electricity and natural gas through energy supply contracts put in place for the period 2014-2020 through ArcelorMittal Energy SCA. Electricity and natural gas contracts were renewed in 2022 and for 2023 under similar terms and conditions. Electricity and natural gas supplies will continue in 2024 under new terms and conditions as both contracts are currently under negotiation. In addition,
220
| Management report | ||
ArcelorMittal Europe and Aperam are both party to a supply agreement under which the Company’s European operations will receive significant volumes of calcined products (e.g. lime and dolomitic lime) from a third party for use in steel production.
Regarding procurement, Aperam still relies on ArcelorMittal for supplies and services in relation to the negotiation of certain contracts with global or large regional suppliers. The Purchasing Services Agreement entered into for an initial term of two years until January 24, 2013 has been renewed and remains in force in relation to the following key categories: operating materials (only hot strip mill), refractory materials, spare parts, sea freight, industrial products and support services (excluding industrial services). The Purchasing Services Agreement also permits Aperam to avail itself of the services and expertise of ArcelorMittal for certain capital expenditures.
Another supply agreement entered into between Aperam and ArcelorMittal Sourcing is effective since January 2020 for the sale of electrodes. Specific IT service agreements have been put in place with Aperam, one for Asset Reliability Maintenance Program ("ARMP") in its Brazilian entities, and two others for the use in Europe of ARMP and for the use of the global wide area network (WAN).
Purchasing activities will continue to be provided to Aperam pursuant to existing contracts with ArcelorMittal entities that it has specifically elected to assume. In addition, since 2011, a services agreement has been concluded between ArcelorMittal Shared Service Center Europe Sp z.o.o. Sp.k. and Aperam for accounting services.
In connection with the spin-off, management also renegotiated an existing Brazilian cost-sharing agreement between ArcelorMittal Brasil and Aperam Inox América do Sul S.A., Aperam Inox Serviços Brasil Ltda., Aperam Inox Tubos Brasil Ltda. and Aperam Bioenergia Ltda. pursuant to which, ArcelorMittal Brasil continued to perform purchasing for the benefit of these Aperam’s Brazilian subsidiaries, with costs being shared on the basis of cost allocation parameters agreed between the parties on a yearly basis.
Share Repurchase Agreement
The Significant Shareholder has entered into a share repurchase agreement with ArcelorMittal on February 12, 2021 (as amended from time to time), (the "Share Repurchase Agreement"), to sell each trading day on which ArcelorMittal has purchased shares under its 2021 share buyback programs (the "Programs") an equivalent number of shares, at the proportion of the then Significant Shareholder's stake in ArcelorMittal of issued and outstanding shares of ArcelorMittal, at the same price as the shares repurchased on the market. The effect of the Share Repurchase Agreement was to maintain the Significant Shareholder's voting rights in ArcelorMittal's issued share capital
(net of treasury shares) at the then-current level, pursuant to the Programs.
On March 4, June 18, July 7, November 17 and December 29, 2021, ArcelorMittal announced the completion of five consecutive Programs under the authorization given by the annual general meetings of shareholders held on June 13, 2020 and June 8, 2021 (see "—Purchases of equity securities by the issuer and affiliated purchasers"). To maintain Significant Shareholder's current level of voting rights as per the Share Repurchase Agreement, in the context of the first, second, third, fourth and fifth Programs, the Company repurchased, 9.9 million, 6.5 million, 8.9 million, 24.5 million and 12.4 million shares, respectively, from the Significant Shareholder for $236 million, $207 million, $273 million, $799 million and $363 million, respectively.
On February 11, 2022, ArcelorMittal announced a new $1 billion share buyback program. To maintain Significant Shareholder's current level of voting rights as per the Share Repurchase Agreement, the Company repurchased 525,177 shares from the Significant Shareholder for $16.2 million. On February 25, 2022, the Company announced the decision of the Significant Shareholder not to further participate to such program. Accordingly, the Share Repurchase Agreement was terminated with respect to this program.
Markets
ArcelorMittal shares are listed and traded (through a single order book) on the Euronext European markets (Paris and Amsterdam) (symbol “MT”), are admitted to trading on the Luxembourg Stock Exchange’s regulated market and listed on the Official List of the Luxembourg Stock Exchange (symbol “MT”) and are listed and traded on the Spanish Stock Exchanges (symbol “MTS”). In the United States, ArcelorMittal shares are listed and traded on the NYSE (symbol “MT”).
Paying agents
The paying agent for shareholders who hold shares listed on the NYSE is Citibank and the paying agent for shareholders who hold shares listed on Euronext Amsterdam, Euronext Paris, and Luxembourg Stock Exchange is ABN AMRO since March 29, 2021, date as from which it replaced BNP Paribas Securities Services.
New York Registry Shares
The Company does not have any American Depositary Receipts. As described under “Additional information—Memorandum and Articles of Association—Form and transfer of shares”, the Company maintains a New York share register with Citibank, N.A. for its shares that trade on the NYSE. As of December 31, 2023, 66,396,511 shares (or approximately 7.79% of ArcelorMittal’s total issued shares) were ArcelorMittal New York Registry Shares. Holders of ArcelorMittal New York
221
| Management report | ||
Registry Shares do not pay fees to Citibank as a general matter, but do incur costs of up to $5 per 100 shares for transactions that require canceling or issuing New York Registry Shares, such as cross-border trades where New York Registry Shares are cancelled in exchange for shares held in ArcelorMittal’s European register, or vice-versa. Subject to certain conditions, Citibank reimburses the Company on an annual basis for expenses incurred by the Company in relation to the ongoing maintenance of the New York share facility (e.g., investor relations expenses, NYSE listing fees, etc.). In 2023, Citibank paid the Company $1,155,394.53 in respect of reimbursements of expenses incurred by the Company in 2023.
Dividend distributions
Based on Luxembourg law and its Articles of Association, ArcelorMittal allocates at least five percent of its net profits to the creation of a reserve. This allocation ceases to be compulsory when the reserve reaches ten percent (10%) of its issued share capital, and becomes compulsory once again when the reserve falls below that percentage. Under Luxembourg law, the amount of any dividends paid to shareholders may not exceed the amount of the profits at the end of the last financial year plus any profits carried forward and any amounts drawn from reserves that are available for that purpose, less any losses carried forward and sums to be placed in reserve in accordance with Luxembourg law or the Articles of Association. A company may not pay dividends to shareholders when, on the closing date of the last financial year, the net assets are, or following the payment of such dividend would become, lower than the amount of the subscribed capital plus the reserves that may not be distributed by law or by virtue of the articles of association. ArcelorMittal’s Articles of Association provide that the portion of annual net profit that remains unreserved is allocated as follows by the general meeting of shareholders upon the proposal of the Board of Directors:
•a global amount is allocated to the Board of Directors by way of directors’ fees (“tantièmes”). This amount may not be less than €1,000,000. In the event that the profits are insufficient, the amount of €1,000,000 shall be imputed in whole or in part to charges. The distribution of this amount among the members of the Board of Directors shall be effected in accordance with the Board of Directors’ rules of procedure; and
•the balance is distributed as dividends to the shareholders or placed in the reserves or carried forward.
Interim dividends may be distributed under the conditions set forth in Luxembourg law by decision of the Board of Directors.
No interest is paid on dividends declared but not paid which are held by the Company on behalf of shareholders.
Following the achievement of the Group's net debt target, in February 2021, the Board approved a new capital return policy. According to this policy, the Board recommended a $0.30/share base dividend be paid in June 2021, which was approved on June 8, 2021 at the annual general meeting of shareholders. The dividend amounted to $325 million ($312 million net of dividends paid to subsidiaries holding treasury shares) and was paid on June 15, 2021.
In February 2022, the Board of Directors recommended an increase of the base annual dividend to $0.38/share, from $0.30/share, to be paid in June 2022, which was approved on May 4, 2022 at the annual general meeting of shareholders. The dividend amounted to $332 million and was paid on June 10, 2022.
In February 2023, the Board of Directors recommended an increase of the base annual dividend from $0.38/share to $0.44/share, which was approved on May 2, 2023 at the annual general meeting of shareholders. The dividend amounted to $369 million and payment included two installments; the first one was paid on June 15, 2023 and the second one was paid on December 7, 2023.
In February 2024, the Board of Directors recommended an increase of the base annual dividend to $0.50/share (from $0.44/share paid in 2023) to be paid in two equal installments in June 2024 and December 2024, subject to the approval of shareholders at the annual general meeting of shareholders in April 2024.
Purchases of equity securities by the issuer and affiliated purchasers
The annual general meeting of shareholders held on May 4, 2022 (the “2022 AGM”) decided (a) to cancel with effect as of the date of the 2022 AGM the authorization granted to the Board of Directors by the general meeting of shareholders held on June 8, 2021 with respect to the share buy-back program (the "Authorization"), and (b) to authorize, effective immediately after the 2022 AGM, the Board of Directors, with the option to delegate to the corporate bodies of the other companies in the ArcelorMittal group in accordance with the Luxembourg law of August 10, 1915 on commercial companies, as amended (the “Law”), to acquire and sell shares in the Company in accordance with the Law and any other applicable laws and regulations, including but not limited to entering into off-market and over-the-counter transactions and to acquire shares in the Company through derivative financial instruments.
On June 9, 2022, ArcelorMittal announced the completion of a second $1 billion share buyback program announced on May 5, 2022, pursuant to an authorization by the 2022 AGM. At market close on June 8, 2022, ArcelorMittal had repurchased 33.3
222
| Management report | ||
million shares for a total value of €943 million (equivalent to $1 billion) at an average price per share of €28.26 ($29.99).
On March 31, 2023, ArcelorMittal announced the completion of another $1.4 billion share buyback program initially announced on July 29, 2022 ("2022 buyback program") pursuant to an authorization given by the annual general meeting of shareholders on May 4, 2022. At market close on March 31, 2023, ArcelorMittal had repurchased 60.4 million shares for a total value of €1.5 billion ($1.5 billion) at an average price per share of €24.10 ($24.68).
On May 5, 2023, the Company announced a new share buyback program of up to 85 million shares to be completed by May 2025 (subject to market conditions) under the authorization given by the annual general meeting of shareholders of May 2, 2023 ("2023 buyback program") The actual amount of shares
that will be repurchased pursuant to this 2023 buyback program will depend on the level of post-dividend free cash flow generated over the period, the continued authorization by shareholders, and market conditions. See “Introduction—History and development of the Company—Additional information”.
As described in “Memorandum and Articles of Association”, the maximum number of shares that may be acquired does not in any event exceed 10% of the Company’s issued share capital. The maximum number of own shares that the Company may hold at any time directly or indirectly may not have the effect of reducing its net assets (“actif net”) below the amount mentioned in paragraphs 1 and 2 of Article 461-272-1 of the Law.
Program1 | 2023 | Total Number of Shares Purchased | Average Price Paid Per Share | Total Number of Shares Purchased as Part of Publicly Announced Plan or Program | Maximum Number of Shares that may yet be purchased under the Plans or Programs (see above explanations) | ||||||||||||
2022 buyback program | January 1 - January 31 | — | — | — | 19,104,941 | ||||||||||||
2022 buyback program | February 1 - February 28 | 3,233,074 | $ | 29.70 | 3,233,074 | 15,871,867 | |||||||||||
2022 buyback program | March 1 - March 31 | 15,871,867 | $ | 28.89 | 15,871,867 | — | |||||||||||
None | April 1 - April 30 | — | — | — | — | ||||||||||||
2023 buyback program | May 1 - May 31 | 5,170,704 | $ | 26.25 | 5,170,704 | 79,829,296 | |||||||||||
2023 buyback program | June 1 - June 30 | 517,205 | $ | 25.34 | 517,205 | 79,312,091 | |||||||||||
2023 buyback program | July 1 - July 31 | — | — | — | 79,312,091 | ||||||||||||
2023 buyback program | August 1 - August 31 | 1,400,000 | $ | 27.10 | 1,400,000 | 77,912,091 | |||||||||||
2023 buyback program | September 1 - September 30 | — | — | — | 77,912,091 | ||||||||||||
2023 buyback program | October 1 - October 31 | — | — | — | 77,912,091 | ||||||||||||
2023 buyback program | November 1 - November 30 | 15,381,386 | $ | 23.98 | 15,381,386 | 62,530,705 | |||||||||||
2023 buyback program | December 1 - December 31 | 3,781,759 | $ | 25.59 | 3,781,759 | 58,748,946 | |||||||||||
1.Commencement of 2022 buyback program was announced on July 29, 2022 for an aggregate amount of $1.4 billion and the completion was announced on March 31, 2023. Commencement of 2023 buyback program was announced on May 5, 2023 for up to 85 million shares; the actual amount of shares to be repurchased will depend on the level of post-dividend free cash flow generated over the period. See “Introduction—History and development of the Company—Additional information”. As of December 31, 2023, the 2023 buyback program was not yet completed.
Share capital
As of December 31, 2023, the Company’s issued share capital amounted to $303 million, represented by 852,809,772 ordinary shares without nominal value. The Company's issued share capital changed as described below in 2021, 2022 and 2023.
Out of the total of 852,809,772 shares in issue, 33,538,016 shares were held in treasury by ArcelorMittal at December 31, 2023, representing 3.93% of its issued share capital.
The Company’s authorized share capital, including the issued share capital, was $395 million, represented by 1,111,418,599 ordinary shares without nominal value as of December 31, 2023. The Company's authorized share capital changed as described below in 2021, 2022 and 2023.
On May 19, 2023, upon mandatory conversion of the remaining 24,290,025 outstanding mandatorily convertible subordinated notes issued on May 18, 2020 and due May 18, 2023,
223
| Management report | ||
ArcelorMittal delivered a total of 57,057,991 treasury shares (of which 9,396,120 to the Significant Shareholder). See note 11.2 to the consolidated financial statements.
In line with the authorization granted by the EGM of ArcelorMittal shareholders held on June 8, 2021 and May 4, 2022, the Board of Directors has decided to keep the number of treasury shares within appropriate levels by cancelling:
(i) on August 4, 2021, 70 million treasury shares. As a result of this cancellation, ArcelorMittal had 1,032,809,772 shares in issue (compared to 1,102,809,772 before the cancellation);
(ii) on September 22, 2021, 50 million treasury shares. As a result of this cancellation, ArcelorMittal had 982,809,772 shares in issue (compared to 1,032,809,772 before cancellation);
(iii) on January 14, 2022, 45 million treasury shares. As a result of this cancellation, ArcelorMittal had 937,809,772 shares in issue (compared to 982,809,772 before cancellation);
(iv) on May 18, 2022, 60 million treasury shares. As a result of this cancellation, ArcelorMittal had 877,809,772 shares in issue (compared to 937,809,772 before cancellation); and
(v) on April 28, 2023, 25 million treasury shares. As a result of such cancellation, ArcelorMittal has 852,809,772 shares in issue (compared to 877,809,772 before the cancellation).
The first two cancellations took into account the $2.2 billion share buyback program announced on July 29, 2021, which was completed on November 16, 2021, whereas the third cancellation took into account the $1 billion share buyback program announced on November 17, 2021, which was completed on December 28, 2021. The fourth cancellation took into account the $1 billion share buyback program announced on May 5, 2022, which was completed on June 8, 2022. The fifth cancellation took into account the 60,431,380 share buyback announced on July 29, 2022 which was completed on March 31, 2023.
Over the years, ArcelorMittal has issued equity-settled share-based payments to certain employees, including stock options, restricted share units and performance share units. See note 8.3 to the consolidated financial statements.
ADDITIONAL INFORMATION
Memorandum and Articles of Association
Below is a summary of ArcelorMittal’s Articles of Association. The full text of the Company’s Articles of Association is also available on www.arcelormittal.com under “Investors-Corporate Governance-Current-Articles of Association” and as filed under Exhibit 1.1 to this annual report on Form 20-F.
Corporate purpose
Article 3 of the Articles of Association provides that the corporate purpose of ArcelorMittal is the manufacture, processing and marketing of steel, steel products and all other metallurgical products, as well as all products and materials used in their manufacture, their processing and their marketing, and all industrial and commercial activities connected directly or indirectly with those objects, including mining and research activities and the creation, acquisition, holding, exploitation and sale of patents, licenses, know-how and, more generally, intellectual and industrial property rights.
The Company may realize its corporate purpose either directly or through the creation of companies, the acquisition, holding or acquisition of interests in any companies or partnerships, membership in any associations, consortia and joint ventures.
In general, the Company’s corporate purpose comprises the participation, in any form whatsoever, in companies and partnerships and the acquisition by purchase, subscription or in any other manner as well as the transfer by sale, exchange or in any other manner of shares, bonds, debt securities, warrants and other securities and instruments of any kind.
It may grant assistance to any affiliated company and take any measure for the control and supervision of such companies.
It may carry out any commercial, financial or industrial operation or transaction that it considers to be directly or indirectly necessary or useful in order to achieve or further its corporate purpose.
Form and transfer of shares
The shares of ArcelorMittal are issued in registered form only and are freely transferable. There are no restrictions on the rights of Luxembourg or non-Luxembourg residents to own ArcelorMittal shares.
In accordance with Luxembourg law, the ownership of registered shares is evidenced by the inscription of the name of the shareholder and the number of shares held by such shareholder in the shareholders’ register. Each transfer of shares is made by a written declaration of transfer recorded in the shareholders’ register of ArcelorMittal, dated and signed by the transferor and the transferee or by their duly appointed agent. ArcelorMittal may accept and enter into its shareholders’ register any transfer based on an agreement between the transferor and the transferee provided a true and complete copy of such agreement is provided to ArcelorMittal.
224
| Management report | ||
The Articles of Association provide that shares may be held through a securities settlement (clearing) system or a professional depositary of securities. Shares held in this manner have the same rights and obligations as the registered shares. Shares held through a securities settlement system or a professional depositary of securities may be transferred in accordance with customary procedures for the transfer of securities in book-entry form.
The ArcelorMittal ordinary shares may be held in registered form on the Company’s register only. Registered shares are fully fungible and may consist of:
a.ArcelorMittal Registry Shares, which are registered directly on ArcelorMittal’s Luxembourg shareholders' register,
b.shares traded on Euronext Amsterdam, Euronext Paris, the regulated market of the Luxembourg Stock Exchange and the Spanish Stock Exchanges, which are held in Euroclear, or
c.shares traded on the NYSE (the "New York Registry Shares"), which are registered (including in the name of the nominee of DTC) in a New York Share Register kept on behalf of ArcelorMittal by Citibank, N.A., its New York transfer agent.
ABN AMRO assists the Company with certain administrative tasks relating to the day-to-day administrative management of the shareholders' register. The Company maintains a New York shareholders' register with Citibank, N.A. (located at 388 Greenwich Street, New York, New York 10013) for its New York Registry Shares that trade on the NYSE with underlying positions held in Euroclear. As of December 31, 2023, 66,396,511 shares (or approximately 7.79% of ArcelorMittal's total issued shares) were New York Registry Shares.
The law of April 6, 2013 concerning dematerialized securities allows Luxembourg issuers to opt for the full dematerialization of shares. The EGM of ArcelorMittal shareholders held on May 10, 2017 authorized and empowered the Board of Directors to give effect to such dematerialization and to determine its effective date, following which new shares in the Company may only be issued in dematerialized form (the “Effective Date”). Notice of the compulsory dematerialization will be given in accordance with Article 6.9 (i) of the Articles of Association. As from the Effective Date, shareholders would be required to hold their shares in a securities account at a bank or other financial intermediary, which would in turn hold the shares via an account with a securities depository such as Clearstream or Euroclear. Dematerialized securities would be solely represented by account entries with the securities depositary and would therefore exist only in electronic form. It would then no longer be
possible for shareholders to hold shares through a direct, nominative registration in the Company’s register of shareholders as is currently the case. As of December 31, 2023, notice of the Effective Date has not been given.
Issuance of shares
The issuance of shares by ArcelorMittal requires either an amendment of the Articles of Association approved by an EGM or a decision of the Board of Directors that is within the limits of the authorized share capital set out in the Articles of Association. In the latter case, the Board of Directors may determine the conditions for the issuance of shares, including the consideration (cash or in kind) payable for such shares.
The EGM may not validly deliberate unless at least half of the share capital is present or represented upon the first call. If the quorum is not met, the meeting may be reconvened as described in “General meeting of shareholders” below. The second meeting will be held regardless of the proportion of share capital represented. At both meetings, resolutions, in order to be adopted, must be carried by at least two-thirds of the votes cast.
Articles 5.1 and 5.2 of the Articles of Association of the Company were amended to reflect the issued share capital decrease described above in "Shareholders and markets–Share capital" for the financial year ending on December 31, 2023. Such amendments to the Articles of Association were filed with the Luxembourg Register of Commerce and Companies on May 11, 2023.
Preemptive rights
Unless limited or canceled by the Board of Directors as described below or by an EGM, holders of ArcelorMittal shares have a pro rata preemptive right to subscribe for newly issued shares, except for shares issued for consideration other than cash (i.e., in kind).
The Articles of Association provide that preemptive rights may be limited or canceled by the Board of Directors in the event of an increase in the Company’s issued share capital until the date being five years from the date of publication in the Luxembourg legal gazette (Recueil électronique des sociétés et associations) (“RESA”) of the relevant meeting minutes, which publication occurred on June 17, 2020 with respect to the minutes of the EGM held on June 13, 2020. This power of the Board of Directors may be renewed from time to time by an EGM for subsequent periods not to exceed five years each.
Repurchase of shares
ArcelorMittal is prohibited by Luxembourg law from subscribing for its own shares. ArcelorMittal may, however, repurchase its own shares or have another person repurchase shares on its behalf, subject to certain conditions, including:
225
| Management report | ||
•a prior authorization of the general meeting of shareholders setting out the terms and conditions of the proposed repurchase, including the maximum number of shares to be repurchased, the duration of the period for which the authorization is given (which may not exceed five years) and the minimum and maximum consideration per share;
•the repurchase may not reduce the net assets of ArcelorMittal on a non-consolidated basis to a level below the aggregate of the issued share capital and the reserves that ArcelorMittal must maintain pursuant to Luxembourg law or its Articles of Association;
•only fully paid-up shares may be repurchased. At December 31, 2023, all of ArcelorMittal’s issued ordinary shares were fully paid-up; and
•the acquisition offer is made on the same terms and conditions to all the shareholders who are in the same position, it being noted however that listed companies may repurchase their own shares on the stock exchange without an acquisition offer having to be made to the shareholders.
In addition, Luxembourg law allows the Board of Directors to approve the repurchase of ArcelorMittal shares without the prior approval of the general meeting of shareholders if necessary to prevent serious and imminent harm to ArcelorMittal. In such a case, the next general meeting of shareholders must be informed by the Board of Directors of the reasons for and the purpose of the acquisitions made, the number and nominal values, or in the absence thereof, the accounting par value of the shares acquired, the proportion of the issued share capital that they represent, and the consideration paid for them.
The annual general meeting of shareholders held on May 2, 2023 (the “2023 AGM”) decided (a) to cancel with effect as of the date of the 2023 AGM the authorization granted to the Board of Directors by the general meeting of shareholders held on May 4, 2022 with respect to the share buy-back program (the "Authorization"), and (b) to authorize, effective immediately after the 2023 AGM, the Board of Directors, with the option to delegate to the corporate bodies of the other companies in the ArcelorMittal group in accordance with the Luxembourg law of August 10, 1915 on commercial companies, as amended (the “Law”), to acquire and sell shares in the Company in accordance with the Law and any other applicable laws and regulations, including but not limited to entering into off-market and over-the-counter transactions and to acquire shares in the Company through derivative financial instruments as well as to enter into cash-settled derivative financial instruments to mitigate the volatility in the share prices paid to acquire shares in the Company.
Any acquisitions, disposals, exchanges, contributions or transfers of shares by the Company or other companies in the ArcelorMittal group must be in accordance with Regulation (EU) No. 596/2014 of the European Parliament and of the Council of April 16, 2014 on market abuse (the "MAR Regulation"), Commission Delegated Regulation (EU) No. 2016/1052 of March 8, 2016 with regard to regulatory technical standards for the conditions applicable to buy-back programs and stabilization measures and Luxembourg law of December 23, 2016 on market abuse implementing the MAR Regulation.
Such transactions may be carried out at any time, including during a tender offer period, subject to applicable laws and regulations including Section 10(b) and Section 9(a)(2) of the Securities Exchange Act of 1934, as amended (the “Exchange Act”), and Rule 10b-5 promulgated under the Exchange Act.
The Authorization is valid until the end of the annual general meeting of shareholders to be held in 2024 (the "2024 AGM") or until the date of its renewal by a resolution of the general meeting of shareholders if such renewal date is prior to the expiration of the 2024 AGM.
The maximum number of shares that may be acquired under the Authorization may not in any event exceed 10% of the Company’s issued share capital. The maximum number of own shares that the Company may hold at any time directly or indirectly may not have the effect of reducing its net assets (“actif net”) below the amount mentioned in paragraphs 1 and 2 of Article 461-2 of the Law. The purchase price per share to be paid shall not exceed 110% of the average of the final listing prices of the 30 trading days preceding the three trading days prior to each date of repurchase, and shall not be less than one euro cent. The final listing prices are those on the Euronext markets where the Company is listed or the Luxembourg Stock Exchange, depending on the market on which the purchases are made. For off-market transactions, the maximum purchase price shall be 110% of the reference price on the Euronext markets where the Company is listed. The reference price will be deemed to be the average of the final listing prices per share on these markets during 30 consecutive days on which these markets are open for trading preceding the three trading days prior to the date of purchase. For the avoidance of doubt, price restrictions set out in the immediately preceding paragraphs do not apply to cash-settled derivative financial instruments entered into to mitigate volatility in the per share prices paid to acquire shares in the Company. In the event of a share capital increase by incorporation of reserves or issue premiums and the free allotment of shares as well as in the event of the division or regrouping of the shares, the purchase price indicated above shall be adjusted by a multiplying coefficient equal to the ratio between the number of shares comprising the issued share capital prior to the transaction and such number following the transaction. The total amount allocated for the Company’s share
226
| Management report | ||
repurchase program may not in any event exceed the amount of the Company’s then available equity.
Capital reduction
The Articles of Association provide that the issued share capital of ArcelorMittal may be reduced subject to the approval of at least two-thirds of the votes cast at an extraordinary general meeting of shareholders where, at first call, at least 50% of the issued share capital is required to be represented, with no quorum being required at a reconvened meeting.
The extraordinary general meeting of shareholders held on May 2, 2023 decided to authorize the Board of Directors, for a period of three years (i) to cancel all the shares repurchased by the Company under its share buyback programs up to a maximum of 88 million shares and to consequently reduce the issued share capital of the Company and the authorized share capital of the Company by an amount corresponding to the product of the number of treasury shares cancelled multiplied by thirty-six U.S. dollar cents (USD 0.36), being the par value of the shares in the Company - and (ii) to consequentially amend articles 5.1 and 5.2 of the articles of association of the Company to reflect the above cancellations and reductions of the issued and authorized share capital of the Company, (iii) to reduce or cancel the relevant reserves constituted under applicable law in relation thereto and (iv) to instruct and delegate power to and authorize the Board of Directors or its delegate(s) to implement the cancellation of the number of treasury shares determined by the Board of Directors and the corresponding reduction of share capital and related matters in one or more installments as deemed fit by the Board of Directors, to cause the share capital reductions and cancellations of the treasury shares and the consequential amendment of the Articles to be recorded by way of one or more notarial deeds, and generally to take any steps, actions or formalities as appropriate or useful to implement this decision of the extraordinary general meeting.
Please refer to the section on “Shareholder and markets - Share capital” for the details on the latest share capital reductions.
General meeting of shareholders
The shareholders’ rights law of May 24, 2011, which transposes into Luxembourg law Directive 2007/36/EC of the European Parliament and of the Council of July 11, 2007 (on the exercise of certain rights of shareholders in listed companies) as amended (the “Shareholders' Rights Law”) includes provisions relating to general meetings of shareholders, as discussed below.
General meetings of shareholders are convened by the publication of a notice at least 30 days before the meeting date in a Luxembourg newspaper, via the online platform called Recueil électronique des sociétés et associations (“RESA”), and by way of press release sent to the major news agencies.
Ordinary general meetings are not subject to any minimum shareholder participation level. Extraordinary general meetings, however, are subject to a minimum quorum of 50% of the share capital. In the event the 50% quorum is not met upon the first call, the meeting may be reconvened by way of convening notice published in the same manner as the first notice, at least 17 days before the meeting date. No quorum is required upon the second call.
Shareholders whose share ownership is directly registered in the shareholders’ register of the Company must receive the convening notice by regular mail, unless they have accepted to receive it through other means (i.e., electronically). In addition, all materials relating to a general meeting of shareholders must be made available on the website of ArcelorMittal from the first date of publication of the convening notice.
The Shareholders’ Rights Law abolished the blocking period and introduced the record date system into Luxembourg law. As set out in the Articles of Association, the record date applicable to ArcelorMittal is the 14th day at midnight before the general meeting date. Only the votes of shareholders who are shareholders of the Company on the record date will be taken into account, regardless of whether they remain shareholders on the general meeting date. Shareholders who intend to participate in the general meeting must notify the Company at the latest on the date indicated in the convening notice of their intention to participate (by proxy or in person).
Ordinary general meetings of shareholders. At an ordinary general meeting of shareholders there is no quorum requirement and resolutions are adopted by a simple majority, irrespective of the number of shares represented. Ordinary general meetings deliberate on any matter that does not require the convening of an extraordinary general meeting. The Articles of Association provide that the annual general meeting of shareholders is held each year within six months from the end of the previous financial year at the Company’s registered office or at any other place in the Grand Duchy of Luxembourg as determined by the Board of Directors and indicated in the convening notice.
Extraordinary general meetings of shareholders. An extraordinary general meeting must be convened to deliberate on the following types of matters:
•an increase or decrease of the authorized or issued share capital,
•a limitation or exclusion of existing shareholders’ preemptive rights,
•the acquisition by any person of 25% or more of the issued share capital of ArcelorMittal,
•approving a merger or similar transaction such as a spin-off, and
227
| Management report | ||
•any transaction or matter requiring an amendment of the Articles of Association.
The extraordinary general meeting must reach a quorum of shares present or represented at the meeting of 50% of the share capital in order to validly deliberate. If this quorum is not reached, the meeting may be reconvened and the second meeting will not be subject to any quorum requirement. In order to be adopted by the extraordinary general meeting (on the first or the second call), any resolution submitted must be approved by at least two-thirds of the votes cast except for certain limited matters where the Articles of Association require a higher majority (see “—Amendment of the Articles of Association”). Votes cast do not include votes attaching to shares with respect to which the shareholder has not taken part in the vote, has abstained or has returned a blank or invalid vote.
In addition, Luxembourg law requires the Board of Directors to convene a general meeting of shareholders if shareholders representing in the aggregate 10% of the issued share capital so require in writing with an indication of the requested agenda. In this case, the general meeting of shareholders must be held within one month of the request. If the requested general meeting of shareholders is not so convened, the relevant shareholder or group of shareholders may petition the competent court in Luxembourg to have a court appointee convene the general meeting.
Shareholder participation at general meetings
The Board of Directors may decide to arrange for shareholders to be able to participate in the general meeting by electronic means by way, among others, of (i) real-time transmission to the public of the general meeting, (ii) two-way communication enabling shareholders to address the general meeting from a remote location, or (iii) a mechanism allowing duly identified shareholders to cast their votes before or during the general meeting without the need for them to appoint a proxyholder who would be physically present at the meeting.
A shareholder may act at any general meeting of shareholders by appointing another person (who need not be a shareholder) as his or her attorney by means of a written proxy using the form made available on the website of the Company. The completed and signed proxy must be sent to the Company in accordance with the instructions set out in the convening notice.
The Board of Directors may also decide to allow shareholders to vote by correspondence by means of a form providing for a positive or negative vote or an abstention on each agenda item. The conditions for voting by correspondence are set out in the Articles of Association and in the convening notice.
Shareholders representing in the aggregate 5% of the issued share capital may also request that additional items be added to the agenda of a general meeting and may draft alternative
resolutions to be submitted to the general meeting regarding existing agenda items. The request must be made in writing and sent either to the electronic address or to the Company’s postal address set out in the convening notice.
The Shareholders’ Rights Law provides that a company’s articles of association may allow shareholders to ask questions prior to the general meeting which will be answered by management during the general meeting’s questions and answers session prior to the vote on the agenda items. Although the Articles of Association do not specifically address this point, shareholders may ask questions in writing ahead of a general meeting, which are taken into account in preparing the general meeting’s questions and answers session. With regard to the May 2, 2023 general meetings, shareholders could also send questions to the Company in advance by writing to a dedicated e-mail address indicated in the convening notice. The Company on a best efforts basis provided responses to the questions during the general meeting Q&A session.
Identification of shareholders
Pursuant to the Shareholders’ Rights Law, listed companies now have the ability to identify their shareholders and ultimately improve communication between them and their shareholders. Intermediaries, including those in third countries, are required to provide the Company with information to enable the identification of shareholders. Intermediaries in-scope of the Shareholders' Rights Law are investment firms, credit institutions and central securities depositories which provide share safekeeping or administration of securities accounts or maintenance services to shareholders or other persons. Third country in-scope intermediaries are those which provide these services to shareholders or other intermediaries with respect to shares in the Company and are located outside of the European Union.
Voting and information rights
There are no restrictions on the rights of Luxembourg or non-Luxembourg residents to vote ArcelorMittal shares. Each share entitles the shareholder to attend a general meeting of shareholders in person or by proxy, to address the general meeting of shareholders and to vote. Each share entitles the holder to one vote at the general meeting of shareholders. There is no minimum shareholding (beyond owning a single share or representing the owner of a single share) required to be able to attend or vote at a general meeting of shareholders.
The voting and information rights of ArcelorMittal’s shareholders have been further expanded since the entry into force of the Shareholders’ Rights Law.
Election and removal of directors
Members of the Board of Directors are elected by simple majority of the represented shareholders at an ordinary general
228
| Management report | ||
meeting of shareholders. Directors are elected for a period ending on a date determined at the time of their appointment. The directors of ArcelorMittal are elected for three-year terms in staggered intervals. Any director may be removed with or without cause by a simple majority vote at any general meeting of shareholders.
(a) a director’s power to vote on a proposal, arrangement or contract in which the director is materially interested;
If a Director has directly or indirectly a financial interest in a transaction that is submitted to the Board of Directors for approval and this interest conflicts with that of ArcelorMittal (other than transactions which are ordinary business operations and are entered into under normal conditions), the Director must advise the Board of Directors of the existence and nature of the conflict and cause a record of his/her statement to be included in the minutes of the meeting. In addition, the Director may not take part in the discussions on and may not vote on the relevant transaction and he or she shall not be counted for the purposes of whether the quorum is present, in which case the Board of Directors may validly deliberate if at least the majority of the non-conflicted directors are present or represented. At the next following general meeting of shareholders of ArcelorMittal, before any other resolution is put to a vote, a special report will be made by the Board of Directors to the shareholders’ meeting on any such transaction.
If a material transaction with a related party involves a Director, that Director may not participate in the approval of such transaction.
(b) the directors’ power, in the absence of an independent quorum, to vote compensation to themselves or any members of their body;
The remuneration of the Directors is determined each year by the annual general meeting of shareholders subject to Article 17 of the Articles of Association. The annual shareholders meeting of the Company decides on the directors’ remuneration. The Executive Chairman is not remunerated for his membership on the Board of Directors. The remuneration of the Executive Chairman is determined by the Board’s ARCG Committee, which consists solely of independent directors. For more information, see “Management and employees—Compensation”.
Pursuant to the Shareholders’ Rights Law, the shareholders must be informed in detail of the remuneration of the members of the Company's Board of Directors and its CEO and the company's remuneration policy. Companies must prepare a management remuneration policy describing all components, criteria, methods and modalities applied to determine the fixed and variable remuneration of such persons. Such remuneration policy must contribute to the Company' business strategy and long-term interests. It must be resubmitted to an advisory vote at
the general meeting of shareholders for approval each time there is a significant change thereto and at least every four years. In addition, companies must prepare a remuneration report for the annual general meeting on the remuneration and benefits granted to directors, and such remuneration report is required to be submitted for an advisory vote at the general meeting of shareholders each year.
(c) borrowing powers exercisable by the directors and how such borrowing powers can be varied;
Any transaction between ArcelorMittal or a subsidiary of ArcelorMittal and a Director (or an affiliate of a Director) must be conducted on arm’s length terms and, if material, must obtain the approval of the Independent Directors.
(d) retirement or non-retirement of directors under an age limit requirement
There is no retirement or non-retirement of directors under an age limit requirement. However, on October 30, 2012, the Board of Directors adopted a policy that places limitations on the terms of independent directors as well as the number of directorships Directors may hold in order to align the Company’s corporate governance practices with best practices in this area. The policy provides that an independent director may not serve on the Board of Directors for more than 12 consecutive years, although the Board of Directors may, by way of exception to this rule, make an affirmative determination, on a case-by-case basis, that he or she may continue to serve beyond the 12 years rule if the Board of Directors considers it to be in the best interest of the Company based on the contribution of the Director involved and the balance between the knowledge, skills, experience and need for renewal of the Board.
(e) number of shares, if any, required for director’s qualification.
Article 8.2 of the Articles of Association states that the members of the Board of Directors do not have to be shareholders in the Company. However, the Board of Directors introduced on October 30, 2012 (as amended on November 7, 2017) a policy that requires members of the Board of Directors to hold 4,000 shares in the Company (6,000 for the Lead Independent Director). For more information, see “Management and employees—Corporate governance—Specific characteristics of the director role”.
ArcelorMittal’s Articles of Association provide that the Significant Shareholder is entitled to nominate a number of candidates for election by the shareholders to the Board of Directors in proportion to its shareholding. The Significant Shareholder has not exercised this right to date.
Amendment of the Articles of Association
Any amendments to the Articles of Association must be approved by an extraordinary general meeting of shareholders
229
| Management report | ||
held in the presence of a Luxembourg notary, followed by the publications required by Luxembourg law.
In order to be adopted, amendments of the Articles of Association relating to the size and the requisite minimum number of independent and non-executive directors of the Board of Directors, the composition of the Audit & Risk Committee, and the nomination rights to the Board of Directors of the Significant Shareholder require a majority of votes representing two-thirds of the voting rights attached to the shares in ArcelorMittal. The same majority rule would apply to amendments of the provisions of the Articles of Association that set out the foregoing rule.
Annual accounts
Each year before submission to the annual ordinary general meeting of shareholders, the Board of Directors approves the stand-alone audited financial statements for ArcelorMittal, the parent company of the ArcelorMittal group as well as the consolidated financial statements of the ArcelorMittal group, each of which are prepared in accordance with IFRS. The Board of Directors also approves the management reports on each of the stand-alone audited financial statements and the consolidated financial statements, and in respect of each of these sets of accounts a report must be issued by the independent auditors.
The stand-alone audited financial statements, the consolidated financial statements, the management reports and the auditor’s reports will be available on request from the Company and on the Company’s website from the date of publication of the convening notice for the annual ordinary general meeting of shareholders.
The stand-alone audited financial statements and the consolidated financial statements, after their approval by the annual ordinary general meeting of shareholders, are filed with the Luxembourg Register of Commerce and Companies.
Dividends
Except for shares held in treasury by the Company, each ArcelorMittal share is entitled to participate equally in dividends if and when declared out of funds legally available for such purposes. The Articles of Association provide that the annual ordinary general meeting of shareholders may declare a dividend and that the Board of Directors may declare interim dividends within the limits set by Luxembourg law.
Declared and unpaid dividends held by ArcelorMittal for the account of its shareholders do not bear interest. Under Luxembourg law, claims for dividends lapse in favor of ArcelorMittal five years after the date on which the dividends have been declared.
Merger and division
A merger whereby the Luxembourg company being acquired transfers to an existing or newly incorporated Luxembourg company all of its assets and liabilities in exchange for the issuance to the shareholders of the company being acquired of shares in the acquiring company, and a division whereby a company (the company being divided) transfers all its assets and liabilities to two or more existing or newly incorporated companies in exchange for the issuance of shares in the beneficiary companies to the shareholders of the company being divided or to such company, and certain similar restructurings must be approved by an extraordinary general meeting of shareholders of the relevant companies held in the presence of a notary. These transactions require the approval of at least two-thirds of the votes cast at a general meeting of shareholders of each of the companies where at least 50% of the share capital is represented upon first call, with no such quorum being required at a reconvened meeting.
Liquidation
In the event of the liquidation, dissolution or winding-up of ArcelorMittal, the assets remaining after allowing for the payment of all liabilities will be paid out to the shareholders pro rata to their respective shareholdings. The decision to liquidate, dissolve or wind-up the Company requires the approval of at least two-thirds of the votes cast at a general meeting of shareholders where at first call at least 50% of the share capital is represented, with no quorum being required at a reconvened meeting. Irrespective of whether the liquidation is subject to a vote at the first or a subsequent extraordinary general meeting of shareholders, it requires the approval of at least two-thirds of the votes cast at the extraordinary general meeting of shareholders.
Mandatory bid—squeeze-out right—sell-out right
Mandatory bid. The Luxembourg law of May 19, 2006 implementing Directive 2004/25/EC of the European Parliament and the Council of April 21, 2004 on takeover bids, as amended from time to time (the “Takeover Law”), provides that, if a person acting alone or in concert acquires securities of ArcelorMittal which, when added to any existing holdings of ArcelorMittal securities, give such person voting rights representing at least one third of all of the voting rights attached to the issued shares in ArcelorMittal, this person is obliged to make an offer for the remaining shares in ArcelorMittal. In a mandatory bid situation the “fair price” is in principle considered to be the highest price paid by the offeror or a person acting in concert with the offeror for the securities during the 12–month period preceding the mandatory bid.
ArcelorMittal’s Articles of Association provide that any person who acquires shares giving them 25% or more of the total voting rights of ArcelorMittal must make or cause to be made, in each country where ArcelorMittal’s securities are admitted to trading
230
| Management report | ||
on a regulated or other market and in each of the countries in which ArcelorMittal has made a public offering of its shares, an unconditional public offer of acquisition for cash to all shareholders for all of their shares and also to all holders of securities giving access to capital or linked to capital or whose rights are dependent on the profits of ArcelorMittal. The price offered must be fair and equitable and must be based on a report drawn up by a leading international financial institution nominated by the Company.
Squeeze-out right. The Takeover Law provides that, when an offer (mandatory or voluntary) is made to all of the holders of voting securities of ArcelorMittal and if after such offer the offeror holds at least 95% of the securities carrying voting rights and 95% of the voting rights, the offeror may require the holders of the remaining securities to sell those securities (of the same class) to the offeror. The price offered for such securities must be a fair price. The price offered in a voluntary offer would be presumed a fair price in the squeeze-out proceedings if the offeror acquired at least 90% of the ArcelorMittal shares carrying voting rights that were the subject of the offer. The price paid in a mandatory offer is presumed a fair price. The consideration paid in the squeeze-out proceedings must take the same form as the consideration offered in the offer or consist solely of cash. Moreover, an all-cash option must be offered to the remaining ArcelorMittal shareholders. Finally, the right to initiate squeeze-out proceedings must be exercised within three months following the expiration of the offer.
Sell-out right. The Takeover Law provides that, when an offer (mandatory or voluntary) is made to all of the holders of voting securities of ArcelorMittal and if after such offer the offeror holds securities carrying more than 90% of the voting rights, the remaining security holders may require that the offeror purchase the remaining securities of the same class. The price offered in a voluntary offer would be presumed “fair” in the sell-out proceedings if the offeror acquired at least 90% of the ArcelorMittal shares carrying voting rights and which were the subject of the offer. The price paid in a mandatory offer is presumed to be a fair price. The consideration paid in the sell-out proceedings must take the same form as the consideration offered in the offer or consist solely of cash. Moreover, an all-cash option must be offered to the remaining ArcelorMittal shareholders. Finally, the right to initiate sell-out proceedings must be exercised within three months following the expiration of the offer.
Disclosure of significant ownership in ArcelorMittal shares
Holders of ArcelorMittal shares and derivatives or other financial instruments linked to ArcelorMittal shares may be subject to the notification obligations of the Luxembourg law of January 11, 2008, as amended, on transparency requirements regarding information about issuers whose securities are admitted to trading on a regulated market (the “Transparency Law”). The
following description summarizes these obligations. ArcelorMittal shareholders are advised to consult with their own legal advisers to determine whether the notification obligations apply to them.
The Transparency Law provides that, if a person acquires or disposes of a shareholding in ArcelorMittal, and if following the acquisition or disposal the proportion of voting rights held by the person reaches, exceeds or falls below one of the thresholds of 5%, 10%, 15%, 20%, 25%, one-third, 50% or two-thirds of the total voting rights existing when the situation giving rise to a declaration occurs, the relevant person must simultaneously notify ArcelorMittal and the CSSF (the Luxembourg securities regulator) of the proportion of voting rights held by it further to such event within four Luxembourg Stock Exchange trading days of the day of execution of the transaction triggering the threshold crossing.
A person must also notify ArcelorMittal of the proportion of his or her voting rights if that proportion reaches, exceeds or falls below the above-mentioned thresholds as a result of events changing the breakdown of voting rights.
The above notification obligations also apply to persons who directly or indirectly hold financial instruments linked to ArcelorMittal shares. Pursuant to article 12 a. of the Transparency Law, persons who hold ArcelorMittal shares and financial instruments linked to ArcelorMittal shares must aggregate their holding.
ArcelorMittal’s Articles of Association also provide that the above disclosure obligations also apply to:
•any acquisition or disposal of shares resulting in the threshold of 2.5% of voting rights in ArcelorMittal being crossed upwards or downwards,
•any acquisition or disposal of shares resulting in the threshold of 3.0% of voting rights in ArcelorMittal being crossed upwards or downwards, and
•with respect to any shareholder holding at least 3.0% of the voting rights in ArcelorMittal, to any acquisition or disposal of shares resulting in successive thresholds of 1.0% of voting rights being crossed upwards or downwards.
Pursuant to the Articles of Association, any person who acquires shares giving him or her 5% or more or a multiple of 5% or more of the voting rights must inform ArcelorMittal within 10 Luxembourg Stock Exchange trading days following the date on which the threshold was crossed by registered letter with return receipt requested as to whether he or she intends to acquire or dispose of shares in ArcelorMittal within the next 12 months or intends to seek to obtain control over ArcelorMittal or to appoint a member to ArcelorMittal’s Board of Directors.
231
| Management report | ||
The sanction of suspension of voting rights automatically applies, subject to limited exceptions set out in the Transparency Law, to any shareholder (or group of shareholders) who has (or have) crossed the thresholds set out in article 7 of the Articles of Association and articles 8 to 15 of the Transparency Law but have not notified the Company accordingly. The sanction of suspension of voting rights will apply until such time as the notification has been properly made by the relevant shareholder(s).
For the purposes of calculating the percentage of a shareholder’s voting rights in ArcelorMittal, the following are taken into account:
•voting rights held by a third party with whom that person or entity has concluded an agreement and which obliges them to adopt, by concerted exercise of the voting rights they hold, a lasting common policy towards ArcelorMittal;
•voting rights held by a third party under an agreement concluded with that person or entity providing for the temporary transfer for consideration of the voting rights in question;
•voting rights attaching to shares pledged as collateral with that person or entity, provided the person or entity controls the voting rights and declares its intention to exercise them;
•voting rights attaching to shares in which a person or entity holds a life interest;
•voting rights which are held or may be exercised within the meaning of the four foregoing points by an undertaking controlled by that person or entity;
•voting rights attaching to shares deposited with that person or entity which the person or entity may exercise at its discretion in the absence of specific instructions from the shareholders;
•voting rights held by a third party in its own name on behalf of that person or entity; and
•voting rights which that person or entity may exercise as a proxy where the person or entity may exercise the voting rights in its sole discretion.
In addition, the Articles of Association provide that, for the purposes of calculating a person’s voting rights in ArcelorMittal, the voting rights attached to shares underlying any other financial instruments owned by that person (such as convertible notes) must be taken into account for purposes of the calculation described above.
Disclosure of insider dealing transactions
Members of the Board of Directors and the members of the Executive Office, Executive Officers and other executives
fulfilling senior management responsibilities within ArcelorMittal and falling with the definition of “Persons Discharging Senior Managerial Responsibilities” set out below and persons closely associated with them must disclose to the CSSF and to ArcelorMittal all transactions relating to shares or debt instruments of ArcelorMittal or derivatives or other financial instruments linked to any shares or debt instruments of ArcelorMittal (together the “Financial Instruments”) conducted by them or for their account. Such notifications shall be made promptly and not later than three business days after the date of the transaction.
“Persons Discharging Senior Managerial Responsibilities” within ArcelorMittal are the members of the Board of Directors, and the Executive Office, the Executive Officers, and other executives occupying a high level management position with regular access to non-public material information relating, directly or indirectly, to ArcelorMittal and have the authority to make management decisions about the future development of the Company and its business strategy (see “Management and employees— Directors and senior management" for a description of senior management). Persons closely associated with them include their respective family members.
Both information on trading in Financial Instruments by “Persons Discharging Senior Managerial Responsibilities” and ArcelorMittal’s Insider Dealing Regulations are available on www.arcelormittal.com under “Investors—Corporate Governance—Share Transactions by Management”. For more information, see “Management and employees—Directors and senior management”. In 2023, nine notifications were received by ArcelorMittal from such persons and filed with the CSSF.
Related Party Transactions
The Shareholders’ Rights Law provides that a company is now required to publicly disclose material transactions (excluding "transactions taking place as part of the company's ordinary activity and concluded under normal market conditions") with related parties no later than at the time of conclusion of the transaction. The same requirement applies to material transactions concluded between related parties of a company and subsidiaries of such company. The Board of Directors must approve material transactions of the Company with related parties. A transaction with a related party is material if (i) its publication and divulgation may have a significant impact on the economic decisions of shareholders and (ii) it may create a risk for the company and its shareholders which are not related parties, including minority shareholders. In the determination of whether a transaction is material both the nature of the transaction and the position of the related party must be taken into account.
232
| Management report | ||
Publication of regulated information
Since January 2009, disclosure to the public of “regulated information” (within the meaning of the Luxembourg Transparency Law) concerning ArcelorMittal has been made by publishing the information through the centralized regulated information filing and storage system managed by the Luxembourg Stock Exchange and accessible in English and French on www.bourse.lu, in addition to the publication by ArcelorMittal of the information by way of press release. All news and press releases issued by the Company are available on www.arcelormittal.com in the “News and Media” section.
Limitation of directors’ liability/indemnification of Directors and the members of the Executive Office
The Articles of Association provide that ArcelorMittal will, to the broadest extent permitted by Luxembourg law, indemnify every director and member of the Executive Office as well as every former director or member of the Executive Office for fees, costs and expenses reasonably incurred in the defense or resolution (including a settlement) of all legal actions or proceedings, whether civil, criminal or administrative, he or she has been involved in his or her role as former or current director or member of the Executive Office.
The right to indemnification does not exist in the case of gross negligence, fraud, fraudulent inducement, dishonesty or for a criminal offense, or if it is ultimately determined that the director or members of the Executive Office has not acted honestly, in good faith and with the reasonable belief that he or she was acting in the best interests of ArcelorMittal.
The Company also maintains liability insurance for its directors and officers, including insurance against liabilities arising under the U.S. Securities Act of 1933, as amended, and the U.S. Securities Exchange Act of 1934, as amended.
Material contracts
The following are material contracts, not entered into in the ordinary course of business, to which ArcelorMittal has been a party during the past two years.
ArcelorMittal Equity Incentive Plan, Performance Share Unit Plan and Special Grant
For a description of such plans, please refer to “Management and employees—Compensation.”
Memorandum of Understanding
Mr. Lakshmi Mittal, Mrs. Usha Mittal, Lumen Investments S.à r.l., Nuavam Investments S.à r.l. (together, the “MoU Group”) and the Company are parties to a Memorandum of Understanding (“MoU”), dated June 25, 2006, to combine Mittal Steel and Arcelor in order to create the world’s leading steel company. (Lumen Investments S.à r.l. and Nuavam Investments S.à r.l. became parties following the assumption of the obligations of
original parties to the MoU that have since ceased to hold Company shares). In April 2008, the Board of Directors approved resolutions amending certain provisions of the MoU in order to adapt it to the Company’s needs in the post-merger and post-integration phase, as described under “Management and employees—Corporate governance—Operation—Lead Independent Director”.
On the basis of the MoU, Arcelor’s Board of Directors recommended Mittal Steel’s offer for Arcelor, and the parties to the MoU agreed to certain corporate governance and other matters relating to the combined ArcelorMittal group. Certain provisions of the MoU relating to corporate governance were incorporated into the Articles of Association of ArcelorMittal at the extraordinary general meeting of the shareholders on November 5, 2007.
Certain additional provisions of the MoU expired effective August 1, 2009 and on August 1, 2011. ArcelorMittal’s corporate governance rules will continue to reflect, subject to those provisions of the MoU that have been incorporated into the Articles of Association, the best standards of corporate governance for comparable companies and to conform with the corporate governance aspects of the NYSE listing standards applicable to non-U.S. companies and Ten Principles of Corporate Governance of the Luxembourg Stock Exchange.
The following summarizes the main provisions of the MoU that remain in effect or were in effect in 2023.
Standstill
The MoU Group agreed not to acquire, directly or indirectly, ownership or control of an amount of shares in the capital stock of the Company exceeding the percentage of shares in the Company that it will own or control following completion of the Offer (as defined in the MoU) for Arcelor and any subsequent offer or compulsory buy-out, except with the prior written consent of a majority of the independent directors on the Company’s Board of Directors. Any shares acquired in violation of this restriction will be deprived of voting rights and shall be promptly sold by the MoU Group. Notwithstanding the above, if (and whenever) the MoU Group holds, directly and indirectly, less than 45% of the then-issued Company shares, the MoU Group may purchase (in the open market or otherwise) Company shares up to such 45% limit. In addition, the MoU Group is also permitted to own and vote shares in excess of the threshold mentioned in the immediately preceding paragraph or the 45% limit mentioned above, if such ownership results from (1) subscription for shares or rights in proportion to its existing shareholding in the Company where other shareholders have not exercised the entirety of their rights or (2) any passive crossing of this threshold resulting from a reduction of the number of Company shares (e.g., through self-tender offers or share buy-backs) if, in respect of (2) only, the decisions to
233
| Management report | ||
implement such measures were taken at a shareholders’ meeting in which the MoU Group did not vote or by the Company’s Board of Directors with a majority of independent directors voting in favor.
Once the MoU Group exceeds the threshold mentioned in the first paragraph of this “Standstill” subsection or the 45% limit, as the case may be, as a consequence of any corporate event set forth in (1) or (2) above, it shall not be permitted to increase the percentage of shares it owns or controls in any way except as a result of subsequent occurrences of the corporate events described in (1) or (2) above, or with the prior written consent of a majority of the independent directors on the Company’s Board of Directors.
If subsequently the MoU Group sells down below the threshold mentioned in the first paragraph of this “Standstill” subsection or the 45% limit, as the case may be, it shall not be permitted to exceed the threshold mentioned in the first paragraph of this “Standstill” subsection or the 45% limit, as the case may be, other than as a result of any corporate event set out in (1) or (2) above or with the prior written consent of a majority of the independent directors.
Finally, the MoU Group is permitted to own and vote shares in excess of the threshold mentioned in the first paragraph of this “Standstill” subsection or the 45% limit mentioned above if it acquires the excess shares in the context of a takeover bid by a third party and (1) a majority of the independent directors of the Company’s Board of Directors consents in writing to such acquisition by the MoU Group or (2) the MoU Group acquires such shares in an offer for all of the shares of the Company.
Non-compete
For so long as the MoU Group holds and controls at least 15% of the outstanding shares of the Company or has representatives on the Company’s Board of Directors or Executive Office, the MoU Group and its affiliates will not be permitted to invest in, or carry on, any business competing with the Company, except for PT ISPAT Indo.
Exchange controls and other limitations affecting security holders
There are no legislative or other legal provisions currently in force in Luxembourg or arising under ArcelorMittal’s Articles of Association that restrict the payment of dividends to holders of ArcelorMittal shares not resident in Luxembourg, except for regulations restricting the remittance of dividends and other payments in compliance with United Nations and EU sanctions. There are no limitations, either under the laws of Luxembourg or in the Articles of Association, on the right of non-Luxembourg nationals to hold or vote ArcelorMittal shares.
Luxembourg takeover law disclosure
The following disclosure is provided based on article 11 of the Luxembourg law of May 19, 2006 transposing Directive 2004/25/EC of the European Parliament and the Council of April 21, 2004 on takeover bids (the “Takeover Law”). The Articles of Association are available on www.arcelormittal.com, under Investors, Corporate Governance, Current Articles of Association.
With regard to articles 11(1)(a) and (c) of the Takeover Law, the Company has issued a single category of shares (ordinary shares), and the Company’s shareholding structure showing each shareholder owning 5% or more of the Company’s share capital is available elsewhere in this report and on www.arcelormittal.com under Investors, Corporate Governance, Shareholding Structure, where the shareholding structure chart is updated monthly.
With regard to article 11(1)(b) of the Takeover Law, the ordinary shares issued by the Company are listed on various stock exchanges including NYSE and are freely transferable.
With regard to article 11(1)(d) of the Takeover Law, each ordinary share of the Company gives right to one vote, as set out in article 13.6 of the Articles of Association, and there are no special control rights attaching to the shares. Article 8 of the Articles of Association provides that the Mittal Shareholder (Mr Lakshmi N. Mittal, Mrs Usha Mittal or any of their heirs or successors acting directly or indirectly and/or the trust or trusts of which Mr. Lakshmi N. Mittal, Mrs. Usha Mittal and/or their heirs or successors are the beneficiaries, hold or control ArcelorMittal shares or any other entity controlled, directly or indirectly, by either of them) may, at its discretion, exercise the right of proportional representation and nominate candidates for appointment to the Board of Directors (defined as “Mittal Shareholder Nominees”). The Mittal Shareholder has not, to date, exercised that right.
Articles 11(1)(e) and (f) of the Takeover Law are not applicable to the Company. However, the sanction of suspension of voting rights automatically applies, subject to limited exceptions set out in the Transparency Law (as defined above), to any shareholder (or group of shareholders) who has (or have) crossed the thresholds set out in article 7 of the Articles of Association and articles 8 to 15 of the Transparency Law but have not notified the Company accordingly. The sanction of suspension of voting rights will apply until such time as the notification has been properly made by the relevant shareholder(s).
Article 11(1)(g) of the Takeover Law is not applicable to the Company.
With regard to article 11(1)(h) of the Takeover Law, the Articles of Association provide that the directors are elected at the
234
| Management report | ||
annual general meeting of shareholders for a term that may not exceed three years, and may be re-elected. The rules governing amendments to the Articles of Association are described elsewhere in this report and are set out in article 19 of the Articles of Association.
With regard to article 11(1)(i) of the Takeover Law, the 2023 AGM granted the Board of Directors a new share buy-back authorization whereby the Board of Directors may authorize the acquisition or sale of Company shares including, but not limited to, entering into off-market and over-the-counter transactions and the acquisition of shares through derivative financial instruments. Any acquisitions, disposals, exchanges, contributions or transfers of shares by the Company or other companies in the ArcelorMittal group must be in accordance with the Luxembourg law of December 23, 2016 on market abuse, Regulation (EU) No. 596/2014 of the European Parliament and of the Council of April 16, 2014 on market abuse and Commission Delegated Regulation (EU) No. 2016/1052 of March 8, 2016 with regard to regulatory technical standards for the conditions applicable to buy-back programs and stabilization measures and may be carried out by all means, on or off-market, including by a public offer to buy-back shares, or by the use of derivatives or option strategies. The fraction of the capital acquired or transferred in the form of a block of shares may amount to the entire program. Such transactions may be carried out at any time, including during a tender offer period, in accordance with applicable laws and regulations, including Section 10(b) and Section 9(a)(2) of the Securities Exchange Act of 1934, as amended (the “Exchange Act”), and Rule 10b-5 promulgated under the Exchange Act. The authorization is valid until the 2024 AGM, or until the date of its renewal by a resolution of the general meeting of shareholders if such renewal date is prior to the 2024 AGM. Details relating to the repurchase of shares, as approved by the 2023 AGM can be found under "—Memorandum and Articles of Association - Repurchase of shares".
Articles 11(1)(j) and (k) of the Takeover Law are not applicable to the Company.
Taxation
United States taxation
The following discussion is a summary of the material U.S. federal income tax consequences that are likely to be relevant to U.S. Holders (as defined below) in respect of the ownership and disposition of ArcelorMittal common shares (hereinafter the “ArcelorMittal shares”) that are held as capital assets (such as for investment purposes). This summary does not purport to address all material tax consequences that may be relevant to a particular U.S. Holder. This summary also does not take into account the specific circumstances of particular investors, some of which (such as tax-exempt entities, banks, insurance
companies, broker-dealers, traders in securities that elect to use a mark-to-market method of accounting for their securities holdings, regulated investment companies, real estate investment trusts, partnerships and other pass-through entities, investors liable for any U.S. alternative minimum tax, investors that own or are treated as owning 10% or more of the total combined voting power or value of ArcelorMittal’s shares, investors that hold ArcelorMittal shares as part of a straddle, hedge, conversion, constructive sale or other integrated transaction, and U.S. Holders whose functional currency is not the U.S. dollar) may be subject to special tax rules. This summary is based on the U.S. Internal Revenue Code of 1986, as amended (the “Code”), the Treasury regulations issued thereunder, judicial decisions, and published rulings and administrative pronouncements of the U.S. Internal Revenue Service (“IRS”), all as in effect on the date hereof, and the income tax treaty between the United States and Luxembourg dated April 3, 1996 (as amended by any subsequent protocols) (the “Treaty”). Those authorities are subject to change (possibly with retroactive effect) or to differing interpretations.
This summary does not address any aspects of U.S. federal tax law other than income taxation, or any state, local, or non-U.S. tax considerations that may be applicable to investors, or the Medicare contribution tax applicable to net investment income of certain non-corporate U.S. Holders. Investors are urged to consult their tax advisors regarding the U.S. federal, state, local and other tax consequences of acquiring, owning and disposing of ArcelorMittal shares.
For purposes of this discussion, a “U.S. Holder” is a beneficial owner of ArcelorMittal shares that is, for U.S. federal income tax purposes:
•an individual citizen or resident of the United States;
•a corporation (or other entity taxable as a corporation for U.S. federal income tax purposes) organized in or under the laws of the United States, any state thereof, or the District of Columbia; or
•any other person that is subject to U.S. federal income tax on a net income basis in respect of the ArcelorMittal shares.
The U.S. federal income tax consequences of a partner in a partnership holding ArcelorMittal shares generally will depend on the status of the partner and the activities of the partnership. The Company recommends that partners in such a partnership consult their own tax advisors.
Except where specifically described below, this discussion assumes that ArcelorMittal is not a passive foreign investment company (“PFIC”) for U.S. federal income tax purposes. See “—Passive foreign investment company ("PFIC") status”.
235
| Management report | ||
(a) Taxation of distributions
Cash distributions made by ArcelorMittal in respect of ArcelorMittal shares will constitute a taxable dividend when such distribution is actually or constructively received, to the extent such distribution is paid out of the current or accumulated earnings and profits of ArcelorMittal (as determined under U.S. federal income tax principles). The amount of any distribution will include the amount of any applicable Luxembourg withholding tax. To the extent the amount of any distribution received by a U.S. Holder in respect of ArcelorMittal shares exceeds the current or accumulated earnings and profits of ArcelorMittal, the distribution (1) will be treated as a non-taxable return of the U.S. Holder’s adjusted tax basis in those ArcelorMittal shares and (2) thereafter will be treated as U.S.-source capital gain. Because ArcelorMittal does not maintain calculations of earnings and profits under U.S. federal income tax principles, it is expected that distributions generally will be reported to U.S. Holders as dividends. Distributions of additional ArcelorMittal shares that are made to U.S. Holders with respect to their ArcelorMittal shares, and that are part of a pro rata distribution to all ArcelorMittal shareholders, generally will not be subject to U.S. federal income tax unless the U.S. Holder has the right to receive cash or property instead, in which case the U.S. Holder will be treated as if it received cash equal to the fair market value of the distribution.
The U.S. dollar amount of a taxable dividend generally will be included in the gross income of a U.S. Holder as ordinary income derived from sources outside the United States for U.S. foreign tax credit purposes and generally will be passive category income for purposes of the foreign tax credit limitation. Dividends paid in euro will be included in a U.S. Holder’s income in a U.S. dollar amount calculated by reference to the exchange rate in effect on the date the dividend is received; a recipient of such dividends that converts such euro to dollars upon receipt generally should not be required to recognize foreign currency gain or loss in respect of the dividend income. Dividends paid by ArcelorMittal will not be eligible for the dividends-received deduction generally allowed to U.S. corporations in respect of dividends received from U.S. corporations.
Subject to certain exceptions for short-term or hedged positions, taxable dividends received by certain non-corporate U.S. Holders (including individuals) with respect to the ArcelorMittal shares will be subject to U.S. federal income taxation at rates that are lower than the rates applicable to ordinary income if the dividends represent “qualified dividend income”. Dividends paid on the ArcelorMittal shares will be treated as qualified dividend income if ArcelorMittal is not a Passive foreign investment company ("PFIC") in the year in which the dividend was paid or in the year prior thereto. As discussed further below, ArcelorMittal believes that it was not a PFIC for U.S. federal income tax purposes with respect to its 2022 and 2023 taxable
years, and ArcelorMittal does not expect to be a PFIC for its 2024 taxable year. See “—Passive foreign investment company ("PFIC") status”.
U.S. Holders of ArcelorMittal shares should consult their own tax advisors regarding the availability of the reduced rate of U.S. federal income tax on dividends in light of their own particular circumstances.
Subject to generally applicable limitations and conditions, Luxembourg dividend withholding tax paid at the appropriate rate applicable to the U.S. Holder may be eligible for a credit against such U.S. Holder’s U.S. federal income tax liability. These generally applicable limitations and conditions include new requirements recently adopted by the IRS in regulations promulgated in December 2021, and any Luxembourg tax will need to satisfy these requirements in order to be eligible to be a creditable tax for a U.S. Holder. In the case of a U.S. Holder that either (i) is eligible for, and properly elects, the benefits of the Treaty, or (ii) consistently elects to apply a modified version of these rules under recently issued temporary guidance and complies with specific requirements set forth in such guidance, the Luxembourg tax on dividends will be treated as meeting the new requirements and therefore as a creditable tax. In the case of all other U.S. Holders, the application of these requirements to the Luxembourg tax on dividends is uncertain, and we have not determined whether these requirements have been met. If the Luxembourg dividend tax is not a creditable tax for a U.S. Holder or the U.S. Holder does not elect to claim a foreign tax credit for any foreign income taxes paid or accrued in the same taxable year, the U.S. Holder may be able to deduct the Luxembourg tax in computing such U.S. Holder’s taxable income for U.S. federal income tax purposes. The temporary guidance discussed above also indicates that the Treasury and the IRS are considering proposing amendments to the December 2021 regulations and that the temporary guidance can be relied upon until additional guidance is issued that withdraws or modifies the temporary guidance. The rules with respect to foreign tax credits are complex and involve the application of rules that depend on a U.S. Holder’s particular circumstances. Accordingly, U.S. Holders are urged to consult their tax advisors regarding the availability of the foreign tax credit under their particular circumstances.
(b) Taxation of sales, exchanges, or other dispositions of ArcelorMittal shares
Sales or other taxable dispositions by U.S. Holders of ArcelorMittal shares generally will give rise to gain or loss equal to the difference between the amount realized on the disposition and the U.S. Holder’s tax basis in such ArcelorMittal shares, as determined in U.S. dollars. A U.S. Holder generally will have an initial tax basis in each ArcelorMittal share equal to its U.S. dollar cost to the U.S. Holder.
236
| Management report | ||
In general, gain or loss recognized on the sale or exchange of ArcelorMittal shares will be capital gain or loss and, if the U.S. Holder’s holding period for such ArcelorMittal shares exceeds one year, will be long-term capital gain or loss. Certain U.S. Holders, including individuals, are eligible for preferential rates of U.S. federal income tax in respect of long-term capital gains. The deduction of capital losses against ordinary income is subject to limitations under the Code.
Passive foreign investment company (“PFIC”) status
Special U.S. federal income tax rules apply to U.S. Holders owning stock of a PFIC. ArcelorMittal believes that it was not a PFIC for U.S. federal income tax purposes with respect to its 2022 and 2023 taxable years, and ArcelorMittal does not expect to be a PFIC for its 2024 taxable year. This conclusion is based upon an annual analysis of its financial position and an interpretation of the PFIC provisions that ArcelorMittal believes is correct. No assurances can be made, however, that the applicable tax law or relevant factual circumstances will not change in a manner that affects the determination of ArcelorMittal’s PFIC status. If, contrary to the foregoing, ArcelorMittal were classified as a PFIC, a U.S. Holder of ArcelorMittal shares would be subject to an increased tax liability upon the gain realized on a sale or other disposition of ArcelorMittal shares and upon the receipt of certain distributions treated as “excess distributions”. Any gain realized would not be treated as a capital gain but would be treated as if the U.S. Holder had realized its gain and certain “excess distributions”, as applicable, ratably over its holding period for ArcelorMittal shares and would be taxed at the highest tax rate in effect for each such year to which the gain was allocated, together with an interest charge in respect of the tax attributable to each such year. If ArcelorMittal were a PFIC and its shares constitute “marketable stock”, a U.S. Holder may elect to instead be taxed annually on a mark-to-market basis with respect to its ArcelorMittal shares and would not be subject to the PFIC rules described above. U.S. Holders should consult their tax advisors regarding the application of the PFIC rules to ArcelorMittal including the availability and consequences of a mark-to-market election with respect to their shares of ArcelorMittal.
Foreign Financial Asset Reporting
Certain U.S. Holders that own “specified foreign financial assets” with an aggregate value in excess of U.S.$50,000 on the last day of the taxable year or U.S.$75,000 at any time during the taxable year are generally required to file an information statement along with their tax returns, currently on Form 8938, with respect to such assets. “Specified foreign financial assets” include any financial accounts held at a non-U.S. financial institution, as well as securities issued by a non-U.S. issuer that are not held in accounts maintained by financial institutions. The understatement of income attributable to “specified foreign financial assets” in excess of U.S.$5,000
extends the statute of limitations with respect to the tax return to six years after the return was filed. U.S. Holders who fail to report the required information could be subject to substantial penalties. U.S. Holders are encouraged to consult with their own tax advisers regarding the possible application of these rules, including the application of the rules to their particular circumstances.
Backup withholding and information reporting
The payment of proceeds received upon the sale, exchange or redemption of ArcelorMittal shares by U.S. Holders within the United States (or through certain U.S.-related financial intermediaries), and dividends on ArcelorMittal shares paid to U.S. Holders in the United States (or through certain U.S.-related financial intermediaries), will be subject to information reporting and may be subject to backup withholding unless the U.S. Holder (1) is an exempt recipient, and establishes that exemption if required or (2) in the case of backup withholding, provides an IRS Form W-9 (or an acceptable substitute form) that contains the U.S. Holder’s taxpayer identification number and that certifies that no loss of exemption from backup withholding has occurred.
Backup withholding is not an additional tax. The amount of backup withholding imposed on a payment to a U.S. Holder will be allowed as a credit against the holder’s U.S. federal income tax liability, if any, or as a refund, so long as the required information is properly furnished to the IRS. Holders that are not "U.S. persons" (as defined in the Code) may need to comply with certification procedures to establish their non-U.S. status in order to avoid information reporting and backup withholding tax requirements.
THE SUMMARY OF U.S. FEDERAL INCOME TAX CONSEQUENCES SET OUT ABOVE IS INTENDED FOR GENERAL INFORMATION PURPOSES ONLY. EACH INVESTOR IN ARCELORMITTAL ORDINARY SHARES IS URGED TO CONSULT ITS OWN TAX ADVISOR WITH RESPECT TO THE PARTICULAR TAX CONSEQUENCES OF THE ACQUISITION, OWNERSHIP AND DISPOSITION OF ARCELORMITTAL SHARES BASED ON THE INVESTOR’S PARTICULAR CIRCUMSTANCES.
Luxembourg taxation
The following is a summary addressing certain material Luxembourg tax consequences that are likely to be relevant to holders of shares in respect of the ownership and disposition of shares in ArcelorMittal.
This summary does not purport to address all material tax considerations that may be relevant to a holder or prospective holder of ArcelorMittal shares. This summary also does not take into account the specific circumstances of particular investors some of which may be subject to special tax rules, including
237
| Management report | ||
dealers in securities, financial institutions, insurance companies, investment funds.
This summary is based on the laws, regulations and applicable tax treaties as in effect on the date hereof in Luxembourg, all of which are subject to change, possibly with retroactive effect. Holders of ArcelorMittal shares should consult their own tax advisers as to the particular tax consequences, under the tax laws of the country of which they are residents for tax purposes of the ownership or disposition of ArcelorMittal shares.
This summary does not address the terms of employee stock options or other incentive plans implemented by ArcelorMittal and its subsidiaries and does not purport to provide the holders of stock subscription options or other comparable instruments (including shares acquired under employee share ownership programs) with a description of the possible tax and social security implications for them, nor to determine under which conditions these options or other instruments are or may become exercisable. These holders are therefore urged to consult their own tax advisers as to the potential tax and social security implications of an exercise of their options or other instruments.
As used herein, a “Luxembourg individual” means an individual resident in Luxembourg who is subject to personal income tax (impôt sur le revenu) on his or her worldwide income from Luxembourg or foreign sources, and a “Luxembourg company” means a company or another entity resident in Luxembourg subject to corporate income tax (impôt sur le revenu des collectivités) on its worldwide income from Luxembourg or foreign sources. For the purposes of this summary, Luxembourg individuals and Luxembourg companies are collectively referred to as “Luxembourg Holders”. A “non-Luxembourg Holder” means any investor in ArcelorMittal shares other than a Luxembourg Holder.
(a) Luxembourg withholding tax on dividends paid on ArcelorMittal shares
Dividends distributed by ArcelorMittal will in principle be subject to Luxembourg withholding tax at the rate of 15%.
Luxembourg resident corporate holders
Dividend withholding tax exemption applies on dividends paid by ArcelorMittal to a Luxembourg company (that is, a fully taxable entity within the meaning of Article 159 of the Luxembourg Income Tax Law) holding shares (or a Luxembourg permanent establishment/representative of a qualifying foreign entity to which the shares are attributable), which meets the qualifying participation test (that is, a shareholding in ArcelorMittal of at least 10% or having an acquisition cost of at least EUR 1.2 million held or committed to be held for a minimum one year holding period) under the conditions of Article 147 of the Luxembourg Income Tax Law). If such exemption from dividend
withholding tax does not apply, a Luxembourg company may be entitled to a tax credit.
Luxembourg resident individual holders
Luxembourg withholding tax on dividends paid by ArcelorMittal to a Luxembourg resident individual holder may entitle such Luxembourg Holder to a tax credit for the tax withheld.
Non-Luxembourg Holders
Non-Luxembourg Holders of ArcelorMittal shares who have held a shareholding in ArcelorMittal representing at least 10% of ArcelorMittal’s share capital (or shares with an acquisition cost of at least EUR 1.2 million) for an uninterrupted period of at least 12 months (or where held for a shorter period, where the holder takes the commitment to hold the qualifying shareholding for such period) may benefit from an exemption from the dividend withholding tax if they are: (i) entities which fall within the scope of Article 2 of the European Council Directive 2011/96/EU, as amended (the “EU Parent-Subsidiary Directive”) and which are not excluded to benefit from the EU Parent-Subsidiary Directive under its mandatory general anti-avoidance rule (“GAAR”) in each case as implemented in Luxembourg, or (ii) corporates subject to a tax comparable to Luxembourg corporate income tax and which are resident of a country having concluded a double tax avoidance treaty with Luxembourg, or (iii) corporates subject to a tax comparable to Luxembourg corporate income tax and which are resident in a State being part of the European Economic Area (EEA) other than a Member State of the European Union, or (iv) corporates resident in Switzerland subject to corporate income tax in Switzerland without benefiting from an exemption.
Non-Luxembourg Holders of ArcelorMittal shares who are tax resident in a country having a double tax avoidance treaty with Luxembourg may claim for a reduced withholding tax rate or a withholding tax relief under the conditions and subject to the limitations set forth in the relevant treaty.
(b) Luxembourg income tax on dividends paid on ArcelorMittal shares and capital gains
Luxembourg resident individual holders
For Luxembourg individuals, income in the form of dividends or capital gains derived from ArcelorMittal shares will normally be subject to individual income tax at the applicable progressive rate with a current top effective marginal rate of 45.78% including the unemployment fund contribution at the maximum rate of 9%. Such dividends may benefit from the 50% exemption set forth in Article 115(15a) of the Luxembourg Income Tax Law, subject to fulfillment of the conditions set out therein. Capital gains will only be taxable if they are realized on a sale of ArcelorMittal shares, which takes place within the first six months following their acquisition, or if the relevant holder (alone or together with his/her spouse or registered partner and his/her
238
| Management report | ||
underage children), directly or indirectly, holds or has held more than 10% of the ArcelorMittal shares at any time during the past five years.
Luxembourg resident corporate holders
For Luxembourg companies, which do not benefit from a special tax regime, income in the form of dividends or capital gains derived from ArcelorMittal shares will be subject to corporate income tax and municipal business tax. The combined rate for these two taxes (including an unemployment fund contribution of 7%) for Luxembourg companies with registered office in Luxembourg City is 24.94% in 2023. Such dividends may benefit either from the 50% exemption set forth in Article 115(15a) of the Luxembourg Income Tax Law or from the full exemption set forth in Article 166 of the Luxembourg Income Tax Law, subject in each case to fulfillment of the respective conditions set out therein. Capital gains realized on the sale of ArcelorMittal shares may benefit from the full exemption provided for by the Grand Ducal Decree of December 21, 2001, as amended, subject to fulfillment of the conditions set out therein.
Non-Luxembourg Holders
An individual or corporate non-Luxembourg Holder of ArcelorMittal shares who/which realizes a gain on disposal thereof (and who/which does not have a permanent establishment in Luxembourg to which the ArcelorMittal shares would be attributable) will only be subject to Luxembourg taxation on capital gains arising upon disposal of such shares if such holder has (if an individual, alone or together with his or her spouse or registered partner and underage children) directly or indirectly held more than 10% of the capital of ArcelorMittal, at any time during the past five years, and either (1) such holder has been a resident of Luxembourg for tax purposes for at least 15 years and has become a non-resident within the last five years preceding the realization of the gain, subject to any applicable tax treaty, or (2) the disposal of ArcelorMittal shares occurs within six months from their acquisition, subject to any applicable tax treaty.
A corporate non-Luxembourg Holder, which has a permanent establishment or a permanent representative in Luxembourg to which ArcelorMittal shares would be attributable, will bear corporate income tax and municipal business tax on dividends received and/or a gain realized on a disposal of such shares under the same conditions as are applicable to a Luxembourg resident corporate holder, as described above.
(c) Other taxes
Net wealth tax
Luxembourg net wealth tax will not be levied on a Luxembourg Holder unless:
•the Luxembourg Holder is a legal entity subject to net wealth tax in Luxembourg; or
•ArcelorMittal shares are attributable to an enterprise or part thereof which is carried on through a permanent establishment or a permanent representative in Luxembourg of a non-resident entity.
Net wealth tax is levied annually at a digressive rate depending on the amount of the net wealth of the above holders, as determined for net wealth tax purposes (i.e. 0.5% on an amount up to EUR 500 million and 0.05% on the amount of taxable net wealth exceeding EUR 500 million).
ArcelorMittal shares may be exempt from net wealth tax subject to the conditions set forth by Article 60 of the Law of October 16, 1934 on the valuation of assets (Bewertungsgesetz), as amended.
Estate and gift tax
Luxembourg inheritance tax may be levied on the transfer of ArcelorMittal shares upon the death of a Luxembourg individual.
Luxembourg gift tax will be levied in the event that a gift of ArcelorMittal shares is made pursuant to a notarial deed signed before a Luxembourg notary.
Other Luxembourg tax considerations
No registration tax will be payable by a holder of shares upon the issue, subscription or acquisition of shares in ArcelorMittal or upon the disposal of shares by sale or exchange.
Evaluation of disclosure controls and procedures
Disclosure controls and procedures
Management maintains disclosure controls and procedures that are designed to ensure that information required to be disclosed in the Company’s reports under the Securities Exchange Act of 1934, as amended (the “Exchange Act”) is recorded, processed, summarized and reported within time periods specified in the SEC’s rules and forms, and that such information is accumulated and communicated to management, including the Chief Executive Officer and Chief Financial Officer, as appropriate, to allow timely decisions regarding required disclosure. ArcelorMittal’s disclosure controls and procedures are designed to provide reasonable assurance of achieving their objectives.
There are inherent limitations to the effectiveness of any system of disclosure controls and procedures, including the possibility of human error and the circumvention or overriding of the controls and procedures. Accordingly, even effective disclosure controls and procedures can only provide reasonable assurance of achieving their control objectives.
239
| Management report | ||
Management, under the supervision and with the participation of its Chief Executive Officer and Chief Financial Officer, carried out an evaluation of the effectiveness of the design and operation of the Company’s disclosure controls and procedures (as defined in Exchange Act Rule 13a-15(e)) as of December 31, 2023. Based upon that evaluation, the Company’s Chief Executive Officer and Chief Financial Officer concluded that, as of December 31, 2023 and as a result of the material weakness, affecting sales and cost of sales in one of the Company’s Canadian subsidiaries and described below, the Company’s disclosure controls and procedures were not effective.
Management’s report on internal control over financial reporting
Management is responsible for establishing and maintaining adequate internal control over financial reporting as defined in Rule 13a-15(f) of the Exchange Act. Internal control over financial reporting is a process designed to provide reasonable assurance regarding the reliability of financial reporting and the preparation of financial statements for external purposes in accordance with generally accepted accounting principles.
Because of its inherent limitations, internal control over financial reporting may not prevent or detect misstatements. Also, projections of any evaluation of effectiveness to future periods are subject to the risk that controls may become inadequate because of changes in conditions, or that the degree of compliance with the policies and procedures may deteriorate.
Management assessed the effectiveness of internal control over financial reporting as of December 31, 2023 based upon the framework in Internal Control—Integrated Framework (2013) issued by the Committee of Sponsoring Organizations of the Treadway Commission (“COSO”). Management’s assessment of the effectiveness of internal controls over financial reporting excludes the evaluation of the internal controls over financial reporting for ArcelorMittal Pecém, which was acquired on March 9, 2023. As of December 31, 2023, ArcelorMittal Pecém represented 3% of the Company’s total assets and 2% of the Company’s sales. The transaction is not expected to materially affect ArcelorMittal’s internal control over financial reporting. The Company expects its internal control system to be fully implemented at ArcelorMittal Pecém during 2024 and to be evaluated by management for effectiveness at that time.
A material weakness is a deficiency, or a combination of deficiencies, in internal control over financial reporting, such that there is a reasonable possibility that a material misstatement of the Company's financial statements will not be prevented or detected on a timely basis. Management has identified a material weakness in internal control over financial reporting as a result of control deficiencies at one of the Company’s Canadian subsidiaries, with respect to information technology general controls (“ITGCs”) in the areas of user access and program change management over certain information
technology (“IT”) systems that support the recognition of sales and cost of sales, ineffective business process controls (automated and manual IT-dependent) due to the dependency on such ITGCs, and other ineffective business process controls supporting the recognition of sales and cost of sales. As of December 31, 2023, this Canadian subsidiary represented 3% of the Company’s total assets and 6% of the Company’s sales for the year then ended.
This material weakness did not result in any material misstatements in the consolidated financial statements. However, due to the existence of the material weakness, a reasonable possibility exists that material misstatements in the Company’s financial statements would not have been prevented or detected on a timely basis.
Based on this assessment, management concluded that, as a result of the material weakness described above, ArcelorMittal’s internal control over financial reporting was not effective as of December 31, 2023.
Ernst & Young S.A., the Company’s independent registered public accounting firm that audited the consolidated financial statements for the year ended December 31, 2023, has issued an adverse opinion on the effectiveness of the Company’s internal control over financial reporting as of December 31, 2023.
Remediation plan
Management and the Company’s Board of Directors are committed to maintaining a strong internal control environment. Management, with the oversight of the Audit & Risk Committee of the Board of Directors, evaluated the material weakness identified as of December 31, 2023, and is implementing a remediation plan to address the material weakness resulting from internal control deficiencies at one of the Company's Canadian subsidiaries and to enhance the Company’s control environment.
The remediation plan will include enhanced identification of IT applications relevant to internal control over financial reporting, appropriate implementation and operation of ITGCs, continued training of Company personnel and clear communication of control responsibilities.
Changes in Internal Control over Financial Reporting
Except as noted in the preceding paragraphs, there have been no changes in the Company’s internal control over financial reporting that occurred during the year ended December 31, 2023 that have materially affected or are reasonably likely to materially affect the Company’s internal control over financial reporting.
240
| Management report | ||
Report of Independent Registered Public Accounting Firm
To the Shareholders and the Board of Directors of ArcelorMittal
Opinion on Internal Control Over Financial Reporting
We have audited ArcelorMittal and subsidiaries’ internal control over financial reporting as of December 31, 2023, based on criteria established in Internal Control—Integrated Framework issued by the Committee of Sponsoring Organizations of the Treadway Commission “(2013 framework),” (the COSO criteria). In our opinion, because of the effect of the material weakness described below on the achievement of the objectives of the control criteria, ArcelorMittal and subsidiaries (the “Company”) has not maintained effective internal control over financial reporting as of December 31, 2023, based on the COSO criteria.
A material weakness is a deficiency, or combination of deficiencies, in internal control over financial reporting, such that there is a reasonable possibility that a material misstatement of the company’s annual or interim financial statements will not be prevented or detected on a timely basis. The following material weakness has been identified and included in management’s assessment. Management has identified a material weakness in internal control over financial reporting as a result of control deficiencies at one of the Company’s Canadian subsidiaries with respect to information technology general controls (“ITGCs”) in the areas of user access and program change management over certain information technology (“IT”) systems that support the recognition of sales and cost of sales, ineffective business process controls (automated and manual IT-dependent) due to the dependency on such ITGCs, and other ineffective business process controls supporting the recognition of sales and cost of sales.
As indicated in the accompanying Management’s report on internal control over financial reporting, management’s assessment of and conclusion on the effectiveness of internal control over financial reporting did not include the internal controls of ArcelorMittal Pecém, which was acquired by the Company in 2023 and which is included in the 2023 consolidated financial statements of the Company and constituted 3% of total assets as of December 31, 2023 and 2% of sales for the year then ended. Our audit of internal control over financial reporting of the Company also did not include an evaluation of the internal control over financial reporting of ArcelorMittal Pecém.
We also have audited, in accordance with the standards of the Public Company Accounting Oversight Board (United States) (PCAOB), the consolidated statements of financial position as of December 31, 2023 and 2022, the related consolidated statements of operations, other comprehensive income, changes in equity and cash flows for each of the two years in the period ended December 31, 2023, and the related notes. This material weakness was considered in determining the nature, timing and extent of audit tests applied in our audit of the 2023 consolidated financial statements, and this report does not affect our report dated February 28, 2024, which expressed an unqualified opinion thereon.
Basis for Opinion
The Company’s management is responsible for maintaining effective internal control over financial reporting and for its assessment of the effectiveness of internal control over financial reporting included in the accompanying Management’s report on internal control over financial reporting. Our responsibility is to express an opinion on the Company’s internal control over financial reporting based on our audit. We are a public accounting firm registered with the PCAOB and are required to be independent with respect to the Company in accordance with the U.S. federal securities laws and the applicable rules and regulations of the Securities and Exchange Commission and the PCAOB.
We conducted our audit in accordance with the standards of the PCAOB. Those standards require that we plan and perform the audit to obtain reasonable assurance about whether effective internal control over financial reporting was maintained in all material respects.
Our audit included obtaining an understanding of internal control over financial reporting, assessing the risk that a material weakness exists, testing and evaluating the design and operating effectiveness of internal control based on the assessed risk, and performing such other procedures as we considered necessary in the circumstances. We believe that our audit provides a reasonable basis for our opinion.
Definition and Limitations of Internal Control Over Financial Reporting
A company’s internal control over financial reporting is a process designed to provide reasonable assurance regarding the reliability of financial reporting and the preparation of financial statements for external purposes in accordance with generally accepted accounting principles. A company’s internal control over financial reporting includes those policies and procedures that (1) pertain to the maintenance of records that, in reasonable detail, accurately and fairly reflect the transactions and dispositions of the assets of the company; (2) provide reasonable assurance that transactions are recorded as necessary to permit preparation of financial statements in accordance with generally accepted accounting principles, and that receipts and expenditures of the company are being made only in accordance with authorizations of management and directors of the company; and (3) provide reasonable assurance regarding prevention or timely detection of unauthorized acquisition, use, or disposition of the company’s assets that could have a material effect on the financial statements.
Because of its inherent limitations, internal control over financial reporting may not prevent or detect misstatements. Also, projections of any evaluation of effectiveness to future periods are subject to the risk that controls may become inadequate because of changes in conditions, or that the degree of compliance with the policies or procedures may deteriorate.
/s/ Ernst & Young
Société anonyme
Cabinet de révision agréé
Luxembourg, Grand Duchy of Luxembourg
February 28, 2024
241
| Management report | ||
Principal accountant fees and services
Ernst & Young S.A. acted as the principal independent registered public accounting firm for ArcelorMittal for the fiscal years ended December 31, 2023 and for the fiscal year ended December 31, 2022. Set forth below is a breakdown of fees for services rendered by the auditor in 2023 and 2022.
Audit Fees. Audit fees for the audits of financial statements in 2023 and 2022 were $24.2 million and $21.1 million, respectively, and for regulatory filings $0.1 million and $0.1 million in 2023 and 2022, respectively.
Audit-Related Fees. Audit-related fees in 2023 and 2022 were $2.5 million and $0.9 million, respectively. Audit-related fees include fees for agreed upon procedures for various transactions or reports.
Tax Fees. Fees relating to tax planning, advice and compliance in 2023 and 2022 were $1.2 million and $0.3 million, respectively.
All Other Fees. Fees in 2023 and 2022 for all other services were $0.1 million and $0.3 million, respectively. All other fees relate to services not included in the first three categories.
The Audit & Risk Committee has reviewed and approved all of the audit, audit-related, tax and other services provided by the principal independent registered public accounting firm in 2023 and 2022 within its scope, prior to commencement of the engagements. None of the services provided in 2023 or 2022 were approved under the de minimis exception allowed under the Exchange Act.
The Audit & Risk Committee pre-approves all permissible non-audit service engagements rendered by the principal independent registered public accounting firm. The Audit & Risk Committee has delegated pre-approval powers on a case-by-case basis to the Audit & Risk Committee Chairman, for instances where the Committee is not in session and the preapproved services are reviewed in the subsequent Committee meeting.
242
| Management report | ||
Glossary - definitions, terminology and principal subsidiaries
Definitions and terminology
Unless indicated otherwise, or the context otherwise requires, references herein to “ArcelorMittal”, “we”, “us”, “our”, “ArcelorMittal Group”, “Group” and the “Company” or similar terms are to ArcelorMittal S.A. consolidated with its subsidiaries. References to “ArcelorMittal S.A.”, “ArcelorMittal parent” or “parent of ArcelorMittal” are to ArcelorMittal S.A., formerly known as Mittal Steel Company N.V. (“Mittal Steel”), having its registered office at 24-26, Boulevard d’Avranches, L-1160 Luxembourg, Grand Duchy of Luxembourg. ArcelorMittal’s principal operating subsidiaries, categorized by reporting segment and location, are listed below.
For the purposes of this annual report, the names of the following ArcelorMittal subsidiaries as abbreviated below are used where applicable.
| Name of Subsidiary | Abbreviation | Country | ||||||||||||
| NAFTA | ||||||||||||||
| ArcelorMittal Dofasco G.P. | ArcelorMittal Dofasco | Canada | ||||||||||||
| ArcelorMittal México S.A. de C.V. | ArcelorMittal Mexico | Mexico | ||||||||||||
| ArcelorMittal Long Products Canada G.P. | ArcelorMittal Long Products Canada | Canada | ||||||||||||
| ArcelorMittal Texas HBI LLC | ArcelorMittal Texas HBI | United States of America | ||||||||||||
| Brazil and neighboring countries ("Brazil") | ||||||||||||||
| ArcelorMittal Brasil S.A. | ArcelorMittal Brasil | Brazil | ||||||||||||
| Acindar Industria Argentina de Aceros S.A. | Acindar | Argentina | ||||||||||||
ArcelorMittal Pecém S.A.1 | ArcelorMittal Pecém | Brazil | ||||||||||||
| Europe | ||||||||||||||
| ArcelorMittal France S.A.S. | ArcelorMittal France | France | ||||||||||||
| ArcelorMittal Belgium N.V. | ArcelorMittal Belgium | Belgium | ||||||||||||
| ArcelorMittal España S.A. | ArcelorMittal España | Spain | ||||||||||||
| ArcelorMittal Flat Carbon Europe S.A. | AMFCE | Luxembourg | ||||||||||||
| ArcelorMittal Poland S.A. | ArcelorMittal Poland | Poland | ||||||||||||
| ArcelorMittal Eisenhüttenstadt GmbH | ArcelorMittal Eisenhüttenstadt | Germany | ||||||||||||
| ArcelorMittal Bremen GmbH | ArcelorMittal Bremen | Germany | ||||||||||||
| ArcelorMittal Méditerranée S.A.S. | ArcelorMittal Méditerranée | France | ||||||||||||
| ArcelorMittal Belval & Differdange S.A. | ArcelorMittal Belval & Differdange | Luxembourg | ||||||||||||
| ArcelorMittal Hamburg GmbH | ArcelorMittal Hamburg | Germany | ||||||||||||
| ArcelorMittal Duisburg GmbH | ArcelorMittal Duisburg | Germany | ||||||||||||
| ArcelorMittal International Luxembourg S.A. | ArcelorMittal International Luxembourg | Luxembourg | ||||||||||||
| Africa and Commonwealth of Independent States ("ACIS") | ||||||||||||||
| ArcelorMittal South Africa Ltd. | ArcelorMittal South Africa | South Africa | ||||||||||||
JSC ArcelorMittal Temirtau2 | ArcelorMittal Temirtau | Kazakhstan | ||||||||||||
| PJSC ArcelorMittal Kryvyi Rih | ArcelorMittal Kryvyi Rih | Ukraine | ||||||||||||
| Mining | ||||||||||||||
| ArcelorMittal Mining Canada G.P. and ArcelorMittal Infrastructure Canada G.P. | ArcelorMittal Mines and Infrastructure Canada ("AMMC") | Canada | ||||||||||||
| ArcelorMittal Liberia Ltd. | ArcelorMittal Liberia | Liberia | ||||||||||||
1.Acquisition during the year. For more details see section - 'Key transactions and events in 2023' above and note 2.2.4 to the consolidated financial statements.
2.On December 7, 2023, the Company completed the sale of ArcelorMittal Temirtau, its Kazakh steel and mining operation. See - " Key transactions and events in 2023" and note 2.3 to the consolidated financial statements.
243
| Management report | ||
In addition, unless indicated otherwise, or the context otherwise requires, references in this annual report to abbreviations or terms shown below have the following definitions:
| ARS | Argentine Peso, the official currency of Argentina | INR | Indian rupee, the official currency of India | |||||||||||
| Articles of Association | the amended and restated articles of association of ArcelorMittal, dated April 28, 2023 filed as Exhibit 1.1 hereto | Iron pellets | agglomerated ultra-fine iron ore particles of a size and quality suitable for use in steel-making processes | |||||||||||
| AUD$ or AUD | Australian dollars, the official currency of Australia | Kilometers | measures of distance are stated in kilometers, each of which equals approximately 0.62 miles, or 1000 in meters, each of which equals approximately 3.28 feet | |||||||||||
| Brownfield project | the expansion of an existing operation | KZT | the Kazakhstani tenge, the official currency of Kazakhstan | |||||||||||
| C$ or CAD | Canadian dollars, the official currency of Canada | Metallurgical coal | a broader term than coking coal that includes all coals used in steelmaking, such as coal used for the pulverized coal injection (“PCI”) process | |||||||||||
| Executive Office | the Executive Chairman, Mr. Lakshmi N. Mittal and Chief Executive Officer, Mr. Aditya Mittal | PLN | Polish złoty, the official currency of Poland | |||||||||||
| CIS | the countries of the Commonwealth of Independent States | Production capacity | the annual production capacity of plant and equipment based on existing technical parameters as estimated by management | |||||||||||
| CNY | Chinese yuan, the official currency of China | Ps or MXN | the Mexican peso, the official currency of the United Mexican States | |||||||||||
| Coking coal | coal that, by virtue of its coking properties, is used in the manufacture of coke, which is used in the steelmaking process | Real, reais or R$ | Brazilian reais, the official currency of Brazil | |||||||||||
| Crude steel | the first solid steel product upon solidification of liquid steel, including ingots from conventional mills and semis (e.g., slab, billet and blooms) from continuous casters | ROM | run of mine - mined iron ore or coal to be fed to a preparation and/or concentration process | |||||||||||
| Downstream | finishing operations: flat products - the process after the production of hot-rolled coil/plates, and long products - the process after the production of blooms/billets (including production of bars, wire rods, SBQ, etc.) | Sales | include shipping and handling fees and costs billed to a customer in a sales transaction | |||||||||||
| DMTU or dmtu | dry metric tonne unit | SBQ | special bar quality steel, a high-quality long product | |||||||||||
| DRI | direct reduced iron, a metallic iron formed by removing oxygen from iron ore without the formation of, or passage through, a smelting phase. DRI can be used as feedstock for steel production | Significant Shareholder | a trust (HSBC Trustee (C.I.) Limited, as trustee), of which Mr. Lakshmi N. Mittal, Mrs. Usha Mittal and their children are the beneficiaries | |||||||||||
| Energy coal | coal used as a fuel source in electrical power generation, cement manufacture and various industrial applications. Energy coal may also be referred to as steam or thermal coal | UAH | Ukrainian hryvnia, the official currency of Ukraine | |||||||||||
| Euro, euros, EUR or € | the official currency of the European Union (“EU”) member states participating in the European Monetary Union | US$, $, dollars, USD or U.S. dollar | United States dollar, the official currency of the United States | |||||||||||
| Sinter | a metallic input used in the blast furnace steel-making process, which aggregates fines, binder and other materials into a coherent mass by heating without melting | Upstream | operations that precede downstream steel-making, coking coal, coke, sinter, DRI, blast furnace, basic oxygen furnace (“BOF”), electric arc furnace (“EAF”), casters & hot rolling/plate mill | |||||||||||
| Spanish Stock Exchanges | the stock exchanges of Madrid, Barcelona, Bilbao and Valencia | Wet recoverable | a quantity of iron ore or coal recovered after the material from the mine has gone through a preparation and/or concentration process excluding drying | |||||||||||
| Steel products | finished and semi-finished steel products, and exclude raw materials (including those described under “upstream” below), direct reduced iron (“DRI”), hot metal, coke, etc. | ZAR | South African rand, the official currency of the Republic of South Africa | |||||||||||
| Tons, net tons or ST | short tons are used in measurements involving steel products as well as crude steel, iron ore, iron ore pellets, DRI, hot metal, coke, coal, pig iron and scrap (a short ton is equal to 907.2 kilograms or 2,000 pounds) | Metric Tonnes or MT | metric tonnes and are used in measurements involving steel products, as well as crude steel, iron ore, iron ore pellets, DRI, hot metal, coke, coal, pig iron and scrap (a metric tonne is equal to 1,000 kilograms or 2,204.62 pounds) | |||||||||||
244
| Management report | ||
| Executive Officers | those executives of the Company who are supporting the Executive Office and jointly with the Executive Office represent the senior management of the Company | Probable mineral reserve | is the economically mineable part of an indicated and, in some cases, a measured mineral resource. | |||||||||||
| EAF | Electric arc furnaces are used to produce steel from scrap melted using electricity, in contrast to the cast iron sector (blast furnace – converter) where it is produced from iron ore. | Mineral resource | is a concentration or occurrence of material of economic interest in or on the Earth's crust in such form, grade or quality, and quantity that there are reasonable prospects for economic extraction. A mineral resource is a reasonable estimate of mineralization, taking into account relevant factors such as cut-off grade, likely mining dimensions, location or continuity, that, with the assumed and justifiable technical and economic conditions, is likely to, in whole or in part, become economically extractable. It is not merely an inventory of all mineralization drilled or sampled. | |||||||||||
| GMB | the Group Management Board, the former senior management body which was replaced by the CEO Office subsequently renamed Executive Office. The Executive Office, supported by nine Executive Officers, makes up the Company’s senior management | Measured mineral resource | is that part of a mineral resource for which quantity and grade or quality are estimated on the basis of conclusive geological evidence and sampling. The level of geological certainty associated with a measured mineral resource is sufficient to allow a qualified person to apply modifying factors, in sufficient detail to support detailed mine planning and final evaluation of the economic viability of the deposit. Because a measured mineral resource has a higher level of confidence than the level of confidence of either an indicated mineral resource or an inferred mineral resource, a measured mineral resource may be converted to a proven mineral reserve or to a probable mineral reserve. | |||||||||||
| Greenfield project | the development of a new project | Indicated mineral resource | is that part of a mineral resource for which quantity and grade or quality are estimated on the basis of adequate geological evidence and sampling. The level of geological certainty associated with an indicated mineral resource is sufficient to allow a qualified person to apply modifying factors in sufficient detail to support mine planning and evaluation of the economic viability of the deposit. Because an indicated mineral resource has a lower level of confidence than the level of confidence of a measured mineral resource, an indicated mineral resource may only be converted to a probable mineral reserve. | |||||||||||
| Green steel | steel products subject to auditor verified certification of the CO2 savings achieved | Inferred mineral resource | is that part of a mineral resource for which quantity and grade or quality are estimated on the basis of limited geological evidence and sampling. The level of geological uncertainty associated with an inferred mineral resource is too high to apply relevant technical and economic factors likely to influence the prospects of economic extraction in a manner useful for evaluation of economic viability. Because an inferred mineral resource has the lowest level of geological confidence of all mineral resources, which prevents the application of the modifying factors in a manner useful for evaluation of economic viability, an inferred mineral resource may not be considered when assessing the economic viability of a mining project, and may not be converted to a mineral reserve. | |||||||||||
| Mineral reserve | is an estimate of tonnage and grade or quality of indicated and measured mineral resources that, in the opinion of the qualified person, can be the basis of an economically viable project. More specifically, it is the economically mineable part of a measured or indicated mineral resource, which includes diluting materials and allowances for losses that may occur when the material is mined or extracted. | |||||||||||||
| Proven mineral reserve | is the economically mineable part of a measured mineral resource and can only result from conversion of a measured mineral resource. | |||||||||||||
245
Exhibits
EXHIBIT INDEX
| Exhibit | Description | ||||
| Number | |||||
| 1.1 | Amended and Restated Articles of Association of ArcelorMittal dated April 28, 2023 available at Exhibit 1.1 | ||||
| 2.1 | The total amount of long-term debt securities authorized under any instrument does not exceed 10% of the total assets of ArcelorMittal and its subsidiaries on a consolidated basis. ArcelorMittal hereby agrees to furnish to the SEC, upon its request, a copy of any instrument defining the rights of holders of long-term debt of ArcelorMittal or of its subsidiaries for which consolidated or unconsolidated financial statements are required to be filed. | ||||
| 2.2 | Description of ArcelorMittal securities registered pursuant to Section 12 of the Securities Exchange Act of 1934 (filed as Exhibit 2.2) | ||||
| 4.1* | Shareholder’s agreement dated as of August 13, 1997 among Ispat International N.V., LNM Holdings S.L. (renamed Ispat International Investments S.L.) and Mr. Lakshmi N. Mittal (filed as Exhibit 4.3 to Mittal Steel Company N.V.’s annual report on Form 20-F for the year ended December 31, 2004 (File No. 001-14666), and incorporated by reference herein) and available at: http://www.sec.gov/Archives/edgar/data/1041989/000095012305003893/y07225exv4w3.txt. | ||||
| 4.2* | Memorandum of Understanding dated June 25, 2006 among Arcelor, Mittal Steel Company N.V. and Mr. and Mrs. Lakshmi N. Mittal (filed as Exhibit 99.1 to Mittal Steel Company N.V.’s report on Form 6-K (File No. 001-14666) filed with the Commission on June 29, 2006, and incorporated by reference herein) and available at: http://www.sec.gov/Archives/edgar/data/1041989/000090342306000774/mittal6k-ex991_0629.htm. | ||||
| 4.3* | Restricted Share Units and Performance Share Units Plan effective May 10, 2011 (filed as Exhibit 4.5 to ArcelorMittal’s annual report on Form 20-F filed on February 22, 2012 (File No. 333-146371), and incorporated by reference herein) and available at: http://www.sec.gov/Archives/edgar/data/1243429/000124342912000008/Exhibit4.5.htm. | ||||
| 4.4* | Supplemental Terms for 2018-2019 to the GMB PSU Plan effective May 9, 2018 (filed as Exhibit 4.13 to the annual report on Form 20-F filed on February 25, 2019) and available at http://www.sec.gov/Archives/edgar/data/1243429/000124342919000005/a2018exhibit413.htm. | ||||
| 4.5* | Supplemental Terms for 2018-2019 to the ArcelorMittal Equity Incentive Plan effective May 9, 2018 (filed as Exhibit 4.14 to the annual report on Form 20-F filed on February 25, 2019) and available at http://www.sec.gov/Archives/edgar/data/1243429/000124342919000005/a2018exhibit414.htm. | ||||
| 4.6* | Supplemental Terms for 2019-2020 Group Management Board Performance Share Units Plan effective December 12, 2019 (filed as Exhibit 4.14 to the annual report on Form 20-F filed on March 3, 2020) and available at https://www.sec.gov/Archives/edgar/data/1243429/000124342920000004/a2019exhibit414.htm | ||||
| 4.7* | Supplemental Terms for 2019-2020 Performance Share Units effective December 12, 2019 (filed as Exhibit 4.15 to the annual report on Form 20-F filed on March 3, 2020) and available at https://www.sec.gov/Archives/edgar/data/1243429/000124342920000004/a2019exhibit415.htm. | ||||
| 4.8* | Supplemental Terms for 2020-2021 Group Management Board Performance Share Units Plan effective December 12, 2020 (filed as Exhibit 4.13 to the annual report on Form 20-F filed on March 8, 2021) and available at https://www.sec.gov/Archives/edgar/data/1243429/000124342921000004/a2020exhibit413.htm | ||||
| 4.9* | Supplemental Terms for 2020-2021 Restricted Share Units and Performance Share Units effective December 12, 2020 (filed as Exhibit 4.14 to the annual report on Form 20-F filed on March 8, 2021) and available at https://www.sec.gov/Archives/edgar/data/1243429/000124342921000004/a2020exhibit414.htm | ||||
| 4.10* | Supplemental Terms for 2021-2022 Group Management Board Performance Share Units Plan effective June 8, 2021 (filed as Exhibit 4.13 to the annual report on Form 20-F filed on March 11, 2022) and available at https://www.sec.gov/Archives/edgar/data/1243429/000124342922000009/a2021exhibit413.htm | ||||
| 4.11* | Supplemental Terms for 2021-2022 Restricted Share Units and Performance Share Units effective June 8, 2021 (filed as Exhibit 4.14 to the annual report on Form 20-F filed on March 11, 2022) and available at https://www.sec.gov/Archives/edgar/data/1243429/000124342922000009/a2021exhibit414.htm | ||||
| 4.12* | ArcelorMittal Equity Incentive Plan effective June 8, 2021 (filed as Exhibit 4.15 to the annual report on Form 20-F filed on March 11, 2022) and available at https://www.sec.gov/Archives/edgar/data/1243429/000124342922000009/a2021exhibit415.htm | ||||
4.13* | Supplemental Terms for 2022-2023 Group Management Board Performance Share Unit Plan effective May 04, 2022 (filed as Exhibit 4.13 to the annual report on Form 20-F filed on March 8, 2023) and available at https://www.sec.gov/Archives/edgar/data/1243429/000124342923000005/a2022exhibit413final.htm | ||||
4.14* | Supplemental Terms for 2022-2023 Restricted Share Units and Performance Share Units effective May 04, 2022 (filed as Exhibit 4.14 to the annual report on Form 20-F filed on March 8, 2023) and available at https://www.sec.gov/Archives/edgar/data/1243429/000124342923000005/a2022exhibit414.htm | ||||
4.15 | Supplemental Terms for 2023-2024 Restricted Share Units and Performance Share Units effective May 02, 2023 and filed as Exhibit 4.15 | ||||
| 8.1 | List of Significant Subsidiaries available at Exhibit 8.1. | ||||
| 12.1 | Certifications of ArcelorMittal’s Chief Executive Officer and Chief Financial Officer pursuant to Rule 13a-14(a) under the Exchange Act and available at Exhibit 12.1. | ||||
| 13.1 | Certifications of ArcelorMittal’s Chief Executive Officer and Chief Financial Officer pursuant to Rule 13a-14(b) under the Exchange Act and Section 1350 of Chapter 63 of Title 18 of the United States Code and available at Exhibit 13.1. | ||||
246
| 15.1 | Consent of Ernst & Young S.A. available and at Exhibit 15.1. | ||||
| 15.2 | Consent of Deloitte Audit S.à r.l. available and at Exhibit 15.2 | ||||
| 15.3 | Mining consents for ArcelorMittal Mining Canada G.P. and available at Exhibit 15.3 | ||||
| 15.4 | Mining consents for Baffinland and available at Exhibit 15.4 | ||||
| 15.5 | Mining consent for Bosnia and available at Exhibit 15.5 | ||||
| 15.6 | Mining consents for Brazil and available at Exhibit 15.6 | ||||
| 15.7 | Mining consent for India and available at Exhibit 15.7 | ||||
15.8 | Mining consent for Liberia and available at Exhibit 15.8 | ||||
15.9 | Mining consents for Mexico (excluding Peña Colorada) and available at Exhibit 15.9 | ||||
15.10 | Mining consent for Peña Colorada and available at Exhibit 15.10 | ||||
15.11 | Mining consent for South Africa and available at Exhibit 15.11 | ||||
15.12 | Mining consents for Ukraine iron ore operations and available at Exhibit 15.12 | ||||
97.1 | Compensation recovery policy and available at Exhibit 97.1 | ||||
| 101.INS | XBRL Instance Document - the instance document does not appear in the Interactive Data File because its XBRL tags are embedded within the Inline XBRL document. | ||||
| 101.SCH | XBRL Taxonomy Extension Schema Document | ||||
| 101.CAL | Inline XBRL Taxonomy Extension Calculation Linkbase Document | ||||
| 101.DEF | Inline XBRL Taxonomy Extension Definition Linkbase Document | ||||
| 101.LAB | Inline XBRL Taxonomy Extension Label Linkbase Document | ||||
| 101.PRE | Inline XBRL Taxonomy Extension Presentation Linkbase Document | ||||
| 104 | Cover Page Interactive Data File (embedded within the Inline XBRL document and contained in Exhibit 101) | ||||
* Previously filed
247
SIGNATURES
The registrant hereby certifies that it meets all of the requirements for filing on Form 20-F and that it has duly caused and authorized the undersigned to sign this annual report on its behalf.
| ARCELORMITTAL | ||
| /s/ Henk Scheffer | ||
| Henk Scheffer | ||
| Company Secretary | ||
Date: February 28, 2024
248

REPORT OF INDEPENDENT REGISTERED PUBLIC ACCOUNTING FIRM
To the shareholders and the Board of Directors of ArcelorMittal
Opinion on the Financial Statements
We have audited the accompanying consolidated statements of financial position of ArcelorMittal and subsidiaries (the Company) as of December 31, 2023 and 2022, the related consolidated statements of operations, other comprehensive income, changes in equity and cash flows for each of the two years in the period ended December 31, 2023, and the related notes (collectively referred to as the "consolidated financial statements"). In our opinion, the consolidated financial statements present fairly, in all material respects, the financial position of the Company at December 31, 2023 and 2022, and the results of its operations and its cash flows for each of the two years in the period ended December 31, 2023, in conformity with International Financial Reporting Standards as issued by the International Accounting Standards Board.
We also have audited, in accordance with the standards of the Public Company Accounting Oversight Board (United States) (PCAOB), the Company’s internal control over financial reporting as of December 31, 2023, based on criteria established in Internal Control — Integrated Framework issued by the Committee of Sponsoring Organizations of the Treadway Commission (“2013 framework”) and our report dated February 28, 2024 expressed an adverse opinion thereon.
Basis for Opinion
These consolidated financial statements are the responsibility of the Company’s management. Our responsibility is to express an opinion on the Company’s consolidated financial statements based on our audits. We are a public accounting firm registered with the PCAOB and are required to be independent with respect to the Company in accordance with the U.S. federal securities laws and the applicable rules and regulations of the Securities and Exchange Commission and the PCAOB.
We conducted our audits in accordance with the standards of the PCAOB. Those standards require that we plan and perform the audit to obtain reasonable assurance about whether the consolidated financial statements are free of material misstatement, whether due to error or fraud. Our audits included performing procedures to assess the risks of material misstatement of the consolidated financial statements, whether due to error or fraud, and performing procedures that respond to those risks. Such procedures included examining, on a test basis, evidence regarding the amounts and disclosures in the consolidated financial statements. Our audits also included evaluating the accounting principles used and significant estimates made by management, as well as evaluating the overall presentation of the consolidated financial statements. We believe that our audits provide a reasonable basis for our opinion.
Critical Audit Matters
The critical audit matters communicated below are matters arising from the current period audit of the consolidated financial statements that were communicated or required to be communicated to the audit committee and that: (1) relate to accounts or disclosures that are material to the consolidated financial statements and (2) involved our especially challenging, subjective or complex judgments. The communication of critical audit matters does not alter in any way our opinion on the consolidated financial statements, taken as a whole, and we are not, by communicating the critical audit matters below, providing separate opinions on the critical audit matters or on the accounts or disclosures to which they relate.
250
Impairment of Goodwill, Intangible Assets and Property, Plant and Equipment
Description of the Matter | The goodwill, property, plant and equipment (“PP&E”) and intangible assets balances of the Company as of December 31, 2023, were $3,908 million, $33,656 million and $1,194 million, respectively. As explained in Note 5.3 to the consolidated financial statements, the Company recorded an impairment of goodwill of $194 million and of PP&E of $732 million, respectively, in relation to the ArcelorMittal Temirtau cash-generating unit (“CGU”), representing the Company’s operations in Kazakhstan, which was subsequently sold on December 7, 2023. In addition, as explained in Note 5.3 to the consolidated financial statements, as a result of the annual impairment assessment described below, the Company recorded an impairment of $112 million for PP&E, in relation to the Long Products CGU of ArcelorMittal South Africa. As explained in Note 5.3 to the consolidated financial statements, the Company’s evaluation of goodwill for impairment at the group of cash-generating units (“GCGU”) level, and PP&E as part of the relevant CGU, involves a comparison of the recoverable amount of each GCGU or CGU to the carrying amount. Except for the ArcelorMittal Temirtau CGU, discussed above, key assumptions that had a significant impact on the Company’s estimate of the recoverable amounts of GCGUs and CGUs, (“the Relevant GCGUs and CGUs”), included future volumes of shipments, future selling prices, variable costs and discount rate. Changes in these assumptions could have a significant impact on the recoverable amount of a GCGU or CGU. There are significant judgments made by management to estimate these assumptions, including as it relates to the impact of the war in Ukraine, both specifically on the Company’s Ukrainian operations, and more broadly, the impact of the war on the level of uncertainty associated with these assumptions. The estimate of the recoverable amount also considers the Company’s exposure to certain climate related risks, which affect the estimates of the future cash flows. Where there is a legal obligation in terms of carbon neutrality, the estimates of the future cash flows include the decarbonization capital expenditure expected to be necessary to maintain the level of economic benefits expected to be generated by the respective assets in the current condition. For the jurisdictions where there is no legal obligation for carbon neutrality, the decarbonization related uncertainty was reflected in the risk premiums in the discount rates applied to determine the present value of the estimated future cash flows. Auditing the recoverable amounts of the Relevant GCGUs and CGUs was complex and required a high degree of auditor judgement and an increased extent of effort, including the involvement of valuation specialists, due to the significant estimation uncertainty and subjective nature of the assumptions used in the estimates, as described above. | ||||
251
How We Addressed the Matter in Our Audit | We obtained an understanding, evaluated the design and tested the operating effectiveness of controls over management’s valuation methodology and assumptions used for the estimates of future cash flows. For example, we evaluated controls over the Company’s forecasting process used to develop the estimated future cash flows and controls over management’s data included in the estimated future cash flows. We evaluated management’s ability to reasonably estimate future cash flows by comparing actual results to management’s historical forecasts. As it relates to future volume of shipments, future selling prices and variable costs, we compared management’s estimates to available external third-party data regarding demand, selling prices and raw material prices. Specifically, as it relates to the estimate of the recoverable amount of ArcelorMittal Kryvyi Rih CGU (representing the Company’s operations in Ukraine), we evaluated the reasonableness of management’s assumption as it relates to the timing for the end of war and the length of the post-war recovery period, by independently developing a reasonable range of point estimates and comparing to management’s estimate. With the assistance of our valuation specialists, we evaluated the effects of climate-related matters, including their impact on risk premiums and discount rates by considering, among other factors, current legislation and regulations related to carbon emissions, as well as the Company’s ongoing initiatives to transition to lower-carbon operations. Also, as part of our procedures, we compared expected decarbonization capital expenditures against approved budgets and where applicable, costs incurred to date. With the assistance of our valuation specialists, we evaluated the discounted cash flows methodology and assessed the discount rates used in the value in use estimates, by comparing to underlying source information, testing the mathematical accuracy of the calculation, developing an independent range of estimates and comparing the discount rate selected by management to our range. We also evaluated the adequacy of the disclosures in note 5.3 of the consolidated financial statements. | ||||
Recoverability of Deferred Tax Assets (“DTAs”)
Description of the Matter | The DTA balance as of December 31, 2023, was $9,469 million, which is primarily related to the ArcelorMittal S.A. (parent company) tax integration. As explained in Note 10.4 to the consolidated financial statements, ArcelorMittal S.A. has DTAs primarily related to tax losses and other tax benefits carried forward. Under current tax law in Luxembourg, tax losses accumulated before January 1, 2017, do not expire and are recoverable against future taxable income. The assessment of the likelihood of future taxable profits being available, and specifically the length of the forecast periods utilized, requires significant management judgment. Auditing the recognition of ArcelorMittal S.A.’s DTA balances is subjective because the estimation requires significant judgment, including the availability of future taxable income against which tax deductions represented by the DTA can be offset. In addition, auditing the recognition of DTA balances that are supported by the expectation of future taxable income arising beyond ArcelorMittal S.A.’s 5-year planning horizon required significant auditor judgment and an increased effort. | ||||
252
How We Addressed the Matter in Our Audit | We obtained an understanding, evaluated the design and tested the operating effectiveness of controls over the Company’s assessment of the recoverability of deferred tax assets. For example, we tested controls over management’s review of the significant assumptions used in estimating the projections of future taxable income, including management’s analysis of the sensitivity of the length of the forecast periods to change, based on other reasonably likely outcomes that would have a material effect on the recoverability of DTAs. To test the recoverability of DTAs, among other procedures, we compared the projections of future taxable income with the actual results of prior periods and, separately, against other forecasted financial information prepared by the Company, such as that used in estimating the recoverable amounts of the Relevant GCGUs and CGUs as described in the ‘Impairment of Goodwill, Intangible Assets and Property, Plant and Equipment’ critical audit matter above. We assessed the Company’s evaluation of the length of the forecast periods to utilize the DTA by independently developing a reasonable range of point estimates and comparing to management’s estimate. Additionally, we tested the completeness and accuracy of the existing intragroup loan and external debt agreements used by management to forecast financial income, the primary input to future taxable income, and we performed sensitivity analyses over this forecast. Where relevant and with the assistance of our tax professionals, we also evaluated management’s proposed tax planning strategies, and potential tax implications of material current year transactions, such as acquisitions. We also evaluated the adequacy of the disclosures in Note 10.4 of the consolidated financial statements in respect of ArcelorMittal S.A.’s DTAs. | ||||
/s/ Ernst & Young
Société anonyme
Cabinet de révision agréé
We have served as the Company’s auditor since 2022.
February 28, 2024
253
REPORT OF INDEPENDENT REGISTERED PUBLIC ACCOUNTING FIRM
To the shareholders and the Board of Directors of ArcelorMittal
Opinion on the Financial Statements
We have audited the accompanying consolidated statement of operations, consolidated statement of other comprehensive income, consolidated statement of changes in equity, and consolidated statement of cash flows of ArcelorMittal and subsidiaries (the “Company”) for the year ended December 31, 2021, and the related notes (collectively referred to as the "consolidated financial statements"). In our opinion, the consolidated financial statements present fairly, in all material respects, the results of the Company’s operations and its cash flows for the year ended December 31, 2021, in conformity with International Financial Reporting Standards as issued by the International Accounting Standards Board.
Basis for Opinion
These consolidated financial statements are the responsibility of the Company’s management. Our responsibility is to express an opinion on the Company’s consolidated financial statements based on our audit. We are a public accounting firm registered with the PCAOB and are required to be independent with respect to the Company in accordance with the U.S. federal securities laws and the applicable rules and regulations of the Securities and Exchange Commission and the PCAOB.
We conducted our audit in accordance with the standards of the PCAOB. Those standards require that we plan and perform the audit to obtain reasonable assurance about whether the consolidated financial statements are free of material misstatement, whether due to error or fraud. Our audit included performing procedures to assess the risks of material misstatement of the consolidated financial statements, whether due to error or fraud, and performing procedures that respond to those risks. Such procedures included examining, on a test basis, evidence regarding the amounts and disclosures in the consolidated financial statements. Our audit also included evaluating the accounting principles used and significant estimates made by management, as well as evaluating the overall presentation of the consolidated financial statements. We believe that our audit provide a reasonable basis for our opinion.
/s/ Deloitte Audit S.à r.l.
March 11, 2022
We began serving as the Company’s auditor in 2007. In 2022 we became the predecessor auditor.
254
| Consolidated financial statements | ||
| ArcelorMittal and Subsidiaries | ||
| Consolidated Statements of Operations | ||
| (millions of U.S. dollar, except share and per share data) | ||
| Year ended December 31, | |||||||||||||||||||||||
| Notes | 2023 | 2022 | 2021 | ||||||||||||||||||||
| Sales | 4.1 and 12.1 | ||||||||||||||||||||||
(including | |||||||||||||||||||||||
| Cost of sales | 4.2 and 12.2 | ||||||||||||||||||||||
(including | |||||||||||||||||||||||
| Gross margin | |||||||||||||||||||||||
| Selling, general and administrative expenses | |||||||||||||||||||||||
| Operating income | |||||||||||||||||||||||
| Income from investments in associates, joint ventures and other investments | 2.6 | ||||||||||||||||||||||
Impairment of investments in associates, joint ventures and other investments | 2.4.4 and 2.6 | ( | |||||||||||||||||||||
| Financing costs - net | 6.2 | ( | ( | ( | |||||||||||||||||||
| Income before taxes | |||||||||||||||||||||||
| Income tax expense | 10.1 | ||||||||||||||||||||||
Net income (including non-controlling interests) | |||||||||||||||||||||||
Net income attributable to equity holders of the parent | |||||||||||||||||||||||
| Net income attributable to non-controlling interests | |||||||||||||||||||||||
Net income (including non-controlling interests) | |||||||||||||||||||||||
| Year ended December 31, | |||||||||||||||||||||||
| 2023 | 2022 | 2021 | |||||||||||||||||||||
Earnings per common share (in U.S. dollar) | |||||||||||||||||||||||
| Basic | |||||||||||||||||||||||
| Diluted | |||||||||||||||||||||||
| Weighted average common shares outstanding (in millions) | 11.3 | ||||||||||||||||||||||
| Basic | |||||||||||||||||||||||
| Diluted | |||||||||||||||||||||||
The accompanying notes are an integral part of these consolidated financial statements.
255
| Consolidated financial statements | ||
| ArcelorMittal and Subsidiaries | ||
| Consolidated Statements of Other Comprehensive Income | ||
| (millions of U.S. dollar, except share and per share data) | ||
| Year ended December 31, | |||||||||||||||||||||||||||||||||||
| 2023 | 2022 | 2021 | |||||||||||||||||||||||||||||||||
| Net income (including non-controlling interests) | |||||||||||||||||||||||||||||||||||
| Items that can be recycled to the consolidated statements of operations | |||||||||||||||||||||||||||||||||||
| Derivative financial instruments: | |||||||||||||||||||||||||||||||||||
| (Loss) gain arising during the period | ( | ||||||||||||||||||||||||||||||||||
| Reclassification adjustments for loss (gain) included in the consolidated statements of operations and financial position (basis adjustments) | ( | ( | |||||||||||||||||||||||||||||||||
| ( | ( | ||||||||||||||||||||||||||||||||||
| Exchange differences arising on translation of foreign operations: | |||||||||||||||||||||||||||||||||||
| Gain (loss) arising during the period | ( | ( | |||||||||||||||||||||||||||||||||
| Reclassification adjustments for loss included in the consolidated statements of operations | |||||||||||||||||||||||||||||||||||
| ( | ( | ||||||||||||||||||||||||||||||||||
| Share of other comprehensive income related to associates and joint ventures | |||||||||||||||||||||||||||||||||||
| (Loss) gain arising during the period | ( | ||||||||||||||||||||||||||||||||||
| Reclassification adjustments for gain included in the consolidated statements of operations and financial position (basis adjustments) | ( | ( | ( | ||||||||||||||||||||||||||||||||
| ( | ( | ||||||||||||||||||||||||||||||||||
| Income tax benefit (expense) related to components of other comprehensive income that can be recycled to the consolidated statements of operations | ( | ( | |||||||||||||||||||||||||||||||||
| Items that cannot be recycled to the consolidated statements of operations | |||||||||||||||||||||||||||||||||||
| Investments in equity instruments at FVOCI: | |||||||||||||||||||||||||||||||||||
| (Loss) gain arising during the period | ( | ( | |||||||||||||||||||||||||||||||||
| Share of other comprehensive gain (loss) related to associates and joint ventures | ( | ( | |||||||||||||||||||||||||||||||||
| ( | ( | ||||||||||||||||||||||||||||||||||
| Employee benefits - Recognized actuarial (loss) gain | ( | ||||||||||||||||||||||||||||||||||
| Share of other comprehensive income related to associates and joint ventures | |||||||||||||||||||||||||||||||||||
| ( | |||||||||||||||||||||||||||||||||||
| Income tax benefit (expense) related to components of other comprehensive income (loss) that cannot be recycled to the consolidated statements of operations | ( | ( | |||||||||||||||||||||||||||||||||
| Total other comprehensive income (loss) | ( | ||||||||||||||||||||||||||||||||||
| Total other comprehensive income (loss) attributable to: | |||||||||||||||||||||||||||||||||||
| Equity holders of the parent | ( | ||||||||||||||||||||||||||||||||||
| Non-controlling interests | ( | ( | |||||||||||||||||||||||||||||||||
Total other comprehensive income (loss) | ( | ||||||||||||||||||||||||||||||||||
| Total comprehensive income | |||||||||||||||||||||||||||||||||||
| Total comprehensive income attributable to: | |||||||||||||||||||||||||||||||||||
| Equity holders of the parent | |||||||||||||||||||||||||||||||||||
| Non-controlling interests | |||||||||||||||||||||||||||||||||||
| Total comprehensive income | |||||||||||||||||||||||||||||||||||
The accompanying notes are an integral part of these consolidated financial statements.
256
| Consolidated financial statements | ||
| ArcelorMittal and Subsidiaries | ||
| Consolidated Statements of Financial Position | ||
| (millions of U.S. dollar, except share and per share data) | ||
| December 31, | |||||||||||||||||
| Notes | 2023 | 2022 | |||||||||||||||
| ASSETS | |||||||||||||||||
| Current assets: | |||||||||||||||||
| Cash and cash equivalents | 6.1.3 | ||||||||||||||||
| Restricted cash | 6.1.3 | ||||||||||||||||
Trade accounts receivable and other (including | 4.3 and 12.1 | ||||||||||||||||
| Inventories | 4.4 | ||||||||||||||||
| Prepaid expenses and other current assets | 4.5 | ||||||||||||||||
| Total current assets | |||||||||||||||||
| Non-current assets: | |||||||||||||||||
| Goodwill and intangible assets | 5.1 and 5.3 | ||||||||||||||||
| Property, plant and equipment and biological assets | 5.2, 5.3 and 7 | ||||||||||||||||
| Investments in associates and joint ventures | 2.4 | ||||||||||||||||
| Other investments | 2.5 | ||||||||||||||||
| Deferred tax assets | 10.4 | ||||||||||||||||
| Other assets | 4.6 | ||||||||||||||||
| Total non-current assets | |||||||||||||||||
| Total assets | |||||||||||||||||
| LIABILITIES AND EQUITY | |||||||||||||||||
| Current liabilities: | |||||||||||||||||
| Short-term debt and current portion of long-term debt | 6.1.2.1 and 7 | ||||||||||||||||
Trade accounts payable and other (including | 4.7 and 12.2 | ||||||||||||||||
| Short-term provisions | 9.1 | ||||||||||||||||
| Accrued expenses and other liabilities | 4.8 | ||||||||||||||||
| Income tax liabilities | |||||||||||||||||
| Total current liabilities | |||||||||||||||||
| Non-current liabilities: | |||||||||||||||||
| Long-term debt, net of current portion | 6.1.2.2 and 7 | ||||||||||||||||
| Deferred tax liabilities | 10.4 | ||||||||||||||||
| Deferred employee benefits | 8.2 | ||||||||||||||||
| Long-term provisions | 9.1 | ||||||||||||||||
| Other long-term obligations | 9.2 | ||||||||||||||||
| Total non-current liabilities | |||||||||||||||||
| Total liabilities | |||||||||||||||||
| Contingencies and commitments | 9.3 and 9.4 | ||||||||||||||||
| Equity: | 11 | ||||||||||||||||
Common shares (no par value, | |||||||||||||||||
Treasury shares ( | ( | ( | |||||||||||||||
| Additional paid-in capital | |||||||||||||||||
| Mandatorily convertible notes | 11.2 | ||||||||||||||||
| Retained earnings | |||||||||||||||||
| Reserves | ( | ( | |||||||||||||||
| Equity attributable to the equity holders of the parent | |||||||||||||||||
| Non-controlling interests | |||||||||||||||||
| Total equity | |||||||||||||||||
| Total liabilities and equity | |||||||||||||||||
257
| Consolidated financial statements | ||
| ArcelorMittal and Subsidiaries | ||
| Consolidated Statements of Changes in Equity | ||
| (millions of U.S. dollar, except share and per share data) | ||
| Reserves | |||||||||||||||||||||||||||||||||||||||||||||||||||||||||||||||||||||||||||||
| Items that can be recycled to the Consolidated Statements of Operations | Items that cannot be recycled to the Consolidated Statements of Operations | ||||||||||||||||||||||||||||||||||||||||||||||||||||||||||||||||||||||||||||
Shares1 | Share Capital | Treasury Shares | Mandatorily Convertible Notes | Additional Paid-in Capital | Retained Earnings | Foreign Currency Translation Adjustments | Unrealized Gains (Losses) on Derivative Financial Instruments relating to CFH | Unrealized Gains (Losses) on Investments in Equity Instruments at FVOCI | Recognized actuarial (losses) gains | Equity attributable to the equity holders of the parent | Non-controlling interests | Total Equity | |||||||||||||||||||||||||||||||||||||||||||||||||||||||||||||||||
| Balance at December 31, 2020 | ( | ( | ( | ||||||||||||||||||||||||||||||||||||||||||||||||||||||||||||||||||||||||||
| Net income (including non-controlling interests) | — | — | — | — | — | — | — | — | — | ||||||||||||||||||||||||||||||||||||||||||||||||||||||||||||||||||||
| Other comprehensive income (loss) | — | — | — | — | — | — | ( | ( | |||||||||||||||||||||||||||||||||||||||||||||||||||||||||||||||||||||
| Total comprehensive income (loss) | — | — | — | — | — | ( | |||||||||||||||||||||||||||||||||||||||||||||||||||||||||||||||||||||||
| Cancellation of shares (note 11.1) | — | ( | — | ( | — | — | — | — | — | — | — | ||||||||||||||||||||||||||||||||||||||||||||||||||||||||||||||||||
| Recognition of share-based payments (note 8.3) | — | — | — | — | — | — | — | — | |||||||||||||||||||||||||||||||||||||||||||||||||||||||||||||||||||||
| Mandatorily convertible notes (note 11.2) | — | — | — | ( | — | ( | — | — | — | — | ( | — | ( | ||||||||||||||||||||||||||||||||||||||||||||||||||||||||||||||||
| Share buyback (note 11.1) | ( | — | ( | — | — | — | — | — | — | — | ( | — | ( | ||||||||||||||||||||||||||||||||||||||||||||||||||||||||||||||||
| Dividend (notes 11.4 and 11.5) | — | — | — | — | — | ( | — | — | — | — | ( | ( | ( | ||||||||||||||||||||||||||||||||||||||||||||||||||||||||||||||||
| Put option NSI (note 11.5.2) | — | — | — | — | — | ( | — | — | — | — | ( | — | ( | ||||||||||||||||||||||||||||||||||||||||||||||||||||||||||||||||
| Divestment of Cleveland-Cliffs shares (note 2.5) | — | — | — | — | — | — | ( | — | — | — | |||||||||||||||||||||||||||||||||||||||||||||||||||||||||||||||||||
| Other movements | — | — | — | — | — | ( | — | — | — | — | ( | — | ( | ||||||||||||||||||||||||||||||||||||||||||||||||||||||||||||||||
| Balance at December 31, 2021 | ( | ( | ( | ||||||||||||||||||||||||||||||||||||||||||||||||||||||||||||||||||||||||||
| Net income (including non-controlling interests) | — | — | — | — | — | — | — | — | — | ||||||||||||||||||||||||||||||||||||||||||||||||||||||||||||||||||||
| Other comprehensive income (loss) | — | — | — | — | — | — | ( | ( | ( | ( | ( | ||||||||||||||||||||||||||||||||||||||||||||||||||||||||||||||||||
| Total comprehensive income (loss) | — | — | — | — | — | ( | ( | ||||||||||||||||||||||||||||||||||||||||||||||||||||||||||||||||||||||
| Cancellation of shares (note 11.1) | — | ( | — | ( | — | — | — | — | — | — | — | ||||||||||||||||||||||||||||||||||||||||||||||||||||||||||||||||||
| Recognition of share-based payments (note 8.3) | — | — | — | — | — | — | — | — | |||||||||||||||||||||||||||||||||||||||||||||||||||||||||||||||||||||
| Share buyback (note 11.1) | ( | — | ( | — | — | — | — | — | — | — | ( | — | ( | ||||||||||||||||||||||||||||||||||||||||||||||||||||||||||||||||
| Dividend (notes 11.4 and 11.5) | — | — | — | — | — | ( | — | — | — | — | ( | ( | ( | ||||||||||||||||||||||||||||||||||||||||||||||||||||||||||||||||
| Put option ArcelorMittal Texas HBI (note 2.2.4) | — | — | — | — | — | ( | — | — | — | — | ( | — | ( | ||||||||||||||||||||||||||||||||||||||||||||||||||||||||||||||||
| Non-controlling interests relating to acquisitions (note 2.2.4) | — | — | — | — | — | — | — | — | — | — | — | ||||||||||||||||||||||||||||||||||||||||||||||||||||||||||||||||||
| Capital increase ArcelorMittal Liberia (note 11.5.1) | — | — | — | — | — | ( | — | — | — | — | ( | ||||||||||||||||||||||||||||||||||||||||||||||||||||||||||||||||||
| Other movements | — | — | — | — | — | ( | — | — | ( | — | ( | ||||||||||||||||||||||||||||||||||||||||||||||||||||||||||||||||||
| Balance at December 31, 2022 | ( | ( | ( | ||||||||||||||||||||||||||||||||||||||||||||||||||||||||||||||||||||||||||
| Net income (including non-controlling interests) | — | — | — | — | — | — | — | — | — | ||||||||||||||||||||||||||||||||||||||||||||||||||||||||||||||||||||
| Other comprehensive income (loss) | — | — | — | — | — | — | ( | ( | ( | ||||||||||||||||||||||||||||||||||||||||||||||||||||||||||||||||||||
| Total comprehensive income (loss) | — | — | — | — | — | ( | ( | ( | |||||||||||||||||||||||||||||||||||||||||||||||||||||||||||||||||||||
| Cancellation of shares (note 11.1) | — | ( | — | ( | — | — | — | — | — | — | — | ||||||||||||||||||||||||||||||||||||||||||||||||||||||||||||||||||
| Conversion of mandatorily convertible notes (note 11.2) | — | ( | ( | — | — | — | — | — | — | ||||||||||||||||||||||||||||||||||||||||||||||||||||||||||||||||||||
| Recognition of share-based payments (note 8.3) | — | — | ( | — | — | — | — | — | — | ||||||||||||||||||||||||||||||||||||||||||||||||||||||||||||||||||||
| Share buyback (note 11.1) | ( | — | ( | — | — | — | — | — | — | — | ( | — | ( | ||||||||||||||||||||||||||||||||||||||||||||||||||||||||||||||||
| Dividend (notes 11.4 and 11.5) | — | — | — | — | — | ( | — | — | — | — | ( | ( | ( | ||||||||||||||||||||||||||||||||||||||||||||||||||||||||||||||||
| Disposal of Erdemir shares (note 2.5) | — | — | — | — | — | — | — | ( | — | — | — | ||||||||||||||||||||||||||||||||||||||||||||||||||||||||||||||||||
| Early redemption of mandatory convertible bonds (note 11.2) | — | — | — | — | — | ( | — | — | — | — | ( | ( | ( | ||||||||||||||||||||||||||||||||||||||||||||||||||||||||||||||||
| Mandatorily convertible bond extension (note 11.2) | — | — | — | — | — | — | — | — | — | — | — | ( | ( | ||||||||||||||||||||||||||||||||||||||||||||||||||||||||||||||||
| Capital increase ArcelorMittal Liberia (note 11.5.1) | — | — | — | — | — | ( | — | — | — | — | ( | ||||||||||||||||||||||||||||||||||||||||||||||||||||||||||||||||||
| Other movements | — | — | — | — | — | ( | — | — | — | — | ( | ( | |||||||||||||||||||||||||||||||||||||||||||||||||||||||||||||||||
| Balance at December 31, 2023 | ( | ( | ( | ( | |||||||||||||||||||||||||||||||||||||||||||||||||||||||||||||||||||||||||
The accompanying notes are an integral part of these consolidated financial statements.
258
| Consolidated financial statements | ||
| ArcelorMittal and Subsidiaries | ||
| Consolidated Statements of Cash Flows | ||
| (millions of U.S. dollar, except share and per share data) | ||
| Year ended December 31, | |||||||||||||||||||||||
| Notes | 2023 | 2022 | 2021 | ||||||||||||||||||||
| Operating activities: | |||||||||||||||||||||||
Net income (including non-controlling interests) | |||||||||||||||||||||||
Adjustments to reconcile net income to net cash provided by operations: | |||||||||||||||||||||||
Depreciation and amortization | 5.1 and 5.2 | ||||||||||||||||||||||
| Net impairment (reversal) charges | 5.3 | ( | |||||||||||||||||||||
| Bargain purchase gain | 2.2.4 | ( | |||||||||||||||||||||
Interest expense | 6.2 | ||||||||||||||||||||||
Interest income | 6.2 | ( | ( | ( | |||||||||||||||||||
| Income tax expense | 10.1 | ||||||||||||||||||||||
Net loss (gain) on disposal of subsidiaries | 2.3 | ( | |||||||||||||||||||||
Income from investments in associates, joint ventures and other investments | 2.6 | ( | ( | ( | |||||||||||||||||||
| Impairment on investments in associates, joint ventures and other investments | 2.6 | ||||||||||||||||||||||
| Provision on pensions and other post-employment benefits | 8.2 | ||||||||||||||||||||||
Change in fair value adjustment on call option on mandatory convertible bonds | 6.2 | ||||||||||||||||||||||
Unrealized foreign exchange effects | ( | ( | |||||||||||||||||||||
| Write-downs of inventories to net realizable value, provisions and other non-cash operating expenses net | 4.4 | ( | |||||||||||||||||||||
| Changes in assets and liabilities that provided (required) cash, net of acquisitions and disposals: | |||||||||||||||||||||||
Trade accounts receivable and other | 4.1 | ( | |||||||||||||||||||||
Inventories | 4.4 | ( | ( | ||||||||||||||||||||
Trade accounts payable and other | 4.7 | ( | ( | ||||||||||||||||||||
| VAT and other amounts (paid) received to/from public authorities | ( | ( | |||||||||||||||||||||
Other working capital and provisions movements | ( | ||||||||||||||||||||||
| Interest paid | ( | ( | ( | ||||||||||||||||||||
| Interest received | |||||||||||||||||||||||
| Income taxes paid | ( | ( | ( | ||||||||||||||||||||
| Dividends received from associates, joint ventures and other investments | |||||||||||||||||||||||
| Cash contributions to plan assets and benefits paid for pensions and other post-employment benefits | 8.2 | ( | ( | ( | |||||||||||||||||||
| Net cash provided by operating activities | |||||||||||||||||||||||
| Investing activities: | |||||||||||||||||||||||
Purchase of property, plant and equipment and intangibles | ( | ( | ( | ||||||||||||||||||||
Disposals of net assets of subsidiaries, net of cash disposed of | 2.3 | ( | |||||||||||||||||||||
Acquisitions of net assets of subsidiaries, net of cash acquired of | 2.2.4 | ( | ( | ( | |||||||||||||||||||
Disposals of property, plant and equipment and intangibles | 5.1 and 5.2 | ||||||||||||||||||||||
Acquisition of associates and joint ventures | 2.4 | ( | |||||||||||||||||||||
| Lease installments and capital expenditure refund relating to ArcelorMittal Italia acquisition | ( | ||||||||||||||||||||||
| Cash collateral for the TSR receivables retained in ArcelorMittal USA after disposal | 6.1.3 | ||||||||||||||||||||||
| Disposal of common and preferred Cleveland-Cliffs shares | 2.5 | ||||||||||||||||||||||
| (Acquisitions) disposals of financial assets | 2.5 | ( | ( | ||||||||||||||||||||
Other investing activities net | ( | ( | ( | ||||||||||||||||||||
| Net cash used in investing activities | ( | ( | ( | ||||||||||||||||||||
| Financing activities: | |||||||||||||||||||||||
Payments from mandatorily convertible subordinated notes/ mandatorily convertible bonds | 11.2 | ( | ( | ||||||||||||||||||||
Proceeds from short-term debt | 6.1.3 | ||||||||||||||||||||||
Proceeds from long-term debt | 6.1.3 | ||||||||||||||||||||||
Payments of short-term debt | 6.1.3 | ( | ( | ( | |||||||||||||||||||
Payments of long-term debt | 6.1.3 | ( | ( | ||||||||||||||||||||
Share buyback | 11.1 | ( | ( | ( | |||||||||||||||||||
Dividends paid (includes | ( | ( | ( | ||||||||||||||||||||
| Repayment of cash pooling liability to Acciaierie d'Italia | 2.3 | ( | |||||||||||||||||||||
Payment of principal portion of lease liabilities and other financing activities | 6.1.3 | ( | ( | ( | |||||||||||||||||||
| Net cash used in financing activities | ( | ( | ( | ||||||||||||||||||||
Net (decrease) increase in cash and cash equivalents | ( | ( | |||||||||||||||||||||
Effect of exchange rate changes on cash | ( | ( | |||||||||||||||||||||
| Cash and cash equivalents: | |||||||||||||||||||||||
| At the beginning of the year | |||||||||||||||||||||||
Reclassification of the period-end cash and cash equivalents from held for sale | 2.3 | ||||||||||||||||||||||
| At the end of the year | |||||||||||||||||||||||
The accompanying notes are an integral part of these consolidated financial statements.
259
| Consolidated financial statements | ||
| (millions of U.S. dollar, except share and per share data) | ||
SUMMARY OF NOTES TO CONSOLIDATED FINANCIAL STATEMENTS
| NOTE 1: ACCOUNTING PRINCIPLES | |||||
| 1.1 | Basis of presentation | ||||
| 1.2 | Climate change disclosures | ||||
| 1.3 | Use of judgment and estimates | ||||
| 1.4 | Accounting standards applied | ||||
| NOTE 2: SCOPE OF CONSOLIDATION | |||||
| 2.1 | Basis of consolidation | ||||
| 2.2 | Investments in subsidiaries | ||||
| 2.3 | Divestments and assets held for sale | ||||
| 2.4 | Investments in associates and joint arrangements | ||||
| 2.5 | Other investments | ||||
| 2.6 | Income (loss) from investments in associates, joint ventures and other investments | ||||
| NOTE 3: SEGMENT REPORTING | |||||
| 3.1 | Reportable segments | ||||
| 3.2 | Geographical information | ||||
| 3.3 | Sales by type of products | ||||
| 3.4 | Disaggregated revenue | ||||
| NOTE 4: OPERATING DATA | |||||
| 4.1 | Revenue | ||||
| 4.2 | Cost of sales | ||||
| 4.3 | Trade accounts receivable and other | ||||
| 4.4 | Inventories | ||||
| 4.5 | Prepaid expenses and other current assets | ||||
| 4.6 | Other assets | ||||
| 4.7 | Trade accounts payable and other | ||||
| 4.8 | Accrued expenses and other liabilities | ||||
| NOTE 5: GOODWILL, INTANGIBLE AND TANGIBLE ASSETS | |||||
| 5.1 | Goodwill and intangible assets | ||||
| 5.2 | Property, plant and equipment and biological assets | ||||
| 5.3 | Impairment of intangible assets, including goodwill, and tangible assets | ||||
| NOTE 6: FINANCING AND FINANCIAL INSTRUMENTS | |||||
| 6.1 | Financial assets and liabilities | ||||
| 6.2 | Financing costs - net | ||||
| 6.3 | Risk management policy | ||||
| NOTE 7: LEASES | |||||
| NOTE 8: PERSONNEL EXPENSES AND DEFERRED EMPLOYEE BENEFITS | |||||
| 8.1 | Employees and key management personnel | ||||
| 8.2 | Deferred employee benefits | ||||
| 8.3 | Share-based payments | ||||
| NOTE 9: PROVISIONS, CONTINGENCIES AND COMMITMENTS | |||||
| 9.1 | Provisions | ||||
| 9.2 | Other long-term obligations | ||||
| 9.3 | Contingent liabilities | ||||
| 9.4 | Commitments | ||||
260
| Consolidated financial statements | ||
| (millions of U.S. dollar, except share and per share data) | ||
| NOTE 10: INCOME TAXES | |||||
| 10.1 | Income tax expense | ||||
| 10.2 | Income tax recorded directly in equity and/or other comprehensive income | ||||
| 10.3 | Uncertain tax positions | ||||
| 10.4 | Deferred tax assets and liabilities | ||||
| 10.5 | Tax losses, tax credits and other tax benefits carried forward | ||||
| NOTE 11: EQUITY | |||||
| 11.1 | Share details | ||||
| 11.2 | Equity instruments and hybrid instruments | ||||
| 11.3 | Earnings per common share | ||||
| 11.4 | Dividends | ||||
| 11.5 | Non-controlling interests | ||||
| NOTE 12: RELATED PARTIES | |||||
| 12.1 | Sales and trade receivables | ||||
| 12.2 | Purchases and trade payables | ||||
| 12.3 | Other transactions with related parties | ||||
261
| Consolidated financial statements | ||
| (millions of U.S. dollar, except share and per share data) | ||
NOTE 1: ACCOUNTING PRINCIPLES
The consolidated financial statements have been prepared on a historical cost basis, except for equity instruments and certain trade receivables at fair value through other comprehensive income ("FVOCI"), financial assets at fair value through profit or loss ("FVTPL"), derivative financial instruments and biological assets, which are measured at fair value less cost to sell, inventories, which are measured at the lower of net realizable value or cost, and the financial statements of the Company’s Venezuelan tubular production facilities Industrias Unicon CA (“Unicon”) and the Company's Argentinian operation Acindar Industria Argentina de Aceros S.A. ("Acindar"), for which hyperinflationary accounting is applied (see note 2.2.2). The consolidated financial statements have been prepared in accordance with International Financial Reporting Standards (“IFRS”) as issued by the International Accounting Standards Board (“IASB”) and are presented in U.S. dollar with all amounts rounded to the nearest million, except for share and per share data.
1.2 Climate change disclosures
The Company continues to develop its assessment of the potential impacts of climate change and the transition to a low
carbon economy and has considered such impacts when preparing its consolidated financial statements. ArcelorMittal's decarbonization strategy aims to achieve carbon neutrality by 2050 in line with the United Nations' Paris agreement. By 2030, the Company is targeting a 25 % reduction in its CO2 emissions intensity across its global steel and mining operations, with an increased European target of 35 %. Both targets cover both scope 1 and 2. The Company's decarbonization roadmap is broken down by country, plant and project to achieve the Company's objectives and features five sets of actions and initiatives that act as stepping-stones toward the goal of achieving net-zero carbon emissions by 2050:
•Transforming the Company's steelmaking assets: this involves switching where applicable from the BF-BOF ("Blast Furnace-Basic Oxygen Furnace") to low-carbon steelmaking technologies through the DRI ("Direct Reduced Iron") and from iron ore preparation in the sinter plant (using heat or pressure to compact a material) to the pellet plant (which compresses or moulds the iron material into the shape of a pellet). Ironmaking with pellets in the DRI is usually coupled with an EAF ("Electric Arc Furnace"). To achieve its 2030 global carbon emissions intensity reduction target, ArcelorMittal has estimated the gross capital cost required to be approximately 10 billion, with the expectation that public funding covers 50 % of the total cost of decarbonization, addressing both capital expenditures and the higher operating expenditures. The Company lists below the main announced or ongoing projects:
262
| Consolidated financial statements | ||
| (millions of U.S. dollar, except share and per share data) | ||
Hamilton (Canada) | In October 2022, ArcelorMittal, broke ground on its decarbonization project (the governments of Canada and Ontario having committed CAD$ | ||||
Gijón and Sestao (Spain) | ArcelorMittal is planning to invest € | ||||
Hamburg (Germany) | ArcelorMittal already operates Europe’s only DRI-EAF plant in Hamburg, where the switch to using hydrogen instead of natural gas in the iron ore reduction process is being prepared. The Company is planning to test the ability of hydrogen DRI on an industrial scale, as well as testing carbon-free DRI in the EAF steelmaking process. The European Commission approved € | ||||
Dunkirk(France) | In Dunkirk, ArcelorMittal would build a | ||||
Bremen and Eisenhüttenstadt (Germany) | ArcelorMittal is developing a project to build a large-scale industrial plant for the DRI based steelmaking at its site in Bremen, as well as EAFs in Bremen and Eisenhüttenstadt, following the announcement of the planned expansion of Germany’s hydrogen infrastructure and alongside its existing H2 Hamburg project. In February 2024, the Company received the European Commission's approval of € | ||||
| Ghent (Belgium) | ArcelorMittal Belgium is planning to build a | ||||
•Increasing the proportion of scrap used in the steelmaking process: the Company can increase the use of low-quality scrap in the BF-BOF steelmaking process by improving steel scrap sorting and classification, installing scrap pre-melting technology, and adjusting the steelmaking process to accommodate scrap. In 2022 and 2023, the Company completed the acquisition of three specialist scrap metal recyclers as the Company continually seeks to enhance its ability to source scrap steel (see note 2.2.4).
•Transforming the energy used in the steelmaking process: this is expected to involve shifting to one or a combination of three alternatives: clean electricity (which could be in the form of green hydrogen), carbon capture usage ("CCU") coupled with carbon capture storage ("CCS") to ensure no carbon is emitted, and use of circular carbon either through natural or synthetic carbon cycles. In November 2023, industrial production of ethanol commenced at ArcelorMittal’s commercial flagship carbon capture and utilization facility in Ghent, Belgium. The €200 million Steelanol facility is a first of its kind for the European steel industry, deploying technology developed by leading carbon utilization company LanzaTech. This facility captures
carbon-rich waste gases from steelmaking and biologically convert them into advanced ethanol through LanzaTech’s biobased process. The facility not only reduces CO2 emissions at the plant by 125,000 tonnes per year, but also results in the production of 80 million liters of bio-ethanol per annum, which can be blended with traditional gasoline as a low-carbon alternative fuel for the transport sector.
•Investing in clean electricity used in the steelmaking process: The Company plans to look for more and varied opportunities in the renewables sector to provide sufficient access to clean energy at affordable prices, purchase renewable energy certificates and make more use of direct power purchase agreements with suppliers from renewables projects. In March 2022, ArcelorMittal announced that it had established a strategic partnership with Greenko Group, India’s leading energy transition company, to develop a ‘round the clock’ renewable energy project with 975 MW of nominal capacity. The 0.6 billion project with commissioning expected by mid-2024 will combine solar and wind power and be supported by Greenko’s hydro pumped storage project, which helps to
263
264 Consolidated financial statements | ||
overcome the intermittent nature of wind and solar power generation. The project provides for 250 MW of uninterrupted renewable power to be supplied annually to AMNS India (ArcelorMittal’s joint venture company in India) resulting in over 20 % of the electricity requirement at AMNS India’s Hazira plant coming from renewable sources, reducing carbon emissions by approximately 1.5 million tonnes per year. In May 2023, ArcelorMittal formed a joint venture with Casa dos Ventos, one of Brazil’s largest developers and producers of renewable energy projects, to develop a 554 MW wind power project aiming to secure and decarbonize a considerable proportion of the Company's wholly-owned subsidiary ArcelorMittal Brasil’s future electricity needs.
•Offsetting residual emissions: For these residual emissions, which today the Company estimates will be 5 % - 10 % of today’s emissions, ArcelorMittal plans to buy high-quality offsets or launch projects to generate high-quality carbon credits that would not have happened without the Company’s intervention.
ArcelorMittal's decarbonization strategy in each part of the world where the Company operates is now based on the same
assumptions in terms of green hydrogen cost, CCS or introduction of climate-friendly policies. In some countries, particularly in the EU and Canada, the Company sees sufficient policy incentives to enable it to ‘Accelerate’ its decarbonization plans. Where these conditions do not yet exist, ArcelorMittal will continue to make improvements to ‘Move’ but it is difficult to ‘Accelerate’ without becoming uncompetitive in that market
Considering the risks related to climate change and the Company's commitment established under the Paris agreement, ArcelorMittal provides explicit information in the notes to these consolidated financial statements regarding how climate change affects the Company's financial information. The Company presents below the references to the various notes where issues associated with climate change are addressed:
| Topic | Note | Content | ||||||
| Estimate and judgment | Note 1.3 Use of judgment and estimates | Judgments and estimates made in assessing the impact of climate change and the transition to a low carbon economy: useful lives of property, plant and equipment, estimates of future cash flow projections for impairment of non-financial assets, decommissioning costs | ||||||
| Sustainable investment | •Note 2.2.4 Acquisitions •Note 2.4.1 Joint ventures •Note 2.5 Other investments •Note 5.2 Property, plant and equipment and biological assets | Investments in renewable energy projects, scrap metal recycling businesses and breakthrough technologies through ArcelorMittal XCarb® Innovation Fund | ||||||
| Measurement of non-financial assets | Note 5.1 Goodwill and intangible assets | Recognition and measurement of emission rights | ||||||
| Note 5.2 Property, plant and equipment and biological assets | Residual useful lives of certain assets, capital expenditures with respect to decarbonization strategy | |||||||
Note 5.3 Impairment of intangible assets, including goodwill, and tangible assets | Inclusion of climate-related risks in the assumptions for impairment testing | |||||||
| Provisions | Note 9.1 Provisions | Recognition of emission obligations | ||||||
| Share-based payments | Note 8.3 Share-based payments | Description of equity incentive plans requiring achievement of specific climate-related targets | ||||||
The preparation of consolidated financial statements in conformity with IFRS recognition and measurement principles and, in particular, making the critical accounting judgments requires the use of estimates and assumptions that affect the reported amounts of assets, liabilities, revenues and expenses. Management reviews its estimates on an ongoing basis using currently available information. Changes in facts and circumstances or obtaining new information or more experience
may result in revised estimates, and actual results could differ from those estimates.
The following summary provides further information about the Company’s critical accounting policies under which significant judgments, estimates and assumptions are made. It should be read in conjunction with the notes mentioned in the summary:
Deferred tax assets (note 10.4): The Company assesses the recoverability of deferred tax assets based on future taxable income projections, which are inherently uncertain and may be
264
| Consolidated financial statements | ||
| (millions of U.S. dollar, except share and per share data) | ||
subject to changes over time. Judgment is required to assess the impact of such changes on the measurement of these assets and the time frame for their utilization. In addition, the Company applies judgment to recognize income tax liabilities when they are probable and can be reasonably estimated depending on the interpretation, which may be uncertain, of applicable tax laws and regulations. ArcelorMittal periodically reviews its estimates to reflect changes in facts and circumstances.
Provisions for pensions and other post-employment benefits (note 8.2): Benefit obligations and plan assets can be subject to significant volatility, in particular due to changes in market conditions and actuarial assumptions. Such assumptions differ by plan, take local conditions into account and include discount rates, expected rates of compensation increases, health care cost trend rates, mortality and retirement rates. They are determined following a formal process involving the Company's expertise and independent actuaries. Assumptions are reviewed annually and adjusted following actuarial and experience changes.
Provisions (note 9): Provisions, which result from legal or constructive obligations arising as a result of past events, are recognized based on the Company's, and in certain instances, third-party's best estimate of costs when the obligation arises. They are reviewed periodically to take into consideration changes in laws and regulations and underlying facts and circumstances.
Impairment of tangible and intangible assets, including goodwill (note 5.3): In order to assess the recoverable amount of tangible and intangible assets at cash-generating unit ("CGU") level and of goodwill at group of cash-generating unit ("GCGU") level, the Company mainly determines their value in use on the basis of the present value of cash flow projections. The estimates, judgments and assumptions applied for the value in use calculations relate primarily to growth rates, expected changes to average selling prices, shipments and direct costs. Assumptions for average selling prices and shipments are based on historical experience and expectations of future changes in the market. When determining value in use, management also applies judgement when assessing whether cash flows expected to arise to achieve sustainability and decarbonization targets are deemed to maintain the same level of economic benefits or whether they improve or enhance the asset's performance (see also below judgments and estimates made in assessing the impact of climate change and the transition to a low carbon economy). Discount rates are reviewed annually.
Impairment of associates and joint ventures (note 2.4.4.): Whenever there is an indication of impairment related to investments accounted for under the equity method, the
Company performs an impairment test based, amongst others, on an estimate of its share in the present value of the projected future cash flows expected to be generated by operations of associates and joint ventures and, similarly to impairment testing of tangible and intangible assets, including goodwill, the estimates, judgments and assumptions applied for the value in use calculations relate primarily to growth rates, expected changes to average selling prices, shipments and direct costs. Assumptions for average selling prices and shipments are based on historical experience and expectations of future changes in the market.
Business combinations (note 2.2.3): Assets acquired and liabilities assumed as part of a business combination are recorded at their acquisition-date fair values. Similarly, consideration including consideration receivable and contingent consideration is measured at fair value. In connection with each of its acquisitions, the Company undertakes a process to identify all assets and liabilities acquired, including intangible assets. Determining the fair value of identifiable assets and liabilities requires the use of valuation techniques which may include judgment and estimates and which may affect the allocation of the amount of consideration paid to the assets and liabilities acquired and goodwill or gain from a bargain purchase recorded as part of the business combination. Estimated fair values are based on information available at acquisition date and on expectations and assumptions that have been deemed reasonable by management. There are several methods that can be used to determine the fair value of assets acquired and liabilities assumed. The "income approach" is based on the forecast of the expected future cash flows adjusted to present value by applying an appropriate discount rate that reflects the risk factors associated with the cash flow streams. Some of the more significant estimates and assumptions inherent in the income method or other methods include the amount and timing of projected future cash flows; the discount rate selected to measure the risks inherent in the future cash flows (weighted average cost of capital); the assessment of the asset's life cycle and the competitive trends impacting the asset, including consideration of any technical, legal, regulatory or economic barriers to entry. The "cost approach" estimates the value of an asset based on the current cost to reproduce of replace the asset. Replacement cost is determined based on market data subsequently adjusted for physical, functional and economic obsolescence. The most common purchase accounting adjustments relate to the following assets and liabilities:
•The fair value of identifiable intangible assets (generally patents, customer relationships, technology, brand or favorable contracts) is estimated based on the above-mentioned income approach;
265
| Consolidated financial statements | ||
| (millions of U.S. dollar, except share and per share data) | ||
•Property, plant and equipment is recorded at market value, or, if not available, depreciated replacement cost;
•The fair value of pension and other post-employment benefits is determined separately for each plan using actuarial assumptions valid as of the acquisition date relating to the population of employees involved and the fair value of plan assets.
•Inventories are estimated based on expected selling prices at the date of acquisition reduced by an estimate of selling expenses and a normal profit margin.
•Adjustments to deferred tax assets and liabilities of the acquiree are recorded to reflect the deferred tax effects of the fair value adjustments relating to identifiable assets and liabilities other than goodwill.
Determining the estimated residual useful lives of tangible and intangible assets acquired requires judgement and certain intangible assets may be considered to have indefinite useful lives.
Financial instruments (note 6.1.5) and financial amounts receivable (note 4.5 and 4.6): Certain of the Company's financial instruments are classified as Level 3 as they include unobservable inputs.
Mineral reserve and resource estimates (note 5.2): Proven iron ore reserves are those quantities whose recoverability can be determined with reasonable certainty from a given date forward and under existing government regulations, economic and operating conditions; probable reserves have a lower degree of assurance but high enough to assume continuity between points of observation. Mineral resource estimates constitute the part of a mineral deposit that have the potential to be economically and legally extracted or produced at the time of the resource determination. The potential for economic viability is established through qualitative evaluation of relevant technical and economic factors likely to influence the prospect of economic extraction. A measured mineral resource is that part of a mineral resource for which quantity, grade or quality, densities, shape, and physical characteristics are so well established that they can be estimated with confidence sufficient to allow the appropriate application of technical and economic parameters, to support production planning and evaluation of the economic viability of the deposit. The estimate is based on detailed and reliable exploration, sampling and testing information gathered through appropriate techniques from locations such as outcrops, trenches, pits, workings and drill holes that are spaced closely enough to confirm both geological and grade continuity. An indicated mineral resource is that part of a mineral resource for which quantity, grade or quality, densities, shape and physical
characteristics, can be estimated with a level of confidence sufficient to allow the appropriate application of technical and economic parameters, to support mine planning and evaluation of the economic viability of the deposit. The estimate is based on detailed and reliable exploration sampling and testing information gathered through appropriate techniques from locations such as outcrops, trenches, pits, workings and drill holes that are spaced closely enough for geological and grade continuity to be reasonably assumed. An inferred mineral resource is that part of a mineral resource for which quantity and grade or quality can be estimated on the basis of geological evidence and limited sampling, and reasonably assumed but not verified geological and grade continuity. The estimate is based on limited information and sampling gathered through appropriate techniques from locations such as outcrops, trenches, pits, workings and drill holes. Estimates of mineral reserves and resources and the estimates of mine life have been prepared by ArcelorMittal experienced engineers and geologists and detailed independent verifications of the methods and procedures are conducted on a regular basis by external consultants. Reserves and resources are updated annually and calculated using a reference price duly adjusted for quality, ore content, logistics and other considerations. In order to estimate reserves and resources, estimates are required for a range of geological, technical and economic factors, including quantities, grades, production techniques, recovery rates, production costs, transport costs, commodity demand, commodity prices and exchange rates. Estimating the quantity and/or grade of reserves and resources requires the size, shape and depth of ore bodies to be determined by analyzing geological data such as drilling samples. This process may require complex and difficult geological judgments to interpret the data. Because the economic assumptions used to estimate reserves and resources change from period to period, and because additional geological data is generated during the course of operations, estimates of reserves and resources may change from period to period.
Judgments and estimates made in assessing the impact of climate change and the transition to a low carbon economy
Assumptions in respect of climate change and the transition to a low carbon economy may impact the Company’s significant judgements and key estimates and result in material changes to financial results and the carrying values of certain assets and liabilities in future reporting periods. The main judgements and estimates made by ArcelorMittal when preparing the 2023 consolidated financial statements related to the expected effects of climate change and the transition to a low carbon economy are described below.
•Property, plant and equipment: Considering the expected date of retirement of some assets in particular certain blast furnaces, basic oxygen furnaces, sinter plants and coke plants following investments in low-carbon steelmaking
266
| Consolidated financial statements | ||
| (millions of U.S. dollar, except share and per share data) | ||
technologies, the Company decreased estimates of residual useful lives of such items of property, plant and equipment for its flat steel operations in the EU and in Canada.
•Impairment of tangible and intangible assets, including goodwill: Value in use calculations relating to flat steel operations in the EU and in Canada, which apply the BF-BOF route, include the impact of decarbonization at the level of cash flow projections as decarbonization is necessary to maintain the level of economic benefits expected to arise from the assets in their current condition considering the legal obligation of carbon neutrality for these operations; accordingly the Company developed assumptions in determining related capital expenditures which reflect announced commitments and initiatives in place, costs associated with operating the new technologies which are expected to be deployed in the short to medium term, commodity prices and carbon emission costs on the basis of historical experience and expectations of future changes. This requires to assess the future development in supply, technology change, production changes and other important factors. For other operations, discount rates are increased to include a risk premium relative to the future estimated decarbonization cost. Due to economic developments, uncertainties over the pace of transition to low-emission technologies, political and environmental actions that will be taken to meet the carbon reduction goals, regulatory changes and emissions activity arising from climate-related matters, the Company’s assumptions used in the recoverable amount calculations, such as capital expenditure, carbon emission costs, level of public funding and other assumptions are inherently uncertain, which could result in significant changes to value in use calculations in future periods and affect impairment assessments.
•Decommissioning costs: Over the next ten years, the retirement of certain above-mentioned assets in the context of the transition to low-carbon steelmaking infrastructures may lead to certain decommissioning costs. The Company considered such costs in its value in use calculations but it has not recognized decommissioning provisions related to decarbonization as the obligating event has not occurred yet. Decommissioning cost estimates are based on the known regulatory and external environment. These cost estimates may change in the future including as a result of the transition to a lower carbon economy.
Situation in Ukraine and collateral consequences
The Company's operations in Ukraine consist of a steel plant, which produced 1.0 million tonnes of steel in 2023 (1.2 million tonnes in 2022), and (captive) mines that produced 4.6 million tonnes of iron ore in 2023 (4.9 million tonnes in 2022); the related property, plant and equipment had a carrying value of
Following the war outbreak on February 24, 2022, the Company idled its Ukrainian operations on March 3, 2022 but restarted blast furnace No.6 (one of the three blast furnaces representing approximately 20 % of ArcelorMittal's Kryvyi Rih ("AMKR") pig iron capacity) on April 11, 2022 to resume low levels of pig iron production. Iron ore production was approximately at 55 % of capacity during the first half of 2022. During the third quarter, iron ore production was temporarily suspended due to weaker demand and logistic constraints but restarted in early October 2022 at approximately 25 % level. During the first half of 2023, the Company continued to ramp up operations and has been operating two of three blast furnaces until end of May 2023 following the restart of blast furnace No.8 on April 14, 2023. On June 6, 2023, following the destruction of the Nova Kakhovka reservoir's dam, AMKR temporarily suspended steelmaking and production of rolled products to reduce water consumption. As a result, the Company shut down blast furnace No.6 slightly earlier than planned for a major planned repair but continued to operate blast furnace No.8. In July 2023, AMKR announced that it had completed the construction of a new pumping station and 5 kilometers pipeline to supply water to the city and to ensure full coverage of its production needs. AMKR is currently operating its mining and steel facilities at 45 % and 30 %, respectively. ArcelorMittal continued to exercise control over its Ukrainian operations and key production assets have not been seriously damaged at the date of this report. In addition, despite the lower level of activity, none of the assets are held for sale or were discontinued
In the context of the annual impairment test of intangible assets, including goodwill, and tangible assets, the Company revised its future cash flow projections and considering that there is significant uncertainty about the evolution of the geopolitical context in Ukraine and the timing and ability for the Company to resume production to a normal level, which resulted in a substantial increase in the discount rate, ArcelorMittal recognized in 2022 a 1,026 impairment loss of property, plant and equipment and intangibles (see note 5.3). In 2023, the Company revised its value in use calculation and timing expectations regarding return to pre-war conditions. It applied separate discount rates over the discrete projections period, including a higher country risk premium for the cash flow projections until the end of 2024 and a return to a pre-war country risk premium after 2024 and for the terminal value calculation as value in use is sensitive to a difference in country
267
| Consolidated financial statements | ||
| (millions of U.S. dollar, except share and per share data) | ||
risk for different periods. It concluded that the recoverable amount remains in excess of the carrying amount. Conversely, if the ongoing conflict between Russia and Ukraine persists, it could continue to have a material effect on the overall macroeconomic environment potentially affecting steel and iron ore demand and prices as well as energy costs. It could also result in further reduced production, sales and income with respect to the Company's Ukrainian operations thus increasing the risk that the Company may need to record an additional impairment charge with respect to such operations in the future.
The increased geopolitical risks induced by the war in Ukraine have adversely impacted global macroeconomic conditions leading to inflationary pressure, rising interest rates and energy costs since early 2022. In 2023, while energy prices declined and inflationary pressure started to dissipate, high interest rates continued to constrain activity. As of October 1, 2023, when goodwill was tested for impairment, discount rates applied for value in use calculations included a higher risk-free rate as compared to October 1, 2022. The Company sees signs of improvement of apparent demand conditions as the destocking phase reaches maturity and remains focused on executing its strategic growth and decarbonization projects.
268
| Consolidated financial statements | ||
| (millions of U.S. dollar, except share and per share data) | ||
1.4 Accounting standards applied
1.4.1 Adoption of new IFRS standards, amendments and interpretations applicable from January 1, 2023
On January 1, 2023, the Company adopted IFRS 17 "Insurance Contracts", which is designed to achieve the goal of a consistent, principle-based accounting for insurance contracts. IFRS 17 requires insurance liabilities to be measured at a current fulfillment value and provides a more uniform measurement and presentation approach for all insurance contracts. IFRS 17 supersedes IFRS 4 "Insurance Contracts" and related interpretations. On June 25, 2020, the IASB issued amendments to IFRS 17, including a deferral of the effective date to periods beginning on or after January 1, 2023. IFRS 17 should be applied retrospectively unless impracticable, with earlier adoption permitted if both IFRS 15 "Revenue from Contracts with Customers" and IFRS 9 "Financial Instruments" have also been applied. On December 9, 2021, the IASB issued a narrow-scope amendment to the transition requirements of IFRS 17 for entities that first apply IFRS 17 and IFRS 9 at the same time whereby an entity is permitted to present comparative information about a financial asset as if the classification and measurement requirements of IFRS 9 had been applied to that financial asset before. As the Company does not issue insurance contracts and considering the limited extent of its reinsurance activities, the adoption of this standard did not have a material impact to the Company's consolidated financial statements.
In addition, on January 1, 2023, the Company adopted the following amendments:
•Amendments to IAS 8. The amendments clarify the distinction between a change in accounting policies and a change in accounting estimates.
•Amendments to IAS 1 and IFRS Practice Statement 2. The amendments are intended to help preparers in deciding which accounting policies to disclose in their financial statements and gives further clarity on the materiality assessment of accounting policies. Changes in accounting policies are to be applied retrospectively while changes in accounting estimates are to be applied prospectively.
•Amendments to IAS 12 "Income Taxes" for deferred taxes related to assets and liabilities arising from a single transaction. The amendments clarify how to account for deferred tax on transactions such as leases and decommissioning obligations.
On May 23, 2023, the IASB issued 'International Tax Reform — Pillar Two Model Rules (Amendments to IAS 12)' to respond to stakeholders’ concerns about the potential implications of the imminent implementation of the OECD Pillar Two model rules on
the accounting for income taxes. As a mandatory temporary exception to the accounting for deferred taxes arising from the implementation of the Pillar Two model rules, an entity does not recognize and does not disclose information about deferred tax assets and liabilities related to the OECD Pillar Two income taxes. Also, in periods in which Pillar Two legislation is enacted or substantively enacted, but not yet in effect, an entity should disclose known or reasonably estimable information that helps users of financial statements understand the entity’s exposure to Pillar Two income taxes arising from that legislation. The Company adopted this amendment and accordingly applied this exception immediately upon issuance of the amendment and retrospectively as of January 1, 2023.
The adoption of the above-mentioned amendments did not have a material impact to the Company's consolidated financial statements.
1.4.2 New IFRS standards, amendments and interpretations applicable from 2024 onward
On January 23, 2020, the IASB issued narrow-scope amendments to IAS 1 to clarify how to classify debt and other liabilities as current or non-current. The amendments aim to promote consistency in applying the requirements by helping companies determine whether, in the statement of financial position, debt and other liabilities with an uncertain settlement date should be classified as current (due or potentially due to be settled within one year) or non-current. The amendments include clarifying the classification requirements for debt a company might settle by converting it into equity. On June 22, 2021, the IASB postponed the effective date of the amendments. The amendments are effective for annual periods beginning on or after January 1, 2024 and are to be applied retrospectively, with early adoption permitted.
On October 31, 2022, the IASB has issued 'Non-current Liabilities with Covenants (Amendments to IAS 1)' to clarify how conditions with which an entity must comply within twelve months after the reporting period affect the classification of a liability. The amendments are effective for annual periods beginning on or after January 1, 2024 and are to be applied retrospectively, with early adoption permitted.
On September 22, 2022, the IASB issued amendments to IFRS 16 "Leases" with respect to the lease liability in a sale and leaseback transaction. The amendments require a seller-lessee to subsequently measure lease liabilities arising from a leaseback in a way that it does not recognize any amount of the gain or loss that relates to the right of use it retains. The new requirements do not prevent a seller-lessee from recognizing in profit or loss any gain or loss relating to the partial or full termination of a lease. The amendments are effective for annual periods beginning on or after January 1, 2024 with early
269
| Consolidated financial statements | ||
| (millions of U.S. dollar, except share and per share data) | ||
adoption permitted. The amendments are to be applied retrospectively.
On May 25, 2023, the IASB has published 'Supplier Finance Arrangements (Amendments to IAS 7 and IFRS 7)' to add disclosure requirements, and ‘signposts’ within existing disclosure requirements, which require entities to provide qualitative and quantitative information about supplier finance arrangements. In particular, entities will have to disclose in the notes information that enables users of financial statements to (i) assess how supplier finance arrangements affect an entity’s liabilities and cash flows and to (ii) understand the effect of supplier finance arrangements on an entity’s exposure to liquidity risk and how the entity might be affected if the arrangements were no longer available to it. The amendments to IAS 7 are effective for annual reporting periods beginning on or after January 1, 2024 (with earlier application permitted) and the amendments to IFRS 7 when it applies the amendments to IAS 7.
On August 15, 2023, the IASB has published 'Lack of Exchangeability (Amendments to IAS 21)' that contains guidance to specify when a currency is exchangeable and how to determine the exchange rate when it is not and how an entity determines the exchange rate to apply when a currency is not exchangeable. The amendments also require the disclosure of additional information when a currency is not exchangeable. The amendments are effective for annual periods beginning on or after January 1, 2025 with early adoption permitted. The amendments do not apply retrospectively. An entity recognizes any effect of initially applying the amendments as an adjustment to the opening balance of retained earnings when the entity reports foreign currency transactions. When an entity uses a presentation currency other than its functional currency, it recognizes the cumulative amount of translation differences in equity.
The Company is still assessing the potential impact of the amendments to IAS 7, IFRS 7 and IAS 21 to its consolidated financial statements. It does not expect that the adoption of the other amendments will have a material impact to its consolidated financial statements. The Company does not plan to early adopt any amendments.
The consolidated financial statements include the accounts of the Company, its subsidiaries and its interests in associated companies and joint arrangements. Subsidiaries are consolidated from the date the Company obtains control (ordinarily the date of acquisition) until the date control ceases. The Company controls an entity when the Company is exposed to or has rights to variable returns from its involvement with the
Associates are those companies over which the Company has the ability to exercise significant influence on the financial and operating policy decisions, which it does not control. Generally, significant influence is presumed to exist when the Company holds more than 20% of the voting rights. Joint arrangements, which include joint ventures and joint operations, are those over whose activities the Company has joint control, typically under a contractual arrangement. In joint ventures, ArcelorMittal exercises joint control and has rights to the net assets of the arrangement. The investment is accounted for under the equity method and therefore recognized at cost at the date of acquisition and subsequently adjusted for ArcelorMittal’s share in undistributed earnings or losses since acquisition, less any impairment incurred. Any excess of the cost of the acquisition over the Company’s share of the net fair value of the identifiable assets, liabilities, and contingent liabilities of the associate or joint venture recognized at the date of acquisition is considered as goodwill. The goodwill, if any, is included in the carrying amount of the investment and is evaluated for impairment as part of the investment. The consolidated statements of operations include the Company’s share of the profit or loss of associates and joint ventures from the date that significant influence or joint control commences until the date significant influence or joint control ceases and any impairment losses. Adjustments to the carrying amount may also be necessary for changes in the Company’s proportionate interest in the investee arising from changes in the investee’s equity that have not been recognized in the investee’s profit or loss. The Company’s share of those changes is recognized directly in the relevant reserve within equity.
The Company assesses the recoverability of its investments accounted for under the equity method whenever there is an indication of impairment. In determining the value in use of its investments, the Company estimates its share in the present value of the projected future cash flows expected to be generated by operations of associates and joint ventures (see also note 2.4.4).
Investments in other entities, over which the Company and/or its operating subsidiaries do not have the ability to exercise significant influence, are accounted for as investments in equity instruments at FVOCI with any resulting gain or loss, net of related tax effect, recognized in the consolidated statements of other comprehensive income. Realized gains and losses from
270
| Consolidated financial statements | ||
| (millions of U.S. dollar, except share and per share data) | ||
While there are certain limitations on the Company’s operating and financial flexibility arising from the restrictive and financial covenants of one of the Company’s credit facilities described in note 6.1.2, there are no significant restrictions resulting from borrowing agreements or regulatory requirements on the ability of consolidated subsidiaries, associates and jointly controlled entities to transfer funds to the parent in the form of cash dividends to pay commitments as they come due.
Intercompany balances and transactions, including income, expenses and dividends, are eliminated in the consolidated financial statements. Gains and losses resulting from intercompany transactions are also eliminated.
271
| Consolidated financial statements | ||
| (millions of U.S. dollar, except share and per share data) | ||
2.2 Investments in subsidiaries
2.2.1 List of subsidiaries
The table below provides a list of the Company’s principal operating subsidiaries at December 31, 2023. Unless otherwise stated, the subsidiaries listed below have share capital consisting solely of ordinary shares or voting interests in the case of partnerships, which are held directly or indirectly by the Company and the proportion of ownership interests held equals to the voting rights held by the Company. The country of incorporation corresponds to their principal place of operations.
| Name of Subsidiary | Country | % of Ownership | ||||||||||||
| NAFTA | ||||||||||||||
| ArcelorMittal Dofasco G.P. | Canada | |||||||||||||
| ArcelorMittal México S.A. de C.V. | Mexico | |||||||||||||
| ArcelorMittal Long Products Canada G.P. | Canada | |||||||||||||
ArcelorMittal Texas HBI LLC | USA | |||||||||||||
| Brazil and neighboring countries ("Brazil") | ||||||||||||||
| ArcelorMittal Brasil S.A. | Brazil | |||||||||||||
| Acindar Industria Argentina de Aceros S.A. ("Acindar") | Argentina | |||||||||||||
ArcelorMittal Pecém 1 | Brazil | |||||||||||||
| Europe | ||||||||||||||
| ArcelorMittal France S.A.S. | France | |||||||||||||
| ArcelorMittal Belgium N.V. | Belgium | |||||||||||||
| ArcelorMittal España S.A. | Spain | |||||||||||||
| ArcelorMittal Flat Carbon Europe S.A. | Luxembourg | |||||||||||||
| ArcelorMittal Poland S.A. | Poland | |||||||||||||
| ArcelorMittal Eisenhüttenstadt GmbH | Germany | |||||||||||||
| ArcelorMittal Bremen GmbH | Germany | |||||||||||||
| ArcelorMittal Méditerranée S.A.S. | France | |||||||||||||
| ArcelorMittal Belval & Differdange S.A. | Luxembourg | |||||||||||||
| ArcelorMittal Hamburg GmbH | Germany | |||||||||||||
| ArcelorMittal Duisburg GmbH | Germany | |||||||||||||
| ArcelorMittal International Luxembourg S.A. | Luxembourg | |||||||||||||
| Africa and Commonwealth of Independent States ("ACIS") | ||||||||||||||
| ArcelorMittal South Africa Ltd. ("AMSA") | South Africa | |||||||||||||
JSC ArcelorMittal Temirtau 3 | Kazakhstan | |||||||||||||
| PJSC ArcelorMittal Kryvyi Rih ("AM Kryvyi Rih") | Ukraine | |||||||||||||
| Mining | ||||||||||||||
| ArcelorMittal Mining Canada G.P. and ArcelorMittal Infrastructure Canada G.P. ("AMMC") | Canada | |||||||||||||
ArcelorMittal Liberia Ltd2 | Liberia | |||||||||||||
1.Acquisition during the year. For more details see note 2.2.4.
2.ArcelorMittal Liberia Ltd is incorporated in Cyprus.
3.On December 7, 2023, the Company completed the sale of ArcelorMittal Temirtau, its Kazakh steel and mining operation see note 2.3.
The functional currency of ArcelorMittal S.A. is the U.S. dollar. The functional currency of each of the principal operating subsidiaries is the local currency, except for ArcelorMittal México, AMMC, ArcelorMittal Liberia Ltd, ArcelorMittal International Luxembourg, whose functional currency is the U.S. dollar and ArcelorMittal Poland, whose functional currency is the euro.
Transactions in currencies other than the functional currency of a subsidiary are recorded at the rates of exchange prevailing at the date of the transaction. Monetary assets and liabilities in currencies other than the functional currency are remeasured at the rates of exchange prevailing on the date of the consolidated statements of financial position and the related translation gains and losses are reported within financing costs in the consolidated statements of operations. Non-monetary items that are carried at cost are translated using the rate of exchange prevailing at the date of the transaction. Non-monetary items
272
| Consolidated financial statements | ||
| (millions of U.S. dollar, except share and per share data) | ||
that are carried at fair value are translated using the exchange rate prevailing when the fair value was determined and the related translation gains and losses are reported in the consolidated statements of comprehensive income.
Since July 1, 2018, Argentina has been considered a highly inflationary country and therefore the financial statements of the Company's long production facilities Acindar Industria Argentina de Aceros S.A. ("Acindar") in Argentina, using a historical cost approach, are adjusted prospectively to reflect the changes in the general purchasing power of the local currency before being translated into U.S. dollar at the year-end exchange rate. The Company used an estimated general price index (Consumer Price Index "IPC") which changed by 211.4 %, 94.8 % and 50.3 % for the year ended December 31, 2023, 2022 and 2021, respectively, for this purpose. As a result of the inflation-related adjustments on non-monetary items, a loss of 105 and 4 and a gain of 33 was recognized in net financing costs for the year ended December 31, 2023, 2022 and 2021, respectively.
Since 2010 Venezuela has been considered a hyperinflationary economy and therefore the financial statements of Unicon are adjusted to reflect the changes in the general purchasing power of the local currency before being translated into U.S. dollar. The Company used estimated general price indices which changed by 190 %, 207 % and 686 % for the years ended December 31, 2023, 2022 and 2021, respectively, for this purpose. As a result of the inflation related adjustments a gain of 8 , 5 and 14 was recognized in net financing cost for the years ended December 31, 2023, 2022 and 2021, respectively.
2.2.3 Business combinations
Business combinations are accounted for using the acquisition method as of the acquisition date, which is the date on which control is transferred to ArcelorMittal. The Company controls an entity when it is exposed to or has rights to variable returns from its involvement with the entity and has the ability to affect those returns through its power over the entity.
The Company measures goodwill at the acquisition date as the total of the fair value of consideration transferred, plus the proportionate amount of any non-controlling interest, plus the fair value of any previously held equity interest in the acquiree, if
any, less the net recognized amount (generally at fair value) of the identifiable assets acquired and liabilities assumed.
In a business combination in which the fair value of the identifiable net assets acquired exceeds the cost of the acquired business, the Company reassesses the fair value of the assets acquired and liabilities assumed. If, after reassessment, ArcelorMittal’s interest in the net fair value of the acquiree’s identifiable assets, liabilities and contingent liabilities exceeds the cost of the business combination, the excess (bargain purchase) is recognized immediately as a reduction of cost of sales in the consolidated statements of operations.
2.2.4 Acquisitions
In January 2023, ArcelorMittal Brasil settled the undisputed amount it accepts as the value of the Votorantim put option for 179 (see note 11.5.2).
On March 9, 2023, following receipt of customary regulatory approvals, ArcelorMittal completed the acquisition of Companhia Siderúrgica do Pecém subsequently renamed ArcelorMittal Pecém for total cash consideration of 2,193 . The Company recognized acquisition-related costs of 4 in selling, general and administrative expenses. ArcelorMittal Pecém is a world-class operation, producing high-quality slab at a globally competitive cost. ArcelorMittal Pecém’s state-of-the-art steel facility in the state of Ceará in northeast Brazil was commissioned in 2016 and produced its first slabs in June of that year. It operates a three -million tonne capacity blast furnace and has access via conveyors to the Port of Pecém, a large scale, deep water port located 10 kilometers from the plant. ArcelorMittal Pecém operates within Brazil’s first Export Processing Zone, and benefits from various tax incentives including a low corporate income tax rate. The Company completed its measurement of the acquisition-date fair value of the identifiable assets and liabilities of ArcelorMittal Pecém. Acquired current assets and other liabilities include 2,605 and 2,605 of restricted cash held in escrow and debt, respectively, which were settled after acquisition date. The Company presented these settlements as non-cash transactions in the consolidated statements of cash flows. It recognized also 3,123 (including trade receivables of 60 ), 1,824 and 100 of current assets, property, plant and equipment and intangible assets, respectively. ArcelorMittal recognized 164 goodwill resulting from operational and financial synergies. Revenue and net income since acquisition date were 1,497 and 340 , respectively. ArcelorMittal Pecém is part of the Brazil reportable segment.
During the first half of 2023, the Company also completed two acquisitions relating to ArcelorMittal Downstream Solutions
273
| Consolidated financial statements | ||
| (millions of U.S. dollar, except share and per share data) | ||
within the Europe reportable segment ("AMDS acquisitions"). On January 3, 2023, ArcelorMittal completed the acquisition of Riwald Recycling, a state-of-the-art ferrous scrap metal recycling business based in the Netherlands. The acquisition is part of ArcelorMittal's strategy of increasing the use of scrap steel to lower CO2 emissions from steelmaking in both the EAF and BF-BOF routes. On March 10, 2023, the Company also completed the acquisition of the German insulation panel manufacturer Italpannelli Germany (subsequently renamed Trier Insulated Panels), which will complement the existing geographic presence and strengthen the product portfolio of ArcelorMittal Downstream Solutions' construction business. The total cash consideration paid for the AMDS acquisitions was €144 million (152 net of cash acquired of 4 ) including debt assumed of 15 . The Company completed the measurement of the acquisition-date fair value of the identifiable assets and liabilities of the AMDS acquisitions and recognized goodwill of 57 , which is primarily attributable to the expected synergies and other benefits from combining the activities of the AMDS acquisitions with those of the Company. Goodwill is not deductible for income tax purposes. Revenue and net loss since acquisition date were 87 and 4 , respectively.
Revenue and net income attributable to the equity holders of the parent of the Company for the twelve months ended December 31, 2023 were 68,579 and 910 , respectively, as though ArcelorMittal had completed the ArcelorMittal Pecém and AMDS acquisitions as of January 1, 2023.
During 2022, among others, the Company completed the acquisition of three specialist scrap metal recyclers as the Company continually seeks to enhance its ability to source scrap steel, a key raw material which supports the ArcelorMittal’s ability to reduce its carbon emissions from steelmaking in both the EAF and BF-BOF routes.
On February 28, 2022, ArcelorMittal acquired John Lawrie Metals Limited ("JLM"), a UK based leading consolidator of ferrous scrap metal, for total consideration of £35 million (43 net of cash acquired of 5 ). The Company completed its measurement of the acquisition-date fair value of the identifiable asset and liabilities of JLM. Revenue and net income since acquisition date till December 31, 2022 were 49 and 3 , respectively. JLM is part of the Europe reportable segment.
On May 2, 2022, ArcelorMittal completed the acquisition of Architectural Steel Limited ("ASL"), a UK based manufacturer of bespoke metal fabrications and flashings for building envelopes to strengthen ArcelorMittal Downstream Solutions' construction business within the Europe segment. Total consideration was £36 million (39 net of cash acquired of 6 ). The Company completed its measurement of the acquisition-date fair value of the identifiable asset and liabilities of ASL. Revenue and net
income since acquisition date till December 31, 2022 were 14 and 3 , respectively.
On May 9, 2022, in order to strengthen the Company's plate operations in the Europe reportable segment in selected downstream and distribution activities, ArcelorMittal increased its interest in the former associate Centro Servizi Metalli S.p.A. ("CSM"), a stainless plate processing business with operations mainly in Italy and Poland, from 49.29 % to 91.68 % through the acquisition of a 42.39 % controlling stake for €13.5 million (7 net of cash acquired of 7 ). The Company completed its measurement of the acquisition-date fair value of the identifiable asset and liabilities of CSM and recognized a 3 bargain purchase gain in cost of sales. Revenue and net income since acquisition date till December 31, 2022 were 76 and 8 , respectively.
On June 30, 2022, ArcelorMittal completed the acquisition of an 80 % interest in voestalpine’s world-class Hot Briquetted Iron ("HBI") plant located in Corpus Christi, Texas and subsequently renamed ArcelorMittal Texas HBI LLC ("ArcelorMittal Texas HBI") for total consideration of 817 (805 net of cash acquired of 12 ) including certain post-closing adjustments. The Company recognized acquisition-related costs of 7 in selling, general and administrative expenses. The facility has an annual capacity of two million tonnes of HBI, a high-quality feedstock made through the direct reduction of iron ore which is used to produce high-quality steel grades in an EAF, but which can also be used in blast furnaces, resulting in lower coke consumption. HBI is a premium, compacted form of DRI developed to overcome issues associated with shipping and handling DRI. voestalpine has retained a 20 % interest in the plant with a corresponding offtake agreement with an initial ten-year term renewable as long as voestalpine retains any interest in ArcelorMittal Texas HBI. ArcelorMittal would own 100 % of any future development of operations. The remaining balance of production will be delivered to third parties under existing supply contracts, and to ArcelorMittal facilities, including to AM/NS Calvert in Alabama, upon the commissioning of its 1.5 million tonne EAF. Pursuant to the purchase agreement, voestalpine's 20 % interest is subject to a call option exercisable by ArcelorMittal upon termination of the offtake agreement or failure by voestalpine to purchase the offtake volume and a put option exercisable by voestalpine at the end of the fifth, tenth and fifteenth year subsequently to the acquisition date. The Company did not ascribe any value to the call option but recognized a 177 financial liability at amortized cost measured at the present value of the redemption amount of the written put option based on the lower of equity value increased by an annual contractual return and fair value. The Company completed its measurement of the acquisition-date fair value of the identifiable assets and liabilities of ArcelorMittal Texas HBI. It recognized 283 (including trade receivables of 124 ), 949 and 11 of current assets, property, plant and
274
| Consolidated financial statements | ||
| (millions of U.S. dollar, except share and per share data) | ||
equipment and intangible assets, respectively. ArcelorMittal recognized a 97 bargain purchase gain in cost of sales as a result of i) ArcelorMittal's agreement for voestalpine to retain a 20 % non-controlling interest ii) the above-mentioned offtake agreement and iii) the fair value of property, plant and equipment exceeding its carrying amount. Revenue and net loss since acquisition date till December 31, 2022 were 445 and 35 , respectively. ArcelorMittal HBI is part of the NAFTA reportable segment.
On July 1, 2022, the Company completed the combined acquisition of three subsidiaries from environmental services and recycling company ALBA International Recycling (ALBA Metall Süd Rhein-Main GmbH, ALBA Electronics Recycling GmbH and ALBA Metall Süd Franken GmbH in aggregate "ALBA") active in ferrous and non-ferrous metal recycling in Germany for total consideration of 65 of which €51 million (45 net of cash acquired of 9 ) in cash and deferred consideration of 11 . Following the completion of the acquisition-date fair value of
the identifiable assets and liabilities of the three companies, the Company recognized goodwill of 22 . Revenue and net income since acquisition date till December 31, 2022 were 87 and 1 , respectively. ALBA is part of the Europe reportable segment.
On November 19, 2021, the Company completed the acquisition of Condesa Tubos, S.L. ("Condesa"), a joint venture in which it already held a 33 % interest, through the acquisition of the remaining 67 % stake from a pool of banks for total consideration of €31 million (25 net of cash acquired of 10 ). The acquisition of Condesa strengthened ArcelorMittal's tubular operations within the Europe segment. Following the completion of the measurement of the acquisition-date fair value of the identifiable assets and liabilities of Condesa, the Company recognized 92 , 39 and 10 of current assets, property, plant and equipment and other non-current assets, respectively, and a 24 bargain purchase gain in cost of sales as ArcelorMittal's industrial expertise was considered by the other previous shareholders.
The table below summarizes the final acquisition-date fair value of the assets acquired and liabilities assumed in 2023, 2022 and 2021:
2023 | 2022 | 2021 | ||||||||||||||||||||||||
ArcelorMittal Pecém | AMDS acquisitions | JLM | ASL | CSM | ArcelorMittal Texas HBI | ALBA | Condesa | |||||||||||||||||||
| Current assets | ||||||||||||||||||||||||||
| Property, plant and equipment | ||||||||||||||||||||||||||
| Intangible assets | ||||||||||||||||||||||||||
| Other non-current assets | ||||||||||||||||||||||||||
| Total assets | ||||||||||||||||||||||||||
| Deferred tax liabilities | ( | ( | ( | ( | ( | |||||||||||||||||||||
| Other liabilities | ( | ( | ( | ( | ( | ( | ( | ( | ||||||||||||||||||
| Total liabilities | ( | ( | ( | ( | ( | ( | ( | ( | ||||||||||||||||||
| Net assets acquired | ||||||||||||||||||||||||||
| Consideration paid net of cash acquired | ||||||||||||||||||||||||||
| Deferred consideration | ||||||||||||||||||||||||||
| Non-controlling interests | ||||||||||||||||||||||||||
| Debt assumed | ( | |||||||||||||||||||||||||
| Fair value of previously held interests at acquisition date | ||||||||||||||||||||||||||
| Remeasurement gain relating to the equity interest previously held | ( | |||||||||||||||||||||||||
| Goodwill/(bargain purchase gain) | ( | ( | ( | |||||||||||||||||||||||
2.3 Divestments and assets held for sale
Non-current assets and disposal groups that are classified as held for sale are measured at the lower of carrying amount and fair value less costs to sell. Assets and disposal groups are classified as held for sale if their carrying amount will be recovered through a sale transaction rather than through continuing use. The non-current asset, or disposal group, is
classified as held for sale only when the sale is highly probable and is available for immediate sale in its present condition and is marketed for sale at a price that is reasonable in relation to its current fair value. Assets held for sale are presented separately in the consolidated statements of financial position and are not depreciated. Gains (losses) on disposal of subsidiaries are recognized in cost of sales, whereas gains (losses) on disposal
275
| Consolidated financial statements | ||
| (millions of U.S. dollar, except share and per share data) | ||
of investments accounted for under the equity method are recognized in income (loss) from investments in associates, joint ventures and other investments.
An operation is classified as discontinued when it represents a separate major line of business or geographical area of operations that either has been disposed of or is classified as held for sale. Discontinued operations are reported on a single line in the Company's consolidated statements of operations. It reflects the after-tax net income from discontinued operations until the date of disposal and the gains or losses net of taxes realized on the disposals of these operations. In addition, cash flows generated by the discontinued operations are reported on a separate line in the consolidated statement of cash flows for the relevant periods.
Divestments in 2023
On December 7, 2023, ArcelorMittal completed the sale of ArcelorMittal Temirtau, its steel and mining operations in Kazakhstan, to Qazaqstan Investment Corporation ("QIC"), a state-controlled direct investment fund. Under the terms of the transaction, on closing ArcelorMittal received consideration of 286 (254 net of cash disposed of 24 and 8 transaction costs) for net assets and a further 250 as repayment of outstanding intra-group receivables. ArcelorMittal will also receive an additional sovereign-fund guaranteed payment of 450 , paid in four equal annual installments, as repayment of an intra-group loan. All ArcelorMittal Temirtau assets were transferred on an ‘as is’ operational basis, meaning QIC assumed control and accountability for ArcelorMittal Temirtau’s operations. As a result of loss of control, the Company derecognized assets and liabilities of 1,650 and 1,372 , respectively. ArcelorMittal recognized in cost of sales a 732 impairment loss of property, plant and equipment upon measuring the recoverable amount based on sales proceeds (see note 5.3). The Company also recognized in cost of sales a 194 impairment loss of goodwill following the allocation to the disposal group of a portion of the ACIS goodwill in proportion of the consideration received to the total recoverable amount of ACIS operations (see notes 5.1 and 5.3). In addition, it reclassified 1,469 of foreign exchange translation losses from other comprehensive income to cost of sales in the consolidated statements of operations.
Divestments in 2021
On March 4, 2020, ArcelorMittal executed an amendment (the “Amendment Agreement”) to the original lease agreement with the Ilva Commissioners with a conditional obligation to purchase the former Ilva business units ("ArcelorMittal Italia") in an extraordinary administration insolvency procedure. The Amendment Agreement outlined the terms for a significant equity investment by an Italian state-sponsored entity, thereby forming the basis for an important new partnership between ArcelorMittal and the Italian government, with the investment
agreement to be executed by November 30, 2020. The Amendment Agreement also provided for a 50 % reduction in the quarterly rental payments payable by ArcelorMittal, with the balance being due upon closing of the purchase obligation. On December 10, 2020, the Company entered into an investment agreement with Invitalia - Agenzia nazionale per l'attrazione degli investimenti e lo sviluppo d'impresa S.P.A (“Invitalia”), the party designated by the Italian government to be the government-sponsored investor as contemplated in the Amendment Agreement, in order to create a partnership between Invitalia and the Company to support the completion of the purchase obligation.
On December 14, 2020, ISP exercised its put option for €111 million (135 ) to sell its share in ArcelorMittal Italia to the Company and the liability it had recognized upon acquisition of ArcelorMittal Italia was derecognized.
The investment agreement includes two capital increases:
•The first investment of €400 million (476 ) which was completed on April 14, 2021 provided Invitalia with 50 % voting and governance rights and therefore joint control over AM InvestCo with a 38 % shareholding;
•The second investment of up to €680 million was payable on closing of the purchase obligation, which was subject to the satisfaction of various conditions precedent by May 2022. On May 31, 2022, following an amendment to the investment agreement signed between ArcelorMittal and Invitalia, the latest date for the second equity injection was extended to May 31, 2024. At the end of December 2022, ArcelorMittal, the Italian Government and Invitalia agreed, among other things, to accelerate the funding originally envisaged to occur in connection with the acquisition of Ilva’s assets (see note 2.4.1).
Subsequently to April 14, 2021, Acciaierie d'Italia Holding (formerly AM InvestCo) operates independently and as such has its own funding plans. Its main operating subsidiary ArcelorMittal Italia was renamed Acciaierie d'Italia. As a result of loss of control, the Company derecognized assets (including 199 of cash pooling receivable from the Company and subsequently settled) and liabilities of 4,639 and 3,873 , respectively, and accounted for its 62 % interest in the joint venture under the equity method at its fair value of 1,205 . The Company recognized in cost of sales a gain of 104 including the reclassification from other comprehensive income to the consolidated statements of operations of foreign exchange translation losses and other for 283 . The fair value measurement was determined using a discounted cash flow model and Level 3 unobservable inputs.
276
| Consolidated financial statements | ||
| (millions of U.S. dollar, except share and per share data) | ||
The table below summarizes the significant divestments completed in 2023 and 2021 (there were no divestments in 2022):
| 2023 | 2021 | ||||||||||
ArcelorMittal Temirtau | Acciaerie d'Italia | ||||||||||
| Cash and cash equivalents | |||||||||||
| Other current assets | |||||||||||
| Intangible assets | |||||||||||
| Property, plant and equipment | |||||||||||
| Other assets | |||||||||||
| Total assets | |||||||||||
| Current liabilities | |||||||||||
| Other long-term liabilities | |||||||||||
| Total liabilities | |||||||||||
| Total net assets | |||||||||||
| % of net assets sold | % | % | |||||||||
| Total net assets disposed of | |||||||||||
ArcelorMittal retained interest | |||||||||||
| Goodwill allocation | ( | ( | |||||||||
| Consideration | |||||||||||
| Reclassification of foreign exchange and other | ( | ( | |||||||||
| Gain (loss) on disposal/derecognition | ( | ||||||||||
2.4 Investments in associates and joint arrangements
The carrying amounts of the Company’s investments accounted for under the equity method were as follows:
| December 31, | |||||||||||
| Category | 2023 | 2022 | |||||||||
| Joint ventures | |||||||||||
| Associates | |||||||||||
Individually immaterial joint ventures and associates1 | |||||||||||
| Total | |||||||||||
277
| Consolidated financial statements | ||
| (millions of U.S. dollar, except share and per share data) | ||
2.4.1 Joint ventures
The following tables summarize the latest available financial information and reconcile it to the carrying value of each of the Company’s material joint ventures, as well as the income statement of the Company’s material joint ventures:
| December 31, 2023 | ||||||||||||||||||||||||||||||||||||||||||||||||||
| Joint Ventures | AMNS India | Calvert | VAMA | Tameh | Borçelik | Al Jubail | VdSA | Total | ||||||||||||||||||||||||||||||||||||||||||
Place of incorporation and operation 1 | India | United States | China | Poland | Turkey | Saudi Arabia | Brazil | |||||||||||||||||||||||||||||||||||||||||||
| Principal Activity | Integrated flat steel producer 4,5 | Automotive steel finishing 6 | Automotive steel finishing | Energy production and supply | Manufacturing and sale of steel 2,3 | Production and sale seamless line pipes and tubes | Renewable energy production and supply | |||||||||||||||||||||||||||||||||||||||||||
| Ownership and voting rights at December 31, 2023 | % | % | % | % | % | % | % | |||||||||||||||||||||||||||||||||||||||||||
| Current assets | ||||||||||||||||||||||||||||||||||||||||||||||||||
| of which cash, cash equivalents and restricted cash | ||||||||||||||||||||||||||||||||||||||||||||||||||
| Non-current assets | ||||||||||||||||||||||||||||||||||||||||||||||||||
| Current liabilities | ||||||||||||||||||||||||||||||||||||||||||||||||||
| of which trade and other payables and provisions | ||||||||||||||||||||||||||||||||||||||||||||||||||
| Non-current liabilities | ||||||||||||||||||||||||||||||||||||||||||||||||||
| of which trade and other payables and provisions | ||||||||||||||||||||||||||||||||||||||||||||||||||
| Non-controlling interest | ||||||||||||||||||||||||||||||||||||||||||||||||||
| Net assets attributable to equity holders of the parent | ||||||||||||||||||||||||||||||||||||||||||||||||||
| Company's share of net assets | ||||||||||||||||||||||||||||||||||||||||||||||||||
| Adjustments for differences in accounting policies and other | ( | ( | ( | |||||||||||||||||||||||||||||||||||||||||||||||
| Carrying amount in the statements of financial position | ||||||||||||||||||||||||||||||||||||||||||||||||||
| Revenue | ||||||||||||||||||||||||||||||||||||||||||||||||||
| Depreciation and amortization | ( | ( | ( | ( | ( | ( | ( | |||||||||||||||||||||||||||||||||||||||||||
| Interest income | ||||||||||||||||||||||||||||||||||||||||||||||||||
| Interest expense | ( | ( | ( | ( | ( | ( | ( | |||||||||||||||||||||||||||||||||||||||||||
| Income tax benefit (expense) | ( | ( | ( | ( | ( | |||||||||||||||||||||||||||||||||||||||||||||
| Income (loss) from continuing operations | ||||||||||||||||||||||||||||||||||||||||||||||||||
| Other comprehensive income (loss) | ( | ( | ( | ( | ( | |||||||||||||||||||||||||||||||||||||||||||||
| Total comprehensive income (loss) | ( | |||||||||||||||||||||||||||||||||||||||||||||||||
| Cash dividends received by the Company | ||||||||||||||||||||||||||||||||||||||||||||||||||
1.The country of incorporation corresponds to the country of operation except for Tameh whose country of operation is also the Czech Republic.
2.Ownership interest in Borçelik was 45.33 % and 50.00 % based on issued shares and outstanding shares, respectively, at December 31, 2023; voting interest was 48.01
3.Adjustment in Borçelik relates primarily to differences in accounting policies regarding revaluation of fixed assets.
4.Adjustments in AMNS India correspond primarily to transaction costs incurred to set up the joint venture and the fair value of the guarantee of the joint venture's debt (see note 9.4).
5.Includes AMNS Luxembourg, AMNS India and intermediate holding entities.
6.Adjustments in Calvert primarily relate to differences in accounting policies regarding inventory valuation.
278
| Consolidated financial statements | ||
| (millions of U.S. dollar, except share and per share data) | ||
| December 31, 2022 | ||||||||||||||||||||||||||||||||||||||||||||||||||
| Joint Ventures | AMNS India | Acciaierie d'Italia | Calvert | VAMA | Tameh | Borçelik | Al Jubail | Total | ||||||||||||||||||||||||||||||||||||||||||
Place of incorporation and operation 1 | India | Italy | United States | China | Poland | Turkey | Saudi Arabia | |||||||||||||||||||||||||||||||||||||||||||
| Principal Activity | Integrated flat steel producer 4,5 | Integrated flat steel producer6 | Automotive steel finishing 7 | Automotive steel finishing | Energy production and supply | Manufacturing and sale of steel 2,3 | Production and sale seamless line pipes and tubes | |||||||||||||||||||||||||||||||||||||||||||
| Ownership and voting rights at December 31, 2022 | % | % | % | % | % | % | % | |||||||||||||||||||||||||||||||||||||||||||
| Current assets | ||||||||||||||||||||||||||||||||||||||||||||||||||
| of which cash, cash equivalents and restricted cash | ||||||||||||||||||||||||||||||||||||||||||||||||||
| Non-current assets | ||||||||||||||||||||||||||||||||||||||||||||||||||
| Current liabilities | ||||||||||||||||||||||||||||||||||||||||||||||||||
| of which trade and other payables and provisions | ||||||||||||||||||||||||||||||||||||||||||||||||||
| Non-current liabilities | ||||||||||||||||||||||||||||||||||||||||||||||||||
| of which trade and other payables and provisions | ||||||||||||||||||||||||||||||||||||||||||||||||||
| Non-controlling interest | ||||||||||||||||||||||||||||||||||||||||||||||||||
| Net assets attributable to equity holders of the parent | ||||||||||||||||||||||||||||||||||||||||||||||||||
| Company's share of net assets | ||||||||||||||||||||||||||||||||||||||||||||||||||
| Adjustments for differences in accounting policies and other | ( | ( | ( | |||||||||||||||||||||||||||||||||||||||||||||||
| Carrying amount in the statements of financial position | ||||||||||||||||||||||||||||||||||||||||||||||||||
| Revenue | ||||||||||||||||||||||||||||||||||||||||||||||||||
| Depreciation and amortization | ( | ( | ( | ( | ( | ( | ( | ( | ||||||||||||||||||||||||||||||||||||||||||
| Interest income | ||||||||||||||||||||||||||||||||||||||||||||||||||
| Interest expense | ( | ( | ( | ( | ( | ( | ( | ( | ||||||||||||||||||||||||||||||||||||||||||
| Income tax benefit (expense) | ( | ( | ( | ( | ( | ( | ||||||||||||||||||||||||||||||||||||||||||||
| Income (loss) from continuing operations | ||||||||||||||||||||||||||||||||||||||||||||||||||
| Other comprehensive income (loss) | ( | ( | ( | |||||||||||||||||||||||||||||||||||||||||||||||
| Total comprehensive income (loss) | ||||||||||||||||||||||||||||||||||||||||||||||||||
| Cash dividends received by the Company | ||||||||||||||||||||||||||||||||||||||||||||||||||
1.The country of incorporation corresponds to the country of operation except for Tameh whose country of operation is also the Czech Republic.
2.Ownership interest in Borçelik was 45.33 % and 50.00 % based on issued shares and outstanding shares, respectively, at December 31, 2022; voting interest was 48.01 % at December 31, 2022.
3.Adjustment in Borçelik relates primarily to differences in accounting policies regarding revaluation of fixed assets.
4.Adjustments in AMNS India correspond primarily to transaction costs incurred to set up the joint venture and the fair value of the guarantee of the joint venture's debt (see note 9.4).
5.Includes AMNS Luxembourg, AMNS India and intermediate holding entities.
6.Includes Acciaierie d'Italia summarized statement of financial position as of December 31, 2022 adjusted for the fair value adjustments at divestment date (see note 2.3).
7.Adjustments in Calvert primarily relate to differences in accounting policies regarding inventory valuation.
279
| Consolidated financial statements | ||
| (millions of U.S. dollar, except share and per share data) | ||
| December 31, 2021 | ||||||||||||||||||||||||||||||||||||||||||||||||||
| Joint Ventures | AMNS India | Acciaierie d'Italia | Calvert | VAMA | Tameh | Borçelik | Al Jubail | Total | ||||||||||||||||||||||||||||||||||||||||||
Place of incorporation and operation1 | India | Italy | United States | China | Poland | Turkey | Saudi Arabia | |||||||||||||||||||||||||||||||||||||||||||
| Principal Activity | Integrated flat steel producer 5,6 | Integrated flat steel producer7 | Automotive steel finishing8 | Automotive steel finishing | Energy production and supply | Manufacturing and sale of steel 2,3,4 | Production and sale seamless line pipes and tubes 9 | |||||||||||||||||||||||||||||||||||||||||||
| Ownership and voting rights at December 31, 2021 | % | % | % | % | % | % | % | |||||||||||||||||||||||||||||||||||||||||||
| Current assets | ||||||||||||||||||||||||||||||||||||||||||||||||||
| of which cash and cash equivalents | ||||||||||||||||||||||||||||||||||||||||||||||||||
| Non-current assets | ||||||||||||||||||||||||||||||||||||||||||||||||||
| Current liabilities | ||||||||||||||||||||||||||||||||||||||||||||||||||
| of which trade and other payables and provisions | ||||||||||||||||||||||||||||||||||||||||||||||||||
| Non-current liabilities | ||||||||||||||||||||||||||||||||||||||||||||||||||
| of which trade and other payables and provisions | ||||||||||||||||||||||||||||||||||||||||||||||||||
| Net assets | ||||||||||||||||||||||||||||||||||||||||||||||||||
| Company's share of net assets | ||||||||||||||||||||||||||||||||||||||||||||||||||
| Adjustments for differences in accounting policies and other | ( | ( | ( | |||||||||||||||||||||||||||||||||||||||||||||||
| Carrying amount in the statements of financial position | ||||||||||||||||||||||||||||||||||||||||||||||||||
| Revenue | ||||||||||||||||||||||||||||||||||||||||||||||||||
| Depreciation and amortization | ( | ( | ( | ( | ( | ( | ( | ( | ||||||||||||||||||||||||||||||||||||||||||
| Interest income | ||||||||||||||||||||||||||||||||||||||||||||||||||
| Interest expense | ( | ( | ( | ( | ( | ( | ( | ( | ||||||||||||||||||||||||||||||||||||||||||
| Income tax benefit (expense) | ( | ( | ( | ( | ||||||||||||||||||||||||||||||||||||||||||||||
| Income (loss) from continuing operations | ( | |||||||||||||||||||||||||||||||||||||||||||||||||
| Other comprehensive income (loss) | ||||||||||||||||||||||||||||||||||||||||||||||||||
| Total comprehensive income (loss) | ( | |||||||||||||||||||||||||||||||||||||||||||||||||
| Cash dividends received by the Company | ||||||||||||||||||||||||||||||||||||||||||||||||||
1.The country of incorporation corresponds to the country of operation except for Tameh whose country of operation is also the Czech Republic.
2.Ownership interest in Borçelik was 45.33 % and 50.00 % based on issued shares and outstanding shares, respectively, at December 31, 2021; voting interest was 48.01 % at December 31, 2021.
3.The non-current liabilities include 39 deferred tax liability.
4.Adjustment in Borçelik relates primarily to differences in accounting policies regarding revaluation of fixed assets.
5.Adjustments in AMNS India correspond primarily to transaction costs incurred to set up the joint venture and the fair value of the guarantee of the joint venture's debt (see note 9.4).
6.Includes AMNS Luxembourg, AMNS India and intermediate holding entities.
7.Includes Acciaierie d'Italia summarized statement of financial position as of December 31, 2021 adjusted for the fair value adjustments at divestment date (see note 2.3). The summarized statement of comprehensive income presents results of Acciaierie d'Italia for the period from April 14, 2021 to December 31, 2021.
8.Adjustments in Calvert primarily relate to differences in accounting policies regarding inventory valuation.
9.The summarized statement of comprehensive income presents results for the full year 2021 including Jubail Energy Services Company ("JESCO") results after July 31, 2021.
AMNS India
AMNS India is an integrated flat carbon steel manufacturer - from iron ore to ready-to-market products with an achievable
crude steel capacity of 8.8 million tonnes per annum. Its manufacturing facilities comprise iron making, steelmaking and downstream facilities spread across India.
280
| Consolidated financial statements | ||
| (millions of U.S. dollar, except share and per share data) | ||
In 2019, ArcelorMittal and Nippon Steel Corporation ("NSC"), Japan’s largest steel producer and the third largest steel producer in the world, created a joint venture to own and operate AMNS India with ArcelorMittal holding a 60 % interest and NSC holding 40 %. Through the agreement, both ArcelorMittal and NSC are guaranteed equal board representation and participation in all significant financial and operating decisions. The Company has therefore determined that it does not control the entity, even though it holds 60 % of the voting rights. AMNS Luxembourg Holding S.A. ("AMNS Luxembourg") is the parent company of the joint venture. ArcelorMittal's 60 % interest is accounted for under the equity method.
AMNS India’s main steel manufacturing facility is located at Hazira, Gujarat in western India. It also has:
–two iron ore beneficiation plants close to the mines in Kirandul and Dabuna, with slurry pipelines that then transport the beneficiated iron ore slurry to the pellet plants in the Kirandul-Vizag and Dabuna-Paradeep systems;
–downstream facilities in Pune, Khopoli and Gandhidham; and
–six service centers in the industrial clusters of Hazira, Indore, Bahadurgarh, Chennai, Kolkata and Pune. It has a complete range of flat rolled steel products, including value added products, and significant iron ore pellet capacity with two main pellet plant systems in Kirandul-Vizag and Dabuna-Paradeep, which have the potential for expansion. Its facilities are located close to ports with deep draft for movement of raw materials and finished goods.
In terms of iron ore pellet capacity, the Kirandul-Vizag system has 8 million tonnes of annual pellet capacity; and the Dabuna-Paradeep system has 12 million tonnes of annual pellet capacity. AMNS India intends to further debottleneck existing operations (steel shop and rolling parts) in the medium term. The first phase of expansion represents capital expenditures of approximately 7.4 billion (0.8 billion for debottlenecking, 1.0 billion for downstream projects and 5.6 billion for upstream projects) and started in October 2022. It aims to increase production at the Hazira facility to 15 million tonnes of rolled products by the first half of 2026 (Phase 1A) following the construction of two blast furnaces (blast furnace 2 to start in 2025 and blast furnace 3 in 2026), the capacity increase of the existing blast furnace 1 from 2 to 3 million tonnes per annum and it includes also a CRM2 complex and galvanizing and annealing line, steel shop, hot strip mill and ancillary equipment (including coke, sinter, networks, power, gas, oxygen plant, etc.) and raw material handling. Feasibility studies are ongoing to
further increase production in a second stage from 15 to 20 million tonnes per annum (Phase 1B).
The resolution plan submitted for the acquisition of AMNS India in 2018 includes a capital expenditure plan of approximately 2.6 billion to be implemented in two stages over six years . The first stage involves investments which increase production of finished steel goods to 7.6 million tonnes per annum. It includes capital expenditure projects with respect to third line CSP caster, Paradeep pellet plant (completed), as well as coke oven, second sinter plant and Dabuna beneficiation plant (in progress). The first stage also includes investment in maintenance to restore current assets, the implementation of an environmental management plan and the implementation of ArcelorMittal’s best practices on raw material sourcing, plant operations, sales and product mix (in particular through greater sophistication of the quality and markets of the steel produced with a focus on developing sales to the automotive industry), people management and health & safety. The second stage involving capital expenditure projects to increase the production of finished steel goods from 7.6 million tonnes per annum to 8.6 million tonnes per annum is now included in the expansion investment plan launched in October 2022 as described above.
On March 16, 2020, AMNS Luxembourg entered into a 5.1 billion ten-year term loan agreement with various Japanese banks which is guaranteed by ArcelorMittal and NSC in proportion to their interests in the joint venture. On March 30, 2023, AMNS Luxembourg entered into an additional 5 billion -year term loan agreement at floating rate with various Japanese banks. The proceeds of the loan, which is guaranteed by ArcelorMittal and NSC in proportion to their respective interests in the joint venture, will be used for the purposes of financing the expenditures necessary for the implementation of phase 1A of expansion to increase production at the Hazira facility to 15 million tonnes. The loan consists of Tranche A, Tranche B and Tranche C of 2 billion, 1 billion and 2 billion, respectively, is arranged to be disbursed by April 30, 2026 at the request of AMNS Luxembourg.
On November 10, 2022, following the approval of the resolution plan by the National Company Law Tribunal ("NCLT") on October 14, 2022, AMNS India completed the acquisition of Uttam Galva Steels Limited subsequently renamed AMNS Khopoli Limited ("AMNSK"), a downstream steel manufacturer in Maharashtra, for which it had made payments to the financial creditors of AMNSK in 2018 and 2019.
On August 26, 2022, AMNS India announced a definitive agreement with Essar Group to acquire, port, power plants and other logistics and infrastructure assets in India for a net value of approximately 2.4 billion. Accordingly, it completed the acquisition of a multi-fuel power plant at Hazira on October 19, 2022 as well as a 25 million-tonne jetty at the all-weather deep
281
| Consolidated financial statements | ||
| (millions of U.S. dollar, except share and per share data) | ||
draft bulk port terminal at Hazira and a 12 million-tonne deep-water jetty at Paradeep on November 15, 2022.
In terms of iron ore mining assets, AMNS India operates the Thakurani mine in the Keonjhar district of Odisha and the Ghoraburhani-Sagasahi mine in the Sudargarh district of Odisha. AMNS India has also made acquisitions of certain ancillary assets including Odisha Slurry Pipeline infrastructure Limited ("OSPIL") which secured an important infrastructure asset for raw material supply to the Paradeep pellet plant and Hazira steel plant and a captive power plant at Paradeep in Odisha.
On May 6, 2023, AMNS India completed the acquisition of Indian Steel Corporation Limited subsequently renamed AMNS Gandhidham specialized in cold-rolled, galvanized and non-ferrous steel products for the automotive, construction, home appliance and general engineering sectors.
Acciaierie d'Italia
Acciaierie d'Italia is the leading steel producer in Italy and produces high-quality and sustainable steel to be used in a range of vital industry sectors across the domestic steel market such as construction, energy, automotive, home appliances, packaging and transport and for international export. Acciaierie d'Italia has operations across various structurally linked operating sites including Europe’s biggest single-site integrated steel facility in Taranto and rolling mills in Genova and Novi Ligure. Genova is also an important hub in terms of intermodal logistics.
On April 14, 2021, pursuant to the investment agreement signed on December 10, 2020 forming a public-private partnership between Invitalia and ArcelorMittal and providing Invitalia joint control rights, ArcelorMittal recorded its 62 % interest at its fair value of 1,205 (see 2.3) at the initial recognition of Acciaierie d'Italia as equity method investment.
On May 31, 2022, Acciaierie d’Italia Holding and Ilva signed an amendment to the Ilva lease agreement (with a conditional purchase obligation) to, among other changes, extend the longstop date for the fulfillment of the conditions precedent (and, therefore, the term of the lease of the Ilva business) by two years until May 31, 2024. In parallel, ArcelorMittal and Invitalia signed an amendment to their investment agreement to extend the latest date for the second equity injection to May 31, 2024 to coincide with the latest date for the fulfillment of the conditions precedent for the purchase of the Ilva business assets and to reflect certain other circumstances. This amendment to the investment agreement confirms Acciaierie d’Italia Holding’s ownership and governance structure until May 2024. At the end of December 2022, in order to address the financial consequences on the Acciaierie d’Italia group of the unprecedented spike in energy costs caused by the Ukraine
crisis, ArcelorMittal, the Italian Government and Invitalia agreed, among other things, to accelerate the funding originally envisaged to occur in connection with the acquisition of Ilva’s assets, consisting in particular of €680 million from Invitalia and €70 million from ArcelorMittal (corresponding to an equivalent amount of receivables towards the Acciaierie d’Italia Group), in the form of a convertible shareholder loan made available on February 14, 2023, as a result of which, upon conversion, Invitalia’s stake in Acciaierie d’Italia Holding would be increased to 60 % and ArcelorMittal’s would reduce to 40 %. The settlement of Invitalia’s shareholder loan was completed on February 17, 2023.
On February 20, 2024, the Italian Government issued a decree placing Acciaierie d’Italia in extraordinary administration subsequent to the request of Invitalia, thereby passing control of the company from its current shareholders, ArcelorMittal and Invitalia, to government appointed commissioners. Acciaierie d’Italia will in all likelihood not be able to complete the acquisition of Ilva’s assets.
VAMA
Valin ArcelorMittal Automotive Steel (“VAMA”) is a joint venture between ArcelorMittal and Hunan Valin which produces steel for high-end applications in the automobile industry. VAMA supplies international automakers and first-tier suppliers as well as Chinese car manufacturers and their supplier networks. In April 2023 VAMA announced the start of production for its second continuous galvanization line with an annual capacity of 450,000 tonnes, bringing its total capacity to 2 millions tonnes per year. Equipment is currently in the ramp-up phase which is expected to be completed by the second half of 2024.
Calvert
AM/NS Calvert ("Calvert"), a joint venture between the Company and NSC, is a steel processing plant in Calvert, Alabama, United States. Calvert had a 6 -year agreement to purchase 2 million tonnes of slabs annually from ThyssenKrupp Steel USA ("TK CSA"), an integrated steel mill complex located in Rio de Janeiro subsequently acquired by Ternium S.A., using a market-based price formula. The slab purchase agreement with Ternium S.A. was terminated with last purchases concluded in May 2021. The remaining slabs for Calvert's operations are sourced from ArcelorMittal plants in Brazil and Mexico and from Cleveland-Cliffs , which following its acquisition of ArcelorMittal USA entered on December 9, 2020 into a new five-year agreement with Calvert (with an automatic three-year extension unless either party provides notice of intent to terminate) for 1.5 million tonnes annually for the initial term and 0.55 million tonnes annually under the extension and which can be reduced with a six-month notice. ArcelorMittal is principally responsible for marketing the product on behalf of the joint venture. Calvert serves the automotive, construction, pipe and tube, service center and appliance/ HVAC industries.
282
| Consolidated financial statements | ||
| (millions of U.S. dollar, except share and per share data) | ||
Calvert plans to invest in an on-site steelmaking facility through a 1.5 million tonnes capacity EAF (producing slabs for the existing operations and replacing part of the purchased slabs). Construction commenced in March 2021 after obtaining all environmental permits, and the facility is expected to start by the end of 2024.
VdSA
On May 5, 2023, following approval by the Brazilian antitrust authority CADE on April 13, 2023, ArcelorMittal formed the joint venture Ventos de Santo Antônio Comercializadora de Energia S.A. ("VdSA") with Casa dos Ventos, one of Brazil’s largest developers and producers of renewable energy projects, to develop a 554 MW wind power project, with ArcelorMittal holding a 55 % stake and Casa dos Ventos holding the remaining 45 %. The project Ventos de Santo Antonio aims to secure and decarbonize a considerable proportion of the Company's wholly-owned subsidiary ArcelorMittal Brazil’s future electricity needs through a 20-year power purchasing power agreement starting on January 1, 2026. Through the agreement, both ArcelorMittal and Casa dos Ventos are guaranteed equal board representation and participation in all significant financial and operating decisions. The Company has therefore determined that VdSA is a joint venture subject to joint control as it does not control the entity, even though it holds a 55 % interest. The Company accounted for its investment in VdSA under the equity method with an initial carrying amount of 147 , of which paid cash consideration of 73 .
Tameh
Tameh is a joint venture between ArcelorMittal and Tauron Group including four energy production facilities located in Poland and the Czech Republic. Tameh’s objective is to ensure energy supply to the Company’s steel plants in Poland and external customers in the Czech Republic as well as the utilization of steel plant gases for energy production processes.
Following the occurrence of a deadlock situation, both Tauron Group and ArcelorMittal had the ability to exercise a put option
right, allowing each partner to sell its shares to the other one. As per the shareholders' agreement, the declaration of acceptance of an offer that is submitted first shall prevail. ArcelorMittal successfully served its declaration on Tauron on January 2, 2024. Tauron challenged this assertion and both parties continue discussions.
Borçelik
Borçelik Çelik Sanayii Ticaret Anonim Şirketi ("Borçelik"), incorporated and located in Turkey, is a joint venture between ArcelorMittal and Borusan Holding involved in the manufacturing and sale of cold-rolled and galvanized flat steel products.
Al Jubail
ArcelorMittal Tubular Products Al Jubail ("Al Jubail") is a state of the art seamless tube mill in Saudi Arabia designed and built to serve the fast growing energy producing markets of Saudi Arabia, the Middle East, North Africa and beyond.
Al Jubail is a joint venture in which the Company owns a 33.34 % interest. On July 31, 2021, Al Jubail completed the acquisition of Jubail Energy Services Company ("JESCO"), a leading producer of carbon steel seamless pipes in Saudi Arabia.
The Company had outstanding shareholder loans given to Al Jubail for 109 as of December 31, 2020. In connection with the shareholding reorganization and completion of the acquisition of JESCO, the Company converted its remaining 109 of shareholders loans and 21 of other receivables into equity and made an additional 50 cash injection to partially finance the acquisition. Following the share conversion and capital injections by ArcelorMittal, the Company's shareholding in Al Jubail was diluted from 40.80 % to 29.23 % as of December 31, 2021. During 2022, the Company made 29 cash injection and converted 14 other receivable into equity. Accordingly, ArcelorMittal's shareholding increased from 29.23 % to 33.34 %.
283
| Consolidated financial statements | ||
| (millions of U.S. dollar, except share and per share data) | ||
2.4.2 Associates
The following table summarizes the financial information and reconciles it to the carrying amount of each of the Company’s material associates, as well as the income statement of the Company’s material associates:
| December 31, 2023 | ||||||||||||||||||||||||||||||||
| Associates | China Oriental | DHS Group | Gonvarri Steel Industries | Baffinland 6 | Total | |||||||||||||||||||||||||||
| Financial statements reporting date | June 30, 2023 | September 30, 2023 | September 30, 2023 | December 31, 2023 | ||||||||||||||||||||||||||||
Place of incorporation and operation1 | Bermuda | Germany | Spain | Canada | ||||||||||||||||||||||||||||
| Principal Activity | Iron and steel manufacturing | Steel manufacturing 3 | Steel manufacturing 4 | Extraction of iron ore 5 | ||||||||||||||||||||||||||||
| Ownership and voting rights at December 31, 2023 | % | % | % | % | ||||||||||||||||||||||||||||
| Current assets | ||||||||||||||||||||||||||||||||
| Non-current assets | ||||||||||||||||||||||||||||||||
| Current liabilities | ||||||||||||||||||||||||||||||||
| Non-current liabilities | ||||||||||||||||||||||||||||||||
| Non-controlling interests | ||||||||||||||||||||||||||||||||
| Net assets attributable to equity holders of the parent | ||||||||||||||||||||||||||||||||
| Company's share of net assets | ||||||||||||||||||||||||||||||||
| Adjustments for differences in accounting policies and other | ( | ( | ( | |||||||||||||||||||||||||||||
Other adjustments2 | ( | ( | ||||||||||||||||||||||||||||||
| Carrying amount in the statements of financial position | ||||||||||||||||||||||||||||||||
| Revenue | ||||||||||||||||||||||||||||||||
| Income / (loss) from continuing operations | ( | |||||||||||||||||||||||||||||||
| Other comprehensive income | ( | ( | ( | |||||||||||||||||||||||||||||
| Total comprehensive income (loss) | ( | |||||||||||||||||||||||||||||||
| Cash dividends received by the Company | ||||||||||||||||||||||||||||||||
1.The country of incorporation corresponds to the country of operation except for China Oriental whose country of operation is China.
2.Other adjustments correspond to the difference between the carrying amount at December 31, 2023 and the net assets situation corresponding to the latest financial statements ArcelorMittal is permitted to disclose translated with closing rates as of the reporting dates described in the table above.
3.The amount for DHS Group includes an adjustment to align the German GAAP financial information with the Company’s accounting policies and is mainly linked to property, plant and equipment, inventory and pension.
4.Adjustments in Gonvarri Steel Industries primarily relate to differences in accounting policies regarding revaluation of fixed assets.
5.Adjustments in Baffinland primarily relate to differences in accounting policies regarding recognized goodwill. In September 2020, following a legal reorganization that was not a business combination for the Company, its share of fair value remeasurement of 1.5 billion was not recognized in the carrying amount of Baffinland.
6.Following a legal reorganization in September 2020, the Company holds an indirect interest in Baffinland through Nunavut Iron Ore Inc.
284
| Consolidated financial statements | ||
| (millions of U.S. dollar, except share and per share data) | ||
| December 31, 2022 | ||||||||||||||||||||||||||||||||
| Associates | China Oriental | DHS Group | Gonvarri Steel Industries | Baffinland6 | Total | |||||||||||||||||||||||||||
| Financial statements reporting date | June 30, 2022 | September 30, 2022 | September 30, 2022 | December 31, 2022 | ||||||||||||||||||||||||||||
Place of incorporation and operation1 | Bermuda | Germany | Spain | Canada | ||||||||||||||||||||||||||||
| Principal Activity | Iron and steel manufacturing | Steel manufacturing 3 | Steel manufacturing 4 | Extraction of iron ore 5 | ||||||||||||||||||||||||||||
| Ownership and voting rights at December 31, 2022 | % | % | % | % | ||||||||||||||||||||||||||||
| Current assets | ||||||||||||||||||||||||||||||||
| Non-current assets | ||||||||||||||||||||||||||||||||
| Current liabilities | ||||||||||||||||||||||||||||||||
| Non-current liabilities | ||||||||||||||||||||||||||||||||
| Non-controlling interests | ||||||||||||||||||||||||||||||||
| Net assets attributable to equity holders of the parent | ||||||||||||||||||||||||||||||||
| Company's share of net assets | ||||||||||||||||||||||||||||||||
| Adjustments for differences in accounting policies and other | ( | ( | ( | |||||||||||||||||||||||||||||
Other adjustments2 | ( | ( | ( | |||||||||||||||||||||||||||||
| Carrying amount in the statements of financial position | ||||||||||||||||||||||||||||||||
| Revenue | ||||||||||||||||||||||||||||||||
| Income / (loss) from continuing operations | ( | |||||||||||||||||||||||||||||||
| Other comprehensive income (loss) | ||||||||||||||||||||||||||||||||
| Total comprehensive income (loss) | ( | |||||||||||||||||||||||||||||||
| Cash dividends received by the Company | ||||||||||||||||||||||||||||||||
1.The country of incorporation corresponds to the country of operation except for China Oriental whose country of operation is China.
2.Other adjustments correspond to the difference between the carrying amount at December 31, 2022 and the net assets situation corresponding to the latest financial statements ArcelorMittal is permitted to disclose as of the reporting dates described in the table above.
3.The amount for DHS Group includes an adjustment to align the German GAAP financial information with the Company’s accounting policies and is mainly linked to property, plant and equipment, inventory and pension.
4.Adjustments in Gonvarri Steel Industries primarily relate to differences in accounting policies regarding revaluation of fixed assets.
5.Adjustments in Baffinland primarily relate to differences in accounting policies regarding revaluation of fixed assets and locally recognized goodwill. In September 2020, following a legal reorganization that was not a business combination for the Company, its share of provisional fair value remeasurement of 1.5 billion was not recognized in the carrying amount of Baffinland.
6.Following a legal reorganization in September 2020, the Company holds an indirect interest in Baffinland through Nunavut Iron Ore Inc.
285
| Consolidated financial statements | ||
| (millions of U.S. dollar, except share and per share data) | ||
| December 31, 2021 | ||||||||||||||||||||||||||||||||
| Associates | China Oriental | DHS Group | Gonvarri Steel Industries | Baffinland 6 | Total | |||||||||||||||||||||||||||
| Financial statements reporting date | June 30, 2021 | September 30, 2021 | September 30, 2021 | December 31, 2021 | ||||||||||||||||||||||||||||
Place of incorporation and operation1 | Bermuda | Germany | Spain | Canada | ||||||||||||||||||||||||||||
| Principal Activity | Iron and steel manufacturing | Steel manufacturing 3 | Steel manufacturing 4 | Extraction of iron ore 5 | ||||||||||||||||||||||||||||
| Ownership and voting rights at December 31, 2021 | % | % | % | % | ||||||||||||||||||||||||||||
| Current assets | ||||||||||||||||||||||||||||||||
| Non-current assets | ||||||||||||||||||||||||||||||||
| Current liabilities | ||||||||||||||||||||||||||||||||
| Non-current liabilities | ||||||||||||||||||||||||||||||||
| Non-controlling interests | ||||||||||||||||||||||||||||||||
| Net assets attributable to equity holders of the parent | ||||||||||||||||||||||||||||||||
| Company's share of net assets | ||||||||||||||||||||||||||||||||
| Adjustments for differences in accounting policies and other | ( | ( | ( | |||||||||||||||||||||||||||||
Other adjustments 2 | ( | ( | ( | |||||||||||||||||||||||||||||
| Carrying amount in the statements of financial position | ||||||||||||||||||||||||||||||||
| Revenue | ||||||||||||||||||||||||||||||||
| Net income (loss) | ( | ( | ||||||||||||||||||||||||||||||
| Other comprehensive income (loss) | ||||||||||||||||||||||||||||||||
| Total comprehensive income (loss) | ( | ( | ||||||||||||||||||||||||||||||
| Cash dividends received by the Company | ||||||||||||||||||||||||||||||||
1.The country of incorporation corresponds to the country of operation except for China Oriental whose country of operation is China.
2.Other adjustments correspond to the difference between the carrying amount at December 31, 2021 and the net assets situation corresponding to the latest financial statements ArcelorMittal is permitted to disclose as of the reporting dates described in the table above.
3.The amount for DHS Group includes an adjustment to align the German GAAP financial information with the Company’s accounting policies, and is mainly linked to property, plant and equipment, inventory and pension.
4.Adjustments in Gonvarri Steel Industries primarily relate to differences in accounting policies regarding revaluation of fixed assets.
5.Adjustments in Baffinland primarily relate to differences in accounting policies regarding revaluation of fixed assets and locally recognized goodwill. In September 2020, following a legal reorganization that was not a business combination for the Company, its share of provisional fair value remeasurement of 1.5 billion was not recognized in the carrying amount of Baffinland.
6.Following a legal reorganization in September 2020, the Company holds an indirect interest in Baffinland through Nunavut Iron Ore Inc.
China Oriental
China Oriental Group Company Limited (“China Oriental”) is a Chinese integrated iron and steel company listed on the Hong Kong Stock Exchange (“HKEx”). The China Oriental Group has manufacturing plants in Hebei Province and Guangdong Province of the People’s Republic of China (the “PRC”) and sells mainly to customers located in the PRC. The China Oriental Group also carries out property development business which is mainly in the PRC.
DHS Group
DHS - Dillinger Hütte Saarstahl AG (“DHS Group”), incorporated and located in Germany, is a leading producer of heavy steel plates, cast slag pots and semi-finished products, such as pressings, pressure vessel heads and shell sections in Europe. The DHS Group also includes a further rolling mill operated by Dillinger France in Dunkirk (France).
Gonvarri Steel Industries
Holding Gonvarri SL (“Gonvarri Steel Industries”) is dedicated to the processing of steel. The entity is a European leader in steel service centers and renewable energy components, with strong presence in Europe and Latin America.
Baffinland
Baffinland Iron Mines Corporation ("Baffinland") owns the Mary River project, which has direct shipping, high grade iron ore on Baffin Island in Nunavut (Canada).
2.4.3 Other associates and joint ventures that are not individually material
The Company has interests in a number of other joint ventures and associates, none of which are regarded as individually material. The following table summarizes the financial
286
| Consolidated financial statements | ||
| (millions of U.S. dollar, except share and per share data) | ||
information of all individually immaterial joint ventures and associates that are accounted for using the equity method:
| December 31, 2023 | December 31, 2022 | |||||||||||||||||||||||||||||||||||||
| Associates | Joint Ventures | Total | Associates | Joint Ventures | Total | |||||||||||||||||||||||||||||||||
| Carrying amount of interests in associates and joint ventures | ||||||||||||||||||||||||||||||||||||||
| Share of: | ||||||||||||||||||||||||||||||||||||||
| Income from continuing operations | ||||||||||||||||||||||||||||||||||||||
| Other comprehensive income (loss) | ( | |||||||||||||||||||||||||||||||||||||
| Total comprehensive income (loss) | ||||||||||||||||||||||||||||||||||||||
2.4.4 Impairment of associates and joint ventures
In the fourth quarter of 2023, Acciaierie d'Italia's financial condition has deteriorated due in particular to the continued high cost of energy and the repeal of relief measures for energy-intensive companies. It has been experiencing liquidity issues, which have resulted in conflicts with suppliers. ArcelorMittal, the Italian Government and Invitalia discussed the terms and conditions of a possible support to Acciaierie d'Italia to address its short-term cash needs and the funding requirements to enable it to complete the acquisition of Ilva’s business units but the parties were not able to reach agreement on how to address Acciaierie d'Italia’s funding needs. The Company assessed the above facts as indicators of impairment with respect to its investment, further confirmed by the extraordinary administration of Acciaierie d'Italia effective February 20, 2024 (see note 2.4.1), and performed accordingly a value in use calculation resulting in a 1,405 impairment loss considering the uncertainty about Acciaierie d'Italia's future.
2.4.5 Investments in joint operations
The Company had investments in the following joint operations as of December 31, 2023 and 2022:
Peña Colorada
2.5 Other investments
Other investments include those investments in equity instruments for which the Company does not have significant influence. The Company irrevocably elected to present the changes in fair value of such equity instruments, which are not
| December 31, | |||||||||||
| 2023 | 2022 | ||||||||||
| Erdemir | |||||||||||
| ArcelorMittal XCarb | |||||||||||
| Stalprodukt S.A. | |||||||||||
| Others | |||||||||||
| Investments in equity instruments at FVOCI | |||||||||||
The Company’s significant investments in equity instruments at FVOCI at December 31, 2023 and 2022 were the following:
Ereĝli Demir ve Çelik Fabrikalari T.A.S. (“Erdemir”)
Erdemir is the leading steel producer in Turkey and produces plates, hot and cold rolled, tin chromium and zinc coated flat steel and supplies basic inputs to automotive, white goods, pipes and tubes, rolling, manufacturing, electrics-electronics, mechanical engineering, energy, heating equipment, shipbuilding, defense and packaging industries.
During the first half of 2023, the Company's interest in Erdemir decreased from 12 % to 4 % following the sale at the Istanbul stock exchange of 265 million shares for the net proceeds of 626 . As the investment was classified at FVOCI, the accumulated revaluation gain of 333 was transferred from other comprehensive income to retained earnings.
Unrealized (losses) gains recognized in other comprehensive income were (105 ) and 66 for the year ended December 31, 2023 and 2022, respectively.
Cleveland-Cliffs
Cleveland-Cliffs was historically the largest and oldest independent iron ore mining company in the United States and it became the largest flat-rolled steel company and largest iron ore pellet producer in North America in 2020 after the acquisition of
287
| Consolidated financial statements | ||
| (millions of U.S. dollar, except share and per share data) | ||
AK Steel and ArcelorMittal USA. It is vertically integrated from mining through iron making, steelmaking, rolling, finishing and downstream with hot and cold stamping of steel parts and components.
On February 9, 2021 and June 18, 2021, ArcelorMittal completed the sale of 40 million and 38.2 million common shares in Cleveland-Cliffs, respectively, as part of a combined primary and secondary public offering of Cleveland-Cliffs shares for total net proceeds of 1,377 . The accumulated gain of 357 (267 net of tax) recognized in other comprehensive income was transferred to retained earnings. On July 28, 2021, Cleveland-Cliffs redeemed the preferred shares and following the completion of the review of the redemption notice, ArcelorMittal received 1,303 . The accumulated gain of 543 (411 net of tax) recognized in other comprehensive income was transferred to retained earnings.
ArcelorMittal’s XCarb™ innovation fund
ArcelorMittal has launched an innovation fund which invests up to 100 annually in groundbreaking companies developing pioneering or breakthrough technologies which will accelerate the steel industry's transition to carbon neutral steelmaking.
Since the launch of the XCarbTM innovation fund in March 2021, ArcelorMittal has invested 189 , including 66 and 43 in 2023 and 2022, of which 66 and 43 , respectively, in equity instruments at FVOCI.
In 2021, ArcelorMittal completed a 30 investment in the carbon recycling company LanzaTech and a 20 investment in Heliogen, a renewable energy technology company. ArcelorMittal is also a lead investor in Form Energy, a company working to accelerate the development of its breakthrough low-cost energy storage technology to enable a reliable, secure, and fully-renewable electric grid year-round, with a 25 equity injection delivered in 2021 and an additional 17.5 in 2022. In addition, in 2022, ArcelorMittal invested 25 in nuclear innovation company TerraPower.
On January 26, 2023, ArcelorMittal invested 36 in Boston Metal, which is developing and commercializing a patented Molten Oxide Electrolysis (MOE) platform for decarbonizing primary steelmaking and is targeting commercialization of this technology by 2026. On June 30, 2023, ArcelorMittal completed also a second 25 investment in TerraPower and on July 4, 2023 invested 5 in Char Technologies which is is developing a high temperature pyrolysis ("HTP") technology that transforms organic waste streams into valuable energy outputs.
Unrealized (losses) gains recognized in other comprehensive income were (18 ) and 50 for the year ended December 31, 2023 and 2022, respectively.
Stalprodukt S.A.
Stalprodukt S.A. is a leading manufacturer and exporter of highly processed steel products based in Poland. Unrealized gains (losses) recognized in other comprehensive income were 8 and (7 ) for the year ended December 31, 2023 and 2022, respectively. In 2022 the Company sold 117,187 shares for total consideration of 6 . The accumulated loss recognized in other comprehensive income of 2 was transferred to retained earnings.
2.6 Income (loss) from investments in associates, joint ventures and other investments
Income (loss) from investments in associates, joint ventures and other investments consisted of the following:
| Year ended December 31, | |||||||||||||||||
| 2023 | 2022 | 2021 | |||||||||||||||
| Share in net earnings of equity-accounted companies | |||||||||||||||||
| Impairment charges | ( | ||||||||||||||||
| Gain (loss) on disposal | |||||||||||||||||
Dividend income 1 | |||||||||||||||||
| Total | ( | ||||||||||||||||
1.Mainly 117 and 89 dividend income from Erdemir in 2022 and 2021, respectively.
3.1 Reportable segments
The Company is organized in five
288
| Consolidated financial statements | ||
| (millions of U.S. dollar, except share and per share data) | ||
These operating segments include the attributable goodwill, intangible assets, property, plant and equipment, and certain equity method investments. They do not include cash and short-term deposits, short-term investments, tax assets and other current financial assets. Attributable liabilities are also those resulting from the normal activities of the segment, excluding tax liabilities and indebtedness but including post retirement obligations where directly attributable to the segment. The treasury function is managed centrally for the Company and is not directly attributable to individual operating segments or geographical areas.
ArcelorMittal’s segments are structured as follows:
•NAFTA represents the flat, long and tubular facilities of the Company located in Canada, Mexico and the United States. NAFTA produces hot briquetted iron and flat products such as slabs, hot-rolled coil, cold-rolled coil, coated steel and plate. These products are sold primarily to customers in the following sectors: automotive, energy, construction, packaging and appliances and via distributors or processors. NAFTA also produces long products such as wire rod, sections, rebar, billets, blooms and wire drawing, and tubular products. The raw material supply of the NAFTA operations includes sourcing from iron ore captive mines in Mexico to supply the steel facilities.
•Brazil includes the flat operations of Brazil, the long and tubular operations of Brazil and neighboring countries including Argentina, Costa Rica and Venezuela. Flat products include slabs, hot-rolled coil, cold-rolled coil and coated steel. Long products consist of wire rod, sections, bar and rebar, billets, blooms and wire drawing. The raw material supply of the Brazil operations includes sourcing from iron ore captive mines in Brazil.
•Europe is the largest flat steel producer in Europe, with operations that range from Spain in the west to Romania in the east, and covering the flat carbon steel product portfolio in all major countries and markets. Europe produces hot-rolled coil, cold-rolled coil, coated products, tinplate, plate and slab. These products are sold primarily to customers in the automotive, general
and packaging sectors. Europe also produces long products consisting of sections, wire rod, rebar, billets, blooms and wire drawing, and tubular products. In addition, it includes Downstream Solutions, primarily an in-house trading and distribution arm of ArcelorMittal. Downstream Solutions also provides value-added and customized steel solutions through further steel processing to meet specific customer requirements. The raw material supply of Europe operations includes sourcing from iron ore captive mines in Bosnia & Herzegovina.
•ACIS produces a combination of flat, long and tubular products. Its steel facilities are located in South Africa, Ukraine and Kazakhstan (before the Company's disposal of its steel making operations in Kazakhstan, see note 2.3). The raw material supply of the ACIS operations includes sourcing from iron ore captive mines in Kazakhstan and Ukraine and coal captive mines in Kazakhstan (before the Company's disposal of its coal and iron ore mining operations in Kazakhstan, see note 2.3).
•The Mining segment comprises the mines owned by ArcelorMittal in Canada and Liberia. It provides the Company's steel operations with high quality and low-cost iron ore reserves and also sells mineral products to third parties.
As from January 1, 2024, ArcelorMittal implemented changes to its organizational structure. India and joint ventures will be reported as a new operating segment including the joint ventures AMNS India, VAMA and Calvert as well as other associates, joint ventures and other investments. The segment Sustainable Solutions will be composed of a number of high-growth, niche, capital light businesses playing an important role in supporting climate action (including renewables, special projects and construction business). They are currently reported within the Europe segment and will be reported as a separate operating segment. The NAFTA segment will be renamed North America. Finally, following the sale of the Company’s operations in Kazakhstan, the remaining parts of the former ACIS segment will be assigned to Others.
289
| Consolidated financial statements | ||
| (millions of U.S. dollar, except share and per share data) | ||
The following table summarizes certain financial data for ArcelorMittal’s operations by reportable segments.
| NAFTA | Brazil | Europe | ACIS | Mining | Others 1 | Elimination | Total | ||||||||||||||||||||||||||||||||||||||||
| Year ended December 31, 2023 | |||||||||||||||||||||||||||||||||||||||||||||||
| Sales to external customers | — | ||||||||||||||||||||||||||||||||||||||||||||||
Intersegment sales 2 | ( | — | |||||||||||||||||||||||||||||||||||||||||||||
| Operating income (loss) | ( | ( | |||||||||||||||||||||||||||||||||||||||||||||
| Depreciation and amortization | ( | ( | ( | ( | ( | ( | ( | ||||||||||||||||||||||||||||||||||||||||
| Impairment | ( | ( | |||||||||||||||||||||||||||||||||||||||||||||
| Capital expenditures | ( | ||||||||||||||||||||||||||||||||||||||||||||||
| Year ended December 31, 2022 | |||||||||||||||||||||||||||||||||||||||||||||||
| Sales to external customers | — | ||||||||||||||||||||||||||||||||||||||||||||||
Intersegment sales 2 | ( | — | |||||||||||||||||||||||||||||||||||||||||||||
| Operating income (loss) | ( | ( | |||||||||||||||||||||||||||||||||||||||||||||
| Depreciation and amortization | ( | ( | ( | ( | ( | ( | ( | ||||||||||||||||||||||||||||||||||||||||
Impairment | ( | ( | |||||||||||||||||||||||||||||||||||||||||||||
| Capital expenditures | |||||||||||||||||||||||||||||||||||||||||||||||
Year ended December 31, 2021 | |||||||||||||||||||||||||||||||||||||||||||||||
| Sales to external customers | — | ||||||||||||||||||||||||||||||||||||||||||||||
Intersegment sales 2 | ( | — | |||||||||||||||||||||||||||||||||||||||||||||
| Operating income (loss) | ( | ( | |||||||||||||||||||||||||||||||||||||||||||||
| Depreciation and amortization | ( | ( | ( | ( | ( | ( | ( | ||||||||||||||||||||||||||||||||||||||||
Impairment reversal | |||||||||||||||||||||||||||||||||||||||||||||||
| Capital expenditures | |||||||||||||||||||||||||||||||||||||||||||||||
1.Others include all other operational and non-operational items which are not segmented, such as corporate and shared services, financial activities, and shipping and logistics.
2.Transactions between segments are reported on the same basis of accounting as transactions with third parties.
The reconciliation from operating income to net income (including non-controlling interests) is as follows:
| Year ended December 31, | |||||||||||||||||
| 2023 | 2022 | 2021 | |||||||||||||||
| Operating income | |||||||||||||||||
| Income from investments in associates and joint ventures | |||||||||||||||||
Impairments of equity method investments | ( | ||||||||||||||||
| Financing costs - net | ( | ( | ( | ||||||||||||||
| Income before taxes | |||||||||||||||||
| Income tax expense | |||||||||||||||||
| Net income (including non-controlling interests) | |||||||||||||||||
3.2 Geographical information
Geographical information, by country or region, is separately disclosed and represents ArcelorMittal’s most significant
regional markets. Attributed assets are operational assets employed in each region and include items such as pension balances that are specific to a country. Unless otherwise stated in the table heading as a segment disclosure, these disclosures are specific to the country or region stated. They do not include goodwill, deferred tax assets, other investments or receivables and other non-current financial assets. Attributed liabilities are those arising within each region, excluding indebtedness.
290
| Consolidated financial statements | ||
| (millions of U.S. dollar, except share and per share data) | ||
Sales (by destination)
| Year ended December 31, | |||||||||||||||||
| 2023 | 2022 | 2021 | |||||||||||||||
| Americas | |||||||||||||||||
United States | |||||||||||||||||
| Brazil | |||||||||||||||||
| Canada | |||||||||||||||||
| Mexico | |||||||||||||||||
| Argentina | |||||||||||||||||
| Others | |||||||||||||||||
| Total Americas | |||||||||||||||||
| Europe | |||||||||||||||||
| Germany | |||||||||||||||||
| Poland | |||||||||||||||||
| France | |||||||||||||||||
| Spain | |||||||||||||||||
Italy1 | |||||||||||||||||
| Czech Republic | |||||||||||||||||
| Turkey | |||||||||||||||||
| United Kingdom | |||||||||||||||||
| Belgium | |||||||||||||||||
| Netherlands | |||||||||||||||||
| Russia | |||||||||||||||||
| Romania | |||||||||||||||||
| Ukraine | |||||||||||||||||
| Others | |||||||||||||||||
| Total Europe | |||||||||||||||||
| Asia & Africa | |||||||||||||||||
| South Africa | |||||||||||||||||
| Morocco | |||||||||||||||||
| Rest of Africa | |||||||||||||||||
| China | |||||||||||||||||
Kazakhstan2 | |||||||||||||||||
| South Korea | |||||||||||||||||
| India | |||||||||||||||||
| Rest of Asia | |||||||||||||||||
| Total Asia & Africa | |||||||||||||||||
| Total | |||||||||||||||||
1.Sales in Italy include sales from Acciaierie d'Italia until April 14, 2021 (see note 2.3).
2.On December 7, 2023, the Company completed the divestment of ArcelorMittal Temirtau. Sales of ArcelorMittal Temirtau were consolidated until that date see note 2.3.
Revenues from external customers attributed to the country of domicile (Luxembourg) were 128 , 206 and 185 for the years ended December 31, 2023, 2022 and 2021, respectively.
Non-current assets1 per significant country:
| December 31, | |||||||||||
| 2023 | 2022 | ||||||||||
| Americas | |||||||||||
| Canada | |||||||||||
Brazil2 | |||||||||||
United States | |||||||||||
| Mexico | |||||||||||
| Argentina | |||||||||||
| Venezuela | |||||||||||
| Others | |||||||||||
| Total Americas | |||||||||||
| Europe | |||||||||||
| France | |||||||||||
| Germany | |||||||||||
| Belgium | |||||||||||
| Poland | |||||||||||
Ukraine | |||||||||||
| Spain | |||||||||||
| Luxembourg | |||||||||||
| Bosnia and Herzegovina | |||||||||||
| Romania | |||||||||||
| Czech Republic | |||||||||||
| Others | |||||||||||
| Total Europe | |||||||||||
| Asia & Africa | |||||||||||
Kazakhstan3 | |||||||||||
| South Africa | |||||||||||
| Liberia | |||||||||||
| Morocco | |||||||||||
India | |||||||||||
| Others | |||||||||||
| Total Asia & Africa | |||||||||||
| Unallocated assets | |||||||||||
| Total | |||||||||||
1.Non-current assets do not include goodwill, deferred tax assets, investments in associates and joint ventures, other investments and other non-current financial assets (as they are not allocated to the individual countries). Such assets are presented under the caption “Unallocated assets”.
2.Brazil includes ArcelorMittal Pecém acquired on March 9, 2023 (see note 2.2.4).
3.On December 7, 2023, the Company completed the sale of ArcelorMittal Temirtau (see note 2.3).
3.3 Sales by type of products
The table below presents sales to external customers by product type. In addition to steel produced by the Company, amounts include material purchased for additional transformation and sold through distribution services. Mining products relate to the Company's own production. Others mainly
291
| Consolidated financial statements | ||
| (millions of U.S. dollar, except share and per share data) | ||
include non-steel and by-products sales, manufactured and specialty steel products sales, shipping and other services.
| Year ended December 31, | |||||||||||||||||
| 2023 | 2022 | 2021 | |||||||||||||||
| Flat products | |||||||||||||||||
| Long products | |||||||||||||||||
| Tubular products | |||||||||||||||||
| Mining products | |||||||||||||||||
| Others | |||||||||||||||||
| Total | |||||||||||||||||
3.4 Disaggregated revenue
Disaggregated revenue
The tables below summarize the disaggregated revenue recognized from contracts with customers:
| Year ended December 31, 2023 | NAFTA | Brazil | Europe | ACIS | Mining | Others | Total | ||||||||||||||||||||||||||||||||||
| Steel sales | |||||||||||||||||||||||||||||||||||||||||
Non-steel sales 1 | |||||||||||||||||||||||||||||||||||||||||
By-product sales 2 | |||||||||||||||||||||||||||||||||||||||||
Other sales 3 | |||||||||||||||||||||||||||||||||||||||||
| Total | |||||||||||||||||||||||||||||||||||||||||
| Year ended December 31, 2022 | NAFTA | Brazil | Europe | ACIS | Mining | Others | Total | ||||||||||||||||||||||||||||||||||
| Steel sales | |||||||||||||||||||||||||||||||||||||||||
Non-steel sales 1 | |||||||||||||||||||||||||||||||||||||||||
By-product sales 2 | |||||||||||||||||||||||||||||||||||||||||
Other sales 3 | |||||||||||||||||||||||||||||||||||||||||
| Total | |||||||||||||||||||||||||||||||||||||||||
| Year ended December 31, 2021 | NAFTA | Brazil | Europe | ACIS | Mining | Others | Total | ||||||||||||||||||||||||||||||||||
| Steel sales | |||||||||||||||||||||||||||||||||||||||||
Non-steel sales 1 | |||||||||||||||||||||||||||||||||||||||||
By-product sales 2 | |||||||||||||||||||||||||||||||||||||||||
Other sales 3 | |||||||||||||||||||||||||||||||||||||||||
| Total | |||||||||||||||||||||||||||||||||||||||||
1.Non-steel sales mainly relate to iron ore, coal, scrap and electricity.
2.By-product sales mainly relate to slag, waste and coke by-products.
3.Other sales are mainly comprised of shipping and other services.
4.1 Revenue
The Company’s revenue is derived from the single performance obligation to transfer primarily steel and mining products under arrangements in which the transfer of control of the products
and the fulfillment of the Company’s performance obligation occur at the same time. Revenue from the sale of goods is recognized when the Company has transferred control of the goods to the buyer and the buyer obtains the benefits from the goods, the potential cash flows and the amount of revenue (the transaction price) can be measured reliably, and it is probable
292
| Consolidated financial statements | ||
| (millions of U.S. dollar, except share and per share data) | ||
that the Company will collect the consideration to which it is entitled to in exchange for the goods.
Whether the customer has obtained control over the asset depends on when the goods are made available to the carrier or the buyer takes possession of the goods, depending on the delivery terms. For the Company’s steel producing operations, generally the criteria to recognize revenue has been met when its products are delivered to its customers or to a carrier who will transport the goods to its customers, this is the point in time when the Company has completed its performance obligations. Revenue is measured at the transaction price of the consideration received or receivable, the amount the Company expects to be entitled to.
Additionally, the Company identifies when goods have left its premises, not when the customer receives the goods. Therefore, the Company estimates, based on its historical experience, the amount of goods in-transit when the transfer of control occurs at the destination and defers the revenue recognition.
The Company’s products must meet customer specifications. A certain portion of the Company’s products are returned or have claims filed against the sale because the products contained quality defects or other problems. Claims may be either of the following:
–Product Rejection - Product shipped and billed to an end customer that did not meet previously agreed customer specifications. Claims typically result from physical defects in the goods, goods shipped to the wrong location, goods produced with incorrect specifications and goods shipped outside acceptable time parameters.
–Consequential Damages - Damages reported by the customer not directly related to the value of the rejected goods (for example: customer processing cost or mill down time, sampling, storage, sorting, administrative cost, replacement cost, etc.).
The Company estimates the variable consideration for such claims using the expected value method and reduces the amount of revenue recognized.
Warranties:
The warranties and claims arise when the product fails on the criteria mentioned above. Sales-related warranties associated with the goods cannot be purchased separately and they serve as an assurance that the products sold comply with agreed specifications. Accordingly, the Company accounts for warranties in accordance with IAS 37 "Provisions, Contingent Liabilities and Contingent Assets" (see note 9).
Periodically, the Company enters into volume or other rebate programs where once a certain volume or other conditions are met, it refunds the customer some portion of the amounts previously billed or paid. For such arrangements, the Company only recognizes revenue for the amounts it ultimately expects to realize from the customer. The Company estimates the variable consideration for these programs using the most likely amount method or the expected value method, whichever approach best predicts the amount of the consideration based on the terms of the contract and available information and updates its estimates each reporting period.
The Company’s payment terms range from 30 to 90 days from date of delivery, depending on the market and product sold. The Company received 351 as advances from its customers which are classified as unsatisfied performance obligations and recognized as liabilities in line with IFRS 15. The Company expects 100 % of these unsatisfied performance obligations as of December 31, 2023 to be recognized as revenue during 2024 as the Company’s contracts have an original expected duration of one year or less.
The tables below summarize the movements relating to the Company's trade receivable and other for the years ended December 31, 2023, 2022 and 2021.
| Year ended December 31, | |||||||||||||||||
| 2023 | 2022 | 2021 | |||||||||||||||
| Trade accounts receivable and other - opening balance | |||||||||||||||||
| Performance obligations satisfied | |||||||||||||||||
| Payments received | ( | ( | ( | ||||||||||||||
| Impairment of receivables (net of write backs and utilization) | ( | ( | |||||||||||||||
Reclassification of the period-end receivables from /(to) held for sale and recognition (derecognition) of receivables related to business combination and divestments 1 | |||||||||||||||||
TSR receivables retained in ArcelorMittal USA divestment 2 | ( | ||||||||||||||||
| Foreign exchange and others | ( | ( | |||||||||||||||
| Trade accounts receivable and other - closing balance | |||||||||||||||||
1.2023 mainly included receivables acquired as part of acquisition of ArcelorMittal Pecém (see note 2.2.4) and receivables from ArcelorMittal Temirtau recognized upon disposal partially offset by the derecognition of ArcelorMittal Temirtau's receivables (see note 2.3). 2022 included mainly receivables acquired as part of acquisition of ArcelorMittal Texas HBI (see note 2.2.4). 2021 included mainly receivables from the joint venture Acciaierie d'Italia (see note 2.3).
2.Cash collateral provided by the Company for the TSR receivables retained in ArcelorMittal USA at the time of disposal in 2020, subsequently fully realized in 2021.
293
| Consolidated financial statements | ||
| (millions of U.S. dollar, except share and per share data) | ||
4.2 Cost of sales
Cost of sales includes the following components:
| Year ended December 31, | |||||||||||||||||
| 2023 | 2022 | 2021 | |||||||||||||||
| Materials | |||||||||||||||||
| Labor costs | |||||||||||||||||
| Logistic expenses | |||||||||||||||||
| Depreciation and amortization | |||||||||||||||||
Net impairment charges/ (reversal) (note 5.3) | ( | ||||||||||||||||
| Foreign exchange translation losses upon disposal of Kazakhstan operations (note 2.3) | |||||||||||||||||
| Other | |||||||||||||||||
| Total | |||||||||||||||||
4.3 Trade accounts receivable and other
Trade accounts receivable are initially recorded at their transaction price and do not carry any interest. ArcelorMittal maintains an allowance for lifetime expected credit loss at an amount that it considers to be a reliable estimate of expected credit losses resulting from the inability of its customers to make required payments. In judging the adequacy of the allowance for expected credit losses, ArcelorMittal considers multiple factors including historical bad debt experience, the current and forward looking economic environment and the aging of the receivables. Recoveries of trade receivables previously reserved in the allowance for expected credit losses are recognized as gains in selling, general and administrative expenses.
ArcelorMittal’s policy is to record an allowance for expected lifetime credit losses and a charge in selling, general and administrative expense when a specific account is deemed uncollectible. The Company concluded that a trade receivable is in default when it is overdue by more than 180 days. Based on historical experience and analysis, the Company concluded that there is a risk of default as such receivables are generally not recoverable and therefore provided for, unless the collectability can be clearly demonstrated. Uninsured trade receivables and the associated allowance are written off when ArcelorMittal has
Trade accounts receivable and allowance for lifetime expected credit losses
| December 31, | |||||||||||
| 2023 | 2022 | ||||||||||
| Gross amount | |||||||||||
| Allowance for lifetime expected credit losses | ( | ( | |||||||||
| Total | |||||||||||
The carrying amount of the trade accounts receivable and other approximates their fair value. Before granting credit to any new customer, ArcelorMittal uses an internally developed credit scoring system to assess the potential customer’s credit quality and to define credit limits by customer. For all significant customers, the credit terms must be approved by the credit committees of each reportable segment. Limits and scoring attributed to customers are reviewed periodically. There are no customers who represent more than 5% of the total balance of trade accounts receivable.
Exposure to credit risk by reportable segment
The maximum exposure to credit risk for trade accounts receivable by reportable segment is as follows:
| December 31, | |||||||||||
| 2023 | 2022 | ||||||||||
| NAFTA | |||||||||||
| Brazil | |||||||||||
| Europe | |||||||||||
| ACIS | |||||||||||
| Mining | |||||||||||
| Total | |||||||||||
294
| Consolidated financial statements | ||
| (millions of U.S. dollar, except share and per share data) | ||
Aging of trade accounts receivable
| December 31, | December 31, | ||||||||||||||||||||||||||||||||||
| 2023 | 2022 | ||||||||||||||||||||||||||||||||||
| Gross | Allowance | Total | Gross | Allowance | Total | ||||||||||||||||||||||||||||||
| Not past due | ( | ( | |||||||||||||||||||||||||||||||||
| Overdue 1-30 days | ( | ( | |||||||||||||||||||||||||||||||||
| Overdue 31-60 days | ( | ( | |||||||||||||||||||||||||||||||||
| Overdue 61-90 days | ( | ||||||||||||||||||||||||||||||||||
| Overdue 91-180 days | ( | ( | |||||||||||||||||||||||||||||||||
| More than 180 days | ( | ( | |||||||||||||||||||||||||||||||||
| Total | ( | ( | |||||||||||||||||||||||||||||||||
The movements in the allowance are calculated based on lifetime expected credit loss model for 2023, 2022 and 2021. The allowances in respect of trade accounts receivable during the periods presented are as follows:
| Year ended December 31, | |||||||||||||||||
| 2023 | 2022 | 2021 | |||||||||||||||
| Allowance - opening balance | |||||||||||||||||
| Additions | |||||||||||||||||
| Write backs / utilization | ( | ( | ( | ||||||||||||||
| Foreign exchange and others | ( | ||||||||||||||||
| Allowance - closing balance | |||||||||||||||||
The Company has established a number of programs for sales without recourse of trade accounts receivable to various financial institutions (referred to as true sale of receivables (“TSR”). Through the TSR programs, certain operating subsidiaries of ArcelorMittal surrender the control, risks and benefits associated with the accounts receivable sold; therefore, the amount of receivables sold is recorded as a sale of financial assets and the balances are derecognized from the consolidated statements of financial position at the moment of sale. The Company classifies trade receivables subject to TSR as financial assets that are held to collect or to sell and recognizes them at FVOCI (see note 6). The fair value measurement is determined based on the invoice amount net of TSR expense payable, a Level 3 unobservable input. The TSR expense is insignificant due to the rate applicable and the short timeframe between the time of sale and the invoice due date. Any loss allowance for these trade receivables is recognized in OCI. As of December 31, 2023 and 2022, the total amount of trade accounts receivables sold amounted to 4.5 billion and 5.3 billion, respectively.
4.4 Inventories
Inventories are carried at the lower of cost or net realizable value. Cost is determined using the average cost method. Costs of production in process and finished goods include the
purchase costs of raw materials and conversion costs such as direct labor and an allocation of fixed and variable production overheads. Raw materials and spare parts are valued at cost, inclusive of freight, shipping, handling as well as any other costs incurred in bringing the inventories to their present location and condition. Interest charges, if any, on purchases have been recorded as financing costs. Costs incurred when production levels are abnormally low are capitalized as inventories based on normal capacity with the remaining costs incurred recorded as a component of cost of sales in the consolidated statements of operations.
Net realizable value represents the estimated selling price at which the inventories can be realized in the normal course of business after allowing for the cost of conversion from their existing state to a finished condition and for the cost of marketing, selling, and distribution. Net realizable value is estimated based on the most reliable evidence available at the time the estimates were made of being the amount that the inventory is expected to realize, taking into account the purpose for which the inventory is held.
Inventories, net of allowance for slow-moving inventory, excess of cost over net realizable value and obsolescence of 1,434 and 1,629 as of December 31, 2023 and 2022, respectively, are comprised of the following:
| December 31, | |||||||||||
| 2023 | 2022 | ||||||||||
| Finished products | |||||||||||
| Production in process | |||||||||||
| Raw materials | |||||||||||
Manufacturing supplies, spare parts and other 1 | |||||||||||
| Total | |||||||||||
295
| Consolidated financial statements | ||
| (millions of U.S. dollar, except share and per share data) | ||
Movements in the inventory write-downs are as follows:
| Year ended December 31, | |||||||||||||||||
| 2023 | 2022 | 2021 | |||||||||||||||
| Inventory write-downs - opening balance | |||||||||||||||||
Additions 1 | |||||||||||||||||
Deductions / Releases 2 | ( | ( | ( | ||||||||||||||
| Foreign exchange and others | ( | ( | |||||||||||||||
| Inventory write-downs - closing balance | |||||||||||||||||
1.Additions refer to write-downs of inventories excluding those utilized or written back during the same financial year.
2.Deductions/releases correspond to write-backs and utilization related to the prior periods.
4.5 Prepaid expenses and other current assets
| December 31, | |||||||||||
| 2023 | 2022 | ||||||||||
| VAT receivables | |||||||||||
| Prepaid expenses and non-trade receivables | |||||||||||
Financial amounts receivable2 | |||||||||||
| Income tax receivable | |||||||||||
| Receivables from public authorities | |||||||||||
| Receivables from sale of intangible, tangible and financial assets | |||||||||||
| Derivative financial instruments (notes 6.1 and 6.3) | |||||||||||
CO2 emission rights | |||||||||||
Other 1 | |||||||||||
| Total | |||||||||||
1.Other included mainly advances to employees, accrued interest and other miscellaneous receivables.
4.6 Other assets
Other assets consisted of the following:
| December 31, | |||||||||||
| 2023 | 2022 | ||||||||||
| Derivative financial instruments (notes 6.1 and 6.3) | |||||||||||
Financial amounts receivable2 | |||||||||||
| Long-term VAT receivables | |||||||||||
| Cash guarantees and deposits | |||||||||||
| Receivables from public authorities | |||||||||||
| Accrued interest | |||||||||||
| Receivables from sale of intangible, tangible and financial assets | |||||||||||
| Income tax receivable | |||||||||||
Other 1 | |||||||||||
| Total | |||||||||||
1.Other mainly includes assets in pension funds and other amounts receivable.
296
| Consolidated financial statements | ||
| (millions of U.S. dollar, except share and per share data) | ||
4.8 Accrued expenses and other liabilities
Accrued expenses and other liabilities were comprised of the following:
| December 31, | |||||||||||
| 2023 | 2022 | ||||||||||
| Accrued payroll and employee related expenses | |||||||||||
| Accrued interest and other payables | |||||||||||
| Payable from acquisition of intangible, tangible & financial assets | |||||||||||
| Other amounts due to public authorities | |||||||||||
| Derivative financial instruments (notes 6.1 and 6.3) | |||||||||||
| Put option liability ArcelorMittal Sul Fluminense (note 11.5.2) | |||||||||||
| Unearned revenue and accrued payables | |||||||||||
| Total | |||||||||||
5.1 Goodwill and intangible assets
The carrying amounts of goodwill and intangible assets are summarized as follows:
| December 31, | |||||||||||
| 2023 | 2022 | ||||||||||
| Goodwill on acquisitions | |||||||||||
| Concessions, patents and licenses | |||||||||||
| Customer relationships and trade marks | |||||||||||
Emission rights | |||||||||||
| Other | |||||||||||
| Total | |||||||||||
Goodwill
Goodwill acquired in business combinations for each of the Company’s operating segments is as follows:
| December 31, 2022 | Acquisitions1 | Foreign exchange differences and other movements | Divestments2 | December 31, 2023 | ||||||||||||||||
| NAFTA | ||||||||||||||||||||
| Brazil | ||||||||||||||||||||
| Europe | ||||||||||||||||||||
| ACIS | ( | ( | ||||||||||||||||||
| Total | ( | |||||||||||||||||||
| December 31, 2021 | Acquisitions1 | Foreign exchange differences and other movements | December 31, 2022 | ||||||||||||||||||||
| NAFTA | ( | ||||||||||||||||||||||
| Brazil | |||||||||||||||||||||||
| Europe | ( | ||||||||||||||||||||||
| ACIS | ( | ||||||||||||||||||||||
| Total | ( | ||||||||||||||||||||||
1.See note 2.2.4
2.See note 2.3
Intangible assets are recognized only when it is probable that the expected future economic benefits attributable to the assets will accrue to the Company and the cost can be reliably measured. Intangible assets acquired separately by ArcelorMittal are initially recorded at cost and those acquired in a business combination are initially recorded at fair value at the date of the business combination. These primarily include the cost of technology and licenses purchased from third parties and operating authorizations granted by governments or other public bodies (concessions). Intangible assets are amortized on a straight-line basis over their estimated economic useful lives, which typically do not exceed five years . Amortization is included in the consolidated statements of operations as part of cost of sales.
ArcelorMittal’s industrial sites which are regulated by the European Directive 2003/87/EC of October 13, 2003 on carbon dioxide (“CO2”) emission rights, effective as of January 1, 2005, are located primarily in Belgium, France, Germany, Luxembourg, Poland and Spain. In Ontario, Canada, ArcelorMittal's operations have been subject to output based pricing system regulations since January 1, 2019 but effective January 1, 2022, they are regulated on carbon pricing under the Ontario Emissions Performance System (“OEPS”). In South Africa, a CO2 tax system was introduced in 2019.
297
| Consolidated financial statements | ||
| (millions of U.S. dollar, except share and per share data) | ||
Other intangible assets are summarized as follows:
| Concessions, patents and licenses | Customer relationships and trade marks | Other | Total | ||||||||||||||||||||
| Cost | |||||||||||||||||||||||
| At December 31, 2021 | |||||||||||||||||||||||
Acquisitions1 | |||||||||||||||||||||||
| Acquisitions through business combinations (note 2.2.4) | |||||||||||||||||||||||
| Disposals | ( | ( | |||||||||||||||||||||
| Foreign exchange differences | ( | ( | ( | ( | |||||||||||||||||||
| Transfers and other movements | ( | ( | |||||||||||||||||||||
| At December 31, 2022 | |||||||||||||||||||||||
Acquisitions1 | |||||||||||||||||||||||
| Acquisitions through business combination (note 2.2.4) | |||||||||||||||||||||||
| Disposal | ( | ( | |||||||||||||||||||||
Divestment (note 2.3) | ( | ( | |||||||||||||||||||||
| Foreign exchange differences | |||||||||||||||||||||||
| Transfers and other movements | |||||||||||||||||||||||
| At December 31, 2023 | |||||||||||||||||||||||
| Accumulated amortization and impairment losses | |||||||||||||||||||||||
| At December 31, 2021 | |||||||||||||||||||||||
| Amortization charge | |||||||||||||||||||||||
| Impairment charge (note 5.3) | |||||||||||||||||||||||
| Foreign exchange differences | ( | ( | ( | ( | |||||||||||||||||||
| Transfers and other movements | ( | ( | |||||||||||||||||||||
| At December 31, 2022 | |||||||||||||||||||||||
Divestment (note 2.3) | ( | ( | |||||||||||||||||||||
| Amortization charge | |||||||||||||||||||||||
| Foreign exchange differences | |||||||||||||||||||||||
| Transfers and other movements | ( | ( | ( | ||||||||||||||||||||
| At December 31, 2023 | |||||||||||||||||||||||
| Carrying amount | |||||||||||||||||||||||
| At December 31, 2022 | |||||||||||||||||||||||
| At December 31, 2023 | |||||||||||||||||||||||
1.Acquisitions in 'other' mainly relate to CO2 emission rights.
Disposal of other intangible assets resulted in a 414 gain.
5.2 Property, plant and equipment and biological assets
Property, plant and equipment is recorded at cost less accumulated depreciation and impairment. Cost includes all related costs directly attributable to the acquisition or construction of the asset. Except for land and assets used in mining activities, property, plant and equipment is depreciated
using the straight-line method over the useful lives of the related assets as presented in the table below.
| Asset Category | Useful Life Range | |||||||
| Land | Not depreciated | |||||||
| Buildings | ||||||||
| Property plant & equipment | ||||||||
| Auxiliary facilities | ||||||||
| Other facilities | ||||||||
The Company’s annual review of useful lives leverages on the experience gained from an in-depth review performed every five years, any significant change in the expected pattern of consumption embodied in the asset, and the specialized
298
| Consolidated financial statements | ||
| (millions of U.S. dollar, except share and per share data) | ||
knowledge of ArcelorMittal’s network of chief technical officers. The chief technical officer network includes engineers with facility-specific expertise related to plant and equipment used in the principal production units of the Company’s operations. The most recent in-depth review took place in 2019, during which the Company performed a review of the useful lives of its fixed assets and determined there were no material changes to the useful lives of property, plant and equipment. In performing this review, the Company gathered and evaluated data, including commissioning dates, designed capacities, maintenance records and programs, and asset performance history, among other attributes. In accordance with IAS 16, Property, Plant and Equipment, the Company considered this information at the level of components significant in relation to the total cost of the item of plant and equipment. Other factors the Company considered in its determination of useful lives included the expected use of the assets, technical or commercial obsolescence, and operational factors. In addition, the Company considered the accumulated technical experience and knowledge sharing programs that allowed for the exchange of best practices within the chief technical officer network and the deployment of these practices across the Company’s principal production units.
Major improvements, which add to productive capacity or extend the life of an asset, are capitalized, while repairs and maintenance are expensed as incurred. Where a tangible fixed asset comprises major components having different useful lives, these components are accounted for as separate items.
Property, plant and equipment under construction is recorded as construction in progress until it is ready for its intended use; thereafter it is transferred to the related class of property, plant and equipment and depreciated over its estimated useful life. Interest incurred during construction is capitalized if the borrowing cost is directly attributable to the construction. Gains and losses on retirement or disposal of assets are recognized in cost of sales.
The residual values and useful lives of property, plant and equipment are reviewed at each reporting date and adjusted if expectations differ from previous estimates. Depreciation methods applied to property, plant and equipment are reviewed at each reporting date and changed if there has been a significant change in the expected pattern of consumption of the future economic benefits embodied in the asset. In the context of the 2021 annual review of useful lives and considering the expected date of retirement of certain assets in particular BF and BOF, sinter plants and coke plants following the implementation of the Company's decarbonization strategy involving the construction of DRI - EAF facilities, the Company decreased estimates of residual useful lives of such items of property, plant and equipment for its flat carbon operations in the EU and in Canada. Accordingly, depreciation charge
increased by 168 in 2023 and is expected to increase by 168 , 142 , 124 , 28 and 26 for the years ended December 31, 2024, 2025, 2026, 2027 and 2028, respectively.
Mining assets comprise:
•Mineral rights acquired;
•Capitalized developmental stripping (as described below in “—Stripping and overburden removal costs”).
Property, plant and equipment used in mining activities is depreciated over its useful life or over the remaining life of the mine, if shorter, and if there is no alternative use. For the majority of assets used in mining activities, the economic benefits from the asset are consumed in a pattern which is linked to the production level and accordingly, assets used in mining activities are primarily depreciated on a units-of-production basis. A unit-of-production is based on the available estimate of proven and probable reserves.
Capitalization of pre-production expenditures ceases when the mining property is capable of commercial production as it is intended by management. General administration costs that are not directly attributable to a specific exploration area are charged to the consolidated statements of operations.
Mineral Reserves and resources
Mineral Reserves are estimates of the amount of product that can be economically and legally extracted from the Company’s properties. Furthermore, mineral resource estimates constitute the part of a mineral deposit that have the potential to be economically and legally extracted or produced at the time of the resource determination. In order to estimate mineral reserves, estimates are required for a range of geological, technical and economic factors, including quantities, grades, production techniques, recovery rates, production costs, transport costs, commodity demand, commodity prices and exchange rates. The potential for economic viability and estimate of mineral resources is established through high level and conceptual engineering studies.
Estimating the quantity and/or grade of mineral reserves requires the size, shape and depth of ore bodies to be determined by analyzing geological data such as drilling samples. This process may require complex and difficult geological judgments to interpret the data. The estimation of mineral resource is based on detailed and reliable exploration, sampling and testing information gathered through appropriate techniques from locations such as outcrops, trenches, pits, workings and drill holes that are spaced closely enough to confirm both geological and grade continuity.
Because the economic assumptions used to estimate mineral reserves and mineral resources change from period to period, and because additional geological data is generated during the
299
| Consolidated financial statements | ||
| (millions of U.S. dollar, except share and per share data) | ||
course of operations, estimates of mineral reserves and mineral resources may change from period to period. Changes in reported mineral reserves and mineral resources may affect the Company’s financial results and financial position in a number of ways, including the following:
•Asset carrying amounts may be affected due to changes in estimated future cash flows.
•Depreciation, depletion and amortization charged in the consolidated statements of operations may change where such charges are determined by the units of production basis, or where the useful economic lives of assets change.
•Overburden removal costs recognized in the consolidated statements of financial position or charged to the consolidated statements of operations may change due to changes in stripping ratios or the units of production basis of depreciation.
•Decommissioning, site restoration and environmental provisions may change where changes in estimated reserves affect expectations about the timing or cost of these activities.
Stripping and overburden removal costs
In open pit and underground mining operations, it is often necessary to remove overburden and other waste materials to access the deposit from which minerals can be extracted. This process is referred to as stripping. Stripping costs can be incurred before the mining production commences (“developmental stripping”) or during the production stage (“production stripping”).
A mine can operate several open pits that are regarded as separate operations for the purpose of mine planning and production. In this case, stripping costs are accounted for separately, by reference to the ore extracted from each separate pit. If, however, the pits are highly integrated for the purpose of mine planning and production, stripping costs are aggregated.
The determination of whether multiple pit mines are considered separate or integrated operations depends on each mine’s specific circumstances. The following factors would point towards the stripping costs for the individual pits being accounted for separately:
•If mining of the second and subsequent pits is conducted consecutively with that of the first pit, rather than concurrently.
•If separate investment decisions are made to develop each pit, rather than a single investment decision being made at the outset.
•If the pits are operated as separate units in terms of mine planning and the sequencing of overburden and ore mining, rather than as an integrated unit.
•If expenditures for additional infrastructure to support the second and subsequent pits are relatively large.
•If the pits extract ore from separate and distinct ore bodies, rather than from a single ore body.
The relative importance of each factor is considered by local management to determine whether the stripping costs should be attributed to the individual pit or to the combined output from several pits.
Developmental stripping costs contribute to the future economic benefits of mining operations when the production begins and so are capitalized as tangible assets (construction in progress), whereas production stripping is a part of on-going activities and commences when the production stage of mining operations begins and continues throughout the life of a mine.
Capitalization of developmental stripping costs ends when the commercial production of the minerals commences.
Production stripping costs are incurred to extract the ore in the form of inventories and/or to improve access to an additional component of an ore body or deeper levels of material. Production stripping costs are accounted for as inventories to the extent the benefit from production stripping activity is realized in the form of inventories. Production stripping costs are recognized as a non-current asset (“stripping activity assets”) to the extent it is probable that future economic benefit in terms of improved access to ore will flow to the Company, the components of the ore body for which access has been improved can be identified and the costs relating to the stripping activity associated with that component can be measured reliably.
All stripping costs assets (either stripping activity assets or capitalized developmental stripping costs) are presented within a specific “mining assets” class of property, plant and equipment and then depreciated on a units-of-production basis.
Exploration and evaluation expenditure
Exploration and evaluation activities involve the search for iron ore and coal resources, the determination of technical feasibility and the assessment of commercial viability of an identified resource. Exploration and evaluation activities include:
•researching and analyzing historical exploration data;
•conducting topographical, geological, geochemical and geophysical studies;
300
| Consolidated financial statements | ||
| (millions of U.S. dollar, except share and per share data) | ||
•carrying out exploratory drilling, trenching and sampling activities;
•drilling, trenching and sampling activities to determine the quantity and grade of the deposit;
•examining and testing extraction methods and metallurgical or treatment processes; and
•detailed economic feasibility evaluations to determine whether development of the reserves is commercially justified and to plan methods for mine development.
Exploration and evaluation expenditure is charged to the consolidated statements of operations as incurred except in the following circumstances, in which case the expenditure is capitalized: (i) the exploration and evaluation activity is within an area of interest which was previously acquired in a business combination and measured at fair value on acquisition; or (ii) when management has a high degree of confidence in the project’s economic viability and it is probable that future economic benefits will flow to the Company.
Capitalized exploration and evaluation expenditures are generally recorded as a component of property, plant and equipment at cost less impairment charges, unless their nature requires them to be recorded as an intangible asset. As the asset is not available for use, it is not depreciated and all capitalized exploration and evaluation expenditure is monitored for indications of impairment. To the extent that capitalized expenditure is not expected to be recovered, it is recognized as an expense in the consolidated statements of operations.
Cash flows associated with exploration and evaluation expenditure are classified as operating activities when they are related to expenses or as an investing activity when they are related to a capitalized asset in the consolidated statements of cash flows.
Development expenditure
Development is the establishment of access to the mineral reserve and other preparations for commercial production. Development activities often continue during production and include:
•sinking shafts and underground drifts (often called mine development);
•making permanent excavations;
•developing passageways and rooms or galleries;
•building roads and tunnels; and
•advance removal of overburden and waste rock.
Development (or construction) also includes the installation of infrastructure (e.g., roads, utilities and housing), machinery, equipment and facilities.
Biological assets
Biological assets are part of the Brazil operating segment and consist of eucalyptus forests located in the Brazilian state of Minas Gerais exclusively from renewable plantations and intended for the production of charcoal to be utilized as fuel and a source of carbon in the direct reduction process of pig iron production in some of the Company’s blast furnaces in Brazil.
Power purchase agreements
Power purchase agreements, which provide for the physical delivery of renewable energy and which do not comply neither with the requirements of IFRS 10 for the existence of control or joint control over a company, IFRS 11 regarding the existence of joint operation over an asset, IFRS 16 for the recognition of a lease, nor with the definition of a derivative under IFRS 9 are accounted for as an executory contract on the basis of the own use exemption when the relevant conditions are met.
301
| Consolidated financial statements | ||
| (millions of U.S. dollar, except share and per share data) | ||
Property, plant and equipment and biological assets are summarized as follows:
| Land, buildings and Improvements | Machinery, equipment and other2 | Construction in progress | Right-of-use assets | Mining Assets | Total | ||||||||||||||||||||||||||||||
| Cost | |||||||||||||||||||||||||||||||||||
At December 31, 2021 | |||||||||||||||||||||||||||||||||||
| Additions | |||||||||||||||||||||||||||||||||||
| Acquisitions through business combinations (note 2.2.4) | |||||||||||||||||||||||||||||||||||
| Foreign exchange differences | ( | ( | ( | ( | ( | ( | |||||||||||||||||||||||||||||
| Disposals | ( | ( | ( | ( | ( | ||||||||||||||||||||||||||||||
Other movements 1 | ( | ( | ( | ||||||||||||||||||||||||||||||||
| At December 31, 2022 | |||||||||||||||||||||||||||||||||||
| Additions | |||||||||||||||||||||||||||||||||||
| Acquisitions through business combinations (note 2.2.4) | |||||||||||||||||||||||||||||||||||
| Foreign exchange differences | |||||||||||||||||||||||||||||||||||
| Disposals | ( | ( | ( | ( | ( | ||||||||||||||||||||||||||||||
Divestments (note 2.3) | ( | ( | ( | ( | ( | ||||||||||||||||||||||||||||||
Other movements 1 | ( | ( | ( | ||||||||||||||||||||||||||||||||
| At December 31, 2023 | |||||||||||||||||||||||||||||||||||
| Accumulated depreciation and impairment | |||||||||||||||||||||||||||||||||||
At December 31, 2021 | |||||||||||||||||||||||||||||||||||
| Depreciation charge for the year | |||||||||||||||||||||||||||||||||||
Impairment (note 5.3) | |||||||||||||||||||||||||||||||||||
| Disposals | ( | ( | ( | ( | ( | ||||||||||||||||||||||||||||||
| Foreign exchange differences | ( | ( | ( | ( | ( | ( | |||||||||||||||||||||||||||||
Other movements 1 | ( | ( | ( | ( | ( | ( | |||||||||||||||||||||||||||||
| At December 31, 2022 | |||||||||||||||||||||||||||||||||||
| Depreciation charge for the year | |||||||||||||||||||||||||||||||||||
| Impairment (note 5.3) | |||||||||||||||||||||||||||||||||||
| Disposals | ( | ( | ( | ( | |||||||||||||||||||||||||||||||
| Foreign exchange differences | ( | ||||||||||||||||||||||||||||||||||
Divestments (note 2.3) | ( | ( | ( | ( | ( | ||||||||||||||||||||||||||||||
Other movements 1 | ( | ( | ( | ( | |||||||||||||||||||||||||||||||
| At December 31, 2023 | |||||||||||||||||||||||||||||||||||
| Carrying amount | |||||||||||||||||||||||||||||||||||
| At December 31, 2022 | |||||||||||||||||||||||||||||||||||
| At December 31, 2023 | |||||||||||||||||||||||||||||||||||
1.Other movements predominantly represent transfers from construction in progress to other categories and retirement of fully depreciated assets.
2.Machinery, equipment and other includes biological assets of 64 and 47 as of December 31, 2023 and 2022, respectively, and bearer plants of 51 and 37 as of December 31, 2023 and 2022, respectively.
Capital expenditures relating to decarbonization and renewable energy projects
In 2023 and 2022, capital expenditures relating to decarbonization projects amounted to 0.2
The carrying amount of temporarily idle property, plant and equipment at December 31, 2023 and 2022 was 264 and 380 including 41 and 39 in Brazil, 6 and 6 in NAFTA, 112 and 89 in
the Europe segment and 105 and 246 in the ACIS segment, respectively.
The carrying amount of property, plant and equipment retired from active use and not classified as held for sale was 22 and nil at December 31, 2023 and 2022 respectively. Such assets are carried at their recoverable amount.
Assets pledged as security
See note 9.4 for information about assets pledged as security by the Company.
302
| Consolidated financial statements | ||
| (millions of U.S. dollar, except share and per share data) | ||
Capital commitments
See note 9.4 for information about contractual commitments for acquisition of property, plant and equipment by the Company.
5.3 Impairment of intangible assets, including goodwill, and tangible assets
Net impairment charges/(reversals) were as follows:
| Year ended December 31, | ||||||||||||||||||||
| Type of asset | 2023 | 2022 | 2021 | |||||||||||||||||
| Goodwill | ||||||||||||||||||||
| Intangible assets | ||||||||||||||||||||
| Tangible assets | ( | |||||||||||||||||||
| Total | ( | |||||||||||||||||||
Impairment test of goodwill
Goodwill is tested for impairment annually, as of October 1 or whenever changes in circumstances indicate that the carrying amount may not be recoverable, at the level of the groups of cash-generating units (“GCGU”) which correspond to the operating segments representing the lowest level at which goodwill is monitored for internal management purposes. Whenever the cash-generating units comprising the operating segments are tested for impairment at the same time as goodwill, the cash-generating units are tested first and any impairment of the assets is recorded prior to the testing of goodwill.
The recoverable amounts of the GCGUs are mainly determined based on their value in use. The value in use of each GCGU is determined by estimating future cash flows. The 2023 impairment test of goodwill did not include the GCGU corresponding to the Mining segment as goodwill allocated to this GCGU was fully impaired in 2015. The key assumptions for the value in use calculations are primarily the discount rates, growth rates, expected changes to average selling prices, shipments and direct costs during the period. Assumptions for average selling prices and shipments are based on historical experience and expectations of future changes in the market. In addition, with respect to raw material price assumptions, the Company applied a range of $70 per tonne to $114 per tonne for iron ore ($70 per tonne to $110 per tonne in 2022) and $185 per tonne to $250 per tonne ($170 per tonne to $268 per tonne in 2022) for coking coal. Cash flow forecasts adjusted for the risks specific to the tested assets are derived from the most recent financial plans approved by management for the next five years. Beyond the specifically forecasted period, the Company extrapolates cash flows for the remaining years based on an estimated growth rate of 2 %. This rate does not exceed the average long-term growth rate for the relevant markets.
The Company considered its exposure to certain climate-related risks which could affect its estimates of future cash flow
projections applied for the determination of the recoverable amount of its GCGUs and CGUs. With the switch to electric vehicles and the move to wind and solar power generation, the Company sees also additional opportunities as customers deepen their understanding of embedded and lifecycle emissions of the materials where steel compares favorably.
The Company is committed to the objectives of the Paris agreement and announced its ambition to reduce carbon emissions by 35 % in Europe and 25 % group-wide by 2030 and achieve group-wide carbon neutrality by 2050. These announced goals will require significant long-term investments which require global level playing field, access to abundant and affordable clean energy, facilitating necessary energy infrastructure, access to sustainable finance for low-emissions steelmaking and accelerated transition to a circular economy. In addition, the Company considered the legal obligation of carbon neutrality by 2050 effective within the EU and in Canada following adoption of the Climate Law and the Net Zero Emission Accountability Act, respectively. Accordingly, with respect to its flat steel operations in the EU and in Canada, ArcelorMittal concluded that future decarbonization capital expenditures, which correspond essentially to the construction of DRI-EAF facilities, are necessary to maintain the level of economic benefits expected to arise from the assets in their current condition and should therefore be included in the Company’s assumptions for future cash flows of the recoverable amount of the respective GCGUs and CGUs. At the same time, the Company is engaged in developing in the near to medium term a range of innovative low-emission technologies for the transition to decarbonized steel including the Smart Carbon route and the Hydrogen-DRI route and required investments are considered in the Company's future cash flow projections. ArcelorMittal acknowledges that CGUs and GCGUs applying the BF-BOF route in other jurisdictions than the EU and Canada will apply decarbonization at a different pace. They may also not yet be subject to a legal obligation of carbon neutrality, as a result of which the future estimated decarbonization cost for such operations is reflected through an additional risk premium embedded in discount rates until they are able to accelerate their decarbonization strategy to meet the 2050 carbon neutrality objective and a legal obligation arises in the relevant jurisdiction.
ArcelorMittal's most substantial climate-related policy risk is the EU Emissions Trading scheme ("'ETS"), which applies to all its European plants. The risk concerns the Company's primary steelmaking plants which are exposed to this regulation. On April 25, 2023, the EU adopted a revision of the ETS Directive including a regulation establishing a carbon border adjustment mechanism (“CBAM”) which entered into force on May 17, 2023. The ETS and CBAM regulations will impact the carbon emissions allowances from the second trading period of Phase
303
| Consolidated financial statements | ||
| (millions of U.S. dollar, except share and per share data) | ||
IV (2026-2030) onwards as they will be gradually phased out (2.5 % by 2026, 5 % by 2027, 10 % by 2028, 22.5 % by 2029, 48.5 % by 2030, 61 % by 2031, 73.5 % by 2032, 86 % by 2033 and 100 % by 2034). The Company’s assumptions for future cash flows include an estimate for costs that the Company expects to incur to acquire emission allowances, which primarily impacts the flat steel operations in the EU under the ETS scheme and in Canada. The assumption for carbon emission cost is based on historical experience, implementation of decarbonization strategies to mitigate or otherwise offset such future costs and information available of future regulatory or operational changes. With respect to the EU ETS scheme, the assumption for carbon emission cost includes also the gradual phasing out of free emission allowances and the forecast market price of emission rights, for which the Company considered in its five-year cash flow projections internal estimates of 85 €/t for 2024, 90 €/t for 2025 and 100 €/t for the period 2026-2028.
The assumptions used in the value in use calculations are inherently uncertain and require management judgment as described in note 1.3. The Company's process includes specific
consideration given to the most recent short, medium and long-term price forecasts and discount rates consistent with external information, expected production and shipment volumes and updated development plans, operating costs and capital expenditure plans. 2023 was impacted by a negative price-cost effect predominantly on account of lower average steel selling prices and lower steel shipments. The decline in steel spreads resulted from the pace of the decline in steel prices being greater than the reduction in the raw material basket and energy costs. At the end of the year, apparent demand conditions showed however signs of improvement as the destocking phase reached maturity.
Management estimates discount rates using pre-tax rates that reflect current market rates for investments of similar risk. The rate for each CGU, including beta, cost of debt and capital structure was estimated from the weighted average cost of capital of producers, which operate a portfolio of assets similar to those of the Company’s assets and CGU specific country risk premiums were applied. GCGU weighted average pre-tax discount rates were as follows in 2023 and 2022:
| NAFTA | Brazil | Europe | ACIS | ||||||||||||||||||||
| GCGU weighted average pre-tax discount rate used in 2023 (in %) | |||||||||||||||||||||||
| GCGU weighted average pre-tax discount rate used in 2022 (in %) | |||||||||||||||||||||||
Once recognized, impairment losses for goodwill are not reversed.
There were no 194 impairment loss relating to a portion of ACIS segment goodwill allocated to the disposal group in proportion of the total sale consideration to the recoverable amount of the remaining ACIS operations. The total value in use calculated for all GCGUs decreased overall in 2023 as compared to 2022 primarily as a result of higher discount rates in Europe and ACIS and lower cash flow projections for certain GCGUs.
In validating the value in use determined for the GCGUs, the Company performed a sensitivity analysis of key assumptions used in the discounted cash-flow model (such as discount rates, average steel selling prices and shipments). As of December 31, 2023, the Company believes that reasonably possible changes in key assumptions could cause an additional impairment loss to be recognized in respect of the ACIS segment.
ACIS produces a combination of flat and long products. Following the sale of the Company's operations in Kazakhstan, ACIS operations include facilities in South Africa and Ukraine. ACIS is significantly sufficient in iron ore. The Company believes that sales volumes, prices and discount rates are the key
assumptions most sensitive to change. ACIS is also exposed to export markets and international steel prices which are volatile, reflecting the cyclical nature of the global steel industry, developments in particular steel consuming industries and macroeconomic trends of emerging markets, such as economic growth. Discount rates may be affected by changes in countries’ specific risks; such risk premium increased significantly since 2022 in Ukraine in the context of the war with Russia. The latter also led to substantially lower levels of production, shipments and revenue at AMKR and such conditions are expected to continue throughout 2024. The ACIS value in use model anticipates an increase in sales volumes in 2024 (5.0 million tonnes) as compared to 2023 (3.4 million tonnes excluding shipments from the Company's operations in Kazakhstan) with higher shipments after 2024. Average selling prices in the model are expected to decrease steadily over time. The table below describes the amount by which the value assigned to a key assumption must change in order for the recoverable amount to equal the carrying amount.
| ACIS | |||||
| Excess of recoverable amount over carrying amount | |||||
| Increase in pre-tax discount rate (change in basis points) | |||||
| Decrease in average selling price (change in %) | % | ||||
| Decrease in shipments (change in %) | % | ||||
304
| Consolidated financial statements | ||
| (millions of U.S. dollar, except share and per share data) | ||
Impairment test of property, plant and equipment and intangibles (excluding goodwill)
At each reporting date, ArcelorMittal reviews the carrying amounts of its intangible assets (excluding goodwill) and tangible assets to determine whether there is any indication that the carrying amount of those assets may not be recoverable through continuing use. If any such indication exists, the recoverable amount of the asset (or cash generating unit) is reviewed in order to determine the amount of the impairment, if any. The recoverable amount is the higher of its fair value less cost of disposal and its value in use.
In estimating its value in use, the estimated future cash flows are discounted to their present value using a pre-tax discount rate that reflects current market assessments of the time value of money and the risks specific to the asset (or cash-generating unit). For an asset that does not generate cash inflows largely independent of those from other assets, the recoverable amount is determined for the cash-generating unit to which the asset belongs. The cash-generating unit is the smallest identifiable group of assets corresponding to operating units that generate cash inflows. If the recoverable amount of an asset (or cash-generating unit) is estimated to be less than its carrying amount, an impairment loss is recognized. An impairment loss is recognized as an expense immediately as part of cost of sales (see note 4.2) in the consolidated statements of operations.
In the case of permanently idled assets, the impairment is measured at the individual asset level. Otherwise, the Company’s assets are measured for impairment at the cash-generating unit level. In certain instances, the cash-generating unit is an integrated manufacturing facility which may also be an operating subsidiary. Further, a manufacturing facility may be operated in concert with another facility with neither facility generating cash inflows that are largely independent from the cash inflows of the other. In this instance, the two facilities are combined for purposes of testing for impairment. As of December 31, 2023 and December 31, 2022, the Company determined it has 46
An impairment loss, related to intangible assets other than goodwill and tangible assets recognized in prior years is
Impairment charges and reversals relating to property, plant and equipment and intangibles (excluding goodwill) were as follows for the years ended December 31, 2023, 2022 and 2021:
2023
In 2023, ArcelorMittal recognized a 732 impairment charge related to property, plant and equipment with respect to the sale on December 7, 2023 of its Kazakhstan operations in the ACIS segment to Qazaqstan Investment Corporation, a state-controlled direct investment fund. The impairment loss resulted from the adjustment of the carrying amount of the disposal group to the net sales proceeds of 278 (see note 2.3).
On November 28, 2023, AMSA announced that it contemplates the wind down of its Longs Business subject to a due diligence and a consultative process involving key customers, suppliers, organized labour, and other stakeholders. Since making the announcement, AMSA has been engaging with various stakeholders, including Government. These stakeholders have expressed widespread concern regarding the negative economic impact of the closure. AMSA was requested to consider what support was needed to change the closure decision. Discussions are currently still ongoing. The Company assessed the recoverable amount of its Longs Business in South Africa based on a value in use calculation and recognized accordingly a 112 impairment charge of property, plant and equipment.
Cash Generating Unit | Region | Operating Segment | Recoverable Amount (Value in Use) | Total Impairment Recorded | 2023 Pre-Tax Discount Rate | 2022 Pre-Tax Discount Rate | Carrying Amount of property, plant and equipment as of December 31, 2023 | ||||||||||||||||||||||||||||||||||
Long Products South Africa | South Africa | ACIS | % | % | |||||||||||||||||||||||||||||||||||||
2022
In 2022, the Company recognized a 1,026 impairment charge related to property, plant and equipment (1,020 ) and intangibles (6 ) with respect to AMKR (Ukraine) in the ACIS segment as a result of the ongoing conflict in Russia, which resulted in low
level of production, sales and net income and created significant uncertainty about the timing and ability of operations to return to a normal level of activity. Adverse geopolitical conditions, which resulted in a substantial increase in the discount rate applied by
305
| Consolidated financial statements | ||
| (millions of U.S. dollar, except share and per share data) | ||
the Company in its recoverable amount (value in use) calculation, deteriorated further during the fourth quarter of 2022 following attacks against Ukrainian power infrastructures causing additional operational issues for AMKR and the concerns about an intensification of the conflict in connection with the announcements of delivery of heavy military equipment
by western countries. The Company applied separate discount rates over the discrete projections period, including a higher country risk premium for 2023 cash flow projections and a return to pre-war country risk premium in the course of 2024 and for the terminal value calculation as value in use is sensitive to a difference in country risk for different periods.
| Cash-Generating Unit | Region | Operating Segment | Recoverable Amount (Value in Use) | Total Impairment Recorded | 2022 Pre-Tax Discount Rates | 2021 Pre-Tax Discount Rate | Carrying amount of property, plant and equipment as of December 31, 2022 | ||||||||||||||||||||||||||||||||||||||||
| Applied to 2023 projections | Applied to subsequent projections | ||||||||||||||||||||||||||||||||||||||||||||||
AMKR | Ukraine | ACIS | % | % | % | ||||||||||||||||||||||||||||||||||||||||||
2021
In the second half of 2021, in connection with the Company’s annual test for impairment of goodwill, property, plant and equipment was also tested for impairment at that date. The Company reversed 218 of impairment charges which had been recognized in 2015 for the Sestao facility in Spain following
idling for an indefinite timing. The impairment reversal results from improved future cash flow projections following restart of operations and the Company's decarbonization strategy in Spain.
| Cash-Generating Unit | Region | Operating Segment | Impairment Reversed | 2021 Pre-Tax Discount Rate | 2020 Pre-Tax Discount Rate | Carrying amount of property, plant and equipment as of December 31, 2021 | ||||||||||||||||||||||||||||||||
| Europe flat products | Europe | Europe | % | % | ||||||||||||||||||||||||||||||||||
6.1 Financial assets and liabilities
Financial assets and liabilities mainly comprise:
•gross debt (see note 6.1.2)
•cash and cash equivalents, restricted cash and reconciliations of cash flows (see note 6.1.3)
•net debt (see note 6.1.4)
•derivative financial instruments (see note 6.1.5)
The estimated fair values of certain financial instruments have been determined using available market information or other valuation methodologies that require judgment in interpreting
market data and developing estimates. The following table summarizes assets and liabilities based on their categories at December 31, 2023:
306
| Consolidated financial statements | ||
| (millions of U.S. dollar, except share and per share data) | ||
| December 31, 2023 | |||||||||||||||||||||||||||||||||||
| Carrying amount in the consolidated statements of financial position | Non-financial assets and liabilities | Assets / Liabilities at amortized cost | Fair value recognized in profit or loss | Fair value recognized in OCI | Derivatives | ||||||||||||||||||||||||||||||
| ASSETS | |||||||||||||||||||||||||||||||||||
| Current assets: | |||||||||||||||||||||||||||||||||||
| Cash and cash equivalents | |||||||||||||||||||||||||||||||||||
| Restricted cash | |||||||||||||||||||||||||||||||||||
| Trade accounts receivable and other | |||||||||||||||||||||||||||||||||||
| Inventories | |||||||||||||||||||||||||||||||||||
| Prepaid expenses and other current assets | |||||||||||||||||||||||||||||||||||
| Total current assets | |||||||||||||||||||||||||||||||||||
| Non-current assets: | |||||||||||||||||||||||||||||||||||
| Goodwill and intangible assets | |||||||||||||||||||||||||||||||||||
| Property, plant and equipment and biological assets | |||||||||||||||||||||||||||||||||||
| Investments in associates and joint ventures | |||||||||||||||||||||||||||||||||||
| Other investments | |||||||||||||||||||||||||||||||||||
| Deferred tax assets | |||||||||||||||||||||||||||||||||||
| Other assets | |||||||||||||||||||||||||||||||||||
| Total non-current assets | |||||||||||||||||||||||||||||||||||
| Total assets | |||||||||||||||||||||||||||||||||||
| LIABILITIES AND EQUITY | |||||||||||||||||||||||||||||||||||
| Current liabilities: | |||||||||||||||||||||||||||||||||||
| Short-term debt and current portion of long-term debt | — | ||||||||||||||||||||||||||||||||||
| Trade accounts payable and other | — | ||||||||||||||||||||||||||||||||||
| Short-term provisions | — | ||||||||||||||||||||||||||||||||||
| Accrued expenses and other liabilities | — | ||||||||||||||||||||||||||||||||||
| Income tax liabilities | — | ||||||||||||||||||||||||||||||||||
| Total current liabilities | — | ||||||||||||||||||||||||||||||||||
| Non-current liabilities: | |||||||||||||||||||||||||||||||||||
| Long-term debt, net of current portion | — | ||||||||||||||||||||||||||||||||||
| Deferred tax liabilities | — | ||||||||||||||||||||||||||||||||||
| Deferred employee benefits | — | ||||||||||||||||||||||||||||||||||
| Long-term provisions | — | ||||||||||||||||||||||||||||||||||
| Other long-term obligations | — | ||||||||||||||||||||||||||||||||||
| Total non-current liabilities | — | ||||||||||||||||||||||||||||||||||
| Equity: | |||||||||||||||||||||||||||||||||||
| Equity attributable to the equity holders of the parent | — | — | — | — | |||||||||||||||||||||||||||||||
| Non-controlling interests | — | — | — | — | |||||||||||||||||||||||||||||||
| Total equity | — | — | — | — | |||||||||||||||||||||||||||||||
| Total liabilities and equity | — | — | |||||||||||||||||||||||||||||||||
307
| Consolidated financial statements | ||
| (millions of U.S. dollar, except share and per share data) | ||
| December 31, 2022 | |||||||||||||||||||||||||||||||||||
| Carrying amount in the consolidated statements of financial position | Non-financial assets and liabilities | Assets / Liabilities at amortized cost | Fair value recognized in profit or loss | Fair value recognized in OCI | Derivatives | ||||||||||||||||||||||||||||||
| ASSETS | |||||||||||||||||||||||||||||||||||
| Current assets: | |||||||||||||||||||||||||||||||||||
| Cash and cash equivalents | |||||||||||||||||||||||||||||||||||
| Restricted cash | |||||||||||||||||||||||||||||||||||
| Trade accounts receivable and other | |||||||||||||||||||||||||||||||||||
| Inventories | |||||||||||||||||||||||||||||||||||
| Prepaid expenses and other current assets | |||||||||||||||||||||||||||||||||||
| Total current assets | |||||||||||||||||||||||||||||||||||
| Non-current assets: | |||||||||||||||||||||||||||||||||||
| Goodwill and intangible assets | |||||||||||||||||||||||||||||||||||
| Property, plant and equipment and biological assets | |||||||||||||||||||||||||||||||||||
| Investments in associates and joint ventures | |||||||||||||||||||||||||||||||||||
| Other investments | |||||||||||||||||||||||||||||||||||
| Deferred tax assets | |||||||||||||||||||||||||||||||||||
| Other assets | |||||||||||||||||||||||||||||||||||
| Total non-current assets | |||||||||||||||||||||||||||||||||||
| Total assets | |||||||||||||||||||||||||||||||||||
| LIABILITIES AND EQUITY | |||||||||||||||||||||||||||||||||||
| Current liabilities: | |||||||||||||||||||||||||||||||||||
| Short-term debt and current portion of long-term debt | — | ||||||||||||||||||||||||||||||||||
| Trade accounts payable and other | — | ||||||||||||||||||||||||||||||||||
| Short-term provisions | — | ||||||||||||||||||||||||||||||||||
| Accrued expenses and other liabilities | — | ||||||||||||||||||||||||||||||||||
| Income tax liabilities | — | ||||||||||||||||||||||||||||||||||
| Total current liabilities | — | ||||||||||||||||||||||||||||||||||
| Non-current liabilities: | |||||||||||||||||||||||||||||||||||
| Long-term debt, net of current portion | — | ||||||||||||||||||||||||||||||||||
| Deferred tax liabilities | — | ||||||||||||||||||||||||||||||||||
| Deferred employee benefits | — | ||||||||||||||||||||||||||||||||||
| Long-term provisions | — | ||||||||||||||||||||||||||||||||||
| Other long-term obligations | — | ||||||||||||||||||||||||||||||||||
| Total non-current liabilities | — | ||||||||||||||||||||||||||||||||||
| Equity: | |||||||||||||||||||||||||||||||||||
| Equity attributable to the equity holders of the parent | — | — | — | — | |||||||||||||||||||||||||||||||
| Non-controlling interests | — | — | — | — | |||||||||||||||||||||||||||||||
| Total equity | — | — | — | — | |||||||||||||||||||||||||||||||
| Total liabilities and equity | — | — | |||||||||||||||||||||||||||||||||
308
| Consolidated financial statements | ||
| (millions of U.S. dollar, except share and per share data) | ||
The Company classifies the bases used to measure certain assets and liabilities at their fair value. Assets and liabilities carried or measured at fair value have been classified into three levels based upon a fair value hierarchy that reflects the significance of the inputs used in making the measurements.
The levels are as follows:
Level 1: Quoted prices in active markets for identical assets or liabilities that the entity can access at the measurement date;
Level 2: Significant inputs other than within Level 1 that are observable for the asset or liability, either directly (i.e.: as prices) or indirectly (i.e.: derived from prices);
The following tables summarize the bases used to measure certain financial assets and financial liabilities at their fair value on recurring basis.
| As of December 31, 2023 | ||||||||||||||||||||||||||
| Level 1 | Level 2 | Level 3 | Total | |||||||||||||||||||||||
| Assets at fair value: | ||||||||||||||||||||||||||
| Investments in equity instruments at FVOCI | ||||||||||||||||||||||||||
| Trade accounts receivable and other subject to TSR programs* | ||||||||||||||||||||||||||
| Derivative financial current assets | ||||||||||||||||||||||||||
| Derivative financial non-current assets | ||||||||||||||||||||||||||
| Total assets at fair value | ||||||||||||||||||||||||||
| Liabilities at fair value: | ||||||||||||||||||||||||||
| Derivative financial current liabilities | ||||||||||||||||||||||||||
| Derivative financial non-current liabilities | ||||||||||||||||||||||||||
| Total liabilities at fair value | ||||||||||||||||||||||||||
*The fair value of TSR program receivables equals carrying amount due to the short time frame between the initial recognition and time of sale.
| As of December 31, 2022 | ||||||||||||||||||||||||||
| Level 1 | Level 2 | Level 3 | Total | |||||||||||||||||||||||
| Assets at fair value: | ||||||||||||||||||||||||||
| Investments in equity instruments at FVOCI | ||||||||||||||||||||||||||
| Trade accounts receivable and other subject to TSR programs* | ||||||||||||||||||||||||||
| Derivative financial current assets | ||||||||||||||||||||||||||
| Derivative financial non-current assets | ||||||||||||||||||||||||||
| Total assets at fair value | ||||||||||||||||||||||||||
| Liabilities at fair value: | ||||||||||||||||||||||||||
| Derivative financial current liabilities | ||||||||||||||||||||||||||
| Derivative financial non-current liabilities | ||||||||||||||||||||||||||
| Total liabilities at fair value | ||||||||||||||||||||||||||
*The fair value of TSR program receivables equals carrying amount due to the short time frame between the initial recognition and time of sale.
Investments in equity instruments at FVOCI classified as Level 1 refer to listed securities quoted in active markets and include mainly the investment in Erdemir (see note 2.5). A quoted market price in an active market provides the most reliable evidence of fair value and is used without adjustment to measure fair value whenever available, with limited exceptions. The total fair value is either the price of the most recent trade at the time of the market close or the official close price as defined
by the exchange on which the asset is most actively traded on the last trading day of the period, multiplied by the number of units held without consideration of transaction costs.
Derivative financial assets and liabilities classified as Level 2 refer to instruments to hedge fluctuations in interest rates, foreign exchange rates, raw materials (base metals), freight,
309
| Consolidated financial statements | ||
| (millions of U.S. dollar, except share and per share data) | ||
energy and emission rights, see note 6.1.5 for further information.
6.1.2 Gross debt
Gross debt includes bank debt, debenture loans and lease obligations and is stated at amortized cost.
6.1.2.1 Short-term debt
Short-term debt, including the current portion of long-term debt, consisted of the following:
| December 31, | |||||||||||
| 2023 | 2022 | ||||||||||
Short-term bank loans and other credit facilities including commercial paper 1 | |||||||||||
| Current portion of long-term debt | |||||||||||
Lease obligations2 | |||||||||||
| Total | |||||||||||
1.The weighted average interest rate on short-term borrowings outstanding was 5.5 % and 4.0 % as of December 31, 2023 and 2022, respectively.
2.See note 7.
Short-term bank loans and other credit facilities include short-term loans, overdrafts and commercial paper.
ArcelorMittal has entered into certain short-term committed bilateral credit facilities renewable on an annual basis. As of December 31, 2023, facilities totaling approximately 0.6 billion, remained fully available.
On July 27, 2022, the Company entered into a 2.2 billion bridge term facility agreement with a financial institution. The facility may be applied towards the purchase price for the intended acquisition of ArcelorMittal Pecém, as well as the refinancing of its existing indebtedness and the payment of related fees, costs and expenses. The facility was available for 12 months from signing with two extension options of 6 months each at the borrower's discretion. On December 8, 2022, an amount of 1.76 billion was cancelled, following the bonds issuances of September 20, 2022 and November 29, 2022. After the cancellation, the remaining available amount under the bridge facility as of December 31, 2022 was 444 . On January 31, 2023 the remaining amount available under the bridge facility of 444 was cancelled.
Commercial paper
The Company has a commercial paper program enabling borrowings of up to €1.5 billion. As of December 31, 2023 and 2022, the outstanding amount was 684 and 796 , respectively.
310
| Consolidated financial statements | ||
| (millions of U.S. dollar, except share and per share data) | ||
6.1.2.2 Long-term debt
Long-term debt is comprised of the following:
| December 31, | |||||||||||||||||||||||||||||
| 2023 | 2022 | ||||||||||||||||||||||||||||
| Year of maturity | Type of Interest | Interest rate1 | Carrying amount at amortized cost | ||||||||||||||||||||||||||
| Corporate | |||||||||||||||||||||||||||||
| 2023 - 2025 | Floating | ||||||||||||||||||||||||||||
€ | 2023 | Fixed | % | ||||||||||||||||||||||||||
€ | 2023 | Fixed | % | ||||||||||||||||||||||||||
€ | 2024 | Fixed | % | ||||||||||||||||||||||||||
| 2024 | Fixed | % | |||||||||||||||||||||||||||
| 2025 | Fixed | % | |||||||||||||||||||||||||||
€ | 2025 | Fixed | % | ||||||||||||||||||||||||||
| 2026 | Fixed | % | |||||||||||||||||||||||||||
€ | 2026 | Fixed | % | ||||||||||||||||||||||||||
| 2027 | Fixed | % | |||||||||||||||||||||||||||
| 2029 | Fixed | % | |||||||||||||||||||||||||||
| 2032 | Fixed | % | |||||||||||||||||||||||||||
| 2039 | Fixed | % | |||||||||||||||||||||||||||
| 2041 | Fixed | % | |||||||||||||||||||||||||||
| EIB loan | 2025 | Fixed | % | ||||||||||||||||||||||||||
| EIB loan | 2032 | Floating | % | ||||||||||||||||||||||||||
| Schuldschein loans | 2025 - 2027 | Fixed | |||||||||||||||||||||||||||
| Schuldschein loans | 2025 - 2027 | Floating | |||||||||||||||||||||||||||
| Other loans | 2023 | Fixed | |||||||||||||||||||||||||||
| Other loans | 2029 - 2035 | Floating | |||||||||||||||||||||||||||
| Total Corporate | |||||||||||||||||||||||||||||
| Americas | |||||||||||||||||||||||||||||
| Other loans | 2024 - 2030 | Fixed/Floating | |||||||||||||||||||||||||||
| Total Americas | |||||||||||||||||||||||||||||
| Europe, Asia & Africa | |||||||||||||||||||||||||||||
| EBRD Facility | 2024 - 2026 | Floating | |||||||||||||||||||||||||||
| Other loans | 2023 - 2043 | Fixed/Floating | |||||||||||||||||||||||||||
| Total Europe, Asia & Africa | |||||||||||||||||||||||||||||
| Total | |||||||||||||||||||||||||||||
| Less current portion of long-term debt | ( | ( | |||||||||||||||||||||||||||
| Total long-term debt (excluding lease obligations) | |||||||||||||||||||||||||||||
Long-term lease obligations2 | |||||||||||||||||||||||||||||
| Total long-term debt, net of current portion | |||||||||||||||||||||||||||||
1.Rates applicable to balances outstanding at December 31, 2023. For debt that has been redeemed in its entirety during 2023, the interest rates refer to the rates at repayment date.
2.Net of current portion of 207 and 228 as of December 31, 2023 and 2022, respectively. See note 7.
311
| Consolidated financial statements | ||
| (millions of U.S. dollar, except share and per share data) | ||
Corporate
On December 19, 2018, ArcelorMittal signed an agreement for a 5.5 billion revolving credit facility (the "Facility"). This Facility replaced the 5.5 billion revolving credit facility dated April 30, 2015, which was amended and extended on December 21, 2016. The agreement incorporated a single tranche of 5.5 billion maturing on December 19, 2023, with two one-year extension options. On November 27, 2019 and on November 26, 2020, ArcelorMittal exercised the options to extend the facility's maturity by one year to December 19, 2024 and to December 19, 2025, respectively. On December 19, 2023 extension was completed for 5.4 billion of the 5.5 billion revolving credit facility, with 0.1 billion lapsed at maturity. The Facility contains restrictive covenants, which among other things, limit encumbrances on the assets of ArcelorMittal and its subsidiaries, the ability of ArcelorMittal’s subsidiaries to incur debt and the ability of ArcelorMittal and its subsidiaries to dispose of assets in certain circumstances. ArcelorMittal's long-term credit rating was upgraded on August 9, 2021 by Moody's to 'Baa3' and its outlook was changed to positive by Moody's on February 19, 2024. On June 16, 2023, Standard & Poor's upgraded ArcelorMittal's outlook to positive and affirmed a long-term credit rating of 'BBB-'. On April 27, 2021, the Facility was amended so that the margin payable will be increased or decreased depending on the Company’s performance against two metrics measured annually against pre-defined targets with respect to its environmental and sustainability performance (CO2 intensity of the Company’s European operations and the number of facilities which have been certified by ResponsibleSteel™). The Facility may be used for general corporate purposes. As of December 31, 2023, the 5.4 billion revolving credit facility was fully available. The Company make drawdowns from and repayments on the Facility in the framework of its cash management.
On September 30, 2010, ArcelorMittal entered into 500 revolving multi-currency letter of credit facility (the "Letter of Credit
Facility"). The Letter of Credit Facility is used by the Company and its subsidiaries for the issuance of letters of credit and other instruments. The terms of the letters of credit and other instruments contain certain restrictions as to duration. The Letter of Credit Facility was amended on October 26, 2012 and September 30, 2014 to reduce its amount to 450 and to 350 , respectively. On July 31, 2019, the Company refinanced its Letter of Credit Facility by entering into a 350 revolving multi-currency letter of credit facility, which initially matured on July 31, 2022. On August 5, 2020, the Letter of Credit Facility maturity was extended to July 31, 2023. On November 25, 2020, the amount of the Letter of Credit Facility was increased to 395 . On June 25, 2021, the maturity of the Letter of Credit Facility was extended to July 31, 2024.
Bonds
On January 17, 2023, at maturity, ArcelorMittal fully repaid the outstanding €367 million (395 ) of its €500 million Fixed Rate Notes due 2023.
On May 19, 2023, at maturity, ArcelorMittal fully repaid €750 million (812 ) Fixed Rate Notes due 2023.
On January 17, 2024, at maturity, ArcelorMittal fully repaid the outstanding €529 million (585 ) of its €1.0 billion Fixed Rate Notes due 2024.
The margin applicable to ArcelorMittal’s principal credit facilities (5.4 billion Revolving Credit Facility and certain other credit facilities) and the coupons on certain of its outstanding bonds are subject to adjustment in the event of a change in its long-term credit ratings.
The following table provides details of the outstanding bonds on maturity, the original coupons and the current interest rates for the bonds impacted by changes in the long-term credit rating:
| Initial value | Nominal amount of outstanding value | Date of issuance | Repayment date | Interest rate1 | Issued at | ||||||||||||||||||||||||||||||
€ | € | Jul 4, 2019 | Jan 17, 2024 | % | % | ||||||||||||||||||||||||||||||
€ | € | Jan 17, 2019 | Jan 17, 2024 | % | % | ||||||||||||||||||||||||||||||
| Jul 16, 2019 | Jul 16, 2024 | % | % | ||||||||||||||||||||||||||||||||
| Jun 1, 2015 | Jun 1, 2025 | % | % | ||||||||||||||||||||||||||||||||
€ | € | Nov 19, 2019 | Nov 19, 2025 | % | % | ||||||||||||||||||||||||||||||
| Mar 11, 2019 | Mar 11, 2026 | % | % | ||||||||||||||||||||||||||||||||
€ | € | Sep 26, 2022 | Sep 28, 2026 | % | % | ||||||||||||||||||||||||||||||
| Nov 29, 2022 | Nov 29, 2027 | % | % | ||||||||||||||||||||||||||||||||
| Jul 16, 2019 | Jul 16, 2029 | % | % | ||||||||||||||||||||||||||||||||
| Nov 29, 2022 | Nov 29, 2032 | % | % | ||||||||||||||||||||||||||||||||
| Oct 8, 2009 | Oct 15, 2039 | % | % | ||||||||||||||||||||||||||||||||
| Aug 5, 2010 | Oct 15, 2039 | % | % | ||||||||||||||||||||||||||||||||
| Mar 7, 2011 | Mar 1, 2041 | % | % | ||||||||||||||||||||||||||||||||
1.Rates applicable at December 31, 2023.
312
| Consolidated financial statements | ||
| (millions of U.S. dollar, except share and per share data) | ||
European Investment Bank (“EIB”) Loan
On June 2, 2021, ArcelorMittal signed a €280 million loan agreement with the European Investment Bank ("EIB") for funding of research, development and innovation projects in Europe over the period of 2021-2023. This operation benefits from a guarantee from the European Union under the European Fund for Strategic Investments. On March 16, 2022 ArcelorMittal draw down the facility in full. As of December 31, 2023, €280 million (309 ) was outstanding.
On December 16, 2016, ArcelorMittal signed a €350 million finance contract with the EIB in order to finance European research, development and innovation projects over the period 2017-2020 within the European Union, predominantly in France, Belgium and Spain, but also in Poland and Luxembourg. This operation benefits from a guarantee from the European Union under the European Fund for Strategic Investments. As of December 31, 2023, €73 million (81 ) was outstanding.
Other loans
On May 4, 2022, ArcelorMittal completed the offering of a €346.5 million variable rate loan, a €24.5 million fixed rate loan, a €263 million variable rate loan and a €66 million fixed rate loan in the German Schuldschein market. On May 6, 2022, the Company further completed the offering of a €25 million fixed rate loan. The proceeds of these issuances were used for general corporate purposes. As of December 31, 2023, €723 million (799 ) was outstanding.
On December 21, 2018, the Company entered into a facility agreement with a group of lenders for €235 million to finance the construction of a new hot strip mill in Mexico. This facility became effective upon issuance of a guarantee by the Oesterreichische Kontrollbank AG in March 2019. The last installment under this agreement is due December 28, 2029. The outstanding amount in total as of December 31, 2023 was €122 million (134 ).
On November 29, 2021, ArcelorMittal entered into an agreement for financing with a financial institution for net proceeds of CAD130 million (105 ) with repayment over several dates in 2021, 2022 and 2023. As of December 31, 2023, the loan was fully repaid.
Other loans relate to various debt with banks and public institutions.
Americas
Other loans
Other loans relate mainly to loans contracted by ArcelorMittal subsidiaries in Mexico with different counterparties.
Europe, Asia and Africa
On December 21, 2017, AMKR entered into a 175 loan agreement with the European Bank for Reconstruction and
Development ("EBRD") in order to support the upgrade of its production facilities, energy efficiency improvement and environmental impact reduction. The loan agreement also provides for an additional 175 in loan facilities which are currently uncommitted. As of December 31, 2023, 18 was outstanding under the agreement.
On December 15, 2022, AMKR entered into a 100 loan agreement with EBRD for working capital purposes. As of December 31, 2023, 100 was drawn under the agreement.
On November 17, 2023, AMKR entered into a 150 loan agreement with EBRD for working capital purposes. 59 were committed and fully drawn as of December 31, 2023. 91 will be committed by EBRD in 2024 upon AMKR's request.
On May 25, 2017, ArcelorMittal South Africa signed a 4.5 billion South African rand revolving borrowing base finance facility maturing on May 25, 2020. The facility was amended and extended on July 26, 2019 with a maturity of July 26, 2022. On August 23, 2021, the facility was further amended and restated for an amount of 3.5 billion South African rand and with a maturity of September 3, 2024. On August 30, 2023, the facility was further amended and restated for an amount of 4.5 billion South African rand and with a maturity of September 7, 2026. Any borrowings under the facility are secured by certain eligible inventory and receivables, as well as certain other working capital and related assets of ArcelorMittal South Africa. The facility is used for general corporate purposes. The facility is not guaranteed by ArcelorMittal. As of December 31, 2023, 3.0 billion South African rand (162 ) was drawn.
Other loans
Other loans mainly relate to loans contracted by ArcelorMittal subsidiaries with different counterparties.
Hedge of net investments
As of April 1, 2018, the Company designated a portfolio of euro denominated debt (€3,627 million and €4,862 million as of December 31, 2023 and 2022, respectively) as a hedge of certain euro denominated investments (€8,635 million and €8,837 million as of December 31, 2023 and 2022, respectively) in order to mitigate the foreign currency risk arising from certain euro denominated subsidiaries' net assets. The risk arises from the fluctuation in spot exchange rates between the U.S. dollar and euro, which causes the amount of the net investments to vary. The hedged risk in the hedge of net investments is a risk of a weakening euro against the U.S. dollar that will result in a reduction in the carrying amount of the Company's net investments in the subsidiaries subject to the hedge. The euro denominated debt is designated as a hedging instrument for the
313
| Consolidated financial statements | ||
| (millions of U.S. dollar, except share and per share data) | ||
change in the value of the net investments that is attributable to changes in the euro/U.S. dollar spot rate.
To assess the hedge effectiveness, the Company determines the economic relationship between the hedging instrument and the hedged item by comparing changes in the carrying amount of the debt portfolio that are attributable to a change in the spot rate with changes in the net investments in the foreign operations due to movements in the spot rate.
As of December 31, 2023 and 2022, the Company recognized 166 foreign exchange loss and 197 foreign exchange gain arising on the translation of the euro denominated debt designated as a hedge of the euro denominated net investments in foreign operations in other comprehensive income within the foreign exchange translation reserve.
Maturity profile
As of December 31, 2023 the scheduled maturities of short-term debt, long-term debt and long-term lease obligations, including their current portion are as follows:
| Year of maturity | Amount | |||||||
| 2024 | ||||||||
| 2025 | ||||||||
| 2026 | ||||||||
| 2027 | ||||||||
| 2028 | ||||||||
| Subsequent years | ||||||||
| Total | ||||||||
Fair value
The following tables summarize the Company’s bases used to estimate its debt at fair value. Fair value measurement has been classified into three levels based upon a fair value hierarchy that reflects the significance of the inputs used in making the measurements.
| As of December 31, 2023 | Carrying amount | Fair Value | |||||||||||||||||||||||||||
| Level 1 | Level 2 | Level 3 | Total | ||||||||||||||||||||||||||
| Instruments payable bearing interest at fixed rates | |||||||||||||||||||||||||||||
| Instruments payable bearing interest at variable rates | |||||||||||||||||||||||||||||
| Total long-term debt, including current portion | |||||||||||||||||||||||||||||
| Short term bank loans and other credit facilities including commercial paper | |||||||||||||||||||||||||||||
| As of December 31, 2022 | Carrying amount | Fair Value | |||||||||||||||||||||||||||
| Level 1 | Level 2 | Level 3 | Total | ||||||||||||||||||||||||||
| Instruments payable bearing interest at fixed rates | |||||||||||||||||||||||||||||
| Instruments payable bearing interest at variable rates | |||||||||||||||||||||||||||||
| Total long-term debt, including current portion | |||||||||||||||||||||||||||||
| Short term bank loans and other credit facilities including commercial paper | |||||||||||||||||||||||||||||
Instruments payable classified as Level 1 refer to the Company’s listed bonds quoted in active markets. The total fair value is the official closing price as defined by the exchange on which the instrument is most actively traded on the last trading day of the period, multiplied by the number of units held without consideration of transaction costs.
Instruments payable classified as Level 2 refer to all debt instruments not classified as Level 1. The fair value of the debt is based on estimated future cash flows converted into U.S. dollar at the forward rate and discounted using current U.S. dollar zero coupon rates and ArcelorMittal’s credit spread quotations for the relevant maturities. There were no instruments payable classified as Level 3.
6.1.3 Cash and cash equivalents, restricted cash and reconciliations of cash flows
Cash and cash equivalents consist of cash and short-term highly liquid investments that are readily convertible to cash with original maturities of three months or less at the time of purchase and are carried at cost plus accrued interest, which approximates fair value.
Cash and cash equivalents are primarily centralized at the parent level and are managed by ArcelorMittal Treasury SNC, although from time to time cash or cash equivalent balances may be held at the Company’s international subsidiaries or its holding companies. Some of these operating subsidiaries have debt outstanding or are subject to acquisition agreements that
314
| Consolidated financial statements | ||
| (millions of U.S. dollar, except share and per share data) | ||
Cash and cash equivalents consisted of the following:
| December 31, | |||||||||||
| 2023 | 2022 | ||||||||||
| Cash at bank | |||||||||||
| Term deposits | |||||||||||
Money market funds1 | |||||||||||
| Total | |||||||||||
Restricted cash represents cash and cash equivalents not readily available to the Company, mainly related to insurance
Restricted cash of 97 as of December 31, 2023 and 114 as of December 31, 2022 included 54 and 52 relating to various environmental obligations, true sales of receivables programs and letters of credit issued in ArcelorMittal South Africa. It also included 13 and 20 in connection with the mandatory convertible bonds as of December 31, 2023 and December 31, 2022, respectively (see note 11.2).
Changes in restricted cash are included within investing activities in the consolidated statements of cash flows.
Reconciliation of liabilities arising from financing activities
The table below details changes in the Company's liabilities arising from financing activities, including both cash and non-cash changes. Liabilities arising from financing activities are those for which cash flows were, or future cash flows will be classified in the Company's consolidated statements of cash flows from financing activities.
| Long-term debt, net of current portion | Short-term debt and current portion of long term debt | ||||||||||
| Balance as of December 31, 2021 (note 6.1.2) | |||||||||||
| Proceeds from long-term debt | — | ||||||||||
| Payments of long-term debt | — | ||||||||||
| Amortized cost | |||||||||||
| Proceeds from short-term debt | — | ||||||||||
| Payments of short-term debt | — | ( | |||||||||
| Current portion of long-term debt | ( | ||||||||||
Payments of principal portion of lease liabilities (note 7) 1 | ( | ( | |||||||||
| Additions to lease liabilities (notes 5.2 and 7) | |||||||||||
| Unrealized foreign exchange effects and other movements | ( | ( | |||||||||
| Balance as of December 31, 2022 (note 6.1.2) | |||||||||||
| Proceeds from long-term debt | — | ||||||||||
| Payments of long-term debt | ( | — | |||||||||
| Amortized cost | ( | ||||||||||
| Proceeds from short-term debt | — | ||||||||||
| Payments of short-term debt | — | ( | |||||||||
| Current portion of long-term debt | ( | ||||||||||
Payments of principal portion of lease liabilities (note 7) 1 | ( | ( | |||||||||
| Additions to lease liabilities (notes 5.2 and 7) | |||||||||||
| Unrealized foreign exchange effects and other movements | |||||||||||
| Balance as of December 31, 2023 (note 6.1.2) | |||||||||||
315
| Consolidated financial statements | ||
| (millions of U.S. dollar, except share and per share data) | ||
6.1.4 Net debt
The Company monitors its net debt in order to manage its capital. The following tables present the structure of the Company’s net debt by original currency translated into USD at December 31, 2023 and December 31, 2022:
| As of December 31, 2023 | Total | EUR | USD | ARS | BRL | INR | Other | ||||||||||||||||||||||||||||||||||
| Short-term debt and current portion of long-term debt | |||||||||||||||||||||||||||||||||||||||||
| Long-term debt, net of current portion | |||||||||||||||||||||||||||||||||||||||||
| Cash and cash equivalents and restricted cash | ( | ( | ( | ( | ( | ( | ( | ||||||||||||||||||||||||||||||||||
| Net debt | ( | ( | ( | ||||||||||||||||||||||||||||||||||||||
| As of December 31, 2022 | Total | EUR | USD | ARS | BRL | INR | Other | ||||||||||||||||||||||||||||||||||
| Short-term debt and current portion of long-term debt | |||||||||||||||||||||||||||||||||||||||||
| Long-term debt, net of current portion | |||||||||||||||||||||||||||||||||||||||||
| Cash and cash equivalents, restricted cash and other restricted funds | ( | ( | ( | ( | ( | ( | ( | ||||||||||||||||||||||||||||||||||
| Net debt | ( | ( | ( | ( | ( | ||||||||||||||||||||||||||||||||||||
6.1.5 Derivative financial instruments
The Company uses derivative financial instruments principally to manage its exposure to fluctuations in interest rates, exchange rates, prices of raw materials, energy and emission rights allowances arising from operating, financing and investing activities. Derivative financial instruments are classified as current or non-current assets or liabilities based on their maturity dates and are accounted for at the trade date. Embedded derivatives are separated from the host contract and accounted for separately if they are not closely related to the host contract. The Company measures all derivative financial instruments based on fair values derived from market prices of the instruments or from option pricing models, as appropriate. Gains or losses arising from changes in fair value of derivatives are recognized in the consolidated statements of operations, except for derivatives that are designated and qualify for cash flow or net investment hedge accounting.
Changes in the fair value of a derivative that is designated and qualifies as a cash flow hedge are recorded in other comprehensive income. Amounts deferred in equity are recorded in the consolidated statements of operations in the periods when the hedged item is recognized in the consolidated statements of operations and within the same line item (see note 6.3 Cash flow hedges).
The Company formally assesses, both at the hedge’s inception and on an ongoing basis, whether the derivatives that are used in hedging transactions are effective in offsetting changes in fair values or cash flows of hedged items. When a hedging
instrument is sold, terminated, expired or exercised, the accumulated gain or loss on the hedging instrument is maintained in equity until the forecasted transaction occurs. If the hedged transaction is no longer probable, the cumulative gain or loss, which had been recognized in equity, is reported immediately in the consolidated statements of operations.
Foreign currency differences arising on the translation of a financial liability designated as a hedge of a net investment in a foreign operation are recognized directly as a separate component of equity, to the extent that the hedge is effective. To the extent that the hedge is ineffective, such differences are recognized in the consolidated statements of operations (see note 6.3 Net investment hedge).
316
| Consolidated financial statements | ||
| (millions of U.S. dollar, except share and per share data) | ||
Derivative financial instruments classified as Level 2:
The following tables summarize this portfolio:
| December 31, 2023 | |||||||||||||||||||||||
| Assets | Liabilities | ||||||||||||||||||||||
| Notional Amount | Fair Value | Notional Amount | Fair Value | ||||||||||||||||||||
| Interest rate instruments | |||||||||||||||||||||||
Other interest rate instruments | |||||||||||||||||||||||
Total interest rate instruments | |||||||||||||||||||||||
| Foreign exchange rate instruments | |||||||||||||||||||||||
| Forward purchase contracts | ( | ||||||||||||||||||||||
| Forward sale contracts | ( | ||||||||||||||||||||||
| Exchange option purchases | ( | ||||||||||||||||||||||
| Exchange options sales | ( | ||||||||||||||||||||||
| Total foreign exchange rate instruments | ( | ||||||||||||||||||||||
| Raw materials (base metals), freight, energy, emission rights | |||||||||||||||||||||||
| Term contracts sales | ( | ||||||||||||||||||||||
| Term contracts purchases | ( | ||||||||||||||||||||||
| Options sales/purchases | |||||||||||||||||||||||
| Total raw materials (base metals), freight, energy, emission rights | ( | ||||||||||||||||||||||
| Total | ( | ||||||||||||||||||||||
| December 31, 2022 | |||||||||||||||||||||||
| Assets | Liabilities | ||||||||||||||||||||||
| Notional Amount | Fair Value | Notional Amount | Fair Value | ||||||||||||||||||||
| Foreign exchange rate instruments | |||||||||||||||||||||||
| Forward purchase contracts | ( | ||||||||||||||||||||||
| Forward sale contracts | ( | ||||||||||||||||||||||
| Exchange option purchases | ( | ||||||||||||||||||||||
| Exchange options sales | ( | ||||||||||||||||||||||
| Total foreign exchange rate instruments | ( | ||||||||||||||||||||||
| Raw materials (base metals), freight, energy, emission rights | |||||||||||||||||||||||
| Term contracts sales | ( | ||||||||||||||||||||||
| Term contracts purchases | ( | ||||||||||||||||||||||
| Option sales/purchases | ( | ||||||||||||||||||||||
| Total raw materials (base metals), freight, energy, emission rights | ( | ||||||||||||||||||||||
| Total | ( | ||||||||||||||||||||||
317
| Consolidated financial statements | ||
| (millions of U.S. dollar, except share and per share data) | ||
In 2022, the Company unwound natural gas and emission rights forward purchase contracts with notional of €0.3 billion and €0.7 billion, respectively, and carrying amount of 1,025 and 1,086 , respectively, designated as a cash flow hedge of future natural gas and emission rights purchases. The deferred gain recognized in other comprehensive income will be recycled to the consolidated statements of operations when the hedged item impacts profit or loss (see note 6.3). In addition, at maturity of forward purchases of emission rights with notional amount of €0.7 billion and carrying amount of 1,408 designated as a cash flow hedge of future emission rights purchases, the Company (i) removed 1,268 (953 net of tax) deferred gain recognized in other comprehensive income from the cash flow hedge reserve (see note 6.3) and included it in the 671 carrying amount of the delivered emission rights as basis adjustment (see note 5.1) and (ii) recycled 140 (104 net of tax) to the consolidated statements of operations in cost of sales (see note 6.3).
Derivative financial assets and liabilities classified as Level 2: Refer to instruments to hedge fluctuations in interest rates, foreign exchange rates, raw materials (base metals), freight, energy and emission rights. The total fair value is based on the price a dealer would pay or receive for the security or similar securities, adjusted for any terms specific to that asset or liability. Market inputs are obtained from well-established and recognized vendors of market data and the fair value is calculated using standard industry models based on significant observable market inputs such as foreign exchange rates, commodity prices, swap rates and interest rates.
Derivative financial instruments classified as Level 3:
The fair valuation of Level 3 derivative instruments is established at each reporting date and compared to the prior period. ArcelorMittal’s valuation policies for Level 3 derivatives are an integral part of its internal control procedures and have been reviewed and approved according to the Company’s principles for establishing such procedures. In particular, such procedures address the accuracy and reliability of input data, the accuracy of the valuation model and the knowledge of the staff performing the valuations.
Call option on MCB
ArcelorMittal establishes the fair valuation of the call option on the 660 mandatory convertible bonds (on March 14, 2023, the Company through its wholly-owned subsidiary Hera Ermac early repaid 226,666 out of the 666,666 outstanding unsecured and unsubordinated bonds mandatorily convertible into preferred shares of such subsidiary (see note 11.2) through the use of binomial valuation models based on the estimated values of the underlying equity spot price of $102 ($127 at December 31, 2022) and volatility of 10 % (13 % at December 31, 2022). Binomial valuation models use an iterative procedure to price options, allowing for the specification of nodes, or points in time, during the time span between the valuation date and the
option’s expiration date. In contrast to the Black-Scholes model, which provides a numerical result based on inputs, the binomial model allows for the calculation of the asset and the option for multiple periods along with the range of possible results for each period.
Observable input data used in the valuations include zero coupon yield curves, stock market price, European Central Bank foreign exchange fixing and SOFR Term curve interest rates. Unobservable inputs are used to measure fair value to the extent that relevant observable inputs are not available. Specifically, the Company computed unobservable volatility data during 2023 based mainly on the movement of China Oriental stock market prices observable in the active market over 90 working days, which is particularly sensitive for the valuation resulting from the model. A 10% increase or decrease in Hera Ermac share prices would result in a 1027 % and 96 % increase and decrease of the fair value of the call option at December 31, 2023, respectively.
Electricity option
ArcelorMittal and an electricity supplier entered into a multi-buyer power supply contract on French market. Other clients of this contract are committed to purchase electricity from the supplier with opt-out rights to be exercised in 2024 for 2025-2029 delivery period and in 2029 for 2030-2034 delivery period. The Company is committed to acquire up to 51 % of the opt-out volumes.
The fair value of the option is based on the Black-Scholes formula model. Observable input data used in the valuation include euro zero coupon yield curve and electricity forward prices for tenors quoted by the European Energy Exchange (EEX). Unobservable input data is used to measure fair value to the extent relevant observable inputs are not available. For instance, electricity forward prices are extrapolated for tenors not quoted by EEX and volatility is computed based on historical settlement prices over the last 3 years. A 10% increase and decrease in electricity forward prices would result in a 19 % decrease and 26 % increase, respectively, of the fair value of the option at December 31, 2023.
The following table summarizes the reconciliation of the fair value of the financial instrument classified as Level 3:
Electricity option | Call option on | ||||||||||
| Balance as of December 31, 2021 | |||||||||||
| Change in fair value | ( | ||||||||||
| Balance as of December 31, 2022 | |||||||||||
| Change in fair value | ( | ||||||||||
| Balance as of December 31, 2023 | ( | ||||||||||
318
| Consolidated financial statements | ||
| (millions of U.S. dollar, except share and per share data) | ||
The fair value movement relating to the Level 3 derivative instrument is recognized in financing costs-net in the consolidated statements of operations .
6.1.6 Other non-derivative financial assets and liabilities
Impairment of financial assets
In relation to the impairment of financial assets, an expected credit loss ("ECL") model is required. The ECL model requires the Group to account for expected credit losses and changes in those ECL at each reporting date to reflect changes in credit risk since initial recognition of the financial assets. In particular, the Company measures the loss allowance for a financial instrument at an amount equal to the lifetime ECL if the credit risk on that financial instrument has increased significantly since initial recognition. Receivables aged 31 days or older and uninsured trade receivables remain consistent with historical levels and the Company did not identify any expected increased risk of default (note 4.3).
All fair value movements for investments in equity instruments at FVOCI, including the difference between the acquisition cost and the current fair value, are recorded in OCI and are not reclassified to the consolidated statements of operations. Investments in equity instruments at FVOCI are exempt from the impairment test because the fair value of the investment is recorded in OCI and not reclassified to profit and loss.
Financial assets are tested for ECLs annually or whenever changes in circumstances indicate that there is a change in credit risk. Any ECL is recognized in the consolidated statements of operations. An ECL related to financial assets is reversed if and to the extent there has been a change in the factors used to determine the recoverable amount. The loss is reversed only to the extent that the asset’s carrying amount does not exceed the carrying amount that would have been determined if no ECL had been recognized. Reversals of ECLs are recognized in net income, except for investments in equity
instruments at FVOCI, in which all fair value movements are recognized in OCI.
6.2 Financing costs - net
Financing costs - net recognized in the years ended December 31, 2023, 2022 and 2021 are as follows:
| Year ended December 31, | |||||||||||||||||
| 2023 | 2022 | 2021 | |||||||||||||||
| Interest expense | ( | ( | ( | ||||||||||||||
| Interest income | |||||||||||||||||
Change in fair value adjustment on call option on mandatory convertible bonds | ( | ( | |||||||||||||||
| Accretion of defined benefit obligations and other long term liabilities | ( | ( | ( | ||||||||||||||
| Net foreign exchange gain/(loss) | ( | ( | |||||||||||||||
Other1 | ( | ( | ( | ||||||||||||||
| Total | ( | ( | ( | ||||||||||||||
1.Other mainly included expenses related to true sale of receivables (“TSR”) programs and bank fees. In 2023, others included 66 relating to the term extension of mandatorily convertible bonds (see note 11.2). In 2021, other also included 163 charges related to an unfavorable court decision in an arbitration case against Sitrel (see note 9.3), 130 premiums and fees related to the early redemption of bonds in 2021, and 61 charges related to early redemption of MCNs (see note 11.2).
6.3 Risk management policy
The Company's operations expose it to a variety of financial risks: interest rate risk, foreign exchange risk, liquidity risk and risks in fluctuations in prices of raw materials, freight, energy and CO2 emissions. The Company actively monitors and seeks to reduce volatility of these exposures through a diversity of financial instruments, where considered appropriate. The Company has formalized how it manages these risks within the Treasury and Financial Risk Management Policy, which has been approved by Management.
Capital management
The Company's objective when managing capital is to safeguard continuity, maintain a strong credit rating and healthy capital ratios to support its business and provide adequate return to shareholders through continuing growth.
The Company sets the amount of capital required on the basis of annual business and long-term operating plans which include capital and other strategic investments. The funding requirement is met through a combination of equity, bonds and other long-term and short-term borrowings.
The Company monitors capital using a gearing ratio, being the ratio of net debt as a percentage of total equity.
319
| Consolidated financial statements | ||
| (millions of U.S. dollar, except share and per share data) | ||
| December 31, | |||||||||||
| 2023 | 2022 | ||||||||||
| Total equity | |||||||||||
| Net debt | |||||||||||
| Gearing | % | % | |||||||||
Interest rate risk
The Company is exposed to interest rate risk on short-term and long-term floating rate instruments and on refinancing of fixed rate debt. The Company's policy is to maintain a balance of fixed and floating interest rate borrowings, which is adjusted depending on the prevailing market interest rates and outlook. As at December 31, 2023, the long-term debt was comprised of 84 % fixed rate debt and 16 % variable rate debt (note 6.1.2). The Company may utilize certain instruments to manage interest rate risks. Interest rate instruments allow the Company to borrow long-term at fixed or variable rates, and to swap the rate of this debt either at inception or during the lifetime of the borrowing. The Company and its counterparties exchange, at predefined intervals, the difference between the agreed fixed rate and the variable rate, calculated on the basis of the notional amount of the swap. Similarly, swaps may be used for the exchange of variable rates against other variable rates.
Foreign exchange rate risk
The Company is exposed to changes in values arising from foreign exchange rate fluctuations generated by its operating activities. Because a substantial portion of ArcelorMittal’s assets, liabilities, sales and earnings are denominated in currencies other than the U.S. dollar (its reporting currency), ArcelorMittal has an exposure to fluctuations and depreciation in the values of these currencies relative to the U.S. dollar. These currency fluctuations, especially the fluctuation of the value of the U.S. dollar relative to the euro, the Canadian dollar, Brazilian real, Polish Zloty, South African rand, Mexican peso and Ukrainian hryvnia, as well as fluctuations in the other countries’ currencies in which ArcelorMittal has significant operations and/or sales, could have a material impact on its financial position, cash flows and results of operations.
ArcelorMittal faces transaction risk, where its businesses generate sales in one currency but incur costs relating to that revenue in a different currency. For example, ArcelorMittal’s subsidiaries may purchase raw materials, including iron ore and coking coal, in U.S. dollar, but may sell finished steel products in other currencies. Consequently, an appreciation of the U.S. dollar will increase the cost of raw materials; thereby having a negative impact on the Company’s operating margins, unless the Company is able to pass along the higher cost in the form of higher selling prices.
Following its Treasury and Financial Risk Management Policy, the Company hedges a portion of its net exposure to foreign exchange rates through forwards, options and swaps.
ArcelorMittal also faces foreign currency translation risk, which arises when ArcelorMittal translates the statements of operations of its subsidiaries, its corporate net debt (note 6.1.4) and other items denominated in currencies other than the U.S. dollar, for inclusion in the consolidated financial statements. The Company manages translation risk arising from its investments in subsidiaries by monitoring the currency mix of the consolidated statements of financial position. The Company may enter into derivative transactions to hedge the residual exposure (see “Net investment hedge”).
The Company also uses derivative instruments at the corporate level to hedge debt recorded in foreign currency other than the functional currency or the balance sheet risk associated with certain monetary assets denominated in a foreign currency other than the functional currency.
Foreign currency sensitivity analysis
As of December 31, 2023, the Company is mainly subject to foreign exchange exposure relating to the euro, Brazilian real, Canadian dollar, South African rand, Mexican peso, Polish zloty, Argentine peso and Ukrainian hryvnia against the U.S. dollar resulting from its trade payables and receivables. The structure of trade receivables and trade payables by original currency translated in USD is as follows as of December 31, 2023:
| December 31, 2023 | |||||||||||
| Trade receivables | Trade payables | ||||||||||
| USD | |||||||||||
| EUR | |||||||||||
| BRL | |||||||||||
| CAD | |||||||||||
| GBP | |||||||||||
| ZAR | |||||||||||
| MXN | |||||||||||
| UAH | |||||||||||
| PLN | |||||||||||
| ARS | |||||||||||
| Other | |||||||||||
| Total | |||||||||||
The sensitivity analysis carried out by the Company considers the effects on its trade receivables and trade payables of a 10 % increase or decrease between the relevant foreign currencies and the U.S. dollar.
320
| Consolidated financial statements | ||
| (millions of U.S. dollar, except share and per share data) | ||
| 10% increase | 10% decrease | ||||||||||||||||||||||
| Trade receivables | Trade payables | Trade receivables | Trade payables | ||||||||||||||||||||
| EUR | ( | ( | |||||||||||||||||||||
| BRL | ( | ( | |||||||||||||||||||||
| CAD | ( | ( | |||||||||||||||||||||
| GBP | ( | ( | |||||||||||||||||||||
| ZAR | ( | ( | |||||||||||||||||||||
| MXN | ( | ( | |||||||||||||||||||||
| UAH | ( | ( | |||||||||||||||||||||
| PLN | ( | ( | |||||||||||||||||||||
| ARS | ( | ( | |||||||||||||||||||||
The use of a 10 % sensitivity rate is used when reporting foreign currency exposure internally to key management personnel and represents management’s assessment of the reasonably possible change in foreign exchange rates. The sensitivity analysis includes trade receivables and trade payables denominated in a currency other than the U.S. dollar and adjusts their translation at the period end for a 10 % change in foreign currency rates. For trade receivables, a positive number indicates an income and a negative number an expense. For trade payables, a positive number indicates an expense and a negative number an income.
Hedge accounting policy
The Company determines the economic relationship between the hedged item and the hedging instrument by analyzing the critical terms of the hedge relationship. In case critical terms do not match and fair value changes in the hedging instrument cannot be expected to perfectly offset changes in the fair value of the hedged item, further qualitative analysis may be performed. Such analysis serves to establish whether the economic relationship is sufficiently strong to comply with the Company’s risk management policies.
The hedge ratio is set out in the Company's risk management strategy and may be individually tailored for each hedging
program in the risk management objective. Hedge ratios below 100% would usually be applied on hedging of forecast exposures with the hedge ratio typically reducing where there is uncertainty due to long hedging tenors or volatility in the underlying exposure.
Liquidity Risk
Liquidity risk is the risk that the Company may encounter difficulties in meeting its obligations associated with financial liabilities that are settled by delivering cash. ArcelorMittal Treasury is responsible for the Company's funding and liquidity management. ArcelorMittal’s principal sources of liquidity are cash generated from its operations, its credit lines at the corporate level and various working capital credit lines at the level of its operating subsidiaries. The Company actively manages its liquidity. Following the Company's Treasury and Financial Risk Management Policy, the levels of cash, credit lines and debt are closely monitored and appropriate actions are taken in order to comply with the covenant ratios, leverage, fixed/floating ratios, maturity profile and currency mix.
The contractual maturities of the below financial liabilities include estimated loan repayments, interest payments and settlement of derivatives, excluding any impact of netting agreements. The cash flows are calculated based on market data as of December 31, 2023, and as such are sensitive to movements in mainly foreign exchange rates and interest rates. The cash flows are non-discounted, except for derivative financial liabilities where the cash flows equal their fair values.
321
| Consolidated financial statements | ||
| (millions of U.S. dollar, except share and per share data) | ||
| December 31, 2023 | |||||||||||||||||||||||||||||||||||
| Carrying amount | Contractual Cash Flow | 2024 | 2025 | from 2026 to 2028 | After 2028 | ||||||||||||||||||||||||||||||
| Non-derivative financial liabilities | |||||||||||||||||||||||||||||||||||
| Bonds | ( | ( | ( | ( | ( | ( | |||||||||||||||||||||||||||||
| Loans over 100 | ( | ( | ( | ( | ( | ( | |||||||||||||||||||||||||||||
| Trade and other payables | ( | ( | ( | ||||||||||||||||||||||||||||||||
| Other loans and leases | ( | ( | ( | ( | ( | ( | |||||||||||||||||||||||||||||
| Total | ( | ( | ( | ( | ( | ( | |||||||||||||||||||||||||||||
| Derivative financial liabilities | |||||||||||||||||||||||||||||||||||
| Foreign exchange contracts | ( | ( | ( | ( | ( | ||||||||||||||||||||||||||||||
Commodity contracts1 | ( | ( | ( | ( | ( | ||||||||||||||||||||||||||||||
| Total | ( | ( | ( | ( | ( | ( | |||||||||||||||||||||||||||||
1.Commodity contracts include base metals, freight, energy and emission rights.
| December 31, 2022 | |||||||||||||||||||||||||||||||||||
| Carrying amount | Contractual Cash Flow | 2023 | 2024 | from 2025 to 2027 | After 2027 | ||||||||||||||||||||||||||||||
| Non-derivative financial liabilities | |||||||||||||||||||||||||||||||||||
| Bonds | ( | ( | ( | ( | ( | ( | |||||||||||||||||||||||||||||
| Loans over 100 | ( | ( | ( | ( | ( | ( | |||||||||||||||||||||||||||||
| Trade and other payables | ( | ( | ( | ||||||||||||||||||||||||||||||||
| Other loans and leases | ( | ( | ( | ( | ( | ( | |||||||||||||||||||||||||||||
| Total | ( | ( | ( | ( | ( | ( | |||||||||||||||||||||||||||||
| Derivative financial liabilities | |||||||||||||||||||||||||||||||||||
| Foreign exchange contracts | ( | ( | ( | ( | |||||||||||||||||||||||||||||||
Commodity contracts1 | ( | ( | ( | ( | ( | ||||||||||||||||||||||||||||||
| Total | ( | ( | ( | ( | ( | ||||||||||||||||||||||||||||||
Cash flow hedges
The following tables present the periods in which the derivatives designated as cash flows hedges are expected to mature:
| December 31, 2023 | |||||||||||||||||||||||||||||||||||
| Assets/ (liabilities) | (Outflows)/inflows | ||||||||||||||||||||||||||||||||||
| Fair value | 3 months and less | 3-6 months | 6-12 months | 2025 | After 2025 | ||||||||||||||||||||||||||||||
| Foreign exchange contracts | ( | ( | ( | ( | |||||||||||||||||||||||||||||||
| Commodities | |||||||||||||||||||||||||||||||||||
| Emission rights | |||||||||||||||||||||||||||||||||||
| Total | |||||||||||||||||||||||||||||||||||
322
| Consolidated financial statements | ||
| (millions of U.S. dollar, except share and per share data) | ||
| December 31, 2022 | |||||||||||||||||||||||||||||||||||
| Assets/ (liabilities) | (Outflows)/inflows | ||||||||||||||||||||||||||||||||||
| Fair value | 3 months and less | 3-6 months | 6-12 months | 2024 | After 2024 | ||||||||||||||||||||||||||||||
| Foreign exchange contracts | ( | ( | |||||||||||||||||||||||||||||||||
| Commodities | ( | ||||||||||||||||||||||||||||||||||
| Emission rights | |||||||||||||||||||||||||||||||||||
| Total | ( | ||||||||||||||||||||||||||||||||||
Associated gains or losses that were recognized in other comprehensive income are reclassified to the consolidated statements of operations in the same period during which the hedged forecasted cash flow affects the consolidated statements of operations. The following table presents the periods in which the realized and unrealized gains or losses on derivatives designated as cash flows hedges recognized in other comprehensive income, net of tax, are expected to impact the consolidated statements of operations:
| December 31, 2023 | |||||||||||||||||||||||||||||||||||
Cash flow hedge reserve1 | (Expense)/income | ||||||||||||||||||||||||||||||||||
| Carrying amount | 3 months and less | 3-6 months | 6-12 months | 2025 | After 2025 | ||||||||||||||||||||||||||||||
| Foreign exchange contracts | |||||||||||||||||||||||||||||||||||
| Commodity contracts | |||||||||||||||||||||||||||||||||||
| Emission rights | |||||||||||||||||||||||||||||||||||
| Total | |||||||||||||||||||||||||||||||||||
1.The cash flow hedge reserve balance as of December 31, 2023 includes 417 deferred gains for the Company's share of such reserves at its equity method investments, which are not included in the table above (1,023 as of December 31, 2022).
December 31, 2022 | |||||||||||||||||||||||||||||||||||
Cash flow hedge reserve1 | (Expense)/income | ||||||||||||||||||||||||||||||||||
| Carrying amount | 3 months and less | 3-6 months | 6-12 months | 2024 | After 2024 | ||||||||||||||||||||||||||||||
| Foreign exchange contracts | |||||||||||||||||||||||||||||||||||
| Commodity contracts | |||||||||||||||||||||||||||||||||||
| Emission rights | |||||||||||||||||||||||||||||||||||
| Total | |||||||||||||||||||||||||||||||||||
1.The cash flow hedge reserve balance as of December 31, 2022 also includes 1,023 deferred gains for the Company's share of such reserves at its equity method investments, which are not included in the table above (603 as of December 31, 2021).
323
| Consolidated financial statements | ||
| (millions of U.S. dollar, except share and per share data) | ||
The following tables summarize the effect of hedge accounting on ArcelorMittal’s consolidated statement of financial position, statement of comprehensive income and statement of changes in equity.
| December 31, 2023 | |||||||||||||||||||||||
| Hedging Instruments | Nominal amount of the hedging instrument | Assets carrying amount | Liabilities carrying amount | Line item in the statement of financial position where the hedging instrument is located | |||||||||||||||||||
| Cash flow hedges | |||||||||||||||||||||||
| Foreign exchange risk - Option/forward/swap contracts | ( | Prepaid expenses and other current assets/Accrued expenses and other liabilities | |||||||||||||||||||||
| Foreign exchange risk - Option/forward/swap contracts | Other assets/Other long-term obligations | ||||||||||||||||||||||
| Price risk - Commodities forwards | ( | Prepaid expenses and other current assets/Accrued expenses and other liabilities | |||||||||||||||||||||
| Price risk - Commodities forwards | ( | Other assets/Other long-term obligations | |||||||||||||||||||||
| Price risk - Emission rights forwards | Prepaid expenses and other current assets/Accrued expenses and other liabilities | ||||||||||||||||||||||
| Total | ( | ||||||||||||||||||||||
| Current derivative assets classified as cash flow hedge | |||||||||||||||||||||||
| Other current derivative assets | |||||||||||||||||||||||
| Total current derivative assets (note 4.5) | |||||||||||||||||||||||
| Non-current derivative assets classified as cash flow hedge | |||||||||||||||||||||||
| Other non-current derivative assets | |||||||||||||||||||||||
| Total non-current derivative assets (note 4.6) | |||||||||||||||||||||||
| Current derivative liabilities classified as cash flow hedge | ( | ||||||||||||||||||||||
| Other current derivative liabilities | ( | ||||||||||||||||||||||
| Total current derivative liabilities (note 4.8) | ( | ||||||||||||||||||||||
| Non-current derivative liabilities classified as cash flow hedge | ( | ||||||||||||||||||||||
| Other non-current derivative liabilities | ( | ||||||||||||||||||||||
| Total non-current derivative liabilities (note 9.2) | ( | ||||||||||||||||||||||
| December 31, 2023 | |||||||||||||||||||||||||||||
| Hedging Instruments | Cash flow hedge reserve at December 31, 2022 | Hedging gains or losses of the reporting period that were recognized in OCI | Gains or losses reclassification adjustment and hedge ineffectiveness | Basis adjustment | Line item in the statement of comprehensive income that includes the reclassification adjustment and hedge ineffectiveness | Cash flow hedge reserve1 at December 31, 2023 | |||||||||||||||||||||||
| Cash flow hedges | |||||||||||||||||||||||||||||
| Foreign exchange risk - Option/Forward contracts | ( | Sales | |||||||||||||||||||||||||||
| Price risk - Commodities Option/Forward contracts | ( | ( | Sales, Cost of sales | ||||||||||||||||||||||||||
| Price risk - Emission rights forwards | ( | Cost of sales | |||||||||||||||||||||||||||
| Total | ( | ( | |||||||||||||||||||||||||||
1.The cash flow hedge reserve balance as of December 31, 2023 also includes 417 deferred gains for the Company's share of such reserves at its equity method investments, which are not disclosed above.
324
| Consolidated financial statements | ||
| (millions of U.S. dollar, except share and per share data) | ||
| December 31, 2022 | |||||||||||||||||||||||
| Hedging Instruments | Nominal amount of the hedging instrument | Assets carrying amount | Liabilities carrying amount | Line item in the statement of financial position where the hedging instrument is located | |||||||||||||||||||
| Cash flow hedges | |||||||||||||||||||||||
| Foreign exchange risk - Option/Forward contracts | ( | Prepaid expenses and other current assets/Accrued expenses and other liabilities | |||||||||||||||||||||
| Foreign exchange risk - Option/Forward/Swap contracts | ( | Other assets/Other long-term obligations | |||||||||||||||||||||
| Price risk - Commodities forwards | ( | Prepaid expenses and other current assets/Accrued expenses and other liabilities | |||||||||||||||||||||
| Price risk - Commodities forwards | ( | Other assets/Other long-term obligations | |||||||||||||||||||||
| Price risk - Emission rights forwards | Prepaid expenses and other current assets/Accrued expenses and other liabilities | ||||||||||||||||||||||
| Total | ( | ||||||||||||||||||||||
| Current derivative assets classified as cash flow hedge | |||||||||||||||||||||||
| Other current derivative assets | |||||||||||||||||||||||
| Total current derivative assets (note 4.5) | |||||||||||||||||||||||
| Non-current derivative assets classified as cash flow hedge | |||||||||||||||||||||||
| Other non-current derivative assets | |||||||||||||||||||||||
| Total non-current derivative assets (note 4.6) | |||||||||||||||||||||||
| Current derivative liabilities classified as cash flow hedge | ( | ||||||||||||||||||||||
| Other current derivative liabilities | ( | ||||||||||||||||||||||
| Total current derivative liabilities (note 4.8) | ( | ||||||||||||||||||||||
| Non-current derivative liabilities classified as cash flow hedge | ( | ||||||||||||||||||||||
| Other non-current derivative liabilities | |||||||||||||||||||||||
| Total non-current derivative liabilities (note 9.2) | ( | ||||||||||||||||||||||
| December 31, 2022 | |||||||||||||||||||||||||||||||||||
| Hedging Instruments | Cash flow hedge reserve at December 31, 2021 | Hedging gains or losses of the reporting period that were recognized in OCI | Gains or losses reclassification adjustment and hedge ineffectiveness | Basis adjustment | Line item in the statement of comprehensive income that includes the reclassification adjustment and hedge ineffectiveness | Cash flow hedge reserve1 at December 31, 2022 | |||||||||||||||||||||||||||||
| Cash flow hedges | |||||||||||||||||||||||||||||||||||
| Foreign exchange risk - Option/Forward contracts | ( | ( | Sales | ||||||||||||||||||||||||||||||||
Price risk - Commodities forwards1 | ( | ( | Sales, Cost of sales | ||||||||||||||||||||||||||||||||
| Price risk - Emission rights forwards | ( | ( | Cost of sales | ||||||||||||||||||||||||||||||||
| Total | ( | ( | |||||||||||||||||||||||||||||||||
1.The cash flow hedge reserve balance as of December 31, 2022 also includes 1,023 deferred gains for the Company's share of such reserves at its equity method investments, which are not disclosed above
325
| Consolidated financial statements | ||
| (millions of U.S. dollar, except share and per share data) | ||
Net investment hedge
The Company designated a portfolio of euro denominated debt as a hedge of certain euro denominated investments (see also note 6.1.2.2.)
The Company has periodically hedged a part of its euro denominated net investments via euro/U.S. dollar cross
currency swaps ("CCS"). These CCS, all of which have been unwound, were designated as net investment hedges. The hedging instrument is categorized as Level 2.
The following tables summarizes the historical gain/loss that will be recycled to the consolidation statements of operations when the hedged assets are disposed of.
December 31, 20231 | |||||||||||||||||||||||
| Date traded | Date maturity /unwound | Notional | OCI gross | Deferred tax | OCI net of deferred tax | ||||||||||||||||||
| December, 2014 | January, 2016 | ( | |||||||||||||||||||||
| May, 2015 | March, 2020 | ( | |||||||||||||||||||||
| May, 2015 | July, 2019 | ( | ( | ||||||||||||||||||||
| March, 2018 | June, 2018 | ( | |||||||||||||||||||||
| April, 2019 | November, 2019 | ( | |||||||||||||||||||||
| Total | ( | ||||||||||||||||||||||
1.In 2023 and in 2022, the Company did not designate any new CCS as net investment hedge.
| December 31, 2023 | |||||||||||||||||||||||||||||||||||||||||
| Hedging Instruments | Nominal amount of the hedging instrument | Assets carrying amount | Liabilities carrying amount | Line item in the statement of financial position where the hedging instrument is located | Change in value used for calculating hedge ineffectiveness for 2021 | Line item in the statement of comprehensive income that includes the recognized hedge ineffectiveness | Foreign currency translation reserve | ||||||||||||||||||||||||||||||||||
| Net investment hedges | |||||||||||||||||||||||||||||||||||||||||
| Foreign exchange risk - Cross Currency Swap | N/a | N/a | |||||||||||||||||||||||||||||||||||||||
| Foreign exchange risk - EUR debt | Short-term debt and current portion of long-term debt; long-term debt, net of current portion | N/a | |||||||||||||||||||||||||||||||||||||||
| Total | |||||||||||||||||||||||||||||||||||||||||
| December 31, 2022 | |||||||||||||||||||||||||||||||||||||||||
| Hedging Instruments | Nominal amount of the hedging instrument | Assets carrying amount | Liabilities carrying amount | Line item in the statement of financial position where the hedging instrument is located | Change in value used for calculating hedge ineffectiveness for 2020 | Line item in the statement of comprehensive income that includes the recognized hedge ineffectiveness | Foreign currency translation reserve | ||||||||||||||||||||||||||||||||||
| Net investment hedges | |||||||||||||||||||||||||||||||||||||||||
| Foreign exchange risk - Cross Currency Swap | N/a | N/a | |||||||||||||||||||||||||||||||||||||||
| Foreign exchange risk - EUR debt | ( | Short-term debt and current portion of long-term debt; long-term debt, net of current portion | N/a | ||||||||||||||||||||||||||||||||||||||
| Total | ( | ||||||||||||||||||||||||||||||||||||||||
326
| Consolidated financial statements | ||
| (millions of U.S. dollar, except share and per share data) | ||
Raw materials, freight, energy risks and emission rights
The Company is exposed to risks in fluctuations in prices of raw materials (including base metals such as zinc, nickel, aluminum, tin, copper and iron ore), freight and energy, both through the purchase of raw materials and through sales contracts. The Company uses financial instruments such as forward purchases or sales, options and swaps in order to manage the volatility of prices of certain raw materials, freight and energy.
Fair values of raw material, freight, energy and emission rights instruments categorized as Level 2 are as follows:
| December 31, | |||||||||||
| 2023 | 2022 | ||||||||||
| Base metals | ( | ||||||||||
| Freight | ( | ||||||||||
| Energy (oil, gas, electricity) | |||||||||||
| Emission rights | |||||||||||
| Total | |||||||||||
| Derivative assets associated with raw materials, energy, freight and emission rights | |||||||||||
| Derivative liabilities associated with raw materials, energy, freight and emission rights | ( | ( | |||||||||
| Total | |||||||||||
ArcelorMittal consumes large amounts of raw materials (the prices of which are related to the London Metals Exchange price index, the Steel Index and Platts Index), ocean freight (the price of which is related to a Baltic Exchange Index), and energy (the prices of which are mainly related to the New York Mercantile Exchange energy index (NYMEX) and the EEX power indexes). As a general matter, ArcelorMittal is exposed to price volatility with respect to its purchases in the spot market and under its long-term supply contracts. In accordance with its risk management policy, ArcelorMittal hedges a part of its exposure related to raw materials procurement.
Emission rights
Pursuant to the application of the European Directive 2003/87/EC of October 13, 2003, as amended by the European Directive 2009/29/EC of April 23, 2009, establishing a scheme for emission allowance trading, the Company enters into certain types of derivatives (mainly forward transactions and options) in order to implement its management policy for associated risks. As of December 31, 2023 and 2022, the Company had a net notional position of 164 with a net positive fair value of 18 and a net notional position of 488 with a net positive fair value of 53 , respectively.
Credit risk
The Company’s treasury department monitors various market data regarding the credit standings and overall reliability of the financial institutions for all countries where the Company’s subsidiaries operate. The choice of the financial institution for the financial transactions must be approved by the treasury department. Credit risk related to customers, customer credit terms and receivables are discussed in note 4.3.
Sensitivity analysis
Foreign currency sensitivity
The following tables detail the Company’s derivative financial instruments' sensitivity to a 10 % strengthening and a 10 % weakening in the U.S. dollar against the euro. A positive number indicates an increase in profit or loss and other equity, where a negative number indicates a decrease in profit or loss and other equity.
The sensitivity analysis includes the Company’s complete portfolio of foreign currency derivatives outstanding. The impact on the non-euro derivatives reflects the estimated move of such currency pairs, when the U.S. dollar appreciates or depreciates 10
| December 31, 2023 | |||||||||||
| Income (loss) | Other Equity | ||||||||||
10% strengthening in U.S. dollar | |||||||||||
10% weakening in U.S. dollar | ( | ( | |||||||||
| December 31, 2022 | |||||||||||
| (loss) Income | Other Equity | ||||||||||
10% strengthening in U.S. dollar | |||||||||||
10% weakening in U.S. dollar | ( | ( | |||||||||
Cash flow sensitivity analysis for variable rate instruments
The following tables detail the Company’s variable interest rate instruments’ sensitivity. A change of 100 basis points (“bp”) in
327
| Consolidated financial statements | ||
| (millions of U.S. dollar, except share and per share data) | ||
interest rates during the period would have increased (decreased) profit or loss by the amounts presented below. This analysis assumes that all other variables, in particular foreign currency rates, remain constant.
| December 31, 2023 | |||||||||||
Floating portion of net debt1 | Interest Rate Swaps/Forward Rate Agreements | ||||||||||
| ( | ( | ||||||||||
| December 31, 2022 | |||||||||||
Floating portion of net debt1 | Interest Rate Swaps/Forward Rate Agreements | ||||||||||
| ( | |||||||||||
1.See note 6.1.4 for a description of net debt (including fixed and floating portion).
Base metals, energy, freight, emissions rights
The following tables detail the Company’s sensitivity to a 10
| December 31, 2023 | |||||||||||
| Income (loss) | Other Equity Cash Flow Hedging Reserves | ||||||||||
'+ | |||||||||||
| Base Metals | ( | ||||||||||
| Iron Ore | ( | ||||||||||
| Freight | |||||||||||
| Emission rights | ( | ||||||||||
| Energy | |||||||||||
'- | |||||||||||
| Base Metals | ( | ||||||||||
| Iron Ore | ( | ||||||||||
| Freight | ( | ||||||||||
| Emission rights | |||||||||||
| Energy | ( | ||||||||||
| December 31, 2022 | |||||||||||
| Income (loss) | Other Equity Cash Flow Hedging Reserves | ||||||||||
'+ | |||||||||||
| Base Metals | |||||||||||
| Iron Ore | |||||||||||
| Freight | |||||||||||
| Emission rights | |||||||||||
| Energy | |||||||||||
'- | |||||||||||
| Base Metals | ( | ( | |||||||||
| Iron Ore | ( | ||||||||||
| Freight | ( | ||||||||||
| Emission rights | ( | ||||||||||
| Energy | ( | ( | |||||||||
328
| Consolidated financial statements | ||
| (millions of U.S. dollar, except share and per share data) | ||
NOTE 7: LEASES
As a lessee, the Company assesses if a contract is or contains a lease at inception of the contract. A contract is or contains a lease if the contract conveys the right to control the use of an identified asset for a period of time in exchange for consideration.
The Company recognizes a right-of-use asset and a lease liability at the commencement date, except for short-term leases of twelve months or less and leases for which the underlying asset is of low value, which are expensed in the consolidated statement of operations on a straight-line basis over the lease term.
The lease liability is initially measured at the present value of the lease payments that are not paid at the commencement date, discounted using the interest rate implicit in the lease, or, if not readily determinable, the incremental borrowing rate specific to the country, term and currency of the contract. Lease payments can include fixed payments, variable payments that depend on an index or rate known at the commencement date, as well as any extension or purchase options, if the Company is reasonably certain to exercise these options. The lease liability is subsequently measured at amortized cost using the effective interest method and remeasured with a corresponding adjustment to the related right-of-use asset when there is a
change in future lease payments in case of renegotiation, changes of an index or rate or in case of reassessments of options.
The right-of-use asset comprises, at inception, the initial lease liability, any initial direct costs and, when applicable, the obligations to refurbish the asset, less any incentives granted by the lessors. The right-of-use asset is subsequently depreciated on a straight-line basis to the earlier end of its estimated useful life or the end of the lease term or to the end of the estimated useful life of the underlying asset, if the lease transfers the ownership of the underlying asset to the Company at the end of the lease term or if the cost of the right-of-use asset reflects that the lessee will exercise a purchase option. Right-of-use assets are also subject to testing for impairment if there is an indicator that they may be impaired.
Variable lease payments not included in the measurement of the lease liabilities are expensed to the consolidated statement of operations in the period in which the events or conditions which trigger those payments occur.
Balances for the Company’s lease activities are summarized as follows:
As at December 31, 2023 | As at December 31, 2022 | |||||||||||||
| Lease liabilities | ||||||||||||||
| Right of-use assets: | ||||||||||||||
| Land, buildings and improvements | ||||||||||||||
| Machinery, equipment and others | ||||||||||||||
| Total right-of-use assets | ||||||||||||||
| Year ended December 31, 2023 | Year ended December 31, 2022 | |||||||||||||
| Depreciation and impairment charges: | ||||||||||||||
| Land, buildings and improvements | ||||||||||||||
| Machinery, equipment and others | ||||||||||||||
| Total depreciation and impairment charges | ||||||||||||||
| Other lease related expenses: | ||||||||||||||
| Interest expense on lease liabilities | ||||||||||||||
| Expenses of short-term leases | ||||||||||||||
| Expenses of leases of low-value assets | ||||||||||||||
| Expenses related to variable lease payments not included in the measurement of lease liabilities | ||||||||||||||
| Additions to right-of-use assets | ||||||||||||||
| Lease payments recorded as reduction of lease liabilities and cash outflow from financing activities | ||||||||||||||
329
| Consolidated financial statements | ||
| (millions of U.S. dollar, except share and per share data) | ||
The Company's lease contracts relate to a variety of assets used in its operational and administrative activities through several units, such as land, buildings, vehicles, industrial machinery, logistic and commercial facilities and power generation facilities. There are no sale and lease back transactions and no restrictions or covenants are imposed by the Company's current effective lease contracts.
The maturity analysis of the lease liabilities as of December 31, 2023 and December 31, 2022, is as follows:
December 31, 2023 | |||||||||||||||||
| 1 year or less | 2-3 years | 4-5 years | Greater than 5 years | TOTAL | |||||||||||||
| Lease liabilities (undiscounted) | |||||||||||||||||
December 31, 2022 | |||||||||||||||||
| 1 year or less | 2-3 years | 4-5 years | Greater than 5 years | TOTAL | |||||||||||||
| Lease liabilities (undiscounted) | |||||||||||||||||
Expenses for variable lease payments relate to rental fees that vary based on the actual level of activities or performance of the underlying leased assets such as a percentage of sales of the Company's goods through certain leased commercial warehouses and fixed rental fees per actual unit of output produced or transported by the leased assets.
An estimation of the future cash outflows to which the Company is potentially exposed in relation to those contracts involving variable lease payments, which are not reflected in the measurement of lease liabilities as of December 31, 2023 and December 31, 2022, is as follows:
December 31, 2023 | |||||||||||||||||
| 1 year or less | 2-3 years | 4-5 years | Greater than 5 years | TOTAL | |||||||||||||
| Potential variable lease payments | |||||||||||||||||
December 31, 2022 | |||||||||||||||||
| 1 year or less | 2-3 years | 4-5 years | Greater than 5 years | TOTAL | |||||||||||||
| Potential variable lease payments | |||||||||||||||||
Also, some of the Company's lease contracts have extension and/or termination options as well as residual value guarantees whose amounts are not reflected in the measurement of the lease liabilities as of December 31, 2023 and December 31, 2022. The potential addition/(reduction) in future cash outflows to which the Company is exposed in case such options are exercised or the guarantees required are as shown in the table below:
December 31, 2023 | |||||||||||||||||
| 1 year or less | 2-3 years | 4-5 years | Greater than 5 years | TOTAL | |||||||||||||
| Potential extension options | |||||||||||||||||
| Potential termination options | ( | ( | ( | ||||||||||||||
| Potential residual value guarantees | |||||||||||||||||
December 31, 2022 | |||||||||||||||||
| 1 year or less | 2-3 years | 4-5 years | Greater than 5 years | TOTAL | |||||||||||||
| Potential extension options | |||||||||||||||||
| Potential termination options | ( | ( | ( | ||||||||||||||
| Potential residual value guarantees | |||||||||||||||||
330
| Consolidated financial statements | ||
| (millions of U.S. dollar, except share and per share data) | ||
Undiscounted amounts related to lease contracts not yet commenced and therefore not included in the recognized lease liabilities as of December 31, 2023 and December 31, 2022, to which the Company is committed are described below:
December 31, 2023 | |||||||||||||||||
| 1 year or less | 2-3 years | 4-5 years | Greater than 5 years | TOTAL | |||||||||||||
| Leases not yet commenced | |||||||||||||||||
December 31, 2022 | |||||||||||||||||
| 1 year or less | 2-3 years | 4-5 years | Greater than 5 years | TOTAL | |||||||||||||
| Leases not yet commenced | |||||||||||||||||
There were neither income from subleasing right-of-use assets nor gains or losses from sales and leaseback for the years ended December 31, 20223 and December 31, 2022.
8.1 Employees and key management personnel
As of December 31, 2023, 2022 and 2021, ArcelorMittal had approximately 127,000 , 154,000 and 158,000 employees, respectively, and the total annual compensation of ArcelorMittal’s employees in 2023, 2022 and 2021 was as follows:
| Year ended December 31, | |||||||||||||||||
| Employee Information | 2023 | 2022 | 2021 | ||||||||||||||
| Wages and salaries | |||||||||||||||||
| Defined benefits cost (see note 8.2) | |||||||||||||||||
| Other staff expenses | |||||||||||||||||
| Total | |||||||||||||||||
The total annual compensation of ArcelorMittal’s key management personnel, including its Board of Directors, expensed in 2023, 2022 and 2021 was as follows:
| Year ended December 31, | |||||||||||||||||
| 2023 | 2022 | 2021 | |||||||||||||||
| Base salary and directors fees | |||||||||||||||||
| Short-term performance-related bonus | |||||||||||||||||
| Post-employment benefits | |||||||||||||||||
| Share-based payments | |||||||||||||||||
The fair value of the shares allocated based on Restricted Share Unit (“RSU”) and Performance Share Unit (“PSU”) plans to ArcelorMittal’s key management personnel was recorded as an expense in the consolidated statements of operations over the relevant vesting periods.
ArcelorMittal’s operating subsidiaries sponsor different types of pension plans for their employees. Also, some of the operating subsidiaries offer other post-employment benefits, that are principally post-retirement healthcare plans. These benefits are broken down into defined contribution plans and defined benefit plans.
Defined contribution plans are those plans where ArcelorMittal pays fixed or determinable contributions to external life insurance or other funds for certain categories of employees. Contributions are paid in return for services rendered by the employees during the period. Contributions are expensed as incurred consistent with the recognition of wages and salaries.
Defined benefit plans are those plans that provide guaranteed benefits to certain categories of employees, either by way of contractual obligations or through a collective agreement. For defined benefit plans, the cost of providing benefits is determined using the projected unit credit method, with actuarial valuations being carried out each fiscal year.
The retirement benefit obligation recognized in the consolidated statements of financial position represents the present value of the defined benefit obligation less the fair value of plan assets. The present value of the defined benefit obligation is determined by discounting the estimated future cash outflows using interest rates of high-quality corporate bonds that are denominated in the currency in which the benefits will be paid, and that have terms to maturity approximating the terms of the related pension obligation. Remeasurement arising from experience adjustments and changes in actuarial assumptions are charged or credited to other comprehensive income in the period in which they arise. Any assets resulting from this calculation are
331
| Consolidated financial statements | ||
| (millions of U.S. dollar, except share and per share data) | ||
limited to the present value of available refunds and reductions in future contributions to the plan.
Current service cost, which is the increase of the present value of the defined benefit obligation resulting from the employee service in the current period, is recorded as an expense as part of cost of sales and selling, general and administrative expenses in the consolidated statements of operations. The net interest cost, which is the change during the period in the net defined benefit liability or asset that arises from the passage of time, is recognized as part of net financing costs in the consolidated statements of operations.
The Company recognizes gains and losses on the settlement of a defined benefit plan when the settlement occurs. The gain or loss on settlement comprises any resulting change in the fair value of plan assets and any change in the present value of the defined benefit obligation. Past service cost is the change in the present value of the defined benefit obligation resulting from a plan amendment or a curtailment. Past service cost is recognized immediately in the consolidated statements of operations in the period in which it arises.
Termination plans are those plans that primarily correspond to terminating an employee’s contract usually following the decision of the employee before the normal retirement date. Liabilities for termination plans are recognized when the affected employees have formally been informed and when amounts owed have been determined using an appropriate actuarial calculation. Liabilities relating to long-term termination plans (like early retirement plans) are calculated annually based on the number of employees that have taken or contractually agreed to take early retirement and are discounted using an interest rate that corresponds to that of high-quality bonds that have maturity dates similar to the terms of the Company’s early retirement obligations. Provisions for social plans are recorded in connection with voluntary separation plans. Voluntary retirement plans primarily correspond to the practical implementation of social plans or are linked to collective agreements signed with certain categories of employees. The Company recognizes a liability and expense when it can no longer withdraw the offer or, if earlier, when it has a detailed formal plan which has been communicated to employees or their representatives.
Other long-term employee benefits include various plans that depend on the length of service, such as long service and sabbatical awards, disability benefits and long-term compensated absences such as sick leave. The amount recognized as a liability is the present value of benefit obligations at the consolidated statements of financial position date, and all changes in the provision (including actuarial gains and losses or past service costs) are recognized in the
consolidated statements of operations in the period in which they arise.
The expense associated with the above pension plans and post-employment benefits, as well as the carrying amount of the related liability/asset on the consolidated statements of financial position are based on a number of assumptions and factors such as discount rates, expected rate of compensation increase, healthcare cost trend rates, mortality rates and retirement rates.
•Discount rates – The discount rate is based on several high-quality corporate bond indexes and yield curves in the appropriate jurisdictions. In countries where there is no deep market in such bonds, the market rates on government bonds are used. Nominal interest rates vary worldwide due to exchange rates and local inflation rates.
•Rate of compensation increase – The rate of compensation increase reflects actual experience and the Company’s long-term outlook, including contractually agreed wage rate increases for represented hourly employees.
•Healthcare cost trend rate – The healthcare cost trend rate is based on historical retiree cost data, near-term healthcare outlook, including appropriate cost control measures implemented by the Company, and industry benchmarks and surveys.
•Mortality and retirement rates – Mortality and retirement rates are based on actual and projected plan experience.
Statements of Financial Position
Total deferred employee benefits including pension or other post-employment benefits, are as follows:
| December 31, | |||||||||||
| 2023 | 2022 | ||||||||||
| Pension plan benefits | |||||||||||
| Other post-employment benefits and other long-term employee benefits ("OPEB") | |||||||||||
| Termination benefits | |||||||||||
| Defined benefit liabilities | |||||||||||
| Provisions for social plans (non-current) | |||||||||||
| Total | |||||||||||
This note, including the table above, discloses the following benefit categories:
•pension plan benefits are pension plans and lump sum benefits that are classified under post-employment
332
| Consolidated financial statements | ||
| (millions of U.S. dollar, except share and per share data) | ||
benefits as required by IAS 19 which are not mandatory by law;
•other post-employment and other long-term employee benefits, also referred to as, OPEB which includes all other post-employment benefits as defined in IAS 19 (e.g. lump sum benefits which are mandatory by law, medical insurance and life insurance) together with all other long-term employee benefits as defined in IAS 19;
•termination benefits, which relate to provisions for long term termination benefits as defined in IAS 19 (e.g. early retirement benefits); and
•provisions for social plans (non-current) which relate to provisions for social plans in restructuring provisions as required by IAS 37.
The provisions for termination benefits relate to European countries (Belgium, Spain and Germany).
Pension plans
This section includes post-employment benefits that are pension plan and lump sum benefits which are not mandatory by law. A summary of the significant defined benefit pension plans is as follows:
Canada
The primary pension plans are those of ArcelorMittal Dofasco, AMMC and ArcelorMittal Long Products Canada.
The ArcelorMittal Dofasco pension plan is a hybrid plan providing the benefits of both a defined benefit and defined contribution pension plan. The defined contribution component is financed by both employer and employee contributions. The employer’s defined contribution is based on a percentage of company profits. The defined benefit pension plan was closed for new hires on December 31, 2010 and replaced by a new defined contribution pension plan with contributions related to age, service and earnings.
At the end of 2012, ArcelorMittal Dofasco froze and capped benefits for the majority of its hourly and salaried employees who were still accruing service under the defined benefit plan and began transitioning these employees to the new defined contribution pension plan for future pension benefits.
In 2023, ArcelorMittal Dofasco entered into a buy-in transaction for a portion of its fully funded pension plans representing 352 obligations.
The AMMC defined benefit plan provides salary related benefit for non-union employees and a flat dollar pension depending on an employee’s length of service for union employees. This plan
was closed for new non-union hires on December 31, 2009 and replaced by a defined contribution pension plan with contributions related to age and service. Effective January 1, 2015, AMMC implemented a plan to transition its non-union employees who were still benefiting under the defined benefit plan to a defined contribution pension plan. Transition dates can extend up to January 1, 2025 depending on the age and service of each member.
In 2023, AMMC entered into a buy-in transaction for a portion of its fully funded pension plans representing obligations of 100 .
ArcelorMittal Long Products Canada sponsors several defined benefit and defined contribution pension plans for its various groups of employees, with most defined benefit plans closed to new entrants several years ago. The primary defined benefit pension plan sponsored by ArcelorMittal Long Products Canada provides certain unionized employees with a flat dollar pension depending on an employee’s length of service.
ArcelorMittal Long Products Canada continued to operate under a six-year collective labor agreement ("CLA") renewed on August 1, 2020 with its Contrecoeur-West union group. Its defined benefit plan was closed to new hires and a new defined contribution type arrangement was established for new hires. A six-year labor agreement was renewed on February 1, 2022 and it covers Contrecoeur East and Longueuil facilities; its defined benefit pension plan is offered for all employees including new hires.
In 2020 and 2022, ArcelorMittal Long Products Canada entered into buy-in transactions for a portion of its fully funded pension plans representing 278 obligations.
Brazil
The primary defined benefit plans, financed through trust funds, have been closed to new entrants. Brazilian entities have all established defined contribution plans that are financed by employer and employee contributions.
Europe
Certain European operating subsidiaries maintain primarily unfunded defined benefit pension plans for a certain number of employees. Benefits are based on such employees’ length of service and applicable pension table under the terms of individual agreements. Some of these unfunded plans have been closed to new entrants and replaced by defined contribution pension plans for active members financed by employer and employee contributions.
As from December 2015 new Belgian legislation modifies the minimum guaranteed rates of return applicable to Belgian defined contribution plans. For insured plans, the rates of 3.25 % on employer contributions and 3.75 % on employee contributions will continue to apply to the accumulated pre-2016 contributions.
333
| Consolidated financial statements | ||
| (millions of U.S. dollar, except share and per share data) | ||
For contributions paid as from January 1, 2016, a new variable minimum guaranteed rate of return applies. From 2016 through 2024, the minimum guaranteed rate of return was 1.75 % and this percentage will be also applicable for the year 2023. Due to the statutory minimum guaranteed return, Belgian defined contribution plans do not meet the definition of defined contribution plans under IFRS. Therefore, the Belgian defined contribution plans are classified as defined benefit plans.
Others
A very limited number of defined benefit plans are in place in other countries (such as Mexico, Morocco, Ukraine and the United States of America).
The majority of the funded defined benefit pension plans described earlier provide benefit payments from trustee-administered funds. ArcelorMittal also sponsors a number of unfunded plans where the Company meets the benefit payment obligation as it falls due. Plan assets held in trusts are legally separated from the Company and are governed by local regulations and practice in each country, as is the nature of the relationship between the Company and the governing bodies and their composition. In general terms, governing bodies are required by law to act in the best interest of the plan members and are responsible for certain tasks related to the plan (e.g. setting the plan's investment policy).
In case of the funded pension plans, the investment positions are generally managed within an asset-liability matching ("ALM") framework that has been developed to achieve long-term investments that are in line with the obligations of the pension plans.
A long-term investment strategy has been set for ArcelorMittal’s major funded pension plans, with its asset allocation comprising of a mixture of equity securities, fixed income securities, real estate and other appropriate assets. This recognizes that different asset classes are likely to produce different long-term returns and some asset classes may be more volatile than others. The long-term investment strategy ensures, in particular, that investments are adequately diversified.
The following tables detail the reconciliation of defined benefit obligation (“DBO”), plan assets, irrecoverable surplus and statements of financial position.
334
| Consolidated financial statements | ||
| (millions of U.S. dollar, except share and per share data) | ||
| Year ended December 31, 2023 | |||||||||||||||||||||||||||||
| Total | Canada | Brazil | Europe | Other | |||||||||||||||||||||||||
| Change in benefit obligation | |||||||||||||||||||||||||||||
| Benefit obligation at beginning of the period | |||||||||||||||||||||||||||||
| Current service cost | |||||||||||||||||||||||||||||
| Interest cost on DBO | |||||||||||||||||||||||||||||
| Past service cost - Plan amendments | |||||||||||||||||||||||||||||
| Past service cost - Curtailments | ( | ( | |||||||||||||||||||||||||||
| Plan participants’ contribution | |||||||||||||||||||||||||||||
| Actuarial (gain) loss | |||||||||||||||||||||||||||||
| Demographic assumptions | |||||||||||||||||||||||||||||
| Financial assumptions | |||||||||||||||||||||||||||||
| Experience adjustment | ( | ||||||||||||||||||||||||||||
| Benefits paid | ( | ( | ( | ( | ( | ||||||||||||||||||||||||
| Divestment (see note 2.3) | ( | ( | |||||||||||||||||||||||||||
| Foreign currency exchange rate differences and other movements | |||||||||||||||||||||||||||||
| Benefit obligation at end of the period | |||||||||||||||||||||||||||||
| Change in plan assets | |||||||||||||||||||||||||||||
| Fair value of plan assets at beginning of the period | |||||||||||||||||||||||||||||
| Interest income on plan assets | |||||||||||||||||||||||||||||
| Return on plan assets less than discount rate | |||||||||||||||||||||||||||||
| Employer contribution | |||||||||||||||||||||||||||||
| Plan participants’ contribution | |||||||||||||||||||||||||||||
| Benefits paid | ( | ( | ( | ( | ( | ||||||||||||||||||||||||
| Foreign currency exchange rate differences and other movements | |||||||||||||||||||||||||||||
| Fair value of plan assets at end of the period | |||||||||||||||||||||||||||||
| Present value of the wholly or partly funded obligation | ( | ( | ( | ( | ( | ||||||||||||||||||||||||
| Fair value of plan assets | |||||||||||||||||||||||||||||
| Net present value of the wholly or partly funded obligation | ( | ( | ( | ( | |||||||||||||||||||||||||
| Present value of the unfunded obligation | ( | ( | ( | ( | |||||||||||||||||||||||||
| Prepaid due to unrecoverable surpluses | ( | ( | ( | ( | |||||||||||||||||||||||||
| Net amount recognized | ( | ( | ( | ( | ( | ||||||||||||||||||||||||
| Net assets related to funded obligations | |||||||||||||||||||||||||||||
| Recognized liabilities | ( | ( | ( | ( | ( | ||||||||||||||||||||||||
| Change in unrecoverable surplus | |||||||||||||||||||||||||||||
| Unrecoverable surplus at beginning of the period | ( | ( | ( | ( | |||||||||||||||||||||||||
| Interest cost on unrecoverable surplus | ( | ( | |||||||||||||||||||||||||||
| Change in unrecoverable surplus in excess of interest | |||||||||||||||||||||||||||||
| Exchange rates changes | ( | ( | |||||||||||||||||||||||||||
| Unrecoverable surplus at end of the period | ( | ( | ( | ( | |||||||||||||||||||||||||
335
| Consolidated financial statements | ||
| (millions of U.S. dollar, except share and per share data) | ||
| Year ended December 31, 2022 | |||||||||||||||||||||||||||||
| Total | Canada | Brazil | Europe | Other | |||||||||||||||||||||||||
| Change in benefit obligation | |||||||||||||||||||||||||||||
| Benefit obligation at beginning of the period | |||||||||||||||||||||||||||||
| Current service cost | |||||||||||||||||||||||||||||
| Interest cost on DBO | |||||||||||||||||||||||||||||
| Past service cost - Plan amendments | ( | ||||||||||||||||||||||||||||
| Past service cost - Curtailments | ( | ( | |||||||||||||||||||||||||||
| Plan participants’ contribution | |||||||||||||||||||||||||||||
| Actuarial (gain) loss | ( | ( | ( | ||||||||||||||||||||||||||
| Demographic assumptions | ( | ||||||||||||||||||||||||||||
| Financial assumptions | ( | ( | ( | ( | ( | ||||||||||||||||||||||||
| Experience adjustment | |||||||||||||||||||||||||||||
| Benefits paid | ( | ( | ( | ( | ( | ||||||||||||||||||||||||
| Foreign currency exchange rate differences and other movements | ( | ( | ( | ( | |||||||||||||||||||||||||
| Benefit obligation at end of the period | |||||||||||||||||||||||||||||
| Change in plan assets | |||||||||||||||||||||||||||||
| Fair value of plan assets at beginning of the period | |||||||||||||||||||||||||||||
| Interest income on plan assets | |||||||||||||||||||||||||||||
| Return on plan assets less than discount rate | ( | ( | ( | ( | ( | ||||||||||||||||||||||||
| Employer contribution | |||||||||||||||||||||||||||||
| Plan participants’ contribution | |||||||||||||||||||||||||||||
| Benefits paid | ( | ( | ( | ( | ( | ||||||||||||||||||||||||
| Foreign currency exchange rate differences and other movements | ( | ( | ( | ||||||||||||||||||||||||||
| Fair value of plan assets at end of the period | |||||||||||||||||||||||||||||
| Present value of the wholly or partly funded obligation | ( | ( | ( | ( | ( | ||||||||||||||||||||||||
| Fair value of plan assets | |||||||||||||||||||||||||||||
| Net present value of the wholly or partly funded obligation | ( | ( | ( | ||||||||||||||||||||||||||
| Present value of the unfunded obligation | ( | ( | ( | ( | |||||||||||||||||||||||||
| Prepaid due to unrecoverable surpluses | ( | ( | ( | ( | |||||||||||||||||||||||||
| Net amount recognized | ( | ( | ( | ( | ( | ||||||||||||||||||||||||
| Net assets related to funded obligations | |||||||||||||||||||||||||||||
| Recognized liabilities | ( | ( | ( | ( | ( | ||||||||||||||||||||||||
| Change in unrecoverable surplus | |||||||||||||||||||||||||||||
| Unrecoverable surplus at beginning of the period | ( | ( | ( | ( | |||||||||||||||||||||||||
| Interest cost on unrecoverable surplus | ( | ( | |||||||||||||||||||||||||||
| Change in unrecoverable surplus in excess of interest | ( | ( | |||||||||||||||||||||||||||
| Exchange rates changes | |||||||||||||||||||||||||||||
| Unrecoverable surplus at end of the period | ( | ( | ( | ( | |||||||||||||||||||||||||
336
| Consolidated financial statements | ||
| (millions of U.S. dollar, except share and per share data) | ||
The following tables detail the components of net periodic pension cost:
| Year ended December 31, 2023 | |||||||||||||||||||||||||||||
| Net periodic pension cost (income) | Total | Canada | Brazil | Europe | Others | ||||||||||||||||||||||||
| Current service cost | |||||||||||||||||||||||||||||
| Past service cost - Plan amendments | |||||||||||||||||||||||||||||
| Past service cost - Curtailments | ( | ( | |||||||||||||||||||||||||||
| Net interest cost (income) on net DB liability (asset) | |||||||||||||||||||||||||||||
| Total | |||||||||||||||||||||||||||||
| Year ended December 31, 2022 | |||||||||||||||||||||||||||||
| Net periodic pension cost (income) | Total | Canada | Brazil | Europe | Others | ||||||||||||||||||||||||
| Current service cost | |||||||||||||||||||||||||||||
| Past service cost - Plan amendments | ( | ||||||||||||||||||||||||||||
| Past service cost - Curtailments | ( | ( | |||||||||||||||||||||||||||
| Net interest cost/(income) on net DB liability (asset) | |||||||||||||||||||||||||||||
| Total | |||||||||||||||||||||||||||||
| Year ended December 31, 2021 | |||||||||||||||||||||||||||||
| Net periodic pension cost (income) | Total | Canada | Brazil | Europe | Others | ||||||||||||||||||||||||
| Current service cost | |||||||||||||||||||||||||||||
| Past service cost - Plan amendments | |||||||||||||||||||||||||||||
| Net interest cost (income) on net DB liability (asset) | |||||||||||||||||||||||||||||
| Total | |||||||||||||||||||||||||||||
Other post-employment benefits and other long-term employee benefits ("OPEB")
This section includes post-employment employees benefits that are not disclosed above (i.e. includes lump sum benefits which are mandatory by law, medical insurance and life insurance). In addition, this section includes all other long-term employee benefits.
ArcelorMittal’s principal operating subsidiaries in Canada, Europe and certain other countries, provide other post-employment benefits and other long-term employee benefits, including medical benefits and life insurance benefits, work
medals and retirement indemnity plans, to employees and retirees.
In April 2021, ArcelorMittal Poland and trade unions reached an agreement on the new CLA. The parties agreed a ten-year transition period for retirement benefits and jubilee awards. At the end of the transition period, in 2031, ArcelorMittal Poland will pay the retirement benefits based on the labor code. In June 2021, the CLA was registered by the National Labor Inspectorate in Poland and accordingly ArcelorMittal Poland recognized total plan amendment and curtailment gain of 51 in cost of sales.
337
| Consolidated financial statements | ||
| (millions of U.S. dollar, except share and per share data) | ||
Summary of changes in the other post-employment benefit obligation and changes in plan assets are as follows:
| Year ended December 31, 2023 | |||||||||||||||||||||||
| Total | Canada | Europe | Others | ||||||||||||||||||||
| Change in benefit obligation | |||||||||||||||||||||||
| Benefit obligation at beginning of the period | |||||||||||||||||||||||
| Current service cost | |||||||||||||||||||||||
| Interest cost on DBO | |||||||||||||||||||||||
| Past service cost - Plan amendments | ( | ||||||||||||||||||||||
| Actuarial (gain) loss | ( | ||||||||||||||||||||||
| Demographic assumptions | |||||||||||||||||||||||
| Financial assumptions | ( | ||||||||||||||||||||||
| Experience adjustment | ( | ( | |||||||||||||||||||||
| Benefits paid | ( | ( | ( | ( | |||||||||||||||||||
| Foreign currency exchange rate differences and other movements | |||||||||||||||||||||||
| Benefit obligation at end of the period | |||||||||||||||||||||||
| Change in plan assets | |||||||||||||||||||||||
| Fair value of plan assets at beginning of the period | |||||||||||||||||||||||
| Benefits paid | ( | ( | |||||||||||||||||||||
| Fair value of plan assets at end of the period | |||||||||||||||||||||||
| Present value of the wholly or partly funded obligation | ( | ( | |||||||||||||||||||||
| Fair value of plan assets | |||||||||||||||||||||||
| Net present value of the wholly or partly funded obligation | ( | ( | |||||||||||||||||||||
| Present value of the unfunded obligation | ( | ( | ( | ( | |||||||||||||||||||
| Net amount recognized | ( | ( | ( | ( | |||||||||||||||||||
338
| Consolidated financial statements | ||
| (millions of U.S. dollar, except share and per share data) | ||
| Year ended December 31, 2022 | |||||||||||||||||||||||
| Total | Canada | Europe | Others | ||||||||||||||||||||
| Change in benefit obligation | |||||||||||||||||||||||
| Benefit obligation at beginning of the period | |||||||||||||||||||||||
| Current service cost | |||||||||||||||||||||||
| Interest cost on DBO | |||||||||||||||||||||||
| Actuarial (gain) loss | ( | ( | ( | ( | |||||||||||||||||||
| Demographic assumptions | |||||||||||||||||||||||
| Financial assumptions | ( | ( | ( | ( | |||||||||||||||||||
| Experience adjustment | ( | ( | |||||||||||||||||||||
| Benefits paid | ( | ( | ( | ( | |||||||||||||||||||
| Foreign currency exchange rate differences and other movements | ( | ( | ( | ||||||||||||||||||||
| Benefit obligation at end of the period | |||||||||||||||||||||||
| Change in plan assets | |||||||||||||||||||||||
| Fair value of plan assets at beginning of the period | |||||||||||||||||||||||
| Return on plan assets less than discount rate | ( | ( | |||||||||||||||||||||
| Fair value of plan assets at end of the period | |||||||||||||||||||||||
| Present value of the wholly or partly funded obligation | ( | ( | |||||||||||||||||||||
| Fair value of plan assets | |||||||||||||||||||||||
| Net present value of the wholly or partly funded obligation | ( | ( | |||||||||||||||||||||
| Present value of the unfunded obligation | ( | ( | ( | ( | |||||||||||||||||||
| Net amount recognized | ( | ( | ( | ( | |||||||||||||||||||
339
| Consolidated financial statements | ||
| (millions of U.S. dollar, except share and per share data) | ||
The following tables detail the components of net periodic other post-employment cost:
| Year ended December 31, 2023 | |||||||||||||||||||||||
| Components of net periodic OPEB cost (income) | Total | Canada | Europe | Others | |||||||||||||||||||
| Current service cost | |||||||||||||||||||||||
| Past service cost - Plan amendments | ( | ||||||||||||||||||||||
| Net interest cost (income) on net DB liability (asset) | |||||||||||||||||||||||
| Actuarial gain recognized during the year | |||||||||||||||||||||||
| Total | |||||||||||||||||||||||
| Year ended December 31, 2022 | |||||||||||||||||||||||
| Components of net periodic OPEB cost (income) | Total | Canada | Europe | Others | |||||||||||||||||||
| Current service cost | |||||||||||||||||||||||
| Net interest cost (income) on net DB liability (asset) | |||||||||||||||||||||||
| Actuarial gain recognized during the year | ( | ( | |||||||||||||||||||||
| Total | |||||||||||||||||||||||
| Year ended December 31, 2021 | |||||||||||||||||||||||
| Components of net periodic OPEB cost (income) | Total | Canada | Europe | Others | |||||||||||||||||||
| Current service cost | ( | ||||||||||||||||||||||
| Past service cost - Plan amendments | ( | ( | |||||||||||||||||||||
| Past service cost - Curtailments | ( | ( | |||||||||||||||||||||
| Net interest cost (income) on net DB liability (asset) | |||||||||||||||||||||||
| Actuarial losses recognized during the year | ( | ( | ( | ||||||||||||||||||||
| Total | ( | ( | |||||||||||||||||||||
The following tables detail where the expense is recognized in the consolidated statements of operations:
| Year ended December 31, | |||||||||||||||||
| 2023 | 2022 | 2021 | |||||||||||||||
| Net periodic pension cost | |||||||||||||||||
| Net periodic OPEB cost | ( | ||||||||||||||||
| Total | |||||||||||||||||
| Cost of sales | |||||||||||||||||
| Selling, general and administrative expenses | |||||||||||||||||
| Financing costs - net | |||||||||||||||||
| Total | |||||||||||||||||
340
| Consolidated financial statements | ||
| (millions of U.S. dollar, except share and per share data) | ||
Plan Assets
The weighted-average asset allocations for the funded defined benefit plans by asset category were as follows:
| December 31, 2023 | |||||||||||||||||||||||
| Canada | Brazil | Europe | |||||||||||||||||||||
| Equity Securities | % | % | % | ||||||||||||||||||||
| - Asset classes that have a quoted market price in an active market | % | % | |||||||||||||||||||||
| - Asset classes that do not have a quoted market price in an active market | % | % | |||||||||||||||||||||
| Fixed Income Securities (including cash) | % | % | % | ||||||||||||||||||||
| - Asset classes that have a quoted market price in an active market | % | % | % | ||||||||||||||||||||
| - Asset classes that do not have a quoted market price in an active market | % | ||||||||||||||||||||||
| Real Estate | % | % | |||||||||||||||||||||
| - Asset classes that have a quoted market price in an active market | |||||||||||||||||||||||
| - Asset classes that do not have a quoted market price in an active market | % | % | |||||||||||||||||||||
| Other | % | % | % | ||||||||||||||||||||
| - Asset classes that have a quoted market price in an active market | % | % | |||||||||||||||||||||
| - Asset classes that do not have a quoted market price in an active market | % | % | '1 | ||||||||||||||||||||
| Total | % | % | % | ||||||||||||||||||||
| December 31, 2022 | |||||||||||||||||||||||
| Canada | Brazil | Europe | |||||||||||||||||||||
| Equity Securities | % | % | % | ||||||||||||||||||||
| - Asset classes that have a quoted market price in an active market | % | % | % | ||||||||||||||||||||
| - Asset classes that do not have a quoted market price in an active market | % | % | |||||||||||||||||||||
| Fixed Income Securities (including cash) | % | % | % | ||||||||||||||||||||
| - Asset classes that have a quoted market price in an active market | % | % | % | ||||||||||||||||||||
| - Asset classes that do not have a quoted market price in an active market | % | % | |||||||||||||||||||||
| Real Estate | % | % | |||||||||||||||||||||
| - Asset classes that have a quoted market price in an active market | |||||||||||||||||||||||
| - Asset classes that do not have a quoted market price in an active market | % | % | |||||||||||||||||||||
| Other | % | % | % | ||||||||||||||||||||
| - Asset classes that have a quoted market price in an active market | % | % | |||||||||||||||||||||
| - Asset classes that do not have a quoted market price in an active market | % | % | '1 | ||||||||||||||||||||
| Total | % | % | % | ||||||||||||||||||||
1.The percentage consists primarily of assets from insurance contracts in Belgium and Canada.
These assets do not include direct investments in ArcelorMittal stock or ArcelorMittal bonds. They may include ArcelorMittal shares or bonds held by mutual fund investments. The invested assets produced a 404 actual return and a 576 loss in 2023 and 2022, respectively.
The Finance and Retirement Committees of the Boards of Directors for the respective operating subsidiaries have general supervisory authority over the respective trust funds. These committees usually establish, monitor and review asset allocation targets for the respective funds. Asset managers are permitted some flexibility to vary the asset allocation from the long-term investment strategy within agreed upon control ranges. The established targets observed as of December 31, 2023 are as described below:
341
| Consolidated financial statements | ||
| (millions of U.S. dollar, except share and per share data) | ||
| December 31, 2023 | |||||||||||||||||||||||
| Canada | Brazil | Europe | |||||||||||||||||||||
| Equity Securities | % | % | % | ||||||||||||||||||||
| Fixed Income Securities (including cash) | % | % | % | ||||||||||||||||||||
| Real Estate | % | % | |||||||||||||||||||||
Other'1 | % | % | % | ||||||||||||||||||||
| Total | % | % | % | ||||||||||||||||||||
1.The percentage consists primarily of assets from insurance contracts in Belgium and Canada.
Assumptions used to determine benefit obligations at December 31,
| Pension Plans | Other Post-employment Benefits | ||||||||||||||||||||||||||||||||||
| 2023 | 2022 | 2021 | 2023 | 2022 | 2021 | ||||||||||||||||||||||||||||||
| Discount rate | |||||||||||||||||||||||||||||||||||
| Range | |||||||||||||||||||||||||||||||||||
| Weighted average | |||||||||||||||||||||||||||||||||||
| Rate of compensation increase | |||||||||||||||||||||||||||||||||||
| Range | |||||||||||||||||||||||||||||||||||
| Weighted average | |||||||||||||||||||||||||||||||||||
| Other Post-employment Benefits | |||||||||||||||||
| 2023 | 2022 | 2021 | |||||||||||||||
| Healthcare cost trend rate assumed | |||||||||||||||||
| Range | |||||||||||||||||
| Weighted average | |||||||||||||||||
Cash contributions and maturity profile of the plans
In 2024, the Company expects its cash contributions to amount to 166 for pension plans, 66 for other post-employment benefits plans and 117 for defined contribution plans. In 2023 and 2022, cash contributions to defined contributions plans were 146 and 141 , respectively.
At December 31, 2023, the weighted average duration of liabilities related to pension and other post-employment benefits plans were 10 years and 11 years, respectively. At December 31, 2022, the weighted average duration of liabilities related to pension and other post-employment benefits plans were 12 years and 12 years, respectively.
Risks associated with defined benefit plans
Through its defined benefit pension plans and OPEB plans, ArcelorMittal is exposed to a number of risks, the most significant of which are detailed below:
Changes in bond yields
An increase in corporate bond yields will decrease plan liabilities, however it will decrease simultaneously the value of the plans’ bond holdings.
Asset volatility
The plan liabilities are calculated using a discount rate set with reference to corporate bond yields; if plan assets underperform this yield, this will create a deficit. In most countries with funded plans, plan assets hold a significant portion of equities, which are expected to outperform corporate bonds in the long-term but contribute to volatility and risk in the short-term. As the plans mature, ArcelorMittal intends to reduce the level of investment risk by investing more in assets that better match the liabilities. However, ArcelorMittal believes that due to the long-term nature of the plan liabilities, a level of continuing equity investment is an appropriate element of a long-term strategy to manage the plans efficiently.
342
| Consolidated financial statements | ||
| (millions of U.S. dollar, except share and per share data) | ||
Life expectancy
Most plans provide benefits for the life of the covered members, so increases in life expectancy will result in an increase in the plans’ benefit obligations.
Assumptions regarding future mortality rates have been set considering published statistics and, where possible, ArcelorMittal’s own experience.
The current longevity at retirement underlying the values of the defined benefit obligation was approximately 23 years.
Healthcare cost trend rate
The majority of the OPEB plans’ benefit obligations are linked to the change in the cost of various health care components. Future healthcare cost will vary based on several factors including price inflation, utilization rate, technology advances, cost shifting and cost containing mechanisms. A higher healthcare cost trend would lead to higher OPEB plan benefit obligations.
Sensitivity analysis
The following information illustrates the sensitivity to a change of the significant actuarial assumptions related to ArcelorMittal’s pension plans (as of December 31, 2023, the defined benefit obligation for pension plans was 5,284 ):
Effect on 2024 Pre-Tax Pension Expense (sum of service cost and interest cost) | Effect on December 31, 2023 DBO | ||||||||||
| Change in assumption | |||||||||||
| ( | |||||||||||
| ( | |||||||||||
| ( | ( | ||||||||||
The following table illustrates the sensitivity to a change of the significant actuarial assumptions related to ArcelorMittal’s OPEB plans (as of December 31, 2023 the defined benefit obligation for post-employment benefit plans was 971 ):
Effect on 2024 Pre-Tax OPEB Expense (sum of service cost and interest cost) | Effect on December 31, 2023 DBO | ||||||||||
| Change in assumption | |||||||||||
| ( | |||||||||||
| ( | ( | ||||||||||
The above sensitivities reflect the effect of changing one assumption at a time. Actual economic factors and conditions often affect multiple assumptions simultaneously, and the effects of changes in key assumptions are not necessarily linear.
8.3 Share-based payments
ArcelorMittal issues equity-settled share-based payments to certain employees which are RSUs and PSUs. Equity-settled share-based payments are measured at fair value (excluding the effect of non market-based vesting conditions) at the grant date. The fair value determined at the grant date of the equity-settled share-based payments is expensed on a graded vesting basis over the vesting period, based on the Company’s estimate of the shares that will eventually vest and adjusted for the effect of non market-based vesting conditions. Where the fair value calculation requires modeling of the Company’s
343
| Consolidated financial statements | ||
| (millions of U.S. dollar, except share and per share data) | ||
ArcelorMittal Equity Incentive Plan
ArcelorMittal operates a long-term incentive plan ("the ArcelorMittal Equity Incentive Plan") to incentivize shareholder wealth creation in excess of performance of a peer group and incentivize executives to achieve strategy. The ArcelorMittal Equity Incentive Plan is intended to align the interests of the Company’s shareholders and eligible employees by allowing them to participate in the success of the Company. The ArcelorMittal Equity Incentive Plan provides for the grant of RSUs and PSUs to eligible employees of the Company (including Executive Officers) and is designed to incentivize employees, improve the Company’s long-term performance and retain key employees.
The grant of PSUs under the ArcelorMittal Equity Incentive Plan aims to serve as an effective performance-enhancing scheme based on the employee’s contribution to the eligible achievement of the Company’s strategy. Awards in connection with PSUs are subject to the fulfillment of cumulative performance criteria over a three-year period from the date of the PSU grant such as return on capital employed ("ROCE"), total shareholders return ("TSR"), earnings per share ("EPS") and gap to competition (until 2022). Since 2021, performance criteria also include a set of three weighted environmental, social and governance ("ESG") indicators representing 30 % and 20 % award vesting for the Executive Office and Executive Officers, respectively, including health & safety, climate action and diversity & inclusion ("D&I"). For health & safety (10 5 years before the grant). For D&I (10 % and 5 % award vesting for Executive Office and Executive Officers, respectively), the target is to reduce by 40 % the gap between the Company's 2030 target of having 25 % women in management and 2020 baseline. For climate (10 % and 5 % award vesting for Executive Office and Executive Officers, respectively), the CO2 emission target has been set to be reached by the end of the vesting period. The employees eligible to receive PSUs are a sub-set of the group of employees eligible to receive RSUs.
RSUs granted under the ArcelorMittal Equity Incentive Plan are designed to provide a retention incentive to eligible employees. RSUs are subject to “cliff vesting” after 3 years, with 100 % of the grant vesting on the third anniversary of the grant contingent upon the continued active employment of the eligible employee within the Company.
The maximum number of PSUs and RSUs available for grant during any given year is subject to the prior approval of the Company’s shareholders at the AGM. The 2020, 2021, 2022 and 2023 Caps for the number of PSUs/RSUs that may be allocated to the Executive Office and other retention and performance based grants below the Executive Office level, were approved at the AGMs on June 13, 2020, June 8, 2021, May 4, 2022 and May 2, 2023 respectively, at a maximum of 4,250,000 shares, 3,500,000 shares, 3,500,000 shares and 3,500,000 shares, respectively.
344
| Consolidated financial statements | ||
| (millions of U.S. dollar, except share and per share data) | ||
Conditions of the 2023 grant were as follows:
| Executive Office | Executive Officers | ||||||||||||||||||||||||||||||||||
2023 Grant | l | PSUs with a year performance period | l | PSUs with a year performance period | |||||||||||||||||||||||||||||||
| l | Value at grant | ||||||||||||||||||||||||||||||||||
| l | Vesting conditions: | l | Vesting conditions: | ||||||||||||||||||||||||||||||||
Target | Stretch | Threshold | Target | Stretch | |||||||||||||||||||||||||||||||
TSR vs. peer group ( | ≥ | TSR vs. peer group ( | — | ≥ | |||||||||||||||||||||||||||||||
| Vesting percentage | Vesting percentage | — | |||||||||||||||||||||||||||||||||
ROCE ( | 2/3 of Target | 4/3 of target | |||||||||||||||||||||||||||||||||
ESG ( | Vesting percentage | ||||||||||||||||||||||||||||||||||
ESG ( | — | ||||||||||||||||||||||||||||||||||
| Vesting percentage | Vesting percentage | — | |||||||||||||||||||||||||||||||||
| l | RSUs with a year vesting period | ||||||||||||||||||||||||||||||||||
Awards made in previous financial years which have not yet reached the end of the vesting period
ArcelorMittal's Equity Incentive Plan for senior management including Executive Officers follows the Company's strategy. In addition to the 2023 grant, the summary of outstanding plans as of December 31, 2023 is as follows:
345
| Consolidated financial statements | ||
| (millions of U.S. dollar, except share and per share data) | ||
| Executive Office | Executive Officers | |||||||||||||||||||||||||||||||
| 2020 Grant | l | PSUs with a year performance period | l | PSUs with a year performance period | ||||||||||||||||||||||||||||
| l | Value at grant | |||||||||||||||||||||||||||||||
| l | Vesting conditions: | l | Vesting conditions: | |||||||||||||||||||||||||||||
| Threshold | Target | Threshold | Target | |||||||||||||||||||||||||||||
| TSR/EPS vs. peer group | ≥ | TSR/EPS vs. peer group | ≥ | |||||||||||||||||||||||||||||
| Vesting percentage | ||||||||||||||||||||||||||||||||
| TSR vs. S&P 500 | Performance equal to Index | ≥Performance equal to Index + | Gap to competition (where applicable) | |||||||||||||||||||||||||||||
| Vesting percentage | Vesting percentage | |||||||||||||||||||||||||||||||
| l | RSUs with a year vesting period | |||||||||||||||||||||||||||||||
| l | RSUs with a year vesting period | |||||||||||||||||||||||||||||||
| Executive Office | Executive Officers | |||||||||||||||||||||||||||||||
| 2021 Grant | l | PSUs with a year performance period | l | PSUs with a year performance period | ||||||||||||||||||||||||||||
| l | Value at grant | |||||||||||||||||||||||||||||||
| l | Vesting conditions: | l | Vesting conditions: | |||||||||||||||||||||||||||||
| Threshold | Target | Target | Stretch | |||||||||||||||||||||||||||||
TSR vs. peer group ( | ≥ | TSR vs. peer group ( | ≥ | |||||||||||||||||||||||||||||
| Vesting percentage | Vesting percentage | |||||||||||||||||||||||||||||||
Gap to competition ( | ||||||||||||||||||||||||||||||||
ESG ( | Vesting percentage | |||||||||||||||||||||||||||||||
ESG ( | ||||||||||||||||||||||||||||||||
| Vesting percentage | ||||||||||||||||||||||||||||||||
| l | RSUs with a year vesting period | |||||||||||||||||||||||||||||||
| l | RSUs with a year vesting period | |||||||||||||||||||||||||||||||
346
| Consolidated financial statements | ||
| (millions of U.S. dollar, except share and per share data) | ||
| Executive Office | Executive Officers | |||||||||||||||||||||||||||||||
2022 Grant | l | PSUs with a year performance period | l | PSUs with a year performance period | ||||||||||||||||||||||||||||
| l | Value at grant | |||||||||||||||||||||||||||||||
| l | Vesting conditions: | l | Vesting conditions | |||||||||||||||||||||||||||||
| Threshold | Target | Target | Stretch | |||||||||||||||||||||||||||||
TSR vs. peer group ( | ≥ | TSR vs. peer group ( | ≥ | |||||||||||||||||||||||||||||
| Vesting percentage | Vesting percentage | |||||||||||||||||||||||||||||||
Gap to competition ( | ||||||||||||||||||||||||||||||||
ESG ( | Vesting percentage | |||||||||||||||||||||||||||||||
ESG ( | ||||||||||||||||||||||||||||||||
| Vesting percentage | Vesting percentage | |||||||||||||||||||||||||||||||
| l | RSUs with a year vesting period | |||||||||||||||||||||||||||||||
The following table summarizes the Company’s share unit plans outstanding as of December 31, 2023:
| At Grant date | Number of shares issued as of December 31, 2023 | |||||||||||||||||||||||||||||||||||||||||||||||||
| Grant date | Type of plan | Number of shares | Number of beneficiaries | Maturity | Fair value per share | Shares outstanding | Shares forfeited | Shares vested | ||||||||||||||||||||||||||||||||||||||||||
| December 8, 2023 | RSU | December 8, 2026 | ||||||||||||||||||||||||||||||||||||||||||||||||
| December 8, 2023 | PSU | January 1, 2027 | ||||||||||||||||||||||||||||||||||||||||||||||||
| December 8, 2023 | Executive Office | January 1, 2027 | ||||||||||||||||||||||||||||||||||||||||||||||||
| December 13, 2022 | RSU | December 13, 2025 | ||||||||||||||||||||||||||||||||||||||||||||||||
| December 13, 2022 | PSU | January 1, 2026 | ||||||||||||||||||||||||||||||||||||||||||||||||
| December 13, 2022 | Executive Office | January 1, 2026 | ||||||||||||||||||||||||||||||||||||||||||||||||
| December 16, 2021 | RSU | December 16, 2024 | ||||||||||||||||||||||||||||||||||||||||||||||||
| December 16, 2021 | PSU | January 1, 2025 | ||||||||||||||||||||||||||||||||||||||||||||||||
| December 16, 2021 | Executive Office | January 1, 2025 | ||||||||||||||||||||||||||||||||||||||||||||||||
| December 14, 2020 | PSU | January 1, 2024 | ||||||||||||||||||||||||||||||||||||||||||||||||
| December 14, 2020 | Executive Office | January 1, 2024 | ||||||||||||||||||||||||||||||||||||||||||||||||
| Total | $ | |||||||||||||||||||||||||||||||||||||||||||||||||
The compensation expense recognized for PSUs and RSUs was 39 , 38 and 35 for the years ended December 31, 2023, 2022 and 2021.
Share unit plan activity is summarized below as of and for each year ended December 31, 2023, 2022 and 2021:
347
| Consolidated financial statements | ||
| (millions of U.S. dollar, except share and per share data) | ||
| RSUs | PSUs and Executive Office | ||||||||||||||||||||||
| Number of shares | Fair value per share | Number of shares | Fair value per share | ||||||||||||||||||||
| Outstanding, December 31, 2020 | |||||||||||||||||||||||
| Granted | |||||||||||||||||||||||
| Exited | ( | ( | |||||||||||||||||||||
| Forfeited | ( | ( | |||||||||||||||||||||
| Outstanding, December 31, 2021 | |||||||||||||||||||||||
| Granted | |||||||||||||||||||||||
| Exited | ( | ( | |||||||||||||||||||||
| Forfeited | ( | ( | |||||||||||||||||||||
| Outstanding, December 31, 2022 | |||||||||||||||||||||||
| Granted | |||||||||||||||||||||||
| Exited | ( | ( | |||||||||||||||||||||
| Forfeited | ( | ( | |||||||||||||||||||||
| Outstanding, December 31, 2023 | |||||||||||||||||||||||
NOTE 9: PROVISIONS, CONTINGENCIES AND COMMITMENTS
ArcelorMittal recognizes provisions for liabilities and probable losses that have been incurred when it has a present legal or constructive obligation as a result of past events, it is probable that the Company will be required to settle the obligation and a reliable estimate of the amount of the obligation can be made. If the effect of the time value of money is material, provisions are discounted using a current pre-tax rate that reflects, where appropriate, the risks specific to the liability. Where discounting is used, the increase in the provision due to the passage of time is recognized as a financing cost. Future operating expenses or losses are excluded from recognition as provisions as they do not meet the definition of a liability. Contingent assets and contingent liabilities are excluded from recognition in the consolidated statements of financial position.
Provisions for onerous contracts are recorded in the consolidated statements of operations when it becomes known that the unavoidable costs of meeting the obligations under the contract exceed the economic benefits expected to be received. Assets dedicated to the onerous contracts are tested for impairment before recognizing a separate provision for the onerous contract.
Provisions for restructuring are recognized when and only when a detailed formal plan exists and a valid expectation in those affected by the restructuring has been raised, by starting to implement the plan or announcing its main features.
ArcelorMittal records asset retirement obligations (“ARO”) initially at the fair value of the legal or constructive obligation in the period in which it is incurred and capitalizes the ARO by increasing the carrying amount of the related non-current asset. The fair value of the obligation is determined as the discounted value of the expected future cash flows. The liability is accreted to its present value through net financing cost and the capitalized cost is depreciated in accordance with the Company’s depreciation policies for property, plant and equipment. Subsequently, when reliably measurable, ARO is recorded on the consolidated statements of financial position increasing the cost of the asset and the fair value of the related obligation. Foreign exchange gains or losses on AROs denominated in foreign currencies are recorded in the consolidated statements of operations.
ArcelorMittal is subject to changing and increasingly stringent environmental laws and regulations concerning air emissions, water discharges and waste disposal, as well as certain remediation activities that involve the clean-up of soil and groundwater. ArcelorMittal is currently engaged in the investigation and remediation of environmental contamination at a number of its facilities. Most of these are legacy obligations arising from acquisitions.
Environmental costs that relate to current operations or to an existing condition caused by past operations, and which do not contribute to future revenue generation or cost reduction, are expensed. Liabilities are recorded when environmental assessments and/or remedial efforts are probable and the cost can be reliably estimated based on ongoing engineering studies, discussions with the environmental authorities and other assumptions relevant to the nature and extent of the remediation that may be required. The ultimate cost to ArcelorMittal is dependent upon factors beyond its control such as the scope and methodology of the remedial action requirements to be established by environmental and public health authorities, new laws or government regulations, rapidly changing technology and the outcome of any potential related litigation. Environmental liabilities are discounted if the aggregate amount of the obligation and the amount and timing of the cash payments are fixed or reliably determinable.
The estimates of loss contingencies for environmental matters and other contingencies are based on various judgments and assumptions including the likelihood, nature, magnitude and timing of assessment, remediation and/or monitoring activities and the probable cost of these activities. In some cases, judgments and assumptions are made relating to the obligation
348
| Consolidated financial statements | ||
| (millions of U.S. dollar, except share and per share data) | ||
or willingness and ability of third parties to bear a proportionate or allocated share of cost of these activities, including third parties who sold assets to ArcelorMittal or purchased assets from it subject to environmental liabilities. ArcelorMittal also considers, among other things, the activity to date at particular sites, information obtained through consultation with applicable regulatory authorities and third-party consultants and contractors and its historical experience with other circumstances judged to be comparable. Due to the numerous variables associated with these judgments and assumptions, and the effects of changes in governmental regulation and environmental technologies, both the precision and reliability of the resulting estimates of the related contingencies are subject to substantial uncertainties. As estimated costs to remediate change, the Company will reduce or increase the recorded liabilities through write backs or additional provisions in the consolidated statements of operations. ArcelorMittal does not expect these environmental issues to affect the utilization of its plants, now or in the future.
ArcelorMittal is currently and may in the future be involved in litigation, arbitration or other legal proceedings. Provisions related to legal and arbitration proceedings are recorded in accordance with the principles described above.
Most of these claims involve highly complex issues. Often these issues are subject to substantial uncertainties and, therefore, the probability of loss and an estimation of damages are difficult to ascertain. Consequently, ArcelorMittal may be unable to make a reliable estimate of the expected financial effect that will result from ultimate resolution of the proceeding. In those cases, ArcelorMittal has disclosed information with respect to the
nature of the contingency. ArcelorMittal has not accrued a provision for the potential outcome of these cases.
For cases in which the Company was able to make a reliable estimate of the expected loss or range of probable loss and has accrued a provision for such loss, it believes that publication of this information on a case-by-case basis would seriously prejudice the Company’s position in the ongoing legal proceedings or in any related settlement discussions. Accordingly, in these cases, the Company has disclosed information with respect to the nature of the contingency, but has not disclosed its estimate of the range of potential loss.
In the cases in which quantifiable fines and penalties have been assessed, the Company has indicated the amount of such fine or penalty or the amount of provision accrued that is the estimate of the probable loss.
349
| Consolidated financial statements | ||
| (millions of U.S. dollar, except share and per share data) | ||
9.1 Provisions
Balance at December 31, 2022 | Additions1 | Deductions/ Payments | Effects of foreign exchange and other movements | Balance at December 31, 2023 | |||||||||||||||||||||||||
| Environmental | ( | ||||||||||||||||||||||||||||
| Emission obligations | ( | ( | |||||||||||||||||||||||||||
| Asset retirement obligations | ( | ||||||||||||||||||||||||||||
| Site restoration | ( | ||||||||||||||||||||||||||||
| Staff related obligations | ( | ||||||||||||||||||||||||||||
| Voluntary separation plans | ( | ||||||||||||||||||||||||||||
| Litigation and other (see note 9.3) | ( | ||||||||||||||||||||||||||||
| Tax claims | ( | ||||||||||||||||||||||||||||
| Other legal claims | ( | ||||||||||||||||||||||||||||
| Commercial agreements and onerous contracts | ( | ||||||||||||||||||||||||||||
| Other | ( | ||||||||||||||||||||||||||||
| ( | |||||||||||||||||||||||||||||
| Short-term provisions | |||||||||||||||||||||||||||||
| Long-term provisions | |||||||||||||||||||||||||||||
Balance at December 31, 2021 | Additions1 | Deductions/ Payments | Effects of foreign exchange and other movements | Balance at December 31, 2022 | |||||||||||||||||||||||||
| Environmental | ( | ( | |||||||||||||||||||||||||||
| Emission obligations | ( | ( | |||||||||||||||||||||||||||
| Asset retirement obligations | ( | ( | |||||||||||||||||||||||||||
| Site restoration | ( | ( | |||||||||||||||||||||||||||
| Staff related obligations | ( | ||||||||||||||||||||||||||||
| Voluntary separation plans | ( | ||||||||||||||||||||||||||||
| Litigation and other (see note 9.3) | ( | ||||||||||||||||||||||||||||
| Tax claims | ( | ||||||||||||||||||||||||||||
| Other legal claims | ( | ||||||||||||||||||||||||||||
| Commercial agreements and onerous contracts | ( | ||||||||||||||||||||||||||||
| Other | ( | ||||||||||||||||||||||||||||
| ( | ( | ||||||||||||||||||||||||||||
| Short-term provisions | |||||||||||||||||||||||||||||
| Long-term provisions | |||||||||||||||||||||||||||||
350
| Consolidated financial statements | ||
| (millions of U.S. dollar, except share and per share data) | ||
There are uncertainties regarding the timing and amount of the provisions above. Changes in underlying facts and circumstances for each provision could result in differences in the amounts provided for and the actual outflows. In general, provisions are presented on a non-discounted basis due to the uncertainties regarding the timing or the short period of their expected consumption.
Environmental provisions have been estimated based on internal and third-party estimates of contamination, available remediation technology, and environmental regulations. Estimates are subject to revision as further information develops or circumstances change.
Provisions for emission obligations are recognized to cover the shortage between the Company's CO2 emissions and the allowances granted, based on the market value of the CO2 allowances as of the reporting date or purchase price of the acquired CO2 emission rights. In 2023 provisions for emission obligations decreased as a result of the settlement of the 2022 shortage through surrendering the corresponding CO2 emission rights to the environmental authorities and lower CO2 emissions during the year as a result of lower production mainly in Europe (see note 4.5).
The Company uses derivative financial instruments and spot purchases to manage its exposure to fluctuations in prices of emission rights allowances. See note 6.3 for the details of the cash flow hedging in place for emission rights, note 4.5 for CO2 emission rights held as current assets and note 5.1 for CO2 emission rights held as Intangible non-current assets. The Company also receives indirect compensation through rebates on its energy tariffs.
Provisions for site restoration are related to costs in connection with the dismantling of site facilities, mainly in France and Poland, of which 66 and 79 at December 31, 2023 and 2022, respectively, with respect to the dismantling of the Florange liquid phase.
Provisions for staff related obligations primarily concern Brazil and are related to various employees’ compensation.
Provisions for voluntary separation plans primarily relate to plans in Spain, France and Brazil, which are expected to be settled within one year.
Provisions for litigation include losses relating to present legal obligations that are considered to be probable see also note 9.3.
In 2023 and 2022 provisions for commercial agreements and onerous contracts were primarily linked to onerous contracts in Poland and Spain.
Other provisions of 182 and 187 at December 31, 2023 and 2022, respectively, are related to the Complementary Agreement Term signed in 2021 between ArcelorMittal Brazil, the Federal and State Prosecutor Offices and the Commission representing affected people, which includes precautionary evacuation of the communities close to the Serra Azul dam, as well as the commitment to implement action plans to ensure the stability, security and decommissioning of the tailing dam. Other provisions also comprise technical warranties and guarantees.
Environmental Liabilities
ArcelorMittal’s operations are subject to a broad range of laws and regulations relating to the protection of human health and the environment at its multiple locations and operating subsidiaries. As of December 31, 2023, excluding asset retirement obligations, ArcelorMittal had established provisions of 620 for environmental remedial activities and liabilities. The provisions for all operations by geographic area included mainly 427 in Europe, 98 in South Africa and 91 in Canada. In addition, ArcelorMittal and the previous owners of its facilities have expended substantial amounts to achieve or maintain ongoing compliance with applicable environmental laws and regulations. ArcelorMittal expects to continue to expend resources in this respect in the future.
Europe
Environmental provisions for ArcelorMittal’s operations in Europe total 427 and are mainly related to the investigation and remediation of environmental contamination at current and former operating sites in Belgium (208 ), Luxembourg (78 ), France (58 ), Poland (40 ), Germany (34 ) and Spain (8 ). This investigation and remediation work relates to various matters such as decontamination of water discharges, waste disposal, cleaning water ponds and remediation activities that involve the clean-up of soil and groundwater. These provisions also relate to human health protection measures such as fire prevention and additional contamination prevention measures to comply with local health and safety regulations.
Belgium
In Belgium, environmental provisions of 208 mainly relate to legal site remediation obligations linked to the closure of the primary installations at the Liège site of ArcelorMittal Belgium. The provisions also include the external recovery and disposal of waste, residues or by-products that cannot be recovered internally at the ArcelorMittal Ghent and Liège sites and the removal and disposal of material containing asbestos.
Luxembourg
In Luxembourg, environmental provisions of 78 relate to the post-closure monitoring and remediation of former production sites, waste disposal areas, slag deposits and mining sites. They include 33 with respect to obligations to secure, stabilize and conduct waterproofing treatment in mining galleries and
351
| Consolidated financial statements | ||
| (millions of U.S. dollar, except share and per share data) | ||
various dumping areas in Mondercange, Dommeldange and Dudelange. In addition, a 26 provision is recognized with respect to the covering process of the Differdange dump which was used for disposal of ladle slag, sludge and certain other residues coming from different Luxembourg sites.
France
In France, environmental provisions of 58 principally relate to the remediation of former sites, including several coke plants, and the capping and monitoring of landfills or basins previously used for residues and secondary material.
The remediation of the coke plants relates mainly to the Thionville, Moyeuvre-Grande, Homecourt, Hagondange and Micheville sites, and is related to the treatment of soil and groundwater. At the Thionville coke plant, soil remediation has been completed, while additional investigations are ongoing for groundwater.
ArcelorMittal is responsible for closure and final rehabilitation of the rest of the site corresponding to the former Conroy and Pérotin slag-heaps, for which the administrative procedure for cessation of activity is underway but due to the COVID-19 pandemic the project slowed down and the remediation has been postponed to 2024 due to change of regulator. In other sites, ArcelorMittal France is responsible for monitoring the concentration of organic compound and heavy metals in soil and groundwater on all former sites closed and/or already remediated. The Florange coke plant was idled in 2020 and is now under investigation for its demolition and remediation.
ArcelorMittal France has an environmental provision that principally relates to the remediation and improvement of storage of secondary materials, the disposal of waste at different ponds and landfills and an action plan for removing asbestos from the installations and mandatory financial guarantees to cover risks of major accident hazard or for gasholders and waste storage. Most of the provision relates to the stocking areas at the Dunkirk site that will need to be restored to comply with local law and to the mothballing of the liquid phase in Florange, including study and surveillance of soil and water to prevent environmental damage, treatment and elimination of waste and financial guarantees requested by public authorities. Environmental provisions also include treatment of slag dumps at the Florange and Dunkirk sites as well as removal and disposal of material containing asbestos at the Dunkirk and Mardyck sites.
Poland
ArcelorMittal Poland’s environmental provision of 40 includes 27 for cleaning and remediation costs following the closure of primary facilities in Kraków and land remediation of post-industrial areas in Ruszca (district of Kraków); the remaining 13 relate to the obligation to reclaim landfills in Kraków,
Zdzieszowice, Dabrowa Górnicza and to dispose of the residues from a landfill in Lipówka which cannot be internally recycled or externally recovered in Dabrowa Gornicza, the storage and disposal of iron-bearing sludge which cannot be reused in the manufacturing process under the environmental law.
Germany
In Germany, the 34 environmental provision essentially relates to ArcelorMittal Bremen’s post-closure obligations at the Prosper coke plant in Bottrop mainly established for soil remediation, groundwater treatment and monitoring.
South Africa
AMSA has environmental provisions of 98 mainly relating to environmental remediation obligations attributable to historical or legacy settling/evaporation dams and waste disposal activities. An important determinant in the final timing of the remediation work relates to obtaining the necessary environmental authorizations.
A provision of 26 relates to the decommissioned Pretoria Works site. This site is in a state of care and maintenance with ongoing rehabilitation. AMSA transformed this old plant into an industrial hub for light industry since the late 1990s. Particular effort is directed to landfill sites, with sales of slag from legacy disposal sites to vendors in the civil construction industry continuing unabated, but other remediation works continued at a slow pace as remediation actions for these sites are long-term in nature.
The Vanderbijlpark Works site, the main flat carbon steel operation of AMSA, contains a number of legacy facilities and areas requiring remediation. The remediation entails the implementation of rehabilitation and decontamination measures of waste disposal sites, waste water dams, ground water and historically contaminated open areas. Provisions relating to this site amount to 15 .
The Newcastle Works site is the main long carbon steel operation of AMSA. A provision of 23 relates to this site. As with all operating sites of AMSA, the above retirement and remediation actions dovetail with numerous large capital expenditure projects dedicated to environmental management. In the case of the Newcastle site, the major current environmental capital project is for air quality improvements, waste site remediation and storm water management.
A provision of 33 relates to the environmental rehabilitation of the Thabazimbi mine. AMSA holds an environmental trust which holds investments for a value of 24 that will be used for rehabilitation purposes.
Canada
In Canada, ArcelorMittal Dofasco has a 31 environmental provision for the expected cost of remediating toxic sediment located in the Company’s East Boatslip site, for which
352
| Consolidated financial statements | ||
| (millions of U.S. dollar, except share and per share data) | ||
management is in process of reviewing the tenders for initiating the expenditure.
Asset Retirement Obligations (“AROs”)
AROs arise from legal requirements and represent management’s best estimate of the present value of the costs that will be required to retire plant and equipment or to restore a site at the end of its useful life, mainly in connection with mining operations. As of December 31, 2023, ArcelorMittal had established provisions for asset retirement obligations of 380 , including mainly 150 for Canada, 63 for Mexico, 47 for Ukraine, 47 for Germany, 30 for Brazil,19 for Liberia and 11 for South Africa. As of December 31, 2023, AROs related to mining activities and total undiscounted amount of site restoration obligations amounted to 293 and 934 , respectively.
AROs in Canada are legal obligations for site restoration and dismantling of the facilities near the mining sites in Mont-Wright and Fire Lake, and the accumulation area of mineral substances at the facility of Port-Cartier in Quebec, upon closure of the mines pursuant to the restoring plan of the mines. In addition, Dofasco has legal obligations for the former Sherman Mine site near Temagami, Ontario.
AROs in Mexico relate to the restoration costs of the Las Truchas, El Volcan, San Jose and the joint operation Peña Colorada iron ore mines.
AROs in Ukraine are legal obligations for site rehabilitation at the iron ore mining site in Kryvyi Rih, upon closure of the mine pursuant to its restoration plan.
In Germany, AROs principally relate to the Hamburg site, which operates on leased land with the contractual obligation to remove all buildings and other facilities upon the termination of the lease, and to the Prosper coke plant in Bottrop for filling the basin, restoring the layer and stabilizing the shoreline at the harbor.
In Liberia, AROs relate to iron ore mine and associated infrastructure and mine related environmental damage and compensation. They cover the closure and rehabilitation plan under both the current operating phase and the not yet completed Phase 2 expansion project.
AROs in South Africa are for the Pretoria, Vanderbijlpark, Saldanha, Newcastle as well as the Coke and Chemical sites, and relate to the closure and clean-up of the plant associated with decommissioned tank farms, tar plants, chemical stores, railway lines, pipelines and defunct infrastructure.
In Belgium, AROs are to cover the demolition costs for the primary facilities at the Liège site.
In Brazil, AROs relate to legal obligations to clean and restore the mining areas of Serra Azul and Andrade, both located in the State of Minas Gerais.
In Poland, AROs relate to the legal obligation to decontaminate and recultivate a land in Krakow following closure of the operations.
In Bosnia and Herzegovina, ARO relates to re-cultivation of dump yard of old iron ore pit Buvac and closing dam Medjedja.
9.2 Other long-term obligations
| Balance at December 31, | |||||||||||
| 2023 | 2022 | ||||||||||
| Derivative financial instruments (notes 6.1 and 6.3) | |||||||||||
| Payable from acquisition of financial assets | |||||||||||
| Unfavorable contracts | |||||||||||
| Income tax payable | |||||||||||
| Put option liability ArcelorMittal Texas HBI (note 11.5.2) | |||||||||||
| Put option liability Sonasid (note 11.5.2) | |||||||||||
| Other | |||||||||||
| Total | |||||||||||
As of December 31, 2023 and 2022, payable from acquisition of financial assets included 52 and 66 respectively related to AMNS India's debt guarantee (see note 9.4).
Unfavorable contracts of 233 and 92 as of December 31, 2023 and 2022, respectively, mainly related to ArcelorMittal Pecém (see note 2.2.4) and ArcelorMittal Brasil.
As of December 31, 2023, the income tax payable mainly related to income tax contingencies (in majority unasserted claims) and withholding tax.
9.3 Contingent liabilities
Tax Claims
ArcelorMittal is a party to various tax claims. As of December 31, 2023, ArcelorMittal had recorded short-term and long-term liabilities related to income tax contingencies of 50 and provisions for non-income tax claims in the aggregate of 81 for which it considers the risk of loss to be probable. Set out below is a summary description of the tax claims (i) for which ArcelorMittal had recorded a provision as of December 31, 2023, (ii) that constitute a contingent liability, (iii) that were resolved in 2023 or (iv) that were resolved and had a financial impact in 2022 or 2021, in each case involving amounts deemed material by ArcelorMittal. The Company is vigorously defending against the pending claims discussed below.
353
| Consolidated financial statements | ||
| (millions of U.S. dollar, except share and per share data) | ||
Brazil
In 2011, ArcelorMittal Brasil received 21 separate tax assessments from the Revenue Service of the State of Espirito Santo for ICMS (a value-added tax) in an amount which totaled 30 relating to a tax incentive (INVEST) it used. The dispute concerns the definition of fixed assets. Following a series of decisions and appeals (partially favorable) over a ten-year period, in July 2021, ArcelorMittal Brasil filed 4 lawsuits (in relation to 21 tax assessments received in 2011) to discuss the remaining amount in the court of first instance. All these cases are pending trial as of December 31, 2023.
In 2011, ArcelorMittal Brasil received a tax assessment for corporate income tax (known as IRPJ) and social contributions on net profits (known as CSL) in relation to (i) the amortization of goodwill on the acquisition of Mendes Júnior Siderurgia (for the 2006 and 2007 fiscal years), (ii) the amortization of goodwill arising from the mandatory tender offer ("MTO") made by ArcelorMittal (ex-Mittal Steel N.V.) to minority shareholders of Arcelor Brasil in connection with the two-step merger of Arcelor and Mittal Steel N.V. (for the 2007 tax year), (iii) expenses related to pre-export financing used to finance the MTO, which were deemed by the tax authorities to be unnecessary for ArcelorMittal Brasil since the expenses were incurred to buy shares of its own company and (iv) CSL over profits of controlled companies in Argentina and Costa Rica. The amount claimed now totals 500 and the ArcelorMittal Brasil's appeal against the second instance decision largely favorable to the Federal Revenue Service has been pending trial with the third instance of the administrative tribunal since March 2018.
In April 2016, ArcelorMittal Brasil received a tax assessment in relation to (i) the amortization of goodwill resulting from the MTO made by ArcelorMittal (ex-Mittal Steel N.V.) to the minority shareholders of Arcelor Brasil in connection with the two-step merger of Arcelor and Mittal Steel N.V. in 2007 and (ii) the amortization of goodwill resulting from ArcelorMittal Brasil’s acquisition of CST in 2008. While the assessment, if upheld, would not result in a cash payment as ArcelorMittal Brasil did not have any tax liability for the fiscal years in question (2011 and 2012), it would result in a 68 financial impact arising from a write off of 'net operating loss carry forward' with respect to the 2011-2012 tax year. ArcelorMittal Brasil's appeal against the unfavorable decision on the lower instances of the assessment has been awaiting judgment in the third instance of the administrative tribunal since November 2019.
In December 2018, ArcelorMittal Brasil received a tax assessment of 126 , which could have an additional 22 financial impact arising from a write off of 'net operating loss carry forward' with respect to the 2013-2014 tax years, principally in relation to the amortization of goodwill resulting from the MTO made by ArcelorMittal (ex-Mittal Steel N.V.) to the minority shareholders of Arcelor Brasil in connection with the two-step
merger of Arcelor and Mittal Steel N.V. in 2007. After lower court decisions and appeals in November 2022, the second instance of the administrative tribunal cancelled the tax assessment. In January 2023, the Federal Revenue Service filed an appeal to the third instance of the administrative tribunal.
In December 2020, ArcelorMittal Brasil received a tax assessment of 44 with respect to the 2015-2016 tax years, related to the amortization of goodwill resulting from the MTO made by ArcelorMittal (ex-Mittal Steel N.V.) to the minority shareholders of Arcelor Brasil in connection with the two-step merger of Arcelor and Mittal Steel N.V. in 2007. ArcelorMittal Brasil filed its defense in the first instance of the administrative tribunal in January 2021 which issued an unfavorable decision in August 2021. ArcelorMittal Brasil filed an appeal to the second instance of the administrative tribunal in September 2021.
In the period from 2014 to 2018, ArcelorMittal Brasil received tax assessments from the Federal Revenue Service in the amount of 46 disputing its use of credits for PIS and COFINS social security taxes in 2010, 2011 and 2013. The disputes relate to the concept of production inputs in the context of these taxes. In four of the cases, the tax assessments have been partially reduced and ArcelorMittal Brasil's subsequent appeals to dispute the remaining amounts are currently pending. One of these cases has already closed at the administrative level and is pending a decision at the first judicial level. In the fifth case, the administrative tribunal of the first instance upheld the tax assessment in March 2017, and ArcelorMittal Brasil appealed to the second instance of the administrative tribunal. In the sixth case, the first instance of the administrative tribunal issued an unfavorable decision in April 2017, and ArcelorMittal Brasil appealed to the second instance of the administrative tribunal. Subsequently, the Superior Court decided two leading cases, not involving ArcelorMittal Brasil, that are expected to strengthen ArcelorMittal’s defense in the sixth case in which part of the contingency is related to scrap acquisition. In February 2011, ArcelorMittal Brasil also filed a claimant individual lawsuit on the PIS/COFINS credits over scrap acquisition matter, in which a favorable and unappealable decision was issued in May 2022. Accordingly and as a result of this legal clarification, in 2022, ArcelorMittal recorded PIS/COFINs tax credits in cost of sales in the amount of 300 with respect to prior periods.
In May 2014, ArcelorMittal Comercializadora de Energia received a tax assessment from the state of Minas Gerais alleging that the company did not correctly calculate tax credits on interstate sales of electricity from February 2012 to December 2013. The amount claimed totals 40 . Following the conclusion of this proceeding at the administrative level, the company received the tax enforcement notice in December 2015 and filed its defense in February 2016. In April 2016, ArcelorMittal Comercializadora de Energia received an
354
| Consolidated financial statements | ||
| (millions of U.S. dollar, except share and per share data) | ||
additional tax assessment in the amount, of 58 , after taking account of a reduction of fines mentioned below regarding the same matter, for infractions which allegedly occurred during the 2014 to 2015 period, and filed its defense in May 2016. Following appeal, the company received a notice from the tax authority in November 2017 that reduced the fees in the second case by 12 , due to retrospective application of a new law. In addition, in February 2019, a reduction of the fine by 7 was finalized in the first case due to the retrospective application of a new law. The cases are currently pending in the first judicial instance.
In 2015, ArcelorMittal Brasil received nine tax assessments from the state of Rio Grande do Sul alleging that the company, through its branches in that state, had not made advance payments of ICMS on sales in that state covering the period from May 2010 to April 2015. The amount claimed totals 89 . In the Administrative instance, all the cases were unfavorably closed. ArcelorMittal Brasil filed 5 lawsuits to discuss the matter. In the first judicial instance, ArcelorMittal Brasil obtained a largely favorable decisions in all cases. There were appeals from the company and the tax authority. In September 2022, the second judicial instance ruled a largely favorable decision to the company in one case (in amount of 4 ). In November 2023, the second judicial instance ruled a largely favorable decision in the Company in two cases (in the amount of 9 ). In December 2023, the court of the second judicial instance ruled against the Company in another case (in the amount of 1 ) and began adjudicating the last case (in the amount of 73 ) for which the trial is pending.
On May 17, 2016, ArcelorMittal Brasil received a tax assessment from the state of Santa Catarina in the current amount of 128 alleging that it had used improper methods to calculate the amount of its ICMS credits. In the Administrative instance, the case was unfavorably closed in November 2020, and ArcelorMittal Brasil filed a lawsuit to challenge the assessment. The case is pending at the judicial instance currently.
In January 2023, ArcelorMittal Brasil received a tax assessment from the Federal Revenue Service in an amount of 156 in which the tax authority rejected the offsetting of PIS/COFINS credits used by the company in 2018. The dispute relates to various types of credits such as credits recognized in Court processes (exclusion of ICMS from the PIS and COFINS calculation base, PIS/COFINS credits in the Manaus Free Trade Zone), expenses related to the acquisition of scrap (including freight), expenses related to port handling, and expenses for freight for finished products. ArcelorMittal Brasil filed an administrative defense in February 2023. In November 2023, the company was notified of the unfavorable decision and filed an appeal in December 2023.
In January 2023, ArcelorMittal Brasil received a tax assessment in an amount of 16 for a 50 % fine for alleged non-payment of the monthly estimate of CIT related to fiscal year 2018. The Federal Revenue accuses the company of undue offsetting of CIT credits paid in Venezuela from 2010 to 2014 when calculating the monthly IRC estimate for 2018. In February 2023, ArcelorMittal Brasil filed its defense. In September 2023, the first administrative instance ruled against the company and ArcelorMittal filed an appeal. In November 2023, ArcelorMittal Brasil received a new tax assessment of 60 . The Federal Revenue accuses the company of allegedly undue offsetting of CIT credits paid in Venezuela from 2010 to 2014 and offset by ArcelorMittal Brasil in 2018. In December 2023, the company filed an administrative defense. Both cases are currently pending.
In 2010, ArcelorMittal Brasil received a first tax assessment for BRL 94 million (19 ) arguing that the company should not have used a tax incentive granted by the State of Bahia, according to which taxpayers could take ICMS credit on the value of freight paid by them, since AMTC is not a real plant (for the period from March 2008 to December 2009). Furthermore, the company also used the tax incentive (“Proauto”), which may not be combined with another tax benefit. In 2012, this case was closed unfavorably at the administrative level and the company filed a lawsuit to discuss the tax charge with the the court of first instance. In 2023, the company obtained a favorable decision from the court of first instance, canceling the assessment. Currently, the case is awaiting a trial by the court of second instance. In June 2014, the company received a second tax assessment of BRL 23 million (5 ) discussing the same matter, but related to a different period (from June 2010 to December 2012). In 2017, the administrative level judged the assessment partially in favor of the company (cancelling the taxes, but maintaining the fines) and the company filed a lawsuit, which is awaiting a decision from the court of first instance. In December 2014, the company received a third tax assessment of BRL 20 million (4 ) discussing the same matter, but related to a different period (from January 2013 to December 2013). In 2015, the administrative court of first instance ruled unfavorably to the company and the company filed an appeal, currently pending trial. In November 2022, the company received a fourth tax assessment of BRL 114 million (24 ) resulting from the use of the accumulated credit, which, according to the tax authorities, could not be used because it had already been extinguished by the statute of limitations. In May 2023, the administrative court of first instance dismissed the defense. In June 2023, the company filed an appeal to the administrative court of second instance and the appeal is currently pending.
Mexico
In 2015, the Mexican Tax Administration Service issued a tax assessment to ArcelorMittal Mexico, with respect to 2008,
355
| Consolidated financial statements | ||
| (millions of U.S. dollar, except share and per share data) | ||
principally due to improper interest deductions relating to certain loans, and unpaid corporate income tax for interest payments that the tax authority categorized as dividends. ArcelorMittal Mexico's complaint for annulment before a Federal Administrative and Tax Court is pending. The amount of the tax assessment as of December 31, 2023 is 247 .
In October 2018, the Mexican Tax Administration Service issued a tax assessment to ArcelorMittal Las Truchas, with respect to 2013 due to: (i) improper interest deductions relating to certain loans (ii) non-deduction of advanced rent payments and (iii) non-deduction of rolling roll expenses. In November 2018, ArcelorMittal Las Truchas filed an administrative appeal before the Administrative Authority on Federal Tax Matters, which was rejected in June 2019 and is being appealed. Therefore, in August 2019, ArcelorMittal Las Truchas filed an annulment complaint before a Federal Administrative and Tax Court. In June 2023, the Federal Administrative and Tax Court ruled against the annulment claim. In July 2023, ArcelorMittal Las Truchas filed an appeal before the Court of Appeal. The amount of the tax assessment as of December 31, 2023 is 129 .
On February 24, 2023, the Tax Administration Service notified ArcelorMittal Las Truchas of a tax assessment, with respect to 2014. In April 2023, ArcelorMittal Las Truchas filed an administrative appeal in respect of this assessment before the Tax Administrative Service. The amount of the tax assessment as of December 31, 2023 is 112 .
Ukraine
In October 2019, AMKR received orders from Ukrainian tax authorities covering the findings of a tax audit for the period from 2015 through the first quarter of 2019 which claimed the company owes additional taxes of 278 for that period. AMKR appealed these orders to the tax authorities resulting in a significant reduction of the amounts claimed. In January 2020, AMKR filed three legal actions with the Kyiv District Administrative Court seeking to cancel the remaining additional charges amounting to 128 . The three cases were later merged into one case (hereinafter called 'First case') and moved to the Dnipro District Administrative Court. In February 2023, the Court dismissed the entirety of the claim except for an amount of $50,000 . The tax authorities appealed the decision in April 2023. In July 2023, the Court dismissed the tax authorities appeal and upheld the first instance decision. In April 2023, tax authorities filed an appeal claim to the Third Administrative Appellate Court. Court opened appeal proceedings and in July 2023, the Third Administrative Appellate Court left the tax authority's appeal unsatisfied, and the decision of the first instance remained unchanged. In September 2023, the Supreme Court opened the cassation proceedings on the claim of tax authority. In November 2023, the Supreme Court satisfied the cassation claim of the tax authority partially and changed decisions of the courts of first and appellate instances. Therefore, AMKR won
this case partially in the amount of 3.4 billion UAH (90 ). Further, in January 2024, the tax authority filed to the Dnipro District Administrative Court the request to review the case based on newly discovered circumstances, court opened proceedings. The amount of the new lawsuit is around $35,500 .
Competition/Antitrust Claims
ArcelorMittal is a party to various competition/antitrust claims. As of December 31, 2023, ArcelorMittal had recorded a non-material amount provision in respect of such claims. Set out below is a summary description of competition/antitrust claims (i) that constitute a contingent liability, (ii) that were resolved in 2023 or (iii) that were resolved and had a financial impact in 2022 or 2021, in each case involving amounts deemed material by ArcelorMittal. The Company is vigorously defending against each of the pending claims discussed below.
Brazil
In September 2000, two construction trade organizations filed a complaint with Brazil’s Administrative Council for Economic Defense (“CADE”) against three long steel producers, including ArcelorMittal Brasil. The complaint alleged that these producers colluded to raise prices in the Brazilian rebar market, thereby violating applicable antitrust laws. In September 2005, CADE issued its final decision against ArcelorMittal Brasil, imposing a fine of 75 . ArcelorMittal Brasil's appeal of the court judgment against it is currently pending.
There is also a related class action commenced by the Federal Public Prosecutor of the state of Minas Gerais against ArcelorMittal Brasil for damages in an amount of 83 based on the alleged violations investigated by CADE. The injunction requested by the Federal Prosecution Office was denied.
A further related lawsuit was commenced in February 2011 by four units of Sinduscons, a civil construction trade organization, in federal court in Brasilia against, inter alia, ArcelorMittal Brasil claiming damages based on an alleged cartel in the rebar market as investigated by CADE and as noted above.
Other Legal Claims
ArcelorMittal is a party to various other legal claims. As of December 31, 2023, ArcelorMittal had recorded provisions of 268 for other legal claims in respect of which it considers the risk of loss to be probable. Set out below is a summary description of the other legal claims (i) in respect of which ArcelorMittal had recorded a provision as of December 31, 2023, (ii) that constitute a contingent liability, (iii) that were resolved in 2023, or (iv) that were resolved and had a financial impact in 2022 or 2021, in each case involving amounts deemed material by ArcelorMittal. The Company is vigorously defending against each of the claims discussed below that remain pending.
356
| Consolidated financial statements | ||
| (millions of U.S. dollar, except share and per share data) | ||
Argentina
Over the course of 2007 to 2021, the Argentinian Customs Office Authority (“Aduana”) notified Acindar, of certain inquiries that it was conducting with respect to prices declared by Acindar related to iron ore imports. The Customs Office Authority was seeking to determine whether Acindar incorrectly declared prices for iron ore imports from several different Brazilian and Bolivian suppliers and from ArcelorMittal Sourcing originally on 39 different claims concerning several shipments made between 2002 and 2021. The investigations are subject to the administrative procedures of the Customs Office Authority and are at different procedural stages depending on the filing date of the investigation. In March 2018, the Customs Office Authority issued a general instruction that ordered customs to withdraw current claims related to the difference between import prices in Argentina and export prices of iron ore when exiting Brazil, which has led to a reduction in the number of claims and amounts claimed against Acindar. In addition, other cases have been dismissed by the National Tax Court. As of December 2023, the aggregate amount claimed by the Customs Office Authority in respect of all iron ore shipments is 90 in 17 different cases. Of these 17 cases, 6 are still in the administrative branch of the Customs Office Authority and the other 11 cases, in which the administrative branch of the Customs Office Authority ruled against Acindar, have been appealed to the Argentinian National Fiscal Court.
Brazil
In 2015, the SINDIMETAL (employees’ union) filed a lawsuit against ArcelorMittal Brasil to annul all the collective labor agreements related to 12-hour work shifts. The case impacts a group of approximately 2,500 employees. In July 2022, the Supreme Court decided a leading case, not involving ArcelorMittal Brasil, that may favorably impact ArcelorMittal Brasil's case, which is currently pending on appeal.
In April 2017, a shareholder in Siderúrgica Três Lagoas (“SITREL”) (of which ArcelorMittal Brasil is the other shareholder), commenced an arbitration against Votorantim Siderurgia S.A. (which subsequently merged into ArcelorMittal Brasil) and SITREL with the Center for Arbitration and Mediation of the Chamber of Commerce Brazil-Canada (CAM-CCBC). The dispute concerns a provision in SITREL’s joint venture agreement relating to the formula used to determine the selling price for steel billets supplied by ArcelorMittal Brasil to SITREL from January 2013 onwards. The shareholder has alleged that the steel billets were overpriced and is seeking compensation for overpaid amounts on both a retrospective and prospective basis, with the initial amount claimed totaling 33 . In April 2022, a final arbitral award was issued, which has been satisfied by ArcelorMittal Brasil. Given ArcelorMittal Brasil’s ownership interest in SITREL, the financial impact for ArcelorMittal was a
net loss after tax of approximately 126 (67 net of partial recovery through dividend payment from SITREL) in 2022.
On March 30, 2022, Votorantim S.A. (“Votorantim”) exercised the put option right it has under its shareholders’ agreement with the Company to sell its entire equity interest in ArcelorMittal Brasil to the Company, following the acquisition of Votorantim's long steel business in Brazil in 2018. There is a dispute between the parties as to the value of the put option. Votorantim has valued the put option at BRL 5.283 billion (i.e. 1,091 ). In September 2022, Votorantim commenced an arbitration against ArcelorMittal Brasil seeking the full amount of its value of the put option, which would be reduced by the undisputed amount ArcelorMittal Brasil accepts as the value of the put option and which was paid in January 2023 for 179 (see note 11.5.2). The parties have filed their respective statements of defense in the arbitration and the case is currently pending.
Italy
In January 2010, ArcelorMittal received notice of a claim filed by Finmasi S.p.A. relating to a memorandum of agreement (“MoA”) entered into between ArcelorMittal Distribution Services France (“AMDSF”) and Finmasi in 2008. The MoA provided that AMDSF would acquire certain of Finmasi’s businesses for an amount not to exceed 114 , subject to the satisfaction of certain conditions precedent, which, in AMDSF’s view, were not fulfilled. Finmasi sued for (i) enforcement of the MoA, (ii) damages of 17 to 29 or (iii) recovery costs plus quantum damages for Finmasi’s alleged lost opportunity to sell to another buyer. In September 2011, the court rejected Finmasi’s claims other than its second claim. The court appointed an expert to determine the quantum of damages. In May 2013, the expert’s report was issued and valued the quantum of damages in the range of 46 to 73 . ArcelorMittal appealed the decision on the merits. In January 2019, Finmasi called on the AMDSF guarantee issued in the context of the enforcement proceedings that were suspended in 2015. After a series of appeals, Finmasi has repaid half of the amount of the guarantee that was called and provided a bank guarantee for the remainder. In December 2022, the Court found that AMDSF has the right to obtain restitution of approximately 28 paid to Finmasi and ordered Finmasi to pay the half still outstanding (approximately 13.9 ) plus interest and certain costs. In February 2023, Finmasi filed an appeal to the Court of Cassation. AMDSF duly filed its defense in March 2023.
357
| Consolidated financial statements | ||
| (millions of U.S. dollar, except share and per share data) | ||
Luxembourg
In June 2012, the Company received writs of summons in respect of claims made by 59 former employees of ArcelorMittal Luxembourg. The claimants allege that they are owed compensation based on the complementary pension scheme that went into effect in Luxembourg in January 2000. The aggregate amount claimed by such former employees (bearing in mind that other former employees may bring similar claims) is 61 . Given the similarities in the claims, the parties agreed to limit the pending proceedings to four test claims. In April 2013, the Esch-sur-Alzette labor court rejected two of these test claims. The relevant plaintiffs are appealing these decisions. In November 2013, the Luxembourg city labor court rejected the two other test claims, which were appealed but were terminated by the court in November 2021. A final decision for the two pilot cases of Esch-sur-Alzette is expected by the end of 2024.
France
Retired and current employees of certain French subsidiaries of ArcelorMittal have initiated lawsuits to obtain compensation for asbestos exposure in excess of the amounts paid by French social security (“Social Security”). Asbestos claims in France initially are made by way of a declaration of a work-related illness by the claimant to the social security authorities resulting in an investigation and a level of compensation paid by social security. Once the social security authorities recognize the work-related illness, the claimant, depending on the circumstances, can also file an action for inexcusable negligence (faute inexcusable) to obtain additional compensation from the employer before a special tribunal. For faute inexcusable cases, the primary health insurance fund, CPAM - advances, the amount of damages and pension increase are reimbursed by the employer found at fault and takes recourse action against the employer.
The number of claims outstanding for asbestos exposure at December 31, 2023 was 243 as compared to 308 at December 31, 2022.
Minority Shareholder Claims Regarding the Exchange Ratio in the Second-Step Merger of ArcelorMittal into Arcelor
ArcelorMittal is the company that results from the acquisition of Arcelor by Mittal Steel N.V. in 2006 and a subsequent two-step merger between Mittal Steel and ArcelorMittal and then ArcelorMittal and Arcelor. Following completion of this merger process, several former minority shareholders of Arcelor or their representatives brought legal proceedings regarding the exchange ratio applied in the second-step merger between ArcelorMittal and Arcelor and the merger process as a whole.
ArcelorMittal believes that the allegations made and claims brought by such minority shareholders are without merit and that the exchange ratio and merger process complied with the requirements of applicable law, were consistent with previous
guidance on the principles that would be used to determine the exchange ratio in the second-step merger and that the merger exchange ratio was relevant and reasonable to shareholders of both merged entities.
Set out below is a summary of the ongoing matter in this regard. Several other claims brought before other courts and regulators on similar grounds were dismissed and are definitively closed.
On May 15, 2012, ArcelorMittal received a writ of summons on behalf of Association des Actionnaires d'Arcelor ("AAA"), a French association of former minority shareholders of Arcelor to appear before the civil court of Paris. The AAA alleged in particular that, based on Mittal Steel’s and Arcelor’s disclosure and public statements, investors had a legitimate expectation that the exchange ratio in the second-step merger would be the same as that of the secondary exchange offer component of Mittal Steel’s June 2006 tender offer for Arcelor (i.e., 11 Mittal Steel shares for 7 Arcelor shares), and that the second-step merger did not comply with certain provisions of company law. AAA claimed, inter alia, damages in a nominal amount and reserved the right to seek additional remedies including the cancellation of the merger. The proceedings before the civil court of Paris were stayed, pursuant to a ruling of such court on July 4, 2013, pending a preparatory investigation (instruction préparatoire) by a criminal judge magistrate (juge d’instruction) triggered by the complaints of AAA and several hedge funds (who quantified their total alleged damages at 282 ). The dismissal of charges (non-lieu) ending the preparatory investigation became final in March 2018. On March 6, 2020 AAA revived its claim before the civil court of Paris on its behalf and on behalf of the hedge funds who had also filed a criminal complaint, as well as two new plaintiffs. The complaint filed by AAA quantifies the total damages claimed at 431 (€390 million). A final hearing date for oral arguments has been scheduled for June 2024.
9.4 Commitments
| December 31, | |||||||||||
| 2023 | 2022 | ||||||||||
| Commitments related to purchases of raw materials and energy | |||||||||||
| Guarantees, pledges and other collateral | |||||||||||
| Capital expenditure commitments | |||||||||||
| Other commitments | |||||||||||
| Total | |||||||||||
Commitments related to purchases of raw materials and energy
Purchase commitments consist primarily of major agreements for procuring iron ore, coking coal, coke and hot metal. The Company also has a number of agreements for electricity, industrial and natural gas, scrap and freight. In addition to those purchase commitments disclosed above, the Company enters
358
| Consolidated financial statements | ||
| (millions of U.S. dollar, except share and per share data) | ||
into purchasing contracts as part of its normal operations which have minimum volume requirements but for which there are no take-or-pay or penalty clauses included in the contract. The Company does not believe these contracts have an adverse effect on its liquidity position.
Commitments related to purchases of raw materials and energy included commitments given to associates for 1,487 and 1,661 as of December 31, 2023 and 2022, respectively. Purchase commitments given to associates included 704 and 691 as of December 31, 2023 and 2022, respectively, related to the gas supply agreement with Kryvyi Rih Industrial Gas. Purchase commitments included commitments given to joint ventures for 838 and 988 as of December 31, 2023 and 2022, respectively. Purchase commitments given to joint ventures included 334 and 424 related to Tameh and 413 and 442 related to Enerfos as of December 31, 2023 and 2022, respectively.
Guarantees, pledges and other collateral
Guarantees related to financial debt and credit lines given on behalf of third parties were 155 and 181 as of December 31, 2023 and 2022, respectively. Additionally, guarantees of 12 and 12 were given on behalf of associates and guarantees of 4,992 and 4,383 were given on behalf of joint ventures as of December 31, 2023 and 2022, respectively.
Guarantees given on behalf of joint ventures included 421 and 354 on behalf of Calvert, 208 and 178 on behalf of Al Jubail and 480 and 341 in relation to outstanding lease liabilities for vessels operated by Global Chartering as of December 31, 2023 and 2022, respectively. Guarantees given on behalf of joint ventures also included 3,490 and 3,088 as of December 31, 2023 and 2022 corresponding to ArcelorMittal's 60 % guarantee of the debt under the term loan agreements entered into by the AMNS India joint venture with various Japanese banks.
As of December 31, 2023, pledges and other collateral mainly related to (i) mortgages entered into by the Company’s operating subsidiaries and (ii) inventories and receivables pledged to secure the South African Rand revolving borrowing base finance facility for the amount drawn of 162 and ceded bank accounts to secure environmental obligations, true sale of receivables programs and the revolving borrowing base finance facility in South Africa of 98 . Pledges of property, plant and equipment were 59 and 98 as of December 31, 2023 and 2022, respectively. Other sureties, first demand guarantees, letters of credit, pledges and other collateral included 319 and 375 of commitments given on behalf of associates as of December 31, 2023 and 2022, respectively, and 313 and 598 of commitments given on behalf of joint ventures as of December 31, 2023 and 2022, respectively.
Capital expenditure commitments
Capital expenditure commitments relate to commitments with respect to purchases of property, plant and equipment including in the context of expansion and improvement projects.
Capital expenditure commitments include 507 and 340 at December 31, 2023 and 2022 relating to ArcelorMittal Liberia Ltd in connection with Phase 2 expansion project that envisages the construction of 15 million tonnes of concentrate sinter fines capacity and associated infrastructure.
Capital expenditure commitments include 394 at December 31, 2023 and 2022 relating to ArcelorMittal Dofasco (Canada) mainly with respect to the construction of DRI – EAF facilities in the framework of the plant's decarbonization project.
Capital expenditure commitments also include 49 and 182 at the iron ore Serra Azul mine (Brazil) at December 31, 2023 and 2022 in connection with the construction of facilities to produce 4.5 million tonnes per annum of DRI quality pellet feed.
Other commitments
Other commitments given comprise mainly commitments incurred for gas supply to electricity suppliers.
As of September 21, 2018 an Environmental Commitment Agreement ("ECA") has been executed between ArcelorMittal Brasil, local government and the Brazilian environmental authorities. ArcelorMittal Brasil committed to carry out, over the next 5 years, a series of environmental operational and capital investments with the aim to reduce atmospheric emissions from the Company's Tubarão site. To comply with the ECA requirements, ArcelorMittal Brasil may need to acquire new equipment and change some of its current operating methods and processes. As of December 31, 2023 and 2022, ArcelorMittal Brasil estimated the underlying costs to implement those investments at 78 and 115 , respectively. The non-compliance with ECA would lead to fines amounting to a maximum of 21 and 19 as of December 31, 2023 and 2022, respectively. On November 19, 2021, following a protocol of intent agreed between the Minas Gerais State Government, ArcelorMittal Brasil and BMB Belgo Mineira Bekaert Artefatos De Arame Ltd ("BMB"), ArcelorMittal Brasil committed to carry out capital expenditures at the Monlevade site to complete the expansion project by the second half of 2026. As of December 31, 2023 and 2022, commitments related to this project were 348 and 420 , respectively.
Commitments to sell
In addition to the commitments presented above, the Company has firm commitments to sell for which it also has firm commitments to purchase included in purchase commitments for 131 and 368 as of December 31, 2023 and 2022, respectively, and mainly related to natural gas and electricity.
359
| Consolidated financial statements | ||
| (millions of U.S. dollar, except share and per share data) | ||
Other
On July 6, 2023, the Luxembourg Parliament approved the law enabling the State of the Grand-Duchy of Luxembourg to exercise the right (following an agreement signed between ArcelorMittal, the Fonds d'Urbanisation et d'Aménagement du Plateau de Kirchberg and the State of the Grand-Duchy of Luxembourg on December 20, 2022) to acquire 50 % of ArcelorMittal's future new headquarters and related right-of-use of land in the Kirchberg district of the city of Luxembourg. The acquisition price is based on construction cost. The exercise date of the right has been extended to February 29, 2024.
NOTE 10: INCOME TAXES
The current tax payable (recoverable) is based on taxable profit (loss) for the year. Taxable profit differs from profit as reported in the consolidated statements of operations because it excludes items of income or expense that are taxable or deductible in other years or are never taxable or deductible. The Company’s current income tax expense (benefit) is calculated using tax rates that have been enacted or substantively enacted as of the date of the consolidated statements of financial position.
Tax is charged or credited to the consolidated statements of operations, except when it relates to items charged or credited to other comprehensive income or directly to equity, in which case the tax is recognized in other comprehensive income or in equity.
Deferred tax is recognized on differences between the carrying amounts of assets and liabilities, in the consolidated financial statements and the corresponding tax basis used in the computation of taxable profit, and is accounted for using the statements of financial position liability method. Deferred tax liabilities are generally recognized for all taxable temporary differences, and deferred tax assets are generally recognized for all deductible temporary differences and net operating loss carry forwards to the extent that it is probable that taxable profits will be available against which those deductible temporary differences can be utilized. Such assets and liabilities are not recognized if the taxable temporary difference arises from the initial recognition of non-deductible goodwill or if the differences arise from the initial recognition (other than in a business combination) of other assets and liabilities in a transaction that affects neither the taxable profit nor the profit reported in the consolidated statements of operations.
Deferred tax liabilities are recognized for taxable temporary differences associated with investments in subsidiaries, associates and joint ventures, except if the Company is able to control the reversal of the temporary difference and it is probable that the temporary difference will not reverse in the foreseeable future. Deferred tax assets arising from deductible temporary differences associated with such investments are
only recognized to the extent that it is probable that there will be sufficient taxable profits against which the benefits of the temporary differences can be utilized and are expected to reverse in the foreseeable future.
Deferred tax assets and liabilities are measured at the tax rates that are expected to apply in the period in which the liability is settled or the asset realized, based on tax rates (and tax laws) that have been enacted or substantively enacted at the consolidated statements of financial position date. The measurement of deferred tax assets and liabilities reflects the tax consequences that would result from the manner in which the Company expects, at the reporting date, to recover or settle the carrying amount of its assets and liabilities.
The carrying amount of deferred tax assets is reviewed at each consolidated statements of financial position date and reduced to the extent that it is no longer probable that sufficient taxable profits will be available to enable all or part of the asset to be recovered. The Company reviews the deferred tax assets in the different jurisdictions in which it operates to assess the possibility of realizing such assets based on projected taxable profit, the expected timing of the reversals of existing temporary differences, the carry forward period of temporary differences and tax losses carried forward and the implementation of planning strategies. Due to the numerous variables associated with these judgments and assumptions, both the precision and reliability of the resulting estimates of the deferred tax assets are subject to substantial uncertainties. In case a history of recent losses is present, the Company considers whether convincing other evidence exists, such as the character of (historical) losses and planning opportunities, to support the deferred tax assets recognition.
Deferred tax assets and liabilities are offset when there is a legally enforceable right to set off current tax assets against current tax liabilities, when they relate to income taxes levied by the same taxation authority and when the Company intends to settle its current tax assets and liabilities on a net basis.
Uncertain (income) tax positions are periodically assessed by the Company based on management’s best judgment given any changes in the facts, circumstances and information available and applicable tax laws. When it is probable that the position taken in the tax return will not be accepted by the tax authorities, the Group establishes provisions based on the most likely amount of the liability (recovery) or weighted average of various possible outcomes to reflect the effect of the uncertainty in determining the related taxable profit (tax loss), tax bases, unused tax losses, unused tax credits or tax rates, to the extent that a reliable estimate can be made.
The Company has adopted International Tax Reform – Pillar Two Model Rules (Amendments to IAS 12 upon their release on
360
| Consolidated financial statements | ||
| (millions of U.S. dollar, except share and per share data) | ||
May 23, 2023). The Amendments provide a temporary mandatory exception from deferred tax accounting for the top-up tax, which is effective immediately, and require new disclosures about the Pillar Two exposure as of December 31, 2023. The Company has applied a temporary mandatory relief from deferred tax accounting for the impacts of the top-up tax and accounts for it as a current tax when incurred.
10.1 Income tax expense
The components of income tax expense (benefit) are summarized as follows:
| Year ended December 31, | |||||||||||||||||
| 2023 | 2022 | 2021 | |||||||||||||||
| Total current tax expense | |||||||||||||||||
Total deferred tax expense (benefit) | ( | ( | ( | ||||||||||||||
| Total income tax expense | |||||||||||||||||
The following table reconciles the expected tax expense at the statutory rates applicable in the countries where the Company operates to the total income tax expense as calculated:
| Year ended December 31, | |||||||||||||||||
| 2023 | 2022 | 2021 | |||||||||||||||
| Net income (loss) (including non-controlling interests) | |||||||||||||||||
| Income tax expense | |||||||||||||||||
| Income before tax | |||||||||||||||||
Tax expense at the statutory rates applicable to income in the countries1 | |||||||||||||||||
| Permanent items | ( | ( | |||||||||||||||
| Rate changes | |||||||||||||||||
| Net change in measurement of deferred tax assets | ( | ( | ( | ||||||||||||||
| Tax effects of foreign currency translation | ( | ( | |||||||||||||||
| Tax credits | ( | ( | ( | ||||||||||||||
| Other taxes | |||||||||||||||||
| Others | |||||||||||||||||
| Income tax expense | |||||||||||||||||
ArcelorMittal’s consolidated income tax expense is affected by the income tax laws and regulations in effect in the various countries in which it operates and the pre-tax results of its subsidiaries in each of these countries, which can change from year to year. ArcelorMittal operates in jurisdictions, mainly in Eastern Europe and Asia, which have a structurally lower corporate income tax rate than the statutory tax rate as enacted in Luxembourg (24.94 %), as well as in jurisdictions, mainly in Brazil and Mexico, which have a structurally higher corporate income tax rate.
| Permanent items | Year ended December 31, | ||||||||||||||||
| 2023 | 2022 | 2021 | |||||||||||||||
| Taxable reversals of (tax deductible) write-downs on shares and receivables | ( | ( | |||||||||||||||
| Non-deductible loss on disposal of Kazakhstan operations | |||||||||||||||||
| Juros sobre o Capital Próprio | ( | ( | ( | ||||||||||||||
| Other permanent items | |||||||||||||||||
| Total permanent items | ( | ( | |||||||||||||||
Taxable reversals of (tax deductible) write-downs on shares and receivables: in connection with the Company's impairment test for goodwill and property, plant and equipment, the recoverability of the carrying amounts of investments in shares and intragroup receivables is also reviewed annually, resulting in tax deductible write-downs, or taxable reversals of previously recorded write-downs, of the values of loans and shares of consolidated subsidiaries in Luxembourg.
361
| Consolidated financial statements | ||
| (millions of U.S. dollar, except share and per share data) | ||
Juros sobre o Capital Próprio: Corporate taxpayers in Brazil, which distribute a dividend can benefit from a tax deduction corresponding to an amount of interest calculated as a yield on capital. The deduction is determined as the lower of the interest as calculated by application of the Brazilian long term interest rate on the opening balance of capital and reserves, and 50% of the income for the year or accumulated profits from the previous year. For accounting purposes, this distribution of interest on capital is regarded as a dividend distribution, while for Brazilian tax purposes it is regarded as tax deductible interest.
Non-deductible loss on disposal of Kazakhstan operations: the Company recorded 0.9 billion impairment charges and 1.5 billion foreign exchange translation losses in connection with the divestment of its operations in Kazakhstan. Both items are non-deductible for tax purposes, see note 2.3.
Rate changes
The 2021 tax expense from rate changes of 12 is mainly due to the impact of the change of the tax rate on deferred taxes in Argentina.
Net change in measurement of deferred tax assets
The 2023 net change in measurement of deferred tax assets of (423 ) mainly consists of (i) recognition of deferred tax assets in Luxembourg of (314 ) including recognition of tax losses carried forward based on revised taxable income forecast of (366 ), and (ii) net recognition of (109 ) of deferred tax assets in other tax jurisdictions, including (292 ) recognition related to higher future profits expectation.
The 2022 net change in measurement of deferred tax assets of (1,154 ) mainly consists of recognition of deferred tax assets in Luxembourg of (1,227 ) including mainly (676 ) effect of the utilization of unrecognized tax losses carried forward following higher profitability of the current year (net of write-downs of shares), (579 ) recognition of tax losses carried forward based on revised taxable income forecast, derecognition of deferred tax assets on losses and deductible temporary differences in Ukraine of 178 , and (105 ) utilization of deferred tax assets in other tax jurisdictions, following profits generated during the year.
The 2021 net change in measurement of deferred tax assets of (2,956 ) mainly consists of recognition of deferred tax assets in Luxembourg of (1,166 ) following higher profitability of the current year and increase of the available deferred tax liabilities, recognition of deferred tax assets on current year taxable reversal of write-downs of the value of shares and receivables of consolidated subsidiaries in Luxembourg (735 ), and (1,055 ) net recognition and utilization of deferred tax assets on losses and temporary differences in the United States and other tax jurisdictions, following significant profits generated during the year.
Tax effects of foreign currency translation
The tax effects of foreign currency translation of (20 ), (34 )and nil at December 31, 2023, 2022 and 2021, respectively, refer mainly to deferred tax assets and liabilities of certain entities with a different functional currency than the currency applied for tax filing purposes.
Tax credits
The tax credits are mainly attributable to the Company’s operating subsidiaries in Brazil. They relate to credits claimed on foreign investments, credits for research and development and other credits.
Other taxes
Other taxes mainly include withholding taxes on dividends, services, royalties and interests as well as mining duties in Canada and Mexico, state tax , Corporate Alternative Minimum Tax ("CAMT") and Base Erosion and Anti-Abuse Tax ("BEAT") in the United States, and Cotisation sur la Valeur Ajoutée des Entreprises ("CVAE'') in France.
| Others | Year ended December 31, | ||||||||||||||||
| 2023 | 2022 | 2021 | |||||||||||||||
| Tax contingencies/settlements | ( | ||||||||||||||||
| Prior period taxes | ( | ( | |||||||||||||||
| Others | ( | ( | |||||||||||||||
| Total | |||||||||||||||||
Tax contingencies/settlements of 43 , (3 ), and 137 at December 31, 2023, 2022 and 2021, respectively, consist of uncertain tax positions (see note 10.3) mainly related to North America and ACIS.
362
| Consolidated financial statements | ||
| (millions of U.S. dollar, except share and per share data) | ||
10.2 Income tax recorded directly in equity and/or other comprehensive income
| Year ended December 31, | ||||||||||||||||||||
| 2023 | 2022 | 2021 | ||||||||||||||||||
| Recognized in other comprehensive income on: | ||||||||||||||||||||
| Deferred tax expense (benefit) | ||||||||||||||||||||
| Unrealized gain on investments in equity instruments at FVOCI | ||||||||||||||||||||
| Gain (loss) on derivative financial instruments | ( | ( | ||||||||||||||||||
| Recognized actuarial gain (loss) | ( | |||||||||||||||||||
| Foreign currency translation adjustments | ||||||||||||||||||||
| ( | ||||||||||||||||||||
| Recognized directly in equity on: | ||||||||||||||||||||
| Current tax expense (benefit) | ||||||||||||||||||||
| Realized gain on investments in equity instruments at FVOCI | ||||||||||||||||||||
| Deferred tax expense (benefit) | ||||||||||||||||||||
| Loss related to repurchase of MCNs | ( | ( | ||||||||||||||||||
| Realized gain on investments in equity instruments at FVOCI | ||||||||||||||||||||
| ( | ( | |||||||||||||||||||
| Total | ( | |||||||||||||||||||
10.3 Uncertain tax positions
10.4 Deferred tax assets and liabilities
The origin of the deferred tax assets and liabilities is as follows:
| Assets | Liabilities | Net | |||||||||||||||||||||||||||||||||
| 2023 | 2022 | 2023 | 2022 | 2023 | 2022 | ||||||||||||||||||||||||||||||
| Intangible assets | ( | ( | ( | ( | |||||||||||||||||||||||||||||||
| Property, plant and equipment | ( | ( | ( | ( | |||||||||||||||||||||||||||||||
| Inventories | ( | ( | |||||||||||||||||||||||||||||||||
| Financial instruments | ( | ( | ( | ||||||||||||||||||||||||||||||||
| Other assets | ( | ( | ( | ( | |||||||||||||||||||||||||||||||
| Provisions | ( | ( | |||||||||||||||||||||||||||||||||
| Other liabilities | ( | ( | |||||||||||||||||||||||||||||||||
| Tax losses and other tax benefits carried forward | |||||||||||||||||||||||||||||||||||
| Tax credits carried forward | |||||||||||||||||||||||||||||||||||
| Deferred tax assets (liabilities) | ( | ( | |||||||||||||||||||||||||||||||||
| Deferred tax assets | |||||||||||||||||||||||||||||||||||
| Deferred tax liabilities | ( | ( | |||||||||||||||||||||||||||||||||
363
| Consolidated financial statements | ||
| (millions of U.S. dollar, except share and per share data) | ||
Deferred tax assets recognized by the Company as of December 31, 2023 included the following:
| Gross amount | Total deferred tax assets | Recognized deferred tax assets | Unrecognized deferred tax assets | ||||||||||||||||||||
| Tax losses and other tax benefits carried forward | |||||||||||||||||||||||
| Tax credits carried forward | |||||||||||||||||||||||
| Other temporary differences | |||||||||||||||||||||||
| Total | |||||||||||||||||||||||
Deferred tax assets recognized by the Company as of December 31, 2022 included the following:
| Gross amount | Total deferred tax assets | Recognized deferred tax assets | Unrecognized deferred tax assets | ||||||||||||||||||||
| Tax losses and other tax benefits carried forward | |||||||||||||||||||||||
| Tax credits carried forward | |||||||||||||||||||||||
| Other temporary differences | |||||||||||||||||||||||
| Total | |||||||||||||||||||||||
As of December 31, 2023, the majority of unrecognized deferred tax assets relates to tax losses carried forward attributable to various subsidiaries located in different jurisdictions (primarily Brazil, France, Luxembourg, Spain and USA) with different statutory tax rates. At each reporting date, ArcelorMittal considers existing evidence, both positive and negative, including the earnings history and results of recent operations, reversals of deferred tax liabilities, projected future taxable income, and planning strategies, that could impact the view with regard to future realization of these deferred tax assets.
The amount of the total deferred tax assets is the aggregate amount of the various recognized and unrecognized deferred tax assets at the various subsidiaries and not the result of a computation with a given blended rate. The utilization of tax losses carried forward is restricted to the taxable income of the subsidiary or tax consolidation group to which it belongs. The utilization of tax losses carried forward may also be restricted by the character of the income, expiration dates and limitations on the yearly use of tax losses against taxable income.
At December 31, 2023, the total amount of accumulated tax losses in Luxembourg with respect to the ArcelorMittal S.A. tax integration amounted to 120.6 billion, of which 35.3 billion is considered realizable, resulting in the recognition of 8.8 billion of deferred tax assets at the applicable income tax rate in Luxembourg. At December 31, 2022, the total amount of accumulated tax losses in Luxembourg with respect to the main tax consolidation amounted to approximately 110.7 billion, of which 34 billion was considered realizable, resulting in the recognition of 8.5 billion of deferred tax assets at the applicable income tax rate in Luxembourg. Under the Luxembourg tax
legislation, tax losses generated before 2017 can be carried forward indefinitely and are not subject to any specific yearly loss utilization limitations. The tax losses carried forward relate primarily to tax deductible write-down charges taken on investments in shares of consolidated subsidiaries recorded by certain of ArcelorMittal’s holding companies in Luxembourg. Of the total tax losses carried forward, 61 billion may be subject to recapture in the future if the write-downs that caused them are reversed creating taxable income unless the Company crystallizes them through sales or other organizational restructuring activities.
The Company believes that it is probable that sufficient future taxable profits will be generated to support the recognized deferred tax asset for tax losses carried forward in Luxembourg. As part of its recoverability assessment the Company has taken into account (i) its most recent forecast approved by management and the Board of Directors, (ii) the likelihood that the factors that have contributed to past losses in Luxembourg will not recur, (iii) the fact that ArcelorMittal in Luxembourg is the main provider of funding to the Company’s consolidated subsidiaries, leading to significant amounts of taxable interest income on outstanding and future loans as updated based on most recent funding strategy, (iv) the expected level of interest expenses in Luxembourg driven by the Group net debt level, (v) the industrial franchise agreement whereby ArcelorMittal S.A. licenses its business model for manufacturing, processing and distributing steel to group subsidiaries, and (vi) other significant and reliable sources of operational income earned from ArcelorMittal’s European and worldwide operating subsidiaries for centralized distribution and procurement activities performed in Luxembourg. The Company has also considered the implications of the net-zero path and its carbon emissions
364
| Consolidated financial statements | ||
| (millions of U.S. dollar, except share and per share data) | ||
intensity reduction targets on its future taxable profits expectations in relation to the existing business models and the potential future financing of such projects, resulting in no major impact on the estimated level of future taxable profit. In performing the assessment, the Company estimates at which point in time its earnings projections are no longer reliable, and thus taxable profits are no longer probable. Accordingly, the Company has established consistent forecast periods for its different income streams for estimating probable future taxable profits, against which the unused tax losses can be utilized in Luxembourg.
At December 31, 2023, based upon the level of historical taxable income and projections for future taxable income over the periods in which the deductible temporary differences are anticipated to reverse, management believes it is probable that ArcelorMittal will realize the benefits of the recognized deferred tax assets of 9.5 billion. The amount of future taxable income required to be generated by ArcelorMittal’s subsidiaries to utilize the deferred tax assets of 9.5 billion is at least 41.5 billion. Historically, the Company has been able to generate sufficient taxable income and believes that it will generate sufficient levels of taxable income in the coming years to allow the Company to utilize tax benefits associated with tax losses carried forward and other deferred tax assets that have been recognized in its consolidated financial statements. Where the Company has had a history of recent losses, it relied on convincing other evidence such as the character of (historical) losses and planning opportunities to support the deferred tax assets recognized.
As of December 31, 2023, ArcelorMittal recorded 168 of deferred income tax liabilities in respect of deferred taxation that would arise if temporary differences on investments in subsidiaries, associates and interests in joint ventures were to be realized in the foreseeable future as compared to 146 as of December 31, 2022. No deferred tax liability has been recognized in respect of other temporary differences on investments in subsidiaries, associates and interests in joint ventures because the Company is able to control the timing of the reversal of the temporary difference and it is probable that such differences will not reverse in the foreseeable future. The amount of these unrecognized deferred tax liabilities is 870 at December 31, 2023 (795 at December 31, 2022).
10.5 Tax losses, tax credits and other tax benefits carried forward
At December 31, 2023, the Company had total estimated tax losses carried forward and other tax benefits of 139.1 billion.
This includes net operating losses and other tax benefits of 15.2 billion primarily related to subsidiaries in the Basque Country in Spain, Luxembourg and the United States, which expire as follows:
| Year expiring | Recognized | Unrecognized | Total | |||||||||||||||||
| 2024 | ||||||||||||||||||||
| 2025 | ||||||||||||||||||||
| 2026 | ||||||||||||||||||||
| 2027 | ||||||||||||||||||||
| 2028 | ||||||||||||||||||||
2029 - 2044 | ||||||||||||||||||||
| Total | ||||||||||||||||||||
The remaining tax losses carried forward and other tax benefits for an amount of 123.9 billion (of which 40.3 billion are recognized and 83.6 billion are unrecognized) are carried forward for unlimited period of time and primarily relate to the Company’s operations in Brazil, France, Luxembourg, Spain and in the United States.
At December 31, 2023, the Company also had total estimated tax credits carried forward of 690 .
Such amount includes tax credits of 499 (of which 129 recognized and 370 unrecognized) and primarily attributable to subsidiaries in the Basque country in Spain which expire as follows:
| Year expiring | Recognized | Unrecognized | Total | |||||||||||||||||
| 2024 | ||||||||||||||||||||
| 2025 | ||||||||||||||||||||
| 2026 | ||||||||||||||||||||
| 2027 | ||||||||||||||||||||
| 2028 | ||||||||||||||||||||
| 2028 - 2043 | ||||||||||||||||||||
| Total | ||||||||||||||||||||
The remaining tax credits for an amount of 191 of which 79 are recognized and 112 are unrecognized) are indefinite and primarily attributable to the Company’s operations in Brazil, Spain and the United States.
365
| Consolidated financial statements | ||
| (millions of U.S. dollar, except share and per share data) | ||
11.1 Share details
On May 14, 2020, the Company completed an offering of common shares, without nominal value for 750 at a price of $9.27 per share. The Significant Shareholder participated in the offerings by contributing an amount of 100 for the shares.
Following the offering of common shares described above with net proceeds of 740 (net of transaction costs of 10 ), on May 14, 2020, the Company issued 80,906,149 fully paid up shares. The Company allocated 29 to share capital, which increased from 364 at December 31, 2019 to 393 at December 31, 2020 and the remainder of 711 to additional paid-in-capital.
Under the terms of the offerings, there was a 180-day lock-up period for the Company on issuances or sales of shares and securities exchangeable for or convertible into shares, subject to customary exceptions.
Share capital
Following the approval by the extraordinary general meeting of shareholders on June 8, 2021 to cancel all the shares repurchased by the Company under its share buyback programs up to a maximum of 165 million shares, the Company decreased issued share capital on August 4, 2021 and September 22, 2021 through the cancellation of 70 million and
On January 14, 2022 and May 18, 2022, ArcelorMittal cancelled 45 million and 60 million treasury shares, respectively, to keep the number of treasury shares within appropriate levels. These cancellations took into account the shares already purchased under the 1,000 share buyback programs announced on November 17, 2021, which were completed on December 28, 2021 and on May 5, 2022, respectively. Following these cancellations, the aggregate number of shares issued and fully paid up and share capital decreased from 982,809,772 and 350 as of December 31, 2021 to 877,809,772 and 312 as of December 31, 2022, respectively.
On April 28, 2023, ArcelorMittal cancelled 25 million treasury shares to keep the number of treasury shares within appropriate levels. This cancellation took into account the shares already purchased under the 60,431,380 share buyback program (see below). Following this cancellation, the aggregate number of shares issued and fully paid up and share capital decreased from 877,809,772 and 312 as of December 31, 2022 to 852,809,772 and 303 as of December 31, 2023, respectively.
The Company’s shares consist of the following:
| December 31, 2021 | Movement in year | December 31, 2022 | Movement in year | December 31, 2023 | |||||||||||||||||||||||||
| Issued shares | ( | ( | |||||||||||||||||||||||||||
| Treasury shares | ( | ( | ( | ( | |||||||||||||||||||||||||
| Total outstanding shares | ( | ||||||||||||||||||||||||||||
The number of issued shares was 982,809,772 at December 31, 2021, 877,809,772 at December 31, 2022 and 852,809,772 at December 31, 2023.
Authorized shares
On August 4, 2021, following the cancellation of 70 million treasury shares, the authorized share capital decreased from 485 represented by 1,361,418,599 ordinary shares without nominal value to 460 represented by 1,291,418,599 ordinary shares without nominal value. On September 22, 2021, following the cancellation of 50 million treasury shares, the authorized share capital decreased further to 442 represented by 1,241,418,599 ordinary shares without nominal value.
Following the cancellations of treasury shares on January 14, 2022 and May 18, 2022, authorized share capital decreased from 442 represented by 1,241,418,599 ordinary shares without nominal value as of December 31, 2021 to 404 represented by 1,136,418,599 ordinary shares without nominal value as of December 31, 2022.
Following the cancellation of treasury shares on April 28, 2023, authorized share capital decreased from 404 represented by 1,136,418,599 ordinary shares without nominal value as of December 31, 2022 to 395 represented by 1,111,418,599 ordinary shares without nominal value as of December 31, 2023.
Share buyback
On March 3, 2021, ArcelorMittal completed its first share buyback program in 2021 and repurchased 27.1 million shares for a total amount of €537 million (650 ) at an average price per share of €19.79 ($23.97 ).
On June 17, 2021, ArcelorMittal completed a second share buyback program and repurchased 17.8 million shares for a total amount of €469 million (570 ) at an average price per share of €26.27 ($31.94 ).
366
| Consolidated financial statements | ||
| (millions of U.S. dollar, except share and per share data) | ||
On July 5, 2021, ArcelorMittal completed a third share buyback program and repurchased 24.5 million shares for a total amount of €630 million (750 ) at an average price per share of €25.77 ($30.66 ).
On November 16, 2021, ArcelorMittal completed a fourth share buyback program and repurchased 67.4 million shares for a total value of €1,881 million (2,200 ) at an average price per share of €27.91 ($32.64 ).
On December 28, 2021, the Company completed a fifth share buyback program and repurchased 34.1 million shares for a total value of €886 million (1,000 ) at an average price per share of €25.99 ($29.34 ).
During 2021, the Company repurchased 62.2 million shares from the Significant Shareholder under its five share buyback programs to maintain Significant Shareholder's current level of voting rights (pursuant to the Share Repurchase Agreement signed on February 12, 2021) for €1,600 million (1,878 ).
On April 25, 2022, ArcelorMittal completed its 1,000 share buyback program announced on February 11, 2022 under the authorization given by the annual general meeting of shareholders of June 8, 2021 and repurchased 31.8 million shares for a total value of €911 million (equivalent to 1,000 ) at an approximate average price per share of €28.68 ($31.49 ).
On June 8, 2022, ArcelorMittal completed a second share buyback program in the amount of 1,000 under the authorization given by the annual general meeting of shareholders of May 4, 2022, bringing the total 2022 buybacks announced so far to 2,000 . ArcelorMittal repurchased 33.3 million shares for a total value of €943 million (equivalent to 1,000 ) at an approximate average price per share of €28.26 ($29.99 ).
On July 29, 2022, the Company announced a third share buyback program of 60.4 million shares (approximately 1.4 billion based on share price as of July 26, 2022) to be completed by the end of May 2023 (subject to market conditions) under the authorization given by the annual general meeting of shareholders of May 4, 2022. The Significant Shareholder has decided not to participate in the program consistent with the position announced on February 25, 2022. On March 31, 2023, ArcelorMittal completed the share buyback program. The total repurchase value was €1,456 million (1,492 ) at an approximate average price per share of €24.10 ($24.68 ).
On May 5, 2023, ArcelorMittal announced the commencement of a new buyback program of up to 85 million shares under the authorization given by the annual general meeting of shareholders of May 2, 2023, to be completed by May 2025. The actual amount of shares that will be repurchased pursuant to this new program will depend on the level of post-dividend free cash flow ("FCF") (calculated as net cash provided by
operating activities less purchases of property, plant and equipment and intangibles less dividends paid to non-controlling shareholders) generated over the period (the Company’s defined policy is to return a minimum of 50 % of post-dividend annual FCF), the continued authorization by shareholders, and market conditions. At market closure on December 31, 2023, ArcelorMittal had repurchased 26.2 million shares for a total value of €601 million (652 ) at an average price per share of €22.88 ($24.85 ).
The shares acquired under the different programs are intended to meet ArcelorMittal’s obligations under debt obligations exchangeable into equity securities; to reduce ArcelorMittal’s share capital, and/or to meet ArcelorMittal’s obligations arising from employee share programs.
Treasury shares
ArcelorMittal held, indirectly and directly, 33.5 million and 72.5 million treasury shares as of December 31, 2023 and December 31, 2022, respectively.
11.2 Equity instruments and hybrid instruments
Mandatory convertible bonds
On December 28, 2009, the Company issued through Hera Ermac, a wholly-owned subsidiary, 750 unsecured and unsubordinated bonds mandatorily convertible into preferred shares of such subsidiary. The bonds were placed privately with a Luxembourg affiliate of Crédit Agricole (formerly Calyon) and are not listed. The Company has the option to call the mandatory convertible bonds until 10 business days before the maturity date. Hera Ermac invested the proceeds of the bonds issuance and an equity contribution by the Company in notes issued by subsidiaries of the Company linked to the values of shares of Erdemir and China Oriental. On April 20, 2011, the Company signed an agreement for an extension of the conversion date of the mandatory convertible bonds to January 31, 2013. On September 27, 2011, the Company increased the mandatory convertible bonds from 750 to 1,000 . The Company has extended the conversion date for the mandatory convertible bonds from time to time.
On March 29, 2019 and December 18, 2019, the Company repaid notes issued by subsidiaries which were linked to the value of the shares of Erdemir. As of December 31, 2020, the remaining notes were linked to the value of the shares of China Oriental (see note 6.1.5).
On December 22, 2020, the maturity of the mandatory convertible bonds was extended from January 29, 2021 to January 31, 2024. The other main features of the mandatory convertible bonds remained unchanged.
On March 14, 2023, the Company, through its wholly-owned subsidiary Hera Ermac, early repaid 226,666 out of the 666,666
367
| Consolidated financial statements | ||
| (millions of U.S. dollar, except share and per share data) | ||
outstanding unsecured and unsubordinated bonds mandatorily convertible into preferred shares of such subsidiary ("MCBs") for a total cash consideration of 340 . The bonds were placed privately with a Luxembourg affiliate of Crédit Agricole. The Company determined that the MCBs are a hybrid instrument including an equity component recognized as non-controlling interests and a liability component. Following the early partial repayment, the Company allocated the cash consideration to the liability component (25 ) and equity component (315 ) of the instrument, which resulted in 291 decrease in non-controlling interests and 24 decrease in retained earnings consistent with the original allocation using the net present value of the future interest payments at the date of early redemption.
On December 21, 2023, the Company signed an agreement for an extension of the conversion date of the mandatory convertible bonds to January 30, 2026. The other main features of the mandatory convertible bonds remained unchanged. The Company determined that this transaction led to the extinguishment of the existing compound instrument and the recognition of a new compound instrument including non-controlling interests for 547 and other liabilities for 113 . The derecognition of the previous instrument and the recognition at fair value of the new instrument resulted in 66 expense included in financing costs-net in the consolidated statement of operations and 32 decrease in non-controlling interests.
Mandatorily convertible subordinated notes
On May 18, 2020, the Company completed an offering of mandatorily convertible subordinated notes (“MCNs”) for 1,250 . The MCNs had a three-year maturity, were issued at 100 % of the principal amount and were mandatorily converted into common shares of the Company upon maturity unless converted earlier at the option of the holders or ArcelorMittal during the conversion period or upon occurrence of certain defined events.
The Significant Shareholder participated in the offerings by contributing an amount of 100 for the MCNs.
The Company determined that the MCNs were a hybrid instrument including an equity component and a debt component.
On December 23, 2021, ArcelorMittal completed separate, privately negotiated agreements with a limited number of holders of MCNs to repurchase 395 in aggregate principal amount of MCNs at the minimum conversion ratio for an aggregate cash consideration of 1,196 . The Company allocated the cash consideration to the debt (30 ) and equity (331 ) components of the instrument and recognized in financing costs - net a 61 loss relating to the liability component and a 774 (589 net of tax) decrease in retained earnings relating to the equity component consistent with the original allocation using net present value of the future interest payments at the date of exchange.
On May 19, 2023, upon mandatory conversion of the 24,290,025 outstanding mandatorily convertible subordinated notes ("MCNs") due May 18, 2023, ArcelorMittal delivered a total of 57,057,991 treasury shares (of which 9,396,120 to the Significant Shareholder) with a carrying amount of 1,534 . The Company determined that the MCNs are a hybrid instrument including an equity component and a debt component. Following the mandatory conversion, it derecognized the 509 equity component presented separately in the statements of changes in equity and recognized a 1,025 (794 net of tax) decrease in additional paid-in capital.
11.3 Earnings per common share
The following table provides the numerators and a reconciliation of the denominators used in calculating basic and diluted earnings per common share for the years ended December 31, 2023, 2022 and 2021.
| Year ended December 31, | |||||||||||||||||
| 2023 | 2022 | 2021 | |||||||||||||||
Net income attributable to equity holders of the parent | |||||||||||||||||
| Weighted average common shares outstanding (in millions) for the purposes of basic earnings per share | |||||||||||||||||
| Incremental shares from assumed conversion of restricted share units and performance share units (in millions) | |||||||||||||||||
| Weighted average common shares outstanding (in millions) for the purposes of diluted earnings per share | |||||||||||||||||
11.4 Dividends
Calculations to determine the amounts available for dividends are based on ArcelorMittal’s financial statements (“ArcelorMittal
S.A.”) which are prepared in accordance with IFRS, as endorsed by the European Union. ArcelorMittal S.A. has no significant manufacturing operations of its own and generates its
368
| Consolidated financial statements | ||
| (millions of U.S. dollar, except share and per share data) | ||
profit mostly from financing activities and the management fees/industrial franchise agreements with Group companies. Accordingly, it can only pay dividends or distributions to the extent it is entitled to receive cash dividend distributions from its
subsidiaries’ recognized gains, profit generated by its own activities, from the sale of its assets or share premiums from the issuance of common shares. Dividends are declared in U.S. dollar and are payable in either U.S. dollar or in euros.
| Description | Approved by | Dividend per share (in $) | Payout date | Total (in millions of $) | |||||||||||||||||||
| Dividend for financial year 2020 | Annual general shareholders’ meeting on June 8, 2021 | June 15, 2021 | |||||||||||||||||||||
| Dividend for financial year 2021 | Annual general shareholders’ meeting on May 4, 2022 | June 10, 2022 | |||||||||||||||||||||
| Dividend for financial year 2022 | Annual general shareholders’ meeting on May 2, 2023 | June 15, 2023 and December 7, 2023 | |||||||||||||||||||||
On May 2, 2023 at the annual general meeting of shareholders, the shareholders approved the Company’s dividend of $0.44 per share. The dividend amounted to 369 and payment includes two installments; the first installment of 185 was paid on June 15, 2023 and the second one of 184 was settled on December 7, 2023.
In February 2024, the Board of Directors recommended the base annual dividend of $0.50 per share, to be paid in two equal installments in June and December 2024, subject to the approval of shareholders at the annual general meeting of shareholders in April 2024.
11.5.1 Non-wholly owned subsidiaries that have material non-controlling interests
The tables below provide a list of the subsidiaries which include significant non-controlling interests at December 31, 2023 and 2022 and for the years ended December 31, 2023, 2022 and 2021.
369
| Consolidated financial statements | ||
| (millions of U.S. dollar, except share and per share data) | ||
| Name of Subsidiary | Country of incorporation and operation | % of non-controlling interests and non- controlling voting rights at December 31, 2023 | % of non-controlling interests and non- controlling voting rights at December 31, 2022 | Net income (loss) attributable to non- controlling interests for the year ended December 31, 2023 | Non-controlling interests at December 31, 2023 | Net income (loss) attributable to non- controlling interests for the year ended December 31, 2022 | Non-controlling interests at December 31, 2022 | Net income (loss) attributable to non- controlling interests for the year ended December 31, 2021 | ||||||||||||||||||||||||||||||||||||||||||
| AMSA | South Africa | % | % | ( | ||||||||||||||||||||||||||||||||||||||||||||||
Société Nationale de Sidérurgie S.A. ("Sonasid")1 | Morocco | % | % | |||||||||||||||||||||||||||||||||||||||||||||||
AMKR | Ukraine | % | % | ( | ( | |||||||||||||||||||||||||||||||||||||||||||||
| Belgo Bekaert Arames ("BBA") | Brazil | % | % | |||||||||||||||||||||||||||||||||||||||||||||||
Hera Ermac2 | Luxembourg | |||||||||||||||||||||||||||||||||||||||||||||||||
| AMMC | Canada | % | % | |||||||||||||||||||||||||||||||||||||||||||||||
| Arceo | Belgium | % | % | |||||||||||||||||||||||||||||||||||||||||||||||
ArcelorMittal Liberia Ltd3 | Liberia | % | % | ( | ( | ( | ||||||||||||||||||||||||||||||||||||||||||||
ArcelorMittal Texas HBI4 | USA | % | % | ( | ( | |||||||||||||||||||||||||||||||||||||||||||||
| Other | ( | |||||||||||||||||||||||||||||||||||||||||||||||||
| Total | ||||||||||||||||||||||||||||||||||||||||||||||||||
1.Sonasid - ArcelorMittal holds a controlling stake of 50 % in Nouvelles Sidérurgies Industrielles ("NSI"). ArcelorMittal controls NSI on the basis of a shareholders’ agreement which includes deadlock arrangements in favor of the Company. NSI holds a 64.86 % stake in Sonasid. The total non-controlling interests in Sonasid of 67.57 % are the result of ArcelorMittal’s indirect ownership percentage in Sonasid of 32.43 % through its controlling stake in NSI.
2.Hera Ermac - The non-controlling interests correspond to the equity component net of transaction fees of the mandatory convertible bonds maturing on January 30, 2026 (see note 11.2).
3.ArcelorMittal Liberia Ltd is incorporated in Cyprus. On December 21, 2023 and December 20, 2022, ArcelorMittal fully settled 100 and 300 capital increases, respectively, in ArcelorMittal Liberia Ltd including 15 and 45 , respectively, on behalf of non-controlling interests.
4.On June 30, 2022, ArcelorMittal acquired a 80 % controlling stake in ArcelorMittal Texas HBI (see note 2.2.4).
The tables below provide summarized statements of financial position for the above-mentioned subsidiaries as of December 31, 2023 and 2022 and summarized statements of operations and summarized statements of cash flows for the years ended December 31, 2023, 2022 and 2021.
| December 31, 2023 | |||||||||||||||||||||||||||||||||||||||||||||||||||||
| Summarized statements of financial position | AMSA | Sonasid | AMKR | BBA | Hera Ermac | AMMC | Arceo | AM Liberia | ArcelorMittal Texas HBI LLC | ||||||||||||||||||||||||||||||||||||||||||||
| Current assets | |||||||||||||||||||||||||||||||||||||||||||||||||||||
| Non-current assets | |||||||||||||||||||||||||||||||||||||||||||||||||||||
| Total assets | |||||||||||||||||||||||||||||||||||||||||||||||||||||
| Current liabilities | |||||||||||||||||||||||||||||||||||||||||||||||||||||
| Non-current liabilities | |||||||||||||||||||||||||||||||||||||||||||||||||||||
| Net assets | ( | ||||||||||||||||||||||||||||||||||||||||||||||||||||
| December 31, 2023 | |||||||||||||||||||||||||||||||||||||||||||||||||||||
| Summarized statements of operations | AMSA | Sonasid | AMKR | BBA | Hera Ermac | AMMC | Arceo | AM Liberia | ArcelorMittal Texas HBI LLC | ||||||||||||||||||||||||||||||||||||||||||||
| Revenue | |||||||||||||||||||||||||||||||||||||||||||||||||||||
Net (loss) income | ( | ( | ( | ( | ( | ||||||||||||||||||||||||||||||||||||||||||||||||
| Total comprehensive income (loss) | ( | ( | ( | ( | ( | ||||||||||||||||||||||||||||||||||||||||||||||||
370
| Consolidated financial statements | ||
| (millions of U.S. dollar, except share and per share data) | ||
| December 31, 2023 | |||||||||||||||||||||||||||||||||||||||||||||||||||||
| Summarized statements of cash flows | AMSA | Sonasid | AMKR | BBA | Hera Ermac | AMMC | Arceo | AM Liberia | ArcelorMittal Texas HBI LLC | ||||||||||||||||||||||||||||||||||||||||||||
| Net cash provided by / (used in) operating activities | |||||||||||||||||||||||||||||||||||||||||||||||||||||
| Net cash provided by / (used in) investing activities | ( | ( | ( | ( | ( | ( | ( | ( | |||||||||||||||||||||||||||||||||||||||||||||
| Net cash provided by / (used in) financing activities | ( | ( | ( | ( | ( | ( | |||||||||||||||||||||||||||||||||||||||||||||||
| Impact of currency movements on cash | ( | ( | |||||||||||||||||||||||||||||||||||||||||||||||||||
| Cash and cash equivalents: | |||||||||||||||||||||||||||||||||||||||||||||||||||||
| At the beginning of the year / at acquisition date | |||||||||||||||||||||||||||||||||||||||||||||||||||||
| At the end of the year | |||||||||||||||||||||||||||||||||||||||||||||||||||||
| Dividend to non-controlling interests | ( | ( | ( | ( | ( | ||||||||||||||||||||||||||||||||||||||||||||||||
| December 31, 2022 | ||||||||||||||||||||||||||||||||||||||||||||||||||
| Summarized statements of financial position | AMSA | Sonasid | AMKR | BBA | Hera Ermac | AMMC | Arceo | AM Liberia | ArcelorMittal Texas HBI LLC | |||||||||||||||||||||||||||||||||||||||||
| Current assets | ||||||||||||||||||||||||||||||||||||||||||||||||||
| Non-current assets | ||||||||||||||||||||||||||||||||||||||||||||||||||
| Total assets | ||||||||||||||||||||||||||||||||||||||||||||||||||
| Current liabilities | ||||||||||||||||||||||||||||||||||||||||||||||||||
| Non-current liabilities | ||||||||||||||||||||||||||||||||||||||||||||||||||
| Net assets | ( | |||||||||||||||||||||||||||||||||||||||||||||||||
| December 31, 2022 | ||||||||||||||||||||||||||||||||||||||||||||||||||
| Summarized statements of operations | AMSA | Sonasid | AMKR | BBA | Hera Ermac | AMMC | Arceo | AM Liberia | ArcelorMittal Texas HBI LLC | |||||||||||||||||||||||||||||||||||||||||
| Revenue | ||||||||||||||||||||||||||||||||||||||||||||||||||
| Net income (loss) | ( | ( | ( | |||||||||||||||||||||||||||||||||||||||||||||||
| Total comprehensive income (loss) | ( | ( | ( | |||||||||||||||||||||||||||||||||||||||||||||||
371
| Consolidated financial statements | ||
| (millions of U.S. dollar, except share and per share data) | ||
| December 31, 2022 | ||||||||||||||||||||||||||||||||||||||||||||||||||
| Summarized statements of cash flows | AMSA | Sonasid | AMKR | BBA | Hera Ermac | AMMC | Arceo | AM Liberia | ArcelorMittal Texas HBI LLC | |||||||||||||||||||||||||||||||||||||||||
| Net cash provided by / (used in) operating activities | ||||||||||||||||||||||||||||||||||||||||||||||||||
| Net cash provided by / (used in) investing activities | ( | ( | ( | ( | ( | ( | ( | |||||||||||||||||||||||||||||||||||||||||||
| Net cash provided by / (used in) financing activities | ( | ( | ( | ( | ( | ( | ||||||||||||||||||||||||||||||||||||||||||||
| Impact of currency movements on cash | ( | ( | ( | ( | ||||||||||||||||||||||||||||||||||||||||||||||
| Cash and cash equivalents: | ||||||||||||||||||||||||||||||||||||||||||||||||||
| At the beginning of the year | ||||||||||||||||||||||||||||||||||||||||||||||||||
| At the end of the year | ||||||||||||||||||||||||||||||||||||||||||||||||||
| Dividend to non-controlling interests | ( | ( | ( | ( | ||||||||||||||||||||||||||||||||||||||||||||||
| December 31, 2021 | |||||||||||||||||||||||||||||||||||||||||||||||
| Summarized statements of operations | AMSA | Sonasid | AMKR | BBA | Hera Ermac | AMMC | Arceo | AM Liberia | |||||||||||||||||||||||||||||||||||||||
| Revenue | |||||||||||||||||||||||||||||||||||||||||||||||
| Net income (loss) | ( | ||||||||||||||||||||||||||||||||||||||||||||||
| Total comprehensive income (loss) | ( | ||||||||||||||||||||||||||||||||||||||||||||||
| December 31, 2021 | |||||||||||||||||||||||||||||||||||||||||||||||
| Summarized statements of cash flows | AMSA | Sonasid | AMKR | BBA | Hera Ermac | AMMC | Arceo | AM Liberia | |||||||||||||||||||||||||||||||||||||||
| Net cash provided by / (used in) operating activities | |||||||||||||||||||||||||||||||||||||||||||||||
| Net cash provided by / (used in) investing activities | ( | ( | ( | ( | ( | ( | |||||||||||||||||||||||||||||||||||||||||
| Net cash provided by / (used in) financing activities | ( | ( | ( | ( | ( | ( | ( | ( | |||||||||||||||||||||||||||||||||||||||
| Impact of currency movements on cash | ( | ( | ( | ( | |||||||||||||||||||||||||||||||||||||||||||
| Cash and cash equivalents: | |||||||||||||||||||||||||||||||||||||||||||||||
| At the beginning of the year | |||||||||||||||||||||||||||||||||||||||||||||||
| At the end of the year | |||||||||||||||||||||||||||||||||||||||||||||||
| Dividend to non-controlling interests | ( | ( | ( | ( | ( | ||||||||||||||||||||||||||||||||||||||||||
11.5.2 Transactions with non-controlling interests
Transactions with non-controlling interests also include the mandatory convertible bonds (see note 11.2).
Put option liabilities
On March 30, 2022 Votorantim S.A. exercised the put option right it has under its shareholders’ agreement with the Company with respect to its 2.9 % preferred share interest in ArcelorMittal Brasil following the acquisition of Votorantim S.A.'s long steel business in Brazil in 2018, which was subsequently renamed ArcelorMittal Sul Fluminense ("AMSF"). The exercise price of the put option is calculated pursuant to an agreed formula in the shareholders’ agreement which applies a 6 times multiple of ArcelorMittal Brasil Longs Business EBITDA in the four immediately preceding calendar quarters from the date of the put option exercise (subject to certain adjustments, such as the exclusion of any unusual, infrequent or abnormal events) less an assumed net debt of BRL 6.2 billion times 15 %. The
372
| Consolidated financial statements | ||
| (millions of U.S. dollar, except share and per share data) | ||
Company determined that it has a present ownership interest in the preferred shares subject to the put option. Accordingly, it recognized at acquisition date of AMSF a 328 financial liability at amortized cost and measured at the present value of the redemption amount. As of December 31, 2022, the Company calculated the put option exercise price in the amount of BRL 1.0 billion (179 see note 4.8). Votorantim S.A. has indicated that it does not agree with ArcelorMittal Brasil’s calculation of the exercise price and filed a request for arbitration on September 28, 2022. The definition of the final put option exercise price will be subject to the arbitration procedure, whose estimated timing for resolution is currently unknown. In January 2023, ArcelorMittal Brasil settled the undisputed amount it accepts as the value of the put option for 179 (see note 9.3).
On June 3, 2021, following an amendment to the shareholders' agreement signed between the Company and non-controlling interests in NSI, an entity in which ArcelorMittal holds a 50 % controlling stake and which holds a 64.86 % interest in Sonasid in Morocco, the Company granted to such non-controlling interests a put option to buy the totality of their shares in NSI exercisable by its holders during three periods between December 5, 2022 to December 4, 2024, December 5, 2027 to December 4, 2029 and December 5, 2032 to December 4, 2034. The carrying amount of the financial liability at amortized cost was 116 and 122 as of December 31, 2023 and 2022, respectively, and is measured at the present value of the redemption amount (see note 9.2).
In conjunction with the acquisition of an 80 % interest in ArcelorMittal Texas HBI on June 30, 2022, ArcelorMittal granted to voestalpine a put option exercisable at the end of the fifth, tenth and fifteenth year subsequently to the acquisition date. The Company recognized at inception a 177 (158 as of December 31, 2023) financial liability at amortized cost measured at the present value of the redemption amount of the written put option based on the lower of equity value increased by an annual contractual return and fair value (see notes 2.2.4 and 9.2).
NOTE 12: RELATED PARTIES
The related parties of the Group are predominately subsidiaries, joint operations, joint ventures, associates and key management personnel (see note 8.1) of the Group. Transactions between the parent company, its subsidiaries and joint operations are eliminated on consolidation and are not disclosed in this note. Related parties include the Significant Shareholder, which is a trust of which Mr. Lakshmi N. Mittal, Mrs. Usha Mittal and their children are the beneficiaries and which owns, together with shares owned directly by Mr. and Mrs. Mittal, 39.87 % of ArcelorMittal’s issued ordinary shares.
Transactions with related parties of the Company mainly relate to sales and purchases of raw materials and steel products and were as follows:
12.1 Sales and trade receivables
| Year ended December 31, | December 31, | ||||||||||||||||||||||||||||||||||
| Sales | Trade receivables | ||||||||||||||||||||||||||||||||||
| Related parties and their subsidiaries where applicable | Category | 2023 | 2022 | 2021 | 2023 | 2022 | |||||||||||||||||||||||||||||
| Calvert | Joint Venture | ||||||||||||||||||||||||||||||||||
Gonvarri Steel Industries 1 | Associate | ||||||||||||||||||||||||||||||||||
| Aperam | Other | ||||||||||||||||||||||||||||||||||
| Borçelik | Joint Venture | ||||||||||||||||||||||||||||||||||
| Bamesa | Associate | ||||||||||||||||||||||||||||||||||
| Tuper | Joint Venture | ||||||||||||||||||||||||||||||||||
| ArcelorMittal CLN Distribuzione Italia | Joint Venture | ||||||||||||||||||||||||||||||||||
| Tameh | Joint Venture | ||||||||||||||||||||||||||||||||||
| Coils Lamiere Nastri (C.L.N.) | Associate | ||||||||||||||||||||||||||||||||||
WDI 2 | Associate | ||||||||||||||||||||||||||||||||||
AMNS India | Joint Venture | ||||||||||||||||||||||||||||||||||
| ArcelorMittal RZK Çelik Servis Merkezi | Joint Venture | ||||||||||||||||||||||||||||||||||
Other 3 | |||||||||||||||||||||||||||||||||||
| Total | |||||||||||||||||||||||||||||||||||
1.Gonvarri Steel Industries include mainly the joint ventures ArcelorMittal Gonvarri Brasil Productos Siderúrgicos and ArcelorMittal Gonvarri SSC Slovakia.
2.WDI includes Westfälische Drahtindustrie Verwaltungsgesellschaft mbH & Co. KG and Westfälische Drahtindustrie GmbH.
373
| Consolidated financial statements | ||
| (millions of U.S. dollar, except share and per share data) | ||
3.Other includes Acciaierie d'Italia. On April 14, 2021, ArcelorMittal completed an investment agreement with Invitalia, an Italian state-owned company, forming the joint venture Acciaierie d’Italia (see note 2.3). On September 30, 2021, the raw material supply agreement between Acciaierie d’Italia and the Company expired without renewal.
12.2 Purchases and trade payables
| Year ended December 31, | December 31, | ||||||||||||||||||||||||||||||||||
| Purchases | Trade payables | ||||||||||||||||||||||||||||||||||
| Related parties and their subsidiaries where applicable | Category | 2023 | 2022 | 2021 | 2023 | 2022 | |||||||||||||||||||||||||||||
| Tameh | Joint Venture | ||||||||||||||||||||||||||||||||||
| Global Chartering | Joint Venture | ||||||||||||||||||||||||||||||||||
| Integrated Metal Recycling | Joint Venture | ||||||||||||||||||||||||||||||||||
| AMNS India | Joint Venture | ||||||||||||||||||||||||||||||||||
| Aperam | Other | ||||||||||||||||||||||||||||||||||
| Exeltium | Associate | ||||||||||||||||||||||||||||||||||
| Alkat | Associate | ||||||||||||||||||||||||||||||||||
| Baycoat | Joint Venture | ||||||||||||||||||||||||||||||||||
| Enerfos | Joint Venture | ||||||||||||||||||||||||||||||||||
| Sitrel | Joint Venture | ||||||||||||||||||||||||||||||||||
| CFL Cargo | Associate | ||||||||||||||||||||||||||||||||||
| Other | |||||||||||||||||||||||||||||||||||
| Total | |||||||||||||||||||||||||||||||||||
12.3 Other transactions with related parties
As of December 3, 2014, ArcelorMittal Calvert LLC signed a member capital expenditure loan agreement with the joint venture Calvert and as of December 31, 2023 and 2022, the loans amounted to 230 and 212 , respectively, including accrued interest. The loans bear interest from 2.27 % to 6.93 % and have various maturity dates ranging from less than 1 to 25 years.
374