UNITED STATES SECURITIES AND EXCHANGE COMMISSION
Washington, D.C. 20549
_________________________
FORM 10-Q
For the quarterly period ended March 31, 2024
For the transition period from to
Commission file number: 001-37700
(Exact Name of Registrant as Specified in its Charter)
(State or Other Jurisdiction of Incorporation or Organization) | (I.R.S. Employer Identification No.) | |||||||||||||
(Address of Principal Executive Offices) | (Zip Code) | |||||||||||||
(Registrant’s Telephone Number, Including Area Code) | ||||||||||||||
N/A (Former Name, Former Address and Former Fiscal Year, if Changed Since Last Report) | ||||||||||||||
| Securities registered pursuant to Section 12(b) of the Act: | ||||||||
| Title of each class | Trading Symbol(s) | Name of each exchange on which registered | ||||||
Indicate by check mark whether the registrant (1) has filed all reports required to be filed by Section 13 or 15(d) of the Securities Exchange Act of 1934 during the preceding 12 months (or for such shorter period that the registrant was required to file such reports), and (2) has been subject to such filing requirements for the past 90 days. Yes ☒ No ☐
Indicate by check mark whether the registrant has submitted electronically every Interactive Data File required to be submitted pursuant to Rule 405 of Regulation S-T (§232.405 of this chapter) during the preceding 12 months (or for such shorter period that the registrant was required to submit such files). Yes ☒ No ☐
Indicate by check mark whether the registrant is a large accelerated filer, an accelerated filer, a non-accelerated filer, a smaller reporting company, or an emerging growth company. See the definitions of “large accelerated filer,” “accelerated filer,” “smaller reporting company,” and “emerging growth company” in Rule 12b-2 of the Exchange Act.
| ☒ | Accelerated filer | ☐ | |||||||||
| Non-accelerated filer | ☐ | Smaller reporting company | |||||||||
| Emerging growth company | |||||||||||
If an emerging growth company, indicate by check mark if the registrant has elected not to use the extended transition period for complying with any new or revised financial accounting standards provided pursuant to Section 13(a) of the Exchange Act. ☐
Indicate by check mark whether the registrant is a shell company (as defined in Rule 12b-2 of the Exchange Act). Yes ☐ No ☒
As of April 30, 2024 there were 14,933,474 shares of $0.01 par value common stock outstanding.
Nicolet Bankshares, Inc.
Quarterly Report on Form 10-Q
March 31, 2024
TABLE OF CONTENTS
| PAGE | |||||||||||
2
PART I – FINANCIAL INFORMATION
Item 1. FINANCIAL STATEMENTS:
NICOLET BANKSHARES, INC.
Consolidated Balance Sheets
(In thousands, except share and per share data)
| March 31, 2024 | December 31, 2023 | ||||||||||
| (Unaudited) | (Audited) | ||||||||||
| Assets | |||||||||||
| Cash and due from banks | $ | $ | |||||||||
| Interest-earning deposits | |||||||||||
Cash and cash equivalents | |||||||||||
| Certificates of deposit in other banks | |||||||||||
| Securities available for sale (“AFS”), at fair value | |||||||||||
| Other investments | |||||||||||
| Loans held for sale | |||||||||||
| Loans | |||||||||||
| Allowance for credit losses - loans (“ACL-Loans”) | ( | ( | |||||||||
Loans, net | |||||||||||
| Premises and equipment, net | |||||||||||
| Bank owned life insurance (“BOLI”) | |||||||||||
| Goodwill and other intangibles, net | |||||||||||
| Accrued interest receivable and other assets | |||||||||||
Total assets | $ | $ | |||||||||
| Liabilities and Stockholders’ Equity | |||||||||||
| Liabilities: | |||||||||||
| Noninterest-bearing demand deposits | $ | $ | |||||||||
| Interest-bearing deposits | |||||||||||
Total deposits | |||||||||||
| Short-term borrowings | |||||||||||
| Long-term borrowings | |||||||||||
| Accrued interest payable and other liabilities | |||||||||||
Total liabilities | |||||||||||
| Stockholders’ Equity: | |||||||||||
| Common stock | |||||||||||
| Additional paid-in capital | |||||||||||
| Retained earnings | |||||||||||
| Accumulated other comprehensive income (loss) | ( | ( | |||||||||
| Total stockholders’ equity | |||||||||||
| Total liabilities and stockholders’ equity | $ | $ | |||||||||
Preferred shares authorized ( | |||||||||||
| Preferred shares issued and outstanding | |||||||||||
Common shares authorized (par value $ | |||||||||||
| Common shares outstanding | |||||||||||
| Common shares issued | |||||||||||
See accompanying notes to unaudited consolidated financial statements.
3
ITEM 1. Financial Statements Continued:
NICOLET BANKSHARES, INC.
Consolidated Statements of Income (Loss)
(In thousands, except share and per share data) (Unaudited)
| Three Months Ended March 31, | |||||||||||
| 2024 | 2023 | ||||||||||
| Interest income: | |||||||||||
| Loans, including loan fees | $ | $ | |||||||||
| Investment securities: | |||||||||||
Taxable | |||||||||||
Tax-exempt | |||||||||||
| Other interest income | |||||||||||
Total interest income | |||||||||||
| Interest expense: | |||||||||||
| Deposits | |||||||||||
| Short-term borrowings | |||||||||||
| Long-term borrowings | |||||||||||
Total interest expense | |||||||||||
Net interest income | |||||||||||
| Provision for credit losses | |||||||||||
| Net interest income after provision for credit losses | |||||||||||
| Noninterest income: | |||||||||||
| Wealth management fee income | |||||||||||
| Mortgage income, net | |||||||||||
| Service charges on deposit accounts | |||||||||||
| Card interchange income | |||||||||||
| BOLI income | |||||||||||
| Deferred compensation plan asset market valuations | |||||||||||
| LSR income, net | |||||||||||
| Asset gains (losses), net | ( | ||||||||||
| Other income | |||||||||||
Total noninterest income | ( | ||||||||||
| Noninterest expense: | |||||||||||
| Personnel | |||||||||||
| Occupancy, equipment and office | |||||||||||
| Business development and marketing | |||||||||||
| Data processing | |||||||||||
| Intangibles amortization | |||||||||||
| FDIC assessments | |||||||||||
| Merger-related expense | |||||||||||
| Other expense | |||||||||||
Total noninterest expense | |||||||||||
| Income (loss) before income tax expense (benefit) | ( | ||||||||||
| Income tax expense (benefit) | ( | ||||||||||
| Net income (loss) | $ | $ | ( | ||||||||
| Earnings (loss) per common share: | |||||||||||
| Basic | $ | $ | ( | ||||||||
| Diluted | $ | $ | ( | ||||||||
| Weighted average common shares outstanding: | |||||||||||
| Basic | |||||||||||
| Diluted | |||||||||||
See accompanying notes to unaudited consolidated financial statements.
4
ITEM 1. Financial Statements Continued:
NICOLET BANKSHARES, INC.
Consolidated Statements of Comprehensive Income (Loss)
(In thousands) (Unaudited)
| Three Months Ended March 31, | |||||||||||
| 2024 | 2023 | ||||||||||
| Net income (loss) | $ | $ | ( | ||||||||
| Other comprehensive income (loss), net of tax: | |||||||||||
Unrealized gains (losses) on securities AFS: | |||||||||||
Net unrealized holding gains (losses) | ( | ||||||||||
Net realized (gains) losses included in income | ( | ||||||||||
| Reclassification adjustment for securities transferred from held to maturity to available for sale | ( | ||||||||||
| Income tax (expense) benefit | |||||||||||
| Total other comprehensive income (loss) | ( | ( | |||||||||
| Comprehensive income (loss) | $ | $ | ( | ||||||||
See accompanying notes to unaudited consolidated financial statements.
5
ITEM 1. Financial Statements Continued:
NICOLET BANKSHARES, INC.
Consolidated Statements of Stockholders’ Equity
(In thousands) (Unaudited)
| Common Stock | Additional Paid-In Capital | Retained Earnings | Accumulated Other Comprehensive Income (Loss) | Total | |||||||||||||||||||||||||
| Balances at December 31, 2023 | $ | $ | $ | $ | ( | $ | |||||||||||||||||||||||
| Comprehensive income: | |||||||||||||||||||||||||||||
Net income, three months ended March 31, 2024 | — | — | — | ||||||||||||||||||||||||||
| Other comprehensive income (loss) | — | — | — | ( | ( | ||||||||||||||||||||||||
| Stock-based compensation expense | — | — | — | ||||||||||||||||||||||||||
Cash dividends on common stock, $ | — | — | ( | — | ( | ||||||||||||||||||||||||
| Exercise of stock options, net | — | — | — | ||||||||||||||||||||||||||
| Issuance of common stock | — | — | — | ||||||||||||||||||||||||||
| Balances at March 31, 2024 | $ | $ | $ | $ | ( | $ | |||||||||||||||||||||||
| Balances at December 31, 2022 | $ | $ | $ | $ | ( | $ | |||||||||||||||||||||||
| Comprehensive income: | |||||||||||||||||||||||||||||
Net income (loss), three months ended March 31, 2023 | — | — | ( | — | ( | ||||||||||||||||||||||||
| Other comprehensive income (loss) | — | — | — | ( | ( | ||||||||||||||||||||||||
| Stock-based compensation expense | — | — | — | ||||||||||||||||||||||||||
| Exercise of stock options, net | — | — | — | ||||||||||||||||||||||||||
| Issuance of common stock | — | — | — | ||||||||||||||||||||||||||
| Balances at March 31, 2023 | $ | $ | $ | $ | ( | $ | |||||||||||||||||||||||
See accompanying notes to unaudited consolidated financial statements.
6
ITEM 1. Financial Statements Continued:
NICOLET BANKSHARES, INC.
Consolidated Statements of Cash Flows (Unaudited)
(In thousands) | Three Months Ended March 31, | ||||||||||
| 2024 | 2023 | ||||||||||
| Cash Flows From Operating Activities: | |||||||||||
| Net income (loss) | $ | $ | ( | ||||||||
| Adjustments to reconcile net income (loss) to net cash provided by (used in) operating activities: | |||||||||||
| Depreciation, amortization, and accretion | |||||||||||
| Provision for credit losses | |||||||||||
| Increase in cash surrender value of life insurance | ( | ( | |||||||||
| Stock-based compensation expense | |||||||||||
| Asset (gains) losses, net | ( | ||||||||||
| Gain on sale of loans held for sale, net | ( | ( | |||||||||
| Proceeds from sale of loans held for sale | |||||||||||
| Origination of loans held for sale | ( | ( | |||||||||
| Net change due to: | |||||||||||
Accrued interest receivable and other assets | ( | ||||||||||
Accrued interest payable and other liabilities | ( | ( | |||||||||
Net cash provided by (used in) operating activities | |||||||||||
| Cash Flows From Investing Activities: | |||||||||||
| Net (increase) decrease in loans | ( | ( | |||||||||
| Net (increase) decrease in certificates of deposit in other banks | |||||||||||
| Purchases of securities AFS | ( | ||||||||||
| Proceeds from sales of securities AFS | |||||||||||
| Proceeds from sales of securities HTM | |||||||||||
| Proceeds from calls and maturities of securities AFS | |||||||||||
| Proceeds from calls and maturities of securities HTM | |||||||||||
| Purchases of other investments | ( | ( | |||||||||
| Proceeds from sales of other investments | |||||||||||
| Proceeds from redemption of BOLI | |||||||||||
| Net (increase) decrease in premises and equipment | ( | ( | |||||||||
| Net (increase) decrease in other real estate and other assets | ( | ||||||||||
Net cash provided by (used in) investing activities | ( | ||||||||||
| Cash Flows From Financing Activities: | |||||||||||
| Net increase (decrease) in deposits | ( | ( | |||||||||
| Net increase (decrease) in short-term borrowings | ( | ||||||||||
| Repayments of long-term borrowings | ( | ( | |||||||||
| Cash dividends paid on common stock | ( | ||||||||||
| Proceeds from issuance of common stock | |||||||||||
| Proceeds from exercise of stock options | |||||||||||
Net cash provided by (used in) financing activities | ( | ( | |||||||||
Net increase (decrease) in cash and cash equivalents | ( | ( | |||||||||
| Cash and cash equivalents: | |||||||||||
Beginning | |||||||||||
Ending * | $ | $ | |||||||||
| Supplemental Disclosures of Cash Flow Information: | |||||||||||
| Cash paid for interest | $ | $ | |||||||||
| Cash paid for taxes | |||||||||||
| Transfer of securities from HTM to AFS | |||||||||||
| Transfer of loans and bank premises to other real estate owned | |||||||||||
| Capitalized mortgage servicing rights | |||||||||||
* There was no
See accompanying notes to unaudited consolidated financial statements.
7
NICOLET BANKSHARES, INC.
Notes to Unaudited Consolidated Financial Statements
Note 1 – Basis of Presentation
General
In the opinion of management, the accompanying unaudited consolidated financial statements contain all adjustments necessary to present fairly the consolidated balance sheets, statements of income (loss), comprehensive income (loss), changes in stockholders’ equity, and cash flows of Nicolet Bankshares, Inc. (the “Company” or “Nicolet”) and its subsidiaries, as of and for the periods presented, and all such adjustments are of a normal recurring nature. All material intercompany transactions and balances have been eliminated. The results of operations for the interim periods are not necessarily indicative of the results to be expected for the entire year.
These interim consolidated financial statements have been prepared according to the rules and regulations of the Securities and Exchange Commission and, therefore, certain information and footnote disclosures normally presented in accordance with generally accepted accounting principles in the United States of America (“U.S. GAAP”) have been omitted or abbreviated. These consolidated financial statements should be read in conjunction with the Company’s audited consolidated financial statements and footnotes included in the Company’s Annual Report on Form 10-K for the year ended December 31, 2023.
Critical Accounting Policies and Estimates
Preparation of consolidated financial statements in conformity with U.S. GAAP requires management to make estimates and assumptions that affect the amounts reported in the consolidated financial statements and accompanying disclosures. Material estimates may be used in accounting for, among other items, the allowance for credit losses, valuation of loans in acquisition transactions, useful lives for depreciation and amortization, fair value of financial instruments, impairment calculations, valuation of deferred tax assets, uncertain income tax positions and contingencies. These estimates and assumptions are based on management’s knowledge of historical experience, current information, and other factors deemed to be relevant; accordingly, as this information changes, actual results could differ from those estimates. Factors that may cause sensitivity to the aforementioned estimates include but are not limited to: external market factors such as market interest rates and employment rates, changes to operating policies and procedures, changes in applicable banking or tax regulations, and changes to deferred tax estimates. Nicolet considers accounting estimates to be critical to reported financial results if the accounting estimate requires management to make assumptions about matters that are highly uncertain and different estimates that management reasonably could have used for the accounting estimate in the current period, or changes in the accounting estimate that are reasonably likely to occur from period to period, could have a material impact on the financial statements. The accounting estimates we consider to be critical include business combinations and the valuation of loans acquired, the determination of the allowance for credit losses, and income taxes.
There have been no material changes or developments with respect to the assumptions or methodologies that the Company uses when applying critical accounting policies and developing critical accounting estimates as disclosed in the Company’s Annual Report on Form 10-K for the year ended December 31, 2023.
Recent Accounting Pronouncements Adopted
In March 2023, the FASB issued ASU 2023-02, Investments - Equity Method and Joint Ventures (Topic 323): Accounting for Investments in Tax Credit Structures Using the Proportional Amortization Method. This ASU permits reporting entities to elect to account for tax equity investments, regardless of the tax credit program for which the income tax credits are received, using the proportional amortization method if certain conditions are met. Under the proportional amortization method, an entity amortizes the initial cost of the investment in proportion to the income tax credits and other income tax benefits received and recognizes the net amortization and income tax credits and other income tax benefits in the income statement as a component of income tax expense. A reporting entity makes an accounting policy election to apply the proportional amortization method on a tax-credit-program-by-tax-credit-program basis rather than electing to apply the proportional amortization method at the reporting entity level or to individual investments. This ASU also requires specific disclosures of investments that generate income tax credits and other income tax benefits from a tax credit program for which the entity has elected to apply the proportional amortization method. The updated guidance is effective for fiscal years beginning after December 15, 2023. Adoption of this ASU did not have a material impact on the Company’s consolidated financial statements.
Future Accounting Pronouncements
In December 2023, the FASB issued ASU 2023-09, Income Taxes (Topic 740): Improvements to Income Tax Disclosures. The amendments in this ASU improve the transparency of income tax disclosures by requiring consistent categories and greater disaggregation of information in the rate reconciliation table, as well as income taxes paid disaggregated by jurisdiction. These expanded disclosures will allow investors to better assess how an entity’s overall operations, including the related tax risks, tax planning, and operational opportunities, affect its income tax rate and prospects for future cash flows. The updated guidance is effective for annual periods beginning after December 15, 2024.
8
Reclassifications
Certain amounts in the 2023 consolidated financial statements have been reclassified to conform to the 2024 presentation. These reclassifications were not material and did not impact previously reported net income or comprehensive income.
Note 2 – Earnings per Common Share
Basic earnings per common share are calculated by dividing net income (loss) by the weighted average number of common shares outstanding during the period. Diluted earnings per common share are calculated by dividing net income (loss) by the weighted average number of shares adjusted for the dilutive effect of common stock awards (outstanding stock options and unvested restricted stock), if any. Presented below are the calculations for basic and diluted earnings per common share.
| Three Months Ended March 31, | |||||||||||
| (In thousands, except per share data) | 2024 | 2023 | |||||||||
| Net income (loss) | $ | $ | ( | ||||||||
| Weighted average common shares outstanding | |||||||||||
| Effect of dilutive common stock awards | |||||||||||
| Diluted weighted average common shares outstanding | |||||||||||
| Basic earnings (loss) per common share* | $ | $ | ( | ||||||||
| Diluted earnings (loss) per common share* | $ | $ | ( | ||||||||
*Cumulative quarterly per share performance may not equal annual per share totals due to the effects of the amount and timing of capital increases. When computing earnings per share for an interim period, the denominator is based on the weighted average shares outstanding during the interim period, and not on an annualized weighted average basis. Accordingly, the sum of the earnings per share data for the quarters will not necessarily equal the year to date earnings per share data.
For the three months ended March 31, 2024, options to purchase approximately 0.1 million shares were excluded from the calculation of diluted earnings per common share as the effect of their exercise would have been anti-dilutive. As a result of the Company’s reported net loss for the three months ended March 31, 2023, all of the common stock awards outstanding were excluded from the computation of diluted earnings (loss) per common share.
Note 3 – Stock-Based Compensation
The Company may grant stock options and restricted stock under its stock-based compensation plans to certain officers, employees and directors. These plans are administered by a committee of the Board of Directors, and at March 31, 2024, approximately 0.6 million shares were available for grant under these stock-based compensation plans.
A Black-Scholes model is utilized to estimate the fair value of stock option grants, while the market price of the Company’s stock at the date of grant is used to estimate the fair value of restricted stock awards. The weighted average assumptions used in the Black-Scholes model for valuing stock option grants for the three months ended March 31, 2024 were as follows. There were no stock options granted for the three months ended March 31, 2023.
| Three Months Ended March 31, 2024 | |||||
| Dividend yield | % | ||||
| Expected volatility | % | ||||
| Risk-free interest rate | % | ||||
| Expected average life | |||||
| Weighted average per share fair value of options | $ | ||||
9
A summary of the Company’s stock option activity is summarized below.
| Stock Options | Option Shares Outstanding | Weighted Average Exercise Price | Weighted Average Remaining Life (Years) | Aggregate Intrinsic Value (in thousands) | ||||||||||||||||||||||
| Outstanding - December 31, 2023 | $ | |||||||||||||||||||||||||
| Granted | ||||||||||||||||||||||||||
| Exercise of stock options * | ( | |||||||||||||||||||||||||
| Forfeited | ( | |||||||||||||||||||||||||
| Outstanding - March 31, 2024 | $ | $ | ||||||||||||||||||||||||
| Exercisable - March 31, 2024 | $ | $ | ||||||||||||||||||||||||
* The terms of the stock option agreements permit having a number of shares of stock withheld, the fair market value of which as of the date of exercise is sufficient to satisfy the exercise price and/or tax withholding requirements. For the three months ended March 31, 2024, 1,131 such shares were withheld by the Company.
Intrinsic value represents the amount by which the fair market value of the underlying stock exceeds the exercise price of the stock options. The intrinsic value of options exercised for the three months ended March 31, 2024 and 2023 was approximately $1.5 million and $0.2 million, respectively.
A summary of the Company’s restricted stock activity is summarized below.
| Restricted Stock | Weighted Average Grant Date Fair Value | Restricted Shares Outstanding | ||||||||||||
| Outstanding - December 31, 2023 | $ | |||||||||||||
| Granted | ||||||||||||||
| Vested * | ( | |||||||||||||
| Outstanding - March 31, 2024 | $ | |||||||||||||
* The terms of the restricted stock agreements permit the surrender of shares to the Company upon vesting in order to satisfy applicable withholding at the minimum statutory withholding rate, and accordingly 175 shares were surrendered for the three months ended March 31, 2024.
The Company recognized approximately $1.4 12.8 million of unrecognized compensation cost related to equity award grants, which is expected to be recognized over the remaining vesting period of approximately three years . The Company recognized a tax benefit of approximately $0.2 million and less than $0.1 million for the three months ended March 31, 2024 and 2023, respectively, for the tax impact of stock option exercises and vesting of restricted stock.
10
Note 4 – Securities and Other Investments
Securities
Securities are classified as AFS or HTM on the consolidated balance sheets at the time of purchase. AFS securities include those securities that the Company intends to hold for an indefinite period of time, but not necessarily to maturity, and are carried at fair value on the consolidated balance sheets. HTM securities include those securities which the Company has both the positive intent and ability to hold to maturity, and are carried at amortized cost on the consolidated balance sheets. Premiums and discounts on investment securities are amortized or accreted into interest income over the estimated life of the related securities using the effective interest method.
The amortized cost and fair value of securities AFS are summarized as follows.
| March 31, 2024 | |||||||||||||||||||||||
| (in thousands) | Amortized Cost | Gross Unrealized Gains | Gross Unrealized Losses | Estimated Fair Value | |||||||||||||||||||
| Securities AFS: | |||||||||||||||||||||||
| U.S. Treasury securities | $ | $ | $ | $ | |||||||||||||||||||
| U.S. government agency securities | |||||||||||||||||||||||
| State, county and municipals | |||||||||||||||||||||||
| Mortgage-backed securities | |||||||||||||||||||||||
| Corporate debt securities | |||||||||||||||||||||||
| Total securities AFS | $ | $ | $ | $ | |||||||||||||||||||
| December 31, 2023 | |||||||||||||||||||||||
| (in thousands) | Amortized Cost | Gross Unrealized Gains | Gross Unrealized Losses | Estimated Fair Value | |||||||||||||||||||
| Securities AFS: | |||||||||||||||||||||||
| U.S. Treasury securities | $ | $ | $ | $ | |||||||||||||||||||
| U.S. government agency securities | |||||||||||||||||||||||
| State, county and municipals | |||||||||||||||||||||||
| Mortgage-backed securities | |||||||||||||||||||||||
| Corporate debt securities | |||||||||||||||||||||||
| Total securities AFS | $ | $ | $ | $ | |||||||||||||||||||
On March 7, 2023, Nicolet executed the sale of $500 million (par value) U.S. Treasury held to maturity securities for a pre-tax loss of $38 million or an after-tax loss of $28 million. Proceeds from the sale were used to reduce existing FHLB borrowings with the remainder held in investable cash. As a result of the sale of securities previously classified as held to maturity, the remaining unsold portfolio of held to maturity securities, with a book value of $177 million, was reclassified to available for sale with a carrying value of approximately $157 million. The unrealized loss on this portfolio of $20 million (at the time of reclassification) increased the balance of accumulated other comprehensive loss $15 million, net of the deferred tax effect, and is subject to future market changes.
11
Proceeds and realized gains or losses from the sale of AFS and HTM securities were as follows.
| Three Months Ended March 31, | |||||||||||
| (in thousands) | 2024 | 2023 | |||||||||
| Securities AFS: | |||||||||||
| Gross gains | $ | $ | |||||||||
| Gross losses | ( | ( | |||||||||
Gains (losses) on sales of securities AFS, net | $ | $ | ( | ||||||||
| Proceeds from sales of securities AFS | $ | $ | |||||||||
| Securities HTM: | |||||||||||
| Gross gains | $ | $ | |||||||||
| Gross losses | ( | ||||||||||
| Gains (losses) on sales of securities HTM, net | $ | $ | ( | ||||||||
| Proceeds from sales of securities HTM | $ | $ | |||||||||
All mortgage-backed securities included in the securities portfolio were issued by U.S. government agencies and corporations. Investment securities with a carrying value of $366 million and $364 million, as of March 31, 2024 and December 31, 2023, respectively, were pledged as collateral to secure public deposits and borrowings, as applicable, and for liquidity or other purposes as required by regulation. Accrued interest on investment securities totaled $5
The following table presents gross unrealized losses and the related estimated fair value of investment securities for which an allowance for credit losses has not been recorded, aggregated by investment category and length of time individual securities have been in a continuous unrealized loss position.
| March 31, 2024 | |||||||||||||||||||||||||||||||||||||||||
| Less than 12 months | 12 months or more | Total | |||||||||||||||||||||||||||||||||||||||
| ($ in thousands) | Fair Value | Unrealized Losses | Fair Value | Unrealized Losses | Fair Value | Unrealized Losses | Number of Securities | ||||||||||||||||||||||||||||||||||
| Securities AFS: | |||||||||||||||||||||||||||||||||||||||||
| U.S. Treasury securities | $ | $ | $ | $ | $ | $ | |||||||||||||||||||||||||||||||||||
| U.S. government agency securities | |||||||||||||||||||||||||||||||||||||||||
| State, county and municipals | |||||||||||||||||||||||||||||||||||||||||
| Mortgage-backed securities | |||||||||||||||||||||||||||||||||||||||||
| Corporate debt securities | |||||||||||||||||||||||||||||||||||||||||
Total | $ | $ | $ | $ | $ | $ | |||||||||||||||||||||||||||||||||||
| December 31, 2023 | |||||||||||||||||||||||||||||||||||||||||
| Less than 12 months | 12 months or more | Total | |||||||||||||||||||||||||||||||||||||||
| ($ in thousands) | Fair Value | Unrealized Losses | Fair Value | Unrealized Losses | Fair Value | Unrealized Losses | Number of Securities | ||||||||||||||||||||||||||||||||||
| Securities AFS: | |||||||||||||||||||||||||||||||||||||||||
| U.S. Treasury securities | $ | $ | $ | $ | $ | $ | |||||||||||||||||||||||||||||||||||
| U.S. government agency securities | |||||||||||||||||||||||||||||||||||||||||
| State, county and municipals | |||||||||||||||||||||||||||||||||||||||||
| Mortgage-backed securities | |||||||||||||||||||||||||||||||||||||||||
| Corporate debt securities | |||||||||||||||||||||||||||||||||||||||||
Total | $ | $ | $ | $ | $ | $ | |||||||||||||||||||||||||||||||||||
12
During first quarter 2023, the Company recognized provision expense of $2.3 no
The amortized cost and fair value of investment securities by contractual maturity are shown below. Expected maturities may differ from contractual maturities because borrowers may have the right to call or prepay obligations with or without call or prepayment penalties; as this is particularly inherent in mortgage-backed securities, these securities are not included in the maturity categories below.
As of March 31, 2024 | Securities AFS | ||||||||||
| (in thousands) | Amortized Cost | Fair Value | |||||||||
| Due in less than one year | $ | $ | |||||||||
| Due in one year through five years | |||||||||||
| Due after five years through ten years | |||||||||||
| Due after ten years | |||||||||||
| Mortgage-backed securities | |||||||||||
| Total investment securities | $ | $ | |||||||||
Other Investments
Other investments include “restricted” equity securities, equity securities with readily determinable fair values, and private company securities. As a member of the Federal Reserve Bank System and the Federal Home Loan Bank (“FHLB”) System, Nicolet is required to maintain an investment in the capital stock of these entities. These equity securities are “restricted” in that they can only be sold back to the respective institutions or another member institution at par. Therefore, they are less liquid than other exchange traded equity securities. As no ready market exists for these stocks, and they have no quoted market value, these investments are carried at cost. Also included are investments in other private companies that do not have quoted market prices, which are carried at cost less impairment charges, if any. The carrying value of other investments are summarized as follows.
| March 31, 2024 | December 31, 2023 | ||||||||||
| (in thousands) | Amount | Amount | |||||||||
Federal Reserve Bank stock | $ | $ | |||||||||
Federal Home Loan Bank (“FHLB”) stock | |||||||||||
| Equity securities with readily determinable fair values | |||||||||||
| Other investments | |||||||||||
| Total other investments | $ | $ | |||||||||
13
Note 5 – Loans, Allowance for Credit Losses - Loans, and Credit Quality
The loan composition is summarized as follows.
| March 31, 2024 | December 31, 2023 | ||||||||||||||||||||||
| (in thousands) | Amount | % of Total | Amount | % of Total | |||||||||||||||||||
| Commercial & industrial | $ | % | $ | % | |||||||||||||||||||
| Owner-occupied commercial real estate (“CRE”) | |||||||||||||||||||||||
| Agricultural | |||||||||||||||||||||||
| CRE investment | |||||||||||||||||||||||
| Construction & land development | |||||||||||||||||||||||
| Residential construction | |||||||||||||||||||||||
| Residential first mortgage | |||||||||||||||||||||||
| Residential junior mortgage | |||||||||||||||||||||||
| Retail & other | |||||||||||||||||||||||
Loans | % | % | |||||||||||||||||||||
| Less allowance for credit losses - Loans (“ACL-Loans”) | |||||||||||||||||||||||
Loans, net | $ | $ | |||||||||||||||||||||
| Allowance for credit losses - Loans to loans | % | % | |||||||||||||||||||||
Accrued interest on loans totaled $21 million and $19 million at March 31, 2024 and December 31, 2023, respectively, and is included in on the consolidated balance sheets.
Allowance for Credit Losses - Loans:
The majority of the Company’s loans, commitments, and letters of credit have been granted to customers in the Company’s market area. Although the Company has a diversified loan portfolio, the credit risk in the loan portfolio is largely influenced by general economic conditions and trends of the counties and markets in which the debtors operate, and the resulting impact on the operations of borrowers or on the value of underlying collateral, if any.
A roll forward of the allowance for credit losses - loans is summarized as follows.
| Three Months Ended | Year Ended | ||||||||||||||||
| (in thousands) | March 31, 2024 | March 31, 2023 | December 31, 2023 | ||||||||||||||
| Beginning balance | $ | $ | $ | ||||||||||||||
| Provision for credit losses | |||||||||||||||||
| Charge-offs | ( | ( | ( | ||||||||||||||
| Recoveries | |||||||||||||||||
| Net (charge-offs) recoveries | ( | ( | ( | ||||||||||||||
| Ending balance | $ | $ | $ | ||||||||||||||
14
The following tables present the balance and activity in the ACL-Loans by portfolio segment.
Three Months Ended March 31, 2024 | |||||||||||||||||||||||||||||||||||||||||||||||||||||||||||
| (in thousands) | Commercial & industrial | Owner- occupied CRE | Agricultural | CRE investment | Construction & land development | Residential construction | Residential first mortgage | Residential junior mortgage | Retail & other | Total | |||||||||||||||||||||||||||||||||||||||||||||||||
| ACL-Loans | |||||||||||||||||||||||||||||||||||||||||||||||||||||||||||
| Beginning balance | $ | $ | $ | $ | $ | $ | $ | $ | $ | $ | |||||||||||||||||||||||||||||||||||||||||||||||||
| Provision | ( | ( | ( | ( | ( | ||||||||||||||||||||||||||||||||||||||||||||||||||||||
| Charge-offs | ( | ( | ( | ( | |||||||||||||||||||||||||||||||||||||||||||||||||||||||
| Recoveries | |||||||||||||||||||||||||||||||||||||||||||||||||||||||||||
| Net (charge-offs) recoveries | ( | ( | ( | ||||||||||||||||||||||||||||||||||||||||||||||||||||||||
| Ending balance | $ | $ | $ | $ | $ | $ | $ | $ | $ | $ | |||||||||||||||||||||||||||||||||||||||||||||||||
| As % of ACL-Loans | % | % | % | % | % | % | % | % | % | % | |||||||||||||||||||||||||||||||||||||||||||||||||
Year Ended December 31, 2023 | |||||||||||||||||||||||||||||||||||||||||||||||||||||||||||
| (in thousands) | Commercial & industrial | Owner- occupied CRE | Agricultural | CRE investment | Construction & land development | Residential construction | Residential first mortgage | Residential junior mortgage | Retail & other | Total | |||||||||||||||||||||||||||||||||||||||||||||||||
| ACL-Loans | |||||||||||||||||||||||||||||||||||||||||||||||||||||||||||
| Beginning balance | $ | $ | $ | $ | $ | $ | $ | $ | $ | $ | |||||||||||||||||||||||||||||||||||||||||||||||||
| Provision | ( | ( | ( | ( | |||||||||||||||||||||||||||||||||||||||||||||||||||||||
| Charge-offs | ( | ( | ( | ( | ( | ( | ( | ||||||||||||||||||||||||||||||||||||||||||||||||||||
| Recoveries | |||||||||||||||||||||||||||||||||||||||||||||||||||||||||||
| Net (charge-offs) recoveries | ( | ( | ( | ( | ( | ( | |||||||||||||||||||||||||||||||||||||||||||||||||||||
| Ending balance | $ | $ | $ | $ | $ | $ | $ | $ | $ | $ | |||||||||||||||||||||||||||||||||||||||||||||||||
| As % of ACL-Loans | % | % | % | % | % | % | % | % | % | % | |||||||||||||||||||||||||||||||||||||||||||||||||
The ACL-Loans represents management’s estimate of expected credit losses in the Company’s loan portfolio at the balance sheet date. To assess the appropriateness of the ACL-Loans, management applies an allocation methodology which focuses on evaluation of qualitative and environmental factors, including but not limited to: (i) evaluation of facts and issues related to specific loans; (ii) management’s ongoing review and grading of the loan portfolio; (iii) consideration of historical loan loss and delinquency experience on each portfolio segment; (iv) trends in past due and nonperforming loans; (v) the risk characteristics of the various loan segments; (vi) changes in the size and character of the loan portfolio; (vii) concentrations of loans to specific borrowers or industries; (viii) existing economic conditions; (ix) the fair value of underlying collateral; and (x) other qualitative and quantitative factors which could affect expected credit losses. Assessing these numerous factors involves significant judgment.
Management allocates the ACL-Loans by pools of risk within each loan portfolio segment. The allocation methodology consists of the following components. First, a specific reserve is established for individually evaluated credit-deteriorated loans, which management defines as nonaccrual credit relationships over $250,000 , collateral dependent loans, purchased credit deteriorated loans, and other loans with evidence of credit deterioration. The specific reserve in the ACL-Loans for these credit deteriorated loans is equal to the aggregate collateral or discounted cash flow shortfall. Management allocates the ACL-Loans with historical loss rates by loan segment. The loss factors are measured on a quarterly basis and applied to each loan segment based on current loan balances and projected for their expected remaining life. Next, management allocates the ACL-Loans using the qualitative factors mentioned above. Consideration is given to those current qualitative or environmental factors that are likely to cause estimated credit losses as of the evaluation date to differ from the historical loss experience of each loan segment. Lastly, management considers reasonable and supportable forecasts to assess the collectability of future cash flows.
Allowance for Credit Losses-Unfunded Commitments:
In addition to the ACL-Loans, the Company has established an ACL-Unfunded commitments, classified in accrued interest payable and other liabilities on the consolidated balance sheets. This reserve is maintained at a level that management believes is sufficient to absorb losses arising from unfunded loan commitments, and is determined quarterly based on methodology similar to the methodology for determining the ACL-Loans. The reserve for unfunded commitments was $3.0
15
Provision for Credit Losses:
The provision for credit losses is determined by the Company as the amount to be added to the ACL loss accounts for various types of financial instruments including loans, investment securities, and off-balance sheet credit exposures after net charge-offs have been deducted to bring the ACL to a level that, in management’s judgment, is necessary to absorb expected credit losses over the lives of the respective financial instruments. See Note 4 for additional information regarding the ACL related to investment securities. The following table presents the components of the provision for credit losses.
| Three Months Ended | Year Ended | ||||||||||||||||
| (in thousands) | March 31, 2024 | March 31, 2023 | December 31, 2023 | ||||||||||||||
| Provision for credit losses on: | |||||||||||||||||
| Loans | $ | $ | $ | ||||||||||||||
| Unfunded commitments | |||||||||||||||||
| Investment securities | |||||||||||||||||
| Total | $ | $ | $ | ||||||||||||||
Collateral Dependent Loans:
A loan is considered to be collateral dependent when, based upon management’s assessment, the borrower is experiencing financial difficulty and repayment is expected to be provided substantially through the operation or sale of the collateral. For collateral dependent loans, expected credit losses are based on the estimated fair value of the collateral at the balance sheet date, with consideration for estimated selling costs if satisfaction of the loan depends on the sale of the collateral. The following tables present collateral dependent loans by portfolio segment and collateral type, including those loans with and without a related allowance allocation.
| March 31, 2024 | Collateral Type | ||||||||||||||||||||||
| (in thousands) | Real Estate | Other Business Assets | Total | Without an Allowance | With an Allowance | Allowance Allocation | |||||||||||||||||
| Commercial & industrial | $ | $ | $ | $ | $ | $ | |||||||||||||||||
| Owner-occupied CRE | |||||||||||||||||||||||
| Agricultural | |||||||||||||||||||||||
| CRE investment | |||||||||||||||||||||||
| Residential first mortgage | |||||||||||||||||||||||
| Total loans | $ | $ | $ | $ | $ | $ | |||||||||||||||||
| December 31, 2023 | Collateral Type | ||||||||||||||||||||||
| (in thousands) | Real Estate | Other Business Assets | Total | Without an Allowance | With an Allowance | Allowance Allocation | |||||||||||||||||
| Commercial & industrial | $ | $ | $ | $ | $ | $ | |||||||||||||||||
| Owner-occupied CRE | |||||||||||||||||||||||
| Agricultural | |||||||||||||||||||||||
| CRE investment | |||||||||||||||||||||||
| Residential first mortgage | |||||||||||||||||||||||
| Total loans | $ | $ | $ | $ | $ | $ | |||||||||||||||||
16
Past Due and Nonaccrual Loans:
The following tables present past due loans by portfolio segment.
| March 31, 2024 | |||||||||||||||||||||||
| (in thousands) | 30-89 Days Past Due (accruing) | 90 Days & Over or nonaccrual | Current | Total | |||||||||||||||||||
| Commercial & industrial | $ | $ | $ | $ | |||||||||||||||||||
| Owner-occupied CRE | |||||||||||||||||||||||
| Agricultural | |||||||||||||||||||||||
| CRE investment | |||||||||||||||||||||||
| Construction & land development | |||||||||||||||||||||||
| Residential construction | |||||||||||||||||||||||
| Residential first mortgage | |||||||||||||||||||||||
| Residential junior mortgage | |||||||||||||||||||||||
| Retail & other | |||||||||||||||||||||||
| Total loans | $ | $ | $ | $ | |||||||||||||||||||
| Percent of total loans | % | % | % | % | |||||||||||||||||||
| December 31, 2023 | |||||||||||||||||||||||
| (in thousands) | 30-89 Days Past Due (accruing) | 90 Days & Over or nonaccrual | Current | Total | |||||||||||||||||||
| Commercial & industrial | $ | $ | $ | $ | |||||||||||||||||||
| Owner-occupied CRE | |||||||||||||||||||||||
| Agricultural | |||||||||||||||||||||||
| CRE investment | |||||||||||||||||||||||
| Construction & land development | |||||||||||||||||||||||
| Residential construction | |||||||||||||||||||||||
| Residential first mortgage | |||||||||||||||||||||||
| Residential junior mortgage | |||||||||||||||||||||||
| Retail & other | |||||||||||||||||||||||
| Total loans | $ | $ | $ | $ | |||||||||||||||||||
| Percent of total loans | % | % | % | % | |||||||||||||||||||
The following table presents nonaccrual loans by portfolio segment.
| March 31, 2024 | December 31, 2023 | ||||||||||||||||
| (in thousands) | Nonaccrual Loans | % of Total | Nonaccrual Loans | % of Total | |||||||||||||
| Commercial & industrial | $ | % | $ | % | |||||||||||||
| Owner-occupied CRE | |||||||||||||||||
| Agricultural | |||||||||||||||||
| CRE investment | |||||||||||||||||
| Construction & land development | |||||||||||||||||
| Residential construction | |||||||||||||||||
| Residential first mortgage | |||||||||||||||||
| Residential junior mortgage | |||||||||||||||||
| Retail & other | |||||||||||||||||
Nonaccrual loans | $ | % | $ | % | |||||||||||||
| Percent of total loans | % | % | |||||||||||||||
17
Credit Quality Information:
The following tables present total loans by risk categories and gross charge-offs by year of origination. Acquired loans have been included based upon the actual origination date.
| March 31, 2024 | Amortized Cost Basis by Origination Year | ||||||||||||||||||||||||||||
| (in thousands) | 2024 | 2023 | 2022 | 2021 | 2020 | Prior | Revolving | Revolving to Term | TOTAL | ||||||||||||||||||||
| Commercial & industrial | |||||||||||||||||||||||||||||
| Grades 1-4 | $ | $ | $ | $ | $ | $ | $ | $ | $ | ||||||||||||||||||||
| Grade 5 | |||||||||||||||||||||||||||||
| Grade 6 | |||||||||||||||||||||||||||||
| Grade 7 | |||||||||||||||||||||||||||||
| Total | $ | $ | $ | $ | $ | $ | $ | $ | $ | ||||||||||||||||||||
| Current period gross charge-offs | $ | $ | $ | $ | ( | $ | ( | $ | ( | $ | ( | $ | $ | ( | |||||||||||||||
| Owner-occupied CRE | |||||||||||||||||||||||||||||
| Grades 1-4 | $ | $ | $ | $ | $ | $ | $ | $ | $ | ||||||||||||||||||||
| Grade 5 | |||||||||||||||||||||||||||||
| Grade 6 | |||||||||||||||||||||||||||||
| Grade 7 | |||||||||||||||||||||||||||||
| Total | $ | $ | $ | $ | $ | $ | $ | $ | $ | ||||||||||||||||||||
| Current period gross charge-offs | $ | $ | $ | $ | $ | $ | ( | $ | $ | $ | ( | ||||||||||||||||||
| Agricultural | |||||||||||||||||||||||||||||
| Grades 1-4 | $ | $ | $ | $ | $ | $ | $ | $ | $ | ||||||||||||||||||||
| Grade 5 | |||||||||||||||||||||||||||||
| Grade 6 | |||||||||||||||||||||||||||||
| Grade 7 | |||||||||||||||||||||||||||||
| Total | $ | $ | $ | $ | $ | $ | $ | $ | $ | ||||||||||||||||||||
| Current period gross charge-offs | $ | $ | $ | $ | $ | $ | $ | $ | $ | ||||||||||||||||||||
| CRE investment | |||||||||||||||||||||||||||||
| Grades 1-4 | $ | $ | $ | $ | $ | $ | $ | $ | $ | ||||||||||||||||||||
| Grade 5 | |||||||||||||||||||||||||||||
| Grade 6 | |||||||||||||||||||||||||||||
| Grade 7 | |||||||||||||||||||||||||||||
| Total | $ | $ | $ | $ | $ | $ | $ | $ | $ | ||||||||||||||||||||
| Current period gross charge-offs | $ | $ | $ | $ | $ | $ | $ | $ | $ | ||||||||||||||||||||
| Construction & land development | |||||||||||||||||||||||||||||
| Grades 1-4 | $ | $ | $ | $ | $ | $ | $ | $ | $ | ||||||||||||||||||||
| Grade 5 | |||||||||||||||||||||||||||||
| Grade 6 | |||||||||||||||||||||||||||||
| Grade 7 | |||||||||||||||||||||||||||||
| Total | $ | $ | $ | $ | $ | $ | $ | $ | $ | ||||||||||||||||||||
| Current period gross charge-offs | $ | $ | $ | $ | $ | $ | $ | $ | $ | ||||||||||||||||||||
| Residential construction | |||||||||||||||||||||||||||||
| Grades 1-4 | $ | $ | $ | $ | $ | $ | $ | $ | $ | ||||||||||||||||||||
| Grade 5 | |||||||||||||||||||||||||||||
| Grade 6 | |||||||||||||||||||||||||||||
| Grade 7 | |||||||||||||||||||||||||||||
| Total | $ | $ | $ | $ | $ | $ | $ | $ | $ | ||||||||||||||||||||
| Current period gross charge-offs | $ | $ | $ | $ | $ | $ | $ | $ | $ | ||||||||||||||||||||
| Residential first mortgage | |||||||||||||||||||||||||||||
| Grades 1-4 | $ | $ | $ | $ | $ | $ | $ | $ | $ | ||||||||||||||||||||
| Grade 5 | |||||||||||||||||||||||||||||
| Grade 6 | |||||||||||||||||||||||||||||
| Grade 7 | |||||||||||||||||||||||||||||
| Total | $ | $ | $ | $ | $ | $ | $ | $ | $ | ||||||||||||||||||||
| Current period gross charge-offs | $ | $ | $ | $ | $ | $ | $ | $ | $ | ||||||||||||||||||||
| Residential junior mortgage | |||||||||||||||||||||||||||||
| Grades 1-4 | $ | $ | $ | $ | $ | $ | $ | $ | $ | ||||||||||||||||||||
| Grade 5 | |||||||||||||||||||||||||||||
| Grade 6 | |||||||||||||||||||||||||||||
| Grade 7 | |||||||||||||||||||||||||||||
| Total | $ | $ | $ | $ | $ | $ | $ | $ | $ | ||||||||||||||||||||
| Current period gross charge-offs | $ | $ | $ | $ | $ | $ | $ | $ | $ | ||||||||||||||||||||
| Retail & other | |||||||||||||||||||||||||||||
| Grades 1-4 | $ | $ | $ | $ | $ | $ | $ | $ | $ | ||||||||||||||||||||
| Grade 5 | |||||||||||||||||||||||||||||
| Grade 6 | |||||||||||||||||||||||||||||
| Grade 7 | |||||||||||||||||||||||||||||
| Total | $ | $ | $ | $ | $ | $ | $ | $ | $ | ||||||||||||||||||||
| Current period gross charge-offs | $ | $ | ( | $ | ( | $ | $ | $ | $ | ( | $ | $ | ( | ||||||||||||||||
| Total loans | $ | $ | $ | $ | $ | $ | $ | $ | $ | ||||||||||||||||||||
18
| December 31, 2023 | Amortized Cost Basis by Origination Year | ||||||||||||||||||||||||||||
| (in thousands) | 2023 | 2022 | 2021 | 2020 | 2019 | Prior | Revolving | Revolving to Term | TOTAL | ||||||||||||||||||||
| Commercial & industrial | |||||||||||||||||||||||||||||
| Grades 1-4 | $ | $ | $ | $ | $ | $ | $ | $ | $ | ||||||||||||||||||||
| Grade 5 | |||||||||||||||||||||||||||||
| Grade 6 | |||||||||||||||||||||||||||||
| Grade 7 | |||||||||||||||||||||||||||||
| Total | $ | $ | $ | $ | $ | $ | $ | $ | $ | ||||||||||||||||||||
| Current period gross charge-offs | $ | $ | ( | $ | ( | $ | $ | $ | ( | $ | ( | $ | $ | ( | |||||||||||||||
| Owner-occupied CRE | |||||||||||||||||||||||||||||
| Grades 1-4 | $ | $ | $ | $ | $ | $ | $ | $ | $ | ||||||||||||||||||||
| Grade 5 | |||||||||||||||||||||||||||||
| Grade 6 | |||||||||||||||||||||||||||||
| Grade 7 | |||||||||||||||||||||||||||||
| Total | $ | $ | $ | $ | $ | $ | $ | $ | $ | ||||||||||||||||||||
| Current period gross charge-offs | $ | $ | $ | $ | $ | $ | ( | $ | $ | $ | ( | ||||||||||||||||||
| Agricultural | |||||||||||||||||||||||||||||
| Grades 1-4 | $ | $ | $ | $ | $ | $ | $ | $ | $ | ||||||||||||||||||||
| Grade 5 | |||||||||||||||||||||||||||||
| Grade 6 | |||||||||||||||||||||||||||||
| Grade 7 | |||||||||||||||||||||||||||||
| Total | $ | $ | $ | $ | $ | $ | $ | $ | $ | ||||||||||||||||||||
| Current period gross charge-offs | $ | $ | $ | $ | $ | $ | ( | $ | $ | $ | ( | ||||||||||||||||||
| CRE investment | |||||||||||||||||||||||||||||
| Grades 1-4 | $ | $ | $ | $ | $ | $ | $ | $ | $ | ||||||||||||||||||||
| Grade 5 | |||||||||||||||||||||||||||||
| Grade 6 | |||||||||||||||||||||||||||||
| Grade 7 | |||||||||||||||||||||||||||||
| Total | $ | $ | $ | $ | $ | $ | $ | $ | $ | ||||||||||||||||||||
| Current period gross charge-offs | $ | $ | $ | $ | $ | $ | $ | $ | $ | ||||||||||||||||||||
| Construction & land development | |||||||||||||||||||||||||||||
| Grades 1-4 | $ | $ | $ | $ | $ | $ | $ | $ | $ | ||||||||||||||||||||
| Grade 5 | |||||||||||||||||||||||||||||
| Grade 6 | |||||||||||||||||||||||||||||
| Grade 7 | |||||||||||||||||||||||||||||
| Total | $ | $ | $ | $ | $ | $ | $ | $ | $ | ||||||||||||||||||||
| Current period gross charge-offs | $ | $ | $ | $ | $ | $ | $ | $ | $ | ||||||||||||||||||||
| Residential construction | |||||||||||||||||||||||||||||
| Grades 1-4 | $ | $ | $ | $ | $ | $ | $ | $ | $ | ||||||||||||||||||||
| Grade 5 | |||||||||||||||||||||||||||||
| Grade 6 | |||||||||||||||||||||||||||||
| Grade 7 | |||||||||||||||||||||||||||||
| Total | $ | $ | $ | $ | $ | $ | $ | $ | $ | ||||||||||||||||||||
| Current period gross charge-offs | $ | $ | $ | $ | $ | $ | $ | $ | $ | ||||||||||||||||||||
| Residential first mortgage | |||||||||||||||||||||||||||||
| Grades 1-4 | $ | $ | $ | $ | $ | $ | $ | $ | $ | ||||||||||||||||||||
| Grade 5 | |||||||||||||||||||||||||||||
| Grade 6 | |||||||||||||||||||||||||||||
| Grade 7 | |||||||||||||||||||||||||||||
| Total | $ | $ | $ | $ | $ | $ | $ | $ | $ | ||||||||||||||||||||
| Current period gross charge-offs | $ | $ | $ | $ | $ | $ | ( | $ | $ | $ | ( | ||||||||||||||||||
| Residential junior mortgage | |||||||||||||||||||||||||||||
| Grades 1-4 | $ | $ | $ | $ | $ | $ | $ | $ | $ | ||||||||||||||||||||
| Grade 5 | |||||||||||||||||||||||||||||
| Grade 6 | |||||||||||||||||||||||||||||
| Grade 7 | |||||||||||||||||||||||||||||
| Total | $ | $ | $ | $ | $ | $ | $ | $ | $ | ||||||||||||||||||||
| Current period gross charge-offs | $ | $ | $ | $ | $ | $ | ( | $ | $ | $ | ( | ||||||||||||||||||
| Retail & other | |||||||||||||||||||||||||||||
| Grades 1-4 | $ | $ | $ | $ | $ | $ | $ | $ | $ | ||||||||||||||||||||
| Grade 5 | |||||||||||||||||||||||||||||
| Grade 6 | |||||||||||||||||||||||||||||
| Grade 7 | |||||||||||||||||||||||||||||
| Total | $ | $ | $ | $ | $ | $ | $ | $ | $ | ||||||||||||||||||||
| Current period gross charge-offs | $ | ( | $ | ( | $ | $ | ( | $ | $ | ( | $ | ( | $ | $ | ( | ||||||||||||||
| Total loans | $ | $ | $ | $ | $ | $ | $ | $ | $ | ||||||||||||||||||||
19
An internal loan review function rates loans using a grading system based on different risk categories. Loans with a Substandard grade are considered to have a greater risk of loss and may be assigned allocations for loss based on specific review of the weaknesses observed in the individual credits. Such loans are monitored by the loan review function to help ensure early identification of any deterioration. A description of the loan risk categories used by the Company follows.
Grades 1-4, Pass: Credits exhibit adequate cash flows, appropriate management and financial ratios within industry norms and/or are supported by sufficient collateral. Some credits in these rating categories may require a need for monitoring but elements of concern are not severe enough to warrant an elevated rating.
Grade 5, Watch: Credits with this rating are adequately secured and performing but are being monitored due to the presence of various short-term weaknesses which may include unexpected, short-term adverse financial performance, managerial problems, potential impact of a decline in the entire industry or local economy and delinquency issues. Loans to individuals or loans supported by guarantors with marginal net worth or collateral may be included in this rating category.
Grade 6, Special Mention: Credits with this rating have potential weaknesses that, without the Company’s attention and correction may result in deterioration of repayment prospects. These assets are considered Criticized Assets. Potential weaknesses may include adverse financial trends for the borrower or industry, repeated lack of compliance with Company requests, increasing debt to net worth, serious management conditions and decreasing cash flow.
Grade 7, Substandard: Assets with this rating are characterized by the distinct possibility the Company will sustain some loss if deficiencies are not corrected. All foreclosures, liquidations, and nonaccrual loans are considered to be categorized in this rating, regardless of collateral sufficiency.
Modifications to Borrowers Experiencing Financial Difficulty:
The following table presents the amortized cost of loans that were made to borrowers experiencing financial difficulty and were modified during the three months ended March 31, 2024 and March 31, 2023, respectively, aggregated by portfolio segment and type of modification.
| (in thousands) | Payment Delay | Term Extension | Interest Rate Reduction | Term Extension & Interest Rate Reduction | Total | % of Total Loans | ||||||||||||||
| Three Months Ended March 31, 2024 | ||||||||||||||||||||
| Commercial & industrial | $ | $ | $ | $ | $ | % | ||||||||||||||
| Owner-occupied CRE | % | |||||||||||||||||||
| Agricultural | % | |||||||||||||||||||
| CRE investment | % | |||||||||||||||||||
| Total | $ | $ | $ | $ | $ | % | ||||||||||||||
| Three Months Ended March 31, 2023 | ||||||||||||||||||||
| Commercial & industrial | $ | $ | $ | $ | $ | % | ||||||||||||||
| Owner-occupied CRE | % | |||||||||||||||||||
| Agricultural | % | |||||||||||||||||||
| CRE investment | % | |||||||||||||||||||
| Total | $ | $ | $ | $ | $ | % | ||||||||||||||
The loans presented in the table above have had more than insignificant payment delays (which the Company has defined as payment delays in excess of three months). These modified loans are closely monitored by the Company to understand the effectiveness of its modification efforts, and such loans generally remain in nonaccrual status pending a sustained period of performance in accordance with the modified terms.
As of March 31, 2024 and December 31, 2023, there were no loans made to borrowers experiencing financial difficulty that were modified during the current period and subsequently defaulted, and there were no commitments to lend additional funds to such debtors.
20
Note 6 – Goodwill and Other Intangibles and Servicing Rights
Management periodically reviews the carrying value of its intangible assets to determine if any impairment has occurred, in which case an impairment charge would be recorded as an expense in the period of impairment, or whether changes in circumstances have occurred that would require a revision to the remaining useful life that would affect expense prospectively. In making such determination, management evaluates whether there are any adverse qualitative factors indicating that an impairment may exist, as well as the performance of the underlying operations or assets which give rise to the intangible. Management also regularly monitors economic factors for potential impairment indications on the value of our franchise, stability of deposits, and the wealth client base, underlying our goodwill and other intangibles. Management concluded no impairment was indicated for the three months ended March 31, 2024 and the year ended December 31, 2023. A summary of goodwill and other intangibles was as follows.
| (in thousands) | March 31, 2024 | December 31, 2023 | |||||||||
| Goodwill | $ | $ | |||||||||
| Core deposit intangibles | |||||||||||
| Customer list intangibles | |||||||||||
| Other intangibles | |||||||||||
| Goodwill and other intangibles, net | $ | $ | |||||||||
| Three Months Ended | Year Ended | ||||||||||
| (in thousands) | March 31, 2024 | December 31, 2023 | |||||||||
| Core deposit intangibles: | |||||||||||
| Gross carrying amount | $ | $ | |||||||||
| Accumulated amortization | ( | ( | |||||||||
| Net book value | $ | $ | |||||||||
| Additions during the period | $ | $ | |||||||||
| Amortization during the period | $ | $ | |||||||||
| Customer list intangibles: | |||||||||||
| Gross carrying amount | $ | $ | |||||||||
| Accumulated amortization | ( | ( | |||||||||
| Net book value | $ | $ | |||||||||
| Additions during the period | $ | $ | |||||||||
| Amortization during the period | $ | $ | |||||||||
21
Mortgage servicing rights (“MSR”): Mortgage servicing rights are amortized in proportion to and over the period of estimated net servicing income, and assessed for impairment at each reporting date, with the amortization recorded in mortgage income, net, in the consolidated statements of income. Mortgage servicing rights are carried at the lower of the initial capitalized amount, net of accumulated amortization, or estimated fair value, and are included in other assets in the consolidated balance sheets. The Company periodically evaluates its mortgage servicing rights asset for impairment. At each reporting date, impairment is assessed based on estimated fair value using estimated prepayment speeds of the underlying mortgage loans serviced and stratification based on the risk characteristics of the underlying loans (predominantly loan type and note interest rate). A summary of the changes in the mortgage servicing rights asset was as follows.
| Three Months Ended | Year Ended | ||||||||||
| (in thousands) | March 31, 2024 | December 31, 2023 | |||||||||
| Mortgage servicing rights asset: | |||||||||||
| MSR asset at beginning of year | $ | $ | |||||||||
| Capitalized MSR | |||||||||||
| Amortization during the period | ( | ( | |||||||||
| MSR asset at end of period | $ | $ | |||||||||
| Valuation allowance at beginning of year | $ | $ | ( | ||||||||
| Reversals | |||||||||||
| Valuation allowance at end of period | $ | $ | |||||||||
| MSR asset, net | $ | $ | |||||||||
| Fair value of MSR asset at end of period | $ | $ | |||||||||
| Residential mortgage loans serviced for others | $ | $ | |||||||||
| Net book value of MSR asset to loans serviced for others | % | % | |||||||||
Loan servicing rights (“LSR”): The Company acquired an LSR asset in December 2021 which will be amortized over the estimated remaining loan service period, as the Company does not expect to add new loans to this servicing portfolio. A summary of the changes in the LSR asset were as follows.
| Three Months Ended | Year Ended | ||||||||||
| (in thousands) | March 31, 2024 | December 31, 2023 | |||||||||
| Loan servicing rights asset: | |||||||||||
| LSR asset at beginning of year | $ | $ | |||||||||
| Amortization during the period | ( | ( | |||||||||
| LSR asset at end of period | $ | $ | |||||||||
| Agricultural loans serviced for others | $ | $ | |||||||||
The following table shows the estimated future amortization expense for amortizing intangible assets and the servicing assets. The projections are based on existing asset balances, the current interest rate environment and estimated prepayment speeds as of March 31, 2024. The actual amortization expense the Company recognizes in any given period may be significantly different depending upon acquisition or sale activities, changes in interest rates, prepayment speeds, market conditions, regulatory requirements and events or circumstances that indicate the carrying amount of an asset may not be recoverable.
| (in thousands) | Core deposit intangibles | Customer list intangibles | MSR asset | LSR asset | |||||||||||||||||||
| Year ending December 31, | |||||||||||||||||||||||
2024 (remaining nine months) | $ | $ | $ | $ | |||||||||||||||||||
| 2025 | |||||||||||||||||||||||
| 2026 | |||||||||||||||||||||||
| 2027 | |||||||||||||||||||||||
| 2028 | |||||||||||||||||||||||
| 2029 | |||||||||||||||||||||||
| Thereafter | |||||||||||||||||||||||
| Total | $ | $ | $ | $ | |||||||||||||||||||
22
Note 7 – Short and Long-Term Borrowings
Short-Term Borrowings:
Short-term borrowings include any borrowing with an original maturity of one year or less. The Company did not
Long-Term Borrowings:
Long-term borrowings include any borrowing with an original maturity greater than one year. The components of long-term borrowings were as follows.
| (in thousands) | March 31, 2024 | December 31, 2023 | |||||||||
| FHLB advances | $ | $ | |||||||||
| Junior subordinated debentures | |||||||||||
| Subordinated notes | |||||||||||
Total long-term borrowings | $ | $ | |||||||||
FHLB Advances: The Federal Home Loan Bank (“FHLB”) advance bears a fixed rate, requires interest-only monthly payments, and has a maturity date of March 2025. The weighted average rate of the FHLB advance was 1.55
Junior Subordinated Debentures: Each of the junior subordinated debentures was issued to an underlying statutory trust (the “statutory trusts”), which issued trust preferred securities and common securities and used the proceeds from the issuance of the common and the trust preferred securities to purchase the junior subordinated debentures of the Company. The debentures represent the sole asset of the statutory trusts. All of the common securities of the statutory trusts are owned by the Company. The statutory trusts are not included in the consolidated financial statements. The net effect of all the documents entered into with respect to the trust preferred securities is that the Company, through payments on its debentures, is liable for the distributions and other payments required on the trust preferred securities. Interest on all debentures is current. Any applicable discounts (initially recorded to carry an acquired debenture at its then estimated fair value) are being accreted to interest expense over the remaining life of the debenture. All the junior subordinated debentures are currently callable and may be redeemed in part or in full, at par, plus any accrued but unpaid interest. At both March 31, 2024 and December 31, 2023, approximately $39
Subordinated Notes (the “Notes”): In July 2021, the Company completed the private placement of $100 million in fixed-to-floating rate subordinated notes due in 2031, with a fixed annual rate of 3.125 % for the first five years, and will reset quarterly thereafter to the then current three-month Secured Overnight Financing Rate (“SOFR”) plus 237.5 basis points. The Notes due in 2031 are redeemable beginning July 15, 2026 and quarterly thereafter on any interest payment date. During first quarter 2024, the Company repurchased and retired approximately $5 million of these Notes.
In December 2021, as the result of an acquisition, Nicolet assumed $22 million in fixed-to-floating rate subordinated notes due in 2030, with a fixed annual interest rate of 7.00 % for the first five years, and will reset quarterly thereafter to the then current SOFR plus 687.5 basis points. The Notes due in 2030 are redeemable beginning June 30, 2025, and quarterly thereafter on any interest payment date. All Notes qualify as Tier 2 capital for regulatory purposes, and are discounted in accordance with regulations when the debt has five years or less remaining to maturity.
23
The following table shows the breakdown of junior subordinated debentures and subordinated notes.
As of March 31, 2024 | As of December 31, 2023 | |||||||||||||||||||||||||
| (in thousands) | Maturity Date | Interest Rate | Par | Unamortized Premium /(Discount) / Debt Issue Costs (1) | Carrying Value | Interest Rate | Carrying Value | |||||||||||||||||||
| Junior Subordinated Debentures: | ||||||||||||||||||||||||||
Mid-Wisconsin Statutory Trust I (2) | 12/15/2035 | % | $ | $ | ( | $ | % | $ | ||||||||||||||||||
Baylake Capital Trust II (3) | 9/30/2036 | % | ( | % | ||||||||||||||||||||||
First Menasha Statutory Trust (4) | 3/17/2034 | % | ( | % | ||||||||||||||||||||||
County Bancorp Statutory Trust II (5) | 9/15/2035 | % | ( | % | ||||||||||||||||||||||
County Bancorp Statutory Trust III (6) | 6/15/2036 | % | ( | % | ||||||||||||||||||||||
Fox River Valley Capital Trust (7) | 5/30/2033 | % | ( | % | ||||||||||||||||||||||
| Total | $ | $ | ( | $ | $ | |||||||||||||||||||||
| Subordinated Notes: | ||||||||||||||||||||||||||
| Subordinated Notes due 2031 | 7/15/2031 | % | $ | $ | ( | $ | % | $ | ||||||||||||||||||
| County Subordinated Notes due 2030 | 6/30/2030 | % | % | |||||||||||||||||||||||
| Total | $ | $ | ( | $ | $ | |||||||||||||||||||||
(1) Represents the remaining unamortized premium or discount on debt issuances assumed in acquisitions, and represents the unamortized debt issue costs for the debt issued directly by Nicolet.
(2) The debentures, assumed in April 2013 as the result of an acquisition, have a floating rate of three-month SOFR plus 1.43 %, adjusted quarterly. *
(3) The debentures, assumed in April 2016 as a result of an acquisition, have a floating rate of three-month SOFR plus 1.35 %, adjusted quarterly. *
(4) The debentures, assumed in April 2017 as the result of an acquisition, have a floating rate of three-month SOFR plus 2.79 %, adjusted quarterly. *
(5) The debentures, assumed in December 2021 as the result of an acquisition, have a floating rate of three-month SOFR plus 1.53 %, adjusted quarterly. *
(6) The debentures, assumed in December 2021 as the result of an acquisition, have a floating rate of three-month SOFR plus 1.69 %, adjusted quarterly. *
(7) The debentures, assumed in December 2021 as the result of an acquisition, have a floating rate of 5-year swap rate plus 3.40 %, which resets every five years.
* The floating rate on this debenture was originally based on three-month LIBOR. Effective with the cessation of LIBOR, the floating rate on this debenture is now based on three-month CME Term SOFR, plus the spread adjustment of 0.26161 %.
Note 8 – Commitments and Contingencies
The Company is party to financial instruments with off-balance sheet risk in the normal course of business to meet the financing needs of its customers. These financial instruments include commitments to extend credit, financial guarantees, and standby letters of credit. Such commitments may involve, to varying degrees, elements of credit risk in excess of amounts recognized on the consolidated balance sheets. The Company’s exposure to credit loss in the event of nonperformance by the other party to the financial instruments for commitments to extend credit and standby letters of credit is represented by the contractual amount of those instruments. The Company uses the same credit policies in making commitments and issuing letters of credit as they do for on-balance sheet financial instruments. See Note 5 for information on the allowance for credit losses-unfunded commitments.
A summary of the contract or notional amount of the Company’s exposure to off-balance sheet risk was as follows.
| (in thousands) | March 31, 2024 | December 31, 2023 | |||||||||
| Commitments to extend credit | $ | $ | |||||||||
| Financial standby letters of credit | |||||||||||
| Performance standby letters of credit | |||||||||||
Commitments to extend credit are agreements to lend to a customer as long as there is no violation of any condition established in the contract, and predominantly included commercial lines of credit with a term of one year or less. The commitments generally have fixed expiration dates or other termination clauses and may require payment of a fee. Since many of the commitments are expected to expire without being drawn upon, the total commitment amounts do not necessarily represent future cash requirements.
Financial and performance standby letters of credit are conditional commitments issued to guarantee the performance of a customer to a third party. Financial standby letters of credit are issued specifically to facilitate commerce and typically result in the commitment being drawn on when the underlying transaction is consummated between the customer and the third party, while performance standby letters of credit generally are contingent upon the failure of the customer to perform according to the terms of the underlying contract with the third party. Both of these guarantees are primarily issued to support public and private
24
borrowing arrangements and, generally, have terms of one year or less. The credit risk involved in issuing letters of credit is essentially the same as that involved in extending loan facilities to customers. The Company holds collateral, which may include accounts receivable, inventory, property, equipment, and income-producing properties, supporting those commitments if deemed necessary. In the event the customer does not perform in accordance with the terms of the agreement with the third-party, the Company would be required to fund the commitment. The maximum potential amount of future payments the Company could be required to make is represented by the contractual amount. If the commitment is funded, the Company would be entitled to seek recovery from the customer.
Interest rate lock commitments to originate residential mortgage loans held for sale and forward commitments to sell residential mortgage loans held for sale are considered derivative instruments (“mortgage derivatives”) and the contractual amounts were $21 million and $20 million, respectively, at March 31, 2024. In comparison, interest rate lock commitments to originate residential mortgage loans held for sale and forward commitments to sell residential mortgage loans held for sale each totaled $13 0.1
Nicolet is party to various pending and threatened claims and legal proceedings arising in the normal course of business activities, some of which may involve claims for substantial amounts. Although Nicolet has developed policies and procedures to minimize legal noncompliance and the impact of claims and other proceedings and endeavored to procure reasonable amounts of insurance coverage, litigation and regulatory actions present an ongoing risk. With respect to all such claims, Nicolet continuously assesses its potential liability based on the allegations and evidence available. If the facts indicate that it is probable that Nicolet will incur a loss and the amount of such loss can be reasonably estimated, Nicolet will establish an accrual for the probable loss. For matters where a loss is not probable, or the amount of the loss cannot be reasonably estimated, Nicolet does not establish an accrual.
Future developments could result in an unfavorable outcome for or resolution of any one or more of the legal proceedings in which Nicolet is a defendant, which may be material to Nicolet’s business or consolidated results of operations or financial condition for a particular fiscal period or periods. Although it is not possible to predict the outcome of any of these legal proceedings or the range of possible loss, if any, based on the most recent information available, advice of counsel and available insurance coverage, if applicable, management believes that any liability resulting from such proceedings would not have a material adverse effect on our financial position or results of operations.
Note 9 – Fair Value Measurements
Fair value represents the estimated price at which an orderly transaction to sell an asset or transfer a liability would take place between market participants at the measurement date under current market conditions (i.e., an exit price concept), and is a market-based measurement versus an entity-specific measurement. The Company records and/or discloses certain financial instruments on a fair value basis. These financial assets and financial liabilities are measured at fair value in three levels, based on the markets in which the assets and liabilities are traded and the observability of the assumptions used to determine fair value. Observable inputs are inputs that market participants would use in pricing the asset or liability based on market data obtained from independent sources. Unobservable inputs are inputs that reflect assumptions of the reporting entity about how market participants would price the asset or liability based on the best information available under the circumstances. The three fair value levels are:
•Level 1 – quoted market prices in active markets for identical assets or liabilities that a company has the ability to access at the measurement date
•Level 2 – inputs other than quoted prices included in Level 1 that are observable for the asset or liability, either directly or indirectly
•Level 3 – significant unobservable inputs for the asset or liability, which are typically based on an entity’s own assumptions, as there is little, if any, related market activity
In instances where the fair value measurement is based on inputs from different levels, the level within which the entire fair value measurement will be categorized is based on the lowest level input that is significant to the fair value measurement in its entirety. This assessment of the significance of an input requires management judgment.
25
Recurring basis fair value measurements:
The following table presents the balances of assets and liabilities measured at fair value on a recurring basis for the periods presented.
| (in thousands) | Fair Value Measurements Using | |||||||||||||||||||||||||
| Measured at Fair Value on a Recurring Basis: | Total | Level 1 | Level 2 | Level 3 | ||||||||||||||||||||||
| March 31, 2024 | ||||||||||||||||||||||||||
| U.S. Treasury securities | $ | $ | $ | $ | ||||||||||||||||||||||
| U.S. government agency securities | ||||||||||||||||||||||||||
| State, county and municipals | ||||||||||||||||||||||||||
| Mortgage-backed securities | ||||||||||||||||||||||||||
| Corporate debt securities | ||||||||||||||||||||||||||
Securities AFS | $ | $ | $ | $ | ||||||||||||||||||||||
| Other investments (equity securities) | $ | $ | $ | $ | ||||||||||||||||||||||
| Derivative assets | $ | $ | $ | $ | ||||||||||||||||||||||
| Derivative liabilities | $ | $ | $ | $ | ||||||||||||||||||||||
| December 31, 2023 | ||||||||||||||||||||||||||
| U.S. Treasury securities | $ | $ | $ | $ | ||||||||||||||||||||||
| U.S. government agency securities | ||||||||||||||||||||||||||
| State, county and municipals | ||||||||||||||||||||||||||
| Mortgage-backed securities | ||||||||||||||||||||||||||
| Corporate debt securities | ||||||||||||||||||||||||||
Securities AFS | $ | $ | $ | $ | ||||||||||||||||||||||
| Other investments (equity securities) | $ | $ | $ | $ | ||||||||||||||||||||||
| Derivative assets | $ | $ | $ | $ | ||||||||||||||||||||||
| Derivative liabilities | $ | $ | $ | $ | ||||||||||||||||||||||
The following is a description of the valuation methodologies used by the Company for the assets and liabilities measured at fair value on a recurring basis, noted in the tables above.
Securities AFS and Equity Securities: Where quoted market prices on securities exchanges are available, the investments are classified as Level 1. Level 1 investments primarily include exchange-traded equity securities. If quoted market prices are not available, fair value is generally determined using prices obtained from independent pricing vendors who use pricing models (with typical inputs including benchmark yields, reported trades for similar securities, issuer spreads or relationship to other benchmark quoted securities), or discounted cash flows, and are classified as Level 2. Examples of these investments include U.S. Treasury securities, U.S. government agency securities, mortgage-backed securities, obligations of state, county and municipals, and certain corporate debt securities. Finally, in certain cases where there is limited activity or less transparency around inputs to the estimated fair value, investments are classified within Level 3 of the hierarchy. Examples of these include private corporate debt securities, which are primarily trust preferred security investments, as well as certain municipal bonds and mortgage-backed securities. At March 31, 2024 and December 31, 2023, it was determined that carrying value was the best approximation of fair value for these Level 3 securities, based primarily on the internal analysis on these securities.
Derivatives: The derivative assets and liabilities include mortgage derivatives. The fair value of interest rate lock commitments are determined using the projected sale price of individual loans based on changes in the market interest rates, projected pull-through rates (the probability that an interest rate lock commitment will ultimately result in an originated loan), the reduction in the value of the applicant’s option due to the passage of time, and the remaining origination costs to be incurred based on management’s estimate of market costs. The fair value of forward commitments are determined using quoted prices of to-be-announced securities in active markets, or benchmarked to such securities. The derivative assets and liabilities are classified with Level 3 of the hierarchy.
26
The following table presents the changes in Level 3 securities AFS measured at fair value on a recurring basis.
| (in thousands) | Three Months Ended | Year Ended | ||||||||||||
| Level 3 Fair Value Measurements: | March 31, 2024 | December 31, 2023 | ||||||||||||
| Balance at beginning of year | $ | $ | ||||||||||||
| Maturities / Paydowns | ( | ( | ||||||||||||
| Unrealized gain / (loss) | ||||||||||||||
| Balance at end of period | $ | $ | ||||||||||||
Nonrecurring basis fair value measurements:
The following table presents the Company’s assets measured at fair value on a nonrecurring basis, aggregated by level in the fair value hierarchy within which those measurements fall.
| (in thousands) | Fair Value Measurements Using | |||||||||||||||||||||||||
| Measured at Fair Value on a Nonrecurring Basis: | Total | Level 1 | Level 2 | Level 3 | ||||||||||||||||||||||
| March 31, 2024 | ||||||||||||||||||||||||||
| Collateral dependent loans | $ | $ | $ | $ | ||||||||||||||||||||||
| Other real estate owned (“OREO”) | ||||||||||||||||||||||||||
| MSR asset | ||||||||||||||||||||||||||
| December 31, 2023 | ||||||||||||||||||||||||||
| Collateral dependent loans | $ | $ | $ | $ | ||||||||||||||||||||||
| OREO | ||||||||||||||||||||||||||
| MSR asset | ||||||||||||||||||||||||||
The following is a description of the valuation methodologies used by the Company for the assets and liabilities measured at fair value on a nonrecurring basis, noted in the table above.
Collateral dependent loans: For individually evaluated collateral dependent loans, the estimated fair value is based upon the present value of expected future cash flows discounted at the loan’s effective interest rate, the estimated fair value of the underlying collateral with consideration for estimated selling costs if satisfaction of the loan depends on the sale of the collateral, or the estimated liquidity of the note.
OREO: For OREO, the fair value is based upon the estimated fair value of the underlying collateral adjusted for the expected costs to sell.
MSR asset: To estimate the fair value of the MSR asset, the underlying serviced loan pools are stratified by interest rate tranche and term of the loan, and a valuation model is used to calculate the present value of the expected future cash flows for each stratum. The servicing valuation model incorporates assumptions that market participants would use in estimating future net servicing income, such as costs to service, a discount rate, ancillary income, default rates and losses, and prepayment speeds. Although some of these assumptions are based on observable market data, other assumptions are based on unobservable estimates of what market participants would use to measure fair value.
27
Financial instruments:
The carrying amounts and estimated fair values of the Company’s financial instruments are shown below.
| March 31, 2024 | ||||||||||||||||||||||||||||||||
| (in thousands) | Carrying Amount | Estimated Fair Value | Level 1 | Level 2 | Level 3 | |||||||||||||||||||||||||||
| Financial assets: | ||||||||||||||||||||||||||||||||
| Cash and cash equivalents | $ | $ | $ | $ | $ | |||||||||||||||||||||||||||
| Certificates of deposit in other banks | ||||||||||||||||||||||||||||||||
| Securities AFS | ||||||||||||||||||||||||||||||||
| Other investments, including equity securities | ||||||||||||||||||||||||||||||||
| Loans held for sale | ||||||||||||||||||||||||||||||||
| Loans, net | ||||||||||||||||||||||||||||||||
| MSR asset | ||||||||||||||||||||||||||||||||
| LSR asset | ||||||||||||||||||||||||||||||||
| Accrued interest receivable | ||||||||||||||||||||||||||||||||
| Financial liabilities: | ||||||||||||||||||||||||||||||||
| Deposits | $ | $ | $ | $ | $ | |||||||||||||||||||||||||||
| Long-term borrowings | ||||||||||||||||||||||||||||||||
| Accrued interest payable | ||||||||||||||||||||||||||||||||
| December 31, 2023 | ||||||||||||||||||||||||||||||||
| (in thousands) | Carrying Amount | Estimated Fair Value | Level 1 | Level 2 | Level 3 | |||||||||||||||||||||||||||
| Financial assets: | ||||||||||||||||||||||||||||||||
| Cash and cash equivalents | $ | $ | $ | $ | $ | |||||||||||||||||||||||||||
| Certificates of deposit in other banks | ||||||||||||||||||||||||||||||||
| Securities AFS | ||||||||||||||||||||||||||||||||
| Other investments | ||||||||||||||||||||||||||||||||
| Loans held for sale | ||||||||||||||||||||||||||||||||
| Loans, net | ||||||||||||||||||||||||||||||||
| MSR asset | ||||||||||||||||||||||||||||||||
| LSR asset | ||||||||||||||||||||||||||||||||
| Accrued interest receivable | ||||||||||||||||||||||||||||||||
| Financial liabilities: | ||||||||||||||||||||||||||||||||
| Deposits | $ | $ | $ | $ | $ | |||||||||||||||||||||||||||
| Long-term borrowings | ||||||||||||||||||||||||||||||||
| Accrued interest payable | ||||||||||||||||||||||||||||||||
The valuation methodologies for the financial instruments disclosed in the above table are described in Note 18, Fair Value Measurements, in the Company’s Annual Report on Form 10-K for the year ended December 31, 2023.
28
ITEM 2. MANAGEMENT’S DISCUSSION AND ANALYSIS OF FINANCIAL CONDITION AND RESULTS OF OPERATIONS
Nicolet Bankshares, Inc. (the “Company” or “Nicolet”) is a bank holding company headquartered in Green Bay, Wisconsin. Nicolet provides a diversified range of traditional banking and wealth management services to individuals and businesses in its market area and through the branch offices of its banking subsidiary, Nicolet National Bank (the “Bank”), primarily in Wisconsin, Michigan, and Minnesota. In this Quarterly Report on Form 10-Q, unless the context indicates otherwise, all references to “we,” “us” and “our” refer to the Company.
Forward-Looking Statements
Statements made in this document and in any documents that are incorporated by reference which are not purely historical are forward-looking statements, as defined in the Private Securities Litigation Reform Act of 1995, including any statements regarding descriptions of management’s plans, objectives, or goals for future operations, products or services, and forecasts of its revenues, earnings, or other measures of performance. Forward-looking statements are based on current management expectations and, by their nature, are subject to risks and uncertainties. These statements are neither statements of historical fact nor assurance of future performance and generally may be identified by the use of words such as “believe,” “expect,” “anticipate,” “plan,” “estimate,” “should,” “will,” “intend,” or similar expressions. Forward-looking statements include discussions of strategy, financial projections, guidance and estimates (including their underlying assumptions), statements regarding plans, objectives, expectations or consequences of various transactions or events, and statements about our future performance, operations, products and services, and should be viewed with caution. Investors should note that many factors, some of which are discussed elsewhere in this document, could affect the future financial results of Nicolet and could cause those results to differ materially from those implied or anticipated by the statements. Except as required by law, we expressly disclaim any obligations to publicly update any forward-looking statements whether written or oral, that may be made from time to time, whether as a result of new information, future developments or otherwise. Important factors, many of which are beyond Nicolet’s control, that could cause our actual results and financial condition to differ materially from those indicated in the forward-looking statements, in addition to those described in detail under Item 1A, “Risk Factors” of Nicolet’s 2023 Annual Report on Form 10-K include, but are not necessarily limited to the following:
•operating, legal and regulatory risks, including the effects of legislative or regulatory developments affecting the financial industry generally or Nicolet specifically;
•our ability to maintain liquidity, primarily through deposits, in light of recent events in the banking industry;
•economic, market, political and competitive forces affecting Nicolet’s banking and wealth management businesses;
•changes in interest rates, monetary policy and general economic conditions, which may impact Nicolet’s net interest income;
•potential difficulties in identifying and integrating the operations of future acquisition targets with those of Nicolet;
•the impact of purchase accounting with respect to our merger activities, or any change in the assumptions used regarding the assets purchased and liabilities assumed to determine their fair value;
•cybersecurity risks and the vulnerability of our network and online banking portals, and the systems or parties with whom we contract, to unauthorized access, computer viruses, phishing schemes, spam attacks, human error, natural disasters, power loss and other security breaches that could adversely affect our business and financial performance or reputation;
•changes in accounting standards, rules and interpretations and the related impact on Nicolet’s financial statements;
•compliance or operational risks related to new products, services, ventures, or lines of business, if any, that Nicolet may pursue or implement;
•changes in monetary and tax policies;
•our ability to attract and retain key personnel;
•examinations by our regulatory authorities, including the possibility that the regulatory authorities may, among other things, require us to increase our allowance for credit losses, write-down assets, or take other actions;
•risks associated with actual or potential information gatherings, investigations or legal proceedings by customers, regulatory agencies or others;
•the potential effects of events beyond our control that may have a destabilizing effect on financial markets and the economy, such as inflation and recessions, weather events, natural disasters, epidemics and pandemics, terrorist activities, wars or other foreign conflicts, disruptions in our customers’ supply chains, disruptions in transportation, essential utility outages or trade disputes and related tariffs;
•each of the factors and risks under Item 1A, “Risk Factors” of Nicolet’s 2023 Annual Report on Form 10-K and in subsequent filings we make with the SEC; and
•the risk that Nicolet’s analysis of these risks and forces could be incorrect and/or that the strategies developed to address them could be unsuccessful.
These factors should be considered in evaluating the forward-looking statements, and you should not place undue reliance on such statements.
29
Overview
The following discussion is management’s analysis of Nicolet’s consolidated financial condition as of March 31, 2024 and December 31, 2023 and results of operations for the three-month periods ended March 31, 2024 and 2023. It should be read in conjunction with our audited consolidated financial statements included in Nicolet’s 2023 Annual Report on Form 10-K.
Economic Outlook
After surprising strength in 2023, the U.S. economy is gradually slowing, with GDP of 2.5% for 2023 anticipated to decline to closer to 2% for first quarter 2024. The labor markets remain robust, and employment payrolls continue to increase. Consumer spending was strong on a bifurcated economy. The wealthiest are benefiting from solid investment (as the S&P 500 nears record levels) and real estate gains, while the less wealthy have pulled back as wages have not kept pace with inflation resulting in rising credit card and auto loan delinquencies.
Inflation showed improvement through mid-2023, before leveling off and recent months have reflected a slight uptick, coming in over 3% compared to the Federal Reserve goal of 2%. It is anticipated that inflation may remain in the 2.5% to 3.0% range for a period of time due to the tight labor markets and de-globalization of supply chains, resulting in higher interest rates for longer. The Federal Reserve is unlikely to take action to lower interest rates until inflation nears their 2% goal. Current projections are only pricing in one or two interest rate cuts before the end of the year.
30
Table 1: Earnings Summary and Selected Financial Data
| At or for the Three Months Ended | |||||||||||||||||||||||||||||
| (In thousands, except per share data) | 3/31/2024 | 12/31/2023 | 9/30/2023 | 6/30/2023 | 3/31/2023 | ||||||||||||||||||||||||
| Results of operations: | |||||||||||||||||||||||||||||
| Net interest income | $ | 62,807 | $ | 64,282 | $ | 61,474 | $ | 59,039 | $ | 56,721 | |||||||||||||||||||
| Provision for credit losses | 750 | 1,000 | 450 | 450 | 3,090 | ||||||||||||||||||||||||
| Noninterest income | 19,422 | 24,434 | 16,541 | 16,841 | (21,844) | ||||||||||||||||||||||||
| Noninterest expense | 47,147 | 50,296 | 45,738 | 44,957 | 44,875 | ||||||||||||||||||||||||
| Income tax expense (benefit) | 6,542 | 6,759 | 14,669 | 7,878 | (4,190) | ||||||||||||||||||||||||
| Net income (loss) | $ | 27,790 | $ | 30,661 | $ | 17,158 | $ | 22,595 | $ | (8,898) | |||||||||||||||||||
| Earnings (loss) per common share: | |||||||||||||||||||||||||||||
| Basic | $ | 1.86 | $ | 2.07 | $ | 1.16 | $ | 1.54 | $ | (0.61) | |||||||||||||||||||
| Diluted | $ | 1.82 | $ | 2.02 | $ | 1.14 | $ | 1.51 | $ | (0.61) | |||||||||||||||||||
| Common Shares: | |||||||||||||||||||||||||||||
| Basic weighted average | 14,907 | 14,823 | 14,740 | 14,711 | 14,694 | ||||||||||||||||||||||||
| Diluted weighted average | 15,249 | 15,142 | 15,100 | 14,960 | 14,694 | ||||||||||||||||||||||||
| Outstanding (period end) | 14,931 | 14,894 | 14,758 | 14,718 | 14,698 | ||||||||||||||||||||||||
| Period-End Balances: | |||||||||||||||||||||||||||||
| Loans | $ | 6,397,617 | $ | 6,353,942 | $ | 6,239,257 | $ | 6,222,776 | $ | 6,223,732 | |||||||||||||||||||
| Allowance for credit losses - loans | 64,347 | 63,610 | 63,160 | 62,811 | 62,412 | ||||||||||||||||||||||||
| Total assets | 8,446,662 | 8,468,678 | 8,416,162 | 8,482,628 | 8,192,354 | ||||||||||||||||||||||||
| Deposits | 7,165,732 | 7,197,800 | 7,182,388 | 7,198,604 | 6,928,579 | ||||||||||||||||||||||||
| Stockholders’ equity (common) | 1,063,655 | 1,039,007 | 974,461 | 977,638 | 961,792 | ||||||||||||||||||||||||
| Book value per common share | 71.24 | 69.76 | 66.03 | 66.42 | 65.44 | ||||||||||||||||||||||||
Tangible book value per common share (2) | 44.91 | 43.28 | 39.18 | 39.37 | 38.20 | ||||||||||||||||||||||||
Financial Ratios: (1) | |||||||||||||||||||||||||||||
| Return on average assets | 1.33 | % | 1.45 | % | 0.81 | % | 1.10 | % | (0.42) | % | |||||||||||||||||||
| Return on average common equity | 10.66 | 12.20 | 6.92 | 9.37 | (3.72) | ||||||||||||||||||||||||
Return on average tangible common equity (2) | 17.07 | 20.22 | 11.62 | 15.95 | (6.34) | ||||||||||||||||||||||||
| Stockholders’ equity to assets | 12.59 | 12.27 | 11.58 | 11.53 | 11.74 | ||||||||||||||||||||||||
Tangible common equity to tangible assets (2) | 8.33 | 7.98 | 7.21 | 7.17 | 7.21 | ||||||||||||||||||||||||
| Reconciliation of Non-GAAP Financial Measures: | |||||||||||||||||||||||||||||
Adjusted net income (loss) reconciliation: (3) | |||||||||||||||||||||||||||||
| Net income (loss) (GAAP) | $ | 27,790 | $ | 30,661 | $ | 17,158 | $ | 22,595 | $ | (8,898) | |||||||||||||||||||
| Adjustments: | |||||||||||||||||||||||||||||
Provision expense (4) | — | — | — | — | 2,340 | ||||||||||||||||||||||||
| Assets (gains) losses, net | (1,909) | (5,947) | (31) | 318 | 38,468 | ||||||||||||||||||||||||
| Merger-related expense | — | — | — | 26 | 163 | ||||||||||||||||||||||||
| Contract termination charge | — | 2,689 | — | — | — | ||||||||||||||||||||||||
| Adjustments subtotal | (1,909) | (3,258) | (31) | 344 | 40,971 | ||||||||||||||||||||||||
Tax on Adjustments (5) | (372) | (635) | (6) | 86 | 10,243 | ||||||||||||||||||||||||
Tax - Wisconsin Tax Law Change (6) | — | — | 6,151 | — | — | ||||||||||||||||||||||||
| Adjusted net income (Non-GAAP) | $ | 26,253 | $ | 28,038 | $ | 23,284 | $ | 22,853 | $ | 21,830 | |||||||||||||||||||
| Adjusted diluted earnings per common share (Non-GAAP) | $ | 1.72 | $ | 1.85 | $ | 1.54 | $ | 1.53 | $ | 1.45 | |||||||||||||||||||
Tangible assets: (2) | |||||||||||||||||||||||||||||
| Total assets | $ | 8,446,662 | $ | 8,468,678 | $ | 8,416,162 | $ | 8,482,628 | $ | 8,192,354 | |||||||||||||||||||
| Goodwill and other intangibles, net | 393,183 | 394,366 | 396,208 | 398,194 | 400,277 | ||||||||||||||||||||||||
| Tangible assets | $ | 8,053,479 | $ | 8,074,312 | $ | 8,019,954 | $ | 8,084,434 | $ | 7,792,077 | |||||||||||||||||||
Tangible common equity: (2) | |||||||||||||||||||||||||||||
| Stockholders’ equity (common) | $ | 1,063,655 | $ | 1,039,007 | $ | 974,461 | $ | 977,638 | $ | 961,792 | |||||||||||||||||||
| Goodwill and other intangibles, net | 393,183 | 394,366 | 396,208 | 398,194 | 400,277 | ||||||||||||||||||||||||
| Tangible common equity | $ | 670,472 | $ | 644,641 | $ | 578,253 | $ | 579,444 | $ | 561,515 | |||||||||||||||||||
Tangible average common equity: (2) | |||||||||||||||||||||||||||||
| Average stockholders’ equity (common) | $ | 1,048,596 | $ | 996,745 | $ | 983,133 | $ | 967,142 | $ | 970,108 | |||||||||||||||||||
| Average goodwill and other intangibles, net | 393,961 | 395,158 | 397,052 | 399,080 | 401,212 | ||||||||||||||||||||||||
| Average tangible common equity | $ | 654,635 | $ | 601,587 | $ | 586,081 | $ | 568,062 | $ | 568,896 | |||||||||||||||||||
(1) Income statement-related ratios for partial-year periods are annualized.
(2) The ratios of tangible book value per common share, return on average tangible common equity, and tangible common equity to tangible assets are non-GAAP financial measures that exclude goodwill and other intangibles, net. These financial ratios have been included as management considers them to be useful metrics with which to analyze and evaluate our financial condition and capital strength. See section “Non-GAAP Financial Measures” below.
(3) The adjusted net income measure is a non-GAAP financial measure that provides information that management believes is useful to investors in understanding our operating performance and trends and also aids investors in the comparison of our financial performance to the financial performance of peer banks. See section “Non-GAAP Financial Measures” below.
(4) Provision expense for 2023 is attributable to the expected loss on a bank subordinated debt investment.
(5) The effective tax rate for periods prior to the July 1, 2023, effective date of the Wisconsin tax law change assumed an effective tax rate of 25%, and periods subsequent to the effective date assumed an effective tax rate of 19.5%.
31
(6) The adjusted net income reconciliation for first and second quarter 2023 is as originally reported, and has not been restated to reflect the $3 million excess tax expense of those quarters that was subsequently reversed in third quarter 2023 due to the Wisconsin tax law change. Thus, the adjusted net income reconciliation for the quarters of 2023 will not sum to the full year impact.
Non-GAAP Financial Measures
We identify “tangible book value per common share,” “return on average tangible common equity,” “tangible common equity to tangible assets” “adjusted net income,” and “adjusted diluted earnings per common share” as “non-GAAP financial measures.” In accordance with the SEC’s rules, we identify certain financial measures as non-GAAP financial measures if such financial measures exclude or include amounts in the most directly comparable measures calculated and presented in accordance with generally accepted accounting principles (“GAAP”) in effect in the United States in our statements of income, balance sheets or statements of cash flows. Non-GAAP financial measures do not include operating and other statistical measures, ratios or statistical measures calculated using exclusively financial measures calculated in accordance with GAAP.
Management believes that the presentation of these non-GAAP financial measures (a) are important metrics used to analyze and evaluate our financial condition and capital strength and provide important supplemental information that contributes to a proper understanding of our operating performance and trends, (b) enables a more complete understanding of factors and trends affecting our business, and (c) allows investors to compare our financial performance to the financial performance of our peers and to evaluate our performance in a manner similar to management, the financial services industry, bank stock analysts, and bank regulators. Management uses non-GAAP measures as follows: in the preparation of our operating budgets, monthly financial performance reporting, and in our presentation to investors of our performance. However, we acknowledge that these non-GAAP financial measures have a number of limitations. Limitations associated with non-GAAP financial measures include the risk that persons might disagree as to the appropriateness of items comprising these measures and that different companies might calculate these measures differently. These disclosures should not be considered an alternative to our GAAP results. A reconciliation of non-GAAP financial measures to the most directly comparable GAAP financial measures is presented in the table above.
Performance Summary
Nicolet recognized a net income of $28 million (or earnings per diluted common share of $1.82) for first quarter 2024, compared to net income of $31 million (or earnings per diluted common share of $2.02) for fourth quarter 2023, and net loss of $9 million (or loss per diluted common share of $0.61) for first quarter 2023.
Net income reflected certain non-core items and the related tax effect of each, including the first quarter 2023 balance sheet repositioning and third quarter 2023 change in Wisconsin state tax law, as well as gains / (losses) on other assets and investments in all periods. These non-core items positively impacted earnings per diluted common share $0.10 for first quarter 2024 and $0.17 for fourth quarter 2023, and negatively impacted earnings per diluted common share $2.06 for first quarter 2023.
Nicolet’s 2023 results were significantly impacted by the first quarter 2023 balance sheet repositioning, which included the sale of $500 million (par value) U.S. Treasury held to maturity securities for a pre-tax loss of $38 million or an after-tax loss of $28 million with the net proceeds used to reduce FHLB borrowings and the remainder held in investable cash. In addition, in July 2023 a new Wisconsin tax law was signed which provided financial institutions with an exemption from state taxable income for interest, fees, and penalties earned on specific loans to existing Wisconsin-based business or agriculture purpose loans. This tax law change to Nicolet moving forward will be a reduction / elimination of State income taxes being expensed; however, it also required a $9.1 million valuation allowance to be established for the State-related deferred tax asset as of the effective date of the legislation. While both provided a drag to 2023 earnings, each also serve as a tailwind for first quarter 2024 and beyond.
•At March 31, 2024, period end assets were $8.4 billion, down slightly ($22 million) from December 31, 2023, mostly lower cash balances, partly offset by growth in loans.
•At March 31, 2024, loans were $6.4 billion, an increase of $44 million (1%) from December 31, 2023, with growth in agricultural, commercial and industrial, and residential real estate loans. For additional information regarding loans, see “BALANCE SHEET ANALYSIS — Loans.”
•Total deposits were $7.2 billion at March 31, 2024, down $32 million from December 31, 2023, mostly noninterest-bearing demand deposits. For additional information regarding deposits, see “BALANCE SHEET ANALYSIS – Deposits.”
•The net interest margin was 3.26% for first quarter 2024, 35 bps higher than the comparable 2023 period. The yield on earning assets increased 95 bps to 5.44%, while the cost of funds increased 71 bps to 3.01%. Net interest income increased $6.1 million (11%) over first quarter 2023, including a $16.7 million increase in interest income offset by a $10.6 million increase in interest expense. For additional information regarding net interest income, see “INCOME STATEMENT ANALYSIS — Net Interest Income.”
32
•Noninterest income was $19.4 million for first quarter 2024, a $41.3 million favorable change compared to first quarter 2023. Excluding net asset gains (losses), noninterest income for first quarter 2024 was $17.5 million, a $0.9 million increase over first quarter 2023. For additional information regarding noninterest income, see “INCOME STATEMENT ANALYSIS — Noninterest Income.”
•Noninterest expense was $47.1 million for first quarter 2024, an increase of $2.3 million (5%) over first quarter 2023. Personnel costs increased $2.2 million (9%), while non-personnel expenses combined increased $0.1 million compared to first quarter 2023. For additional information regarding noninterest expense, see “INCOME STATEMENT ANALYSIS — Noninterest Expense.”
INCOME STATEMENT ANALYSIS
Net Interest Income
Tax-equivalent net interest income is a non-GAAP measure, but is a preferred industry measurement of net interest income (and its use in calculating a net interest margin) as it enhances the comparability of net interest income arising from taxable and tax-exempt sources. The tax-equivalent adjustments bring tax-exempt interest to a level that would yield the same after-tax income by applying the effective Federal corporate tax rates to the underlying assets. Tables 2 and 3 present information to facilitate the review and discussion of selected average balance sheet items, tax-equivalent net interest income, interest rate spread and net interest margin.
Table 2: Average Balance Sheet and Net Interest Income Analysis - Tax-Equivalent Basis
For the Three Months Ended March 31, | |||||||||||||||||||||||||||||||||||
2024 | 2023 | ||||||||||||||||||||||||||||||||||
| (in thousands) | Average Balance | Interest | Average Yield/Rate | Average Balance | Interest | Average Yield/Rate | |||||||||||||||||||||||||||||
| ASSETS | |||||||||||||||||||||||||||||||||||
| Interest-earning assets | |||||||||||||||||||||||||||||||||||
Total loans, including loan fees (1)(2) | $ | 6,398,838 | $ | 93,744 | 5.81 | % | $ | 6,201,780 | $ | 79,186 | 5.11 | % | |||||||||||||||||||||||
| Investment securities: | |||||||||||||||||||||||||||||||||||
Taxable | 689,563 | 4,557 | 2.64 | % | 1,224,395 | 4,961 | 1.63 | % | |||||||||||||||||||||||||||
Tax-exempt (2) | 195,212 | 1,640 | 3.36 | % | 284,140 | 2,285 | 3.22 | % | |||||||||||||||||||||||||||
| Total investment securities | 884,775 | 6,197 | 2.80 | % | 1,508,535 | 7,246 | 1.93 | % | |||||||||||||||||||||||||||
| Other interest-earning assets | 345,507 | 4,588 | 5.26 | % | 120,275 | 1,536 | 5.11 | % | |||||||||||||||||||||||||||
Total non-loan earning assets | 1,230,282 | 10,785 | 3.49 | % | 1,628,810 | 8,782 | 2.16 | % | |||||||||||||||||||||||||||
Total interest-earning assets | 7,629,120 | $ | 104,529 | 5.44 | % | 7,830,590 | $ | 87,968 | 4.49 | % | |||||||||||||||||||||||||
| Other assets, net | 751,475 | 740,033 | |||||||||||||||||||||||||||||||||
Total assets | $ | 8,380,595 | $ | 8,570,623 | |||||||||||||||||||||||||||||||
| LIABILITIES AND STOCKHOLDERS’ EQUITY | |||||||||||||||||||||||||||||||||||
| Interest-bearing liabilities | |||||||||||||||||||||||||||||||||||
| Savings | $ | 758,698 | $ | 2,458 | 1.30 | % | $ | 888,979 | $ | 2,365 | 1.08 | % | |||||||||||||||||||||||
| Interest-bearing demand | 897,919 | 3,828 | 1.71 | % | 985,778 | 3,339 | 1.37 | % | |||||||||||||||||||||||||||
| Money market accounts (“MMA”) | 1,931,576 | 13,866 | 2.89 | % | 1,847,701 | 11,190 | 2.46 | % | |||||||||||||||||||||||||||
| Core time deposits | 1,076,477 | 11,104 | 4.15 | % | 602,882 | 2,693 | 1.81 | % | |||||||||||||||||||||||||||
| Total interest-bearing core deposits | 4,664,670 | 31,256 | 2.69 | % | 4,325,340 | 19,587 | 1.84 | % | |||||||||||||||||||||||||||
| Brokered deposits | 680,124 | 7,734 | 4.57 | % | 566,282 | 5,350 | 3.83 | % | |||||||||||||||||||||||||||
Total interest-bearing deposits | 5,344,794 | 38,990 | 2.93 | % | 4,891,622 | 24,937 | 2.07 | % | |||||||||||||||||||||||||||
| Wholesale funding | 165,088 | 2,234 | 5.35 | % | 499,485 | 5,718 | 4.58 | % | |||||||||||||||||||||||||||
Total interest-bearing liabilities | 5,509,882 | 41,224 | 3.01 | % | 5,391,107 | 30,655 | 2.30 | % | |||||||||||||||||||||||||||
| Noninterest-bearing demand | 1,768,177 | 2,168,640 | |||||||||||||||||||||||||||||||||
| Other liabilities | 53,940 | 40,768 | |||||||||||||||||||||||||||||||||
| Stockholders’ equity | 1,048,596 | 970,108 | |||||||||||||||||||||||||||||||||
| Total liabilities and stockholders’ equity | $ | 8,380,595 | $ | 8,570,623 | |||||||||||||||||||||||||||||||
| Net interest income and rate spread | $ | 63,305 | 2.43 | % | $ | 57,313 | 2.19 | % | |||||||||||||||||||||||||||
| Tax-equivalent adjustment & net free funds | 498 | 0.83 | % | 592 | 0.72 | % | |||||||||||||||||||||||||||||
| Net interest income and net interest margin | $ | 62,807 | 3.26 | % | $ | 56,721 | 2.91 | % | |||||||||||||||||||||||||||
(1)Nonaccrual loans and loans held for sale are included in the daily average loan balances outstanding.
(2)The yield on tax-exempt loans and tax-exempt investment securities is computed on a tax-equivalent basis using a federal tax rate of 21% and adjusted for the disallowance of interest expense.
33
Table 3: Volume/Rate Variance - Tax-Equivalent Basis
For the Three Months Ended March 31, 2024 Compared to March 31, 2023: | |||||||||||||||||
| Increase (Decrease) Due to Changes in | |||||||||||||||||
| (in thousands) | Volume | Rate | Net (1) | ||||||||||||||
| Interest-earning assets | |||||||||||||||||
Total loans, including loan fees (2) (3) | $ | 1,726 | $ | 12,832 | $ | 14,558 | |||||||||||
| Investment securities: | |||||||||||||||||
| Taxable | (1,409) | 1,005 | (404) | ||||||||||||||
Tax-exempt (3) | (743) | 98 | (645) | ||||||||||||||
| Total investment securities | (2,152) | 1,103 | (1,049) | ||||||||||||||
| Other interest-earning assets | 3,141 | (89) | 3,052 | ||||||||||||||
Total non-loan earning assets | 989 | 1,014 | 2,003 | ||||||||||||||
Total interest-earning assets | $ | 2,715 | $ | 13,846 | $ | 16,561 | |||||||||||
| Interest-bearing liabilities | |||||||||||||||||
| Savings | $ | (371) | $ | 464 | $ | 93 | |||||||||||
| Interest-bearing demand | (312) | 801 | 489 | ||||||||||||||
| MMA | 550 | 2,126 | 2,676 | ||||||||||||||
| Core time deposits | 3,183 | 5,228 | 8,411 | ||||||||||||||
| Total interest-bearing core deposits | 3,050 | 8,619 | 11,669 | ||||||||||||||
| Brokered deposits | 1,214 | 1,170 | 2,384 | ||||||||||||||
Total interest-bearing deposits | 4,264 | 9,789 | 14,053 | ||||||||||||||
| Wholesale funding | (3,524) | 40 | (3,484) | ||||||||||||||
Total interest-bearing liabilities | 740 | 9,829 | 10,569 | ||||||||||||||
| Net interest income | $ | 1,975 | $ | 4,017 | $ | 5,992 | |||||||||||
(1)The change in interest due to both rate and volume has been allocated in proportion to the relationship of dollar amounts of change in each.
(2)Nonaccrual loans and loans held for sale are included in the daily average loan balances outstanding.
(3)The yield on tax-exempt loans and tax-exempt investment securities is computed on a tax-equivalent basis using a federal tax rate of 21% and adjusted for the disallowance of interest expense.
The Federal Reserve raised short-term interest rates a total of 425 bps during 2022, increasing the Federal Funds rate to a range of 4.25% to 4.50% as of December 31, 2022. Additional increases totaling 100 bps were made during 2023, resulting in a Federal Funds range of 5.25% to 5.50% as of December 31, 2023, which remained unchanged at March 31, 2024.
Tax-equivalent net interest income was $63 million for the three months ended March 31, 2024, an increase of $6 million (10%) over the three months ended March 31, 2023. The $6 million increase in tax-equivalent net interest income was attributable to favorable volumes and favorable rates, which added $2 million and $4 million, respectively, to net interest income.
Average interest-earning assets decreased $201 million to $7.6 billion from the comparable 2023 period, primarily due to the first quarter 2023 balance sheet repositioning (as discussed in further detail under “Performance Summary” above). Between the comparable three-month periods, average loans increased $197 million (3%), on solid organic loan growth. Average investment securities decreased $624 million between the comparable three-month periods, while other interest-earning assets increased $225 million, with both attributable to the first quarter 2023 balance sheet repositioning. As a result, the mix of average interest-earning assets shifted to 84% loans, 12% investments and 4% other interest-earning assets (mostly cash) for first quarter 2024, compared to 79%, 19% and 2%, respectively, for first quarter 2023.
Average interest-bearing liabilities were $5.5 billion for first quarter 2024, an increase of $119 million (2%) over first quarter 2023. Average interest-bearing core deposits increased $339 million and average brokered deposits increased $114 million between the comparable three-month periods, reflecting growth in higher cost deposit products. Wholesale funding decreased $334 million between the comparable three-month periods, due to the first quarter 2023 balance sheet repositioning. The mix of average interest-bearing liabilities was 85% core deposits, 12% brokered deposits and 3% wholesale funding for first quarter 2024, compared to 80%, 11%, and 9%, respectively, for first quarter 2023.
The interest rate spread increased 24 bps between the comparable three-month periods, as the repricing of liabilities has slowed (with fewer interest rate increases during 2023 and none in 2024), while new and renewed loans continue to reprice in a higher interest rate environment. The interest-earning asset yield increased 95 bps to 5.44% for the first three months of 2024, due to the changing mix of interest-earning assets (noted above), as well as the higher interest rate environment. The loan yield
34
improved 70 bps to 5.81% between the comparable three-month periods, largely due to the repricing of new and renewed loans, while the yield on investment securities increased 87 bps to 2.80%. The cost of funds increased 71 bps to 3.01% for first quarter 2024, also reflecting the higher interest rate environment as well as a migration of customer deposits into higher rate deposit products. The contribution from net free funds increased 11 bps, mostly due to the higher value in the current interest rate environment. As a result, the tax-equivalent net interest margin was 3.26% for first quarter 2024, up 35 bps compared to 2.91% for first quarter 2023.
Tax-equivalent interest income was $105 million for first quarter 2024, up $17 million from the comparable period of 2023, comprised of $3 million higher volumes and $14 million higher average rates. Interest income on loans increased $15 million over first quarter 2023, due to higher rates from the rising interest rate environment, as well as solid loan growth. Interest expense increased to $41 million for first quarter 2024, up $11 million compared to first quarter 2023, mostly due to a higher cost of funds.
Provision for Credit Losses
The provision for credit losses was $0.8 million for the three months ended March 31, 2024 (entirely related to the ACL-Loans), compared to $3.1 million for the three months ended March 31, 2023 (comprised of $0.8 million related to the ACL-Loans and $2.3 million for the ACL on securities AFS). The provision for credit losses on loans was attributable to growth and changes in the underlying loan portfolio, while the 2023 provision for credit losses on securities AFS was due to the expected loss on a bank subordinated debt investment which was fully charged-off during first quarter 2023.
The provision for credit losses is predominantly a function of Nicolet’s methodology and judgment as to qualitative and quantitative factors used to determine the appropriateness of the ACL. The appropriateness of the ACL-Loans is affected by changes in the size and character of the loan portfolio, changes in levels of collateral dependent and other nonperforming loans, historical losses and delinquencies in each portfolio segment, the risk inherent in specific loans, concentrations of loans to specific borrowers or industries, existing and future economic conditions, the fair value of underlying collateral, and other factors which could affect expected credit losses. The ACL for securities is affected by risk of the underlying issuer, while the ACL for unfunded commitments is affected by many of the same factors as the ACL-Loans, as well as funding assumptions relative to lines of credit. See also Note 5, “Loans, Allowance for Credit Losses - Loans, and Credit Quality” of the Notes to Unaudited Consolidated Financial Statements under Part I, Item 1, for additional disclosures. For additional information regarding asset quality and the ACL-Loans, see “BALANCE SHEET ANALYSIS — Loans,” “— Allowance for Credit Losses - Loans,” and “— Nonperforming Assets.”
Noninterest Income
Table 4: Noninterest Income
| Three Months Ended March 31, | |||||||||||||||||||||||
| (in thousands) | 2024 | 2023 | $ Change | % Change | |||||||||||||||||||
| Trust services fee income | $ | 2,339 | $ | 2,033 | $ | 306 | 15 | % | |||||||||||||||
| Brokerage fee income | 4,146 | 3,479 | 667 | 19 | |||||||||||||||||||
| Wealth management fee income | 6,485 | 5,512 | 973 | 18 | |||||||||||||||||||
| Mortgage income, net | 1,364 | 1,466 | (102) | (7) | |||||||||||||||||||
| Service charges on deposit accounts | 1,581 | 1,480 | 101 | 7 | |||||||||||||||||||
| Card interchange income | 3,098 | 3,033 | 65 | 2 | |||||||||||||||||||
| BOLI income | 1,347 | 1,200 | 147 | 12 | |||||||||||||||||||
| Deferred compensation plan asset market valuations | 59 | 946 | (887) | N/M | |||||||||||||||||||
| LSR income, net | 1,134 | 1,155 | (21) | (2) | |||||||||||||||||||
| Other income | 2,445 | 1,832 | 613 | 33 | |||||||||||||||||||
| Subtotal | 17,513 | 16,624 | 889 | 5 | |||||||||||||||||||
| Asset gains (losses), net | 1,909 | (38,468) | 40,377 | N/M | |||||||||||||||||||
Total noninterest income | $ | 19,422 | $ | (21,844) | $ | 41,266 | (189) | % | |||||||||||||||
| N/M means not meaningful. | |||||||||||||||||||||||
Noninterest income was $19.4 million for the first three months of 2024, a favorable change of $41.3 million compared to the first three months of 2023, primarily due to the 2023 balance sheet repositioning. Excluding net asset gains (losses), noninterest income for the first three months of 2024 was $17.5 million, a $0.9 million (5%) increase over the comparable period in 2023.
35
Wealth management fee income was $6.5 million, up $1.0 million (18%) from the first three months of 2023, on growth in accounts and assets under management (up 8% from year-end 2023), including favorable market-related changes.
Mortgage income includes net gains received from the sale of residential real estate loans into the secondary market, capitalized mortgage servicing rights (“MSR”), servicing fees net of MSR amortization, fair value marks on the mortgage interest rate lock commitments and forward commitments (“mortgage derivatives”), and MSR valuation changes, if any. Net mortgage income of $1.4 million, decreased $0.1 million (7%) between the comparable three-month periods, due to changes in the MSR valuation (first quarter 2023 included a $0.5 million recovery to the MSR valuation versus none in first quarter 2024), partly offset by higher secondary market volumes and the related gains on sales. See also Note 6, “Goodwill and Other Intangibles and Servicing Rights” of the Notes to Unaudited Consolidated Financial Statements under Part I, Item 1, for additional disclosures on the MSR asset.
Other income of $2.4 million for the three months ended March 31, 2024 was up $0.6 million from the comparable 2023 period, largely due to card incentive income.
Net asset gains of $1.9 million for the first three months of 2024 were primarily attributable to a $1.0 million gain on sale of an investment security and $0.9 million gain on the early extinguishment of Nicolet subordinated notes, while net asset losses of $38.5 million for the first three months of 2023 were primarily attributable to losses on the sale of approximately $500 million (par value) U.S. Treasury held to maturity securities as part of a balance sheet repositioning.
Noninterest Expense
Table 5: Noninterest Expense
| Three Months Ended March 31, | |||||||||||||||||||||||
| ($ in thousands) | 2024 | 2023 | Change | % Change | |||||||||||||||||||
| Personnel | $ | 26,510 | $ | 24,328 | $ | 2,182 | 9 | % | |||||||||||||||
| Occupancy, equipment and office | 8,944 | 8,783 | 161 | 2 | |||||||||||||||||||
| Business development and marketing | 2,142 | 2,121 | 21 | 1 | |||||||||||||||||||
| Data processing | 4,270 | 3,988 | 282 | 7 | |||||||||||||||||||
| Intangibles amortization | 1,833 | 2,161 | (328) | (15) | |||||||||||||||||||
| FDIC assessments | 1,033 | 540 | 493 | 91 | |||||||||||||||||||
| Merger-related expense | — | 163 | (163) | (100) | |||||||||||||||||||
| Other expense | 2,415 | 2,791 | (376) | (13) | |||||||||||||||||||
Total noninterest expense | $ | 47,147 | $ | 44,875 | $ | 2,272 | 5 | % | |||||||||||||||
| Non-personnel expenses | $ | 20,637 | $ | 20,547 | $ | 90 | — | % | |||||||||||||||
| Average full-time equivalent (“FTE”) employees | 948 | 943 | 5 | 1 | % | ||||||||||||||||||
Noninterest expense was $47.1 million, an increase of $2.3 million (5%) over the first three months of 2023. Personnel costs increased $2.2 million (9%), while non-personnel expenses combined increased $0.1 million compared to the first three months of 2023.
Personnel expense was $26.5 million for the three months ended March 31, 2024, an increase of $2.2 million from the comparable period in 2023. Salary expense increased $1.0 million (5%) over the first three months of 2023, reflecting merit increases between the years, higher incentives commensurate with current period earnings, and a slightly larger employee base (with average full-time equivalent employees up 1%). Fringe benefits increased $1.2 million over the first three months of 2023, mostly due to higher overall health care expenses. Salary expense was also impacted by the change in the fair value of nonqualified deferred compensation plan liabilities. See also “Noninterest Income” for the offsetting fair value change to the nonqualified deferred compensation plan assets.
Occupancy, equipment and office expense was $8.9 million for the first three months of 2024, up $0.2 million (2%) compared to the first three months of 2023, largely due to software and technology solutions.
Data processing expense was $4.3 million, up $0.3 million (7%) between the comparable three-month periods, mostly due to volume-based increases in core, brokerage, and card processing charges.
Intangibles amortization decreased $0.3 million between the comparable three-month periods due to lower amortization from the aging intangibles.
Other expense was $2.4 million, down $0.4 million (13%) between the comparable three-month periods, mostly due to lower professional fees.
36
Income Taxes
Income tax expense was $6.5 million (effective tax rate of 19.1%) for the first three months of 2024, compared to income tax benefit of $4.2 million (effective tax rate of 32.0%) for the comparable period of 2023. The change in income tax was mostly due to the first quarter 2023 pretax loss, and also reflects the lower effective tax rate beginning in the second half of 2023 related to the Wisconsin tax law change noted above in the “Performance Summary” section.
BALANCE SHEET ANALYSIS
At March 31, 2024, period end assets were $8.4 billion, down slightly ($22 million) from December 31, 2023, mostly lower cash balances, partly offset by growth in loans. Total loans increased $44 million (1%) from December 31, 2023, with growth in agricultural, commercial and industrial, and residential real estate loans. Total deposits of $7.2 billion at March 31, 2024, decreased $32 million from December 31, 2023, mostly noninterest-bearing demand deposits. Total stockholders’ equity was $1.1 billion at March 31, 2024, an increase of $25 million over December 31, 2023, with earnings partly offset by the quarterly dividend payment.
Compared to March 31, 2023, assets increased $254 million (3%), with growth in loans and cash balances partly offset by investment securities maturities and paydowns. Total loans increased $174 million (3%), primarily in residential mortgage and agricultural loans, while total deposits increased $237 million from March 31, 2023, with growth in time and money market deposits partly offset by lower noninterest-bearing demand deposits. Stockholders’ equity increased $102 million from March 31, 2023, with solid net income and favorable net fair value investment changes partly offset by dividend payments.
Loans
Nicolet services a diverse customer base primarily throughout Wisconsin, Michigan and Minnesota. We concentrate on originating loans in our local markets and assisting current loan customers. Nicolet actively utilizes government loan programs such as those provided by the U.S. Small Business Administration (“SBA”) and the U.S. Department of Agriculture’s Farm Service Agency (“FSA”).
An active credit risk management process is used to ensure that sound and consistent credit decisions are made. The credit management process is regularly reviewed and has been modified over the past several years to further strengthen the controls. Factors that are important to managing overall credit quality are sound loan underwriting and administration, systematic monitoring of existing loans and commitments, effective loan review on an ongoing basis, early problem loan identification and remedial action to minimize losses, an appropriate ACL-Loans, and sound nonaccrual and charge-off policies.
For additional disclosures on loans, see also Note 5, “Loans, Allowance for Credit Losses - Loans, and Credit Quality,” in the Notes to Unaudited Consolidated Financial Statements under Part I, Item 1. For information regarding the allowance for credit losses and nonperforming assets see “BALANCE SHEET ANALYSIS – Allowance for Credit Losses - Loans” and “BALANCE SHEET ANALYSIS – Nonperforming Assets.” A detailed discussion of the loan portfolio accounting policies, general loan portfolio characteristics, and credit risk are described in Note 1, “Nature of Business and Significant Accounting Policies,” of the Notes to Consolidated Financial Statements, included in Part II, Item 8 of the Company’s 2023 Annual Report on Form 10-K.
37
Table 6: Period End Loan Composition
| March 31, 2024 | December 31, 2023 | March 31, 2023 | |||||||||||||||||||||||||||||||||
| (in thousands) | Amount | % of Total | Amount | % of Total | Amount | % of Total | |||||||||||||||||||||||||||||
| Commercial & industrial | $ | 1,307,490 | 20 | % | $ | 1,284,009 | 20 | % | $ | 1,330,052 | 21 | % | |||||||||||||||||||||||
| Owner-occupied CRE | 955,786 | 15 | 956,594 | 15 | 969,064 | 16 | |||||||||||||||||||||||||||||
| Agricultural | 1,190,371 | 19 | 1,161,531 | 18 | 1,065,909 | 17 | |||||||||||||||||||||||||||||
Commercial | 3,453,647 | 54 | 3,402,134 | 53 | 3,365,025 | 54 | |||||||||||||||||||||||||||||
| CRE investment | 1,188,722 | 18 | 1,142,251 | 18 | 1,146,388 | 19 | |||||||||||||||||||||||||||||
| Construction & land development | 241,730 | 4 | 310,110 | 5 | 333,370 | 5 | |||||||||||||||||||||||||||||
Commercial real estate | 1,430,452 | 22 | 1,452,361 | 23 | 1,479,758 | 24 | |||||||||||||||||||||||||||||
Commercial-based loans | 4,884,099 | 76 | 4,854,495 | 76 | 4,844,783 | 78 | |||||||||||||||||||||||||||||
| Residential construction | 84,370 | 2 | 75,726 | 1 | 134,782 | 2 | |||||||||||||||||||||||||||||
| Residential first mortgage | 1,167,069 | 18 | 1,167,109 | 19 | 1,014,166 | 16 | |||||||||||||||||||||||||||||
| Residential junior mortgage | 206,434 | 3 | 200,884 | 3 | 177,026 | 3 | |||||||||||||||||||||||||||||
Residential real estate | 1,457,873 | 23 | 1,443,719 | 23 | 1,325,974 | 21 | |||||||||||||||||||||||||||||
| Retail & other | 55,645 | 1 | 55,728 | 1 | 52,975 | 1 | |||||||||||||||||||||||||||||
Retail-based loans | 1,513,518 | 24 | 1,499,447 | 24 | 1,378,949 | 22 | |||||||||||||||||||||||||||||
| Total loans | $ | 6,397,617 | 100 | % | $ | 6,353,942 | 100 | % | $ | 6,223,732 | 100 | % | |||||||||||||||||||||||
As noted in Table 6 above, the loan portfolio at March 31, 2024, was 76% commercial-based and 24% retail-based. Commercial-based loans are considered to have more inherent risk of default than retail-based loans, in part because of the broader list of factors that could impact a commercial borrower negatively. In addition, the commercial balance per borrower is typically larger than that for retail-based loans, implying higher potential losses on an individual customer basis. Credit risk on commercial-based loans is largely influenced by general economic conditions and the resulting impact on a borrower’s operations or on the value of underlying collateral, if any.
Total loans of $6.4 billion at March 31, 2024, increased $44 million (1%) from December 31, 2023, with growth in agricultural, commercial and industrial, and residential real estate loans. At March 31, 2024, commercial and industrial loans represented the largest segment of Nicolet’s loan portfolio at 20% of the total portfolio, followed by agricultural and CRE investment at 19% and 18%, respectively, of the loan portfolio. The loan portfolio is widely diversified and included the following industries: manufacturing, wholesaling, paper, packaging, food production and processing, agriculture, forest products, hospitality, retail, service, and businesses supporting the general building industry. The following chart provides the industry distribution of our commercial loan portfolio at March 31, 2024.
| Commercial Loan Portfolio by Industry Type (based on NAICS codes) | |||||
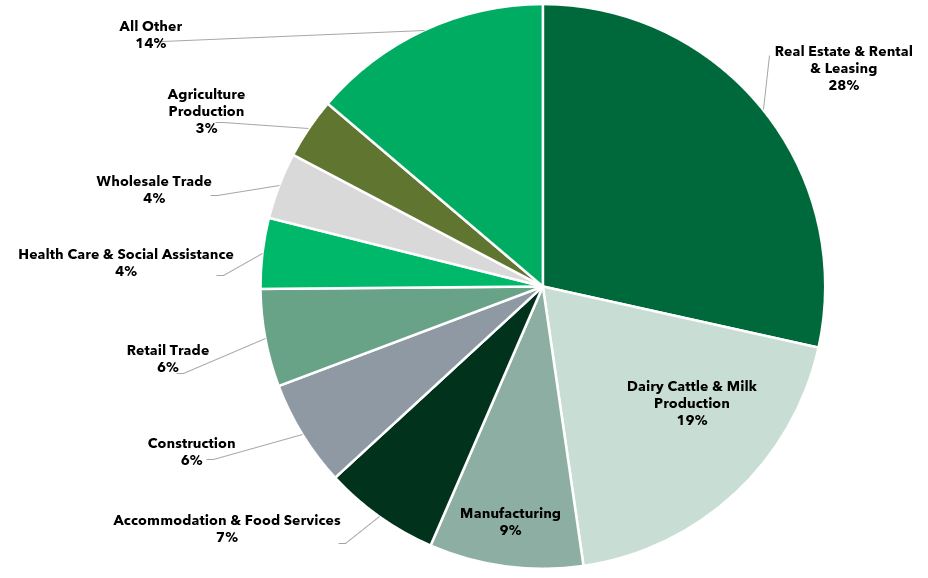
38
The following tables present the maturity distribution of the loan portfolio.
Table 7: Loan Maturity Distribution
As of March 31, 2024 | Loan Maturity | ||||||||||||||||||||||||||||
| (in thousands) | One Year or Less | After One Year to Five Years | After Five Years to Fifteen Years | After Fifteen Years | Total | ||||||||||||||||||||||||
| Commercial & industrial | $ | 488,465 | $ | 677,297 | $ | 130,152 | $ | 11,576 | $ | 1,307,490 | |||||||||||||||||||
| Owner-occupied CRE | 108,932 | 657,026 | 155,637 | 34,191 | 955,786 | ||||||||||||||||||||||||
| Agricultural | 440,731 | 371,092 | 338,745 | 39,803 | 1,190,371 | ||||||||||||||||||||||||
| CRE investment | 164,539 | 768,889 | 229,804 | 25,490 | 1,188,722 | ||||||||||||||||||||||||
| Construction & land development | 55,502 | 139,010 | 36,919 | 10,299 | 241,730 | ||||||||||||||||||||||||
| Residential construction * | 42,729 | 8,461 | 849 | 32,331 | 84,370 | ||||||||||||||||||||||||
| Residential first mortgage | 29,971 | 261,617 | 171,796 | 703,685 | 1,167,069 | ||||||||||||||||||||||||
| Residential junior mortgage | 20,616 | 16,909 | 36,286 | 132,623 | 206,434 | ||||||||||||||||||||||||
| Retail & other | 31,030 | 12,400 | 8,507 | 3,708 | 55,645 | ||||||||||||||||||||||||
| Total loans | $ | 1,382,515 | $ | 2,912,701 | $ | 1,108,695 | $ | 993,706 | $ | 6,397,617 | |||||||||||||||||||
| Percent by maturity distribution | 22 | % | 46 | % | 17 | % | 15 | % | 100 | % | |||||||||||||||||||
| Total fixed rate loans | $ | 629,377 | $ | 2,653,059 | $ | 716,811 | $ | 323,819 | $ | 4,323,066 | |||||||||||||||||||
| Total floating rate loans | $ | 753,138 | $ | 259,642 | $ | 391,884 | $ | 669,887 | $ | 2,074,551 | |||||||||||||||||||
As of December 31, 2023 | Loan Maturity | ||||||||||||||||||||||||||||
| (in thousands) | One Year or Less | After One Year to Five Years | After Five Years to Fifteen Years | After Fifteen Years | Total | ||||||||||||||||||||||||
| Commercial & industrial | $ | 444,176 | $ | 691,364 | $ | 137,823 | $ | 10,646 | $ | 1,284,009 | |||||||||||||||||||
| Owner-occupied CRE | 85,945 | 663,791 | 179,103 | 27,755 | 956,594 | ||||||||||||||||||||||||
| Agricultural | 441,792 | 335,670 | 343,717 | 40,352 | 1,161,531 | ||||||||||||||||||||||||
| CRE investment | 120,674 | 789,093 | 206,789 | 25,695 | 1,142,251 | ||||||||||||||||||||||||
| Construction & land development | 44,467 | 169,343 | 80,015 | 16,285 | 310,110 | ||||||||||||||||||||||||
| Residential construction * | 31,777 | 7,832 | 766 | 35,351 | 75,726 | ||||||||||||||||||||||||
| Residential first mortgage | 25,996 | 268,442 | 178,786 | 693,885 | 1,167,109 | ||||||||||||||||||||||||
| Residential junior mortgage | 14,709 | 18,878 | 36,548 | 130,749 | 200,884 | ||||||||||||||||||||||||
| Retail & other | 30,799 | 12,637 | 8,319 | 3,973 | 55,728 | ||||||||||||||||||||||||
| Total loans | $ | 1,240,335 | $ | 2,957,050 | $ | 1,171,866 | $ | 984,691 | $ | 6,353,942 | |||||||||||||||||||
| Percent by maturity distribution | 20 | % | 47 | % | 18 | % | 15 | % | 100 | % | |||||||||||||||||||
| Total fixed rate loans | $ | 547,023 | $ | 2,718,410 | $ | 794,080 | $ | 326,346 | $ | 4,385,859 | |||||||||||||||||||
| Total floating rate loans | $ | 693,312 | $ | 238,640 | $ | 377,786 | $ | 658,345 | $ | 1,968,083 | |||||||||||||||||||
* The residential construction loans with a loan maturity after five years represent a construction to permanent loan product.
Allowance for Credit Losses - Loans
For additional disclosures on the allowance for credit losses, see Note 5, “Loans, Allowance for Credit Losses - Loans, and Credit Quality,” in the Notes to Unaudited Consolidated Financial Statements under Part I, Item 1. A detailed discussion of the loan portfolio accounting policies, general loan portfolio characteristics, and credit risk are described in Note 1, “Nature of Business and Significant Accounting Policies,” of the Notes to Consolidated Financial Statements, included in Part II, Item 8 of the Company’s 2023 Annual Report on Form 10-K.
Credit risks within the loan portfolio are inherently different for each loan type. Credit risk is controlled and monitored through the use of lending standards, a thorough review of potential borrowers, and ongoing review of loan payment performance. Active asset quality administration, including early problem loan identification and timely resolution of problems, aids in the management of credit risk and minimization of loan losses. Loans charged off are subject to continuous review, and specific efforts are taken to achieve maximum recovery of principal, interest, and related expenses. For additional information regarding nonperforming assets see also “BALANCE SHEET ANALYSIS – Nonperforming Assets.”
The ACL-Loans represents management’s estimate of expected credit losses in the Company’s loan portfolio at the balance sheet date. To assess the overall appropriateness of the ACL-Loans, management applies an allocation methodology which focuses on evaluation of qualitative and environmental factors, including but not limited to: (i) evaluation of facts and issues related to specific loans; (ii) management’s ongoing review and grading of the loan portfolio; (iii) consideration of historical loan loss and delinquency experience on each portfolio segment; (iv) trends in past due and nonaccrual loans; (v) the risk characteristics of the various loan segments; (vi) changes in the size and character of the loan portfolio; (vii) concentrations of loans to specific borrowers or industries; (viii) existing economic conditions; (ix) the fair value of underlying collateral; and (x)
39
other qualitative and quantitative factors which could affect expected credit losses. Assessing these numerous factors involves significant judgment; therefore, management considers the ACL-Loans a critical accounting estimate.
Management allocates the ACL-Loans by pools of risk within each loan portfolio segment. The allocation methodology consists of the following components. First, a specific reserve is established for individually evaluated credit deteriorated loans, which management defines as nonaccrual credit relationships over $250,000, collateral dependent loans, purchased credit deteriorated loans, and other loans with evidence of credit deterioration. The specific reserve in the ACL-Loans for these credit deteriorated loans is equal to the aggregate collateral or discounted cash flow shortfall. Second, management allocates the ACL-Loans with historical loss rates by loan segment. The loss factors are measured on a quarterly basis and applied to each loan segment based on current loan balances and projected for their expected remaining life. Next, management allocates the ACL-Loans using the qualitative and environmental factors mentioned above. Consideration is given to those current qualitative or environmental factors that are likely to cause estimated credit losses at the evaluation date to differ from the historical loss experience of each loan segment. Lastly, management considers reasonable and supportable forecasts to assess the collectability of future cash flows.
Management performs ongoing intensive analysis of the loan portfolio to allow for early identification of customers experiencing financial difficulties, maintains prudent underwriting standards, understands the economy of its markets, and considers the trend of deterioration in loan quality in establishing the level of the ACL-Loans. In addition, various regulatory agencies periodically review the ACL-Loans, and may require the Company to make additions to the ACL-Loans or may require that certain loan balances be charged off or downgraded into classified loan categories when their credit evaluations differ from those of management based on their judgments of collectability from information available to them at the time of their examination.
At March 31, 2024, the ACL-Loans was $64 million (representing 1.01% of period end loans), minimally changed from $64 million (or 1.00% of period end loans) at December 31, 2023 and up from $62 million (or 1.00% of period end loans) at March 31, 2023. The components of the ACL-Loans are detailed further in Table 8 below.
Table 8: Allowance for Credit Losses - Loans
| Three Months Ended | Year Ended | ||||||||||||||||
| (in thousands) | March 31, 2024 | March 31, 2023 | December 31, 2023 | ||||||||||||||
| ACL-Loans: | |||||||||||||||||
| Balance at beginning of period | $ | 63,610 | $ | 61,829 | $ | 61,829 | |||||||||||
| Provision for credit losses | 750 | 750 | 2,650 | ||||||||||||||
| Charge-offs | (216) | (184) | (1,653) | ||||||||||||||
| Recoveries | 203 | 17 | 784 | ||||||||||||||
| Net (charge-offs) recoveries | (13) | (167) | (869) | ||||||||||||||
| Balance at end of period | $ | 64,347 | $ | 62,412 | $ | 63,610 | |||||||||||
| Net loan (charge-offs) recoveries: | |||||||||||||||||
| Commercial & industrial | $ | (75) | $ | (108) | $ | 80 | |||||||||||
| Owner-occupied CRE | 162 | — | (526) | ||||||||||||||
| Agricultural | — | 2 | (63) | ||||||||||||||
| CRE investment | — | — | — | ||||||||||||||
| Construction & land development | — | — | — | ||||||||||||||
| Residential construction | — | — | — | ||||||||||||||
| Residential first mortgage | — | 1 | (2) | ||||||||||||||
| Residential junior mortgage | 3 | — | (95) | ||||||||||||||
| Retail & other | (103) | (62) | (263) | ||||||||||||||
| Total net (charge-offs) recoveries | $ | (13) | $ | (167) | $ | (869) | |||||||||||
| Ratios: | |||||||||||||||||
| ACL-Loans to total loans | 1.01 | % | 1.00 | % | 1.00 | % | |||||||||||
| Net charge-offs to average loans, annualized | 0.00 | % | 0.01 | % | 0.01 | % | |||||||||||
40
Nonperforming Assets
As part of its overall credit risk management process, management is committed to an aggressive problem loan identification philosophy. This philosophy has been implemented through the ongoing monitoring and review of all pools of risk in the loan portfolio to identify problem loans early and minimize the risk of loss. For additional disclosures on credit quality, see Note 5, “Loans, Allowance for Credit Losses - Loans, and Credit Quality” of the Notes to Unaudited Consolidated Financial Statements under Part I, Item 1. For additional information on loans see “BALANCE SHEET ANALYSIS – Loans” and for additional information on the ACL-Loans see “BALANCE SHEET ANALYSIS – Allowance for Credit Losses-Loans.”
Nonperforming loans are considered one indicator of potential future loan losses. Nonperforming loans are defined as nonaccrual loans and loans 90 days or more past due but still accruing interest. Loans are generally placed on nonaccrual status when contractually past due 90 days or more as to interest or principal payments. Additionally, whenever management becomes aware of facts or circumstances that may adversely impact the collectability of principal or interest on loans, it is management’s practice to place such loans on nonaccrual status immediately. Nonperforming assets include nonperforming loans and other real estate owned (“OREO”). At March 31, 2024, nonperforming assets were $28 million and represented 0.33% of total assets, unchanged from December 31, 2023, and down from $41 million or 0.50% of total assets at March 31, 2023.
The level of potential problem loans is another predominant factor in determining the relative level of risk in the loan portfolio and in determining the appropriate level of the ACL-Loans. Potential problem loans are generally defined by management to include loans rated as Substandard by management but that are in performing status; however, there are circumstances present which might adversely affect the ability of the borrower to comply with present repayment terms. The decision of management to include performing loans in potential problem loans does not necessarily mean that Nicolet expects losses to occur, but that management recognizes a higher degree of risk associated with these loans. The loans that have been reported as potential problem loans are predominantly commercial-based loans covering a diverse range of businesses and real estate property types. Potential problem loans were $67 million (1% of loans) and $68 million (1% of loans) at March 31, 2024 and December 31, 2023, respectively. Potential problem loans require heightened management review given the pace at which a credit may deteriorate, the potential duration of asset quality stress, and uncertainty around the magnitude and scope of economic stress that may be felt by Nicolet’s customers and on underlying real estate values.
41
Table 9: Nonperforming Assets
| (in thousands) | March 31, 2024 | December 31, 2023 | March 31, 2023 | ||||||||||||||
| Nonperforming loans: | |||||||||||||||||
| Commercial & industrial | $ | 3,761 | $ | 4,046 | $ | 2,874 | |||||||||||
| Owner-occupied CRE | 4,721 | 4,399 | 7,128 | ||||||||||||||
| Agricultural | 12,418 | 12,185 | 18,782 | ||||||||||||||
| Commercial | 20,900 | 20,630 | 28,784 | ||||||||||||||
| CRE investment | 1,430 | 1,453 | 4,126 | ||||||||||||||
| Construction & land development | 10 | 161 | 748 | ||||||||||||||
| Commercial real estate | 1,440 | 1,614 | 4,874 | ||||||||||||||
| Commercial-based loans | 22,340 | 22,244 | 33,658 | ||||||||||||||
| Residential construction | — | — | — | ||||||||||||||
| Residential first mortgage | 3,983 | 4,059 | 4,986 | ||||||||||||||
| Residential junior mortgage | 171 | 150 | 196 | ||||||||||||||
| Residential real estate | 4,154 | 4,209 | 5,182 | ||||||||||||||
| Retail & other | 183 | 172 | 55 | ||||||||||||||
Retail-based loans | 4,337 | 4,381 | 5,237 | ||||||||||||||
Total nonaccrual loans | 26,677 | 26,625 | 38,895 | ||||||||||||||
| Accruing loans past due 90 days or more | — | — | — | ||||||||||||||
Total nonperforming loans | $ | 26,677 | $ | 26,625 | $ | 38,895 | |||||||||||
| Nonaccrual loans (included above) covered by guarantees | $ | 6,088 | $ | 5,785 | $ | 5,372 | |||||||||||
| OREO: | |||||||||||||||||
| Commercial real estate owned | $ | 305 | $ | 305 | $ | 628 | |||||||||||
| Residential real estate owned | 132 | 154 | — | ||||||||||||||
| Bank property real estate owned | 808 | 808 | 1,347 | ||||||||||||||
Total OREO | 1,245 | 1,267 | 1,975 | ||||||||||||||
Total nonperforming assets | $ | 27,922 | $ | 27,892 | $ | 40,870 | |||||||||||
| Ratios: | |||||||||||||||||
| Nonperforming loans to total loans | 0.42 | % | 0.42 | % | 0.62 | % | |||||||||||
| Nonperforming assets to total loans plus OREO | 0.44 | % | 0.44 | % | 0.66 | % | |||||||||||
| Nonperforming assets to total assets | 0.33 | % | 0.33 | % | 0.50 | % | |||||||||||
| ACL-Loans to nonperforming loans | 241 | % | 239 | % | 160 | % | |||||||||||
42
Deposits
Deposits represent Nicolet’s largest source of funds, which provide a stable and lower-cost funding source. Deposit levels may be impacted by competition with other bank and nonbank institutions, as well as with a number of non-deposit investment alternatives available to depositors. Deposit challenges include competitive deposit product features, price changes on deposit products given movements in the interest rate environment and other competitive pricing pressures, and customer preferences regarding higher rate deposit products or non-deposit investment alternatives.
Total deposits of $7.2 billion at March 31, 2024, decreased $32 million from December 31, 2023, mostly noninterest-bearing demand deposits from seasonal trends as well as some migration to higher rate deposit products. Core deposit balances of $6.4 billion at March 31, 2024, decreased $200 million from December 31, 2023, while brokered deposits increased $168 million. Compared to March 31, 2023, total deposits increased $237 million, the net of a $260 million increase in brokered deposits and a $23 million decrease in core deposits. The deposit composition is presented in Table 10 below.
Table 10: Period End Deposit Composition
| March 31, 2024 | December 31, 2023 | March 31, 2023 | |||||||||||||||||||||||||||||||||
| (in thousands) | Amount | % of Total | Amount | % of Total | Amount | % of Total | |||||||||||||||||||||||||||||
| Noninterest-bearing demand | $ | 1,665,229 | 23 | % | $ | 1,958,709 | 27 | % | $ | 2,094,623 | 30 | % | |||||||||||||||||||||||
| Interest-bearing demand | 1,121,030 | 16 | % | 1,055,520 | 15 | % | 1,138,415 | 17 | % | ||||||||||||||||||||||||||
| Money market | 2,027,559 | 28 | % | 1,891,287 | 26 | % | 1,886,879 | 27 | % | ||||||||||||||||||||||||||
| Savings | 765,084 | 11 | % | 768,401 | 11 | % | 865,824 | 12 | % | ||||||||||||||||||||||||||
| Time | 1,586,830 | 22 | % | 1,523,883 | 21 | % | 942,838 | 14 | % | ||||||||||||||||||||||||||
Total deposits | $ | 7,165,732 | 100 | % | $ | 7,197,800 | 100 | % | $ | 6,928,579 | 100 | % | |||||||||||||||||||||||
| Brokered transaction accounts | $ | 265,818 | 4 | % | $ | 166,861 | 2 | % | $ | 233,393 | 4 | % | |||||||||||||||||||||||
| Brokered and listed time deposits | 517,190 | 7 | % | 448,582 | 6 | % | 289,181 | 4 | % | ||||||||||||||||||||||||||
Total brokered deposits | $ | 783,008 | 11 | % | $ | 615,443 | 8 | % | $ | 522,574 | 8 | % | |||||||||||||||||||||||
| Customer transaction accounts | $ | 5,313,084 | 74 | % | $ | 5,507,056 | 77 | % | $ | 5,752,348 | 83 | % | |||||||||||||||||||||||
| Customer time deposits | 1,069,640 | 15 | % | 1,075,301 | 15 | % | 653,657 | 9 | % | ||||||||||||||||||||||||||
Total customer deposits (core) | $ | 6,382,724 | 89 | % | $ | 6,582,357 | 92 | % | $ | 6,406,005 | 92 | % | |||||||||||||||||||||||
Total estimated uninsured deposits were $2.1 billion (representing 29% of total deposits) at March 31, 2024, unchanged from $2.1 billion (representing 29% of total deposits) at December 31, 2023.
Liquidity Management
Liquidity management refers to the ability to ensure that adequate liquid funds are available to meet the current and future cash flow obligations arising in the daily operations of the Company. These cash flow obligations include the ability to meet the commitments to borrowers for extensions of credit, accommodate deposit cycles and trends, fund capital expenditures, pay dividends to stockholders (if any), and satisfy other operating expenses. The Company’s most liquid assets are cash and due from banks and interest-earning deposits, which totaled $427 million and $491 million at March 31, 2024 and December 31, 2023, respectively. Balances of these liquid assets are dependent on our operating, investing, and financing activities during any given period.
The $64 million decrease in cash and cash equivalents since year-end 2023 included $23 million net cash provided by operating activities, partly offset by $49 million net cash used in investing activities (mostly to fund loan growth) and $38 million net cash used in financing activities (mostly lower deposit balances). As of March 31, 2024, management believed that adequate liquidity existed to meet all projected cash flow obligations.
Nicolet’s primary sources of funds include the core deposit base, repayment and maturity of loans, investment securities calls, maturities, and sales, and procurement of brokered deposits or other wholesale funding. At March 31, 2024, approximately 46% of the investment securities portfolio was pledged as collateral to secure public deposits and borrowings, as applicable, and for liquidity or other purposes as required by regulation. Liquidity sources available to the Company at March 31, 2024, are presented in Table 12 below.
43
Table 12: Liquidity Sources
| (in millions) | March 31, 2024 | |||||||
FHLB Borrowing Availability (1) | $ | 622 | ||||||
| Fed Funds Lines | 175 | |||||||
| Fed Discount Window | 11 | |||||||
| Immediate Funding Availability | $ | 808 | ||||||
| Brokered Capacity | 1,008 | |||||||
| Guaranteed portion of SBA loans | 88 | |||||||
| Other funding sources | 78 | |||||||
Short-Term Funding Availability (2) | $ | 1,174 | ||||||
| Total Contingent Funding Availability | $ | 1,982 | ||||||
(1) Excludes outstanding FHLB borrowings of $5 million at March 31, 2024. | ||||||||
| (2) Short-term funding availability defined as funding that could be secured between 2 and 30 days. | ||||||||
Management is committed to the Parent Company being a source of strength to the Bank and its other subsidiaries, and therefore, regularly evaluates capital and liquidity positions of the Parent Company in light of current and projected needs, growth or strategies. The Parent Company uses cash for normal expenses, dividend payments, debt service requirements, and, when opportune, for common stock repurchases, repayment of debt, or investment in other strategic actions such as mergers or acquisitions. At March 31, 2024, the Parent Company had $85 million in cash. Additional cash sources available to the Parent Company include access to the public or private markets to issue new equity, subordinated notes or other debt. Dividends from the Bank and, to a lesser extent, stock option exercises, represent significant sources of cash flows for the Parent Company. The Bank is required by federal law to obtain prior approval of the OCC for payments of dividends if the total of all dividends declared by the Bank in any year will exceed certain thresholds. Management does not believe that regulatory restrictions on dividends from the Bank will adversely affect its ability to meet its cash obligations.
Interest Rate Sensitivity Management and Impact of Inflation
A reasonable balance between interest rate risk, credit risk, liquidity risk and maintenance of yield, is highly important to Nicolet’s business success and profitability. As an ongoing part of our financial strategy and risk management, we attempt to understand and manage the impact of fluctuations in market interest rates on our net interest income. The consolidated balance sheet consists mainly of interest-earning assets (loans, investments and cash) which are primarily funded by interest-bearing liabilities (deposits and other borrowings). Such financial instruments have varying levels of sensitivity to changes in market rates of interest. Market rates are highly sensitive to many factors beyond our control, including but not limited to general economic conditions and policies of governmental and regulatory authorities. Our operating income and net income depends, to a substantial extent, on “rate spread” (i.e., the difference between the income earned on loans, investments and other earning assets and the interest expense paid to obtain deposits and other funding liabilities).
Asset-liability management policies establish guidelines for acceptable limits on the sensitivity to changes in interest rates on earnings and market value of assets and liabilities. Such policies are set and monitored by management and the Board of Directors’ Asset and Liability Committee.
To understand and manage the impact of fluctuations in market interest rates on net interest income, we measure our overall interest rate sensitivity through a net interest income analysis, which calculates the change in net interest income in the event of hypothetical changes in interest rates under different scenarios versus a baseline scenario. Such scenarios can involve static balance sheets, balance sheets with projected growth, parallel (or non-parallel) yield curve slope changes, immediate or gradual changes in market interest rates, and one-year or longer time horizons. The simulation modeling uses assumptions involving market spreads, prepayments of rate-sensitive instruments, renewal rates on maturing or new loans, deposit retention rates, and other assumptions.
Among other scenarios, we assessed the impact on net interest income in the event of a gradual +/-100 bps and +/-200 bps change in market rates (parallel to the change in prime rate) over a one-year time horizon to a static (flat) balance sheet. The results provided include the liquidity measures mentioned above and reflect the current interest rate environment. The interest rate scenarios are used for analytical purposes only and do not necessarily represent management’s view of future market interest rate movements. Based on financial data at March 31, 2024 and December 31, 2023, the projected changes in net interest income over a one-year time horizon, versus the baseline, are presented in Table 13 below, and reflect a shift from an asset sensitive position to a liability sensitive position due to the deposit mix shift to higher cost deposit products that are more sensitive to changes in interest rates. The results are in compliance with Nicolet’s policy guidelines.
44
Table 13: Interest Rate Sensitivity
| March 31, 2024 | December 31, 2023 | ||||||||||
| 200 bps decrease in interest rates | 0.6 | % | (1.1) | % | |||||||
| 100 bps decrease in interest rates | 0.3 | % | (0.6) | % | |||||||
| 100 bps increase in interest rates | (0.3) | % | 0.6 | % | |||||||
| 200 bps increase in interest rates | (0.5) | % | 1.2 | % | |||||||
Actual results may differ from these simulated results due to timing, magnitude and frequency of interest rate changes, as well as changes in market conditions and their impact on customer behavior and management strategies.
The effect of inflation on a financial institution differs significantly from the effect on an industrial company. While a financial institution’s operating expenses, particularly salary and employee benefits, are affected by general inflation, the asset and liability structure of a financial institution consists largely of monetary items. Monetary items, such as cash, investments, loans, deposits and other borrowings, are those assets and liabilities which are or will be converted into a fixed number of dollars regardless of changes in prices. As a result, changes in interest rates have a more significant impact on a financial institution’s performance than does general inflation. Inflation may also have impacts on the Bank’s customers, on businesses and consumers and their ability or willingness to invest, save or spend, and perhaps on their ability to repay loans. As such, there would likely be impacts on the general appetite for banking products and the credit health of the Bank’s customer base.
Capital
Management regularly reviews the adequacy of its capital to ensure that sufficient capital is available for current and future needs and is in compliance with regulatory guidelines. The capital position and strategies are actively reviewed in light of perceived business risks associated with current and prospective earning levels, liquidity, asset quality, economic conditions in the markets served, and level of returns available to shareholders. Management intends to maintain an optimal capital and leverage mix for growth and shareholder return. For details on the change in capital see “BALANCE SHEET ANALYSIS.”
The Company’s and the Bank’s regulatory capital ratios remain above minimum regulatory ratios, including the capital conservation buffer. At March 31, 2024, the Bank’s regulatory capital ratios qualify the Bank as well-capitalized under the prompt-corrective action framework. This strong base of capital has allowed Nicolet to be opportunistic in strategic growth. A summary of the Company’s and the Bank’s regulatory capital amounts and ratios, as well as selected capital metrics are presented in the following table.
45
Table 14: Capital
At or for the Three Months Ended | At or for the Year Ended | ||||||||||
| ($ in thousands) | March 31, 2024 | December 31, 2023 | |||||||||
| Company Stock Repurchases: * | |||||||||||
| Common stock repurchased during the period (dollars) | $ | — | $ | 1,519 | |||||||
| Common stock repurchased during the period (full shares) | — | 26,853 | |||||||||
| Company Risk-Based Capital: | |||||||||||
| Total risk-based capital | $ | 955,514 | $ | 930,804 | |||||||
| Tier 1 risk-based capital | 775,693 | 750,811 | |||||||||
| Common equity Tier 1 capital | 736,714 | 712,040 | |||||||||
| Total capital ratio | 13.3 | % | 13.0 | % | |||||||
| Tier 1 capital ratio | 10.8 | % | 10.5 | % | |||||||
| Common equity tier 1 capital ratio | 10.2 | % | 9.9 | % | |||||||
| Tier 1 leverage ratio | 9.6 | % | 9.2 | % | |||||||
| Bank Risk-Based Capital: | |||||||||||
| Total risk-based capital | $ | 859,098 | $ | 827,341 | |||||||
| Tier 1 risk-based capital | 795,774 | 768,726 | |||||||||
| Common equity Tier 1 capital | 795,774 | 768,726 | |||||||||
| Total capital ratio | 12.0 | % | 11.5 | % | |||||||
| Tier 1 capital ratio | 11.1 | % | 10.7 | % | |||||||
| Common equity tier 1 capital ratio | 11.1 | % | 10.7 | % | |||||||
| Tier 1 leverage ratio | 9.9 | % | 9.4 | % | |||||||
| * Reflects common stock repurchased under board of director authorizations for the common stock repurchase program. | |||||||||||
Critical Accounting Estimates
The preparation of financial statements in conformity with U.S. GAAP requires management to make estimates, assumptions or judgments that affect the amounts reported in the financial statements and accompanying notes. These estimates and assumptions are based on historical experience, current information, and other factors deemed to be relevant; accordingly, as this information changes, actual results could differ from those estimates. Nicolet considers accounting estimates to be critical to reported financial results if the accounting estimate requires management to make assumptions about matters that are highly uncertain and different estimates that management reasonably could have used for the accounting estimate in the current period, or changes in the accounting estimate that are reasonably likely to occur from period to period, could have a material impact on the financial statements. The accounting estimates we consider to be critical include business combinations and the valuation of loans acquired, the determination of the allowance for credit losses, and income taxes. A discussion of these estimates can be found in the “Critical Accounting Estimates” section in Management’s Discussion and Analysis of Financial Condition and Results of Operations included in the Company’s 2023 Annual Report on Form 10-K. There have been no changes in the Company’s determination of critical accounting policies and estimates since December 31, 2023.
ITEM 3. QUANTITATIVE AND QUALITATIVE DISCLOSURES ABOUT MARKET RISK
There have been no material changes in our market risk at March 31, 2024, from that presented in our 2023 Annual Report on Form 10-K. See section “Interest Rate Sensitivity Management and Impact of Inflation” within Management’s Discussion and Analysis of Financial Condition and Results of Operations under Part I, Item 2, for our interest rate sensitivity position at March 31, 2024.
46
ITEM 4. CONTROLS AND PROCEDURES
(a) Disclosure Controls and Procedures. Management, under the supervision, and with the participation, of our principal executive officer and principal financial officer, evaluated our disclosure controls and procedures (as such term is defined in Exchange Act Rule 13a-15(e)). Based upon that evaluation, our principal executive officer and principal financial officer concluded that our disclosure controls and procedures were effective as of the end of the period covered by this report.
(b) Changes in Internal Control Over Financial Reporting. There were no changes in the Company’s internal control over financial reporting (as such term is defined in Exchange Act Rule 13a-15(f)) during the quarter covered by this report that have materially affected, or are reasonably likely to materially affect, the Company’s internal control over financial reporting.
PART II – OTHER INFORMATION
ITEM 1. LEGAL PROCEEDINGS
The Company and its subsidiaries may be involved from time to time in various routine legal proceedings incidental to our respective businesses. Neither the Company nor any of its subsidiaries are currently engaged in any legal proceedings that are expected to have a material adverse effect on our results of operations or financial position.
ITEM 1A. RISK FACTORS
There have been no material changes in the risk factors previously disclosed in the Company’s Annual Report on Form 10-K for the year ended December 31, 2023.
ITEM 2. UNREGISTERED SALES OF EQUITY SECURITIES AND USE OF PROCEEDS
Issuer Purchases of Equity Securities
The following table contains information regarding purchases of Nicolet’s common stock made during first quarter 2024 by or on behalf of the Company or any “affiliated purchaser,” as defined by Rule 10b-18(a)(3) of the Exchange Act.
Total Number of Shares Purchased (a) | Average Price Paid per Share | Total Number of Shares Purchased as Part of Publicly Announced Plans or Programs | Maximum Number of Shares that May Yet Be Purchased Under the Plans or Programs (b) | ||||||||||||||||||||
| (#) | ($) | (#) | (#) | ||||||||||||||||||||
| Period | |||||||||||||||||||||||
| January 1 – January 31, 2024 | 360 | $ | 80.74 | — | |||||||||||||||||||
| February 1 – February 29, 2024 | — | $ | — | — | |||||||||||||||||||
| March 1 – March 31, 2024 | 946 | $ | 84.77 | — | |||||||||||||||||||
| Total | 1,306 | $ | 83.66 | — | 535,000 | ||||||||||||||||||
a.During first quarter 2024, the Company withheld 175 common shares for minimum tax withholding settlements on restricted stock, and withheld 1,131 common shares to satisfy the exercise price and tax withholding requirements on stock option exercises. These are not considered “repurchases” and, therefore, do not count against the maximum number of shares that may yet be purchased under the Board of Directors’ authorization.
b.The Board of Directors approved a common stock repurchase program which authorized, with subsequent modifications, the use of up to $276 million to repurchase outstanding shares of common stock. This common stock repurchase program was last modified on April 19, 2022, and has no expiration date. There were no common stock repurchases under this program during first quarter 2024. At March 31, 2024, approximately $46 million remained available under this common stock repurchase program, or approximately 535,000 shares of common stock (based upon the closing stock price of $85.99 on March 31, 2024).
ITEM 3. DEFAULTS UPON SENIOR SECURITIES
None.
ITEM 4. MINE SAFETY DISCLOSURES
Not applicable.
47
ITEM 5. OTHER INFORMATION
Rule 10b5-1 and Non-Rule 10b5-1 Trading Arrangements: None
ITEM 6. EXHIBITS
The following exhibits are filed herewith:
| Exhibit Number | Description | |||||||
| 10.1 | ||||||||
| 10.2 | ||||||||
| 31.1 | ||||||||
| 31.2 | ||||||||
| 32.1 | ||||||||
| 32.2 | ||||||||
| 101 | Interactive data files for Nicolet Bankshares, Inc.’s Quarterly Report on Form 10-Q for the quarter ended March 31, 2024, formatted in Inline XBRL: (i) the Consolidated Balance Sheets (unaudited), (ii) the Consolidated Statements of Income (Loss) (unaudited), (iii) the Consolidated Statements of Comprehensive Income (Loss) (unaudited), (iv) the Consolidated Statements of Stockholders’ Equity (unaudited), (v) the Consolidated Statements of Cash Flows (unaudited), and (vi) Notes to Unaudited Consolidated Financial Statements. | |||||||
| 104 | Cover Page from Nicolet Bankshares, Inc.’s Quarterly Report on Form 10-Q for the quarter ended March 31, 2024 (formatted in Inline XBRL and contained in Exhibit 101) | |||||||
(1) Incorporated by reference to Exhibit 10.15 in the Registrant’s Annual Report on Form 10-K for the fiscal year ended December 31, 2023, filed on February 28, 2024 (File No. 001-37700).
(2) Incorporated by reference to Exhibit 10.17 in the Registrant’s Annual Report on Form 10-K for the fiscal year ended December 31, 2023, filed on February 28, 2024 (File No. 001-37700).
48
SIGNATURES
Pursuant to the requirements of the Securities Exchange Act of 1934, the registrant has duly caused this report to be signed on its behalf by the undersigned thereunto duly authorized.
| NICOLET BANKSHARES, INC. | |||||
| May 8, 2024 | /s/ Michael E. Daniels | ||||
| Michael E. Daniels | |||||
| Chairman, President, and Chief Executive Officer | |||||
| May 8, 2024 | /s/ H. Phillip Moore, Jr. | ||||
| H. Phillip Moore, Jr. | |||||
| Chief Financial Officer | |||||
49