
Nokia Annual Report
on Form 20-F 2023
As filed with the Securities and Exchange Commission on 29 February 2024
UNITED STATES
SECURITIES AND EXCHANGE COMMISSION
Washington, D.C. 20549
FORM 20-F
ANNUAL REPORT PURSUANT TO SECTION 13 OR 15(d) OF THE
SECURITIES EXCHANGE ACT OF 1934
For the fiscal year ended 31 December 2023
Commission file number 1-13202
(Exact name of Registrant as specified in its charter)
Republic of Finland
(Jurisdiction of incorporation)
(Address of principal executive offices)
(Name, Telephone, E-mail and/or Facsimile number and Address of Company Contact Person)
Securities registered pursuant to Section 12(b) of the Securities Exchange Act of 1934 (the “Exchange Act”):
Title of each class | Trading Symbol(s) | Name of each exchange on which registered |
(1) Not for trading, but only in connection with the registration of American Depositary Shares representing these shares, pursuant to the requirements of the Securities and Exchange Commission.
Securities registered pursuant to Section 12(g) of the Exchange Act: None
Securities for which there is a reporting obligation pursuant to Section 15(d) of the Exchange Act: None
Indicate the number of outstanding shares of each of the registrant’s classes of capital or common stock as of the close of the period covered by the annual report. Shares: 5 613 496 565 .
Indicate by check mark if the registrant is a well-known seasoned issuer, as defined in Rule 405 of the Securities Act. | No ☐ | |
If this report is an annual or transition report, indicate by check mark if the registrant is not required to file reports pursuant to Section 13 or 15(d) of the Exchange Act. | Yes ☐ | |
Indicate by check mark whether the registrant: (1) has filed all reports required to be filed by Section 13 or 15(d) of the Exchange Act during the preceding 12 months (or for such shorter period that the registrant was required to file such reports), and (2) has been subject to such filing requirements for the past 90 days. | No ☐ | |
Indicate by check mark whether the registrant has submitted electronically every Interactive Data File required to be submitted pursuant to Rule 405 of Regulation S-T (§232.405 of this chapter) during the preceding 12 months (or for such shorter period that the registrant was required to submit such files). | No ☐ | |
Indicate by check mark whether the registrant is a large accelerated filer, an accelerated filer, a non-accelerated filer, a smaller reporting company, or an emerging growth company. See the definitions of “large accelerated filer,” “accelerated filer,” “smaller reporting company” or “emerging growth company” in Rule 12b-2 of the Exchange Act. (Check one): |
Accelerated filer ☐ | |
Non-accelerated filer ☐ | Smaller reporting company ☐ |
Indicate by check mark whether the registrant has filed a report on and attestation to its management’s assessment of the effectiveness of its internal control over financial reporting under Section 404(b) of the Sarbanes Oxley Act (15 U.S.C. 7262(b)) by the registered public accounting firm that prepared or issued its audit report. | |
If securities are registered pursuant to Section 12(b) of the Act, indicate by check mark whether the financial statements of the registrant included in the filing reflect the correction of an error to previously issued financial statements. | |
Indicate by check mark whether any of those error corrections are restatements that required a recovery analysis of incentive-based compensation received by any of the registrant’s executive officers during the relevant recovery period pursuant to §240.10D-1(b). | ☐ |
Indicate by check mark which basis of accounting the registrant has used to prepare the financial statements included in this filing: |
U.S. GAAP ☐ | |
Other ☐ |
If “Other” has been checked in response to the previous question, indicate by check mark which financial statement item the registrant has elected to follow. | Item 17 ☐ | Item 18 ☐ |
If this is an annual report, indicate by check mark whether the registrant is a shell company (as defined in Rule 12b-2 of the Exchange Act). | Yes ☐ |
Form 20-F Item Number | Form 20-F Heading | Section in Document | |
ITEM | 1 | IDENTITY OF DIRECTORS, SENIOR MANAGEMENT AND ADVISERS | N/A |
ITEM | 2 | OFFER STATISTICS AND EXPECTED TIMETABLE | N/A |
ITEM | 3 | KEY INFORMATION | |
3A | [Reserved] | ||
3B | Capitalization and Indebtedness | N/A | |
3C | Reasons for the Offer and Use of Proceeds | N/A | |
3D | Risk Factors | Operating and financial review and prospects—Risk factors | |
ITEM | 4 | INFORMATION ON THE COMPANY | |
4A | History and Development of the Company | Cover page; Business overview; Introduction and use of certain terms; Business overview—Our history; Operating and financial review and prospects—Liquidity and capital resources; General Facts on Nokia—Alternative performance measures; Operating and financial review and prospects—Significant subsequent events; Other information— Investor information | |
4B | Business Overview | Business overview—Nokia in 2023; Business overview—Our strategy; Business Overview—Our business groups; Financial statements—Notes to the consolidated financial statements—Note 2.2. Segment information; General facts on Nokia—Government regulation | |
4C | Organizational Structure | Business overview—Nokia in 2023; Financial statements—Notes to the consolidated financial statements—Note 2.2. Segment information; Financial statements—Notes to the consolidated financial statements—Note 6.2. Principal Group companies; Financial statements—Notes to the consolidated financial statements—Note 6.3. Significant partly-owned subsidiaries | |
4D | Property, Plants and Equipment | Financial statements—Notes to the consolidated financial statements—Note 4.2. Property, plant and equipment; Financial statements—Notes to the consolidated financial statements—Note 4.3. Leases; Business overview—Supply chain, sourcing and manufacturing | |
4A | UNRESOLVED STAFF COMMENTS | None | |
ITEM | 5 | OPERATING AND FINANCIAL REVIEW AND PROSPECTS | |
5A | Operating Results | Business overview—Our strategy; General facts on Nokia—Government regulation; Financial statements—Notes to the consolidated financial statements—Section 2. Results for the year; Financial statements—Notes to the consolidated financial statements—Note 5.4. Financial risk management; Operating and financial review and prospects— Operating and financial review | |
5B | Liquidity and Capital Resources | Operating and financial review and prospects—Liquidity and capital resources; Financial statements—Notes to the consolidated financial statements—Note 5.2. Financial assets and liabilities; Financial statements—Notes to the consolidated financial statements—Note 5.3. Derivative and firm commitment assets and liabilities; Financial statements—Notes to the consolidated financial statements—Note 6.1. Commitments, contingencies and legal proceedings; Financial statements—Notes to the consolidated financial statements—Note 5.4. Financial risk management | |
5C | Research and Development, Patents and Licenses etc. | Business overview—Our strategy; Business overview—Nokia Technologies; Operating and financial review and prospects—Results of operations; Operating and financial review and prospects—Results of segments | |
5D | Trend Information | Business overview—Nokia in 2023; Business overview—Our strategy | |
5E | Critical Accounting Estimates | N/A | |
ITEM | 6 | DIRECTORS, SENIOR MANAGEMENT AND EMPLOYEES | |
6A | Directors and senior management | Corporate governance—Corporate Governance Statement | |
6B | Compensation | Corporate governance—Compensation; Financial statements—Notes to the consolidated financial statements—Note 6.4. Related party transactions; Corporate Governance —Remuneration; Financial Statements—Notes to the consolidated financial statements—Note 3.2. Remuneration of key management | |
6C | Board Practices | Corporate governance—Corporate governance statement; Corporate governance—Remuneration—Remuneration governance | |
6D | Employees | Operating and financial review and prospects—Sustainability and corporate responsibility | |
6E | Share Ownership | Business Overview—Nokia in 2023; Corporate governance—Remuneration—Remuneration Report 2023; Corporate governance—Corporate governance statement; Financial statements—Notes to the consolidated financial statements—Note 3.3. Share-based payments | |
Cross-reference table to Form 20-F
Form 20-F Item Number | Form 20-F Heading | Section in Document | |
6F | Disclosure of a registrant’s action to recover erroneously awarded compensation | N/A | |
ITEM | 7 | MAJOR SHAREHOLDERS AND RELATED PARTY TRANSACTIONS | |
7A | Major Shareholders | Operating and financial review and prospects—Shares and shareholders | |
7B | Related Party Transactions | Financial statements—Notes to the consolidated financial statements—Note 6.4. Related party transactions | |
7C | Interests of Experts and Counsel | N/A | |
ITEM | 8 | FINANCIAL INFORMATION | |
8A | Consolidated Statements and Other Financial Information | Financial statements; Reports of independent registered public accounting firm; Operating and financial review and prospects—Shares and shareholders—Dividend and share buybacks; Financial statements—Notes to the consolidated financial statements—Note 6.1. Commitments, contingencies and legal proceedings | |
8B | Significant Changes | Operating and financial review and prospects—Significant subsequent events; Financial statements—Notes to the consolidated financial statements—Notes 6.5. Subsequent events | |
ITEM | 9 | THE OFFER AND LISTING | |
9A | Offer and Listing Details | Operating and financial review and prospects—Shares and shareholders; Other information—Investor information—Stock exchanges | |
9B | Plan of Distribution | N/A | |
9C | Markets | Operating and financial review and prospects—Shares and shareholders; Financial statements—Notes to the consolidated financial statements—Note 1.1. Corporate information; Investor information; Other information—Investor information—Stock exchanges | |
9D | Selling Shareholders | N/A | |
9E | Dilution | N/A | |
9F | Expenses of the Issue | N/A | |
ITEM | 10 | ADDITIONAL INFORMATION | |
10A | Share capital | N/A | |
10B | Memorandum and Articles of Association | Operating and financial review and prospects—Articles of Association; Other information—Exhibits | |
10C | Material Contracts | N/A | |
10D | Exchange Controls | General facts on Nokia—Controls and procedures—Exchange controls | |
10E | Taxation | General facts on Nokia—Taxation | |
10F | Dividends and Paying Agents | N/A | |
10G | Statement by Experts | N/A | |
10H | Documents on Display | Other information—Investor information—Documents on display | |
10I | Subsidiary Information | N/A | |
ITEM | 11 | QUANTITATIVE AND QUALITATIVE DISCLOSURES ABOUT MARKET RISK | Business overview—Our strategy; Operating and financial review and prospects—Risk factors—Financial and tax-related uncertainties; Financial statements—Notes to the consolidated financial statements—Note 5.4. Financial risk management; Financial statements—Notes to the consolidated financial statements—Note 4.5. Trade receivables and other customer-related balances |
ITEM | 12 | DESCRIPTION OF SECURITIES OTHER THAN EQUITY SECURITIES | |
12A | Debt Securities | N/A | |
12B | Warrants and Rights | N/A | |
12C | Other Securities | N/A | |
12D | American Depositary Shares | General facts on Nokia—American Depositary Shares; Introduction and use of certain terms | |
ITEM | 13 | DEFAULTS, DIVIDEND ARREARAGES AND DELINQUENCIES | None |
Form 20-F Item Number | Form 20-F Heading | Section in Document | |
ITEM | 14 | MATERIAL MODIFICATIONS TO THE RIGHTS OF SECURITY HOLDERS AND USE OF PROCEEDS | None |
ITEM | 15 | CONTROLS AND PROCEDURES | Corporate governance—Corporate governance statement—Risk management, internal control and internal audit functions at Nokia; General facts on Nokia—Controls and procedures |
ITEM | 16 | [Reserved] | |
16A | AUDIT COMMITTEE FINANCIAL EXPERT | Corporate governance—Corporate governance statement—Board of Directors—Committees of the Board of Directors | |
16B | CODE OF ETHICS | Corporate governance—Corporate governance statement—Regulatory Framework; Operating and financial review and prospects—Sustainability and corporate responsibility; Other information—Exhibits | |
16C | PRINCIPAL ACCOUNTANT FEES AND SERVICES | Corporate governance—Corporate governance statement—Auditor fees and services; Corporate governance—Corporate governance statement—Audit Committee pre- approval policies and procedures | |
16D | EXEMPTIONS FROM THE LISTING STANDARDS FOR AUDIT COMMITTEES | None | |
16E | PURCHASES OF EQUITY SECURITIES BY THE ISSUER AND AFFILIATED PURCHASERS | Operating and financial review and prospects—Shares and shareholders—Purchases of equity securities by the Company and affiliated purchasers Corporate Governance—Compensation | |
16F | CHANGE IN REGISTRANT’S CERTIFYING ACCOUNTANT | N/A | |
16G | CORPORATE GOVERNANCE | Corporate governance—Corporate governance statement—Regulatory framework | |
16H | MINE SAFETY DISCLOSURE | None | |
16I | DISCLOSURE REGARDING FOREIGN JURISDICTIONS THAT PREVENT INSPECTIONS | N/A | |
16J | INSIDER TRADING POLICIES | N/A | |
16K | CYBERSECURITY | Corporate governance—Corporate Governance Statement—Risk management, internal control and internal audit functions at Nokia; Operating and financial review and prospects—Risk factors—Risks impacting our competitiveness | |
ITEM | 17 | FINANCIAL STATEMENTS | Financial statements |
ITEM | 18 | FINANCIAL STATEMENTS | Financial statements |
ITEM | 19 | EXHIBITS | Other information—Exhibits |
Certain statements contained in this report constitute
“forward-looking statements.” Forward-looking statements
provide Nokia's current expectations of future events and
trends based on certain assumptions and include any
statement that does not directly relate to any current or
historical fact. The words “believe,” “expect,” “expectations,”
“anticipate,” “foresee,” “see,” “target,” “estimate,” “designed,”
“aim,” “plan,” “intend,” “influence,” “assumption,” “focus,”
“continue,” “project,” “should," "is to," "will,” "strive," "may,”
"could,” “forecast,” or similar expressions as they relate to us
or our management are intended to identify these forward-
looking statements, as well as statements regarding:
a)business strategies, projects, market expansion, growth
management, and future industry trends and megatrends
and our plans to address them;
b)future performance of our businesses and any future
distributions and dividends;
c)expectations and targets regarding financial performance,
results, operating expenses, cash flows, taxes, currency
exchange rates, hedging, cost savings and competitiveness,
as well as results of operations including targeted synergies
and those related to market share, prices, net sales, income
and margins;
d)expectations, plans, timelines or benefits related to changes
in our organizational and operational structure;
e)market developments in our current and future markets
and their seasonality and cyclicality, including the
communications service provider market, as well as general
economic conditions, future regulatory developments and
the expected impact, timing and duration of potential global
pandemics and geopolitical conflicts on our businesses, our
supply chain, our customers’ businesses and the general
market and economic conditions;
f)our position in the market, including product portfolio
and geographical reach, and our ability to use the same
to develop the relevant business or market and maintain
our order pipeline over time;
g)any future collaboration or business collaboration
agreements or patent license agreements or arbitration
awards, including income from any collaboration or
partnership, agreement or award;
h)timing of the development and delivery of our products
and services;
i)the outcome of pending and threatened litigation,
arbitration, disputes, regulatory proceedings or
investigations by authorities;
j)restructurings, investments, capital structure optimization
efforts, divestments and our ability to achieve the financial
and operational targets set in connection with any such
restructurings, investments, and capital structure
optimization efforts including our ongoing cost savings
program;
k)future capital expenditures, temporary incremental
expenditures or other R&D expenditures to develop or
rollout new products; and
l)sustainability and corporate responsibility.
These statements are based on management’s best
assumptions and beliefs in light of the information currently
available to it and are subject to a number of risks and
uncertainties, many of which are beyond our control, which
could cause actual results to differ materially from such
statements. These statements are only predictions based upon
our current expectations and views of future events and
developments and are subject to risks and uncertainties that
are difficult to predict because they relate to events and
depend on circumstances that will occur in the future. Risks
and uncertainties that could affect these statements include
but are not limited to the risk factors specified under the
section “Risk factors” of this report and in our other filings or
documents furnished with the U.S. Securities and Exchange
Commission. Other unknown or unpredictable factors or
underlying assumptions subsequently proven to be incorrect
could cause actual results to differ materially from those
in the forward-looking statements. We do not undertake
any obligation to publicly update or revise forward-looking
statements, whether as a result of new information, future
events or otherwise, except to the extent legally required.
Forward-looking statements
Nokia Corporation is a public limited liability company
incorporated under the laws of the Republic of Finland and
registered to the Finnish Trade Register since 1896. In this
Annual Report on Form 20-F, any reference to “we,” “us,” “the
Group,” “the company” or “Nokia” means Nokia Corporation
and its consolidated subsidiaries and generally Nokia’s
continuing operations, except where we separately specify that
the term means Nokia Corporation or a particular subsidiary
or business segment only or our discontinued operations.
References to “our shares,” matters relating to our shares or
matters of corporate governance refer to the shares and
corporate governance of Nokia Corporation.
Nokia Corporation has published its consolidated financial
statements in euro for periods beginning on or after 1 January
1999. In this Annual Report on Form 20-F, references to “EUR,”
“euro” or “€” are to the common currency of the European
Economic and Monetary Union, references to “dollars,” “US
dollars,” “USD” or “$” are to the currency of the United States,
and references to “Chinese yuan” or “Chinese yuan renminbi”
or “CNY” are to the official currency of the People’s Republic
of China.
Additional terms are defined in the "Glossary."
The information contained in, or accessible through, the
websites linked throughout this Annual Report on Form 20-F is
not incorporated by reference into this document and should
not be considered a part of this document.
Nokia Corporation furnishes Citibank, N.A., as Depositary,
with its consolidated financial statements and a related audit
opinion of our independent auditors annually. These financial
statements are prepared on the basis of International Financial
Reporting Standards (IFRS) as issued by the International
Accounting Standards Board and in conformity with IFRS as
adopted by the European Union. In accordance with the
rules and regulations of the SEC, we do not provide a
reconciliation of our consolidated financial statements to the
generally accepted accounting principles in the US, or US GAAP.
We also furnish the Depositary with quarterly reports
containing unaudited financial information prepared on the
basis of IFRS, as well as all notices of shareholders’ meetings
and other reports and communications that are made available
generally to our shareholders. The Depositary makes these
notices, reports and communications available for inspection
by record holders of American Depositary Receipts (ADRs),
evidencing American Depositary Shares (ADSs), and distributes
to all record holders of ADR notices of shareholders’ meetings
received by the Depositary.
In addition to the materials delivered to holders of ADRs by
the Depositary, holders can access our consolidated financial
statements, and other information included in our annual
reports and proxy materials, at nokia.com/financials. This
Annual Report on Form 20-F is also available at nokia.com/
financials as well as on Citibank’s website at https://
app.irdirect.net/company/49733/hotline/. Holders may also
request a hard copy of this annual report by calling the toll-free
number 1-877-NOKIA-ADR (1-877-665-4223), or by directing a
written request to Citibank, N.A., Shareholder Services, PO Box
43077, Providence, RI 02940-3081, United States. With each
annual distribution of our proxy materials, we offer our record
holders of ADRs the option of receiving all of these documents
electronically in the future.
Introduction and use of certain terms

In this report
Our customers | |
Contents | 1 | ||||||||||||
Nokia Annual Report on Form 20-F 2023

Business
overview
Business overview | Corporate governance | Operating and financial review and prospects | General facts on Nokia | Financial statements | Other information | 2 | |||||||
Nokia Annual Report on Form 20-F 2023

Business overview | Corporate governance | Operating and financial review and prospects | General facts on Nokia | Financial statements | Other information | 3 | |||||||
Nokia in 2023
Nokia Annual Report on Form 20-F 2023
The platform
for our future
The Nokia platform guides everything we do across our
global organization. Its three elements shape our ambition,
our strategy and our culture.
Our purpose
At Nokia, we create technology that helps the world act together.
While our lives may be getting longer, healthier and richer, the world is facing
fundamental challenges: Productivity is stalling, pressure on the planet is increasing
and access to opportunity remains stubbornly unequal.
Digitalization is central to the solution.
We see the potential of digital to transform business, industry and society. When the
world’s organizations, machines and devices are in sync with each other and the
people they serve, a new capability unfolds to create a more productive, sustainable
and accessible future.
Our commitment
We are delivering the next evolution in critical networking through technology
leadership and trusted partnerships.
We are meeting the new demands placed on networks through the next evolution of
networking where networks meet cloud with ‘networks that sense, think and act’.
These networks go beyond connecting people and things, bits and bytes. They’re
adaptable, autonomous, and consumable. They’re ‘alive with intelligence’ and enable
people, machines and devices to interact in real time, like never before.
Critically, ‘networks that sense, think and act’ are creating new opportunities for our
customers and partners, both existing and new, to access and harness the full power
of networking like never before. How?
■By ‘sensing’ and understanding human and machine parameters using next
generation mobile and optical technologies
■By ‘thinking’ of actions before a fault occurs in the network or in an enterprise
using next generation analytics and AI
■By ‘acting’ to connect humans and machines alike by enabling wide area or local
area networks.
Essentials
Our essentials highlight the culture we are creating for our people,
customers and partners.
As we seek to realize the full potential of digital in every industry, acting as a
collaborative partner to our customers and pioneering the next evolution of
networks, we are creating the culture needed to drive the future growth of Nokia.
■Open – in mindset, to opportunity, with transparency
■Fearless – bringing authenticity, sharing ideas and opinions, embracing collaboration
■Empowered – to make decisions, to act with clear accountability.
Helping
the world
act together
At Nokia, we create technology that helps the world act together.
As a B2B technology innovation leader, we are pioneering the future where
networks meet cloud to realize the full potential of digital in every industry.
Through networks that sense, think and act, we work with our
customers and partners to create the digital services and
applications of the future.
Our products, solutions and services can drive social,
environmental, and economic progress. Digitalization and
connectivity can have a critical role in solving some of the world’s
greatest challenges including stalled productivity, climate change
and unequal access to opportunity. Our products and solutions
bring digitalization to physical industries and cities, helping them
decarbonize and increase efficiency, productivity and safety.
Shareholder distributions
Dividend proposed in respect of 2023(2) | Share buyback program announced in January 2024 to return up to |
EUR 0.13 | EUR 600m |
per share | over 2 years |
Financial highlights
For the year ended 31 December | |||
EURm | 2023 | 2022 | 2021 |
Net sales | 22 258 | 24 911 | 22 202 |
Gross profit | 8 687 | 10 222 | 8 834 |
Gross margin | 39.0% | 41.0% | 39.8% |
Operating profit | 1 688 | 2 318 | 2 158 |
Operating margin | 7.6% | 9.3% | 9.7% |
Profit for the year(1) | 674 | 4 210 | 1 654 |
EUR | |||
Earnings per share, diluted(1) | 0.12 | 0.74 | 0.29 |
Proposed dividend per share(2) | 0.13 | 0.12 | 0.08 |
At 31 December | |||
EURm | 2023 | 2022 | 2021 |
Net cash and interest-bearing financial investments(3) | 4 323 | 4 767 | 4 615 |
(1)From continuing operations
(2)The Board of Directors proposes to the Annual General Meeting to be authorized to decide in its discretion on the distribution of
an aggregate maximum of EUR 0.13 per share as dividend from the retained earnings and/or as assets from the reserve for
invested unrestricted equity.
(3)Non-IFRS measure. For the definition and reconciliation of non-IFRS measures to the most directly comparable IFRS measures,
refer to the “Alternative performance measures” section.
Business overview | Corporate governance | Operating and financial review and prospects | General facts on Nokia | Financial statements | Other information | 4 | |||||||
Nokia in 2023 continued
Nokia Annual Report on Form 20-F 2023
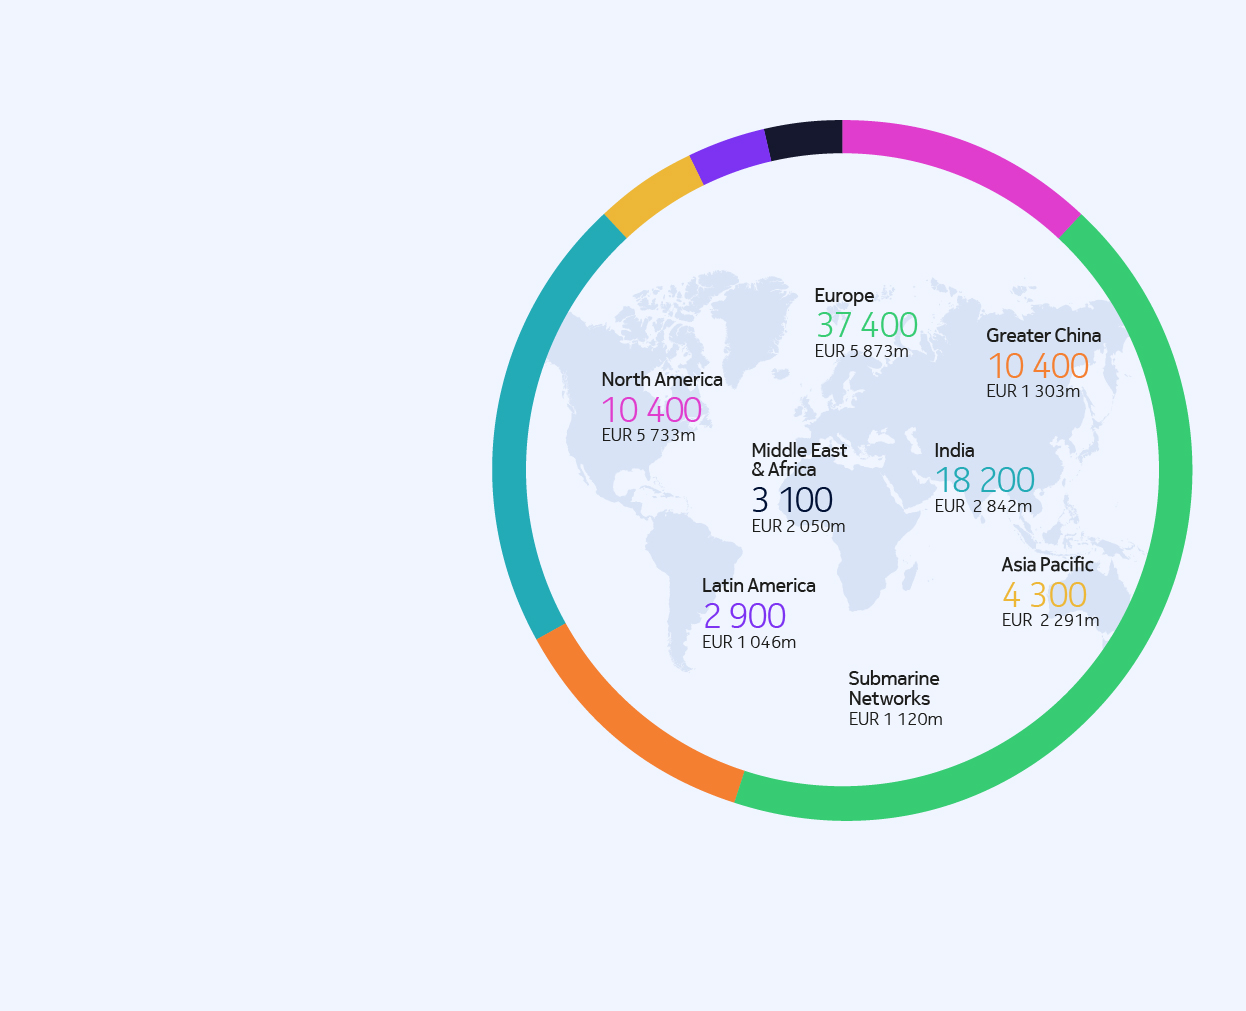
Global reach
Our technology solutions enable critical
networks for communications service
providers (CSPs) and enterprises around
the world.
Net sales in 2023
EUR 22.3bn
Countries of operation
~130
Average number of employees in 2023
~86 700
Strengthening our
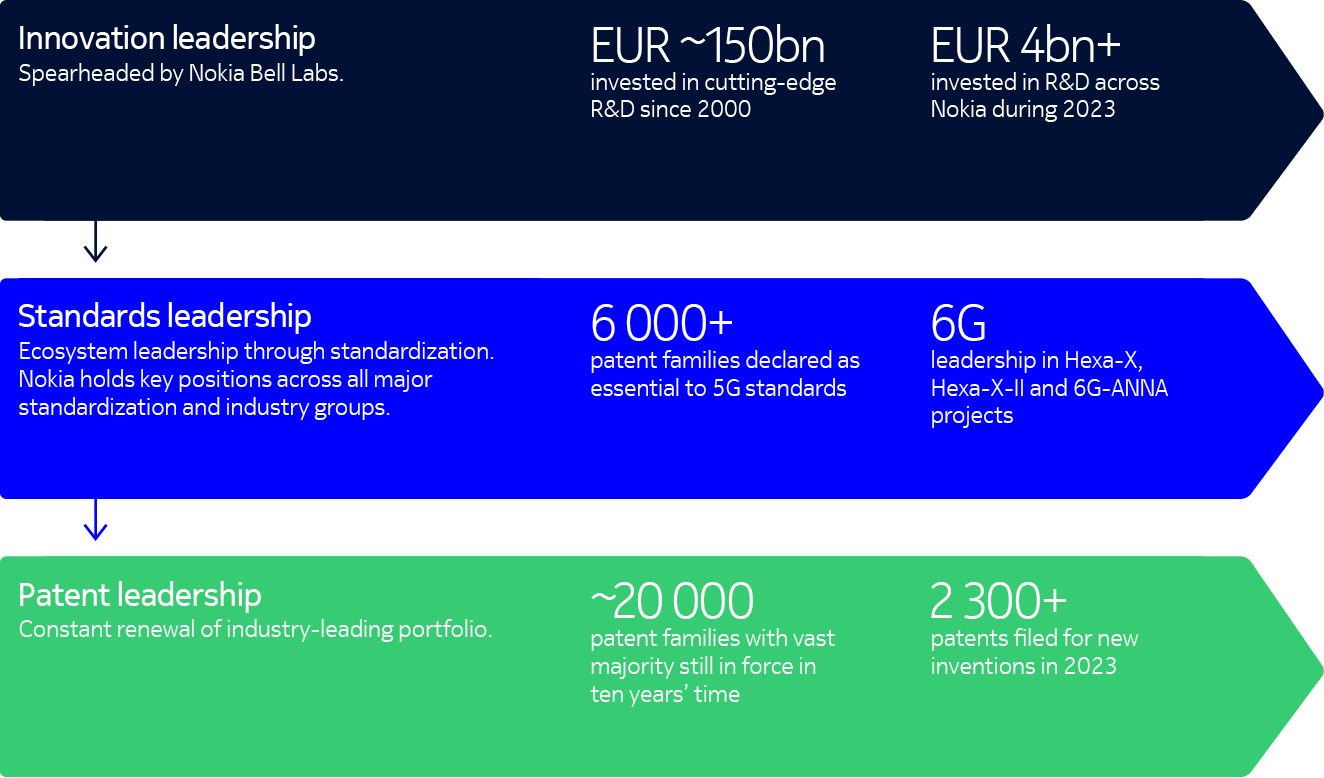
technology leadership
R&D investment since 2000
EUR ~150bn
Patent families declared as essential to
5G standard
6 000+
Nobel Prizes awarded for ground-breaking
achievements in global innovation
10
Business overview | Corporate governance | Operating and financial review and prospects | General facts on Nokia | Financial statements | Other information | 5 | |||||||
Nokia in 2023 continued
Nokia Annual Report on Form 20-F 2023
(1) Regional net sales figures exclude net sales of Submarine Networks business.
Regional split of employees and net sales(1)
Key ESG data for 2023
We have gathered a visual summary of key ESG (environmental,
social and governance) data points and a view of our recognitions
from external ratings organizations. This provides a snapshot with
more information in the “Sustainability and corporate
responsibility” section of this report.
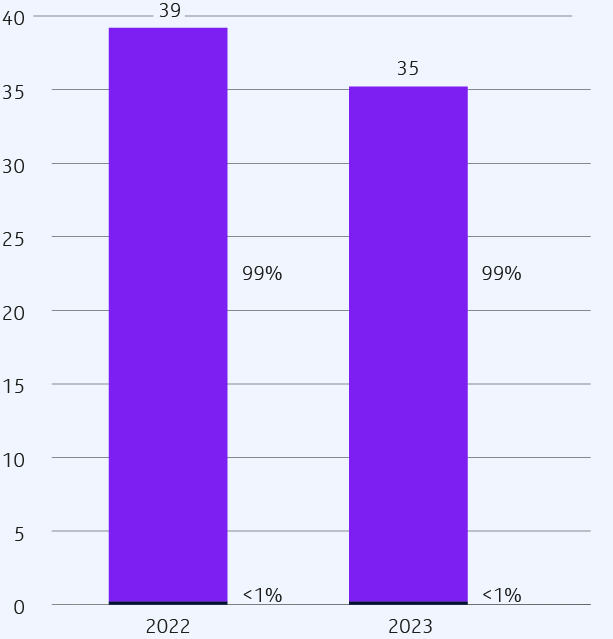
Nokia carbon footprint in 2023
Million metric tons CO2e / %
Scope 1, 2 Scope 3
Share of suppliers achieving satisfactory sustainability score(1) from supplier performance evaluation(2) % | ||
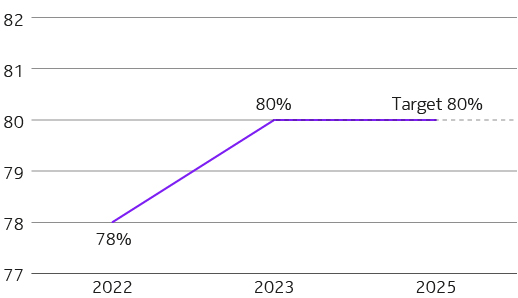 | (1)Based on aggregated weighted share. (2)Based on Corporate Responsibility onsite audit programs, EcoVadis, CDP, Conflict minerals. | |
Share of CO2e reduction achieved by final assembly suppliers towards zero emissions target(1) Million metric tons CO2e / % | ||
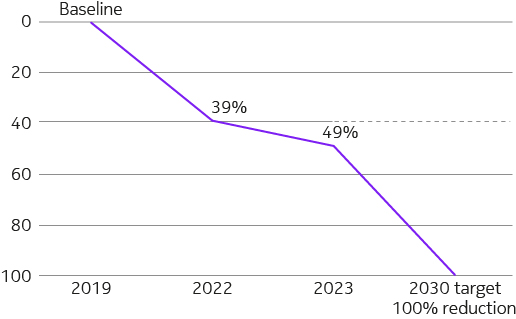 | (1)Against 2019 baseline. |
Business overview | Corporate governance | Operating and financial review and prospects | General facts on Nokia | Financial statements | Other information | 6 | |||||||
Nokia in 2023 continued
Nokia Annual Report on Form 20-F 2023


Human Rights Due Diligence cases
Cases handled by the Human Rights Due Diligence
process and how they were resolved
Go
Go with conditions
No go
Gender split at the end of 2023 | ||
18 900 Female | 62 100 Male | 3 500 Blank(1) |
(1)Detail on employee level not collected or is blank | ||
A-
Nokia again achieved a ranking of A- from CDP(2) for its work on
climate change
(2)CDP is a not-for-profit charity that runs the global disclosure system for investors,
companies, cities, states and regions to manage their environmental impacts.
Business overview | Corporate governance | Operating and financial review and prospects | General facts on Nokia | Financial statements | Other information | 7 | |||||||
Nokia in 2023 continued
Nokia Annual Report on Form 20-F 2023
ESG Rankings and ratings | Score (range: top/bottom) | Latest result | ||
 | 83.03% (industry average: 72.36%) | 2023 Jan | ||
Clean 200 | 82nd out of 200 | 2023 Feb | ||
 | 24th out of 200 | 2023 Mar | ||
 | Top 1% – Platinum | 2023 Mar | ||
 | Recognized as one of the 2023 World’s Most Ethical Companies ® | 2023 Mar | ||
 | ESG Score 4.7/5.0 | 2023 Jun | ||
 | AAA (AAA/CCC) | 2023 Aug | ||
 | Prime, B- (A+/D-) | 2023 Oct | ||
 | Ambassador status | 2023 Oct | ||
 | 11.2 (low risk of experiencing material financial impacts from ESG factors). Jan 2024: Sustainalytics’ 2024 Top-Rated ESG Companies List(3) | 2024 Jan | ||
 | A- (A/D-) | 2024 Feb | ||
(3)Refers to 2023 result, received in January 2024. | ||||


Our business groups
Nokia has four business groups with each of them aiming to become a technology and market leader in their respective sector.
Network Infrastructure | ||||
Network Infrastructure provides the equipment, software and services that enable all of the physical links that power networks. Its product offering includes IP routing and switching products, and the equipment to power fiber networks along with subsea and terrestrial optical networks. Its customers include communications service providers, webscales and hyperscalers, digital industries and governments. | ||||
Segment net sales (EURm) | Segment operating margin (%) | |||
-11% | ‘+’90 bps | |||
Mobile Networks | ||||
Mobile Networks creates products and services covering all mobile technology generations. Its portfolio includes products for radio access networks (RAN) and microwave radio (MWR) links for transport networks, solutions for network management, as well as network planning, optimization, network deployment and technical support services. | ||||
Segment net sales (EURm) | Segment operating margin (%) | |||
-8% | ‘-’140 bps | |||
Cloud and Network Services | ||||
Cloud and Network Services enables communications service providers (CSPs) and enterprises to deploy and monetize 5G, cloud-native software and as-a-service delivery models. | ||||
Segment net sales (EURm) | Segment operating margin (%) | |||
-4% | ‘+’260 bps | |||
Nokia Technologies | ||||
Nokia Technologies is responsible for managing Nokia’s patent portfolio and monetizing Nokia’s intellectual property including patents, technologies and the Nokia brand. | ||||
Segment net sales (EURm) | Segment operating margin (%) | |||
-32% | –810 bps | |||
Business overview | Corporate governance | Operating and financial review and prospects | General facts on Nokia | Financial statements | Other information | 8 | |||||||
Nokia in 2023 continued
Nokia Annual Report on Form 20-F 2023
READ MORE ON PAGES 23 TO 24 | → |
READ MORE ON PAGES 25 TO 26 | → |
READ MORE ON PAGES 27 TO 28 | → |
READ MORE ON PAGES 29 TO 30 | → |
FEDERICO GUILLÉN
PRESIDENT, NETWORK
INFRASTRUCTURE
TOMMI UITTO
PRESIDENT,
MOBILE NETWORKS
RAGHAV SAHGAL
PRESIDENT, CLOUD
AND NETWORK SERVICES
JENNI LUKANDER
PRESIDENT, NOKIA
TECHNOLOGIES
Progress in a
challenging environment
meaningful shift in customer spending impacted
our industry in 2023, with more caution due to the
macroeconomic environment, high interest rates,
and customers working down elevated inventories
accumulated during the pandemic-related supply
chain crisis. The demand environment was much more
challenging than we had expected at the start of the year,
particularly in North America, meaning we ended with a full-
year net sales decline.
However, due to the proactive cost actions we took across our
organization, we were able to protect our profitability while
still continuing to invest in R&D. All three of our networks
business groups delivered within the ranges we targeted at
the start of the year despite the net sales headwinds. Delays
in signing renewal agreements meant Nokia Technologies’
profitability was below the targeted range.
Given our strong cash position at the end of 2023, the
Board of Directors proposed an increase in the dividend
from EUR 12 cents to EUR 13 cents and initiated a new
share buyback program to return up to EUR 600 million
to shareholders over the next two years.
Considering the scale of the market challenges we faced
in 2023, I am pleased with the resilience of our financial
performance and the significant achievements across
our business groups.
Business overview | Corporate governance | Operating and financial review and prospects | General facts on Nokia | Financial statements | Other information | 9 | |||||||
Letter from our President and CEO
Nokia Annual Report on Form 20-F 2023
A
PEKKA LUNDMARK,
PRESIDENT AND CEO
“Despite the challenging market
environment in 2023, we delivered a resilient
financial performance, made progress on
our strategy, and continued to create
world-leading technology.”
Network Infrastructure’s net sales were negatively impacted
by market uncertainty during the year, but profitability was
robust and there was strong order intake across the business
in the last quarter. Network Infrastructure ended the year with
improving orders for IP Networks from webscale customers
and good momentum in Fixed Networks from government
initiatives for broadband deployments. Network Infrastructure
also continued to advance its technology leadership with the
launch of its PSE-6s solution for optical networking, which
went live in customer network trials, setting a new record
of 800Gbps per wavelength transmission over 6 600km.
The introduction of the 7730 Service Interconnect Router
brought the power of our advanced routing silicon to more
parts of the network.
Mobile Networks’ full-year net sales declined as rapid 5G
deployment in India was not enough to offset a reduction in
spending in North America. The net sales decline and regional
mix led to a modest decline in margins. However, Mobile
Networks has increased its 5G market share significantly in
recent years and has continued to grow in private wireless
and diversify into new segments. The business group also
continued to improve its technology competitiveness with
new additions to its AirScale radio access network portfolio,
powered by the latest ReefShark System-on-Chip technology.
Those additions included new high-performance massive MIMO
radios as well as new baseband capacity and control cards,
ready for 5G-Advanced and delivering unprecedented
connectivity, capacity, and energy efficiency. Mobile Networks
also launched anyRAN, a revolutionary approach to Cloud RAN
giving operators and enterprises high performance, energy
efficiency and resiliency.
Cloud and Network Services had a strong year with progress
in profitability despite a net sales decline. It introduced the
Network as Code platform with a developer portal to accelerate
network programmability and monetization, closing the year
with nine commercial agreements. Cloud and Network Services
also made strides in the management of its portfolio, including
the announcement of Red Hat as the primary infrastructure
platform for Nokia Core Network applications, the agreed sale
of its Device Management and Service Management Platform
businesses, and the divestment of its VitalQIP products.
Nokia Technologies experienced a net sales decline as the
prior year benefited from a significant one-off and as some of
its major patent licensing agreements were still outstanding at
the end of 2023. However, Nokia Technologies signed more
than 50 deals, including Apple and Samsung, during the year
and filed patents on more than 2 300 new inventions to
continue building our industry-leading patent portfolio. It also
continued to grow in new focus areas, including automotive,
consumer electronics, and IoT. In early 2024, Nokia
Technologies concluded its smartphone patent license renewal
cycle which began in 2021, entering a period of stability.
Strategic progress
Early in 2023 we refreshed our corporate strategy to better
position Nokia for longer-term growth opportunities. Sweeping
digitalization, advances in artificial intelligence (AI) and the
expansion of cloud computing will require significant
investments in networks with vastly improved capabilities.
To ensure Nokia capitalizes on those growth opportunities,
we announced six strategic pillars in February, and by the end
of the year we had made clearly identifiable progress on all
of them.
For instance, we meaningfully increased our market share in
mobile networks and in optical networks. We also continued to
diversify and expand the share of enterprise in our customer
mix, with enterprise customers making up more than 10% of
our Group net sales in 2023. And we made several moves
to actively manage our portfolio this year, including the
aforementioned divestments in Cloud and Network Services,
and Mobile Networks announcing the acquisition of Fenix
Group to strengthen our offer to the defense sector in the
United States.
Business longevity in Nokia Technologies was boosted with the
conclusion of the smartphone patent license renewal cycle in
early 2024, as well as through continued expansion into new
areas. We also continued to develop new business models,
with Cloud and Network Services leading the industry on
programmable networks and growing its Software-as-a-Service
operations fivefold to more than 40 customers.

Business overview | Corporate governance | Operating and financial review and prospects | General facts on Nokia | Financial statements | Other information | 10 | |||||||
Letter from our President and CEO continued
Nokia Annual Report on Form 20-F 2023
Finally, we made solid progress in developing our
environmental, social, and governance (ESG) strengths into a
competitive advantage for Nokia. We received another top
ranking in Sustainalytics’ 2023 ESG Top-Rated Companies list,
and MSCI ESG Ratings gave us the highest-level AAA rating.
Both of these ratings provide information to investors on
financially relevant ESG matters. We also issued our first-ever
sustainability-linked bond.
Nokia became the first telecom company to announce
the manufacture of fiber broadband optical modules in
the United States for the Broadband Equity, Access, and
Deployment (BEAD) program, working with partners to bridge
the digital divide. And Nokia represented European businesses
at a G7 Summit side event in May looking at how to increase
cooperation to strengthen digital infrastructure in
developing economies.
Renewing our brand
Along with the six strategic pillars, we announced four
enablers to support our strategic execution: developing
future-fit talent; investing in long-term research in key
domains; digitalizing our operations; and renewing our brand
to establish a clear position for Nokia as a B2B technology
innovation leader.
One of the highlights of the year was the unveiling of
our renewed brand at Mobile World Congress in February,
which has helped reset how key audiences view our company.
Our brand will continue to be an important enabler of our
strategy and long-term business goals.
Changes in operating model
To accelerate our strategic execution and navigate market
uncertainty, in October we announced plans to give our
business groups increased operational autonomy and
agility so they could diversify faster, build new ecosystem
partnerships, implement new business models, and invest
in technology leadership.
As part of this, we streamlined our operating model through
embedding sales and other go-to-market teams into the
business groups from the start of 2024. Our aim was to
increase the agility and speed of decision-making and enable
our business groups to better seize growth opportunities
with existing and new customers.
Due to ongoing market uncertainty, we also announced
a plan to reset our cost base to help protect profitability.
We aim to lower our cost base on a gross basis by between
EUR 800 million and EUR 1 200 million by the end of 2026,
compared to 2023, assuming on-target variable pay in
both periods.
Technology leadership drives our business
Since we committed to increasing our R&D funding in 2020,
our strengthened technology competitiveness has helped
drive market share gains and has contributed to significantly
improved customer satisfaction scores.
We updated our Technology Strategy 2030 in October to
guide our product and services development as well as our
customers’ network transformation, with the aim of positioning
Nokia as a leader for the 5G era and beyond.
Our innovation is spearheaded by Nokia Bell Labs, which
continued to make technological breakthroughs last year
including in optical networking and 6G. Two other highlights
included UNEXT (Unified Networking Experience), a Nokia Bell
Labs research initiative that promises to redefine network
software and systems. And our participation in a US Defense
Advanced Research Projects Agency (DARPA) initiative to design
a future network architecture for the Moon.
Business overview | Corporate governance | Operating and financial review and prospects | General facts on Nokia | Financial statements | Other information | 11 | |||||||
Letter from our President and CEO continued
Nokia Annual Report on Form 20-F 2023

To maximize the commercial potential of Nokia Bell Labs’
innovations, we embarked on new venture partnerships and
a new venture studio. We are now working with America’s
Frontier Fund, Roadrunner Venture Studios, and Celesta
Capital to create and invest in strategic start-ups and to
commercialize Nokia Bell Labs’ research.
Looking ahead
Despite the challenging market environment, we delivered
a resilient financial performance, made progress on our
strategy, and continued to create world-leading technology.
Nevertheless, it was a challenging year in terms of our share
price development, and of course we can’t be content
with that. Our foremost priority is to create value for our
shareholders. We took several steps in pursuit of that goal
in 2023 and we will be relentless on improving shareholder
value creation going forward. I would like to thank the entire
Nokia team for everything they have done this year and their
determination to strengthen our position for the future.
Pekka Lundmark
President and CEO
Business overview | Corporate governance | Operating and financial review and prospects | General facts on Nokia | Financial statements | Other information | 12 | |||||||
Letter from our President and CEO continued
Nokia Annual Report on Form 20-F 2023

Our customers
We serve three customer segments: communications
service providers, enterprises and licensees.
Networks play an increasingly important role in the economy
and in society. As a result, we serve a growing number of
customers who provide critical services to end-users. We
distinguish three customer segments that we serve with our
hardware, software and services portfolio: communications
services providers and enterprises, therein enterprise verticals
and webscalers. In addition, we license our intellectual property
to industries that benefit from our fundamental innovations,
primarily in the mobile devices, automotive, consumer
electronics and IoT industries.
Our analysis of the evolution of these segments is set out
below.
1 | Communications service providers (CSPs) |
The CSPs estimated total addressable market (TAM)
declined 6% to EUR 96 billion from 2022 to 2023.
A communications service provider offers telecommunications
services such as voice and/or data services through fixed and/
or mobile connectivity to consumers, enterprises, governments
and other communications service providers. Nokia maintains
a consolidated view of the Nokia total addressable market
based on multiple external analyst reports, customer and
key competitor reported and announced insights as well as
Nokia internal insights. We estimate that in 2023, the CSPs
estimated total addressable market (excluding Russia and
Belarus) for Nokia was EUR 96 billion, having declined by 6%
excluding the impact of changes in foreign currency exchange
rates from 2022 to 2023 as the macro-environment, high
interest rates and inventory build-up during 2022 combined to
see operators reduce their spending meaningfully.
We expect it to only grow moderately, at a 1% compound
annual growth rate (CAGR) between 2023 and 2028 excluding
the impact of changes in foreign currency exchange rates.
We expect that fixed wireless access, fiber, IP routing and
optical networks will grow faster than the overall CSP market,
driven by the continuous demand for higher speed access
technologies at homes and workplaces. The 5G cycle will also
yield growth in software, namely in 5G Core and in all software
segments supporting 5G operability and monetization.
CSPs have kept their capital expenditure intensity flat, but
increased their earnings through automation, digitalization,
shifts in channel mix, outsourcing and asset sales. We expect
them to remain focused on the monetization of their
connectivity strengths, and on cost optimization. They are
also considering divesting from passive infrastructure and
transitioning towards network sharing models. In areas in which
the network is built for coverage, this might reduce demand
for network vendor equipment. We have also seen the first
examples of CSPs relying on webscalers to lead the transition
to cloud-based operational and business models. When
combined with open RAN standards that aim at splitting a base
transceiver station into subcomponents with open interfaces,
this may allow for new entrants into the market and increase
competition. Conversely, it should also serve to accelerate
innovation and create opportunities for market share gains
for those investing in the technology, including for Nokia.
Geopolitics and environmental criteria increasingly influence
investment and vendor decisions. Security and sovereignty
have become important factors across the vendor landscape.
Government-funded broadband initiatives also provide
additional funding for investments, for example in rural areas.
Sustainability considerations such as green energy use, energy
consumption reduction plans and circular economy approaches
also shift the criteria for vendor selection.
2 | Enterprises |
Enterprise estimated TAM grew by 7% to
EUR 16 billion from 2022 to 2023.
Enterprise TAM includes enterprise verticals and webscaler
markets. In 2023, the estimated enterprise TAM (excluding
Russia and Belarus) was EUR 16 billion, having grown by 7%
from 2022 to 2023 excluding the impact of changes in foreign
currency exchange rates. We forecast this market to grow
strongly, at 7% CAGR until 2028 excluding the impact of
changes in foreign currency exchange rates, with the private
wireless market reaching 22% CAGR.
Enterprise verticals
An enterprise vertical represents a grouping of companies
by an industry that offers products and services that meet
specific needs. We primarily focus on transportation and
logistics, energy, manufacturing, and public sector verticals.
This reflects our assessment that these are seeing the most
significant digitalization over the coming years, as they
automate many aspects of their operations. We project that
growth will mainly be driven by private wireless and wireline
networks in manufacturing, as well as in the public sector and
in energy. We estimate that IP routing and optical networks
will also continue to grow moderately in these segments.
Business overview | Corporate governance | Operating and financial review and prospects | General facts on Nokia | Financial statements | Other information | 13 | |||||||
Our customers
Nokia Annual Report on Form 20-F 2023
Webscalers
Webscaler refers to companies that provide cloud-based,
scalable solutions and services. Alphabet (Google Cloud
Platform), Amazon (Amazon Web Services) and Microsoft
(Azure) are the largest cloud players – also referred to as
hyperscalers – operating on a global scale. Our TAM for
webscalers consists mainly of optical networks and IP routing.
Within optical networks, we expect that data center
interconnect (DCI) will be a strong growth driver, while the
increasing webscaler data traffic requires adoption of higher
bit rate technologies also in IP routing.
The largest global webscalers are also assuming an increasingly
important role within the telecommunications domain. They
target edge computing as the next growth engine for industrial
automation workloads and low-latency applications. They also
partner with CSPs to co-locate edge stacks on-premises and at
metro sites. Additionally, they aim to run telecommunications
network workloads on their cloud infrastructure. As such,
webscalers are customers and partners, as well as potential
competitors in some areas.
3 | Licensees |
Licensees refers to companies who have agreed licenses to
use Nokia’s intellectual property. This includes the licensing
of Nokia’s patent portfolio, the licensing of technologies for
integration into consumer devices and licensing of the Nokia
brand. The majority of Nokia Technologies’ revenues comes
from patent licensing where we have agreements with most
major smartphone vendors as well as licensing programs for
consumer electronics, video services, automotive and the wider
IoT domain. In total, we have more than 200 licensees across
all our programs, including companies like Apple, Samsung
and Lenovo.
1 | 2 | 3 | |||||||||||
CSPs | Enterprise | Licensees | |||||||||||
Focus on connectivity strengths and using cost optimization via automation and asset carve outs to fund both fiber and 5G investments Favoring cloud strengths in vendor and partner ecosystem Network monetization targeting enterprise and edge use cases | Enterprise verticals Digitalization and automation of operations in industrial segments Transition to software-centric operations and adoption of industrial operational technology (OT) edge and on-premise clouds Energy and manufacturing as early adopters of private wireless and automation solutions Federal, state government and cities network modernization acceleration | Patent portfolio with long lifetime the vast majority of Nokia’s patents still in force in ten years’ time New inventions every year In 2023, Nokia filed patent applications on more than 2 300 new inventions, enabling 5G networks, connected 5G devices and more Annual number of patent filings expected to grow due to continued investments in R&D and standardization Entire industries powered by our fundamental cellular and multimedia inventions providing us with the opportunity to expand our licensing coverage; we are making good progress in our growth areas of consumer electronics, automotive and IoT | |||||||||||
Webscalers Edge computing as a growth engine – industrial automation workloads across on-premise, edge, public cloud Partnering with CSPs to co-locate edge stacks and building an ecosystem for low-latency apps Targeting telco and network workloads to run on their cloud infrastructure Collaborating with CSPs in the transformation of network operations | |||||||||||||
Business overview | Corporate governance | Operating and financial review and prospects | General facts on Nokia | Financial statements | Other information | 14 | |||||||
Our customers continued
Nokia Annual Report on Form 20-F 2023
Our strategy
Networks are the key enabler for the digitalization of
industries and the realization of the broader potential
of the metaverse.
In 2021, Nokia set out its strategy to deliver sustainable,
profitable growth by becoming a B2B technology innovation
leader, accompanied by a new purpose and operating model.
In 2023, Nokia made an evolution in this strategy and how we
deliver against it with the introduction of six strategic pillars.
These pillars are the key objectives that will define Nokia’s
success in the future and enable it to achieve its long-term
ambitions. Each of Nokia’s business groups which will
be introduced in the following sections, are focused on
implementing these strategic pillars in their respective businesses.
The six pillars are:
Grow CSP business faster than market | 1 | Expand the share of enterprise in our business | 2 | Actively manage our portfolio | 3 | |||||
CSPs will continue to be our biggest customer segment. We will leverage our strong technological position, investment in technology leadership and emerging opportunities to grow our share in key markets, with geopolitical considerations supporting this ambition. | Enterprise verticals and webscalers are deploying campus networks, wide area private wireless networks, enterprise physical networks and data centers at an accelerated rate to digitalize their operations. Being a technology leader in all these domains, we pursue these opportunities to grow our enterprise business. | Maintaining our portfolio segments at number one or number two position, through several routes including active portfolio management, is critical for a profitable and sustainable business. There may be cases where a leadership position is not possible and for these cases, we will consider alternatives. | ||||||||
Secure business longevity in Nokia Technologies | 4 | Build new business models | 5 | Develop ESG into a competitive advantage | 6 | |||||
We are investing to ensure the sustained competitiveness of our patent portfolio. We will continue to pursue opportunities from sectors outside mobile devices, such as automotive, consumer electronics, IoT and video services. | To broaden our customer base and change our margin profile, we see potential in new platform business models within the broader ecosystem. We engage with service providers, webscalers, industrial giants and emerging players like app developers and start-ups, to drive the creation of new products, services, and solutions, and to explore new business models including Cloud RAN, Network as Code and as-a-Service. | ESG is increasingly important for customers, investors, regulators, partners and Nokia employees. There is space in our industry to become the ‘trusted provider’ and Nokia aims to claim this position. Our ESG strategy lays out how we will do this and our specific areas of focus. | ||||||||
The six pillars are underpinned by four enablers: | |||||||
Develop future- fit-talent | Invest in long-term research | Digitalize our own operations | Refresh our brand | ||||
We have launched and are executing a new people strategy focused on growth, skills and development. We build the right future skills for our employees in the technical domains identified in our technology vision and strategy, and the commercial skills to support our expansion into new domains. | Sustained technology leadership is a key driver of our success: it requires us to anticipate, shape and invest in the next technology waves and breakthroughs. We continue to invest in long-term research to ensure a leadership position in line with our Technology Vision 2030. We are also deeply engaged in leading and influencing standards and developing standard essential patents. | We are increasing the digitalization of our own operations to lead by example with a set of ambitious, company-wide strategic initiatives to increase the company’s performance and competitiveness, focused on efficiency, productivity and agility in internal operations, customer experience and R&D. | To ensure Nokia is recognized as a B2B technology innovation leader, we refreshed our brand in 2023. Our new visual identity is emblematic of an energized, dynamic and modern Nokia. | ||||
Business overview | Corporate governance | Operating and financial review and prospects | General facts on Nokia | Financial statements | Other information | 15 | |||||||
Our strategy
Nokia Annual Report on Form 20-F 2023
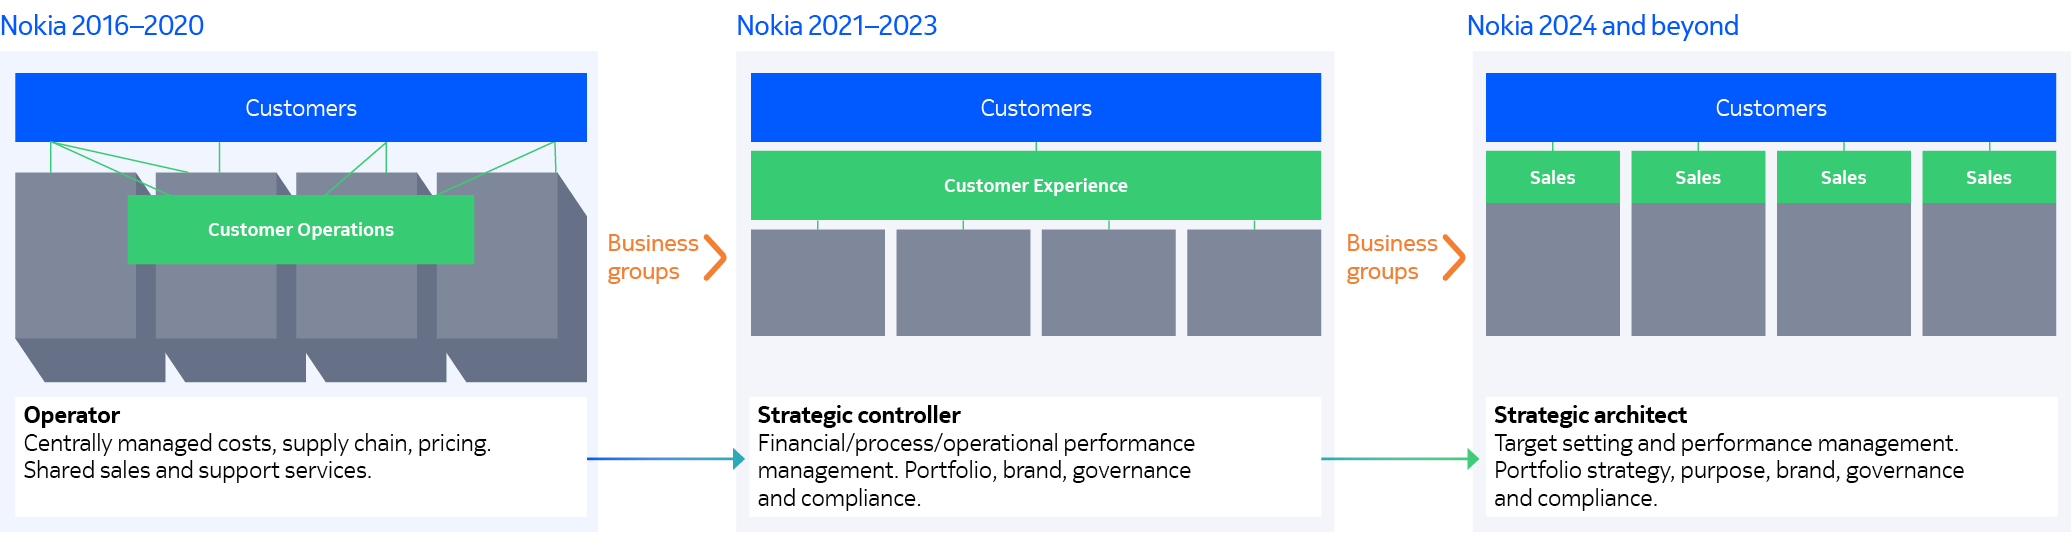
Accelerating strategy execution – providing
business groups with greater autonomy
In 2021, Nokia significantly streamlined its operating model,
moving from a matrix organization and creating four P&L-
responsible business groups structured around unique
customer offerings. Since then, its business groups have
increased investments in R&D, strengthened their technology
leadership, and rebalanced their portfolio while growing faster
than the market and expanding into new growth areas.
■Network Infrastructure has extended its technology
leadership position and is growing faster than the market
■Mobile Networks substantially improved the
competitiveness of its products, taking a leadership
position in 5G and gaining market share
■Cloud and Network Services has grown faster than the
market in its five growth segments, including Enterprise
private wireless, while rebalancing its portfolio
■Nokia Technologies has expanded into areas such as
automotive, multimedia and consumer electronics,
and has signed new patent license agreements with
Apple and Samsung
In Q4 2023, Nokia accelerated its strategy execution through
providing its four business groups with increased operational
autonomy and agility along with embedding sales teams
directly into the business rather than the central sales
organization the company has utilized until now. This will
enable the business groups to better address opportunities in
their distinctive markets with our existing and new customers.
They will be empowered to diversify faster, build new
ecosystem partnerships, implement new business models
and invest for technology leadership.
Dedicated sales teams with a strong product and customer
connection will enable business groups to better seize growth
opportunities with our existing and new customers and
diversify into enterprise, webscale and government sectors.
This change will bring highly empowered teams in front of
customers that are able to make quicker decisions based
on their needs. Sales teams will collaborate across Nokia to
ensure customers continue to benefit from the breadth of all
Nokia offers.
Nokia’s lean corporate center will act as a strategic architect,
providing oversight in key areas, including target setting and
performance management and portfolio development along
with governance and compliance. The company will continue its
commitment to long-term research through Nokia Bell Labs, as
evidenced by its recent announcement of a new venture studio
and venture capital partnerships to unleash the full commercial
potential of Nokia Bell Labs technologies beyond the needs of
Nokia’s business groups.
Accompanying the move towards more autonomous business
groups and to provide investors with greater transparency in
assessing their financial performance, Nokia will begin reporting
a cash flow metric and regional sales at the business group level
in 2024.
Business overview | Corporate governance | Operating and financial review and prospects | General facts on Nokia | Financial statements | Other information | 16 | |||||||
Our strategy continued
Nokia Annual Report on Form 20-F 2023
Our path to
continued
technology
leadership
As one of the industry’s leading investors in
communication technology research and development
(R&D), we drive innovation across a comprehensive
portfolio of network equipment, software, services
and licensing opportunities.
Nokia’s world-leading research and
development
We have a global network of R&D centers, each with specialties
and ecosystems built around both competencies and
technologies. Most of our near- to mid-term R&D is conducted
within the business groups’ structures and is further elaborated
in the business group-specific sections of this report.
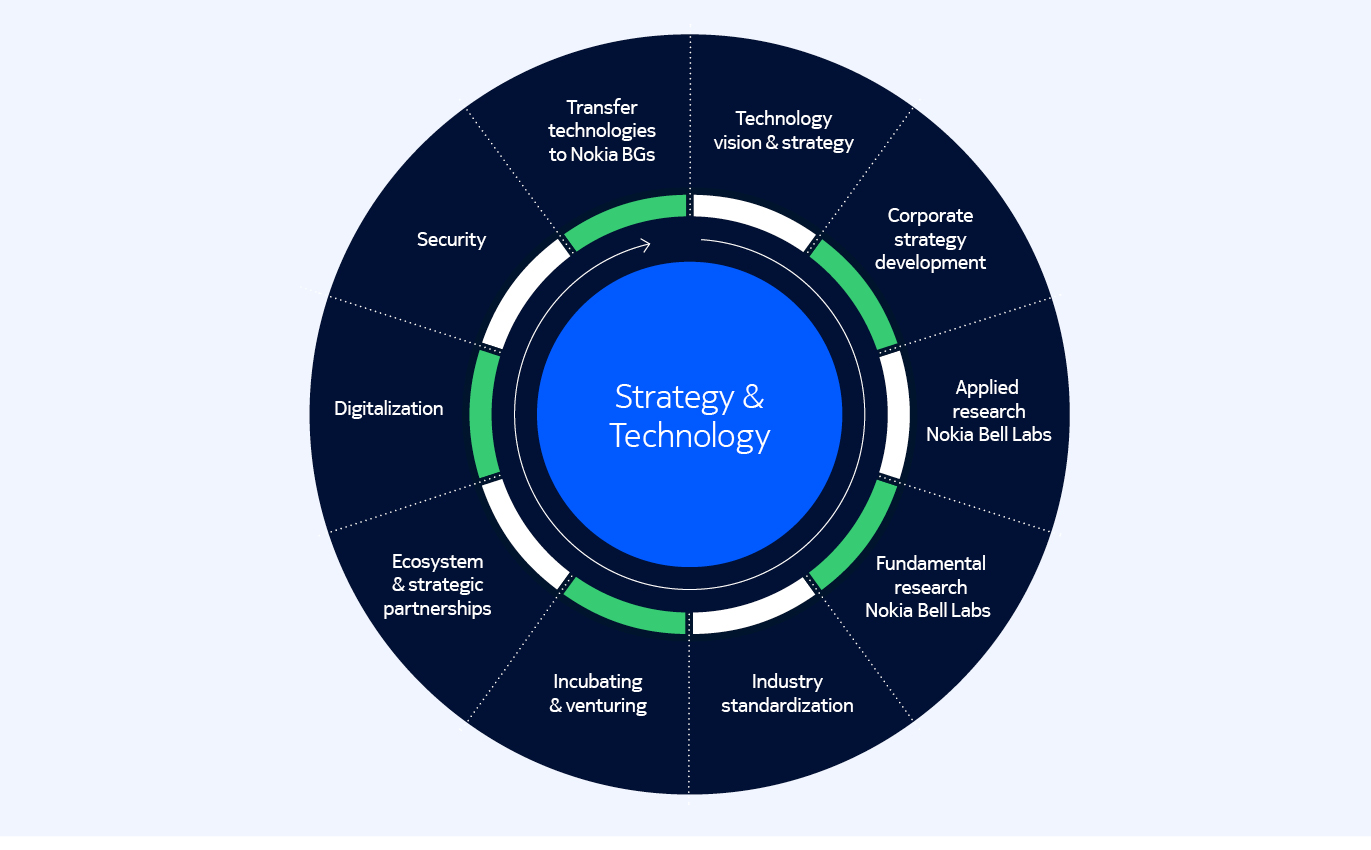
Laying the path for Nokia’s future
technology innovation and identifying the
most promising areas for new value creation
Beyond the R&D of our business groups, Nokia’s dedicated
Strategy and Technology (S&T) organization is focused
on longer-term technology cycles. S&T is responsible for
formulating a coherent corporate strategy and establishing
a technology and architecture vision across the company.
It is also overseeing the implementation of this vision in
partnership with Nokia’s business groups.
S&T drives company-wide internal technology alignment and,
through the transfer of technologies to the business groups,
contributes to the evolution of Nokia’s portfolio to enable
continued technology leadership.
Nokia Bell Labs
As Nokia’s industrial research lab, Nokia Bell Labs solves human
needs through the power of human intellect. Throughout its
nearly 100-year history, Nokia Bell Labs has been bringing
together the brightest minds in mathematics, physics,
computing and engineering to work on the world’s biggest
scientific challenges. In 2023, we added our 10th Nobel Prize
for work completed at Bell Labs with the Nobel Prize in
Chemistry awarded to our alumnus Louis Brus.
Nokia Bell Labs’ primary research areas are network
fundamentals, automation, semiconductors and devices, AI and
software systems. As an industrial research lab, we innovate with
purpose, pursuing responsible, sustainable technologies that will
have a demonstrable impact on society. Nokia Bell Labs believes
that the best research is done in an inclusive, collaborative
manner, taking multiple diverse points of view into account.
With Nokia Bell Labs, we continue our heritage of pioneering
significant innovations in the essential technologies driving
communication networks and systems. Many of the
fundamental technologies that are used in 5G standards were
invented at Nokia, and now we are focused on technology
leadership beyond 5G. We are finalizing standardization
work for the first release of the 5G-Advanced era, known as
3GPP Release 18, and have started to work on the upcoming
Release 19.
Business overview | Corporate governance | Operating and financial review and prospects | General facts on Nokia | Financial statements | Other information | 17 | |||||||
Our strategy continued
Nokia Annual Report on Form 20-F 2023
Nokia continues to be at the forefront of 6G research. Since
January 2023, we have led Hexa-X-II, the second phase of the
European Commission’s flagship 6G initiative for research into
the next generation of wireless networks. In 2023, Nokia also
launched a first-of-its-kind 6G Lab in India to research
foundational 6G technologies like network as a sensor,
network exposure and automation.
In 2023, we achieved two key technological milestones on
the path to 6G. First, the implementation of AI and machine
learning (ML) into the radio air interface, effectively granting
6G radios the ability to learn. Secondly, we utilized new sub-
terahertz (sub-THz) spectrum frequencies to substantially
increase network capacity. At the 2023 Mobile World Congress,
we presented a live demonstration of a 6G joint communication
and sensing proof-of-concept.
In 2023, Nokia Bell Labs also set four new world records for
submarine optical communications, and optical and fixed
networks with research that set a path to long-term technology
leadership in the next generation of network infrastructures.
Nokia Bell Labs is also at the forefront of non-traditional
network research with a focus on AI and machine learning that
is needed for future advanced communication capabilities. We
believe it is important to develop AI in an ethical, responsible
and sustainable way, and this led us to create a cross-
organization AI Center of Excellence.
Nokia Bell Labs has had recent success in collaborating with
government agencies and businesses on distinct commercial
contracts. This includes additional funded agreements with the
US Government for the future of space communication and
lunar communication architecture studies with Nokia Bell Labs
being chosen by DARPA for the LunA-10 Capability Study to
design an integrated multi-service architecture to support a
thriving economy on the Moon in the next decade and beyond.
Nokia Bell Labs is regarded as a leading industry and thought
leader on lunar surface communication networks, which NASA
recently recognized by giving it the FY2023 NASA Langley
Research Center Large Business Prime Contractor of the
Year Award. Nokia Bell Labs also signed a memorandum of
understanding with Aramco Digital for joint R&D collaboration
and innovation on digitalization and industrial automation
use cases.
Nokia Bell Labs continues to explore new concepts that could
lead to growth in both neighboring and nascent markets. We
launched UNEXT, a new research initiative for a future Network
Software System that creates a unified networking experience
for autonomous service creation leveraging distributed
computing and new business environments. Just as Bell Labs’
invention of UNIX transformed computing, our UNEXT research
initiative is poised to transform networking, by breaking down
barriers that have traditionally prevented network elements
from interoperating.
Nokia is actively engaged in leading and influencing standards
and developing new standard-essential patents (SEPs),
shaping future technologies and systems while strengthening
its IPR portfolio.
We also pursue future growth platforms through investment
in NGP Capital innovation funds, and the in-house incubation
and commercialization of venture projects. In 2023, we saw our
first venture projects going to market and winning their first
customer deals.
We also launched new venture capital partnerships with
America’s Frontier Fund, Roadrunner Venture Studios and
Celesta Capital to aid in the creation and funding of spinouts
that can maximize the commercial potential of Nokia Bell Labs
innovations and the creation of long-term value for Nokia.
In S&T, we are also focused on enabling Nokia to evolve as
a best-in-class digital enterprise and identifying security
requirements, trends and evolving risks, to position Nokia
as a trusted security partner for the 5G era and beyond.
Business overview | Corporate governance | Operating and financial review and prospects | General facts on Nokia | Financial statements | Other information | 18 | |||||||
Our strategy continued
Nokia Annual Report on Form 20-F 2023
“Nokia is actively engaged
in leading and influencing standards
and developing new standard-
essential patents (SEPs), shaping
future technologies and systems
while strengthening its IPR portfolio.”
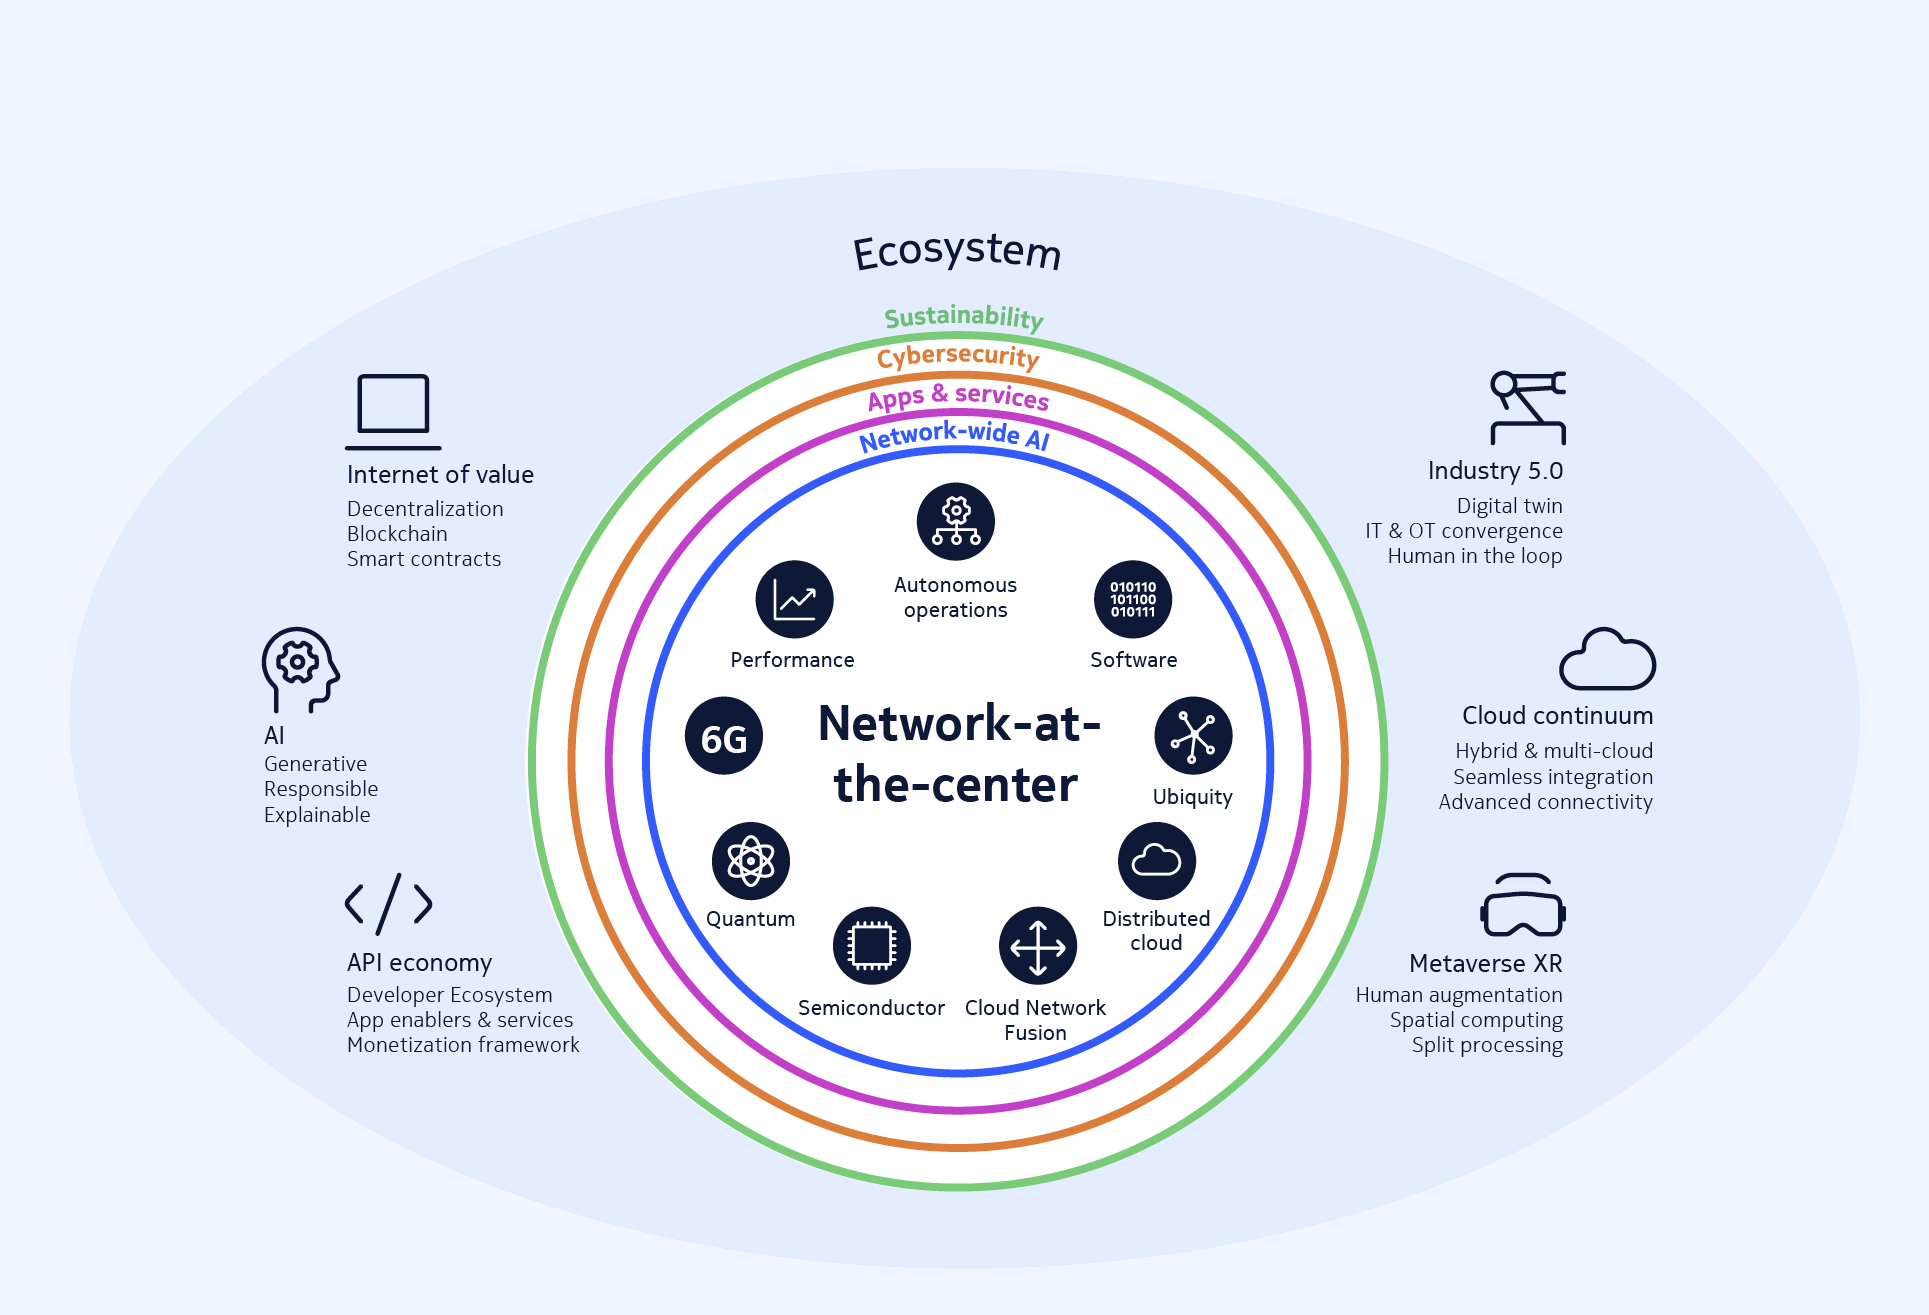
Our Technology
Strategy 2030
The network is critical to realizing the enormous range
of potential that emerging innovations and technologies
such as AI, the metaverse and the cloud open in the
communication provider, industrial, enterprise and
consumer spheres as we approach 2030.
In 2023, we revealed our Technology Strategy 2030, a roadmap
to emerging technologies and future network architecture.
Unparalleled technological advancement will drive major
changes in the way we live and work in the upcoming decade.
The global rate of technology adoption will be impacted
by trends such as a deepening focus on environmental
sustainability, cybersecurity and inclusion. Advances in
semiconductors, software, artificial intelligence and machine
learning, metaverse technologies, Web3 and cloud technologies
will continue to accelerate. These technologies will significantly
extend the scope of what is possible, connecting and merging
the human, physical and digital worlds to help solve some of
the greatest global challenges we face.
Building on our Technology Vision 2030, describing how we
expect emerging technologies to impact the world in the
coming years, Nokia’s Technology Strategy 2030 outlines the
insights, priorities and actions necessary for businesses to
remain proactive in response to these accelerating technological
advancements and the digital economy interplay and how,
together with our customers and the industry, we must evolve
networks to meet the challenges of tomorrow and beyond.
Network demand continues to accelerate
Network traffic is continuing to grow and will rise dramatically
as AI, ML, extended reality (XR), digital twins, automation, and
billions of additional devices proliferate. According to our new
Global Network Traffic 2030 report, end-user data traffic
demand will increase at a compounded annual growth rate
of 22% to 25% from 2022 through 2030 and global network
traffic demand is expected to reach between 2 443 and
3 109 exabytes per month in 2030.
Our Technology Strategy 2030 addresses the interplay of
expanding technologies, the impact on network capabilities
and demand and how Nokia will stay ahead of evolving
customer requirements. In the years ahead, networks will
undergo significant evolution and must become cognitive
and automated ecosystems capable of addressing the
transformative needs and operating models of diverse
organizations, industries and consumers.
Future network architecture
The network architecture of the future will need to be more
dynamic and agile, to swiftly adapt to the shifting landscape
of applications and service demands, as well as new business
and operating models. We have developed a future network
architecture that leverages network digital twin technology as
a central building block. The architecture brings networks and
clouds together to optimize both the user experience and
resource utilization. This future network brings enhancements
in management and orchestration with the help of digital twin
technology and AI to deliver optimal life-cycle management
of deployed assets and applications. Unified Application
Programming Interfaces (APIs) facilitate the development
of an ecosystem where services and applications can be easily
developed, deployed, and interoperated through the network.
To achieve our goals over the coming years we will continue to
anticipate future challenges for our customers and understand
how emerging technologies impact their evolving networks,
infrastructures and business models through continuous
assessment, monitoring and governance of our technology
strategy, which guides our portfolio development.
Business overview | Corporate governance | Operating and financial review and prospects | General facts on Nokia | Financial statements | Other information | 19 | |||||||
Our strategy continued
Nokia Annual Report on Form 20-F 2023
“Nokia’s Technology Strategy 2030 outlines the insights, priorities and
actions necessary for businesses to remain proactive in response to
accelerating technological advancements and the digital economy
interplay and how, together with our customers and the industry, we
must evolve networks to meet the challenges of tomorrow and beyond.”
Business overview | Corporate governance | Operating and financial review and prospects | General facts on Nokia | Financial statements | Other information | 20 | |||||||
Our strategy continued
Nokia Annual Report on Form 20-F 2023
The network and digital economy interplay
Evolution of network technologies will shape the future of the digital era
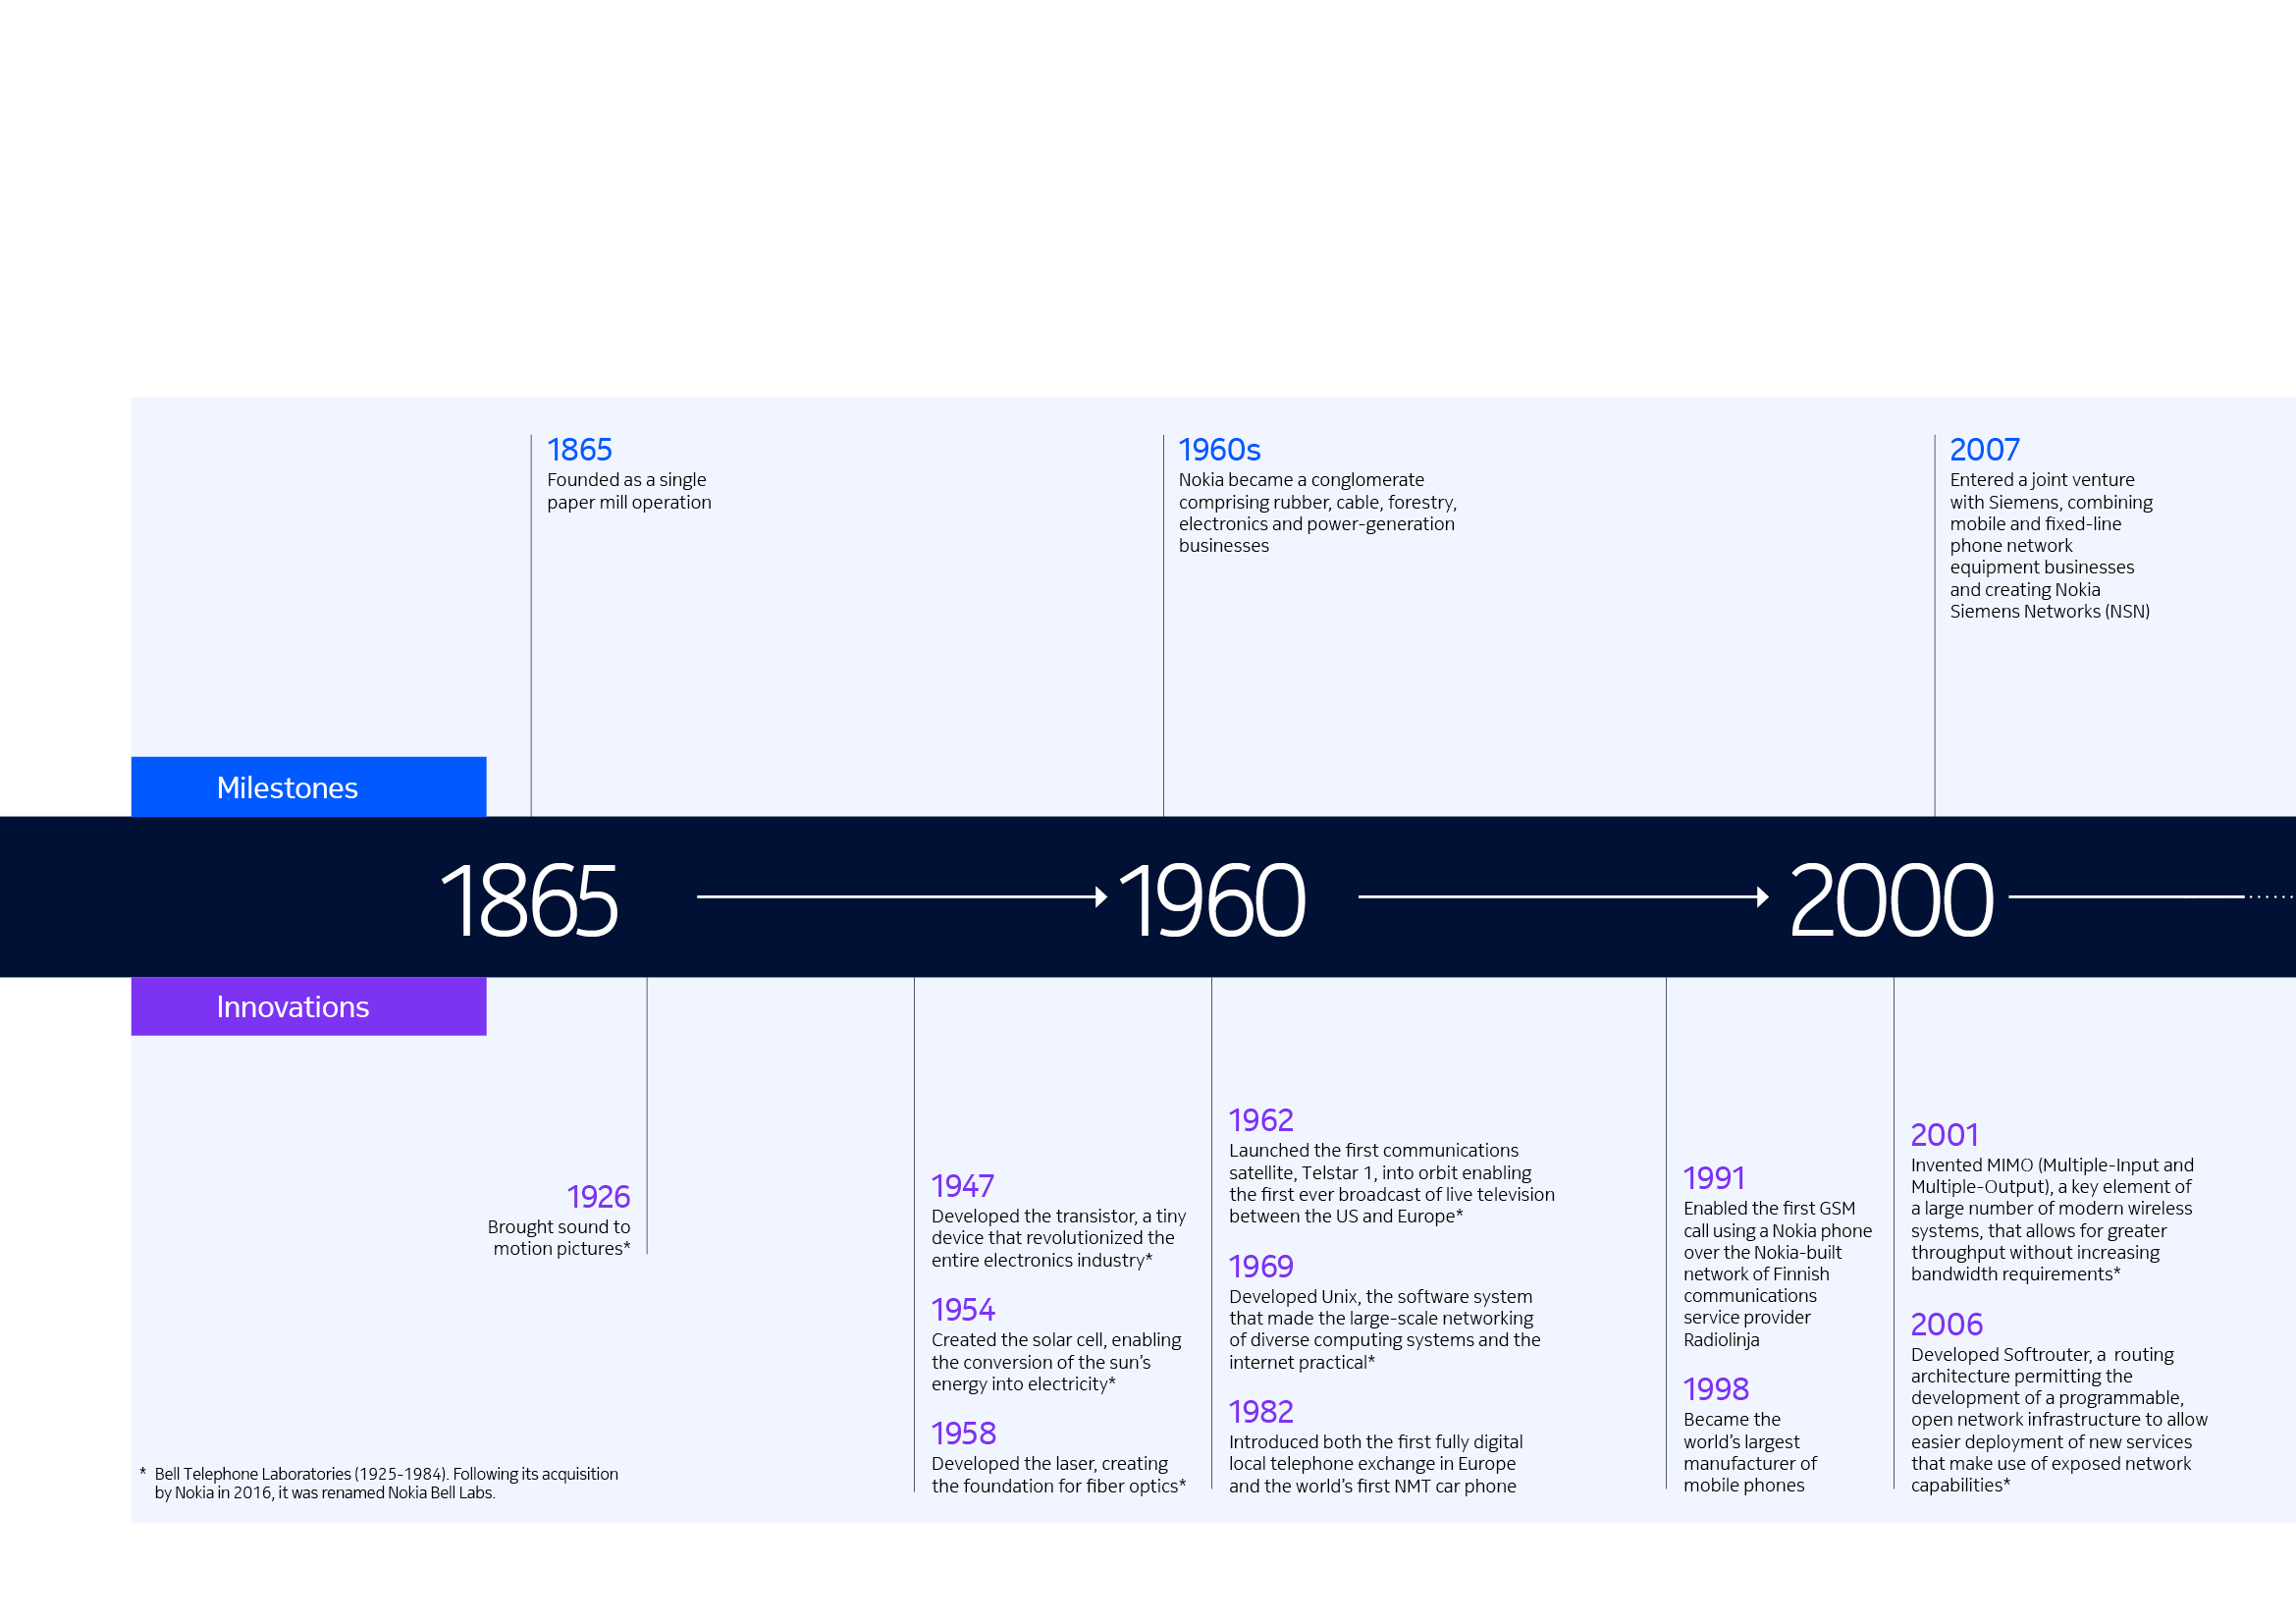
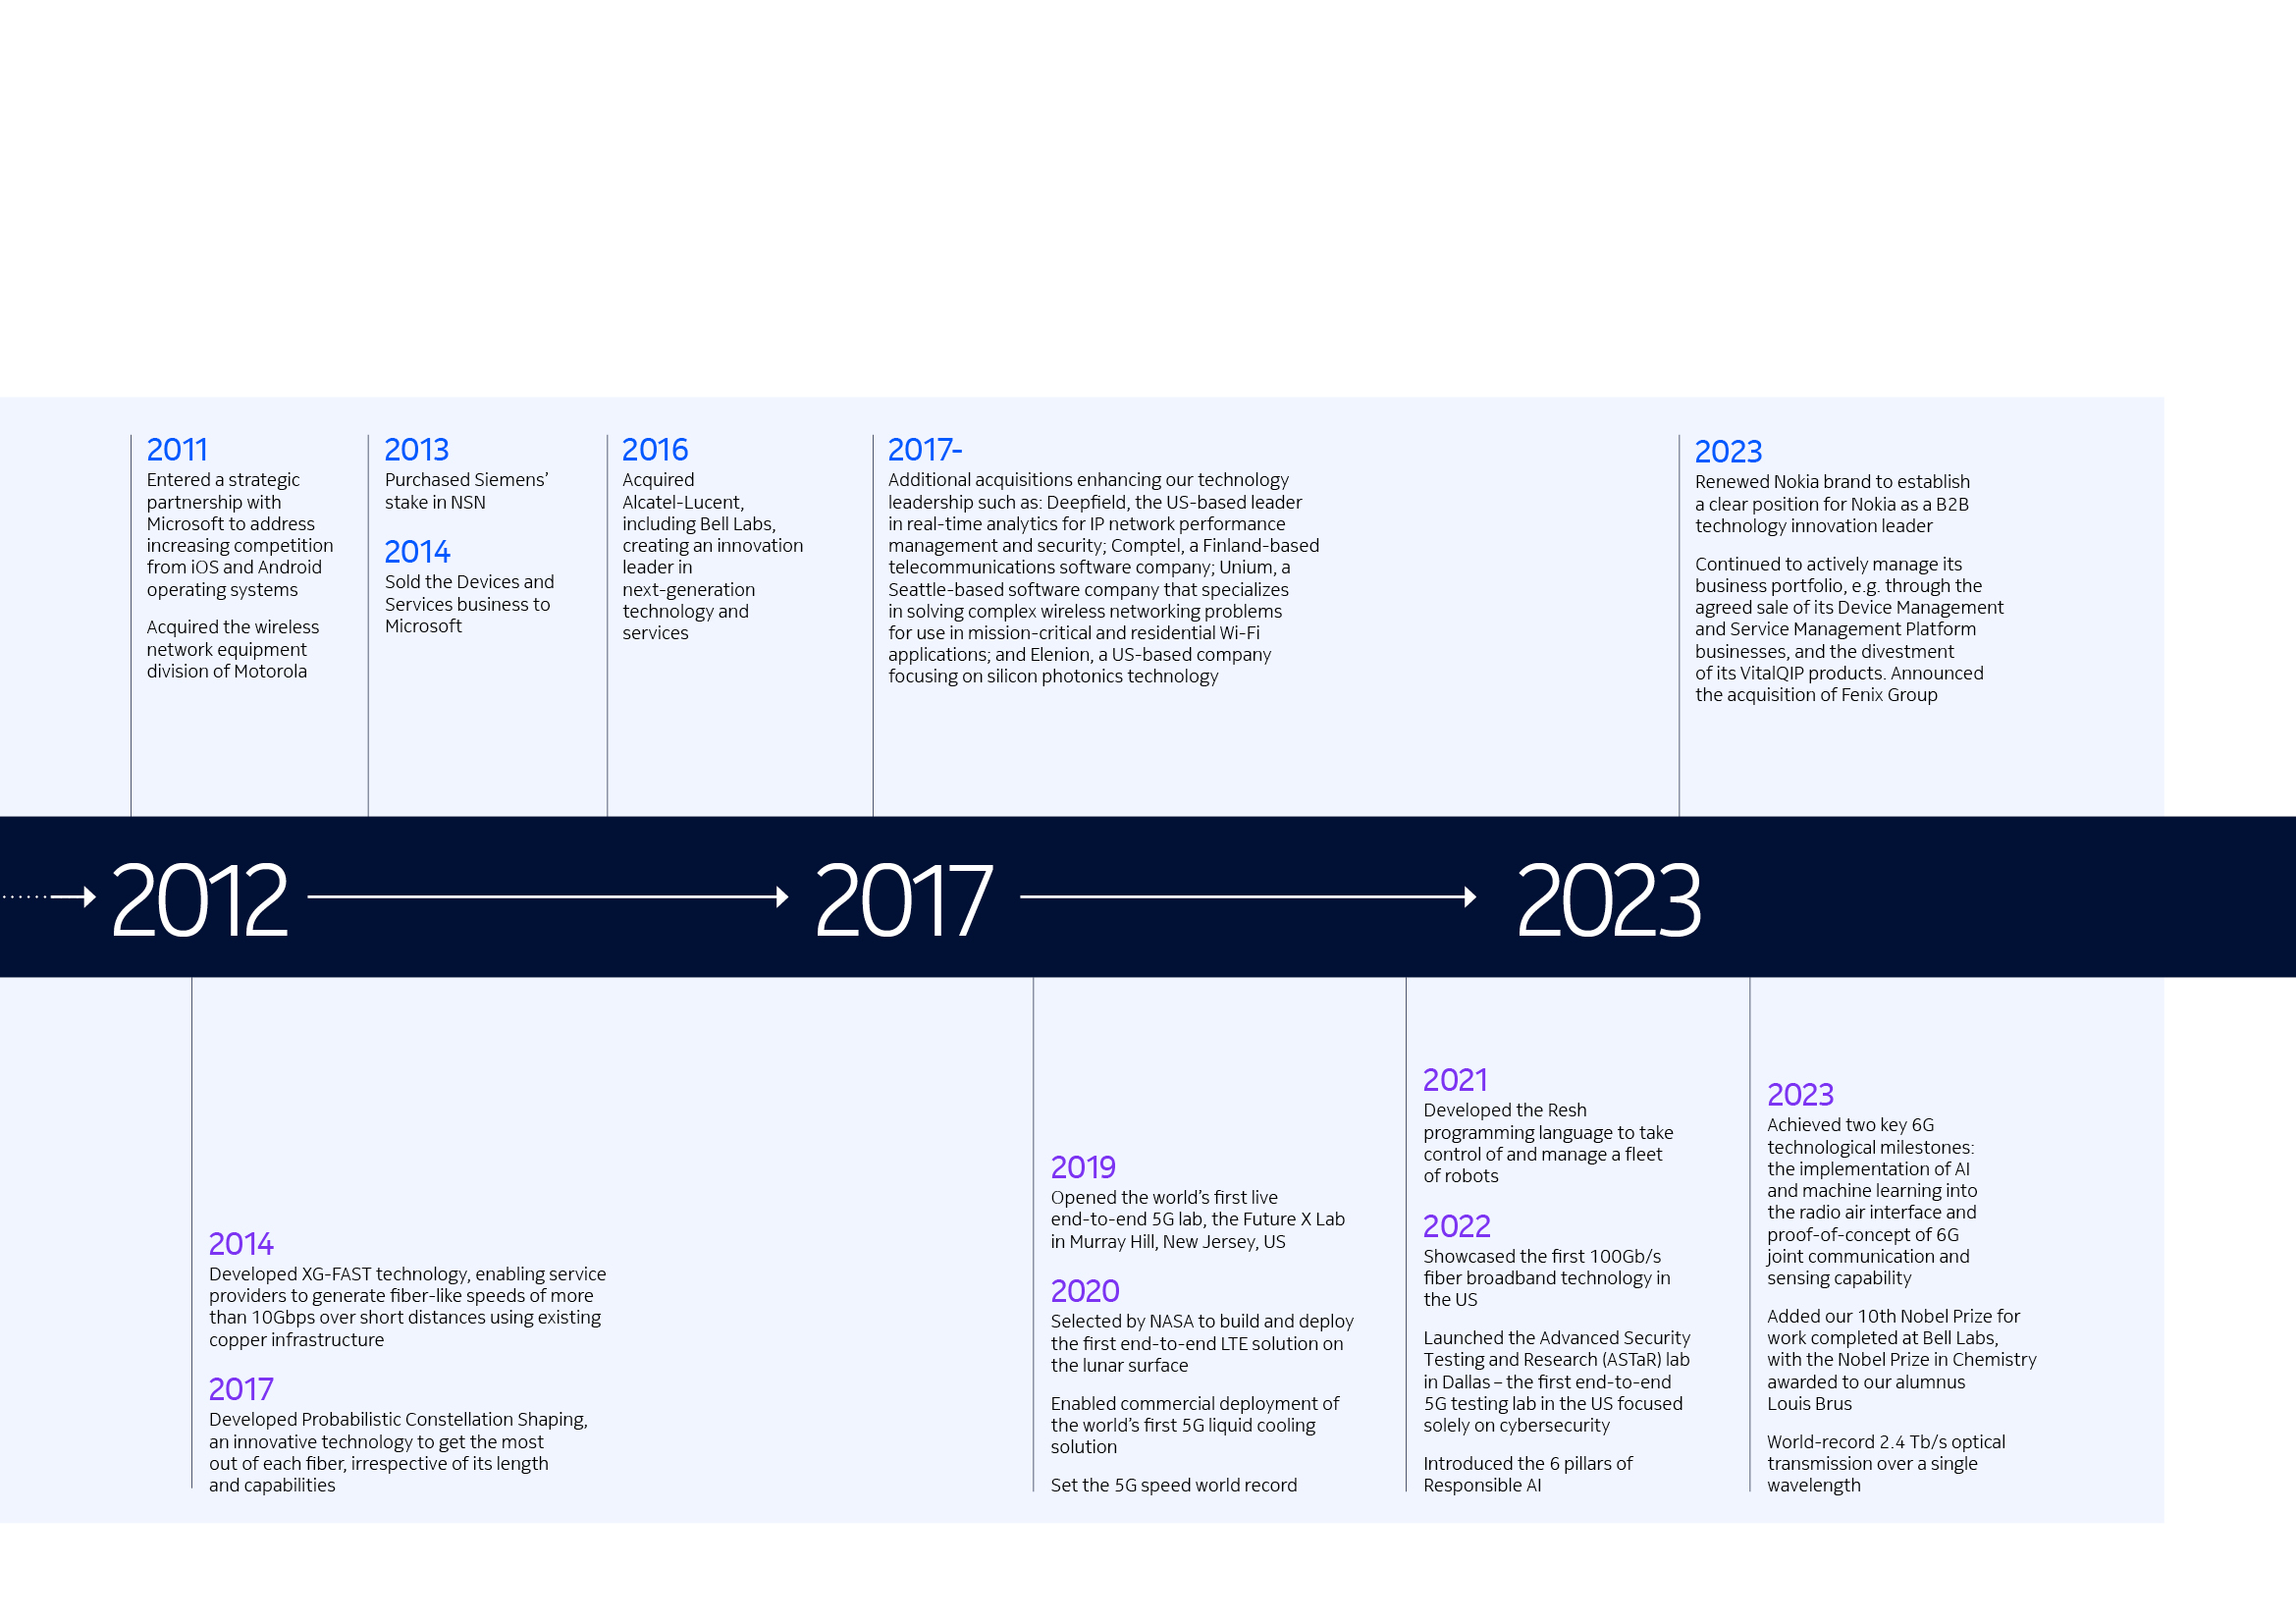
Our history
Nokia has been adapting to the needs of an ever-changing world for over 155 years.
Business overview | Corporate governance | Operating and financial review and prospects | General facts on Nokia | Financial statements | Other information | 21 | |||||||
Our history
Nokia Annual Report on Form 20-F 2023
Business overview | Corporate governance | Operating and financial review and prospects | General facts on Nokia | Financial statements | Other information | 22 | |||||||
Our history continued
Nokia Annual Report on Form 20-F 2023

Network
Infrastructure
Network Infrastructure delivers fixed access, IP
routing, data center networks and optical transport,
both terrestrial and subsea, for business-critical and
mission-critical applications for CSP, enterprise and
webscale customers.
2023 in brief
In 2023, Network Infrastructure’s net sales declined by
11% from 2022, based on a strong first half with a more
challenging latter part to the year. While a build-up in
customer inventory – along with macroeconomic
uncertainty – acted to depress revenue, strong demand
for our technology innovation helped raise segment
operating margin by 90 basis points to 13.1%.
■First to announce the manufacture of broadband
network electronics products for the U.S. BEAD program
■Chosen by GFiber Labs (Google Fiber) to deliver a 20 Gig
service to residential and enterprise customers with
existing fiber networks
■Began Swisscom’s service migration to a new high-
capacity optical transport network
■Selected by OpenColo to expand data center site
connectivity using 800GE routing interfaces
■Began work with Nomios Group to triple capacity for the
GÉANT European research network: the first research
network to deploy 800GE routing interfaces
■Completed the Amitié subsea cable system – the highest
capacity transoceanic communications cable ever
deployed – in a project led by Aqua Comms, Meta,
Microsoft and Vodafone
Market overview
During 2023, technology developments such as the emergence
of generative AI and high profile announcements of plans
for virtual reality devices underpinned our belief – supported
by the research work of Nokia Bell Labs – that demand for
connectivity will continue to grow over time to support
pervasive technologies including digitalization and the
metaverse. At the same time Network Infrastructure saw a
number of short-term challenges that made for a tough latter
part of the year. These range from a build-up of customer
inventory in response to the recent supply chain crunch to
some delays in customer investment prompted by ongoing
macroeconomic uncertainty.
In the face of these challenges, Network Infrastructure’s
strategy remains concentrated on technology leadership and
customer focus. We launched several significant new products
during 2023. These include the PSE6-s photonic service
engine, which delivers a competitive edge in terms of scale,
performance and sustainability; the 7730 Service Interconnect
Router, using our new FPcx silicon and run under Nokia SR Linux
to bring significant benefits to customers in terms of security,
capability, power and speed; and the industry’s first carrier-
grade Wi-Fi 7 product portfolio, three times faster than Wi-Fi 6
and based on our innovative Corteca software, designed to
help customers monetize their networks. As a result, we have
maintained or grown market share in all of our businesses,
made progress in the enterprise customer segment and laid
the foundation for future profitable growth.
The estimated Network Infrastructure addressable market,
excluding Submarine Networks for 2023 was EUR 43 billion.
Business overview and organization
Our business divisions are: Fixed Networks, IP Networks,
Optical Networks and Submarine Networks.
Fixed Networks is a leading provider of access infrastructure
(fiber and copper), in-home Wi-Fi solutions, cloud solutions and
virtualization. In 2023, we maintained our leading position in
passive optical networks(1) and we have more than 400 fiber
customers in 130 countries. We are leaders in 25G-PON (now
being deployed by Google Fiber) as well as XGS-PON. Fixed
Networks continues to play a leading role in the dynamic fixed
wireless access market, with 50 FWA 5G deployments (including
mmWave) globally. In 2023, additions to our portfolio included
the industry’s first carrier-grade Wi-Fi 7 product portfolio,
new 5G FWA devices and extensions to our software offerings
including the Corteca home connectivity solution to enable
CSPs to better monetize their networks. Nokia was also the first to
announce the manufacturing of broadband network electronics
products for the U.S. BEAD government stimulus program.
Business overview | Corporate governance | Operating and financial review and prospects | General facts on Nokia | Financial statements | Other information | 23 | |||||||
Business groups
Nokia Annual Report on Form 20-F 2023
“Network Infrastructure maintained
focus in 2023 – despite market-driven
challenges in the latter part of the
year – continuing to bring innovative
technologies to customers worldwide.”
↗
FEDERICO GUILLÉN
PRESIDENT, NETWORK INFRASTRUCTURE
IP Networks is the leading global vendor in IP edge routing in
EMEA(2) and holds the number two position in the global total
routing market (excluding China)(3). The business delivers high-
performance IP access, aggregation, edge and core routing
solutions with a focus on service provider, mission-critical
enterprise, and webscale networks. Named a ‘leader’ and
‘outperformer’ in 2023 for data center fabric solutions by
Gigaom, we deliver advanced data center networking solutions
for telco, webscale and enterprise cloud requirements. In 2023,
we continued to lead the market in next generation 800 Gigabit
Ethernet IP routing, announcing wins with Nomios Group for
the GÉANT European research network and with etisalat by
e& UAE. We were chosen to deploy 800GE links in the world’s
fastest live supercomputing network showcase at the SC 2023
conference. IP Networks expanded its portfolio during the
year with the launch of the 7730 Service Interconnect Router
product family and FPcx fully programmable routing silicon.
This will bring the power of Nokia’s routing portfolio to new
parts of the network and new mission-critical and CSP
customers.
Optical Networks is a leader in optical transport networks for
metro, regional and long-haul applications and collaborates
with our Submarine Networks on innovation-led subsea
applications. We hold the number two position in the optical
market worldwide, excluding China(4). We have more than
100 customers for our fifth generation Photonic Service Engine
coherent digital signal processor, PSE-V, which was launched in
2020. And, in Q1 2023, we announced the PSE-6s, a ground-
breaking new solution that sets new milestones in scale,
performance and sustainability for optical transport networks.
These include unmatched 2.4Tb/s scale; three times the
previous reach for 800 Gigabit per second (Gb/s) wavelengths
and sustainable network evolution with 60 percent less network
power consumption per 100 Gbit equivalent, by comparison
with earlier generations. PSE-6s was used by GlobalConnect to
demonstrate a record-breaking 1.2Tb/s coherent transmission
over a single wavelength in a live network and has also been
demonstrated in live networks by customers including Colt
and network wholesaler, lyntia.
Submarine Networks continues to be a leader in the growing
undersea telecoms networks segment(5), which today carries
99% of worldwide internet traffic. As the industry’s only
end-to-end turnkey supplier, Submarine Networks is able
to capitalize on projects from a diverse range of customers
including CSPs, hyperscalers, private investors and energy
solutions companies. With a substantial backlog of projects
supporting demand in 2024 and 2025, Submarine Networks
has significant long-term prospects, which we are addressing
with investments in R&D in areas including capacity increase,
terrestrial/submarine integration and solutions in the area
of environmental standard development.
Competition
Our competitors include Huawei and ZTE, along with Calix
and Adtran (Fixed Networks), Cisco and Juniper (IP Networks),
Ciena and Infinera (Optical Networks), and Subcom and NEC
(Submarine Networks).
(1) Number one position globally in xPON OLT shipments and number one in XGS-PON
OLT/ONT globally. Number one in G.fast globally. All data, Dell’Oro, September 2023.
(2) Dell’Oro, 2Q23 four-quarter rolling average.
(3) Dell’Oro 2Q23.
(4) Omdia Q3 2023.
(5) Nokia’s own estimate.
2.4 Tb/s
Optical transport enabled by Nokia’s new PSE-6s super
coherent optical engines
150 million
Passive optical network (PON) lines shipped to broadband
providers around the world by Nokia by end 2023 (includes
5 million XGS-PON and 1 million 25G PON-enabled lines)
65%
Reduction in IP network operations costs with the Nokia
Network Services Platform network automation platform

Business overview | Corporate governance | Operating and financial review and prospects | General facts on Nokia | Financial statements | Other information | 24 | |||||||
Business groups continued
Nokia Annual Report on Form 20-F 2023

Mobile
Networks
Mobile Networks creates products and services
covering all mobile technology generations.
Its portfolio includes products for radio access
networks and microwave radio links for transport
networks, solutions for network management,
as well as network planning, optimization, network
deployment and technical support services.
2023 in brief
In 2023, Mobile Networks net sales declined 8% to
EUR 9.8 billion. We delivered a segment operating margin
of 7.4% thanks to improved product cost competitiveness,
cost control measures, lower variable pay and strong
execution.
■Reached 319 commercial 5G deals and had more than
710 private wireless customers, with 159 in 5G
■Launched new AirScale massive MIMO radios and ultra-
performance AirScale baseband powered by ReefShark,
bringing higher capacity and connectivity, network
performance, power efficiency and easy deployment
■Launched anyRAN to drive Cloud RAN partnerships
enabling flexibility for mobile network operators
and enterprises
■Announced acquisition of Fenix Group in the US,
which strengthens our offering to the defense sector
■Developed new sales channels for Private Wireless
networks via partnerships with Cisco, HPE/Athonet
and Microsoft Azure
Market overview
The estimated Mobile Networks addressable market(1) for 2023
was EUR 43 billion and is estimated to have declined 13% in
2023. At the end of 2022 this market was expected to grow
5% in FY2023.
Nokia was impacted by industry-wide macroeconomic
uncertainty in 2023, resulting in customers pausing spending,
especially in North America. The resulting drop in revenues
was partly offset by India’s rapid 5G deployment. The market
outlook continues to be uncertain, but we see a substantial
need for operators to invest in 5G globally with only
approximately 25% of the potential mid-band 5G high-capacity
base stations so far deployed outside China. We also see
opportunities to grow in Private Wireless networks, Cloud RAN,
and 3GPP RAN solutions for the defense sector.
Business overview and organization
Despite the challenging macroeconomic environment and
losing the RAN business with AT&T in the United States, Nokia
continued to grow its Radio Access Networks market share.
According to Dell’Oro, Nokia has increased its 5G RAN market
share (excl. China) faster than any competitor since Q1 2022.(2)
While continuing major 5G deployments for Bharti Airtel and
Reliance Jio in India, Nokia announced new 5G deals in 2023,
for example, with MTN in South Africa, Orange and Zain in
Jordan, Antina in Singapore, Charter Communications in the
United States, Eastlink in Canada, and Virgin Media O2 in the
United Kingdom. Nokia was also selected by Deutsche Telekom
for the deployment of a commercial Open RAN network.
This deal marks a significant return for Nokia into Deutsche
Telekom’s network in Germany. At the same time, against the
backdrop of a challenging market outlook, we began to take
proactive measures to reduce our cost base to secure long-
term profitable growth.
Supporting our strategy to diversify our customer base, we
shared developing new sales channels for Private Wireless
networks via partnerships with Cisco, HPE/Athonet and
Microsoft Azure. We also announced the acquisition of Fenix
Group in the United States, which strengthens our offering
to the defense sector.
In 2023, Mobile Networks launched new additions to its
AirScale radio access network portfolio, powered by the latest
ReefShark System-on-Chip (SoC) technology. Those include
new high-performance Massive MIMO radios as well as new
baseband capacity and control cards, ready for 5G-Advanced
and delivering unprecedented connectivity, capacity, and
energy efficiency.
Business overview | Corporate governance | Operating and financial review and prospects | General facts on Nokia | Financial statements | Other information | 25 | |||||||
Business groups continued
Nokia Annual Report on Form 20-F 2023
↗
TOMMI UITTO
PRESIDENT, MOBILE NETWORKS
“2023 saw Mobile Networks making
progress in securing technology
leadership with new portfolio
launches for high-performance,
energy-efficient wireless networks.
Customer satisfaction scores reached
the highest levels since 2016, and we
also grew our customer base and
took market share, despite the severe
decline of addressable market.”
We also launched anyRAN, a new approach that leverages
collaboration with leading cloud infrastructure and computing
hardware suppliers. The approach offers flexibility of choice
for operators and enterprises on their evolution path towards
Cloud RAN and ensures high performance, energy efficiency,
resiliency, service and feature parity, and security across hybrid
networks of co-existing Cloud RAN and purpose-built RAN.
We continued integrating artificial intelligence and machine
learning capabilities into our products and solutions, for
example in our new network management solutions, as well as
in services where AI/ML-based safety crew checks, digital site
surveys and driverless acceptance solutions improve the
health, safety and service delivery quality of our field teams.
Furthermore, we introduced new radios in our Wavence
microwave transport portfolio, which help expand 5G capacity
and coverage, to support the connectivity needs of
communications service providers, enterprises and industries.
Mobile Networks proactively develops new approaches to
building networks. In 2023 for example, we showcased an
industry-first successful aggregation of 5G Standalone
spectrum using Five Components Carrier Aggregation (5CCA)
in sub-6 GHz spectrum, together with Qualcomm and T-Mobile
in the US. Nokia also achieved sustained average downlink
speeds of over 2 Gbps using millimeter wave spectrum for 5G
Fixed Wireless Access, over a distance of almost 11 kilometers.
With AST SpaceMobile, we achieved 5G cellular broadband
connectivity from space using everyday smartphones with
Nokia technology.
Competition
The RAN market is a highly consolidated market. Our main
competitors are Huawei, Ericsson, Samsung and ZTE, but there
are also a number of smaller competitors competing in specific
technology or regional sub-segments, such as NEC and Fujitsu.
In microwave, our key competitors include Ceragon, NEC and
Aviat, alongside Huawei and Ericsson.
(1)Excluding China, Russia and Belarus.
(2)Dell’Oro Group Inc., Mobile RAN quarterly report 4Q23 (rolling 4Q).
#2
in 4G/5G Radio Access Networks global market share,
excluding China
319
Commercial 5G deals

Business overview | Corporate governance | Operating and financial review and prospects | General facts on Nokia | Financial statements | Other information | 26 | |||||||
Business groups continued
Nokia Annual Report on Form 20-F 2023

Cloud and
Network
Services
Cloud and Network Services (CNS) serves
communications service providers, enterprises,
hyperscale customers, digital developers and
partners. Our strategy is focused on a new
digital ecosystem encompassing 5G Core, secure
autonomous operations, private wireless and campus
edge, Network as Code and SaaS. These fast-growing
areas are important to our customer base, are the
focal point of CNS investment priorities, and reflect
our view of the digital ecosystem that is essential to
5G value creation.
2023 in brief
Net sales declined 4% year-on-year while our operational
discipline contributed to an approximately 3 percentage
point increase in the segment operating margin. These
results were accompanied by a host of customer wins and
deployments, as well as the introduction of new products
and services, including the following key developments:
■Launching our Network as Code platform to accelerate
network programmability and monetization
■Introducing a new 4G and 5G Core Network software solution
to meet the mission critical needs of enterprise verticals
■Seeing Nokia AVA for Energy SaaS solution chosen by O2
Telefónica Germany to curb energy use
■Adding 150 new enterprise campus private wireless
customers, including Husky Terminal and The Ocean Cleanup
■Being selected by Belgium’s Citymesh for our 5G-connected
drone platform to establish the world’s first nationwide
drone network
Market overview
The necessity of monetizing 5G networks and services,
deepening AI into network solutions and management, and
transitioning to as-a-Service models requires our customers
to find new ways to generate returns on their digital assets,
reduce complexity, and mitigate security risks for their
mission-critical networks.
We support that work by delivering cloud-native software
solutions and services that strengthen network efficiency,
self-protection and self-healing, and energy management; by
deploying industrial solutions that drive digital transformation
and Industry 4.0; and by helping our customers automate
network operations and manage security.
The estimated CNS addressable market in 2023 was
approximately EUR 26.8 billion.
Business overview and organization
In 2023, CNS was composed of five units: Business Applications,
Cloud and Cognitive Services, Core Networks, Enterprise Campus
Edge Solutions, and Network Monetization Platform.
In October 2023, Nokia announced operational changes to help
the company execute more quickly on its strategy. As part of that
announcement, CNS made the decision to integrate Core Networks
and Business Applications into three new units: Product &
Engineering, Services & Care, and Emerging Technologies. Those
changes took effect 1 January 2024. The Cloud & Cognitive
Services, Enterprise Campus Edge Solutions, and Network
Monetization Platform units were not impacted by
the organizational changes.
Our growing Software-as-a-Service (SaaS) delivery model
supports each unit to help customers transition to greater
network flexibility and achieve faster time to value.
The Network Monetization Platform unit introduced another
critical ecosystem enabler in September 2023 with our Network
as Code platform that allows application developers and CSPs
to accelerate the work of producing software applications for
new enterprise, industrial and consumer use cases, and
monetizing 5G and 4G network assets beyond basic connectivity.
Business overview | Corporate governance | Operating and financial review and prospects | General facts on Nokia | Financial statements | Other information | 27 | |||||||
Business groups continued
Nokia Annual Report on Form 20-F 2023
“Our consistent focus on helping
customers and partners create new value
and transform their business operations
enabled CNS to deliver another year of
meaningful progress in executing our
strategy and managing our portfolio.
This was highlighted by the launch of
our strategic Network as Code platform
and our announcement to make Red Hat
the primary infrastructure platform for
our Core Network applications.”
↗
RAGHAV SAHGAL
PRESIDENT, CLOUD AND NETWORK SERVICES
During the year, we made solid progress actively managing
our portfolio, with announcements to divest Nokia’s VitalQIP
products to Cygna Labs Corp; to make Red Hat the primary
infrastructure platform for Nokia Core Network applications;
and to sell Nokia’s Device Management and Service
Management Platform businesses to Lumine Group Inc.
Competition
The market in which we compete has vendors and other
industry participants which may on occasion be a customer, a
partner, or a direct competitor, depending on the nature of the
engagement. We are regularly building and nurturing alliances
with partners such as IT vendors, hyperscalers, and systems
integrators, which are increasingly influential in this space.
The competitive environment comprises many networking
companies, infrastructure and application software suppliers,
services specialists, hyperscalers, cloud providers, and a wide
range of industry segment businesses.
In 2023, Nokia was ranked #1 again by Omdia for our Core
portfolio breadth and competitiveness strength(1); rated #1
again in automated assurance by Analysys Mason(2); rated #1 in
network automation software by Appledore Research(3); rated
by Kaleido Intelligence as the #1 Champion in Private Network
Hardware, Private Network Software, and Private Network
Management(4); rated as a leader in service orchestration by
GlobalData(5); and ranked as an industry leader in network
security by GigaOm for our extended detection response
market (XDR) security platform(6).
Nokia had the most CSP customers of 5G Standalone Core
in the industry, with a total of 107 at the end of 2023.
We continued to have marketplace leadership in private
wireless networking with 710 customers; of which 159 are 5G.
(1)Omdia Market Landscape: Core 2023, June 2023.
(2)Analysys Mason, Automated assurance: worldwide market shares 2022, September
2023.
(3)Appledore Research, Leading Suppliers in Network Automation Software, June 2023
(4)Kaleido Intelligence, Connectivity Vendor Hub: Private Networks 2023, 24 October,
2023.
(5)GlobalData, Network Service Orchestration: Competitive Landscape Assessment,
August 2023.
(6)GigaOM, GigaOm Radar for Extended Detection and Response (XDR), April 2023.
Nokia had the most CSP customers of 5G
Standalone Core in the industry, with
107
at the end of 2023
We continued to have marketplace leadership
in private wireless networking with more than
710
customers; of which
159
are 5G
Business overview | Corporate governance | Operating and financial review and prospects | General facts on Nokia | Financial statements | Other information | 28 | |||||||
Business groups continued
Nokia Annual Report on Form 20-F 2023


Nokia
Technologies
Nokia Technologies is responsible for managing
Nokia’s patent portfolio and monetizing Nokia’s
intellectual property, including patents, technologies
and the Nokia brand.
2023 in brief
Net sales for the full year decreased 32% to EUR 1 085 million
and segment operating profit decreased 39% to
EUR 734 million. Significant progress was made with
smartphone license renewals and expansion into
growth areas:
■Drove innovation, filing patents on over 2 300 new
inventions, and reaching 6 000 patent families declared
as essential to the 5G standard
■Signed over 50 new patent license agreements including
new agreements with Apple and Samsung
■Expanded patent licensing efforts into new areas such
as video streaming
■Our voice codec was selected as the Immersive Voice
and Audio Services (IVAS) standard by the Third
Generation Partnership Project (3GPP)
■Commenced legal action against Amazon and HP for the
unauthorized use of Nokia’s video-related technologies.
Market overview
Nokia Technologies is responsible for managing Nokia’s
patent portfolio and monetizing Nokia’s intellectual property,
encompassing patents, technologies and the Nokia brand.
This effort builds on Nokia’s continued innovation leadership,
long-term investment in research and development, and
decades of driving technology standards development.
Licensees pay royalty fees for the use of our technology,
which we reinvest, along with additional investment, into
developing the next generation of inventions.
Net sales for the full year decreased 32% to EUR 1 085 million
and segment operating profit decreased 39% at EUR 734
million. We signed over 50 new patent license agreements
across our licensing programs, including new agreements
with Apple and Samsung, and continued to make progress in
our patent licensing growth areas with new deals in IoT and
Multimedia. And at the beginning of 2024, we agreed new 5G
cross-license agreements with OPPO and vivo, resolving all
pending patent litigation between the parties. Nokia will receive
royalty payments from OPPO and vivo, along with catch-up
payments to cover non-payment during the dispute period.
Business overview and organization
Nokia Technologies has three business areas: Patent Licensing
of Nokia’s patent portfolio, Technology Licensing of Nokia’s
technologies for integration into consumer devices, and Brand
Partnerships for licensing the Nokia brand.
Patent Licensing: We manage the Nokia patent portfolio,
working with other Nokia business groups, and continue to
grow our patent licensing and monetization activities, which
drive most of Nokia Technologies’ net sales. The core of our
business is the mobile devices licensing program, where we
have agreements with most major smartphone vendors. We
also have patent licensing programs for automotive, consumer
electronics, IoT and video services.
Technology Licensing: We license our OZO Audio and OZO
Playback multimedia technologies to smartphone and camera
manufacturers, and drive advanced audio and video research
and standardization, along with product incubation for new,
immersive voice and video solutions.
Business overview | Corporate governance | Operating and financial review and prospects | General facts on Nokia | Financial statements | Other information | 29 | |||||||
Business groups continued
Nokia Annual Report on Form 20-F 2023
“We are delighted to have signed new
patent license agreements with Apple
and Samsung this year. Together
these provide long-term financial
stability to our licensing business.”
↗
JENNI LUKANDER
PRESIDENT, NOKIA TECHNOLOGIES
Brand Partnerships: Nokia has a strategic agreement with HMD
Global Oy (HMD) granting HMD an exclusive global license to
create Nokia-branded mobile phones and tablets. Under the
agreement, Nokia receives royalty payments from HMD for
sales of Nokia branded mobile phones and tablets, covering
both brand and patent licensing. The licensing agreement will
expire by March 2026. In September 2023, HMD announced
plans to transition to a multi-brand strategy which will include
an HMD original range along with Nokia branded phones.
Innovation and standards leadership
Nokia has defined many of the fundamental technologies used
in virtually all mobile devices and has a leading role in open
standardization. Since 2000, Nokia has invested around
EUR 150 billion in research and development (R&D). As a result,
we own one of the broadest and strongest patent portfolios
in the telecommunications sector with around 20 000 patent
families (each family can comprise several individual patents).
We own a leading share of Standard Essential Patents (SEPs) in
every generation of cellular standards, with over 6 000 patent
families declared as essential to the 5G standard. Our portfolio
also covers significant multimedia assets, particularly in video
compression technology, which allows large files to be shared
across the internet. The work of Nokia’s inventors in video
research and standardization has been recognized with
numerous prestigious awards, including five Technology &
Engineering Emmy® Awards.
Our inventors also continue to lead in voice communication.
In 2023, the Third Generation Partnership Project (3GPP)
selected the Immersive Voice and Audio Services (IVAS) codec,
developed together with our partners, as the next generation
voice coding standard. IVAS brings spatial audio to mobile
communications for the first time, enabling more immersive
calls by capturing and sharing the full spatial audio scene.
Nokia was one of the first companies in the world to achieve
the globally recognized ISO 9001 certification for our high-
quality patent portfolio management processes. Our patent
portfolio has a long lifetime, with the vast majority of patents
still in force in ten years’ time. We continue to refresh our
portfolio with new inventions every year. In 2023, we filed
patent applications on more than 2 300 new inventions,
enabling 5G networks, connected 5G devices and more.
As we continue to invest heavily in R&D and standardization,
the annual number of filings is expected to grow.
6 000+
patent families declared as essential to the 5G standard
5 000+
multimedia inventions
Business overview | Corporate governance | Operating and financial review and prospects | General facts on Nokia | Financial statements | Other information | 30 | |||||||
Business groups continued
Nokia Annual Report on Form 20-F 2023

Supply chain,
sourcing and
manufacturing
In 2023, Nokia’s supply chain delivery capability was
fully restored after the previous years’ constraints.
This year, we focused on managing customer demand
and further developing our risk management capabilities.
We continued to optimize our manufacturing,
distribution and supplier network across the regions.
Nokia’s supply chain is essential for our customers, our
business, and for managing customer demand and supply for
our hardware, software and contract manufactured products.
Our end-to-end operations include sourcing, demand and
supply planning, manufacturing, distribution and logistics.
In 2023, we purchased over EUR 13 billion worth of products
and services from around 10 000 different suppliers.
While the volatile geopolitical operating environment continued
to pose challenges to our supply chain management in 2023,
global semiconductor shortages no longer created similar
disruptions as in the past few years.
Focus on risk and cost management
Throughout 2023, we saw a softening of the global demand for
our equipment, linked to the overall macroeconomic situation,
as well as inventory digestion by some customers. In this
context, we continued to work closely with our customers
to form the best possible forecast outlook in the mid and
long term. In addition, we had a strong focus on inventory
management to offset potential excess risks.
Furthermore, we developed our risk management capabilities
supported by increased digitalization and automation
to navigate the rapidly changing business environment.
Inventories and safety buffers were largely kept upstream
on a component level, increasing the flexibility to react to
any potential short-term product type changes.
Cost inflation throughout the supply chain continued to impact
our margins, but through sustained focus on improving our
product cost and careful management of our customer pricing,
we were able to keep this under control.
Building resilience through strong
partnerships and a regional approach
As we further develop a robust and sustainable supply
chain that can best serve our customers, maintaining focus
on resilience is critical. We continuously optimize our
manufacturing, distribution and supplier network across the
regions in which we operate to better serve our customers.
We also further leverage artificial intelligence and machine
learning capabilities to better develop our supply chain and
factory network.
Our geographically dispersed manufacturing network consists
of both our own manufacturing (18% of the network) and
contract manufacturing partners to minimize geographic and
geopolitical risks. Our network is strategically located around
the world which breaks down by number of sites as: Europe
23%, Asia Pacific, Japan/India 30%, China 35% and the
Americas 13%. Each year our spending by location will vary
depending on our regional demand and in 2023 our spending
was approximately broken down as: Europe 27%, Asia Pacific,
Japan/India 42%, Greater China 18% and Americas 13%.
Our regional approach will not only enable us to deliver
a more rapid response to our customers’ needs, but also
reduce transportation costs and CO2 emissions.
Business overview | Corporate governance | Operating and financial review and prospects | General facts on Nokia | Financial statements | Other information | 31 | |||||||
Supply chain, sourcing and manufacturing
Nokia Annual Report on Form 20-F 2023

Sustainability enablement and innovation
We clearly communicate our Third-party Code of Conduct and Nokia Supplier Requirements,
incorporating the Responsible Business Alliance (RBA) Code of Conduct requirements, to our
suppliers. These include standards for responsible sourcing in key areas such as the environment
and human rights. Adherence to the standards is checked through audits and EcoVadis
documentation assessments, before being followed-up via one-on-one sessions and webinars
on various ESG topics.
In 2023, we conducted supplier on-site audits to ensure good visibility over labor rights, health
and safety and environmental issues. The number of audits significantly increased during 2023
as COVID-related restrictions were removed.
We are committed to cutting greenhouse gas emissions across our value chain by 50% by 2030,
in line with our science-based target. Our own factories are on track to reach 100% renewable
electricity by 2025. We also work closely with the entirety of our supply chain to develop new
digital solutions and product innovations to cut emissions.
In 2023, we continued to work with our electronics manufacturing services suppliers to track
their roadmap activities as we look to achieve the mutually agreed target that the Nokia portion
of their manufacturing reaches net zero by 2030. We also expanded deep dives into the
roadmap designs for our energy-intense component supplier categories such as integrated
circuits, semi-discretes, and printed wiring boards. As part of our circularity program, we
introduced recycled material content targets to our mechanical suppliers and we recognized
supplier climate and circularity innovations via our Supplier Diamond Award.
“Design for Environment” is an integral part of our supply chain sustainability strategy. It aims
to ensure Nokia products are in line with our policies and goals for product stewardship and
environmental sustainability. We therefore continued to collaborate with our suppliers to
encourage sustainable solutions in transportation, logistics and packaging, using alternative
materials and optimized designs to deliver sustainable product packaging, reducing use of virgin
plastics, and increasing recycled content materials. As an example, this year we have deployed
FiberFlute and honeycomb cardboard solutions to replace plastic cushions in some product
deliveries. Moreover, we are piloting other fiber-based solutions to replace plastic in our repair
centers and are studying implementation on a wider scale.
Supply chain logistics is one of the areas in which we constantly look for innovative ways to
reduce our carbon footprint. As an example, together with DHL Global Forwarding (DGF), we
redesigned one of our key intercontinental logistics routes. Using a combination of transport
modes, we were able to reduce the use of air freight with a resulting 68% reduction in transport
carbon emissions compared to the previous logistics model.
We are committed to prioritizing and strengthening resilience and sustainability across the end-
to-end supply chain to help us deal effectively with challenges that arise. See the “Sustainability
and corporate responsibility” section for more information on Nokia’s sustainability targets and
achievements, including those related to supplier sustainability.
Own manufacturing
As of 31 December 2023, the production capacity for sites owned by us is noted below:
Country | Location and products(1) | Productive capacity, net (m2)(2) |
China | Suzhou: radio frequency systems(3) | 13 500 |
Finland | Oulu: base stations | 10 000 |
France | Calais: submarine cables | 61 000 |
Germany | Hannover: radio frequency systems(4) | 23 500 |
India | Chennai: base stations, radio controllers and transmission systems, fixed networks | 15 500 |
UK | Greenwich: submarine cables | 11 000 |
(1)We consider the production capacity of our manufacturing network to be sufficient to meet the requirements of our business.
The extent of utilization of our manufacturing facilities varies from plant to plant and from time to time during the year. None of
these facilities is subject to a material encumbrance. During 2023, Nokia disposed of the following sites: 1) Trignac: radio
frequency systems (France), 7 300 m2 net productive capacity, 2) Meriden: radio frequency systems (USA), 31 000 m2 net
productive capacity, and 3) Bydgoszcz: remanufacturing, product integration (Poland), 15 200 m2 net productive capacity. During
2022, manufacturing activities ended at the following site: Kilsyth: radio frequency systems (Australia), 5 400 m2 net productive
capacity.
(2)Production capacity equals the total area allotted to manufacturing and to the storage of manufacturing-related materials.
(3)In December 2022, Nokia entered into an agreement regarding the disposal of this site, and during 2023, Nokia partially disposed
of the site. As of 31 December 2023, the site’s productive capacity totaled 27 000 m2, of which the net productive capacity
attributable to Nokia was 13 500 m2. The disposal of the remaining net productive capacity is expected to be completed during
2024.
(4)Nokia has entered into an agreement on the disposal of this site. The disposal is expected to be completed during 2024.
Business overview | Corporate governance | Operating and financial review and prospects | General facts on Nokia | Financial statements | Other information | 32 | |||||||
Supply chain, sourcing and manufacturing continued
Nokia Annual Report on Form 20-F 2023

Corporate
governance
General Meeting of Shareholders | |
Board of Directors | |
Group Leadership Team and the President and CEO | |
Remuneration | |
Remuneration Report 2023 | |
Letter from the Chair of the Personnel Committee of the Board | |
The updated Remuneration Policy for the Board of Directors | |
The updated Remuneration Policy for the President and CEO | |
Remuneration of the Nokia Group Leadership Team in 2023 | |
Business overview | Corporate governance | Operating and financial review and prospects | General facts on Nokia | Financial statements | Other information | 33 | |||||||
Nokia Annual Report on Form 20-F 2023
Select highlights in our corporate governance during 2023 ■Our 2023 Annual General Meeting saw a record number of shareholders and votes represented and strong shareholder support for all the Board’s proposals. ■We were proud to lead the introduction of the individual director election method in the Finnish market and provide our shareholders with the opportunity to consider each candidate separately in our 2023 Annual General Meeting. ■We implemented the Executive Officer Clawback Policy, meeting the NYSE listing standards issued in response to the US Securities and Exchange Commission’s 2023 rules implementing the incentive-based compensation recovery provisions of the Dodd-Frank Act. In addition, we refreshed our all-employee Clawback Policy on incentive compensation. ■We were pleased to host multiple meetings with our largest shareholders to discuss Nokia’s sustainability, remuneration and governance approach. | ||
This corporate governance statement is prepared in
accordance with Chapter 7, Section 7 of the Finnish Securities
Markets Act (2012/746, as amended) and the Finnish
Corporate Governance Code 2020 (the “Finnish Corporate
Governance Code”).
Regulatory framework
Our corporate governance practices comply with Finnish laws
and regulations, our Articles of Association approved by the
shareholders and corporate governance guidelines (“Corporate
Governance Guidelines”) adopted by the Board of Directors.
The Corporate Governance Guidelines reflect our commitment
to strong corporate governance. They include the directors’
responsibilities, the composition and election of the members
of the Board and its Committees, and certain other matters
relating to corporate governance. We also comply with the
Finnish Corporate Governance Code adopted by the Securities
Market Association.
We follow the rules and recommendations of Nasdaq Helsinki
and Euronext Paris as applicable to us due to the listing of our
shares on these exchanges. Furthermore, as a result of the
listing of our American Depositary Shares on the New York
Stock Exchange (NYSE) and our registration under the US
Securities Exchange Act of 1934, we follow the applicable US
federal securities laws and regulations, including the Sarbanes-
Oxley Act of 2002 as well as the rules of the NYSE, in particular
the corporate governance standards under Section 303A of the
NYSE Listed Company Manual. We comply with these standards
to the extent such provisions are applicable to us as a foreign
private issuer.
To the extent compliance with any non-domestic rules would
conflict with the laws of Finland, we are obliged to comply with
Finnish laws and applicable regulations. There are no significant
differences in the corporate governance practices applied by
Nokia compared with those applied by US companies under the
NYSE corporate governance standards with the exception that
Nokia complies with Finnish law with respect to the approval of
equity compensation plans. Under Finnish law, stock option
plans require shareholder approval at the time of their launch.
All other plans that include the delivery of company stock in
the form of newly issued shares or treasury shares require
shareholder approval at the time of delivery of the shares
unless shareholder approval has been granted through an
authorization to the Board, a maximum of five years earlier.
The NYSE corporate governance standards require that equity
compensation plans are approved by the company’s
shareholders. Nokia aims to minimize the necessity for, or
consequences of, conflicts between the laws of Finland and
applicable non-domestic corporate governance standards.
In addition to the Corporate Governance Guidelines, the
Committees of the Board have adopted charters that define
each Committee’s main duties and operating principles. The
Board has also adopted the Code of Conduct that applies
to directors, executives, and employees of Nokia, as well as
employees of Nokia’s subsidiaries and affiliated companies
(such as joint ventures) in which Nokia owns a majority of the
shares or exercises effective control. Furthermore, the Board
has adopted the Code of Ethics and Executive Officer Clawback
Policy applicable to our key executives, including the President
and CEO, CFO and Corporate Controller.
Business overview | Corporate governance | Operating and financial review and prospects | General facts on Nokia | Financial statements | Other information | 34 | |||||||
Corporate governance statement
Nokia Annual Report on Form 20-F 2023
Corporate governance
statement
“In 2023, we continued delivering on Nokia’s commitment to strong corporate governance
and related practices. To do that, the activities of the Board of Directors are structured to
develop the Company’s strategy and to enable the Board to support and oversee
management on its delivery within a transparent governance framework.”
Main corporate governance bodies of Nokia
Pursuant to the provisions of the Finnish Limited Liability
Companies Act (2006/624, as amended) (the “Finnish Companies
Act”), the legislation under which Nokia operates, and Nokia’s
Articles of Association, the control and management of Nokia
are divided among shareholders at a general meeting, the
Board, the President and CEO and the Group Leadership Team,
chaired by the President and CEO.
General Meeting of Shareholders
Nokia’s shareholders play a key role in corporate governance,
with our Annual General Meeting offering a regular opportunity
to exercise their decision-making power in Nokia. In addition,
at the meeting the shareholders may exercise their right to
speak and ask questions.
Each Nokia share entitles a shareholder to one vote at general
meetings of Nokia. The Annual General Meeting decides, among
other things, on the election and remuneration of the Board,
the adoption of annual accounts, the distribution of retained
earnings shown on the balance sheet, discharging the
members of the Board and the President and CEO from liability,
as well as on the election and fees of the external auditor and
the sustainability reporting assurer. The Remuneration Policy is
presented to the general meeting at least every four years and
the Remuneration Report annually. Resolutions of the general
meeting regarding the policy and the report are advisory
in nature.
In addition to the Annual General Meeting, an Extraordinary
General Meeting may be convened when the Board considers
such a meeting to be necessary, or when the provisions of
the Finnish Companies Act mandate that such a meeting must
be held.
The Finnish Companies Act was amended on 11 July 2022 to
enable limited liability companies to hold hybrid and virtual-
only general meetings. A virtual general meeting, as defined by
the Finnish Companies Act, is a meeting held without a physical
meeting venue, where shareholders must be able to exercise
their shareholder rights in full by virtual means, including voting
in real time and asking questions orally during the meeting.
We believe the Finnish legislation can be considered a leading
example of protecting shareholders’ rights in virtual general
meetings. Once reliable technical methods for automated
foreign shareholder identification become available in Finland,
virtual general meetings are expected to improve the position
of nominee-registered private shareholders residing outside
of Finland, who may have been unable to attend the general
meeting in person or be represented by proxy. The benefits of
virtual general meetings would further include the ability of the
Company to hold a general meeting also under extraordinary
external circumstances such as navigating through restrictions
on physical gatherings.
In accordance with the Finnish Companies Act, the articles
of association must be amended to hold a general meeting
virtually, necessitating a two-thirds qualified majority of shares
and votes. After consulting with its largest shareholders,
Nokia is proposing to the Annual General Meeting 2024 such
amendment to its Articles of Association to allow virtual
meetings in extraordinary external circumstances and to be
prepared for all general meeting formats. Having the option of
virtual meetings included in the Articles would not preclude in-
person meetings and shareholders’ rights would always be
protected as a first priority regardless of the meeting format.
Annual General Meeting 2023 and 2024
The Annual General Meeting 2023 took place at Messukeskus
Siipi, the Helsinki Expo and Convention Centre, on 4 April 2023.
We were pleased to see the record number of votes cast as well
as the strong shareholder support received for all the Board’s
proposals at the Meeting. For the second consecutive year, the
turnout for the vote stood at a record high level. Also, a record
number of 108 603 shareholders representing approximately
3 190 million shares and 56.6% of all the shares and votes
in the Company participated the Annual General Meeting.
On the other hand, fewer shareholders participated in person
compared to the years before the COVID-pandemic as the
Company was offering an opportunity to cast votes in advance
and follow the meeting as well as ask questions through a live
webcast. All of the Board’s proposals were supported by more
than 92% of the votes cast.
Nokia Corporation’s Annual General Meeting 2024 is planned to
be held on 3 April 2024. The Board’s proposals to the Annual
General Meeting 2024 were published on 25 January 2024.
Business overview | Corporate governance | Operating and financial review and prospects | General facts on Nokia | Financial statements | Other information | 35 | |||||||
Corporate governance statement continued
Nokia Annual Report on Form 20-F 2023
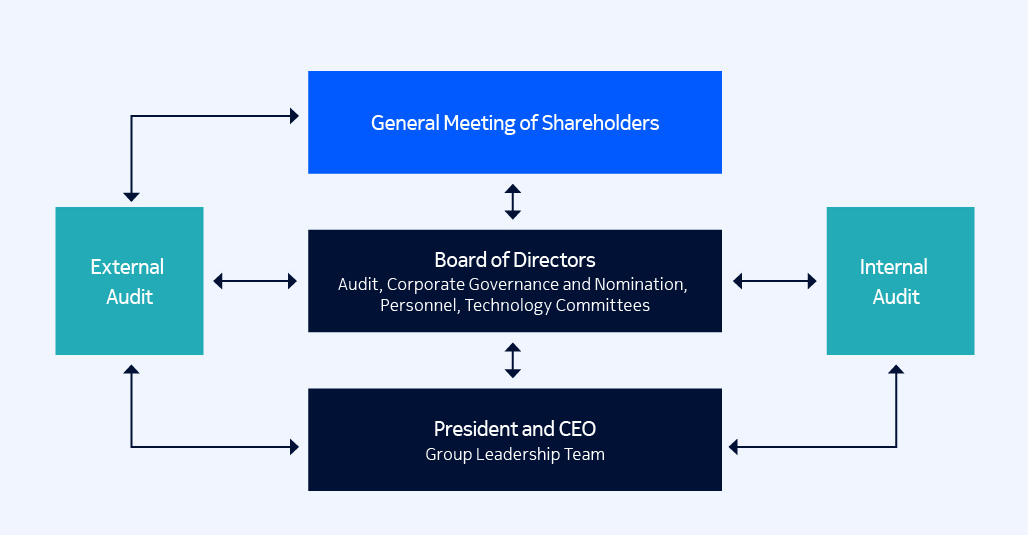
Corporate governance framework
Board of Directors
The operations of Nokia are managed under the direction of
the Board, within the framework set by the Finnish Companies
Act and Nokia’s Articles of Association as well as any
complementary rules of procedure as defined by the Board,
such as the Corporate Governance Guidelines and the charters
of the Board’s Committees.
Election and composition of the Board of Directors
Pursuant to the Articles of Association of Nokia, we have
a Board that is composed of a minimum of seven and a
maximum of 12 members. The members of the Board are
elected at least annually at each Annual General Meeting.
The candidates are considered individually and those receiving
the most votes shall be elected pursuant to the Finnish
Companies Act. The term of the Board members begins at the
close of the general meeting at which they were elected, or
later as resolved by the general meeting, and expires at the
close of the following Annual General Meeting. The Annual
General Meeting convenes by 30 June annually.
Our Board’s leadership structure consists of a Chair and Vice
Chair elected annually by the Board and confirmed by the
independent directors of the Board from among the Board
members upon the recommendation of the Corporate
Governance and Nomination Committee. The Chair of the
Board has certain specific duties as stipulated by Finnish law
and our Corporate Governance Guidelines. The Vice Chair of
the Board assumes the duties of the Chair of the Board in the
event the Chair is prevented from performing his or her duties.
The independent directors of the new Board also confirm
the election of the members and chairs for the Board’s
Committees from among the Board’s independent directors
upon the recommendation of the Corporate Governance and
Nomination Committee and based on each Committee’s
member qualification standards. These elections take place at
the Board’s assembly meeting following the general meeting.
The Corporate Governance and Nomination Committee aims
to continually renew the Board to have an efficient Board
of international professionals with a diverse mix of skills,
experience and other personal qualities in line with the diversity
principles established by the Board. The Corporate Governance
and Nomination Committee considers potential director
candidates based on the short- and long-term needs of the
Company. In the process of identifying and selecting the
candidates matching these needs and desired profiles,
the Committee engages search firms and external advisers.
Board independence
In accordance with the Corporate Governance Guidelines
adopted by the Board of Directors, the Nokia Board shall have
a majority of directors who meet the criteria for independence
as defined by the Finnish Corporate Governance Code
(independent of both the Company and any significant
shareholders who hold at least 10% or more of the total shares
or voting rights of the Company) and the rules of the NYSE.
Furthermore, all of the members of the Board Committees
shall be independent Directors under the relevant criteria for
independence required by the Finnish Corporate Governance
Code and the applicable rules of the NYSE.
The Board will monitor its compliance with these requirements
for director independence on an ongoing basis. Each independent
director is expected to notify the Chair of the Corporate
Governance and Nomination Committee, as soon as reasonably
practicable, in the event that his or her personal circumstances
change in a manner that may affect the Board’s evaluation of
such director’s independence. The Board of Directors evaluates
the independence of its members annually and, in addition
to this, on a continuous basis with the assistance of the
Corporate Governance and Nomination Committee.
Board diversity
The Board has adopted principles concerning Board diversity
describing our commitment to promoting a diverse Board
composition and how diversity is embedded into our processes
and practices when identifying and proposing new Board
candidates, as well as when proposing re-election of current
Board members.
At Nokia, diversity is not a static concept but rather a relevant
mix of required elements for the Board as a whole that evolves
with time based on, among other things, the relevant business
objectives and future needs of Nokia. Board diversity is treated
as a means of improvement and development rather than
an end in itself. Diversity of our Board is considered from a
number of aspects including, but not limited to, skills and
experience, tenure, age, nationality, ethnicity, cultural and
educational backgrounds, self-declared gender identity,
as well as other individual qualities.
Nokia acknowledges and supports the resolution adopted
by the Finnish Government on 17 February 2015 on gender
equality on the boards of directors of Finnish large and mid-cap
listed companies, as well as the board gender balance directive
adopted by the European Parliament on 22 November 2022
and its forthcoming national implementation in the Finnish
Companies Act and in the Finnish Corporate Governance Code.
We report annually on our objectives relating to equal
representation of genders, the means to achieve them,
and the progress we make. We have met our aim to have at
least 40% of the Director positions held by members of
underrepresented genders. In the current Board composition,
50% of the Board members are female and in the Board
composition proposed to the Annual General Meeting 2024,
40% of the Board members are female.
Director time commitments
The Corporate Governance and Nomination Committee
monitors closely the time commitments of the Board members
and annually reviews the Directors’ attendance rate at the
Board and Committee meetings to ensure they are able to
devote the appropriate time to the Company to carry out
their duties and responsibilities. The Corporate Governance
Guidelines of the Board include numerical limits and a process
for pre-clearance of new roles in public companies. Directors
should not serve on more than four other boards of public
companies in addition to the Nokia Board, and on no more
than three other boards of public companies in addition to the
Nokia Board, in cases where they serve as board chair or lead
independent director outside the Nokia Board. The Audit
Committee members should not serve on more than two other
audit committees of public companies in addition to the Nokia
Audit Committee. No positions in excess of these limits may be
held without prior consent by the Chair of the Board and the
Chair of the Corporate Governance and Nomination Committee
determining that such positions would not impair the Director’s
service on the Nokia Board or Audit Committee.
The Corporate Governance and Nomination Committee
will annually, ahead of preparing the proposal on the Board
composition, review and assess the Directors’ current and
planned time commitments outside the Company to seek
affirmation that all Directors acknowledge the time
commitment principles set forth in the Corporate
Governance Guidelines of the Board.
Business overview | Corporate governance | Operating and financial review and prospects | General facts on Nokia | Financial statements | Other information | 36 | |||||||
Corporate governance statement continued
Nokia Annual Report on Form 20-F 2023
Current members of the Board of Directors
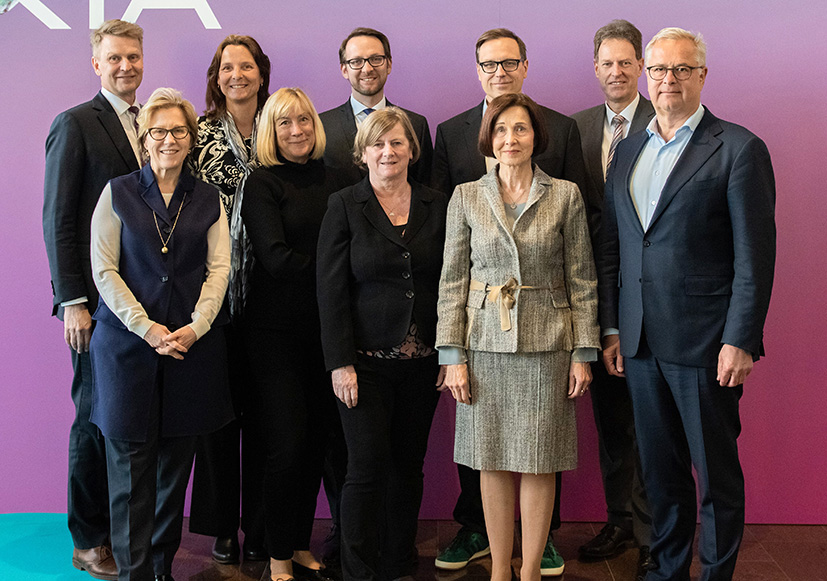
The Annual General Meeting held on 4 April 2023 elected
ten members to the Board for a term ending at the close
of the next Annual General Meeting. Sari Baldauf, Thomas
Dannenfeldt, Lisa Hook, Jeanette Horan, Thomas Saueressig,
Søren Skou, Carla Smits-Nusteling and Kai Öistämö were
re-elected as Board members. Timo Ahopelto and Elizabeth
Crain were elected as new Board members. Following the
meeting, the Board re-elected Sari Baldauf to serve as Chair
and re-elected Søren Skou as the Vice Chair of the Board for
the same term.
The current members of the Board are all non-executive and
for the term that began at the Annual General Meeting 2023,
all Board members were determined to be independent of
Nokia and its significant shareholders under the Finnish
Corporate Governance Code and the NYSE rules, as applicable.
There are currently six different nationalities represented on
the Board and 50% of the Board members are female. In
addition to biographical information of the Board members,
the table in the upper right corner sets forth the number of
shares and American Depositary Shares (ADS) held by the
Board members. As at 31 December 2023, they held a total of
900 190 shares and ADSs in Nokia, representing approximately
0.02% of our total shares and voting rights excluding shares
held by the Nokia Group.
Biographical details of the Board members
Gender | Year of Birth | Nationality | Tenure(1) | Independent of the company and major shareholders | Shares(2) | ADSs(2) | |
Sari Baldauf (Chair) | Female | 1955 | Finnish | 5 | Independent | 290 575 | |
Søren Skou (Vice Chair) | Male | 1964 | Danish | 4 | Independent | 89 325 | |
Timo Ahopelto | Male | 1975 | Finnish | 0 | Independent | 21 418 | |
Elizabeth Crain | Female | 1964 | American | 0 | Independent | 22 771 | |
Thomas Dannenfeldt | Male | 1966 | German | 3 | Independent | 117 597 | |
Lisa Hook | Female | 1958 | American | 1 | Independent | 35 626 | |
Jeanette Horan | Female | 1955 | British | 6 | Independent | 116 476 | |
Thomas Saueressig | Male | 1985 | German | 1 | Independent | 34 705 | |
Carla Smits-Nusteling | Female | 1966 | Dutch | 7 | Independent | 135 973 | |
Kai Öistämö | Male | 1964 | Finnish | 1 | Independent | 35 724 | |
(1)Terms as Nokia Board member before the Annual General Meeting on 4 April 2023. (2)The number of shares or ADSs includes shares and ADSs received as director compensation as well as shares and ADSs acquired through other means. Stock options or other equity awards that are deemed as being beneficially owned under the applicable SEC rules are not included. | |||||||
Experience and skills of the Board members
Business Exec role with P&L responsibility | External boardroom roles/ Governance expertise | Finance and accounting | Legal /Public policy/ Compliance | Communications service provider market segment | Enterprise market segment | Technology | Cybersecurity | Environmental/ Social issues | |
Current Board members | |||||||||
Sari Baldauf | ✔ | ✔ | ✔ | ✔ | ✔ | ✔ | |||
Søren Skou | ✔ | ✔ | ✔ | ✔ | ✔ | ||||
Timo Ahopelto | ✔ | ✔ | ✔ | ✔ | ✔ | ||||
Elizabeth Crain | ✔ | ✔ | ✔ | ✔ | |||||
Thomas Dannenfeldt | ✔ | ✔ | ✔ | ✔ | ✔ | ||||
Lisa Hook | ✔ | ✔ | ✔ | ✔ | ✔ | ✔ | ✔ | ||
Jeanette Horan | ✔ | ✔ | ✔ | ✔ | ✔ | ||||
Thomas Saueressig | ✔ | ✔ | ✔ | ✔ | ✔ | ✔ | ✔ | ||
Carla Smits-Nusteling | ✔ | ✔ | ✔ | ✔ | |||||
Kai Öistämö | ✔ | ✔ | ✔ | ✔ | ✔ | ✔ | |||
Proposed new Board member | |||||||||
Michael McNamara | ✔ | ✔ | ✔ | ✔ | ✔ |
Business overview | Corporate governance | Operating and financial review and prospects | General facts on Nokia | Financial statements | Other information | 37 | |||||||
Corporate governance statement continued
Nokia Annual Report on Form 20-F 2023
Proposed members of the Board of Directors
Proposals of the Board of Directors to the Annual General
Meeting 2024 were published on 25 January 2024. On the
recommendation of the Corporate Governance and Nomination
Committee, the Board proposes to the Annual General Meeting
that the number of Board members be ten. Jeanette Horan has
informed the Committee that she will no longer be available to
serve on the Nokia Board of Directors after the Annual General
Meeting. Consequently, on the recommendation of the
Corporate Governance and Nomination Committee, the Board
proposes that the following nine current Board members be re-
elected as members of the Nokia Board of Directors for a term
ending at the close of the next Annual General Meeting: Timo
Ahopelto, Sari Baldauf, Elizabeth Crain, Thomas Dannenfeldt,
Lisa Hook, Thomas Saueressig, Søren Skou, Carla Smits-Nusteling
and Kai Öistämö.
Furthermore, the Board proposes, on the recommendation
of the Corporate Governance and Nomination Committee,
that Michael McNamara, former Executive Vice President and
Chief Information Officer of Target Corporation, be elected to
the Board for a term ending at the close of the next Annual
General Meeting.
The Corporate Governance and Nomination Committee will
propose in the assembly meeting of the new Board of Directors
that Sari Baldauf be re-elected to serve as Chair of the Board
and Søren Skou be re-elected to serve as Vice Chair of the
Board, subject to their election to the Board of Directors. The
Board composition proposed to the Annual General Meeting
2024 has representation of six nationalities and 40% of the
proposed members are female.
The proposed members of the Board are non-exeucutive and
for the term beginning at the Annual General Meeting 2024
they have been determined to be independent of Nokia
and its significant shareholders under the Finnish Corporate
Governance Code and the rules of the NYSE. Any possible
changes impacting the independence assessment would
be assessed as of the date of the Annual General Meeting.
The Corporate Governance and Nomination Committee has
prepared the composition of the Board of Directors to the
Annual General Meeting 2024 after assessing proposed
Directors’ external time commitments, taking into account
shareholders’ expectations in this regard.
While the prevailing Finnish market practice is to vote on the
proposed Board composition as a slate, some of our investors
have expressed their preference of being able to consider each
director individually in accordance with global market practice.
After leading the related change in market practice, Nokia was
proud to be among the first Finnish listed companies providing
our shareholders with the opportunity to consider each Board
member candidate individually at our Annual General Meeting
2023. We are committed to continue individual director
election in our forthcoming Annual General Meeting 2024
and onwards.
Business overview | Corporate governance | Operating and financial review and prospects | General facts on Nokia | Financial statements | Other information | 38 | |||||||
Corporate governance statement continued
Nokia Annual Report on Form 20-F 2023
Biographical details of our current Board members
 | 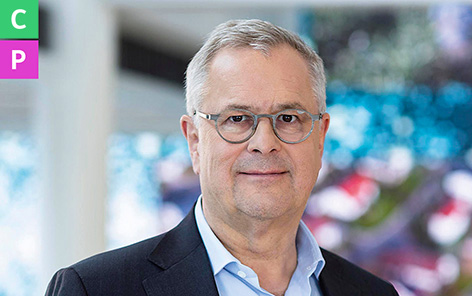 |  |  | ||||
Chair Sari Baldauf | Vice Chair Søren Skou | Timo Ahopelto | Elizabeth Crain | ||||
b. 1955 | b. 1964 | b. 1975 | b. 1964 | ||||
Chair of the Nokia Board since 2020.
Board member since 2018. Member of the
Corporate Governance and Nomination
Committee, the Personnel Committee
and the Technology Committee.
Master of Business Administration, Helsinki
School of Economics and Business
Administration, Finland. Bachelor of Science,
Helsinki School of Economics and Business
Administration, Finland. Honorary
doctorates in Technology (Helsinki
University of Technology, Finland) and
Business Administration (Turku School of
Economics and Business Administration and
Aalto University School of Business, Finland).
Executive Vice President and General
Manager, Networks Business Group, Nokia
1998–2005. Various executive positions
at Nokia in Finland and in the United
States 1983–1998.
Chair of the Board of the Finnish Climate
Leadership Coalition (CLC). Senior Advisor
of DevCo Partners Oy.
Member of the Board of Technology
Industries of Finland 2021–2023. Member
of the Board of Directors of Aalto
University 2018–2023. Member of the
Supervisory Board of Mercedes-Benz
Group AG 2008-2023. Member of the
Supervisory Board of Deutsche Telekom
AG 2012–2018. Chair of the Board of
Directors of Fortum Corporation 2011–
2018. Member of the Board of Directors
of Akzo Nobel 2012–2017.
Vice Chair of Nokia Board since 2022.
Nokia Board member since 2019.
Chair of the Corporate Governance and
Nomination Committee and member
of the Personnel Committee.
MBA (honours), IMD, Switzerland.
Bachelor of Business Administration,
Copenhagen Business School, Denmark.
Maersk International Shipping Education
(M.I.S.E.).
Chief Executive Officer of A.P. Møller –
Mærsk A/S 2016–2022. Chief Executive
Officer of Maersk Line 2012–2016. Chief
Executive Officer of Maersk Tankers
2001–2011. Variety of executive roles,
senior positions and other roles at A.P.
Møller – Mærsk since 1983.
Chair of the Board of the Mærsk
Mc-Kinney Møller Center for Zero Carbon
Shipping (a not-for-profit foundation).
Chair of the Board of HES International.
Chair of of the Board of Controlant hf.
Chair of the Board of Bygma A/S. Member
of the Board of CV Obel A/S. Senior
Advisor to Global Infrastructure Partners
(GIP), Chair of GIP portfolio Companies
VTG GmbH and Skyborn Renewables
GmbH.
Founding Partner of Lifeline Ventures
and early-stage investor. Nokia Board
member since 2023. Member of the
Audit Committee and the Technology
Committee.
Master’s degree in Industrial
Management, Helsinki University of
Technology, Finland.
Head of Strategy and Business
Development, Blyk 2006–2009. Founding
CEO, Vice President of Worldwide
Commercial Operations, CRF Health
2000–2006. Consultant, McKinsey &
Company 1999–2000.
Chair of the Board of Directors of Lifeline
SPAC I Plc. Member of the Board of
Directors of Digital Workforce Services
Plc. Member of the Board of Directors of
Solidium Oy. Member of the Board of
Finnish Business and Policy Forum EVA
and Research Institute for Finnish
Economy (ETLA). Chair of the Board of
Finnish Startup Community. Member
of the Board of Directors of Tietoevry
Corporation 2017–2023. Chair of the
Board of Slush Conference 2018–2023
and member of the Board 2013–2018.
Member of the Board of Business Finland
2014–2020. Member of the Board,
Startup Foundation 2015–2018.
Nokia Board member since 2023.
Member of the Audit Committee and the
Personnel Committee.
MBA, the Wharton School at the
University of Pennsylvania, United States.
Bachelor of Science in Economics, Arizona
State University, United States.
Co-Founder of Moelis & Company; served
as the Chief Operating Officer 2007–
2023 and as a member of the Board of
Directors of Moelis & Company 2017–
2021. Managing Director, Office
of the CEO at UBS Investment Bank
2005–2007. Chief Operating Officer
and Chief Administrative Officer of the
UBS Investment Banking Department
Americas franchise 2001–2005.
Investment Principal, McCown De Leeuw
& Company 2000–2001. Investment
Principal, Morgan Stanley Capital Partners
1997–2000. Vice President, Investment
Banking, Merrill Lynch & Co. 1994–1997.
Associate, Investment Banking, J.P.
Morgan Securities 1992–1994. Analyst,
Merrill Lynch & Co. 1988–1990.
Member of the Board of Directors
and Chair of the Audit Committee
of Exscientia Plc. Trustee Emeritus,
The Royal Academy Trust, London.
Business overview | Corporate governance | Operating and financial review and prospects | General facts on Nokia | Financial statements | Other information | 39 | |||||||
Corporate governance statement continued
Nokia Annual Report on Form 20-F 2023
Biographical details of our current Board members continued
 |  |  | ||||||
Thomas Dannenfeldt | Lisa Hook | Jeanette Horan | ||||||
b. 1966 | b. 1958 | b. 1955 | ||||||
Nokia Board member since 2020. Chair of
the Personnel Committee and member of
the Audit Committee
Degree in Mathematics, University of
Trier, Germany.
Chief Financial Officer of Deutsche
Telekom AG 2014–2018. Chief Financial
Officer of Deutsche Telekom’s German
operations 2010–2014. Various
operational positions (sales, marketing,
customer care, finance and procurement
in fixed and mobile business, national
and international positions) at Deutsche
Telekom 1992–2010.
Chair of the Supervisory Board of
Ceconomy AG and Chair of the
Presidential Committee and Mediation
Committee. Member of the Board of
Advisors at axxessio GmbH.
Member of the Board of Directors of
T-Mobile US 2013–2018 and Buy-In
2013–2018. Chair of the Board of
Directors of T-Systems International
2013–2018 and EE Ltd. 2014–2016.
Nokia Board member since 2022.
Member of the Personnel Committee
and the Corporate Governance and
Nomination Committee.
Juris Doctorate, Dickinson School of Law
at Pennsylvania State University, United
States. Bachelor’s degree in Public Policy,
Duke University, United States.
President and CEO of Neustar, Inc. 2010–
2018 and COO 2008–2010. President
and CEO of Sunrocket, Inc. 2006–2007.
Executive positions at America Online,
Inc. 2000–2004. Previous positions as
Partner at Brera Capital Partners,
managing director of Alpine Capital
Group, LLC., various executive positions
at Time Warner, Inc., legal adviser to the
Chairman of the Federal Communications
Commission, and General Counsel of the
Cable Group at Viacom International, Inc.
Member of the Board of Directors of
Fidelity National Information Services, Inc.
Lead Independent Director of the Board
of Directors of Philip Morris International.
Member of the Board of Zayo Group.
Chair of Advisory Board of Trilantic
Capital Partners. Member of the US
National Security Telecommunications
Advisory Committee. Member of the
Board of Directors of Ritchie Bros.
Auctioneers Inc. 2021–2023, Ping Identity
Holding Corporation 2019–2022,
Partners Group Holdings 2020–2021,
Unisys Corporation 2019–2021, Neustar,
Inc. 2010–2019 and RELX Plc and RELX
NV, 2006–2016.
Nokia Board member since 2017.
Member of the Audit Committee and
the Technology Committee.
MBA, Business Administration and
Management, Boston University, the
United States. BSc, Mathematics,
University of London, United Kingdom.
Various executive and managerial
positions at IBM 1998–2015. Vice
President of Digital Equipment
Corporation 1994–1998. Vice President,
Development of Open Software
Foundation 1989–1994.
Member of the Supervisory Board at
Wolters Kluwer, and the Chair of the
Selection and Remuneration Committee.
Member of the Board of Advisors at
Jane Doe No More, a not-for-profit
organization. Member of the Board of
Directors of the Ridgefield Symphony
Orchestra, a not-for-profit organization.
Member of the Board of Advisors of
Cybereason 2017–2018. Member of the
Board of Directors of West Corporation
2016–2017 and Microvision 2006–2017.
Business overview | Corporate governance | Operating and financial review and prospects | General facts on Nokia | Financial statements | Other information | 40 | |||||||
Corporate governance statement continued
Nokia Annual Report on Form 20-F 2023
Biographical details of our current Board members continued
 |  |  | ||||||
Thomas Saueressig | Carla Smits-Nusteling | Kai Öistämö | ||||||
b. 1985 | b. 1966 | b. 1964 | ||||||
Member of the Executive Board of SAP SE
and Global Head of SAP Product
Engineering. Nokia Board member since
2022. Member of the Technology
Committee.
Degree in Business Information
Technology, University of Cooperative
Education in Mannheim, Germany. Joint
Executive MBA from ESSEC, France and
Mannheim Business School, Germany.
Chief Information Officer of SAP SE
2016–2019, Vice President, Global Head
of IT Services of SAP SE 2014–2016. Held
various positions at SAP in Germany since
2007, including assignment in the SAP
Labs Silicon Valley in Palo Alto, California,
the United States.
Member of the Young Global Leaders of
the World Economic Forum. Member of
the Industry Advisory Board of the
Munich Institute of Robotics and Machine
Intelligence (MIRMI).
Nokia Board member since 2016. Chair of
the Audit Committee and member of the
Corporate Governance and Nomination
Committee.
Master’s Degree in Business Economics,
Erasmus University Rotterdam, the
Netherlands. Executive Master of Finance
and Control, Vrije University Amsterdam,
the Netherlands.
Member of the Board of Directors and
Chief Financial Officer of KPN 2009–2012.
Various financial positions at KPN 2000–
2009. Various financial and operational
positions at TNT/PTT Post 1990–2000.
Member of the Board of Directors and
Chair of the Audit Committee of
Allegro.eu SA. Member of the Board of
Directors of the Stichting Continuïteit
Ahold Delhaize (SCAD) foundation.
Chair of the Board of Directors of TELE2
AB 2013–2023. Lay Judge in the
Enterprise Court of the Amsterdam Court
of Appeal 2015–2022. Member of the
Supervisory Board and Chair of the Audit
Committee of ASML 2013–2021. Member
of the Management Board of the Unilever
Trust Office 2015–2019.
President and CEO of Vaisala Corporation.
Nokia Board member since 2022. Chair of
the Technology Committee and member
of the Corporate Governance and
Nomination Committee.
PhD in computer science, Tampere
University of Technology, Finland.
Chief Operating Officer of InterDigital,
Inc. 2018–2020. Executive Partner of Siris
Capital Group 2016–2018. EVP, Chief
Development Officer at Nokia 2010–
2014. EVP, Devices at Nokia 2008–2010.
EVP, Mobile Phones Business Group at
Nokia 2006–2008. Several previous
positions at Nokia 1991–2006.
Venture Partner of Kvanted Oy. Chairman
of the Board of Fastems Group 2014–
2022. Member of the Board of Directors
of Sanoma Group 2010–2021. Chairman
of the Board of Helvar Oy Ab 2014–2020.
Member of the Board of Directors of
Mavenir Plc. 2017–2018. Member of the
Board of Directors of Digia / Qt Group Oyj
2015–2018. Member of the Board of
Directors of InterDigital, Inc. 2015–2018.
Member of the Board of Directors of
Oikian solutions Oy 2014–2018. Chairman
of the Board, Tampere University
2013–2017. Chairman of the Board of
Directors, Tekes 2012–2014. Member of
the Board of Directors of Nokian Renkaat
Oyj 2008–2010.
Business overview | Corporate governance | Operating and financial review and prospects | General facts on Nokia | Financial statements | Other information | 41 | |||||||
Corporate governance statement continued
Nokia Annual Report on Form 20-F 2023
Operations of the Board of Directors
The Board represents and is accountable to the shareholders
of Nokia. While its ultimate statutory accountability is to the
shareholders, the Board also takes into account the interests
of Nokia’s other stakeholders. The Board’s responsibilities are
active, not passive, and include the responsibility to evaluate
the strategic direction of Nokia, its management policies and
the effectiveness of the implementation of such by the
management on a regular basis. It is the responsibility of the
members of the Board to act in good faith and with due care,
so as to exercise their business judgment on an informed basis,
in a manner that they reasonably and honestly believe to be in
the best interests of Nokia and its shareholders. In discharging
this obligation, the members of the Board must inform
themselves of all relevant information reasonably available to
them. The Board and each Board Committee also have the
power to appoint independent legal, financial or other advisers
as they deem necessary. The Company will provide sufficient
funding to the Board and to each Committee to exercise
their functions and provide compensation for the services
of their advisers.
The Board is ultimately responsible for, and its duties include,
monitoring and reviewing Nokia’s financial reporting process,
the effectiveness of related control and audit functions and the
independence of Nokia’s external auditor, as well as monitoring
the Company’s statutory audit. The Board’s responsibilities
also include overseeing the structure and composition of our
top management and monitoring legal compliance and the
management of risks related to our operations. In doing so, the
Board may set annual ranges and/or individual limits for capital
expenditures, investments and divestitures and other financial
and non-financial commitments that may not be exceeded
without a separate Board approval.
In risk management, the Board’s role includes risk analysis
and assessment in connection with financial, strategy and
business reviews, updates and decision-making proposals.
Risk management policies and processes are an integral part
of Board deliberations and risk-related updates are provided to
the Board on a recurring basis. For a more detailed description
of our risk management policies and processes, refer to the
“Risk management, internal control and internal audit functions
at Nokia—Risk management principles” section.
The Board has the responsibility for appointing and discharging
the President and Chief Executive Officer, Chief Financial
Officer and Chief Legal Officer.
The Board approves and the independent directors of the
Board confirm the compensation and terms of employment of
the President and CEO, subject to the requirements of Finnish
law, upon the recommendation of the Personnel Committee
of the Board. The compensation and terms of employment of
the other Group Leadership Team members are approved by
the Personnel Committee upon the recommendation of the
President and CEO.
Board oversight of environmental and social activities and
governance practices
Under our Corporate Governance Guidelines, the Board
evaluates Nokia’s environmental and social activities and
governance practices, related risks and target setting as well as
their implementation and effectiveness across the Company.
In 2023, the Board reviewed our sustainability strategy and
targets, approved the targets on climate change and diversity
included in the short-term incentive program and monitored
them and other ESG targets, as well as the evolving ESG
requirements and expectations, investor feedback, our
disclosure approach, and Nokia’s net zero strategy and roadmap.
In addition, the Board Committees monitor environmental
and social developments and activities in the Company in
their respective areas of responsibilities. During 2023, the
Audit Committee’s responsibilities included the continued
implementation planning of new climate- and other
sustainability reporting requirements, preparing the proposal
for election of the auditor carrying out the assurance of the
sustainability reporting, and oversight of the ethics and
compliance program and cybersecurity risks and maturity.
The Audit Committee also reviews sustainability disclosures
annually, as well as the information on the use of conflict
minerals in Nokia’s products presented in the annual reports
and the related regulatory filings.
The Personnel Committee oversees human capital
management, including personnel policies and practices
related to Nokia’s culture, physical safety, employee well-being,
diversity, recruiting, development and retention. In 2023,
the Personnel Committee focused, among other things, on a
people risk review, including physical safety and succession
planning, as well as preparing Nokia’s Long-Term Incentive Plan
2024–2026. The Committee recommended to the Board
to include carbon emission reduction in the metrics of the
long-term incentive plan as well as diversity and health and
safety as metrics in the short-term incentive plan. The
Corporate Governance and Nomination Committee assesses
and advises the Board on ESG-related activities and practices,
aiming to enhance the governance structure supporting them.
The Technology Committee reviews how the Company’s ESG
strategy embeds into its technology strategy and roadmaps.
Board oversight of cybersecurity
Nokia group-level security is set up in four domains: product,
service, information, and customer security. While the
oversight of the security risks and their management, including
cybersecurity, is a Board level responsibility in the Company,
the detailed reviews of the different security domains are
allocated to the Committees of the Board. These Committees
are responsible for monitoring and assessing the security,
including cybersecurity-related risks and reporting to the Board
in their respective areas of responsibilities. The responsibilities
of the Audit Committee include oversight of the management
and processes related to the IT and services security risks and
maturity, including security-related controls, compliance,
incident process, disclosures and risk management. The
Technology Committee oversees the product and customer
security risk management. The Committees report to the
Board on a regular basis and prepare recommendations to the
Board, whenever deemed necessary. In addition, the Board
receives regularly updates on cybersecurity.
Business overview | Corporate governance | Operating and financial review and prospects | General facts on Nokia | Financial statements | Other information | 42 | |||||||
Corporate governance statement continued
Nokia Annual Report on Form 20-F 2023
Key areas of focus for the Board’s and its Committees’ activities in 2023
The table below sets out a high-level overview of the key areas of focus for the Board’s and its Committees’ activities during the year.
January | February/March | April | May | July | September/October | November | |
Board | –Business and financial reviews –Q4 and 2022 financials –AGM proposals, incl. profit distribution –Annual Policy and Charter review –Board evaluation –Review of CEO’s performance, remuneration and targets | –Annual report and 20-F –Remuneration Report 2022 | –Annual General Meeting (AGM) and appointing Board Chair, Vice Chair and Committee members –Business and financial reviews –Strategy –Q1 financials | –Business and financial reviews –Strategy –Geopolitical update –Product and customer security update –Digitalization update –Ethics & compliance update –Litigation update –People strategy and Group Leadership Team (GLT) succession approach update | –Business and financial reviews –Q2 financials –Strategy –Annual ESG review | –Annual strategy meeting –Geopraphical market deep-give –Business and financial reviews –Q3 financials | –Business and financial reviews –Strategy –Long-range forecast and annual target setting –Key risks review –GLT succession planning update –Investors’ feedback on governance, remuneration and sustainability |
Corporate Governance and Nomination Committee | –AGM proposals on Board composition and remuneration –Independence review –Corporate governance statement | –Committee compositions –Future Board composition –AGM shareholder feedback | –Planning of Board composition proposal | –Corporate governance and ESG-related developments in regulation –Planning of Board composition proposal –Board evaluation approach | –Board remuneration review and benchmarking –Annual assessment of director commitments –Finalizing Board composition proposal to the AGM –Annual Charter review | ||
Personnel Committee | –Incentive achievements for 2022 –CEO and GLT performance –Incentive targets and objectives for 2023 –Long-term Incentive Plan (LTI) grant proposal for 2023 –Remuneration Report 2022 | –LTI design for 2024–2026 –Equity plan status –AGM shareholder feedback –GLT remuneration –Culture update –GLT succession approach –Clawback Policy related regulation | –Remuneration Policy 2024 structure review –Executive Clawback Policy –LTI design for 2024–2026 –Human capital risk review, including physical safety –Committee adviser’s market and benchmarking update | –Incentive Compensation Clawback Policy –LTI design for 2024–2026 –Human capital update –Remuneration Policy 2024 including shareholder consultation | –2024 incentive targets –LTI Plan 2024–2026 –Investor feedback –Planning of Remuneration Report for 2023 –GLT succession planning –Executive shareholding assessment –Annual Charter review | ||
Audit Committee | –Q4 and 2022 financials –Auditor reporting –Ethics and compliance, internal audit and internal controls updates –AGM proposals to the Board –Annual Policy review | –Annual report and 20-F for 2022, including Sustainability reporting –Auditor reporting –Internal controls update | –Q1 financials –Auditor reporting –Ethics and compliance, internal audit and internal controls updates –Treasury update –IT and service security update –Tax update –Conflict Minerals Report | –Q2 financials –Auditor reporting –Ethics and compliance, internal audit and internal controls updates –Finance IT and digitalization | –Q3 financials –Auditor reporting –Ethics and compliance, internal audit and internal controls updates –ESG disclosure and reporting developments, processes and controls –IT and service security updates | –Treasury update –Pensions update –Audit, internal audit and internal controls updates –Privacy update –Annual Charter and Policy review | |
Technology Committee | –Updates on major innovation and technology trends –Review of strategic technology initiatives | –Updates on major innovation and technology trends –Review of strategic technology initiatives –Cybersecurity: product and customer safety | –Sustainability technology strategy –Updates on major innovation and technology trends –Review of strategic technology initiatives | –Updates on major innovation and technology trends –Review of strategic technology initiatives –Cybersecurity: product and customer security |
Business overview | Corporate governance | Operating and financial review and prospects | General facts on Nokia | Financial statements | Other information | 43 | |||||||
Corporate governance statement continued
Nokia Annual Report on Form 20-F 2023
Board evaluation
In line with our Corporate Governance Guidelines, the Board
conducts a comprehensive annual performance evaluation,
which also includes evaluation of the Board Committees’
work, the Board and Committee Chairs and individual Board
members. The Board evaluation is conducted as a self-
evaluation, typically with a detailed questionnaire, while an
external evaluator is periodically engaged. Feedback is also
requested from selected members of management as part of
the Board evaluation process. The questions aim to measure
and elicit feedback on the processes, structure, accountability,
transparency, and effectiveness of the Board and to gain an
overview of the issues that are areas of excellence, areas where
the Board thinks greater focus is warranted and determining
areas where the performance could be enhanced.
Each year, the results of the evaluation are discussed and
analyzed by the entire Board and improvement actions are
agreed based on such discussions. In 2023, the evaluation
process was carried out as a thorough self-evaluation for
a second consecutive year by using an external evaluation
platform that included both numeric assessments and the
possibility to provide more detailed written comments.
The questionnaire comprised areas such as Nokia purpose
and strategy, Board agenda and meetings, and Board
composition and dynamics, as well as information,
reporting and risk management.
Meetings of the Board of Directors
The Board of Directors constitutes a quorum if more than half
of its members are present. The Board held 15 meetings
excluding Committee meetings during 2023. In total ten (67%)
of these meetings were regular meetings in person or by video
connection. The other five meetings were held in writing.
Board meeting attendance | Board and Committee meeting attendance(1) | ||||
Member | Meetings | % | Meetings | % | |
Sari Baldauf (Chair) | 15/15 | 100 | 28/28 | 100 | |
Søren Skou (Vice Chair) | 15/15 | 100 | 23/23 | 100 | |
Timo Ahopelto (as of 4 April 2023) | 11/11 | 100 | 18/18 | 100 | |
Bruce Brown (until 4 April 2023) | 4/4 | 100 | 8/8 | 100 | |
Elizabeth Crain (as of 4 April 2023) | 11/11 | 100 | 19/19 | 100 | |
Thomas Dannenfeldt | 15/15 | 100 | 26/26 | 100 | |
Lisa Hook | 15/15 | 100 | 24/24 | 100 | |
Jeanette Horan | 14/15 | 93 | 24/25 | 96 | |
Edward Kozel (until 4 April 2023) | 4/4 | 100 | 7/7 | 100 | |
Thomas Saueressig | 15/15 | 100 | 19/19 | 100 | |
Carla Smits-Nusteling | 15/15 | 100 | 26/26 | 100 | |
Kai Öistämö | 15/15 | 100 | 24/24 | 100 | |
Average attendance (%) | 99.4 | 99.7 | |||
Directors meet without management in connection with each
regularly scheduled meeting. According to Board practices,
meetings without management present are only attended by
non-executive directors. These meetings are chaired by the
non-executive Chair of the Board. In cases where the non-
executive Chair of the Board is unable to chair these meetings,
the non-executive Vice Chair of the Board chairs the meeting.
Additionally, the independent directors would meet separately
at least once annually. In 2023, all members of the Board were
non-executive and determined to be independent from Nokia
and significant shareholders under the Finnish Corporate
Governance Code and the rules of the NYSE.
Committees of the Board of Directors
In 2023, the Board of Directors had four Committees that
assisted the Board in its duties pursuant to their respective
Committee charters. The Board may also establish new or
ad hoc committees for detailed reviews or consideration of
particular topics to be proposed for the approval of the Board.
Any director who so wishes may attend, as a non-voting
observer, meetings of Committees of which they are
not members.
Business overview | Corporate governance | Operating and financial review and prospects | General facts on Nokia | Financial statements | Other information | 44 | |||||||
Corporate governance statement continued
Nokia Annual Report on Form 20-F 2023
Directors’ attendance at the Board and Committee meetings in 2023 is set forth in the table below:
(1)Any director who so wishes may attend, as a non-voting observer, meetings of committees of which they are not members. Figures exclude directors attending committee
meetings as non-voting observers.
The Audit Committee
The following table sets forth the members of the Audit
Committee and their meeting attendance in 2023:
Member | Attendance (meetings) | Attendance (%) |
Carla Smits-Nusteling (Chair) | 6/6 | 100 |
Timo Ahopelto (as of 4 April 2023) | 4/4 | 100 |
Elizabeth Crain (as of 4 April 2023) | 4/4 | 100 |
Thomas Dannenfeldt | 6/6 | 100 |
Lisa Hook (until 4 April 2023) | 2/2 | 100 |
Jeanette Horan | 6/6 | 100 |
Edward Kozel (until 4 April 2023) | 2/2 | 100 |
Average attendance (%) | 100 |
The Committee consists of a minimum of three members of
the Board who meet all applicable independence, financial
literacy and other requirements as stipulated by Finnish law,
the Finnish Corporate Governance Code and the rules of the
NYSE. As of 4 April 2023, the Audit Committee has consisted of
the following five members of the Board: Carla Smits-Nusteling
(Chair), Timo Ahopelto, Elizabeth Crain, Thomas Dannenfeldt
and Jeanette Horan.
The Committee is responsible for assisting the Board in the
oversight of:
■the quality and integrity of the Company’s financial and
non-financial reporting and related disclosures;
■the statutory audit of the Company’s financial statements;
including the sustainability reporting therein;
■the external auditor’s qualifications and independence;
■the performance of the external auditor subject to the
requirements of Finnish law;
■the performance of the Company’s internal controls,
risk management and the assurance function;
■the performance of the internal audit function;
■the Company’s compliance with legal and regulatory
requirements, including the performance of its ethics
and compliance program;
■the monitoring and assessment of any related party
transactions;
■the pension liabilities and taxation of the Company; and
■the processes and management related to the cybersecurity
of the Company, including IT and services security.
In discharging its oversight role, the Audit Committee has full
access to all Company books, records, facilities and personnel.
The Audit Committee also maintains procedures for the
receipt, retention and treatment of complaints received by
Nokia regarding accounting, internal controls, or auditing
matters and for the confidential, anonymous submission by
our employees of concerns relating to accounting or auditing
matters. Nokia’s disclosure controls and procedures, which
are reviewed by the Audit Committee and approved by the
President and CEO and the Chief Financial Officer, as well as
the internal controls over financial reporting, are designed
to provide reasonable assurance regarding the quality
and integrity of Nokia’s financial statements and related
disclosures. For further information on internal control over
financial reporting, refer to the section “Risk management,
internal control and internal audit functions at Nokia–Description
of internal control procedures in relation to the financial
reporting process”.
Under the Finnish Companies Act, an external auditor is elected
by a simple majority vote of the shareholders at the Annual
General Meeting for one year at a time. The Audit Committee
prepares the proposal to the shareholders for the election
or re-election of the nominee, upon its evaluation of the
qualifications and independence of the external auditor. Under
Finnish law, the fees of the external auditor are also approved
by the shareholders by a simple majority vote at the Annual
General Meeting. The Committee prepares the proposal to the
shareholders in respect of the fees of the external auditor, and
approves the external auditor’s annual audit fees under the
guidance given by the Annual General Meeting. For information
about the fees paid to Nokia’s external auditor, Deloitte Oy,
during 2023 refer to the section “Auditor fees and services”.
The Board has determined that all members of the Audit
Committee, including its Chair, Carla Smits-Nusteling,
are “audit committee financial experts” as defined in the
requirements of Item 16A of the Annual Report on Form 20-F
filed with the US Securities and Exchange Commission (SEC).
Carla Smits-Nusteling and each of the other members of the
Audit Committee are “independent directors” as defined by
Finnish law, the Finnish Corporate Governance Code and in
Section 303A.02 of the NYSE Listed Company Manual.
The Audit Committee meets a minimum of four times a year.
The Committee meets separately with the representatives of
Nokia’s management, heads of the internal audit, and ethics
and compliance functions, and the external auditor in
connection with each regularly scheduled meeting. The head of
the internal audit function has, at all times, direct access to the
Audit Committee, without the involvement of management.
Audit Committee pre-approval policies and procedures
The Audit Committee of the Board is responsible, among other
matters, for oversight of the external auditor’s independence,
subject to the requirements of applicable legislation. The
Audit Committee has adopted a policy regarding an approval
procedure of audit services performed by the external auditors
of the Nokia Group and permissible non-audit services
performed by the principal external auditor of the Nokia Group
(the “Pre-approval Policy”).
Under the Pre-approval Policy, proposed services either:
(i) may be pre-approved by the Audit Committee in accordance
with certain service categories described in the Pre-approval
Policy (general pre-approval); or (ii) require the specific
pre-approval of the Audit Committee (specific pre-approval).
The Pre-approval Policy sets out the audit, audit-related, tax
and other services that have received the general pre-approval
of the Audit Committee. All other audit, audit-related (including
services related to internal controls and significant mergers
and acquisitions projects), tax and other services are subject
to specific pre-approval by the Audit Committee. All service
requests concerning generally pre-approved services are
submitted to an appointed Audit Committee delegate within
management, who determines whether the services are within
the generally pre-approved services. The Pre-approval Policy is
subject to annual review by the Audit Committee.
The Audit Committee establishes budgeted fee levels annually
for each of the categories of audit and non-audit services that
are pre-approved under the Pre-approval Policy, namely, audit,
audit-related, tax and other services. At each regular meeting
of the Audit Committee, the auditor provides a report in order
for the Audit Committee to review the services that the auditor
is providing, as well as the cost of those services.
Business overview | Corporate governance | Operating and financial review and prospects | General facts on Nokia | Financial statements | Other information | 45 | |||||||
Corporate governance statement continued
Nokia Annual Report on Form 20-F 2023
The Corporate Governance and Nomination Committee
The following table sets forth the members of the Corporate
Governance and Nomination Committee and their meeting
attendance in 2023:
Member | Attendance (meetings) | Attendance (%) |
Søren Skou (Chair as of 4 April 2023) | 3/3 | 100 |
Sari Baldauf | 5/5 | 100 |
Bruce Brown (until 4 April 2023) | 2/2 | 100 |
Lisa Hook (as of 4 April 2023) | 3/3 | 100 |
Carla Smits-Nusteling | 5/5 | 100 |
Kai Öistämö | 5/5 | 100 |
Average attendance (%) | 100 |
The Committee consists of three to five members of the
Board who meet all applicable independence requirements as
stipulated by Finnish law, the Finnish Corporate Governance
Code and the rules of the NYSE. As of 4 April 2023, the
Corporate Governance and Nomination Committee has
consisted of the following five members of the Board: Søren
Skou (Chair), Sari Baldauf, Lisa Hook, Carla Smits-Nusteling
and Kai Öistämö.
The Committee fulfills its responsibilities by:
■actively identifying individuals qualified to be elected
members of the Board, as well as considering and
evaluating the appropriate level and structure of director
remuneration;
■preparing and evaluating the principles regarding Board
diversity;
■preparing proposals to the shareholders on the director
nominees for election at the general meetings, as well as
director remuneration;
■monitoring and assessing the directors’ current and planned
time commitments outside the Nokia Board and their
attendance at Nokia Board and Committee meetings;
■monitoring significant developments in the law and practice
of corporate governance, including the sustainability-
related governance trends and the directors’ duties and
responsibilities;
■assisting the Board and each Committee of the Board
in its annual performance evaluation process, including
establishing criteria to be applied in connection with such
evaluations;
■developing and administering Nokia’s Corporate
Governance Guidelines and giving recommendations
regarding them to the Board; and
■reviewing Nokia’s disclosure in the corporate governance
statement.
The Committee has the power and practice to appoint
a recruitment firm to identify appropriate new director
candidates.
Business overview | Corporate governance | Operating and financial review and prospects | General facts on Nokia | Financial statements | Other information | 46 | |||||||
Corporate governance statement continued
Nokia Annual Report on Form 20-F 2023
The Personnel Committee
The following table sets forth the members of the Personnel
Committee and their meeting attendance in 2023:
Member | Attendance (meetings) | Attendance (%) |
Thomas Dannenfeldt (Chair as of 4 April 2023) | 5/5 | 100 |
Sari Baldauf | 5/5 | 100 |
Bruce Brown (until 4 April 2023) | 1/1 | 100 |
Elizabeth Crain (as of 4 April 2023) | 4/4 | 100 |
Lisa Hook (as of 4 April 2023) | 4/4 | 100 |
Søren Skou | 5/5 | 100 |
Average attendance (%) | 100 |
The Committee consists of a minimum of three members of
the Board who meet all applicable independence requirements
as stipulated by Finnish law, the Finnish Corporate Governance
Code and the rules of the NYSE. As of 4 April 2023, the
Personnel Committee has consisted of the following five
members of the Board: Thomas Dannenfeldt (Chair), Sari
Baldauf, Elizabeth Crain, Lisa Hook and Søren Skou.
The Committee has overall responsibility for evaluating,
resolving and making recommendations to the Board
regarding:
■preparing the Remuneration Policy and the Remuneration
Report;
■compensation and terms of employment of the Company’s
senior management;
■human capital management;
■all equity-based plans;
■incentive compensation plans, policies and programs
of the Company affecting executives; and
■possible other significant incentive plans.
The Committee is responsible for preparing the Remuneration
Policy, including Nokia’s compensation philosophy and
principles and ensuring that the Company’s compensation
programs are performance-based, designed to contribute to
long-term shareholder value creation in line with shareholders’
interests, properly motivate management and are aligned
with the Remuneration Policy, as well as supporting overall
corporate strategies.
The Committee also oversees human capital management
and periodically reviews the personnel policies and practices
of Nokia related to human capital management and social
responsibilities relating to its employees , including Company
culture, physical safety, employee wellbeing, morale, diversity,
equity and inclusion, talent management and development,
succession planning, resourcing, recruiting, attrition,
retention and employee engagement.
Business overview | Corporate governance | Operating and financial review and prospects | General facts on Nokia | Financial statements | Other information | 47 | |||||||
Corporate governance statement continued
Nokia Annual Report on Form 20-F 2023
The Technology Committee
The following table sets forth the members of the Technology
Committee and their meeting attendance in 2023:
Member | Attendance (meetings) | Attendance (%) |
Kai Öistämö (Chair) | 4/4 | 100 |
Timo Ahopelto (as of 4 April 2023) | 3/3 | 100 |
Sari Baldauf (as of 4 April 2023) | 3/3 | 100 |
Bruce Brown (until 4 April 2023) | 1/1 | 100 |
Jeanette Horan | 4/4 | 100 |
Edward Kozel (until 4 April 2023) | 1/1 | 100 |
Thomas Saueressig | 4/4 | 100 |
Average attendance (%) | 100 |
The Committee consists of a minimum of three members of
the Board who meet applicable independence requirements as
stipulated by Finnish law, the Finnish Corporate Governance
Code and the rules of the NYSE and have such skills in
innovation, technology and science matters as the Board
determines adequate from time to time. As of 4 April 2023,
the Technology Committee has consisted of the following five
members of the Board: Kai Öistämö (Chair), Timo Ahopelto,
Sari Baldauf, Jeanette Horan and Thomas Saueressig.
In its dialogue with and provision of opinions and advice to the
management, the Committee will periodically review:
■the Company’s technological competitiveness and new
strategic technology initiatives as well as market trends,
considering both organic and inorganic options to retain
or attain competitiveness;
■the Company’s approach to major technological
innovations;
■key technology trends that may result in disruptive threats
or opportunities and the proposals on how to adequately
address them;
■high-level risks and opportunities associated with the
Company’s Research and Development Programs;
■embedding sustainability in the technology roadmaps; and
■the processes and management related to the
cybersecurity of the Company, including product and
customer security.
Business overview | Corporate governance | Operating and financial review and prospects | General facts on Nokia | Financial statements | Other information | 48 | |||||||
Corporate governance statement continued
Nokia Annual Report on Form 20-F 2023
Group Leadership Team and the President and CEO
The Group Leadership Team is responsible for the operative
management of Nokia. The Group Leadership Team is chaired
by the President and CEO. The President and CEO’s rights and
responsibilities include those allotted to the President under
Finnish law.
During 2023, the Group Leadership Team was complemented
with the appointment of Esa Niinimäki, Chief Legal Officer,
effective as of 25 January 2023.
On 31 December 2023, the Group Leadership Team consisted
of 11 members, including the President and CEO, representing
six different nationalities. In total 27% of the Group Leadership
Team members were female.
In addition to biographical information of the Group Leadership
Team members, the table on the right sets forth the number of
shares held by the members as at 31 December 2023, a total
of 4 239 962 Nokia shares. These holdings represented
approximately 0.08% of our total shares and voting rights
excluding shares held by the Nokia Group. The number of
shares includes shares received as compensation as well as
shares acquired through other means.
At 31 December 2023, no American Depositary Shares (ADS)
were held by the Group Leadership Team members. Stock
options or other equity awards that are deemed as being
beneficially owned under the applicable SEC rules are not
included in the table.
Name | Position | Gender | Year of birth | Nationality | On GLT since | Shares |
Pekka Lundmark | President and CEO | Male | 1963 | Finnish | 2020 | 1 473 060 |
Nishant Batra | Chief Strategy and Technology Officer | Male | 1978 | Indian | 2021 | 484 473 |
Ricky Corker | Chief Customer Experience Officer | Male | 1967 | Australian | 2019 | 437 199 |
Federico Guillén | President of Network Infrastructure | Male | 1963 | Spanish | 2016 | 453 764 |
Amy Hanlon-Rodemich | Chief People Officer | Female | 1972 | American | 2022 | - |
Jenni Lukander | President of Nokia Technologies | Female | 1974 | Finnish | 2019 | 102 297 |
Esa Niinimäki | Chief Legal Officer | Male | 1976 | Finnish | 2023 | 33 588 |
Raghav Sahgal | President of Cloud and Network Services | Male | 1962 | American | 2020 | 569 659 |
Melissa Schoeb | Chief Corporate Affairs Officer | Female | 1968 | American | 2021 | 161 367 |
Tommi Uitto | President of Mobile Networks | Male | 1969 | Finnish | 2019 | 246 945 |
Marco Wirén | Chief Financial Officer | Male | 1966 | Finnish/Swedish | 2020 | 277 610 |
Business overview | Corporate governance | Operating and financial review and prospects | General facts on Nokia | Financial statements | Other information | 49 | |||||||
Corporate governance statement continued
Nokia Annual Report on Form 20-F 2023
Biographical details of the current members of the Nokia Group Leadership Team
 |  |  |  | |||||
Pekka Lundmark | Nishant Batra | Ricky Corker | Federico Guillén | |||||
b. 1963 | b. 1978 | b. 1967 | b. 1963 | |||||
President and Chief Executive Officer
(CEO) since 2020. Rejoined Nokia in 2020.
Master’s degree in Information Systems,
Department of Technical Physics, Helsinki
University of Technology, Finland.
President and CEO, Fortum Corporation,
2015–2020. President and CEO,
Konecranes Plc, 2005–2015 and Group
Executive Vice President 2004–2005.
President and CEO, Hackman Oyj, 2002–
2004. Managing Partner, Startupfactory
2000–2002. Various executive positions
at Nokia 1990–2000.
Commissioner, Broadband Commission
for Sustainable Development. Member
of the Board, Research Institute of the
Finnish Economy (ETLA) and Finnish
Business and Policy Forum (EVA).
International Member of the Royal
Swedish Academy of Engineering Sciences
(IVA). Member of the Board, Finnish
Athletics Federation. Member of the
European Round Table for Industry.
Member of The Business Council (the
United States).
Chairman of the Board, Confederation
of Finnish Industries 2019–2020.
Member of the Board, East Office of
Finnish Industries 2009–2020. Chairman
of the Board, Finnish Energy 2016–2018.
Chief Strategy and Technology Officer
(CSTO). Group Leadership Team member
since 2021. Joined Nokia in 2021.
MBA from INSEAD. Master’s degrees in
Telecommunications and in Computer
Science, Southern Methodist University,
Dallas, the United States. Bachelor’s
degree in Computer Applications, Devi
Ahilya University, Indore, Madhya
Pradesh, India.
Executive Vice President and Chief
Technology Officer, Veoneer Inc. 2018–
2021. Prior to Veoneer Inc. held several
senior positions at Ericsson 2006–2018
in the United States, Sweden and India.
Chair of the Board of ReOrbit Oy.
Member of the Board of Directors of
Sensys Gatso Group 2020–2022.
Chief Customer Experience Officer
(CCXO). Group Leadership Team member
since 2019. Joined Nokia in 1993.
Bachelor in Communications and
Electronic Engineering from the Royal
Melbourne Institute of Technology,
Australia.
Heading the global Customer Experience
organization 2021–2023. President of
Customer Operations, Americas, Nokia
2019–2020. Executive Vice President and
President of North America, Nokia 2011–
2018. Head of Asia Pacific, Nokia Siemens
Networks 2009–2011. Head of Asia North
Region, Nokia Siemens Networks 2008–
2009. Head of Hutchison Global
Customer Business Team, Nokia Siemens
Networks 2007–2008. Vice President Asia
Pacific, Nokia Networks 2005–2007. Lead
Sales Director Asia Pacific, Nokia
Networks 2004–2005. Account Director
Telstra, Nokia Networks 2002–2003.
Account Director Vodafone Australia and
New Zealand, and Sales Director
Vodafone Asia Pacific Customer Business
Team, Nokia Networks 2001–2002.
Commercial Director Global Accounts
British Telecom, Nokia Networks 2001.
Senior sales and marketing positions at
Nokia 1993–2001.
President of Network Infrastructure.
Group Leadership Team member since
2016. Joined Nokia in 2016.
Degree in Telecommunications
Engineering, ETSIT at Universidad
Politécnica de Madrid, Spain. Master’s
degree in Switching & Communication
Architectures, ETSIT at Universidad
Politécnica de Madrid, Spain. Master’s
Degree in International Management,
ESC Lyon and Alcatel, France.
President of Customer Operations,
Europe, Middle East & Africa and Asia
Pacific, Nokia 2018–2020. President of
Fixed Networks, Nokia 2016–2018.
President of Fixed Networks, Alcatel-
Lucent 2013–2016. President and Chief
Senior Officer of Alcatel-Lucent Spain and
Global Account Manager Telefónica,
Alcatel-Lucent 2009–2013. Vice President
Sales of Vertical Market Sales in Western
Europe, Alcatel-Lucent 2009. Head of
Regional Support Center, Fixed Access
Division for South Europe, Middle East &
Africa, India and Caribbean & Latin
America, Alcatel-Lucent 2007–2009.
President and Chief Senior Officer, Alcatel
Mexico and Global Account Manager,
Telmex 2003–2007. Various R&D,
portfolio and sales management
positions with Telettra in Spain,
and with Alcatel in Spain, Belgium
and the United States 1989–2003.
Business overview | Corporate governance | Operating and financial review and prospects | General facts on Nokia | Financial statements | Other information | 50 | |||||||
Corporate governance statement continued
Nokia Annual Report on Form 20-F 2023
Biographical details of the current members of the Nokia Group Leadership Team continued
 |  |  |  | |||||
Amy Hanlon-Rodemich | Jenni Lukander | Esa Niinimäki | Raghav Sahgal | |||||
b. 1972 | b. 1974 | b. 1976 | b. 1962 | |||||
Chief People Officer (CPO). Group
Leadership Team member since 2022.
Joined Nokia in 2022.
Master of Human Resources and
Organizational Development, University
of San Francisco, the United States.
Bachelor of Arts in English, Tufts
University, Boston, the United States.
Chief People Officer, GlobalLogic, a
Hitachi Group Company 2019–2022. Vice
President, Human Resources, Synopsys,
Inc. 2017–2019. Executive Vice President,
People Success, Milestone Technologies
2016–2017. Director and Global HR Head,
Yahoo 2013–2016. Various positions such
as Senior HR Business Partner, Senior
Manager, Director, Global Talent
Development Operations, VMware 2004–
2013. Employee Relations Specialist,
Technology Credit Union 2003–2004.
Human Resources Manager, CAT
Technology 2000–2003. Manager,
Staffing Programs, Inktomi Corporation
1996–2000.
Member of the Board, Exceptional
Women Awardees Foundation. Advisory
Board member, Topia, Inc. Advisory Board
Member, BrightPlan.
President of Nokia Technologies. Group
Leadership Team member since 2019.
Joined Nokia in 2007.
Master of Laws, University of Helsinki,
Finland.
Senior Vice President, Head of Patent
Business, Nokia 2018–2019. Vice
President, Head of Patent Licensing,
Nokia 2018. Vice President, Head of
Litigation and Competition Law, Nokia
2016–2018. Director, Head of Regulatory
and Competition Law, Nokia 2015–2016.
Director, Head of Competition Law, Nokia
2011–2015. Senior Legal Counsel, Nokia
2007–2011. Visiting lawyer, Nokia 2001.
Lawyer, Roschier Ltd. 1999–2007.
Chief Legal Officer (CLO) and Board
Secretary. Group Leadership Team
member since 2023. Joined Nokia in 2007.
Master of Laws, Fordham University,
School of Law, New York, the United
States. Master of Laws, University of
Helsinki, Finland.
Interim Chief Legal Officer, Nokia 2022–
2023. Deputy Chief Legal Officer, Vice
President, Corporate Legal and Board
Secretary, Nokia 2018–2023. General
Counsel, Global Services, Nokia 2015–
2018. Head of Corporate Legal, Nokia
Solutions and Networks and Head of
Finance & Labor Legal, Nokia 2013–2015.
Senior Legal Counsel, Legal and IP, India,
Middle East and Africa, Nokia 2012–2013.
(Senior) Legal Counsel, Corporate Legal,
Nokia 2007–2011. Group Legal Counsel,
Metsä Group 2005–2007. Associate
Lawyer, White & Case LLP 2003–2005.
Chair of Legal Affairs Committee of the
Confederation of Finnish Industries.
Member of the Market Practice Board of
Securities Market Association and the
Policy Committee of the Directors’
Institute Finland.
President of Cloud and Network Services.
Group Leadership Team member since
2020. Joined Nokia in 2017.
Master of Science in Computer Systems
Management, University of Maryland, the
United States. Bachelor of Science in
Computer Engineering, Tulane University,
New Orleans, the United States.
Executive Business Certificate in General
Management, Harvard University,
the United States.
President of Nokia Enterprise 2020.
Senior Vice President, Nokia Software
2017–2020. President, NICE Ltd. Asia
Pacific and the Middle East 2010–2017.
Advisory Board Member, Orga Systems
2010–2014. Vice President,
Communications Business Unit, Asia
Pacific & Japan, Oracle 2008–2010. Chief
Business Officer, Comverse 2005–2006.
Executive Vice President, Asia Pacific,
CSG 2002–2005. Vice President,
Software Products Group Asia Pacific,
Lucent Technologies 2000–2002.
Business overview | Corporate governance | Operating and financial review and prospects | General facts on Nokia | Financial statements | Other information | 51 | |||||||
Corporate governance statement continued
Nokia Annual Report on Form 20-F 2023
Biographical details of the current members of the Nokia Group Leadership Team continued
 |  |  | ||||||
Melissa Schoeb | Tommi Uitto | Marco Wirén | ||||||
b. 1968 | b. 1969 | b. 1966 | ||||||
Chief Corporate Affairs Officer (CCAO).
Group Leadership Team member since
2021. Joined Nokia in 2021.
Bachelor of Arts, double major in
International Relations and Spanish,
University of Mary Washington, Virginia,
the United States. Fellowship Recipient,
Four Freedoms Foundation, Rome, Italy.
Vice President, Corporate Affairs,
Occidental 2017–2021. Vice President,
Communications and Public Affairs,
Occidental 2012–2017. Senior Director,
Communications and Public Affairs,
Occidental 2007–2012. Senior Vice
President and Senior Partner, General
Manager and other senior positions,
FleishmanHillard 2002–2007. Director of
Global Communications, Nortel Networks
2000–2002. Vice President, Technology,
FleishmanHillard 1998–2000. Business
Director, The VenCom Group Inc. 1995–
1997. Consultant, London, the United
Kingdom and Washington D.C., the United
States, Gemini Consulting 1991–1995.
Member of the Arthur Page Society
and The Seminar. Member of Mary
Washington University College of
Business Executive Advisory Board.
President of Mobile Networks. Group
Leadership Team member since 2019.
Joined Nokia in 1996.
Master’s degree in industrial
management, Helsinki University of
Technology, Finland. Master’s degree
in operations management, Michigan
Technological University, the United States.
Senior Vice President (VP), Global Product
Sales, Mobile Networks, Nokia 2016–
2018. Senior VP, Global Mobile
Broadband Sales, Customer Operations,
Nokia Networks 2015–2016. Senior VP,
West Europe, Customer Operations, Nokia
Networks 2013–2015. Head of Radio
Cluster (Senior VP), Mobile Broadband,
Nokia Siemens Networks (NSN) 2012–
2013. Head of Global LTE Radio Access
Business Line (VP) and Quality, Mobile
Broadband NSN, 2011–2012. Head of
Product Management, Network Systems,
NSN 2010. Head of Product Management,
Radio Access, NSN 2009. Head of
WCDMA/HSPA and Radio Platforms
Product Management, NSN 2008. Head of
WCDMA/HSPA Product Line Management,
NSN 2007. General Manager, Radio
Controller Product Management Nokia
Networks, 2005–2007. Various other
positions at Nokia since 1999.
Member of the Board of Technology
Industries of Finland. Board member at
F-Secure Oyj (standing for election at the
2024 AGM).
Chief Financial Officer (CFO). Group
Leadership Team member since 2020.
Joined Nokia in 2020.
Master’s degree in Business
Administration, University of Uppsala,
Sweden. Studies in management and
strategic leadership, including at Duke
Business School, the United States; IMD,
Switzerland and Stockholm School of
Economics, Sweden.
President, Wärtsilä Energy and Executive
Vice President, Wärtsilä Group 2018–
2020. Executive Vice President and CFO,
Wärtsilä Group 2013–2018. Executive
Vice President and CFO, SSAB Group
2008–2013. Vice President, Business
Control, SSAB Group 2007–2008. CFO,
Eltel Networks 2006–2007. Vice President
of Business Development, Eltel Networks
2004–2005. Head of Service Division,
Eltel Networks 2003–2004. Vice
President, Corporate Development, Eltel
Networks 2002–2003. Vice President,
Strategy & Business Development, NCC
Group 1999–2002. Head of Strategic
Planning, NCC Group 1998–1999. Group
Controller, NCC Group 1996–1998.
Vice Chair of the Board of Directors
of Neste Corporation 2019–2023 and
member of the Board of Directors of
Neste Corporation 2015–2023.
Business overview | Corporate governance | Operating and financial review and prospects | General facts on Nokia | Financial statements | Other information | 52 | |||||||
Corporate governance statement continued
Nokia Annual Report on Form 20-F 2023
Risk management, internal control and
internal audit functions at Nokia
Risk management principles
We have a systematic and structured approach to risk
management. Risk management covers strategic, operational,
financial, compliance and hazard risks. The principles
documented in the Nokia Enterprise Risk Management (ERM)
Policy, which is approved by the Audit Committee of the Board,
require risk management and its elements to be integrated into
key processes:
■ERM is an integral part of Nokia’s objective setting and
key decision-making
Key risks and opportunities are primarily identified against
business targets either in business operations or as an
integral part of strategy and financial planning. Key risks
are monitored as part of the management and business
performance information flow. Our overall risk management
concept is based on managing the key risks that would
prevent us from meeting our objectives, rather than
focusing on eliminating all risks.
■ERM is an integral part of Nokia’s corporate governance
ERM accountability runs through the Company and is
embedded into Nokia corporate governance. The Board of
Directors and Group Leadership Team are committed to
effective risk management as a core management capability
that supports Nokia in achieving strategic, tactical and
operational business objectives and in managing business
performance.
■Risk ownership follows business ownership
Nokia ERM is aligned to the overall Nokia governance model,
where Nokia’s businesses are accountable for meeting
approved plans and targets as agreed within Nokia.
Each business or function head is an owner of the risks in
their respective responsibility area and is responsible for
identifying and managing key risks and capturing opportunities.
■ERM is an area of continuous improvement
ERM is an area of continuous improvement for Nokia.
The Chief Financial Officer, who also functions as the
Chief Risk Officer, provides guidance and sponsors the
development of ERM practices and ERM improvement.
In addition to the principles defined in the Nokia Enterprise Risk
Management Policy, other key corporate level policies reflect
the implementation of specific aspects of risk management.
Cybersecurity Risk Management
Nokia, along with its partners and contracted third parties,
faces cybersecurity threats like ransomware, viruses, worms
and other malicious software, unauthorized modifications, or
illegal activities that may cause potential security risks and
other harm to Nokia, its customers or consumers and other
end-users of Nokia’s products and services. The dynamic
nature of IT makes it challenging to fully mitigate these risks.
Nokia’s joint ventures and other group companies may have
limited ability to oversee such threats.
The cybersecurity incidents may lead to lengthy and costly
incident response, remediation of the attack or breach and
legal proceedings and fines imposed on us, as well as adverse
effects to our reputation and brand value. Despite ongoing
investments, preventing, detecting and containing cyber-
attacks remain challenging. Additionally, the cost and
operational consequences of implementing further information
system protection measures, especially if prescribed by
national authorities, could be significant. We may not be
successful in implementing such measures in due time, which
could lead to business disruptions and the implementation
being more expensive, time-consuming and resource intensive.
The regulatory framework around responding to and disclosing
such events is in flux. We may not be able to comply with the
regulations that must be implemented or such compliance may
negatively impact our ability to deal with the underlying event.
We face a number of cybersecurity risks within our business.
Although such risks have not materially affected us thus far,
including our business strategy, results of operations, or
financial condition, we have from time to time experienced
threats to and breaches of our data and systems, including
malware and computer virus attacks. We continue to
address these challenges, but there is no guarantee against
future attacks.
Nokia has well-established cybersecurity processes built into its
overall security risk management framework. This integration is
achieved through the implementation of a security program set
on various processes, such as cybersecurity risk management,
third-party security risk management, security incident
management and disaster recovery.
The Chief Security Officer, who has the authority to establish
and oversee the Nokia information security program, keeps
Nokia’s executive leadership informed on program outcomes
and highlights information security risks which may affect Nokia
business and customers. Nokia’s executive leadership provides
direction and support and has the responsibility to execute
the program within their own domains. Key principles are
communicated through the Nokia Information Security Policy,
applicable also to third parties and collaborators and supported
by topical Standard Operation Procedures and guidelines.
Nokia’s security ambition is reflected in the supplier selection
processes, contracts and supplier (re)assessments ensuring
effective security is in place in our supply chain and with our
third-party partners. We are dedicated to adhering to
applicable laws, regulations, contractual commitments, and
industry best practices, including but not limited to ISO 27001,
NIST SP 800 series, Cloud Security Alliance Control Matrix, and
the Information Security Forum.
Nokia’s cybersecurity incidents are handled in the Security
Incident Management Process, which covers all phases of
incident response, including preparation, identification,
containment, eradication, recovery and post-incident analysis.
Each confirmed cybersecurity-related incident is assessed
against a classification scheme (impact on confidentiality,
integrity and availability of the related asset, urgency, and
priority of the security incident). Significant cybersecurity
incidents are elevated and managed by a cross-functional,
executive management-level team, which is responsible for
making the necessary decisions and prioritizing actions that can
minimize the impact of the security incident to Nokia and its
customers. Members from the CFO and Legal and Compliance
teams are responsible for determining the materiality
of the security incident and promptly informing the Audit
Committee of the Board. The Nokia management team for
assessing and managing cybersecurity threats includes
members with training and experience in security risk
management, security governance, cyber resilience, security
incident management, information technology, cybersecurity
legal and compliance requirements and disclosures. For an
overview of the training and experience of the members of the
Board and our assessment of their experience and skills related
to cybersecurity, please see “Main corporate governance
bodies of Nokia–Board of Directors”.
Business overview | Corporate governance | Operating and financial review and prospects | General facts on Nokia | Financial statements | Other information | 53 | |||||||
Corporate governance statement continued
Nokia Annual Report on Form 20-F 2023
Description of internal control procedures in relation
to the financial reporting process
Management is responsible for establishing and maintaining
adequate internal control over Nokia’s financial reporting. Our
internal control over financial reporting is designed to provide
reasonable assurance to management and the Board regarding
the reliability of financial reporting and the preparation and fair
presentation of published financial statements.
Management conducts a yearly assessment of Nokia’s internal
controls over financial reporting in accordance with the
Committee of Sponsoring Organizations framework (the “COSO
framework”, 2013) and the Control Objectives for Information
and Related Technology (COBIT) framework of internal controls.
The assessment is performed based on a top-down risk
assessment of our financial statements covering significant
accounts, processes and locations, corporate-level controls
and information systems’ general controls.
As part of its assessment, management has documented:
■the corporate-level controls, which create the “tone from
the top” containing the Nokia values and Code of Conduct
and which provide discipline and structure to decision-
making processes and ways of working. Selected items
from our operational mode and governance principles are
separately documented as corporate-level controls;
■the significant processes: (i) give a complete end-to-end
view of all financial processes; (ii) identify key control points;
(iii) identify involved organizations; (iv) ensure coverage for
important accounts and financial statement assertions;
and (v) enable internal control management within Nokia;
■the control activities, which consist of policies and
procedures to ensure management’s directives are carried
out and the related documentation is stored according to
our document retention practices and local statutory
requirements; and
■the information systems’ general controls to ensure that
sufficient IT general controls, including change management,
system development and computer operations, as well as
access and authorizations, are in place.
Further, management has also:
■assessed the design of the controls in place aimed at
mitigating the financial reporting risks;
■tested operating effectiveness of all key controls; and
■evaluated all noted deficiencies in internal controls over
financial reporting in the interim and as of year end.
In 2023, Nokia has followed the procedures as described
above and has reported on the progress and assessments to
management and to the Audit Committee of the Board on a
quarterly basis.
Description of the organization of the internal
audit function
We have an internal audit function that examines and
evaluates the adequacy and effectiveness of our system of
internal control. Internal audit reports to the Audit Committee
of the Board. The head of the internal audit function has direct
access to the Audit Committee, without the involvement of
management. The internal audit staffing levels and annual
budget are approved by the Audit Committee. All authority
of the internal audit function is derived from the Board.
The internal audit aligns to the business by business group
and function.
Annually, a risk-based internal audit plan is developed with
input from management, taking into account key business
risks and external factors. This plan is approved by the Audit
Committee. Audits are completed across business groups
and functions. The results of each audit are reported to
management identifying issues, financial impact, if any, and the
correcting actions to be completed. Quarterly, the internal
audit function communicates the progress of the internal audit
plan completion, including the results of the closed audits, to
the Audit Committee. Any changes to the risk environment
impacting the internal audit plan are presented to the Audit
Committee for review and approval on a quarterly basis.
Internal audit also works closely with Internal Controls and
Ethics and Compliance offices to review any financial and
compliance concerns brought to light from various channels
and, where relevant, works with Enterprise Risk Management
to ensure priority risk areas are reviewed through audits.
Business overview | Corporate governance | Operating and financial review and prospects | General facts on Nokia | Financial statements | Other information | 54 | |||||||
Corporate governance statement continued
Nokia Annual Report on Form 20-F 2023
Related party transactions
We determine and monitor related parties in accordance with
the International Accounting Standards (IAS 24, Related Party
Disclosures) and other applicable regulations including the
applicable US securities laws. We maintain information on our
related parties, as well as monitor and assess related party
transactions. As a main principle, all transactions should be
conducted at arm’s-length and as part of the ordinary course
of business. In exceptional cases where these principles would
be deviated from, Nokia would set up a separate process to
determine the related parties in question and to seek relevant
approvals in accordance with internal guidelines and applicable
regulations.
Main procedures relating to insider
administration
Our insider administration is organized according to the
applicable European Union and Finnish laws and regulations
as well as applicable US securities laws and regulations. In
addition, the Board of Directors has approved the Nokia Insider
Policy, which sets out Nokia-wide rules and practices to ensure
full compliance with applicable rules and that inside information
is recognized and treated in an appropriate manner and with
the highest integrity. The Nokia Insider Policy is applicable
to all directors, executives and employees of Nokia.
Persons discharging managerial responsibilities
Nokia has identified members of the Board of Directors
and the Group Leadership Team as persons discharging
managerial responsibilities who, along with persons closely
associated with them, are required to notify Nokia and the
Finnish Financial Supervisory Authority of their transactions
with Nokia’s financial instruments. Nokia publishes the
transaction notifications.
In addition, according to the Nokia Insider Policy, persons
discharging managerial responsibilities are obligated to clear
with the Head of Corporate Legal a planned transaction
in Nokia’s financial instruments in advance. It is also
recommended that trading and other transactions in Nokia’s
financial instruments are carried out in times when the
information available to the market is as complete as possible.
Closed window
Persons discharging managerial responsibilities are subject
to a closed window period of 30 calendar days preceding the
disclosure of Nokia’s quarterly or annual result announcements,
as well as the day of the disclosure. During the closed window
period, persons discharging managerial responsibilities are
prohibited from dealing in Nokia’s financial instruments.
Nokia has imposed this closed window period also on
separately designated financial reporting persons who are
recurrently involved with the preparation of Nokia’s quarterly
and annual results announcements. These persons are
separately notified of their status as designated financial
reporting persons.
Insider registers
Nokia does not maintain a permanent insider register. Insiders
are identified on a case-by-case basis for specific projects
and are notified of their insider status. Persons included in a
project-specific insider register are prohibited from dealing
in Nokia’s financial instruments until the project ends or is
made public.
Supervision
Our insider administration’s responsibilities include internal
communications related to insider matters and trading
restrictions, setting up and maintaining our insider registers
and arranging related trainings, as well as organizing and
overseeing compliance with the insider rules.
Violations of the Nokia Insider Policy must be reported to
the Head of Corporate Legal. Nokia employees may also use
channels stated in the Nokia Code of Conduct for reporting
incidents involving suspected violations of the Nokia Insider Policy.
Auditor fees and services
Deloitte Oy, based in Helsinki, Finland, served as our auditor
for the financial year ended 31 December 2023 and for the
financial year ended 31 December 2022. The auditor is elected
annually by our shareholders at the Annual General Meeting for
the next financial year commencing after the election. On an
annual basis, the Audit Committee of the Board prepares a
proposal to the shareholders regarding the appointment of
the auditor based upon its evaluation of the qualifications
and independence of the auditor to be proposed for election.
The following table presents fees by type paid to Deloitte’s
network of firms for the years ended 31 December:
EURm | 2023 | 2022 |
Audit fees(1) | 20.2 | 22.7 |
Audit-related fees(2) | 1.7 | 0.8 |
Tax fees(3) | 0.4 | 0.4 |
All other fees(4) | 0.3 | 0.2 |
Total | 22.6 | 24.1 |
(1)Audit fees consist of fees incurred for the annual audit of the Group’s consolidated
financial statements and the statutory financial statements of the Group’s
subsidiaries.
(2)Audit-related fees consist of fees billed for assurance and related services that are
reasonably related to the performance of the audit or review of the Group’s
financial statements or that are traditionally performed by the independent auditor,
and include consultations concerning financial accounting and reporting standards;
advice and assistance in connection with local statutory accounting requirements;
due diligence related to mergers and acquisitions; and audit procedures in
connection with investigations in the pre-litigation phase and compliance programs.
They also include fees billed for other audit services, which are those services that
only the independent auditor can reasonably provide, and include the provision of
comfort letters and consents in connection with statutory and regulatory filings and
the review of documents filed with the SEC and other capital markets or local
financial reporting regulatory bodies.
(3)Tax fees include fees billed for: (i) services related to tax compliance including
preparation and/or review of tax returns, preparation, review and/or filing of
various certificates and forms and consultation regarding tax returns and
assistance with revenue authority queries; compliance reviews, advice and
assistance on other indirect taxes; and transaction cost analysis; (ii) services related
to tax audits; (iii) services related to individual compliance (preparation of individual
tax returns and registrations for employees (non-executives), assistance with
applying for visas, residency, work permits and tax status for expatriates); (iv)
services related to technical guidance on tax matters; (v) services related to
transfer pricing advice and assistance with tax clearances; and (vi) tax consultation
and planning (advice on stock-based remuneration, local employer tax laws, social
security laws, employment laws and compensation programs and tax implications
on short-term international transfers).
(4)Other fees include fees billed for Company establishments, liquidations, forensic
accounting, data security, other consulting services and reference materials and
services.
Business overview | Corporate governance | Operating and financial review and prospects | General facts on Nokia | Financial statements | Other information | 55 | |||||||
Corporate governance statement continued
Nokia Annual Report on Form 20-F 2023
Remuneration
This section sets out our remuneration governance,
policies and how they have been implemented within
Nokia. It includes our Remuneration Report where
we disclose the remuneration of our Board members
and the President and CEO for 2023, which will be
presented to the Annual General Meeting (AGM) 2024
for an advisory vote.
Our updated Remuneration Policy will also be presented
to the AGM 2024 for an advisory vote. A summary of the
updated Remuneration Policy is set out in this section and
the full Policy is available on our website.
Other remuneration-related information provided alongside
the Remuneration Report and the Remuneration Policy is
not subject to a vote at the AGM 2024 but provides added
information on the remuneration policies applied within
Nokia as well as on the remuneration of the Group
Leadership Team members.
We report information applicable to executive remuneration
in accordance with Finnish regulatory requirements and
with requirements set by the US Securities and Exchange
Commission that are applicable to us.
Highlights
■Despite the challenging market environment in 2023,
Nokia delivered a resilient financial performance, we made
progress on our strategy, and continued to create world-
leading technology.
■As reported last year, at the beginning of 2023, the
President and CEO, Pekka Lundmark, received a base
salary increase of 3.5% in recognition of his performance.
During 2023, in line with the Company’s cost control
efforts, Pekka Lundmark requested that his salary
increase of 3.5% be cancelled as of 1 July 2023. His base
salary for the second half of 2023 remained unchanged
since his appointment in 2020.
■Our President and CEO, Pekka Lundmark’s 2023 Short-
term Incentive (STI) was subject to a scorecard of Nokia
Economic Profit, gender diversity, carbon emission
reduction (Scope 1, 2 and 3) and personal strategic
objectives. Following the year end, performance was
assessed against the predetermined targets and resulted
in an overall STI payout of 65.30% of target opportunity
for Pekka Lundmark. Further details on the targets and
performance assessment and outcomes are provided in
the Remuneration Report.
■The Long-term Incentive (LTI) awards (performance shares)
granted to Pekka Lundmark and other GLT members in
2020 vested at 39.5% of target following the end of the
3-year performance period, as a result of the dividend
adjusted share price achievement of €3.21. Further details
of the target and performance assessment are set out in
the Remuneration Report.
■The Personnel Committee reviewed our Remuneration
Policy (“Policy”) during 2023 in preparation for our second
“Say on Pay” shareholder vote at the 2024 AGM. A minor
amendment is proposed to the LTI leaver provision under
the Policy to further align with market practice. A few
other presentational changes are also proposed to the
Policy to provide enhanced disclosure for greater
transparency, taking account of the feedback received
from our shareholders.
■Reflecting the input from our shareholders, we are also
making some changes to the performance metrics for
our 2024 LTI and STI. The 2024 metrics for the LTI
(performance shares) plan for Pekka Lundmark and the
rest of the GLT will be subject to a scorecard of 50%
relative TSR, 40% cumulative reported Earnings Per
Share (EPS) (adjusted for impairments and M&A) and
10% carbon emission reduction (Scope 1, 2 and 3).
■To bring greater focus on our profitability and cash
position as well as other important ESG topics such as
health and safety, the 2024 metrics for the STI plan for
Pekka Lundmark will be subject to a new scorecard of
60% operating profit, 20% Cash Release, 10% health
and safety and 10% diversity.
■Pekka Lundmark will receive a salary increase of 8.5%
in 2024, to bring his total target remuneration closer
to the market level, although remaining below median
of our Global Peer Group.
Business overview | Corporate governance | Operating and financial review and prospects | General facts on Nokia | Financial statements | Other information | 56 | |||||||
Remuneration
Nokia Annual Report on Form 20-F 2023
Remuneration Report 2023
Word from the Chair of the Personnel
Committee of the Board

Dear Fellow Shareholder,
I am delighted to present the first Remuneration
Report since my appointment as the Chair of the
Personnel Committee of the Nokia Board.
Business context
2023 saw a meaningful shift in customer spending which
impacted our industry, with more caution due to the
macroeconomic environment, high interest rates and
customers working down elevated inventories accumulated
during the pandemic-related supply chain crisis. This industry-
wide shift has led to our net sales declining over the full year.
However, due to proactive actions we took across our
organization, we were able to protect our profitability while
continuing to invest in R&D. Despite all the challenges faced
during the year, we maintained a strong cash position in 2023
and the Board proposed an increase in the dividend from
EUR 12 cents to 13 cents and initiated a new share buyback
program to return up to EUR 600 million to our shareholders
over the next two years.
Shareholder support and the updated Remuneration Policy
The Policy that applied for the 2020-2023 period was
approved by shareholders at the 2020 AGM with 86.37% of
votes cast in favor. The Board’s implementation of that Policy
also received strong support at the AGMs in 2021, 2022 and
2023, with over 90% votes in favor in all three years.
We have monitored developments in shareholder and
voting agency guidance on remuneration and conducted a
thorough review of the Policy during 2023. The review
concluded that the overall remuneration structure continues
to be suitable for Nokia and is aligned to our strategic goals.
Where amendments have been proposed to the Policy,
these are intended to further align our arrangements with
market practice and to provide greater transparency to help
shareholders understand our arrangements and practices. We
consulted with our largest shareholders and several other key
stakeholders on some proposed amendments to the Policy.
The shareholders we engaged with were generally supportive
of the proposed amendments and made a few helpful and
constructive suggestions for the Committee to consider.
The feedback was taken into account as the proposed Policy
was finalized.
Remuneration of the President and CEO – base salary and
incentive opportunities
As reported last year, Pekka Lundmark received a salary
increase of 3.5% in January 2023 as a result of Nokia’s
continued growth and strong business performance.
However, in July 2023, he asked to reverse the salary
increase taking into consideration the Company’s
cost control efforts, the macroeconomic context, the fact
that our GLT requested a salary freeze for 2023 and the
wider employee experience. His base salary for the second
half of 2023 remained unchanged since his appointment in
2020. There was no increase to Pekka Lundmark’s STI and
LTI opportunities during 2023.
Pekka Lundmark’s total target remuneration has remained
below the median of our Global Peer Group since his
appointment, as a result of the restrained approach the
Personnel Committee and the Board have continued to take
on executive remuneration, taking account of the current
financial pressures being felt by shareholders and our
employees. However, considering the Company’s resilient
performance under Pekka Lundmark’s leadership despite
the industry-wide challenges we faced during 2023, the
Committee and the Board recognize that Pekka Lundmark’s
current remuneration is not at a competitive level, either
relative to others in less senior roles in the Company or
relative to other CEOs in our Global Peer Group. This
situation is not sustainable in the long term. The Board
decided to increase Pekka Lundmark’s base salary by 8.5%
in 2024. His 2024 STI and LTI opportunities will remain
unchanged. As a result, his total target remuneration in 2024
will remain below the median of our Global Peer Group.
Our employees globally have received salary increases
of approximately 14 percentage points during the past
three years.
STI performance and outcomes for 2023
Pekka Lundmark’s 2023 STI was subject to a scorecard of
70% Nokia Economic Profit, 10% gender diversity, 5% carbon
emission reduction (Scope 1 and 2), 5% carbon emission
reduction (Scope 3) and 10% personal strategic objectives.
Nokia Economic Profit was determined based on the
comparable operating profit less the cost of normalized
core net working capital (i.e. net receivables, inventories
and trade creditors). The 2023 Economic Profit outcome
of €854m was below the threshold set at the beginning of
the year for Pekka Lundmark’s 2023 STI. This outcome was
largely as a result of the 5G patent cross-license agreements
negotiation with OPPO and vivo that continued into early
2024. Since 2021, Nokia has been involved in legal disputes
with OPPO and vivo over patent payments in several
countries in Europe and Asia.
Business overview | Corporate governance | Operating and financial review and prospects | General facts on Nokia | Financial statements | Other information | 57 | |||||||
Remuneration continued
Nokia Annual Report on Form 20-F 2023
Our remuneration philosophy
At the core of Nokia’s philosophy lie three principles:
■pay for performance and aligning the interests of
employees with shareholders;
■ensuring that remuneration programs and policies
support the delivery of the corporate strategy
and create long-term sustainable shareholder
value; and
■ensuring that executive remuneration reflects the
contribution to achieving our ESG targets which
support long-term shareholder value creation.
While there have been intense negotiations between the
relevant parties, the Company prioritized protecting the
value of its patent portfolio over achieving certain timelines
for resolution. In January and February 2024, we announced
the conclusion of the patent cross-license agreements with
OPPO and vivo, respectively. Under the agreements, OPPO
and vivo will make royalty payments, along with catch-up
payments to cover the periods of non-payment. The
agreements resolve all pending patent litigation between
the parties, in all jurisdictions. The Personnel Committee
and the Board recognized that although both agreements
were signed in early 2024 instead of 2023, the outcomes
were in the best interest of the Company and our
shareholders. Therefore, to fairly reflect the significant
effort and achievements of Pekka Lundmark and our GLT,
the Board decided it would be appropriate to reflect the
value created from signing both agreements in the Nokia
Economic Profit outcome for 2023 STI purposes, which
would result in an above threshold payout under this
element for Pekka Lundmark. However, taking account
of the current financial pressure we are under and our
restrained approach to executive remuneration as a matter
of principle, it was decided that a one-third discount should
be applied to the EP outcome which resulted in a payout of
37% of target under this element for Pekka Lundmark.
Our 2023 diversity objective was based on the female
percentage of our global external hires. We delivered a full
year outcome of 27.9% of female external hiring against a
target of 28%, which resulted in 90% of the target payout
under this element for Pekka Lundmark. Our absolute
Scope 1 and 2 carbon emission for 2023 was 195 897 tCO2e
against a target of 221 652 tCO2e, which resulted in the
maximum payout of 225% of target under this element.
Our Scope 3 carbon emission targets were based on a
number of emission improvement actions reflecting the
key milestones of our Net Zero Roadmap. During 2023,
we achieved 83.03% of the targets under this element.
The Personnel Committee and the Board carried out a
detailed assessment of Pekka Lundmark’s personal strategic
objectives achievement following the year end and
determined a 150% of target payout under this element.
The personal strategic objectives and the assessment are
set out in the Remuneration Report. As a result, a total of
65.30% of target STI was payable to Pekka Lundmark in
respect of 2023 performance.
LTI performance and outcomes for 2020–2023
The 2020 LTI (performance shares) was subject to the
predetermined dividend adjusted share price targets and a
three-year performance period which ended in October 2023.
Based on the dividend adjusted share price outcome of €3.21,
the award vested at 39.5% of target for Pekka Lundmark and
other GLT members who received the grant in 2020.
Pekka Lundmark also received a grant under our eLTI co-
investment arrangement in August 2020, under which he
purchased €2.6 million in Nokia shares and received two-for-
one matching shares in return. The matching shares were also
subject to dividend adjusted share price targets with a three-
year performance period, which ended in August 2023. The
threshold share price was not met. Therefore, his matching
shares under the 2020 eLTI lapsed in full.
STI and LTI performance conditions for 2024
During 2023, the Committee also undertook a review of the
performance metrics used for our LTI and STI and decided
to make a number of changes for 2024 to ensure our incentive
plans continue to support the business strategy and growth
over the next three years. Our 2024 incentive plans for the
President and CEO and the rest of the GLT will follow the
structure set out below.
Delivering the next year’s step in the strategic plan – STI | |
Operating Profit 60% | Cash Release 20% |
Continued focus on profitability | Achieve a strong cash position |
Health & safety 10% – Lost Time Injury Frequency Rate (with a fatality modifier) | Diversity 10% |
Deliver on our focus on the continued health and safety of our employees | Deliver on our commitment to become a more diverse employer |
Delivering sustainable value – LTI | |
50% relative TSR, 40% cumulative reported EPS (adjusted for impairments and M&A), 10% carbon emission reduction (Scope 1, 2 and 3) | |
A more rounded and balanced approach reflecting performance over the long term in growing the business and in delivering shareholder value whilst working towards our 2030 goal of 50% carbon emission reduction | |
Taking account of the shareholder feedback received as
well as market practice, the absolute TSR metric in the LTI
will be replaced by cumulative reported EPS (adjusted for
impairments and M&A) in 2024. The Scope 1, 2 and 3 carbon
emission reduction targets will also be introduced to the
2024 LTI. We are one of the very few companies in the
market to include Scope 3 targets in incentive plans. This
demonstrates our commitment to deliver our long-term
emission reduction goal and to be a market leader in
addressing climate change.
Our other ESG-related focus and commitment is reflected
in the introduction of the health and safety metric with a
fatality modifier and the continued use of the diversity
metric in our 2024 STI. The change of financial metric for
the 2024 STI from Economic Profit to Operating Profit and
Cash Release supports our short-term strategic priority on
delivering profit and maintaining a strong cash position.
Based on feedback received from our shareholders,
they are also considered more transparent metrics than
Economic Profit.
Share ownership requirement
Our President and CEO is required to hold Nokia shares
equivalent to three times his annual base salary. Pekka
Lundmark currently maintains a total shareholding which
significantly exceeds the requirement. This demonstrates
his commitment to and alignment with Nokia’s long-term
success and our shareholder interests.
Conclusions
Remuneration outcomes for 2023 reflect our resilient
performance despite the challenges during the year and
demonstrate our remuneration philosophy of pay for
performance. The proposed Remuneration Policy
amendments build on what has proved to be a successful
remuneration strategy over the years. I thank shareholders
who assisted the Committee in the consultation process,
and very much welcome their constructive feedback and
support for the proposals. I look forward to your continued
support at our 2024 AGM.
Thomas Dannenfeldt,
Chair of the Personnel Committee
Business overview | Corporate governance | Operating and financial review and prospects | General facts on Nokia | Financial statements | Other information | 58 | |||||||
Remuneration continued
Nokia Annual Report on Form 20-F 2023
Introduction
This Remuneration Report of Nokia Corporation (the Report)
has been approved by the Company’s Board of Directors
(the Board) to be presented to the Annual General Meeting
2024. The resolution of the Annual General Meeting on the
Report is advisory. The Report presents the remuneration
of the Board members and the President and CEO for the
financial year 2023 in accordance with the Finnish Decree
of the Ministry of Finance 608/2019 and the Finnish
Corporate Governance Code of 2020, as well as other
applicable Finnish laws and regulations. The members of the
Board and the President and CEO have been remunerated in
accordance with our approved Remuneration Policy during
the financial year 2023. No temporary or other deviations
from the Policy have been made and no clawback provisions
have been exercised during the financial year 2023.
In 2023, our remuneration structure promoted the
Company’s long-term financial success by setting the
performance criteria for short- and long-term incentives to
support the Company’s short- and long-term goals, as well
as through shareholding requirements set for the President
and CEO, the GLT and the Board members. Aligned with
Nokia’s pay-for-performance remuneration principle,
performance-based remuneration was emphasized over
fixed base salary. The setting and application of the
performance criteria for incentive programs executed the
philosophy of pay-for-performance and supported the
delivery of the corporate strategy as well as the creation
of long-term sustainable shareholder value.
The table on the right compares the development of the
remuneration of our Board of Directors, President and CEO,
average employee pay and Company performance over a
five-year period.
The pay-for-performance remuneration principle applied
to the President and CEO, as well as the shareholding
requirement of the President and CEO and the Board
members, as applicable, contribute to an alignment of
interests with shareholders, while also promoting and
incentivizing decisions that are in the long-term interest
of the Company.
Year | Aggregate remuneration of the Board of Directors (EUR)(1) | President and CEO actual remuneration (EUR)(2) | Average salaries and wages (EUR)(3) | Net sales (EURm) | Total shareholder return (rebased to 100 at 31 Dec 2018)(4) |
2019 | 2 219 000 | 3 897 625 | 61 980 | 23 315 | 66.90 |
2020 | 2 016 000 | 3 587 781 | 65 787 | 21 852 | 63.95 |
2021 | 1 821 000 | 4 908 244 | 70 411 | 22 202 | 113.13 |
2022 | 2 280 000 | 4 316 606 | 74 100 | 24 911 | 88.94 |
2023 | 2 503 000 | 3 738 560 | 69 074 | 22 258 | 64.68 |
(1)Aggregate total remuneration paid to the members of the Board during the financial year as annual fee and meeting fee, as applicable, and as approved by general meetings of shareholders. The value depends on the number of members elected to the Board for each term as well as on the composition of the Board committees and travel required. During the term that began from the Annual General Meeting 2021, the Board had eight members only, compared to ten members during the following terms. (2)The President and CEO actual remuneration represents the aggregate total of the two CEOs in 2020. (3)Average salaries and wages are based on average employee numbers and their total salaries and wages as reported in the Company’s financial statements. (4)Total shareholder return on last trading day of the previous year. | |||||
We also present this data graphically:
Comparative data (rebased year-end 2018 = 100)
Business overview | Corporate governance | Operating and financial review and prospects | General facts on Nokia | Financial statements | Other information | 59 | |||||||
Remuneration continued
Nokia Annual Report on Form 20-F 2023
Remuneration of the Board of Directors
The shareholders resolve annually on director remuneration
based on a proposal made by the Board of Directors on the
recommendation of the Board’s Corporate Governance and
Nomination Committee.
The aggregate amount of remuneration paid to Board
members in 2023 equaled EUR 2 503 000 of which
EUR 2 370 000 consisted of annual fees and the rest of
meeting fees. In accordance with the resolution by the
Annual General Meeting 2023, approximately 40% of the
annual fee from Board and Board Committee work was paid
in Nokia shares purchased from the market on behalf of
the Board members following the Annual General Meeting.
The directors shall retain until the end of their directorship
such number of shares that corresponds to the number of
shares they have received as Board remuneration during
their first three years of service on the Board.
The rest of the annual fee was paid in cash, most of which
was used to cover taxes arising from the remuneration. All
meeting fees were paid in cash.
It is the Company’s policy that the non-executive members
of the Board do not participate in any of Nokia’s equity
programs and do not receive performance shares, restricted
shares, or any other variable remuneration for their duties
as Board members. No such variable remuneration was paid
since all persons acting as Board members during the
financial year 2023 were non-executive.
Board remuneration for the term that began at the Annual General Meeting held on 4 April 2023 and ends at the close of the Annual General Meeting in 2024 consisted of the following fees. |
Annual fee | EUR |
Chair | 440 000 |
Vice Chair | 210 000 |
Member | 185 000 |
Chair of Audit Committee | 30 000 |
Member of Audit Committee | 15 000 |
Chair of Personnel Committee | 30 000 |
Member of Personnel Committee | 15 000 |
Chair of Technology Committee | 20 000 |
Member of Technology Committee | 10 000 |
Meeting fee(1) | EUR |
Meeting requiring intercontinental travel | 5 000 |
Meeting requiring continental travel | 2 000 |
(1)Paid for a maximum of seven meetings per term.
The following table outlines the total annual remuneration paid in 2023 to the members of the Board for their services, as resolved by the shareholders at the Annual General Meeting. |
Annual fees (EUR) | Meeting fees (EUR)(1) | Total remuneration paid (EUR) | 60% of annual fees and all meeting fees paid in cash (EUR) | 40% of annual fees paid in shares (EUR) | Number of shares (approximately 40% of the annual fee) | |
Sari Baldauf (Chair) | 465 000 | 10 000 | 475 000 | 289 000 | 186 000 | 47 427 |
Søren Skou (Vice Chair) | 225 000 | 14 000 | 239 000 | 149 000 | 90 000 | 22 948 |
Timo Ahopelto | 210 000 | 10 000 | 220 000 | 136 000 | 84 000 | 21 418 |
Bruce Brown (until 4 April 2023)(2) | — | 5 000 | 5 000 | 5 000 | — | — |
Elizabeth Crain | 215 000 | 15 000 | 230 000 | 144 000 | 86 000 | 21 928 |
Thomas Dannenfeldt | 230 000 | 9 000 | 239 000 | 147 000 | 92 000 | 23 458 |
Lisa Hook | 200 000 | 17 000 | 217 000 | 137 000 | 80 000 | 20 399 |
Jeanette Horan | 210 000 | 10 000 | 220 000 | 136 000 | 84 000 | 21 418 |
Edward Kozel (until 4 April 2023)(2) | — | 5 000 | 5 000 | 5 000 | — | — |
Thomas Saueressig | 195 000 | 14 000 | 209 000 | 131 000 | 78 000 | 19 889 |
Carla Smits-Nusteling | 215 000 | 14 000 | 229 000 | 143 000 | 86 000 | 21 928 |
Kai Öistämö | 205 000 | 10 000 | 215 000 | 133 000 | 82 000 | 20 908 |
Total | 2 370 000 | 133 000 | 2 503 000 | 1 555 000 | 948 000 | 241 721 |
(1)Meeting fees include all meeting fees paid for the term that ended at the Annual General Meeting held on 4 April 2023 and meeting fees accrued and paid in 2023 for the term that began at the same meeting. (2)Stepped down at the Annual General Meeting on 4 April 2023 and received only one meeting fee in 2023. | ||||||
Business overview | Corporate governance | Operating and financial review and prospects | General facts on Nokia | Financial statements | Other information | 60 | |||||||
Remuneration continued
Nokia Annual Report on Form 20-F 2023
Remuneration of the President and CEO
The following table shows the actual remuneration received by Pekka Lundmark in 2023 and 2022. The LTI figures relate to the
vesting of the final tranche of the restricted share award granted to him on joining Nokia in respect of forfeited shares from his
previous employer and the vesting of the 2020 LTI performance shares.
EUR | 2023 | Pay mix(1) | 2022 | Pay mix(1) |
Salary | 1 322 750 | 36% | 1 300 000 | 31% |
Short-term incentive(2) | 1 079 695 | 30% | 2 342 438 | 56% |
Long-term incentive | 1 240 359 | 34% | 560 318 | 13% |
Other compensation(3) | 95 756 | 113 850 | ||
Total | 3 738 560 | 4 316 606 |
(1) Pay mix reflects the proportions of base salary, STI and LTI of total remuneration, excluding other remuneration.
(2) STI represents the amounts earned in respect of financial year 2023, but that are paid in April 2024.
(3) Other remuneration includes benefits such as telephone, car, driver, tax compliance support, and medical insurance.
Pursuant to Finnish legislation, Nokia is required to make contributions to the Finnish TyEL pension arrangements in respect
of the President and CEO. Such payments can be characterized as defined contribution payments. In 2023, payments to the
Finnish state pension system equalled EUR 422 274 for Pekka Lundmark in respect of his service as President and CEO
(EUR 475 384 for Pekka Lundmark in 2022). No supplementary pension arrangements were offered.
2023 Short-term Incentive of the President and CEO
Targets for the STI are set annually at or before the start of the year, balancing the need to deliver value with the need to
motivate and drive the performance of the Executive Team. Targets are determined for a set of strategic metrics that align with
driving sustainable value for shareholders and are set in the context of market expectations and analyst consensus forecasts.
For 2023, Pekka Lundmark had a target STI opportunity of 125% of annual base salary. His 2023 STI framework was based
on a scorecard of financial, strategic and ESG objectives. Achievement against the 2023 targets was as follows:
Metric | Weight | Target | STI outcome (% of target) |
Economic Profit(1) | 70% | EUR 1 851 million | 37% |
Diversity | 10% | Female percentage of global external hires of 28% | 90% |
Carbon emission reduction Scope 1&2 | 5% | 221 652 tCO2e | 225% |
Carbon emission reduction Scope 3 | 5% | ■Finalize Nokia’s Net Zero Roadmap and transition plan ■Achieve each business group’s committed roadmap milestones towards higher energy-efficient products and services | 83.03% |
Personal strategic objectives | 10% | ■Define the 2030 technology and business vision ■Develop alternative value creation strategies beyond the 3-year long-range plan | 150% |
Total STI outcome | 100% | 65.30% |
(1)Non-IFRS measure. For the definition and reconciliation of non-IFRS measures to the most directly comparable IFRS measures, refer to the “Alternative performance
measures” section. Nokia Economic Profit was determined based on the comparable operating profit less the cost of normalized core net working capital, which was
measured excluding the impact from the sale of receivables.
Accordingly, the total 2023 STI payout for Pekka Lundmark as the President and CEO was EUR 1 079 695.
Business overview | Corporate governance | Operating and financial review and prospects | General facts on Nokia | Financial statements | Other information | 61 | |||||||
Remuneration continued
Nokia Annual Report on Form 20-F 2023
Long-term Incentive awards granted to the President and CEO during 2023
In 2023, Pekka Lundmark was granted the following LTI (performance share) awards.
Targets for our LTI performance shares are set in a similar context to the STI. The performance share targets are set at the start
of the performance period and locked in for the life of the plan. The performance condition for the 2023 performance shares is
based on two-thirds absolute TSR and one-third relative TSR against our global peer group(1) over the three-year performance
period from 2023 to 2026. The targets for both metrics and the performance and vesting outcomes will be disclosed in the
2026 Remuneration Report.
Performance share awards granted during the year(2) | Units granted | Grant date face value (EUR)(3) | Grant date | Vesting |
2023 LTI performance shares | 635 700 | 2 434 731 | 6 July 2023 | Q3 2026 |
(1) Global peer group consisted of 27 companies (see details under the “Global peer group” section).
(2) The maximum vesting is 200% if stretch performance targets are met. Vesting is also subject to continued employment.
(3) Grant date face value was calculated using the closing price of €3.83 on the date of grant.
Long-term Incentive awards and other equity awards vested for the President and CEO during 2023
The final tranche of Pekka Lundmark’s 2020 restricted share award, made to him on joining Nokia to compensate for the
forfeited awards from his previous employer, vested on 1 October 2023 as set out in the table below.
Restricted share awards vested during the year | Units granted | Target | Achievement | Units vested | Value of vested award(1) (EUR) |
2020 Restricted Share award final tranche (3/3) | 117 467 | N/A | N/A | 117 467 | 380 590 |
(1) The vesting value was calculated using the closing share price of €3.24 on 21 November 2023, the day before the share delivery date.
The 2020 LTI performance share award granted to Pekka Lundmark in November 2020 had a three-year performance period and
was subject to dividend adjusted share price targets over the performance period. This award vested on 1 November 2023 as
set out in the table below.
LTI performance shares vested during the year | Units granted | Target share price (EUR) | Share price achievement (EUR) | Vesting outcome (% of target) | Units vested | Value of vested award(1) (EUR) |
2020 LTI performance shares | 671 800 | 3.67 | 3.21 | 39.5% | 265 361 | 859 770 |
(1) The vesting value was calculated using the closing share price of €3.24 on 21 November 2023, the day before the share delivery date.
Pekka Lundmark also received an eLTI grant in 2020, under which he invested €2.6 million in Nokia shares and received two-for-
one matching shares in return. The matching shares were subject to dividend adjusted share price targets over a three-year
performance period. However, as the threshold share price was not achieved, the matching shares lapsed in full on 1 August 2023.
eLTI matching performance shares vested during the year | Units granted | Target share price (EUR) | Share price achievement (EUR) | Vesting outcome (% of target) | Units vested |
2020 eLTI matching performance shares | 1 390 894 | 5.35 | 3.72 | 0.00 | 0 |
Business overview | Corporate governance | Operating and financial review and prospects | General facts on Nokia | Financial statements | Other information | 62 | |||||||
Remuneration continued
Nokia Annual Report on Form 20-F 2023
The President and CEO’s share ownership and unvested share awards
Our share ownership policy requires that the President and CEO holds a minimum of three times his or her annual base salary in
Nokia shares in order to ensure alignment with shareholder interests over the long term. Pekka Lundmark significantly exceeds
this requirement with a holding of 346%, well within the five-year allotted period.
Pekka Lundmark | Units | Value(1) (EUR) |
Beneficially owned shares at 31 December 2023 | 1 473 060 | 4 495 779 |
Unvested shares under outstanding Nokia equity plans(2) | 2 910 980 | 8 884 310 |
Total | 4 384 040 | 13 380 089 |
(1) The values are based on the closing price of a Nokia share of EUR 3.052 on Nasdaq Helsinki on 29 December 2023.
(2) The number of units represents the number of unvested awards as of 31 December 2023.
The President and CEO’s termination provisions 2023
Termination by | Reason | Notice | Compensation |
Nokia | Cause | None | The President and CEO is entitled to no additional remuneration and all unvested equity awards would be forfeited after termination. |
Nokia | Reasons other than cause | Up to 12 months | The President and CEO is entitled to a severance payment equaling up to 12 months’ remuneration (including annual base salary, benefits, and target short- term incentive) and unvested equity awards would be forfeited after termination. |
President and CEO | Any reason | 12 months | The President and CEO may terminate his service agreement at any time with 12 months’ notice. The President and CEO would either continue to receive salary and benefits during the notice period or, at Nokia’s discretion, a lump sum of equivalent value. Additionally, the President and CEO would be entitled to any short- or long-term incentives that would normally vest during the notice period. Any unvested equity awards would be forfeited after termination. |
President and CEO | Nokia’s material breach of the service agreement | Up to 12 months | In the event that the President and CEO terminates his service agreement based on a final arbitration award demonstrating Nokia’s material breach of the service agreement, he is entitled to a severance payment equaling up to 12 months’ remuneration (including annual base salary, benefits and target incentive). Any unvested equity awards would be forfeited after termination. |
The President and CEO is subject to a 12-month non-competition and non-solicit obligation that applies after the termination
of the service agreement or the date when he is released from his obligations and responsibilities, whichever occurs earlier.
Business overview | Corporate governance | Operating and financial review and prospects | General facts on Nokia | Financial statements | Other information | 63 | |||||||
Remuneration continued
Nokia Annual Report on Form 20-F 2023
Remuneration Policy
Nokia Corporation’s Remuneration Policy, which applies to the
governing bodies of the Company, i.e. the Board of Directors
and the President and CEO, was approved by shareholders at
the Annual General Meeting 2020 receiving 86.37% of votes
in favor. During 2023, the Board’s Personnel Committee
carried out a review of the Remuneration Policy and concluded
the Policy remains suitable for Nokia’s business strategy.
Therefore, only minor changes are proposed to the Policy
alongside some presentational changes to further align our
arrangements with market practice and to provide greater
transparency on our disclosure. This section sets out the
updated Policy, which will be submitted to the Annual General
Meeting 2024 to be adopted through an advisory vote.
The updated Policy would apply to remuneration in respect
of the four-year period from 2024 to 2027, unless presented
to the General Meeting at an earlier date with proposed
changes.
The updated Remuneration Policy for the Board
of Directors
In accordance with the Remuneration Policy, the Board’s
Corporate Governance and Nomination Committee periodically
reviews the remuneration for the Chair and members of the
Board against companies of similar size and complexity.
The objective of the Corporate Governance and Nomination
Committee is to enable Nokia to compete for top-of-class
Board competence to maximize value creation for its
shareholders. The Committee’s aim is that the Company has
an efficient Board composed of international professionals
representing a diverse and relevant mix of skills, experience,
background and other personal qualities in line with the
diversity principles established by the Board. Competitive
Board remuneration contributes to the achievement of
this target.
The main structure of the Board remuneration as outlined
in the Remuneration Policy is set out in the table below.
Fees | Fees consist of annual fees and meeting fees. Approximately 40% of the annual fee is paid in Nokia shares purchased from the market on behalf of the Board members or alternatively delivered as treasury shares held by the Company. The balance is paid in cash, most of which is typically used to cover taxes arising from the paid remuneration. Meeting fees are paid in cash. |
Incentives | Non-executive directors are not eligible to participate in any Nokia incentive plans and do not receive performance shares, restricted shares or any other equity-based or other form of variable compensation for their duties as members of the Board. |
Pensions | Non-executive directors do not participate in any Nokia pension plans. |
Share ownership requirement | Members of the Board shall normally retain until the end of their directorship such number of shares that corresponds to the number of shares they have received as Board remuneration during their first three years of service on the Board (the net amount received after deducting those shares needed to offset any costs relating to the acquisition of the shares, including taxes). |
Other | Directors are compensated for travel and accommodation expenses as well as other costs directly related to Board and Committee work. These are paid in cash. |
Proposals of the Board of Directors to the Annual General
Meeting 2024 were published on 25 January 2024. The
Corporate Governance and Nomination Committee has
resolved to recommend to the Board that the annual fees
of Board members would remain at an unchanged level.
Consequently, the Board proposes to the Annual General
Meeting 2024 that the annual fees payable for a term ending
at the close of the next Annual General Meeting be as follows:
■EUR 440 000 for the Chair of the Board;
■EUR 210 000 for the Vice Chair of the Board;
■EUR 185 000 for each member of the Board;
■EUR 30 000 each for the Chairs of the Audit Committee and
the Personnel Committee and EUR 20 000 for the Chair of
the Technology Committee as an additional annual fee;
■EUR 15 000 for each member of the Audit Committee and
Personnel Committee and EUR 10 000 for each member of
the Technology Committee as an additional annual fee.
The Board has resolved to establish a Strategy Committee to
support the management in terms of strategy work and to act
as a preparatory body for the Board. Consequently, on the
recommendation of the Corporate Governance and Nomination
Committee, the Board also proposes that:
■EUR 20 000 be paid for the Chair of the Strategy
Committee and EUR 10 000 be paid for each member of
the Strategy Committee as an additional annual fee for
the Committee’s first term commencing from the Annual
General Meeting and ending at the close of the next Annual
General Meeting.
In addition, the Board of Directors proposes that the meeting
fees for Board and Committee meetings remain at the current
level. The meeting fees are based on potential travel required
between the Board member’s home location and the location
of a meeting and are paid for a maximum of seven meetings
per term as follows:
■EUR 5 000 per meeting requiring intercontinental travel;
■EUR 2 000 per meeting requiring continental travel.
Only one meeting fee is paid if the travel covered by the fee
includes several meetings of the Board and its Committees.
The Board also proposes that members of the Board shall
be compensated for travel and accommodation expenses
as well as other costs directly related to Board and Board
Committee work.
Business overview | Corporate governance | Operating and financial review and prospects | General facts on Nokia | Financial statements | Other information | 64 | |||||||
Remuneration continued
Nokia Annual Report on Form 20-F 2023
The updated Remuneration Policy for the President and CEO
Remuneration element | Purpose and link to strategy | Operation including maximum opportunity | Performance conditions |
Base salary | To attract and retain individuals with the requisite level of knowledge, skills and experience to lead our businesses | Base salary is normally reviewed annually taking into consideration a variety of factors, including but not limited to, performance of the Company and the individual, remuneration of our external peer group, changes in individual responsibilities and employee salary increases. | Whilst there are no performance targets attached to the payment of base salary, performance is considered as context in the annual salary review. |
Pension | To provide retirement benefit aligned with local country practice | Pension arrangements reflect the relevant market practice and may evolve year on year. The President and CEO may participate in the applicable pension programs available to other executives in the country of employment. The current President and CEO participates in the Finnish statutory Employee’s Pension Act (TyEL); there is no supplementary pension plan. The retirement age is the statutory retirement age in Finland. | N/A |
Benefits | To provide a competitive level of benefits and to support recruitment and retention | Benefits will be provided in line with local market practice in the country of employment and may evolve year on year. Benefits may include, for example, a company car (or cash equivalent), risk benefits (for example life and disability insurance) and employer contributions to insurance plans (for example medical insurance). Additional benefits and allowances may be offered in certain circumstances such as relocation support, expatriate allowances, and temporary living and transportation expenses aligned with Nokia’s mobility policy. | N/A |
Short-term incentive (STI) | To incentivize and reward performance against delivery of the annual business plan | STI is based on performance against one-year financial and non-financial targets and normally paid in cash. Minimum payout is 0% of base salary. Target opportunity is 125% of base salary. Maximum opportunity is 281.25% of base salary. The Company Clawback Policies apply. | Performance measures, weightings and targets for the selected measures are set at the start of the year annually by the Board of Directors to ensure they continue to support Nokia’s short-term business strategy. These measures can vary from year to year to reflect business priorities and may include a balance of financial, key operational and non-financial measures. Although the performance measures and weighting may differ year on year reflecting the business priorities, in any given year, a minimum of 60% of measures will be based on financial criteria. Performance metrics and weightings are disclosed retrospectively in the annual Remuneration Report. |
Long-term incentive (LTI) – performance share award | To reward for delivery of sustainable long-term performance, align the President and CEO’s interests with those of shareholders and aid retention | Long-term incentive awards may be made annually in shares, vesting normally after three years dependent on the achievement of stretching performance conditions measured over a three-year period. Target award level is 200% of base salary at the date of grant, with maximum vesting of 400% of base salary. The Company Clawback Policies apply. | Performance measures, weightings and targets for the selected measures are set by the Board of Directors to ensure they continue to support Nokia’s long-term business strategy and financial success. Targets are set in the context of Nokia’s long-term plans and analyst forecasts, ensuring that they are considered both achievable and sufficiently stretching. The Committee may choose different measures and weightings each year based on the business plan and these will consist of at least 60% financial measures and/or share price-related measures. Performance metrics and weightings are disclosed retrospectively in the annual Remuneration Report. |
Business overview | Corporate governance | Operating and financial review and prospects | General facts on Nokia | Financial statements | Other information | 65 | |||||||
Remuneration continued
Nokia Annual Report on Form 20-F 2023
Remuneration element | Purpose and link to strategy | Operation including maximum opportunity | Performance conditions |
Enhanced LTI (eLTI) – co-investment arrangement | To further align the President and CEO’s interests with Nokia’s long-term success and shareholder interests | To further align the President and CEO’s interests with Nokia’s long-term success and shareholder interests eLTI is only granted in exceptional circumstances. The President and CEO may be invited, at the discretion of the Board, to purchase investment shares of up to 200% of base salary, and in return, receive two matching shares for every one investment share purchased. The matching shares are delivered in the form of performance shares, typically subject to the same performance conditions as for the LTI performance share award, with a three-year performance and vesting period. The minimum vesting of the matching shares is 0% of base salary and maximum vesting is two times grant level. The Company Clawback Policies apply. | The performance metrics, targets and weightings for the matching shares are typically the same as those for LTI performance shares granted in the same year. |
Shareholding requirement | To align the President and CEO’s interests with shareholder interests and ensure any decisions made are in the long-term interest of the Company | The President and CEO is required to build and maintain a shareholding equivalent to 300% of base salary, to be achieved normally within five years of appointment. | N/A |
Business overview | Corporate governance | Operating and financial review and prospects | General facts on Nokia | Financial statements | Other information | 66 | |||||||
Remuneration continued
Nokia Annual Report on Form 20-F 2023
Pay mix and remuneration scenarios for the President
and CEO
The chart below illustrates how the proportion of the President
and CEO’s remuneration package varies at the minimum, target
and maximum levels of performance. A significant proportion
of remuneration is linked to performance, especially at stretch
performance levels. Actual pay mix is influenced by the extent
to which the performance targets set for the STI and LTI are
achieved and may vary from the scenarios below.
The long-term incentive vesting outcomes in the chart below
ignore share price movement from grant to vest. The eLTI is
not included in this analysis as it is not an annual award and
is only granted in exceptional circumstances. The vesting
outcome of the matching performance shares under the eLTI
would be dependent, besides the performance, on the value of
the investment, which could range from 0% to 200% of base
salary for the President and CEO. The minimum and maximum
vesting levels for the matching performance shares are
provided in the above summary table of the remuneration
elements.
President and CEO pay mix scenarios
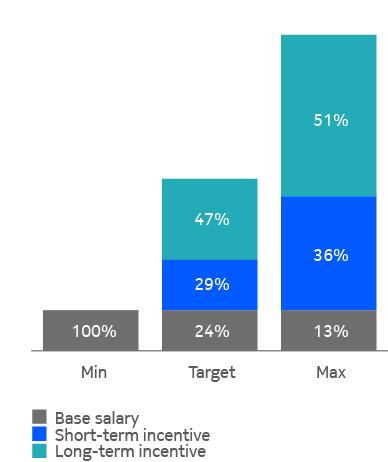
Share ownership requirement
Nokia believes that it is desirable for its executives to
own shares in Nokia to align their interests with those of
shareholders and to ensure that their decisions are in the
long-term interest of the Company. The President and CEO
is required to own three times his or her annual base salary
in Nokia shares and is given a period of five years from
appointment to achieve the required level of share ownership.
Clawback Policies
The Company Clawback Policies apply to the President and
CEO’s incentive plans. The Executive Clawback Policy is applied
in the case of any erroneously awarded remuneration due to
restatement in the Company’s financial statements with a
three-year look back period, resulting in the recoupment of
excess amounts previously paid based on numbers which have
since been materially restated.
Additionally, the Board of Directors may, in its sole discretion,
apply the Nokia Incentive Compensation Clawback Policy in
circumstances such as reputational damage, gross misconduct
and willful breach of internal control procedure.
Remuneration on recruitment
Our policy on recruitment is to offer a remuneration package
that is sufficient to attract, retain and motivate the individual
with the right skills for the required role.
On occasion, we may offer buy-out awards to compensate for
a candidate’s forfeited awards on leaving a previous employer.
Such buy-out awards would, where possible, reflect the nature
of the forfeited awards in terms of delivery mechanism, time
horizons, attributed expected value and performance conditions.
Termination provisions
In the event of a termination of employment, any payable
remuneration is determined in line with legal advice regarding
local legislation, country policies, contractual obligations
and the rules of the applicable incentive and benefit plans.
Payment in lieu of notice will not typically exceed the value
of 12 months’ remuneration (including base salary, benefits,
STI and pension contribution, if applicable). The treatment of
equity incentive awards may depend on the circumstances
of the departure. In the event of death, permanent disability
or retirement, unvested awards are normally allowed to be
retained. These awards will vest either on departure or at
normal vesting date, subject to performance (if applicable)
and time proration, unless the Board of Directors determines
otherwise. Current termination provisions of the President and
CEO’s service agreement are described in the Remuneration
Report.
Change of control arrangements, if any, are based on a double
trigger structure, which means that both a specified change of
control event and termination of the individual’s employment
must take place for any change of control-based severance
payment to materialize.
Business overview | Corporate governance | Operating and financial review and prospects | General facts on Nokia | Financial statements | Other information | 67 | |||||||
Remuneration continued
Nokia Annual Report on Form 20-F 2023
Work of the Personnel Committee
The Personnel Committee convened five times during 2023 with a general theme for each meeting.
Remuneration governance
We manage our remuneration through clearly defined
processes, with well-defined governance principles, ensuring
that no individual is involved in the decision-making related
to their own remuneration, and that there is appropriate
oversight of any remuneration decision. Remuneration of
the Board is annually presented to shareholders for approval
at the Annual General Meeting.
The Board submits its proposal to the Annual General Meeting
on the recommendation of the Board’s Corporate Governance
and Nomination Committee, which actively considers and
evaluates the appropriate level and structure of directors’
remuneration. Shareholders also authorize the Board to
resolve to issue shares, for example to settle Nokia’s equity-
based incentive plans, based on the proposal of the Board.
The Board of Directors approves, and the independent
members of the Board confirm, the remuneration of
the President and CEO, upon recommendation of the
Personnel Committee.
The Personnel Committee consults regularly with the President
and CEO and the Chief People Officer. The President and
CEO has an active role in the remuneration governance and
performance management processes for the GLT and the wider
employee population at Nokia. However, the President and CEO
or the Chief Personnel Officer are not present when their own
remuneration is reviewed or discussed. This enables the
Personnel Committee to be mindful of employee pay and
conditions across the broader employee population.
The Committee has the power, in its sole discretion, to retain
remuneration consultants to assist the Personnel Committee in
evaluating executive remuneration. During 2023, the Personnel
Committee engaged Willis Towers Watson, an independent
external consultant, to assist in the review and determination
of executive remuneration and program design, as well as to
provide insight into market trends and regulatory
developments.
The Personnel Committee Chair regularly engages with
shareholders to discuss their views on our remuneration
policies, programs and associated disclosures and reflects
on their feedback. These insights are taken account of in
the Committee’s and Board’s decision-making process for
executive remuneration.
May
■LTI design for 2024–2026
■Equity plan status
■2023 Annual General Meeting season review
■GLT remuneration review
■Culture update
■GLT succession approach
■The SEC’s regulation on clawback
July
■Remuneration Policy review
■Nokia Executive Clawback Policy review
■LTI design for 2024–2026
■Market practice update
■People risks including physical safety review
September
■Nokia Incentive Compensation Clawback Policy review
■LTI design for 2024–2026
■Analytics and demographics
■Remuneration Policy 2024 including the shareholder
consultation process
November
■LTI and Share in Success Plan Rules renewal
for 2024–2026 and 2024 incentive metrics
■2024 equity plan budget and allocation
■Proxy agency and shareholder feedback
■Planning of Remuneration Report for 2023
■GLT Succession planning
■Executive shareholding assessment
■Personnel Committee charter review
Business overview | Corporate governance | Operating and financial review and prospects | General facts on Nokia | Financial statements | Other information | 68 | |||||||
Remuneration continued
Nokia Annual Report on Form 20-F 2023
January
■2022 STI performance outcome
■2023 STI and LTI metrics and target setting
■President and CEO remuneration review
■Equity plan vesting and granting during 2023
■Remuneration Report for 2022
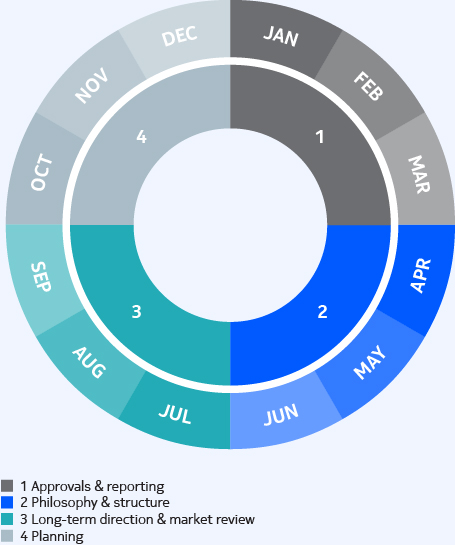
Remuneration of the Nokia Group
Leadership Team in 2023
The remuneration of the members of the GLT (excluding the
President and CEO) consists of base salary, other benefits, and
short- and long-term incentives. Short-term incentive plans
are based on rewarding the delivery of business performance
utilizing certain, or all, of the following metrics as appropriate
to the member’s role: Economic Profit, diversity, carbon
emission reduction and defined strategic objectives.
Executives in the GLT are subject to the same remuneration
policy framework as the President and CEO. This includes
being subject to the Clawback Policies and shareholding
requirements. The shareholding requirement for members
of the GLT is two times their annual base salary, built within
a period of five years of their appointment.
At the end of 2023, the Group Leadership Team consisted of 11 persons split between Finland, other European countries, Singapore and the United States. For information regarding the current Group Leadership Team composition, refer to the Corporate Governance Statement. |
Name | Position in 2023 | Appointment date |
Pekka Lundmark | President and CEO | 1 August 2020 |
Nishant Batra | Chief Strategy and Technology Officer | 18 January 2021 |
Ricky Corker | Chief Customer Experience Officer | 1 January 2019 |
Federico Guillén | President of Network Infrastructure | 8 January 2016 |
Amy Hanlon-Rodemich | Chief People Officer | 24 October 2022 |
Jenni Lukander | President of Nokia Technologies | 1 August 2019 |
Esa Niinimäki | Chief Legal Officer | 25 January 2023 |
Raghav Sahgal | President of Cloud and Network Services | 1 June 2020 |
Melissa Schoeb | Chief Corporate Affairs Officer | 12 April 2021 |
Tommi Uitto | President of Mobile Networks | 31 January 2019 |
Marco Wirén | Chief Financial Officer | 1 September 2020 |
Remuneration of the Group Leadership Team members in 2023 Remuneration of the Group Leadership Team (excluding the President and CEO) in 2022 and 2023, in the aggregate, was as follows: |
EURm⁽¹⁾ | 2023 | 2022 |
Salary, short-term incentives and other compensation(2) | 10.8 | 13.6 |
Long-term incentives(3) | 2.5 | 7.0 |
Total | 13.3 | 20.6 |
(1)The values represent each member’s time on the Group Leadership Team. (2)Short-term incentives represent amounts earned in respect of 2023 performance. Other compensation includes mobility-related payments, local benefits and pension costs. (3)The amounts represent the equity awards that vested in 2023 and 2022. | ||
The members of the Group Leadership Team (excluding the President and CEO) were awarded the following equity awards under the Nokia equity program in 2023: |
Award | Units awarded(1) | Grant date fair value (EUR) | Grant date | Vesting |
Performance share award(2) | 1 858 500 | 7 118 055 | 6 July 2023 | Q3 2026 |
Restricted share award(3) | 1 454 000 | 4 376 540 | 15 December 2023 | Q4 2024, Q4 2025 |
(1)Includes units awarded to persons who were Group Leadership Team members during 2023. (2)The 2023 performance shares have a three-year performance period based on absolute total shareholder return. The maximum payout is 200% subject to maximum performance against the performance criteria. Vesting is subject to continued employment. (3)Vesting of each tranche of the restricted share awards is conditional on continued employment. | ||||
Business overview | Corporate governance | Operating and financial review and prospects | General facts on Nokia | Financial statements | Other information | 69 | |||||||
Remuneration continued
Nokia Annual Report on Form 20-F 2023
Unvested equity awards held by the Group Leadership Team, including the President and CEO
The following table sets forth the potential aggregate ownership interest through the holding of equity-based long-term incentives
of the Group Leadership Team in office, including the President and CEO, at 31 December 2023:
Shares receivable through performance shares at grant | Shares receivable through performance shares at maximum(4) | Shares receivable through restricted shares | |
Number of equity awards held by the Group Leadership Team(1) | 9 556 958 | 19 113 916 | 1 454 000 |
% of the outstanding shares(2) | 0.17% | 0.35% | 0.03% |
% of the total outstanding equity incentives (per instrument)(3) | 22.19% | 23.26% | 1.55% |
(1)Includes the 11 members of the Group Leadership Team in office at 31 December 2023.
(2)The percentages are calculated in relation to the outstanding number of shares and total voting rights of Nokia at 31 December 2023, excluding shares held by the Nokia Group.
No member of the Group Leadership Team owns more than 1% of the outstanding Nokia shares.
(3)The percentages are calculated in relation to the total outstanding equity incentives per instrument.
(4)At maximum performance, under the performance share plans outstanding at 31 December 2023, the payout would be 200% and the table reflects this potential maximum payout.
Employee Share Purchase Plan
All eligible Nokia employees, including the President and CEO and our GLT members can participate in the Employee Share Purchase
Plan, by making contributions from their monthly net salaries (up to a cap) to purchase Nokia shares at market value. Participants will
receive one matching share for every two purchased shares they still hold at the end of the applicable annual plan cycle. Until the
matching shares are delivered, the participants have no shareholder rights, such as voting or dividend rights associated with the
matching shares.
Business overview | Corporate governance | Operating and financial review and prospects | General facts on Nokia | Financial statements | Other information | 70 | |||||||
Remuneration continued
Nokia Annual Report on Form 20-F 2023
Pay for performance
Core to our remuneration philosophy is a desire to pay for
performance.
Each year we review overall total shareholder return compared
with LTI vesting, mapping the performance of the plans against
the total shareholder return curve.
Share price and total shareholder return vs long-term
incentive performance
* 2021 LTI's performance period ended in Jan 2024. The vesting outcome of this award
will be reported in the 2024 Remuneration Report.
** 2022 and 2023 LTIs' performance periods not yet completed.
Looking at the performance of our long-term incentive plans
against total shareholder return, there is a reasonable
alignment with the performance of the plans declining as total
shareholder return declines.
The Board continues to actively monitor the performance of
our long-term incentive plans to ensure that they deliver value
for shareholders.
Global peer group
The global peer group used in our remuneration benchmarking
and relative TSR performance assessment consists of
27 companies.
ABB | IBM |
Adobe | Infineon Technologies |
Airbus | Juniper Networks |
ASML | Kone |
Atos | Motorola Solutions |
BAE Systems | NXP Semiconductors |
Capgemini | Oracle |
Ciena | Philips |
Cisco Systems | SAP |
Corning | Siemens Healthineers |
Dell Technologies | VMware |
Ericsson | Vodafone Group |
Hewlett Packard Enterprise | Wärtsilä |
HP |
Business overview | Corporate governance | Operating and financial review and prospects | General facts on Nokia | Financial statements | Other information | 71 | |||||||
Remuneration continued
Nokia Annual Report on Form 20-F 2023

Operating and financial
review and prospects
Business overview | Corporate governance | Operating and financial review and prospects | General facts on Nokia | Financial statements | Other information | 72 | |||||||
Nokia Annual Report on Form 20-F 2023
Selected financial data
This section includes selected financial and other measures for the Nokia Group as of and for each of the years in the three-year period ended 31 December 2023. The information has been derived
from, and should be read in conjunction with, our audited consolidated financial statements prepared in accordance with IFRS. The consolidated financial statements as of 31 December 2023 and
2022, and for the years ended 31 December 2023, 2022 and 2021 are included in this report.
EURm (except for percentage and personnel data) | 2023 | 2022 | 2021 |
From the consolidated income statement | |||
Net sales | 22 258 | 24 911 | 22 202 |
Operating profit | 1 688 | 2 318 | 2 158 |
% of net sales | 7.6% | 9.3% | 9.7% |
Profit before tax | 1 499 | 2 184 | 1 926 |
Profit from continuing operations | 674 | 4 210 | 1 654 |
Profit/(loss) from discontinued operations | 5 | 49 | (9) |
Profit for the year | 679 | 4 259 | 1 645 |
From the consolidated statement of financial position | |||
Non-current assets | 21 694 | 22 677 | 20 452 |
Current assets | 18 087 | 20 266 | 19 597 |
Assets held for sale | 79 | — | — |
Total assets | 39 860 | 42 943 | 40 049 |
Total shareholders' equity | 20 537 | 21 333 | 17 360 |
Non-controlling interests | 91 | 93 | 102 |
Total equity | 20 628 | 21 426 | 17 462 |
Interest-bearing liabilities(1) | 4 191 | 4 477 | 4 653 |
Lease liabilities(1) | 997 | 1 042 | 1 009 |
Provisions(1) | 1 262 | 1 435 | 1 569 |
Other liabilities(1) | 12 782 | 14 563 | 15 356 |
Total shareholders’ equity and liabilities | 39 860 | 42 943 | 40 049 |
Other information | |||
Research and development expenses | (4 327) | (4 550) | (4 214) |
% of net sales | (19.4)% | (18.3)% | (19.0)% |
Capital expenditure(2) | (652) | (601) | (560) |
% of net sales | (2.9)% | (2.4)% | (2.5)% |
Personnel expenses | (7 470) | (7 903) | (7 541) |
Average number of employees | 86 689 | 86 896 | 87 927 |
Order backlog, EUR billion | 22.0 | 19.5 | 20.3 |
EURm (except for percentage and personnel data) | 2023 | 2022 | 2021 |
Key financial indicators and ratios | |||
Earnings per share attributable to equity holders of the parent | |||
Basic earnings per share, EUR | |||
Continuing operations | 0.12 | 0.75 | 0.29 |
Profit for the year | 0.12 | 0.76 | 0.29 |
Diluted earnings per share, EUR | |||
Continuing operations | 0.12 | 0.74 | 0.29 |
Profit for the year | 0.12 | 0.75 | 0.29 |
Proposed dividend per share, EUR(3) | 0.13 | 0.12 | 0.08 |
Return on capital employed %(2) | 6.7% | 9.5% | 10.1% |
Return on shareholders’ equity %(2) | 3.2% | 22.0% | 10.9% |
Equity ratio %(2) | 51.8% | 49.9% | 43.6% |
Net debt to equity (gearing) %(2) | (21.0)% | (22.2)% | (26.4)% |
Cash and cash equivalents | 6 234 | 5 467 | 6 691 |
Total cash and interest-bearing financial investments(2) | 8 514 | 9 244 | 9 268 |
Net cash and interest-bearing financial investments(2) | 4 323 | 4 767 | 4 615 |
Net cash flows from operating activities | 1 317 | 1 474 | 2 625 |
Free cash flow(2)(4) | 665 | 873 | 2 065 |
(1)Includes both current and non-current liabilities in the consolidated statement of financial position.
(2)Non-IFRS measures. For the definition and reconciliation of non-IFRS measures to the most directly comparable IFRS measures,
refer to the ”Alternative performance measures” section.
(3)The Board of Directors proposes to the Annual General Meeting to be authorized to decide in its discretion on the distribution of
an aggregate maximum of EUR 0.13 per share as dividend from the retained earnings and/or as assets from the reserve for
invested unrestricted equity.
(4)Free cash flow is calculated according to the new definition, refer to the “Alternative performance section” for details.
Business overview | Corporate governance | Operating and financial review and prospects | General facts on Nokia | Financial statements | Other information | 73 | |||||||
Selected financial data
Nokia Annual Report on Form 20-F 2023
Operating and financial review
The financial information included in this “Operating and financial review” section as of and for the years ended 31 December 2023 and 2022 has been derived from our audited consolidated
financial statements included in this report. The financial information should be read in conjunction with, and is qualified in its entirety by reference to, our audited consolidated financial
statements. For a discussion of the year ended 31 December 2022 compared to the year ended 31 December 2021, please refer to the “Operating and financial review” section of our Annual
Report on Form 20-F for the year ended 31 December 2022.
Results of operations
This “Results of operations” section discusses the results of our continuing operations.
Cost savings program
On 19 October 2023, Nokia announced actions being taken across business groups to address
the increasingly challenging market environment that the Company faces. The Company will
reduce its cost base and increase operational efficiency while protecting its R&D capacity and
commitment to technology leadership.
Nokia targets to lower its cost base on a gross basis (i.e. before inflation) by between
EUR 800 million and EUR 1 200 million by the end of 2026 compared to 2023, assuming on-
target variable pay in both periods. This represents a 10-15% reduction in personnel expenses.
The program is expected to lead to a 72 000–77 000 employee organization compared to the
86 000 employees Nokia had when the program was announced.
The program is expected to deliver savings on a net basis but the magnitude will depend on
inflation. The cost savings are expected to primarily be achieved in Mobile Networks, Cloud and
Network Services and Nokia’s corporate functions. One-time restructuring charges and cash
outflows of the program are expected to be similar to the annual cost savings achieved.
The current plan envisages achieving gross cost savings of EUR 1 000 million within the
2024–2026 program although this remains subject to change depending on the evolution of
end market demand. This includes the expected gross cost savings along with the associated
restructuring charges and cash outflows for the program. Nokia expects approximately 70% of
the savings to be achieved within operating expenses and 30% within cost of sales. By business
group, approximately 60% of the savings are expected to be achieved within Mobile Networks,
30% within Cloud and Network Services and the remaining 10% between Network Infrastructure
and corporate center.
The prior cost savings program from 2021 to 2023 is now essentially completed.
Conclusion of smartphone patent license renewal cycle
On 8 February 2024, Nokia announced it had signed its last remaining major smartphone patent
license agreement and concluded its smartphone patent license renewal cycle which began in
2021. Nokia Technologies will now enter a period of stability with no major smartphone license
agreements expiring for a number of years. In addition to license agreements signed with Apple
and Samsung in 2023, and Huawei in December 2022, Nokia Technologies signed agreements
with Honor, OPPO and vivo, among others at the beginning of 2024.
As a result, at the conclusion of the smartphone patent license renewal cycle, Nokia Technologies
currently has an annual net sales run-rate (contracted recurring net sales) of approximately
EUR 1.3 billion, excluding catch-up net sales. In addition to the remaining addressable
smartphone market, it will continue to focus on opportunities to grow the annual net sales
run-rate through patent licensing in areas such as automotive, consumer electronics, IoT and
multimedia, to reach a run-rate of EUR 1.4-1.5 billion in the mid term.
Business overview | Corporate governance | Operating and financial review and prospects | General facts on Nokia | Financial statements | Other information | 74 | |||||||
Operating and financial review
Nokia Annual Report on Form 20-F 2023
For the year ended 31 December 2023 compared to the year ended
31 December 2022
The following table sets forth the results of Nokia’s continuing operations and the percentage of
net sales for the years indicated.
2023 | 2022 | |||||
EURm | % of net sales | EURm | % of net sales | Year-on-year change % | ||
Net sales | 22 258 | 100.0 | 24 911 | 100.0 | (11) | |
Cost of sales | (13 571) | (61.0) | (14 689) | (59.0) | (8) | |
Gross profit | 8 687 | 39.0 | 10 222 | 41.0 | (15) | |
Research and development expenses | (4 327) | (19.4) | (4 550) | (18.3) | (5) | |
Selling, general and administrative expenses | (2 929) | (13.2) | (3 013) | (12.1) | (3) | |
Other operating income and expenses | 257 | 1.2 | (341) | (1.4) | (175) | |
Operating profit | 1 688 | 7.6 | 2 318 | 9.3 | (27) | |
Share of results of associated companies and joint ventures | (39) | (0.2) | (26) | (0.1) | 50 | |
Financial income and expenses | (150) | (0.7) | (108) | (0.4) | 39 | |
Profit before tax | 1 499 | 6.7 | 2 184 | 8.8 | (31) | |
Income tax (expense)/benefit | (825) | (3.7) | 2 026 | 8.1 | (141) | |
Profit for the year from continuing operations | 674 | 3.0 | 4 210 | 16.9 | (84) | |
Attributable to: | ||||||
Equity holders of the parent | 660 | 3.0 | 4 201 | 16.9 | (84) | |
Non-controlling interests | 14 | 0.1 | 9 | — | 56 | |
Net sales
Net sales in 2023 were EUR 22 258 million, a decrease of EUR 2 653 million, or 11%, compared
to EUR 24 911 million in 2022. In 2023, our industry was impacted by a meaningful shift in
customer behavior driven by the macroeconomic environment, high interest rates and customer
inventory digestion. In addition to a negative impact from foreign exchange rate fluctuations,
performance was driven by declines across all four business groups, with particular weakness in
Network Infrastructure, Mobile Networks and Nokia Technologies. Net sales declined 3% due to
foreign exchange rate fluctuations in 2023.
The following table sets forth distribution of net sales by region for the years indicated.(1)
EURm | 2023 | 2022 | Year-on-year change % |
Asia Pacific | 2 291 | 2 648 | (13) |
Europe(1) | 5 873 | 6 662 | (12) |
Greater China | 1 303 | 1 581 | (18) |
India | 2 842 | 1 290 | 120 |
Latin America | 1 046 | 1 223 | (14) |
Middle East & Africa | 2 050 | 1 969 | 4 |
North America | 5 733 | 8 388 | (32) |
Submarine Networks | 1 120 | 1 150 | (3) |
Total | 22 258 | 24 911 | (11) |
(1)All Nokia Technologies IPR and licensing net sales are allocated to Finland.
The following table sets forth distribution of net sales by customer type for the years indicated.
EURm | 2023 | 2022 | Year-on-year change % |
Communications service providers | 17 652 | 19 921 | (11) |
Enterprise | 2 282 | 1 997 | 14 |
Licensees | 1 085 | 1 595 | (32) |
Other(1) | 1 239 | 1 398 | (11) |
Total | 22 258 | 24 911 | (11) |
(1)Includes net sales of Submarine Networks which operates in a different market, and Radio Frequency Systems (RFS), which is being
managed as a separate entity, and certain other items, such as elimination of inter-segment revenues and certain items related to
purchase price allocation. Submarine Networks and RFS net sales also include revenue from communications service providers and
enterprise customers.
Gross profit
Gross profit in 2023 was EUR 8 687 million, a decrease of EUR 1 535 million, or 15%, compared
to EUR 10 222 million in 2022. The decrease in gross profit was attributable to all four business
groups, particularly to unfavorable regional mix in Mobile Networks and a lower contribution
from Nokia Technologies. Gross profit in 2023 also reflected higher restructuring and associated
charges, which amounted to EUR 151 million in 2023, compared to EUR 84 million in 2022.
In 2023, variable pay accruals within cost of sales were lower, compared to 2022. Gross margin
in 2023 was 39.0%, compared to 41.0% in 2022.
Business overview | Corporate governance | Operating and financial review and prospects | General facts on Nokia | Financial statements | Other information | 75 | |||||||
Operating and financial review continued
Nokia Annual Report on Form 20-F 2023
Operating expenses
Our research and development expenses in 2023 were EUR 4 327 million, a decrease of
EUR 223 million, or 5%, compared to EUR 4 550 million in 2022. Research and development
expenses represented 19.4% of our net sales in 2023 compared to 18.3% in 2022. While
research and development expenses declined in 2023, they declined at a slower rate than net
sales, reflecting the impact of inflation in addition to our commitment to build and maintain
technology leadership across our portfolio. Research and development expenses were also
positively impacted by foreign exchange rate fluctuations. By business, the decrease was
primarily related to both Mobile Networks and Network Infrastructure. Research and
development expenses in 2023 also reflected higher restructuring and associated charges,
which amounted to EUR 61 million in 2023, compared to EUR 37 million in 2022. In 2023,
variable pay accruals within research and development expenses were lower, compared to 2022.
Our selling, general and administrative expenses in 2023 were EUR 2 929 million, a decrease
of EUR 84 million compared to EUR 3 013 million in 2022. Selling, general and administrative
expenses represented 13.2% of our net sales in 2023 compared to 12.1% in 2022. The modest
decrease in selling, general and administrative expenses was driven by the impact of inflation,
which was broad-based across businesses and reflected higher salary expenses, but was
somewhat offset by cost savings actions and the positive impact from foreign exchange rate
fluctuations. Additionally, the lower selling, general and administrative expenses in 2023
reflected higher restructuring and associated charges, partially offset by lower amortization
of acquired intangible assets. 2023 included restructuring and associated charges of
EUR 138 million, compared to EUR 52 million in 2022. In 2023, selling, general and administrative
expenses included amortization of acquired intangible assets of EUR 301 million, compared to
EUR 356 million in 2022. In 2023, variable pay accruals within selling, general and administrative
expenses were lower, compared to 2022.
Other operating income and expenses in 2023 was a net income of EUR 257 million, an
improvement of EUR 598 million, compared to a net expense of EUR 341 million in 2022.
The improvement in other operating income and expenses was primarily related to the positive
impact from foreign exchange hedging, a net positive fluctuation related to provisions
associated with a country exit, the sale of digital assets, a net positive fluctuation in the amount
of loss allowances on trade receivables, partly offset by a net negative impact from Nokia’s
venture fund investments. The impact of hedging was positive EUR 80 million in 2023, compared
to a negative impact of EUR 107 million in 2022. In 2022, a provision associated with a country
exit amounting to EUR 98 million was booked, of which EUR 49 million was reversed in 2023.
Additionally, the net loss related to Nokia’s venture fund investments in 2023 was approximately
EUR 70 million, compared to a net benefit of approximately EUR 20 million in 2022.
Operating profit
Our operating profit in 2023 was EUR 1 688 million, a decrease of EUR 630 million, compared
to an operating profit of EUR 2 318 million in 2022. The decrease in operating profit was due
to lower gross profit, partially offset by a net positive fluctuation in other operating income
and expenses, lower research and development expenses and lower selling, general and
administrative expenses. Our operating margin in 2023 was 7.6%, compared to 9.3% in 2022.
Financial income and expenses
Financial income and expenses were a net expense of EUR 150 million in 2023, an increase
of EUR 42 million, compared to a net expense of EUR 108 million in 2022. The net negative
fluctuation in financial income and expenses mainly resulted from a EUR 207 million negative
fluctuation in net foreign exchange gains and losses and EUR 136 million of higher interest
expenses which were partly offset by EUR 233 million of higher interest income and a
EUR 61 million impairment in 2022 related to loans extended to a customer. The higher
interest income was primarily driven by EUR 130 million higher interest income on financial
investments and EUR 95 million higher net interest income on deferred pension plans.
Profit before tax
Our profit before tax in 2023 was EUR 1 499 million, a decrease of EUR 685 million compared
to EUR 2 184 million in 2022.
Income tax
Income taxes were a net expense of EUR 825 million in 2023, a net negative fluctuation of
EUR 2 851 million compared to a net benefit of EUR 2 026 million in 2022. The fluctuation
in net income taxes was primarily attributable to the recognition of Finnish deferred tax assets
of EUR 2.5 billion that positively impacted 2022, as well as a non-recurring tax expense of
EUR 392 million related to an internal operating model change that led to a remeasurement
of a deferred tax asset that negatively impacted 2023. For more details on these items,
please refer to Note 2.5. Income taxes in our consolidated financial statements.
Profit attributable to equity holders of the parent and earnings per share
The profit attributable to equity holders of the parent in 2023 was EUR 660 million, a decrease
of EUR 3 541 million, compared to a profit of EUR 4 201 million in 2022. The change in profit
attributable to equity holders of the parent was primarily due to the net negative fluctuation in
income taxes, the lower operating profit and, to a lesser extent, a net negative fluctuation in
financial income and expenses.
Our EPS from continuing operations in 2023 was EUR 0.12 (basic) and EUR 0.12 (diluted)
compared to EUR 0.75 (basic) and EUR 0.74 (diluted) in 2022.
Business overview | Corporate governance | Operating and financial review and prospects | General facts on Nokia | Financial statements | Other information | 76 | |||||||
Operating and financial review continued
Nokia Annual Report on Form 20-F 2023
Results of segments
In 2023, we had four operating and reportable segments for financial reporting purposes:
(1) Network Infrastructure, (2) Mobile Networks, (3) Cloud and Network Services and (4) Nokia
Technologies. We also present segment-level information for Group Common and Other. The
amounts presented in this “Results of segments” section for each reportable segment and
Group Common and Other represent the amounts reported to the management for the purpose
of assessing performance and making decisions about resource allocation. Certain costs and
revenue adjustments are not allocated to the segments for this purpose. For more information
on our operational and reporting structure as well as the reconciliation of reportable segment
measures to those of the Nokia Group, refer to Note 2.2. Segment information, in the
consolidated financial statements.
Network Infrastructure
For the year ended 31 December 2023 compared to the year ended 31 December 2022
The following table sets forth the segment operating results and the percentage of net sales for
the years indicated.
2023 | 2022 | |||||
EURm | % of net sales | EURm | % of net sales | Year-on-year change % | ||
Net sales(1) | 8 037 | 100.0 | 9 047 | 100.0 | (11) | |
Cost of sales | (4 987) | (62.1) | (5 739) | (63.4) | (13) | |
Gross profit | 3 050 | 37.9 | 3 308 | 36.6 | (8) | |
Research and development expenses | (1 259) | (15.7) | (1 307) | (14.4) | (4) | |
Selling, general and administrative expenses | (818) | (10.2) | (833) | (9.2) | (2) | |
Other operating income and expenses | 81 | 1.0 | (66) | (0.7) | (223) | |
Operating profit | 1 054 | 13.1 | 1 102 | 12.2 | (4) | |
(1)In 2023, net sales include IP Networks net sales of EUR 2 606 million, Optical Networks net sales of EUR 1 942 million, Fixed
Networks net sales of EUR 2 369 million and Submarine Networks net sales of EUR 1 120 million. In 2022, net sales include IP
Networks net sales of EUR 3 063 million, Optical Networks net sales of EUR 1 891 million, Fixed Networks net sales of EUR 2 943
million and Submarine Networks net sales of EUR 1 150 million.
Net sales
Network Infrastructure net sales in 2023 were EUR 8 037 million, a decrease of EUR 1 010 million,
or 11%, compared to EUR 9 047 million in 2022. While net sales in Network Infrastructure were
negatively impacted by foreign exchange rate fluctuations in 2023, the decrease reflected
declines across all businesses, with the exception of Optical Networks. Net sales declined 2%
due to foreign exchange rate fluctuations in 2023.
IP Networks net sales were EUR 2 606 million in 2023, a decrease of EUR 457 million, or 15%,
compared to EUR 3 063 million in 2022. Net sales in IP Networks decreased in 2023, with
particular weakness in North America as CSP customers evaluated their spending through most
of the year, with smaller variations across other regions.
Optical Networks net sales were EUR 1 942 million in 2023, an increase of EUR 51 million,
or 3%, compared to EUR 1 891 million in 2022. The increase in Optical Networks net sales
primarily reflected the strong momentum of and customer engagement with our PSE-V
solutions. From a regional perspective, the net sales increase was primarily driven by India,
with smaller variations in other regions.
Fixed Networks net sales were EUR 2 369 million in 2023, a decrease of EUR 574 million, or 20%,
compared to EUR 2 943 million in 2022. The decline in Fixed Networks net sales was primarily
driven by weakness in North America with a slowdown in fixed wireless access, as well as in fiber
where customers evaluated their spending and digested inventories.
Submarine Networks net sales were EUR 1 120 million in 2023, a decrease of EUR 30 million,
or 3%, compared to EUR 1 150 million in 2022. The slight decrease in Submarine Networks net
sales mainly reflected project timing, while the business continues to execute on its strong
order backlog.
Gross profit
Network Infrastructure gross profit in 2023 was EUR 3 050 million, a decrease of EUR 258 million,
or 8%, compared to EUR 3 308 million in 2022. Network Infrastructure gross margin in 2023 was
37.9%, compared to 36.6% in 2022. Network Infrastructure gross profit declined while gross
margin improved, primarily reflecting favorable mix shift despite the decline in net sales. In 2023,
variable pay accruals within Network Infrastructure cost of sales were lower, compared to 2022.
Operating expenses
Network Infrastructure research and development expenses were EUR 1 259 million in 2023,
a decrease of EUR 48 million, or 4%, compared to EUR 1 307 million in 2022. The decrease in
research and development expenses largely reflected lower variable pay accruals and foreign
exchange rate fluctuations, which more than offset the impact of inflation.
Network Infrastructure selling, general and administrative expenses were EUR 818 million in
2023, a decrease of EUR 15 million, or 2%, compared to EUR 833 million in 2022. The decrease
in Network Infrastructure selling, general and administrative expenses largely primarily reflected
lower variable pay accruals and foreign exchange rate fluctuations, which more than offset the
impact of inflation.
Network Infrastructure other operating income and expenses was an income of EUR 81 million
in 2023, a change of EUR 147 million compared to an expense of EUR 66 million in 2022. The
change in other operating income and expenses was mainly due to the positive impact from the
sale of digital assets and foreign exchange hedging, as well as a net positive fluctuation in the
amount of loss allowances on trade receivables.
Operating profit
Network Infrastructure operating profit was EUR 1 054 million in 2023, a decrease of EUR 48 million,
or 4%, compared to EUR 1 102 million in 2022. Network Infrastructure operating margin in 2023
was 13.1%, compared to 12.2% in 2022.
Business overview | Corporate governance | Operating and financial review and prospects | General facts on Nokia | Financial statements | Other information | 77 | |||||||
Operating and financial review continued
Nokia Annual Report on Form 20-F 2023
Mobile Networks
For the year ended 31 December 2023 compared to the year ended 31 December 2022
The following table sets forth the segment operating results and the percentage of net sales for
the years indicated.
2023 | 2022 | |||||
EURm | % of net sales | EURm | % of net sales | Year-on-year change % | ||
Net sales | 9 797 | 100.0 | 10 671 | 100.0 | (8) | |
Cost of sales | (6 364) | (65.0) | (6 575) | (61.6) | (3) | |
Gross profit | 3 433 | 35.0 | 4 096 | 38.4 | (16) | |
Research and development expenses | (2 010) | (20.5) | (2 234) | (20.9) | (10) | |
Selling, general and administrative expenses | (822) | (8.4) | (865) | (8.1) | (5) | |
Other operating income and expenses | 122 | 1.2 | (57) | (0.5) | (315) | |
Operating profit | 723 | 7.4 | 940 | 8.8 | (23) | |
Net sales
Mobile Networks net sales in 2023 were EUR 9 797 million, a decrease of EUR 874 million, or 8%,
compared to EUR 10 671 million in 2022. While net sales in Mobile Networks were negatively
impacted by foreign exchange rate fluctuations in 2023, the decline mainly reflected weakness in
North America which was somewhat offset by strong growth in India. Net sales in North America
declined sharply, as customers evaluated their spending amidst macroeconomic uncertainty
and depleted their inventories through the year. Strong growth in India was driven by the
continuation of 5G deployments and market share expansion in the region. Net sales declined
3% due to foreign exchange rate fluctuations in 2023.
Gross profit
Mobile Networks gross profit in 2023 was EUR 3 433 million, a decrease of EUR 663 million, or
16%, compared to EUR 4 096 million in 2022. Mobile Networks gross margin in 2023 was 35.0%,
compared to 38.4% in 2022. The decrease in Mobile Networks gross profit and gross margin
largely reflected unfavorable regional mix. In 2023, variable pay accruals within Mobile Networks
cost of sales were lower, compared to 2022.
Operating expenses
Mobile Networks research and development expenses were EUR 2 010 million in 2023, a
decrease of EUR 224 million, or 10% compared to EUR 2 234 million in 2022. The lower research
and development expenses mainly reflected lower variable pay accruals, continued cost control
and the positive impact of foreign exchange rate fluctuations, which largely offset the impact
of inflation.
Mobile Networks selling, general and administrative expenses were EUR 822 million in 2023,
a decrease of EUR 43 million, or 5%, compared to EUR 865 million in 2022. The decrease in
Mobile Networks selling, general and administrative expenses mainly reflected lower variable pay
accruals, continued cost control and the positive impact of foreign exchange rate fluctuations,
which more than offset the impact of inflation.
Mobile Networks other operating income and expenses was an income of EUR 122 million in
2023, a change of EUR 179 million compared to an expense of EUR 57 million in 2022. The
change in other operating income and expenses was primarily due to the positive impact from
foreign exchange hedging and the sale of digital assets, as well as a net positive fluctuation in
the amount of loss allowances on trade receivables.
Operating profit
Mobile Networks operating profit was EUR 723 million in 2023, a decrease of EUR 217 million,
compared to EUR 940 million in 2022. Mobile Networks operating margin was 7.4% in 2023
compared to 8.8% in 2022.
Business overview | Corporate governance | Operating and financial review and prospects | General facts on Nokia | Financial statements | Other information | 78 | |||||||
Operating and financial review continued
Nokia Annual Report on Form 20-F 2023
Cloud and Network Services
For the year ended 31 December 2023 compared to the year ended 31 December 2022
The following table sets forth the segment operating results and the percentage of net sales for
the years indicated.
2023 | 2022 | |||||
EURm | % of net sales | EURm | % of net sales | Year-on-year change % | ||
Net sales | 3 220 | 100.0 | 3 351 | 100.0 | (4) | |
Cost of sales | (1 944) | (60.4) | (2 011) | (60.0) | (3) | |
Gross profit | 1 276 | 39.6 | 1 340 | 40.0 | (5) | |
Research and development expenses | (577) | (17.9) | (577) | (17.2) | — | |
Selling, general and administrative expenses | (494) | (15.3) | (544) | (16.2) | (9) | |
Other operating income and expenses | 50 | 1.6 | (42) | (1.3) | (219) | |
Operating profit | 255 | 7.9 | 177 | 5.3 | 44 | |
Net sales
Cloud and Network Services net sales in 2023 were EUR 3 220 million, a decrease of
EUR 131 million, or 4%, compared to EUR 3 351 million in 2022. In addition to the negative
impact from foreign exchange fluctuations, net sales in Cloud and Network Services reflected
growth in Enterprise Solutions and Core Networks which was more than offset by declines in
Cloud and Cognitive Services and Business Applications. Net sales declined 3% due to foreign
exchange rate fluctuations in 2023.
Gross profit
Cloud and Network Services gross profit in 2023 was EUR 1 276 million, a decrease of
EUR 64 million, or 5%, compared to EUR 1 340 million in 2022. Cloud and Network Services gross
margin in 2023 was 39.6%, compared to 40.0% in 2022. The decrease in Cloud and Network
Services gross profit reflected the mix shift from software sales towards lower margin hardware
sales in the first half of the year, somewhat offset by lower variable pay accruals in 2023
compared to 2022.
Operating expenses
Cloud and Network Services research and development expenses were EUR 577 million in 2023,
flat compared to EUR 577 million in 2022. The flat research and development expenses largely
reflected lower variable pay accruals in 2023 compared to 2022, the positive impact of foreign
exchange rate fluctuations and continued discipline on cost control which offset the impact
of inflation.
Cloud and Network Services selling, general and administrative expenses were EUR 494 million
in 2023, a decrease of EUR 50 million, or 9%, compared to EUR 544 million in 2022. The
decrease in Cloud and Network Services selling, general and administrative expenses largely
reflected lower variable pay accruals in 2023 compared to 2022, the positive impact of foreign
exchange rate fluctuations and continued discipline on cost control which offset the impact
of inflation.
Cloud and Network Services other operating income and expenses was an income of
EUR 50 million in 2023, a change of EUR 92 million compared to an expense of EUR 42 million
in 2022. The change in other operating income and expenses was primarily due to the positive
impact from foreign exchange hedging and the sale of digital assets.
Operating profit
Cloud and Network Services operating profit was EUR 255 million in 2023, an increase of
EUR 78 million, compared to EUR 177 million in 2022. Cloud and Network Services operating
margin in 2023 was 7.9% compared to 5.3% in 2022.
Business overview | Corporate governance | Operating and financial review and prospects | General facts on Nokia | Financial statements | Other information | 79 | |||||||
Operating and financial review continued
Nokia Annual Report on Form 20-F 2023
Nokia Technologies
For the year ended 31 December 2023 compared to the year ended 31 December 2022
The following table sets forth the segment operating results and the percentage of net sales for
the years indicated.
2023 | 2022 | |||||
EURm | % of net sales | EURm | % of net sales | Year-on-year change % | ||
Net sales | 1 085 | 100.0 | 1 595 | 100.0 | (32) | |
Cost of sales | — | — | (5) | (0.3) | (100) | |
Gross profit | 1 085 | 100.0 | 1 590 | 99.7 | (32) | |
Research and development expenses | (224) | (20.6) | (214) | (13.4) | 5 | |
Selling, general and administrative expenses | (140) | (12.9) | (136) | (8.5) | 3 | |
Other operating income and expenses | 13 | 1.2 | (32) | (2.0) | (141) | |
Operating profit | 734 | 67.6 | 1 208 | 75.7 | (39) | |
Net sales
Nokia Technologies net sales in 2023 were EUR 1 085 million, a decrease of EUR 510 million, or
32%, compared to EUR 1 595 million in 2022. The decrease in Nokia Technologies net sales was
primarily due to a significant one-off that benefited 2022, which related to an option exercised
within a long-term license, as well as catch-up net sales in 2022 related to new deals signed in
the same year. Net sales in 2023 were also impacted by lower net sales from a smartphone
vendor whose market share has meaningfully declined and the lower net sales from a license that
expired at the end of the third quarter 2023, which were somewhat offset by catch-up net sales
related to deals signed in the second quarter of 2023.
Gross profit
Nokia Technologies gross profit in 2023 was EUR 1 085 million, a decrease of EUR 505 million, or
32%, compared to EUR 1 590 million in 2022. The lower gross profit in Nokia Technologies was
due to lower net sales.
Operating expenses
Nokia Technologies research and development expenses in 2023 were EUR 224 million, an
increase of EUR 10 million, or 5%, compared to EUR 214 million in 2022. The increase in Nokia
Technologies research and development expenses was primarily due to higher investments to
drive creation of intellectual property.
Nokia Technologies selling, general and administrative expenses in 2023 were EUR 140 million,
an increase of EUR 4 million, or 3%, compared to EUR 136 million in 2022.
Nokia Technologies other operating income and expenses in 2023 was an income of EUR 13 million,
a change of EUR 45 million compared to an expense of EUR 32 million in 2022. The change in
other operating income and expenses was primarily related to the reversal of loss allowance on
certain trade receivables recorded in 2022 and the positive impact from hedging.
Operating profit
Nokia Technologies operating profit in 2023 was EUR 734 million, a decrease of EUR 474 million,
or 39%, compared to an operating profit of EUR 1 208 million in 2022. The decrease in Nokia
Technologies operating profit was primarily related to lower net sales, partially offset by a net
positive fluctuation in other operating income and expenses. Nokia Technologies operating
margin in 2023 was 67.6% compared to 75.7% in 2022.
Business overview | Corporate governance | Operating and financial review and prospects | General facts on Nokia | Financial statements | Other information | 80 | |||||||
Operating and financial review continued
Nokia Annual Report on Form 20-F 2023
Group Common and Other
For the year ended 31 December 2023 compared to the year ended 31 December 2022
The following table sets forth the operating results for Group Common and Other, and the
percentage of net sales for the years indicated.
2023 | 2022 | |||||
EURm | % of net sales | EURm | % of net sales | Year-on-year change % | ||
Net sales | 130 | 100.0 | 295 | 100.0 | (56) | |
Cost of sales | (136) | (104.6) | (307) | (104.1) | (56) | |
Gross profit | (6) | (4.6) | (12) | (4.1) | (50) | |
Research and development expenses | (120) | (92.3) | (117) | (39.7) | 3 | |
Selling, general and administrative expenses | (216) | (166.2) | (226) | (76.6) | (4) | |
Other operating income and expenses | (49) | (37.7) | 37 | 12.5 | (232) | |
Operating loss | (391) | (300.8) | (318) | (107.8) | 23 | |
Net sales
Group Common and Other net sales in 2023 were EUR 130 million, a decrease of EUR 165 million,
or 56%, compared to EUR 295 million in 2022. The decrease in Group Common and Other net
sales was related to reduced net sales from Radio Frequency Systems, mainly driven by the
divested business carved out during 2023.
Gross profit
Group Common and Other gross profit in 2023 was negative EUR 6 million, compared to
negative EUR 12 million in 2022. Group Common and Other gross margin in 2023 was negative
4.6% compared to negative 4.1% in 2022.
Operating expenses
Group Common and Other research and development expenses in 2023 were EUR 120 million,
an increase of EUR 3 million, or 3%, compared to EUR 117 million in 2022.
Group Common and Other selling, general and administrative expenses in 2023 were
EUR 216 million, a decrease of EUR 10 million, or 4%, compared to EUR 226 million in 2022.
In 2023, variable pay accruals within Group Common and Other selling, general and
administrative expenses were lower, compared to 2022.
Group Common and Other other operating income and expense in 2023 was an expense
of EUR 49 million, a net negative fluctuation of EUR 86 million compared to an income of
EUR 37 million in 2022. The net negative fluctuation in 2023 was primarily related to Nokia’s
venture fund investments. In 2023, Nokia’s venture fund investments generated a loss of
approximately EUR 70 million, compared to a benefit of approximately EUR 20 million in 2022.
Operating loss
Group Common and Other operating loss in 2023 was EUR 391 million, a change of EUR 73 million,
compared to an operating loss of EUR 318 million in 2022. The change in Group Common and
Other operating loss was primarily attributable to the lower other operating income somewhat
offset by lower selling, general and administrative expenses.
Business overview | Corporate governance | Operating and financial review and prospects | General facts on Nokia | Financial statements | Other information | 81 | |||||||
Operating and financial review continued
Nokia Annual Report on Form 20-F 2023
Liquidity and capital resources
Financial position
At 31 December 2023, our cash and cash equivalents equaled EUR 6 234 million, an increase
of EUR 767 million compared to EUR 5 467 million as of 31 December 2022. The increase was
primarily attributable to net cash inflow from operating activities of EUR 1 317 million and net
cash inflow related to interest-bearing financial investments of EUR 1 527 million, offset by
capital expenditure of EUR 652 million, net cash outflow related to long-term borrowings of
EUR 302 million, payment of principal portion of lease liabilities of EUR 239 million, dividends
of EUR 621 million and share repurchases of EUR 300 million.
At 31 December 2023, our total cash and interest-bearing financial investments(1) equaled
EUR 8 514 million, a decrease of EUR 730 million, compared to EUR 9 244 million as of
31 December 2022. The decrease was primarily attributable to the same factors as the ones
that contributed to the increase in cash and cash equivalents except for the net cash inflow
related to interest-bearing financial investments of EUR 1 527 million.
At 31 December 2023, our net cash and interest-bearing financial investments(1) equaled
EUR 4 323 million, a decrease of EUR 444 million, compared to EUR 4 767 million as of
31 December 2022. The decrease was mainly attributable to capital expenditure of EUR 652 million,
payment of the principal portion of the lease liabilities of EUR 239 million, dividends of
EUR 621 million and share repurchases of EUR 300 million, offset by net cash inflow from
operating activities of EUR 1 317 million.
(1)Non-IFRS measures. For the definition and reconciliation of non-IFRS measures to the most directly comparable IFRS measures,
refer to the ”Alternative performance measures” section.
Cash flow
The cash inflow from operating activities in 2023 was EUR 1 317 million, a decrease of
EUR 157 million compared to a cash inflow of EUR 1 474 million in 2022. The decrease
was primarily attributable to a decrease in net profit, adjusted for non-cash items, of
EUR 3 238 million, a decrease of EUR 575 million compared to EUR 3 813 million in 2022,
partially offset by a decrease in cash tied-up to net working capital of EUR 1 282 million in 2023
compared to EUR 1 843 million cash tied-up in 2022. The primary drivers for the decrease in
cash tied-up to net working capital compared to 2022 were related to a decrease in inventories
of EUR 443 million compared to an increase of EUR 991 million in 2022, and a decrease in
receivables of EUR 304 million compared to an increase in receivables of EUR 451 million in
2022. These were partially offset by a decrease in liabilities of EUR 2 029 million compared
to a decrease of EUR 401 million in 2022. The decrease in liabilities during 2023 was primarily
attributable to a decrease in trade payables, a decrease in liabilities related to variable pay, and
restructuring and associated cash outflows, partially offset by an increase in contract liabilities.
In 2023, the cash inflow from operating activities included paid taxes of EUR 576 million,
an increase of EUR 195 million compared to EUR 381 million in 2022, interest received of
EUR 178 million compared to EUR 65 million in 2022 and interest paid of EUR 241 million
compared to EUR 180 million in 2022.
The cash inflow from investing activities was EUR 1 043 million in 2023, compared to a
EUR 1 880 million cash outflow in 2022. Cash inflow from investing activities was primarily
driven by net cash inflow of EUR 1 527 million of interest-bearing financial investments in 2023
compared to net cash outflow of EUR 1 198 million in 2022, partially offset by cash outflow
due to the capital expenditure of EUR 652 million in 2023 compared to EUR 601 million in 2022
and net cash outflow from other non-current financial assets of EUR 49 million compared to
EUR 66 million in 2022.
Major items of capital expenditure in 2023 included investments in R&D equipment, test
equipment, hardware for telecommunication and cloud environment, repair or improvements
of sites, shipyards and vessels.
In 2023, the cash outflow from financing activities was EUR 1 502 million, compared to a
EUR 837 million cash outflow in 2022. The cash outflow was driven by repayments of long-term
borrowings of EUR 798 million, dividend payments of EUR 621 million, share repurchases of
EUR 300 million and payments of the principal portion of lease liabilities of EUR 239 million,
partially offset by proceeds from long-term borrowings of EUR 496 million. In 2022, the cash
outflow was driven by dividend payments of EUR 353 million, share repurchases of EUR 300 million
and payments of the principal portion of lease liabilities of EUR 217 million.
Business overview | Corporate governance | Operating and financial review and prospects | General facts on Nokia | Financial statements | Other information | 82 | |||||||
Operating and financial review continued
Nokia Annual Report on Form 20-F 2023
Financial assets and debt
At 31 December 2023, our net cash and interest-bearing financial investments(1) equaled
EUR 4 323 million consisting of EUR 8 514 million in total cash and interest-bearing financial
investments(1), and EUR 4 191 million of long-term and short-term interest-bearing liabilities.
We hold our total cash and interest-bearing financial investments(1) predominantly in euro.
Our interest-bearing financial investments mainly include high-quality money market and fixed
income instruments with strict maturity limits and diversified counterparty risk limits. We also
have a EUR 1 500 million revolving credit facility available for liquidity purposes. The facility has
no financial covenants and remains undrawn.
At 31 December 2023, our interest-bearing liabilities consisted of EUR 378 million notes due
in 2024, EUR 292 million notes due in 2025, EUR 500 million R&D loan from the European
Investment Bank maturing in 2025, EUR 167 million R&D loan from the Nordic Investment Bank
with final maturity in 2025, EUR 630 million notes due in 2026, USD 500 million notes due in
2027, EUR 500 million notes due in 2028, USD 74 million notes due in 2028, USD 206 million
notes due in 2029, EUR 500 million notes due in 2031, USD 500 million notes due in 2039, and
EUR 110 million of other liabilities. The EUR notes maturing in 2024, 2025, 2026, 2028 and 2031
as well as the USD notes maturing in 2027 and 2039, are issued by Nokia Corporation, while the
USD notes maturing in 2028 and 2029 are issued by Lucent Technologies Inc., a predecessor
to Nokia of America Corporation (Nokia’s wholly-owned subsidiary, formerly known as Alcatel-
Lucent USA Inc.). The loans from the Nordic Investment Bank and from the European Investment
Bank are drawn by Nokia Corporation. For more information on our interest-bearing liabilities,
refer to Note 5.2. Financial assets and liabilities, of our consolidated financial statements.
In June 2021, we exercised our option to extend the maturity date of the EUR 1 500 million
revolving credit facility. Subsequent to the extension, EUR 1 412 million of the facility has its
maturity in June 2026 and EUR 88 million of the facility has its maturity in June 2024.
We consider that with EUR 8 514 million of total cash and interest-bearing financial
investments(1) and with our undrawn revolving credit facility, we have sufficient funds to satisfy
our future working capital needs, capital expenditure, R&D investments, structured finance,
venture fund commitments, acquisitions and debt service requirements, at least through 2024.
We further consider that with our current credit ratings of BBB- by S&P Global Ratings, Ba1 by
Moody’s, and BBB- by Fitch, we have access to the capital markets should any funding needs
arise in 2024.
We aim to maintain investment grade credit ratings.
Off-balance sheet arrangements
There are no material off-balance sheet arrangements that have, or are reasonably likely to
have, a current or future effect on our financial condition, revenues or expenses, results of
operations, liquidity, capital expenditures or capital resources that are material to investors,
except for the purchase obligations and lease commitments, as well as guarantees and financing
commitments disclosed in Note 6.1. Commitments, contingencies and legal proceedings,
and in Note 5.4. Financial risk management, of our consolidated financial statements.
(1)Non-IFRS measures. For the definition and reconciliation of non-IFRS measures to the most directly comparable IFRS measures,
refer to “Alternative performance measures” section.
Venture fund investments and commitments
We make financing commitments to a number of unlisted venture funds that make technology-
related investments. The majority of the investments are managed by NGP Capital, a global
venture capital firm backing exceptional entrepreneurs driving the convergence of the physical
and virtual world.
As of 31 December 2023, our venture fund investments equaled EUR 784 million, compared
to EUR 828 million as of 31 December 2022. For more information on the fair value of our
venture fund investments, refer to Note 5.2. Financial assets and liabilities, of our consolidated
financial statements.
As of 31 December 2023, our venture fund commitments equaled EUR 381 million, compared
to EUR 433 million as of 31 December 2022. As a limited partner in venture funds, we are
committed to capital contributions and entitled to cash distributions according to the respective
partnership agreements and underlying fund activities. For more information on venture fund
commitments, refer to Note 6.1. Commitments, contingencies and legal proceedings, of our
consolidated financial statements.
Treasury policy
Treasury activities are governed by the Nokia Treasury Policy approved by the President
and CEO within the authority granted by the Board of Directors and supplemented by operating
procedures approved by the CFO, covering specific areas such as foreign exchange risk, interest
rate risk, credit risk and liquidity risk. The objective of treasury’s liquidity and capital structure
management activities is to ensure that we have sufficient liquidity to go through unfavorable
periods without being severely constrained by the availability of funds to execute Nokia’s
business plans and implement Nokia’s long-term business strategy. We are risk-averse in our
treasury activities.
Business overview | Corporate governance | Operating and financial review and prospects | General facts on Nokia | Financial statements | Other information | 83 | |||||||
Operating and financial review continued
Nokia Annual Report on Form 20-F 2023
Foreign exchange impact
We are a company with global operations and net sales derived from various countries, invoiced
in various currencies. Therefore, our business and results from operations are exposed to
changes in exchange rates between the euro, our reporting currency, and other currencies, such
as the US dollar. The magnitude of foreign exchange exposures changes over time as a function
of our net sales and costs in different markets, as well as the prevalent currencies used for
transactions in those markets. Significant changes in exchange rates may also impact our
competitive position and related price pressures through their impact on our competitors.
To mitigate the impact of changes in exchange rates on our results, we hedge material net
foreign exchange exposures (net sales less costs in a currency) typically with a hedging horizon
of approximately 12 months. For the majority of these hedges, hedge accounting is applied to
reduce income statement volatility.
In 2023, approximately 25% of Group net sales and 30% of total costs were denominated in
euros, and approximately 50% of Group net sales and 45% of total costs were denominated
in US dollars. In 2023, approximately 5% of Group net sales and total costs were denominated
in Chinese yuan and approximately 5% of Group net sales and total costs were denominated in
Indian rupee.
The average currency mix for Group net sales and total costs:
2023 | 2022 | ||||
Currency | Net sales | Total costs | Net sales | Total costs | |
EUR | ~25% | ~30% | ~25% | ~25% | |
USD | ~50% | ~45% | ~50% | ~50% | |
CNY | ~5% | ~5% | ~5% | ~5% | |
INR | ~5% | ~5% | ~0% | ~5% | |
Other | ~15% | ~15% | ~20% | ~15% | |
Total | ~100% | ~100% | ~100% | ~100% | |
For the full year 2023 compared to the previous year, the US dollar was weaker against the euro.
The weaker US dollar in 2023 on a year-on-year basis had a negative impact on our net sales
reported in euros. However, the weaker US dollar also contributed to slightly lower costs of sales
and operating expenses on a year-on-year basis. In total, before hedging, the weaker US dollar
on a year-on-year basis had a slightly negative effect on our operating profit in 2023.
For a discussion of the instruments used by us in connection with our hedging activities, refer to
Note 5.4. Financial risk management, of our consolidated financial statements. Refer also to the
“Risk factors” section.
Business overview | Corporate governance | Operating and financial review and prospects | General facts on Nokia | Financial statements | Other information | 84 | |||||||
Operating and financial review continued
Nokia Annual Report on Form 20-F 2023

Sustainability
and corporate
responsibility
We believe that the positive impact of the technology
we create provides our greatest contribution to
realizing the United Nations Sustainable Development
Goals (SDGs) and outweighs potential negative
impacts of the technology.
ur purpose is to create technology that helps the
world act together. We believe that digitalization
and enhanced connectivity will play an increasingly
significant role in helping industries and economies
decarbonize while enabling a more inclusive society. These
technology enablers are critical to achieving the Sustainable
Development Goals of 2030.
We see the potential of digital technologies to create a more
sustainable, productive, and accessible world. At Nokia, we take
a two-pronged approach to sustainability. First, we minimize
our potentially negative environmental and value chain impact –
our “footprint”. Second, we maximize our potentially positive
environmental impact on industries and economies as well
as our social impact in the communities we operate in – our
“handprint”. We believe that our potential handprint far
outweighs our current footprint. Industry studies such as
the GSMA study on the impact of mobile communications
technologies on carbon emission reductions, have shown the
potential of digitalization and enhanced connectivity on several
industrial sectors and consumers.
A critical component of Nokia’s sustainability approach also
rests on our focus on governance and culture. We maintain
robust policies, processes, and management systems across
our value chain to align with regulation and global frameworks.
Our strategy, purpose, and targets
Our approach to sustainability is built on our company’s
purpose – to create technology that helps the world act
together. In 2023, Nokia took a step forward in embedding
sustainability into our corporate strategy by announcing the
ambition to develop ESG as a competitive advantage,
integrated into Nokia’s 2030 Technology Vision and continued
to deliver on it as part of our company purpose. Our
sustainability initiatives and approaches in 2023 were built on
our existing impact materiality matrix.
Nokia’s sustainability strategy is based on topics where we
believe we can have the greatest impact on ESG risks and
opportunities. The five pillars of our sustainability strategy
are shown in the following diagram.
Business overview | Corporate governance | Operating and financial review and prospects | General facts on Nokia | Financial statements | Other information | 85 | |||||||
Sustainability and corporate responsibility
Nokia Annual Report on Form 20-F 2023
O
5 ESG pillars | |||||||||
 |  |  | |||||||
Environment | Industrial digitalization | Security and privacy | |||||||
Be the leader in energy efficiency and circular practices | We provide connectivity and digital solutions that sustainably transform physical industries | Security and privacy become a cornerstone of our reputation and product proposition | |||||||
 |  | ||||||||
Bridging the digital divide | Responsible business | ||||||||
We are a bridge for digital inclusion through our connectivity and digital skill building solutions | Take a proactive and values-driven role in driving responsible business practices internally and in our value chain | ||||||||
For the environment, we emphasize two areas: climate and
circularity. For climate, we look to be the leader in energy
efficiency in silicon, software, and systems, providing the
networks and operations skills to scale smart energy solutions.
We also intend to accelerate our first mover ambition in energy
efficiency in 5G-Advanced and 6G through early engagement in
standardization and ecosystem development. For circularity,
we focus on opportunities to promote hardware circularity
and manage the sourcing and reuse of key source materials.
Industrial digitalization provides the opportunity to
sustainably transform physical industries and cities through
digitalization and connectivity. Our offering for industries and
cities can enable decarbonization, resource efficiency, and
improved safety. We are excited by the opportunities in
digitalization enablement, cloud-based service delivery and
partnership-driven use case solutions to enable net zero
in key industries.
Security and privacy are positioned as the cornerstone of
our product proposition. Product development follows the
“Design for Security” methodology, and Nokia’s security team
partners with our customers to build and maintain secure
networks, compliant with national regulations for critical
telecom infrastructure.
We aim to bridge the digital divide using our broad product
portfolio across terrestrial and non-terrestrial networks and
focused partnering to address different demographics through
digital skill building. Connectivity, combined with digital skills,
enables increased equality of access to healthcare, education
and employment for individuals and the opportunity to
participate in the digital economy for small businesses.
In responsible business we work to ensure our business
practices are aligned to our ethical and responsible values
across our value chain. We collaborate closely with customers
and suppliers to engage on systemic issues related to the
environment, health and safety, mitigating the misuse of
technology (and advocating for responsible AI principles),
ethics, human rights and working conditions, as well as focusing
on diversity, equity and inclusion in Nokia’s own workforce.
Business overview | Corporate governance | Operating and financial review and prospects | General facts on Nokia | Financial statements | Other information | 86 | |||||||
Sustainability and corporate responsibility continued
Nokia Annual Report on Form 20-F 2023
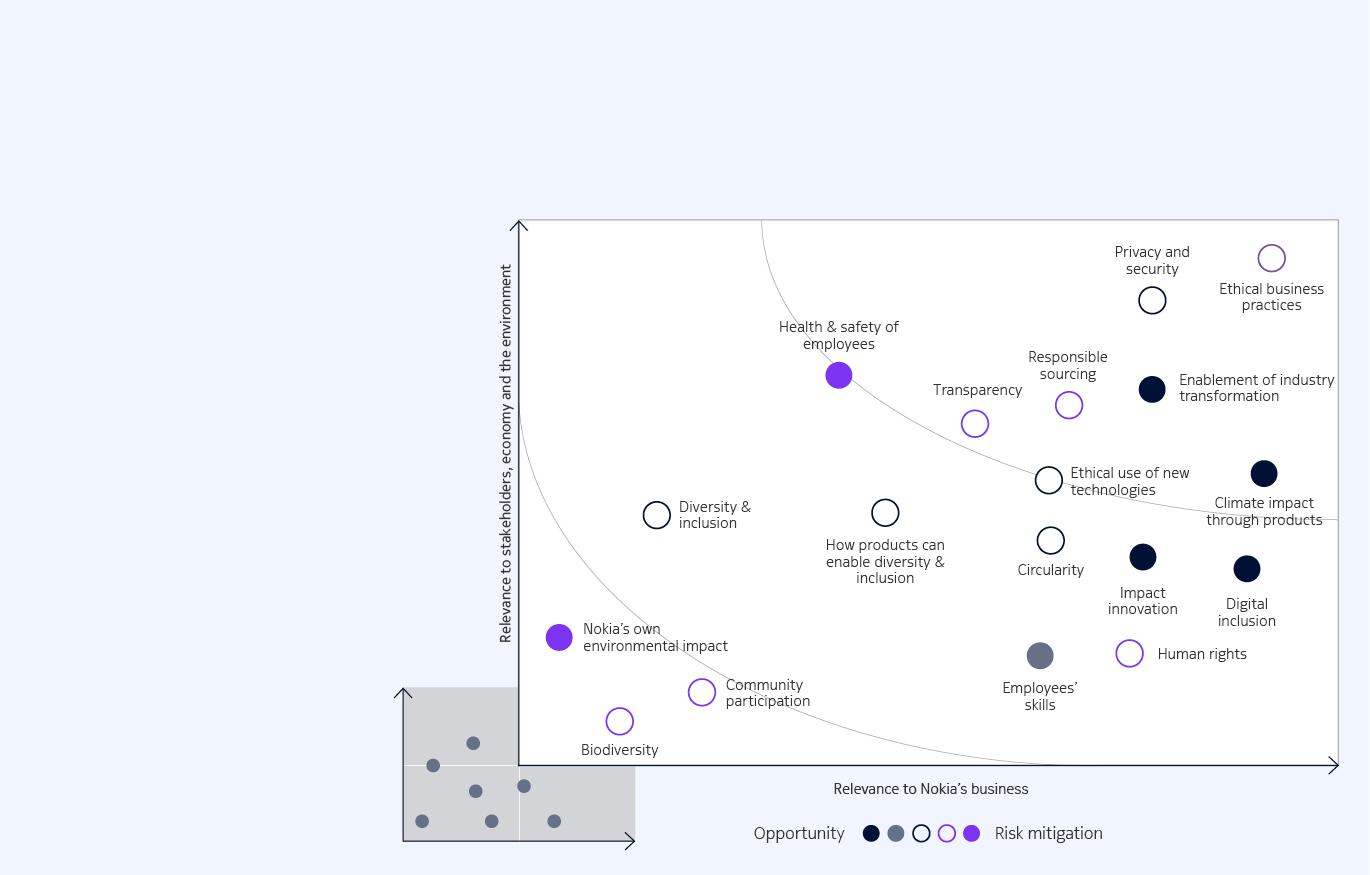
Our materiality matrix
In 2023, our sustainability approach was based on our existing impact materiality assessment, which was completed in
2022. The following diagram shows the top-right quadrant of the impact materiality assessment matrix, which displays
the topics identified through the assessment as most relevant to our business and stakeholders, the economy and the
environment in 2023. Of these, the most important topics for Nokia are:
■Climate impact through products
■Environmental impact through
products and enabling
transformation in other industries
■Ethical business practices and ethical
use of new technologies
■Privacy and security
■Responsible sourcing
Climate, ethical business practices,
and how Nokia’s products can enable
change in other industries, cities and
society continued to be among the
most material topics. The most
significant growth in importance
among stakeholders was seen in
privacy and security, responsible
sourcing and circularity.

Sustainable Development Goals
The United Nations SDGs and their targets
remain a key framework for our sustainability
work. SDGs 8, 9 and 13 are the most material
for our business and reflect the areas in which
we can have the greatest positive impact.
We believe that digitalization and enhanced
connectivity will continue to play a critical role
in accelerating and achieving all 17 SDGs. Here
are examples of how the work we do actively
contributes to our most material SDGs.
Business overview | Corporate governance | Operating and financial review and prospects | General facts on Nokia | Financial statements | Other information | 87 | |||||||
Sustainability and corporate responsibility continued
Nokia Annual Report on Form 20-F 2023
 |  |  | ||
Promote inclusive and sustainable economic growth, employment and decent work | Build resilient infrastructure, promote sustainable industrialization and foster innovation | Take urgent action to combat climate change and its impacts | ||
In 2023, Nokia deployed the Rural Connect Solution in Middle East and Africa to connect the unconnected and bridge the coverage gap in remote areas of sub-Saharan Africa. The solution takes a new approach to evolving radio access network sites with a focus on reducing energy consumption. It incorporates baseband units with AirScale power rectifiers and long-lasting lithium batteries in a compact, portable package that can be installed almost anywhere. Nokia is collaborating with UNICEF to bridge the digital divide by helping to improve digital education and training in schools in select parts of Senegal, West Africa. The principal beneficiaries are teachers, as well as middle school students in underserved areas. The scope of work includes specific sessions on digital skills, as well as upgrading equipment and connectivity. | In 2023, Nokia partnered with DXC Technology, to launch DXC Signal Private LTE and 5G, a managed secure private wireless network and digitalization platform solution that helps industrial enterprises digitally transform their operations, especially in key market segments including manufacturing, energy, healthcare, logistics, transportation, and education. During the year we also announced that we will work with US energy provider Xcel Energy to help modernize grid operations. The project will include the deployment of Nokia private LTE network technology, helping support secure, reliable data connectivity and new levels of automation. The network technologies will back a growing mix of renewable power sources for Xcel Energy and optimize the delivery of electricity to its millions of customers. | In 2023, Nokia announced a new update in its optics portfolio with the sixth- generation super-coherent photonic service engine, PSE-6s, which can reduce network power consumption in optical transport by up to 60% per bit. We also announced Habrok massive MIMO radios, which offer improved energy efficiency by using up to 30% less energy through a combination of software, hardware and services. During the year we also communicated that we helped Vietnamese communications service provider MobiFone achieve overall energy savings of almost 14% in the first trial of our new Digital Design service. The service analyzes each individual cell in the network and recommends the most appropriate radio link power balance to reduce transmit power. Nokia joined with Orange under the Switch to Circular Economy Value Chains initiative, run by UNIDO (United Nations Industrial Development Organization). The project aims to support corporates in accelerating their circularity efforts, including with their partners in developing countries. Nokia will work closely with Orange to further develop circular approaches in network equipment, including setting up a new refurbishment and repair center in Egypt, which will extend the lifetime of Nokia products. |
Key sustainability targets
Our ESG targets are determined based on our sustainability strategy and material topics and are distributed across short, medium and long term. The key targets are listed in the table below which
shows progress against selected targets.
Progress against select ESG targets in 2023
Strategic focus area | Target year | Base year | Target | 2023 results | Status |
Environment | |||||
Climate | 2030 | 2019 | Our science-based target (SBT(1)): Reduce our greenhouse gas (GHG) emissions across our value chain (Scope 1, 2 and 3) by 50% between 2019 and 2030, and reach net zero by 2050. | Emissions covered by our SBT were 34 319 800 tons CO2e,(2) which is a 9% decrease from 2022. Despite this decrease, our current SBT emissions are now at the same level as the 2019 baseline year. This means that the 2030 SBT is still not on track with a linear reduction trajectory. While we continue to accelerate innovations in product energy efficiency and supplier collaboration, the availability and take-up of renewable energy by Nokia's customers must rapidly increase to support the achievement of the interim target. | Not on track |
2030 | 2019 | Our final assembly suppliers reach zero emissions by 2030. | Our final assembly suppliers’ emissions were 38 500 tons CO2e, which is a 49% reduction from 2019. | On track | |
2030 | 2019 | Our suppliers reduce GHG emissions by 50% by 2030.(3) | Our suppliers’ emissions were 540 500 tons CO2e, which is a 82% reduction from 2019. However, as this includes emissions data from hundreds of suppliers and the quality of allocated emissions data has been of concern, we are conscious that some of the reductions may be due to the quality of the data reported. | On track | |
2030 | 2019 | Our logistics’ GHG emissions reduced by 73% by 2030. | Our logistics emissions were 140 900 tons CO2e, which is a 54% decrease from 2019. | On track | |
2023 | N/A | Reach 75% renewable electricity in our own facilities. | Reached 75% renewable electricity in our own facilities. | Achieved | |
2023 | 2019 | Reach 65% reduction of our facilities' GHG emissions compared to 2019. | Reached 69% reduction of our facilities’ GHG emissions. | Achieved | |
Circularity | 2030 | 2019 | 95% circularity rate for waste from our offices, labs, manufacturing, installation and product takeback by 2030. | We have recognized areas where a high circularity rate has already been achieved and also areas requiring further action. There are still data gaps to be closed but data accuracy has increased. Annual waste circularity outcome for 2023 was 86%. | On track |
Bridging the digital divide | |||||
Connecting the unconnected and under- served | 2030 | 2021 | Helping our customers to connect the next 2 billion measured by number of subscriptions in Nokia radio customers’ networks by 2030. | In line with Nokia’s long term goal, we work with our customers to provide broadband based digital services on more subscriptions. The number of mobile broadband subscriptions in Nokia radio customers’ networks has increased from 2022 to the end of 2023 by 372 million (2022-2023: 772 million)(4). | On track |
2025 | 2021 | Harness Nokia technology, capabilities and funds to improve the lives of 1 500 000 through social digitalization projects, digital skills building, and connecting the unconnected or underserved by 2025(5). | We reached 130 832 reported direct beneficiaries(6) through social digitalization projects, building digital skills, connecting the unconnected or underserved and improving inclusion, equity and diversity. The current total reported direct beneficiaries for 2022 and 2023 were 691 534. | On track | |
Business overview | Corporate governance | Operating and financial review and prospects | General facts on Nokia | Financial statements | Other information | 88 | |||||||
Sustainability and corporate responsibility continued
Nokia Annual Report on Form 20-F 2023
Strategic focus area | Target year | Base year | Target | 2023 results | Status |
Security and privacy | |||||
Security and privacy | 2023 | N/A | 95% mandatory training completion related to privacy. | In 2023, the mandatory training completion rate was 98%. | Achieved |
Responsible Business | |||||
Health & safety | 2030 | 2016 | 100% of suppliers delivering high-risk activity to meet “H&S preferred supplier” status (score 4 or more out of 5) in our Health & Safety Maturity Assessment. | 18% of relevant suppliers met H&S “Preferred” supplier status. To reach the 2030 target, Nokia continues to work with our supplier base, engaging and promoting the supplier safety competences, offering safety training and setting supplier workshops in order to improve supplier Health and Safety awareness and capability. | On track |
2023 | N/A | Zero critical or fatal incidents for employees and suppliers. | In 2023, there were zero work-related fatal incidents involving employees. However, we regret three work-related fatal incidents resulting in the death of one contractor/ subcontractor and two third-parties.(7) | Not achieved | |
Inclusion & diversity | 2023 | N/A | Reach a minimum of 27% female hires in global external recruits. | 28% of external recruits were women. We achieved the 2023 target via increased marketing, communication and talent attraction activities to make Nokia’s employer brand stand out for diversity-friendly employment policies and attract diverse talent. | Reached |
Ethics & compliance | 2030 | 2016 | Maintain 85% favorability of employee/line manager engagement on ethics and compliance. | In 2023, 85% of employees said that their line manager talked to the team about the importance of ethics and compliance. | Achieved |
2023 | N/A | Ethical Business Training completed by 95% of employees. | 98% of employees completed Ethical Business Training. | Achieved | |
Responsible sourcing | 2025 | N/A | 98% 3TG traceability and conflict-free status to smelter level in our supply chain as well as conflict-free status of the smelters. Extended due diligence and conflict-free status of cobalt, mica and two additional minerals. | As of 2023, we have achieved 81% traceability to the smelter level in our supply chain as well as conflict-free status of the smelters. We have also extended and conducted due diligence for cobalt and mica and mapped the supply chains for additional minerals. For those due- diligence will follow in the next years. | On track |
2025 | 2020 | 80% of suppliers achieve satisfactory sustainability score (based on aggregated weighted share) from supplier performance evaluation (based on Corporate Responsibility onsite audit programs, EcoVadis, CDP, Conflict minerals). | 80% of suppliers, on average, received a satisfactory sustainability score in our assessment programs. | On track | |
(1)The current SBT covers the following activities: Scope 1: emissions from our facilities, car fleet and marine fleet own vessels. Scope 2: market-based emissions from purchased energy. Scope 3: emissions from the customer use of sold products (covering almost 100% of
our current portfolio) and emissions from the logistics, the final assembly factories in our supply chain, and the marine fleet chartered vessels.
(2)CO2e = carbon dioxide equivalents.
(3)Refers to our material suppliers.
(4)Source: GSMA Intelligence.
(5)Improving lives refers to increased digital connectivity and inclusion for 1 500 000 people.
(6)Individuals that independent from any relationship with the company were directly benefited by Nokia’s contributions or activities related to digital connectivity and inclusion directly resulting from them.
(7)Nokia has revised its fatality-reporting criteria in 2023, to include third parties such as members of the public who are assessed as being impacted by an incident that is deemed within Nokia’s control. This more closely aligns Nokia’s reporting with some of its closest
industry stakeholders and competitors.
Business overview | Corporate governance | Operating and financial review and prospects | General facts on Nokia | Financial statements | Other information | 89 | |||||||
Sustainability and corporate responsibility continued
Nokia Annual Report on Form 20-F 2023
Sustainability governance
The Board of Directors evaluates Nokia’s
ESG practices, related risks and target
setting, as well as their implementation
and effectiveness across the Company.
In 2023, the Board reviewed Nokia’s
sustainability strategy and targets,
evolving ESG requirements and
expectations, investor feedback,
disclosure approach, net zero strategy
and roadmap.
In addition, the Board’s committees
monitor environmental and social
developments and activities in the
Company in their respective areas of
responsibilities. The Chief Corporate
Affairs Officer has overall responsibility
for sustainability in the Group
Leadership Team.
In line with our mode of operation, the
Group Leadership Team approves our
sustainability-related strategy, overall
targets and operational frameworks,
within which corporate functions and
business groups can operate. This enables
accountable and empowered business
groups while maintaining appropriate
strategic and operative oversight.
Internal councils and committees,
such as the Sustainability Council, are
used to steer, align and ensure the
implementation of these strategies,
targets and frameworks and review
recommendations to the Group
Leadership Team.
Our overall sustainability governance
framework and responsibilities are
shown in the opposite diagram.
Business overview | Corporate governance | Operating and financial review and prospects | General facts on Nokia | Financial statements | Other information | 90 | |||||||
Sustainability and corporate responsibility continued
Nokia Annual Report on Form 20-F 2023
Nokia Board of Directors | ■Approves ESG strategy and evaluates ESG practices, related risks and target setting as well as their implementation and effectiveness. ■Specific sustainability topics are reviewed by Board Committees based on their responsibilities, including ESG reporting, materiality assessment, ethics and compliance, cybersecurity, privacy, culture, human capital management and embedding sustainability in our technologies. | ||
 | |||
Group Leadership Team | ■Reviews and approves implementation of and changes to sustainability-related policies, management and operational frameworks, strategy, targets and performance, annual sustainability report and links to rewarding. ■Conducts sustainability review and provides feedback a minimum two times per year and as topic-specific areas require ■CEO, CFO and business group presidents review additional sustainability topics a minimum of two times per year as part of Nokia business reviews. | ||
| | | | ||||
Sustainability Council ■Steers the alignment of sustainability strategy, priorities, and the implementation of sustainability activities across Nokia ■Contributes to the sustainability strategy and materiality assessment, and reviews sustainability targets and performance ■Provides additional insight to sustainability-related risks and opportunities | Donations and Sponsorships Committee ■Sets principles for allocation of corporate donations and investments for universities and communities ■Approves funds for donation allocation and reviews major sponsorships ■Assesses the impact of all donation programs | Inclusion and Diversity Steering Committee ■Reviews annual Inclusion and Diversity (I&D) plans ■Sets Nokia-level I&D ambitions and measures impact and targets ■Evaluates business group-level I&D actions and provides feedback to business groups | Human Rights Due Diligence Council ■Governs high-level alignment on Nokia’s Human Rights Policy and implementing procedures ■Steers decisions on Nokia businesses from a human rights point of view. ■Ensures alignment between all business groups and functions and that appropriate mitigations are put in place | ||||
Members Senior leaders from units representing all business groups, Customer Experience, Corporate Affairs, People, Finance, Strategy and Technology and Legal and Compliance. Convened ten times in 2023. | Members Chief Financial Officer, Chief Corporate Affairs Officer, Chief People Officer, VP Technology Leadership, Chief Compliance Officer, Head of Customer Experience Finance. Convened once in 2023. | Members Chief Legal Officer, Head of Inclusion & Diversity, other senior leaders from business groups, Human Resources, ESG and legal, and representatives from employee resource groups. Did not convene in 2023(1). | Members Chief Legal Officer, Chief Corporate Affairs Officer, Chief Compliance Officer, VP Sustainability, VP Technology Leadership, other senior leaders per need. Head of Human Rights, and Legal Counsel. Convened twice in 2023. | ||||
| | ||||||
ESG function The corporate ESG function drives the implementation of the ESG strategy and actions needed to achieve targets at the operational level. Subject matter experts contribute fact-based input to the different functions and business groups. Ensures corporate sustainability reporting is in line with requirements and regulations. | Ethics and Compliance function Supports employees with training and guidance, fostering ethical decision-making and choices that are consistent with our values, policies, and laws. Promotes an open reporting culture and oversees robust and impartial concern reporting, investigation and remediation processes. | ||||||
(1) Due to reorganization the Inclusion and Diversity Steering Committee did not meet during 2023 and the Sustainability governance model will be reviewed and updated in 2024. | |||||||
Risk management
Sustainability-related risks and opportunities are part of our
Enterprise Risk Management framework. We recognize and aim
to mitigate the potential risks and negative impacts associated
with our business whether related to technology, supply chains,
the climate or people, while also driving opportunities within
and beyond our business to contribute to achieving the
UN SDGs. We have policies and processes for our identified
material sustainability-related risks, including our Code of
Conduct which reflects our values through clear and simple
directions on ways of working for all employees and business
partners. The main features of our risk management systems
are described as part of our corporate governance statement
(see Corporate Governance Statement—Risk management,
internal control and internal audit functions at Nokia).
The “Risk factors” section of this report discusses the most
important risk factors affecting our operations. These risks
include sustainability-related issues such as:
■product safety and energy efficiency;
■environmental incidents;
■people safety and security;
■privacy and security, including cybersecurity threats
■potential human rights abuse through misuse of the
technology we provide;
■potential lack of proper respect for human rights, fair labor
conditions, the environment and supply chains;
■non-compliance with regulations or our supplier and
customer requirements;
■violation of ethical standards, including our Code of
Conduct;
■labor unrest and strikes;
■inability to retain, motivate, develop and recruit
appropriately skilled employees;
■public harm to our brand;
■issues with trade tariffs and taxation, including tax disputes;
and
■disruptions in our manufacturing, service creation, delivery,
logistics or supply chain caused, for instance, by natural
disasters, military actions, civil unrest, public health, and safety
threats (including disease outbreaks), many of which may be
fueled by the adverse effects resulting from climate change.
How these risks are managed, including related key policies and
actions, is further discussed in the following paragraphs, in the
context of the relevant topics.
Sustainability recognitions
We respond to key ratings and ranking organizations to drive
greater transparency and external recognition of our work.
For example, for 2023, we were assessed by Sustainalytics
to be at low risk of experiencing material financial impacts
from ESG factors. In early 2024, we were included in
Sustainalytics’ 2024 ESG Top-Rated Companies list. The ESG
Risk Ratings by Sustainalytics provide information for investors
assessing financially material ESG issues that affect the long-
term performance of their investments.
In the MSCI ESG Ratings assessment, we received a rating of
AAA (on a scale of AAA–CCC). The MSCI ESG Ratings are used
by investors to measure companies’ resilience to long-term,
financially relevant ESG risks.
Further information on all our recognitions can be found
on our website.
Business overview | Corporate governance | Operating and financial review and prospects | General facts on Nokia | Financial statements | Other information | 91 | |||||||
Sustainability and corporate responsibility continued
Nokia Annual Report on Form 20-F 2023


Environment
This section covers how we address our own
environmental footprint, including our focus on both
climate and circularity. We strive to minimize our
footprint across Scope 1, 2 and 3 by actively and
continually managing that footprint. As the volume of
network traffic rises in a more connected, digitalized
world, we must work to separate this growth in traffic
from any equivalent growth in energy consumption.
We also need to constantly strive to reduce GHG
emissions across our operations and facilities, and
work with our supply chain to help drive greater
energy and resource efficiency through the whole
chain. We believe our technology will play an ever-
more significant role in helping other industries and
society decarbonize (see the “Industrial digitalization”
section of this report).
Climate
Climate change remains a significant risk to society and the
natural environment. It can negatively impact our supply chain
and our customers’ business, as well as the global economy
and political and social stability.
We recognize that the products and services we provide
globally may affect the environment and climate as
manufacturing, distributing, and operating these products
requires energy and other natural resources. In 2023, 97%
of our GHG emissions footprint came from our products
in use by our customers in their networks. We can impact
our footprint by constantly improving power consumption,
increasing energy efficiency, and innovating where possible.
We continue to also innovate in terms of the silicon, software
and hardware we develop. During the year some of those
innovations included:
■MantaRay Energy, a solution for RAN energy efficiency,
combines Nokia’s capabilities to optimize the energy
consumption of radio access networks with AI and ML
■An expanded portfolio of energy-efficient site solutions
designed for our AirScale baseband portfolio
■A new update to our optics portfolio with launch of the
sixth-generation super-coherent photonic service engine
(PSE-6s)
GHG emissions from our own operations account for only 1%
of Nokia’s total carbon emissions, but we remain committed to
decarbonizing our operational footprint.
We are a member of the RE100 initiative aligned with our global
ambition to use 100% renewable electricity across our facilities
by 2025. In 2023, we reached our annual target of 75% of
renewable electricity across our facilities.
Our commitment to climate action was further validated
through Nokia’s Sustainable Finance Framework announced in
2023. This framework was established in accordance with the
recommendations of the Sustainability-Linked Bond Principles
(SLBP), and the Sustainability Performance Target in the
framework is based on Nokia’s science-based target of
reduction of absolute GHG emissions across our value chain
(Scope 1, 2 and 3) measured in metric tons CO2e. A second-
party opinion for the Framework was provided by
Sustainalytics, assessing Nokia’s Sustainability Performance
Target as ‘Highly Ambitious’ and the Company’s selected KPI –
reduction of absolute GHG emissions across its value chain –
as ‘Very Strong’.
As digitalization plays an increasing role in helping industries
and communities decarbonize, it is important that we are part
of the climate conversation. Our sustainability leadership
participated in the New York Climate Week and the UN General
Assembly in September 2023, meeting with key UN and climate
leaders on the role of technology in environmental and social
challenges. In December 2023, Nokia joined Business Finland
and other Finnish climate leaders in COP28 (the United Nations
Climate Change Conference) to again emphasize the
importance of digital solutions in accelerating the response to
climate change and supporting industries in which emissions
are hard to abate.
Business overview | Corporate governance | Operating and financial review and prospects | General facts on Nokia | Financial statements | Other information | 92 | |||||||
Sustainability and corporate responsibility continued
Nokia Annual Report on Form 20-F 2023
Accelerating our climate ambition
In 2023, Nokia collaborated with the Carbon Trust to
investigate how to accelerate its net zero targets and the
related pathway and levers. The Carbon Trust partners with
leading businesses, governments and financial institutions
to help turn their climate ambition into climate action.
In December 2023, the Group Leadership Team approved
the plan to fast-forward both our net zero target (Scope 1, 2
and 3) and our interim 2030 Scope 1 and 2 targets.
■We have set a new long-term target to reach net zero GHG
emissions across our value chain(1) by 2040
■We also aim to accelerate our existing interim 2030 target
to reduce emissions across our own operations,(2) reaching
an 83% reduction by 2030
■To ensure its targets are aligned with climate science,
Nokia submitted its net zero letter of commitment to the
Science Based Targets initiative (SBTi) in February 2024
and will submit the targets themselves for validation
Our key climate achievements in 2023
Our existing SBT is to reduce our total emissions by 50%
between 2019 and 2030 across our value chain (Scope 1, 2
and 3)(3). Overall, Nokia’s SBT carbon emissions in 2023 saw
a reduction of 9% compared to 2022. Our Scope 1 GHG
emissions in 2023 increased by 7 % to 111 100 tons CO2e
driven by our marine fleet, and our market-based(4) Scope 2
emissions reached 84 800 tons CO2e. By the end of 2023,
we had reduced our Scope 2 emissions by 37% compared
to 2022. Our Scope 3 emissions included in the SBT were
34 123 900 tons CO2e in 2023. This represents a reduction
of 9 % over the previous year.
Despite this decrease, our current SBT emissions are now at
the same level as the 2019 baseline year. This means that
the 2030 target was not on track with the expected linear
trajectory. While we continue to accelerate innovations in
product energy efficiency and supplier collaboration, the
availability and take up of renewable energy by Nokia’s
customers must rapidly increase to support the achievement
of the interim target.
Climate actions in our value chain
More and more Nokia customers are accelerating their journey
towards renewable energy. Therefore, from 2023 onward, we
started to collect customer-specific emissions factors from
our customers as we believe this could give a better indication
of our total Scope 3 category 11 (use of sold products) GHG
emissions than just using a GHG Protocol-mandated global
emissions factor.
Therefore, in 2023, we also calculated a total Scope 3 category
11 emissions number based on blended emissions factors. The
blended emissions factor is a combination of customer-specific
emissions factors confirmed by customers, country-average
emissions factors and global emissions factors. Our total Scope
3 category 11 emissions based on the 2023 blended emissions
factor was 33 691 400 tons CO2e. In this first year, the blended
emissions consist of 5% calculated by customer-specific
emission factors, 92% calculated by country-average emission
factors and 3% calculated by a global emission factor. Nokia
intends to further develop the collection and calculation of
customer-specific emissions factors going forward.
We also work with our suppliers to reduce our upstream
indirect emissions and to drive circular practice and innovation.
In 2023, we continued and enhanced our supplier climate
engagement and saw 458 of our key suppliers responding to
CDP’s request to disclose their climate performance information,
while 283 also provided emission reduction targets.
We saw good results from our climate work with our suppliers,
with our logistics suppliers achieving a 54% decrease in
emissions over the 2019 baseline. Logistics emissions were
140 900 tons CO2e in 2023. Our final assembly supplier
emissions were 38 500 tons CO2e, which is a 49% reduction
from 2019.
In early 2023, we were once again recognized by CDP for our
work on climate issues, receiving an A- score for our climate
work. We were also included in the CDP’s Supplier Engagement
Rating Leaderboard, reserved for companies with the highest
rating for supplier engagement on climate change. CDP is a
global organization that runs a bespoke global rating system
for investors, companies, cities, states and regions
to disclose their environmental impact.
We also had 247 suppliers responding to the CDP water
security questionnaire. We encouraged suppliers to set climate
targets aligned to the SBTi and again recognized climate-
related innovations as part of our Supplier Diamond Awards
program.
(1) Scope 1, 2 and 3.
(2) Scope 1 and 2. This includes complete decarbonization of Nokia’s car fleet as
well as its facilities and marine fleet reductions as aligned with the
International Maritime Industry (IMO) decarbonization pathway.
(3)The current SBT covers the following activities: Scope 1: emissions from our
facilities, car fleet and marine fleet own vessels. Scope 2: market-based
emissions from purchased energy. Scope 3: emissions from the customer use
of sold products (covering almost 100% of our current portfolio) and emissions
from logistics, final assembly factories in our supply chain, and marine fleet
chartered vessels.
(4) Market-based method derives emission factors from contractual instruments,
which include any type of contract between two parties for the sale and purchase
of energy bundled with attributes about the energy generation, or for unbundled
attribute claims.
Business overview | Corporate governance | Operating and financial review and prospects | General facts on Nokia | Financial statements | Other information | 93 | |||||||
Sustainability and corporate responsibility continued
Nokia Annual Report on Form 20-F 2023
Circularity
We aim to be a driver of circular practices in our industry.
We focus on opportunities to promote hardware circularity
by managing the sourcing and reuse of key source materials.
We build on our existing waste processes and circular products
and services offering, proactively increasing the takeback of
products from customer modernization projects and end-of-
life equipment and increasing the availability and sales of
refurbished products.
We also look to increase the use of recycled materials in our
products, augmenting the inclusion of recycled plastics, steel,
copper, nickel and aluminum in our product design.
Our circularity highlights in 2023
We have a robust environmental management system and
environmental policy. At the end of 2023, the coverage of
employees within the scope of ISO 14001 certification was 90%.
We introduced our first Sustainable Finance Framework that
underscores the importance of ESG within its business and
financing structure. We successfully completed an inaugural
EUR 500 million sustainability-linked bond.
We announced our sponsorship of a professorship with the
University of Jyväskylä in Finland to explore the measurement
of our industry’s biodiversity impacts.
Our circularity achievements:
In 2023, we achieved 81% tin, tantalum, tungsten and gold
traceability and conflict-free status and extended due diligence
for cobalt and mica.
We introduced a circular metric to guide our operational
circularity journey and to close the material loop. Our target
is to be 95% circular with regard to waste in 2030.
As part of our drive for the refurbishment and reuse of our
products in 2023, we sent around 2 610 metric tons of old
telecommunications equipment for material recycling.
Approximately 49 300 units were refurbished for reuse/resell
purposes with a total weight of 290 metric tons.
We have a robust environmental management system and
environmental policy, supported by documented processes
and procedures to ensure their implementation. The system
helps us to monitor our progress and identify needed
improvements. Our own operational footprint is certified under
the ISO 14001 environmental management system standard,
and at the end of 2023 the coverage of employees within the
scope of that certification was 90%.
Exploring biodiversity
Biodiversity is of increasing importance for our stakeholders.
At Nokia we also look more broadly at our dependence on
natural resources, including climate, biodiversity and geological
diversity (geodiversity). By geodiversity, we mean the Earth’s
minerals, rocks, fossils, soils, sediments, landforms, topography
and hydrological features such as rivers and lakes. In 2023, we
started to work to understand the impacts affecting natural
capital (including biodiversity and geodiversity) across our
value chain.
As a part of a holistic approach to biodiversity Nokia expanded
its forest protection efforts by establishing two new nature
conservation areas in Finland. One of these areas covers
71 hectares in Northern Ostrobothnia and the other covers
14 hectares in the Capital Region. In 2023, our total protected
area expanded to 242 hectares, comprising 131 hectares of
forested areas, 11 islands and 111 hectares of marine
environments.
In December, through its University Collaboration engagements
Nokia announced a collaboration with the University of
Jyväskylä and the Finnish Innovation Fund SITRA to improve
biodiversity footprint assessments. The collaboration aims to
help organizations develop effective strategies and measures
to assess and reduce their biodiversity footprint.
Business overview | Corporate governance | Operating and financial review and prospects | General facts on Nokia | Financial statements | Other information | 94 | |||||||
Sustainability and corporate responsibility continued
Nokia Annual Report on Form 20-F 2023
Share of suppliers who have completed identification of all smelters and have
achieved conflict-free status
(1)3TG combined shows the 4 minerals together (Tantalum, Tin, Gold and Tungsten), and is core to our reporting.
(1)
Industrial digitalization
Digitalization and enhanced connectivity are a
critical part of the solution to decarbonizing and
dematerializing physical industries that significantly
contribute to global carbon emissions. This is our
handprint – it represents the enablement effect
of the technology solutions we provide. We aim
to maximize this handprint as it provides our
greatest potential impact on climate change.
As part of our strategy, we provide low-latency connectivity,
private wireless networks, sensors, and AI/ML as the basis
of a “Green Digital” proposition in our enterprise portfolio.
We are working within our ecosystem to identify methodologies
that better measure the enablement effect and articulate
the business case for transformation to accelerate and
scale adoption.
Nokia has been a member of the European Green Digital
Coalition (EGDC) since 2021. As part of the EGDC, Nokia has
contributed to developing methodologies to measure the net
environmental impact of digital solutions in different industrial
sectors. At Mobile World Congress 2023, Nokia’s Integrated
Operations Center smart city project with Nicosia, the capital
of Cyprus, was highlighted by the EGDC in their announcement
detailing their online case studies.
We work with customers across the energy, manufacturing, and
transportation industries among others, providing ever-growing
evidence that there is no green without digital. We are considered
the leading vendor of private wireless to enterprises, with
710 private wireless customers.
For example, in 2023 Nokia partnered with IT company Kyndryl
to enable Dow Company to digitalize the largest integrated
chemical manufacturing facility in the western hemisphere in
Freeport, Texas, removing paper from the manufacturing and
maintenance processes. And in September we launched an
array of industrial 5G devices to keep enterprise teams and
public safety workers safe, connected and informed over
private wireless networks in hazardous and industrial
environments such as ports, mines, chemical plants and
offshore oil platforms.
Business overview | Corporate governance | Operating and financial review and prospects | General facts on Nokia | Financial statements | Other information | 95 | |||||||
Sustainability and corporate responsibility continued
Nokia Annual Report on Form 20-F 2023

Security and privacy
In our ESG strategy we position security and privacy
as the cornerstone of our product proposition.
We work to ensure a common security baseline
enforced for all products and services and accelerate
our security strategy ambitions.
Nokia has well-established cybersecurity processes built into its
overall security risk management framework. This integration
is achieved through the implementation of a robust Security
Program set on various processes, such as cybersecurity risk
management, third-party security risk management, security
incident management and disaster recovery.
In 2023, Nokia conducted a security training program that
included annual all-employee mandatory training, quarterly
awareness campaigns, monthly phishing simulations, and
expanded initiatives to safeguard key data such as our Zero-
Trust and Critical Information Protection Program and our
dedicated Application Security Program.
We have developed and maintain an actionable Cyber Resilience
service, built on an assessment of the cyber risks Nokia is most
likely to experience. This includes investments in our Cyber
Defense Center and our Computer Emergency Response team,
as well as the execution of regular incident simulations and
tabletop exercises to ensure resilience in case of a cyber event.
We have also strengthened our third-party security process
through improved supplier selection procedures, ensuring
that security governance and compliance are embedded in
our supplier selection processes and contracts.
Product and Services Security
At Nokia, we recognize the paramount significance of product
and services security in the rapidly evolving landscape of
telecommunications and technology. In an era marked by
digital transformation and interconnected ecosystems, the
security of our offerings is crucial to our operations. We
understand that our customers rely on Nokia for solutions
that not only elevate performance but also guarantee the
integrity and confidentiality of their critical data.
We are dedicated to achieving a common security baseline
enforced for all products and services. To accelerate our
security ambitions, we are reinforcing the Nokia Design for
Security framework, driving end-to-end product security
testing initiatives like the Advanced Security Testing and
Research (ASTaR) Lab, and leveraging our own security
innovations.
Secure products are our priority, supported by initiatives such
as the Product Security Transformation Program, the pursuit
of certifications for essential 5G products, and the evolution of
our product security platforms. We have set up Service Security
as a separate domain to cover the full-service lifecycle with a
properly defined service security framework and we remain
focused on the continuous certification of services teams to
the ISO 27001 standard. We also have a program dedicated
to enhancing the security of Nokia service companies and
joint ventures.
Privacy
In privacy, we have established a comprehensive Company-
wide privacy program based on respecting privacy rights and
exercising high standards of integrity in dealing with – and
protecting – personal data, set out in core principles that are
based on relevant laws, best practices, and standards. We
conduct privacy assessments that aim to mitigate privacy
risk in relation to the data we collect, process and store.
We observe the concept of data minimization, meaning we
endeavor only to collect personal data that is necessary for the
purposes for which it is collected and to retain such data for no
longer than is necessary. We implement appropriate controls to
ensure that only persons with a clear and justifiable need to
know can access personal data. We have formal processes and
procedures in place to manage and mitigate any related risk
to data subjects in the event of a personal data breach.
These processes also include mechanisms to communicate in
a timely fashion with supervisory authorities, should that be
required. A program of privacy awareness, and general and
targeted role-based training, ensures that we continuously
and effectively address areas of the highest privacy impact.
Our mission is to protect and safeguard personal data in
Nokia’s possession, and we have a network of certified privacy
professionals who regularly provide coaching on privacy.
Business overview | Corporate governance | Operating and financial review and prospects | General facts on Nokia | Financial statements | Other information | 96 | |||||||
Sustainability and corporate responsibility continued
Nokia Annual Report on Form 20-F 2023
Bridging the digital divide
We aim to bridge the digital divide and connect the
unconnected through our broadband and innovative
connectivity solutions. Our solutions can bring more
inclusive access to opportunities and help resolve many
social and economic challenges the world faces today.
Nokia aims to bring both our connectivity and digital skills-
building solutions to support more inclusive access to
healthcare, education, and employment opportunities. We also
aim to enable new business opportunities for SMEs through
digitalization. We can achieve this by leveraging our broad
product portfolio, as well as through focused strategies with
non-terrestrial network operators to connect different
demographics to broadband-level speeds in both fixed and
wireless domains.
For example, in September we announced the deployment of
Nokia’s energy-efficient passive optical LAN (POL) solution at
100 schools in a cutting-edge network for schools in South
Korea. The deployment, completed in collaboration with
Dongkuk Systems and Erum I&C, aims to enhance the existing
infrastructure and provide a high-capacity network to support
digital learning. This initiative is part of the South Korean
Ministry of Education’s Green Smart School program to
transform existing school facilities into smart learning
environments, including the creation of large-capacity
multimedia classes.
We also implement social initiatives via non-governmental
organizations (NGOs) to further support our sustainability
strategy. In 2023, we reached 130 832 direct beneficiaries(1)
through social digitalization projects, building digital skills,
connecting the unconnected or underserved, and improving
inclusion, equity and diversity. This year, we saw the finalization
of some programs and the initial launch of new programs,
which both led to the total number of direct beneficiaries being
lower than in 2022.
Our program with UNICEF in Morocco continued in 2023,
reaching 3 928 people through mentor training, awareness
raising sessions, regional and national social innovation
bootcamps, project or business incubation and digital skills
training. The program aims to empower youth with digital,
entrepreneurial skills and environmental knowledge.
One of our flagship social initiatives in India is Smartpur, which
was developed to improve access to livelihood opportunities,
healthcare, financial services, education and governance for
rural communities by utilizing the transformative power
of technology. In 2023, we supported Smartpur centers in
350 villages across India and the number of direct beneficiaries
reached in 2023 is 119 795.
(1)Individuals that independent from any relationship with the company were directly
benefited by Nokia’s contributions or activities related to digital connectivity and
inclusion directly resulting from them.
Business overview | Corporate governance | Operating and financial review and prospects | General facts on Nokia | Financial statements | Other information | 97 | |||||||
Sustainability and corporate responsibility continued
Nokia Annual Report on Form 20-F 2023

Responsible business
We strive to execute all business activities in a
trustworthy, ethical and transparent manner. This
includes interactions with our employees as well as
with our business partners, customers and suppliers.
We aim to work with only third parties that share our
values, that work to ensure compliance with the law
and that reinforce a commitment to ethical behavior.
Highlights
98% of our employees completed our 2023 Ethical Business
Training.
In 2023, we implemented 635 supply chain audits, including
141 on-site in-depth audits on corporate responsibility topics,
48 on-site audits against our Supplier Requirements and
446 supplier assessments using the EcoVadis scorecards,
which consisted of 62% of Nokia’s total spend.
We successfully completed our second independent
assessment for the Global Network Initiative (GNI), with the
public report made available in 2023. The assessors highlighted
Nokia’s strong human rights culture, noting that many issues
are flagged and addressed informally even prior to surfacing
during the formal process.
Of the Human Rights Due Diligence cases investigated in 2023,
96% of total cases were resolved as “Go” or “Go with
Conditions” (63% and 33% respectively) and 4% as “No Go”.
We also improved our diversity hiring in 2023 with women
representing 28% of external hires.
We take a proactive and values-driven approach to responsible
business practices both internally and within our value chain.
We aim to improve outcomes related to issues including
environmental and human rights risks.
Ethics and compliance
We aim to conduct our business with the highest standards of
business ethics and integrity. Our comprehensive compliance
program and our strong culture of integrity allow us to earn
and keep the trust of customers, governments, employees and
other stakeholders. The foundation of our commitment to
integrity is our Code of Conduct, which provides a framework
that unites our leaders and employees behind a common vision
and set of values. This Code sets out four defining principles
that are supplemented by 14 key compliance policy areas.
Business overview | Corporate governance | Operating and financial review and prospects | General facts on Nokia | Financial statements | Other information | 98 | |||||||
Sustainability and corporate responsibility continued
Nokia Annual Report on Form 20-F 2023
98%
of our employees completed the
Ethical Business Training
Our Code of Conduct and the 14 main policy areas | |||||||||
We do business the right way ■Conflict of interest ■Dealing with government officials ■Fair competition ■Improper payments (anti-corruption) ■Trade compliance ■Working with third parties | We respect our people and community ■Environment ■Fair employment ■Health, safety & labor conditions ■Human rights ■Privacy | We safeguard our assets ■Controllership ■Intellectual property & confidential information ■Insider trading | |||||||
Four defining principles | ||||||||||||
We follow the laws of the countries where we do business and adhere to Nokia’s policies and procedures | We personally set the example for each other and our stakeholders by being honest and fair | We promote a culture of integrity through mutual respect, trust in each other and high standards of ethics in all our business dealings | We hold each other accountable to the Code of Conduct and if we are aware of potential violations, we promptly report them | |||||||||
We do business the right way
Our Third-Party Code of Conduct, which is applicable to
our suppliers and partners, clearly states our expectations
regarding ethical conduct. We ask our third parties to adhere to
Nokia’s Third-Party Code of Conduct. Third-party commercial
partners, including distributors and indirect resellers, are
required to annually certify compliance with this code, and high
risk third parties are required to complete compliance training.
This code is further supplemented by policies, procedures,
and guidance documents covering a range of topics, including
third-party screening procedures and corporate hospitality.
We also have a separate Code of Ethics that sets out further
expectations for our President and CEO, Chief Financial Officer
and Corporate Controller.
In 2023, we deployed annual mandatory training on ethical
business practices for our employees. Our Ethical Business
Training was completed by 98% of our employees, surpassing
the agreed target of 95%.
We supplement our all-employee mandatory training with
targeted training focusing on particular parts of our operations
and addressing high risk areas, regulatory requirements and
critical and emerging needs. We use a combination of videos,
in-depth training modules, microlearning modules, animations,
and live training sessions to educate employees about high-risk
areas.
In 2023, more than 23 600 attendees received live training
with over 35 compliance topics covered in about 75 sessions.
For select topics, we provide short, animated “just-in-time”
training modules that provide information at the time it is
needed; these are triggered by specific employee actions. For
example, a just-in-time training module on anti-competition
risks is delivered to employees who are attending trade
association meetings, and a module regarding our investigation
process is delivered to employees and external individuals
who raise concerns.
Anti-corruption and bribery
We employ a multi-faceted approach to prevent corruption,
and we have clear and unambiguous policies concerning
improper payments, facilitation payments, gifts and hospitality,
sponsorships and donations and other areas of corruption risk.
Our policies and expectations regarding our strict prohibition
on improper payments and corrupt behavior apply to our
employees, partners and suppliers.
We implement training and regularly communicate with
our employees regarding legal and compliance risks, and
we review these risks and our mitigation measures with the
Company’s senior leadership and Audit Committee of the
Board of Directors.
In 2023, we created a new online anti-corruption training
module and included several topics related to anti-corruption
in our annual “Ethical Business Training,” including: bribery
workplace scenarios, policy information and special
requirements when working with government officials.
We conduct periodic audits and risk assessments to ensure
that we identify and respond to corruption risks across our
operations. Our compliance operations reviews provide an
in-depth assessment of a business or region’s compliance
programs and status, including a review of the strength of
the culture of integrity. In addition, our compliance control
framework assessments provide a deep analysis of compliance
risks and controls associated with a specific business, country,
or region.
These site or business reviews focus on identifying anti-
corruption risks (as well as other risks) and developing,
implementing, and monitoring responsive mitigation controls.
We also carry out risk-based due diligence and monitoring
procedures for all third parties to assess and manage potential
risks related to engaging and working with them. In 2023,
we completed four compliance operation reviews and
13 compliance control framework assessments.
Nokia’s Anti-Corruption Center of Excellence is a dedicated
group within our compliance team that assesses, monitors,
and approves or rejects engagement with high-risk third
parties (including, but not limited to, commercial third parties
and high-risk suppliers), as well as practices such as gifts,
entertainment, hospitality, sponsorships, and donations.
All third parties and suppliers that conduct business with
Nokia are subject to a risk-based screening process.
The activities of the Anti-Corruption Center of Excellence are
digitalized and tool-based, including, for example, monitoring
and training of third parties.
Third parties must adhere to our Third-Party Code of Conduct,
and they are required to sign our anti-corruption certification
annually. In 2023, over 260 of our commercial third parties
certified that they reviewed our Third-Party Code of Conduct
and completed the training video. In addition, as necessary,
live discussions on effective compliance programs are held
with our commercial partners with the goal of exchanging
best practices.
Oversight and grievance mechanisms
Our Board of Directors, its Audit Committee and our Group
Leadership Team all provide oversight of our ethics and
compliance program. Our Chief Compliance Officer provides
periodic reports and updates on our compliance program
(including information relating to investigations, due diligence,
transaction metrics, and evolving external enforcement and risk
trends) to the Board, the Audit Committee, and others, as needed.
Using one of the several resources available to them
employees are expected and encouraged to report concerns
about suspected misconduct or potential violations of the law,
our Code of Conduct, or our company policies. We provide
numerous channels and mechanisms to facilitate such
reporting, including anonymous reporting (unless prohibited
by local law), and we strive to ensure that employees feel
comfortable reporting concerns. Our global Ombuds Program
helps drive our ‘speak-up’ culture and allays concerns
employees may have about potential reprisal for filing a report.
In 2023, the Business Integrity Group, our investigation team
in the Ethics and Compliance organization, received a total
of 1 056 concerns, of which 483 were integrity concerns
investigated by the Business Integrity Group as suspected
violations of our Code of Conduct. The Business Integrity
Group closed 370 investigations into alleged violations of our
Code of Conduct, of which 159 were substantiated with cause
found after investigation. Following investigations conducted
by the Business Integrity Group, we implemented corrective
actions including dismissals, suspension without pay, written
warnings, coaching/counseling, training, and restitution.
Beyond individual discipline, detailed root cause analysis was
conducted for substantiated cases, and unsubstantiated cases,
as appropriate, to identify, implement, and to monitor remedial
measured and improvements.
Business overview | Corporate governance | Operating and financial review and prospects | General facts on Nokia | Financial statements | Other information | 99 | |||||||
Sustainability and corporate responsibility continued
Nokia Annual Report on Form 20-F 2023
Human rights
We are committed to the principles of the Universal Declaration
of Human Rights, the United Nations Global Compact and the
OECD Guidelines for Multinational Enterprises. We endorsed
the United Nations Guiding Principles on Business and Human
Rights in 2011. We encourage our suppliers and business
partners to share our values.
Our Code of Conduct, together with our Human Rights Policy,
sets out our approach to human rights. Our human rights
processes cover the whole value chain, from supplier
management to product end use, and we have set clear
requirements for all areas separately.
The technology we provide can bring positive benefits to
individuals and broader society. We have a robust Human
Rights Due Diligence process that aims to ensure the
technology we provide is not misused to limit the privacy or
freedom of expression of any individual or group. This process,
which is embedded in our global sales process, provides the
mechanism and tools to effectively mitigate our most salient
human rights risks arising from the potential misuse of the
products and technology we provide.
Before any sale is made, we aim to identify the level of
possible risk to human rights through potential misuse of our
technology and provide mitigation if any risk is identified. The
Human Rights Due Diligence process is initiated according to
various triggers including technology type, customer, country
and use case. Of the Human Rights Due Diligence cases
handled in 2023, 96% of total cases were resolved as “Go”
or “Go with Conditions” (63% and 33%) respectively and 4%
as “No Go”.
In addition to potential product misuse, human rights risks
appear in our global supply chain (see the “Responsible
sourcing” section and our Modern Slavery Statement published
on our website).
We are a member of the Global Network Initiative, a multi-
stakeholder group of companies, civil society organizations
(including human rights and press freedom groups),
investors and academics working together to protect and
advance freedom of expression and privacy in the ICT sector.
We have successfully completed our second independent GNI
assessment, and the public report was made available in
October 2023. The assessors highlighted Nokia’s strong
human rights culture, noting that many issues are flagged
and addressed informally even prior to surfacing during the
formal process. The GNI also noted our Human Rights Due
Diligence processes encompassing relevant functions across
the Company with strong escalation mechanisms. To ensure
best-in-class human rights mitigations our Human Rights Due
Diligence process also went through an internal audit that
began in 2022 and was completed in 2023, providing findings
that led to increased digitalization of the process.
Responsible sourcing
We expect our suppliers to adhere to our Third-Party Code of
Conduct and provide them with our Supplier Requirements,
including the Responsible Business Alliance (RBA) Code
of Conduct and additional, Nokia-specific sustainability
requirements. The requirements cover such topics as
environment, health, safety and security, privacy, risk
management, labor and human rights, modern slavery,
and ethics. We also run assessments and audits on our
suppliers and provide training to ensure they meet our
ethical requirements and continuously improve on their
performance. We work with them on remediation actions and
push to raise the bar on standards across our ecosystem.
In 2023, we implemented 635 supply chain audits, including
141 on-site in-depth audits on corporate responsibility topics,
48 on-site audits against our Supplier Requirements and
446 supplier assessments and follow-ups using the EcoVadis
scorecards. We continued our work to increase the use of
recycled material content in our products. As part of our
circularity program, we introduced recycled material content
targets for our mechanical suppliers. We also held training
workshops for suppliers on topics such as climate change,
circularity, responsible minerals sourcing, modern slavery,
labor migration, diversity and inclusion, and health and safety.
We continued to work with suppliers on the CDP Climate
program which includes learning and capability building, data
reporting, target setting and performance evaluation. In 2023,
we expanded the deep dives on emissions reduction roadmap
development with carbon intense segments of our supply
chain such as integrated circuits (ICs) and semi-discretes,
and printed wiring boards (PWBs).
Business overview | Corporate governance | Operating and financial review and prospects | General facts on Nokia | Financial statements | Other information | 100 | |||||||
Sustainability and corporate responsibility continued
Nokia Annual Report on Form 20-F 2023
63%
of the cases handled by HRDD
in 2023 were resolved as “Go”
Cases handled in 2023 by the Human
Rights Due Diligence process and how
they were resolved
Our people
“At Nokia, we care about our people
and believe they are critical to
the long-term sustainability and
competitiveness of our company.”

Business overview | Corporate governance | Operating and financial review and prospects | General facts on Nokia | Financial statements | Other information | 101 | |||||||
Sustainability and corporate responsibility continued
Nokia Annual Report on Form 20-F 2023
The essentials and our people
strategy
The foundation of our culture is based on the Nokia
essentials – open, fearless and empowered – which
incorporate our values and determine how we interact
with each other and the world around us both as a
company and as individuals.

Our people strategy brings to life our Nokia
essentials and translates Nokia’s vision to
create an unbeatable people experience
into ambitions and actions in the following
four ways:

At Nokia we work together to align personal, professional
and business growth by providing our people with visibility,
resources and support in their careers. By enriching,
recognizing and rewarding individual experiences and skills,
we aim to be a company where people not only work but thrive.
We have improved our employee user experience with tools
that enable employees to take even more ownership of their
careers and that support our leaders with insights to guide
employees’ careers. Through AI-driven platforms, employees
have an increased visibility of opportunities and job trends
across all of Nokia, which optimizes their long-term
career planning.
The platforms democratize career development and help to
mitigate bias, enabling employees to embrace their ambitions
and explore their career journey. In addition, our Technical
Career Path Program continues to support employees to
advance their careers as subject matter experts, as required
for the continued success of Nokia.
We believe that communities help accelerate learning. Learning
is social, and we learn together as individuals, as teams and
as a company. We can learn faster when we all bring our unique
experiences and knowledge. Therefore, we currently have
256 internal coaches and around 670 mentors available at
Nokia to support our employees on their growth journey,
all of them directly accessible via our platform.
Focus on sustainability enablement
In 2023, we continued sustainability enablement across Nokia
through the ESG Community of Interest, a collaborative
innovation platform for knowledge building. The community
organized several knowledge-sharing sessions on energy
efficiency, bridging the digital divide, sustainable sourcing,
circularity and ESG standards.
We also launched an ESG certification training curriculum with
four certification levels to equip key people with the knowledge
they need to explore ESG as a competitive advantage. We set
up three ESG customer advisory councils – forums for Nokia
and its customers’ ESG leaders to explore common solutions
and enablers for sustainable development.
Business overview | Corporate governance | Operating and financial review and prospects | General facts on Nokia | Financial statements | Other information | 102 | |||||||
Sustainability and corporate responsibility continued
Nokia Annual Report on Form 20-F 2023

It is more important than ever to lead with strong human skills
that promote psychological safety and create a working
environment in which all people can live our Nokia essentials,
with a priority on well-being to enable stronger and more
resilient teams.
To help leaders role-model the right behaviors while retaining
strategic and operational focus, we have implemented new
initiatives in 2023, including:
■Developed and piloted face-to-face “Leadership4Impact”
sessions for early and mid-level line managers
■Embedded enhanced psychological safety and leadership
skills within people agendas
■Introduced Leader Lab sessions, designed to support
leaders at all levels with learning and resources needed
to lead in the current moment, addressing real-time
challenges while building a strong leadership community
■Conducted the inaugural Nokia Leaders Summit, where top
executives came together to focus on further developing
our strategy with input from the investor and customer
communities

Inclusion and diversity are core to the way we do business,
innovate with our customers and partners, and attract talent.
We bring together people with diverse identities, cognition,
education, expertise and backgrounds. To make everyone feel
valued and respected, we need an environment where all get
equal opportunities to grow and develop, for the benefit and
well-being of the individual, team and company.
Nokia’s Inclusion & Diversity Community brings together
employees across the organization to educate and share
best practices to widen the impact of our inclusion and
diversity initiatives. Since its start in June 2022, it has
continuously increased its membership – with currently
about 1 200 members – and has provided about 40 learning
and sharing sessions.
In 2023, the focus has been on the inclusion of people with
disabilities and neurodivergent employees, areas in which Nokia
closely collaborates with nonprofit organizations for business
disability inclusion such as Disability:IN and Inclusion Works.
To ensure that our managers can improve their leadership of
multi-generational teams as well as their talent acquisition,
retention and productivity, we published the Leading an Aging
Workforce and the Successful Early Career Strategies e-books
in 2023.
We also continued to drive improvements in gender diversity
by monitoring pay equity. In 2023, our end-of-year review of
Nokia’s gender pay gap showed a statistically insignificant
unexplained pay gap.
We will continue to further emphasize and apply mitigations
to improve in gender diversity, with the following key efforts.
■Targeting a minimum threshold for women hires in our
global external recruits since 2021. In 2023, we exceeded
the minimum mark of 27% by hiring 28% women.
■Running programs in collaboration with the global gender
equality champion UN Women, both with our customers and
internally, to support women’s careers.
Business overview | Corporate governance | Operating and financial review and prospects | General facts on Nokia | Financial statements | Other information | 103 | |||||||
Sustainability and corporate responsibility continued
Nokia Annual Report on Form 20-F 2023

We are shaping the Nokia environment to enable people to
be empowered and productive. We strive toward increased
flexibility in how and where employees work, simplified policies
and processes, psychological safety, and the feeling of working
in a united manner.
In 2023, we launched a new consolidated people tool, NokiaME,
to simplify key global HR processes and tool, with a continued
rollout over the next few years.
This year we again asked our employees what they needed and
how management could better support them through our
Annual Employee Survey and reached a high participation rate
of 76% of Nokia employees, which represents a 10% increase
in participation year over year. This feedback loop is essential
for developing a better experience.

Business overview | Corporate governance | Operating and financial review and prospects | General facts on Nokia | Financial statements | Other information | 104 | |||||||
Sustainability and corporate responsibility continued
Nokia Annual Report on Form 20-F 2023
Employee demographics
The market for skilled employees in our business remains
extremely competitive. Our workforce has evolved over
recent years as we have introduced changes in our strategy
to respond to our business targets and activities. These
changes may in the future cause disruption and fatigue
among employees, which, when coupled with our employee
demographics and a dependence on key resources in some
areas, make a focus on skill refreshing, well-being, inclusivity
and enabling personal and professional growth imperative.
In 2023, the average number of employees was 86 689
(86 896 in 2022 and 87 927 in 2021).
At the end of 2023, 27% of our executive leadership positions
were held by women, while the share of women in all leadership
positions across Nokia was 17%. In total, women accounted for
23% of our workforce.
86 689
the average number of employees in 2023
27%
of our executive leadership positions
were held by women at the end of 2023.
Well-being
On 19 October, Nokia announced a number of restructuring
changes. As part of the support we want to offer our people
during these difficult times, we have focused on providing
guidance, tools and trainings to support employees and
managers with timely, relevant information to navigate
through this period of change.
The Personal Support Service, our global employee assistance
program, is available to all employees and their family
members, providing access to 24/7 professional support in
their local language. These confidential resources play an
important role in providing counselling and guidance during
times of uncertainty.
In 2023, we continued to provide opportunities for employees
to develop their capabilities in a wide range of wellbeing topics,
from self-care and mindfulness to mental health and burnout,
with a special focus on implementing ways to increase personal
financial stability and coping with change. Over 14 000 employees
engaged with the global training series content, which was
complemented by regional trainings in local languages.
During the year, we also launched a new guide “Having Open
Conversations” to support dialogue about mental health
within teams. And our ShareToCare Employee Resource Group
continues to grow, bringing people together to have open
conversations about mental health.
All employees now have access to an exercise app to encourage
them to take breaks and remain active during their workday,
providing short exercises to support both the mind and body.
We delivered 25 sessions as part of the “Thrive with Well-Being”
series and “Be well, Lead well” leadership development
program to targeted groups of employees and people
managers across the organization.
Business overview | Corporate governance | Operating and financial review and prospects | General facts on Nokia | Financial statements | Other information | 105 | |||||||
Sustainability and corporate responsibility continued
Nokia Annual Report on Form 20-F 2023
Share of women in our workforce
at the end of 2023
Health, safety and labor conditions
The health and safety of our employees is the non-negotiable
foundation of how Nokia conducts its business. Our Code
of Conduct is the basis for labor conditions, enhanced by
a full set of global HR policies and procedures that enable
fair employment. We adhere to the International Labour
Organization (ILO) Declaration on Fundamental Principles and
Rights at Work, and we meet, or where possible exceed, the
requirements of labor laws and regulations wherever we have
operations. We work hard to ensure decent working conditions
and fair employment, recognizing both international and local
laws and guidelines. Our health and safety management system
is the basis for our overall Health and Safety program and an
integral part of how we manage health and safety.
The system is certified with the internationally recognized
ISO 45001 framework. The certification is provided by a
third party, Bureau Veritas, and the share of our employees
covered by the certification at the end of 2023 was 88%.
We implement training, analysis, assessments, and
consequence management to address job-related health
and safety risks. We run a wide range of programs targeted
at improving our health and safety performance, while also
encouraging employees and contractors to report near
misses and dangerous incidents.
We see the highest risk exposure to health and safety in the
delivery of field work, which is predominantly delivered by
our contractors through tasks such as working at height,
driving for work, and electrical installation and maintenance.
Consequently, we have set stringent KPIs related to a supplier’s
ability to deliver safely, which is evaluated by our Health and
Safety Maturity Assessment.
In 2023, there were no (zero) work-related fatal incidents
involving employees. However, we regret the three work-
related fatal incidents resulting in the death of one
contractor / subcontractor and two third parties(1).
Any such serious incidents while carrying out work on behalf
of Nokia are unacceptable. Each incident is thoroughly
investigated to establish root causes and corrective actions are
implemented to reduce the likelihood of future occurrences.
In 2023, Nokia ensured 100% of our suppliers formally pledged
to follow the Nokia lifesaving rules.
Creating a safer work environment starts with good leadership.
Our leaders are in a key position to strengthen the health and
safety culture. Conducting a Senior Leader Safety Tour is a
targeted, direct and strategic way to engage with local teams in
order to influence safety behaviors. In 2023, Nokia set a target
of having Senior Leaders lead forty safety tours of specific
sites. Nokia recorded 144 such tours in 2023.
Our key standards Working at Height, Rigging & Lifting, Driving,
Electrical and Underground Assets Avoidance are implemented
with non-negotiables for effective controls to manage risk on a
global scale in all markets. Incident management and reporting
and investigation programs encourage all employees and
contractors working on our behalf to report all incidents
including near misses and high potential incidents.
Our assurance and governance programs have built in
checkpoints to measure effectiveness. We have agreed metrics
and KPIs designed into all levels of our programs and business
processes to assure and manage risk in critical areas such as
supplier qualification and project management, where high-risk
activities are delivered. Operational reviews and internal
and external audits provide the visibility and accountability
needed to improve performance and reduce risk. In addition,
regular reporting, communication of recovery plans and
action management are in place to ensure effective
program management.
By the end of 2023, 99% of suppliers delivering high-risk
activity had been assessed using our Health and Safety
Maturity Assessment process and 99% of the assessed
suppliers were health and safety compliant. We also carried
out implementation assessments on 99% of all high-risk
projects, 98% of which were found to meet our minimum
non-negotiable requirements.
(1)Nokia has revised its fatality reporting criteria in 2023 to include third parties such
as members of the public who are assessed as being impacted by an incident that is
deemed within Nokia’s control. This more closely aligns Nokia’s reporting with some
of its closest industry stakeholders and competitors.
Business overview | Corporate governance | Operating and financial review and prospects | General facts on Nokia | Financial statements | Other information | 106 | |||||||
Sustainability and corporate responsibility continued
Nokia Annual Report on Form 20-F 2023
88%
share of our employees covered by
ISO 45001 certification at the end of 2023

Shares and shareholders
Share details
Shares and share capital
Nokia has one class of shares. Each Nokia share entitles the holder to one vote at general
meetings of Nokia.
At 31 December 2023, the share capital of Nokia Corporation equaled EUR 245 896 461.96 and
the total number of shares issued was 5 613 496 565. At 31 December 2023, the total number
of shares included 87 895 712 shares owned by Group companies representing approximately
1.6% of the total number of shares and the total voting rights.
In 2023, under the authorization granted to the Board of Directors by the Annual General
Meeting, the Parent Company issued 59 500 000 new shares without consideration to itself
to fulfill the Company’s obligation under the Nokia Equity Programs.
In 2023, under the authorization granted to the Board of Directors by the Annual General
Meeting, the Parent Company issued 16 885 827 treasury shares to employees, including certain
members of the Group Leadership Team, as settlement under Parent Company equity-based
incentive plans and the employee share purchase plan. The shares were issued without
consideration and in accordance with the rules of the plans.
Information on the authorizations held by the Board of Directors in 2023 to issue shares and
special rights entitling to shares, to transfer shares and repurchase own shares, as well as
information on related party transactions, the shareholders, stock options, shareholders’ equity
per share, dividend yield, price per earnings ratio, share prices, market capitalization, share
turnover and average number of shares is available in this section “Shares and shareholders”
and additionally in the “Corporate governance—Compensation” section and Notes 5.1. Equity
and 3.2. Remuneration of key management in the consolidated financial statements.
In November 2023, the Board of Directors decided to cancel 78 301 011 Nokia shares held by
the Company and repurchased under the second EUR 300 million phase of the EUR 600 million
buyback program announced in 2022. The second phase of the buyback program started in
January 2023 and ended in November 2023. The cancellation did not affect the Company’s
share capital nor total equity.
The Board of Directors held at 31 December 2023 a total of 900 190 shares and ADSs in Nokia,
which represented approximately 0.02% of our total shares and voting rights excluding shares
held by the Nokia Group. The President and CEO owned at 31 December 2023 a total of
1 473 060 shares.
There were no public takeover offers by third parties for Nokia’s shares or by Nokia for other
companies’ shares during the 2023 and 2022 fiscal years.
Nokia does not have minimum or maximum share capital or a par value of a share.
31 December | 2023 | 2022 | 2021 | 2020 | 2019 |
Share capital, EURm | 246 | 246 | 246 | 246 | 246 |
Shares, (000s) | 5 613 497 | 5 632 298 | 5 675 461 | 5 653 886 | 5 640 536 |
Shares held by the Group, (000s) | 87 896 | 45 282 | 40 468 | 36 390 | 34 955 |
Number of shares excluding shares held by the Group, (000s) | 5 525 601 | 5 587 016 | 5 634 993 | 5 617 496 | 5 605 581 |
Average number of shares excluding shares held by the Group during the year | |||||
Basic, (000s)(1) | 5 549 468 | 5 614 182 | 5 630 025 | 5 612 418 | 5 599 912 |
Diluted, (000s)(1) | 5 585 923 | 5 670 020 | 5 684 235 | 5 612 418 | 5 626 375 |
Number of registered shareholders(2) | 247 893 | 238 359 | 233 844 | 246 886 | 248 526 |
(1)Used in calculation of earnings per share for profit or loss for the year attributable to equity holders of the parent.
(2)Each account operator is included in the figure as only one registered shareholder.
Business overview | Corporate governance | Operating and financial review and prospects | General facts on Nokia | Financial statements | Other information | 107 | |||||||
Shares and shareholders
Nokia Annual Report on Form 20-F 2023
Key ratios
For the year ended 31 December, Continuing operations | 2023 | 2022 | 2021 | 2020 | 2019 |
Earnings per share, basic, EUR | 0.12 | 0.75 | 0.29 | (0.45) | 0.00 |
Earnings per share, diluted, EUR | 0.12 | 0.74 | 0.29 | (0.45) | 0.00 |
P/E ratio | 25.42 | 5.77 | 19.22 | neg. | — |
Proposed dividend per share, EUR(1) | 0.13 | 0.12 | 0.08 | 0.00 | 0.00 |
Total dividends, EURm(1)(2) | 730 | 676 | 449 | — | — |
Payout ratio(1) | 1.08 | 0.16 | 0.28 | — | — |
Dividend yield %(1) | 4.26 | 2.77 | 1.44 | — | — |
31 December | 2023 | 2022 | 2021 | 2020 | 2019 |
Shareholders’ equity per share, EUR | 3.72 | 3.82 | 3.08 | 2.22 | 2.73 |
Share price(3) | 3.05 | 4.33 | 5.57 | 3.15 | 3.30 |
Market capitalization, EURm | 16 853 | 24 192 | 31 409 | 17 701 | 18 476 |
(1)The Board of Directors proposes to the Annual General Meeting to be authorized to decide in its discretion on the distribution of
an aggregate maximum of EUR 0.13 per share as dividend from the retained earnings and/or as assets from the reserve for
invested unrestricted equity.
(2)In 2023, total dividends is calculated based on the proposed Annual General Meeting authorization to the Board of a maximum
distribution of EUR 0.13 per share for the financial year 2023, and the total number of shares on the date of issuing the financial
statements for 2023. On the date of issuing the financial statements for 2023 the total number of Nokia shares is 5 613 496 565.
Comparative amounts represent the actual total distribution to equity holders of the parent for the financial year presented.
(3)Closing Nokia share price at year end on Nasdaq Helsinki.
Share turnover
For the year ended 31 December | 2023 | 2022 | 2021 | 2020 | 2019 |
Number of shares traded during the year (000s)(1) | 7 754 279 | 10 294 615 | 16 560 334 | 13 903 762 | 11 003 630 |
Average number of shares excluding shares held by the Group during the year (000s) | 5 549 468 | 5 614 182 | 5 630 025 | 5 612 418 | 5 599 912 |
Share turnover % | 140 | 183 | 294 | 248 | 196 |
(1)Source: Nasdaq Helsinki, the NYSE composite tape and Euronext Paris.
The principal trading markets for the shares are Nasdaq Helsinki and Euronext Paris, in the form
of shares, and the NYSE, in the form of ADSs.
Share price development
Nasdaq Helsinki
EUR | High | Low | Value |
2023 Full year High/Low | 4.70 | 2.70 | |
2023 Full year Average (Volume-weighted) | 3.73 | ||
Year-end value 31 December 2023 | 3.05 | ||
Year-end value 31 December 2022 | 4.33 | ||
Change from 31 December 2022 to 31 December 2023 | (29.6)% |
New York Stock Exchange
USD | High | Low | Value |
2023 Full year High/Low | 5.04 | 2.94 | |
2023 Full year Average (Volume-weighted) | 4.05 | ||
Year-end value 31 December 2023 | 3.42 | ||
Year-end value 31 December 2022 | 4.64 | ||
Change from 31 December 2022 to 31 December 2023 | (26.3)% |
Euronext Paris
EUR | High | Low | Value |
2023 Full year High/Low | 4.70 | 2.70 | |
2023 Full year Average (Volume-weighted) | 3.76 | ||
Year-end value 31 December 2023 | 3.06 | ||
Year-end value 31 December 2022 | 4.34 | ||
Change from 31 December 2022 to 31 December 2023 | (29.5)% |
Business overview | Corporate governance | Operating and financial review and prospects | General facts on Nokia | Financial statements | Other information | 108 | |||||||
Shares and shareholders continued
Nokia Annual Report on Form 20-F 2023
Stock option exercises
Since 2019, Nokia has not administered any global stock option plans.
Dividend and share buybacks
The dividend to shareholders is Nokia’s principal method of distributing earnings to
shareholders. The dividend policy was updated at the Capital Markets Day in March 2021
to be “We target recurring, stable and over time growing ordinary dividend payments,
taking into account the previous year’s earnings as well as the company’s financial position
and business outlook”.
The Board of Directors proposes to the Annual General Meeting 2024 that based on the
balance sheet to be adopted for the financial year ended on 31 December 2023, no dividend
is distributed by a resolution of the Annual General Meeting. Instead, the Board of Directors
proposes to be authorized to resolve in its discretion on the distribution of an aggregate
maximum of EUR 0.13 per share as dividend from the retained earnings and/or as assets from
the reserve for invested unrestricted equity. The authorization would be used to distribute
dividend and/or assets from the reserve for invested unrestricted equity in four installments
during the authorization period, in connection with the quarterly results, unless the Board
of Directors decides otherwise for a justified reason. The proposed total authorization for
distribution of dividend and/or assets from the reserve for invested unrestricted equity is
in line with the Company’s dividend policy. The authorization would be valid until the opening
of the next Annual General Meeting. The Board would make separate resolutions on the
amount and timing of each distribution of dividend and/or assets from the reserve for
invested unrestricted equity.
Nokia’s Board of Directors has initiated a share buyback program under the current
authorization from the Annual General Meeting to repurchase shares, with purchases expected to
begin in the first quarter of 2024. The program targets to return up to EUR 600 million of cash
to shareholders in tranches over a period of two years, subject to continued authorization
from the Annual General Meeting.
In February 2022, Nokia’s Board of Directors initiated a share buyback program under the
authorizations from the Annual General Meetings 2021 and 2022 to repurchase shares to return
up to EUR 600 million of cash to shareholders in tranches over a period of two years. The first
phase of the share buyback program with a maximum aggregate purchase price of EUR 300
million started in February 2022 and ended in November 2022. The second EUR 300 million
phase of the share buyback program started in January 2023 and ended in November 2023.
The whole share buyback program has now been completed and the repurchased shares have
been cancelled.
We distribute distributable funds, if any, within the limits set by the Finnish Companies Act as
defined below. We make and calculate the distribution, if any, in the form of cash dividends,
assets from the reserve for invested unrestricted equity, share buybacks, or in some other form,
or a combination of these. There is no specific formula by which the amount of a distribution
is determined, although some limits set by law are discussed below. The timing and amount
of future distributions of retained earnings and/or assets from the reserve for invested
unrestricted equity, if any, will depend on our future results and financial conditions.
Under the Finnish Companies Act, we may distribute retained earnings and/or assets from the
reserve for invested unrestricted equity on our shares only upon a shareholders’ resolution
and subject to limited exceptions in the amount proposed by the Board. The amount of any
distribution is limited to the amount of distributable earnings of the Parent Company pursuant
to the last audited financial statements approved by our shareholders, taking into account the
material changes in the financial situation of the Parent Company after the end of the last
financial period and a statutory requirement that the distribution of earnings must not result
in insolvency of the Parent Company. Subject to exceptions relating to the right of minority
shareholders to request a certain minimum distribution, the distribution may not exceed the
amount proposed by the Board of Directors.
Purchases of equity securities by the Company and affiliated purchasers
The table below presents additional information on the purchases of treasury shares in 2023:
Period | Total number of shares purchased | Average price paid per share, EUR | Total number of shares purchased as part of publicly announced plans or programs | Maximum value of shares that may yet be purchased under the plans or programs, EUR |
January | 6 156 200 | 4.44 | 6 156 200 | 272 653 299 |
February | 5 991 500 | 4.40 | 5 991 500 | 246 290 179 |
March | 6 871 300 | 4.39 | 6 871 300 | 216 111 864 |
April | 5 556 000 | 4.19 | 5 556 000 | 192 858 651 |
May | 7 845 100 | 3.77 | 7 845 100 | 163 286 436 |
June | 7 725 400 | 3.83 | 7 725 400 | 133 733 303 |
July | 8 004 933 | 3.69 | 8 004 933 | 104 229 737 |
August | 9 117 690 | 3.55 | 9 117 690 | 71 835 889 |
September | 8 030 700 | 3.68 | 8 030 700 | 42 257 048 |
October | 9 510 000 | 3.26 | 9 510 000 | 11 213 435 |
November | 3 492 188 | 3.21 | 3 492 188 | — |
December | — | — | — | — |
Total | 78 301 011 | 3.83 | 78 301 011 | — |
Business overview | Corporate governance | Operating and financial review and prospects | General facts on Nokia | Financial statements | Other information | 109 | |||||||
Shares and shareholders continued
Nokia Annual Report on Form 20-F 2023
Shareholders
At 31 December 2023, shareholders registered in Finland represented approximately 26% and
shareholders registered in the name of a nominee represented approximately 74% of the total
number of shares of Nokia Corporation. The number of directly registered shareholders was
247 893 at 31 December 2023. Each account operator (12) is included in this figure as only one
registered shareholder.
Largest shareholders registered in Finland at 31 December 2023(1)
Shareholder | Total number of shares 000s | % of all shares | % of all voting rights |
Solidium Oy | 325 000 | 5.79 | 5.79 |
Keskinäinen Työeläkevakuutusyhtiö Varma | 80 236 | 1.43 | 1.43 |
Keskinäinen Eläkevakuutusyhtiö Ilmarinen | 75 227 | 1.34 | 1.34 |
Keskinäinen Työeläkevakuutusyhtiö Elo | 46 066 | 0.82 | 0.82 |
Valtion Eläkerahasto | 37 000 | 0.66 | 0.66 |
Oy Lival Ab | 17 310 | 0.31 | 0.31 |
Svenska Litteratursällskapet i Finland r.f. | 15 217 | 0.27 | 0.27 |
OP Finland Fund | 14 833 | 0.26 | 0.26 |
Nordea Bank Abp | 14 047 | 0.25 | 0.25 |
Sijoitusrahasto Seligson & Co | 13 639 | 0.24 | 0.24 |
(1)Excluding nominee registered shares and shares owned by Nokia Corporation. Nokia Corporation owned 76 437 051 shares at
31 December 2023.
Breakdown of share ownership at 31 December 2023(1)
By number of shares owned | Number of shareholders | % of shareholders | Total number of shares | % of all shares |
1–100 | 64 068 | 25.85 | 3 099 887 | 0.06 |
101–1 000 | 113 516 | 45.79 | 50 199 617 | 0.89 |
1 001–10 000 | 61 876 | 24.96 | 193 112 400 | 3.44 |
10 001–100 000 | 7 916 | 3.19 | 195 350 157 | 3.48 |
100 001–500 000 | 408 | 0.17 | 79 398 334 | 1.41 |
500 001–1 000 000 | 37 | 0.02 | 25 598 078 | 0.46 |
1 000 001–5 000 000 | 44 | 0.02 | 99 933 974 | 1.78 |
Over 5 000 000 | 28 | 0.01 | 4 966 804 118 | 88.48 |
Total | 247 893 | 100 | 5 613 496 565 | 100 |
(1)The breakdown covers only shareholders registered in Finland, and each account operator (12) is included in the number of
shareholders as only one registered shareholder. As a result, the breakdown is not illustrative of the entire shareholder base
of Nokia.
By nationality | % of shares |
Non-Finnish shareholders | 74.45 |
Finnish shareholders | 25.55 |
Total | 100.00 |
By shareholder category (Finnish shareholders) | % of shares |
Corporations | 3.37 |
Households | 7.79 |
Financial and insurance institutions | 2.80 |
Non-profit organizations | 1.23 |
Governmental bodies (incl. pension insurance companies) | 10.36 |
Total | 25.55 |
At 31 December 2023, a total of 673 777 277 ADSs (equivalent to the same number of shares
or approximately 11.8% of the total shares) were outstanding and held of record by 95 655
registered holders in the United States. We are aware that many ADSs are held of record by
brokers and other nominees, and accordingly the above number of holders is not necessarily
representative of the actual number of persons who are beneficial holders of ADSs or the
number of ADSs beneficially held by such persons. Based on information available from
Broadridge Financial Solutions, Inc., the number of beneficial owners of ADSs at 31 December
2023 was 753 324.
Based on information known to us as of 2 February 2024, at 31 December 2023, BlackRock, Inc.
beneficially owned 372 591 440 Nokia shares, which at that time corresponded to approximately
6.6% of the total number of shares and voting rights of Nokia.
To the best of our knowledge, Nokia is not directly or indirectly owned or controlled by any other
corporation or any government, and there are no arrangements that may result in a change of
control of Nokia.
Shares owned by the members of the Board and the Group Leadership Team
At 31 December 2023, the members of our Board and the Group Leadership Team held a total
of 5 140 152 shares and ADSs in Nokia, which represented approximately 0.09% of our shares
and total voting rights excluding shares held by the Nokia Group.
Offer and listing details
Our capital consists of shares traded on Nasdaq Helsinki under the symbol “NOKIA” and Euronext
Paris under the symbol “NOKIA”. Our ADSs, each representing one of our shares, are traded on
the NYSE under the symbol “NOK”. The ADSs are evidenced by American Depositary Receipts
(ADRs) issued by Citibank, N.A.
Business overview | Corporate governance | Operating and financial review and prospects | General facts on Nokia | Financial statements | Other information | 110 | |||||||
Shares and shareholders continued
Nokia Annual Report on Form 20-F 2023
Articles of Association
Articles of Association
Amendment of our Articles of Association requires a resolution
of the general meeting of shareholders, supported by two-
thirds of the votes cast and two-thirds of the shares
represented at the meeting.
Registration
Nokia Corporation is organized under the laws of the Republic
of Finland and registered in the Finnish Trade Register under
business identity code 0112038-9. Under its current Articles of
Association, Nokia’s corporate purpose is to research, develop,
manufacture, market, sell and deliver products, software and
services in a wide range of consumer and business-to-business
markets. These products, software and services relate to,
among others, network infrastructure for telecommunication
operators and other enterprises, the internet of things, human
health and wellbeing, multi-media, big data and analytics,
mobile devices and consumer wearables and other electronics.
The company may also create, acquire and license intellectual
property and software as well as engage in other industrial and
commercial operations, including securities trading and other
investment activities. The company may carry on its business
operations directly, through subsidiary companies, affiliate
companies and joint ventures.
Directors’ voting powers
Under Finnish law, resolutions of the Board shall be made
by a majority vote. A director shall refrain from taking any part
in the consideration of an agreement between the director
and the company or third party, or any other issue that may
provide any material benefit to him or her, which may be
contradictory to the interests of the company. Under Finnish
law, there is no age limit requirement for directors, and there
are no requirements under Finnish law that a director must
own a minimum number of shares in order to qualify to act
as a director. However, in accordance with the current
Company policy, approximately 40% of the annual fee payable
to the Board members is paid in Nokia shares purchased from
the market or alternatively by using treasury shares held by
Nokia, and the directors shall retain until the end of their
directorship such number of shares that corresponds to the
number of shares they have received as Board remuneration
during their first three years of service (the net amount
received after deducting those shares used for offsetting any
costs relating to the acquisition of the shares, including taxes).
Share rights, preferences and restrictions
Each share confers the right to one vote at general meetings.
According to Finnish law, a company generally must hold an
Annual General Meeting called by the Board within six months
from the end of the financial year. Additionally, the Board is
obliged to call an Extraordinary General Meeting whenever such
meeting is deemed necessary, or at the request of the auditor
or shareholders representing a minimum of one-tenth of all
outstanding shares. Under our Articles of Association, the
Board is elected at least annually at the Annual General Meeting
of shareholders for a term ending at the end of the next
Annual General Meeting.
Under Finnish law, shareholders may attend and vote at
general meetings in person or by proxy. It is not customary
in Finland for a company to issue forms of proxy to its
shareholders. Accordingly, Nokia does not do so. However,
registered holders and beneficial owners of ADSs are issued
forms of proxy by the Depositary.
To attend and vote at a general meeting, a shareholder must
be registered in the register of shareholders in the Finnish
book-entry system on or prior to the record date set forth
in the notice of the general meeting. A registered holder
or a beneficial owner of the ADSs, like other beneficial owners
whose shares are registered in the Company’s register
of shareholders in the name of a nominee, may vote with
their shares provided that they arrange to have their name
entered in the temporary register of shareholders for the
general meeting.
The record date is the eighth business day preceding the
meeting. To be entered in the temporary register of
shareholders for the general meeting, a holder of ADSs must
provide the Depositary, or have his or her broker or other
custodian provide the Depositary, on or before the voting
deadline, as defined in the proxy material issued by the
Depositary, a proxy with the following information: the name,
address, and social security number or another corresponding
personal identification number of the holder of the ADSs,
the number of shares to be voted by the holder of the ADSs
and the voting instructions. The register of shareholders as
of the record date of each general meeting is public until the
end of the respective meeting. Other nominee registered
shareholders can attend and vote at general meetings by
instructing their broker or other custodian to register the
shareholder in Nokia’s temporary register of shareholders
and give the voting instructions in accordance with the broker’s
or custodian’s instructions.
By completing and returning the form of proxy provided by
the Depositary, a holder of ADSs also authorizes the Depositary
to give notice to us, required by our Articles of Association,
of the holder’s intention to attend the general meeting.
The rights of shareholders are related to the shares as
set forth in the Finnish Companies Act and our Articles of
Association. Neither Finnish law nor our Articles of Association
set limitations on the rights to own Nokia securities, including
the rights of foreign shareholders to hold or exercise voting
rights in the said securities. Amendment of the Articles of
Association requires a decision of the general meeting of
shareholders, supported by two-thirds of the votes cast
and two-thirds of the shares represented at the meeting.
Each of our shares confers equal rights to share in the
distribution of the Company’s funds. Under Finnish law,
dividend entitlement lapses after three years if a dividend
remains unclaimed for that period, in which case the
unclaimed dividend will be recognized as income by Nokia.
Business overview | Corporate governance | Operating and financial review and prospects | General facts on Nokia | Financial statements | Other information | 111 | |||||||
Articles of Association
Nokia Annual Report on Form 20-F 2023
Disclosure of shareholder ownership or
voting power
According to the Finnish Securities Market Act, a shareholder
shall disclose his or her ownership or voting power to the
company and the Finnish Financial Supervisory Authority when
the ownership or voting power reaches, exceeds or falls below
5, 10, 15, 20, 25, 30, 50 or 90% of all the shares or the voting
rights. The term “ownership” includes ownership by the
shareholder, as well as selected related parties, and calculating
the ownership or voting power covers agreements or other
arrangements, which when concluded would cause the
proportion of voting rights or number of shares to reach,
exceed or fall below the aforementioned limits. Upon receiving
such notice, the company shall disclose it by a stock exchange
release without undue delay.
Purchase obligation
Our Articles of Association require a shareholder that holds
one-third or one-half of all of our shares to purchase the
shares of all other shareholders that so request. A shareholder
who becomes subject to the purchase obligation is also
obligated to purchase any subscription rights, stock options
or convertible bonds issued by the company if so requested
by the holder. The purchase price of the shares under our
Articles of Association is the higher of: (a) the weighted average
trading price of the shares on Nasdaq Helsinki during the ten
business days prior to the day on which we have been notified
by the purchaser that its holding has reached or exceeded
the threshold referred to above or, in the absence of such
notification or its failure to arrive within the specified period,
the day on which our Board otherwise becomes aware of this;
or (b) the average price, weighted by the number of shares,
which the purchaser has paid for the shares it has acquired
during the last 12 months preceding the date referred to in (a).
Under the Finnish Securities Market Act, a shareholder whose
voting power exceeds 30% or 50% of the total voting rights
in a company shall, within one month, offer to purchase the
remaining shares of the company, as well as any other rights
entitling to the shares issued by the company, such as
subscription rights, convertible bonds or stock options issued
by the company. The purchase price shall be the market price
of the securities in question. Subject to certain exceptions,
the market price is determined on the basis of the highest
price paid for the security during the preceding six months
by the shareholder or any party in close connection to the
shareholder. Subject to certain exceptions, if the shareholder
or any related party has not during the six months preceding
the offer acquired any securities that are the target for the
offer, the market price is determined based on the average
of the prices paid for the security in public trading during the
preceding three months weighted by the volume of trade.
Under the Finnish Companies Act, a shareholder whose holding
exceeds nine-tenths of the total number of shares or voting
rights in Nokia has both the right and, upon a request from the
minority shareholders, the obligation to purchase all the shares
of the minority shareholders for the then current market price.
The market price is determined, among other things, on the
basis of the recent market price of the shares. The purchase
procedure under the Finnish Companies Act differs, and the
purchase price may differ, from the purchase procedure and
price under the Finnish Securities Market Act, as discussed
above. However, if the threshold of nine-tenths has been
exceeded through either a mandatory or a voluntary public
offer pursuant to the Finnish Securities Market Act, the market
price under the Finnish Companies Act is deemed to be the
price offered in the public offer, unless there are specific
reasons to deviate from it.
Pre-emptive rights
In connection with any offering of shares, the existing
shareholders have a pre-emptive right to subscribe for
shares offered in proportion to the amount of shares in
their possession. However, a general meeting of shareholders
may vote, by a majority of two-thirds of the votes cast and
two-thirds of the shares represented at the meeting, to waive
this pre-emptive right provided that, from the company’s
perspective, weighty financial grounds exist.
Monitoring of Foreign Corporate
Acquisitions
Under the Finnish Act on the Monitoring of Foreign Corporate
Acquisitions (2012/172 as amended), a notification to the
Ministry of Economic Affairs and Employment is required for a
non-resident of Finland, directly or indirectly, when acquiring
one-tenth or more of the voting power or corresponding
factual influence in a company. The Ministry of Economic Affairs
and Employment has to confirm the acquisition unless the
acquisition would jeopardize important national interests, in
which case the matter is referred to the Council of State. If the
company in question is operating in the defense sector, an
approval by the Ministry of Economic Affairs and Employment is
required before the acquisition is made. These requirements
are not applicable if, for instance, the voting power is acquired
in a share issue that is proportional to the holder’s ownership
of the shares. Moreover, the requirements do not apply to
residents of countries in the European Economic Area or
EFTA countries, except where at least one-tenth of shares
or other controlling right in such resident are held by a party
not resident in the European Economic Area or EFTA.
Business overview | Corporate governance | Operating and financial review and prospects | General facts on Nokia | Financial statements | Other information | 112 | |||||||
Articles of Association continued
Nokia Annual Report on Form 20-F 2023
Risk factors
Set forth below is a description of risk factors that could
affect our business. Shareholders and potential investors
should carefully review the following risk factors, in
addition to other information contained in this report.
The risk factors described below should not be construed
as exhaustive. There may be additional risks that are
unknown to us, and other risks currently believed to
be immaterial that could turn out to be material.
These risks, either individually or collectively, could adversely
affect our business, competitiveness, market share, sales,
costs, expenses, results of operations, profitability, financial
condition, liquidity, reputation, brand and share price. Unless
otherwise indicated or the context otherwise requires,
references in these risk factors to “Nokia”, the “Nokia Group”,
“Group”, “we”, “us” and “our” mean Nokia’s consolidated
operating segments. Certain risks or events may be more
prevalent with respect to the Group or a certain business
group, business or part of the Group.
In evaluating the risks, one should not rely exclusively on the
bullets in the below summary but read the full risk factor
discussion. This report also contains forward-looking
statements that involve risks and uncertainties presented
in “Forward-looking statements” above.
Risk factors summary
Our capability to compete as a trusted partner for critical
networks, and remain a leading provider of technology,
software and services in the industries and markets in which we
operate, is dependent on multiple external and internal factors,
partially outside our control, such as:
Risks related to our strategy and its execution
■Sustained traffic growth over customers’ networks,
introduction of new use cases and low-latency services to
drive the demand for our products;
■Reaching technology limits in key technologies which might
change demand patterns for our products and competitive
dynamics;
■Trends, such as cloudification, Open RAN and openness in
general, virtualization and disaggregation with potential
impact on our portfolio of products and services, competitive
landscape, business models and our margin profile;
■The degree our investments, including venture funds,
result in technologies, products or services that achieve or
retain broad or timely market acceptance, answer to the
expanding needs or preferences of our customers or
consumers, or in breakthrough innovations, research assets,
digitalization and intellectual property that we could
otherwise utilize for value creation;
■Our success in acquiring or divesting businesses and
technologies, integrating acquisitions, entering into
licensing arrangements, forming and managing joint
ventures or partnerships and in realizing the anticipated
benefits, synergies, cost savings or efficiencies from these
transactions;
■Our success in continuing to improve our organizational and
operational structure for increased operational efficiency,
executing our business plans and business models, in
identifying and implementing the appropriate measures to
improve cost-efficiency and in managing the inflationary
pressure on costs in order to continue investments in R&D
and future capabilities, including 5G-Advanced and 6G,
enterprise, cloud, security, automation, digitalization, and
development of new standard essential patents; and
■Our ability to meet our sustainability targets, including with
respect to our greenhouse gas emission commitments, and
to comply with stakeholder expectations and increasing
number of regulations regarding sustainability activities
and disclosures.
Surrounding economic, financial and competitive
environment
■General economic and financial market conditions, such as
high inflation, increased global macroeconomic uncertainty,
major currency fluctuations, higher interest rates and
financing costs, and other developments in the economies
and industries where we, our customers, partners and
suppliers operate, including the ongoing situations in
Ukraine and the Middle East;
■The cyclical nature of the markets in which we operate,
competitor behavior, technological changes and the speed
of technological adoption, customer consolidation, the
number of competent suppliers, customer purchasing
and spending appetite and behavior, deployments and
rollout timing;
■High inflation and our ability to pass increased costs to
our pricing;
■Price erosion largely driven by competition challenging the
connectivity business models of our customers;
■Our dependency on a limited number of customers and
large multi-year agreements;
■Competitiveness of, or developments regarding, pricing and
agreement terms we offer, including developments with
respect to customer financing or extended payment terms
or credit lines that we provide our customers; and
■Willingness of banks or other institutions to purchase
our receivables.
Our competitiveness
■Our ability to adapt to changing business models,
technological changes and to meet new competition;
■Our ability to invest in new competitive high-quality
products and services, such as 5G-Advanced, Open RAN, 6G,
the Internet of Things (IoT), the cloud or software, upgrades
and technologies that have accurately anticipated
technological, regulatory and market trends;
■Our success in the development of new technologies
and services, their rollout and commercialization in
a timely manner;
■Our capabilities to manage end-to-end costs related to
our portfolio of products and services;
Business overview | Corporate governance | Operating and financial review and prospects | General facts on Nokia | Financial statements | Other information | 113 | |||||||
Risk factors
Nokia Annual Report on Form 20-F 2023
■Severity of inefficiencies, incidents, malfunctions or
disruptions of our information technology systems and
processes or disruptions of services relying on our own or
third-party IT, including cybersecurity threats and incidents;
■Actual or perceived security or privacy breaches, as well as
defects, errors or vulnerabilities in our technology and that
of third-party providers;
■Our manufacturing, service creation, delivery, logistics or
supply chain to operate without significant interruptions or
shortages, including the impacts of geopolitical tensions
and open conflicts feeding uncertainty in the global
supply chain;
■Performance capabilities of our partners and suppliers, and
their high standards to meet product quality, health, safety
or security requirements or comply with other regulations
or local laws, such as environmental or labor laws;
■Natural or man-made disasters, military actions, wars, labor
unrest, civil unrest or health crises, such as another global
pandemic, impacting our service delivery or production
sites or the production sites of our suppliers, which are
geographically concentrated; and
■Our ability to retain, develop, reskill and recruit appropriately
skilled employees in the right activities and locations.
Intellectual property rights, technology and brand
licensing
■Our ability to create new relevant technologies, products
and services through our R&D, as well as our ability to
protect our innovations and to maintain the strength of our
intellectual property portfolio;
■Our ability to monetize our intellectual property for
instance, due to market, regulatory and other
developments, or court rulings in intellectual property-
related litigation and other disputes;
■Uncertainty relating to the evolving global regulatory and
standardization landscape relating to intellectual property;
■Developments in the concentrated smartphone market, the
source of a significant portion of our patent licensing income;
■Success and profitability of technology licensing, brand
licensing and other business ventures, including venture
fund investments where the valuation and proceeds of our
venture fund investments may fluctuate;
■Our ability to renew existing license agreements and
conclude new license agreements regarding our intellectual
property that we license to others on acceptable commercial
terms, and the timing, cost, and potential need for litigation
to achieve such renewals and new license agreements;
■Claims that we have allegedly infringed third parties’ IPR; and
■Our ability to renew or finalize licenses regarding
technologies that are licensed to us on acceptable
commercial terms.
Geopolitical, legal, regulatory and compliance
environment
■Direct and indirect regulation and political developments
affecting trade, taxation, national security, competition law,
export controls and sanctions, cyber security, supply chains,
environmental, social and governance topics and anti-
corruption;
■Geopolitical tensions, escalations or expansions into open
conflicts, such as potential further developments related to
the situations with Russia and Ukraine or in Gaza, risks
related to increasing tensions in the Red Sea and the South
China Sea;
■Changes in existing regulations or in their application, and
emerging new regulations applicable to current or new
technologies, products or telecommunications and
technology sectors in general impacting our products,
services or business;
■Our products, services and operations meeting all relevant
quality, health, safety or security standards and other
recommendations and regulatory requirements globally;
■Compliance with laws and regulations relating to privacy,
data protection, and the protection or transfer of personal
data;
■Disruptiveness of litigation, arbitration or agreement-
related disputes, and inspections, investigations, claims,
and government proceedings which we may be subject to
at any given time due to the global nature of our business;
■Our ability to maintain an effective system of governance
and compliance processes, disclosure controls and internal
control over financial reporting and influence those of third
parties whose performance we may be held liable for;
■The degree of control and level of influence in the joint
ventures where Nokia is the minority partner and other
affiliated companies where Nokia does not have direct
management control, or which are not fully integrated
into its operational infrastructure; and
■Damage caused to existing undersea infrastructure
during installation or maintenance of undersea
telecommunications cable networks.
Financial and tax-related uncertainties
■Complex tax laws and rules, including any changes in the
aforesaid, as well as diverse tax authority practices and
interpretations;
■Our ability to utilize our tax attributes and deferred tax
assets;
■Access to sources of funding on favorable terms or at all;
■Our ability to maintain our credit ratings;
■Exchange rate fluctuations impacting our net sales, costs
and results of operations, as well as the US dollar value
of our dividends and market price of our ADSs;
■Our pension and other post-employment benefit
obligations and the potential need for increased funding;
and
■Recoverability of the carrying amount of our goodwill,
which could result in significant impairment charges.
Ownership of our shares
■Uncertainty of the amount of dividend and/or repayment
of capital and other profit distributions such as share
buybacks to shareholders for each financial period;
■Volatility of the trading price of our shares and ADSs,
including as a result of factors outside our control; and
■Potential requirement of non-Finnish shareholders
to provide detailed information in order to obtain
advantageous withholding tax treatment for dividends.
Business overview | Corporate governance | Operating and financial review and prospects | General facts on Nokia | Financial statements | Other information | 114 | |||||||
Risk factors continued
Nokia Annual Report on Form 20-F 2023
Full risk factor discussion
Risks related to our strategy and its execution
We may be unable to successfully implement our strategic
plans, sustain or improve the operational and financial
performance of our business groups, correctly identify or
successfully pursue business opportunities, correctly
anticipate or successfully mitigate technological disruptions
that have adverse effects on our business, or otherwise grow
our business.
Our success is dependent on our ability to become and remain
a leading provider of technology, software and services in the
industries and markets in which we operate. However, there
can be no assurance that we will correctly identify trends,
opportunities or threats to pursue or mitigate to be able to
achieve the goals or targets we have set. For example, our
plans assume sustained growth in traffic over our customers’
networks. For this to happen, video streaming needs to
continue to grow significantly or new high-data use cases (for
instance, Virtual Reality or Augmented Reality) need to be
developed and drive high concurrency traffic. We also assume
a growing number of use cases and demand for low latency
services. Should these not materialize, demand for our
products and services might be negatively affected.
Our path to continued technology leadership lies in long-term
research and development to drive innovation across a
comprehensive portfolio of network equipment, software,
services and licensing. We are investing, for instance, in 5G-
Advanced and 6G research, security and development of new
standard-essential patents. The R&D of innovative products,
services and technologies is a complex and uncertain process
and there can be no assurance that our investments will result
in technologies, products or services that achieve or retain
broad or timely market acceptance, are commercially
successful, answer to the expanding needs or preferences of
our customers or consumers, or breakthrough innovations that
we could otherwise utilize for value creation. As an example,
while we believe that the progress of cloudification and open
RAN and openness in general creates an opportunity for us to
differentiate with our products and to serve our customers
better, it may lead to entry of new competitors with different
business models to build multi-vendor RAN networks. The
virtualization and cloudification of core and radio networks
and the convergence of IT and telecommunications may
lower barriers of entry for IT and webscale companies in the
traditional telecommunications industry or they may build up
tight strategic partnerships with our traditional competitors or
our communications service provider customers. The enhanced
competition might result in increased price competition and
negatively affect our margins. Virtualization and disaggregation
might also affect other parts of our portfolio and lead to
changes in competitive landscape, business models, and
margin profile. Also, reaching certain technology limits, for
example in Optical or in spectral efficiency gains in 6G, might
adversely change the demand pattern and competitive
dynamics for our products and services. We see the network as
the key enabler of metaverse opportunities, but the network
capabilities will need to evolve to fulfill the anticipated needs.
We implement our strategic plans, for instance, by entering into
licensing arrangements, partnering with third parties and may
engage in possible transactions, such as acquisitions, mergers,
joint ventures or minority investments that could complement
or improve our existing operations or technologies and enable
us to grow our business. We also engage to divestitures of our
existing businesses or operations in order to sharpen our
business focus. Additionally, we may make investments in
certain investment funds, including NGP Capital, that invest in
other companies. There can be no assurance that our efforts
to continuously improve our operations and efficiencies will or
continue to generate the expected results or improvements or
that we will achieve intended targets or financial objectives
related to such efforts. For instance, the underlying rationale
or the business case in terms of profits, revenue, strategic
impact or otherwise justifying the creation or continuation of
the arrangement may not be realized. We may also encounter
issues or inefficiencies related to our organizational and
operational structure, including being unable to successfully
implement the business plans. Also, the planned transactions
may not ultimately be completed on favorable terms or at all,
or transactions may result in liabilities. Transactions may result
in claims between the parties such as indemnification or breach
of contract claims, which can consume time and management
attention, and the outcome of any claims related to
transactions may be difficult to predict. Furthermore, our initial
assumptions may be incorrect in evaluating a transaction or we
may fail or be unable to discover or identify significant matters
during the course of performing our due diligence. Therefore,
we may be exposed to unknown, larger or contingent liabilities
of acquired businesses, such as those related to contractual
obligations, taxes, pensions, environmental liabilities, disputes
and compliance matters.
Performance failures of our partners, as well as failures to
agree to partnering arrangements with third parties could
adversely affect us.
We are increasingly collaborating and partnering with third
parties to develop technologies, products and services,
as well as seeking new revenue streams through partnering
arrangements. We also depend on partners in our efforts to
monetize our brands and technologies, including those of Nokia
and Nokia Bell Labs, and we have outsourced various functions
to third parties and are relying on them to provide certain
services to us. Furthermore, according to our technology vision
for 2030, the opportunities of the metaverse will be realized by
a multi-party value ecosystem developed around collaboration,
co-innovation and partnering. Although the objective of the
collaborative and partnering arrangements is a mutually
beneficial outcome for each party, our ability to introduce and
provide technologies, products and services in a timely manner
and so that those are commercially viable and meet our,
our customers’ and consumers’ quality, safety, security and
other standards could be hampered by performance or other
failures of our partners or the companies we collaborate with.
For instance, if a partner acts inconsistently with our ethical,
sustainability, compliance, brand, or quality standards, this
can negatively affect our reputation, the value of our brand
and the business outcome of our partnerships. Furthermore,
if we fail altogether to achieve the collaboration or partnering
arrangements needed to succeed, we may be unable to bring
our products, services or technologies to market successfully
or in a timely manner. It is also possible that the parties we
currently collaborate with, turn into our competitors.
In many areas, including IT, finance and human resources-
related arrangements, a failure to maintain an efficient
relationship with the selected partner may lead to ongoing
operational problems or even to severe business disruptions,
and the availability of the processes and services upon which
we rely may be interrupted. Performance problems may
result in missed reporting deadlines, internal controls
challenges, financial losses, missed business opportunities and
reputational harm. In addition, as management’s focus shifts
from a direct to an indirect operational control in these areas,
there is a risk that without active management and monitoring
of the relationship, the services provided may be below
appropriate quality standards. Partners may not meet agreed
service levels, in which case, depending on the impacted
service, our contractual remedies may not fully cure all of
the damages we may suffer. This is particularly true for any
Business overview | Corporate governance | Operating and financial review and prospects | General facts on Nokia | Financial statements | Other information | 115 | |||||||
Risk factors continued
Nokia Annual Report on Form 20-F 2023
deficiencies that would impact the reporting requirements
applicable to us as a company listed on multiple stock
exchanges. In outsourcing projects, we may encounter
disruption to business resulting from broken processes and
distraction of our employees that may need to train the
partner’s staff or be trained in the partner’s systems.
Adjustments to staff size and transfer of employees to the
partner’s companies could have an adverse effect on us, for
instance through impacting the morale of our employees
and raising complex labor law issues and resulting in the loss
of key personnel. Additionally, partnering and outsourcing
arrangements can create a dependency on the outsourcing
company, causing issues in our ability to learn from day-to-day
responsibilities, gain hands-on experience, adapt to changing
business needs and properly transfer the specific know-how to
the new outsourcing partners. Concerns could equally arise
from giving third parties access to confidential data, strategic
technology applications and books and records. There is also a
risk that we may not be able to determine whether controls
have been effectively implemented, and whether the partner
company’s performance-monitoring reports are accurate.
Our efforts aimed at managing and improving our financial
or operational performance may not lead to targeted results,
benefits, cost savings or improvements in our competitiveness.
We are continuously targeting increased efficiency of our
operations. In October 2023, we announced strategic and
operational changes to our business and a program to reset
our cost base while protecting our R&D capacity and
commitment to technology leadership. The program targets to
lower our cost base on a gross basis (i.e. before inflation) by
between EUR 800 million and EUR 1 200 million by the end of
2026 compared to 2023 assuming on-target variable pay in
both periods.
Failure by us to determine the appropriate operational
structure, prioritization of operating expenses and other costs,
to identify and implement the appropriate measures to
increase simplicity and improve cost-efficiency, or to maintain
achieved efficiency levels, could limit our future investments
and have a material adverse effect on our competitiveness,
results of operations and financial condition. Our current
and future cost-saving measures may be costly, potentially
disruptive to operations, and may not lead to sustainable
improvements in our overall competitiveness and profitability
and there can be no assurance that such measures will be met
as planned in contemplated timeframes or at all. Our plans
may be altered in the future, including adjusting any projected
financial or other targets. The anticipated costs or the level
of disruption expected from implementing such plans or
restructurings may be higher than expected. Efforts to plan
and implement cost-saving initiatives may divert management
attention from the rest of the business and adversely affect
our business.
There are also several other factors that may prevent or delay
a successful implementation of any cost-saving or efficiency
improvement initiatives, including, among others, the following:
■the need to make additional investments in other areas
such as 5G-Advanced and 6G, enterprise, security, cloud,
development of new standard essential patents and
automation/digitalization of services and our own
operations;
■inaccuracy in our expectations with respect to market
growth, customer demand and other trends;
■legislative constraints or unfavorable changes in legislation
in the markets in which we operate influencing timing, costs
and expected savings of certain contemplated initiatives;
■our ability to align and adjust resources, systems and tools,
including digitalization and automation of processes,
related to implementation of planned organizational
changes;
■intended business plans may require us to inform or
consult with employees and labor representatives, and such
processes may influence the timing, costs and extent of
expected savings and the feasibility of certain
contemplated initiatives;
■accelerating inflation driving increase in cost base; and
■bargaining power of our suppliers which may prevent us
from achieving targeted procurement savings.
Furthermore, cost-saving initiatives may negatively affect
our ability to develop new or improve existing products and
compete effectively in certain markets, and there is no
guarantee that we will continue to be able to successfully
innovate or remain technologically competitive.
We may be subject to increased scrutiny related to our
sustainability activities and disclosures, and our reputation
and brand as well as the willingness of customers and
suppliers to do business with us could be harmed if we fail to
meet our sustainability goals.
Our business could be negatively impacted by a failure to
appropriately address existing and emerging matters relating
to sustainability and good corporate citizenship. We may fail
or be unable to fully achieve one or more of our sustainability
targets, such as our greenhouse gas emission commitments,
due to a range of factors within or beyond our control, and we
may adjust or modify our targets in light of new information,
adjusted projections, or a change in business strategy, any of
which could negatively impact our brand, reputation, and
business. It is also possible that stakeholders may not be
satisfied with our sustainability disclosures, targets and
practices or the speed of their adoption which could result in
action against Nokia by regulators or other third parties or
negative pressure on us or our stock.
The ESG regulatory environment is complex and fast-moving
with new standards proposed or adopted by various regulators
around the world, the applicability of which to Nokia needs to
be constantly and consistently evaluated. A failure to, or
perception of a failure to, adapt, disclose metrics and set
targets that are rigorous enough or in an acceptable format
or otherwise in compliance with applicable regulations, or to
prioritize the most relevant sustainability actions and targets,
could negatively impact our ESG-related third-party ratings,
brand, reputation, and business. It is also possible that third
parties rating our ESG practices and performance may make
unfavorable, inaccurate or unsubstantiated interpretations of
our ESG practices and performance based on their own
assessments and publish such interpretations with or without
offering us the possibility to comment. We could also incur
additional costs and require additional resources to address
evolving regulatory requirements and to monitor and report
on our sustainability performance programs, and those of our
value chain partners, as required, and to comply with various
sustainability practices and disclosure requirements. The lack
of global standardization in the way data disclosures should be
made is making ESG-related reporting difficult, which may
contribute to challenges for investors to correctly assess
disclosures or our ability to comply with each disclosure
requirement. In addition to this, the challenge of data
collection may affect our ability to accurately evaluate climate-
and other ESG-related risks and identify and implement
strategies for long-term resilience. Furthermore, we foresee
that the global rate of technology adoption will be partially
driven by sustainability matters such as governance, security
Business overview | Corporate governance | Operating and financial review and prospects | General facts on Nokia | Financial statements | Other information | 116 | |||||||
Risk factors continued
Nokia Annual Report on Form 20-F 2023
and energy efficiency in the longer term. Our failure, or
perceived failure, to meet sustainability disclosure regulations,
standards, practices or sustainability targets could result in
legal sanctions, as well as negatively impact our reputation,
employee retention, access to financing and the willingness
of our customers and suppliers to do business with us.
Risks related to the general economic and financial
market conditions and to the industries and markets
in which we operate
Our sales and profitability have been and may in the future
be materially and adversely affected by general economic and
financial market conditions, such as accelerating inflation,
increased global macroeconomic uncertainty, major currency
fluctuations, higher interest rates and financing costs, and
other developments in the economies where we operate.
We are a company with global operations with sales, R&D,
manufacturing facilities, partners and suppliers located in
various countries around the world. Adverse developments in
and the general weakness of global economic conditions has
had an adverse effect on us and the spending of our customers
during the past year. For instance, the uncertain nature,
magnitude, and duration of hostilities stemming from Russia’s
military invasion of Ukraine, including the potential effects of
sanctions limitations, retaliatory cyber-attacks on the world
economy and markets, or any other geopolitical escalation,
for instance in the Middle East or Taiwan, could contribute to
increased market volatility and uncertainty, which could have
an adverse impact on macroeconomic factors affecting market
demand, inflationary development and supply.
Any adverse developments in economies, such as increases
in the level of inflation, interest rates or unemployment,
may affect demand for consumables, such as mobile devices,
mobile subscriptions and both the services that end-users
subscribe to and the usage levels of such services, which may
lead communications service providers to invest less in related
infrastructure and services or to invest in low-margin products
and services. This may further be mirrored as an adverse
effect on the business of our patent, technology or brand
licensees and our patent licensing income. Likewise, adverse
developments in economic conditions may lead certain
customer segments, such as webscale companies,
transportation & logistics, energy, manufacturing, and public
sector verticals, to invest less or delay spend in infrastructure
and services to digitize their operations or to invest in low-
margin products and services. Further, the purchasing power of
our customers, particularly in developing markets, depends to a
greater extent on the price development of basic commodities
and currency fluctuations, which may render our products or
services unaffordable. Economic slowdown may also lead to an
overcapacity in supply and inflated inventories, and to delays
and shortages in case of sharp recovery and ramp-up of
demand with a potentially adverse effect on our ability and
our suppliers’ ability to deliver products and services in time.
Increasing inflation and other current market conditions are
driving cost increases in operations, materials and labor and
may also result in strikes and other industrial actions.
General uncertainty and adverse developments in the financial
markets could have a material adverse effect on our, our
customers’, suppliers’ and other partners’ ability to obtain
sufficient or affordable financing on satisfying terms. Higher
interest rates have increased the cost of financing. Uncertain
market conditions may further increase the price of financing
or decrease its availability if the banks and investors were to
tighten lending standards or increase interest rates, or if
certain assets would decline in value, which could lead to
difficulties in raising funds or accessing liquidity necessary
to maintain our financial condition and ongoing operations.
We face intense competition and are dependent on
development of the industries and markets in which we
operate. The markets are cyclical and are affected by many
factors, including the general economic environment,
technological changes or the speed of technological adoption,
competitor behavior, customer consolidation, customers’
purchasing and spending appetite and behavior, including mix
of supply, deployments and rollout timing. Our existing
competition and new competition challenging the connectivity
business models of our customers are driving price erosion.
The competitive environment in the markets in which
we operate, including the related services markets, is
characterized by maturing industry technologies, 5G and
related new technologies, diversification of supplier
ecosystems, equipment price erosion and aggressive price
competition. Our competition endeavors to gain market share
in selected regions where Nokia has a large footprint. Despite
strong growth in mobile data traffic, most of our customer
base has been facing persistent erosion in unit revenue and is
reverting to vendors to compensate for it. Competition for new
customers, as well as for new infrastructure deployment, is
particularly intense and focused on the favorability of price and
agreement terms. We compete with companies that have large
overall scale, which affords such companies more flexibility
compared to us. In addition, new competition may be entering
the network infrastructure and related services business
through adoption of new technologies or business models,
such as virtualized RAN and Open RAN or as-a-service models
for products or services.
We are particularly dependent on the investments made by
communications service providers in mobile connectivity,
network infrastructure and related services. The pace and size
of such investments are in turn dependent on the ability of
communications service providers to increase their subscriber
numbers, reduce churn, maintain or increase their average
revenue per user, and compete with business models eroding
revenue from traditional voice, messaging and data transport
services, as well as the financial condition of such service
providers. Their cost containment actions and merger activity
have in the past constricted capital expenditure, and may
continue to do so in the future, resulting in further competition
and pressure on pricing and profitability. In addition, the
investments of the communications service providers in the
new spectrum assets may reduce their funds available for
investing in the new network infrastructure and related
services. Furthermore, the level of demand by communications
service providers and other customers that purchase our
products and services is dependent on their ability to monetize
their investment and introduce new use cases and can
therefore change quickly and vary over short periods of time.
Communications service providers may also consolidate their
supplier base to our disadvantage — all the way to a one-
supplier model, for instance in a specific product area. A
portion of our revenues is driven by the timing of completion
and customer acceptances. As a result of the uncertainty and
variations in the telecommunications and vertical industries,
accurately forecasting revenues, results and cash flow remains
difficult. Furthermore, significant reduction of business with us
could result in the loss of benefits related to economies of scale.
We may be unable to respond successfully to technological
changes in the markets in which we operate. Market
developments favoring new technological solutions, such as
Software Defined Networks (SDNs), Edge computing, cloud and
virtualization, may result in reduced spending to the benefit of
our competitors who have, or may have, a stronger position in
such technologies. The technological viability of standardized,
low-margin hardware products in combination with the
Business overview | Corporate governance | Operating and financial review and prospects | General facts on Nokia | Financial statements | Other information | 117 | |||||||
Risk factors continued
Nokia Annual Report on Form 20-F 2023
virtualization of functions can induce a change in purchase
behavior, resulting in favoring other vendors or in higher
bargaining power versus Nokia due to more alternative
vendors. Our customers may prefer best-of-breed from
multiple vendors, a single vendor or turn to alternative vendors
to maintain end-to-end services. Additionally, new competitors
may enter the industry as a result of acquisitions or shifts in
technology. Furthermore, some companies, including webscale
companies, may drive a faster pace of innovation in
telecommunications infrastructure through more collaborative
approaches and open technologies across access, backhaul,
core and management.
We expect to generate a significant share of our growth from
new customers, including webscale companies and vertical
customers, for example in transportation & logistics, energy,
manufacturing, and public sector verticals. Each of these
sectors may face adverse industry developments, which may
significantly impact the size of investments addressable by us
and our ability to address these investments, in terms of both
having the right products available and being able to obtain
new customers and having the right go-to-market capabilities
and expertise to address the specific needs of these sectors.
Furthermore, there are various incumbent and new actors
competing with Nokia in these customer groups we
strategically target. With these types of customers, the nature
of competition and the required capabilities can be significantly
different from the communications service provider market,
including competition based on access network, core network,
cloud infrastructure, platforms, applications and devices, and
related services.
Competitive intensity remains high in the market as
competitors seek to take share in 5G rollouts, which is
creating a risk of persistent high price erosion in the industry.
If domestic and global economic conditions worsen, overall
spending on 5G infrastructure may be reduced or delayed, and
spending in our other network products and services might
be even more rapidly reduced to preserve the customer
investment in 5G, which would adversely impact demand for
our products and services in these markets. Further, any
reduction in our market share in 5G compared with our
installed base in 4G due to decisions to protect our
profitability, inability to meet the customers’ requirements
or other reasons, may have a material negative effect on
our scale and profitability.
We are dependent on a limited number of customers and
large multi-year agreements. The loss of a single customer
or contract, operator consolidation, unfavorable contract
terms or other issues related to a single agreement may
have a material adverse effect on our business and
financial condition.
A significant proportion of the net sales and profits that we
generate have historically been derived from a limited number
of customers. As consolidation among existing customers
continues, it is possible that an even greater portion of
our net sales will be attributable to a smaller number of large
communications service providers. These developments
are also likely to increase the impact on our net sales based
on the outcome of certain individual agreement tenders.
Communications service providers are also increasingly
entering into asset sharing arrangements, as well as joint
procurement agreements, which may reduce their investments
and the number of networks available for us to service.
Furthermore, procurement organizations of certain large
communications service providers sell consulting services
to enhance the negotiating position of small operators with
their vendors.
As a result of the intense competition in the industry, we may
increasingly be required to agree to less favorable terms in
order to remain competitive. Any unfavorable developments in
relation to, or any change in the agreement terms applicable
to, a major customer may have a material adverse effect on our
business, results of operations and financial condition. Also,
agreements in the networks business are typically complex
and long-term in nature and it is possible that over time the
contract terms of the agreement may prove less favorable to
us than originally expected, for instance due to changes in
costs and product portfolio decisions, and those may be
difficult to amend promptly to address new developments,
such as the accelerating inflation that we are currently facing.
Furthermore, in particular given the bargaining power of our
customers or limited legal ability to deviate from the standard
governmental contract terms, we may be exposed to onerous
terms and liabilities in our customer contracts.
Loss of a single customer, its significant business or contract,
or other issues related to a single agreement, may have a
material adverse effect on our business and financial condition.
We have lost customers and contracts in the past and the
same may happen in the future. Furthermore, any suspension,
termination or non-performance by us under an agreement’s
terms may have a material adverse effect on us, for example
due to penalties for breaches, early termination or reduced
orders or customer footprint. In addition, we may lose existing
agreements, or we may be unable to renew or gain new
agreements, for instance due to customer policies that limit
the ability of customers to have one network provider
exceeding a certain threshold of business in a given market
or as a result of merger activity where the customer may
decide to concentrate their spending elsewhere.
The timing of sales and results of operations associated with
large multi-year agreements or turnkey projects may differ
significantly from expectations. For instance, recognition of
sales and related costs in network implementation projects are
often linked with achievement of customer acceptances, which
may delay for reasons that may or may not be attributable to
us. Moreover, such agreements often require dedication of
substantial amounts of working capital and other resources,
which may adversely affect our cash flow, particularly in the
early stages of an agreement’s term, or may require us to
continue to sell certain products and services, or to sell in
certain markets that would otherwise be discontinued or
exited, thereby diverting resources from developing more
profitable or strategically important products and services, or
focusing on more profitable or strategically important markets.
Furthermore, our customer agreements may involve complex
transformation of the networks as the customers deploy new
technologies and the related costs and scope of required
deliverables may differ from our expectations at the time we
enter into such agreements.
Business overview | Corporate governance | Operating and financial review and prospects | General facts on Nokia | Financial statements | Other information | 118 | |||||||
Risk factors continued
Nokia Annual Report on Form 20-F 2023
We may be adversely affected by developments with respect
to customer financing or extended payment terms that we
provide to our customers. Unwillingness of banks or other
institutions to provide guarantees or financing to our
customers or purchase our receivables could impair our
capability to enter agreements with new customers or
markets, to mitigate payment risk and to manage our liquidity.
Requests for customer financing and extended payment terms
are typical for our industry and uncertainty or lack of liquidity
in the financing markets, among other things, may result in
increased customer financing requests. In the event that
export credit agencies face constraints on their ability or
willingness to provide guarantees or financing to our
customers, or there is insufficient demand from banks or other
financial institutions to purchase receivables, such events could
have a material adverse effect on our business and financial
condition. Furthermore, reduced availability of credits by
export credit agencies supporting our sales could affect
our ability to attract customers and enter new markets thus
facing the possibility of reduced sales.
In certain cases, the amounts and duration of these financings
and trade credits, and the associated impact on our working
capital, may be significant. We have agreed to extended
payment terms for a number of our customers and may
continue to do so in the future. Extended payment terms may
result in a material aggregate amount of trade credits and even
when the associated risk is mitigated by a diversified customer
portfolio, defaults in the aggregate could have a material
adverse effect on us.
All in all, our ability to manage our total customer financing
and trade credit exposure depends on a number of factors,
including, but not limited to market conditions affecting our
customers, the levels and terms of credit available to us and
our customers, the cooperation of export credit agencies and
our ability to mitigate exposure on acceptable terms. We may
be unsuccessful in managing the challenges associated with the
customer financing and trade credit exposure that we may face
from time to time, particularly in difficult financial conditions in
the market. While defaults under financings, guarantees and
trade credits to our customers resulting in impairment charges
and credit losses have not been significant for us in the past,
these may increase in the future, in particular in markets such
as India with increased risks potentially affecting our customers.
Further, commercial banks may not continue to be able or
willing to provide sufficient long-term financing, even if backed
by export credit agency guarantees, due to their own constraints,
and certain of our competitors may also have greater access to
such financing, which could adversely affect our competitiveness.
Additionally, we have sold certain receivables to banks or other
financial institutions, and any significant change in our ability
to continue this practice could impair our capability to mitigate
such payment risk and to manage our liquidity.
Nokia also arranges bank guarantees and bonds and issues
commercial guarantees in customers’ favor in relation to our
business. In the event we are unable to collect outstanding
guarantees and bonds, this could limit our possibilities to issue
new guarantees and bonds, which are required in customer
agreements or practices. We also face a risk that such
commercial guarantees/bonds may be unfairly called.
Risks impacting our competitiveness
We may fail to invest effectively and profitably in new
competitive high-quality products, services, upgrades and
technologies or bring them to the market in a timely manner.
We also may fail to adapt to changing business models.
Our business performance and results of operations will
depend to a significant extent on our ability to succeed in the
following areas:
■maintaining and developing a competitive product portfolio
and service capability that is attractive to our customers,
for instance by keeping pace with technological advances
in our industry and pursuing technologies that become
commercially accepted and price competitive;
■maintaining compliance with regulatory requirements and
standards;
■introducing new products, services and upgrades of current
products and doing so on a cost-efficient and timely basis;
■developing new or enhancing existing processes and tools
for our service offerings;
■optimizing the amount of customer or market-specific
technology, product and feature variants in our product
portfolio;
■continuing to meet evolving expectations and enhancing
the quality of our products and services, complying with
emerging industry standards as well as introducing products
and services that have desired features and attributes,
such as energy efficiency;
■maintaining and building up strategic partnerships in our
value creation chain (e.g. in product creation and project
delivery); and
■leveraging our technological strengths and addressing
competing technological and product developments carried
out by competitors while keeping prices and costs at
competitive levels.
The industries in which we operate are characterized by rapidly
evolving technologies, frequent new technological requirements,
product feature introductions and evolving industry standards.
The participants in the markets where we operate compete on
the basis of product and service offerings, technical capabilities
and quality in addition to price and affordability.
The R&D of new, innovative and technologically advanced
products, such as 5G-Advanced, Open RAN, 6G, IoT, the cloud
and software as well as upgrades to current products and new
generations of technologies, is a complex and an uncertain
process requiring high levels of innovation and investment,
including trying to accurately anticipate technological,
regulatory and market trends. We may focus our resources
on products and technologies that do not become widely
accepted or ultimately prove unviable. Additionally, many of
our current and planned products are highly complex and may
contain defects or errors that are, for instance, detected only
after deployment in telecommunications networks. Even if
we invest in new competitive products, services, upgrades
or technologies and proactively manage the costs related to
our portfolio of products and services, including component
sourcing, manufacturing, logistics and other operations,
we may still fail to maintain or improve our market position,
competitiveness or scale and keep prices and costs at
competitive levels or provide high-quality products and services.
Certain of our competitors have significant resources to invest
in market exploration and may seek new monetization models
or drive industry development and capture value in areas
where we may not currently be competitive or do not have
similar resources available to us. These areas may include
monetization models linked to large amounts of consumer
data, large connected communities, home or other
entertainment services, alternative payment mechanisms or
marketing products. We also face competition from various
companies that may be able to develop technologies or
products that become preferred over those developed by
us or result in adverse effects on us through, for instance,
Business overview | Corporate governance | Operating and financial review and prospects | General facts on Nokia | Financial statements | Other information | 119 | |||||||
Risk factors continued
Nokia Annual Report on Form 20-F 2023
developing technological innovations that make our
innovations less relevant. In addition, reduced government
funding and support for our R&D activities could affect our
ability to develop new technology or products.
Inefficiencies, incidents, malfunctions or disruptions of
information technology systems and processes could have
a material adverse effect on our business and results of
operations. As our business operations, including those we
have outsourced, rely on complex IT systems, networks and
related services, our reliance on the precautions taken by us
and external companies to ensure the reliability of our own
and third-party IT systems, networks and related services is
increasing. Consequently, certain disruptions in IT systems
and networks affecting us and our external providers could
also have a material adverse effect on our business.
All IT systems, networks and processes are potentially
vulnerable to damage, incidents, malfunction or interruption
from a variety of sources. Our own and customer-facing
operations rely on the efficient and uninterrupted operation of
complex and centralized IT systems, networks and processes,
which are integrated with those of third parties. The ongoing
migration to cloud-based architectures and network function
virtualization has introduced further complexity and
associated risk.
We are, to a significant extent, relying on third parties for the
provision of IT services. While we have outsourced certain
functions, we have also increased our dependence on the
reliability of external providers as well as on the security of
communication with them. We may experience disruptions if
our partners do not deliver as expected or if we are unable to
successfully manage systems and processes together with our
business partners. We will often need to use new service
providers and may, due to technical developments or choices
regarding technology, increase our reliance on certain new
technologies, such as cloud, and certain other services that are
used over the internet rather than using a traditional licensing
model. Switching to new service providers and introducing
new technologies is inherently risky and may expose us to an
increased risk of disruptions in our operations, for instance
due to network inefficiency or outage, a cybersecurity or a
compliance incident, malfunctions, failure in disaster recovery
or IT service continuity or other disruptions resulting from IT
systems and processes.
We are constantly seeking to improve the quality and security
of our IT systems. However, despite precautions taken by us,
we may fail to successfully secure our IT and any malfunction or
disruption of our current or future systems or networks, such
as an outage in a telecommunications network used by any of
our IT systems, or a cybersecurity incident, such as an attack,
malware, ransomware or other event that leads to an
unanticipated interruption or malfunction of our IT systems,
processes, networks or data leakages, could have a material
adverse effect on our business, results of operations and brand
value. A disruption of services relying on our IT, for instance,
could cause significant discontent among customers and
their end-users resulting in claims, contractual penalties or
deterioration of our brand value. Further, while we are
increasing our investments in digitalizing our operations and
transforming our IT, the legacy IT systems may be gradually
more vulnerable to malfunction, disruptions or security
incidents than the new IT systems replacing them.
We are exposed to risks related to information security.
Our business model relies on solutions for distribution of
services and software or data storage, which entail inherent
risks relating not only to applicable regulatory regimes,
but also to cybersecurity incidents and other unauthorized
access to network data or other potential security risks
that may adversely affect our business and/or compromise
personal data.
Our business and operations rely on confidentiality of
proprietary and other sensitive information, for instance related
to our employees and our customers, including our government
customers. Our business models rely on certain centralized
data processing solutions and cloud or remote delivery-based
services for distribution of services and software or data
storage, accessible by our partners or subcontractors according
to the roles and responsibilities defined.
We, our subsidiaries and joint ventures, products and online
services, marketing and developer sites and third parties that
we contract have been and may in the future be subject to
cybersecurity incidents, including hacking, ransomware,
viruses, worms and other malicious software, unauthorized
modifications, or illegal activities that may cause potential
security risks and other harm to us, our customers or
consumers and other end-users of our products and services.
IT is rapidly evolving, the techniques used to obtain
unauthorized access or sabotage systems change frequently
and the parties behind cyber-attacks and other industrial
espionage are sophisticated and have extensive resources,
and it is not commercially or technically feasible to mitigate all
known vulnerabilities in a timely manner or to eliminate all risk
of cyber-attacks and data breaches. Additionally, we contract
with multiple third parties in various jurisdictions who collect
and use certain data on our behalf. Although we have
processes in place designed to ensure appropriate collection,
handling and use of such data, third parties may use the data
inappropriately or breach laws and agreements in collecting,
handling or using or leaking such data. Our business is also
vulnerable to theft, fraud or other forms of deception,
sabotage and intentional acts of vandalism by third parties and
employees. Further, compared to our fully integrated group
companies, our ability to mitigate and oversee risk of cyber-
attacks and data breaches may be more limited in our joint
venture companies and other group companies having their
own governance and system infrastructure, such as our local
service companies focusing on network field services.
The cybersecurity incidents may lead to lengthy and costly
incident response, remediation of the attack or breach, legal
proceedings and fines imposed on us, as well as adverse
effects to our reputation and brand value. Additionally,
cyber-attacks can be difficult to prevent, detect or contain.
We cannot rule out the possibility that there may have been
cyber-attacks that have been successful and/or evaded our
detection. We continue to invest in risk mitigating actions;
however, there can be no assurance that such investments and
actions will prevent or detect future cyber-attacks. Additionally,
the cost and operational consequences of implementing
further information system protection measures, especially
if prescribed by national authorities, could be significant.
We may not be successful in implementing such measures in
due time, which could lead to business disruptions and the
implementation to be more expensive, time-consuming and
resource intensive. The regulatory framework around
responding to and disclosing such events is in flux. We may
not be able to comply with the regulations that must be
implemented or such compliance may negatively impact our
ability to deal with the underlying event.
In connection with providing products and services to our
customers, certain personal and consumer data is collected,
stored and processed through us, either by us or by our
business partners or subcontractors in various jurisdictions.
Loss, improper disclosure or processing or leakage of any
personal or consumer data collected by us, or which is made
Business overview | Corporate governance | Operating and financial review and prospects | General facts on Nokia | Financial statements | Other information | 120 | |||||||
Risk factors continued
Nokia Annual Report on Form 20-F 2023
available to us or our partners or subcontractors or stored
in or through our products and services, could have a material
adverse effect on us and harm our reputation and brand.
Additionally, governmental authorities may misuse our network
products to access the personal data of individuals without
our involvement; for example, through the so-called lawful
intercept capabilities of network infrastructure, impairing
our reputation.
We may face problems or disruptions in manufacturing,
service creation, delivery, logistics or supply chain. Such
challenges include securing availability of resources or
components to meet the demand, ability to adapt supply,
defects in products or related software or services, and
achieving required efficiencies and flexibility. Our suppliers
and partners may fail to meet product quality, health, safety
or security requirements or comply with other regulations
or local laws, such as environmental, social or labor laws.
Additionally, adverse events, such as geopolitical disruptions,
natural or man-made disasters, civil unrest or health crises,
have and may continue to have an impact on our service
delivery, production sites or the production sites of our
suppliers and partners which are geographically concentrated.
We have an extensive supply network, including a
geographically dispersed manufacturing network consisting
of both our own manufacturing and contract manufacturing
partners. We, or third parties that we have outsourced
manufacturing and services delivery to, may experience
difficulties in adapting supply to meet the changing customer
demand, ramping up and down production, adjusting network
implementation capabilities as needed on a timely basis,
maintaining an optimal inventory level, adopting new
manufacturing processes, finding the most timely way to
develop the best technical manufacturing solutions for new
products, managing the increasingly complex manufacturing
process, service creation and delivery process or achieving
required efficiencies and flexibility. In addition, these
operations are exposed to various risks and potential liabilities,
including those related to geopolitics,transition to low carbon
economy, compliance with laws and regulations, exposure
to environmental liabilities or other claims. In addition to
operational complexity, these may increase our costs related
to our supply chain.
Our manufacturing operations depend on obtaining sufficient
quantities of fully functional products, components, sub-
assemblies, software, services, energy and other resources
on a timely basis. In certain cases, a particular component
or service may be available only from a limited number of
suppliers or from a single supplier in the supply chain. Suppliers
have and may, from time to time, extend lead times, limit
supplies, change their partner preferences, increase prices,
provide poor quality supplies or be unable to adapt to changes
in demand due to capacity constraints or other factors, which
could adversely affect our ability to deliver our products and
services on a timely basis or increase our costs. For example,
the global semiconductor components shortage constrained
our deliveries and the continuing uncertainty around
components, raw material availability and potential energy
shortages in the market limit our visibility and may continue to
have an impact on our ability to supply to our customers and
increase our costs. We are working closely not only with our
suppliers to ensure component availability but also with our
customers to ensure we can meet their needs. We are also
building up critical material buffers to be prepared to balance
short-term disruptions. Many of our competitors and also
companies from other industries utilize the same contract
manufacturers, component suppliers and service vendors.
If they have purchased capacity or components ahead of us,
or if there is significant consolidation in the relevant supplier
base, this could prevent us from acquiring the required
components or services, which could limit our ability to
supply our customers and increase our costs.
Our products are highly complex and defects in their design,
manufacture and associated hardware, software, content and
installation have occurred in the past and may continue to
occur in the future. Quality issues may cause, for instance,
delays in deliveries, loss of intellectual property, liabilities for
network outages, court fees and fines due to breaches of
significantly increasing regulatory privacy requirements and
related negative publicity, and additional repair, product
replacement or warranty costs to us, and harm our reputation
and our ability to sustain or obtain business with our current
and potential customers. With respect to our services, quality
issues may relate to the challenges of having the services
fully operational at the time they are made available to our
customers and maintaining them on an ongoing basis. We
may also be subject to damages due to product liability claims
arising from defective products and components. We make
provisions to cover our estimated warranty costs for our
products and pending liability claims. We believe our provisions
are appropriate, although the ultimate outcome may materially
differ from the provisions that are provided for, which could
have a material adverse effect on us.
A large proportion of our manufacturing, service creation and
delivery is carried out by third-party suppliers. These vary in
size and often engage a number of tiers of suppliers, which
limits our direct control. Suppliers may fail to meet our supplier
requirements, such as product quality, safety, security and
other standards of us and our customers. Certain suppliers
may not comply with local laws, including, among others, local
labor law, health and safety or environmental requirements.
The activities we manage or that are managed by third parties
for us may also be subject to negative publicity and purchasing
boycotts, strikes or other forms of social, political, economic
or environmental activism. These all can lead to exposure
in the form of litigation, product recalls or brand damage
through association.
Many of our production sites or the production sites of our
suppliers and partners are geographically concentrated,
with a majority of such suppliers and partners based in Asia.
We rely on efficient logistics chain elements, such as regional
distribution hubs and transport chain elements (main ports,
streets and airways). We are working on gradually increasing the
regionalization of our supply network to increase resilience.
However, in the event that any of these geographic areas are
affected by any adverse conditions that disrupt production
or deliveries from our suppliers and partners, such as trade
restrictions, severe impacts of environmental events,
geopolitical events, man-made or natural disasters (for
instance, flooding, heavy rain or extreme heat that climate
change is expected to further intensify or current unrest by the
Red Sea), war, civil unrest or health crises such as the COVID-19
pandemic, our ability to deliver our products on a timely basis
could be adversely affected. In a similar manner, these adverse
conditions may also cause disruption to our service creation
and delivery, which, in either case, may lead to a material
adverse effect on our business and results of operations.
Competition for employees and leaders is increasing globally.
We may be unable to retain, motivate, develop, reskill and
recruit appropriately skilled employees or we may fail in
workforce balancing. Employees may face change fatigue or
reduction in motivation and energy as our efforts to evolve
our business and improve efficiency continue.
Our success in executing our strategy, to address opportunities
in new technologies and business models and customer
Business overview | Corporate governance | Operating and financial review and prospects | General facts on Nokia | Financial statements | Other information | 121 | |||||||
Risk factors continued
Nokia Annual Report on Form 20-F 2023
segments in particular, requires and is dependent on our ability
to retain, motivate, develop, reskill and recruit appropriately
skilled employees and in particular those with relevant technical
expertise. Our workforce has fluctuated over recent years as
we have introduced changes in our strategy to respond to
our business targets and endeavors. In October 2023,
we announced strategic and operational changes to our
business and a program to reset our cost base. The program is
expected to lead to a 72 000 to 77 000-employee organization
compared to the 86 000 employees Nokia has today. Such
changes and uncertainty may cause disruption, fatigue and
dissatisfaction among employees as our efforts to evolve
our business and maximize operational efficiency continue.
Employee motivation, energy, focus, morale and productivity
may be reduced, causing inefficiencies and other problems
across the organization resulting in the loss of key employees
and increased costs in resolving and addressing such matters.
The loss of key employees could result in resource gaps, some
of which may only be noticed after a certain period of time
or which negatively impact our relationship with customers,
vendors or other business partners.
Our efforts to rebalance our workforce as planned may fail,
for instance due to legal restrictions or collective bargaining
agreements, which may result in a non-optimal workforce,
larger than expected costs and not meeting our financial
targets for such plans. Our inability to negotiate successfully
with employee representatives or failures in our relationships
with such representatives could result in strikes and other
industrial actions by the employees which may in turn result
in significant disruption in our day-to-day operations and
higher ongoing labor costs. The market for skilled employees
is increasingly competitive, particularly given the similar
technology trends affecting various industries simultaneously
and increased remote working expanding the job market for
individual employees. We have encountered, and may in the
future encounter, shortages of appropriately skilled employees
or lose key employees or senior management. There can be
no assurances that we will be able to implement measures
successfully to retain or hire the employees we need. This may
require significant time, attention and resources from our
senior management and other key employees within our
organization and may result in increased costs or otherwise
have a material adverse effect on us.
In response to our experience during the COVID-19 pandemic
and our employees’ feedback, we provide flexibility for
employees to work up to three days a week remotely and
increased support for flexible working hours and fully virtual
working. With the permanently increasing share of remote
working, there is a risk that we may be exposed to a larger
extent than before to impacts related to remote work and
arranging the home office, such as increased attrition, decreased
creativity or productivity of employees, supervising working
hours, challenges in identifying, assessing and supporting
employees in stress or poor mental health, inability to help
employees to work safely in their home office environment or
developing and supervising the execution of related internal
policies leading to potential health issues and litigation.
Risks associated with intellectual property rights,
technology and brand licensing
Our patent licensing income and other intellectual property-
related revenues are subject to risks and uncertainties such
as our ability to maintain our existing sources of intellectual
property-related revenue, establish new sources of revenue
and protect our intellectual property from infringement.
A proportionally significant share of the current patent
licensing income is generated from the smartphone market,
which is rapidly changing and features a limited number of
large vendors.
The continued strength of our intellectual property portfolios
depends on our ability to create new relevant technologies,
products and services through our R&D activities and to
protect our intellectual property rights (IPR). If those
technologies, products and services do not become relevant,
and therefore attractive to potential licensees, the strength of
our intellectual property portfolios could be reduced. Despite
the steps that we have taken to protect our technology
investments with IPR, we cannot be certain that any rights or
pending applications will be granted or that the rights granted
in connection with any future patents or other IPR will be
valid and sufficiently broad to protect our innovations and
maintain the relative strength of our portfolio. Third parties
may infringe our intellectual property relating to our
proprietary technologies or disregard their obligation to seek
necessary licenses under our patents or seek to pay less than
reasonable licensing fees. As a result, we may be unable to
continue to develop or protect our intellectual property-
related revenue or establish new sources of revenue.
Regulatory and other developments regarding protection
awarded to technology innovations or compensation trends
with respect to licensing may impact our ability to protect,
monetize or divest our intellectual property. Any patents or
other IPR may be challenged, invalidated or circumvented,
and any right granted under our patents may not provide
competitive advantages for us. In the technology sector
generally, certain licensees are actively avoiding concluding
license agreements on fair and reasonable commercial terms,
or are withholding making license payments, while some
suggest that licensors may be able to collect unreasonably high
license payments, with both behaviors attracting regulatory
attention. Authorities in various countries have increasingly
monitored patent monetization and may aim to influence
the terms on which patent licensing arrangements or patent
divestments may be executed, which could compromise
control over or protection of our technology and proprietary
information. Such terms may be limited to a certain country or
region; however, authorities could potentially seek to widen the
scope and even impose global terms, potentially resulting in
an adverse effect on us or limiting our ability to monetize our
patent portfolios.
There is no assurance that past levels are indicative of
future levels of intellectual property-related revenue. Poor
performance by any of Nokia’s patent, technology or brand
licensees may impact Nokia financially, for example, if a
licensee’s ability to pay is reduced, the licensee decides
to divest or scale back a particular part of its business or
it becomes insolvent or bankrupt. Additionally, poor
performance of potential or current licensees may limit a
licensee’s motivation to seek new or renew existing licensing
arrangements with us. Furthermore, patent license agreements
can cover both past and future sales of licensees, and the
portion of the income that relates to licensees’ past sales is
not expected to have a recurring benefit. Ongoing patent
income from licensing is generally subject to various factors
(for instance, sales by the licensees) that we have little or no
control over, and it can vary considerably from time to time
based on factors such as the terms of agreements we enter
into with licensees.
We seek to expand the scope of our licensing activities to
other industries, in particular those that implement mobile
communications and multimedia technologies, such as the
automotive, consumer electronics and IoT industries. The
actors in some of these industries may not have traditionally
paid intellectual property-related royalties and the expansion
of our licensing activities into such industries may involve
Business overview | Corporate governance | Operating and financial review and prospects | General facts on Nokia | Financial statements | Other information | 122 | |||||||
Risk factors continued
Nokia Annual Report on Form 20-F 2023
litigation. In addition, entering highly fragmented markets or
markets with a high volume of licensees may affect our
effectiveness and/or profitability.
We retained our patent portfolio after the sale of the Devices &
Services business in 2014. Following the sale of the Devices &
Services business, Nokia is no longer required to agree upon
cross-licenses to cover Nokia’s handset business, which has
contributed to growing our licensing revenue. While this has
been our practice, there can be no guarantee that this can
be continued in the future. Also, in the past, parts of our
intellectual property development were driven by innovation
from the Devices & Services business. As we no longer own
this business, our future intellectual property relating to the
mobile phone sector may lessen and our ability to influence
industry trends and technology selections may reduce.
We also enter into business agreements on behalf of our
business groups, which may grant certain licenses to our
patents. Some of these agreements may inadvertently grant
licenses to our patents with a broader scope than intended,
or they may otherwise make the enforcement of our patents
more difficult.
To renew existing license agreements and conclude new
license agreements with potential licensees, we may and have
engaged in legal actions to enforce our intellectual property
rights against unlawful infringement, the outcomes of which
are uncertain.
Intellectual property-related disputes are common in the
technology industry. While we strive to reach negotiated
settlements of any disputes in relation to license agreements
with companies using our intellectual property, sometimes
it is necessary to engage in litigation or arbitration in order
to renew existing license agreements which have expired or
conclude new license agreements with unlicensed parties.
In certain cases, we have engaged in litigation or arbitration
proceedings to enforce our rights, for instance to enforce
our patents or to establish the terms of a patent license
agreement. Due to the nature of litigation and arbitration
proceedings, there can be no assurances as to the final
outcome, timing or costs involved in such litigation or
arbitration proceedings or as to our ability to renew existing
license agreements or conclude new license agreements
with potential licensees on acceptable commercial terms.
In other cases, other companies have commenced and may
continue to commence actions against us seeking to establish
the invalidity of our intellectual property, including our patents,
or to contest our licensing practices or file competition law
complaints with courts or competition authorities. In the event
that one or more of our patents is challenged, a court may
invalidate the patent or determine that the patent is not
enforceable. The outcome of court proceedings is difficult
to predict and, consequently, our ability to use intellectual
property for revenue generation may from time to time
depend on favorable court rulings. Additionally, if any of our
patents is invalidated, or if the scope of the claims in any
patents is limited by a court decision, we could be prevented
from using such patents as a basis for product differentiation
or from licensing the invalidated or limited portion of our IPR.
Even if such a patent challenge is not successful, the related
proceedings could be expensive and time-consuming, divert
the attention of our management and technical experts from
our business and have an adverse effect on our reputation.
Any diminution in the protection of our IPR could cause us to
lose certain benefits of our R&D investments.
While the primary source of Nokia Technologies business
group net sales and profits is licensing of the Nokia patents,
we are also engaged with licensing of technologies and
of the Nokia brand, as well as with other business ventures,
including technology innovation and incubation. Expected
net sales and profitability for these businesses may not
materialize as planned or, for some of these businesses,
at all.
There can be no assurances that our Nokia Technologies
business group, or any other part of Nokia, will be successful in
innovation and incubation or in generating net sales and profits
through its business plans, for instance in patent, technology
and brand licensing. The industries in which we operate, or may
operate in the future, are generally fast paced, rapidly evolving,
innovative and at different levels of maturity. Additionally, we
are entering into new business areas based on our technology
assets and may explore new business ventures. Such business
areas or plans may be adversely affected by adverse industry
and market developments in the numerous diverse markets in
which we operate, and the investments we make may not
achieve the targeted scale, intended benefits or yield expected
rates of return.
Our products, services and business models depend on
technologies that we have developed as well as technologies
that are licensed to us by certain third parties. As a result,
evaluating the rights related to the technologies we use or
intend to use is increasingly challenging, and we expect to
continue to face claims that we have allegedly infringed third
parties’ IPR. The use of these technologies may also result in
increased licensing costs for us, restrictions on our ability to
use certain technologies in our products and/or costly and
time-consuming litigation.
Our products and services include increasingly complex
technologies that we have developed or that have been
licensed to us by certain third parties. The amount of such
proprietary technologies and the number of parties claiming
to own relevant IPR continue to increase. The holders of
patents and other IPR potentially relevant to these complex
technologies may be unknown to us, may have different
business models, may refuse to grant licenses to their
proprietary rights or may otherwise make it difficult for us to
acquire a license on commercially acceptable terms. If licensing
agreements are not available on commercially acceptable
terms, we could be precluded from making and selling the
affected products or could face increased licensing costs. As
new features are added to our products, we may need to
acquire further licenses, including from new and sometimes
unidentified owners of intellectual property. The lack of
availability of licenses for copyrighted content, delayed
negotiations or restrictive IPR license terms may have a
material adverse effect on the cost or timing of content-
related services and products offered by us, mobile network
operators or third-party service providers. The cumulative
costs of obtaining any necessary licenses are difficult to predict
and may be significant.
Additionally, although we endeavor to ensure that we and the
companies collaborating with us possess appropriate IPR or
licenses, we cannot fully avoid the risks of IPR infringement by
suppliers of components, processes and other various layers
in our products, or by companies with which we collaborate.
Similarly, we and our customers may face claims of
infringement in connection with the use of our products.
Any restrictions on our ability to sell our products due to
expected or alleged infringements of third-party IPR and any
IPR claims, regardless of merit, could result in a material loss
of profits, costly litigation, the obligation to pay damages and
other compensation, the diversion of the attention of our key
employees, product shipment delays or the need for us to
develop non-infringing technology or to enter into a licensing
agreement on unfavorable commercial terms.
Business overview | Corporate governance | Operating and financial review and prospects | General facts on Nokia | Financial statements | Other information | 123 | |||||||
Risk factors continued
Nokia Annual Report on Form 20-F 2023
In line with standard practice in our industry, we generally
indemnify our customers for certain intellectual property-
related infringement claims initiated by third parties relating
to products or services purchased from us. These may include
claims from non-practicing entities having no product or
service business. If such claims are made directly against our
customers, we may have limited opportunities to participate in
the processes including in negotiations and in defenses, or to
evaluate the outcomes and resolutions in advance. All IPR
indemnifications can result in significant payment obligations
for us that are difficult to estimate in advance. Moreover, our
indemnification responsibilities typically arise whether or not
the IPR assertions against our customers have merit.
Since all technology standards that we use and rely on,
including mobile communication technologies such as the
Universal Mobile Telecommunications System (UMTS), Long-
Term Evolution (LTE) and 5G, or fixed line communication
technologies, include certain IPR, we cannot avoid risks of
facing claims for infringement of such rights due to our reliance
on such standards. We believe the number of third parties
declaring their patents to be potentially relevant to these
standards is increasing, which may increase the likelihood
that we will be subject to such claims in the future. As the
number of market entrants and the complexity of technologies
increase, it remains likely that we will need to obtain licenses
with respect to existing and new standards from other
licensors. While we believe most of such IPR actually found to
be essential to a particular standard carries an obligation to
be licensed on fair, reasonable and non-discriminatory terms,
not all intellectual property owners agree to apply such terms,
nor do all owners agree on what is fair, reasonable and non-
discriminatory. As a result, we have experienced costly and
time-consuming litigation proceedings against us and our
customers or suppliers over such issues and we may continue
to experience such litigation in the future.
From time to time, certain existing patent licenses may expire
or otherwise become subject to renegotiation. The inability to
renew or finalize such arrangements or renew licenses with
acceptable commercial terms may result in litigation, which
may be expensive and time-consuming and divert the efforts
of our management and technical experts from our business
and, if decided against us, could result in unfavorable judgments
or restrictions on our ability to sell certain of our products
or require us to pay increased licensing fees, fines or other
penalties and expenses, and/or to enter into costly settlements.
Our patent license agreements may not cover all the future
businesses that we may enter, our existing business may not
necessarily be covered by our patent license agreements if
there are changes in our corporate structure or our
subsidiaries, or our newly acquired businesses may already
have patent license agreements with terms that differ from
similar terms in our patent license agreements. This may
result in increased costs, restrictions in the use of certain
technologies or time-consuming and costly disputes whenever
there are changes in our corporate structure or our subsidiaries,
or whenever we enter into new business areas or acquire
new businesses.
We make accruals and provisions to cover our estimated total
direct IPR costs for our allegedly infringing products. Our
estimated total direct IPR costs take into account items such
as payments to licensors, accrued expenses under existing
agreements and provisions for potential liabilities. We believe
our accruals and provisions are at an appropriate level. The
ultimate outcome, however, may differ from the provided level,
which could have an adverse impact on us.
Risks stemming from geopolitical, legal, regulatory
and compliance environment
Current international trends show increased enforcement
activity in areas such as national security, competition law,
export control and sanctions, privacy, cybersecurity, climate
change, human rights and anti-corruption. Furthermore, we
have observed an increase in the adoption of surveillance, data
localization, national sourcing and national hiring requirements,
regulations and policies, as well as regulators’ increased
interest in regulatory reform and reorganization and their
growing appetite for tackling topics such as non-personal data,
artificial intelligence, open access and net neutrality.
We conduct our business globally, being subject to direct
and indirect regulation and exposed to geopolitical and
regulatory risks, such as complex regulatory frameworks,
unfavorable or unpredictable treatment in relation to trade
sanctions, tariffs, tax matters and export controls, exchange
controls and other restrictions, geopolitical conflicts and
military actions, labor unrest, civil unrest, and public security
and safety threats, which could have a material adverse
effect on us and our supply chain and our ability to sell
or supply products and services, including network
infrastructure equipment and components manufactured
in such countries.
We have witnessed political unrest and open conflicts in the
past in various markets in which we conduct business or in
which we have operations, which have adversely affected our
sales, profitability or operations in these markets, including
the safety and security of our employees, and also in certain
cases affected us outside these countries or regions. Any
reoccurrence or escalation of such unrest could have a further
material adverse effect on our people, sales or results of
operations. For instance, a potential expansion of the current
conflict in Gaza or the unrest on the coast of the Red Sea could
impact our business on multiple levels from market access over
supply chain, general economic developments, security and
safety of our operations in concerned countries, potential
sanctions or boycotts, and reputational risks. Escalating
tensions over Taiwan and territorial disputes in the South China
Sea could lead to various risks, including short- or long-term
supply chain disruptions from Taiwan and further risks subject
to the nature and severity of the tensions. Should we decide to
exit or otherwise alter our presence in a particular market, this
may have an adverse effect on us through, for example,
disruption to our operations in the event we need to relocate
significant parts of our operations, triggered investigations, tax
audits by authorities, claims by contracting parties or
reputational damage. At Nokia, we make our sales in a
transparent, regulated and compliant manner and in
accordance with applicable laws and regulations.
Notwithstanding our compliance measures, there exists a risk
that the equipment we sell may subsequently be misused,
relocated or resold without our knowledge or consent. The
results and costs of investigations or claims against our
international operations may be difficult to predict and could
lead to lengthy disputes, fines or fees, indemnities or costly
settlements.
The regulatory, trade controls and sanctions legal environment
can be difficult to navigate for companies with global
operations, impacting ability to grow or maintain business in
specific markets or enter new markets. As a global operator,
Nokia conducts business subject to export controls regulations
and in countries subject to various sanctions and our business
may be impacted by new, existing or tightened export control
regulations, sanctions, embargoes or other forms of economic
and trade restrictions imposed on certain countries, regions
and entities. Although we strive to conduct all operations of
Nokia, and in particular any operations undertaken in countries
targeted by sanctions, in accordance with our compliance
program, we cannot ensure that breaches will not occur.
Business overview | Corporate governance | Operating and financial review and prospects | General facts on Nokia | Financial statements | Other information | 124 | |||||||
Risk factors continued
Nokia Annual Report on Form 20-F 2023
Export controls, tariffs or other fees or levies imposed on
our products and environmental, health, product safety,
data protection and security, consumer protection, money
laundering and other regulations that adversely affect the
export, import, technical design, pricing or costs of our
products could also adversely affect our sales and results
of operations. Further, we rely on multilateral trade regimes
to help ensure a balanced playing field. Conflicts between
countries and geopolitical tensions may lead to implementation
of multiple and possibly conflicting unilateral measures or
uncertainties impacting trade of products and services and
which may also affect our customers’ ability or willingness
to invest in capital expenditures and increase our costs or
have adverse impacts on our operations and supply chain.
We have a significant presence in emerging markets in which
the political, economic, legal and regulatory systems are less
predictable than in countries with more developed institutions.
These markets represent a significant portion of our total
sales, and a significant portion of expected future industry
growth. Most of our suppliers are located in, and our products
are manufactured and assembled in, emerging markets,
particularly in Asia. Our business and investments in these
markets may be subject to risks and uncertainties, including
unfavorable or unpredictable treatment in relation to tax
matters, exchange controls, restrictions affecting our ability to
make cross-border transfers of funds, regulatory proceedings,
unsound or unethical business practices, challenges in
protecting our IPR, information security, nationalization,
inflation, currency fluctuations or the absence of or
unexpected changes in regulation, as well as other
unforeseeable operational risks.
Our business and results of operations may be adversely
affected by regulation favoring the local industry participants,
as well as other measures with potentially protectionist
objectives or outcomes that host governments in various
countries may take, including the introduction of local technical
standards that divert from the globally adopted standards.
Governments and regulators, particularly after changes in
political regimes, may make legal and regulatory changes, slow
down or reverse the adoption of favorable policy measures,
or interpret and apply existing laws in ways that make our
products and services less appealing to customers or require
us to incur substantial costs, change our business practices
or prevent us from offering our products and services. In
particular, there is a growing trend in many countries to require
minimum local content in products and/or services, and we
may be required to invest in certain movement of operations
or joint ventures to retain market share. Restrictive
government policies or actions, such as the ones we saw in
relation to the COVID-19 pandemic, or limitations on visas
or work permits for certain foreign workers, may make it
difficult for us to move our employees into and out of these
jurisdictions. Our operations and employee recruitment and
retention depend on our ability to obtain the necessary visas
and work permits for our employees to travel and work in the
jurisdictions in which we operate. The impact of changes in or
uncertainties related to general regulation and trade policies
could adversely affect our business and results of operations
even in cases where the regulations do not directly apply to us
or our products and services.
Changes in various existing regulations or in their application
to current or new technologies, products or
telecommunications and technology sectors in general, or
emerging new regulation in areas such as security, privacy,
digital economy or sustainable finance, may adversely affect
our operations and business results.
We develop our products based on existing regulations and
technical standards. In the case of new technology, we must
often rely on our predictions for and interpretation of
unfinished technical standards and upcoming or draft
regulations or, in certain cases, have products developed in the
absence of applicable regulations and standards.
Fragmentation of rules, lengthy legislative processes and
unpredictability of regulatory changes present a particular
challenge. Due in part to this fragmentation, we face a risk in
the inability to meet regulatory or market expectations on
security and privacy in our products and services, and
perceived or actual breaches of our information systems or
customer information systems if fault is attributable to Nokia.
An increase in regulation of the digital economy and
telecommunications following the European Commission’s
ambitious Green Deal and Path to Digital Decade could fail to
find the right balance between political ambitions and practical
considerations, which might negatively affect Nokia and have
a stifling effect on innovation due to strict product liability
requirements, limits on the use of data, and extensive due
diligence and reporting requirements. From a spectrum policy
perspective, unrealistic spectrum pricing, failure to enable
access to additional spectrum in various bands and/or failure
to achieve frequency band harmonization could also adversely
impact Nokia’s customers and Nokia itself.
Changes in applicable data and privacy-related regulatory
frameworks, such as the EU General Data Protection Regulation
(GDPR), EU AI Act, the Data Act and the recent adoption of EU
eEvidence Regulations and the upcoming ePrivacy Regulations,
including similar regulations in other countries and their
application may adversely affect our business, including
possible changes that increase costs, limit or restrict
possibilities to offer products or services, or reduce or could be
seen to reduce the privacy aspects of our offerings. For
instance, countries could require governmental interception
capabilities or issue regulations aimed at allowing direct
governmental access to data for the products and services we
offer. Such requirements or regulations could adversely affect
us, if, among other things, we decide to
reduce our sales to such markets or if such requirements or
regulations would be limiting our ability to use components,
products or software that we have developed or sourced from
other companies.
Our current business models and operations rely on certain
centralized data processing solutions and cloud or remote
delivery-based services for distribution of services and
software or data storage, which have certain inherent risks,
including those stemming from applicable regulatory regimes,
including data protection or data localization, that may cause
limitations in implementing such business models or
conducting business. An increase in the protectionist stances
of governments around the world, which impact the free flow
of data across borders, has already affected and may further
affect our global service delivery model. Furthermore, we
observe that enforcement actions and investigations by
regulatory authorities related to data security incidents and
privacy violations continue to increase. Unauthorized
disclosure, transfer or loss of sensitive or confidential data,
whether through systems failure, employee negligence, fraud
or misappropriation, by us, our vendors or other parties with
whom we do business (if they fail to meet the standards we
impose) could subject us to significant litigation, monetary
damages, regulatory enforcement actions, fines and criminal
prosecution in one or more jurisdictions.
Artificial intelligence can provide useful tools to augment our
capabilities and help us work more efficiently. Those could help
us use large volumes of data more efficiently and reliably and
assist us in performing tasks which are too difficult to perform
only manually. Their use has many advantages, but also risks
Business overview | Corporate governance | Operating and financial review and prospects | General facts on Nokia | Financial statements | Other information | 125 | |||||||
Risk factors continued
Nokia Annual Report on Form 20-F 2023
and challenges related to such topics as intellectual property
rights, security, confidentiality, and privacy.
We are seeing an increase in climate and other sustainability-
related regulations and customer requirements globally. In the
longer term, such regulations or requirements could impact,
for instance, our energy, component and logistic costs or
competitiveness of our product offering, as well as affect
availability of financing from ESG-focused investors or financial
institutions. Changes to existing regulation related to
Sustainable Finance, such as the EU Taxonomy Regulation and
its delegated acts, the new EU Corporate Sustainability
Reporting Directive and the related delegated acts, as well as
announced and upcoming regulations such as the EU Carbon
Border Adjustment Mechanism Regulation, the EU Corporate
Due Diligence Directive, the US SEC Climate Disclosure Rule, the
California Corporate Data Accountability Act and the Climate
Related Financial Risk Law will lead to more detailed reporting
obligations, controls and documentation requirements and
could also affect our ability to work with certain suppliers, as
well as have an impact on how our products and sustainability
footprint are perceived by the markets. For example, the EU
Taxonomy Regulation aims to define rules for which economic
activities contribute to sustainability objectives and mandates
companies to report the share of their turnover, capital
expenses and operating expenses aligned with specified
technical criteria. If our business activities do not meet all the
technical criteria as defined in the EU Taxonomy Regulation,
or if our offering is not recognized by other similar standards
developed around the world, it could potentially have some
impact on our financing costs, share price or brand value in the
longer term, depending on how such standards are interpreted
and used by the markets, financial institutions and investors in
the future.
We operate in many jurisdictions around the world, and
we are subject to various legal frameworks addressing
corruption, fraud, competition, privacy, security, trade
policies, environment, human rights, supply chains and
other risk areas. At any given time, we may be subject
to inspections, investigations, claims, and government
proceedings, and the extent and outcome of such
proceedings may be difficult to estimate with any certainty.
We may be subject to material fines, penalties and other
sanctions as a result of such investigations.
Bribery and anti-corruption laws in effect in many countries
prohibit companies and their intermediaries from making
improper payments to public officials or private individuals for
the purpose of obtaining new business, maintaining existing
business relationships or gaining any business advantage.
Certain anti-corruption laws such as the United States Foreign
Corrupt Practices Act (FCPA) also require the maintenance of
proper books and records, and the implementation of controls
and procedures in order to ensure that a company’s operations
do not involve corrupt payments. Since we operate throughout
the world and given that some of our customers are
government-owned entities and that our projects and
agreements often require approvals from public officials, there
is a risk that our employees, suppliers or commercial third-
party representatives may take actions that are in violation of
our compliance policies and of applicable anti-corruption laws.
In many parts of the world where we operate, local practices
and customs may be inconsistent with our policies, including
the Nokia Code of Conduct, and could violate anti-corruption
laws, including the FCPA and the UK Bribery Act 2010, and
applicable European Union regulations, as well as applicable
economic sanctions, embargoes and applicable competition
and privacy laws. Our employees, or other parties acting on
our behalf, could violate policies and procedures intended to
promote compliance with anti-corruption laws, economic
sanctions, competition or privacy laws or other applicable
regulations. Violations of these laws by our employees or other
parties acting on our behalf, regardless of whether we had
participated in such acts or had knowledge of such acts, could
result in us or our employees becoming subject to criminal
or civil enforcement actions, including fines or penalties,
disgorgement of profits and suspension or disqualification of
sales. Additionally, violations of law or allegations of violations
may result in reputational harm and loss of business and
adversely affect our brand and reputation. Detecting,
investigating and resolving such situations may also result in
significant costs, including the need to engage external
advisers, and consume significant time, attention and
resources from our management and other key employees.
The results and costs of such investigations or claims may be
difficult to predict and could lead to, for instance, lengthy
disputes, fines, fees or indemnities, costly settlement or the
deterioration of the Nokia brand. Furthermore, even without
allegations of misconduct against us, our employees or other
parties acting on our behalf, we may face loss of business as
a result of improper conduct or alleged improper conduct by
our competitors.
As part of mergers and acquisitions, we may be subject to
claims, fines, investigations or assessments for conduct that we
failed to or were unable to discover or identify in the course of
performing our due diligence, including unknown or unasserted
liabilities and issues relating to fraud, trade compliance, non-
compliance with applicable laws and regulations, improper
accounting policies or other improper activities.
Our governance, internal controls and compliance processes
could fail to detect errors or wrongdoings and to prevent
regulatory penalties at corporate level, in operating
subsidiaries and joint ventures.
Nokia is a publicly listed company and, as such, subject to
various securities and accounting rules and regulations. For
instance, we must monitor and assess our internal control over
financial reporting and its compliance with the applicable rules
and regulations. A failure of our corporate functions, our
business groups, our operating subsidiaries or our joint
ventures to maintain effective internal controls over financial
reporting, or to comply with the applicable securities and
accounting rules and regulations, could adversely affect the
accuracy and timeliness of our financial reporting, which could
result, for instance, in loss of confidence in us or in the accuracy
and completeness of our financial reports, or otherwise in the
imposition of fines or other regulatory measures, which could
have a material adverse effect on us.
Integrity and high ethical standards are an essential part of
our culture. However, despite our Group-wide compliance
measures, including ethical business trainings and other
actions (including towards our suppliers), we may not be able
to prevent breaches of law or governance standards within our
business, subsidiaries, joint ventures or in our supply chain.
If we fail to or are unable to comply with applicable law and
regulations, we could experience penalties and adverse rulings
in enforcement and other proceedings.
We are subject to litigation proceedings, which may be
disruptive and expensive. In addition, an unfavorable
outcome of litigation, arbitration, agreement-related
disputes or product liability-related allegations against
our business could have a material adverse effect on us.
We are a party to lawsuits, arbitration proceedings, agreement-
related disputes and product liability-related allegations in
the normal course of our business. Litigation, arbitration or
agreement-related disputes can be expensive, lengthy and
disruptive to normal business operations and divert the efforts
of our management. Moreover, the outcomes of complex legal
Business overview | Corporate governance | Operating and financial review and prospects | General facts on Nokia | Financial statements | Other information | 126 | |||||||
Risk factors continued
Nokia Annual Report on Form 20-F 2023
proceedings or agreement-related disputes are difficult to
predict. An unfavorable resolution of a particular lawsuit,
arbitration proceeding or agreement-related dispute could have
a material adverse effect on us. The investment or acquisition
decisions we make may subject us to litigation arising from
minority shareholders’ actions and investor dissatisfaction with
the activities of our business. Shareholder disputes, if resolved
against us, could have a material adverse effect on us.
We record provisions for pending claims when we determine
that an unfavorable outcome is likely and the loss can
reasonably be estimated. Although we believe our provisions
for pending claims are appropriate, due to the inherent
uncertain nature of legal proceedings, the ultimate outcome or
actual cost of settlement may materially differ from estimates.
Although our products are designed to meet all relevant
safety standards and other recommendations and regulatory
requirements globally, we cannot guarantee we will not become
subject to product liability claims or be held liable for such
claims, which could have a material adverse effect on us. We
have been involved in several lawsuits alleging adverse health
effects associated with our products, including those caused by
electromagnetic fields, and the outcome of such procedures is
difficult to predict, including potentially significant fines or
settlements. Even a perceived risk of adverse health effects of
mobile devices or base stations could have a material adverse
effect on us, for instance, through a reduction in the demand
for mobile devices, and a decreased demand for mobile networks
or increased difficulty in obtaining sites for base stations.
For a more detailed discussion of litigation to which we are a
party, refer to Note 6.1. Commitments, contingencies and legal
proceedings, in our consolidated financial statements.
We are involved in joint ventures and other affiliated
companies with their own governance and system
infrastructure and are exposed to risks inherent to
companies under joint management or not having direct
management control.
We have a number of joint ventures, including those where
Nokia is the minority partner, and other affiliated companies
with their own governance and system infrastructure where
Nokia does not have direct management control. The
agreements related to our joint ventures may require
unanimous consent or the affirmative vote of a qualified
majority of the shareholders to take certain actions, thereby
possibly slowing down the decision-making process or
impairing our ability to implement our key policies and
practices, such as our compliance processes and culture, in a
comprehensive or timely manner. In addition, joint venture
companies and other affiliated companies having their own
governance and system infrastructure, such as our local service
companies focusing on networks field services, involve inherent
risks such as those associated with a complex corporate
governance structure, lack of transparency or uniform controls
and procedures and consequent risks of compliance breaches
or other similar issues, or issues in dissolving such entities or
divesting their shareholdings, assets and liabilities, and may
also involve negative public perceptions caused by the joint
venture partner that are adverse to us.
We engage in the installation and maintenance of undersea
telecommunications cable networks and related telecom
solutions. During this activity, we may cause damage to
existing undersea infrastructure, for which we may ultimately
be held responsible.
We supply, install and maintain submarine optical fiber cable
networks linking mainland to islands, island to island or several
points along a coast. Our activities also include the provision
of optical fiber infrastructure to oil and gas platforms and
other offshore installations. Despite precautionary measures,
there is a risk that previously laid infrastructure, such as third-
party fiber optic cables, electrical power lines or hydrocarbon
pipelines, may go undetected and be damaged during the
process of laying or maintaining the telecommunications
cables. Such an event could potentially cause temporary
business interruption to third parties operating in the same
area, environmental incidents, safety accidents, unwanted
media or regulatory attention, loss of reputation, litigation,
repair costs or compensation payments for the affected
parties. While we have contractual limitations in place,
maintain insurance coverage to limit our exposure, and have
expertise and established ways of working that minimize such
risks, these protections may be insufficient to cover such
exposure entirely.
Financial and tax-related uncertainties
We have operations in many countries with different tax laws
and rules, which may result in complex tax issues and
disputes.
Taxation or other fees collected by governments or
governmental agencies may result in unexpected payment
obligations, and in response to prevailing difficult economic
conditions in the public sector, coupled with already enacted
and proposed fundamental changes in international tax
regulations, there may be an increased aggressiveness in
collecting such fees or taxes. We may be obliged to pay
additional taxes for past periods as a result of changes in law,
or changes of tax authority practice or interpretation (possibly
with retroactive effect in certain cases), or inaccurate
interpretations of tax laws by us resulting potentially in a
material adverse effect on our cash flow and financial position.
In particular, potential changes in reallocation of taxing rights
and other fundamental international tax principles, the OECD
Pillar project and digital business-related initiatives, our wide
geographical footprint of operations and activities and changes
in tax laws or global laws regarding transfer pricing could
adversely impact our business, operating results and overall
tax burden. There may also be unforeseen tax expenses that
turn out to have an unfavorable impact on us, adverse tax
consequences related to past acquisitions and divestments,
and potential tax liabilities that we are currently not aware of.
As a result, and given the inherently unpredictable nature of
taxation, our tax rate may change from its current level and
our cash flows regarding taxes may not be stable.
As a company with global operations, we are subject to tax
investigations in various jurisdictions, and such proceedings can
be lengthy, involve actions that can hinder local operations and
affect unrelated parts of our business, and the outcome of
such proceedings is difficult to predict. While we have made
provisions for certain tax issues, the provisions we have made
may not be adequate to cover such increases.
In the context of our sale of the Devices & Services business to
Microsoft, we are required to indemnify Microsoft for certain
tax liabilities, including (i) tax liabilities of the Nokia entities
acquired by Microsoft in connection with the closing of the sale
of the Devices & Services business, (ii) tax liabilities associated
with the assets acquired by Microsoft and attributable to tax
periods ending on or prior to the closing date of the sale of the
Devices & Services business, and (iii) tax liabilities relating to
the pre-closing portion of any taxable period that includes the
closing date of the sale of the Devices & Services business.
Our actual or anticipated performance, among other factors,
could reduce our ability to utilize our tax attributes and
deferred tax assets.
Deferred tax assets recognized on tax losses, unused tax
credits and tax-deductible temporary differences are
dependent on our ability to offset such items against future
Business overview | Corporate governance | Operating and financial review and prospects | General facts on Nokia | Financial statements | Other information | 127 | |||||||
Risk factors continued
Nokia Annual Report on Form 20-F 2023
taxable income within the relevant tax jurisdiction. Such
deferred tax assets are also based on our assumptions on
future taxable earnings, and these may not be realized as
expected which may cause the deferred tax assets to be
materially reduced. Any such reduction could have a material
effect on us. As an example, Nokia derecognized EUR 2.9 billion
deferred tax assets related to Finland in 2020 and
re-recognized EUR 2.5 billion of deferred tax assets related
to Finland in 2022. Additionally, our earnings have been
unfavorably affected in the past, and may continue to be in
the future, in the event that no tax benefits are recognized
for certain deferred tax items.
We may not have access to sources of funding on favorable
terms, or at all.
In periods when the capital and credit markets experience
significant volatility, the amounts, sources and cost of capital
available to us may be adversely affected. Deteriorating
economic conditions or financial uncertainty in any of the
markets in which we sell our products could reduce business
confidence and adversely impact spending patterns, and
thereby could adversely affect the amounts, sources and cost
of capital available to us. Our business requires a significant
amount of cash and we continue to invest in our R&D and other
future capabilities. We rely on multiple sources of funding for
short-term and long-term capital and aim to minimize the
liquidity risk by maintaining a sufficient cash position and
having committed credit lines in place. However, if economic
conditions deteriorate or the credit market tightens, there can
be no assurances that we will be able to generate sufficient
amounts of capital or to maintain an efficient capital structure
from time to time.
We also may not be able to have access to additional sources
of funds that we may need from time to time with reasonable
terms, or at all. If we cannot access capital or sell receivables
on a commercially viable basis, our business, financial condition
and cash flow could materially suffer.
We may not be able to maintain our investment grade
credit ratings
Moody’s, S&P Global Ratings, Fitch and other credit rating
agencies have assigned credit ratings to us. Following the
upgrades by Moody’s and S&P Global Ratings in February 2023,
we updated our goal from re-establishing investment grade
credit ratings to maintaining our investment grade credit
ratings. However, there can be no assurances that we will be
able to maintain our current investment grade credit ratings.
In the event our credit rating is downgraded, it could have a
material adverse effect, for instance, on our cost of funds
and related margins, our business and results of operations,
financial condition, liquidity, or access to capital markets.
Due to our global operations, our net sales, costs and results
of operations, as well as the US dollar value of our dividends
and market price of our ADSs, are affected by exchange
rate fluctuations.
We operate globally and are therefore exposed to foreign
exchange risks in the form of both transaction risks and
translation risks. Our policy is to monitor and hedge foreign
exchange rate exposures within defined exposure identification
horizons. We manage our operations to mitigate, but not to
eliminate, the impacts of exchange rate fluctuations and our
hedging activities may prove unsuccessful in mitigating the
potentially negative impact of exchange rate fluctuations.
Additionally, significant volatility in the relevant exchange rates
and interest rates may increase our hedging costs, as well
as limit our ability to hedge our exchange rate exposures
including, in particular certain emerging market currencies.
Furthermore, exchange rate fluctuations may have an adverse
effect on our net sales, costs and results of operations,
as well as our competitive position, through their impact
on our customers, suppliers and competitors.
We also experience other financial market-related risks,
including changes in interest rates and in prices of marketable
securities that we own. We may use derivative financial
instruments to reduce certain of these risks. If our strategies
to reduce such risks are not successful, our financial condition
and results of operations may be harmed.
Additionally, exchange rate fluctuations may materially affect
the US dollar value of any dividends or other distributions that
are paid in euro, as well as the market price of our ADSs.
Our pension and other post-employment benefit obligations
are subject to numerous factors that could result in a need
for increased funding, adversely affecting our results of
operations and cash flow.
We are exposed to various employee cost-related risks,
including those related to pension, and other post-
employment benefits (OPEB). In the US, we maintain significant
employee pension benefit plans and a significant retiree
welfare benefit plan (providing post-employment healthcare
benefits and post-employment life insurance coverage).
Outside the US, we contribute to pension schemes for large
numbers of current and former employees. The US and non-US
plans and schemes have funding requirements that depend on,
among other things, various legal requirements, how assets
set aside to pay for those obligations are invested, the
performance of financial markets, interest rates, assumptions
regarding the life expectancy of covered employees and
retirees, and medical cost inflation and medical care utilization.
To the extent that any of those variables change, the funding
required for those plans and schemes may increase, adversely
affecting our results of operations and cash flow.
The most significantly underfunded plans are in Germany
which do not currently have minimum regulatory funding
requirements. With respect to other significantly underfunded
plans, there are the OPEB plans in the US where Nokia is able to
fund the liabilities by utilizing IRC Section 420 transfers from
the US pension surplus up until 2032. More details about these
plans can be found in Note 3.4. Pensions and other post-
employment benefits in our consolidated financial statements.
The carrying amount of our goodwill may not be recoverable.
We assess the carrying amount of goodwill annually, or more
frequently if events or changes in circumstances indicate that
such carrying amount may not be recoverable. We assess the
carrying amount of other identifiable assets if events or
changes in circumstances indicate that their carrying amounts
may not be recoverable, for instance, if we would not generate
revenues from our businesses as anticipated, or if our
businesses would not generate sufficient positive operating
cash flows. These, or other factors, may lead to a decrease in
the value of our assets, including intangible assets and the
goodwill attributed to our businesses, resulting in impairment
charges that may adversely affect our net profit for the year.
While we believe the estimated recoverable values are
reasonable, actual performance in the short and long term
and our assumptions on which we base our calculations could
materially differ from our forecasts, which could impact future
estimates of our businesses’ recoverable values, and may
result in impairment charges.
Business overview | Corporate governance | Operating and financial review and prospects | General facts on Nokia | Financial statements | Other information | 128 | |||||||
Risk factors continued
Nokia Annual Report on Form 20-F 2023
Risks associated with ownership of our shares
The amount of dividend and/or repayment of capital and
other profit distributions such as share buybacks to
shareholders for each financial period is uncertain.
As announced on 25 January 2024, our Board proposes that
the Annual General Meeting authorizes the Board to resolve on
the distribution of an aggregate maximum of EUR 0.13 per
share as dividend from the retained earnings and/or as assets
from the reserve for invested unrestricted equity in respect of
financial year 2023. Furthermore, the Board initiated a share
buyback program under the authorization granted by the
Annual General Meetings to repurchase shares. The program
targets to return up to EUR 600 million of cash to shareholders
in tranches over a period of two years, subject to continued
authorization by the Annual General Meeting. The first phase of
the share buyback program is expected to begin in the first
quarter of 2024. Our Annual General Meeting 2023, held on 4
April 2023, authorized the Board to resolve on the distribution
of an aggregate maximum of EUR 0.12 per share as dividend
from the retained earnings and/or as assets from the reserve
for invested unrestricted equity in respect of the financial year
2022. Furthermore, in 2022, our Board initiated a share
buyback program, under the authorizations granted by Nokia’s
Annual General Meetings, to return up to EUR 600 million of
cash to shareholders in tranches over a period of two years.
The first phase of the share buyback program with a maximum
aggregate purchase price of EUR 300 million started on
14 February 2022 and ended on 11 November 2022. The
second EUR 300 million phase of the share buyback program
started on 2 January 2023 and it ended on 10 November 2023.
We cannot assure that we will distribute dividends and/or
capital repayments on the shares issued by us, nor is there any
assurance as to the amount of any dividend and/or repayment
of capital we may pay, including but not limited to situations
where we make commitments to increase our dividends.
Neither can we guarantee that we finalize the announced
share buyback program. The payment and the amount of any
dividend and/or repayment of capital as well as additional share
buyback programs is subject to the discretion of the general
meeting of our shareholders and our Board, and will depend
on available cash balances, expected cash flow generation,
anticipated cash needs, retained earnings, the results of
our operations and our financial condition and terms of
outstanding indebtedness, as well as other relevant factors
such as restrictions, prohibitions or limitations imposed by
applicable laws. Further, even if any conditions or factors
covering the issuance or distribution of dividends are met, the
Board or the shareholders have in the past decided, and may
going forward decide, not to issue or distribute dividends or
initiate additional buyback programs.
Our share and/or ADS price may be volatile and subject to
fluctuations.
Our share and/or ADS price may be volatile and could be
subject to fluctuations in response to various factors, some
of which are beyond our control. In addition to the factors
described in this “Risk Factors” section, other factors that
could cause fluctuations in our share price include, among
others, high volatility in the securities markets generally and
volatility in telecommunications and technology companies’
securities in particular, trading volumes, speculation in the
media or retail or institutional investment communities
regarding the Company and our prospects, future
developments in our industry and competitors, our financial
results and the expectations of financial analysts, as well as
the timing or content of any public communications, including
reports of operating results, by us or our competitors. Further,
factors in the public trading market for our stock may produce
price movements that may or may not comport with macro,
industry or company-specific fundamentals, including, without
limitation, the sentiment of retail investors (including as may be
expressed on financial trading and other social media sites and
online forums), the direct access by retail investors to broadly
available trading platforms, the amount and status of short
interest in our securities, access to margin debt, trading in
options and other derivatives on our common stock and any
related hedging and other trading factors.
The market price of, and trading volume for, our shares and/or
ADSs may change for reasons not necessarily related to our
actual operating performance. The capital markets have
experienced extreme volatility that has often been unrelated to
the operating performance of particular companies. In addition,
in the past, following periods of volatility in the market price of
a company’s securities, stockholders often institute securities
class action litigation against that company. This type of
litigation could result in substantial costs and divert our
management’s attention and resources, which could have a
material adverse effect on our cash flows, our ability to execute
our business strategy and our ability to make distributions to
our stockholders.
Non-Finnish shareholders are likely required to provide
detailed information to obtain advantageous withholding tax
treatment for dividends.
As described in more detail under “General facts on Nokia–
Taxation”, non-Finnish shareholders are required to provide
certain information in order to benefit from the reduced
dividend withholding tax rates set out in the applicable tax
treaties. Furthermore, custodians are required to fulfill certain
strict requirements and take over certain responsibilities and
assume liability for incorrectly applied withholding tax, or a
higher withholding tax rate will apply. Such requirements
will likely impose an additional administrative burden on
shareholders or result in the higher withholding rate
becoming applicable for non-Finnish shareholders.
Business overview | Corporate governance | Operating and financial review and prospects | General facts on Nokia | Financial statements | Other information | 129 | |||||||
Risk factors continued
Nokia Annual Report on Form 20-F 2023
Significant subsequent events
After 31 December 2023, no significant subsequent events have taken place.
Business overview | Corporate governance | Operating and financial review and prospects | General facts on Nokia | Financial statements | Other information | 130 | |||||||
Significant subsequent events
Nokia Annual Report on Form 20-F 2023

General facts
on Nokia
Business overview | Corporate governance | Operating and financial review and prospects | General facts on Nokia | Financial statements | Other information | 131 | |||||||
Nokia Annual Report on Form 20-F 2023
General facts on Nokia
American Depositary Shares
Fees and charges
ADS holders may have to pay the following service fees to the
Depositary:
Service | Fees, USD |
Issuance of ADSs | Up to 5 cents per ADS(1) |
Cancellation of ADSs | Up to 5 cents per ADS(1) |
Distribution of cash dividends or other cash distributions | Up to 2 cents per ADS |
Distribution of ADSs pursuant to (i) stock dividends, free stock distributions or (ii) exercises of rights to purchase additional ADSs | Up to 5 cents per ADS |
Distribution of securities other than ADSs or rights to purchase additional ADSs | Up to 5 cents per ADS(1) |
ADS transfer fee | 1.50 cents per transfer(1) |
(1)These fees are typically paid to the Depositary by the brokers on behalf of their
clients receiving the newly issued ADSs from the Depositary and by the brokers on
behalf of their clients delivering the ADSs to the Depositary for cancellation. The
brokers in turn charge these transaction fees to their clients.
Additionally, ADS holders are responsible for certain fees and
expenses incurred by the Depositary on their behalf and
certain governmental charges such as taxes and registration
fees, transmission and delivery expenses, conversion of foreign
currency and fees relating to compliance with exchange control
regulations. The fees and charges may vary over time.
In the event of refusal to pay the depositary fees, the
Depositary may, under the terms of the deposit agreement,
refuse the requested service until payment is received or may
set off the amount of the depositary fees from any distribution
to be made to the ADS holder.
Payments
In 2023, our Depositary made the following payments on our
behalf in relation to our ADS program:
Category | Payment, USD |
Settlement infrastructure fees (including the Depositary Trust Company fees) | 1 047 044.65 |
Proxy process expenses (including printing, postage and distribution) | 1 853 812.02 |
Legal fees | — |
NYSE listing fees | 500 000.00 |
Investor relations expenses | 9 095.92 |
Total | 3 409 952.59 |
Additionally for 2023, our Depositary reimbursed us
USD 6 000 000 mainly related to contributions towards our
investor relations activities, including investor meetings and
conferences and fees of investor relations service vendors,
and other miscellaneous expenses related to the listing of our
ADSs in the United States.
Controls and procedures
Our management, with the participation of our President and
CEO and our Chief Financial Officer, conducted an evaluation
pursuant to Rules 13a-15(e) and 15d-15(e) under the
Securities Exchange Act of 1934, as amended (the Exchange
Act), of the effectiveness of our disclosure controls and
procedures at 31 December 2023. Based on such evaluation,
our President and CEO and our Chief Financial Officer have
concluded that our disclosure controls and procedures
were effective.
Disclosure controls and procedures mean controls and other
procedures that are designed to ensure that information
required to be disclosed by us in the reports that we file or
submit under the Exchange Act is recorded, processed,
summarized and reported, within the time periods specified in
the Commission’s rules and forms, and that such information
required to be disclosed by us in the reports that we file or
submit under the Exchange Act is accumulated and
communicated to our management, including our President
and CEO and our Chief Financial Officer, or persons performing
similar functions, as appropriate to allow timely decisions
regarding required disclosures.
Management’s annual report on internal control over
financial reporting
Our management is responsible for establishing and
maintaining adequate internal control over financial reporting
for Nokia. Our internal control over financial reporting is
designed to provide reasonable assurance regarding the
reliability of financial reporting and the preparation and fair
presentation of published financial statements. Because of its
inherent limitations, internal control over financial reporting
may not prevent or detect misstatements. Also, projections of
any evaluation of effectiveness to future periods are subject to
the risk that controls may become inadequate because of
changes in conditions, or that the degree of compliance with
the policies or procedures may deteriorate.
Our management evaluated the effectiveness of our internal
control over financial reporting using the criteria described in
Internal Control – Integrated Framework (2013) issued by the
Committee of Sponsoring Organizations of the Treadway
Commission (COSO). Based on this evaluation, our
management has assessed the effectiveness of Nokia’s internal
control over financial reporting at 31 December 2023 and
concluded that such internal control over financial reporting
was effective.
The effectiveness of our internal control over financial
reporting at 31 December 2023 has been audited by Deloitte
Oy, an independent registered public accounting firm. Refer to
section “Reports of independent registered public accounting
firm”.
Changes in internal control over financial reporting
There have been no changes in our internal control over
financial reporting during 2023 that have materially affected,
or are reasonably likely to materially affect, our internal control
over financial reporting.
Business overview | Corporate governance | Operating and financial review and prospects | General facts on Nokia | Financial statements | Other information | 132 | |||||||
General facts on Nokia
Nokia Annual Report on Form 20-F 2023
Attestation report of the registered public
accounting firm
Refer to section “Reports of independent registered public
accounting firm”.
Exchange controls
There are currently no Finnish laws that may affect the import
or export of capital, or the remittance of dividends, interest or
other payments.
Government regulation
Nokia and its businesses are subject to direct and indirect
regulation in each of the countries in which we and our
customers do business. As a result, changes in or uncertainties
related to various types of regulations applicable to current
or new technologies, intellectual property, products, services,
company operations and business environment (e.g. labor laws,
taxation) could affect our business adversely. Moreover, the
implementation of technological or legal requirements could
impact our products and services, technology and patent
licensing activities, manufacturing and distribution processes,
and could affect the timing of product and services
introductions and the cost of our production, products and
services, as well as their commercial success. Also, our business
is subject to the impacts of changes in economic and trade
policies. Export control, tariffs or other fees or levies imposed
on our products and services and environmental, product
safety and security and other regulations that adversely affect
the export, import, pricing or costs of our products and
services, as well as export prohibitions (sanctions) enacted by
the EU, the United States or other countries or regions could
adversely affect our net sales and results of operations.
Further, potential governmental intervention in supply chain
(e.g. prohibiting imports from certain geographies or imposing
certain criteria on selection of suppliers) may impact
Nokia’s operations.
For example, depending on the geography, our products and
services are subject to a wide range of government regulations
that might have a direct impact on our business, including, but
not limited to, regulation related to product certification,
standards, spectrum management, provision of
telecommunications services, privacy and data protection,
competition and sustainability. The EU-level or local member
state regulation has a direct impact on many areas of our
business, markets and customers within the EU. The European
regulation influences, for example, conditions for innovation
for telecommunications infrastructure and internet and related
services, as well as technology and patent licensing, investment
in fixed and wireless broadband communication infrastructure
and operation of global data flows. Additionally, with respect to
certain developing market countries, the business environment
we operate in can be affected by localization requirements.
We proactively exchange views and address the impact of any
planned changes to the regulatory environment on our
business activities with state agencies, regulators and other
decision-makers either through our government relations
representatives in various geographies and through our experts,
or indirectly through memberships in industry associations.
Sales in United States-sanctioned countries
General
We are a global company and have sales in most countries of
the world. Nokia is committed to the highest standards of
ethical conduct, and adheres to all applicable national and
international trade-related laws. As a leading international
telecommunications company with global operations, Nokia has
a presence also in countries subject to international sanctions.
All operations of Nokia, and in particular any operations
undertaken in countries targeted by sanctions, are conducted
in accordance with our comprehensive and robust internal
compliance program to ensure that they are in full compliance
with all applicable laws and regulations. In addition, we
continuously monitor international developments and assess
the appropriateness of our presence and business in these,
and all, markets. Nevertheless, business in these markets is
marked by complexity and uncertainty.
We cannot exclude the possibility that third parties may
unlawfully divert our products to these countries from other
countries in which we sell them, or that, for services distributed
through the internet, third parties could have accessed them
in markets or countries for which they are not intended by
circumventing the industry standard protective mechanisms,
such as IP address blocks, despite our efforts in implementing
measures to prevent such actions.
Disclosure pursuant to Section 219 of the Iran Threat
Reduction and Syria Human Rights Act of 2012
We operate in Iran in compliance with applicable economic
sanctions and other trade-related laws. We provide
telecommunications equipment with ancillary services to
network operator customers and internet service providers.
We do not deliver equipment and services to Iran for military
purposes, or for the purpose of limiting political discourse,
blocking legitimate forms of free speech or conducting
surveillance of individuals.
In connection with the business activities relating to Iran, we
have two local offices in Iran that employed one employee at
the end of 2023 through a branch of a Finnish subsidiary. Nokia
is the controlling shareholder in Pishahang Communications
Network Development Company (Pishahang). The other
minority shareholder in Pishahang is Information Technology
Application Development TACFAM Company (Tacfam).
We continue to maintain routine contacts with governmental
agencies in Iran as required, for example, to maintain a legal
presence and office facilities in Iran, pay taxes and employ
Iranian nationals.
To our knowledge, none of our sales in Iran in 2023 are
required to be disclosed pursuant to ITRA Section 219,
with the possible exception of the following.
In 2023, we continued only with our existing contractual
obligations in compliance with applicable economic sanctions
and other trade-related laws including limited local delivery of
radio products and transmission licenses, including associated
services, to MTN Irancell.
Although it is difficult to evaluate with any reasonable degree
of certainty, we have concluded that we cannot exclude the
possibility that MTN Irancell or Tacfam is owned or controlled,
directly or indirectly, by the government of Iran. None of these
activities involve US affiliates of Nokia, or any persons from the
United States.
Business overview | Corporate governance | Operating and financial review and prospects | General facts on Nokia | Financial statements | Other information | 133 | |||||||
General facts on Nokia continued
Nokia Annual Report on Form 20-F 2023
Nokia does not normally allocate net profit on a country-by-
country or activity-by-activity basis, other than as set forth
in Nokia’s consolidated financial statements prepared in
accordance with IFRS. Therefore, for this exercise Nokia will
reflect its sales margin in lieu of the net profit/loss. In 2023,
we recognized net sales of approximately EUR 1 million from
business with MTN Irancell. Sales margin from this customer
amounted to 99%.
Although we evaluate our business activities on an ongoing
basis, we intend to continue not accepting any new business in
Iran in 2024 and intend to only complete existing contractual
obligations in Iran in compliance with applicable economic
sanctions and other trade-related laws.
Taxation
General
The statements of the United States and Finnish tax laws set
out below are based on the laws in force as of the date of this
report and may be subject to any changes in US or Finnish law,
and in any double taxation convention or treaty between the
United States and Finland, occurring after that date, possibly
with retroactive effect.
For purposes of this discussion, “US Holders” are beneficial
owners of ADSs that: (i) hold the ADSs as capital assets; (ii) are
citizens or residents of the United States, corporations created
in or organized under US law, estates whose income is subject
to US federal income tax, or trusts that elect to be treated as a
US person or are both subject to the primary supervision of a
US court and controlled by a US person; and (iii) in each case,
are considered residents of the United States for purposes of
the current income tax convention between the United States
and Finland, referred to as the “Treaty”, and the limitation on
benefits provisions therein. Special rules apply to US Holders
that are also residents of Finland and to citizens or residents of
the United States that do not maintain a substantial presence,
permanent home or habitual abode in the United States. For
purposes of this discussion, it is assumed that the Depositary
and its custodian will perform all actions as required by the
deposit agreement with the Depositary and other related
agreements between the Depositary and Nokia.
If a partnership holds ADSs (including for this purpose any
entity or arrangement treated as a partnership for US federal
income tax purposes), the tax treatment of a partner will
depend upon the status of the partner and activities of the
partnership. If a US Holder is a partnership or a partner in a
partnership that holds ADSs, the holder is urged to consult its
own tax adviser regarding the specific tax consequences of
owning and disposing of its ADSs.
Because this summary is not exhaustive of all possible tax
considerations – such as situations involving financial
institutions, banks, tax-exempt entities, pension funds, US
expatriates, real estate investment trusts, persons that are
dealers in securities, persons who own (directly, indirectly or
by attribution) 10% or more of the share capital or voting
stock of Nokia, persons who acquired their ADSs pursuant
to the exercise of employee stock options or otherwise as
compensation, or US Holders whose functional currency is not
the US dollar, who may be subject to special rules that are
not discussed herein – holders of shares or ADSs that are US
Holders are advised to satisfy themselves as to the overall US
federal, state and local tax consequences, as well as to the
overall Finnish and other applicable non-US tax consequences,
of their ownership of ADSs and the underlying shares by
consulting their own tax advisers. This summary does not
discuss the treatment of ADSs that are held in connection with
a permanent establishment or fixed base in Finland, and it does
not address the US Medicare tax on certain investment income.
For the purposes of both the Treaty and the US Internal
Revenue Code of 1986, as amended, referred to as the
“Code”, US Holders of ADSs will be treated as the owners
of the underlying shares that are represented by those ADSs.
Accordingly, the following discussion, except where otherwise
expressly noted, applies equally to US Holders of ADSs, on the
one hand, and to shares on the other.
The holders of ADSs will, for Finnish tax purposes, be treated
as the owners of the shares that are represented by the ADSs.
The Finnish tax consequences for the holders of shares, as
discussed below, also apply to the holders of ADSs.
US taxation of cash dividends
For US federal income tax purposes, the gross amount of
dividends paid to US Holders of shares or ADSs out of our
current or accumulated earnings and profits, including any
related Finnish withholding tax, generally will be included in
gross income as foreign source dividend income. We do not
expect to maintain calculations of our earnings and profits
under US federal income tax principles; therefore, US Holders
should expect that the entire amount of any distribution
generally will be reported as dividend income. Dividends will not
be eligible for the dividends received deduction allowed to
corporations under the Code. The amount includible in income
(including any Finnish withholding tax) will equal the US dollar
value of the payment, determined at the time such payment
is received by the Depositary (in the case of ADSs) or by the
US Holder (in the case of shares), regardless of whether the
payment is in fact converted into US dollars. Generally, any gain
or loss resulting from currency exchange rate fluctuations
during the period between the time such payment is received
and the date the dividend payment is converted into US dollars
will be treated as US source ordinary income or loss to a
US Holder.
Special rules govern and specific elections are available to
accrual method taxpayers to determine the US dollar amount
includible in income in the case of a dividend paid (and taxes
withheld) in foreign currency. Accrual basis taxpayers are urged
to consult their own tax advisers regarding the requirements
and elections applicable in this regard.
Dividends received generally will constitute foreign source
“passive category income” for foreign tax credit purposes.
Subject to certain limitations, Finnish taxes withheld may be
eligible for credit (not in excess of the applicable Treaty rate)
against a US Holder’s US federal income tax liability.
Additionally, if Nokia makes a distribution from its reserve for
invested unrestricted equity when it does not have current or
accumulated earnings and profits, a US Holder may not be able
to claim such credit.
In lieu of a credit, a US Holder may elect to claim a deduction
in respect of its Finnish income taxes provided the deduction
is claimed for all of the foreign taxes paid by the US Holder in
that particular taxable year. A deduction does not reduce US
tax on a dollar-for-dollar basis like a tax credit. The deduction,
however, is not subject to the limitations applicable to foreign
tax credits.
Business overview | Corporate governance | Operating and financial review and prospects | General facts on Nokia | Financial statements | Other information | 134 | |||||||
General facts on Nokia continued
Nokia Annual Report on Form 20-F 2023
Provided that certain holding period and other requirements
are met, individuals and certain other non-corporate US
Holders are eligible for reduced rates of US federal income tax
at a maximum rate of 20% in respect of “qualified dividend
income”. Dividends that Nokia pays with respect to its shares
and ADSs generally will be qualified dividend income if certain
holding periods are met and Nokia was neither a passive
foreign investment company (PFIC) in the taxable year prior to
the year in which the dividend was paid nor in the taxable year
in which the dividend is paid. Nokia currently believes that
dividends it pays with respect to its shares and ADSs will
constitute qualified dividend income for US federal income tax
purposes; however, this is a factual matter and is subject to
change. Nokia anticipates that its dividends will be reported as
qualified dividends on Forms 1099-DIV delivered to US Holders.
US Holders of shares or ADSs are urged to consult their own
tax advisers regarding the availability to them of the reduced
dividend tax rate in light of their own particular situation and
the computations of their foreign tax credit limitation with
respect to any qualified dividends paid to them, as applicable.
We believe we should not be classified as a PFIC for US federal
income tax purposes for the taxable year ended 31 December
2023 and we do not expect to become a PFIC in the
foreseeable future. US Holders are advised, however, that
this conclusion is a factual determination that must be made
annually and thus may be subject to change. If we were to be
classified as a PFIC, the tax on distributions on our shares or
ADSs and on any gains realized upon the disposition of our
shares or ADSs generally would be less favorable than as
described herein. Dividends paid by a PFIC are not “qualified
dividend income” and are not eligible for reduced rates of
taxation. Additionally, US persons who are shareholders in a
PFIC generally will be required to file an annual report disclosing
the ownership of such shares and certain other information.
US Holders should consult their own tax advisers regarding the
application of the PFIC rules, including the related reporting
requirements, to their ownership of our shares or ADSs.
Finnish withholding taxes on cash dividends
Under the Finnish Income Tax Act and Act on Taxation of
Non-residents’ Income, non-residents of Finland are generally
subject to a withholding tax at a rate of 30% on dividends paid
by a Finnish resident company. Further, under the Finnish
Prepayment Act, 50% preliminary tax must be withheld on
dividends paid in certain situations. However, pursuant to the
Treaty, dividends paid to US Holders are generally subject to
Finnish withholding tax at reduced rates. Under the Finnish
Income Tax Act and tax court practice, the distribution of funds
from reserves for invested unrestricted equity by a listed
company such as Nokia is taxed as a distribution of a dividend.
As of 1 January 2021, nominee registered shares are generally
subject to a withholding tax at a rate of 35% on dividends paid
by Nokia. This withholding tax regime is based on OECD’s
TRACE (Treaty Relief and Compliance Enhancement) model.
Under the rules, the 35% withholding tax will generally be
applied on dividend distributions on nominee registered
shares by listed companies such as Nokia, unless custodians
fulfill certain strict requirements and are willing to take over
certain responsibilities (e.g. registration with the Finnish
Tax Administration (so-called authorized intermediary),
identification of the beneficial owner of the dividend and
collecting and submitting detailed recipient information to the
Finnish Tax Administration using specific filing procedures).
Furthermore, application of reduced withholding tax rates at
source require that the custodian and dividend distributor
are willing to assume liability of incorrectly applied withholding
tax. If the custodian only registers with the Finnish Tax
Administration and submits (or undertakes to submit) the
detailed recipient details to the Finnish Tax Administration,
the 30% withholding tax rate can be applied, instead of 35%.
Any tax withheld in excess can be reclaimed after the
calendar year of the dividend payment by submitting a refund
application to the Finnish Tax Administration no later than
by the end of the third calendar year following the dividend
payment year. During the year of dividend payment, the refund
can be processed if custodians and dividend distributor fulfill
the above-mentioned requirements laid down for actual
dividend distribution.
It is exceptionally also possible that any tax not withheld at
source is later assessed directly to the shareholder by the
Finnish Tax Administration, in cases where the failure to
withhold tax at source is not due to negligence of the custodian
or the dividend distributor.
Holders of shares or ADSs are urged to consult their own
custodian regarding the availability of reduced withholding tax
rates in light of their own particular situation and approach
their custodian in terms of their responsibilities, as well as
consult their own tax advisers regarding the availability
to them of the tax credit from dividend withholding tax.
US and Finnish tax on sale or other disposition
A US Holder generally will recognize taxable capital gain or loss
on the sale or other disposition of ADSs in an amount equal
to the difference between the US dollar value of the amount
realized and the adjusted tax basis (determined in US dollars)
in the ADSs. If the ADSs are held as a capital asset, this gain
or loss generally will be long-term capital gain or loss if, at the
time of the sale, the ADSs have been held for more than one
year. Any capital gain or loss, for foreign tax credit purposes,
generally will constitute US source gain or loss. In the case of a
US Holder that is an individual, long-term capital gain generally
is subject to US federal income tax at preferential rates. The
deductibility of capital losses is subject to significant limitations.
The deposit or withdrawal by a US Holder of shares in exchange
for ADSs or of ADSs for shares under the deposit agreement
generally will not be subject to US federal income tax or Finnish
income tax.
The sale by a US Holder of the ADSs or the underlying shares,
other than an individual who, by reason of his residence in
Finland for a period exceeding six months, is or becomes liable
for Finnish income tax according to the relevant provisions of
Finnish tax law, generally will not be subject to income tax in
Finland, in accordance with Finnish tax law and the Treaty.
Business overview | Corporate governance | Operating and financial review and prospects | General facts on Nokia | Financial statements | Other information | 135 | |||||||
General facts on Nokia continued
Nokia Annual Report on Form 20-F 2023
Finnish transfer tax
The transfer of our shares and ADSs for cash through a broker
or other appropriate intermediary is generally not subject to
Finnish transfer tax. Non-brokered transfers will generally be
exempted from the transfer tax if the transferee has been
approved as a trading party in the market where the transfer
is executed, or other conditions are met. Transfers of ADSs on
the New York Stock Exchange are exempt. Where the transfer
does not fulfill the above requirements, and either the buyer
or the seller is a Finnish resident or a Finnish branch office of a
specified foreign financial service provider, the buyer is liable
to pay transfer tax of 1.6% of the transaction price where the
resulting tax is at least EUR 10. Parliament has approved a
change in the transfer tax rate from 1.6% to 1.5% entering
into force as of 1 January 2024 (no change to EUR 10 de
minimis threshold). The new reduced tax rate will be applied
retroactively to transfers that have been bindingly agreed upon
on or after 12 October 2023. If transfer tax on such transfers
is paid during 2023, the old 1.6% tax rate should still be used.
The Finnish Tax Administration will in such case refund the
excess tax once the new rules have entered into force. Selling
shareholders should consult their tax advisers regarding the
specific tax considerations of a sale of our shares or ADSs.
Finnish inheritance and gift taxes
A transfer of an underlying share by gift or by reason of the
death of a US Holder and the transfer of an ADS are not subject
to Finnish gift or inheritance tax provided that none of the
deceased person, the donor, the beneficiary of the deceased
person or the recipient of the gift is resident in Finland.
Non-residents of the United States
Beneficial owners of ADSs that are not US Holders will not be
subject to US federal income tax on dividends received with
respect to ADSs unless such dividend income is effectively
connected with the conduct of a trade or business within the
United States. Similarly, non-US Holders generally will not
be subject to US federal income tax on any gain realized on
the sale or other disposition of ADSs, unless (a) the gain is
effectively connected with the conduct of a trade or business
in the United States or (b) in the case of an individual, that
individual is present in the United States for 183 days or more
in the taxable year of the disposition and other conditions
are met.
The United States information reporting and backup
withholding
Dividend payments with respect to shares or ADSs and
proceeds from the sale or other disposition of shares or ADSs
may be subject to information reporting to the Internal
Revenue Service and possible US backup withholding. Backup
withholding will not apply to a holder if the holder furnishes a
correct taxpayer identification number or certificate of foreign
status and makes any other required certification in connection
therewith, or if it is a recipient otherwise exempt from backup
withholding (such as a corporation). Any US persons required
to establish their exempt status generally must furnish a duly
completed IRS Form W-9 (Request for Taxpayer Identification
Number and Certification). Non-US holders generally are not
subject to US information reporting or backup withholding.
However, such holders may be required to provide certification
of non-US status (generally on IRS Form W-8BEN for individuals
and Form W-8BEN-E for corporations) in connection with
payments received in the United States or through certain
US-related financial intermediaries. Backup withholding is not
an additional tax. Amounts withheld as backup withholding may
be credited against a holder’s US federal income tax liability,
and the holder may obtain a refund of any excess amounts
withheld under the backup withholding rules by timely filing the
appropriate claim for refund with the Internal Revenue Service
and furnishing the proper required information.
Business overview | Corporate governance | Operating and financial review and prospects | General facts on Nokia | Financial statements | Other information | 136 | |||||||
General facts on Nokia continued
Nokia Annual Report on Form 20-F 2023
Key ratios
Earnings per share (basic)
Profit/(loss) attributable to equity holders of the parent
Weighted average number of shares outstanding during the year
Earnings per share (diluted)
Profit/(loss) attributable to equity holders of the parent adjusted for the effect of dilution
Adjusted weighted average number of shares during the year
P/E ratio
Closing share price at 31 December
Earnings per share (basic) for continuing operations
Payout ratio
Proposed dividend per share
Earnings per share (basic) for continuing operations
Dividend yield %
Proposed dividend per share
Closing share price at 31 December
Shareholders’ equity per share
Capital and reserves attributable to equity holders of the parent
Number of shares at 31 December – number of treasury shares at 31 December
Market capitalization
(Number of shares at 31 December – number of treasury shares at 31 December) x closing share price at 31 December
Share turnover %
Number of shares traded during the year
Average number of shares during the year
Business overview | Corporate governance | Operating and financial review and prospects | General facts on Nokia | Financial statements | Other information | 137 | |||||||
General facts on Nokia continued
Nokia Annual Report on Form 20-F 2023
Alternative performance measures
Certain financial measures presented in this report are not measures of financial performance,
financial position or cash flows defined in IFRS. As these measures are not defined in IFRS, they
may not be directly comparable with financial measures used by other companies, including
those in the same industry. The primary rationale for presenting these measures is that the
management uses these measures in assessing the financial performance of Nokia and believes
that these measures provide meaningful supplemental information on the underlying business
performance of Nokia. These financial measures should not be considered in isolation from,
or as a substitute for, financial information presented in compliance with IFRS.
Beginning with its Annual Report 2023 Nokia changed how it defines its Free cash flow measure
to better align it with common practice and Non-GAAP reporting guidelines. Previously Nokia
defined Free cash flow as Net cash flows from operating activities – purchases of property, plant
and equipment and intangible assets (capital expenditures) + proceeds from sale of property,
plant and equipment and intangible assets – purchase of non-current financial investments +
proceeds from sale of non-current financial investments. The new definition is Net cash flows
from operating activities – purchases of property, plant and equipment and intangible assets
(capital expenditures). The comparative amounts for Free cash flow presented in this report
have been revised accordingly.
Return on capital employed %
Definition
Return on capital employed is defined as Profit before tax + Interest expense on interest-
bearing liabilities / Average capital and reserves attributable to equity holders of the parent +
average non-controlling interests + average interest-bearing liabilities.
Purpose
Return on capital employed indicates how efficiently Nokia uses its capital to generate profits.
Composition of return on capital employed %:
EURm | 2023 | 2022 | 2021 |
Profit before tax | 1 499 | 2 184 | 1 926 |
Interest expense on interest-bearing liabilities | 201 | 103 | 113 |
Total | 1 700 | 2 287 | 2 039 |
Average capital and reserves attributable to equity holders of the parent(1) | 20 935 | 19 347 | 14 913 |
Average non-controlling interests(1) | 92 | 98 | 91 |
Average interest-bearing liabilities(1) | 4 334 | 4 565 | 5 115 |
Total capital employed | 25 361 | 24 010 | 20 119 |
Return on capital employed % | 6.7% | 9.5% | 10.1% |
(1)Calculated as the average of opening and closing balance for the year as presented in the consolidated statement of financial
position. Refer to the consolidated financial statements.
Return on shareholders’ equity %
Definition
Return on shareholders’ equity is defined as Profit/(loss) for the year attributable to equity
holders of the parent / Average capital and reserves attributable to equity holders of the parent.
Purpose
Return on shareholders’ equity indicates how efficiently Nokia uses the capital invested by its
shareholders to generate profits.
Composition of return on shareholders’ equity %:
EURm | 2023 | 2022 | 2021 |
Profit/(loss) for the year attributable to equity holders of the parent | 665 | 4 250 | 1 623 |
Average capital and reserves attributable to equity holders of the parent(1) | 20 935 | 19 347 | 14 913 |
Return on shareholders’ equity % | 3.2% | 22.0% | 10.9% |
(1)Calculated as the average of opening and closing balance for the year as presented in the consolidated statement of financial
position. Refer to the consolidated financial statements.
Equity ratio %
Definition
Equity ratio % is defined as Total capital and reserves attributable to equity holders of the
parent + non-controlling interests / Total assets.
Purpose
Equity ratio indicates the proportion of assets financed by the capital provided by the equity
holders of the parent to the total assets of Nokia.
Composition of equity ratio %:
EURm | 2023 | 2022 | 2021 |
Total capital and reserves attributable to equity holders of the parent | 20 537 | 21 333 | 17 360 |
Non-controlling interests | 91 | 93 | 102 |
Shareholders’ equity | 20 628 | 21 426 | 17 462 |
Total assets | 39 860 | 42 943 | 40 049 |
Equity ratio % | 51.8% | 49.9% | 43.6% |
Business overview | Corporate governance | Operating and financial review and prospects | General facts on Nokia | Financial statements | Other information | 138 | |||||||
General facts on Nokia continued
Nokia Annual Report on Form 20-F 2023
Total cash and interest-bearing financial investments
Definition
Total cash and interest-bearing financial investments consist of cash and cash equivalents,
current interest-bearing financial investments and non-current interest-bearing financial
investments.
Purpose
Total cash and interest-bearing financial investments is used to indicate funds available to
Nokia to run its current and invest in future business activities as well as provide return for
security holders.
Composition of total cash and interest-bearing financial investments:
EURm | 2023 | 2022 | 2021 |
Cash and cash equivalents | 6 234 | 5 467 | 6 691 |
Current interest-bearing financial investments | 1 565 | 3 080 | 2 577 |
Non-current interest-bearing financial investments | 715 | 697 | — |
Total cash and interest-bearing financial investments | 8 514 | 9 244 | 9 268 |
Net cash and interest-bearing financial investments
Definition
Net cash and interest-bearing financial investments equals total cash and interest-bearing
financial investments less long-term and short-term interest-bearing liabilities.
Purpose
Net cash and interest-bearing financial investments is used to indicate Nokia’s liquidity position
after cash required to settle the interest-bearing liabilities.
Composition of net cash and interest-bearing financial investments:
EURm | 2023 | 2022 | 2021 |
Total cash and interest-bearing financial investments | |||
Cash and cash equivalents | 6 234 | 5 467 | 6 691 |
Current interest-bearing financial investments | 1 565 | 3 080 | 2 577 |
Non-current interest-bearing financial investments | 715 | 697 | — |
Interest-bearing liabilities | |||
Long-term interest-bearing liabilities | (3 637) | (4 249) | (4 537) |
Short-term interest-bearing liabilities | (554) | (228) | (116) |
Net cash and interest-bearing financial investments | 4 323 | 4 767 | 4 615 |
Net debt to equity (gearing) %
Definition
Net debt to equity (gearing) % is defined as Interest-bearing liabilities less Total cash and
interest-bearing financial investments / (Total capital and reserves attributable to the equity
holders of the parent + Non-controlling interests).
Purpose
Net debt to equity ratio presents the relative proportion of shareholders’ equity and interest-
bearing liabilities used to finance Nokia’s assets and indicates the leverage of Nokia’s business.
Composition of net debt to equity (gearing) %:
EURm | 2023 | 2022 | 2021 |
Interest-bearing liabilities | |||
Long-term interest-bearing liabilities | 3 637 | 4 249 | 4 537 |
Short-term interest-bearing liabilities | 554 | 228 | 116 |
Total cash and interest-bearing financial investments | |||
Cash and cash equivalents | (6 234) | (5 467) | (6 691) |
Current interest-bearing financial investments | (1 565) | (3 080) | (2 577) |
Non-current interest-bearing financial investments | (715) | (697) | — |
Net debt | (4 323) | (4 767) | (4 615) |
Total capital and reserves attributable to equity holders of the parent | 20 537 | 21 333 | 17 360 |
Non-controlling interests | 91 | 93 | 102 |
Shareholders’ equity | 20 628 | 21 426 | 17 462 |
Net debt to equity (gearing) % | (21.0)% | (22.2)% | (26.4)% |
Free cash flow
Definition
Free cash flow is defined as Net cash flows from operating activities – purchases of property,
plant and equipment and intangible assets (capital expenditures).
Purpose
Free cash flow is the cash that Nokia generates after investments in property, plant and
equipment and intangible assets, and we believe it provides meaningful supplemental
information as it represents the cash available to service and repay interest-bearing financial
liabilities, including lease liabilities, make investments to grow business and distribute funds to
shareholders. It is a measure of cash generation, working capital efficiency and capital discipline
of the business.
Business overview | Corporate governance | Operating and financial review and prospects | General facts on Nokia | Financial statements | Other information | 139 | |||||||
General facts on Nokia continued
Nokia Annual Report on Form 20-F 2023
Composition of free cash flow:
EURm | 2023 | 2022 | 2021 |
Net cash flows from operating activities | 1 317 | 1 474 | 2 625 |
Purchase of property, plant and equipment and intangible assets (capital expenditures) | (652) | (601) | (560) |
Free cash flow | 665 | 873 | 2 065 |
Capital expenditure
Definition
Purchases of property, plant and equipment and intangible assets (excluding assets acquired
under business combinations).
Purpose
Capital expenditure is used to describe investments in future profit-generating activities.
Composition of capital expenditure:
EURm | 2023 | 2022 | 2021 |
Purchase of property, plant and equipment and intangible assets | (652) | (601) | (560) |
Capital expenditure | (652) | (601) | (560) |
Comparable operating profit
Definition
Comparable operating profit excludes intangible asset amortization and other purchase price
fair value adjustments, goodwill impairments, restructuring-related charges and certain other
items affecting comparability.
Purpose
We believe that our comparable operating profit provides meaningful supplemental information
to both management and investors regarding Nokia’s underlying business performance
by excluding certain items of income and expenses that may not be indicative of Nokia’s
business operating results. Comparable operating profit is used also in determining
management remuneration.
Composition of comparable operating profit:
EURm | 2023 | 2022 | 2021 |
Operating profit | 1 688 | 2 318 | 2 158 |
Restructuring and associated charges | 356 | 177 | 263 |
Amortization of acquired intangible assets | 352 | 411 | 391 |
Costs associated with country exit | (49) | 98 | — |
Impairment and write-off of assets, net of reversals | 25 | 97 | 45 |
Settlement of legal disputes | — | — | (80) |
Gain on sale of fixed assets | — | — | (53) |
Other | 3 | 8 | 51 |
Comparable operating profit | 2 375 | 3 109 | 2 775 |
Comparable operating margin %
Definition
Comparable operating margin is defined as Comparable operating profit / Net sales.
Purpose
Comparable operating margin is used as a measure of Nokia’s operating profitability as a
percentage of net sales excluding intangible asset amortization and other purchase price fair
value adjustments, goodwill impairments, restructuring-related charges and certain other items
affecting comparability.
As with comparable operating profit, we believe that our comparable operating margin provides
meaningful supplemental information to both management and investors regarding Nokia’s
underlying business performance by excluding certain items of income and expenses that may
not be indicative of Nokia’s business operating results.
Composition of comparable operating margin:
EURm | 2023 | 2022 | 2021 |
Comparable operating profit | 2 375 | 3 109 | 2 775 |
Net sales | 22 258 | 24 911 | 22 202 |
Comparable operating margin % | 10.7% | 12.5% | 12.5% |
Business overview | Corporate governance | Operating and financial review and prospects | General facts on Nokia | Financial statements | Other information | 140 | |||||||
General facts on Nokia continued
Nokia Annual Report on Form 20-F 2023

Financial
statements
Consolidated statement of cash flows | |
1.3. Use of estimates and critical accounting judgments | |
Section 2: Results for the year | |
Section 3: Compensation and benefits | |
Section 4: Operating assets and liabilities | |
Section 5: Capital and financial instruments | |
Section 6: Other information | |
Business overview | Corporate governance | Operating and financial review and prospects | General facts on Nokia | Financial statements | Other information | 141 | |||||||
Nokia Annual Report on Form 20-F 2023
EURm | Note | 2023 | 2022 | 2021 |
Net sales | 2.1, 2.2 | |||
Cost of sales | 2.3 | ( | ( | ( |
Gross profit | ||||
Research and development expenses | 2.3 | ( | ( | ( |
Selling, general and administrative expenses | 2.3 | ( | ( | ( |
Other operating income | 2.3 | |||
Other operating expenses | 2.3 | ( | ( | |
Operating profit | ||||
Share of results of associates and joint ventures | 6.4 | ( | ( | |
Financial income(1) | 2.4 | |||
Financial expenses(1) | 2.4 | ( | ( | ( |
Profit before tax | ||||
Income tax (expense)/benefit | 2.5 | ( | ( | |
Profit from continuing operations | ||||
Profit/(loss) from discontinued operations | ( | |||
Profit for the year | ||||
Attributable to: | ||||
Equity holders of the parent | ||||
Non-controlling interests | ||||
Earnings per share attributable to equity holders of the parent | 2.6 | EUR | EUR | EUR |
Basic | ||||
Profit from continuing operations | ||||
Profit for the year | ||||
Diluted | ||||
Profit from continuing operations | ||||
Profit for the year |
(1)In 2023, Nokia changed the presentation of net interest income on defined benefit plans within financial income and expenses. The comparative amounts for 2022 and 2021 have been recast accordingly. Refer to Note 2.4. Financial income and expenses for more information. |
The notes are an integral part of these consolidated financial statements.
Business overview | Corporate governance | Operating and financial review and prospects | General facts on Nokia | Financial statements | Other information | 142 | |||||||
Consolidated income statement
For the year ended 31 December
Nokia Annual Report on Form 20-F 2023
EURm | Note | 2023 | 2022 | 2021 |
Profit for the year | ||||
Items that will not be reclassified to profit or loss | ||||
Remeasurements of defined benefit plans | ( | ( | ||
Income tax related to items that will not be reclassified to profit or loss | 2.5 | ( | ||
Total of items that will not be reclassified to profit or loss | ( | ( | ||
Items that may be reclassified to profit or loss | ||||
Translation differences | ||||
Exchange differences on translating foreign operations | ( | |||
Transfer to income statement | ( | |||
Net investment hedges | ||||
Net fair value gains/(losses) | ( | ( | ||
Cash flow and other hedges | ||||
Net fair value losses | ( | ( | ( | |
Transfer to income statement | ( | |||
Financial assets at fair value through other comprehensive income | ||||
Net fair value losses | ( | ( | ( | |
Transfer to income statement | ||||
Other decrease, net | ( | ( | ||
Income tax related to items that may be reclassified to profit or loss | 2.5 | ( | ( | |
Total of items that may be reclassified to profit or loss | ( | |||
Other comprehensive (loss)/income, net of tax | ( | |||
Total comprehensive (loss)/income for the year | ( | |||
Attributable to: | ||||
Equity holders of the parent | ( | |||
Non-controlling interests |
The notes are an integral part of these consolidated financial statements.
Business overview | Corporate governance | Operating and financial review and prospects | General facts on Nokia | Financial statements | Other information | 143 | |||||||
Consolidated statement of comprehensive income
For the year ended 31 December
Nokia Annual Report on Form 20-F 2023
EURm | Note | 2023 | 2022 |
ASSETS | |||
Non-current assets | |||
Goodwill | 4.1 | ||
Other intangible assets | 4.1 | ||
Property, plant and equipment | 4.2 | ||
Right-of-use assets | 4.3 | ||
Investments in associated companies and joint ventures | 6.4 | ||
Non-current interest-bearing financial investments | 5.2, 5.4 | ||
Other non-current financial assets | 5.2, 5.4 | ||
Defined benefit pension assets | 3.4 | ||
Deferred tax assets | 2.5 | ||
Other non-current receivables | 4.6 | ||
Total non-current assets | |||
Current assets | |||
Inventories | 4.4 | ||
Trade receivables | 4.5, 5.2, 5.4 | ||
Contract assets | 4.5 | ||
Current income tax assets | 2.5 | ||
Other current receivables | 4.6 | ||
Current interest-bearing financial investments | 5.2, 5.4 | ||
Other current financial and firm commitment assets | 5.2, 5.3, 5.4 | ||
Cash and cash equivalents | 5.2, 5.4 | ||
Total current assets | |||
Assets held for sale | 6.4 | ||
Total assets | |||
EURm | Note | 2023 | 2022 |
SHAREHOLDERS’ EQUITY AND LIABILITIES | |||
Equity | |||
Share capital | |||
Share premium | |||
Treasury shares | ( | ( | |
Translation differences | ( | ||
Fair value and other reserves | |||
Reserve for invested unrestricted equity | |||
Retained earnings | |||
Total shareholders’ equity | |||
Non-controlling interests | |||
Total equity | 5.1 | ||
Non-current liabilities | |||
Long-term interest-bearing liabilities | 5.2, 5.3, 5.4 | ||
Long-term lease liabilities | 5.4 | ||
Defined benefit pension and post-employment liabilities | 3.4 | ||
Deferred tax liabilities | 2.5 | ||
Contract liabilities | 4.5 | ||
Other non-current liabilities | 4.6 | ||
Provisions | 4.7 | ||
Total non-current liabilities | |||
Current liabilities | |||
Short-term interest-bearing liabilities | 5.2, 5.3, 5.4 | ||
Short-term lease liabilities | 5.4 | ||
Other financial and firm commitment liabilities | 5.2, 5.3, 5.4 | ||
Contract liabilities | 4.5 | ||
Current income tax liabilities | 2.5 | ||
Trade payables | 5.2, 5.4 | ||
Other current liabilities | 4.6 | ||
Provisions | 4.7 | ||
Total current liabilities | |||
Total liabilities | |||
Total shareholders’ equity and liabilities |
The notes are an integral part of these consolidated financial statements.
Business overview | Corporate governance | Operating and financial review and prospects | General facts on Nokia | Financial statements | Other information | 144 | |||||||
Consolidated statement of financial position
At 31 December
Nokia Annual Report on Form 20-F 2023
EURm | Note | 2023 | 2022 | 2021 |
Profit for the year | ||||
Adjustments, total(1) | ( | |||
Change in net working capital(2) | ( | ( | ( | |
Cash flows from operations | ||||
Interest received | ||||
Interest paid | 4.3, 5.2 | ( | ( | ( |
Income taxes paid, net | ( | ( | ( | |
Net cash flows from operating activities | ||||
Purchase of property, plant and equipment and intangible assets | ( | ( | ( | |
Proceeds from sale of property, plant and equipment and intangible assets | ||||
Acquisition of businesses, net of cash acquired | ( | ( | ( | |
Proceeds from disposal of businesses, net of cash disposed | ||||
Purchase of interest-bearing financial investments | ( | ( | ( | |
Proceeds from interest-bearing financial investments | ||||
Purchase of other non-current financial assets | ( | ( | ( | |
Proceeds from other non-current financial assets | ||||
Other | ( | ( | ||
Net cash flows from/(used in) investing activities | ( | ( | ||
Acquisition of treasury shares | 5.1 | ( | ( | |
Proceeds from long-term borrowings | 5.4 | |||
Repayment of long-term borrowings | 5.4 | ( | ( | ( |
(Repayment of)/proceeds from short-term borrowings | 5.4 | ( | ( | |
Payment of principal portion of lease liabilities | 4.3, 5.4 | ( | ( | ( |
Dividends paid | 5.1 | ( | ( | ( |
Net cash flows used in financing activities | ( | ( | ( | |
Translation differences | ( | |||
Net increase/(decrease) in cash and cash equivalents | ( | ( | ||
Cash and cash equivalents at 1 January | ||||
Cash and cash equivalents at 31 December | ||||
The consolidated statement of cash flows combines cash flows from both continuing and discontinued operations. | ||||
The notes are an integral part of these consolidated financial statements. | ||||
(1) Adjustments | |||
EURm | 2023 | 2022 | 2021 |
Depreciation and amortization | |||
Share-based payments | |||
Impairment charges | |||
Restructuring charges | |||
Loss/(gain) from other non-current financial assets | ( | ( | |
Gain on sale of property, plant and equipment | ( | ( | ( |
Financial income and expenses | |||
Income tax expense/(benefit) | ( | ||
Other adjustments, net | |||
Total | ( |
Restructuring charges in adjustments represent the non-cash portion recognized in the
consolidated income statement.
(2) Change in net working capital | |||
EURm | 2023 | 2022 | 2021 |
Decrease/(increase) in receivables | ( | ||
Decrease/(increase) in inventories | ( | ( | |
Decrease in non-interest-bearing liabilities | ( | ( | ( |
Total | ( | ( | ( |
Business overview | Corporate governance | Operating and financial review and prospects | General facts on Nokia | Financial statements | Other information | 145 | |||||||
Consolidated statement of cash flows
For the year ended 31 December
Nokia Annual Report on Form 20-F 2023
EURm | Note | Share capital | Share premium | Treasury shares | Translation differences | Fair value and other reserves | Reserve for invested unrestricted equity | Retained earnings/ (Accumulated deficit) | Total shareholders’ equity | Non-controlling interests | Total equity |
1 January 2021 | ( | ( | ( | ||||||||
Profit for the year | |||||||||||
Other comprehensive income | 5.1 | ( | |||||||||
Total comprehensive income for the year | |||||||||||
Share-based payments | |||||||||||
Settlement of share-based payments | ( | ( | ( | ||||||||
Dividends | 5.1 | ( | ( | ||||||||
Total transactions with owners | ( | ||||||||||
31 December 2021 | ( | ( | ( | ||||||||
Profit for the year | |||||||||||
Other comprehensive income | 5.1 | ( | ( | ( | |||||||
Total comprehensive income for the year | ( | ||||||||||
Share-based payments | |||||||||||
Settlement of share-based payments | ( | ( | ( | ||||||||
Acquisition of treasury shares(1) | 5.1 | ( | ( | ( | ( | ||||||
Cancellation of treasury shares(1) | 5.1 | ( | |||||||||
Dividends | 5.1 | ( | ( | ( | ( | ||||||
Total transactions with owners | ( | ( | ( | ( | ( | ||||||
31 December 2022 | ( | ||||||||||
Profit for the year | |||||||||||
Other comprehensive loss | 5.1 | ( | ( | ( | ( | ( | ( | ||||
Total comprehensive income for the year | ( | ( | ( | ( | |||||||
Share-based payments | |||||||||||
Settlement of share-based payments | ( | ( | ( | ||||||||
Acquisition of treasury shares(1) | 5.1 | ( | ( | ( | |||||||
Cancellation of treasury shares(1) | 5.1 | ( | |||||||||
Disposal of subsidiaries | ( | ( | |||||||||
Dividends | 5.1 | ( | ( | ( | ( | ||||||
Total transactions with owners | ( | ( | ( | ( | ( | ||||||
31 December 2023 | ( | ( |
(1)Treasury shares have been acquired as part of the share buyback program announced on 3 February 2022 using the reserve for invested unrestricted equity. The shares repurchased in the first phase of the program between 14 February and 11 November 2022 were
cancelled on 8 December 2022. The shares repurchased in the second phase of the program between 2 January and 10 November 2023 were cancelled on 30 November 2023. Refer to Note 5.1. Equity for more information.
The notes are an integral part of these consolidated financial statements.
Business overview | Corporate governance | Operating and financial review and prospects | General facts on Nokia | Financial statements | Other information | 146 | |||||||
Consolidated statement of changes in shareholders’ equity
Nokia Annual Report on Form 20-F 2023
Section 1 |
Basis of
preparation
This section describes the general accounting policies
applied in preparation of these consolidated financial
statements, including the basis of presentation
and key consolidation principles. This section also
summarizes the accounting matters that involve
most judgment or estimation uncertainty. The
specific accounting policies as well as details of key
accounting estimates and judgments are provided
in the related notes.
Nokia Corporation, a public limited liability company
incorporated and domiciled in Helsinki, Finland, is the parent
company (Parent Company or Parent) for all its subsidiaries
(together Nokia or the Group). Nokia is a global provider of
mobile, fixed and cloud network solutions combining hardware,
software and services, as well as licensing of intellectual
property, including patents, technologies and the Nokia brand.
Nokia’s operational headquarters are located in Espoo, Finland.
The shares of Nokia Corporation are listed on the Nasdaq
Helsinki Stock Exchange, the New York Stock Exchange and
the Euronext Paris Stock Exchange.
These consolidated financial statements for the year ended
31 December 2023 were authorized for issuance and filing
by the Board of Directors on 29 February 2024.
The consolidated financial statements are prepared in
accordance with International Financial Reporting Standards
(IFRS Accounting Standards) as issued by the International
Accounting Standards Board (IASB) and as adopted by the
European Union (EU). The consolidated financial statements
also conform to Finnish accounting and company legislation.
The consolidated financial statements are presented in
millions of euros (EURm), except when otherwise noted,
and are prepared under the historical cost convention,
except when otherwise disclosed in the accounting policies
in the specific notes.
This paragraph is included in connection with statutory
reporting requirements in Germany. The fully consolidated
German subsidiary, Nokia Solutions and Networks GmbH & Co.
KG, registered in the commercial register of Munich under HRA
88537, has made use of the exemption available under § 264b
and § 291 of the German Commercial Code (HGB).
The consolidated financial statements comprise the financial
statements of the Parent Company, and each of those
companies over which it exercises control. Control over an
entity exists when Nokia is exposed, or has rights, to variable
returns from its involvement with the entity and has the ability
to affect those returns through its power over the entity.
Presumption is that a majority of voting rights results in
control. To support this presumption, Nokia considers all
relevant facts and circumstances in assessing whether it has
power over the entity including voting rights and potential
voting rights, rights to appoint key management personnel
and rights arising from other contractual arrangements.
Consolidation of a subsidiary begins when Nokia obtains
control over the subsidiary and ceases when it loses control
over the subsidiary.
All intercompany transactions are eliminated as part of the
consolidation process. Non-controlling interest represents the
proportion of net profit or loss, other comprehensive income
and net assets in subsidiaries that is not attributable to the
equity holders of the Parent.
An associate is an entity over which Nokia exercises significant
influence. A joint venture is a type of joint arrangement
whereby the parties that have joint control of the arrangement
have rights to the net assets of the arrangement.
Nokia’s investments in associates and joint ventures are
accounted for using the equity method. Under the equity
method, the investment in an associate or joint venture is
initially recognized at cost. The carrying amount of the
investment is adjusted to recognize changes in Nokia’s share
of net assets of the associate or joint venture since the
acquisition date. Nokia’s share of profits and losses of
associates and joint ventures is reflected in the consolidated
income statement. Any change in other comprehensive income
of associates and joint ventures is presented as part of
Nokia’s other comprehensive income.
Business overview | Corporate governance | Operating and financial review and prospects | General facts on Nokia | Financial statements | Other information | 147 | |||||||
Notes to the consolidated financial statements
Nokia Annual Report on Form 20-F 2023
and discontinued operations
Non-current assets or disposal groups are classified as assets
held for sale if their carrying amounts will be recovered
principally through a sale transaction rather than through
continuing use. Non-current assets classified as held for sale,
or included in a disposal group classified as held for sale, are
not depreciated or amortized.
Discontinued operation is reported when a component of
Nokia, comprising operations and cash flows that can be clearly
distinguished both operationally and for financial reporting
purposes from the rest of Nokia, has been disposed of or is
classified as held for sale, and that component represents a
major line of business or geographical area of operations or is
part of a single coordinated plan to dispose of a separate major
line of business or geographical area of operations. Profit or
loss from discontinued operations is reported separately
from income and expenses from continuing operations in the
consolidated income statement, with prior periods presented
on a comparative basis. Intra-group revenues and expenses
between continuing and discontinued operations are
eliminated. Discontinued operations presented in these
consolidated financial statements comprise the financial results
related to the HERE digital mapping and location services
business and the Devices & Services business sold in 2015
and 2014, respectively.
Foreign currency translation
The consolidated financial statements are presented in euro,
the functional and presentation currency of the Parent
Company. The financial statements of all Group companies
are measured using the functional currency, which is the
currency of the primary economic environment in which the
Transactions in foreign currencies are recorded at exchange
rates prevailing at the date of the transactions. For practical
reasons, a rate that approximates the actual rate at the date
of the transaction is often used. Monetary assets and liabilities
denominated in foreign currency are translated at the
exchange rates prevailing at the end of the reporting period.
Foreign exchange gains and losses arising from monetary
assets and liabilities as well as fair value changes of related
hedging instruments are recognized in financial income and
expenses. Unrealized foreign exchange gains and losses related
to non-monetary non-current financial investments are
included in the fair value measurement of these investments
and recognized in other operating income and expenses.
Foreign Group companies
On consolidation, the assets and liabilities of foreign
operations whose functional currency is other than euro are
translated into euro at the exchange rates prevailing at the end
of the reporting period. The income and expenses of these
foreign operations are translated into euro at the average
exchange rates for the reporting period. The exchange
differences arising from translation for consolidation are
recognized as translation differences in other comprehensive
income. On disposal of a foreign operation the cumulative
amount of translation differences relating to that foreign
judgments
The preparation of financial statements requires use of
management judgment in selecting and applying accounting
policies as well as making estimates and assumptions about
the future. These judgments, estimates and assumptions may
have a significant effect on the amounts recognized in the
financial statements.
The estimates and assumptions used in determining the
carrying amounts of assets and liabilities are based on
historical experience, expected outcomes and various other
factors that were available when these financial statements
were prepared, and they are believed to be reasonable under
the circumstances. The estimates and assumptions are
reviewed continually and revised if changes in circumstances
occur, or as a result of new information. As estimates
and assumptions inherently contain a varying degree of
uncertainty, actual outcomes may differ resulting in
adjustments to the carrying amounts of assets and liabilities
in subsequent periods.
The accounting matters listed below are determined to involve
the most difficult, subjective or complex judgments, or are
considered as major sources of estimation uncertainty that
may have a significant risk of resulting in a material adjustment
to the carrying amounts of assets and liabilities within the next
financial year. Please refer to the specific notes for further
information on the key accounting estimates and judgments.
Key accounting estimates and judgments | Note |
Judgment related to recognition of deferred tax assets | 2.5. Income taxes |
Estimate of pension and other post-employment benefit obligations | 3.4. Pensions and other post-employment benefits |
Business overview | Corporate governance | Operating and financial review and prospects | General facts on Nokia | Financial statements | Other information | 148 | |||||||
Notes to the consolidated financial statements continued
Nokia Annual Report on Form 20-F 2023
interpretations
On 1 January 2023, Nokia adopted the following amendments
to the accounting standards issued by the IASB and endorsed
by the EU:
■IFRS 17 Insurance Contracts (including the June 2020 and
December 2021 Amendments to IFRS 17);
■Amendments to IAS 8 Accounting Policies, Changes in
Accounting Estimates and Errors: Definition of Accounting
Estimates;
■Amendments to IAS 1 Presentation of Financial Statements
and IFRS Practice Statement 2 Making Materiality
Judgements: Disclosure of Accounting Policies;
■Amendments to IAS 12 Income Taxes: Deferred Tax related
to Assets and Liabilities arising from a Single Transaction;
and
■Amendments to IAS 12 Income Taxes: International Tax
Reform—Pillar Two Model Rules.
The amendments had no material impact on the measurement,
recognition or presentation of any items in Nokia’s
consolidated financial statements for 2023. The amendments
affecting the disclosures are explained below.
The amendments to IAS 1 and IFRS Practice Statement 2
related to disclosure of accounting policies aim to help entities
provide accounting policies disclosures that are more useful by
replacing the requirement to disclose ‘significant’ accounting
policies with a requirement to disclose ‘material’ accounting
policies and adding guidance to help entities determine when
accounting policies information is material and, therefore,
needs to be disclosed. These amendments are reflected in the
accounting policies disclosures in Nokia’s consolidated financial
statements for 2023.
The amendments to IAS 12 related to Pillar Two Model Rules
have been introduced in response to the OECD’s BEPS Pillar
Two rules and include a mandatory temporary exception to
the recognition and disclosure of deferred taxes arising from
the jurisdictional implementation of the Pillar Two model rules,
and disclosure requirements for affected entities to help
users of the financial statements better understand an
entity’s exposure to Pillar Two income taxes arising from that
legislation, particularly before its effective date. Information
on the impact of Pillar Two legislation on Nokia is disclosed in
Note 2.5. Income taxes.
Nokia has not early adopted any new or amended standards or
interpretations that have been issued but are not yet effective.
The new and amended standards and interpretations issued by
the IASB that are effective in future periods are not expected
to have a material impact on the consolidated financial
statements of Nokia when adopted. Nokia intends to adopt
these new and amended standards and interpretations, if
applicable, when they become effective and are endorsed by
the EU.
Business overview | Corporate governance | Operating and financial review and prospects | General facts on Nokia | Financial statements | Other information | 149 | |||||||
Notes to the consolidated financial statements continued
Nokia Annual Report on Form 20-F 2023
Section 2 |
Results for
the year
This section provides details of items presented
in the income statement including disaggregation
of net sales by region and customer type, results of
Nokia’s operating segments, as well as information
on operating expenses and other operating income.
Furthermore, this section contains information about
financial income and expenses and income taxes, as
well as earnings per share.
Nokia accounts for a contract with a customer when the
contract has been approved in writing, which is generally
when both parties are committed to perform their
respective obligations, the rights, including payment terms,
regarding the goods and services to be transferred can be
identified, the contract has commercial substance, and
collection of the consideration to which Nokia expects to be
entitled is probable. Management considers only legally
enforceable rights in evaluating the accounting for contracts
with customers. As such, frame agreements that do not
create legally enforceable rights and obligations are
accounted for based on the issuance of subsequent legally
binding purchase orders under the frame agreements.
A contract modification or a purchase order is accounted
for as a separate contract if the scope of the contract
increases by additional distinct goods or services, and the
price of the contract increases by an amount that reflects
the standalone selling price of those additional goods or
services. In cases where the additional goods or services
are distinct but not sold at a standalone selling price,
the contract modification is accounted for prospectively.
In cases where the additional goods or services are not
distinct, the modification is accounted for through a
cumulative catch-up adjustment.
Nokia recognizes revenue from contracts with customers
to reflect the transfer of promised goods and services to
customers for amounts that reflect the consideration to
which Nokia expects to be entitled in exchange for those
goods and services. The consideration may include a
variable amount, which Nokia estimates based on the most
likely amount. Items causing variability include volume
discounts and sales-based or usage-based royalties. Nokia
includes variable consideration into the transaction price
only to the extent that it is highly probable that a significant
revenue reversal will not occur. The transaction price also
excludes amounts collected on behalf of third parties.
In cases where the timing of payments provides either the
customer or Nokia with a significant benefit of financing,
the transaction price is adjusted for the effect of financing
and the related interest revenue or interest expense
is presented separately from revenue. As a practical
expedient, Nokia does not account for financing
components if, at contract inception, the consideration is
expected to be received within one year before or after the
goods or services have been transferred to the customer.
Nokia enters into contracts with customers consisting of any
combination of hardware, services and intellectual property.
Hardware and software sold by Nokia includes warranty,
which can either be assurance-type for repair of defects
and replacement of hardware recognized as a centralized
warranty provision, or service-type for scope beyond the
repair of defects or for a time period beyond the standard
assurance-type warranty period and considered a separate
performance obligation within the context of the contract.
The associated revenue recognized for such contracts
depends on the nature of the underlying goods and services
provided. The promised goods or services in the contract
might include sale of goods, license of intellectual property
and grant of options to purchase additional goods or
services that may provide the customer with a material
right. Nokia conducts an assessment at contract inception
to determine which promised goods and services in a
customer contract are distinct and accordingly identified
as performance obligations.
The standalone selling price of each performance obligation
is determined by considering factors such as the price of
the performance obligation if sold on a standalone basis and
the expected cost of the performance obligation plus a
reasonable margin when price references are not available.
The portion of the transaction price allocated to each
performance obligation is then recognized when the
revenue recognition criteria for that performance obligation
have been met.
Business overview | Corporate governance | Operating and financial review and prospects | General facts on Nokia | Financial statements | Other information | 150 | |||||||
Notes to the consolidated financial statements continued
Nokia Annual Report on Form 20-F 2023
Nokia allocates the transaction price to each distinct
performance obligation on the basis of their standalone
selling prices, relative to the overall transaction price. If a
standalone selling price is not observable, it is estimated.
The transaction price may include a discount or a variable
amount of consideration that is generally allocated
proportionately to all performance obligations in the
contract unless Nokia has observable evidence that the
entire discount relates to only one or more, but not all,
performance obligations in a contract. The amount of
revenue recognized is the amount allocated to the satisfied
performance obligation based on the relative standalone
selling prices. A performance obligation may be satisfied
at a point in time or over time.
As described in Note 4.5. Trade receivables and other
customer-related balances, Nokia presents its customer
contracts in the statement of financial position as either
a contract asset or a contract liability, depending on
the relationship between Nokia’s performance and
the customer’s payment for each individual contract.
Sale of products
Nokia manufactures and sells a range of networking
equipment, covering the requirements of network
operators. Revenue for these products is recognized when
control of the products has transferred, the determination
of which may require judgment. Typically, for standard
equipment sales, control transfers upon delivery. For
more complex solutions, control generally transfers
upon acceptance.
In some arrangements, mainly within the Submarine Networks
business, Nokia’s performance does not create an asset with an
alternative use and Nokia recognizes revenue over time using
the output method, which faithfully depicts the manner in
which the asset is transferred to the customer as well as
Nokia’s enforceable rights to payment for the work completed
to date, including margin. The output measure selected by
Nokia for each contract may vary depending on the nature
of the contract.
Sale of services
Nokia provides services related to the provision of networking
equipment, ranging from managing a customer’s network
and product maintenance services to network installation,
integration and optimization. Revenue for each separate
service performance obligation is recognized as or when the
customer obtains the benefits of Nokia’s performance. Service
revenue is recognized over time for managed and maintenance
services, as in these cases Nokia performs throughout a fixed
contract term and the customer simultaneously receives and
consumes the benefits as Nokia performs. In some cases,
Nokia performs services that are subject to customer
acceptance where revenue is recognized when the customer
acceptance is received.
Sale of intellectual property licenses
Nokia provides its customers with licenses to intellectual
property (IP) owned by Nokia by granting software licenses
and rights to benefit from Nokia’s IP in their products.
When a software license is sold, revenue is recognized
upon delivery or acceptance of the software, as Nokia has
determined that each software release is distinct and the
license is granted for software as it exists when the control
transfers to the customer.
When Nokia grants customers a license to use IP owned by
Nokia, the associated license fee revenue is recognized in
accordance with the substance of the relevant agreements.
In the majority of cases, Nokia retains obligations to
continue to develop and make available to the customer
the latest IP in the licensed assets during the contract term,
and therefore revenue is recognized pro rata over the
period during which Nokia is expected to perform.
Recognition of the revenue as pro rata over the term of the
license is considered the most faithful depiction of Nokia’s
satisfaction of the performance obligation as the IP being
licensed towards the customer includes new inventions
patented by Nokia that are highly interdependent and
interrelated and created through the course of continuous
research and development (R&D) efforts that are relatively
stable throughout the year. In some contracts, Nokia has
no remaining obligations to perform after granting a license
to the initial IP, and licensing fees are non-refundable. In
these cases, revenue is recognized at the beginning of the
license term.
Business overview | Corporate governance | Operating and financial review and prospects | General facts on Nokia | Financial statements | Other information | 151 | |||||||
Notes to the consolidated financial statements continued
Nokia Annual Report on Form 20-F 2023
Revenue disaggregation
Management has determined that Nokia’s geographic areas
are considered as the primary determinants to depict how
the nature, amount, timing and uncertainty of revenue and
cash flows are affected by economic factors. Nokia’s primary
customer base consists of companies that operate on
a country-specific or a regional basis. Although Nokia’s
technology cycle is similar around the world, different countries
and regions are inherently in a different stage of that cycle,
often influenced by macroeconomic conditions specific to
those countries and regions. In addition to Net sales to external
customers by region, the chief operating decision-maker,
as described in Note 2.2. Segment information, also reviews
Net sales by customer type disclosed in this note.
Each reportable segment, as described in Note 2.2. Segment
information, consists of customers that operate in all
geographic areas. No reportable segment has a specific
revenue concentration in any geographic area other than
Nokia Technologies, which is included within Europe.
Net sales to external customers by region are based on the
location of the customer, except for Nokia Technologies IPR
and licensing net sales which are allocated to Europe.
EURm | 2023 | 2022 | 2021 |
Asia Pacific | |||
Europe | |||
Greater China | |||
India | |||
Latin America | |||
Middle East & Africa | |||
North America | |||
Submarine Networks | |||
Total |
Net sales by customer type
EURm | 2023 | 2022 | 2021 |
Communications service providers | |||
Enterprise | |||
Licensees | |||
Other(1) | |||
Total |
(1)Includes net sales of Submarine Networks which operates in a different market, and
Radio Frequency Systems (RFS), which is being managed as a separate entity, and
certain other items, such as eliminations of inter-segment revenues. Submarine
Networks and RFS net sales also include revenue from communications service
Order backlog
At 31 December 2023, the aggregate amount of the
transaction price allocated to partially or wholly unsatisfied
performance obligations arising from fixed contractual
commitments amounted to EUR 22.0 billion (EUR 19.5 billion
in 2022). Management has estimated that these unsatisfied
performance obligations will be recognized as revenue as follows:
2023 | 2022 | |
Within 1 year | ||
2-3 years | ||
More than 3 years | ||
Total |
The estimated timing of the satisfaction of these performance
obligations is subject to change owing to factors beyond
Nokia’s control such as customer and network demand,
market conditions and, in some cases, restrictions imposed
by the weather or other factors impacting project logistics.
Revenue recognized in the reporting period from performance
obligations satisfied (or partially satisfied) in previous periods
(for example, due to changes in transaction price) was
not material.
Business overview | Corporate governance | Operating and financial review and prospects | General facts on Nokia | Financial statements | Other information | 152 | |||||||
Notes to the consolidated financial statements continued
Nokia Annual Report on Form 20-F 2023
Nokia has four
financial reporting purposes: (1) Network Infrastructure,
(2) Mobile Networks, (3) Cloud and Network Services
and (4) Nokia Technologies. In addition, Nokia provides
net sales disclosure for the following business
divisions within the Network Infrastructure segment:
(i) IP Networks, (ii) Optical Networks, (iii) Fixed Networks
and (iv) Submarine Networks.
The President and CEO is the chief operating decision-
maker monitoring the operating results of segments
for the purpose of assessing performance and making
decisions about resource allocation. Key financial
performance measures of the segments comprise
primarily net sales and segment operating profit.
The evaluation of segment performance and allocation
of resources is primarily based on segment operating
profit which the management believes is the most
relevant measure for this purpose. Segment operating
profit excludes intangible asset amortization and
other purchase price fair value adjustments, goodwill
impairments, restructuring-related charges and certain
other items of income and expenses that may not be
indicative of the business operating results.
Accounting policies of the segments are the same as
those for the Group except for the aforementioned
items of income and expenses that are not allocated to
the segments. Inter-segment revenues and transfers are
accounted for as if the revenues were to third parties,
that is, at current market prices.
Segment descriptions
Network Infrastructure
The Network Infrastructure segment serves communications
service providers, enterprises, webscales and public sector
customers. It comprises the following business divisions:
(i) IP Networks, which provides IP networks and services
for residential, mobile, enterprise and cloud applications;
(ii) Optical Networks, which provides optical transport
networks for metro, regional, and long-haul applications, and
collaborates with Submarine Networks on subsea applications;
(iii) Fixed Networks, which provides fiber, fixed wireless access
and copper technologies; and (iv) Submarine Networks,
which offers undersea cable transmission.
Mobile Networks
The Mobile Networks segment creates products and services
covering all mobile technology generations. Its portfolio
includes products for radio access networks (RAN) and
microwave radio (MWR) links for transport networks, and
solutions for network management, as well as network
planning, optimization, network deployment and technical
support services.
Cloud and Network Services
The Cloud and Network Services segment is built around
software and the cloud and is focused on driving leadership
in cloud-native software and as-a-service delivery models,
as demand for critical networks accelerates; and has strong
market positions in communications software, private wireless
networks, and cognitive (or intelligent) services. The Cloud
and Network Services portfolio encompasses core network
solutions, including both voice and packet core; business
applications covering areas like security, automation, and
monetization; cloud and cognitive services; and enterprise
solutions covering private wireless and industrial automation.
Nokia Technologies
Nokia Technologies segment monetizes Nokia’s intellectual
property, including patents, technologies and the Nokia brand,
building on Nokia’s continued innovation leadership, long-term
investment into research and development, and decades of
driving technology standards development. The majority of net
sales and related costs and expenses attributable to licensing
and patenting the patent portfolio of Nokia is recorded in
Nokia Technologies, while each segment separately records
its own research and development expenses.
Group Common and Other
Despite not being a reportable segment, Nokia also provides
segment-level information for Group Common and Other.
Group Common and Other includes Radio Frequency Systems
which is managed as a separate entity. In addition, Group
Common and Other includes certain corporate-level and
centrally managed operating expenses, as well as fair value
gains and losses on investments in venture funds, including
investments managed by NGP Capital.
Business overview | Corporate governance | Operating and financial review and prospects | General facts on Nokia | Financial statements | Other information | 153 | |||||||
Notes to the consolidated financial statements continued
Nokia Annual Report on Form 20-F 2023
Segment results
EURm | Network Infrastructure(1) | Mobile Networks | Cloud and Network Services | Nokia Technologies | Group Common and Other | Eliminations and unallocated items(2) | Nokia Group |
2023 | |||||||
Net sales to external customers | |||||||
Net sales to other segments | ( | ( | |||||
Operating profit/(loss) | ( | ( | |||||
Share of results of associated companies and joint ventures | ( | ( | ( | ||||
Financial income and expenses | ( | ||||||
Profit before tax | |||||||
Other segment items | |||||||
Depreciation and amortization | ( | ( | ( | ( | ( | ( | ( |
2022 | |||||||
Net sales to external customers | |||||||
Net sales to other segments | ( | ||||||
Operating profit/(loss) | ( | ( | |||||
Share of results of associated companies and joint ventures | ( | ( | ( | ( | |||
Financial income and expenses | ( | ||||||
Profit before tax | |||||||
Other segment items | |||||||
Depreciation and amortization | ( | ( | ( | ( | ( | ( | ( |
2021 | |||||||
Net sales to external customers | |||||||
Net sales to other segments | ( | ||||||
Operating profit/(loss) | ( | ( | |||||
Share of results of associated companies and joint ventures | ( | ( | |||||
Financial income and expenses | ( | ||||||
Profit before tax | |||||||
Other segment items | |||||||
Depreciation and amortization | ( | ( | ( | ( | ( | ( | ( |
(1)Includes IP Networks net sales of EUR in 2022 and EUR sales of EUR (2)Unallocated items comprise costs related to intangible asset amortization, restructuring-related charges, impairments and certain other items. |
Material reconciling items between total segment
operating profit and operating profit for the Group
EURm | 2023 | 2022 | 2021 | |
Total segment operating profit | ||||
Restructuring and associated charges | ( | ( | ( | |
Amortization of acquired intangible assets | ( | ( | ( | |
Costs associated with country exit | ( | |||
Impairment and write-off of assets, net of reversals | ( | ( | ( | |
Settlement of legal disputes | ||||
Gain on sale of fixed assets | ||||
Other | ( | ( | ( | |
Operating profit for the Group |
Business overview | Corporate governance | Operating and financial review and prospects | General facts on Nokia | Financial statements | Other information | 154 | |||||||
Notes to the consolidated financial statements continued
Nokia Annual Report on Form 20-F 2023
Information by geographies and customer
concentration
EURm | 2023 | 2022 | 2021 |
Finland | |||
United States | |||
India | |||
France | |||
Great Britain | |||
Other | |||
Total |
Net sales to external customers by country are based on the
location of the customer, except for Nokia Technologies IPR
and licensing net sales which are allocated to Finland.
Major customers
As is typical for our industry, Nokia’s net sales are largely driven
by multi-year customer agreements with a limited number of
significant customers. In 2023, no single customer represented
more than 10% of net sales. In 2022, net sales to the largest
customer were 10 % and in 2021, 11 % of net sales to external
customers. Net sales to the largest customer were reported
by Network Infrastructure, Mobile Networks and Cloud and
Network Services, as well as Group Common and Other.
EURm | 2023 | 2022 |
Finland | ||
United States | ||
France | ||
Other | ||
Total |
Non-current assets consists of goodwill, other intangible
assets, property, plant and equipment and right-of-use assets.
operating income
Nokia presents its income statement based on the
function of expenses as it considers this to provide more
relevant information about its financial performance.
Information about the nature of expenses is provided
in the notes. Certain items of income and expenses,
such as gains and losses from venture funds, are
presented as other operating income and expenses
as Nokia considers these items to be related to its
operating activities but not to any specific functions.
expenses incurred are recognized as a reduction of
the related expenses except for certain non-recurring
grants that are recognized as other operating income.
Government grants received in the form of R&D tax
credits are recognized as a reduction of R&D expenses if
the tax credit relates to the R&D expenditures incurred
by Nokia and the tax credit is reimbursed in cash by the
government in cases where Nokia is not able to offset it
against its income tax payable. R&D tax credits that do
not meet both conditions are recognized as income
tax benefit.
Expenses by nature
EURm | 2023 | 2022 | 2021 |
Personnel expenses | |||
Cost of material | |||
Project subcontracting and other customer contract expenses | |||
Depreciation and amortization | |||
IT services | |||
Impairment charges | |||
Other | |||
Total operating expenses |
Operating expenses include government grant income and R&D
tax credits of EUR 173 million (EUR 146 million in 2022 and
EUR 111 million in 2021) most of which have been recognized
as a deduction against research and development expenses.
EURm | 2023 | 2022 | 2021 |
Cost of sales | |||
Research and development expenses | |||
Selling, general and administrative expenses | |||
Total restructuring charges |
(1)Restructuring charges include defined benefit plan curtailment income and expenses.
Business overview | Corporate governance | Operating and financial review and prospects | General facts on Nokia | Financial statements | Other information | 155 | |||||||
Notes to the consolidated financial statements continued
Nokia Annual Report on Form 20-F 2023
EURm | 2023 | 2022 | 2021 |
Gain on sale of property, plant and equipment including divested business | |||
Subsidies and government grants | |||
(Losses)/gains from venture funds | ( | ||
Settlements and resolutions of legal disputes | |||
Other | |||
Total |
Other operating expenses
EURm | 2023 | 2022 | 2021 |
Expected credit losses on trade receivables | ( | ( | |
Impairment of disposal groups | ( | ||
Changes in provisions | ( | ( | |
Foreign exchange gains/(losses) on hedging forecasted sales and purchases | ( | ||
Other | ( | ( | ( |
Total | ( | ( |
Financial income
EURm | 2023 | 2022 | 2021 |
Interest income on financial investments | |||
Interest income on financing components of other contracts | |||
Net interest income on defined benefit plans(1) | |||
Other financial income(2) | ( | ||
Total |
(1)In 2023, Nokia changed the presentation of net interest income on defined benefit plans from financial expenses to financial
income as it better reflects the nature of this item which Nokia expects to be an income also in the foreseeable future. The
comparative amounts for 2022 and 2021 have been recast accordingly.
(2)In 2023, includes an expense of EUR 2 million (income of EUR 11 million in 2022 and expense of EUR 33 million in 2021) due to a
change in the fair value of the financial liability related to Nokia Shanghai Bell. Refer to Note 6.3. Significant partly-owned subsidiaries.
Financial expenses
EURm | 2023 | 2022 | 2021 |
Interest expense on interest-bearing liabilities | ( | ( | ( |
Negative interest on financial investments | ( | ( | ( |
Interest expense on financing components of other contracts(1) | ( | ( | ( |
Interest expense on lease liabilities | ( | ( | ( |
Net fair value (losses)/gains on hedged items under fair value hedge accounting | ( | ||
Net fair value gains/(losses) on hedging instruments under fair value hedge accounting | ( | ( | |
Net foreign exchange (losses)/gains | ( | ( | |
Other financial expenses(2) | ( | ( | ( |
Total | ( | ( | ( |
(1)In 2023, includes EUR 106 million (EUR 46 million in 2022 and EUR 12 million in 2021) related to the sale of receivables.
(2)In 2023, includes an increase in loss allowance of EUR 9 million (impairment of EUR 61 million in 2022 and increase in loss
allowance of EUR 32 million in 2021) related to loans extended to certain emerging market customers.
Business overview | Corporate governance | Operating and financial review and prospects | General facts on Nokia | Financial statements | Other information | 156 | |||||||
Notes to the consolidated financial statements continued
Nokia Annual Report on Form 20-F 2023
Income tax expense comprises current tax and deferred tax.
Tax is recognized in the income statement except to the
extent that it relates to items recognized in other
comprehensive income, or directly in equity, in which case
the related tax is recognized in other comprehensive income
or equity, respectively.
Current taxes are calculated based on the results of the
Group companies in accordance with local tax laws and using
tax rates that are enacted or substantively enacted at the
reporting date. Corporate taxes withheld at the source of
the income on behalf of Group companies are accounted
for as income taxes when determined to represent a tax on
net income.
Deferred tax assets and liabilities are determined using the
balance sheet liability method for all temporary differences
arising between the tax bases of assets and liabilities and
their carrying amounts in the statement of financial
position. Deferred tax assets are recognized to the extent
it is probable that future taxable profit will be available
against which the unused tax losses, unused tax credits
and deductible temporary differences can be utilized in
the relevant jurisdictions. Deferred tax assets are assessed
for realizability at each reporting date. When facts and
circumstances indicate it is no longer probable that
deferred tax assets will be utilized, adjustments are made
as necessary.
Deferred tax liabilities are recognized for taxable temporary
differences, and for temporary differences that arise
between the fair value and the tax base of identifiable net
assets acquired in business combinations. Deferred tax
liabilities are not recognized if they arise from the initial
recognition of goodwill. Deferred tax liabilities are
recognized on taxable temporary differences associated
with investments in subsidiaries, associates and joint
arrangements, unless the timing of the reversal of the
temporary difference is controlled by Nokia, and it is
probable that the temporary difference will not reverse
in the foreseeable future. Nokia applies the exception to
recognizing and disclosing information about deferred
tax assets and liabilities related to Pillar Two income taxes.
Deferred tax assets and deferred tax liabilities are measured
using the enacted or substantively enacted tax rates at
the reporting date that are expected to apply in the
period when the asset is realized or the liability is settled.
Deferred tax assets and liabilities are not discounted.
Deferred tax assets and deferred tax liabilities are offset for
presentation purposes when there is a legally enforceable
right to set off current tax assets against current tax
liabilities, and the deferred tax assets and deferred tax
liabilities relate to income taxes levied by the same taxation
authority on either the same taxable entity or different
taxable entities which intend either to settle current tax
liabilities and assets on a net basis, or realize the assets and
settle the liabilities simultaneously in each future period
in which significant amounts of deferred tax liabilities or
deferred tax assets are expected to be settled or recovered.
Nokia periodically evaluates positions taken in tax returns
in situations where applicable tax regulation is subject to
interpretation. The amounts of current and deferred tax
assets and liabilities are adjusted when it is considered
probable, i.e. more likely than not, that certain tax positions
may not be fully sustained upon review by tax authorities.
The amounts recorded are based on the most likely amount
or the expected value, depending on which method Nokia
expects to better predict the resolution of the uncertainty,
at each reporting date.
Nokia is subject to income taxes in the jurisdictions in
which it operates. Judgment is required in determining
current tax expense, uncertain tax positions, deferred
tax assets and deferred tax liabilities; and the extent to
which deferred tax assets can be recognized.
Estimates related to the recoverability of deferred tax
assets are based on forecast future taxable income
and tax planning strategies. Based on these estimates
and assumptions, at 31 December 2023 Nokia has
EUR 21 569 million (EUR 20 214 million in 2022) of
unused tax losses, unused tax credits and deductible
temporary differences for which no deferred tax assets
are recognized due to uncertainty of utilization. The
majority of the unrecognized deferred tax assets relate
to France.
The utilization of deferred tax assets is dependent on
future taxable profit in excess of the profit arising from
the reversal of existing taxable temporary differences.
The recognition of deferred tax assets is based on the
assessment of whether it is probable that sufficient
taxable profit will be available in the future to utilize the
unused tax losses, unused tax credits and deductible
temporary differences before the unused tax losses
and unused tax credits expire. Recognition of deferred
tax assets involves judgment regarding the future
financial performance of the particular legal entity
or tax group that has recognized the deferred tax asset.
At 31 December 2022, Nokia re-recognized deferred
tax assets of EUR 2.5 billion related to Finland in the
statement of financial position.
Business overview | Corporate governance | Operating and financial review and prospects | General facts on Nokia | Financial statements | Other information | 157 | |||||||
Notes to the consolidated financial statements continued
Nokia Annual Report on Form 20-F 2023
Components of the income tax expense/benefit
EURm | 2023 | 2022 | 2021 |
Current tax expense | ( | ( | ( |
Deferred tax (expense)/benefit | ( | ||
Total | ( | ( |
Income tax reconciliation
EURm | 2023 | 2022 | 2021 |
Income tax expense at statutory rate | ( | ( | ( |
Permanent differences | |||
Non-creditable withholding taxes | ( | ( | ( |
Income taxes for prior years(1) | |||
Effect of different tax rates of subsidiaries operating in other jurisdictions | ( | ( | ( |
Effect of deferred tax assets not recognized(2) | ( | ( | ( |
Benefit arising from previously unrecognized deferred tax assets(3) | |||
Net (increase)/decrease in uncertain tax positions | ( | ( | |
Change in income tax rates | |||
Income taxes on undistributed earnings | ( | ( | ( |
Total | ( | ( |
(1)In 2021, relates primarily to a tax benefit related to past operating model integration.
(2)In 2023, includes a remeasurement of deferred tax assets related to internal operating model change.
(3)In 2022, includes a re-recognition of deferred tax assets related to Finland.
Income tax liabilities and assets include a net liability of EUR 184 million (EUR 182 million in 2022)
relating to uncertain tax positions with inherently uncertain timing of cash outflows.
Prior period income tax returns for certain Group companies are under examination by local tax
authorities. Nokia has ongoing tax investigations in various jurisdictions, including the United
States, Canada, India, Brazil, Saudi Arabia, France, China and South Korea. Nokia’s business and
investments, especially in emerging market countries, may be subject to uncertainties, including
unfavorable or unpredictable tax treatment. Management judgment and a degree of estimation
are required in determining the tax expense or benefit. Even though management does not
expect that any significant additional taxes in excess of those already provided for will arise
as a result of these examinations, the outcome or actual cost of settlement may vary materially
from estimates.
Deferred tax assets and liabilities
2023 | 2022 | ||||||
Deferred | Deferred | Net | Deferred | Deferred | Net | ||
EURm | tax assets | tax liabilities | balance | tax assets | tax liabilities | balance | |
Tax losses carried forward and unused tax credits | ( | ||||||
Undistributed earnings | ( | ( | |||||
Intangible assets and property, plant and equipment | ( | ( | |||||
Right-of-use assets | ( | ( | |||||
Defined benefit pension assets | ( | ( | |||||
Other non-current assets | ( | ( | |||||
Inventories | ( | ( | |||||
Other current assets | ( | ( | |||||
Lease liabilities | |||||||
Defined benefit pension and other post-employment liabilities | |||||||
Other non-current liabilities | ( | ||||||
Provisions | ( | ( | |||||
Other current liabilities | ( | ( | |||||
Other temporary differences | ( | ( | |||||
Total before netting | ( | ( | |||||
Netting of deferred tax assets and liabilities | ( | — | ( | — | |||
Total after netting | ( | ( | |||||
In 2023 Nokia recognized a deferred tax expense and a decrease in deferred tax assets of
EUR 0.4 billion due to an internal transaction related to an operating model change that led
to a remeasurement of deferred tax assets in Finland and the United States.
Nokia has undistributed earnings of EUR 356 million (EUR 388 million in 2022) for which a
deferred tax liability has not been recognized as these earnings will not be distributed in the
foreseeable future.
Business overview | Corporate governance | Operating and financial review and prospects | General facts on Nokia | Financial statements | Other information | 158 | |||||||
Notes to the consolidated financial statements continued
Nokia Annual Report on Form 20-F 2023
Movements in the net deferred tax balance during the year:
EURm | 2023 | 2022 | 2021 |
1 January | |||
Recognized in income statement, continuing operations | ( | ||
Recognized in other comprehensive income | ( | ||
Other | ( | ( | |
Translation differences | ( | ||
31 December |
In addition, at 31 December 2023, Nokia has unrecognized deferred tax assets of which
the majority relate to France. These deferred tax assets have not been recognized due to
uncertainty regarding their utilization. A significant portion of the French unrecognized deferred
tax assets are indefinite in nature and available against future French tax liabilities, subject to a
limitation of 50% of annual taxable profits.
deferred tax asset was recognized due to uncertainty of utilization:
EURm | 2023 | 2022 |
Temporary differences | ||
Tax losses carried forward | ||
Tax credits | ||
Total |
Expiry of tax losses carried forward and unused tax credits:
2023 | 2022 | ||||||
EURm | Recognized | Unrecognized | Total | Recognized | Unrecognized | Total | |
Tax losses carried forward | |||||||
Within 10 years | |||||||
Thereafter | |||||||
No expiry | |||||||
Total | |||||||
Tax credits | |||||||
Within 10 years | |||||||
Thereafter | |||||||
No expiry | |||||||
Total | |||||||
Nokia continually evaluates the probability of utilizing its deferred tax assets and considers both
positive and negative evidence in its assessment. At 31 December 2021, Nokia concluded based
on its assessment that it was not probable that it would have been able to utilize the unused
tax losses, unused tax credits and deductible temporary differences in Finland, which were
generated over a longer period including as a result of historical operating performance and
integration costs in Finland related to the 2016 acquisition of Alcatel-Lucent. This conclusion
was based on the weighting of objective negative evidence of cumulative taxable losses against
more subjective positive evidence. The primary factors in this weighting were the more objective
record of a pattern of historical financial performance compared to the more inherently
subjective expectations regarding future financial performance in Finland.
In 2022, Nokia generated accounting and taxable profit in Finland and there were improvements
in financial performance compared to preceding periods. The changes arose from the underlying
improvements in operating performance. These improvements are expected to be sustained in
the upcoming years, as well as over the longer term. In addition, Nokia has determined that, in
2022, a pattern of material taxable profits was re-established in Finland. Nokia’s re-established
pattern of profitability together with Nokia’s forecasts of future taxable profit in Finland
provides positive evidence about its ability to utilize the unused tax losses and deductible
temporary differences in Finland. At 31 December 2022, Nokia concluded based on its
assessment that it is probable that it will be able to utilize the unused tax losses and deductible
temporary differences and re-recognized deferred tax assets of EUR 2.5 billion in the statement
of financial position.
In 2023, Nokia generated accounting and taxable profit in Finland and continued to recognize
net deferred tax assets related to Finland. In performing its assessment, Nokia has not applied
any cut-off period, other than expiry under the relevant tax legislation. A significant portion of
Finnish deferred tax assets are indefinite in nature and available fully against future Finnish tax
liabilities. Due to the non-expiry of these assets, the sensitivity of future profit projections
affects mainly the period of time over which the deferred tax assets are expected to be utilized.
Income tax related to items of other comprehensive income
2023 | 2022 | 2021 | |||||||||
EURm | Gross | Tax | Net | Gross | Tax | Net | Gross | Tax | Net | ||
Remeasurements of defined benefit plans | ( | ( | ( | ( | ( | ||||||
Translation differences | ( | ( | |||||||||
Net investment hedges | ( | ( | ( | ( | ( | ( | |||||
Cash flow and other hedges | ( | ( | ( | ||||||||
Financial assets at fair value through other comprehensive income | ( | ( | |||||||||
Other decrease | ( | ( | ( | ( | |||||||
Total | ( | ( | ( | ||||||||
Business overview | Corporate governance | Operating and financial review and prospects | General facts on Nokia | Financial statements | Other information | 159 | |||||||
Notes to the consolidated financial statements continued
Nokia Annual Report on Form 20-F 2023
OECD Pillar Two model rules
Nokia is within the scope of the OECD Pillar Two model rules,
which introduce a global minimum tax rate of 15% per
jurisdiction. Pillar Two legislation has been enacted in Finland,
the jurisdiction in which Nokia is incorporated, and will come
into effect from 1 January 2024. Since the Pillar Two legislation
was not effective at the reporting date, Nokia has no related
current tax expense. Nokia applies the exemption to
recognizing and disclosing information about deferred tax
assets and liabilities related to Pillar Two income taxes, as
provided in the amendments to IAS 12 issued in May 2023.
Nokia has performed an analysis of the expected impact of the
Pillar Two legislation and based on this analysis the impact on
income tax expense and effective tax rate in the short term is
expected to be immaterial. The main elements of this analysis
were the following:
■Current understanding of the interpretation of the rules.
■Applicability of the safe harbors for recent years provided
for in the Pillar Two legislation.
■Analysis of potential income tax expense in respect of
jurisdictions not meeting safe harbor tests.
Accounting policies Basic earnings per share is calculated by dividing the profit or loss attributable to equity holders of the parent by the weighted average number of shares outstanding during the year. Diluted earnings per share is calculated by adjusting the profit or loss attributable to equity holders of the parent, and the weighted average number of shares outstanding, for the effects of all dilutive potential ordinary shares. Potential ordinary shares are excluded from the calculation of diluted earnings per share when they are determined to be antidilutive. |
EURm | 2023 | 2022 | 2021 |
Profit or loss attributable to equity holders of the parent | |||
Continuing operations | |||
Discontinued operations | ( | ||
Profit for the year | |||
Number of shares (000s) | |||
Weighted average number of shares outstanding | |||
Effect of potentially dilutive shares | |||
Performance shares | |||
Restricted shares and other | |||
Total effect of potentially dilutive shares | |||
Adjusted weighted average number of shares | |||
Earnings per share, EUR | |||
Basic earnings per share | |||
Continuing operations | |||
Discontinued operations | |||
Profit for the year | |||
Diluted earnings per share | |||
Continuing operations | |||
Discontinued operations | |||
Profit for the year |
Business overview | Corporate governance | Operating and financial review and prospects | General facts on Nokia | Financial statements | Other information | 160 | |||||||
Notes to the consolidated financial statements continued
Nokia Annual Report on Form 20-F 2023
Section 3 |
Compensation
and benefits
This section provides information on Nokia’s
employee benefits including remuneration of the
management and Board of Directors. Employee
benefits comprise salaries and wages, short-term
cash incentives and share-based payments, as well
as post-employment benefits in accordance with
the local conditions and practices in the countries
in which Nokia operates.
Information about the remuneration of the President
and CEO and Board of Directors is provided in
compliance with Finnish Accounting Standards.
EURm | 2023 | 2022 | 2021 |
Salaries and wages(1) | |||
Pensions and other post- employment benefits | |||
Defined contribution plans | |||
Defined benefit plans(2) | |||
Share-based payments | |||
Social security costs | |||
Total |
(1)Includes termination benefits.
(2)Excludes amounts recorded in financial income and expenses, refer to Note 3.4.
Pensions and other post-employment benefits.
2023 | 2022 | 2021 | |
Average number of employees |
Remuneration of the Group Leadership Team
The amounts below represent each member’s time on the
Group Leadership Team.
EURm | 2023 | 2022 | 2021 |
Short-term benefits | |||
Post-employment benefits(1) | |||
Share-based payments | |||
Termination benefits(2) | |||
Total |
(1)The members of the Group Leadership Team participate in the local retirement
programs applicable to employees in the country where they reside.
(2)Includes both termination payments and payments made under exceptional
contractual arrangements for lapsed equity awards.
Remuneration of the President and CEO
EUR | 2023 | 2022 | 2021 |
Base salary | |||
Cash incentive payments | |||
Share-based payment expenses(1) | |||
Pension expenses | |||
Other benefits(2) | |||
Total |
(1)Represents the expense for all outstanding equity grants recorded during the year.
(2)Other benefits consist of telephone, car, driver, mobility, tax compliance support
Terms of termination of employment of the President
and CEO
The President and CEO, Pekka Lundmark, may terminate his
service agreement at any time with 12 months’ prior notice.
The President and CEO would either continue to receive salary
and benefits during the notice period or, at Nokia’s discretion,
a lump sum of equivalent value. Additionally, the President and
CEO would be entitled to any short- or long-term incentives
that would normally vest during the notice period. Any
unvested equity awards would be forfeited after termination.
In the event that the President and CEO terminates his service
agreement based on a final arbitration award demonstrating
Nokia’s material breach of the service agreement, he is entitled
to a severance payment equaling up to 12 months of
compensation, including annual base salary, benefits and target
incentive. Any unvested equity awards would be forfeited
after termination.
Business overview | Corporate governance | Operating and financial review and prospects | General facts on Nokia | Financial statements | Other information | 161 | |||||||
Notes to the consolidated financial statements continued
Nokia Annual Report on Form 20-F 2023
Remuneration of the Board of Directors
The annual remuneration paid to the members of the Board of Directors, as decided by the Annual General Meetings in the respective years: |
2023 | 2022 | 2021 | |||||||||
Annual fee(1) EUR | Meeting fees(2) EUR | Shares received(3) number | Annual fee(1) EUR | Meeting fees(2) EUR | Shares received(3) number | Annual fee(1) EUR | Meeting fees(2) EUR | Shares received(3) number | |||
Sari Baldauf, Chair (4)(5) | |||||||||||
Søren Skou, Vice Chair(4) | |||||||||||
Timo Ahopelto(5)(6) | |||||||||||
Bruce Brown | |||||||||||
Elizabeth Crain(4)(6) | |||||||||||
Thomas Dannenfeldt(4)(6) | |||||||||||
Lisa Hook(4) | |||||||||||
Jeanette Horan(5)(6) | |||||||||||
Edward Kozel | |||||||||||
Thomas Saueressig(5) | |||||||||||
Carla Smits-Nusteling(6) | |||||||||||
Kari Stadigh | |||||||||||
Kai Öistämö(5) | |||||||||||
Total | |||||||||||
(1)Annual fees consist of Board member fees and Committee chair and member fees. (2)Meeting fees include all meeting fees paid for the term that ended at the Annual General Meeting held on 4 April 2023, and meeting fees accrued and paid in 2023 for the term that began at the same meeting. (3)Approximately (4)Annual fees in 2023 include EUR (5)Annual fees in 2023 include EUR (6)Annual fees in 2023 include EUR |
Business overview | Corporate governance | Operating and financial review and prospects | General facts on Nokia | Financial statements | Other information | 162 | |||||||
Notes to the consolidated financial statements continued
Nokia Annual Report on Form 20-F 2023
Nokia offers three types of global share-based
compensation plans for employees: performance shares,
restricted shares and the employee share purchase plan.
All plans are equity-settled.
Employee services received and the corresponding
increase in equity are measured by reference to the
fair value of the equity instruments at the grant date,
excluding the impact of any non-market vesting
conditions. Plans that apply tranched vesting are
accounted for under the graded vesting model. Share-
based compensation plans are generally conditional on
continued employment as well as the fulfillment of any
performance conditions specified in the award terms.
Until the Nokia shares are delivered, the participants
do not have any shareholder rights, such as voting or
dividend rights, associated with the shares. The share
grants are generally forfeited if the employment
relationship with Nokia terminates prior to vesting.
Share-based compensation is recognized as an expense
over the relevant service periods.
Share-based payment expense
In 2023, the share-based payment expense recognized in the
income statement for all share-based compensation plans
amounted to EUR 202 million (EUR 149 million in 2022 and
EUR 118 million in 2021).
Performance shares
In 2023, Nokia had outstanding Performance shares from
grants made in 2020, 2021, 2022 and 2023. Starting in 2021,
grants made for Performance shares have been targeted on a
more limited basis to senior level employees and executives.
Plan | Performance shares outstanding at target | Confirmed payout (% of target) | Performance period | Settlement year |
2020 | 2020-2023 | 2023 | ||
2021 | 2021-2023 | 2024 | ||
2022 | 2022-2024 | 2025 | ||
2023 | 2023-2025 | 2026 |
The 2020, 2021, and 2022 Performance share grants have
a three-year vesting period where Nokia’s actual total
shareholder return (ATSR) is compared to the target total
shareholder return to determine the number of Nokia shares
that will be delivered at settlement. The 2020, 2021 and 2022
Performance share grants do not include a minimum
payout guarantee.
The 2023 Performance share grants apply the ATSR
performance metric to two-thirds of the grant. For the
remaining one-third of the granted shares, the metrics are
either a service condition alone or a Relative total shareholder
return (RTSR). RTSR grants measure Nokia’s share performance
against its peer group companies where minimum payout for
this metric requires Nokia to be at least in the 25th percentile
when compared with the peer group.
Restricted shares
In 2023, there were outstanding Restricted shares from grants
made in 2020, 2021, 2022 and 2023. Starting in 2021, Nokia
has granted Restricted shares to selected employees as the
primary method of equity compensation. Restricted shares
are Nokia shares that will be delivered to eligible participants
at a future point in time, subject to the fulfillment of
predetermined service conditions. Restricted shares will either
vest on the third anniversary of the award or follow a tranche
vesting schedule whereby each plan vests in one or more
tranches determined at the award date.
The Restricted share grants are generally forfeited if the
employment relationship with Nokia terminates prior to vesting
of the applicable tranche or tranches.
Employee share purchase plan
Nokia offers a voluntary Employee Share Purchase Plan (ESPP)
to its employees. Participating employees make contributions
from their net salary to purchase Nokia shares on a monthly
basis during a 12-month savings period. Nokia delivers one
matching share for every two purchased shares the employee
holds at the end of the plan cycle. In 2023, 6 726 190 matching
shares were issued as a settlement to the participants of the
ESPP 2022 (5 243 560 matching shares issued under the 2021
Plan in 2022 and 4 851 070 matching shares issued under the
2020 Plan in 2021).
Business overview | Corporate governance | Operating and financial review and prospects | General facts on Nokia | Financial statements | Other information | 163 | |||||||
Notes to the consolidated financial statements continued
Nokia Annual Report on Form 20-F 2023
Performance shares | Restricted shares | ||||
Number of shares outstanding at target | Weighted average grant date fair value (EUR) | Number of shares outstanding | Weighted average grant date fair value (EUR) | ||
1 January 2021 | |||||
Granted | |||||
Forfeited | ( | ( | |||
Vested(1) | ( | ( | |||
31 December 2021 | |||||
Granted | |||||
Forfeited | ( | ( | |||
Vested(1) | ( | ( | |||
31 December 2022 | |||||
Granted | |||||
Forfeited | ( | ( | |||
Vested(1) | ( | ( | |||
31 December 2023 | |||||
(1)Vested performance shares at target are to be multiplied by the confirmed payout (% of target) to calculate the total number of Nokia shares settled. | |||||
Estimation of grant date fair values | |
Plan | Grant date fair value |
ATSR | Estimated considering the dividend-adjusted Nokia share price at the end of the performance period of the plan and the target payout levels set for the plan. |
RTSR | Estimated considering a combination of the dividend-adjusted Nokia share price compared with benchmark companies’ share prices at the end of the performance period of the plan and the target payout levels set for the plan. |
Restricted Shares | Estimated using the grant date market price of the Nokia share less the present value of dividends expected to be paid during the vesting period. |
Business overview | Corporate governance | Operating and financial review and prospects | General facts on Nokia | Financial statements | Other information | 164 | |||||||
Notes to the consolidated financial statements continued
Nokia Annual Report on Form 20-F 2023
Nokia has various post-employment plans in accordance with the local conditions and
practices in the countries in which it operates. Nokia’s defined benefit plans comprise
pension schemes as well as other benefit plans providing post-employment healthcare and
life insurance coverage to certain employee groups. Defined benefit plans expose Nokia to
various risks such as investment risk, interest rate risk, life expectancy risk, and regulatory/
compliance risk. The characteristics and extent of these risks vary depending on the legal,
fiscal and economic requirements in each country, as well as the impact of global events.
The plans are generally funded through payments to insurance companies or contributions
to trustee-administered funds as determined by periodic actuarial calculations.
The costs of defined benefit plans are assessed using the projected unit credit method.
The defined benefit obligation is measured as the present value of the estimated future
cash outflows using interest rates on high-quality corporate bonds or government bonds
with maturities most closely matching expected payouts of benefits. The plan assets
are measured at fair value at the reporting date. The liability or asset recognized in the
statement of financial position is the present value of the defined benefit obligation at the
reporting date less the fair value of plan assets adjusted for effects of any asset ceiling.
Actuarial valuations for defined benefit plans are performed annually or when a material
plan amendment, curtailment or settlement occurs. Service cost related to employees’
service in the current period and past service cost resulting from plan amendments and
curtailments, as well as gains and losses on settlements, are presented in cost of sales,
research and development expenses or selling, general and administrative expenses. Net
interest as well as pension plan administration costs not considered in determining the
return on plan assets, are presented in financial income and expenses. Remeasurements,
comprising actuarial gains and losses, the effect of the asset ceiling and the return
on plan assets, excluding amounts recognized in net interest, are recognized in other
comprehensive income. Remeasurements are not reclassified to profit or loss in
subsequent periods.
In a defined contribution plan, Nokia’s legal or constructive obligation is limited to the
amount that it agrees to contribute to the fund. Nokia’s contributions to defined
contribution plans, multi-employer and insured plans are recognized in the income
statement in the period to which the contributions relate. If a pension plan is funded
through an insurance contract where Nokia does not retain any legal or constructive
obligations, the plan is treated as a defined contribution plan. All arrangements that
do not fulfill these conditions are considered defined benefit plans.
Defined benefit plans
Nokia’s most significant defined benefit plans are in the United States, Germany, and the
United Kingdom. Together, they account for 93 % of Nokia’s total defined benefit obligation
(91 % in 2022) and 91 % of Nokia’s total fair value of plan assets (90 % in 2022).
EURm | Defined benefit obligation | Fair value of plan assets | Effects of asset ceiling | Net defined benefit balance |
2023 | ||||
United States, Pension | ( | |||
United States, OPEB | ( | ( | ||
Germany | ( | ( | ||
United Kingdom | ( | |||
Other | ( | ( | ||
Total | ( | ( | ||
2022 | ||||
United States, Pension | ( | |||
United States, OPEB | ( | ( | ||
Germany | ( | ( | ||
United Kingdom | ( | |||
Other | ( | ( | ||
Total | ( | ( |
Funded status of defined benefit obligation:
EURm | 2023 | 2022 |
Wholly funded | ||
Partly funded | ||
Unfunded | ||
Total |
Business overview | Corporate governance | Operating and financial review and prospects | General facts on Nokia | Financial statements | Other information | 165 | |||||||
Notes to the consolidated financial statements continued
Nokia Annual Report on Form 20-F 2023
United States
Nokia has significant defined benefit pension plans and a significant post-employment welfare
benefit plan (OPEB) providing post-employment healthcare benefits and life insurance coverage
in the United States.
Defined Benefit Pension Plans
The defined benefit pension plans include both traditional service-based programs and cash-
balance plans. Salaried, non-union-represented employees are covered by a cash-balance
program. All other legacy programs, including legacy service-based programs, were frozen by
31 December 2009. For former employees who, when actively employed, were represented
by a union, Nokia maintained two defined benefit pension plans, both of which are traditional
service-based programs. On 31 December 2021, these two plans were merged.
Other Post-Employment Benefit Plan
The other post-employment benefit plan provides welfare benefits for certain retired former
employees. Pursuant to an agreement with the Communications Workers of America (CWA) and
the International Brotherhood of Electrical Workers (IBEW) unions, Nokia provides post-employment
healthcare benefits and life insurance coverage for employees formerly represented by these
Germany
Nokia maintains two primary plans in Germany which cover the majority of active employees:
the cash-balance plan Beitragsorientierter Altersversorgungs Plan (BAP) for the Group’s Nokia
employees and a similar cash-balance program (AVK Basis-/Matchingkonto) for the Group’s
former Alcatel-Lucent employees. Individual benefits are generally dependent on eligible
compensation levels, ranking within the Group and years of service. These plans are partially
funded defined benefit pension plans, the benefits being subject to a minimum return
guaranteed by the Group. The funding vehicle for the BAP is the NSN Pension Trust e.V.
The trust is legally separate from the Group and manages the plan assets in accordance with
the respective trust agreements.
All other plans have been frozen or closed in prior years and replaced by the cash-balance plans.
Benefits are paid in annual installments, as monthly retirement pension, or as a lump sum on
retirement in an amount equal to accrued pensions and guaranteed interest.
United Kingdom
Nokia maintains one primary plan in the UK, “Nokia Retirement Plan for former NSN & ALU
employees”, which is the result of the 2019 merger of the legacy Nokia plan where the plan
was merged and members’ benefits were transferred to the legacy Alcatel-Lucent plan. The
combined plan consists of both money purchase sections with Guaranteed Minimum Pension
(GMP) underpin and final salary sections. All final salary sections are closed to future benefit
accrual: the legacy Nokia plan closed on 30 April 2012 and the legacy Alcatel-Lucent plan
on 30 April 2018. Individual benefits for final salary sections are dependent on eligible
compensation levels and years of service. For the money purchase sections with GMP underpin,
individual benefits are dependent on the greater of the value of GMP at retirement date and
the pension value resulting from the individual’s invested funds. Nokia engages the services of
an external trustee service provider to manage all investments for the combined pension plan.
Business overview | Corporate governance | Operating and financial review and prospects | General facts on Nokia | Financial statements | Other information | 166 | |||||||
Notes to the consolidated financial statements continued
Nokia Annual Report on Form 20-F 2023
Defined benefit obligation | 2023 | 2022 | |||||||
EURm | United States pension | United States OPEB | Other pension | Total | United States pension | United States OPEB | Other pension | Total | |
1 January | ( | ( | ( | ( | ( | ( | ( | ( | |
Current service cost | ( | ( | ( | ( | ( | ( | |||
Interest expense | ( | ( | ( | ( | ( | ( | ( | ( | |
Past service cost | ( | ( | |||||||
Settlements(1) | |||||||||
Total | ( | ( | ( | ( | ( | ( | ( | ||
Remeasurements: | |||||||||
Gain/(loss) from change in demographic assumptions | ( | ( | ( | ||||||
(Loss)/gain from change in financial assumptions | ( | ( | ( | ( | |||||
Experience (loss)/gain | ( | ( | ( | ( | ( | ( | ( | ||
Total | ( | ( | ( | ||||||
Translation differences | ( | ( | ( | ( | |||||
Contributions from plan participants | ( | ( | ( | ( | ( | ( | |||
Benefits paid | |||||||||
Other | ( | ( | ( | ( | |||||
Total | |||||||||
31 December | ( | ( | ( | ( | ( | ( | ( | ( | |
Weighted average duration of the defined benefit obligation (in years) | |||||||||
Business overview | Corporate governance | Operating and financial review and prospects | General facts on Nokia | Financial statements | Other information | 167 | |||||||
Notes to the consolidated financial statements continued
Nokia Annual Report on Form 20-F 2023
Fair value of plan assets | 2023 | 2022 | |||||||
EURm | United States pension | United States OPEB | Other pension | Total | United States pension | United States OPEB | Other pension | Total | |
1 January | |||||||||
Interest income | |||||||||
Administrative expenses and interest on asset ceiling | ( | ( | ( | ( | ( | ( | |||
Settlements(1) | ( | ( | ( | ( | |||||
Total | ( | ||||||||
Remeasurements: | |||||||||
Return on plan assets, excluding amounts included in interest income | ( | ( | ( | ( | ( | ( | |||
Total | ( | ( | ( | ( | ( | ( | |||
Translation differences | ( | ( | ( | ( | |||||
Contributions: | |||||||||
Employers | |||||||||
Plan participants | |||||||||
Benefits paid | ( | ( | ( | ( | ( | ( | ( | ( | |
Section 420 transfer(2) | ( | ( | |||||||
Other | ( | ( | ( | ( | |||||
Total | ( | ( | ( | ( | ( | ( | ( | ( | |
31 December | |||||||||
(1)In 2023, the settlement relates to transfer of assets from formerly Nokia managed Provident Fund to Indian government managed Provident Fund platform (EPFO).
(2)Refer to the Future cash flows section below for description of Section 420 transfers.
The impact of the asset ceiling limitation | 2023 | 2022 | |||||||
EURm | United States pension | United States OPEB | Other pension | Total | United States pension | United States OPEB | Other pension | Total | |
1 January | ( | ( | ( | ( | |||||
Interest expense | ( | ( | |||||||
Remeasurements: | |||||||||
Change in asset ceiling, excluding amounts included in interest expense | |||||||||
Translation differences | ( | ( | ( | ( | |||||
31 December | ( | ( | ( | ( | |||||
Net balances | 2023 | 2022 | |||||||
EURm | United States pension | United States OPEB | Other pension | Total | United States pension | United States OPEB | Other pension | Total | |
31 December | ( | ( | ( | ( | |||||
Consisting of: | |||||||||
Net pension assets | |||||||||
Net pension liabilities | ( | ( | ( | ( | ( | ( | ( | ( | |
Business overview | Corporate governance | Operating and financial review and prospects | General facts on Nokia | Financial statements | Other information | 168 | |||||||
Notes to the consolidated financial statements continued
Nokia Annual Report on Form 20-F 2023
Recognized in the income statement
EURm | 2023 | 2022 | 2021 |
Current service cost(1) | |||
Past service cost(1) | ( | ( | |
Net interest(2) | ( | ( | ( |
Settlements(1) | ( | ( | |
Total | ( |
(1)Included in operating expenses within the income statement.
(2)Included in financial income within the income statement.
Recognized in other comprehensive income
EURm | 2023 | 2022 | 2021 |
Return on plan assets, excluding amounts included in interest income | ( | ( | |
Gain/(loss) from change in demographic assumptions | ( | ( | |
(Loss)/gain from change in financial assumptions | ( | ||
Experience (loss)/gain | ( | ( | |
Change in asset ceiling, excluding amounts included in interest expense | |||
Total | ( | ( |
Actuarial assumptions and sensitivity analysis
Actuarial assumptions
Discount rate | Mortality table | |||
2023 | 2022 | 2023 | ||
United States | Pri-2012 w/MP-2020 Mortality projection scale | |||
Germany | Heubeck 2018G | |||
United Kingdom(1) | CMI 2021 | |||
Total weighted average for all countries | ||||
(1)Mortality tables for United Kingdom have been adjusted with 1.5 % long-term rate of improvement.
Assumptions regarding future mortality are set based on actuarial advice in accordance with
obligation and sensitivity of the defined benefit obligation to changes in these assumptions:
2023 | 2022 | Change in assumption | Increase in assumption(1) EURm | Decrease in assumption(1) EURm | |
Discount rate for determining present values | ( | ||||
Pension growth rate | ( | ||||
Inflation rate | ( | ||||
Life expectancy | ( |
(1)Positive movement indicates a reduction in the defined benefit obligation; a negative movement indicates an increase in the
defined benefit obligation.
Sensitivity analysis
When calculating the sensitivity of the defined benefit obligation to significant actuarial
assumptions, the present value of the defined benefit obligation is calculated using the
projected unit credit method. The sensitivity analyses are based on a change in an assumption
while holding all other assumptions constant and may not be representative of the actual impact
of changes. If more than one assumption is changed simultaneously, the combined impact
of changes would not necessarily be the same as the sum of the individual changes. If the
assumptions change to a different level compared with that presented, the effect on the defined
benefit obligation may not be linear. Increases and decreases in the principal assumptions, which
are used in determining the defined benefit obligation, do not have a symmetrical effect on
the defined benefit obligation primarily due to the compound interest effect created when
determining the net present value of the future benefit.
Key source of estimation uncertainty
The determination of pension and other post-employment benefit obligations and
expenses for defined benefit plans is dependent on a number of estimates and
assumptions, including the discount rate, future mortality rate, annual rate of increase
in future compensation levels, and healthcare costs trend rates and usage of services
in the United States where the majority of our post-employment healthcare plans are
maintained. Changes in assumptions and actuarial estimates may materially affect the
benefit obligation, future expense and future cash flow.
Business overview | Corporate governance | Operating and financial review and prospects | General facts on Nokia | Financial statements | Other information | 169 | |||||||
Notes to the consolidated financial statements continued
Nokia Annual Report on Form 20-F 2023
Investment strategies
The overall pension investment objective of Nokia is to
preserve or enhance the defined benefit pension plans’ funded
status through the implementation of an investment strategy
that maximizes return within the context of minimizing funded
status risk. In formulating the asset allocation for the plans,
multiple factors are considered, including, but not limited to,
the long-term risk and return expectations for a variety of
asset classes as well as current and multi-year projections
of the defined benefit pension plans’ demographics, benefit
payments, contributions and funded status. Local trustee
boards are responsible for conducting Asset-Liability
Management (ALM) studies, when appropriate; overseeing the
investment of plan assets; and monitoring and managing
associated risks under company oversight and in accordance
with local law. The results of the ALM framework are
implemented on a plan level.
Nokia’s pension investment managers may use derivative
financial instruments including futures contracts, forward
contracts, options and interest rate swaps to manage market
risk. The performance and risk profile of investments is
regularly monitored on a standalone basis as well as in the
broader portfolio context. One risk is a decline in the plan’s
funded status as a result of the adverse performance of plan
assets and/or defined benefit obligations. The application
of the ALM study focuses on minimizing such risks.
United States plan assets
The majority of Nokia’s United States pension plan assets are
held in a master pension trust. The OPEB plan assets are held
in two separate trusts. The Pension & Benefits Investment
Committee formally approves the target allocation ranges
every few years on the completion of the ALM study by
external advisers and Nokia’s investment management
company (NIMCO). The overall United States pension plan
asset portfolio, at 31 December 2023, reflects a balance of
investments split of approximately 20 /80 between equity,
including alternative investments for this purpose, and fixed
income securities.
Disaggregation of plan assets
2023 | 2022 | ||||||||
EURm | Quoted | Unquoted | Total | % | Quoted | Unquoted | Total | % | |
Equity securities | |||||||||
Fixed income securities | |||||||||
Insurance contracts | |||||||||
Real estate | |||||||||
Short-term investments | |||||||||
Private equity and other | |||||||||
Total | |||||||||
Most short-term investments including cash, equities and fixed-income securities have quoted market prices in active markets. Equity securities represent investments in equity funds and direct investments, which have quoted market prices in an active market. Fixed income securities represent direct investments in government and corporate bonds, as well as investments in bond funds, which have quoted market prices in an active market. Insurance contracts are customary pension insurance contracts structured under domestic law in the respective countries. Real estate investments are investments in commercial properties or real estate funds, which invest in a diverse range of real estate properties. Short-term investments are liquid assets or cash, which are being held for a short period of time, with the primary purpose of controlling the tactical asset allocation. Private equity net asset values (NAVs) are determined by the asset managers based on inputs such as operating results, discounted future cash flows and market-based comparable data. Assets invested in alternative asset classes such as private equity, real estate and absolute return, are measured using latest available valuations provided by the asset managers, reviewed by Nokia, and adjusted for subsequent cash flows. |
Business overview | Corporate governance | Operating and financial review and prospects | General facts on Nokia | Financial statements | Other information | 170 | |||||||
Notes to the consolidated financial statements continued
Nokia Annual Report on Form 20-F 2023
Future cash flows
Contributions
Group contributions to the pension and other post-employment benefit plans are made to
facilitate future benefit payments to plan participants. The funding policy is to meet minimum
funding requirements as set forth in the employee benefit and tax laws, as well as any such
additional amounts as Nokia may determine appropriate. Contributions are made to benefit
plans for the sole benefit of plan participants. Employer contributions expected to be paid in
2024 total EUR 56 million.
United States
Funding methods
Funding requirements for the two United States qualified defined benefit pension plans are
determined by the applicable statutes, namely the Employee Retirement Income Security Act of
1974 (ERISA), the Internal Revenue Code of 1986, and regulations issued by the Internal Revenue
Service (IRS). In determining funding requirements, ERISA allows assets to be either fair value
or an average value over a period of time; and liabilities to be based on spot interest rates or
average interest rates over a period of time. For the non-represented and formerly represented
defined benefit pension plans, Nokia does not foresee any future funding requirement for
regulatory funding purposes, given the plans’ asset allocation and the level of assets compared
to liabilities.
Post-employment healthcare benefits for both non-represented and formerly union
represented retirees are capped for those who retired after 28 February 1990. The benefit
obligation associated with this group of retirees is 98 % of the total United States retiree
healthcare obligation at 31 December 2023. The US government’s Medicare program is the
primary payer for those aged 65 and older.
Section 420 transfers
Section 420 of the U.S. Internal Revenue Code (Section 420) allows for the transfer of pension
assets in excess of specified thresholds above the plan’s funding obligation (excess pension
assets) to a retiree health benefits account, a retiree life insurance account, or both, maintained
within the pension plan and to use the assets in such accounts to pay for, or to reimburse the
employer for the cost of providing applicable health or life insurance benefits, each as defined
in Section 420, for retired employees, and with respect to health benefits, their spouses and
dependents. Employers making such transfers are required to continue to provide healthcare
benefits or life insurance coverage, as the case may be, for a certain period of time (cost
maintenance period) at levels prescribed by regulations. Pursuant to Section 420, Nokia has
transferred EUR 131 million during 2023 (EUR 117 million in 2022). Section 420 is currently set
to expire on 31 December 2032.
Benefit payments
The following table summarizes expected benefit payments from the defined benefit pension
plans and other post-employment benefit plans until 2033. Actual benefit payments may differ
from expected benefit payments.
US Pension | US OPEB | Other countries | Total | |||||||
EURm | Management | Occupational | Supplemental plans | Formerly union represented | Non-union represented | |||||
2024 | ||||||||||
2025 | ||||||||||
2026 | ||||||||||
2027 | ||||||||||
2028 | ||||||||||
2029-2033 | ||||||||||
Benefits are paid from plan assets where there is sufficient funding available to the plan to cover
the benefit obligation. Any payments in excess of the plan assets are paid directly by Nokia.
Direct benefit payments expected to be paid in 2024 total EUR 111 million.
Business overview | Corporate governance | Operating and financial review and prospects | General facts on Nokia | Financial statements | Other information | 171 | |||||||
Notes to the consolidated financial statements continued
Nokia Annual Report on Form 20-F 2023
Section 4 |
Operating
assets and
liabilities
This section provides detailed information on Nokia’s
assets and liabilities related to its operating activities
such as tangible and intangible fixed assets, leases,
inventories, trade receivables and other customer
related balances, and provisions.
Intangible assets acquired separately are measured on
initial recognition at cost. Internally generated intangibles,
except for development costs that may be capitalized, are
expensed as incurred. Development costs are capitalized
only if Nokia has the technical feasibility to complete the
asset; has an ability and intention to use or sell the asset;
can demonstrate that the asset will generate future
economic benefits; has resources available to complete
the asset; and has the ability to measure reliably the
expenditure during development.
The useful life of Nokia’s intangible assets, other than
goodwill, is finite. Following initial recognition, finite
intangible assets are carried at cost less accumulated
amortization and accumulated impairment losses. Intangible
assets are amortized over their useful lives, generally three
considered to best reflect the pattern in which the asset’s
future economic benefits are expected to be consumed.
Depending on the nature of the intangible asset, the
amortization charges are included in cost of sales,
research and development expenses or selling, general
and administrative expenses.
Goodwill is allocated to the cash-generating units or groups
of cash-generating units that are expected to benefit from
the synergies of the related business combination and that
reflect the lowest level at which goodwill is monitored for
internal management purposes. A cash-generating unit, as
determined for the purposes of Nokia’s goodwill impairment
testing, is the smallest group of assets generating cash
inflows that are largely independent of the cash inflows
from other assets or groups of assets. The carrying value
of a cash-generating unit includes its share of relevant
corporate assets allocated to it on a reasonable and
consistent basis. When the composition of one or more
groups of cash-generating units to which goodwill has been
allocated is changed, the goodwill is reallocated based on
the relative fair value of the affected groups of cash-
generating units.
annually. In addition, Nokia assesses the recoverability of the
carrying value of goodwill and intangible assets if events
or changes in circumstances indicate that the carrying value
may be impaired. Factors that Nokia considers when it
reviews indications of impairment include, but are not
limited to, underperformance of the asset relative to its
historical or projected future results, significant changes
in the manner of using the asset or the strategy for the
overall business, and significant negative industry or
economic trends.
Nokia conducts its impairment testing by determining the
recoverable amount for an asset, a cash-generating unit or
groups of cash-generating units. The recoverable amount
of an asset, a cash-generating unit or groups of cash-
generating units is the higher of its fair value less costs of
disposal and its value-in-use. The recoverable amount is
compared to the asset’s, cash-generating unit’s or groups
of cash-generating units’ carrying value. If the recoverable
amount for the asset, cash-generating unit or groups of
cash-generating units is less than its carrying value, the
asset is considered impaired and is written down to its
recoverable amount. Impairment losses are presented
in cost of sales, research and development expenses or
selling, general and administrative expenses, except for
impairment losses on goodwill, which are presented in
other operating expenses.
Business overview | Corporate governance | Operating and financial review and prospects | General facts on Nokia | Financial statements | Other information | 172 | |||||||
Notes to the consolidated financial statements continued
Nokia Annual Report on Form 20-F 2023
EURm | Goodwill | Intangible assets | Total | ||
2023 | |||||
Acquisition cost at 1 January | |||||
Additions | |||||
Disposals, retirements and reclassifications | ( | ( | ( | ||
Translation differences | ( | ( | ( | ||
Acquisition cost at 31 December | |||||
Accumulated amortization and impairment charges at 1 January | ( | ( | ( | ||
Amortization | ( | ( | |||
Impairment charges | ( | ( | |||
Disposals, retirements and reclassifications | |||||
Translation differences | |||||
Accumulated amortization and impairment charges at 31 December | ( | ( | ( | ||
Net book value at 1 January | |||||
Net book value at 31 December | |||||
2022 | |||||
Acquisition cost at 1 January | |||||
Additions | |||||
Disposals, retirements and reclassifications | ( | ( | |||
Translation differences | |||||
Acquisition cost at 31 December | |||||
Accumulated amortization and impairment charges at 1 January | ( | ( | ( | ||
Amortization | ( | ( | |||
Disposals, retirements and reclassifications | |||||
Translation differences | ( | ( | ( | ||
Accumulated amortization and impairment charges at 31 December | ( | ( | ( | ||
Net book value at 1 January | |||||
Net book value at 31 December |
Net book value of intangible assets by type of asset
EURm | 2023 | 2022 | |
Customer relationships | |||
Patents and licenses | |||
Technologies and IPR&D | |||
Tradenames and other | |||
Total |
At 31 December 2023, the weighted average for the remaining
amortization period is approximately two years for customer
relationships, six years for patents and licenses, two years for
technologies and IPR&D, and three years for tradenames
and other.
Business overview | Corporate governance | Operating and financial review and prospects | General facts on Nokia | Financial statements | Other information | 173 | |||||||
Notes to the consolidated financial statements continued
Nokia Annual Report on Form 20-F 2023
Goodwill
Nokia has allocated goodwill to its operating segments
corresponding to groups of cash-generating units (CGUs) that
are expected to benefit from goodwill. Refer to Note 2.2.
Segment information.
Allocation of goodwill
groups of CGUs at 31 December:
EURm | 2023 | 2022 | |
Network Infrastructure | |||
Mobile Networks | |||
Cloud and Network Services |
Recoverable amounts
The recoverable amounts of the groups of CGUs in 2023 were
based on value-in-use that was determined using a discounted
cash flow calculation. The cash flow projections used in
calculating the recoverable amounts were based on financial
plans approved by management covering an explicit forecast
period of three years .
Seven additional years of cash flow projections subsequent
to the explicit forecast period of three years reflect a gradual
progression towards the steady state cash flow projections
modeled in the terminal year. The terminal growth rate
assumptions reflect long-term average growth rates for the
industries and economies in which the groups of CGUs operate.
The discount rates reflect current assessments of the time
value of money and relevant market risk premiums considering
risks and uncertainties for which the future cash flow estimates
have not been adjusted. Discounted cash flow projections are
based on post-tax cash flows and post-tax discount rates,
which do not materially differ from the pre-tax basis
discounted cash flow projections. Other key variables in future
cash flow projections include assumptions on estimated sales
growth, gross margin and operating margin.
Sales growth and gross margin assumptions reflect
management expectations of addressable market growth,
market share and competitive position, strategy and long-term
business outlook. Gross margin and operating profit
assumptions include the impact of an ongoing cost savings
program announced on 19 October 2023. The cost savings
program is expected to reduce cost base and increase
operational efficiency especially within Mobile Networks
and Cloud and Network Services.
impairment test for the groups of CGUs:
Terminal growth rate | Post-tax discount rate | ||||
Key assumption % | 2023 | 2022 | 2023 | 2022 | |
Network Infrastructure | |||||
Mobile Networks | |||||
Cloud and Network Services | |||||
The results of the impairment testing indicate adequate
headroom for each group of CGUs in 2023.
Business overview | Corporate governance | Operating and financial review and prospects | General facts on Nokia | Financial statements | Other information | 174 | |||||||
Notes to the consolidated financial statements continued
Nokia Annual Report on Form 20-F 2023
Property, plant and equipment are stated at cost less
accumulated depreciation and accumulated impairment
losses. Depreciation is recorded on a straight-line basis
over the expected useful lives of the assets as follows:
Buildings and constructions | |
Buildings and constructions | |
Light buildings and constructions | |
Vessels | |
Cable-laying vessels | |
Cable-laying accessories | |
Machinery and equipment | |
Production machinery and measuring and test equipment | |
Other machinery and equipment |
Land and water areas are not depreciated.
Maintenance, repairs and renewals are generally
expensed in the period in which they are incurred.
However, major renovations are capitalized and included
in the carrying amount of the asset when it is probable
that future economic benefits in excess of the originally
assessed standard of performance of the existing asset
will flow to Nokia. Major renovations are depreciated over
the remaining useful life of the related asset. Leasehold
improvements are depreciated over the shorter of the
lease term and the useful life. Gains and losses on the
disposal of property, plant and equipment are included
in other operating income or expenses.
EURm | Land, buildings, constructions and vessels | Machinery, equipment and other | Assets under construction | Total | |||
2023 | |||||||
Acquisition cost at 1 January | |||||||
Additions | |||||||
Reclassifications | ( | ||||||
Disposals and retirements | ( | ( | ( | ( | |||
Translation differences | ( | ( | ( | ( | |||
Acquisition cost at 31 December | |||||||
Accumulated depreciation at 1 January | ( | ( | ( | ||||
Depreciation | ( | ( | ( | ||||
Disposals and retirements | |||||||
Translation differences | |||||||
Accumulated depreciation at 31 December | ( | ( | ( | ||||
Net book value at 1 January | |||||||
Net book value at 31 December | |||||||
2022 | |||||||
Acquisition cost at 1 January | |||||||
Additions | |||||||
Reclassifications | ( | ||||||
Disposals and retirements | ( | ( | ( | ( | |||
Translation differences | |||||||
Acquisition cost at 31 December | |||||||
Accumulated depreciation at 1 January | ( | ( | ( | ||||
Depreciation | ( | ( | ( | ||||
Impairment charges | ( | ( | ( | ||||
Disposals and retirements | |||||||
Translation differences | ( | ( | ( | ||||
Accumulated depreciation at 31 December | ( | ( | ( | ||||
Net book value at 1 January | |||||||
Net book value at 31 December |
Business overview | Corporate governance | Operating and financial review and prospects | General facts on Nokia | Financial statements | Other information | 175 | |||||||
Notes to the consolidated financial statements continued
Nokia Annual Report on Form 20-F 2023
In the majority of its lease agreements, Nokia is acting
as a lessee. Nokia’s leased assets relate mostly to
commercial and industrial properties such as R&D,
production and office facilities. Nokia also leases vehicles
provided as employee benefits and service vehicles.
There are only minor lease contracts, mainly concerning
subleases of vacant leasehold or freehold facilities,
where Nokia is acting as a lessor.
As a lessee, Nokia recognizes a right-of-use asset and a
lease liability at the commencement date of the lease.
Right-of-use assets are measured at cost less
accumulated depreciation and impairment losses, and
adjusted for any remeasurements of the lease liabilities.
basis over the lease term as follows:
Buildings | |
Other |
Lease liabilities are initially measured at the present value
of the lease payments made over the lease term. Nokia
uses its incremental borrowing rate to calculate the
present value as the interest rate implicit in the lease is
not readily determinable. Subsequently, lease liabilities
are measured on an amortized cost basis using the
effective interest method. In addition, lease liabilities are
remeasured if there is a lease modification, a change in
the lease term or a change in the future lease payments.
The interest component of the lease payments is
recognized as interest expense in financial expenses.
Nokia applies practical expedients whereby the payments
for short-term leases and leases of low-value assets are
recognized as an operating expense on a straight-line
basis over the lease term. In addition, Nokia does not
separate certain non-lease components from lease
components but instead accounts for each lease
component and associated non-lease component
as a single lease component.
Right-of-use assets
EURm | Buildings | Other | Total |
2023 | |||
Acquisition cost at 1 January | |||
Additions(1) | |||
Retirements | ( | ( | ( |
Translation differences | ( | ( | |
Acquisition cost at 31 December | |||
Accumulated depreciation at 1 January | ( | ( | ( |
Depreciation | ( | ( | ( |
Impairment charges | |||
Retirements | |||
Translation differences | |||
Accumulated depreciation at 31 December | ( | ( | ( |
Net book value at 1 January | |||
Net book value at 31 December | |||
2022 | |||
Acquisition cost at 1 January | |||
Additions(1) | |||
Retirements | ( | ( | ( |
Translation differences | ( | ||
Acquisition cost at 31 December | |||
Accumulated depreciation at 1 January | ( | ( | ( |
Depreciation | ( | ( | ( |
Impairment charges | |||
Retirements | |||
Translation differences | |||
Accumulated depreciation at 31 December | ( | ( | ( |
Net book value at 1 January | |||
Net book value at 31 December | |||
(1) Additions comprise new lease contracts as well as modifications and remeasurements of existing lease contracts. | |||
Amounts recognized in the income statement
EURm | 2023 | 2022 | 2021 |
Depreciation of right-of-use assets | ( | ( | ( |
Interest expense on lease liabilities | ( | ( | ( |
Impairment charges, net of reversals | ( | ||
Total | ( | ( | ( |
Amounts recognized in the income statement presented above
exclude expenses relating to short-term leases and leases of
low-value assets, income from subleasing right-of-use assets
and gains or losses arising from sale and leaseback transactions
as these are immaterial.
Amounts reported in the statement of cash flows
EURm | 2023 | 2022 | 2021 |
Payment of principal portion of lease liabilities | ( | ( | ( |
Interest paid on lease liabilities | ( | ( | ( |
Total | ( | ( | ( |
Amounts reported in the statement of cash flows exclude
payments for short-term leases and leases of low-value assets.
The maturity analysis of lease liabilities is presented in
Note 5.4. Financial risk management. Commitments related
to future lease contracts are presented in Note 6.1.
Business overview | Corporate governance | Operating and financial review and prospects | General facts on Nokia | Financial statements | Other information | 176 | |||||||
Notes to the consolidated financial statements continued
Nokia Annual Report on Form 20-F 2023
Inventories are measured at the lower of cost and net
realizable value. Cost is determined using standard cost,
which approximates actual cost on a first-in first-out
(FIFO) basis. In addition to the cost of materials and
direct labor, an appropriate proportion of production
overheads is allocated to the cost of inventory. Net
realizable value is the estimated selling price in the
ordinary course of business less the estimated costs
necessary to make the sale.
Nokia classifies its inventories to raw materials and
semi-finished goods, finished goods, and contract work
in progress. Contract work in progress comprises costs
incurred to date for customer contracts where the
contractual performance obligations are not yet satisfied.
Contract work in progress will be recognized as cost of
sales when the corresponding revenue is recognized.
EURm | 2023 | 2022 |
Raw materials and semi-finished goods | ||
Finished goods | ||
Contract work in progress | ||
Total |
The cost of inventories recognized as an expense during
the year and included in cost of sales is EUR 7 978 million
(EUR 8 623 million in 2022 and EUR 6 427 million in 2021).
The cost of inventories recognized as an expense includes
EUR 296 million (EUR 267 million in 2022 and EUR 203 million
in 2021) in respect of write-downs of inventory to net
realizable value.
The cost of inventories recognized as an expense has
been reduced by EUR 88 million (EUR 98 million in 2022
and EUR 112 million in 2021) in respect of the reversal of
write-downs of inventory to net realizable value. Previous
write-downs have been reversed primarily as a result of
changes in estimated customer demand.
Customer contracts
Nokia presents its customer contracts in the statement of
financial position as either a contract asset or a contract
liability, depending on the relationship between Nokia’s
performance and the customer’s payment for each
individual contract. On a net basis, a contract asset position
represents where Nokia has performed by transferring
goods or services to a customer before the customer has
provided the associated consideration or before payment
is due. Conversely, a contract liability position represents
where a customer has paid consideration or payment is due,
but Nokia has not yet transferred goods or services to the
customer. Contract assets presented in the statement of
financial position are current in nature while contract
liabilities can be either current or non-current.
Invoices are generally issued as control transfers and/or as
services are rendered. Invoiced receivables represent an
unconditional right to receive the consideration and only
the passage of time is required before the consideration is
received. Invoiced receivables are presented separately
from contract assets as trade receivables in the statement
of financial position. Trade receivables may be converted to
customer loan receivables in certain cases where extended
payment terms are requested. From time to time Nokia may
also extend loans to other third parties and these loans are
accounted for similarly as customer loan receivables. Nokia
sells trade receivables and customer loan receivables to
various financial institutions primarily without recourse in
the normal course of business, in order to manage credit
risk and working capital cycle.
The business model for managing trade receivables and
customer loan receivables is holding receivables to collect
contractual cash flows and selling receivables. Trade
receivables and customer loan receivables are initially
recognized and subsequently remeasured at fair value
using the discounted cash flow method.
The changes in fair value are recognized in the fair value
reserve through other comprehensive income. Interest
calculated using the effective interest method as well as
foreign exchange gains and losses are recognized in financial
income and expenses.
Discounts without performance obligations presented on
the statement of financial position in other current liabilities
relate to discounts given to customers which will be
executable upon satisfying specific criteria. As these
discounts become executable, they are netted against
related trade receivables or customer loan receivables.
Expected Credit Losses
Loss allowance for expected credit losses (ECL) is recognized
on financial assets measured at amortized cost and financial
assets measured at fair value through other comprehensive
income, as well as on financial guarantee contracts and loan
commitments. Nokia continuously assesses its financial
instruments on a forward-looking basis and accounts
for the changes in ECL on a quarterly basis using the
following method:
■ECL = PD x LGD x EAD
■Probability of Default (PD) is based on the credit rating
profile of the counterparties as well as specific local
circumstances as applicable, unless there are specific
events that would indicate that the credit rating would
not be an appropriate basis for estimating credit risk at
the reporting date.
■For Loss Given Default (LGD), the recovery rate is based
on the type of receivable, specific local circumstances
as applicable and related collateral arrangements,
if any.
■Exposure at Default (EAD) is normally the nominal value
of the receivable.
Business overview | Corporate governance | Operating and financial review and prospects | General facts on Nokia | Financial statements | Other information | 177 | |||||||
Notes to the consolidated financial statements continued
Nokia Annual Report on Form 20-F 2023
4.5. Trade receivables and other customer-related balances
Nokia applies a simplified approach to recognize a loss
allowance based on lifetime ECL on trade receivables
and contract assets without significant financing
components. Based on quantitative and qualitative
analysis, Nokia has determined that the credit risk
exposure arising from its trade receivables is low risk.
Quantitative analysis focuses on historical loss rates,
historic and projected sales and the corresponding trade
receivables, and overdue trade receivables including
indicators of any deterioration in the recovery
expectation. Qualitative analysis focuses on all relevant
conditions, including customer and country credit rating,
to improve the accuracy of estimating lifetime ECL.
For customer loan receivables, the ECL is calculated
separately for each significant counterparty using the
method described above, including the impact of any
collateral arrangements or other credit enhancements
to LGD. The estimate is based on 12-month ECL unless
there has been a significant increase in credit risk for
the specific counterparty since the initial recognition,
in which case lifetime ECL is estimated. Breaches of
contract, credit rating downgrades and other credit
measures are typical indicators that Nokia takes into
consideration when assessing whether the credit risk on
a financial instrument has increased significantly since
initial recognition. Nokia considers additional indicators
to determine if a financial asset is credit-impaired
including whether the counterparty is in significant
financial difficulties and whether it is becoming probable
that the customer will enter bankruptcy or financial
reorganization. Typically customer loan credit risk is
higher than credit risk of trade receivables and contract
assets on average.
The change in the amount of ECL for trade receivables
and contract assets is recognized in other operating
expenses and for customer loan receivables in financial
expenses. For customer loan receivables, the loss
allowance is recorded as an adjustment in other
comprehensive income instead of adjusting the carrying
amount that has already been recorded at fair value. If
trade receivables and customer loan receivables are sold,
the impact of ECL is reversed and the difference between
the carrying amount derecognized and the consideration
received is recognized in financial expenses.
Customer-related balances Nokia aims to ensure the highest possible quality in trade receivables and contract assets as well as customer or third-party loan receivables. The Credit Risk Management Standard Operating Procedure, approved by the CFO, lays out the framework for the management of business-related credit risks. The Credit Risk Management Standard Operating Procedure sets out that credit decisions are based on credit evaluation in each business, including credit rating and limits for larger exposures, according to defined principles. Group level limit approvals are required for material credit exposures. Credit risks are monitored in each business and, where appropriate, mitigated on a case-by-case basis with the use of letters of credit, collaterals, sponsor guarantees, credit insurance and sale of selected receivables. |
Aging of trade receivables and other customer-related balances at 31 December | |||||
Past due | |||||
EURm | Current | 1-30 days | 31-180 days | > 180 days | Total |
2023 | |||||
Trade receivables(1) | |||||
Contract assets | |||||
Customer financing-related loan receivables | |||||
Total gross receivables | |||||
Expected credit loss allowance(2)(3) | ( | ( | ( | ( | ( |
Total net receivables | |||||
2022 | |||||
Trade receivables(1) | |||||
Contract assets | |||||
Customer financing-related loan receivables | |||||
Total gross receivables | |||||
Expected credit loss allowance(2)(3) | ( | ( | ( | ( | ( |
Total net receivables | |||||
(1) Nokia’s payment terms are (2) The total expected credit loss allowance includes EUR (3) In 2023, the decrease in the expected credit loss allowance includes EUR EUR | |||||
The reversal of expected credit loss charged to the income statement in 2023 was EUR charged to the income statement was EUR |
Business overview | Corporate governance | Operating and financial review and prospects | General facts on Nokia | Financial statements | Other information | 178 | |||||||
Notes to the consolidated financial statements continued
Nokia Annual Report on Form 20-F 2023
Credit risk exposure by customer and country
Credit exposure is measured as the total of trade receivables, contract assets and loans
outstanding from customers and committed credits. Trade receivables do not include any major
concentrations of credit risk by customer.
as well as loans and loan commitments to customers:
Customer | 2023 | 2022 |
Customer 1 | ||
Customer 2 | ||
Customer 3 | ||
Total | ||
Country | 2023 | 2022 |
Country 1(1) | ||
Country 2 | ||
Country 3 | ||
Total |
Contract assets and contract liabilities
Contract asset balances decrease upon reclassification to trade receivables when Nokia’s right
to payment becomes unconditional. Contract liability balances decrease when Nokia satisfies the
related performance obligations and revenue is recognized. There were no material cumulative
adjustments to revenue recognized arising from changes in transaction prices, changes in
measures of progress or changes in estimated variable consideration.
During the year, Nokia recognized EUR 1.4 billion (EUR 1.6 billion in 2022) of revenue that was
included in the current contract liability balance at the beginning of the period.
Other non-current receivables
EURm | 2023 | 2022 |
R&D tax credits | ||
Indirect tax receivables | ||
Other | ||
Total |
Other current receivables
EURm | 2023 | 2022 |
VAT and other indirect tax receivables | ||
Prepayments related to contract manufacturing | ||
IT-related prepaid expenses | ||
R&D tax credits and grant receivables | ||
Divestment-related receivables | ||
Other | ||
Total |
Other non-current liabilities
EURm | 2023 | 2022 |
Salaries, wages and social charges | ||
Other | ||
Total |
Other current liabilities
EURm | 2023 | 2022 |
Salaries, wages and social charges | ||
Accrued expenses related to customer projects | ||
Discounts without performance obligations | ||
VAT and other indirect tax payables | ||
Other(1) | ||
Total |
(1)Includes accrued logistics, R&D, IT and royalty expenses.
Business overview | Corporate governance | Operating and financial review and prospects | General facts on Nokia | Financial statements | Other information | 179 | |||||||
Notes to the consolidated financial statements continued
Nokia Annual Report on Form 20-F 2023
Provision is recognized when Nokia has a present legal or
constructive obligation as a result of past events, it is
probable that an outflow of resources will be required
to settle the obligation and a reliable estimate of the
amount can be made. Management judgment may be
required in determining whether it is probable that an
outflow of economic benefits will be required to settle
the obligation. The amount recognized as a provision
is based on the best estimate of unavoidable costs
required to settle the obligation at the end of the
reporting period.
When estimating the amount of unavoidable costs,
management may be required to consider a range of
possible outcomes and their associated probabilities,
risks and uncertainties surrounding the events and
circumstances, as well as making assumptions about the
timing of payment. Changes in estimates of timing or
amounts of costs required to settle the obligation may
become necessary as time passes and/or more accurate
information becomes available. Nokia assesses the
adequacy of its existing provisions and adjusts the
amounts as necessary based on actual experience
and changes in facts and circumstances at each
reporting date.
Restructuring provision
Nokia provides for the estimated cost to restructure when a
detailed formal plan of restructuring has been completed,
approved by management, and announced. Restructuring costs
consist primarily of personnel restructuring charges. The other
main components are costs associated with exiting real estate
locations, and costs of terminating certain other contracts
directly linked to the restructuring. At 31 December 2023, the
restructuring provision amounted to EUR 255 million including
personnel and other restructuring costs. The provision consists
primarily of amounts related to the announcements made by
Nokia on 16 March 2021 and 19 October 2023. The majority of
the restructuring cash outflows is expected to occur over the
next two years .
Warranty provision Nokia provides for the estimated liability to repair or replace products under standard warranty at the time revenue is recognized. The provision estimate is based on historical experience of the level of repairs and replacements. Cash outflows related to the warranty provision are generally expected to occur in the next | Project loss provision Nokia provides for onerous contracts based on the lower of the expected cost of fulfilling the contract and the expected cost of terminating the contract. An onerous contract is a contract in which the unavoidable costs of meeting the obligations under the contract exceed the economic benefits expected to be received under it. Project loss provisions relate to contracts with customers and are evaluated at a contract level. The majority of the project loss provision utilization is expected to occur over the next | |
Litigation and environmental provisions Nokia provides for the estimated future settlements related to legal proceedings based on the probable outcome of the claims. Nokia also provides for environmental remediation when Nokia becomes obliged, legally or constructively, to rectify environmental damage relating to soil, groundwater, surface water or sediment contamination. Cash outflows related to the litigation and environmental liabilities are inherently uncertain and generally occur over several periods. For a presentation of legal matters potentially affecting Nokia, refer to Note 6.1. Commitments, contingencies and legal proceedings. | ||
Other provisions Nokia provides for various legal and constructive obligations such as material liability, indirect tax provisions, divestment- related provisions, employee-related provisions other than restructuring provisions and asset retirement obligations. Cash outflows related to other provisions are generally expected to occur over the next | ||
Litigation and | Project | |||||
EURm | Restructuring | Warranty | environmental(2) | losses | Other | Total |
1 January 2023 | ||||||
Charged to income statement | ||||||
Additions | ||||||
Reversals | ( | ( | ( | ( | ||
Total charged to income statement | ||||||
Utilized during year(1) | ( | ( | ( | ( | ( | ( |
Translation differences and other | ( | ( | ( | |||
31 December 2023 | ||||||
Non-current | ||||||
Current |
(1)The utilization of restructuring provision includes items transferred to accrued expenses, of which EUR (2)Environmental provision was EUR |
Business overview | Corporate governance | Operating and financial review and prospects | General facts on Nokia | Financial statements | Other information | 180 | |||||||
Notes to the consolidated financial statements continued
Nokia Annual Report on Form 20-F 2023
Section 5 |
Capital and
financial
instruments
This section provides information on shareholders’
equity, shareholders’ remuneration and Nokia’s
capital management objectives. Furthermore, this
section comprises the policies and disclosures related
to Nokia’s financial assets and liabilities and hedge
accounting, as well as information on Nokia’s financial
risks and financial risk management principles
and objectives.
Shares and share capital
Share capital
Nokia Corporation has one class of shares. Each share entitles
the holder to one vote at general meetings. The shares
have no par value nor is there a minimum or maximum share
capital or number of shares under the Articles of Association
of Nokia Corporation. The share capital amounted to
EUR 245 896 461.96
and consisted of 5 613 496 565 (5 632 297 576 in 2022)
issued and fully paid shares.
In 2023, Nokia Corporation issued without consideration in a
directed share issue 59 500 000 (20 800 000 in 2022) new
shares to itself to fulfill the Company’s obligations under the
Nokia Equity Programs and canceled 78 301 011 (63 963 583
in 2022) shares it had repurchased during the year under its
share buyback program.
Share premium
Share premium reserve consists of the share premium
account of the Parent Company. In addition, the equity impact
corresponding to the employee services received related to the
equity-settled share-based compensation plans is recorded in
the share premium reserve.
Treasury shares
At 31 December 2023, the number of Nokia shares held by
the Group companies was 87 895 712 (45 281 539 in 2022)
representing 1.6 % (0.8 % in 2022) of the share capital and total
voting rights.
In 2023, Nokia Corporation transferred without consideration
to employees, including certain members of the Group
Leadership Team, as settlement of the Group’s equity-based
incentive plans and the employee share purchase plan. In
addition, Nokia repurchased 78 301 011
second phase of its share buyback program (63 963 583
2022 under the first phase of the program). The repurchased
shares were canceled in November 2023.
Number of shares outstanding at the beginning and at the
end of the period
Number of shares 000s | 2023 | 2022 | 2021 |
1 January | |||
Settlement of share-based payments | |||
Acquisition of treasury shares | ( | ( | |
31 December |
Nature and purpose of other equity reserves
Translation differences
Translation differences consist of foreign exchange differences
arising from translation of foreign operations into euro, the
presentation currency of the consolidated financial statements,
as well as gains and losses related to hedging of net investments
in foreign operations.
Fair value and other reserves
Pension remeasurements
Pension remeasurements reserve includes actuarial gains
and losses as well as return on plan assets and changes in the
effect of the asset ceiling, excluding amounts recognized in net
interest, related to Nokia’s defined benefit plans.
Hedging reserve
Hedging reserve includes the change in fair value that reflects
the change in spot exchange rates for certain foreign exchange
forward contracts and foreign exchange options, as well as the
part of cross-currency swaps that is designated as a cash flow
hedge to the extent that the hedges are effective.
Cost of hedging reserve
Cost of hedging reserve includes the forward element of
foreign exchange forward contracts and the time value of
foreign exchange options related to cash flow hedging of
forecast foreign currency sale and purchase transactions.
Additionally, cost of hedging reserve includes the difference
between the change in fair value of the forward element of
foreign exchange forward contracts and the time value of
option contracts and the amortization of the forward element
of foreign exchange forward contracts and time value of option
contracts related to net investment hedging. Cost of hedging
reserve also includes changes in fair value from foreign
currency basis spread related to fair value hedging of foreign
currency denominated bonds.
Business overview | Corporate governance | Operating and financial review and prospects | General facts on Nokia | Financial statements | Other information | 181 | |||||||
Notes to the consolidated financial statements continued
Nokia Annual Report on Form 20-F 2023
Fair value reserve
Fair value reserve includes the changes in fair value of financial
instruments that are managed in a portfolio with a business
model of holding financial instruments to collect contractual
cash flows including principal and interest, as well as selling
financial instruments. The fair value changes recorded in fair
value reserve for these instruments are reduced by amounts
of loss allowances.
Reserve for invested unrestricted equity
The reserve for invested unrestricted equity includes that
part of the subscription price of issued shares that according
to the share issue decision is not to be recorded to the share
capital as well as other equity inputs that are not recorded to
some other reserve. The amount received for treasury shares
are recorded to the reserve for invested unrestricted equity,
unless it is provided in the share issue decision that it is to
be recorded in full or in part to the share capital. The Nokia
shares repurchased under the ongoing share buyback
program are funded using funds in the reserve for invested
unrestricted equity.
Other equity
Retained earnings
Retained earnings is the net total of previous years’ profits
and losses less dividends paid to the shareholders.
Non-controlling interests
Non-controlling interests represent the share of net assets of
certain subsidiaries attributable to their minority shareholders.
For more information on the contractual arrangement related
to the ownership interests in the Nokia Shanghai Bell Group,
refer to Note 6.3. Significant partly-owned subsidiaries.
Changes in other comprehensive income by component of equity |
Fair value and other reserves | |||||
EURm | Translation differences(1) | Pension remeasurements | Hedging reserve | Cost of hedging reserve | Fair value reserve |
1 January 2021 | ( | ( | ( | ||
Foreign exchange translation differences | |||||
Net investment hedging losses | ( | ||||
Remeasurements of defined benefit plans | |||||
Net fair value (losses)/gains | — | — | ( | ( | |
Transfer to income statement | ( | — | |||
Movement attributable to non-controlling interests | ( | ||||
31 December 2021 | ( | ( | ( | ( | |
Foreign exchange translation differences | |||||
Net investment hedging losses | ( | ||||
Remeasurements of defined benefit plans | ( | ||||
Net fair value gains/(losses) | — | — | ( | ( | |
Transfer to income statement | — | ||||
Movement attributable to non-controlling interests | |||||
31 December 2022 | ( | ( | |||
Foreign exchange translation differences | ( | ||||
Net investment hedging gains | |||||
Remeasurements of defined benefit plans | ( | ||||
Net fair value gains/(losses) | — | — | ( | ( | |
Transfer to income statement | — | ( | |||
Movement attributable to non-controlling interests | |||||
31 December 2023 | ( | ( | ( | ||
(1)At 31 December 2023 translation differences include a EUR |
Business overview | Corporate governance | Operating and financial review and prospects | General facts on Nokia | Financial statements | Other information | 182 | |||||||
Notes to the consolidated financial statements continued
Nokia Annual Report on Form 20-F 2023
Capital management
For capital management purposes Nokia defines capital as
total equity and interest-bearing liabilities less cash and cash
equivalents, current interest-bearing financial investments and
non-current interest-bearing financial investments. The main
objectives of Nokia’s capital management are to maintain a
solid overall financial position and to ensure sufficient financial
flexibility to execute Nokia’s long-term business strategy and
to provide returns to shareholders.
From a cash perspective, Nokia aims to maintain the balance
of its cash and cash equivalents and interest-bearing financial
investments less interest-bearing liabilities at 10 -15 % of
annual net sales over time. This cash target was announced
in March 2023, and it replaced the previous cash target to
maintain a level of cash and cash equivalents and interest-
bearing financial investments at 30 % or more of annual net
sales. To support these objectives, Nokia aims to maintain
investment grade credit ratings. At 31 December 2023, Nokia’s
long-term credit ratings are BBB- (stable) by Fitch, Ba1 (stable)
by Moody’s, and BBB- (stable) by S&P Global Ratings.
With regards to shareholder remuneration, Nokia targets
recurring, stable and over time growing ordinary dividend
payments, taking into account the previous year’s earnings as
well as the Company’s financial position and business outlook.
Nokia may also use share repurchases as a tool to manage its
capital structure through the reduction of capital and distribute
excess cash to the shareholders.
Distribution of funds
Nokia distributes funds to its shareholders in two ways:
a) as dividends from retained earnings and/or as assets
from the reserve for invested unrestricted equity, and b) by
repurchasing shares using funds in the unrestricted equity.
The amount of any distribution is limited to the amount of
distributable earnings of the Parent Company, and subject to
exceptions relating to the right of minority shareholders to
request a certain minimum distribution, the distribution may
not exceed the amount proposed by the Board of Directors.
Dividend and/or assets from the reserve for unrestricted
invested equity
For the financial year 2023
Nokia’s Board of Directors proposes to the Annual General
Meeting 2024 that no dividend is distributed by a resolution of
the AGM for the financial year ended on 31 December 2023.
Instead, the Board proposes to be authorized to decide, in its
discretion, on the distribution of an aggregate maximum of
EUR 0.13 per share as dividend from the retained earnings
and/or as assets from the reserve for invested unrestricted
equity. The authorization would be used to distribute
dividend and/or assets from the reserve for invested
unrestricted equity in four installments during the period of
validity of the authorization unless the Board decides otherwise
for a justified reason. Distributions of dividend and/or assets
from the reserve for unrestricted invested equity are
recognized as a reduction of equity and a liability when the
Board has decided on the distribution. On the date of issuing
the financial statements for 2023 the total number of Nokia
shares is 5 613 496 565 and consequently the total amount
of distribution would be EUR 730 million. The total number of
shares includes the shares held by the Parent Company which
are not entitled to a distribution.
For the financial year 2022
The AGM in 2023 resolved to authorize the Board of Directors
to decide on the distribution of an aggregate maximum
of EUR 0.12 per share as dividend and/or as assets from the
reserve of invested unrestricted equity for the financial year
2022. The authorization was used to distribute a dividend in
four installments. During 2023, three installments of dividend
were distributed amounting to EUR 0.09 per share and
EUR 499 million in total. The fourth installment of EUR 0.03 per
share and EUR 166 million in total was paid in February 2024.
The total amount of dividend paid for the financial year 2022
was EUR 665 million.
For the financial year 2021
For the financial year 2021, a total dividend of EUR 448 million,
corresponding to EUR 0.08 per share, was paid.
Share buyback programs
Program announced in 2022
In February 2022, Nokia’s Board of Directors initiated a share
buyback program under authorization from the AGM to
repurchase shares. The program targeted to return up to
EUR 600 million of cash to shareholders in tranches over a
period of two years . The repurchases were funded using funds
in the reserve for invested unrestricted equity and hence the
repurchases reduced Nokia’s total unrestricted equity.
In the first phase of the program, which was launched on
11 February 2022 and which ended on 11 November 2022,
Nokia repurchased 63 963 583 1.1 %
of the total number of Nokia shares at 31 December 2021.
The aggregate purchase price of all shares acquired in the
first phase was EUR 300 million and the average price per share
was EUR 4.69 . The repurchased shares were canceled in
December 2022.
In the second phase of the program, which was launched on
2 January 2023 and which ended on 10 November 2023,
Nokia repurchased 78 301 011 1.4 %
of the total number of Nokia shares at 31 December 2022.
The aggregate purchase price of all shares acquired under the
second phase of the program was EUR 300 million and the
average price per share was EUR 3.83 . The repurchased shares
were canceled in November 2023.
Program announced in 2024
Nokia’s Board of Directors is initiating a share buyback program
under the current authorization from the AGM to repurchase
shares, with purchases expected to begin in March 2024.
The program targets to return up to EUR 600 million of
cash to shareholders in tranches over a period of two years ,
subject to continued authorization from the AGM.
Business overview | Corporate governance | Operating and financial review and prospects | General facts on Nokia | Financial statements | Other information | 183 | |||||||
Notes to the consolidated financial statements continued
Nokia Annual Report on Form 20-F 2023
Authorizations given to the Board of Directors
The following authorizations related to the issue and
repurchase of shares were given to the Board of Directors at
the AGM held on 4 April 2023.
Authorization to issue shares and special rights entitling
to shares
The shareholders authorized the Board to issue a maximum
of 550 million shares, corresponding to less than 10 % of the
total number of Nokia’s shares, through one or more issues
of shares or special rights entitling to shares. The Board is
authorized to issue either new shares or shares held by Nokia.
Shares and special rights entitling to shares may be issued in
deviation from the shareholders’ pre-emptive rights within the
limits set by law. The authorization may be used to develop
Nokia’s capital structure, diversify the shareholder base,
finance or carry out acquisitions or other arrangements,
settle Nokia’s equity-based incentive plans or for other
purposes resolved by the Board of Directors.
The authorization is effective until 3 October 2024, and it
terminated the previous authorizations to issue shares and
special rights entitling to shares.
Authorization to repurchase shares
The shareholders authorized the Board to repurchase a
maximum of 550 million shares, corresponding to less than
unrestricted equity, which means that the repurchases will
reduce Nokia’s distributable funds. Shares may be repurchased
to be canceled, held to be reissued, transferred further or for
other purposes resolved by the Board. The price paid for the
shares shall be based on the market price of Nokia shares on
the securities markets on the date of the repurchase or a price
otherwise formed in a competitive process. The shares may be
repurchased otherwise than in proportion to the shares held by
the shareholders. The Board shall resolve on all other matters
related to the repurchase of Nokia shares.
The authorization is effective until 3 October 2024, and it
terminated the previous authorization to repurchase shares
to the extent that the Board has not previously resolved to
repurchase shares based on such authorization.
Business overview | Corporate governance | Operating and financial review and prospects | General facts on Nokia | Financial statements | Other information | 184 | |||||||
Notes to the consolidated financial statements continued
Nokia Annual Report on Form 20-F 2023
Fair value
Fair value is the price that would be received to sell an
asset or paid to transfer a liability in an orderly transaction
between market participants at the measurement date.
Financial assets and liabilities measured at fair value are
categorized based on the availability of observable inputs
used to measure their fair value. Three hierarchical levels
are based on an increasing amount of judgment associated
with the inputs used to derive fair valuation for these assets
and liabilities, Level 1 being market values for exchange
traded products, Level 2 being primarily based on publicly
available market information and Level 3 requiring most
management judgment.
The fair value of an asset or a liability is measured using
the assumptions that market participants would use
when pricing the asset or liability, assuming that market
participants act in their economic best interest, by using
quoted market rates, discounted cash flow analyses and
other appropriate valuation models. Nokia uses valuation
techniques that are appropriate in the circumstances and
for which sufficient data is available to measure fair value,
maximizing the use of relevant observable inputs and
minimizing the use of unobservable inputs. At the end of
each reporting period, all financial assets and liabilities, that
are either measured at fair value on a recurring basis or for
which fair values are disclosed in the financial statements,
are categorized within the fair value hierarchy based on
the lowest level input that is significant to the fair value
measurement as a whole.
Classification and measurement
Financial assets
Nokia classifies its financial assets that are debt instruments
in the following three categories: financial assets measured
at amortized cost, financial assets measured at fair value
through other comprehensive income, and financial assets
measured at fair value through profit and loss. The selection
of the appropriate category is made based on both Nokia’s
business model for managing the financial asset and on the
contractual cash flow characteristics of the asset. Equity
instruments and derivative financial assets are measured
at fair value through profit and loss.
Nokia’s business model for managing financial assets is defined
on a portfolio level. The business model must be observable on
a practical level by the way the business is managed. The cash
flows of financial assets measured at amortized cost are solely
payments of principal and interest. These assets are held within
a business model that has an objective to hold assets to collect
contractual cash flows. Financial assets measured at fair value
through other comprehensive income have cash flows that are
solely payments of principal and interest, and these assets are
held within a business model that has an objective that is
achieved both by holding financial assets to collect contractual
cash flows and selling financial assets. For these categories,
a loss allowance is calculated on a quarterly basis based on a
review of collectability (probability of default) and available
collateral (loss given default) for the asset, recorded as an
adjustment to the carrying amount of the asset and recognized
in other financial expenses in the income statement.
Financial assets measured at fair value through profit and loss
are assets that do not fall in either of the categories in the
paragraph above. Additionally, the accounting for financial
assets depends on whether the financial asset is part of a
hedging relationship (refer to Note 5.3. Derivative and firm
commitment assets and liabilities).
All purchases and sales of financial assets are recorded on
the trade date, i.e. when Nokia commits to purchase or sell
the asset. All financial assets are initially measured at fair
value and subsequently remeasured according to their
classification. Subsequently, instruments classified as fair
value through profit or loss and instruments classified as fair
value through other comprehensive income are remeasured
at fair value, while instruments classified as amortized cost
are remeasured using the effective interest rate method.
For instruments classified as fair value through profit or
loss, the fair value adjustments and foreign exchange gains
and losses are recognized in the income statement either in
other operating income and expenses or financial income
and expenses as determined by the purpose of the
instruments. For instruments classified as fair value through
other comprehensive income, changes in fair value are
recognized in the fair value reserve through other
comprehensive income (refer to Note 5.1. Equity).
For instruments classified as amortized cost, interest
calculated using the effective interest method, as well as
foreign exchange gains and losses, are recognized in
financial income and expenses in the income statement.
A financial asset is derecognized when substantially all the
risks and rewards related to the financial asset have been
transferred to a third party that assumes control of the
asset. On derecognition of a financial asset, the difference
between the carrying amount and the consideration
received is recognized in the income statement either in
other operating income and expenses or financial income
and expenses as determined by the purpose of the
instrument. The FIFO method is used to determine the
cost basis of financial assets at amortized cost that are
disposed of.
Financial liabilities
Nokia classifies its financial liabilities as financial liabilities
measured at amortized cost except for derivative liabilities
and the conditional obligation related to Nokia Shanghai
Bell, which are classified as financial liabilities at fair value
through profit and loss.
All financial liabilities are initially recognized at fair value and,
in the case of borrowings and payables, net of transaction
costs. Financial liabilities are subsequently remeasured
according to their classification.
For financial liabilities measured at amortized cost, interest
calculated using the effective interest method, as well as
foreign exchange gains and losses, are recognized in
financial income and expenses in the income statement.
Financial liabilities are derecognized when the related
obligation is discharged, canceled or expired. Additionally, a
substantial modification of the terms of an existing financial
liability is accounted for as a derecognition of the original
financial liability and the recognition of a new financial
liability. On derecognition of a financial liability, the
difference between the carrying amount extinguished and
the consideration paid is recognized in financial income or
expenses in the income statement.
Business overview | Corporate governance | Operating and financial review and prospects | General facts on Nokia | Financial statements | Other information | 185 | |||||||
Notes to the consolidated financial statements continued
Nokia Annual Report on Form 20-F 2023
Fair value of financial instruments
2023 | 2022 | ||||||||||||||||||||
Carrying amounts | Fair value(1) | Carrying amounts | Fair value(1) | ||||||||||||||||||
Fair value through profit or loss | Fair value through other comprehensive income(2) | Fair value through profit or loss | Fair value through other comprehensive income(2) | ||||||||||||||||||
EURm | Amortized cost | Level 1 | Level 2 | Level 3 | Level 2 | Total | Total | Amortized cost | Level 1 | Level 2 | Level 3 | Level 2 | Total | Total | |||||||
Non-current interest-bearing financial investments | |||||||||||||||||||||
Investments in venture funds | |||||||||||||||||||||
Other non-current financial assets(3) | |||||||||||||||||||||
Other current financial assets(3) | |||||||||||||||||||||
Derivative assets(4) | |||||||||||||||||||||
Trade receivables(3) | |||||||||||||||||||||
Current interest-bearing financial investments | |||||||||||||||||||||
Cash and cash equivalents | |||||||||||||||||||||
Total financial assets | |||||||||||||||||||||
Long-term interest-bearing liabilities | |||||||||||||||||||||
Other long-term financial liabilities | |||||||||||||||||||||
Short-term interest-bearing liabilities | |||||||||||||||||||||
Other short-term financial liabilities | |||||||||||||||||||||
Derivative liabilities(4) | |||||||||||||||||||||
Discounts without performance obligations(3) | |||||||||||||||||||||
Trade payables | |||||||||||||||||||||
Total financial liabilities | |||||||||||||||||||||
(1)The following fair value measurement methods are used for items not carried at fair value: The fair values of long-term interest-bearing liabilities, including current portion, are primarily based on publicly available market information (level 2). The fair values of other
assets and liabilities, including loan receivables and loans payable, are primarily based on discounted cash flow analysis (level 2). The fair value is estimated to equal the carrying amount for short-term financial assets and financial liabilities due to limited credit risk and
short time to maturity.
(2)No financial instruments measured at fair value through other comprehensive income are categorized in fair value hierarchy level 1 or level 3.
(3)For further information on trade receivables, customer loans and discounts without performance obligation, refer to Note 4.5. Trade receivables and other customer-related balances.
(4)For further information on derivative assets and liabilities, refer to Note 5.3. Derivative and firm commitment assets and liabilities.
Business overview | Corporate governance | Operating and financial review and prospects | General facts on Nokia | Financial statements | Other information | 186 | |||||||
Notes to the consolidated financial statements continued
Nokia Annual Report on Form 20-F 2023
Financial assets
Interest-bearing financial investments
Nokia invests a portion of the corporate cash needed to cover
the projected cash outflows of its ongoing business operations
in highly liquid, interest-bearing investments. Interest-bearing
financial investments may include investments measured at
amortized cost and investments measured at fair value
through profit and loss.
Non-current interest-bearing financial investments are
investments in highly liquid corporate bonds that are long-term
in nature based on their initial maturity and are measured at
amortized cost using the effective interest method.
Current interest-bearing financial investments in bank
deposits, as well as fixed income and money market securities
with an initial maturity or put feature longer than three
months, that have characteristics of solely payments of
principal and interest and are not part of structured
investments, are managed in a portfolio with a business model
of holding investments to collect principal and interest and
are measured at amortized cost using the effective interest
method. These investments are executed with the main
purpose of collecting contractual cash flows and principal
repayments. However, investments are sold from time to time
for liquidity management and market risk mitigation purposes.
Current interest-bearing financial investments may also include
money market funds that do not qualify as cash equivalents,
investments acquired for trading purposes, investment
structures consisting of securities traded in combination with
derivatives with complementing and typically offsetting risk
factors and other investments that have cash flows not being
solely payments of principal and interest. These investments
are executed for capital appreciation and other investment
returns and can be sold at any time. These investments are
classified as fair value through profit or loss, with fair value
adjustments, foreign exchange gains and losses and realized
gains and losses recognized in financial income and expenses
in the income statement. The fair values of these investments
are based on publicly available market information.
Corporate cash investments in bank deposits used as collateral
for derivative transactions are measured at amortized cost
using the effective interest method.
Other financial assets
Other non-current financial assets include unlisted private
equity and unlisted venture fund investments, including
investments managed by NGP Capital which specializes in
growth-stage investing. These investments do not fulfill the
criteria of being solely payments of principal and interest
and they are classified as investments at fair value through
profit and loss. The fair value of these level 3 investments is
determined using one or more valuation techniques where
the use of the market approach generally consists of using
comparable market transactions, while the use of the income
approach generally consists of calculating the net present
value of expected future cash flows.
For unlisted funds, the selection of appropriate valuation
techniques by the fund managing partner may depend on the
availability and reliability of relevant inputs. In some cases,
one valuation technique may provide the best indication
of fair value while in other circumstances multiple valuation
techniques may be appropriate.
Inputs generally considered include the original transaction
price, recent transactions in the same or similar instruments,
completed or pending third-party transactions in the
underlying investment or comparable issuers, subsequent
rounds of financing, recapitalizations or other transactions
undertaken by the issuer, offerings in the equity or debt capital
markets, and changes in financial ratios or cash flows, adjusted
as appropriate for liquidity, credit, market and/or other risk
factors. The fair value may be adjusted to reflect illiquidity
and/or non-transferability, with the amount of such discount
estimated by the managing partner in the absence of
market information.
Level 3 investments are remeasured at each reporting date
taking into consideration any changes in estimates, projections
and assumptions, as well as any changes in economic and other
relevant conditions. These investments include approximately
50 separate venture funds investing in hundreds of individual
companies in various sectors and geographies, focusing on 5G,
digital health, software and enterprise sectors.
Hence, specific estimates and assumptions used by managing
partners in the absence of observable inputs do impact the
fair value of individual investments, but no individual input
has a significant impact on the aggregated fair value of
level 3 investments.
Fair value adjustments, foreign exchange gains and losses,
and realized gains and losses from the disposal of these
investments are recognized in other operating income and
expenses in the income statement.
From time to time Nokia may have investments in listed equity
shares classified as level 1 investments. These are exchange
traded products with quoted prices readily and regularly
available from an exchange representing actual and regularly
occurring market transactions on an arm’s-length basis.
Other non-current financial assets also include restricted
assets and other receivables, customer financing-related loan
receivables (refer to note 4.5. Trade receivables and other
customer-related balances) and certain other financial assets
of a long-term nature.
Restricted assets and other receivables include restricted bank
deposits primarily related to employee benefits as well as other
loan receivables measured at amortized cost using the
effective interest method.
The cash flows of certain other financial assets of a long-term
nature do not fulfill the criteria of being solely payments of
principal and interest. These investments are measured at fair
value using quoted market rates, discounted cash flow models
or other appropriate valuation methods as of the reporting
date. Fair value adjustments, foreign exchange gains and
losses, and realized gains and losses from the disposal of
these investments are mainly recognized in financial income
and expenses in the income statement.
Other current financial assets include the current part of
other non-current financial assets as well as short-term loan
receivables measured at amortized cost using the effective
interest method.
Cash and cash equivalents
Cash and cash equivalents include cash at bank and in hand
as well as highly liquid, fixed income and money market
investments that are readily convertible to known amounts of
cash with maturities at acquisition of three months or less, as
well as bank deposits with maturities or contractual call periods
at acquisition of three months or less. Due to the high credit
quality and short-term nature of these investments, there is
an insignificant risk of change in value. Investments in money
market funds that have a risk profile consistent with the
aforementioned criteria are also classified as cash equivalents.
Business overview | Corporate governance | Operating and financial review and prospects | General facts on Nokia | Financial statements | Other information | 187 | |||||||
Notes to the consolidated financial statements continued
Nokia Annual Report on Form 20-F 2023
Investments that have cash flows that are solely payments of
principal and interest are measured at amortized cost using the
effective interest method whereas all other investments are
classified as fair value through profit and loss, with fair value
adjustments and foreign exchange gains and losses recognized
in financial income and expenses in the income statement.
The fair values of these investments are based on publicly
available market information.
Financial liabilities
Interest-bearing liabilities
Long-term and short-term interest-bearing liabilities are
measured at amortized cost using the effective interest
method. Long-term and short-term interest-bearing liabilities
include issued bonds and other borrowings. Short-term
interest-bearing liabilities also include the current portion
of long-term interest-bearing liabilities and collaterals for
derivative transactions.
Other financial liabilities
Other financial liabilities mainly include a conditional obligation
to China Huaxin as part of the Nokia Shanghai Bell (NSB)
definitive agreements where China Huaxin obtained the right
to fully transfer its ownership interest in NSB to Nokia in
exchange for a future cash settlement. The financial liability
related to the conditional obligation is measured based on the
expected future cash settlement with any changes recorded
in financial income and expenses in the income statement.
The measurement of this level 3 financial liability involves
estimation of the option exercise price and the distribution of
excess cash balances upon exercise. Unobservable valuation
inputs include certain financial performance metrics of NSB. No
individual input has a significant impact on the total fair value.
Trade payables
Trade payables are carried at invoiced amount in the statement
of financial position. Trade payables includes balances payable
to suppliers under reverse factoring arrangements with
financial institutions. These balances are classified as trade
payables and the related payments as cash flows from
operating activities, since the payments are made to the banks
on very similar terms as to suppliers. Possible extensions to
payment terms beyond the due dates agreed with suppliers
are insignificant and there are no special guarantees securing
the payments to be made.
Interest-bearing loans and other borrowings All borrowings presented in the table below are senior unsecured and have no financial covenants. | ||||||
Carrying amount EURm(1) | ||||||
Issuer/borrower | Instrument | Currency | Nominal (million) | Final maturity | 2023 | 2022 |
Nokia Corporation | EUR | 3/2024 | ||||
Nokia Corporation | EIB R&D Loan | EUR | 2/2025 | |||
Nokia Corporation | NIB R&D Loan(3) | EUR | 5/2025 | |||
Nokia Corporation | EUR | 5/2025 | ||||
Nokia Corporation | EUR | 3/2026 | ||||
Nokia Corporation | USD | 6/2027 | ||||
Nokia of America Corporation | USD | 1/2028 | ||||
Nokia Corporation | EUR | 5/2028 | ||||
Nokia of America Corporation | USD | 3/2029 | ||||
Nokia Corporation | linked Senior Notes(4) | EUR | 8/2031 | |||
Nokia Corporation | USD | 5/2039 | ||||
Nokia Corporation and various subsidiaries | Other borrowings | |||||
Total | ||||||
(1)Carrying amount includes EUR value gains (EUR (2)In February 2023 Nokia purchased in a tender offer EUR amount) of the notes due 15 May 2025 and EUR (3)The remaining loan from the Nordic Investment Bank (NIB) is repayable in (4)The bond has a one-time redemption premium at maturity of EUR across its value chain (Scope 1, 2, and 3) by Performance Target in Nokia’s Sustainable Finance Framework that enables the issuance of sustainability-linked financing instruments. | ||||||
Changes in level 3 financial assets and liabilities measured at fair value | |||||
2023 | 2022 | ||||
EURm | Financial assets | Financial liabilities | Financial assets | Financial liabilities | |
1 January | ( | ( | |||
Net (losses)/gains in income statement | ( | ||||
Additions(1) | |||||
Deductions(1) | ( | ( | |||
Transfers out of level 3 | ( | ||||
Other movements | ( | ||||
31 December | ( | ( | |||
(1)For level 3 financial assets, additions mainly include capital contributions to venture funds and deductions mainly include distributions from venture funds. | |||||
A net loss of EUR included in the profit and loss during 2023. | |||||
Business overview | Corporate governance | Operating and financial review and prospects | General facts on Nokia | Financial statements | Other information | 188 | |||||||
Notes to the consolidated financial statements continued
Nokia Annual Report on Form 20-F 2023
Fair value
All derivatives are recognized initially at fair value on the
date a derivative contract is entered into and subsequently
remeasured at fair value. The method of recognizing
the resulting gain or loss varies according to whether
the derivatives are designated and qualify under
hedge accounting.
Foreign exchange forward contracts are valued at market-
forward exchange rates. Changes in fair value are measured
by comparing these rates with the original contract-forward
rate. Currency options are valued at each reporting date
by using the Garman & Kohlhagen option valuation model.
Interest rate swaps and cross-currency swaps are valued
using the discounted cash flow method.
Nokia applies hedge accounting on certain foreign exchange
forward contracts, options or option strategies, and interest
rate derivatives. Qualifying options and option strategies
have zero net premium, or a net premium paid. For option
structures, the critical terms of the purchased and written
options are the same and the notional amount of the
written option component is not greater than that of the
purchased option.
In the fair valuation of foreign exchange forward contracts,
Nokia separates the forward element and considers it to be
the cost of hedging for foreign exchange forward contracts.
In the fair valuation of foreign exchange option contracts,
Nokia separates the time value and considers it to be the
cost of hedging for foreign exchange option contracts. In
the fair valuation of cross-currency swaps, Nokia separates
the foreign currency basis spread and considers it to be the
cost of hedging for cross-currency swaps.
Hedge effectiveness is assessed at inception and
subsequently on a quarterly basis during the hedge
relationship to ensure that an economic relationship exists.
As Nokia only enters in hedge relationships where the critical
terms match, the assessment of effectiveness is done on a
qualitative basis with no significant ineffectiveness expected.
Presentation in the statement of cash flows
The cash flows of a hedge are classified as cash flows from
operating activities in cases where the underlying hedged items
relate to Nokia’s operating activities. When a derivative
contract is accounted for as a hedge of an identifiable position
relating to financing or investing activities, the cash flows of
the contract are classified in the same way as the cash flows of
the position being hedged. Cash flows of derivatives used in
hedging the foreign exchange risk of Nokia’s cash position are
presented in cash flows from investing activities.
Cash flow hedges: hedging of forecast foreign currency
denominated sales and purchases
Nokia applies cash flow hedge accounting primarily to foreign
exchange exposure that arises from highly probable forecast
operative business transactions. The risk management strategy
is to hedge material net exposures (identified standard net
sales exposure minus identified standard costs exposure) by
using foreign exchange forwards and foreign exchange options
in a layered hedging style that follows defined hedging level
ranges and hedge maturities in quarterly time buckets. The
hedged item must be highly probable and present an exposure to
variations in cash flows that could ultimately affect profit or loss.
For qualifying foreign exchange forwards and foreign exchange
options, the change in fair value that reflects the change in
spot exchange rates on a discounted basis is recognized in
hedging reserve through other comprehensive income (refer to
Note 5.1. Equity). The changes in the forward element of the
foreign exchange forwards and the time value of the options
that relate to hedged items are deferred in the cost of
hedging reserve through other comprehensive income (refer
to Note 5.1. Equity) and are subsequently accounted for in
the same way as the spot element or intrinsic value.
In each quarter, Nokia evaluates whether the forecast
sales and purchases are still expected to occur. If a portion
of the hedged cash flow is no longer expected to occur,
the hedge accounting criteria are no longer met and all
related deferred gains or losses are derecognized from
fair value and other reserves and recognized in other
operating income and expenses in the income statement.
If the hedged cash flow ceases to be highly probable, but is
still expected to occur, accumulated gains and losses remain
in fair value and other reserves until the hedged cash flow
affects profit or loss.
Nokia’s risk management objective is to hedge forecast cash
flows until the related revenue has been recognized. Each
hedge relationship is discontinued during the quarter when
the hedge matures, which is also the quarter that it had
been designated to hedge. At this point, the accumulated
gain or loss of cash flow hedges is reclassified to other
operating income and expenses in the income statement.
In cases where the forecast amount of revenue is not
recognized during a quarter, the full accumulated gain or
loss of cash flow hedges designated for said quarter is still
reclassified and the portion related to forecast revenue that
was not recognized is disclosed as hedge ineffectiveness.
As cash flow hedges primarily mature in the same quarter
as the hedged item, there is no significant ineffectiveness
resulting from the time value of money. Nokia will validate
the magnitude of the impact of discounting related to the
amount of gain or loss recognized in fair value and other
reserves on a quarterly basis.
Cash flow and fair value hedges: hedging of foreign
exchange risk of future interest cash flows
Nokia also applies cash flow hedging to future interest cash
flows in foreign currency related to issued bonds. These
future interest cash flows are hedged with cross-currency
swaps that have been bifurcated and designated partly as
fair value hedges (see Fair value hedges: hedging of interest
rate exposure below) to hedge both the foreign exchange
and interest rate benchmark risk component of the issued
bond, and partly as cash flow hedges to hedge the foreign
exchange risk related to the remaining portion of interest
cash flows on the issued bond. The accumulated gain or loss
for the part of these cross-currency swaps designated as
cash flow hedges is initially recorded in hedging reserve
through other comprehensive income and reclassified to
profit or loss at the time when the related interest cash
flows are settled.
Business overview | Corporate governance | Operating and financial review and prospects | General facts on Nokia | Financial statements | Other information | 189 | |||||||
Notes to the consolidated financial statements continued
Nokia Annual Report on Form 20-F 2023
Fair value hedges: hedging of interest rate exposure
Nokia applies fair value hedge accounting to reduce
exposure to fair value fluctuations of interest-bearing
liabilities due to changes in interest rates and foreign
exchange rates. Nokia uses interest rate swaps and cross-
currency swaps aligned with the hedged items to hedge
interest rate risk and associated foreign exchange risk.
Nokia has entered into long-term borrowings mainly at fixed
rates and has swapped most of them into floating rates in
line with a defined target interest profile. Nokia aims to
mitigate the adverse impacts from interest rate fluctuations
by continuously managing net interest exposure resulting
from financial assets and liabilities by setting appropriate
risk management benchmarks and risk limits. The hedged
item is identified as a proportion of the outstanding loans
up to the notional amount of the swaps as appropriate to
achieve the risk management objective. Nokia enters into
interest rate swaps that have similar critical terms to the
hedged item, such as reference rate, reset dates, payment
dates, maturities and notional amount and hence Nokia
expects that there will be no significant ineffectiveness.
Nokia has not entered into interest rate swaps where it
would be paying fixed rates.
Nokia’s borrowings are carried at amortized cost. Changes
in the fair value of derivatives designated and qualifying as
fair value hedges, together with any changes in the fair value
of hedged liabilities attributable to the hedged risk, are
recorded in financial income and expenses in the income
statement. Nokia separates the foreign currency basis
spread from cross-currency swaps and excludes it from the
hedged risk as cost of hedging that is initially recognized
and subsequently measured at fair value and recorded in
the cost of hedging reserve through other comprehensive
income. If a hedge relationship no longer meets the criteria
for hedge accounting, hedge accounting ceases, the cost
of hedging recorded in the cost of hedging reserve is
immediately expensed and any fair value adjustments
made to the carrying amount of the hedged item while the
hedge was effective are recognized in financial income and
expenses in the income statement based on the effective
interest method.
Fair value hedges: hedging of foreign exchange exposure
In certain cases, mainly related to long-term construction
projects, Nokia applies fair value hedge accounting for foreign
exchange risk with the objective to reduce the exposure to
fluctuations in the fair value of firm commitments due to
changes in foreign exchange rates. The change in fair value
that reflects the change in spot exchange rates of the foreign
exchange forwards designated and qualifying as fair value
hedges, together with any changes in the fair value of the
hedged firm commitments attributable to the hedged risk,
are recorded in financial income and expenses in the
income statement.
At the end of the hedge relationship the accumulated changes
in the spot element of qualifying fair value hedges are recorded
as adjustments to net sales or cost of sales in the income
statement according to the hedge designation. The changes
in the forward element of the foreign exchange forwards that
relate to hedged items are deferred in the cost of hedging
reserve through other comprehensive income and reclassified
to other operating income and expenses in the income
statement at the end of the hedge relationship.
Hedges of net investments in foreign operations
Nokia applies hedge accounting for its foreign currency
hedging of selected net investments. The hedged item can
be an amount equal to or less than the carrying amount of
the net assets of the foreign operation in the statement of
financial position. The risk management strategy is to protect
the euro counter value of the portion of this exposure
expected to materialize as non-euro cash repatriation in the
foreseeable future.
For qualifying foreign exchange forwards, foreign exchange
options and option strategies, the change in fair value that
reflects the change in spot exchange rates is recognized in
translation differences in shareholders’ equity (refer to Note
5.1. Equity). The changes in the forward element of foreign
exchange forwards as well as the changes in the time value
of options (collectively known as the “cost of hedging”) is
recognized in the cost of hedging reserve through other
comprehensive income. The cost of hedging at the date of
designation of the foreign exchange forward or option contract
as a hedging instrument is amortized to financial income and
expenses in the income statement over the duration of the
contract. Hence, in each reporting period, the change in fair
value of the forward element of the foreign exchange forward
contract or the time value of the option contract is recorded
in the cost of hedging reserve through other comprehensive
income, while the amortization amount is reclassified from the
cost of hedging reserve to profit or loss.
The cumulative amount or proportionate share of changes
in the fair value of qualifying hedges deferred in translation
differences is recognized as gain or loss on disposal of all or
part of a foreign subsidiary.
Derivatives not designated in hedge accounting
relationships carried at fair value through profit and loss
For derivatives not designated under hedge accounting, but
hedging identifiable forecast exposures such as anticipated
foreign currency denominated sales and purchases, the
gains and losses are recognized in other operating income
and expenses in the income statement. The gains and losses
on all other derivatives not designated under hedge
accounting are recognized in financial income and expenses.
Embedded derivatives included in contracts are identified
and monitored by Nokia. For host contracts that are not
financial assets containing embedded derivatives that are
not closely related, the embedded derivatives are separated
and measured at fair value at each reporting date with
changes in fair value recognized in financial income and
expenses in the income statement. For host contracts that
are financial assets containing embedded derivatives, the
whole contract is measured at fair value at each reporting
date with changes in fair value recognized in financial
income and expenses in the income statement.
Business overview | Corporate governance | Operating and financial review and prospects | General facts on Nokia | Financial statements | Other information | 190 | |||||||
Notes to the consolidated financial statements continued
Nokia Annual Report on Form 20-F 2023
Derivatives and firm commitments
2023 | 2022 | ||||||||||
Assets | Liabilities | Assets | Liabilities | ||||||||
EURm | Fair value(1) | Notional(2) | Fair value(1) | Notional(2) | Fair value(1) | Notional(2) | Fair value(1) | Notional(2) | |||
Cash flow hedges | |||||||||||
Foreign exchange forward contracts | ( | ( | |||||||||
Currency options bought | |||||||||||
Currency options sold | |||||||||||
Fuel hedges | ( | ||||||||||
Cash flow and fair value hedges(3) | |||||||||||
Cross-currency swaps | ( | ( | |||||||||
Fair value hedges | |||||||||||
Interest rate swaps | ( | ( | |||||||||
Foreign exchange forward contracts | ( | ( | |||||||||
Firm commitments | ( | ( | |||||||||
Hedges on net investment in foreign subsidiaries | |||||||||||
Foreign exchange forward contracts | ( | ||||||||||
Derivatives not designated in hedge accounting relationships carried at fair value through profit and loss | |||||||||||
Foreign exchange forward contracts | ( | ( | |||||||||
Currency options bought | |||||||||||
Embedded derivatives(4) | |||||||||||
Other derivatives | |||||||||||
Total | ( | ( | |||||||||
(1)Included in other current financial and firm commitment assets and other financial and firm commitment liabilities in the statement of financial position. (2)Includes the gross amount of all notional values for contracts that have not yet been settled or canceled. The amount of notional value outstanding is not necessarily a measure or indication of market risk as the exposure of certain contracts may be offset by that of other contracts. (3)Cross-currency swaps have been designated partly as fair value hedges and partly as cash flow hedges. (4)Embedded derivatives are related to customer contracts. | |||||||||||
accounting and cash flow hedge accounting, and interest rate swaps as hedges under fair value hedge accounting at 31 December:
Notional (million in currency) | Fair value EURm | ||||||||
Entity | Instrument | Currency | Maturity | 2023 | 2022 | 2023 | 2022 | ||
Nokia Corporation | Interest rate swaps | EUR | 3/2024 | ( | |||||
Nokia Corporation | Interest rate swaps | EUR | 5/2025 | ( | |||||
Nokia Corporation | Interest rate swaps | EUR | 3/2026 | ( | ( | ||||
Nokia Corporation | Cross-currency swaps | USD | 6/2027 | ( | ( | ||||
Nokia Corporation | Interest rate swaps | EUR | 5/2028 | ( | ( | ||||
Nokia Corporation | Interest rate swaps | EUR | 8/2031 | ||||||
Nokia Corporation | Cross-currency swaps | USD | 5/2039 | ( | ( | ||||
Total | ( | ( | |||||||
Business overview | Corporate governance | Operating and financial review and prospects | General facts on Nokia | Financial statements | Other information | 191 | |||||||
Notes to the consolidated financial statements continued
Nokia Annual Report on Form 20-F 2023
General risk management principles
Nokia has a systematic and structured approach to risk
management. Key risks and opportunities are primarily
identified against business targets either in business
operations or as an integral part of strategy and financial
planning. Risk management covers strategic, operational,
financial, compliance and hazard risks. Key risks and
opportunities are analyzed, managed and monitored as
part of business performance management. The principles
documented in the Nokia Enterprise Risk Management Policy,
which is approved by the Audit Committee of the Board,
require risk management and its elements to be integrated into
key processes. One of the core principles is that the business
or function head is also the risk owner, although all employees
are responsible for identifying, analyzing and managing risks,
as appropriate, given their roles and duties. Nokia’s overall risk
management concept is based on managing the key risks that
would prevent Nokia from meeting its objectives, rather than
focusing on eliminating risks. In addition to the principles
defined in the Nokia Enterprise Risk Management Policy,
other key policies and operating procedures reflect the
implementation of specific aspects of risk management,
including financial risk management.
Financial risks
The objective for treasury activities is to guarantee sufficient
funding at all times and to identify, evaluate and manage
financial risks. Treasury activities support this aim by mitigating
the adverse effects on the profitability of the underlying
business caused by fluctuations in the financial markets,
and by managing the capital structure by balancing the levels
of liquid assets and financial borrowings. Treasury activities
are governed by the Nokia Treasury Policy approved by the
President and CEO, which provides principles for overall
financial risk management and determines the allocation
of responsibilities for financial risk management activities.
Operating procedures approved by the Chief Financial Officer
(CFO) cover specific areas such as foreign exchange risk,
interest rate risk, credit risk and liquidity risk, as well as the use
of derivative financial instruments in managing these risks.
Nokia is risk averse in its treasury activities.
Financial risks are divided into market risk covering foreign
exchange risk and interest rate risk; credit risk covering
business-related credit risk and financial credit risk; and
liquidity risk.
Market risk
Foreign exchange risk
Nokia operates globally and is exposed to transaction and
translation foreign exchange risks. The objective of foreign
exchange risk management is to mitigate adverse impacts from
foreign exchange fluctuations on Nokia’s profitability and cash
flows. Treasury applies a global portfolio approach to manage
foreign exchange risks within approved guidelines and limits.
Transaction risk arises from foreign currency denominated
assets and liabilities together with foreign currency
denominated future cash flows. Transaction exposures are
managed in the context of various functional currencies of
Group companies. Material transactional foreign exchange
exposures are hedged, unless hedging would be uneconomical
due to market liquidity and/or hedging cost. Exposures are
defined using transaction nominal values. Exposures are mainly
hedged with derivative financial instruments, such as foreign
exchange forward contracts and foreign exchange options
with most of the hedging instruments having a duration
of less than a year.
A layered hedging approach is typically used for hedging of
highly probable forecast foreign currency denominated cash
flows with quarterly hedged items defined based on set hedge
ratio ranges for each successive quarter. Hedged items defined
for successive quarters are hedged with foreign exchange
forward contracts and foreign exchange options with a hedge
ratio of 1 :1. Hedging level ranges are adjusted on a monthly
basis including hedging instrument designation and
documentation as appropriate. In cases where hedges exceed
the hedge ratio range for any specific quarter, the hedge
portfolio for that specific quarter is adjusted accordingly.
In certain cases, mainly related to long-term construction
projects, Nokia applies fair value hedge accounting for foreign
exchange risk with the objective to reduce the exposure to
fluctuations in the fair value of the related firm commitments
due to changes in foreign exchange rates. Exposures are mainly
hedged with foreign exchange forward contracts with most
of the hedging instruments matching the duration of the
underlying projects. Nokia continuously manages the portfolio
of hedging instruments to ensure appropriate alignment with
the portfolio of hedged items at a hedging ratio of 1 :1.
As Nokia has entities where the functional currency is other
than the euro, the shareholders’ equity is exposed to
fluctuations in foreign exchange rates. Changes in shareholders’
equity caused by movements in foreign exchange rates are
shown as currency translation differences in the consolidated
financial statements. The risk management strategy is to
protect the euro counter value of the portion of this exposure
expected to materialize as foreign currency repatriation cash
flows in the foreseeable future. Exposures are mainly hedged
with derivative financial instruments, such as foreign exchange
forward contracts and foreign exchange options with most of
the hedging instruments having a duration of less than a year.
Hedged items are defined based on conservative expectations
of repatriation cash flows based on a range of considerations.
Net investment exposures are reviewed, hedged items
designated, and hedging levels adjusted at minimum on a
quarterly basis with a hedge ratio of 1 :1. Additionally, hedging
levels are adjusted whenever there are significant events
impacting expected repatriation cash flows.
The foreign exchange risk arising from foreign currency
denominated interest-bearing liabilities is primarily hedged
using cross-currency swaps that are also used to manage
Nokia’s interest rate profile (refer to the interest rate risk
section below).
Business overview | Corporate governance | Operating and financial review and prospects | General facts on Nokia | Financial statements | Other information | 192 | |||||||
Notes to the consolidated financial statements continued
Nokia Annual Report on Form 20-F 2023
EURm | USD | CNY | JPY | INR |
2023 | ||||
Foreign exchange exposure designated as hedged item for cash flow hedging, net(1) | ( | ( | ||
Foreign exchange exposure designated as hedged item for fair value hedging for FX risk, net(2) | ||||
Foreign exchange exposure designated as hedged item for net investment hedging(3) | ||||
Foreign exchange exposure from interest-bearing liabilities(4) | ( | |||
Foreign exchange exposure from items on the statement of financial position, excluding interest-bearing liabilities, net | ( | ( | ||
Other foreign exchange derivatives, carried at fair value through profit and loss, net(5) | ( | ( | ( | |
2022 | ||||
Foreign exchange exposure designated as hedged item for cash flow hedging, net(1) | ( | ( | ||
Foreign exchange exposure designated as hedged item for fair value hedging for FX risk, net(2) | ||||
Foreign exchange exposure designated as hedged item for net investment hedging(3) | ||||
Foreign exchange exposure from interest-bearing liabilities(4) | ( | |||
Foreign exchange exposure from items on the statement of financial position, excluding interest-bearing liabilities, net | ( | ( | ( | |
Other foreign exchange derivatives, carried at fair value through profit and loss, net(5) | ( | ( |
(1)Includes foreign exchange exposure from forecast cash flows related to sales and purchases. In some currencies, especially the US dollar, Nokia has substantial foreign exchange exposures in both estimated cash inflows and outflows. These underlying exposures have
been hedged.
(2)Includes foreign exchange exposure from contractual firm commitments. These underlying exposures have been substantially hedged.
(3)Includes net investment exposures in foreign operations. These underlying exposures have been hedged.
(4)Includes interest-bearing liabilities that have been hedged with cross-currency swaps and foreign exchange forwards. Refer to Note 5.3. Derivative and firm commitment assets and liabilities.
(5)Items on the statement of financial position are hedged by a portion of foreign exchange derivatives not designated in a hedge relationship and carried at fair value through profit and loss. Embedded derivatives are included in this line item.
Effects of hedge accounting on the financial position and performance
Nokia is using several types of hedge accounting programs to manage its foreign exchange and interest rate risk exposures; refer to Note 5.3. Derivative and firm commitment assets and liabilities.
EURm | Cash flow hedges(1) | Net investment hedges(1) | Fair value hedges for FX risk(1) | Fair value and cash flow hedges(1) |
2023 | ||||
Carrying amount of hedging instruments | ( | ( | ||
Notional amount of hedging instruments | ( | ( | ( | |
Notional amount of hedged items | ( | |||
Change in intrinsic value of hedging instruments since 1 January | ||||
Change in value of hedged items used to determine hedge effectiveness | ( | ( | ( | ( |
2022 | ||||
Carrying amount of hedging instruments | ( | ( | ( | |
Notional amount of hedging instruments | ( | ( | ( | |
Notional amount of hedged items | ( | |||
Change in intrinsic value of hedging instruments since 1 January | ( | ( | ( | ( |
Change in value of hedged items used to determine hedge effectiveness |
(1)No significant ineffectiveness has been recorded during the periods presented and economic relationships have been fully effective.
Business overview | Corporate governance | Operating and financial review and prospects | General facts on Nokia | Financial statements | Other information | 193 | |||||||
Notes to the consolidated financial statements continued
Nokia Annual Report on Form 20-F 2023
The methodology for assessing foreign exchange risk
exposures: Value-at-Risk
Nokia uses the Value-at-Risk (VaR) methodology to assess
exposures to foreign exchange risks. The VaR-based
methodology provides estimates of potential fair value losses
in market risk-sensitive instruments as a result of adverse
changes in specified market factors, at a specified confidence
level over a defined holding period. Nokia calculates the foreign
exchange VaR using the Monte Carlo method, which simulates
random values for exchange rates in which Nokia has exposures
and takes the non-linear price function of certain derivative
instruments into account. The VaR is determined using
volatilities and correlations of rates and prices estimated from
a sample of historical market data, at a 95 % confidence level,
using a one-month holding period. To put more weight on
recent market conditions, an exponentially weighted moving
average is performed on the data with an appropriate decay
factor. This model implies that, within a one-month period, the
potential loss will not exceed the VaR estimate in 95 % of
possible outcomes.
In the remaining 5 % of possible outcomes, the potential loss
will be at minimum equal to the VaR figure and, on average,
substantially higher. The VaR methodology relies on a number
of assumptions, which include the following: risks are measured
under average market conditions, changes in market risk
factors follow normal distributions, future movements in
market risk factors are in line with estimated parameters and
the assessed exposures do not change during the holding
period. Thus, it is possible that, for any given month, the
potential losses at a 95 % confidence level are different and
could be substantially higher than the estimated VaR.
The VaR calculation includes foreign currency denominated
monetary financial instruments, such as current financial
investments, loans and trade receivables, cash, and loans
and trade payables; foreign exchange derivatives carried
at fair value through profit and loss that are not in a hedge
relationship and are mostly used to hedge the statement
of financial position foreign exchange exposure, as well as
embedded derivatives; and foreign exchange derivatives
designated as forecast cash flow hedges, fair value hedges
and net investment hedges as well as the exposures
designated, as hedged items for these hedge relationships.
The VaR risk measures for Nokia’s sensitivity to foreign exchange risks are presented in the Total VaR column and the simulated impact to financial statements is presented in the profit, other comprehensive income (OCI) and cumulative translation adjustment (CTA) columns in the table below. | |||||||||
2023 | 2022 | ||||||||
Simulated impact on financial statements | Simulated impact on financial statements | ||||||||
EURm | Total VaR | Profit | OCI | CTA | Total VaR | Profit | OCI | CTA | |
31 December | |||||||||
Average for the year | |||||||||
Range for the year | |||||||||
The most significant foreign exchange hedging instruments under cash flow, net investment and fair value hedge accounting at 31 December: | ||||||||
Maturity breakdown of notional amounts (EURm)(1) | ||||||||
Currency | Fair value (EURm) | Weighted average hedged rate | Total | Within 3 months | Between 3 and 12 months | Between 1 and 3 years | Beyond 3 years | |
2023 | ||||||||
Cash flow hedge accounting | GBP | ( | ( | ( | ( | |||
USD | ( | ( | ( | |||||
USD | ( | |||||||
Net investment hedge accounting | CNY | ( | ( | |||||
Fair value hedge accounting for FX risk | USD | ( | ( | ( | ( | ( | ( | |
2022 | ||||||||
Cash flow hedge accounting | GBP | ( | ( | ( | ||||
JPY | ( | ( | ( | |||||
USD | ( | ( | ( | |||||
USD | ||||||||
Net investment hedge accounting | CNY | ( | ( | ( | ||||
USD | ( | ( | ( | |||||
Fair value hedge accounting for FX risk | USD | ( | ( | ( | ( | ( | ( | |
(1) Negative notional amounts indicate that hedges sell currency, and positive notional amounts indicate that hedges buy currency. | ||||||||
Business overview | Corporate governance | Operating and financial review and prospects | General facts on Nokia | Financial statements | Other information | 194 | |||||||
Notes to the consolidated financial statements continued
Nokia Annual Report on Form 20-F 2023
Interest rate risk
Nokia is exposed to interest rate risk either through market
value fluctuations of items on the statement of financial
position (price risk) or through changes in interest income or
expenses (refinancing or reinvestment risk). Interest rate risk
mainly arises through interest-bearing liabilities and assets.
Estimated future changes in cash flows and the structure of
the statement of financial position also expose Nokia to
interest rate risk.
The objective of interest rate risk management is to mitigate
adverse impacts arising from interest rate fluctuations on the
income statement, cash flow and financial assets and liabilities
while taking into consideration Nokia’s target capital structure
and the resulting net interest rate exposure. Nokia has entered
into long-term borrowings mainly at fixed rates and swapped
most of them into floating rates, in line with a defined target
interest profile. Nokia has not entered into interest rate swaps
where it would be paying fixed rates. Nokia aims to mitigate
the adverse impacts from interest rate fluctuations by
continuously managing net interest rate exposure arising
from financial assets and liabilities, by setting appropriate
risk management benchmarks and risk limits.
Treasury monitors and manages interest rate exposure
centrally. Nokia uses selective sensitivity analyses to assess and
measure interest rate exposure arising from interest-bearing
assets, interest-bearing liabilities and related derivatives.
Sensitivity analysis determines an estimate of potential
fair value changes in market risk-sensitive instruments by
varying interest rates in currencies in which Nokia has material
amounts of financial assets and liabilities while keeping all
other variables constant.
Sensitivities to credit spreads are not reflected in the
sensitivity analysis.
Interest rate profile of items under interest rate risk management at 31 December: | |||||
2023 | 2022 | ||||
EURm | Fixed rate | Floating rate(1) | Fixed rate | Floating rate(1) | |
Non-current interest-bearing financial investments | |||||
Current interest-bearing financial investments | |||||
Cash and cash equivalents | |||||
Interest-bearing liabilities | ( | ( | ( | ( | |
Financial assets and liabilities before derivatives | ( | ( | |||
Interest rate derivatives | ( | ( | |||
Financial assets and liabilities after derivatives | |||||
(1)All cash equivalents and derivative transaction-related collaterals with initial maturity of three months or less are considered floating rate for the purposes of interest rate risk management. | |||||
Nokia’s sensitivity to interest rate exposure in the investment and debt portfolios is presented in the fair value column in the table below with simulated impact to the financial statements presented in the profit and other comprehensive income (OCI) columns. | |||||||
2023 | 2022 | ||||||
Impact on | Impact on | Impact on | Impact on | Impact on | Impact on | ||
EURm | fair value | profit | OCI | fair value | profit | OCI | |
Interest rates - increase by | ( | ( | ( | ||||
Interest rates - decrease by | ( | ( | ( | ( | |||
Business overview | Corporate governance | Operating and financial review and prospects | General facts on Nokia | Financial statements | Other information | 195 | |||||||
Notes to the consolidated financial statements continued
Nokia Annual Report on Form 20-F 2023
Credit risk
Credit risk refers to the risk that a counterparty will default on
its contractual obligations resulting in financial loss to Nokia.
Credit risk arises from credit exposures to customers, including
outstanding receivables, financial guarantees and committed
transactions, as well as financial institutions, including bank
and cash, fixed income and money market investments,
and derivative financial instruments. Credit risk is managed
separately for business-related and financial credit exposures.
Financial instruments contain an element of risk resulting from
changes in the market price due to counterparties becoming
less creditworthy or risk of loss due to counterparties being
unable to meet their obligations. Financial credit risk is
measured and monitored centrally by Treasury. Financial
credit risk is managed actively by limiting counterparties to
a sufficient number of major banks and financial institutions,
and by monitoring the creditworthiness and the size of
exposures continuously. Additionally, Nokia enters into netting
arrangements with all major counterparties, which give the
right to offset in the event that the counterparty would not
be able to fulfill its obligations. Nokia enters into collateral
agreements with most counterparties, which require
counterparties to post collateral against derivative receivables.
Investment decisions are based on strict creditworthiness and
maturity criteria as defined in the Treasury-related policies and
procedures. As a result of this investment policy approach and
active management of outstanding investment exposures,
Nokia has not been subject to any material credit losses in its
financial investments in the years presented. Due to the high
credit quality of Nokia’s financial investments, the expected
credit loss for these investments is deemed insignificant based
on 12 months’ expected credit losses at 31 December 2023.
For information on expected credit losses for customer-related
balances, refer to Note 4.5. Trade receivables and other
customer-related balances.
Nokia has restricted bank deposits primarily related to
employee benefits of EUR 119 million (EUR 122 million in 2022)
that are presented in other non-current financial assets.
Nokia has assessed the counterparty credit risk for these
financial assets and concluded that expected credit losses
are not significant.
Outstanding non-current and current interest-bearing financial investments, cash equivalents and cash classified by credit rating grades ranked in line with S&P Global Ratings categories at 31 December: | ||||||||
Cash equivalents and interest-bearing financial investments | ||||||||
EURm | Rating(1) | Cash | Due within 3 months | Due between 3 and 12 months | Due between 1 and 3 years | Due between 3 and 5 years | Due beyond 5 years | Total(2)(3) |
2023 | AAA | |||||||
AA+ - AA- | ||||||||
A+ - A- | ||||||||
BBB+ - BBB- | ||||||||
Other | ||||||||
Total | ||||||||
2022 | AAA | |||||||
AA+ - AA- | ||||||||
A+ - A- | ||||||||
BBB+ - BBB- | ||||||||
Other | ||||||||
Total | ||||||||
(1)Bank Parent Company ratings are used here for bank groups. Actual bank subsidiary ratings may differ from the Bank Parent Company rating. (2)Non-current and current interest-bearing financial investments and cash equivalents include bank deposits, structured deposits, investments in money market funds and investments in fixed income instruments. (3)Instruments that include a call feature have been presented at their final maturities. Instruments that are contractually due beyond three months include EUR (EUR | ||||||||
The following table sets out financial assets and liabilities subject to offsetting under enforceable master netting agreements and similar arrangements at 31 December. To reconcile the items presented to the statement of financial position, items that are not subject to offsetting would need to be included, refer to Note 5.3. Derivative and firm commitment assets and liabilities. | ||||
Related amounts not set off in the statement of financial position | ||||
EURm | Net amounts of financial assets/ (liabilities) presented in the statement of financial position | Financial instruments assets/(liabilities) | Cash collateral (received)/pledged | Net amount |
2023 | ||||
Derivative assets | ( | ( | ||
Derivative liabilities | ( | ( | ||
Total | ( | ( | ||
2022 | ||||
Derivative assets | ( | ( | ||
Derivative liabilities | ( | ( | ||
Total | ( | ( | ||
The financial instruments subject to enforceable master netting agreements and similar arrangements are not offset in the statement of financial position as there is no intention to settle net or realize the asset and settle the liability simultaneously. |
Business overview | Corporate governance | Operating and financial review and prospects | General facts on Nokia | Financial statements | Other information | 196 | |||||||
Notes to the consolidated financial statements continued
Nokia Annual Report on Form 20-F 2023
Liquidity risk
Liquidity risk is defined as financial distress or extraordinarily
high financing costs arising from a shortage of liquid funds in
a situation where outstanding debt needs to be refinanced
or where business conditions unexpectedly deteriorate and
require financing. Transactional liquidity risk is defined as
the risk of executing a financial transaction below fair market
value or not being able to execute the transaction at all
within a specific period of time. The objective of liquidity risk
management is to maintain sufficient liquidity, and to ensure
that it is readily available without endangering its value in order
to avoid uncertainty related to financial distress at all times.
Nokia aims to secure sufficient liquidity at all times through
efficient cash management and by investing primarily in highly
liquid money market investments. Depending on its overall
liquidity position, Nokia may pre-finance or refinance upcoming
debt maturities before contractual maturity dates. The
transactional liquidity risk is minimized by entering into
transactions where proper two-way quotes can be obtained
from the market. Nokia aims to ensure flexibility in funding
by maintaining committed and uncommitted credit lines.
Certain changes in financial liabilities do not have a direct
impact on Nokia’s liquidity position. A disaggregation of cash
and non-cash changes in financial liabilities has been presented
in the adjacent table.
Nokia’s significant credit facilities and funding programs at 31 December: | |||||
Utilized (million) | |||||
Committed/uncommitted | Financing arrangement | Currency | Nominal (million) | 2023 | 2022 |
Committed | Revolving Credit Facility(1) | EUR | |||
Uncommitted | Finnish Commercial Paper Programme | EUR | |||
Uncommitted | Euro-Commercial Paper Programme | EUR | |||
Uncommitted | Euro Medium Term Note Programme(2) | EUR | |||
Total | |||||
(1)The facility has its maturity in June 2026, except for EUR (2)All euro-denominated bonds have been issued under the Euro Medium Term Note Programme. | |||||
Changes in lease liabilities, interest-bearing liabilities and associated derivatives arising from financing activities: | |||||
EURm | Long-term interest-bearing liabilities | Short-term interest-bearing liabilities | Derivatives held to hedge long- term borrowings(1) | Lease liabilities(2) | Total |
1 January 2023 | |||||
Cash flows | ( | ( | ( | ( | ( |
Non-cash changes: | |||||
Changes in foreign exchange rates | ( | ( | ( | ( | |
Changes in fair value | ( | ||||
Reclassification between long-term and short-term | ( | ||||
Additions(3) | |||||
Other | ( | ( | ( | ||
31 December 2023 | |||||
1 January 2022 | |||||
Cash flows | ( | ( | ( | ||
Non-cash changes: | |||||
Changes in foreign exchange rates | ( | ||||
Changes in fair value | ( | ( | |||
Reclassification between long-term and short-term | ( | ||||
Additions(3) | |||||
Other | |||||
31 December 2022 | |||||
(1)Includes derivatives designated in fair value and cash flow hedge accounting relationships as well as derivatives not designated in hedge accounting relationship but hedging identifiable long-term borrowing exposure. (2)Includes non-current and current lease liabilities. (3)Includes new lease contracts as well as modifications and remeasurements of existing lease contracts. | |||||
Business overview | Corporate governance | Operating and financial review and prospects | General facts on Nokia | Financial statements | Other information | 197 | |||||||
Notes to the consolidated financial statements continued
Nokia Annual Report on Form 20-F 2023
loan commitments given and obtained. The line-by-line analysis does not directly reconcile with the statement of financial position.
2023 | 2022 | ||||||||||||
Due | Due | ||||||||||||
EURm | within 3 months | between 3 and 12 months | between 1 and 3 years | between 3 and 5 years | beyond 5 years | Total | within 3 months | between 3 and 12 months | between 1 and 3 years | between 3 and 5 years | beyond 5 years | Total | |
Non-current financial assets | |||||||||||||
Non-current interest-bearing financial investments | |||||||||||||
Other non-current financial assets(1) | |||||||||||||
Current financial assets | |||||||||||||
Other current financial assets excluding derivatives(1) | |||||||||||||
Current interest-bearing financial investments(2) | |||||||||||||
Cash and cash equivalents(2) | |||||||||||||
Cash flows related to derivative financial assets net settled: | |||||||||||||
Derivative contracts – receipts | ( | ( | ( | ( | ( | ( | |||||||
Cash flows related to derivative financial assets gross settled: | |||||||||||||
Derivative contracts – receipts | |||||||||||||
Derivative contracts – payments | ( | ( | ( | ( | ( | ( | ( | ( | ( | ( | |||
Trade receivables | |||||||||||||
Non-current financial and lease liabilities | |||||||||||||
Long-term interest-bearing liabilities | ( | ( | ( | ( | ( | ( | ( | ( | ( | ( | ( | ( | |
Long-term lease liabilities | ( | ( | ( | ( | ( | ( | ( | ( | |||||
Other non-current financial liabilities | ( | ( | ( | ( | ( | ( | |||||||
Current financial and lease liabilities | |||||||||||||
Short-term interest-bearing liabilities | ( | ( | ( | ( | ( | ( | |||||||
Short-term lease liabilities | ( | ( | ( | ( | ( | ( | |||||||
Other financial liabilities excluding derivatives(3) | ( | ( | ( | ( | ( | ( | |||||||
Cash flows related to derivative financial liabilities net settled: | |||||||||||||
Derivative contracts - payments | ( | ( | ( | ( | ( | ( | ( | ( | |||||
Cash flows related to derivative financial liabilities gross settled: | |||||||||||||
Derivative contracts – receipts | |||||||||||||
Derivative contracts – payments | ( | ( | ( | ( | ( | ( | ( | ( | ( | ( | ( | ( | |
Discounts without performance obligations | ( | ( | ( | ( | ( | ( | ( | ( | ( | ( | |||
Trade payables | ( | ( | ( | ( | ( | ( | ( | ( | ( | ( | |||
Commitments given and obtained | |||||||||||||
Loan commitments given undrawn(4) | ( | ( | ( | ( | ( | ( | |||||||
Loan commitments obtained undrawn(5) | ( | ( | ( | ||||||||||
(1)Other non-current financial assets and other current financial assets excluding derivatives include mainly customer financing-related loan receivables. (2)Instruments that include a call feature have been presented at their final maturities. Instruments that are contractually due beyond three months include EUR (3)Other financial liabilities excluding derivatives include a conditional obligation to China Huaxin presented in the earliest period as the exercise period is open. (4)Loan commitments given undrawn have been included in the earliest period in which they could be drawn or called. (5)Loan commitments obtained undrawn have been included based on the period in which they expire. These amounts include related commitment fees. | |||||||||||||
Business overview | Corporate governance | Operating and financial review and prospects | General facts on Nokia | Financial statements | Other information | 198 | |||||||
Notes to the consolidated financial statements continued
Nokia Annual Report on Form 20-F 2023
Section 6 |
Other
information
This section contains information on
Nokia’s off-balance sheet commitments
and contingencies, Group structure and related
party transactions, as well as post reporting
date events.
proceedings
Contractual obligations
EURm | Within 1 year | 1-5 years | More than 5 years |
2023 | |||
Purchase obligations | |||
Lease commitments(1) | |||
2022 | |||
Purchase obligations | |||
Lease commitments(1) |
(1)Relates to lease contracts that had not yet commenced as at the reporting date.
At 31 December 2023, Nokia has potential undiscounted future
lease payments of EUR 838 million (EUR 807 million in 2022)
relating to extension options not expected to be exercised and
EUR 33 million (EUR 15 million in 2022) relating to termination
options expected to be exercised that are not included in the
lease liability.
Guarantees and financing commitments
The contingent liabilities in the table below represent the
maximum principal amount of guarantees and financing
commitments, and do not reflect management’s expected
outcomes.
EURm | 2023 | 2022 |
Guarantees on behalf of Group companies | ||
Guarantees issued by financial institutions | ||
Commercial guarantees(1) | ||
Non-commercial guarantees | ||
Corporate guarantees(2) | ||
Commercial guarantees(1) | ||
Non-commercial guarantees | ||
Financing commitments | ||
Customer finance commitments(3) | ||
Venture fund commitments(4) |
(1)Commercial guarantees are guarantees that are issued in the normal course of
business to Nokia’s customers for the performance of Nokia’s obligations under
supply agreements; these include tender bonds, performance bonds and warranty
bonds.
(2)Corporate guarantees are guarantees with a primary obligation that are issued to
Nokia’s customers and other third parties.
(3)Customer finance commitments are available under customer loan facilities.
Availability of the facility depends on the borrower’s continuing compliance with the
agreed financial and operational covenants, and other administrative terms of the
facility. The loan facilities are primarily available to fund purchases of network
infrastructure equipment and services. Refer to Note 4.5. Trade receivables and
other customer-related balances.
(4)As a limited partner in NGP Capital and certain other funds making technology-
related investments, Nokia is committed to capital contributions and entitled to
cash distributions according to the respective partnership agreements and
underlying fund activities. In January 2022, Nokia agreed on a capital commitment
of USD 400 million to NGP Capital’s Fund V. The fund’s emphasis on companies
developing emerging 5G use cases for industrial and business transformation aligns
closely with Nokia’s technology leadership vision and its efforts to maximize the
value shift towards cloud. Per industry standard practice, the capital will be called
throughout the 10-year lifecycle of the fund.
Business overview | Corporate governance | Operating and financial review and prospects | General facts on Nokia | Financial statements | Other information | 199 | |||||||
Notes to the consolidated financial statements continued
Nokia Annual Report on Form 20-F 2023
Legal matters
Nokia discloses ongoing legal matters that relate to possible obligations whose existence
will be confirmed by the occurrence or non-occurrence of one or more uncertain future
events not wholly within the control of Nokia. These matters are assessed continually to
determine whether an outflow of resources embodying economic benefits has become
Nokia is and will likely continue to be subject to various legal proceedings that arise from time
to time, including proceedings related to intellectual property, antitrust, commercial disputes,
product liability, environmental issues, tax, health and safety, employment and wrongful
discharge, sales and marketing practices, international trade, securities, privacy matters and
compliance. While management does not expect any of the legal proceedings it is currently
aware of to have a material adverse effect on Nokia’s financial position, litigation is inherently
unpredictable and Nokia may in the future receive judgments or enter into settlements that
could have a material adverse effect on its results or cash flows.
Litigation and proceedings
Mass labor litigation in Brazil
Nokia is defending against a number of labor claims in various Brazilian labor courts. Plaintiffs are
former employees whose contracts were terminated after Nokia exited from certain managed
services contracts. The claims mainly relate to payments made under, or in connection with,
the terminated labor contracts. Nokia has closed the majority of the court cases through
settlement or judgment.
Asbestos litigation in the United States
Nokia is defending approximately 300 asbestos-related matters, at various stages of litigation.
The claims are based on premises liability, products liability, and contractor liability. The claims
also involve plaintiffs allegedly diagnosed with various diseases, including but not limited to
asbestosis, lung cancer, and mesothelioma.
Intellectual property rights litigation
Continental
In 2019, Continental Automotive Systems (Continental) brought breach of FRAND (fair,
reasonable and non-discriminatory terms) and antitrust claims against Nokia and others.
The antitrust claims were dismissed. In 2022, this decision became final after Continental
lost on appeal and reconsideration requests. Continental also brought breach of contract and
FRAND-related claims against Nokia in 2021. In 2023, Nokia’s motion to dismiss was granted
in part and denied in part, and the action is proceeding on the remaining claims at this time.
OPPO
In 2021, Nokia commenced patent infringement proceedings against OPPO, OnePlus and Realme
in several countries in Asia and Europe. OPPO responded by filing invalidation actions and patent
infringement actions against Nokia in Germany, China and Finland and actions in China against
Nokia relating to standard essential patent licensing issues. In January 2024, Nokia announced
that it has concluded a multi-year patent cross-license agreement with OPPO. Under the
agreement OPPO will make royalty payments, along with catch-up payments to cover the periods
of non-payment. The agreement resolves all pending patent litigation between the parties,
in all jurisdictions.
vivo
In 2022, Nokia commenced patent infringement proceedings against vivo in Germany and
several countries in Asia. Vivo responded by filing a number of patent infringement actions
against Nokia equipment in Germany and China. They also filed an action in China against Nokia
relating to standard essential patent licensing issues. In February 2024, Nokia announced that it
has concluded a multi-year patent cross-license agreement with vivo. Under the agreement vivo
will make royalty payments, along with catch-up payments to cover the periods of non-payment.
The agreement resolves all pending patent litigation between the parties, in all jurisdictions.
Amazon
In 2023, Nokia commenced patent infringement proceedings against Amazon in Brazil,
Germany, the European Unified Patent Court, India, the United Kingdom and the United States
(International Trade Commission/District Court). Across these actions, more than 30 patents
are in suit, covering video-related technologies implemented in Amazon’s services and devices.
HP
In 2023, Nokia commenced patent infringement proceedings against HP in Brazil, Germany, the
European Unified Patent Court and the United States (International Trade Commission/District
Court). Across these actions, there are 14 patents in suit, covering video coding technologies
implemented in HP’s products.
Business overview | Corporate governance | Operating and financial review and prospects | General facts on Nokia | Financial statements | Other information | 200 | |||||||
Notes to the consolidated financial statements continued
Nokia Annual Report on Form 20-F 2023
Company name | Country of incorporation | Parent holding % | Group ownership interest % |
Nokia Solutions and Networks Oy | Finland | ||
Nokia of America Corporation | United States | — | |
Nokia Shanghai Bell Co., Ltd.(1) | China | — | |
Nokia Solutions and Networks B.V. | Netherlands | — | |
Nokia Technologies Oy | Finland | ||
Nokia Participations | France | — | |
Alcatel Lucent | France | — | |
Nokia Networks France | France | — | |
Nokia Solutions and Networks India Private Limited | India | — | |
Nokia Solutions and Networks Japan G.K. | Japan | — | |
Nokia Solutions and Networks Branch Operations Oy | Finland | — | |
Alcatel Submarine Networks | France | — | |
Nokia Arabia Limited | Saudi Arabia | — | |
Nokia Solutions and Networks do Brasil Telecomunicações Ltda. | Brazil | — | |
Nokia Solutions and Networks Taiwan Co., Ltd. | Taiwan | — | |
Nokia Spain, S.A. | Spain | — | |
Nokia UK Limited | United Kingdom | — | |
Nokia Solutions and Networks System Technology (Beijing) Co., Ltd.(2) | China | — | |
Nokia Canada Inc. | Canada | — | |
Nokia Solutions and Networks Italia S.p.A. | Italy | — | |
Nokia Solutions and Networks Australia Pty Ltd | Australia | — | |
(1)Nokia Group owns interests. Nokia Shanghai Bell Co., Ltd. is the parent company of the Nokia Shanghai Bell Group (NSB Group). Refer to Note 6.3. Significant partly-owned subsidiaries. (2)Nokia Solutions and Network System Technology (Beijing) Co., Ltd. is a wholly-owned subsidiary of Nokia Shanghai Bell Co., Ltd. and the Nokia Group has control over this subsidiary through its holding in the NSB Group. | |||
Business overview | Corporate governance | Operating and financial review and prospects | General facts on Nokia | Financial statements | Other information | 201 | |||||||
Notes to the consolidated financial statements continued
Nokia Annual Report on Form 20-F 2023
Nokia holds an ownership interest of 50 % plus one share in Nokia Shanghai Bell’s parent
company, Nokia Shanghai Bell Co., Ltd. (NSB), with China Huaxin Post & Telecommunication
Economy Development Center (China Huaxin) holding the remaining ownership interests. Nokia
applied judgment to conclude that it is able to control NSB based on an assessment of various
factors including the ability to nominate key management personnel, decision-making related
to the management of NSB operations and Nokia’s exposure to variable returns from NSB.
In 2017, Nokia entered into a contractual arrangement providing China Huaxin with the right to
fully transfer its ownership interest in NSB to Nokia and Nokia with the right to purchase China
Huaxin’s ownership interest in NSB in exchange for a future cash settlement. To reflect this,
Nokia derecognized the non-controlling interest balance related to NSB and recognized a
financial liability based on the estimated future cash settlement to acquire China Huaxin’s ownership
interest. In 2023, the contractual arrangement was extended until 30 June 2024. If it expires
unexercised, Nokia will derecognize the financial liability and record non-controlling interest
equal to its share of NSB’s net assets with any difference recorded within shareholders’ equity.
The measurement of the financial liability is complex as it involves estimation of the option
exercise price and the distribution of excess cash balances upon exercise. In 2023, Nokia
recognized a EUR 2 million loss (EUR 11 million gain in 2022) in financial income and expenses
to reflect a change in the estimated future cash settlement. At 31 December 2023, the
expected future cash settlement amounted to EUR 455 million (EUR 482 million in 2022).
Financial information for the Nokia Shanghai Bell Group
entities within the Nokia Shanghai Bell Group but before elimination of intercompany
transactions with the rest of the Nokia Group.
EURm | 2023 | 2022 |
Summarized income statement | ||
Net sales(1) | ||
Operating loss | ( | ( |
Loss for the year | ( | ( |
Loss for the year attributable to: | ||
Equity holders of the parent | ( | ( |
Non-controlling interests(2) | ||
Summarized statement of financial position | ||
Non-current assets | ||
Non-current liabilities | ( | ( |
Non-current net assets | ||
Current assets(3) | ||
Current liabilities | ( | ( |
Current net assets | ||
Net assets(4) | ||
Non-controlling interests(2) | ||
Summarized statement of cash flows | ||
Net cash flows from operating activities | ||
Net cash flows from/(used in) investing activities | ( | |
Net cash flows used in financing activities | ( | ( |
Translation differences | ( | ( |
Net decrease in cash and cash equivalents | ( | ( |
(1)Includes EUR 19 million (EUR 29 million in 2022) net sales to other Nokia Group entities.
(2)Based on the contractual arrangement with China Huaxin, Nokia does not recognize any non-controlling interest in NSB.
(3)Includes a total of EUR 700 million (EUR 725 million in 2022) of cash and cash equivalents.
(4)The distribution of the profits of NSB requires the passing of a special resolution by more than two-thirds of its shareholders,
subject to a requirement that at least 50 % of the after-tax distributable profits are distributed as dividends each year.
Business overview | Corporate governance | Operating and financial review and prospects | General facts on Nokia | Financial statements | Other information | 202 | |||||||
Notes to the consolidated financial statements continued
Nokia Annual Report on Form 20-F 2023
Nokia has related party transactions with its subsidiaries, associated companies, joint ventures
and pension funds as well as the management and the Board of Directors. Transactions and
balances between group companies are eliminated on consolidation. For more information on
principles of consolidation and principal Group companies, refer to Note 1.2. General accounting
policies, and Note 6.2. Principal Group companies, respectively.
Transactions with associated companies and joint ventures
EURm | 2023 | 2022 | 2021 | ||
Sales | |||||
Purchases | ( | ( | ( | ||
Trade receivables | |||||
Trade payables | ( | ( | ( |
Investments in associated companies and joint ventures are individually immaterial.
In 2016, Nokia entered into a strategic agreement with HMD Global Oy (HMD) granting HMD an
exclusive global license to create Nokia branded mobile phones and tablets for ten years . Under
the agreement, Nokia receives royalty payments from HMD for sales of Nokia branded mobile
phones and tablets, covering both brand and patent licensing. In August 2023, Nokia and HMD
amended the licensing agreement so that HMD’s exclusive license to create Nokia branded
devices will expire by March 2026. Nokia has held an ownership interest in HMD since 2020
which it has accounted for as an investment in associate. In 2023, Nokia recorded an impairment
loss of EUR 28 million related to its investment in HMD in the share of result of associates and
joint ventures.
Nokia holds a 51 % ownership interest in TD Tech Holding Limited (“TD Tech HK”), a Hong Kong
based joint venture holding company which Nokia has accounted for as an investment in
associate. In 2023, TD Tech HK has entered into an agreement to divest the entire business
of the joint venture through the sale of TD Tech HK’s operating subsidiaries to a consortium
consisting of Huawei Technologies, Chengdu High-tech Investment Group and other buyers. The
closing of the transaction is conditional upon receiving regulatory approvals for the transaction
and is expected in 2024. Following the transaction, Nokia will exit from its shareholding in TD
Tech HK. Nokia expects to record a gain on the contemplated transactions. At 31 December
2023, the carrying amount of Nokia’s investment in TD Tech HK is included in assets held for
sale in the statement of financial position.
Transactions with pension funds
Nokia has borrowings of EUR 37 million (EUR 37 million in 2022) from Nokia
Unterstützungsgesellschaft mbH, Nokia’s German pension fund, a separate legal entity. The loan
bears interest at the rate of 6 % per annum and its duration is pending until further notice by the
loan counterparties who have the right to terminate the loan with a 90 -day notice. The loan is
included in short-term interest-bearing liabilities in the statement of financial position. For more
information on Nokia’s post-employment benefit plans, refer to Note 3.4. Pensions and other
post-employment benefits.
Transactions with the Group Leadership Team and the Board of Directors
Directors in 2023, 2022 or 2021. For information on remuneration of Nokia’s key management
personnel, refer to Note 3.2. Remuneration of key management.
Business overview | Corporate governance | Operating and financial review and prospects | General facts on Nokia | Financial statements | Other information | 203 | |||||||
Notes to the consolidated financial statements continued
Nokia Annual Report on Form 20-F 2023
Report of independent registered public
accounting firm
To the shareholders and the Board of Directors of Nokia
Corporation.
Opinion on the Financial Statements
We have audited the accompanying consolidated statements
of financial position of Nokia Corporation and subsidiaries
(the "Company") as of December 31, 2023 and 2022, and
the related consolidated income statements, consolidated
statements of comprehensive income, consolidated
statements of changes in shareholders’ equity and
consolidated statements of cash flows for each of the three
years in the period ended December 31, 2023, and the related
notes (collectively referred to as the "financial statements").
In our opinion, the financial statements present fairly, in all
material respects, the financial position of the Company as of
December 31, 2023 and 2022, and the results of its operations
and its cash flows for each of the three years in the period
ended December 31, 2023, in conformity with International
Financial Reporting Standards as issued by the International
Accounting Standards Board and International Financial
Reporting Standards as adopted by the European Union.
We have also audited, in accordance with the standards of the
Public Company Accounting Oversight Board (United States)
(PCAOB), the Company's internal control over financial
reporting as of December 31, 2023, based on criteria
established in Internal Control — Integrated Framework (2013)
issued by the Committee of Sponsoring Organizations of the
Treadway Commission and our report dated 29 February 2024,
expressed an unqualified opinion on the Company's internal
control over financial reporting.
Basis for Opinion
These financial statements are the responsibility of the
Company's management. Our responsibility is to express an
opinion on the Company's financial statements based on our
audits. We are a public accounting firm registered with the
PCAOB and are required to be independent with respect to the
Company in accordance with the U.S. federal securities laws
and the applicable rules and regulations of the Securities and
Exchange Commission and the PCAOB.
We conducted our audit in accordance with the standards of
the PCAOB. Those standards require that we plan and perform
the audit to obtain reasonable assurance about whether
the financial statements are free of material misstatement,
whether due to error or fraud. Our audits included performing
procedures to assess the risks of material misstatement of
the financial statements, whether due to error or fraud,
and performing procedures that respond to those risks.
Such procedures included examining, on a test basis,
evidence regarding the amounts and disclosures in the
financial statements. Our audits also included evaluating the
accounting principles used and significant estimates made by
management, as well as evaluating the overall presentation of
the financial statements. We believe that our audits provide a
reasonable basis for our opinion.
Critical Audit Matters
The critical audit matters communicated below are matters
arising from the current-period audit of the financial
statements that were communicated or required to be
communicated to the audit committee and that (1) relate to
accounts or disclosures that are material to the financial
statements and (2) involved especially challenging, subjective,
or complex judgments. The communication of critical
audit matters does not alter in any way our opinion on the
financial statements, taken as a whole, and we are not, by
communicating the critical audit matters below, providing
separate opinions on the critical audit matters or on the
accounts or disclosures to which they relate.
Revenue recognition – Accounting for significant
and complex contracts – Refer to Note 2.1 to the
financial statements
Critical Audit Matter Description
The Company recognises revenue in accordance with
International Financial Reporting Standard 15 Revenue from
Contracts with Customers. Certain contracts that the Company
enters into are particularly significant in value and contain
highly complex terms and conditions which impact revenue
recognition. Such complexities include the determination
of the standalone selling price, combination of contracts
assessments, accounting for contractual discounts and
subsequent modifications or other factors occurring during
the contract period that may impact revenue recognition.
Given the level of complexity and management judgement
involved in the accounting for significant and complex
contracts, performing audit procedures to evaluate the
reasonableness of these accounting judgements required a
high degree of auditor judgement, and there was significant
audit effort in obtaining sufficient audit evidence.
How the Critical Audit Matter Was Addressed in the Audit
Our audit procedures related to the determination of the
appropriateness of the accounting for significant and complex
contracts included the following, among others:
■We assessed management’s accounting policy in relation
to the areas of complexity identified in all significant and
complex contracts to determine compliance of the policy
with IFRS 15;
■We tested the effectiveness of controls over revenue
recognition of significant and complex contracts, specifically
focusing on controls relating to the areas of accounting
complexity;
■We utilised data analytics to identify contracts that were
significant in value and contained complexities;
■We analyzed the terms and conditions of significant and
complex contracts entered into or modified during the
current-period, inspected documentation of ongoing
commercial discussions, and obtained supporting audit
evidence;
■We made inquiries of senior management in the finance,
operations and sales teams relevant to the significant
and complex contracts, assessed financial reporting
considerations related to those discussions and obtained
supporting audit evidence;
■We assessed whether management’s conclusions, including
determination of standalone selling price, were in
compliance with IFRS 15.
Business overview | Corporate governance | Operating and financial review and prospects | General facts on Nokia | Financial statements | Other information | 204 | |||||||
Reports of independent registered public accounting firm
Nokia Annual Report on Form 20-F 2023
Valuation of Goodwill — Mobile Networks — Refer to
Note 4.1 to the financial statements
Critical Audit Matter Description
The Company’s evaluation of goodwill for impairment involves
the comparison of the recoverable amount of each applicable
cash generating unit (“CGU”), or group of CGUs, to its carrying
value on at least an annual basis, in line with International
Accounting Standard 36 Impairment of Assets. The goodwill
balance allocated to Mobile Networks (“MN”) is €2,228 million
as of 31 December 2023 and is included in the total goodwill
balance of €5,504 million. The Company based the recoverable
amount on the value in use, which uses a discounted cash
flow model.
Management’s discounted future cash flow model consists of
an explicit three-year long-range forecast and seven additional
years of cash flow projections to a terminal year. We identified
the valuation of MN’s goodwill as a critical audit matter because
of the significant estimates and assumptions management
made in the value in use calculation related to future revenues,
future expenses and cost savings. Auditing the significant
judgements and assumptions management made to estimate
the recoverable amount of MN required a high degree of
auditor judgement and increased audit effort, including the
need to involve our valuation specialists.
How the Critical Audit Matter Was Addressed in the Audit
Our audit procedures related to the determination of the
appropriateness of management assumptions in relation to
future revenue forecasts and future expenses in the MN
cashflows utilized in impairment testing included the following,
among others:
■We tested the operating effectiveness of the Company’s
controls over goodwill impairment evaluation, specifically
focusing on controls related to the determination of the
recoverable amount, as well as controls over forecasting;
■We held discussions with key members of management to
understand how the MN forecast, including key assumptions
around future revenues, future expenses, and the impact of
cost savings were derived;
■We utilised our valuation specialists to review valuation
assumptions, and challenge certain estimates and
judgments used in deriving the value in use of MN;
■We challenged net sales, operating expenses and operating
margin assumptions by comparing to (1) historical and
forecasted peer company data, (2) historical actual results,
and (3) prior period internal forecasts;
■We read analyst reports to identify supporting or
contradictory information in relation to management’s
revenue and operating profit assumptions; and
■We evaluated the adequacy of the Company's disclosures
against the requirements of IAS 36.
29 February 2024
We have served as the Company’s auditor since 2020.
Business overview | Corporate governance | Operating and financial review and prospects | General facts on Nokia | Financial statements | Other information | 205 | |||||||
Reports of independent registered public accounting firm continued
Nokia Annual Report on Form 20-F 2023
Report of independent registered public
accounting firm
To the shareholders and the Board of Directors of Nokia
Corporation.
Opinion on Internal Control over Financial Reporting
We have audited the internal control over financial reporting
of Nokia Corporation and subsidiaries (the “Company”) as of
31 December 2023, based on criteria established in Internal
Control — Integrated Framework (2013) issued by the
Committee of Sponsoring Organizations of the Treadway
Commission (COSO). In our opinion, the Company maintained,
in all material respects, effective internal control over financial
reporting as of 31 December 2023, based on criteria
established in Internal Control — Integrated Framework (2013)
issued by COSO.
We have also audited, in accordance with the standards of the
Public Company Accounting Oversight Board (United States)
(PCAOB), the consolidated financial statements as of and for
the year ended 31 December 2023, of the Company and our
report dated 29 February 2024 expressed an unqualified
opinion on those financial statements.
Basis for Opinion
The Company’s management is responsible for maintaining
effective internal control over financial reporting and for
its assessment of the effectiveness of internal control
over financial reporting, included in the accompanying
Management’s annual report on internal control over financial
reporting. Our responsibility is to express an opinion on the
Company’s internal control over financial reporting based on
our audit. We are a public accounting firm registered with the
PCAOB and are required to be independent with respect to the
Company in accordance with the U.S. federal securities laws
and the applicable rules and regulations of the Securities and
Exchange Commission and the PCAOB.
We conducted our audit in accordance with the standards of
the PCAOB. Those standards require that we plan and perform
the audit to obtain reasonable assurance about whether
effective internal control over financial reporting was
maintained in all material respects. Our audit included
obtaining an understanding of internal control over financial
reporting, assessing the risk that a material weakness exists,
testing and evaluating the design and operating effectiveness
of internal control based on the assessed risk, and performing
such other procedures as we considered necessary in the
circumstances. We believe that our audit provides a reasonable
basis for our opinion.
Definition and Limitations of Internal Control over
Financial Reporting
A company’s internal control over financial reporting is a
process designed to provide reasonable assurance regarding
the reliability of financial reporting and the preparation of
financial statements for external purposes in accordance with
generally accepted accounting principles. A company’s internal
control over financial reporting includes those policies and
procedures that (1) pertain to the maintenance of records
that, in reasonable detail, accurately and fairly reflect the
transactions and dispositions of the assets of the company; (2)
provide reasonable assurance that transactions are recorded
as necessary to permit preparation of financial statements in
accordance with generally accepted accounting principles, and
that receipts and expenditures of the company are being made
only in accordance with authorizations of management and
directors of the company; and (3) provide reasonable assurance
regarding prevention or timely detection of unauthorized
acquisition, use, or disposition of the company’s assets that
could have a material effect on the financial statements.
Because of its inherent limitations, internal control over
financial reporting may not prevent or detect misstatements.
Also, projections of any evaluation of effectiveness to future
periods are subject to the risk that controls may become
inadequate because of changes in conditions, or that the
degree of compliance with the policies or procedures may
deteriorate.
Deloitte Oy
Helsinki, Finland
29 February 2024
Business overview | Corporate governance | Operating and financial review and prospects | General facts on Nokia | Financial statements | Other information | 206 | |||||||
Reports of independent registered public accounting firm continued
Nokia Annual Report on Form 20-F 2023

Business overview | Corporate governance | Operating and financial review and prospects | General facts on Nokia | Financial statements | Other information | 207 | |||||||
Nokia Annual Report on Form 20-F 2023
Exhibits
1 | |
8 | |
11 | |
12.1 | |
12.2 | |
13 | |
15.1 | |
97.1 | |
101 | Interactive Data Files (Inline XBRL – Related Documents). |
104 | Cover Page Interactive Data File (formatted as inline XBRL and contained in Exhibit 101). |
Business overview | Corporate governance | Operating and financial review and prospects | General facts on Nokia | Financial statements | Other information | 208 | |||||||
Exhibits
Nokia Annual Report on Form 20-F 2023
Glossary
2G (Second Generation Mobile Communications): Also known
as GSM (Global System for Mobile Communications): A digital
system for mobile communications that is based on a widely-
accepted standard and typically operates in the 900 MHz,
1800 MHz and 1900 MHz frequency bands.
3G (Third Generation Mobile Communications): The third
generation of mobile communications standards designed for
carrying both voice and data generally using WCDMA or close
variants. See also WCDMA.
3GPP (The Third Generation Partnership Project): A
consortium comprising several standards organizations which
develop protocols for mobile telecommunications. The initial
goal was to develop a global technical specification for a 3G
mobile phone system. Since then, the operations have been
extended and today the main focus is on 5G networks.
4G (Fourth Generation Mobile Communications): The fourth
generation of mobile communications standards based on LTE,
offering IP data connections only and providing true broadband
internet access for mobile devices. See also LTE.
5G (Fifth Generation Mobile Communications): The next
major phase of mobile telecommunications standards. 5G is a
complete redesign of network architecture with the flexibility
and agility to support upcoming service opportunities. It
delivers higher speeds, higher capacity, extremely low latency
and greater reliability.
6G (Sixth Generation Mobile Communications): The cellular
industry introduces a new generation about every ten years.
The next generation of technology is expected to be
introduced by 2030 and is generally referred to as 6G.
Access network: A telecommunications network between
a local exchange and the subscriber station.
Airframe: Our 5G-ready, end-to-end data center solution that
combines the benefits of cloud computing technologies with
the requirements of the core and radio telecommunications
world. It is available in Rackmount and Open Compute Project
(OCP) form factors. This enables the solution to be very
scalable: from small distributed latency-optimized data centers
to massive centralized hyperscale data center deployment.
AirScale Radio Access: A 5G-ready complete radio access
generation that helps operators address the increasing
demands of today and tomorrow. The solution comprises:
Nokia AirScale Base Station with multiband radio frequency
elements and system modules; Nokia AirScale Active Antennas;
Cloud RAN with Nokia AirScale Cloud Base Station Server and
the cloud-based AirScale RNC (Radio Network Controller) for
3G; Nokia AirScale Wi-Fi; common software; and services which
use intelligent analytics and extreme automation to maximize
the performance of hybrid networks.
Alcatel-Lucent: Alcatel-Lucent Group, that has been part of
the Nokia Group since 2016.
Anyhaul: Mobile transport solution for 5G networks covering
microwave, IP, optical and broadband.
Artificial Intelligence (AI): Autonomous and adaptive
intelligence of machines, where machines have the ability to
perform tasks in complex environments without constant
guidance by a user and have the ability to improve
performance by learning from experience.
Bandwidth: The width of a communication channel, which
affects transmission speeds over that channel.
Base station: A network element in a mobile network
responsible for radio transmission and reception to or from
the mobile station.
Broadband: The delivery of higher bandwidth by using
transmission channels capable of supporting data rates
greater than the primary rate of 9.6 Kbps.
Churn: A measure of the number of customers or subscribers
who leave their service provider, e.g., a mobile operator,
during a given time period.
Cloud: Cloud computing is a model for enabling ubiquitous,
convenient, on-demand network access to a shared pool of
configurable computing resources (e.g., networks, servers,
storage, applications and services) that can be rapidly
provisioned and released with minimal management effort.
Cloud and Network Services: Our Cloud and Network Services
business group enables CSPs and enterprises to deploy
and monetize 5G, cloud-native software and as-a-Service
delivery models.
CloudBand: Our cloud management and orchestration
solutions enabling a unified cloud engine and platform for
Network Functions Virtualization (NFV). See also NFV.
Cloud RAN: Cloud RAN refers to all or some of the baseband
functions being run on a commercial off-the-shelf (COTS)
computing platform rather than purpose-built hardware.
Common Software Foundation (CSF): As a coherent software
suite, Nokia’s cloud-native Common Software Foundation
is designed to deliver applications that are hardware- and
vendor-agnostic, and easy to deploy, integrate, use and upgrade.
Converged core: Wireless and fixed access convergence within
the core. As we move towards a 5G standalone core, service
providers will be able to use a common set of control plane
functions within the core to manage both wireless and fixed
user plane functions. The ability of a unified control plane will
simplify operations and provide independent location, scaling
and lifecycle management capabilities.
Convergence: The coming together of two or more disparate
disciplines or technologies. Convergence types are, for
example, IP convergence, fixed-mobile convergence and device
convergence.
Core network: A combination of exchanges and the basic
transmission equipment that together form the basis for
network services.
CSPs: Communications service providers. One of Nokia’s
customer segments.
Customer Experience Management: Software suite used to
manage and improve the customer experience, based on
customer, device and network insights.
Digital: A signaling technique in which a signal is encoded into
digits for transmission.
Discontinued operations: The continuing financial effects of
the HERE business and the Devices & Services business. HERE
was divested to an automotive consortium and substantially all
of the Devices & Services business was sold to Microsoft.
Business overview | Corporate governance | Operating and financial review and prospects | General facts on Nokia | Financial statements | Other information | 209 | |||||||
Glossary
Nokia Annual Report on Form 20-F 2023
Ecosystem: An industry term to describe the increasingly
large communities of mutually beneficial partnerships that
participants such as hardware manufacturers, software
providers, developers, publishers, entertainment providers,
advertisers and ecommerce specialists form in order to bring
their offerings to market. At the heart of the major ecosystems
in the mobile devices and related services industry is the
operating system and the development platform upon which
services are built.
Enterprise verticals: One of Nokia’s customer segments. An
enterprise vertical represents a grouping of companies by an
industry (like energy or transportation) that offers products
and services that meet specific needs of that industry. Within
the enterprise verticals segments, we primarily focus on
transportation, energy, manufacturing, logistics and the
public sector.
ETSI (European Telecommunications Standards Institute):
Standards produced by the ETSI contain technical
specifications laying down the characteristics required
for a telecommunications product.
Fixed Wireless Access (FWA): Uses wireless networks to
connect fixed locations such as homes and businesses with
broadband services.
FP5: Nokia’s fifth generation of high-performance IP routing
silicon, and the latest range of our AirScale 5G products.
Future X: A network architecture – a massively distributed,
cognitive, continuously adaptive, learning and optimizing
network connecting humans, senses, things, systems,
infrastructure and processes.
G.fast: A fixed broadband technology able to deliver up to
1Gbps over very short distances (for example, for in-building
use, also called “Fiber-to-the-Building”). Launched in 2014,
G.fast uses more frequencies and G.fast Vectoring techniques
to achieve higher speeds.
GPON (Gigabit Passive Optical Network): A fiber access
technology that delivers 25Gbps over a single optical fiber to
multiple end points including residential and enterprise sites.
GSM (Global System for Mobile Communications): A digital
system for mobile communications that is based on a widely
accepted standard and typically operates in the 900 MHz,
1800 MHz and 1900 MHz frequency bands. See also 2G.
GSM-R (GSM-Railway): An international wireless
communications standard for railway communication and
applications. A sub-system of European Rail Traffic
Management System (ERTMS), it is used for communication
between train and railway regulation control centers.
Hexa-X: European Commission’s flagship 6G initiative for
research into the next generation of wireless networks. The
initiative began in January 2021 with Nokia as project lead,
working closely with a strong consortium of European partners.
Hyperscalers: One of Nokia’s customer segments. Hyperscaler
refers to companies like Alphabet (Google), Amazon (Amazon
Web Services), Microsoft and Meta Platforms (Facebook) that
provide cloud solutions at a global scale leveraging massive
connected data centers.
Internet of Things (IoT): All things such as cars, the clothes
we wear, household appliances and machines in factories
connected to the internet and able to automatically learn
and organize themselves.
IP (Internet Protocol): A network layer protocol that offers a
connectionless internet work service and forms part of the
(Transmission Control Protocol) TCP/IP protocol.
IP (Intellectual Property): Intellectual property results from
original creative thought, covering items such as patents,
copyright material and trademarks, as well as business models
and plans.
IPR (Intellectual Property Rights): Legal rights protecting the
economic exploitation of intellectual property, a generic term
used to describe products of human intellect, for example
patents, that have an economic value.
IP/MPLS (IP Multiprotocol Label Switching): IP/MPLS is a
routing technique in telecommunications networks that directs
data from one node to the next based on short path labels
rather than long network addresses, thus avoiding complex
lookups in a routing table and speeding traffic flows.
IPR licensing: Generally, an agreement or an arrangement
where a company allows another company to use its
intellectual property (such as patents, trademarks or
copyrights) under certain terms.
LTE (Long-Term Evolution): 3GPP radio technology evolution
architecture and a standard for wireless communication of
high-speed data. Also referred to as 4G.
Mission-critical networks/communications: One of the key
elements of 5G. Mission-critical communications meets the
needs of emergency responders such as emergency operations
centers, fire departments, emergency vehicles, police, and
search and rescue services, replacing traditional radio with new
communications capabilities available to smartphone users.
Mobile broadband: Refers to high-speed wireless internet
connections and services designed to be used from multiple
locations.
Mobile Networks: Our Mobile Networks business group offers
products and services for radio access networks covering
technologies from 2G to 5G, and microwave radio links for
transport networks.
MPLS: Multiprotocol Label Switching, a routing technique
for networks.
MSO: Multiple System Operators (MSO) are operators of
multiple cable television systems. The majority of system
operators run cable systems in more than one community
and hence most of them are multiple system operators.
Network Infrastructure: Our Network Infrastructure business
group provides fiber, copper, fixed wireless access
technologies, IP routing, data center, subsea and terrestrial
optical networks – along with related services – to customers
including communications service providers, webscales
(including hyperscalers), digital industries and governments.
NFV (Network Functions Virtualization): Principle of separating
network functions from the hardware they run on by using
virtual hardware abstraction.
Nokia Bell Labs: Our research arm engaged in discovering and
developing the technological shifts needed for the next phase
of human existence as well as exploring and solving complex
problems to radically redefine networks.
Nokia Technologies: Our Nokia Technologies business group
is responsible for managing Nokia’s patent portfolio and
monetizing Nokia’s intellectual property, including patents,
technologies and the Nokia brand.
Non-Standalone (NSA): Network architecture that is built over
an existing 4G network.
Business overview | Corporate governance | Operating and financial review and prospects | General facts on Nokia | Financial statements | Other information | 210 | |||||||
Glossary continued
Nokia Annual Report on Form 20-F 2023
Operating System (OS): Software that controls the basic
operation of a computer or a mobile device, such as managing
the processor and memory. The term is also often used to
refer more generally to the software within a device, for
example, the user interface.
O-RAN: The term O-RAN refers to interfaces and architecture
elements as specified by the O-RAN alliance. O-RAN Alliance is a
specification group defining next-generation RAN infrastructures,
empowered by principles of intelligence and openness.
Packet: Part of a message transmitted over a packet-switched
network.
Platform: Software platform is a term used to refer to an
operating system or programming environment, or a
combination of the two.
PON (Passive Optical Network): A fiber access architecture
in which unpowered fiber optic splitters are used to enable a
single optical fiber to serve multiple endpoints without having
to provide individual fibers between the hub and customer.
Private wireless network: Private wireless is a standalone
network focused on industrial operational assets and users.
A private wireless network provides broadband connectivity,
similar to a public wireless network, but is owned and controlled
by the organization that built or purchased it.
Programmable world: A world where connectivity will expand
massively, linking people as well as billions of physical objects –
from cars, home appliances and smartphones, to wearables,
industrial equipment and health monitors. What distinguishes
the Programmable World from the Internet of Things (IoT)
is the intelligence that is added to data to allow people to
interpret and use it, rather than just capture it.
PSE-3: The PSE-3 chipset is the first coherent digital signal
processor to implement Probabilistic Constellation Shaping
(PCS), a modulation technique pioneered by Nokia Bell Labs.
RAN (Radio Access Network): A mobile telecommunications
system consisting of radio base stations and transmission
equipment.
SDAN: Software Defined Access Network.
SDN (Software-Defined Network): Decoupling of network
control and data forwarding to simplify and automate
connections in data centers, clouds and across the wide area.
SD-WAN: Software-Defined Networking in a Wide Area Network
(WAN) that simplifies and automates enterprise networks,
seamlessly connecting users and applications, from branch
office to cloud.
SEP (Standard-Essential Patent): Generally, patents needed to
produce products which work on a standard which companies
declare as essential and agree to license on Fair, Reasonable
and Non-Discriminatory (FRAND) terms. Can also be referred
to as essential patent.
Single RAN: Single RAN (S-RAN) allows different radio
technologies to be provided at the same time from a single
base station, using a multi-purpose platform.
Small cells: Low-powered radio access nodes (micro cells or
picocells) that are a vital element in handling very dense data
traffic demands. 3G and LTE small cells use spectrum licensed
by the operator; Wi-Fi uses unlicensed spectrum which is
therefore not under the operator’s exclusive control.
Standalone (SA): Network architecture that allows independent
operation of a 5G service without interaction with an existing
4G core and 4G radio network.
Technology licensing: Generally, refers to an agreement or
arrangement where under certain terms a company provides
another company with its technology and possibly know-how,
whether protected by intellectual property or not, for use in
products or services offered by the other company.
Telco cloud: Applying cloud computing, SDN and NFV principles
in telecommunications environment, for example separating
application software from underlying hardware with
automated, programmable interfaces while still retaining
telecommunications requirements such as high availability
and low latency.
Transmission: The action of conveying signals from one point
to one or more other points.
TXLE (Technical Extra-Large Enterprise): Technically
sophisticated companies, such as banks, that invest heavily in
their own network infrastructures to gain a key competitive
advantage.
VDSL2 (Very High Bit Rate Digital Subscriber Line 2): A fixed
broadband technology, the successor of ADSL. Launched in
2007, it typically delivers a 30Mbps broadband service from
a street cabinet (also called a Fiber to the Node deployment)
over existing telephone lines.
VDSL2 vectoring: A fixed broadband technology launched in
2011, able to deliver up to 100Mbps over a VDSL2 line by
applying noise cancellation techniques to remove cross-talk
between neighboring VDSL2 lines.
Virtual Reality (VR): The simulation of a three-dimensional
image or environment that can be interacted with in a
seemingly real or physical way by a person using special
electronic equipment, such as a helmet with a screen inside
or gloves fitted with sensors.
VoLTE (Voice over LTE): Required to offer voice services on an
all-IP LTE network and generally provided using IP Multimedia
Subsystem, which is an architectural framework designed to
deliver IP-based multimedia services on telecommunications
networks; standardized by 3GPP.
WAN (Wide Area Network): A geographically distributed private
telecommunications network that interconnects multiple local
area networks.
WCDMA (Wideband Code Division Multiple Access): A third-
generation mobile wireless technology that offers high data
speeds to mobile and portable wireless devices. Also referred
to as 3G.
Webscale companies: Companies which are investing in cloud
technology and network infrastructure on an increasing scale
to fulfill their needs for massive, mission-critical networks.
WING: Worldwide IoT Network Grid is a managed service that
offers CSPs the ability to support their enterprise customers
with global IoT connectivity across borders and technologies.
WLAN (Wireless Local Area Network): A local area network
using wireless connections, such as radio, microwave or
infrared links, in place of physical cables.
Business overview | Corporate governance | Operating and financial review and prospects | General facts on Nokia | Financial statements | Other information | 211 | |||||||
Glossary continued
Nokia Annual Report on Form 20-F 2023
Investor information
Information on the internet
www.nokia.com
Available on the internet: financial reports, members of the Group Leadership Team, other
investor-related materials and events, and press releases as well as environmental and social
information, including our People & Planet Report, Code of Conduct, Corporate Governance
Statement and Remuneration Statement.
SEC maintains an internet site that contains reports, proxy and information statements, and
other information regarding issuers that file electronically with the SEC (http://www.sec.gov).
Investor Relations contacts
investor.relations@nokia.com
Annual General Meeting
Date:3 April 2024
Place:Helsinki, Finland
Dividend
The Board proposes to the Annual General Meeting 2024 to be authorized to decide, in its
discretion, on the distribution of an aggregate maximum of EUR 0.13 per share as dividend from
the retained earnings and/or as assets from the reserve for invested unrestricted equity.
Financial reporting
Our interim reports in 2024 are planned to be published on 18 April 2024, 18 July 2024 and
17 October 2024. The full-year 2024 results are planned to be published in January 2025.
Information published in 2023
All our global press releases and statements published in 2023 are available on the internet at
www.nokia.com/en_int/news/releases.
Stock exchanges
The Nokia Corporation share is quoted on the following stock exchanges:
Symbol | Trading currency | |
Nasdaq Helsinki (since 1915) | NOKIA | EUR |
New York Stock Exchange (since 1994) | NOK | USD |
Euronext Paris (since 2015) | NOKIA | EUR |
Documents on display
The documents referred to in this Annual Report on Form 20-F can be read at the Securities and
Exchange Commission’s internet site at http://www.sec.gov.
Contact information
Nokia Head Office
Karakaari 7
FI-02610 Espoo, Finland
FINLAND
Tel. +358 (0) 10 44 88 000
Fax +358 (0) 10 44 81 002
Business overview | Corporate governance | Operating and financial review and prospects | General facts on Nokia | Financial statements | Other information | 212 | |||||||
Investor information
Nokia Annual Report on Form 20-F 2023
Signatures
The registrant hereby certifies that it meets all of the
requirements for filing on Form 20-F and that it has duly
caused and authorized the undersigned to sign this
Annual Report on Form 20-F on its behalf.
Nokia Corporation
By:/S/ STEPHAN PROSI
Name:Stephan Prosi
Title:Vice President, Corporate Controlling and Accounting
By:/S/ JOHANNA MANDELIN
Name:Johanna Mandelin
Title:Global Head of Corporate Legal
29 February 2024
Business overview | Corporate governance | Operating and financial review and prospects | General facts on Nokia | Financial statements | Other information | 213 | |||||||
Signatures
Nokia Annual Report on Form 20-F 2023